Author Archives: author

Transient Creep of the Lithosphere and Propagation of a Local Vertical Displacement Over the Earth’s Surface

DOI: 10.31038/GEMS.2025773

Abstract

Laboratory experiments with rock samples show that creep at small strains is transient and is described by the linear hereditary rheological model of Andrade. Flows that restore isostasy (in particular, postglacial ones) cause deformations in the lithosphere that do not exceed 10-3 and, therefore, demonstrate transient creep. The effective viscosity characterizing transient creep is lower than the effective viscosity at steady-state creep and depends on the characteristic time of the process under consideration. The characteristic duration of isostatic equilibrium recovery after the initial disturbance of the Earth’s surface relief does not exceed ten thousand years, and therefore the depth distribution of rheological properties differs from the distribution that corresponds to slow geological processes. The perturbations of the Earth’s surface relief caused by an initial small-scale perturbation that disrupts isostasy are considered. The propagation of vertical displacements along the Earth’s surface from the area of the initial perturbation is carried out by diffusion-type waves that arise during the process of isostasy recovery, and by convective waves that arise due to the vertical temperature gradient in the lithosphere. The solutions of the equations of continuum mechanics are obtained using the Fourier transform in the spatial horizontal coordinate and the Laplace transform in time.

Keywords

Transient creep, Isostatic recovery, Vertical movements of the Earth’s surface, Thermoconvective waves, Diffusion-type waves

Introduction

Andrade proposed a law to describe the transient creep he observed experimentally in 1910. This law was later confirmed in numerous laboratory studies of rock creep conducted at high temperatures and pressures typical of the Earth’s interior [1-5]. The well-known concept in mechanics that creep is transient at small deformations was first introduced into geophysics in the work of [6], where the idea was put forward that flows in the mantle associated with small deformations, and, in particular, postglacial flows, occur in the transient creep regime. The concept of transient creep at small deformations of geomaterial was further developed in the monograph [7]. Experimental and theoretical justifications for the applicability of the Andrade rheological model in studying dynamic processes in the lithosphere and mantle are presented in [8]. The lithospheric plate is a cold boundary layer formed by mantle convection, and the thickness of continental plates beneath cratons can exceed 200 km. The rheological model of a power-law non-Newtonian fluid, which describes steady-state creep and is commonly used in modern geophysical studies, leads to a very high effective viscosity characterizing creep at small deformations. With such a high effective viscosity, the lithosphere would be purely elastic even over geological times. Transient creep corresponds to a much lower effective viscosity than steady-state creep. Therefore, transient creep must be taken into account when examining geophysical processes in the lithosphere. The effective viscosity corresponding to transient creep depends on the characteristic duration of the geophysical process under consideration. In [8-11], low-amplitude thermoconvective waves in the lithosphere, the existence of which is due to transient creep, were considered, and it was shown that thermoconvective oscillations (standing waves) lead to the formation of sedimentary basins on continental cratons. The characteristic time of this process is about 108 years. The work [12] considers the recovery of isostatic equilibrium after an initial small – scale disturbance of the earth’s surface relief. As a result of the recovery process, the Earth’s surface returns to a flat position, which corresponds to the equilibrium state with a uniform horizontal density distribution. The characteristic duration of this process does not exceed 1000 years, and therefore the distribution of rheological properties by the depth of the lithosphere and crust differs from the distribution that corresponds to slower processes associated with convective motion. A process with a characteristic time of about 1000 years is a fairly fast process, the study of which does not require taking into account the influence of the vertical temperature gradient present in the lithosphere, since thermal effects are associated with very slowly occurring thermal conductivity. However, this process is slow enough to neglect the elasticity, compressibility, and inertia of the lithosphere.

In this paper, we will consider the movements of the Earth’s surface caused by initial vertical displacements. If a vertical displacement disrupting the isostatic equilibrium of the crust has occurred in some area of the Earth’s surface, then the process of isostasy recovery is reduced not only to a gradual decrease in the initial vertical displacements in this area, but also to the propagation of displacements beyond its boundaries. The processes of displacement propagation in the crust can be called diffusion-type waves. Waves of this type appear when solving parabolic equations of the theory of diffusion or heat conduction. These waves describe the process of propagation of temperature disturbance from the area where the disturbance occurred to the environment. The temperature gradually increases in remote areas, and the temperature in the initially disturbed area decreases. The propagation of the disturbance is accompanied by its strong attenuation, and over time, the temperature disturbance disappears everywhere. This is exactly how the process of displacement propagation occurs in the elastic crust, where the displacement acts as an analogue of temperature disturbance. It will be shown what movements of the Earth’s surface created by diffusion-type and thermoconvective waves caused by the initial vertical displacement of this surface.

Rheological Model

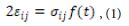
Laboratory studies show that at small deformations transient creep occurs, in which creep deformations depend linearly on the applied constant stresses

where  f(t) is the creep function, which provides an analytical description of transient creep, εij and  is the strain tensor measured from the state at the moment of stress application. For rocks, the creep function at high temperatures is well described by Andrade’s law

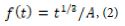
where A is the Andrade rheological parameter. At short times, transient creep obeys Lomnitz’s law, but already at times of the order of a day, Andrade’s law becomes valid [13]. Therefore, Andrade’s law will be used in the study of low-frequency waves. The attenuation of high-frequency seismic waves is described by Lomnitz’s rheology [14], but in this paper, although we will talk about Rayleigh surface elastic waves, their attenuation will not be considered. To generalize the results of experiments carried out at constant stresses to the case of variable stresses, we can use the linear Boltzmann theory, valid for sufficiently small deformations. This theory leads to an integral relationship between strains and stresses

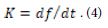
where t is the observation time, and K(t) is the integral creep kernel determined by the creep function

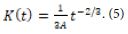
As follows from (2) and (4), the creep kernel corresponding to Andrade’s law has the form

The rheological model described by equations (3) and (5) will be called the Andrade model. This model generalizes Andrade’s law to the case of variable stresses. At sufficiently large deformations, transient creep is replaced by steady-state creep, which is described by the rheological model of a power-law non-Newtonian fluid. The value of the Andrade rheological parameter depends on temperature, pressure, and mineralogical composition. The depth distribution of the Andrade parameter was obtained in [11]. Since the Andrade parameter decreases with increasing temperature, and the temperature increases with depth in the lithosphere, this parameter decreases with depth. In the upper crust, the thickness of which is about 20 km, the value of this parameter is estimated as A ≈ 1016 Pa∗ s1/3 . With such a high value of  A, the upper crust behaves as an elastic layer even on times of the order of the age of the Earth. More precisely, the upper crust, the thickness of which is about 20 km, is brittle-elastic, and elasticity dominates only in the lower layer of the upper crust, the thickness of which is about 10 km. In the uppermost layer of the crust, brittleness dominates, and its strength is very low [11]. We will assume that the upper crust with a thickness of 20 km is an elastic layer with a reduced shear modulus due to brittleness. Within the framework of the simplified model of the lithosphere beneath the upper crust used in the paper,we use the depth-averaged estimate A ≈ 1012 Pa∗ s1/3.

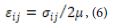
Since the total deviatoric deformation of the medium can be represented as the sum of the deviatoric creep deformation (1) and the deviatoric elastic deformation

where μ is the elastic shear modulus, an elastic-creeping medium whose creep is transient is described by the equation

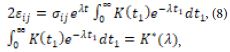
In linear stability theory, it is assumed that the strains and stresses depend on time as exp(λt), where λ is the complex decrement, and the right-hand side of equation (3) takes the form

where the asterisk denotes the Laplace transform, which is used here only to evaluate the integral in equation (8). The Laplace transform of the creep kernel (5) yields

where the gamma function is Γ (1/3)≈3. Linear stability theory considers the behavior of a mechanical system at large times elapsed since the occurrence of a small disturbance. Therefore, in equation (8), the upper limit of integration is t=∞.

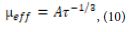
Thus, when the time dependence has the form exp(λt), at large times the effective shear modulus of the Andrade medium has the form

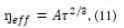
and the effective Newtonian viscosity is written as

where  is the characteristic time of the process. As follows from (11), on time scales of the order of 1000 years, small-scale postglacial flows, which are characterized by an average value of the rheological parameter A ≈ 1012 Pa∗ s1/3, correspond to an effective viscosity eff ≈ 1019 Pa∗ s. Such estimate agrees in order of magnitude with the viscosity estimates found when considering small – scale postglacial flows within the framework of the rheological model of a Newtonian fluid [15]. Consequently, the estimates of Andrade parameter obtained on the basis of data from laboratory experiments with rock samples at temperatures and pressures characteristic of the Earth’s interior [11], correspond to the observational data used to estimate the viscosity of the upper mantle [15]. The effective viscosity for the Andrade medium depends on the characteristic time of the process under consideration and, therefore, the effective viscosity found for postglacial flows with a characteristic time of 1000 years cannot be used in the study of slower geological processes [8,13].
Thermoconvective and Elastic Surface Waves

We consider an elastic thin plate lying on a layer with Andrade rheology. The origin of coordinate is placed on the upper surface, and the z-axis is directed vertically upward. The thin plate (z = 0) models the upper elastic crust, and the layer (-1 < z < 0) – the underlying lithosphere. The equations describing the disturbances of the lithostatic equilibrium of an incompressible medium are written as

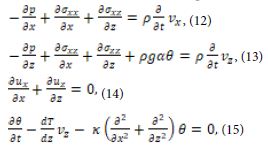
where p  is the pressure perturbation, σxx, σxz and σzz are the components of the deviatoric stress tensor,  vx and vz are the velocities, θ is the temperature perturbation,  x is the thermal diffusivity,  is the vertical gradient of the unperturbed temperature, which is assumed to be uniform throughout the depth of the lithosphere, ρ is the density, α is the coefficient of thermal expansion, g is the gravitational acceleration. The velocities, stresses, pressure and temperature perturbations are functions of the vertical spatial coordinate, the horizontal coordinate x, and time t. Equations (12) and (13) describe the two-dimensional motion of the medium (the motion occurs in the xz plane) taking into account the Archimedes force. Equation (14) is the condition of incompressibility of the medium, and equation (15) is the heat balance equation. Equations (12) – (15) use the Boussinesq approximation, within which the mechanical compressibility of the medium can be neglected, and thermal compressibility can be taken into account only in the equations of motion. Rheological equations are added to equations (12) – (15)

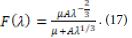

where F(λ) is the complex viscosity of the Andrade viscoelastic medium (7)

Equations (16) relate deviatoric stresses to strain rates, which are defined as

On the upper surface of the lithosphere (z = 0) the boundary conditions, determined by the force action of the elastic plate, are imposed

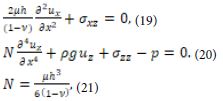
where ν is Poisson’s ratio, N is the flexural rigidity of the elastic plate with thickness h. The displacements  ux and uz in the plate are equal to the displacements in the underlying layer at z = 0. The temperature boundary condition is added to the boundary conditions (19) and (20)

The incompressibility condition for a viscous medium, under which equation (14) is valid, is written as

where τ is the characteristic time of the flow under consideration, and K is the bulk modulus. It follows from (23) and (11)

In equations (12) and (13), the inertial terms can be neglected under the condition

from which it follows

Slow flows with a large characteristic time τ are called creeping. Convective flows in the Earth are a typical example of creeping flows. The lithosphere, which exhibits both elastic and viscous properties, is described by the Maxwell viscoelastic rheological model. Elasticity can be neglected for a sufficiently slow flow

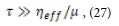
where µ is the elastic shear modulus, and ηeff  is called the Maxwell time. It follows from condition (27)

To move to dimensionless variables, we introduce the following scales: the length scale is the layer thickness d, the time scale is d2/x , where κ is the thermal diffusivity, the velocity scale is κ/d, the pressure (and stress) scale is A /d2, where ηA is the viscosity scale for the Andrade medium. The temperature difference between the hot lower and cold upper surfaces of the layer is taken as the temperature scale. For the Andrade medium ηA = A(d2 /x)2/3, and then with an exponential dependence on time, the dimensionless effective viscosity takes the form


and the Rayleigh number for the Andrade medium is defined as

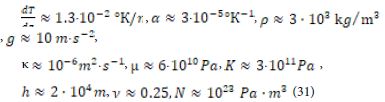
The lithosphere is characterized by the following values of physical parameters [16]:

The thickness of the continental lithosphere, which is taken as the length scale, is estimated as d = 2∗ 105 m. Since the Andrade parameter for the lithosphere is estimated as 1012 Pa∗.s1/3 m, the Rayleigh number, according to (31), is estimated as Ra ≈ 80.

We will represent the vertical velocity as

where λ is the complex increment, k is the real wave number. We will represent all the physical variables in a similar form. This representation allows us to reduce the system of partial differential equations (12) – (18) to a system of ordinary differential equations, in which all variables characterizing the strain rates, stresses, and pressure depend only on the vertical coordinate z. The characteristic time τ for a flow with a decrement λ can be represented as .

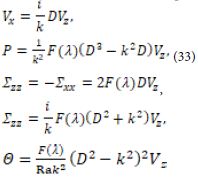
Passing to dimensionless variables and substituting relations (32) into equations (12) – (15), (16) and (18), we obtain relations connecting the amplitudes of pressure, temperature, and components of the deviatoric stress tensor with the amplitude of the vertical velocity

Excluding from the equations the amplitudes of all physical variables, except for the amplitude of the vertical velocity Vz , we arrive at an ordinary differential equation, valid for small values of λ, for which we can neglect elasticity and inertia of the layer (-1 < z <0) simulating the lithosphere,

From (34) it follows that the influence of the temperature gradient can be neglected when

The boundary conditions on the upper deformable surface of layer z = 1 are

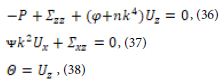
where Uz is the vertical displacement of the upper boundary of the layer, i.e. the deviation of the boundary surface from the plane z = 1. Equations (36) and (37) follow from the condition of equilibrium of the forces acting on a unit area of the disturbed surface of the layer, and equation (38) follows from the condition of vanishing of the temperature disturbance on this surface. Equations (36) and (38) include the displacement of the boundary Uz due to the fact that in the state of equilibrium there is vertical gradients of pressure and temperature in the layer. Condition (38) assumes that the boundary motion is determined by the motion of material points located on this boundary. In equations (36) and (37), dimensionless parameters are introduced:

which characterize the deformable surface. For sufficiently small k, the influence of a thin elastic plate modeling the upper crust is negligible.

Using the parameter φ, the Rayleigh number can be written as  The parameter φ describes the mobility of the boundary and is the ratio of the additional hydrostatic pressure caused by the boundary displacement to the characteristic viscous stress in the layer. The smaller the parameter φ, the more mobile the boundary. For a very large value of φ, the upper surface of the layer behaves like a fixed boundary.



Under each lithospheric plate, there is an isothermal core of large-scale mantle convection, and there is movement with a constant horizontal velocity at the lithosphere-mantle boundary [16]. Therefore, in the coordinate system that moves together with the lithospheric plate, the following conditions must be imposed at the lower boundary of the plate

Thus, the lower boundary of the lithosphere, considered as a boundary layer of large-scale convection, is isothermal (the temperature perturbation is zero at this boundary) and “solid” (zero velocity components at this boundary).

The general solution of the ordinary differential equation (34) is written as

where   q1 , q2 , q3 are the roots of the equation

Investigating surface waves, for which disturbances do not penetrate into the deepest layers of the lithosphere, we consider only sufficiently large values of the wave number (k > 3), for which  eq1 z , eq2 z and eq3 z are close to zero at the lower boundary (z = -1). In this case, to satisfy the boundary conditions at the lower boundary of the lithosphere, it is sufficient to set C4 = C5 = C6 = 0 Substituting (40) into the boundary conditions (36) – (38) on the upper surface, we arrive at a system of three homogeneous equations for three unknowns C1 , C2 and C3. In order for this system to have a solution, it is necessary to equate its determinant to zero

As a result, we obtain the characteristic equation relating the decrement λ to the wave number k. For large wave numbers (k > 5), the imaginary parts of the complex decrements are very small. This means that the temperature gradient present in the lithosphere has a very weak effect and the Rayleigh number in equations (34) and (41) can be neglected. For k = 3, the decrement takes the value . Such a convective wave propagates with the dimensionless velocity . The dimensional velocity of this wave is extremely small: m/year. Values of k < 3 cannot be considered since equation (42) was obtained for surface waves. However, the study of thermoconvective waves [8,9,10,11] allows us to assume that for k < 3 the imaginary part of the decrement and the propagation velocity increase, while the real part of the decrement (attenuation) tends to zero.

The characteristic equation (42) is obtained for sufficiently small values of k and λ, for which the elasticity and inertia of the medium can be neglected. For large values of the wave number k and the decrement λ, the viscosity of the medium and temperature effects can be neglected but the elasticity and inertia of the medium must be taken into account. In this case, it is more convenient, while maintaining the length scale d=2∗ 105 m, to move to the velocity scale  and the time scale Then λ=iw (the decrement becomes purely imaginary), and the characteristic equation takes the form

This equation has solutions w(k) = Vk, where V ≈ 0.95529 is the dimensionless velocity of the surface wave. Its dimensional velocity is slightly lower than the velocity of the bulk transverse wave. Taking into account the effect of gravity (non-zero parameter φ) slightly increases the frequencies ω(k) ≈ 0.95531k. Equation (43) describes the Rayleigh wave in an incompressible medium. Taking into account compressibility, equation (43) becomes


where  This parameter can be considered small, since it has little effect on the result. The frequencies ω found from equation (43) and from equation (44) differ by approximately 3%.



When k and λ are small enough to neglect elasticity and inertia, but not small enough to take into account thermal effects, the complex decrement λ turns out to be a real number (lmλ = 0). In this case, which will be discussed in the next section, there is no wave motion at a fixed k but we can speak of a diffusion – type wave in the presence of a whole spectrum of values of k.

Laplace Transform. Diffusion-type Wave

Solving the problem of excitation of surface waves by the initial disturbance of the Earth’s surface, we will use the Laplace transform with respect to time t and the Fourier transform with respect to the spatial horizontal coordinate x. Representation (32) introduces the Fourier transform but not the Laplace transform, which allows us to find not only solutions of the form exp (λt).

The Laplace transform is a convenient mathematical apparatus for solving differential equations with initial conditions. The Laplace transform f∗(s), denoted by an asterisk, is related to the original f(t) by the equation

The Laplace variable s is a complex number, unlike the Fourier variable k, which is a real wave number.

Using the Laplace transform, we can write the rheological equation (3) as

where G∗A  is the Laplace analogue of the shear modulus for the Andrade medium, Γ(1/3) ≈ 3 is the gamma function. Equation (7) corresponds to the Laplace image

where G∗ is the Laplace analogue of the shear modulus for an elastic-creeping medium.

As follows from (46), the elasticity of the medium can be neglected if the condition

is satisfied, under which the Laplace analogue of the shear modulus for the Andrade medium G∗A is significantly less than the elastic shear modulus μ. According to the property of the Laplace transform, it follows from (47)

The compressibility of the medium can be neglected if the Laplace analogue of the shear modulus for the Andrade medium G*A is significantly less than the elastic bulk modulus K. Since the elastic shear modulus μ is less than the bulk modulus (K ≈ 3μ), condition (48) allows us to neglect not only the elasticity but also the compressibility of the medium. Since μ ≈ 6. 1010 Pa and A ≈ 1012 Pa ∗ s1/3 , it follows from (48) that the lithosphere beneath the elastic upper crust behaves as a creeping Andrade medium, not exhibiting elasticity or compressibility at times exceeding 104 s.

The effect of inertia is negligibly small (inertial forces are small compared to the forces arising during deformations of the Andrade medium), if

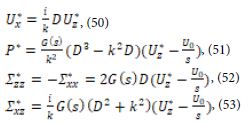
The right-hand side of (49) is estimated as 20 s for the lithosphere. Consequently, neglecting elasticity, inertia can be neglected even more so. Isostatic recovery processes with characteristic times not exceeding 10,000 years are slow enough to neglect elasticity, compressibility, and inertia, but are not slow enough to take into account the buoyant Archimedean force, the presence of which is due to the vertical temperature gradient in the lithosphere. The physical variables in equations (12) – (14) depend on the horizontal coordinate x, the vertical coordinate z, and time t. Applying the Fourier transform in the coordinate x and the Laplace transform in time t to these equations and excluding all physical variables except the vertical displacement, we arrive at the relations

where the differential operator D = d/dz is introduced, and U0=U0(x, z) is the initial (t = 0) distribution of vertical displacements. In the equations (50) – (53), the Fourier transforms of the physical variables are denoted by corresponding capital letters, the Laplace images are marked with the asterisk, k is the wave number (the Fourier variable), s is the Laplace variable. Then we obtain the ordinary differential equation for the vertical displacement

The solution of equation (54), which satisfies the boundary condition for z⟶ – ∞, is written as

where C1 and C2 are arbitrary integration constants that depend on the Laplace variable, and the wave number k can take negative values. Substitution of the solution (55) into the boundary conditions (19) – (20) allows us to eliminate arbitrary constants and represent the vertical displacement of the upper surface (z = 0) in the form

where G*A = As1/3 is the analog of the shear modulus for the Andrade medium. It should be noted that the substitution of (50) and (53) into the boundary condition (19) leads to the relation C2 = – C1 /k, at which horizontal displacements and tangential stresses are absent on the upper surface. Thus, when searching for a solution to equation (54), one can replace the boundary condition (19) with the condition U*x= 0 at z = 0 or with the condition Σ*xz= 0 at z=0.

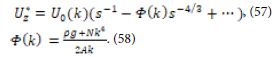
In order to find the asymptotic (small times) dependence of the Laplace origin on time, it is sufficient to expand the Laplace image in a series in powers of s in a neighborhood of s = ∞ and invert by Laplace each term of the series [17]. The right-hand side of (24) for s⟶ ∞, is representable in the form of a series

Inverting the terms of the series (57), we obtain the asymptotic dependence of the vertical displacement on time

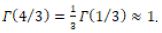
where the gamma-function at the point 4/3 is estimated as

The asymptotic dependence (59) is valid when

As follows from (60), the asymptotic dependence (59) can be represented in the form

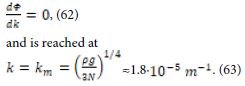
The function Φ(k) has a sharp minimum, which is found from the condition

If we switch to the length scale introduced above d=2∗105 m, this wave number takes the value Km= 3.6

At large times, the displacements of the surface are described by another asymptotic formula. In the neighborhood of the point s = 0, the right-hand side of equality (56) can be represented as a series  

According to the theorem on the asymptotic behavior of the original [17], the Laplace original at large times can be represented as a series whose terms are obtained as a result of the inverse Laplace transform of each term of the series (64). Keeping only the first term of the expansion, we find

Asymptotic dependence (65) is valid at large times, when

As follows from (65), at large times, harmonics with different wave numbers k decay according to the same law t-1/3 and the effect of propagation of surface displacements, which occurs at small times, disappears. Since the minimum value of Φ(k) is achieved at k=km , inequality (66) is satisfied for any wave numbers if

If the medium underlying the elastic upper crust had the rheology of a Newtonian fluid with viscosity η, the analogue of the shear modulus G*A(s) should be replaced by ηs, and equation (56) would be written as

Inversion of the Laplace image (68) yields

where τ is the recovery time, depending on the wave number k. Relation (69) is valid for any times t, in contrast to relation (61), which characterizes the Andrade medium and is valid only for not too large times, limited by condition (60).

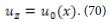
Let at the initial instant t = 0 the displacement of the upper surface (z = 0) be given as

The Fourier transform of the function (70) is

and the inverse Fourier transform gives

Inversing the Fourier image (61), we find

In the case when u0=x is an even function, (73) can be written as

Let the initial displacement have the form of a “step”

If x<-1/2 or x > 1/2 

The Fourier transform for such a “step” has the form

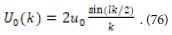
For a sufficiently large width l of the initial perturbation, the values of the function (76) are very small when k > 2π /l, i.e., the wider the perturbation region, the narrower the range of wave numbers k, in which the Fourier image is different from zero. Thus, the integration on the right-hand side of (74) is carried out over the region k<2π/l in the neighborhood of the point k = 0. According to the solution (55), for a fixed wave number k, the isostatic flow causes displacements in the lithosphere, depending on the depth as exp (- kz). Since k < 2π /l, we can say that this flow penetrates into the lithosphere to a depth of the order of l/π. Therefore, the flows arising after the removal of small-scale glaciations or other surface loads (for example, drying salt lakes), for which l does not exceed 200 km, are concentrated in the lithosphere. Caused by large-scale glacial loads (l ≈ 1000 ÷ 3000 km) flows that penetrate into the low mantle and recover isostasy over a period of time of about 10,000 years, are not considered in this paper.

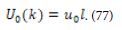
As follows from (76), when the width of the initial perturbation is small (lk << 1), the Fourier transform does not depend on k

The image (77) corresponds to a point initial perturbation

where δ (x) is the delta function

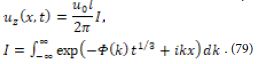
In the case of a point initial perturbation (perturbation of any initial width l can be regarded as a point perturbation when we consider displacements at a sufficient distance from the initial perturbation, that is, for x >> l) , it is possible to obtain an analytic solution of the problem of vertical surface motions. For the point initial perturbation, the dependence of the vertical displacements of the surface on the horizontal coordinate and time is determined by the integral

As follows from (62), the expansion of the function Φ(k) in a power series in the neighborhood of has the form k=km

where

The power series (80), which represents the function Φ(k) given by (58), converges when |k-km|≤km, i.e., the radius of convergence of this series is R=km

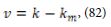
After changing the variable

the integral (79) takes the form

Equation (83) can be rewritten as

where

The integral on the right-hand side of equality (84) is calculated using the saddle point method used in the theory of functions of a complex variable [18]). The stationary point vo is found from condition

The function of the complex variable f(v), which is given by (85), has a stationary point

As follows from (87), in a neighborhood of the stationary point vo, the function f (v) can be represented in the form

Substituting (88) into (84), we obtain

By choosing such a path of integration in the complex plane, which is determined by the saddle-point method, we find the relation

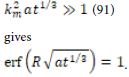
where erf(x) is the error function, and R=km is the radius of convergence of the power series (80). At times significantly exceeding 1010s ≈ 300 years, the condition

It is known that erf(x)=1 for x>>1, and the value erf(x) is close to 1 for x > 1.

Thus, as follows from (79), (89) and (90), the required distribution of the vertical displacements of the surface takes the form

The found solution (92) is valid for sufficiently long times (from several hundreds to several thousand years). The upper bound on time is imposed by condition (60), in which k=km.

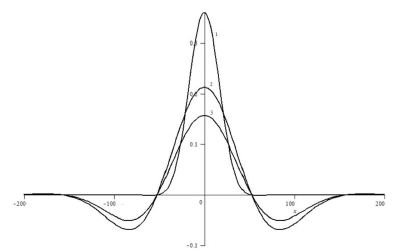
The graphs in Figure 1 are constructed by the relation (92) and show the dependence of the vertical displacements on the horizontal coordinate at different instants of time.

Figure 1: The dependence of the vertical displacements of the Earth’s surface on the horizontal coordinate at different times for the case when the width of the region of the initial displacement l is 10 km. Curve 1 corresponds to 30 years, curve 2 to 300 years, curve 3 to 1000 years.

By differentiating the right-hand side of (92) with respect to t for a fixed value of x, it is not difficult to find the velocity of the vertical motion of the Earth’s surface at points sufficiently far from the region of the initial disturbance of the relief. For example, when uo= 100 m, l = 10 km, x = 100 km, the velocity  reaches its maximum value (about 1 mm/year) during the time t ≈ 600 years. The generalization of the considered case of the initial point vertical displacement to the 3D problem formulation implies not too much new to understanding of the process under consideration: it is sufficient to replace the coordinate x by the polar coordinate r in Figure 1 (the solution does not depend on the polar angle for the point perturbation of vertical displacement). The initial disturbance of the Earth’s surface leads not only to diffusion-type waves, but also to seismic waves and convective waves. Diffusion-type waves cannot be considered without the initial disturbance, which produces a spectrum of harmonics. Each of these harmonics is not a traveling wave. The wave effect appears only when the entire spectrum is considered.

In the previous section, traveling harmonic waves, both convective and elastic, were considered. The solutions obtained can be represented as

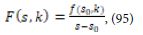
where uo is the initial vertical displacement of the surface, ω=Imλ, Λ=Reλ, and λ is the found value of the complex decrement (Reλ<0). The use of the Laplace transform allows us to find an arbitrary constant C. To do this, we transform the original equations using the Laplace transform, and substitute the resulting general solution, containing arbitrary constants, into the boundary conditions Laplace transformed. As a result, we find the function F(s, k) and obtain a solution to the problem in the form of a Laplace image

To invert the Laplace image (94), we can use the well-known theorem on the asymptotic behavior of the original [17]. According to this theorem, in order to find an asymptotic solution at large times (t → ∞), it is sufficient to know the Laplace image in the neighborhood of the singular point . In our case, this singular point is a first-order pole, in the neighborhood of which

and the Laplace original has the form

The pole so is equal to the complex decrement λ found in the previous section.

Expression (96) is the Fourier image. To pass to the Fourier original, it is necessary to specify the function Uo(k) determined by the initial disturbance. As a result, we can obtain a solution in the form of a running wave packet.

Conclusion

The paper considers disturbances of the Earth’s surface relief caused by an initial small-scale disturbance that disrupts isostasy. The solutions of the equations of continuum mechanics are obtained using the Fourier transform with respect to the spatial horizontal coordinate and the Laplace transform with respect to time [19]. The propagation of vertical displacements along the Earth’s surface from the region of the initial perturbation is carried out by surface waves. At short times, the presence of vertical temperature gradient in the lithosphere can be neglected and a solution in the form of a decaying seismic wave can be obtained. In this case, the creep of the medium, leading to attenuation, is described by the rheological Lomnitz’s law. At very short times, creep can also be neglected, obtaining a solution in the form of an elastic Rayleigh wave. At very long times, the elasticity and inertia of the lithosphere can be neglected but, taking into account the vertical temperature gradient, a solution in the form of a thermoconvective wave can be obtained. At not too large and not too small times, one can neglect not only elasticity and inertia, as in the description of a thermoconvective wave, but also thermal effects, as in the description of Rayleigh waves, obtaining a wave of the diffusion type that occurs in the process of isostasy recovery.

The initial disturbance determines the spectrum of wave numbers k. Elastic Rayleigh waves are characterized by large values of k and propagate very quickly, determining the relief of the Earth’s surface only in the first seconds after the disturbance occurs. Thermoconvective waves are characterized by small values of k (large wavelengths) and propagate very Diffusion-type waves correspond to values of k lying between the wave numbers characteristic of thermoconvective waves and the wave numbers characteristic of Rayleigh waves. The wave character of the solution at short times is due to inertia, and at long times – to the vertical temperature gradient. In the case of Rayleigh and thermoconvective waves, each harmonic moves according to the law , where ω is the frequency and Λ(k) is the decrement. In a diffusion-type wave, each harmonic is motionless, and the harmonic with the wave number (wavelength decays most slowly. Wave motion appears after the inverse Fourier transform due to the dependence of attenuation on k.

Conflict of Interest

The author declares no conflicts of interest in this paper.

References

  1. Goetze C (1971) High temperature rheology of Westerly J Geophys Res 76: 1223-1230.
  2. Goetze C, Brace WF (1972) Laboratory observations of high-temperature rheology of rocks. Tectonophysics 13: 583-600.
  3. Murrell SAF, Chakravarty S (1973) Some new rheological experiments on igneous rock at temperatures up to 1120°C. Geophys J Roy Astron Soc 34: 211-250.
  4. Murrell SAF (1976) Rheology of the lithosphere – experimental Tectonophysics 36: 5-24.
  5. Berckhemer H, Auer F, Drisler J (1979) High-temperature anelasticity and elasticity of mantle peridotite. Phys Earth planet Inter 20: 48-59.
  6. Weertman J (1978) Creep laws for the mantle of the Phil Trans Roy Soc London A 288: 9-26.
  7. Karato S (2008) Deformation of Earth An Introduction to the Rheology of Solid Earth. Cambridge university press.
  8. Birger BI (1998) Rheology of the Earth and thermoconvective mechanism for sedimentary basins formation. Geophys J Inter 134: 1-12.
  9. Birger BI (2000) Excitation of thermoconvective waves in the continental Geophys J Inter 140: 24-36.
  10. Birger BI (2012) Transient creep and convective instability of the Geophys J Inter 191: 909 – 922.
  11. Birger BI (2013) Temperature-dependent transient creep and dynamics of cratonic Geophys J Inter 195: 695-705.
  12. Birger BI (2018) Andrade Creep at the Isostasy Recovering Flows in the Izv Phys Solid Earth 54: 849-858.
  13. Birger BI (2007) Attenuation of seismic waves and universal rheological model of the Earth’s Izv Phys Solid Earth 43: 635-641.
  14. Birger BI Internal friction in the Earth’ crust and transverse seismic waves. AIMS Geosciences 8: 84 – 97.
  15. Cathles LM (1975) The viscosity of the Earth’s mantle. Princeton university press.
  16. Turcotte and Schubert G (1982) Geodynamics: Application of Continuum Physics to Geological Problems. New York: John Wiley.
  17. von Doetsch G (1974) Introduction to the Theory and Application of the Laplace Transformation.
  18. Copson ET (2004) Asymptotic Cambridge University Press.
  19. Birger I. (2024) Instability of the Earth’s lithosphere. Cambridge Scholars Publishing.

Draft on Hygiene and Infection Prevention in Outpatient Care for the Second Quarter of the 21st Century – An Europe- and German-centred Perception

DOI: 10.31038/IDT.2025624

Abstract

Professional care and nursing for people in need of care in Germany faces a number of serious challenges. Due to the demographic development and the recruitment of nursing personnel and aides of different educational and professional background, an increasing number of people in need of diverse forms of care encounter a diversity of nursing personel with a variety of language and professional skills.

A basic pillar of healthcare and nursing, hygiene and infection prevention, stands under high pressure. On the one hand, the concept of hygiene in a home environment is heavily person-bound and may widely diverge between person in need of care and nursing personnel. On the other hand, practice and interpretation of the recommendations for infection prevention of the leading healthcare institutes, as well as the basic learning contents, are highly variable, at times deficient or not present at all.

The perceptions of when hands or gloves are contaminated differ considerably. The touching of different surfaces and objects in the working environment during a workflow often does not agree with strategies to minimize the spreading of pathogenic germs. Also, wearing a protection mask is handled at will, at times covering mouth and nose, at times only the mouth, at times sitting under the chin.

This way of nursing practice meets a world of pathogens, in which the bacteria during the last 50 years underwent a genuine evolutionary change. Antibiotic-resistant bacteria now pose an over-size challenge for the current practice of home nursing and care for elderly. An adjustment in education, quality validation, and appreciation of hygienic competent work is of need.

Keywords

Pathogens, Antibiotic resistance, Home nursing, Asepsis, Infection prevention

Introduction

Over the past 150 years, life expectancy in our country has more than doubled [1], maternal and infant mortality have fallen to a fraction of what they were in 1872 [2], and the importance of infectious diseases as a cause of death has been almost entirely replaced by heart and circulatory diseases or malignant neoplasms [3].

In the mid-19th century, tuberculosis was the number one death angel in Germany, apart from times of war and years of severe cholera epidemics; today, the “tubercle bacillus” Mycobacterium tuberculosis plays hardly any role in Germany [4].

Due to an adaptation process of various bacterial strains to the rapidly increasing use of antibiotics following the enormous success of Penicillin G in field hospitals during World War II, the golden age in the fight against bacterial infections is at stake [5]. Strains of different bacterial species are establishing antibiotic resistances combined with high virulence, and are developing into pandemic threats [6,7]. They are responsible for a large share of deaths worldwide related to bacterial infections. National leading institutions point to an expected resurgence of deaths from infectious diseases and call for general attention [8].

These infections have been closely monitored in hospitals, while outpatient settings and the general population are only gradually becoming aware of the situation. The permeability of the interface between inpatient care, nursing homes, and home care highlights a critical problem in this context [9]. It is questionable whether the hygiene standards found in current outpatient care at home or in shared living arrangements are sufficient to deal with this threat.

The Threat

In a comprehensive study, an inventory of deaths from antibiotic-resistant infections and their distribution across the continents was carried out for the year 2019 [6]. Modeling for the expected development up to the year 2050 shows an increase [7], which, even in the Western world, places death from infectious disease on an equal footing with death from cardiovascular diseases or malignant neoplasms. The seriousness of this situation is expressed, for those not directly affected, in the call for attention from national leading institutions and ministries [8].

Now, the grim reapers in the Western World are no longer Mycobacterium tuberculosis, but Escherichia coli, followed by Staphylococcus aureus, Klebsiella pneumoniae, Streptococcus pneumoniae, Acinetobacter baumannii, and Pseudomonas aeruginosa [6] (Table 1). The organism described by the physician Friedrich Escherich in 1885, isolated from the rectum of a girl, ranges in appearance from a beneficial gut commensal to a highly virulent pathogen. Various E. coli strains are equipped with genes for different pathways of antibiotic inactivation or toxin production [10-12], thereby offering a high diversity of virulence mechanisms.

Table 1: Pathogen spectrum and antibiotic resistance in community-acquired and nosocomial infections

A) Urinary tract infections, pathogen prevalence, antibiotic resistance.

Study objective

Pathogen spectrum

References

Pathogen spectrum uncomplicated cystitiscomplicated urinary tract infection E. coli (70–80%),Staphylococcus saprophyticus (5-15%), .IIn individual cases, other enterobacteria like Proteus mirabilis, Klebsiella spp. Enterococcus ssp.

E. coli and other enterobacteria, enterococci

Pseudomonas ssp.

[41] Wagenlehner et al.Urinary tract infections (UTI)Akt Urol 2014; 45: 135–146
Pathogens of catheter-associated urinary Tract infections E. coli (43,6%, ESBL-positive proportion 11,8%), Enterococcus spp. (23,0%), P. aeruginosa (10,7%), Klebsiella spp. (10,3%), Proteus spp. (9,6%),S. saprophyticus (2,2%),S. aureus (3,2%) [42] KRINKO at the RKI, Bundesgesundheitsbl 2015 · 58: 641–650 DOI 10.1007/s00103-015-2152-3
Nosocomial urinary tract infections and resistenciesUrosepsis pathogens global in urology70 countries

ca. 30.000 participants

(Prevalence Europe; Global)

E. coli (41%; 43%),P. aeruginosa (13%; 10%),Enterococcus (12%; 11%),

Klebsiella spp. (8%; 10%)

Enterobacter spp (6%; 6%),

Proteus spp. (4%; 4%)

Staphylococcus aureus (4;4)

Acinetobacter spp (1%; 2%)

45% of Enterobacteriaceae and 21% of P. aeruginosa multidrug-resistant.

[43] Tandoğdu Z, Bartoletti R, Cai T, et al. Wagenlehner R,Resistance patterns of nosocomial urnary tract infections in urology departments: 8-year results of global prevalence of infections in urology study. World J Urol 2013;
Pathogen spectrum and resistance rates in community-acquired uncomplicated urinary tract infectionsNationwide cross-sectional study in Germany 2019-212390 study participants E. coli (70,5%),Klebsiella pneumoniae (5,5%), Enterococcus ssp (5,2%), Proteus mirabilis (4,6%), Staphylococcus ssp (4,8%)Resistance rates in E. coli depending on previous infections, with a single infection being <15% [14] Klingeberg et al.,Dtsch Arztebl Int 2024; 121: 175-81; DOI: 10.3238/arztebl.m2023.0267

B) Pathogen spectrum in nosocomial infections in healthcare facilities.

Nosocomial infections in long-term care facilities in 2016German results of the HALT 3 study131 facilities

10,556 residents

Infectionsof the urinary tract (31.1%)of the respiratory tract (24.3%)

of the skin/soft tissue (23.7%)

21 microbiological diagnostics:

2 viruses, 1 fungus

6 E. coli, 3 Pseudomonas aeruginosa, 3 Streptococcus pneumoniae,

2 Staphylococcus aureus,

2 Clostridoides difficile


[13] Schmidt N. et al.,Bundesgesundheitsbl. 2022; 65: 863–871 https: //doi.org/10.1007/s00103-022-03566-3
Prevalence of nosocomial infections in German hospitals in 2016218 hospitals64,412 patients E. coli (16,6%),Clostridoides difficile (13,6%), Staphylococcus aureus (12%), Enterococcus faecalis (6,9%), Pseudomonas aeruginosa (5,8%) [44] Behnke M, Aghdassi SJ, Hansen S, Peña Diaz LA, Gastmeier P, Piening B: The prevalence of nosocomial infection and antibiotic use in German hospitals. Dtsch Arztebl Int 2017; 114: 851–7. DOI: 10.3238/arztebl.2017.0851

C) global impact and spectrum of pathogens of antibiotic-resistant bacteria.

Global burden of bacterial antibiotic resistance 2019for 23 pathogensin 204 countries the 6 leading pathogens associated with deaths related to antibiotic resistanceEscherichia coli, Staphylococcus aureus, Klebsiella pneumoniae, Streptococcus pneumoniae, Acinetobacter baumannii, Pseudomonas aeruginosaresponsible for approximately 929,000 deaths due to AMR and around 3.6 million deaths associated with AMR in 2019. [6] Antimicrobial Resistance Collaborators. Global burden of bacterial antimicrobial resistance in 2019: a systematic analysis. Lancet. 2022 Feb 12;399(10325): 629-655. doi: 10.1016/S0140-6736(21)02724-0. Epub 2022 Jan 19.

Infections caused by Escherichia coli have long been clinically recognized, as they are responsible for a large proportion of urinary tract infections (UTIs) (Table 1). In the HALT-3 surveys on nosocomial infections in long-term care facilities, UTIs were recorded as the greatest burden in Germany on a reference day in 2016, with E. coli being the most frequently detected bacterium [13]. In a cross-sectional study from 2019-21 on resistance rates in community-acquired UTIs, E. coli was detected in 75.4% of cases, with a significant number of resistances against various antibiotics [14]. The second most frequently detected bacterium was Klebsiella pneumoniae.

In the HALT-2 study, methicillin-resistant Staphylococcus aureus was still in the foreground as the first notable antibiotic-resistant pathogen in the German healthcare system [15]. Antibiotic-resistant Staphylococcus aureus are known for causing wound infections and respiratory tract infections [16]. For the years 2021/22, a declining incidence of antibiotic-resistant Staphylococcus aureus was reported in Germany compared to other regions in Europe [17]. A problematic MRSA strain, which was able to spread in the USA and evolved from a skin and soft tissue infection pathogen to a sepsis-causing pathogen, has not established itself in Europe [18].

The report from the German national reference center for Gram-negative hospital pathogens can be regarded as a proxy for the burden of antibiotic-resistant bacterial infections [19]. The increase in submissions of bacterial isolates for the years 2022–2023 by more than 7%, mostly for the investigation of reduced carbapenem susceptibility or carbapenemase activity, reflects an actual rise in resistance to beta-lactam antibiotics as used in hospitals. In addition to the Enterobacterales E. coli and Klebsiella pneumoniae and others, Pseudomonas aeruginosa and Acinetobacter baumannii are also strongly represented.

The worldwide occurrence of highly problematic strains of the species Klebsiella pneumoniae [20], Acinetobacter baumanii [21], and Enterococcus faecium [22] highlights the issue at stake. Together with viral pathogens [23], they confront healthcare with changing challenges. In particular, elderly care and care provision in nursing homes seem to be on shaky ground [24].

The Challenge

Clean and Uncontaminated – Incorrect Teaching and Basic Assumptions

In the patient’s room, the geriatric nurse tells her student that “there are no bacteria in this clean room and no risk of contamination”. She then continues, saying she “does not need to disinfect the hands anymore since she already disinfected them in the hallway earlier”. After having changed her clothing, brushed her hair back with her hand, and touched two door handles after hand disinfection, 3 different ways of introducing germs, skin, hair, and cloths of care givers, but also surfaces in the patient surroundings, like door handles and bed control, since they are not freshly disinfected, are not recognized.

This kind of false communication in such a mixed teaching/nursing situation Is one reason for the establishment of entirely wrong beliefs in nursing students on pathogen sources (Ernsberger, 2024, not puplished). Indeed, a significant portion of the nursing staff in outpatient care share the belief that hand disinfection upon entering the care area ensures clean hands throughout the entire stay. Similarly, a surprisingly large number of nurses assume that they can assess the degree of contamination in a care area with the naked eye (Ernsberger, not published).

A striking example is the assurance by a senior managing caregiver that the urine in this drainage bag looks clear and clean. In fact, a few days earlier, laboratory tests had confirmed stable colonization with Pseudomonas aeruginosa in this urine at a density of >100,000 colony-forming units [25]. The colonizations that are reliably recognized as such by the outpatient care staff are in urine with clouds of bacteria aggregated in flakes. This corresponds to bacterial cultures in a senescent growth phase, which have gone hours or days beyond their exponential growth phase.

In these frequently observed cases in outpatient care, serious misjudgments by numerous caregivers become apparent. The knowledge that microscopy and time-intensive observation under suitable laboratory conditions were necessary to allow Robert Koch, for the first time 150 years ago, to make bacteria visible to the eye [4] is largely unknown. Equally unknown is the understanding of the historical development of concepts on the nature of infectious diseases and the germ theory of infection causation [26].

These case studies demonstrate how failures in teaching and evaluation may misguide nurses to decide for a non-appropriate safety level and disinfection regime for a planned workflow.

Hand Hygiene – A Surprisingly Demanding Matter

The “five moments of hand hygiene” defined by the WHO and specified in national guidelines [27,28] are considered the most effective single measure for preventing the spread of germs and the most useful means to reducing nosocomial infections. However, their full application to essential nursing routines, such as emptying a patient’s urine drainage bag and assisting with elimination, is not sufficiently followed by many outpatient care workers [24].

Deficient hygiene practice, inadequate training, and the lack of continuing education programs among outpatient care workers in a residential long term care facility, associated with the spread of MRGN4 Acinetobacter baumannii, highlights the scale of the problem [9]. Due to problems in hygiene competence, there is currently not sufficient protection against the spread of viral or bacterial pathogens in many home care settings.

In outpatient care, the WHO recommendations on hand hygiene, the section D [27], summary on the use of gloves, is most frequently violated. The section “D. When wearing gloves, change or remove gloves in the following situations: during patient care if moving from a contaminated body site to another body site” [27-30] is often not followed, and if followed, only efficient when the workflow is well structured. Especially when assisting with excretions, there are many opportunities for cross-contamination when both hands are involved [24]. Confusion of left and right hand will easily result in the spread of Enterobacteriales and Enterococci.

Focusing the work of one hand on tasks in contaminated areas, such as removing feces or operating the drainage port of the urine bag, and the other hand on tasks to be performed cleanly, such as supporting the patient, selecting hygiene papers, or operating the bed control, requires good preparation and high concentration (Table 2). Maintaining such a strait workflow for both hands, and not switching between sides, is not easily achievable for many caregivers. Errors at this time have the potential to transfer Enterobacteriaceae or Enterococcaceae from stool and, possibly, Pseudomonas aeruginosa from bacteriuria into the bed environment, the bathroom sanitary installations, hygiene paper storage areas, or even clothing via contaminated disposable gloves [31].

Table 2: Common misjudgments and hygiene violations and affected pathogens.

Hygiene violation or misjudgment

Affected activities or items

Affected or spread pathogens

Misjudgment of cleanliness Contaminated disposable gloves from assistance with excretions

assistance with urine from bacteriuria or urinary tract infection

surface not freshly disinfected for temporary storage

alle germs from previous activities

Escherichia coli, Enterococcus spp,
Klebsiella spp, Proteus mirabilis, u.a.

Escherichia coli, Pseudomonas aeruginosa,

Enterococcus spp. Klebsiella pneumoniae u.a.

poorly defined microbial mixture from the patient’s environment

Incomplete preparation Too little hygiene paper
Disinfection aid supplies forgotten
No suitable disposable gloves
During a hasty trip to the storage area, door handles, cabinet handles, and supply depot packages became contaminated with germs from the excretions (see above) due to wearing contaminated gloves
Inadequate hand hygiene Dirty hands perform tasks that need to be kept clean
when assisting with excretions
when emptying the urine bag
Fingernails and jewelry
With assistance with excretions; pathogens (see above) transferred to bed, control devices, surfaces, and in the storage area

urine drops and splashes pathogens (see above) transferred to bed, control devices

foreing pathogens

Inadequate training No employee notes With inaccurately remembered and shortened workflows, hygiene-relevant steps are forgotten from memory.

Pathogens, Their Nature, and Their Means of Transmission – An Underrated Subject in Care

Conversations about hygiene and causes of infection with nursing staff in outpatient care, unfortunately, often fizzle out very quickly. Language skills play a role, given the increasing number of nursing staff from countries with highly different language background. Personnel from countries with highly diverse language and cultural backgrounds shall be reached by educational and Informational texts on the nature, ways of transmission, and clinical pictures attributed to different pathogens [32].

Providing short and easy to read texts in the native language of nursing staff (arabic, amharic, english, german, serbo-croatian, vietnamese) has a 2-fold intention. On the one hand, they shall explain the reasoning behind certain hygiene protocols in light of the different transmission pathways of the different classes of pathogens. On the other hand, the hope is to spark interest by addressing caregivers in their mother’s language, and to sensibilise for the challenge set by the transmission pathways used by antibiotic-resistant bacteria.

A significant factor here is the commitment of the nursing management and the quality of training in the nursing service. However, it, unfortunately, is common practice that clients or patients of nursing services are not informed about continuing education activities, and they are also not announced on the nursing services’ websites.

Risk in Both Directions – The Correct Use of Personal Protection Equipment

The transmission of germs in outpatient care is not a one-way street. The spread of bacterial germs through contact and smear infection, coughing, or cuts and puncture injuries transmits pathogens both toward the care recipient and the caregiver. Similarly, the transmission route of viral pathogens through aerosols, coughing, or smear infection is initially open in both directions.

Personal protection equipment (PPE) [33], disposable gloves and mouth-nose masks provide tools that should protect the staff, i.e., caregivers, reliably. However, the effectiveness of these aids in protecting personnel depends on correct handling (Table 3). The proper handling of PPE also plays a central role when it comes to disposable gloves. Here, timely donning, as well as timely removal or changing, is of central importance (Table 2).

Table 3: Training and further education deficits in the face of highly virulent bacterial and viral pathogens.

Poor hygiene knowledge and awareness Too often a lack of interest in questions about the biology and clinical aspects of pathogenstoo often a lack of interest in clinical microbiologythe importance of hygiene for infection prevention remains unclear Knowledge of the nature and distribution of viral and bacterial pathogens is very limited
the design of aseptic work routines is too often inadequate [39]
hygiene is often considered a nuisance, and its central importance for personal and public health is not clear
Lack of awareness about the pathogen load of lifestyle accessories Jewelry, necklaces, braceletsFingernails and hair Transfer of germ profiles between/from patients, staff, and personal surroundings including pets, also directly into the patient’s bedGerm reservoir strongly dependent on prior activity, personal hygiene,in particular Staphylococci, Enterococci, and Enterobacteriales
Deficits in the use of personal protective equipment Putting on the mouth-nose protective mask too late and taking it off too early, removing it temporarilytaking off contaminated disposable gloves too late Transmission of bacterial and viral pathogens in droplets and aerosolsTransmission of all germs from the area of activity and work, including Enterobacteriaceae,Enterococci, Pseudomonas, Staphylococci
Insufficient knowledge of asepsis and lack of aseptic work routines The necessity to always disinfect surfaces in new care situations or after contamination is often not recognized.The point at which disposable gloves become contaminated is not recognized.The classification of work areas and procedures according to an ANTT [39] often seems unfamiliar. This way, germs from previous care procedures can be carried over into new workflows.Pathogens from assistance with excretions and emptying urine are spread in this process (see above).Often, unclean, open areas are chosen for temporary placement, and contaminations already present there are carried further.

The example of a caregiver (Ernsberger, unpublished), who attends to clients scattered throughout the neighborhood with one pair of gloves, is an example that hardly ever comes to public attention or legal scrutiny. This stands in reprehensible contradiction to the WHO recommendations ‘C. Remove gloves after caring for a patient – do not wear the same pair of gloves for the care of more than one patient.’ [27]. Such behaviour risks to deposit bacteria and other pathogen collection of unknown composition in the environment of a person in need of care and the caregiver himself.

This is an example to illustrate how important continued education Is for the knowledge of hygienic principles in outpatient care, not only in Germany, for the sake of Infection prevention and well-being of the people in need of care and the caregivers.

Final Considerations

Hygiene Violations – Poor Planning and Execution on Various Levels

For an observant person in need of care, it becomes apparent how many problems arise from incomplete work preparation (Table 2). A rushed walk of the caregiver in the middle of assistance with excretions to the supply rooms is often because not enough hygiene papers were prepared for assistance, or because the disinfectant spray was forgotten during urine disposal. Here, the careful, thoughtful preparation makes a decisive difference.

Of a different nature are two levels of hygiene violations: knowledge that should be present from recommendations and learning content Issued by leading institutes for healthcare.

For the classical task of emptying urine drainage bags, examples include the height of the urine bag to remain below bladder level, preventing drips at the drainage port, and disinfecting wiping of the same [34]. In assistance with fecal excretion, it is changing gloves before transitioning from wiping to putting on a new incontinence pant [35].

A new level seems to be emerging with the development of antibiotic-resistant bacteria. The is the impression that many caregivers are aware that such a problem exists, but not that it could occur in their outpatient work. It appears that education and training “providing information about the nature and occurrence of pathogenic germs” could form a foundation for care in the coming decades. This should be complemented by a detailed examination of the surfaces in the work environment and their potential germ colonization.

Asepsis and Antisepsis – A Puzzling Relationship for Many Home Caregivers

The aseptic non-touch technique (ANTT) [36], is not well established in outpatient care in Germany. The division of a work environment into areas that must strictly be kept clean and free of contamination, the distinction between areas with different levels of cleanliness or microbial load, and the planning of workflows to prevent contact with contaminated areas during steps that need to remain clean, is too often inadequate. The question of infection prevention and its monitoring in home care arises only late and has only become a subject of serious consideration after the COVID-19 pandemic [37].

Unfortunately, hygiene and discussions centered around this topic, pathogens, and the nature of infectious diseases are often perceived as unnecessary or disruptive in the usual care context. The legacy of Semmelweis, Pasteur, Lister, and Koch has not made the impact here that it did in general hospital care and particularly in surgery [38,39]. Looking at the massive damage caused by the SARS-CoV-2 pandemic in residential facilities [40], the question arises how a genuine interest in this health care pillar can be triggered, In particular to promote the development of evidence-based infection prevention in home care

Conclusions

Currently, too many working routines in outpatient care are not suitable for containing the spread of bacterial strains via contact infections, droplets, or aerosols.

One aim is a better education, verification and training, combined with appropriate reward and recognition. The establishment of antibiotic-resistant bacterial reservoirs in the environment of people in need of care, due to inadequate structuring of nursing routines, lack of knowledge about asepsis, or wearing hygienically inappropriate lifestyle accessories and jewelry, must be strictly avoided.

Demanding outpatient care services to document their level of training and certified continuing education in hygiene, aseptic work practices, the use of PPE for staff and clients, as well as knowledge in clinical hygiene on their websites provides a way to link an obligation for hygiene training and continuing education with an information duty towards clients

Conflict of Interest

The author, UE, states that there is no financial conflict of interest.

Acknowledgments

The author, UE, is grateful to Ute Wagner for extensive support and discussion on individual topics. The late specialist nurse Pedro Zieba contributed to initiating the project. Lorenz and Martin Sieber initiated the electronic working environment for preparing the manuscript (completely without AI and ChatGPT).

References

  1. https://www.destatis.de/DE/Themen/Gesellschaft-Umwelt/Bevoelkerung/Sterbefaelle-Lebenserwartung/sterbetafel.html?templateQueryString=1+zu+10+rechner&templateQueryString=1+zu+10+rechner; Entwicklung der Lebenserwartung in Deutschland – Statistisches Bundesamt;
  2. https://www.bib.bund.de/DE/Fakten/Fakt/pdf/S10-Saeuglingssterblichkeit-ab-1872.pdf?__blob=publicationFile&v=4; S10-Saeuglingssterblichkeit-ab-1872.pdf;
  3. https://de.statista.com/statistik/daten/studie/1284105/umfrage/todesursachen-in-deutschland-historisch/;Todesursachen in Deutschland 1892-2010| Statista;
  4. Loddenkemper R (2007) Die Entdeckung des Tuberkelbacillus. Dtsch Ärztebl 104: A775.
  5. Jean SS, Harnod D, Hsueh PR (2022) Global threat of carbapenem resistant gram-negative bacteria. Front Cell Infect Microbiol 12: 823684. [crossref]
  6. Antimicrobial Resistance Collaborators (2022) Global burden of bacterial antimicrobial resistance in 2019: a systematic analysis. Lancet 399: 629-655. [crossref]
  7. GBD 2021 (2024) Antimicrobial Resistance Collaborators. Global burden of bacterial antimicrobial resistance 1990-2021: a systematic analysis with forecasts to 2050. Lancet 404: 1199-1226. [crossref]
  8. Bundesgesundheitsministerium https://www.bundesgesundheitsministerium.de/fileadmin/Dateien/3_Downloads/G/G7/G7_AMR_de_2022.pdf; Antimikrobielle Resistenzen: Krankheitslast in G7-Staaten und weltweit;
  9. Schwerdtner N-L, Trommer S, Dietsch S, et al. (2020) Herausforderungen im Umgang mit MRE in außerklinischen IntensivpflegeWohngemeinschaften. Epid Bull 37: 3-11.
  10. Riley LW (2020) Distinguishing Pathovars from Nonpathovars: Escherichia coli. Microbiol Spectr 2020 8: 10. [crossref]
  11. Denamur E, Clermont O, Bonacorsi S, Gordon D (2021) The population genetics of pathogenic Escherichia coli. Nat Rev Microbiol 19: 37-54. [crossref]
  12. Nasrollahian S, Graham JP, Halaji M (2024) A review of the mechanisms that confer antibiotic resistance in pathotypes of E. coli. Front Cell Infect Microbiol 14: 1387497. [crossref]
  13. Schmidt N, Marujo V, Eckmanns T, Zacher B, Arvand M, et al. (2022) Healthcare-associated infections and antimicrobial use in long-term care facilities. German results of the third European point prevalence survey HALT-3]. Bundesgesundheitsbl 65: 863-871. [crossref]
  14. Klingeberg A, Willrich N, Schneider M, Schmiemann G, Gágyor I, et al. (2024) The percentage of antibiotic resistance in uncomplicated community-acquired urinary tract infections. Dtsch Ärztebl Int 121: 175-181. [crossref]
  15. Ruscher C, Schaumann R, Mielke M (2012) The challenge of infections and multiresistant bacteria among the elderly living in long-term care facilities. Bundesgesundheitsblatt Gesundheitsforschung Gesundheitsschutz 55: 1444-1452. [crossref]
  16. BfR, 2025, fragen-und-antworten-zu-methicillin-resistenten-staphylococcus-aureus-mrsa.pdf; https://www.bfr.bund.de/assets/01_Ver%C3%B6ffentlichungen/FAQ_deutsch/fragen-und-antworten-zu-methicillin-resistenten-staphylococcus-aureus-mrsa.pdf
  17. Layer-Nicolaou F, Strommenger B, Cuny C, Werner G (2023) Eigenschaften, Häufigkeit und Verbreitung von MRSA in Deutschland – Zur Situation 2021/2022. Epid Bull 44: 3-14.
  18. Planet PJ (2017) Life After USA300: The Rise and Fall of a Superbug. J Infect Dis 215: S71-S77. [crossref]
  19. Pfennigwerth N, Cremanns M, Eisfeld J, Hans J, Anders A, et al. (2025) Bericht des Nationalen Referenzzentrums für gramnegative Krankenhauserreger für das Jahr 2023. Epid Bull 2: 3-11.
  20. Jia X, Zhu Y, Jia P, Liu X, Yu W, et al. (2022) Emergence of a Superplasmid Coharboring Hypervirulence and Multidrug Resistance Genes in Klebsiella pneumoniae Poses New Challenges to Public Health. Microbiol Spectr 10: e0263422. [crossref]
  21. Ibrahim S, Al-Saryi N, Al-Kadmy IMS, Aziz SN (2021) Multidrug-resistant Acinetobacter baumannii as an emerging concern in hospitals. Mol Biol Rep 48: 6987-6998.
  22. Wei Y, Palacios Araya D, Palmer KL (2024) Enterococcus faecium: evolution, adaptation, pathogenesis and emerging therapeutics. Nat Rev Microbiol 22: 705-721. [crossref]
  23. Olano JP, Walker DH (2009) Agents of Emerging Infectious Diseases. Vaccines for Biodefense and Emerging and Neglected Diseases 30: 1-20. [crossref]
  24. Ernsberger U (2024) Pathogen-Verkehr am Patientenbett. HygMed 49: D43-D51.
  25. Ernsberger U (2025) Interrupting the spread of germs : The art of emptying urinary drainage bags. Urologie [crossref]
  26. Karamanou M, Panayiotakopoulos G, Tsoucalas G, Kousoulis AA, Androutsos G (2012) From miasmas to germs: a historical approach to theories of infectious disease transmission. Infez Med 20: 58-62. [crossref]
  27. WHO, 2009. Glove-use-information-leaf let.pdf (who.int) https://cdn.who.int/media/docs/default-source/integrated-health-services-(ihs)/infection-prevention-and-control/hand-hygiene/tools/glove-use-information-leaflet.pdf?sfvrsn=13670aa_10
  28. RKI, 2023. Medizinische Einmalhandschuhe und Schutzhandschuhe: Indikation und Desinfektion; https://www.rki.de/DE/Content/Infekt/Krankenhaushygiene/ThemenAZ/H/Handschuhe.html
  29. Gartmeier M, Baumgartner M, Burgkart R, Heiniger S, Berberat PO (2019) Why hand hygiene is not sufficient: modeling hygiene competence of clinical staff as a basis for its development and assessment. GMS J Med Educ 36: Doc39. [crossref]
  30. Imhof R, Chaberny IF, Schock B (2021) Gloves use and possible barriers—an observational study with concluding questionnaire. GMS Hyg Infect Control [crossref]
  31. Ernsberger U (2022) ESKAPE-Pathogene und -Infektionsketten – benutz te Einmalhandschuhe als Pathogen-Vektoren. Hyg Med 47: D44-D51.
  32. Ernsberger U (2023) Viren und Bakterien als Infektionsauslöser. Pflege Z 76: 34-35. [crossref]
  33. Hill B, Lamichhane G, Wamburu A (2024) Infection prevention and control: critical strategies for nursing practice. Br J Nurs 33: 804-811. [crossref]
  34. Ernsberger U (2021) Hygiene-Defizite bei der Versorgung suprapubischer Blasenkatheter und der Urinentleerung durch Pflegedienste in derhäuslichen Pflege. HygMed 46: D50-D57.
  35. Ernsberger U, Hilfe bei Ausscheidungen“in der häuslichen Versorgung bei bettlägerigen Pflegebedürftigen. HygMed 2023; 48: D36-D44.
  36. Clare S, Rowley S (2018) Implementing the Aseptic NonTouch Technique (ANTT®) clinical practice framework for aseptic technique: a pragmatic evaluation using a mixed methods approach in two London hospitals. J Infect Prev 19: 6-15. [crossref]
  37. Brockhaus L, Sass N, Labhardt ND (2024) Barriers and facilitators to infection prevention practices in home healthcare: a scoping review and proposed implementation framework. Infect Prev Pract 6: 100342. [crossref]
  38. Lepenos T, Sanoudou D, Protogerou A, Laios K, Androutsos G, et al. (2024) Louis Pasteur (1822-1895), Ignaz Semmelweis (1818-1865), Joseph Lister (1827-1912) and the Link Between Their Works Toward the Development of Antisepsis: A Narrative Review. Cureus 16: e62543. [crossref]
  39. Nakayama DK (2018) Antisepsis and Asepsis and How They Shaped Modern Surgery. Am Surg 84: 766-771. [crossref]
  40. Mbalayen F, Dutheillet-de-Lamothe V, Letty A, et al. (2022) The COVID-19 pandemic and responses in nursing homes: a cross-sectional study in four European countries. Int J Environ Res Public Health 19: 15290. [crossref]
  41. Wagenlehner FM, Pilatz A, Naber K, Weidner W (2014) Harnwegsinfektionen. Aktuelle Urol 45: 135-145.
  42. KRINKO beim RKI (2015) Prävention und Kontrolle Katheter-assoziierter Harnwegsinfektionen: Empfehlung der Kommission für Krankenhaushygiene und Infektionsprävention (KRINKO) beim Robert Koch-Institut. Bundesgesundheitsbl 58: 641-650. [crossref]
  43. Tandoğdu Z, Bartoletti R, Cai T, Çek M, Grabe M, et al. (2016) Antimicrobial resistance in urosepsis: outcomes from the multinational, multicenter global prevalence of infections in urology (GPIU) study 2003-2013. World J Urol 34: 1193-200. [crossref]
  44. Behnke M, Aghdassi SJ, Hansen S, Peña Diaz LA, Gastmeier P, et al. (2017) The prevalence of nosocomial infection and antibiotic use in German hospitals. Dtsch Arztebl Int 114: 851-857. [crossref]

Commentary: Rethinking Cultural Narratives of Infertility in Nigerian Cinema

DOI: 10.31038/AWHC.2025834


This study makes a noteworthy contribution to psychological research on reproductive health by revealing how cultural narratives shape personal experiences of infertility. Through a deconstruction of a hand‑picked array of Nollywood titles, the analysis draws a detailed picture of how entrenched convictions about motherhood, femininity, and marital expectations still map out the social and emotional landscape of infertility throughout Nigeria. The commentary then pulls apart the ramifications of these representations, pondering how media can either uphold or disrupt the prevailing norms.

Infertility stakes a claim in a sensitive, symbol‑laden corner of social life, where a woman’s sense of self is often judged by whether she can bear children. The movies surveyed reveal that infertility is far from a medical issue; it morphs into a public proving ground for character, virtue and societal worth. The women portrayed shoulder a load: unrelenting family pressure, biting social scrutiny and a deep‑rooted internalised shame.

The psychological strain that follows springs not from the inability to conceive but also from the cultural weight that childlessness carries. Jane, the protagonist of Wives and Infertility and Judith from 3 Nights and 3 Babies both lay bare how being stripped of agency can gnaw at a woman’s emotional core, seeping into every corner of her life. Their retreat, lingering grief, and the fear they keep locked inside echo the patterns repeatedly documented in research on infertility.

These movies illustrate how cultural myths that dump all responsibility onto women amplify the emotional weight they bear. By omitting any portrayal of infertility, the narratives reinforce gendered stereotypes that warp help‑seeking habits and postpone necessary medical care. This pattern mirrors real‑world trends where men tend to avoid fertility testing while women shoulder sanctioned blame. Such cinematic depictions matter because films function as mirrors, giving audiences the language to interpret infertility. When blame lands one‑sidedly and drags a stigma along, the mental repercussions are heavy. Self‑reproach, strife, and an ever‑growing sense of social isolation keep reappearing.

Even as the films delicately convey this heft, they simultaneously lay bare a deeper contest for self‑determination within the confines of patriarchal homes. Women navigate, endure and at times subtly push back against prescriptions, yet they often do so in muted tones, preserving both dignity and communal equilibrium. This understated bargaining mirrors the doctrines of nego feminism, which recognises that resistance, across African milieus, seldom erupts as overt confrontation. Instead, it emerges as calculated decision‑making that lets women persist within bounded environments. The psychological fallout of these coping tactics is, predictably, a tapestry. They may shield women from the social fallout, but in doing so, they leave them shouldering quiet, hidden emotional burdens that seldom get acknowledged.

The results also prompt questions about how the media either reinforces or challenges stigma. Nollywood’s reach spans millions, throughout Africa and its diaspora. When movies tie a woman’s identity closely to biological motherhood, they help shape a psychological climate that barely leaves room for alternative routes to building a family. The negative depiction of adoption and assisted reproduction in the films examined is especially worrisome, hinting that modern fertility solutions remain shadowed by suspicion and moral anxiety. These ramifications reach into health inform public‑health education and shape the broader societal openness to a range of reproductive choices.

At the time, the rich emotional texture of movies such as The Wait hints that Nollywood could indeed steer public opinion in a new direction. The support group shown in the film, for instance, carves out a space where shared vulnerability can surface and psychosocial healing can take root. If storytellers lean into arcs, they might spark healthier conversations about infertility by bringing male infertility into view, portraying reproductive technologies in a positive light and crafting narratives that affirm women regardless of their reproductive outcomes.

Ultimately, the paper invites psychologists, media scholars and public‑health practitioners to reflect on how cultural narratives intertwine with well‑being. It stresses that portrayals need to be more balanced while recognising infertility as a shared burden and encouraging empathy rather than judgment. As stigma keeps women and couples unheard, Nollywood still offers a powerful stage for rewriting the cultural scripts that shape attitudes and behaviour.

The study clears a trail for cross‑disciplinary ventures that knit together film, psychology, gender studies and public health. It urges a re‑imagining of reproductive narratives with one that honours infertility’s lived realities while refusing to amplify the surrounding cultural anxieties. By framing infertility as a shared challenge rather than a personal moral lapse, Nollywood can chip away at stigma and foster healthier psychological outcomes for the individuals and families navigating this intricate experience.

Inner Worlds Make Outer Worlds: Reflecting on 10 years of Research into Stuckness

DOI: 10.31038/PSYJ.2025754


Have you ever granted yourself the luxury of mapping the changes in your inner world against changes in your theory and meaning making?

I did.

I reviewed ten years (2016-2025) of researching stuckness to understand how my changing inner world created shifts in my theory of stuckness. This review is published by the Action Research Journal and entitled “Shamefully Stuck to Joyfully Jammed? Reflexivity in Researching Stuckness”.

This paper uses an Action Research approach to describe five cycles of change in my life and how these changes created shifts in my theory through the processes of reflexivity. It also speaks to the valuable role of co-researchers in my research eco-system. The outputs from this research included a doctorate, three papers, two books, and a coaching praxis.

Just as a frame, I work as an Existential psychotherapist and coach, living in South Africa, but working globally with corporate and public sector leaders. The research period began with a doctorate in Existential Psychotherapy at Middlesex University in 2016. I am now (2025) completing my second book and learning new things all the time. Stuckness has been a gift that just keeps on giving.

During these ten years I experienced a lot of change, including in my relationship to myself (and my stuckness), my racialised thinking, the impact of the deaths of five dearly beloved people, relationship break-ups, my ADHD explosion, and menopause. These factors created changes in my research including a more contextual and compassionate approach to stuckness and the broadening of the applicability of the theory created by working through my own racialised thinking. By engaging deeply with my own wounding, I was able to appreciate the role wounds play in initiating transformation. By engaging with my own losses, I was able to understand how transformation always includes many losses. Initially my theory positioned stuckness as a degenerative event experienced as a result of intrapsychic factors caused by individual deficiency. In straighter and less kind words, people got stuck because they were too pig-headed, stupid, or lazy to adapt.

Now I understand stuckness as a regenerative developmental impasse that allows us to digest our pasts and incubate a new future.

We all get stuck and this experience is essential for our transformation and adaption, it is stuckness that enables our evolution. One example of how changes in my inner world resulted in changes in my theory is described below. But before I go there, I want to note that I did all the recommended reflexivity processes; journaling, making pictures, engaging with others, taking issues to therapy, and I still missed reflecting fully on my deeper assumptions around stuck me, and stuck others.

After completing the interviews, I coded everything and started building a narrative about who and how people get stuck. The emerging narrative was awful – bland, judgemental, and demoralising. It was then that my research supervisor asked me why I was so hard on the research participants. While figuring this out I began to see the undercurrent of judgment I had of my own stuck self, as well as the participants.

As I worked with my own self-judgement around being stuck, my approach to the stuck participants changed. I began to understand the role of my own wounding in my stuckness, and then I was able to see it in the data. My mind opened to the possibility that stuck people were not completely at fault, and then I started to recognise the enormous role context had played in people getting stuck. I went back to the literature review and discovered that the role of context in stuckness was almost completely absent. All writers had minimised this critical factor making stuckness an intrapsychic and not a relational experience.

I was delighted by this insight and threw away all my original coding. I began coding again, this time looking for context. As a result of this and other insights, a new narrative emerged, one where stuckness was not an intrapsychic phenomenon caused by people being stupid or lazy. It was the idea of stuckness always being a relationship issue where one party was dancing an outdated dance that had no traction with the dancing partner or current context.We get stuck when the dance we learned at an earlier time is no longer effective, and when our wounds are triggered and pop up for attention. It is then that we must go inwards to find our new dance, one that matches the current context and creates traction for our action.

Writing the paper for the Action Research Journal has given me so many insights.

Firstly, that we can use inner work and reflexivity as the alchemical engine that refines, enriches and grows our theory. In this way, we can use reflexivity as a mechanism to bring ideas in consciously and with integrity, not rule them out as subjective and irrelevant.Furthermore that when we create a compassionate and supportive inner world for ourselves, we can create human centric research that is compelling, compassionate, and useful. That if we want to build useful and humanising theories, we need to have the inner worlds that support this. Our research and research participants are only human if we are too.A further area of learning was the importance of co-researchers and the research eco-system. Isolated research is an echo-chamber of our inner worlds, and when these are stuck or blind, we need others to invigorate our research.

Lastly, that research is never complete, it’s just good enough for now.

On the Origins of Land Ice Loss in Polar Regions

DOI: 10.31038/GEMS.2025772

Abstract

We show that the loss of land ice mass is determined not by global warming but by seismic activity, and thus neither supports nor rebuts global warming theories.

Keywords

Loss of land ice mass

There are lots of articles claiming that land ice mass loss is caused by global warming. Figures 1-3 show that the distribution of land ice loss in Greenland and Antarctica mimics the distribution of coastal seismic activity, strongly suggesting that the primary factor affecting land ice loss is not temperature but coastal seismic activity.

Figure 1: Map A shows GRACE and GRACE-FO observations of Greenland land ice mass change in 2002 – 2023, according to NASA. Map B shows magnitude ⩾ 4.0 earthquakes in 60.3°N-84°N, 70°W-10°W in 1997/1/1 – 2025/6/1. Map A is shown in the projection employed by NASA, while map B is shown in the projection employed by USGS. For the ease of comparison, each map shows the towns of Savissivik, Aasiatt, Nanortalik, Kulusuk, mount Gunnbjorn, points 77°N, 24°W, 82°N, 24°W, 82°N, 66°W, all marked with asterisks, as well as Scorseby Sound. Coastal earthquakes are marked with different colors, while quakes removed from the coast are shown in gray. The regions of large ice loss around Savissivik and Aasiatt and the region between the two towns with somewhat lesser ice loss correspond to earthquakes marked purple. The region of large ice loss around Nanotalik corresponds to earthquakes marked green. The region of large ice loss around Kulusuk, Gannbjorn corresponds to earthquakes marked blue. The region of medium ice loss between points 77°N, 24°W, 82°N, 64°W corresponds to earthquakes marked orange. The region between Scorse by Sound and 77°N, 24°W shows no ice loss, nor does it show any earthquakes. The region between points 82°N, 64°W and 79°N, 66°W shows only small ice loss, and only one earthquake. Map C is a copy of map be showing two largest landslides; the 2017/6/17 landslide was just next to two purple quakes, while the 2023/9/16 one was close to the two quakes marked brown.

Figure 2: MapA shows GRACE and GRACE-FO observations of land ice mass change in Antarctica, according to NASA. Map B shows magnitude ⩾ 4.0 earth-quakes south of 62°S in 1997/1/1-2025/6/1. Map A is presented in the projection selected by NASA, while map B is presented in the projection selected by USGS. Images C and D are parts of map A placed under the corresponding portions of map B. The largest rate of ice loss is on the Amundsen Sea sector. The second largest rate of ice loss is on the Antarctica Peninsula and Alexander Island 71°S, 70°W, with third largest rate of ice loss in Antarctica is in Queen Mary Land and Wilkes Land. The fourth largest rate of ice loss in Antarctica is Cape Andreyev. Map E shows magnitude ⩾4.0 earthquakes south of 62°S in 2015/1/1 – 2025/6/1. It shows no earthquakes in Queen Mary Land and Wilkes Land, the region has experienced most ice gain in 2021-2023. Map F shows all magnitude ⩾5.3 earthquakes in 1900 – 2024 south of 64°S; it reveals that the centers of coastal seismic activity practically coincide with the centers of ice loss.

Remarkable is the presence of antipodal symmetry in the phenomena discussed, As Figure 3 shows, the Arctic sinkholes of the past 30 years appeared almost antipodal to the centers of Antarctic ice loss. The largest loss of ice mass in Antarctica occurs in and close to Amundsen Sea sector, almost antipodal to Taymyr, Kara Sea, and Novaya Zemlya.

Figure 3: Map A shows the 2017/6/17 landslide in Nuugaatsiaq, 71.535°N 53.2125°W and the 2023/9/16 landslide in Dickson Fjord, 72.833°N, 26.95°W from Figure 1-C, marked by diamonds; recently-formed sinkholes in the Gyda, Yamal peninsulas, as well as one in Taymyr peninsula at ≈75.5°N, 108°E, marked by asterisks ⋆; an unusual melting in Auyuittuq National Park 67.883°N, 65.017°W in the summer of 2008, marked by a four-point star; the northernmost volcano Beerenberg; and the most powerful earthquake north of 64°N. Map B shows the southernmost volcano Erebus; three most powerful earthquakes south of 60°S; and the regions of ice loss from Figure 3. Map C shows the antipode of Antarctica contour superimposed on the contours of the Arctic. The two volcanoes are almost antipodal to each other, as are the 1933/11/20 and 1998/3/28 earthquakes. The Amundsen Sea sector of ice loss is almost antipodal to the recently-formed sinkholes Gyda and Yamal peninsulas; as well as the Novaya Zemlya and Severnaya Zemlya archipelagos, which, according to the University of Edinburgh, experienced the largest loss of ice in the Russian Arctic in 2010 – 2018. Antarctica Peninsula and Alexander Island 71°S, 70°W, which showed the second largest rate of ice loss, are almost antipodal to the recently-formed sinkhole in Taymyr. Queen Mary Land and Wilkes Land, which showed the third largest rate of ice loss, is almost antipodal to the 2017/6/17 landslide and Auyuittuq National Park. The fourth largest rate of ice loss in Antarctica is almost antipodal to the 2023/9/16 landslide and the giant oods around 71.08°N,26.83°W in the Scoresby Sound 70.5°N,25°W.

WL-QML, almost antipodal to Ban Island and Greenland. The Taymyr-Kara Sea-Novaya Zemlya region has been also marked by recently formed sinkholes. Figure 3 suggests that the much-larger- than-average loss of ice mass and the appearance of sinkholes are due to subglacial/subpermafrost thermal activity most likely caused by seismicity. Figures 1-3 confirm that the regions of ice loss mimic seismic activity in Antarctica as well as Greenland; the events in Greenland and Baffin Island marked in Figure 3A occurred near the regions of increased seismicity in Figure 1. NASA does not provide any information about ice mass loss along the arctic boundary of Russia, however, Figure 4 suggests that the recently-formed sinkholes are also related to seismic activity. That ice loss, in one form or another, may be caused by quakes, contemporaneous or precedent, is supported by Figure 5 and the 1958/7/10 UTC time (1958/7/9 local time) massive landslide caused by a magnitude 7.8 quake.

Figure 4: Map A shows magnitude ⩾ 3.9 earthquakes in 66°N−80°N, 34°E−180°Ein 2003/6/1 – 2025/6/1 along with sink-holes discovered after2015/5/1. Map B zooms in on the Taymyr peninsula. Map C shows all nuclear explosions in the region in 1973-1990, there have been no nuclear explosions in the region since. Map D is just a part of Figure 3C. The sink holes in Yamal are within the triangle formed by the 3 earthquakes around it, but the sinkhole in Gyda are not. However, the sinkholes in Gyda are just north of nuclear explosions shown. The Taymyr sinkhole, it seems to be a harbinger of the earthquakes to hit Taymyr shortly. Prior to 2003/6/1, only two quakes of that magnitude are known to have hit Taymyr, one on 1986/5/19, the other one on 1990/6/9.

Figure 5: On 2025/5/28, a huge portion of a glacier in the Swiss Alps had broken from the mountainside and crashed onto the village of Blatten at 46.417°N, 7.817°E, shown by an asterisk, approximately 16 km from the epicenter of the 1946/1/25 magnitude 6.2 quake at 46.499°N, 7.644°E, shown by a disk. Although the earthquake struck in 1946, smaller quakes in the region have not stopped until now; e.g. 2016/10/24 46.421°N 7.576°E magnitude 4.4, 2024/6/4 47.085°N 8.796°E magnitude 4.2, etc., not to mention numerous magnitude ⩽4.0 quakes.

Formation of Diamond in Graphite of Gray Cast Iron

DOI: 10.31038/GEMS.2025771

Abstract

During the Raman study of gray cast iron, we found graphite flakes decorated with spherical diamond crystals. The first-order Raman bands of these diamonds and the graphites that belong to them are given. The diamond pattern leads us to assume that the diamonds were primarily crystallographically arranged. The now arcuate arrangement lets us presume that stress deformed the graphite flake perpendicular to the c-axis. The often present Raman forbidden 867 cm-1 line, which is usually IR-active, is found together with frequently found methane and benzene in graphite, maybe as intercalates. As a rule, the studied diamonds always show the graphite line besides the diamond band because the cross-section for sp2 is much greater than for sp3– bonded structures.

Keywords

Raman spectroscopy, Graphite flakes, Diamond in cast iron, Pressure questions, Forbidden Raman line, CH4 intercalation, Deformation of graphite

Introduction

During the study of gray cast iron in “as-cast state”, we found diamond crystals in graphite for the first time using Raman spectroscopy. In the past, Sobolev et al. (1993) [1] synthesized diamond in cast iron by detonation. Forerunners were DeCarli PS, Jamieson JC (1961) [2] and Cowan et al. (1968) [3], who produced diamonds from carbon by high-pressure shock waves. They could make a hexagonal diamond for the first time. In our gray cast iron samples, we also found in graphite nodules hexagonal lonsdaleite crystals with their characteristic Raman triplet at 1244, 1305, and 1356 cm-1 [1,4]. Sobolev et al. (1993) [1] and Sobolev et al. (2020) [5] synthesized diamonds in gray cast iron; however, they obviously did not check the cast iron for the presence of diamonds before their detonation experiments. So, diamonds/nanodiamonds are probably always present and serve in part as seeds for the formation of larger diamonds. In our case, detonation or shock waves can definitely be excluded.

Samples and Methods

For the study, we selected six different gray cast iron samples, in which we found diamonds. One sample (Sample 2) served for detailed research [6]. Sample 2, a rectangular parallelepiped of 15.2 g, is treated in two steps with hydrochloric acid (25%). In the first step, we solved 1.90 g to remove possible remnants of diamonds from the grinding and polishing. We rejected this part. In the second step, we extracted an additional 1.60 g of iron from the sample. The solid remnants in the hydrochloric acid solution of the second sample (graphite, boron, and carbides) were cleaned with destilled water and placed on a microscope slide to dry. The amount of the remnant was not determined, therefore the exact amount of diamonds is not possible. For the study, we generally used a polarization microscope for transmission and reflection (Olympus BX43) equipped with an X-Y or rotating stage coupled with the EnSpectr Raman spectrometer R532. Details are in Thomas et al. (2025) [7]. Figure 1 shows the reference Raman spectrum of diamond from Brazil (Mining Academy Freiberg: 2453/37) in the range of 0 to 2000 cm-1, taken at 30 mW on the sample.

Figure 1: Reference Raman spectrum of diamond. The FWHM (Full-Width at Half Maximum) is 4.26 ± 0.42 cm-1.

Experimental Section and Results

From the second cleaned solution fraction, we put small graphite flakes on the microscope slice. Under many graphite flakes with single or a couple of diamonds, we found two flakes with many diamonds, which are ± regularly distributed (Figure 2). For a more detailed study, we used the number two shown in Figure 2. The diamonds show in graphite a double arrangement of hyperboloids perpendicular to each other, demonstrating two-dimensional stress.

Notes to Figure 2: A picture tells us more than 1000 words. For the distortion of 3.8 µm, a force of 3.8 N is applied over the area of the graphite flake, which corresponds to a pressure of approximately 3.04 GPa. That means, in local areas, high pressure is possible (see further below).

Figure 2: Graphite flake (black) with ± regularly crystallographically arranged diamonds (white). The graphite flakes have a thickness of about ≥ 2.5 µm, and the percentage of diamonds is ~7.4 vol%. The red lines show schematically the bend of the graphite plate perpendicular to the c-axis.
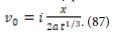
From Raman spectrometric measurements, we obtained the following data for 11 diamonds (Table 1).

Table 1: Results of the measurements on the diamond spheres shown in Figure 2 (532 nm laser, four mW excitation on the sample).

Crystal

Diamond (cm-1) FWHM (cm-1) Graphite (cm-1) FWHM (cm-1) n
Flake 1b 1329.2 ± 2.8 66.4 ± 0.6 1582.4 ± 7.7 62.2 ± 2.1

11

n: number of studied crystals; FWHM: Full-Width at Half Maximum.

A typical Raman spectrum is shown in Figure 3. Note, according to Prawer (1998) [8], the Raman cross-section for sp2 clusters is significantly greater (by a factor of 50, including the 1580 cm-1 band) than that for sp3-bonded carbon of diamond. The large FWHM values are a problem because all diamonds (in cast iron or in nature: see Thomas, 2025) [9] show such large values for FWHM. It is conceivable that the partial hydrogenation of the diamond surface is its origin [10].

Figure 3: Raman spectrum (4 mW excitation) of diamond from Figure 2. Because the measuring point is about 1 µm in diameter, the Raman band of “graphite” is the result of a relatively high concentration of sp2 cluster in diamond [8], by a thin carbon coating on the diamond, or simply by the excitation of the graphite matrix by chance.

From a rough estimation (Figure 2), we obtain a diamond volume of about 7.4 vol% for the graphite flake. The regular arrangement of the more or less spherical diamond crystals points to a growth of the diamonds in the graphite flake during the production of the gray cast iron. Extreme high pressure to produce diamonds can, in each case, be excluded. The exact origin of such diamonds can not be explained at present. It is clear that the diamonds grow after the formation of graphite, and they are not trapped in graphite by change, as the regular arrangement shows. Obviously, the diamonds mark the grain boundary edges. The low number of diamonds shows that the graphite is less defective and reduces the number of nucleation sites. The process of transforming graphite into a diamond typically requires very high pressures (4.5-6 GPa) and temperatures (900-1,300°C). Such high values for pressure are probably not achieved in the production of gray cast iron. The exact pressure and temperature can vary slightly depending on impurities and the presence of catalysts. Here is iron the favorite. Generally, other catalysts are nickel, cobalt, and alloys of Fe, Ni, Co, and rare-earth metals. These can dramatically lower the pressure and temperature needed for diamond formation. The metals dissolve graphite and facilitate the rearrangement of carbon atoms into the diamond structure at much lower pressure, or even lower with optimized catalysts.

Figure 4 results are approximately obtained using the temperature, the molar volume of graphite and diamond, and the entropy of both using Dean’s (1979) [11] and Jacob’s (1995) [12] data. According to Figure 4, the pressure reduces from 2.19 to 1.82 GPa (triangle), which also corresponds to the stability of calcite as a melt droplet in the gray cast iron (see Brümmer et al. 2025 [6]), which demonstrates a high pressure for the stabilization, because at atmospheric pressure, calcite decomposes into CaO and CO2 [13]. An increase in the molar volume is, for example, possible by the formation of a porous texture or impurities (Fe3C). One all-present catalyst is the iron in the surroundings of the graphite flakes, the primary catalyst. Another one is the methane sitting in the graphite lattice, as we assume from Figure 5. This figure shows the sharp Raman forbidden band at 867 cm-1; however, this band is usually only IR active [14,15]. According to Kawashima and Katagiri (1999) [16], it arises from impurities and/ or structural imperfections. Dmitruk et al. (2012) showed that after quantum-chemical investigations, the methane molecule intercalates between graphite planes. The most stable form of these is methane, which is in the form of dimers or clathrates. The concentration of such intercalated amounts to mole% [14]. With Raman spectroscopy, we can show that most graphite in the gray cast iron contains methane and benzene, which, at high temperatures, behave supercritically and move very fast to the grain boundary edges, forming there clathrates as a preliminary stage of DLC (Diamond Like Carbon).

Figure 4: The graph shows the calculated equilibrium curve of graphite and diamond, as well as the effect of the increase in the molar volume of the graphite (black triangle) by 7.4% resulting in a drop in pressure of 0.95 GPa at 1000°C.

Note: In all studied samples, this remarkable Raman-forbidden line was found, which means that at least this line is typical for gray cast iron. More studies on this problem are necessary. The intercalated methane (CH4) together with hydrogen (H2) serves in the supercritical state as seeds for the nucleation of diamonds in the graphite grain boundaries, and with fewer defects.

Figure 5: Raman bands of graphite (D-band at 1350 cm-1; G-band at 1580 cm-1). The insertion shows the forbidden Raman line in graphite, which is usually only IR-active. This line is typical for graphite in gray cast iron. The intensity of the forbidden Raman band at 866 cm-1 is only 1/30 of the G-band.

Discussion

We found diamonds using Raman spectroscopy in all the gray cast iron samples studied. Finding diamonds with classic light- microscopical methods in gray cast iron is somewhat tricky. Raman spectroscopy is very helpful for making a clear decision. To prevent diamonds from being used for the preparation of the samples, we rigorously removed the surface of the samples with hydrochloric acid. During that process, we found occasional flakes of graphite with crystallographically arranged diamonds. Most graphite flakes show only, if at all, a single or a small couple (1-3) of diamonds. In a recent paper by Shumilova et al. (2025) [17], the results of glassy carbon synthesized from supercritical fluid in the C-O-H system at 800°C and pressures of 500 to 1000 atm show similar carbon bodies; however, with strongly different Raman band positions using the 532 nm laser (Table 1 in that paper). Because the FWHM values for diamonds are huge [9], more sophisticated studies are necessary.

Acknowledgement

The author extends his sincere gratitude to Gregor Brümmer (Altzheim, Germany) and Klaus Scheiblauer (Wiener-Neustad, Austria).

References

  1. Sobolev VV, Taran Yu N, Gubenko SI (1993) Synthesis of diamond in cast iron. Met Sci Heat Treat 35: 3-9.
  2. DeCarli PS, Jamieson JC (1961) Formation of diamond by explosive Science 133: 1821-1823. [crossref]
  3. Cowan GR, Dunnington BW, Holtzman A H (1968) Process for synthesizing United States Patent Office, 3,401,019, 12 P.
  4. Goryainov SV, Likhacheva Ayu, Ovsyuk NN (2018) Raman scattering in Journal of Experimental and Theoretical Physics 127: 20-24.
  5. Sobolev VV, Gubenko SI, Rudakov DV, Kyrychenko OL, Balakin OO (2020) Influence of mechanical and thermal treatments on microstructural transformations in cast ions and properties of synthesized diamond Solid State Physics, Mineral Processing 4: 53-62.
  6. Brümmer G, Thomas R, Scheiblauer K (2025) Wie wächst er nun? Der Graphit im Gußeisen unter dem Raman-Spektroskop. Giesserei Rundschau 72, 4: in press.
  7. Thomas R, Brümmer G, Scheiblauer K (2025) Unexpected carbon phases in grey cast iron – diamond, calcite, and GEMS 7(4): 1-6.
  8. Prawer S, Nugent KW, Jamieson DN (1998) The Raman spectrum of amorphous Diamond and Related Materials 7: 106-110.
  9. Thomas R (2025) Diamond in pegmatites and related rocks in the upper GEMS 7: 1-5.
  10. Datta J, Ray NR, Sen P, Biswas HS, Vogler EA (2012) Structure of hydrogenated diamond like carbon by micro-Raman spectroscopy. Material Letters 71: 131-133.
  11. Dean JA (1979) Lang’s Handbook of 15th ed. McGraw-Hill, New York. 1291 P.
  12. Jacob KT (1995) Determination of the Gibbs energy of diamond using a solid state Solid State Communications 94: 763-765.
  13. Hou M, Zang Q, Tao R, Liu H, Kono Y, et al. (2019) Temperature-induced amorphization in CaCO3 at high pressure and implications for recycled CaCO3 in subduction Nat Commun 10: 1-8.
  14. Dresselhaus MS, Dresselhaus G, Eklund PC, Chung DDL (1977) Lattice vibrations in graphite and intercalation compounds of graphite. Materials Science and Engineering 31: 141-152.
  15. Thomas R, Rericha A, Pohl WL, Davidson P (2018) Genetic significance of the 867 cm-1 out-of-plane Raman mode in graphite associated with V-bearing green Mineralogy and Petrology 112: 613-645.
  16. Kawashima Y, Katagiri G (1999) Observation of the out-of-plane mode on the Raman scattering from the graphite edge plane. Physical Review B 59: 62-64.
  17. Shumilova TG, Ivanova LA, Isaenko VV, Ulyashev VV, Medvedev Vya, et al. (2025) Glassy carbon synthesis from supercritical fluid in the C-O-H system at 800°C and pressues of 500-1000 Glass and Ceramics 81: 401-408.

The Two Faces of Social Media Influencer Marketing: Insights from the Cosmetic Industry

DOI: 10.31038/PSYJ.2025753

Abstract

Influencer marketing has become a dominant strategy in the age of social media. Social media influencers (SMIs) affect consumer behavior by sharing experiences and recommendations across platforms, often leading to purchase decisions. The retail industry has embraced this practice as a primary marketing tool, with SMIs leveraging paid activations or personal experiences to create a sense of need among followers. While much research has focused on SMIs in the fashion industry, this study contributes by turning attention to the cosmetic and beauty sector and by examining the often-overlooked negative consequences of influencer marketing. Specifically, it explores overconsumption, distorted brand perception, and adverse consumer psychology. Drawing on a comprehensive literature review and a survey of Gen-Z consumers, this study investigates the relationship between influencer marketing in cosmetics and its detrimental outcomes.

Keywords

Influencer marketing, Social media influencers, Cosmetic and beauty sector, Social identity, Overconsumption

Introduction

In the age of rampant social media use in daily life, with 4.41 billion projected users by 2025, a category of social media users classified as ‘social media influencers’ (SMIs) or ‘opinion leaders’ has become a constant across various social media platforms [1]. These influencers are defined as “experts or social connectors influencing other people’s attitude regarding products and brands” [2]. Influencers garner audiences that share their interests and opinions on platforms such as Instagram, TikTok, Facebook, and other social media platforms. Brands have taken note of the unique ability that SMIs possess to connect with their audiences by building a personal brand and authenticity on their platform [3]. Whether focused on fashion, fitness, health, or niche topics, SMIs attract audiences ranging from hundreds to hundreds of thousands of followers who value their opinions. Brands that tap into these individuals’ skills engage in the practice of influencer marketing. This strategy, adopted by brands, represents a relatively new branch of marketing. The influencer marketing channel, which pays opinion leaders (SMIs) to post and promote products in order to increase sales, has become prevalent with every brand that has a social media presence. The success of the strategy in the digital climate is undeniable, in that it is estimated that “spending on influencer campaigns has increased dramatically, with a global spend of $16.4 billion in 2022” [4]. With constant exposure to advertisements and brand messaging, consumers often look to these opinion leaders to determine what they need and should buy [5]. This, in turn, drives consumer buying intention and consumption patterns, as well as impacts their perception of brands [6]. No industry is necessarily excluded from this marketing practice, which has led to the prominence and success of influencer marketing.

One industry that significantly benefits from this practice is the cosmetic industry. Already valued at nearly 500 billion dollars globally, the cosmetic market continues to grow as consumer interest increases, in large part due to social media trends and influencers. The cosmetic industry has always had a space in media, particularly in movies and magazines. In the current age of social media, makeup and beauty trends continuously shape and evolve the industry, with makeup artists and influencers, as well as lifestyle influencers, sharing their everyday products. Younger generations, who are key consumers of social media, form the primary target demographic for the influencer marketing of cosmetic products [7]. This study explores the heavily social media dependent college-age population and their consumer habits, while factoring in the consideration of the cohort having little disposable income.

At its core, the role of influencers is to create desire by encouraging consumers to want to look like them, share their lifestyle, or fit in with their community. Brands rely on this persuasive power, paying influencers to place products directly in front of target audiences. Yet this raises important questions: Have brands lost their own voice when it comes to speaking to their consumers? Have they relied on influencers so much that they are no longer going to be able to reach consumers on their own? This study seeks to address these questions by exploring how influencer marketing in cosmetics affects consumer habits, particularly overconsumption and its psychological and environmental impacts. It considers whether consumers purchase products they neither need nor like, simply because an influencer recommended them. The waste involved in production, packaging, shipping, and spending are all underrepresented consequences of this practice.

Theoretical Framework

This study examines social media marketing within the cosmetic industry, specifically focusing on overconsumption, psychological/environmental impacts, and distortion of brand perception. To address these issues, a theoretical framework grounded in consumer psychology and behavior is applied. The central theory guiding this research is the media dependency theory. Media Dependency Theory Media dependency theory contributes significantly to this study’s framework by demonstrating “a dependency relationship between digital influencers and their followers”. The theory explains how influencers cultivate trust and credibility, which fosters a perceived relationship with their followers. This relational dynamic is a key driver of influencer marketing’s effectiveness as a strategy. Brands recognize that individuals can establish more authentic connections with consumers than organizations can, and therefore utilize influencers in promoting and selling their products. In the context of cosmetics, Kurshid et al. [8] emphasized that influencers are “key sources of product-related information for consumers, particularly in the beauty industry.” The characteristics that set influencers apart from other social media users further support this dependency. Influencers foster relationships through their authentic appearance, voices, and opinions. Their success depends on qualities such as relatability, expertise, entertainment, and attractiveness, which resonate with their follower base.

Social media users consciously or subconsciously seek these characteristics when choosing who to follow, and their presence often correlates with the effectiveness of influencer promotions. These qualities attract attention, build followings, and facilitate interactions that form the foundation of trust and influence. Prior research has shown that consumers often make purchase decisions based on the opinions—or by actively seeking the opinions—of influencers they follow [9]. As these relationships develop, users may increasingly depend on influencers’ recommendations, preferences, and lifestyles to guide their own decisions. This study applies media dependency theory to better understand how influencers persuade followers to purchase products they may not want, need, or use, as an outcome of this dependency. Examining how influencer characteristics build followings, foster relationships, and encourage consumer action helps explain the potential negative consequences of such dependency, including overconsumption and its associated environmental impacts. Furthermore, the theory aids in exploring how an influencer’s role in shaping consumer choices can sometimes overshadow or even replace a brand’s ability to connect directly with consumers.

Literature Review

Social Media Influencers (SMIs)

Over the past 20 years, the presence and popularity of social media have rapidly increased. What began as platforms for sharing photos and thoughts, along with likes and comments, has evolved into live streaming, short-form video content, stories, saved posts, and more. With this evolution of content came the rise of social media celebrities, commonly known as social media influencers (SMIs). These individuals are defined as those who lead, influence, and inspire followers on social media platforms through their online presence and opinions [10]. Their influence spans many domains: beauty, fashion, do-ityourself projects, cars, watches, sports, and more, as they share skills, styles, and interests that attract likes, comments, and followers.

Recognizing the persuasive power of these individuals, brands have increasingly partnered with influencers to advertise and endorse products. By leveraging their credibility and authenticity, influencers build trust and foster genuine communication with followers [11]. Influencer marketing is defined as a sub branch of digital marketing, where famous key individuals who are believed to have a master-level understanding try to influence the buyer to purchase a certain brand of product or service, including product placement and endorsements via social influence. The relationship between influencers and consumer behavior is well established, as influencer marketing consistently drives buying decisions. Consumers now use social media not only as a platform for connection but also as a search engine and recommendation tool, relying on influencers for both advice and product discovery. This constant exposure to promotional content often drives consumers to purchase beyond their actual needs, as influencers rapidly shape trends that reach thousands to millions of people [12].

The cosmetic sector is particularly reliant on influencer content. Product demonstration is often essential in cosmetics, making social media platforms ideal for showing how products work and look. With more than 90% of cosmetic brands maintaining a strong presence on social media, the industry is highly saturated, and visibility is vital. Social media also serves as a review hub, search engine, and trend reporter, especially for younger consumers. Brands showcase their identity through imagery, copy, and interaction with followers, while influencers lend authenticity and credibility by giving these brands a personal voice.

Motivations for Following and Characteristics of SMIs

For influencers to impact consumer purchases, they must first attract followers and encourage interaction. Motivations for following vary but often include inspiration, relatability, attractiveness, and credibility. These qualities are central to the effectiveness of influencers, as influencers who display honesty, integrity, and sincerity, along with trustworthiness and ethics, are perceived as more believable. When influencers successfully convey these characteristics, they are more likely to build trust, increase engagement, and ultimately influence purchasing decisions. Indicators of success such as follower counts, likes, comments, shares, and overall reach are carefully monitored by both audiences and brands. These metrics serve as signals of credibility and play a significant role in determining whether brands choose to collaborate with influencers to promote products. The integration of influencers into retail marketing is substantial. For every dollar invested in influencer marketing, brands generate more than six dollars in revenue, with some reporting over twenty dollars per dollar spent. This level of return demonstrates how influencer marketing has reshaped retail strategies and developed into a multi-billion dollar industry. By amplifying brand reach through multiple voices, influencer marketing extends communication beyond official brand accounts and allows messages to be tailored to diverse audiences. This strategy has become a powerful driver of consumer purchase decisions and can help build brand loyalty through the trust followers place in influencers.

Negative Impacts of Influencer Marketing in Cosmetics

Although research on influencer marketing, particularly in the fashion sector, is extensive, most studies emphasize positive aspects of consumer psychology, such as uses and gratifications, social identity, or purchase intention, rather than the tangible negative outcomes. This study seeks to address three critical areas that remain underexplored in the cosmetic sector: overconsumption, psychological and environmental impacts, and distortion of brand perception. Heavy reliance on social media for product discovery often leads to overdependence or even addictive behaviors, which result in overconsumption. Consumers frequently purchase products they do not need simply because influencers recommend them. Such behavior contributes to significant waste in production, packaging, and distribution, ultimately creating serious environmental consequences. While research on fast fashion has highlighted similar concerns, their relevance in the cosmetic industry remains insufficiently examined. Furthermore, constant exposure to influencer-driven promotions can blur the distinction between a brand’s voice and an influencer’s voice. When consumers cannot clearly separate the two, brand identity risks distortion. In some cases, reliance on influencer partnerships may even alienate loyal customers. These psychological effects on brand perception are as critical as the material consequences of overconsumption and waste.

Based on the theoretical framework and relevant literature reviewed, the following conceptual model is proposed (see Figure 1).

Figure 1: Conceptual model

Method

An online survey was created to gather robust data surrounding consumer habits regarding interaction with social media influencers. The survey employed a convenience sample drawn from a major research-intensive university located in the southeastern region of the United States. The survey was created using Qualtrics XM software and distributed to participants via an email invitation containing the survey link. On average, students required approximately 10 to 15 minutes to complete it. Prior to data collection, the survey received approval from the university’s Institutional Review Board (IRB). This study focused exclusively on college-age social media users who follow influencers promoting beauty and cosmetic products. This demographic was selected because “Gen Z has a dependence on technology for seeking out information about goods and services before making a purchase decision, and they have a strong reliance on e-word-of-mouth (WOM) advertising”. To ensure eligibility, participants were first asked if they use social media, which platforms they use, and whether they follow beauty and cosmetic influencers. Only those who indicated “yes” to all three questions qualified to continue. Clarifying questions were then used to confirm that the influencers they follow promote beauty and cosmetic products within their content. Participants who did not meet these criteria were excluded from the study.

Instruments

Nine key constructs were assessed using established scales from prior research. Unless otherwise noted, all items were measured on a 7-point Likert scale (1 = strongly disagree, 7 = strongly agree). Along with the primary constructs proposed in the conceptual model, this study also measured several external variables to provide additional insight into college-age students’ social media habits, such as purchase loyalty, purchase intention, and social comparison. Before examining motivations for following influencers, the study measured participants’ general social media usage using a scale developed by Hagerborn et al. [13]. To understand what qualities resonate most with users when deciding to follow and engage with influencers, scales from Croes and Bartels and Zhang et al. [14] were employed. These measures included characteristics such as trends, followers, attractiveness, relatability, and entertainment value. Participants selected the characteristics that best reflected their experiences.

Social identification with social media beauty and cosmetic influencers was measured using a three-item scale adapted from Leach et al.. Participants indicated the extent to which they felt psychologically connected and aligned with the influencers. Opinion leadership was also assessed to capture the role influencers play in shaping followers’ attitudes and decisions. Scales were adapted from Gentina et al. and Thakur et al. Participants indicated how effectively influencers interacted and engaged with their audiences while promoting beauty and cosmetic products. To maintain focus, they were asked to name a specific influencer to keep in mind when responding. Consumption habits were measured using the consumption desire scale by Patwardhan et al. [15]. Participants reflected on whether their perceived need or pressure to buy products increased with greater exposure to influencers, and whether they had overspent or purchased beyond their needs. This measure provided insight into how influencer-driven marketing contributes to excessive consumption. Distortion of brand perception was measured using items adapted from existing parasocial interaction/relationship (PSI/PSR) and influencer characteristic scales, modified to fit the cosmetic and influencer context.

Buying behavior and purchase intention were examined through several validated scales. Participants were first asked how many beauty and cosmetic products recommended by the named influencer they had purchased in the past 12 months. A purchase intention scale by Ki and Kim [16], along with items adapted from Fakhreddin and Foroudi and Kay et al. [17], measured likelihood of future purchases. Buying behavior was further assessed using scales from Ki and Kim, Croes and Bartels, and Kay et al. Purchase loyalty was measured using a scale adapted from Pereira et al. and Walsh et al., as cited in Fakhreddin and Foroudi. This construct examined participants’ allegiance to influencers and the products they endorse. Product knowledge was measured using a scale by Kay et al. which assessed participants’ interest, confidence, and expertise with beauty and cosmetic products, providing insight into how easily they might be persuaded by influencer recommendations. Finally, social comparison was measured using the online social comparison scale developed by Gibbons and Buunk, Steers et al., Reer et al., and Latif et al., as cited in Tandon et al. [18]. Participants indicated their experiences of comparing themselves to others in terms of appearance and possessions. This measure contextualized consumer buying behavior within the cosmetic sector.

Results

Participants

A total of 237 students participated in the survey; after removing incomplete responses, 157 usable samples remained (66.2%). All participants were between 18 and 22 years old, with 96.2% identifying as female. The majority identified as White American (82.8%), followed by African American (7.8%). By class standing, seniors represented the largest group (33.1%). Reported annual household income varied, with 30.6% indicating $150,000 or more and 25.5% reporting $100,000–$149,999 (see Table 1).

Table 1: Demographic profile

Demographic Variable

Category Frequency Valid Percent

Cummulative Percent

Gender Male

6

3.8%

3.8%

  Female

151

96.2%

100.0%

  Total

157

100.0%

 
Age 18-21

123

78.3%

78.3%

  22-25

31

19.7%

98.1%

  26-41

3

1.9%

100.0%

Academic class standing Freshman

18

11.5%

11.5%

  Sophomore

40

25.5%

36.9%

  Junior

38

24.2%

61.1%

  Senior

52

33.1%

94.3%

  Graduate

9

5.7%

100.0%

Ethnicity White American

130

82.8%

82.8%

  Black or African American

12

7.6%

90.4%

  Hispanic or Latino

5

3.2%

93.6%

  Asian

4

2.5%

96.2%

  Other

6

3.8%

100.0%

Annual Household income Under $25000

27

17.2%

17.2%

  $25,000-$50,000

11

7.0%

24.2%

  $50,001-$75,000

13

8.3%

32.5%

  $75,001-$99,999

18

11.5%

43.9%

  $1,00,000-$1,49,999

40

25.5%

69.4%

  $1,50,000 and Over

48

30.6%

100.0%

Social Media Usage and Influencers Followed

Survey participants shared their social media habits to reflect their exposure to various platforms and interactions with influencers. A majority (63.1%) reported spending between one and three hours per day on social media. TikTok emerged as the most commonly used platform for following influencers (84.4%), followed by Instagram (66.9 %). In terms of purchasing behavior, 65.6% indicated that they had purchased between one and five cosmetic or beauty products in the past year as a result of influencer recommendations. Participants also identified the influencers they followed most closely in the context of beauty and cosmetic promotion. Alix Earle was the most frequently mentioned, cited by 25% of participants, followed by Bridget Pheloung (Acquired Style) and Emilie Kieser. The responses included both traditional lifestyle influencers and professional makeup artists, highlighting the diversity of influencer types within the cosmetics space.

Reasons for following and Motivations for Engaging with SMIs

Participants identified the characteristics most important when choosing to follow influencers (see Table 2). Entertainment value ranked highest (71.3%), followed by relatability and authenticity, each selected by more than half of respondents. Mean score analysis revealed the strongest motivations for engaging with beauty influencers were information seeking (M = 6.02), content style and aesthetics (M = 5.75), and relaxing entertainment (M = 5.37). Among influencer attributes, trust (M = 5.83), expertise (M = 5.56), and interactivity (M = 5.06) were ranked most important, while attractiveness and popularity were considered less influential.

Table 2: Reasons for Following SMIs

Rank

Reason Frequency

Percentage

1

Entertainment

114

71.3%

2

Relatability

102

63.7%

3

Authenticity

89

55.6%

4

Creative Inspiration

87

54.4%

5

Humor

61

38.1%

6

Credibility

61

38.1%

7

Expertise

55

34.4%

8

Attractiveness

51

31.9%

9

Conumerism

23

14.4%

10

Number of Followers

13

8.1%

11

Other

3

1.9%

12

Congruency

0

0.0%

Relationships Among Variables

Correlation and regression analyses were conducted to examine the proposed model (Tables 3 and 4). A principal components extraction with Varimax rotation was first conducted to identify the underlying factor structure. Factors with eigenvalues greater than 1.0 were retained. After removing three cross-loading items, the retained factors explained 74.5% of the variance. Scale reliability was confirmed with Cronbach’s alpha values ranging from .71 to .96, exceeding the .70 threshold (Nunnally & Bernstein, 1994). Harman’s single-factor test (Mayr & Teller, 2024) showed that a single factor accounted for 25% of the variance, below the 50% threshold, indicating that common method bias was not a major concern. Most variables were significantly correlated at the .05 level or below. Regression analyses further indicated that both social identity and opinion leadership had positive effects on overconsumption (β = .22, t = 3.01, p < .01; β = .38, t = 5.09, p < .001, respectively), distortion of brand perception (β = .15, t = 2.33, p < .05; β = .58, t = 8.88, p < .001, respectively), and social comparison (β = .26, t = 3.41, p < .001; β = .24, t = 3.15, p < .01, respectively).

Table 3: Correlations


1

2 3 4 5 6 7 8 9 10

11

Social identity

.395**

.631** .490** .277** .022 .168* .325** .249** .270** .171*

.324**

Opinion leadership

.316**

.316** .349** .231** .347** .333** .409** .289** .540** .615**

.386**

Purchase intent

.278**

.276** .261** .147 .303** .199* .285** .319** .469** .462**

.373**

Brand loyalty

.271**

.236** .238** .189* .275** .111 .261** .255** .433** .390**

.414**

Distortion of brand perception

.243**

.332** .280** .114 .315** .423** .303** .107 .476** .524**

.279**

Overconsumption

.339**

.352** .327** .351** .174* .161* .296** .476** .225** .197*

.246**

Social comparison

.133

.345** .238** .115 .096 .168* .162* .171* .213** .160*

.182*

Note: 1=cool; new Trend; 2=Companionship; 3=Relaxing entertainment; 4=Boredom; 5=Information seeking; 6=Content 7=Attractiveness;8=Popularity; 9=Expertise; 10=Trust; 11=Interactivity *p < .05, **p < .01

Table 4: Regression Results


IVs

Social identity Opinion leader
β t p β t

p

Motivations            
Companionship

.53

7 .30 <.001 .20 2.80

.006

Relaxation

.32

4.42 <.001 .40 4.86

<.001

Information seeking      

.22

2.86

.005

Content      

.19

2.38

.018

F-value p

Adjust R2

24.6

<.001

.47


9.61

<.001

.25

   
SMI Characteristics

Attractiveness

.21

2.64 .009 .20 3.18

.002

Popularity      

.17

2.75

.007

Expertise      

.20

2.78

.006

Trust Interactivity  .27  3.23 .002 .43 5.73

<.001

F-value p

Adjust R2

8.44

<.001

.19


33.19

<.001

.51


Discussion of Findings

This study explored how social media influencer marketing impacts consumer behavior and psychology in the cosmetic sector. The analysis focused on the relationship between exposure to and interaction with influencers, overconsumption of products, and distorted brand perceptions.

The results identified key motivations for following influencers—entertainment, relatability, and authenticity—highlighting that genuine and transparent content is highly valued. For cosmetic and beauty products, influencers perceived as authentic, relatable, and entertaining resonate most strongly with followers. In terms of characteristics, trust, expertise, and interactivity emerged as most influential. Trust was ranked the highest, reflecting consumers’ need to feel confident in recommendations. This trust directly influenced willingness to purchase and contributed to unnecessary buying, linking influencer credibility to overconsumption. Expertise was the second most valued trait, as followers viewed influencer knowledge and skill as signals of product quality, further driving purchase decisions. Interactivity ranked third, enhancing followers’ sense of connection and belonging through comments, live videos, giveaways, and other engagement strategies. These findings demonstrate how trust, expertise, and interactivity together create a strong psychological bond between influencers and their followers.

Overconsumption—the purchase of products beyond need—was a central outcome of this study. Popularity, boredom, and companionship were all highly correlated with overconsumption. Popularity heightened perceptions of product necessity, as consumers sought belonging or alignment with trends. Notably, 89.3% of survey participants reported purchasing a product based on an influencer’s recommendation, with approximately 140 respondents acknowledging such purchases. These behaviors carry implications for product waste, packaging, shipping, and environmental impact when items are bought unnecessarily and discarded. Companionship, the feeling of belonging to an influencer’s community, also contributed to overconsumption by reinforcing a sense of shared identity. Trust and expertise further lowered skepticism toward recommendations, while interactivity amplified exposure to product promotions, strengthening feelings of need. Together, these patterns reveal how influencers can exploit psychological drivers to encourage excessive purchasing.

Distorted brand perception was another key outcome. Trust and expertise strongly correlated with how consumers perceived brands, as influencers’ credibility reduced skepticism and hesitation toward promoted products. Interactivity also shaped brand perception by fostering loyalty through ongoing engagement, which made brands appear more personable and accessible. However, this reliance on influencers meant that trust was often placed in the influencer rather than the brand, blurring the line between the two. Motivations such as content and companionship further influenced brand perception. Content—defined by style, format, and consistency—had the strongest correlation, showing how influencer presentation directly shaped consumer views of brands. Companionship reinforced this effect by creating a sense of friendship and belonging. These findings suggest that when influencers represent brands, they can overshadow brand identity and compromise the direct relationship between brands and consumers.

Finally, the study highlighted broader psychological implications. Attractiveness and popularity were strongly associated with opinion leadership, suggesting that physical appeal, visibility, and follower count significantly enhance an influencer’s ability to shape consumer opinions in the beauty and cosmetics domain. In addition, companionship and relaxation emerged as key motivations for social identification. These findings indicate that perceived interpersonal closeness, such as feeling that influencers are friends or conversational partners, along with psychological relief through enjoyment, stress reduction, or temporary escape, play meaningful roles in fostering users’ identification with influencers. Furthermore, both social identity and opinion leadership were found to positively influence overconsumption, distorted brand perception, and social comparison. Collectively, these results underscore the psychological mechanisms—trust, expertise, interactivity, attractiveness, popularity, and companionship—that make influencer marketing both highly persuasive and potentially problematic.

Implications

Theoretical Implications

The findings of this study align closely with existing literature and extend theoretical perspectives on consumer behavior in social media contexts. Specifically, they support the concept of trend-based consumerism, brand perception theories, and social comparison processes. Denton emphasized the role of influencer-driven social media trends in stimulating consumption, particularly among younger consumers. While Denton’s study focused on apparel, the current research demonstrates a similar pattern in the cosmetics sector, with popularity characteristics strongly correlated with overconsumption. Brand perception theories are also reinforced. Fitriati et al. argued that influencer recommendations shape consumer expectations of product value, a finding consistent with this study’s results showing that interactivity and dependency on influencers influence brand perceptions. Similarly, Bentley et al. emphasized consumers’ direct psychological relationships with brands, an avenue that complements but differs from the present study’s focus on influencer-driven brand associations. Croes and Bartels highlighted the role of social identification and motivations for social media use, shaping how this study measured motivations for following influencers. Adapting their scale produced results consistent with prior findings.

Together, these findings provide strong theoretical support for media dependency theory. The study shows that college-aged consumers rely heavily on influencers for product information and purchase decisions, with information seeking emerging as the strongest motivation. This dependency not only validates the central premise of media dependency theory but also reveals its potential negative outcomes, such as overconsumption and distorted brand perceptions. The psychological drivers of this dependency—such as the need to belong and feelings of companionship—further extend the theory by highlighting how relational ties with influencers contribute to excessive consumption. Importantly, these implications extend beyond cosmetics, offering insight into how reliance on influencers can shape consumer decision-making, brand communication, and purchasing behaviors across industries.

Practical Implications

This study provides several practical implications for brands, influencers, and consumers. For brands, the findings suggest that working with influencers perceived as trusted and knowledgeable is crucial, as these traits are strongly associated with purchase intention and brand perception. High interactivity is also valuable, as greater engagement increases exposure to both influencer content and brand products. However, the study also highlights risks: brand perception can become distorted when closely tied to influencers. The line between actual need and perceived need often blurs in influencer interactions, and consumers who later view their purchases as wasteful may associate this negatively with the brand. While profit remains central, brands will need to address the pressures of overconsumption created by influencer marketing and prioritize direct communication and authentic engagement with consumers. Loyalty and trust can coexist with influencer partnerships, but only if carefully managed.

For influencers, the study underscores the importance of managing relationships with followers ethically and transparently. Trust and expertise are powerful drivers of success but can also contribute to dependency, comparison, and waste. Like brands, influencers may prioritize personal gain in partnerships, which can compromise ethical decision-making. Transparency, as required by FTC regulations, builds trust among followers. Communicating when a recommendation is unaffiliated with a brand can further enhance authenticity. Additionally, being selective about brand partnerships strengthens credibility, whereas promoting products solely for financial gain undermines trust and perceived expertise.

Finally, consumers also benefit from these findings. As social media becomes increasingly embedded in daily life, particularly among Gen Z women, awareness of influencer practices is essential. This study highlights the manipulative nature of influencer marketing, where popularity and psychological drivers—such as the need to belong or relieve boredom— are often used to stimulate purchases. By recognizing these tactics, consumers can better distinguish between actual needs and perceived needs created by influencer messaging. Awareness of how repeated exposure intensifies feelings of need may also help reduce unnecessary purchases. Although challenging in the highly engaging environment of social media, developing this awareness can support more intentional and restrained consumption [19-21].

Conclusion and Future Research

This study examined the negative impacts of influencer marketing in the cosmetic sector, focusing on Generation Z college-aged women who are highly active on platforms such as TikTok and Instagram. The findings confirm that influencers hold significant power in shaping purchase decisions and brand perceptions. This research also contributes to existing knowledge by shifting the conversation on overconsumption from the fast-fashion industry to the cosmetic sector, where influencer marketing similarly drives trend-based cycles and waste. While influencer partnerships are effective in expanding reach, they risk weakening brands’ direct connection with consumers. These insights underscore the importance of balancing influencer strategies with efforts to preserve authentic brand-consumer relationships, laying the groundwork for future research on the long-term consequences of these dynamics. The study also identifies several avenues for future research. Given the breadth of variables examined, further investigation is needed into specific outcomes such as short-term versus long-term brand loyalty, sustained effects on brand perception, and the measurable environmental impact of overconsumption. Future research could explore issues such as shipping, packaging, and product waste to better assess the broader ecological footprint of influencer marketing. As this practice continues to expand, the availability of longitudinal data will offer additional opportunities to examine its implications for both brands and consumers.

References

  1. Vaghela K, Damle M, Hamza MS, Oudah AY (2023) Impact of social media influencers on brand promotion. AIP Conference Proceedings.
  2. Fakhreddin F, Foroudi P (2021) Instagram influencers: The role of opinion leadership in consumers’ purchase behavior. Journal of Promotion Management 28: 795-825.
  3. Croes E, Bartels J (2021) Young adults’ motivations for following social influencers and their relationship to identification and buying behavior. Computers in Human Behavior 124: 106910.
  4. Bentley K, Rajagopal P, Kulow K (2024) Unfaithful brands: How brand attachment can lead to negative responses to influencer marketing campaigns. Journal of Consumer Psychology 343: 456-472.
  5. Hassan SH, Teo SZ, Ramayah T, Al-Kumaim NH (2021) The credibility of social media beauty gurus in young millennials’ cosmetic product choice. PLOS ONE 16: e0249286
  6. Fitriati R, Siwi ISM, Munawaroh, Rudiyanto (2023) Mega-influencers as online opinion leaders: Establishing cosmetic brand engagement on social media. Journal of Promotion Management 29: 359-382.
  7. Williams DE, Pochipinski B, MacDonald M, Caulfield J (2023) The depiction of beauty-by-beauty influencers on Instagram and generations Z’s perception of them. Journal of Promotion Management 30: 473-512.
  8. Khurshid S, Ayoub DA, Kortam W (2024) The impact of influencer marketing on consumers’ intentions toward beauty brands after the COVID-19 pandemic. Arab Journal of Administration 44: 1-10.
  9. Lee JE, Watkins B (2016) YouTube vloggers’ influence on consumer luxury brand perceptions and intentions. Journal of Business Research 69: 12
  10. Geng R, Chen X, Wang S (2023) Wear in or wear out: How consumers respond to repetitive influencer marketing. Internet Research 34: 810-848.
  11. Silva MJdB, Farias SAd, Silva CJ (2023) Endorsement on Instagram and cultural dimensions: An analysis of digital influencers. The Bottom Line 36: 1-28.
  12. Denton A (2023) The cost of looking good: How fashion and trend-based consumerism impact the economy, law, and environment. Indiana Journal of Global Legal Studies 30: 2
  13. Hagerborn C, Ivarsson I, Linde S (2024) Trending towards overconsumption: The role of social media in shaping Swedish Gen Z’s buying patterns. Bachelor’s thesis, Jönköping University, Jönköping International Business School. DiVA
  14. Zhang S, Huang C, Li X, Ren A (2022) Characteristics and roles of streamers in ecommerce live streaming. The Service Industries Journal 42: 1001-1029
  15. Patwardhan V, Mallya J, Kaliappan S, Kumar D (2024) Influence of social media on young adults’ food consumption behavior: Scale development. Cogent Social Sciences 10: 2391016.
  16. Ki CW, Kim YK (2023) The mechanism by which social media influencers persuade consumers: The role of consumers’ desire to mimic. Psychology & Marketing 40: 24- 46.
  17. Kay S, Mulcahy R, Parkinson J (2020) What is less is more: The impact of macro and micro social media influencers’ disclosure. Journal of Marketing Management 36: 248-278.
  18. Tandon A, Dhir A, Talwar S, Kaur P, Mäntymäki M (2021) Dark consequences of social media-induced fear of missing out (FoMO): Social media stalking, comparisons, and fatigue. Technological Forecasting & Social Change 169: 120834.
  19. ElSayad G (2024) Beyond likes, comments, and shares: How can influencer marketing drive customer equity and purchase intention? Journal of Promotion Management 30: 1087-1112.
  20. Faust NT, Hong Y, Gains N, Christopoulos GI (2024) The effect of implicit theories of human beauty and perceived pressure on cosmetic consumption. Psychology of Aesthetics 18: 43-58.
  21. Isyanto P, Gita Sapitri R, Sinaga O (2019) Micro influencers marketing and brand image to purchase intention of cosmetic products Focallure. Systematic Reviews in Pharmacy 11: 601-605.

Effect of Moringa oleifera Aqueous Seed Extract on Some Productive Indicators of Broiler Chickens

DOI: 10.31038/IJVB.2025924

Abstract

Background: The research aims to study the effect of the Moringa oleifera aqueous seeds extract (MSE) on some productive indicators of broiler chickens. The experiment was conducted using 300 broiler chicks of the Ross 308 strain. Starting from one day of age until 42 days. The broiler chickens were allocated into four equal groups: T1 (control), T2, T3 and T4, each of which included 75 broiler chickens. They were fed balanced and uniform diets according to their age. Drinking water was ad libitum provided, with the addition of the MSE at a rate of 0, 80, 100 and 120 ml/liter of water for T1, T2, T3 and T4, respectively.

Results: The results showed a significant improvement (P<0.05) in the growth rate, and feed conversion ratio, with a decrease (P<0.05) in the percentage of dead broiler chickens, for the groups treated with MSE compared to the control group T1.

Conclusions: The study suggests that adding the aqueous of MSE to the drinking water of broiler chickens results in the improvement of the studied productivity indicators.

Keywords

Moringa oleifera, Seed extract, Productive indicators, Broiler chickens

Background

The poultry industry is one of the most important sectors of animal production, contributing to the provision of high-quality animal protein in large quantities to meet the growing nutritional needs of humans [1]. With increasing production, it has become necessary to rely on feed additives to improve growth, increase feed conversion efficiency, and enhance immunity against diseases. Antibiotics have been used for many years to achieve this goal [2], but their extensive use has led to the emergence of health problems, most notably the development of bacterial resistance to antibiotics and the accumulation of drug residues in poultry meat and eggs, which negatively impacts consumer health [3]. Therefore, recent studies have focused on safe and effective natural alternatives, with medicinal plants and their derivatives, such as oils and extracts, playing a prominent role in this field [4]. Moringa oleifera is a medicinal plant rich in active compounds such as phenols, flavonoids, antioxidants, amino acids, and minerals [5]. It is used as a plant-based supplement to improve health and immunity and increase production efficiency in poultry. Phenolic compounds and flavonoids are key factors in increasing the activity of antioxidant enzymes, reducing oxidative stress caused by free radical formation, and supporting the bird’s immune system by stimulating the production of antibodies and increasing the number of white blood cells [6]. Isothiocyanates and other plant compounds also act as antimicrobials, helping to reduce bacterial infections and disease, and improving the integrity of the intestinal mucosa, which positively impacts nutrient absorption and reduces mortality rates [7]. Several studies have indicated the important role of using Moringa in poultry nutrition to improve health and productivity [8]. Ali et al., [9] found that adding MSE to drinking water can lead to lower mortality rates and increased growth, which enhances production efficiency, as found by Rehman et al., [10]. Adding MSE to poultry drinking water has significant effects on improving growth rates, weight gain, meat quality, and its vitamin, mineral, protein, and fat content. Verma et al., [11] found that when studying the effect of adding an aqueous extract of Moringa oleifera leaves to the drinking water of four groups of broiler chickens, the first group received drinking water devoid of the extract, the second group received 60 ml of the extract per liter, the third group received 90 ml per liter, and the fourth group received 120 ml per liter. The results showed a significant increase (P<0.01) in the weights of broiler chickens and an improvement in the feed conversion ratio in the groups treated with the extract, with the highest increase recorded in the group receiving 90 ml per liter. Given the recent trend toward using medicinal plants and their extracts as a natural alternative to antibiotics to enhance chicken production efficiency, which enhances the safety of animal products and reduces reliance on chemicals that may negatively impact human health and the environment, the aim of this study was to study the effect of adding different levels of aqueous MSE to drinking water on some production indicators (weight gain, feed consumption, feed conversion ratio, and mortality rate) in broiler chickens.

Materials and Methods

Animals, Treatments and Experimental Design

The study was conducted using 300 one-day-old chickens of Ross 308 strain, in a private farm on the outskirts of Hama city, which relies on a semi-closed breeding system and a bedding of sawdust. The experiment lasted for 42 days during the period from 01/09/2024 to 11/10/2024. The broiler chicks were distributed into four groups, each containing 75 broiler chickens. Each group contained three replicates, each containing 25 broiler chickens, according to a completely random design. The broiler chickens were placed in mesh cages with dimensions of 2 x 1.5 m, with a density of 8 chickens /m2. The broiler chickens of each replicate were placed in a place equipped with a feeder and a drinker, and all groups underwent the same treatment in terms of heating, ventilation, and everything related to the management and care system. The broiler chickens were cared for from one day old until 42 days old, and the temperature was controlled when receiving the broiler chicks at around 33°C during the first three days, then it was gradually reduced at a rate of 1°C daily for all the studied treatments to be fixed at 21°C, while light was provided 24 hours a day during the first three days of caring for the broiler chicks, then the lighting was gradually reduced at a rate of one hour a day until the age of one week, to fix the lighting program according to (20L: 4D) until the end of the fattening period [12]. The broiler chickens were also vaccinated according to a unified preventive vaccination program followed in the breeding area (Table 1), in addition to giving them vitamins to resist the stress caused by the used vaccine.

Table 1: Immunization program followed during the period of care.

Today’s

Method of giving the vaccine

Type of vaccine given

1

Eye Drop Newcastle and bronchitis

10

Drinking Water  ND Clone 30

14

Drinking Water Gumboro

25

Drinking Water ND Clone 30

The broiler chickens were fed with balanced protein and energy pellet feed mixtures produced by Feedmix (Hama, Syria). The care period was divided into three phases: the starter phase (1-14 days), the grower phase (15-25 days), and the finisher phase (26-42 days). The feed mixtures were provided in accordance with their needs according to the age phase (Table 2) according to the recommended nutritional requirements tables for the breed Aviagen [13]. The feed mixtures and water were ad libitum provided.

Table 2: Composition of feed mixtures used in feeding experimental broiler chickens.

Ingredients(g/kg)

Starter Mixture
(1-14 days)
Grower Mixture
(15-25 days)

Finisher Mixture
(26-42 days)

Yellow corn

556.4

594.3

624.3

Soybean meal, 48%

320

280

231.3

Corn gluten, 60%

59.8

55.7

65.7

Soybean oil

20

30

40

Calcium carbonate

13

12

10.5

Calcium dibasic Phosphate

15

13

13

Common salt

1.5

1.5

1.5

Premix*

3

3

3

DL-Methionine, 98%

2.3

2

1.8

Lysine, Hcl, 78%

4.7

4.2

4.6

Choline

0.7

0.7

0.7

Threonine

1

1

1

Phytase

0.1

0.1

0.1

NaCo3

2.5

2.5

2.5

Chemical composition (g/kg)**      
ME kcal/kg diet

3012.65

3108.199

3213.92

Crude Protein%

23.48

21.57

20.14

Calcium

9.7

8.7

8.1

Available P

4.8

4.3

4.1

Lysine

14.4

12.9

11.9

Methionine

5.6

5.1

4.8

Threonine

9.7

8.8

8.1

*Premix per kg of diet: vitamin A, 1500 IU; vitamin D3, 200 IU; vitamin E, 10 mg; vitamin K3, 0.5 mg; thiamine, 1.8 mg; riboflavin, 3.6 mg; pantothenic acid, 10 mg; folic acid, 0.55 mg; pyridoxine, 3.5 mg; niacin, 35 mg; cobalamin, 0.01 mg; biotin, 0.15 mg; Fe, 80 mg; Cu, 8 mg; Mn, 60 mg; Zn, 40 mg; I, 0.35 mg; Se, 0.15 mg.
**According to Ross manual Guide, Aviagen [12].

Preparation of the Aqueous Extract of Moringa Seeds

Moringa seeds were obtained from private shops selling medicinal herbs in Hama Governorate. They were cleaned, leaves and foreign bodies were removed, dried, and then ground using a special mill for medicinal plants until a fine powder was obtained. Then 100 g of the powder were collected and mixed with 1000 ml of distilled water (at a ratio of 10: 1) using an electric mixer. The mixture was then left for 24 hours at room temperature. After that, the mixture was filtered using several layers of medical gauze to get rid of suspended particles. Then, the mixture was placed in a centrifuge (Bio-Rad- USA) at a speed of 3000 rpm for 10 minutes. After that, the extract was filtered using Whatman No. 101 filter papers to obtain a clear solution. Then, the extract was diluted with clean drinking water to obtain the doses that were provided to the broiler chickens daily [14] as follows:

Group T1: Drinking water only (control group).

Group T2: 80 ml of MSE/L of drinking water.

Group T3: 100 ml of MSE/L of drinking water.

Group T4: 120 ml of MSE/L of drinking water.

Chemical Analysis of Moringa Seed Extract Treatments

The MSE treatments (T2, T3, and T4) were analyzed for alkaloids, carbohydrates, flavonoids, glycosides, phenols, proteins, saponins, steroids, tannins, and terpenoids using the standard method by Ijarotimi et al. [15] and Nathaniel et al. [16], as shown in Table 3.

Table 3: Phytochemical content (mg/L) of moringa seed extract (MSE) treatments.

Phytochemicals

T2 T3

T4

Alkaloids

8.53

8.89

9.16

Carbohydrates

2.79

3.35

3.54

Flavonoids

3.98

4.23

4.52

Phenols

17.96

18.41

18.99

Protein

32.77

33.32

34.12

Saponins

5.87

6.18

6.63

Steroids

4.12

4.73

5.34

Tannins

47.63

53.2

55.32

Terpenoids

18.24

18.97

19.48

The calcium, magnesium, phosphorus, potassium, zinc, iron, and sodium content of MSE treatments was determined according to the methods described by Liang et al. [17]. The MSE treatments (T2, T3, and T4) were analyzed for vitamin A, B1, B2, B3, B6, B12, C, D3, E, K3, and β-carotene (Table 4) using the methods described by Sami et al. [18].

Table 4: Mineral and vitamin composition (mg/L) of moringa seed extract (MSE) treatments.

Micronutrients

T2 T3

T4

Calcium

601.3

621.7

637.8

Magnesium

38.47

41.20

43.50

Phosphorus

356.0

396.4

405.8

Potassium

69.00

74.00

77.10

Zinc

1.067

1.170

1.243

Iron

6.260

6.490

6.750

Sodium

243.8

262.7

275.7

Vitamin A

4.040

4.480

4.640

Vitamin B1

0.140

0.170

0.250

Vitamin B2

0.230

0.310

0.350

Vitamin B3

0.230

0.320

0.390

Vitamin B6

0.280

0.320

0.360

Vitamin B12

0.110

0.130

0.170

Vitamin C

4.650

4.800

4.940

Vitamin D3

ND

ND

ND

Vitamin E

546.0

597.0

630.0

Vitamin K3

ND

ND

ND

β-carotene

ND

ND

ND

ND = not detected.

Studied Indicators

The production indicators were studied during 42 days of the chickens ‘ life, as follows:

Weight of hatched broiler chickens (g): The broiler chickens were weighed at one day of age in each replicate separately using a scale with an accuracy of 0.1 g.

Weekly live weight (g): The individual weight of the broiler chickens was recorded weekly for all chickens in the studied groups.

Weight gain (g): Live weight at the end of the period – live weight at the beginning of the period [19].

Average feed intake of the broiler chickens (g): According to the average weekly feed intake, by weighing the amount of feed provided to each group at the beginning of the week, then weighing the amount of feed remaining in the feeders for each group at the end of the week, and according to the difference in weight. The average feed intake of each chicken was calculated according to the following equation:

Average feed intake (g) = Amount of feed given (g) – Amount of feed remaining (g).

Feed conversion ratio: According to the conversion ratio for each group weekly according to the following relationship:

Mortality rate: The number of dead broiler chickens was recorded daily from each replicate, and their percentage was recorded during the care period extending up to 42 days of age.

Statistical Analysis

The results of all studied indicators were subjected to statistical analysis using analysis of variance according to the completely random design using the statistical program SPSS26, and the significant differences between the averages of the coefficients were compared using the LSD test at a significance level of p < 0.05.

The mathematical model was as follows: Yij = μ + Ti + eij

Where:

Yij = Individual observation.

μ = The overall mean for the trial under consideration.

Ti = The effect of the ith treatment.

eij = Random residual error. [20]

Results

Live Weight

The results in Table 5 show the effect of adding the aqueous of MSE to drinking water on the average live weight of the experimental broiler chickens. As it is noted, there is a significant increase (P<0.05) in the average weights of the broiler chickens in the treatment groups T2, T3, T4, as they reached 2626.89, 2669.96, and 2725.66 g at the end of the experiment for the three groups, respectively, compared to the control group T1, which reached 2499.28 g.

Table 5: The Effect of adding aqueous of MSE to drinking water on the average live weight of experimental broiler chickens. (g)

The age

Experimental groups (Mean ± SD)
T1 T2 T3 T4

P- value

Day 1

4.12 ± 43.25ns 4.97 ± 43.32 ns 4.55 ± 43.46 ns 5.32 ± 43.37 ns 0.531
Week 1 8.74 ± 171.75 b 9.93 ± 181.64a 8.35 ± 185.46a  ± 187.479.27a

0.046

Week 2

12.54 ± 446.86c 13.01 ± 480.75b 12.89 ± 500.65a 13.42 ± 512.68a 0.039
Week 3 19.71 ± 915c 22.34 ± 967.92b 23.45 ± 993.26a 24.98 ± 1018.87a

0.042

Week 4

26.52 ± 1428.15c 26.05 ± 1513.42b 27.34 ± 1544.58b 28.54 ± 1582.28a 0.040
Week 5 31.10 ± 1990.85b 2099.62 ± 30.25a 31.21 ± 2137.08a 32.18 ± 2184.38 a

0.043

Week 6

34.13 ± 2499.28b 31.02 ± 2626.89a 35.73 ± 2669.96a 39.52 ± 2725.66 a

0.041

T1: Drinking water only (control group). T2: 80 ml of MSE/liter of drinking water.
T3: 100 ml of MSE/liter of drinking water. T4: 120 ml of MSE/liter of drinking water.
ns indicates no significant differences within the same line between the experimental groups (P>0.05).
Different letters a, b, c within the same line indicates significant differences between groups at a level of (P≤0.05).

Weight Gain

The results in Table 6 show the effect of adding the aqueous of MSE to drinking water on the average weight gain of broiler chickens during the experimental stages. A significant increase (P<0.05) was observed in the average weight gain of broiler chickens in the treatment groups T2, T3, T4, which reached 2582.57, 2626.5, and 2682.29 g at the end of the experiment, respectively, compared to the control group T1, which reached 2456.03 g.

Table 6: Effect of adding aqueous of MSE to drinking water on the average weight gain of experimental broiler chickens. (g)

The age

Experimental groups (Mean ± SD)
T1 T2 T3 T4

P- value

Week 1

4.12 ± 128.5 ns 4.55 ± 138.32ns 3.95 ± 142 ns 4.56 ± 144.1 ns 0.121
Week 2 5.10 ± 275.11b 6.40 ± 299.11ab 6.70 ± 315.19a 6.32 ± 325.21a

0.045

Week 3

12.70 ± 468.14b 13.30 ± 487.17a 14.11 ± 492.6a 14.10 ± 506.19a 0.043
Week 4 22.30 ± 513.15b 20.35 ± 545.5a 21.45 ± 551.32a 22.57 ± 563.41a

0.034

Week 5

19.16 ± 562.7b 18.67 ± 586.2ab 19.87 ± 592.5a 19.47 ± 602.1a 0.031
Week 6 7.62 ± 508.43b 8.42 ± 527.27ab 9.71 ± 532.88a 9.32 ± 541.28a

0.042

Full experience

31.02 ± 2456.03b  ± 2582.5727.78a 2626.5 ± 22.6a 32.1 ± 2682.29a

0.041

T1: Drinking water only (control group). T2: 80 ml of MSE/liter of drinking water.
T3: 100 ml of MSE/liter of drinking water. T4: 120 ml of MSE/liter of drinking water.
ns indicates no significant differences within the same line between the experimental groups (P>0.05).
Different letters a, b within the same line indicates significant differences between groups at a level of (P≤0.05).

Feed Intake

The results in Table 7 show the effect of adding the aqueous of MSE to drinking water on the average amount of feed consumed by the experimental broiler chickens. It is noted that there was no significant effect (P>0.05) of the MSE on the amount of feed consumed by the treatment groups T2, T3, T4, as the average reached 4530.4, 4556.86, and 4572.47 g, compared to the control group, as the average reached 4518.19 g.

Table 7: Effect of adding aqueous of MSE to drinking water on the average amount of feed intake of experimental broiler chickens. (g)

The age

Experimental groups (Mean ± SD)
T1 T2 T3 T4

P- value

Week 1

5.17 ± 188ns 5.20 ± 189.12ns 4.90 ± 190.34ns 5.88 ± 191.52ns 0.131
Week 2 5.80 ± 414.21ns 6.25 ± 416.34ns 6.98 ± 419.74ns 7.22 ± 420.61ns

0.081

Week 3

10.72 ± 732.14ns 12.14 ± 733.44 ns 14.19 ± 734.67ns 13.35 ± 735.41ns 0.075
Week 4 24.35 ± 813.15ns 22.30 ± 816.41 ns 25.37 ± 827.42ns 23.50 ± 835.81ns

0.053

Week 5

29.46 ± .1129.2ns 31.26 ± .1131.1 ns 34.21 ± .1139.24ns 35.56 ± .1141.21ns 0.068
Week 6 37.32 ± 1241.49ns 35.72 ± 1243.99ns  ± 1245.4937.51ns 36.75 ± 1247.91ns

0.094

Full experience

35.72 ± 4518.19ns 4530.4 ± 30.52ns 4556.86 ± 33.8 ns 4572.47 ± 40.12ns

0.055

T1: Drinking water only (control group). T2: 80 ml of MSE/liter of drinking water.
T3: 100 ml of MSE/liter of drinking water. T4: 120 ml of MSE/liter of drinking water.
ns indicates no significant differences within the same line between the experimental groups (P>0.05).

Feed Conversion Ratio

The results in Table 8 show the effect of adding the aqueous of MSE to drinking water on the average feed conversion ratio of the experimental broiler chickens. As indicated, there is a significant improvement (P<0.05) in the average feed conversion ratio of the broiler chickens of the treatment groups T2, T3, T4, as it reached 1.754, 1.735, and 1.705 g/g for the three groups, respectively, compared to the control group T1, as it reached 1.840 g/g.

Table 8: Effect of adding aqueous of MSE to drinking water on the average feed conversion ratio of experimental broiler chickens. g/g

The age

 Experimental groups (Mean ± SD)                   
T1 T2 T3 T4

P- value

Week 1

5.17 ± 1.463b 5.20 ± 1.397a 4.90 ± 1.340a 5.88 ± 1.329a 0.047
Week 2 5.80 ± 1.505b 6.25 ± 1.392a 6.98 ± 1.332a 7.22 ± 1.293a

0.045

Week 3

10.72 ± 1.564b 12.14 ± 1.505a 14.19 ± 1.491a 13.35 ± 1.453a 0.031
Week 4 24.35 ± 1.585b 22.30 ± 1.517a 25.37 ± 1.501a 23.50 ± 1.483a

0.042

Week 5

29.46 ± .2.007b 31.26 ± .1.929a 34.21 ± .1.923a 35.56 ± .1.895a 0.033
Week 6 37.32 ± 2.442b 35.72 ± 2.359a 37.51 ± 2.337a 36.75 ± 2.306a

0.035

Full experience

35.72 ± 1.840b 1.754 ± 30.45a 1.735 ± 33.8a 1.705 ± 36.12a

0.024

T1: Drinking water only (control group). T2: 80 ml of MSE/liter of drinking water.
T3: 100 ml of MSE/liter of drinking water. T4: 120 ml of MSE/liter of drinking water.
Different letters a, b within the same line indicates significant differences between groups at a level of (P≤0.05).

Mortality

The results in Table 9 show the effect of adding the aqueous of MSE to drinking water on the mortality rates of the experimental broiler chickens. A significant decrease (P<0.05) is observed in the percentage of dead broiler chickens in the treatment groups T2, T3, T4, as it reached 4, 2.66, and 1.33% at the end of the experiment for the three groups, respectively, compared to the control group T1, which reached 8%.

Table 9: Effect of adding aqueous of MSE to drinking water on the Average total mortality rate of broiler chickens in the experimental groups (%).

Groups

Total number of broiler chickens in the group Number of live broiler chickens at the end of the experiment

Mortality %

T1

75 69 8b
T2 75 72

4a

T3

75 73 2.66 a
T4 75 74

1.33a

P- value


0.043

T1: Drinking water only (control group). T2: 80 ml of MSE/liter of drinking water.
T3: 100 ml of MSE/liter of drinking water. T4: 120 ml of MSE/liter of drinking water.
Different letters a, b within the same line indicates significant differences between groups at a level of (P≤0.05).

Discussion

The results of the present study show the important role of MSE in improving the growth and weight gain of broiler chickens. These findings are consistent with that of Alabi et al. [21] when providing the aqueous extract of Moringa oleifera leaves to broiler chickens, as they noted that the average daily weight gain and final body weight were higher in the groups that received the extract at 120 ml/liter compared to the control group. Khan et al. [22] also recorded a significant increase in body weight when Moringa leaf powder was added at a rate of 1.2% to broiler chickens feed mixtures. In addition, adding Moringa oleifera leaves at a level of 5% to 20% to feed mixtures showed a significant improvement in the growth of broiler chickens [23]. The reason for the improved growth and weight gain may be explained by the richness of Moringa seeds in proteins rich in sulfur amino acids and their high content of oil and beneficial unsaturated fatty acids [24]. The results of the study show that there was no significant effect of MSE on the amount of feed consumed. This is consistent with previous researchers [25,26], who did not observe any effect of Moringa on the amount of feed consumed, while it contradicts the results reached by other authors [27,28,29], who found an increase in the amount of feed consumed. The results of the study also indicate an improvement in the feed conversion rate in broiler chickens in the treatment groups compared to the control group. These results are consistent with what was reached by previous researchers [28,29,30], who explained that Moringa leaves have an effect in improving the feed conversion rate, while the results differed from that of Naga et al. [31], who did not observe any effect of Moringa leaves on the feed conversion rate, while Cui et al. [25] found a significant increase in the feed conversion rate in Moringa leaf treatments. The improvement in the feed conversion rate may be attributed to the fact that MSE improves intestinal health, as it works to increase the length of the villi in the digestive tract [32], which in turn leads to better absorption of the nutrients available in Moringa leaves [33]. The results show a significant decrease in the percentage of dead broiler chicks during the experiment in the groups treated with MSE. This is consistent with the results of Alnidawi et al. [34] and contradicts that of other researchers [26,35,36]. The reason for the decrease in the mortality rate in the treatment groups may be attributed to the Moringa seeds containing a high percentage of antioxidants, vitamins and nutrients that contribute to enhancing the broiler chickens’ immunity and resistance to diseases.

Conclusions

The study concludes the positive effect of using the aqueous of MSE with drinking water in improving the productive performance of broiler chickens, as the live weight increased with stability in the amount of feed consumed, and the feed conversion ratio and the percentage of dead broiler chickens decreased.

Author Contributions

Researcher dr. Mohamed Alrez wrote the research, conducted the experiments, statistically analyzed the results, tabulated them, reviewed the research, and prepared it for publication.

Declarations

Ethics Approval and Consent to Participate

Approval was obtained from the Institutional Animal Care and Use Committee (IACUC) and informed consent was obtained from the animal owner for the experiments and publication of the results, with a commitment to applying the best veterinary practices for animal care

Consent for publication

Not applicable.

Availability of data and materials

The data obtained and analyzed during the current study are available from the corresponding author upon request and are also available on the website: https: //orcid.org/0009-0003-0735-1807.

Competing interests

The authors declare no competing interests.

Funding

The research was funded with support from Hama University.

References

  1. Gupta S, Jain R, Kachhwaha S, Kothari SL. (2018). Nutritional and medicinal applications of Moringa oleifera Lam – Review of current status and future possibilities. J Herbal Med [crossref]
  2. Makkar HP, Francis G, Becker K. (2007). Bioactivity of phytochemicals in some lesser-known plants and their effects and potential applications in livestock and aquaculture production systems. Animal [crossref]
  3. Pandey A, Pandey RD, Tripathi P, Gupta PP, Haider J, Bhatt S, Singh AV. (2012). Moringa oleifera Lam. (Sahijan) – a plant with a plethora of diverse therapeutic benefits: an updated retrospection. Med Aromat Plants [crossref]
  4. Stohs SJ, Hartman MJ. (2015). Review of the safety and efficacy of Moringa oleifera. Phytother Res [crossref]
  5. Rachmawati I, Rifai M. (2014). In vitro immunomodulatory activity of aqueous extract of Moringa oleifera Lam. leaf to the CD4+, CD8+ and B220+ cells in Mus musculus. J Exp Life Sci [crossref]
  6. Anwar F, Sajid L, Muhammad A, Anwarul HG. (2007). Moringa oleifera: A food plant with multiple medicinal uses. Phytother Res [crossref]
  7. Egbu CF, Motsei LE, Yusuf AO, Mnisi CM. (2022). Evaluating the efficacy of Moringa oleifera seed extract on nutrient digestibility and physiological parameters of broiler chickens. Agriculture, 12(8):1102. [crossref]
  8. Gul S, Hussain F, Taj R, Ullah A. (2024). https://www.mdpi.com/2077-0472/12/8/1102 J Adv Vet Anim Res, 11(2):339–348. [crossref]
  9. Ali S, Masood S, Zaneb H, Rehman HF, Masood S, Khan MR, et al. (2017). Supplementation of zinc oxide nanoparticles has beneficial effects on intestinal morphology in broilers chicken. Pak Vet J [crossref]
  10. Rehman HF, Zaneb H, Masood S, Yousaf MS, Hayat K, Majeed KA, et al. (2022). Effect of selenium nanoparticles and mannan oligosaccharide supplementation on growth performance, stress indicators, and intestinal microarchitecture of broilers reared under high stocking density. Animals [crossref]
  11. Verma MP, Lavania P, Baswal AK, Kumar A. (2024). Efficacy of Moringa oleifera leaf aqueous extract supplementation on growth performance of native ‘Ankleshwar’ poultry birds. Biological Forum – Int J, 16(3):257–261. [crossref]
  12. Aviagen. (2018). Ross Broiler: Management Handbook. Available at: https://en.aviagen.com
  13. Aviagen R. (2009). Ross Broiler Management Manual. Available at: http://goldenpoultry.com/wp-content/uploads/2014/09/Ross-Broiler-Handbook-2014i-EN.pdf
  14. Egbu CF, Motsei LE, Yusuf AO, Mnisi CM. (2022). Evaluating the efficacy of Moringa oleifera seed extract on nutrient digestibility and physiological parameters of broiler chickens. Agriculture, 12:1102. [crossref]
  15. Ijarotimi OS, Adeoti OA, Ariyo O. (2013). Comparative study on nutrient composition, phytochemical, and functional characteristics of raw, germinated, and fermented Moringa oleifera seed flour. J Food Sci Nutr [crossref]
  16. Nathaniel EU, Onyancha JM, Mugambi M, Ncene W, Moriasi GA. (2020). Chemical composition of Moringa oleifera Lam. and Moringa stenopetala Bac. leaves from Kenya. Int J Plant Res [crossref]
  17. Liang L, Wang C, Li S, Chu X, Sun K. (2019). Nutritional compositions of Indian Moringa oleifera seed and antioxidant activity of its polypeptides. Food Sci Nutr [crossref]
  18. Sami R, Li Y, Qi B, Wang S, Zhang Q, Han F, Ma Y, Jing J, Jiang L. (2014). HPLC analysis of water-soluble and fat-soluble vitamins of okra (Abelmoschus esculentus). J Chem [crossref]
  19. Abou Sekken MSM. (2015). Performance, immune response, and carcass quality of broilers fed low-protein diets containing Moringa oleifera leaves meal or its extract. J Am Sci [crossref]
  20. Sastry EVD. (2007). Essentials of Agricultural Statistics. Pointer Publishers, Jaipur (India), pp. 260–266.
  21. Alabi O, Malik A, Ng’ambi J, Obaje P, Ojo B. (2017). Effect of aqueous Moringa oleifera (Lam) leaf extracts on growth performance and carcass characteristics of Hubbard broiler chicken. Braz J Poult Sci, 19:273–280. [crossref]
  22. Khan I, Zaneb H, Masood S, Yousaf MS, Rehman HF, Rehman H. (2017). Effect of Moringa oleifera leaf powder supplementation on growth performance and intestinal morphology in broiler chickens. Anim Physiol Anim Nutr, 101:114–121. [crossref]
  23. Moreki JC, Gabanakgosi K. (2014). Potential use of Moringa oleifera in poultry diets. Glob J Anim Sci Res, 2:109–115. [crossref]
  24. Macambira GMCB, Rabello MIV, Navarro CDC, Lopes EC, Lopes GRD, Nascimento JDCRD, Silva JDCRD. (2022). Effects of Moringa oleifera leaf meal on performance and carcass yield of broilers. Rev Bras Zootec, 51. [crossref]
  25. Cui YM, Wang J, Lu W, Zhang HJ, Wu SG, Qi GH. (2018). Effect of dietary supplementation with Moringa oleifera leaf on performance, meat quality, and oxidative stability of meat in broilers. Poult Sci, 97(8):2836–2844. [crossref]
  26. Hassan HMA, El-Moniary MM, Hamouda Y, El-Daly EF, Youssef AW, Abd El-Azeem NA. (2016). Effect of different levels of Moringa oleifera leaves meal on productive performance, carcass characteristics, and some blood parameters of broiler chicks under heat stress. Asian J Anim Vet Adv, 11(1):60–66. [crossref]
  27. Akande TD, Ogunyemi J, Okunlola PF, Owolabi E, Olakanmi O. (2022). Growth-promoting and anti-lipogenic characteristics of three phytogenic feed additives in broilers’ diets. Adv Anim Vet Sci, 10(5):999–1006. [crossref]
  28. Gorleku DO, Badu GPA, Afele JT, Kaba JS, Abunyewa AA. (2022). Assessing the efficiency of Moringa oleifera leaf meal on the growth performance of broiler chicken. J Appl Life Sci Environ, 54(4):370–376. [crossref]
  29. El-Moniary MM, Hemid AAA, El-Wardany I, Gehad AE, Gouda A. (2010). The effect of early age heat conditioning and some feeding programs for heat-stressed broiler chicks on productive performance. World J Agric Sci, 6:689–695. [crossref]
  30. Khalid N, Sakhawat SF, Mehmood H, Ali MM, Ali R, Amin Y, Ayaz M. (2021). Effects of Moringa oleifera leaf powder as feed additive on growth performance and blood parameters of broilers. J Anim Health Prod, 9(3):271–276.
  31. Naga MK, Ashour AA, Rahman SAA, Abed M. (2020). Performance and histomorphological parameters of broiler chicks fed low crude protein diet supplemented with Moringa oleifera leaves powder. Menoufia J Anim Poult Fish Prod, 4(5):65–85.
  32. Abdulsalam SM, Yahaya S, Yakasai MA. (2015). Performance of broiler chickens fed on Moringa oleifera leaf meal supplemented poultry feed. Niger Agric J, 46(1):139–146. [crossref]
  33. Nkukwana TT, Muchenje V, Masika PJ, Mushonga B. (2015). Intestinal morphology, digestive organ size, and digesta pH of broiler chickens fed diets supplemented with or without Moringa oleifera leaf meal. S Afr J Anim Sci, 45(4):362–370. [crossref]
  34. Alnidawi A, Ali F, Abdelgayed S, Ahmed F, Farid MM. (2016). Moringa oleifera leaves in broiler diets: Effect on chicken performance and health. Food Sci Quality Manag, 58:40–48. [crossref]
  35. El-Tazi SM. (2014). Effect of feeding different levels of Moringa oleifera leaf meal on the performance and carcass quality of broiler chicks. Int J Sci Res, 3(5):147–151. [crossref]
  36. Ayo-Ajasa OY, Abiona JA, Fafiolu AO, Egbeyale LT, Njoku CP, Omotayo IG, Abel FAS. (2016). Performance characteristics of broilers fed graded levels of Moringa oleifera leaf meal. Malays J Anim Sci, 19(1):23–31. [crossref]

Domestic Violence: Combining AI Simulation and Mind Genomics Thinking to Explore Potential Mind-Sets and Relevant Responses

DOI: 10.31038/ALE.2025211

Abstract

The paper deals with the issues involved in domestic violence, specifically the problem of how to help police officers understand the mind of the abuser. Through AI, the police office can develop a simulation system that allows the office to explore the “mind” of the abuser to learn what different abusers may be thinking and what might be effective strategies to deal with the abuser. In turn, Mind Genomics provides the user with a sense of the different types of thinking going on among abusers and what may be reasonable points of discussion. The paper shows how to simulate these mind-sets and how to simulate the advice that a psychotherapist might give the police officer when considering the domestic violence situation. The paper finishes with a vision of AI coupled with Mind Genomics as a new educational tool for police officers that in effect becomes a never-exhausted, “always on” guide which can be used to deal with problems in “real time.”

Keywords

Abuser mind-set, Domestic violence intervention, Mind genomics, Police training

Introduction

Domestic violence is a persistent issue affecting victims, families, and communities. Police officers play a crucial role in addressing this issue, but understanding the broader psychological, social, and economic dynamics is essential. Officers face intense and volatile situations, where victims may not disclose their mistreatment due to fear, shame, or a desire to protect the abuser. They must balance immediate protective duties with awareness of long-term psychological dynamics [1-3]. Victims may react differently, wanting immediate intervention or refusing assistance due to financial or emotional challenges. Societal stigma attached to domestic incidents can further complicate the situation, leading to victims retracting claims or minimizing the severity of the abuse [4-6]. Understanding the root causes of domestic violence, including familial upbringing, past trauma, substance abuse, and socioeconomic stressors, is crucial for effective intervention. Officers must be sensitive to these nuances and develop strategies that tailor responses to the nuanced mind-set of the individuals involved. Non-judgmental communication is key, and officers should engage both the victim and the abuser with respect and tact [7-10]. Providing victims with realistic options and resources, such as social services, local shelters, or legal aid, is also vital. Officers must walk a fine line between restraint and proactivity, ensuring their intervention not only addresses immediate violence but also opens pathways for long-term solutions [11-13].

The Issues Emerging When We Recognize the Different Mind-Sets of Domestic Abusers

Domestic violence perpetrators display a wide range of mind-sets that determine the severity of abuse, interaction with victims, and response to law enforcement. Standard, one-size-fits-all approaches often fail to account for the differing motivations, rationalizations, and emotional ecosystems driving abusive behavior. Common mind-sets include “control-oriented” abusers who rely on coercion, intimidation, and isolation tactics, “rage-driven” abusers who act explosively in moments of anger or frustration, and “calculating manipulator” abusers who abuse their partners covertly without physical violence. Some abusers may have underlying mental health issues, such as narcissistic or antisocial personality disorders, which require training in recognizing these conditions. Understanding the diversity of abusive mind-sets challenges the stereotype that domestic violence is always a one-time, heightened emotional situation. Officers trained in identifying abusive mind-sets can better approach victims and discern the full scope of violence. Recognizing key mind-sets can help provide victims with a path toward long-term safety and justice [14-16].

How AI can Provide Us with Rapid Learning

Artificial Intelligence (AI) has the potential to revolutionize law enforcement training, particularly, in teaching police officers about domestic violence. By incorporating AI technology into training programs, officers can enhance their understanding of domestic violence, preparing them to respond more effectively. AI can create highly customized and interactive simulations, replicating real-life domestic violence situations, and providing immediate feedback and alternative responses. AI can handle large amounts of data, allowing for more comprehensive training modules. It also offers anonymity and privacy, fostering a deeper understanding of the subject matter. However, AI lacks the emotional intelligence of human instructors, which is crucial when dealing with sensitive societal issues. Over-reliance on AI may lead to a lack of human interaction, which is essential when dealing with sensitive societal issues. AI-driven training may also foster a “one-size-fits-all” mentality, limiting an officer’s ability to improvise during unpredictable situations. Ethical concerns arise due to AI models that are based only on certain types of case data, potentially filtering out other experiences and reinforcing stereotypes [17-19]. The 15 questions presented in Table 1 give a sense of the range of information available through AI, using the Mind Genomics platform, BimiLeap.com (Idea Coach option). The strategy to obtain this information was simply to instruct AI to provide questions and then answers to those questions, regarding issues in the interaction of police officers with situations involving domestic violence. The Mind Genomics platform was used (BimiLeap.com), with the request put into the Idea Coach feature.

Table 1: AI-generated questions and answers regarding the use of AI in cases of domestic violence.

Mind-Sets Revealed by Mind Genomics and Potential Advances in Understanding Domestic Violence

Mind Genomics is an emerging science that posits that individuals display unique, patterned ways of thinking through their responses to various stimuli in everyday life. This field, originally applied in consumer behavior to understand how different personalities react to specific messages, extends to broader areas, contributing to revelations about societal and interpersonal behavior. At its core, Mind Genomics proposes that the human mind is organized into various “mind-sets” or cognitive segments, which refer to stable, shared patterns of reasoning coordinated by specific stimuli. These mind-sets represent different cognitive predispositions toward processing experiences, emotions, and behavior. When applied to the studies of abusers in cases of domestic violence, Mind Genomics offers a structured way to categorize individuals based on how they think and interpret their actions, intent, and consequences [20-23]. In this context, mind-sets can be understood as specific patterns or clusters of thought processes that lead to specific behaviors or attitudes. Conceptually, mind-sets are a form of subgrouping within a larger population, crucially helping identify common responses shared by individuals within the same cognitive pattern. In terms of domestic violence, mind-sets could unveil how abusers cognitively justify, rationalize, or express their actions. One abuser might function within a mind-set of domination and control, motivated by power dynamics, while another’s behavior may be propelled by a defensive mind-set characterized by paranoia or insecurity. These divided categories can be used to reflect underlying mental frameworks that influence behavior and to understand abusers as individuals shaped by distinct cognitive lenses. Defining and categorizing abusers based on mind-sets could lead to more effective intervention strategies, helping law enforcement, social workers, and counselors understand the underlying motives behind such behavior. Recognizing whether an abuser perceives their actions through a lens of entitlement, frustration, or trauma can guide distinct approaches to rehabilitation or policing. For instance, abusers operating from a mind-set of control may require different therapeutic interventions from those who commit abuse sporadically in response to perceived emotional threats. By understanding mind-sets, patterns of abuse can be identified from early situational cues and interventions can be tailored based on cognitive predispositions. The value of positing hypothetical mind-sets lies in the ability to frame domestic violence in a non-homogeneous way. One criticism of prior generalized approaches to understanding abusers is that they often overlook the diversity of thought processes and personal histories underlying domestic violence. Instead of assuming that all abusers have the same motivations, positing different mind-sets helps domestic violence responders acknowledge the complexity of this behavior. Applying mind-sets allows for empathy-driven, psychologically informed intervention programs, making protective services more precisely suited to individual needs. This nuanced approach serves both the victim’s safety and the abuser’s potential rehabilitation. The law enforcement community can significantly benefit from applying Mind Genomics thinking to categorize abusers. When officers respond to domestic disputes, the traditional focus might be on immediate cessation of conflict or criminal arrest. However, with training in mind-sets as informed by Mind Genomics, law enforcement might also gain insight into the cognitive frameworks guiding the abuser’s actions. By identifying early markers of cognitive predispositions through statements, behavior, or situational history, officers could better predict the likelihood of reoffending, immediate safety risks, and guide victims toward the most appropriate services depending on the abuser’s mind-set. Additionally, police officers could more effectively diffuse situations by understanding the specific psychological motivations driving the behavior rather than using blanket approaches to all cases of abuse. The origins of Mind Genomics stem from decades of research into behavioral psychology and consumer science, aimed at decoding how people intellectually process stimuli. The concept was introduced in marketing programs to categorize consumers based on their emotional and intellectual responses to products, services, or advertisements. Behind this idea was the understanding that people process information in diverse, context-dependent ways, which could be traced and cataloged. This practice was later expanded to areas outside commercial issues. The rationale is that segmented, data-driven understandings of mind-sets bring value to domains like criminal justice, providing tools for better psychological prediction and tailored interventions. By incorporating Mind Genomics thinking into law enforcement approaches, the community stands to gain a new, deeper framework for profiling criminal behavior beyond rudimentary labels such as “violent” or “non-violent.” This could mean that police forces, probation offices, social workers, and courts can develop more intelligent, predictive forms of justice. Instead of intervention tools that rely on generic assessments of aggression or conflict, understanding mind-sets allows for interventions that recognize cognitive diversity among offenders. As this approach gains traction, we can expect collaboration between data scientists, psychologists, and public safety professionals to create systematic tools that identify structured pathways toward behavioral reform—ideal for criminals who might otherwise remain in cycles of abuse.

Combining Mind Geonomics Thinking with AI to Simulate Three Hypothetical Mind-Sets of Domestic Abusers

When analyzing domestic violence, it is important to understand that abusers might fall into different behavioral and psychological types. These mind-sets’ impact may affect how each abuser approaches their victims, how they view their actions, and how they might react to authority or intervention by law enforcement. For law enforcement officers, understanding these mind-sets can be crucial in handling the situation safely and effectively. This section explores how AI can be used to hypothesize the existence of three mind-sets of abusers in domestic violence cases, and then immediately simulate the “deeper nature” of each mind-set. The three mind-sets were generated by AI through the prompt to only identify three mind-sets. AI was not told the nature of these mind-sets.

The three mind-sets emerging from AI’s simulation are:

  1. Entitled & Control-Oriented Mindset: This person sees violence as a way to assert dominance and control, motivated by entitlement.

  2. Emotionally Volatile Mindset: This abuser is driven by strong emotions, often unable to manage intense anger or jealousy.

  3. Avoidant & Manipulative Mindset: This abuser is more calculated and strategic, using manipulation and more subtle forms of abuse to maintain control, but might be quick to downplay or deny their actions to outsiders, like law enforcement.

By framing responses from these different mind-sets, officers can start to identify patterns in abuser psychology—whether the abuser leans more towards outright control, emotional volatility, or calculated manipulation—thus better equipping themselves to see through manipulation and respond appropriately to each unique situation. Table 2 shows eight questions that a police officer might ask—or observe—when arriving at a domestic violence scene, along with three potential responses from abusers, each aligned with one of the above mindsets.

Table 2: Eight questions that a police officer might ask, and simulated answers from mind-sets.

Combining Mind Genomics Thinking with AI to Simulate a Therapy Session

Police officers can enhance their understanding of domestic violence incidents by simulating different mind-sets of potential abusers. By observing how different abusive mind-sets engage in therapeutic dialogue, officers gain insight into the psychological motives, behavioral triggers, and rationalizations that drive abusive behavior. This knowledge can help officers approach domestic violence situations with more nuanced strategies, potentially de-escalating situations or identifying early warning signs before violence occurs. By incorporating multiple mind-sets, officers can witness and analyze abuser reactions when challenged within a therapeutic framework, improving communication skills and informs appropriate intervention strategies. Additionally, simulating different mindsets can help officers distinguish abusive actions from mental health crises or substance-related violence, allowing officers to refer individuals to social or mental health services if necessary. Finally, simulating various personalities and therapeutic responses helps officers develop increased empathy for both abusers and victims, enhancing their ability to connect victims with resources and reduce the risk of retaliation or further violence in the home. AI can be instructed to provide varying levels of depth in its simulation. By slightly altering the instructions to AI, the user can incorporate the thinking of the psychotherapist as well, beyond simply the psychotherapist moderating the session. Table 3 shows the instructions given to AI, and the additional, optional instructions, to provide a deeper insight into the mind of the psychotherapist. Table 4 compares simulations from a session talking about a “code word” to signal when the emotions are overly strong. Table 5 compares simulations from a session talking about “taking a break” when the emotions are overly strong. Table 6 compares simulations from a session talking about moving the argument away from accusation.

Table 3: Instructions to AI to simulate a group therapy session with the psychotherapist making a suggestion and the three mind-sets responding, as well the private thoughts of the three mind-sets.

Table 4: Psychotherapist suggestion about a code word to signal and then reduce tensions—a comparison of two levels of analysis.

Table 5: Psychotherapist’s suggestion about removing oneself from the situation–A comparison of two levels of analysis.

Table 6: Psychotherapist suggestion about a reframing and moving away from anger towards communication—A comparison of two levels of analysis.

Discussion and Conclusions

< class=”rowfont”p>Police personnel often struggle with domestic violence calls in the complex, emotionally charged environment of law enforcement. AI and Mind Genomics are rapidly changing training methods, offering officers realistic simulations with unmatched depth and accuracy. AI offers broad to detailed situational training for real-time decision-making, enabling officers to join simulated crises, engage with everyone, forecast results, and refine the plan. AI simulations are intriguing for their agility and realism, as they allow officers to learn comprehensively in dynamic, reactive situations. AI can mimic emotions, relationships, and personality, while Mind Genomics combined with AI simulates the minds of victims and offenders, allowing the exploration of domestic violence occurring with people of different mind-sets and ways of thinking about the same issue. AI’s tolerance for human variations is strong, as everyone in a domestic violence situation discusses their emotions and experiences. AI allows police officers to explore the range of reactions to the same situation, including victims being terrified yet compliant, hesitant, doubtful, or protective of the abuser, and perpetrators being violent, manipulative, or repentant.

AI exercises can be tailored to train police regarding tactical de-escalation, such as calming the scene, separating victims and abusers, and calling social workers or mental health professionals. Gamification boosts situational preparation and learning, and AI can become a patient, persistent, data-driven mentor most police officers never had.

AI and Mind Genomics-trained cohorts may collaborate on domestic violence strategies that include social work, psychology, and legislation. By challenging the AI to generate novel social situations, new intervention and conflict resolution approaches may develop. Despite imperfections, the approach helps individuals acquire more knowledge than from textbooks or lectures. AI that correctly simulates reality, calculates emotional intelligence, biases, human behaviors, cognitive load during decision-making, and more, is decades ahead. This level of readiness changes police work in stressful, unpredictable circumstances, opening up a new era of opportunities in our ever-changing world.

Acknowledgments

The authors are delighted to acknowledge the ongoing help of Vanessa A. and Angela A. in the preparation of this and companion manuscripts.

References

  1. Campbell AM, Thompson SL, Harris TL, Wiehe SE (2021) Intimate Partner Violence and Pet Abuse: Responding Law Enforcement Officers’ Observations and Victim Reports From the Scene. Journal of Interpersonal Violence. [crossref]
  2. Piquero AR, Jennings WG, Jemison E, Kaukinen C, Knaul FM (2021) Domestic violence during the COVID-19 pandemic – Evidence from a systematic review and meta-analysis. Journal of Criminal Justice. [crossref]
  3. Saxton MD, Olszowy L, MacGregor JCD, MacQuarrie BJ, Wathen CN (2021) Experiences of Intimate Partner Violence Victims With Police and the Justice System in Canada. Journal of Interpersonal Violence. [crossref]
  4. Hine B, Noku L, Bates EA, Jayes K (2022) But, Who Is the Victim Here? Exploring Judgments Toward Hypothetical Bidirectional Domestic Violence Scenarios. Journal of Interpersonal Violence. [crossref]
  5. Muñoz-Rivas M, Bellot A, Montorio I, Ronzón-Tirado R, Redondo N (2021) Profiles of Emotion Regulation and Post-Traumatic Stress Severity among Female Victims of Intimate Partner Violence. International Journal of Environmental Research and Public Health. [crossref]
  6. Ullman SE (2021) Correlates of social reactions to victims’ disclosures of sexual assault and intimate partner violence: a Systematic review. Trauma, Violence, & Abuse. [crossref]
  7. Black A, Lumsden K (2023) Precautionary policing and dispositives of risk in a police force control room in domestic abuse incidents: an ethnography of call handlers, dispatchers and response officers. In: Ethnography and the Evocative World of Policing. Routledge.
  8. Franklin CA, Garza AD, Goodson A, Bouffard LA (2020) Police perceptions of crime victim behaviors: A trend analysis exploring mandatory training and knowledge of sexual and domestic violence survivors’ trauma responses. Crime & Delinquency.
  9. Nancarrow H, Thomas K, Ringland V, Modini T (2020) Accurately identifying the “person most in need of protection” in domestic and family violence law. Australia’s National Research Organisation for Women’s Safety.
  10. Notko M, Husso M, Piippo S, Fagerlund M, Houtsonen J (2021) Intervening in domestic violence: interprofessional collaboration among social and health care professionals and the police. Journal of Interprofessional Care. [crossref]
  11. Fagerlund M (2021) Gender and police response to domestic violence. Police Practice and Research.
  12. Notko M, Husso M, Piippo S, Fagerlund M, Houtsonen J (2021) Intervening in domestic violence: interprofessional collaboration among social and health care professionals and the police. Journal of Interprofessional Care. [crossref]
  13. Saxton MD, Jaffe PG, Dawson M, Straatman AL, Olszowy L (2022) Complexities of the Police Response to Intimate Partner Violence: Police Officers’ Perspectives on the Challenges of Keeping Families Safe. Journal of Interpersonal Violence. [crossref]
  14. Kadiani A, Chaudhury S, Saldanha D, Pande N, Menon P (2020) Psychosocial profile of male perpetrators of domestic violence: A population-based study. Industrial Psychiatry Journal. [crossref]
  15. Peraica T, Kovačić Petrović Z, Barić Ž, Galić R, Kozarić-Kovačić D (2021) Gender differences among domestic violence help-seekers: socio-demographic characteristics, types and duration of violence, perpetrators, and interventions. Journal of Family Violence.
  16. Wexler DB (2020) The Stop Domestic Violence Program: Group Leader’s Manual. WW Norton & Company.
  17. Amusa LB, Bengesai AV, Khan HTA (2022) Predicting the Vulnerability of Women to Intimate Partner Violence in South Africa: Evidence from Tree-based Machine Learning Techniques. Journal of Interpersonal Violence. [crossref]
  18. Khurana B, Seltzer SE, Kohane IS, Boland GW (2019) Making the ‘invisible’ visible: transforming the detection of intimate partner violence. BMJ Quality & Safety.
  19. McDaniel JL, Pease K, eds. (2021) Predictive Policing and Artificial Intelligence. Routledge.
  20. Jahja E, Papajorgji P, Moskowitz H, et al. (2024) Measuring the perceived wellbeing of hemodialysis patients: A Mind Genomics cartography. PLoS ONE. [crossref]
  21. Moskowitz HR, Kover A, Papajorgji P (2022) Applying Mind Genomics to Social Sciences. Information Science Reference.
  22. Moskowitz HR, Wren J, Papajorgji P (2020) Mind Genomics and the Law. Lambert Academic Publishing.
  23. Papajorgji P, Moskowitz H (2022) The ‘Average Person’ thinking about radicalization: a mind genomics cartography. Journal of Police and Criminal Psychology. [crossref]

Using AI to “Educate” by Synthesizing Issues of National and International Concern: The Case of Leaked Information About Israel’s Plans

DOI: 10.31038/PSYJ.2025752

Abstract

The paper demonstrates the use of generative AI (ChatGPT 3.5) to simulate an international issue, and then analyze reactions to the simulation. The study shows the simulation of what might happen if the United States were to share secret information obtained with Israel, specifically sharing that information with a country hostile to Israel. The paper shows how to simulate the situation, identify themes, understand possible ramifications of the action, and simulate the responses of groups that would react positively or negatively to this action. Using the Mind Genomics platform, BimiLeap.com (Idea Coach feature), the paper shows, in a step-by-step manner, the opportunities emerging when simulation and automated AI-analysis become widely available to the public in an efficient, low-cost manner. The paper finishes with a speculation on the effect such a platform might have in the world of education.

Keywords

AI simulation in international relations, Democratizing predictive modeling, Generative AI for critical thinking, Mind Genomics, Perspective-based AI analysis

Introduction

Artificial intelligence (AI) is revolutionizing the way decision-makers at the highest levels of government address complex, uncomfortable, and embarrassing situations. With AI advancements, there is a growing need for an accessible, inexpensive simulation system which democratizes access to predictive modeling, making both public officials and regular citizens smarter in the process. A rapid, inexpensive AI simulation system made available to government institutions and the general public would make for a smarter society overall. Empowering people with tools to model unpleasant or embarrassing events could steer us toward more democratic, informed decision-making [1,2]. An accessible AI simulation tool would allow sensitive government positions to better anticipate and address critical consequences before making decisions. These tools could simulate the outcomes of controversial policy choices, define strategic responses to unforeseen disasters, or highlight unintended social or economic impacts. Crowdsourcing AI simulations would allow ideas and resolutions to emerge from unexpected places, making the process more democratic [3-5].

This system would be beneficial not only for government officers but also for academia, civil organizations, industries, and entrepreneurs. By making AI simulations accessible, governments can make quick decisions for time-sensitive threats and foster greater trust and transparency between governments and the public [6,7].

Opening AI simulations to the masses would increase accountability, forcing advocates of policies to rigorously justify their decisions. However, democratizing simulations comes with risks, such as manipulation of results to serve biases or agendas. Ethical guidelines and safeguards could be built into AI models to identify and neutralize malicious designs [8].

A Worked Example: Simulating a Recent Issue of a Possible “Tiff” Between the US and Israel

Artificial intelligence (AI) systems accessible through Idea Coach, the AI-linked feature of Mind Genomics through BimiLeap.com, can be used for simulation. The simulation, shown in detail in this paper, generates insights into real-world scenarios, such as the hypothetical “betrayal” by the U.S. sharing with others secret information which it had developed with Israel. AI is adept at synthesizing raw data and generating insights which mirror complex human situations, removing cognitive biases typically present when humans analyze scenarios emotionally. AI also excels at organizing complex networks of variables and ensuring cohesiveness, which is crucial when confronting intricate issues like geopolitics, national security, or international diplomacy [9-11]. AI’s ability to summarize and generate outcomes has real-world implications for organizations in sectors like government, law, business, or research. It can sort through thousands of variations, reporting back on probable consequences, best- and worst-case actions, and even unintended secondary effects from multiple perspectives. AI synthesizes ideas and combines knowledge from dispersed domains, allowing for imaginative, unexpected “mashups” of factors which human analysts might overlook [12].

Summarization also yields practical benefits in a time-efficiency context, as AI can distill raw data into workable hypotheses and summarize them in seconds, increasing productivity and allowing teams to focus on interpretation and action. AI’s summaries also have a unique advantage of quantifying uncertainty, generating confidence levels for certain aspects of scenarios while pointing out areas requiring further scrutiny or research [13]. With the foregoing as background, consider the two scenarios shown in Table 1, and the insights which emerge, even from simulated results. AI is able to put a human face on the topic and give a sense of reality to what otherwise might be an important but hard to conceptualize topic.

Table 1: The two scenarios.

Key Ideas

Artificial Intelligence (AI) has the potential to revolutionize various industries by summarizing its own thinking (see Table 2). By allowing AI to synthesize its own ideas through literature, case studies, or hypothetical scenarios, it can provide an objective and multi-angle analysis of complex human situations. This can mitigate human biases and limitations, as AI can sift through emotional pitfalls to provide an unbiased summary. AI’s ability to process vast amounts of information quickly and efficiently allows it to cross-reference various data points faster than expert human analysts. AI-generated summaries can also serve as a baseline for human analysts, providing them with preliminary insights and enabling them to explore new angles. AI summarization can factor ideas from economics, sociology, history, and political science—turning each analysis into a multi-perspective solution. In situations where speed is essential, AI summarization could streamline operations and predict potential outcomes from betrayal scenarios and larger ripple effects.

Table 2: Key ideas emerging from the synthesis of the compositions.

Uncovering Themes in the Compositions: Steps Towards AI’s Ability to Coach “Critical Thinking”

AI can significantly improve critical thinking in the digital age by enhancing traditional methods of developing this skill. Platforms like BimiLeap allow users to engage with Mind Genomics, stimulating hypothetical situations like political betrayals. AI can also help break down scenarios into fundamental themes, promoting a deeper level of mental discipline and making individuals more insightful thinkers (see Table 3). When a user creates a composition, they engage in Mind Genomics, framing the scenario and deciding what may be relevant. AI then offers feedback by identifying the core themes within the composition, acting as a mentor who not only reads but dissects and interprets the writing. AI acts as a coach by pinpointing basic concepts or “themes” in ways the person may have overlooked. This back-and-forth between narrative building and thematic deconstruction can enhance a person’s capacity for critical thinking. Repetition of this exercise sharply improves the ability to think critically and in a structured, versatile manner. The iterative, feedback-based nature of AI-coached thinking prevents complacency or overreliance on surface-level thinking. The external viewpoint offered by AI’s thematic breakdown removes the “ego” which might intrinsically accompany self-evaluation, instead giving objective and critical feedback.Regular use of this AI-guided process for a few days can develop sharper cognitive functions, particularly regarding the ability to see ideas as interconnected systems. This theme-oriented perspective can be applied to various fields, enhancing not just analytical skill but also creativity.

Table 3: Themes emerging from the compositions.

Teaching What If’s: AI showing the Same “Situational Facts” from Different Perspectives

By exploring various perspectives, AI helps simulate cause-and-effect scenarios, fostering a deeper understanding of any given issue (see Table 4). This offers potential for strategic planning and critical thinking instruction. Considering multiple perspectives is essential for strategic planning, helping decision-makers foresee possible outcomes and adjust their strategies accordingly. Students exposed to AI-generated alternative perspectives are guided to think beyond their inherent biases, fostering analytical skills crucial for critical thinking in today’s ever-changing global environment. The value of making this analysis immediately available after a study encourages quicker learning cycles, allowing students to reconsider their positions and comprehend the complexities of international relations in real time. An AI-driven, perspective-oriented curriculum would encourage students to appreciate global interdependence and the cascade of effects which result from betrayal, diplomatic tensions, or alliances. Integrating AI into education and strategic planning multiple times over a semester or as part of everyday government operations could lead to better understanding of social issues and international affairs. By the fourth or fifth iteration on a topic or topics, cognitive flexibility should be demonstrably enhanced. Institutions like the government could benefit greatly from implementing this type of perspective-based thinking in their decision-making processes.

Table 4: What If’s—Themes in the composition.

Alternative Viewpoints: Putting Oneself in the Other Person’s “Shoes”

AI-driven alternative viewpoint analysis can enhance education in decision-making by allowing users to explore different perspectives on the same issue. Platforms like BimiLeap.com, which focus on Mind Genomics, offer users the ability to simulate real-world scenarios, incorporating AI-generated alternative viewpoints. This deepens critical thinking and enhances individuals’ ability to foster multidimensional thought processes. AI-driven simulations challenge cognitive biases and assumptions, allowing individuals to engage in rationality across the spectrum and uncover both positive and negative consequences [14-16]. This method of educational analysis accelerates the learning process by situating students within real-life scenarios where nuanced thought is encouraged and demanded. The effort ends up helping to overcome rote learning habits which handicap decision-making, drawing attention to hidden complexities and understanding long-term ramifications, latent variables, and conflicting interests, doing so simply while intriguing the student with analyses of a topic of their own choosing.

The primary value of these tools in decision-making is their ability to broaden context, forcing decision-makers to view issues from a broader, less egocentric perspective. As seen in Table 5, AI can generate responses from hypothetical perspectives, such as impacted civilian populations, international governing bodies, or economic markets, helping avoid rash decision-making. This approach exposes learners to novel possibilities they might not encounter within their conventional curriculum.For professionals, AI can simulate potential repercussions of various strategies, making adaptations more agile and thoughtful. This process fosters empathy through diverse opinions, humanizing abstract political or social groups. It also accelerates cognitive development by condensing learning cycles.Nothing is “free” however. Challenges emerging include the reliability and neutrality of AI outputs, as well as the unwanted outcome of over-reliance on algorithmic interpretations. Despite these challenges, AI-built scenarios pave the way for learners and professionals to adapt more easily to global issues as they evolve.

Table 5: Seeing the topic from the viewpoint of others.

The Road to Innovation: What is Missing?

Critical thinking about “what may be missing” is a powerful tool for understanding the present and envisioning future possibilities and innovation (see Table 6). It involves actively investigating gaps in information, logic, or assumptions, challenging superficial answers and pushing deeper inquiry. Encouraging critical thinking cultivates an environment of inquiry, encouraging individuals to question, probe, and evaluate unexamined factors which could change their understanding of the issue. The real value of this approach lies in its application to real-world situations, such as potential betrayal in international relations, engineering and design flaws, and storytelling plot points. By honing the practice of identifying what is missing, individuals prime themselves to think more flexibly, remaining open to new interpretations and information under pressure. The “what is missing” mindset not only critiques the present but also lays the foundation for future advancements, which is the heart of innovation. To drive this process effectively among others, it is essential that the environment is safe for inquiry and wrong answers. Mistakes need to be seen as part of the process of critical reflection and innovation, rather than failures. The “what is missing” exercise not only improves critical thinking but also builds a tolerance for ambiguity—a vital skill in the information age.

Table 6: What is missing?

The process can be gamified to make it more engaging and visual. For example, a curiosity game can be designed where students compete to identify the most critical gap in a scenario with missing information, thereby pooling their critical thinking skills for a collective, superior result. This method trains the mind to think dynamically, recognizing complex systems and interweaving factors, both seen and unseen.

Driving Innovation: Using the Simulated Events to Identify Issues that Need Structural Solutions

In the complex world of international relations, crises often arise from betrayals, misunderstandings, and unintended consequences. However, these moments of tension offer fertile ground for creative innovation. As leaders, thinkers, and innovators, we must shift our focus from crisis management to opportunity creation, focusing on the long-term possibilities and breaking the “fight or flight” mind-set. Every crisis contains the seeds of transformation within it, and entering a creative mindset allows us to repair and forge new paths simultaneously. By shifting focus towards innovation, we can capitalize on the opportunity created by temporary breaches and create a long-term vision built on creativity and strategic foresight. To create opportunities, we must re-examine the parameters driving the conflict and see the issues outside of their immediate context. This can lead to the emergence of fresh ideas and solutions which would not have been considered under more stable circumstances. Innovation often emerges most prolifically when the established order has been disrupted, allowing for new partnerships, novel strategies, and modernization (see Table 7).

Table 7: Innovative ideas emerging from the exercise.

In diplomacy, creativity is messier, as failure can lead to sanctions, loss of lives, or deeper mistrust. This high-stakes environment requires an iterative but safe process of ideation. We need to explore more lateral ways to imagine solutions, allowing for checks, re-alignments, and pivots. Integrating diverse perspectives and narratives is crucial for reshaping the dialogue. Fostering an environment where voices are heard, such as involving diverse fields like cybersecurity experts, social strategists, and data analysts, can enable holistic thinking and turn immediate threats or betrayals into premeditated actions which fuel future cooperation (see Table 7).

Interested Audiences vs. Disinterested or Even Hostile Audiences

When a group embraces a new idea, it often signifies a positive reaction to the innovation, as it aligns with their broader objectives and aligns with their national security and diplomacy goals. This acceptance can drive collaboration and validate the innovation, acknowledging that it meets their pressing needs or concerns. In contrast, when a group sees the innovation as critical, they may view it as a solution to a long-standing challenge or a method to solidify alliances. This commitment to the idea often leads to further commitment to its implementation, such as legislative support, financial backing, and integration into national or organizational strategies. Advocacy, a powerful tool for spreading the idea, can create wider acceptance and credibility. This can force opponents to react, as the embraced idea sets the standard for the future. The enthusiasm of the group’s acceptance can provide valuable insights for applied innovation across other fields (see Table 8).

Table 8: Audiences interested in the questions.

A group’s open rejection of an idea can signal a disconnect in values, strategies, or perspectives, potentially threatening their established practices or creating risks they deem unmanageable. Rejection can also be a sign of resistance to change, as some groups prefer to stick to tried-and-true solutions rather than adopting new ideas. Rejection may also be tied to the preservation of specific interests, such as political, economic, or cultural interests. Strategic misalignment may also be a reason for rejection. However, rejection can also be an opportunity to gather critical insights about concerns and fears, allowing for adjustments or changes in the presentation strategy. Engaging with opposing groups can lead to constructive engagement, identification of commonalities, and potentially lead to resolution or compromise (see Table 9).

Table 9: Opposing audiences.

Food for Thought: Questions and Answers Generated by AI

AI has become an indispensable tool in problem-solving, idea generation, and critical thinking, particularly in personalized tutoring. It can serve as a thought partner, particularly in probing deep subjects like geopolitical issues. As demonstrated in Table 10, platforms like BimiLeap.com, for example, use AI as an autonomous knowledge giver and questioner, generating relevant questions and offering insightful answers based on defined topics. This allows users to delve deeper into geopolitical and strategic dimensions, enhancing their understanding and enabling them to think expansively. AI’s ability to ask complex questions that encourage users to delve deeper shows how AI-generated questions empower the “wisdom of the masses” in relation to key political and social issues.

Table 10: Questions and answers generated by AI.

Coda: Transforming Education

AI-driven learning and problem-solving are revolutionizing education by providing a proactive approach to guiding people through complex problems. Platforms like Mind Genomics and BimiLeap.com offer platforms which are always on, providing context-sensitive answers in real time. This is particularly beneficial for young learners who can interact with complex problems that traditional education has not prepared them.AI-driven learning is not just about using technology for rote teaching; it is about engaging the imagination, fostering empathy, cultivating autonomy, and fueling an unrelenting inquiry into the world. It places immense problem-solving capacity into the hands of students, transforming them into skilled questioners and solvers of the world’s most immediate and pressing issues.

AI-driven systems also hold immense potential for society at large, as they can turn everyday dilemmas into solvable challenges, allowing individuals to work out strategic solutions informed by cognitive theory and real-world precedent. This approach makes problem-solving more accessible and engaging for younger students, turning the learning process into a game of discovery rather than a tedious repeat of established knowledge.

This model shows what problem-solving could look like not just in the classroom but across civil society. Grade school students taught to ask smart, informed questions are better equipped to tackle larger problems in life. With the help of AI, today’s students are tomorrow’s innovators or community leaders.

Discussion and Conclusions

AI-powered teaching platforms can encourage critical thinking by posing context-aware questions which challenge users to consider multiple viewpoints and implications. These AI tutors can simulate a multi-angle approach to learning, encouraging users to examine each facet of an issue from different perspectives. Continuous feedback and refinement enhance the learning process, as AI tools can probe further and ask follow-up questions which delve into the nuances of a user’s responses. AI-powered teaching platforms can introduce considerations which may not have occurred to human users, such as cybersecurity threats, media influence, and the role of non-state actors. AI can also provide personalized depth by adjusting the difficulty and focus of its questions to meet the user’s knowledge level and areas of interest.

AI systems can provide meaningful content generated from massive datasets, summaries, and topical analysis almost instantly. This scalability ensures that users always have access to the information they need when they need it. The future of AI-led thought leadership looks promising, as the partnership between humans and AI for complex learning and ideation could usher in new intellectual paradigms. AI tutors ensure that problems are approached from unique, data-driven angles, blending creativity, logic, and historical understanding into a comprehensive matrix of solutions.

Acknowledgment

The authors wish to acknowledge the extensive use of the Idea Coach, the AI-feature of the Mind Genomics platform—BimiLeap.com—as a co-developer of these ideas.

References

  1. Floridi L, Cowls J, Beltrametti M, Chatila R, Chazerand P, et al. (2018) AI4People—an ethical framework for a good AI society: opportunities, risks, principles, and recommendations. Minds and machines. 28: 689-707. [crossref]
  2. Moon MJ (2023) Searching for inclusive artificial intelligence for social good: Participatory governance and policy recommendations for making AI more inclusive and benign for society. Public Administration Review. 83: 1496-505.
  3. Rodriguez P, Costa I (2024) Artificial Intelligence and Machine Learning for Predictive Threat Intelligence in Government Networks. Advances in Computer Sciences 7: 1-0.
  4. Van Noordt C, Misuraca G (2022) Artificial intelligence for the public sector: results of landscaping the use of AI in government across the European Union. Government information quarterly. 39: 101714.
  5. Yigitcanlar T, Corchado JM, Mehmood R, Li RY, Mossberger K, et al. (2021) Responsible urban innovation with local government artificial intelligence (AI): A conceptual framework and research agenda. Journal of Open Innovation: Technology, Market, and Complexity. 7: 71.
  6. Chiariello AM (2022) AI and Public Services: a challenging relationship between benefits, risks and compliance with unavoidable principles. European Review of Digital Administration & Law. 2: 185-203.
  7. Fulton R, Fulton D, Hayes N, Kaplan S (2024) The Transformation Risk-Benefit Model of Artificial Intelligence: Balancing Risks and Benefits Through Practical Solutions and Use Cases.
  8. Stahl BC (2021) Artificial intelligence for a better future: an ecosystem perspective on the ethics of AI and emerging digital technologies. Springer Nature.
  9. Bareis J, Katzenbach C (2021) Talking AI into Being: The Narratives and Imaginaries of National AI Strategies and Their Performative Politics. Science Technology & Human Values 47: 855-81.
  10. Feijóo C, Kwon Y, Bauer JM, Bohlin E, Howell B, et al. (2020) Harnessing artificial intelligence (AI) to increase wellbeing for all: The case for a new technology diplomacy. Telecommunications Policy 44: 101988. [crossref]
  11. McQuillan D (2022) Resisting AI: An anti-fascist approach to artificial intelligence. Policy Press; 2022
  12. Daly A, Hagendorff T, Hui L, Mann M, Marda V, et al. (2019) Artificial intelligence governance and ethics: global perspectives. arXiv preprint arXiv: 1907 .03848.
  13. Palomares I, Martínez-Cámara E, Montes R, García-Moral P, Chiachio M, et al. (2021) A panoramic view and swot analysis of artificial intelligence for achieving the sustainable development goals by 2030: progress and prospects.
  14. Chamorro-Premuzic TI (2023) human: AI, automation, and the quest to reclaim what makes us unique. Harvard Business Press.
  15. Esmaeilzadeh H, Vaezi R (2022) Conscious empathic AI in service. Journal of Service Research. 25: 549-64.
  16. Lara F, Rueda J (2021) Virtual reality not for “Being someone” but for “Being in someone else’s shoes”: avoiding misconceptions in empathy enhancement. Frontiers in Psychology. 24: 12: 741516. [crossref]