Author Archives: author

Public Participation in the Malaysian Environmental Impact Assessment

DOI: 10.31038/ESCC.2019112

Abstract

The environmental impact assessment in Malaysia can generally be categorized as preliminary and detailed. Public participation in preliminary EIA is confined to the review of environmental impact statements by technical committees. Public participation in detailed EIA is more extensive involving inputs of ad-hoc panel members during scoping, public display and comments of EIS as well as review of the EIS by the panel members. Consultation with affected communities is conducted by consultants during EIS preparation though the process is not spelled in the legislation. At only the initial level of involvement in the spectrum of public participation, there is still much room for improvement in engaging the public in the Malaysia EIA. Public participation in the Malaysian EIA could be extended beyond the EIS review stage by engaging the public in scoping and assessment and even during development of policies and plans. Public participation in Malaysia requires further facilitation to improve accessibility to the necessary information for effective provision of comments.

Keywords

Public participation, consultation, EIA, EIS, Environment, Malaysia

Introduction

Environmental impact assessment (EIA) is a process to systematically identify, predict, evaluate and mitigate impacts of development proposals to facilitate decision-making by relevant authorities on the worthiness of the proposals. The impacts evaluated consist mainly of the biological, physical and social aspects [1]. The EIA has its origin in the United States (US) with the enactment of the National Environment Policy Act (NEPA) in 1970. The act was developed in response to mounting public awareness for environmental protection stemming from increasing pollution across the US due to industrialization and urbanization [2]. The Santa Barbara oil spill in 1969 and construction of the Interstate Highway System resulting in extensive losses of ecosystems both pushed for the subsequent passing of NEPA [3]. Since then, other countries began to model their environmental laws after NEPA and to date, there are more than 100 countries in the list [4].

Only 4 years later, the Environmental Quality Act 1974 was enacted in Malaysia requiring development proposals with significant environmental impacts to have EIA conducted under Section 34A [5]. However, it was until 1987 that the Environmental Quality (Prescribed Activities) (Environmental Impact Assessment) Order was made and the order came into effect on the 1st April 1988. While prescribed activities had not been well defined under Section 34A of the Environmental Quality Act 1974, thus limiting the ability of the Act to dictate EIA for certain proposals, it became clear in 1988 that the prescribed activities listed in the Order would be subject to EIA [6]. The order was replaced by the Environmental Quality (Prescribed Activities) (Environmental Impact Assessment) Order 2015 [7]. The major difference of the two Orders, other than a revision of the prescribed activities, is that the 2015 version specifies the prescribed activities whose environmental impact statements (EIS) require public display and comments. Both the Orders do not illustrate the EIA process and the process is not easily accessible on the official portal of the Malaysian Department of Environment [6, 7].

EIA Process in Malaysia and Public Participation

There are two types of EIA, namely the preliminary and detailed EIAs. The types of EIA have not been stated in the Orders but have been mentioned in the guide for investors published by DOE [6-8]. Prescribed activities listed in the First Schedule of the Environmental Quality (Prescribed Activities) (Environmental Impact Assessment) Order 2015 do require to have the EIS public displayed and commented, and are generally subject to the preliminary EIA. However, those listed in the Second Schedule of the Order prompting public display and comments of the EIS are put through the detailed process [7, 8]. Prescribed activities in the Second Schedule are deemed to have larger impacts than those in the First Schedule due to comparatively larger scale of the activities. Both the preliminary and detailed EIAs undergo the typical EIA stages of screening, scoping, EIS preparation and review, decision-making and follow-up but the stages differ in levels of details and activities [9]. A comparison of both the processes is shown in Table 1.

Table 1. Comparison of Preliminary and Detailed EIAs in Malaysia.

EIA Stage

Preliminary EIA

Detailed EIA

Screening

Prescribed activities in the First Schedule of the EIA Order 2015

Prescribed activities in the Second Schedule of the EIA Order 2015

Scoping

Terms of Reference (TOR) is submitted to the state DOE office.

The scope of EIS is confirmed through issuance of a formal letter by the office.

TOR is submitted to the national DOE headquarters.

DOE calls for ad-hoc panel meeting for the TOR at the headquarters. The ad-hoc panel comprises government officers, academics of universities and representatives of non-governmental organizations (NGOs).

If additional scope is required, the TOR is then revised and resubmitted.

EIS Preparation

Preparation of preliminary EIS based on the scope stated in the letter issued by the state DOE.

No public display and comment of EIS is required.

Preparation of detailed EIS based on the scope in the final TOR submitted.

Copies of EIS are displayed at locations specified by the DOE, including the state DOE offices, the headquarters, universities and public libraries for public comments.

EIS review

EIS is distributed to technical committee members for review.

The technical committee usually comprises government officers.

Technical committee meeting is held at the state DOE office for evaluation of whether the EIS meets the legal requirement and addresses all relevant impacts satisfactorily.

EIS is distributed to ad-hoc panel members for review.

Ad-hoc panel meeting is held at the DOE headquarters for evaluation of whether the EIS meets the legal requirement and addresses all relevant impacts satisfactorily.

Decision-making

The state DOE director approves or rejects the EIS or requires provision of additional information before approval.

If approval is granted, it comes with a set of approval conditions.

The Director General of DOE approves or rejects the EIS or requires provision of additional information before approval.

If approval is granted, it comes with a set of approval conditions.

Follow-up

Post-EIA monitoring which involves submission of quarterly environmental monitoring reports to the DOE.

Post-EIA monitoring which involves submission of quarterly environmental monitoring reports to the DOE.

From Table 1, it appears that only detailed EIA involves public participation. To understand the extent of public participation in Malaysia, a further probe of the definition of public participation and the definition of public is necessary. The IAIA defines public participation as ‘involvement of individuals and groups that are positively or negatively affected by, or that are interested in, a proposed project, program, plan or policy that is subject to decision-making process” [10]. The undertakings of public participation implies the democratic approach of a country [11]. For instance, a deliberative approach provides limited means for the undertaking of public participation in comparison to the collaborative approach which upholds inclusiveness, openness and consideration of multiple perspectives for effective planning and decision-making [12]. Lawrence perceived EIA as a form of social learning in the quest for sustainable development during which all stakeholders have the opportunity to enhance their knowledge [13].

Participation is fundamentally different from consultation in the sense that participation involves active engagement in decision-making while consultation is confined to the request of information and inputs from intended parties [14].Putting participation on a scale, consultation can be visualized as a lower level of participation providing minimum opportunity for the public to be involved in decision-making [15]. The International Association for Public Participation (IAP2) divides public participation into 5 levels starting with informing at the bottom which revolves around provision of unbiased information to the public so that they can understand the issues at hand. Consultation is at the next level up. Involvement sits higher that consultation and focuses on engagement with the public to ensure public needs and concerns are continuously gathered and considered. Next on the spectrum is collaboration which forges a partnership with the public in identification of alternatives and solutions. The highest level is empowerment which grants the decision-making power to the public [15]. The EPA’s spectrum of public involvement aligns with that of IAP2 in Figure 1.

ESCC 2019-102 - Daniel Tang Kuok Ho Malaysia_F1

Figure 1. Spectrum of Public Involvement [16].

The Level of Public Participation in the Malaysian EIA

Referring again to Table 1, elements of public participation can now be identified in both the preliminary and detailed EIA processes. In preliminary EIA, it is confined to the review stage involving stakeholders in the technical committee who comprise largely of government officers. In detailed EIA, public participation is garnered via public display and comments of the EIS at designated locations as well as the review of the TOR and the EIS by ad-hoc panel members consisting of government officers, academics of universities and representatives of NGOs.

There is minimal involvement of other members of the public particularly those affected by the proposals in preliminary EIA as reflected by the process in Table 1. In practice, consultants appointed to prepare the EIS may conduct social survey to gather opinions of the communities around the project area but such practice widely varies as it is not required in preliminary EIA, hence a lack of model to be adopted [8, 17]. For detailed EIA, there is a higher extent of public participation starting from the review and comments of the TOR by the ad-hoc panel members to the review of the EIS by the members. Public participation has also been extended to the public display of EIS at designated locations for comments and announcement of the display via DOE’s website and newspapers. This is akin to the level of involvement of the public participation spectrum proposed by IAP2 and the level of recommendation in the EPA’s spectrum. Public display of EIS invites comments not only from those affected by the proposal but other members of the public whom are concerned about the proposal [17].

At this point, it becomes clear that public participation in Malaysia is often confined to particular stages of EIA for instance, the EIS preparation and review stages of preliminary EIA if social survey is conducted during impact assessment. Based on Wood’s model of EIA [9], public participation should permeate every stage of EIA starting from consideration of alternatives to monitoring action impacts. Nonetheless, different countries may incorporate public participation to varying extents at different stages of the EIA. Taking the Western Australia for example, public comments are invited during screening on the need for assessment and the level of assessment of a proposal. This extends to the scoping stage with publication of the Environmental Scoping Document, equivalent to the TOR in Malaysia on the website of the environmental authority for public comments. The EIS is also published for comments and the final decision on EIS approval can be appealed [18]. In New Zealand, while there is no public scoping, public participation is facilitated via public hearing and review of EIS. For public hearing to be held, it must either be requested by members of the public who have provided comment on a proposal or come under the decision of the ministry or environmental agency. Nonetheless, public participation in New Zealand is not confined to EIA [19]. The Resource Management Act 1991promotes public participation via open standing at the stage of national policies and plans establishment and application by members of the public to Environmental Court for enforcement order in pursuit of sustainable management. At regional level, consultation with Tangata Whenua i.e. the local Maori people is conducted for development of regional and district plans [20].

In Malaysia, based on the author’s experience in environmental consultation, public meetings are conducted for detailed EIA involving the communities at the vicinity of the proposed development sites and such meetings are usually conducted once or twice to gather their inputs and perceptions of the proposals. Certain concerns are addressed by the proponents during the meetings but follow-up of the inputs, comments and perceptions via a feedback mechanism is lacking. Such approach is at best a form of consultation. The affected communities have very little influence over the alternatives of the proposal unlike in the Western Australia where public comments are invited from the screening stage of EIA and in New Zealand, where public participation comes even earlier at the strategic assessment stage [20, 21]. The public display and comments of EIS at designated locations can be perceived as involvement or recommendation level engaging the general public and not just the affected communities in providing concerns. The practice, however, is not well-facilitated. The availability of EIS at specific locations limits the accessibility of the public to the information necessary to provide their comments.  The public can also purchase the EIS from the appointed EIA consultant at a cost which is often quite prohibitive [22]. This forms a stark difference to Western Australia where information related to the EIA ranging from scoping documents, EIS to assessment of the authority and final approval are posted on the website of the environmental authority [21]. In New Zealand, the EIS are also readily available online for public comments and only commercially confidential information is withheld [23]. A search on the World Wide Web reveals very few complete EIS of proposals in Malaysia and in most instances, only the executive summaries are made available.

The EIA process may differ in states in Malaysia having their own environmental legislation and it appears that public participation could elude the state’s EIA legislation [24]. Other than engagement of government officers and NGOs in the review of EIS, public participation could be missing from the EIA process and the access of EIS could be made tedious, thus further hampering public engagement in EIA.

Conclusion

Public participation has been incorporated into the EIA processes in Malaysia but it is still far from maturity. The most common form of public participation is consultation involving representatives of government departments and NGOs in the review of EIS. For detailed EIA, the extent of public participation is increased with public display of EIS for comments and the review of TOR by ad-hoc panel members as well as their inputs during scoping meeting. However, general members of the public have not been actively engaged in the EIA processes. It can be argued that the knowledge level of the Malaysian public members in providing constructive comments is still relatively low [17]. However, in a democratic system, it is the right of the public to have access to the necessary information to provide their thoughts and feedback, and such right should be respected in decision-making. Besides, public participation in EIA should be viewed as a form of social learning through which higher level of public knowledge in this respect can be achieved. It is therefore recommended that public participation in Malaysia should be extended beyond the EIS review stage and should be facilitated by making necessary information available on an official online portal.

References

  1. MacKinnon AJ, Duinker PN, Walker TR (2018) The Application of Science in Environmental Impact Assessment. United Kingdom: Routledge 2018.
  2. Rychlak RJ, Case DW (2010) Environmental Law: Oceana›s Legal Almanac Series. New York: Oxford University Press 2010: 111–120.
  3. Mohl RA (2007) Stop the road: Freeway revolts in American cities. J Urban Hist 2007 July 01.
  4. Eccleston CH (2008) NEPA and Environmental Planning: Tools, Techniques, and Approaches for Practitioners. Fluoride. US: CRC Press 2008.
  5. https://www.doe.gov.my/portalv1/wp-content/uploads/2015/01/Environmental_Quality_Act_1974_-_ACT_127.pdf
  6. http://www.doe.gov.my/eia/wp-content/uploads/2012/03/Environmental-Quality-Prescribed-Activities.pdf
  7. https://www.doe.gov.my/portalv1/wp-content/uploads/2015/01/Perintah-Kualiti-Alam-Sekeliling-Aktiviti-Yang-Ditetapkan-Eia-2015.pdf
  8. Environmental requirements: A guide for investor. Putrajaya, Malaysia: Department of Environment 2010.
  9. Wood C (2003) Environmental Impact Assessment: A Comparative Review 2nd ed. Harlow, UK: Prentice Hall 2003.
  10. Andre P, Enserink B, Connor D, Croal P (2006) Public Participation International Best Practice Principles. Special Publication Series No. 4. USA: International Association for Impact Assessment 2006.
  11. Carpenter J, Brownill S (2008) Approaches to democratic involvement: widening community engagement in the English Planning System. Planning Theory & Practice 2008.
  12. Tewdwr-Jones M,  Allmendinger P (2002) Conclusion: communicative planning, collaborative planning and the post-positivist planning theory landscape. In P Allmendinger & M Tewdwr-Jones (eds). Planning Futures: New Directions for Planning Theory. Oxon: Routledge 2002: 206-216.
  13. Lawrence DP (2003) Environmental Impact Assessment Practical Solutions to Recurrent Problems. New Jersey: John Wiley & Sons 2003.
  14. Petts J (1999) Public participation and environmental impact assessment. In J Petts (ed). Handbook of Environmental Impact Assessment. V.1, Environmental Impact Assessment: Process, Methods and Potential Oxford, UK: Blackwell Science. 1999: 145-177.
  15. https://cdn.ymaws.com/www.iap2.org/resource/resmgr/foundations_course/IAP2_P2_Spectrum_FINAL.pdf
  16. https://www.epa.gov/sites/production/files/2015-09/documents/spectrum508.pdf
  17. Marzuki A (2009) A review on public participation in environment impact assessment in Malaysia. Theoretical and Empirical Researches in Urban Management. 2009.
  18. http://www.epa.wa.gov.au/step-step-through-proposal-assessment-process
  19. ELAW. New Zealand. 2017. Available: https://www.elaw.org/eialaw/new-zealand
  20. Ministry for the Environment. An everyday guide to the RMA – Applying for a resource consent. Wellington. New Zealand: Ministry for the Environment 2015.
  21. EPA. EPA assessment reports. 2017. Available: http://www.epa.wa.gov.au/epa-assessment-reports
  22. https://www.thestar.com.my/news/nation/2017/12/26/myhsrs-eia-report-ready-for-public-viewing/
  23. https://www.epa.govt.nz/public-consultations/
  24. NREB (2019) The Natural Resources and Environment Ordinance (Prescribed Activities) Order 1994. 2019.

Comparative Treatment between Sitagliptin vs. Metformin, Alone or In Combination, In Patients with Polycystic Ovarian Syndrome. A Clinical Entity with a High Risk of Developing Diabetes Mellitus and Gestational Diabetes

DOI: 10.31038/EDMJ.2019341

Summary

Objective: To determine the efficacy of sitagliptin alone or in combination with metformin in women with polycystic ovary in terms of ovarian cyclicity, fertility and cardio metabolic profile compared to metformin alone.

Rationale: Polycystic Ovarian Syndrome (PCOS) affects a percentage of 5–10% of women of reproductive age worldwide and has a prevalence of 6.6% (95% CI 2.3 to 10.9%). Mexican women and the most common cause of infertility in developed countries.

It has been observed that treatment with insulin-sensitizing drugs (metformin and pioglitazone) improve menstrual cyclicity and fertility in the metabolic profile with polycystic ovary patients. Incretins and DPP-4 inhibitors have been shown to improve the activity of pancreatic β cell would increase weight loss by its anorectic effect and the existence of adequate weight control and improvement of fertility.

The previous tests have compared the effect of exenatide and alone or in combination with metformin in the treatment of PCOS, in this article we are going to compare sitagliptin and metformin alone or in combination.

Study design: Blind, controlled and randomized clinical trial.

Patients: Women between 18 – 40 years of age, with a BMI> 20 and with diagnosis of PCOS with the Rotterdam criteria.

Results: In the normalized menstruation index it was found that there was a statistically significant intragroup increase in each of the treatments. The sitagliptin had a higher percentage of change with 127%, followed by that of metformin with 87.5% and then the COMBO with 60%. No statistically significant differences were found between treatment groups.

Conclusion: The therapeutic effect of Sitagliptin was observed in patients with PCOS comparable to metformin and the combination of metformin-sitagliptin is more effective in terms of ovulation than the other two treatments alone

Keywords

Polycystic Ovarian Syndrome, Diabetes Mellitus, Prediabetes, Insulin Resistance

Background

Polycystic Ovarian Syndrome is a syndrome of ovarian dysfunction whose main characteristics are hyperandrogenism, hyperandrogenemia and the presence of polycystic ovaries. This syndrome affects a percentage of between 5 to 10% of women of reproductive age [1]; however, in Mexican-American women a prevalence of 12.8% has been reported. In 2010, Moran et al. They conducted a prospective cross-sectional study in 150 Mexican women to determine the prevalence of PCOS in this population. By Rotterdam criteria, a prevalence of 6.6% was found (95% CI: 2.3–10.9%) [2–4].

Its etiology remains unknown and is the most common cause of infertility in developed countries [1]. Polycystic Ovarian Syndrome is associated with important metabolic alterations. The prevalence of Diabetes Mellitus 2 is 10 times higher in women with PCOS than among women without this entity. An alteration in glucose tolerance or the development of Diabetes Mellitus 2 is found in 30 to 50% of women over 30 years of age obese with PCOS, so screening for glucose intolerance has been recommended in women with PCOS [3]. The prevalence of metabolic syndrome is 2 to 3 times higher among women with PCOS than among women without this entity and 20% of women with PCOS less than 20 years of age have metabolic syndrome [1]. There is also a significant risk among patients with PCOS of developing Gestational Diabetes [5].

A significant number of patients with PCOS are overweight and many are obese; however, obesity is not considered as a cause for the development of this syndrome [6].

Regarding Pathophysiology in studies, it is suggested that teak cells in women with Polycystic Ovarian Syndrome are more efficient in the conversion of androgenic precursors to testosterone than teak cells in normal women. The concentration of LH has a relative increase over FSH and the ovaries preferentially synthesize androgens. An increase in the frequency of the pulses of the Gonadotropin Releasing Hormone (GnRH) was observed. The increase in the frequency of GnRH pulses favors transcription of the Beta subunit of LH over the Beta subunit of FSH [5].

The role of insulin in the pathophysiology of PCOS is very important because it acts in synergy with LH to increase the synthesis of androgens in the cells of teak and the ovaries of women with PCOS seem to have greater sensitivity to the effect of insulin, perhaps hypersensitivity to it, even when the classic white organs of insulin, such as muscle and fat, show resistance to its action [6–8].

Insulin prevents ovulation both by direct affection of follicular development and by the indirect increase of intra-ovarian androgen levels or alteration of gonadotropin secretion. A decrease in circulating insulin levels results in an increase in the frequency of ovulation or menstruation, reduction of testosterone concentrations or both [1].

Metformin is the most widely used biguanide for the treatment of type 2 diabetes mellitus worldwide. Its most important action is the inhibition of hepatic glucose production but also increases the sensitivity of peripheral tissues to insulin. Increased insulin sensitivity, which contributes to the efficacy of metformin in the treatment of diabetes, has also been found in non-diabetic women with polycystic ovarian syndrome [1].

In women with PCOS, long-term treatment with metformin can increase ovulation, improve menstrual cyclicity and reduce androgen levels; the use of metformin can even improve hirsutism. However, it has not shown any risk modification to develop DM2 [1,9].

The results of a randomized clinical study reported in 1998, that pretreatment with metformin, compared with placebo, increased the incidence of ovulation after a subsequent treatment with clomiphene. The meta-analysis of Lord and cols in 2002 included data from 13 trials and 543 women with PCOS and concluded that metformin is effective and increases the frequency of ovulation (odds ratio, 3.88, 95% confidence interval, 2.25 to 6.69) [9,10].

The signals derived from the intestine and stimulated by the intake of oral nutrients have an important role in the release of insulin. Studies suggest that glucagon-like peptide (GLP-1) and Glucose-Dependent Insulinotropic Polypeptide (GIP) represent the dominant peptides in most intestinal insulin-stimulating hormones. GIP and GLP-1 are members of the glucagon peptide superfamily and share amino acids [11].

Incretins increase insulin secretion in a glucose-dependent manner by activation of other specific β-cell receptors [11]. An intracerebroventricular injection of GLP-1, or GLP-1 receptor agonists, produces a reduction in food intake that is associated with weight loss in some but not in all studies [11].

There are other actions of GLP-1 on the β cell independent of the acute stimulation of insulin secretion. GLP-1R agonists (GLP-1 receptor) also promote insulin biosynthesis, proliferation of β-cells and stimulate exocrine or precursor cells towards greater differentiation to the β cell phenotype. The increase in the volume of the β cell dependent on GLP-1 receptors has been demonstrated in several experiments in animals. The expansion of the β cell after the administration of GLP-1R receptor agonists prevents or delays the incidence of Diabetes Mellitus in mice [12].

GLP-1 also activates anti-apoptotic pathways, leading to a reduction in β cell death. Studies in mice have shown a reduction in the activation of caspase 3. The antiapoptotic action of GLP-1R agonists is probably directed to the reduction of peroxide-induced apoptosis of Min6 cells [12].

Giovani Paacini et al. They carried out a study whose objective was the characterization of the secretion of GIP and GLP-1 after a load of 75 g of glucose in women with PCOS without glucose intolerance compared with healthy women. The concentrations of GLP1 were the same in the women with PCOS with respect to the control women in the initial phase of the tolerance curve until 60 minutes and were significantly lower in women with PCOS at 180 minutes of the curve [11].

In a study conducted by Pontikis et al. In 20 women with PCOS who underwent a glucose tolerance curve and isoglycemic test after a night of fasting in a two-week interval, they measured levels of insulin, glucose, C-peptide, GIP and GLP-1. Obese women with PCOS were found to have low levels of GIP concentrations in response to the glucose tolerance curve compared to the control group. Age, sensitivity to insulin (QUICKI), SHBG, and basal GIP did not differ between the control group and patients with PCOS. However, baseline GLP-1 was significantly lower in obese women with PCOS compared to both control groups (p 0.023) and in thin women (p <0.02). The group with PCOS showed a decrease in GIP levels after the glucose load compared to the control group [13,14].

A novel drug, exenatide, is an incretin mimetic that simulates the glucorregulatory properties of GLP-1 [12].
Exenatide therapy often results in a loss of weight which can result in a decrease in insulin resistance. The optimal treatment of PCOS should not only improve anovulation but should also reduce comorbidities such as obesity, insulin resistance and DM2, which are linked to this syndrome [11].

Exenatide, which is an analogue of incretin glp-1, apparently has beneficial effects on the β cell mass when given in pharmacological doses to rodents. The effect of DPP4 inhibitors on the mass of the β cell is less clear. In mice in which diabetes was induced and treated with sitagliptin, it was observed that this drug preserved the β cells of apoptosis but there was no increase in the β cell mass [6].

A study conducted by Elkind-Hirsch K. et al. In patients with Polycystic Ovarian Syndrome, overweight and with insulin resistance evaluated the treatment with exenatide and metformin in terms of menstrual cyclicity, hormonal parameters, metabolic profile and inflammatory markers. We included 60 overweight women (BMI> 27) and oligo-ovulation with PCOS, between 18 and 40 years of age [15].

The results of the study showed a statistically significant increase in menstrual frequency in all treatment groups (p 0,001). More regular menses were reported with combination therapy compared with single-drug therapy (p 0.018). Compared with the baseline, ovulation periods improved in all groups, with a significantly higher proportion with the combined therapy (p 0.01) [15].

The weight decreased significantly from the first to the last visit in all groups (p 0.001). The reduction in body weight was associated with an increase in menstrual frequency significantly (p <.006) [15].

HOMA-IR decreased significantly with all treatments (p 0.043). Similarly, insulin sensitivity, determined by IS OGTT, improved significantly with treatment (p <0.002). The improvement in sensitivity was significantly higher with combination therapy than with treatment with exenatide alone (p <0.02) but not compared with metformin (p <0.085) [16].

The most frequent adverse effects were gastrointestinal to medium to moderate, nausea was the most frequent adverse effect and was greater during combination therapy [15].

Sitagliptin is a molecule that belongs to the family of selective inhibitors of the enzyme Dipeptidyl Peptidase 4 (DDP-4) that normally degrades the endogenous incretins GIP and GLP-1 [16].

In humans, it has been observed that a daily dose of sitagliptin for 10 days resulted in a nearly double increase in GLP-1 after meals.

A study conducted by Kazutaka Aoki et al. It evaluated the effect of miglitol, sitagliptin and its combination on plasma concentrations of glucose, insulin and incretins in non-diabetic men. The results showed that insulin sensitivity among the group taking sitagliptin significantly improved, endogenous GIP and GLp1 concentrations increased and a statistically significant increase in pancreatic insulin secretion was observed [16].

A systematic review and meta-analysis of drugs belonging to DDP-4 showed that there is no risk of gastrointestinal adverse effects but there was an increased risk of urinary tract infections, headache and especially nasopharyngitis [16].

It has been observed that treatment with insulin-sensitizing drugs (metformin and pioglitazone) improves menstrual cyclicity, fertility and the metabolic profile in patients with polycystic ovary [17]. However, they have no effect on the activity of the beta cell and therefore on the progression to DM2 or Gestational Diabetes [18,19]. Incretins and DPP-4 inhibitors have been shown to improve the activity of the pancreatic β-cell, inhibit apoptosis, in addition to promoting weight loss due to its anorexigenic effect, thus providing an adequate control of weight and an improvement in fertility [17]. In addition, there was a deficit in the secretion and concentrations of GIP and GLP-1 in women with PCOS [13,14]. In a previous pilot study conducted by Paredes Palma JC et al. The statistically significant effect of sitagliptin on ovarian cyclicity was observed, increasing the normalized rate of menstruation by 60% and observing ovulation in terms of comparable progesterone secretion in women who were treated with Metformin [20]. This study carried out an extended study with a larger number of patients with PCOS to compare the use of Sitagliptin Vs Metformin Vs Metformin + Sitagliptin in patients with PCOS with a greater number of patients.

Hypothesis

Treatment with sitagliptin alone or in combination with metformin in women with polycystic ovary syndrome will be more efficient in terms of ovarian cyclicity, fertility and cardiometabolic profile compared to metformin alone.

Study Design

Blinding controlled and randomized clinical trial.

Objectives

  • Evaluate the change in menstrual frequency with the use of sitagliptin and metformin, alone and in combination, in obese and nonobese women with polycystic ovarian syndrome and assess the effect on the hormonal, metabolic and inflammatory profile.

Primary Objective

  • To evaluate the changes in the menstrual pattern of patients with thin and obese SOP with the use of sitagliptin and metformin, alone and in combination.

Secondary Objectives

  • Evaluate changes in anthropometry (absolute weight, BMI, waist circumference, hip waist index).
  • Evaluate changes in insulin sensitivity and secretion.
  • Evaluate changes in the concentration of reproductive hormones (FSH, LH, PRL, testosterone, androstenedione, DHEA, DHEAS, 17 OHP4, TSH).
  • Evaluate changes in ovulation rhythm (progesterone in luteal phase).
  • Evaluate changes in the lipid profile (total cholesterol, HDL, LDL, VLDL, LDL, non-HDL cholesterol, triglycerides).
  • Evaluate changes in inflammatory markers (C-reactive protein, VSG and adiponectin, IL6, SHBG).

Inclusion Criteria

  • Age between18–40 years
  • BMI> 20
  • SOP diagnosis by Rotterdam criteria

Exclusion Criteria

  • Women diagnosed with diabetes mellitus.
  • Smokers
  • Hormonal use in the 6 months prior to entering the study.
  • Drugs that affect intestinal motility.
  • Consumption of lipid-lowering drugs.
  • Drugs that reduce weight in the last 3 months.
  • Metformin intake in the last 6 months.
  • No history of assisted fertilization treatment in the previous 6 months.

Elimination Criteria

Informed consent letter is not signed.

  • There is no attachment to treatment.
  • Do not attend scheduled appointments of pancreatic insulin secretion [16].

Description of the Experimental Maneuver

The participating patients were summoned every Friday from 8 am to 2 pm. The reason for the study, its advantages and disadvantages, was amply explained and the signing of an informed consent was submitted for consideration. To the patients who accepted to enter, clinical evaluation was applied (determination of menstrual pattern and application of the Ferriman Gallwey scale to determine the degree of hyperandrogenism), transvaginal USG and hormonal quantification were requested (LH, FSH, testosterone, androstenedione, dehydroepiandrosterone, prolactin, cortisol, ACTH, TSH, T4, T3) in order to identify patients who meet the Rotterdam criteria and exclude other diseases with a clinical picture similar to PCOS. Patients who were identified with PCOS were cited in the follicular phase of the menstrual cycle (from the 1st to the 5th day of menstruation), special mention are those patients who undergo amenorrhea who were cited from the 1st to the 5th day of bleeding after the application of 5 mg daily of medroxyprogesterone, at this time randomization was done to assign them to one of three groups:

  • Group 1, Metformin with an initial dose of 425 mg VO before breakfast and before dinner until reaching a dose of 850 mg. every 12 hours.
  • Group 2, Sitagliptin 100 mg vo. every 24 hours.
  • Group 3, Sitagliptin plus Metformin in the doses described above.

Before the administration of the first dose, they were programmed for a glucose tolerance curve of 5 hours with 75 g. of glucose. In the first sample, 20 ml were obtained to quantify: lipid profile (total cholesterol, HDL, LDL, VLDL, LDL, non-HDL cholesterol triglycerides) and inflammation markers (C reactive protein, VSG and adiponectin, IL6, SHBG) taking counts the following times 0, 30, 60, 120, 180, 240 and 300 minutes. At each time 3 ml were taken to quantify glucose and insulin.

The same was done 24 weeks after the completion of the treatment according to the assigned group with only 24 hrs of suspension of the assigned medication. An individual with a normal menstrual pattern was considered if she presented 5 menses in 24 weeks of intervention with medications (Menstruation Normalization Index, INM) (FIGURE 1).

Statistical Analysis

It was performed for quantitative variables, average and standard deviation. For proportional variables, proportions were calculated. The quantitative variables were compared with a paired student’s T. For qualitative variables, chi square test was performed. A p less than 0.05 will be considered as statistical significance.

Results

Thirty patients who were diagnosed with PCOS according to the Rotterdam criteria were included in this study, other causes of hyperandrogenism were ruled out. The patients presented clinical or biochemical signs of hyperandrogenism and 28 (93.3%) had ultrasound images compatible with polycystic ovaries. The age range was between 18 and 37 years old. Ten and nine patients (63.3%) presented menstrual alterations, 8 patients (26.6) presented opsomenorrhea and 11 (36.6%) amenorrhea. Regarding weight, 7 patients (2.3%) presented obesity grade I, 2 patients (0.6%) obesity grade II, 5 (1.6%) patients presented obesity grade III. Considering that in a time of 6 months it is normal to present 5 menstrual cycles, an index was created to normalize the number of menses per group according to their frequency. (Table 1).

TABLE 1. CLINICAL CHARACTERISTICS BY TREATMENT GROUP.
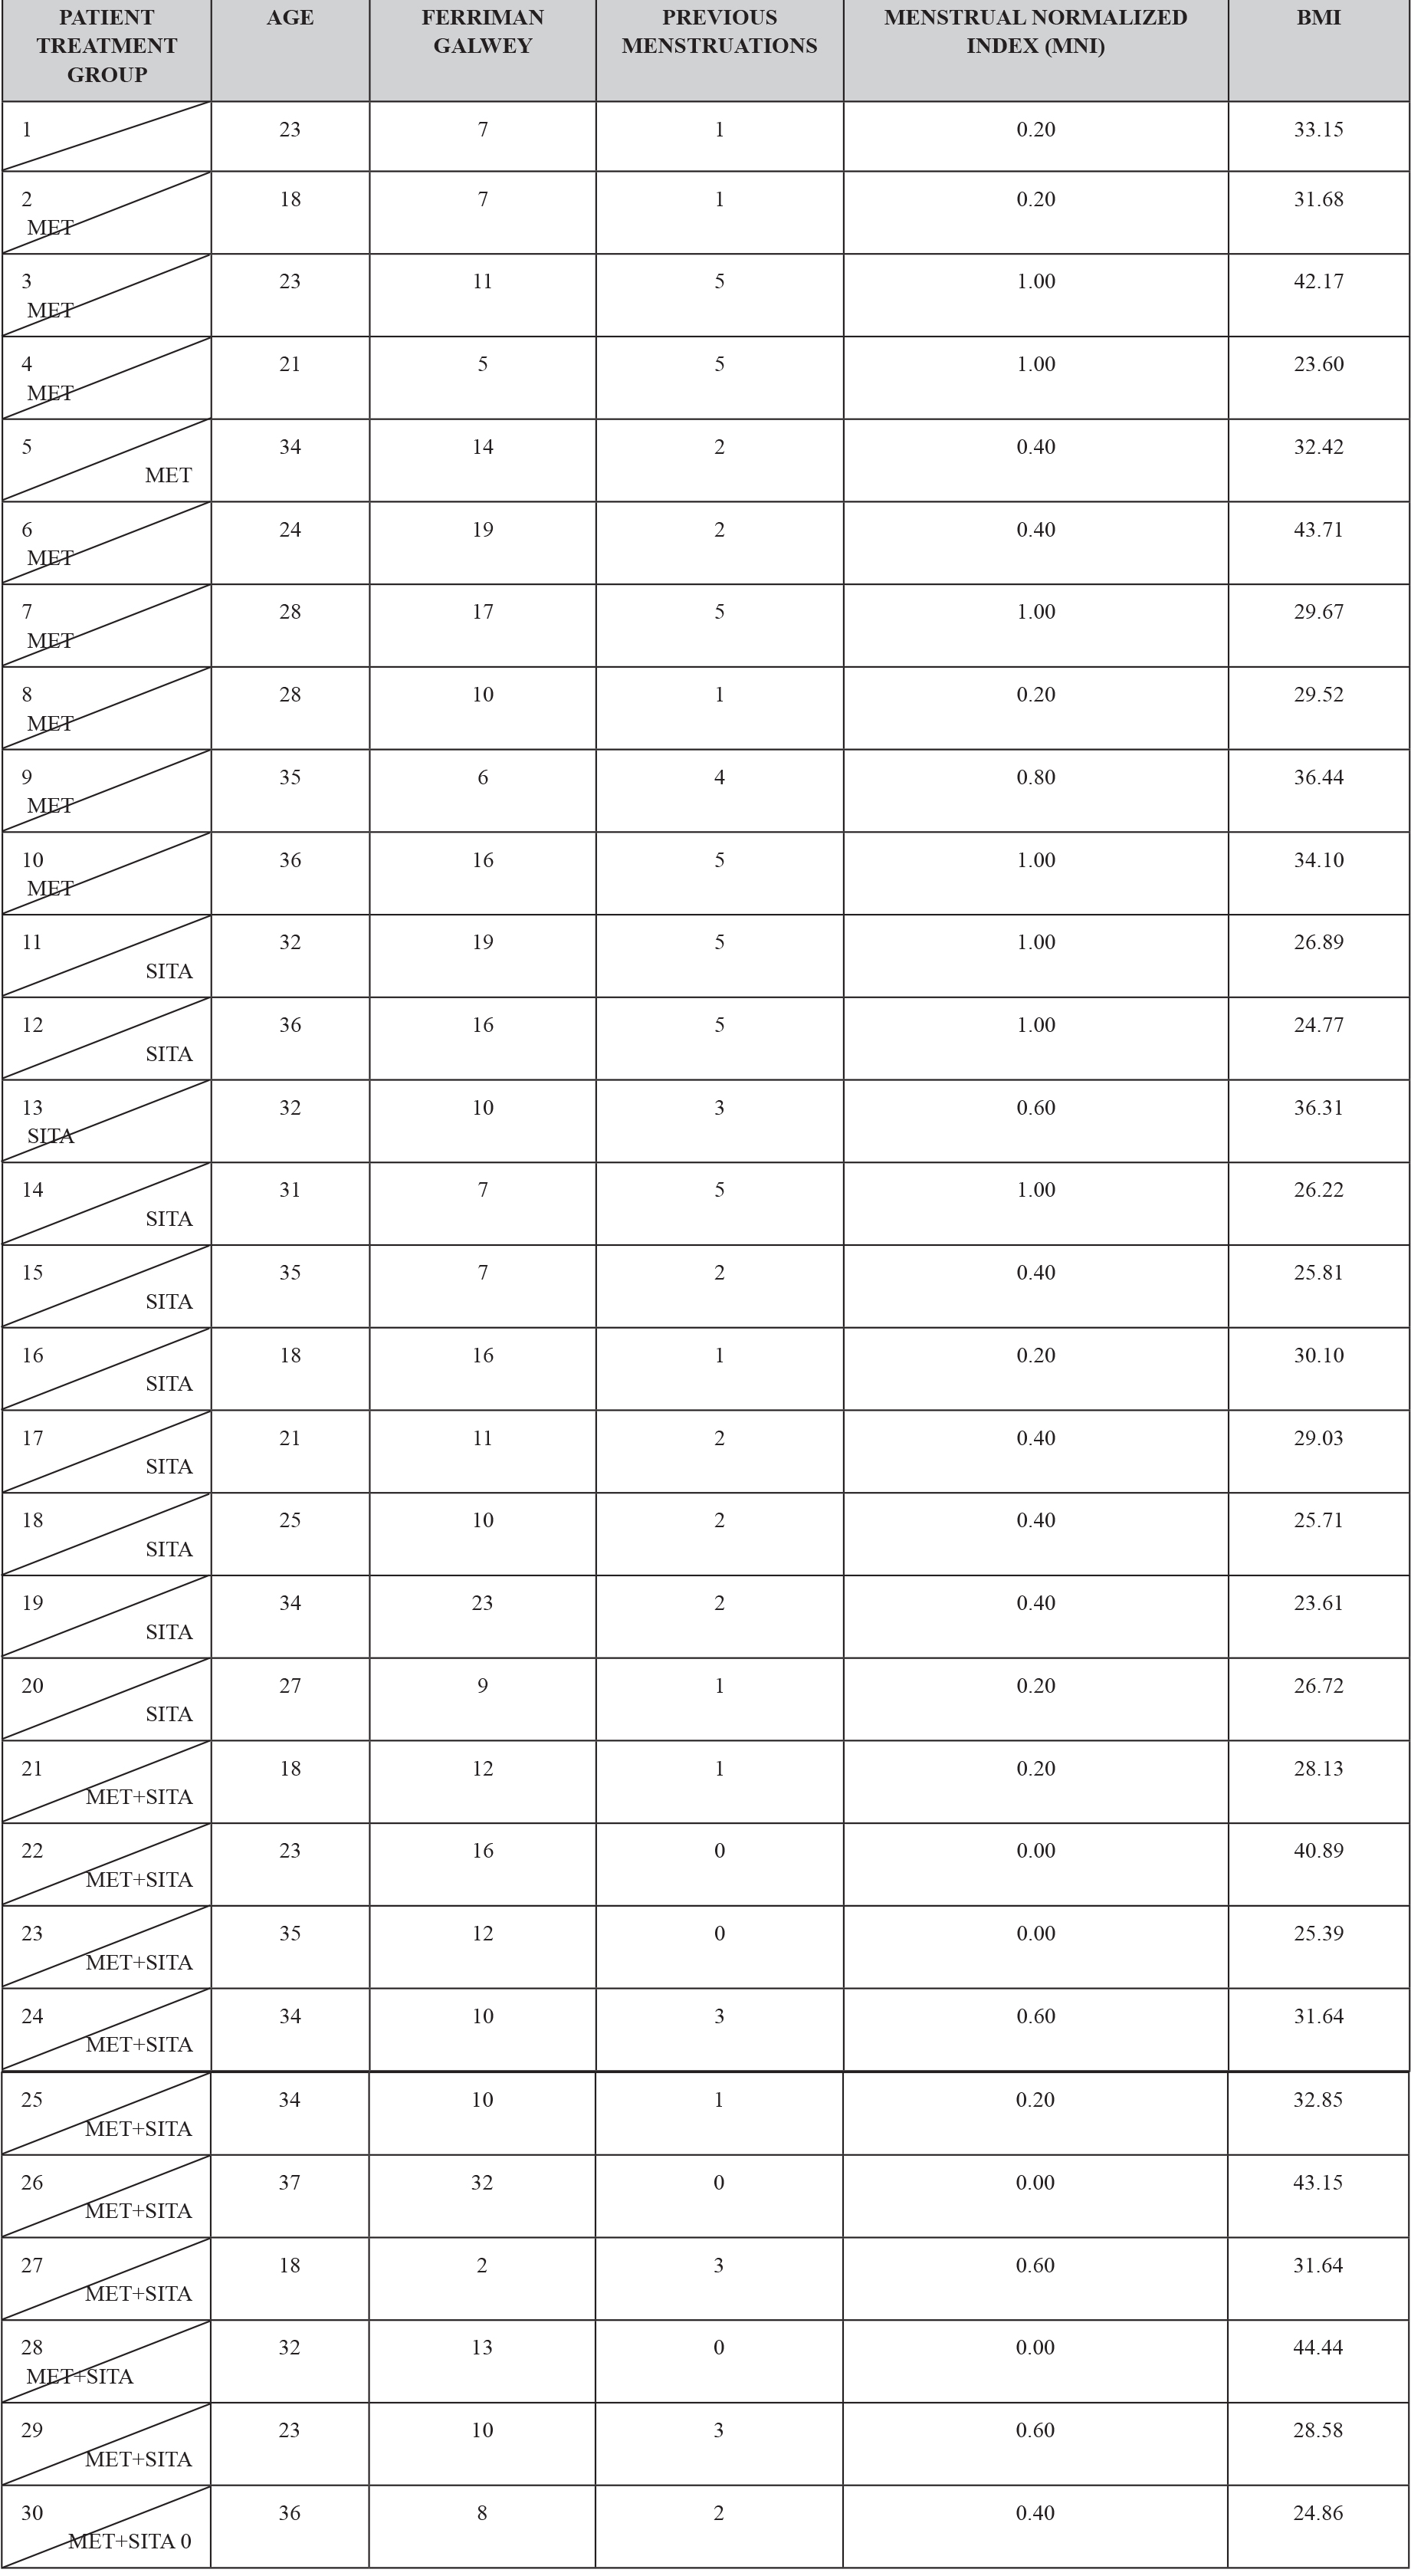
EDMJ Juan Carlos Paredes Palma_F15

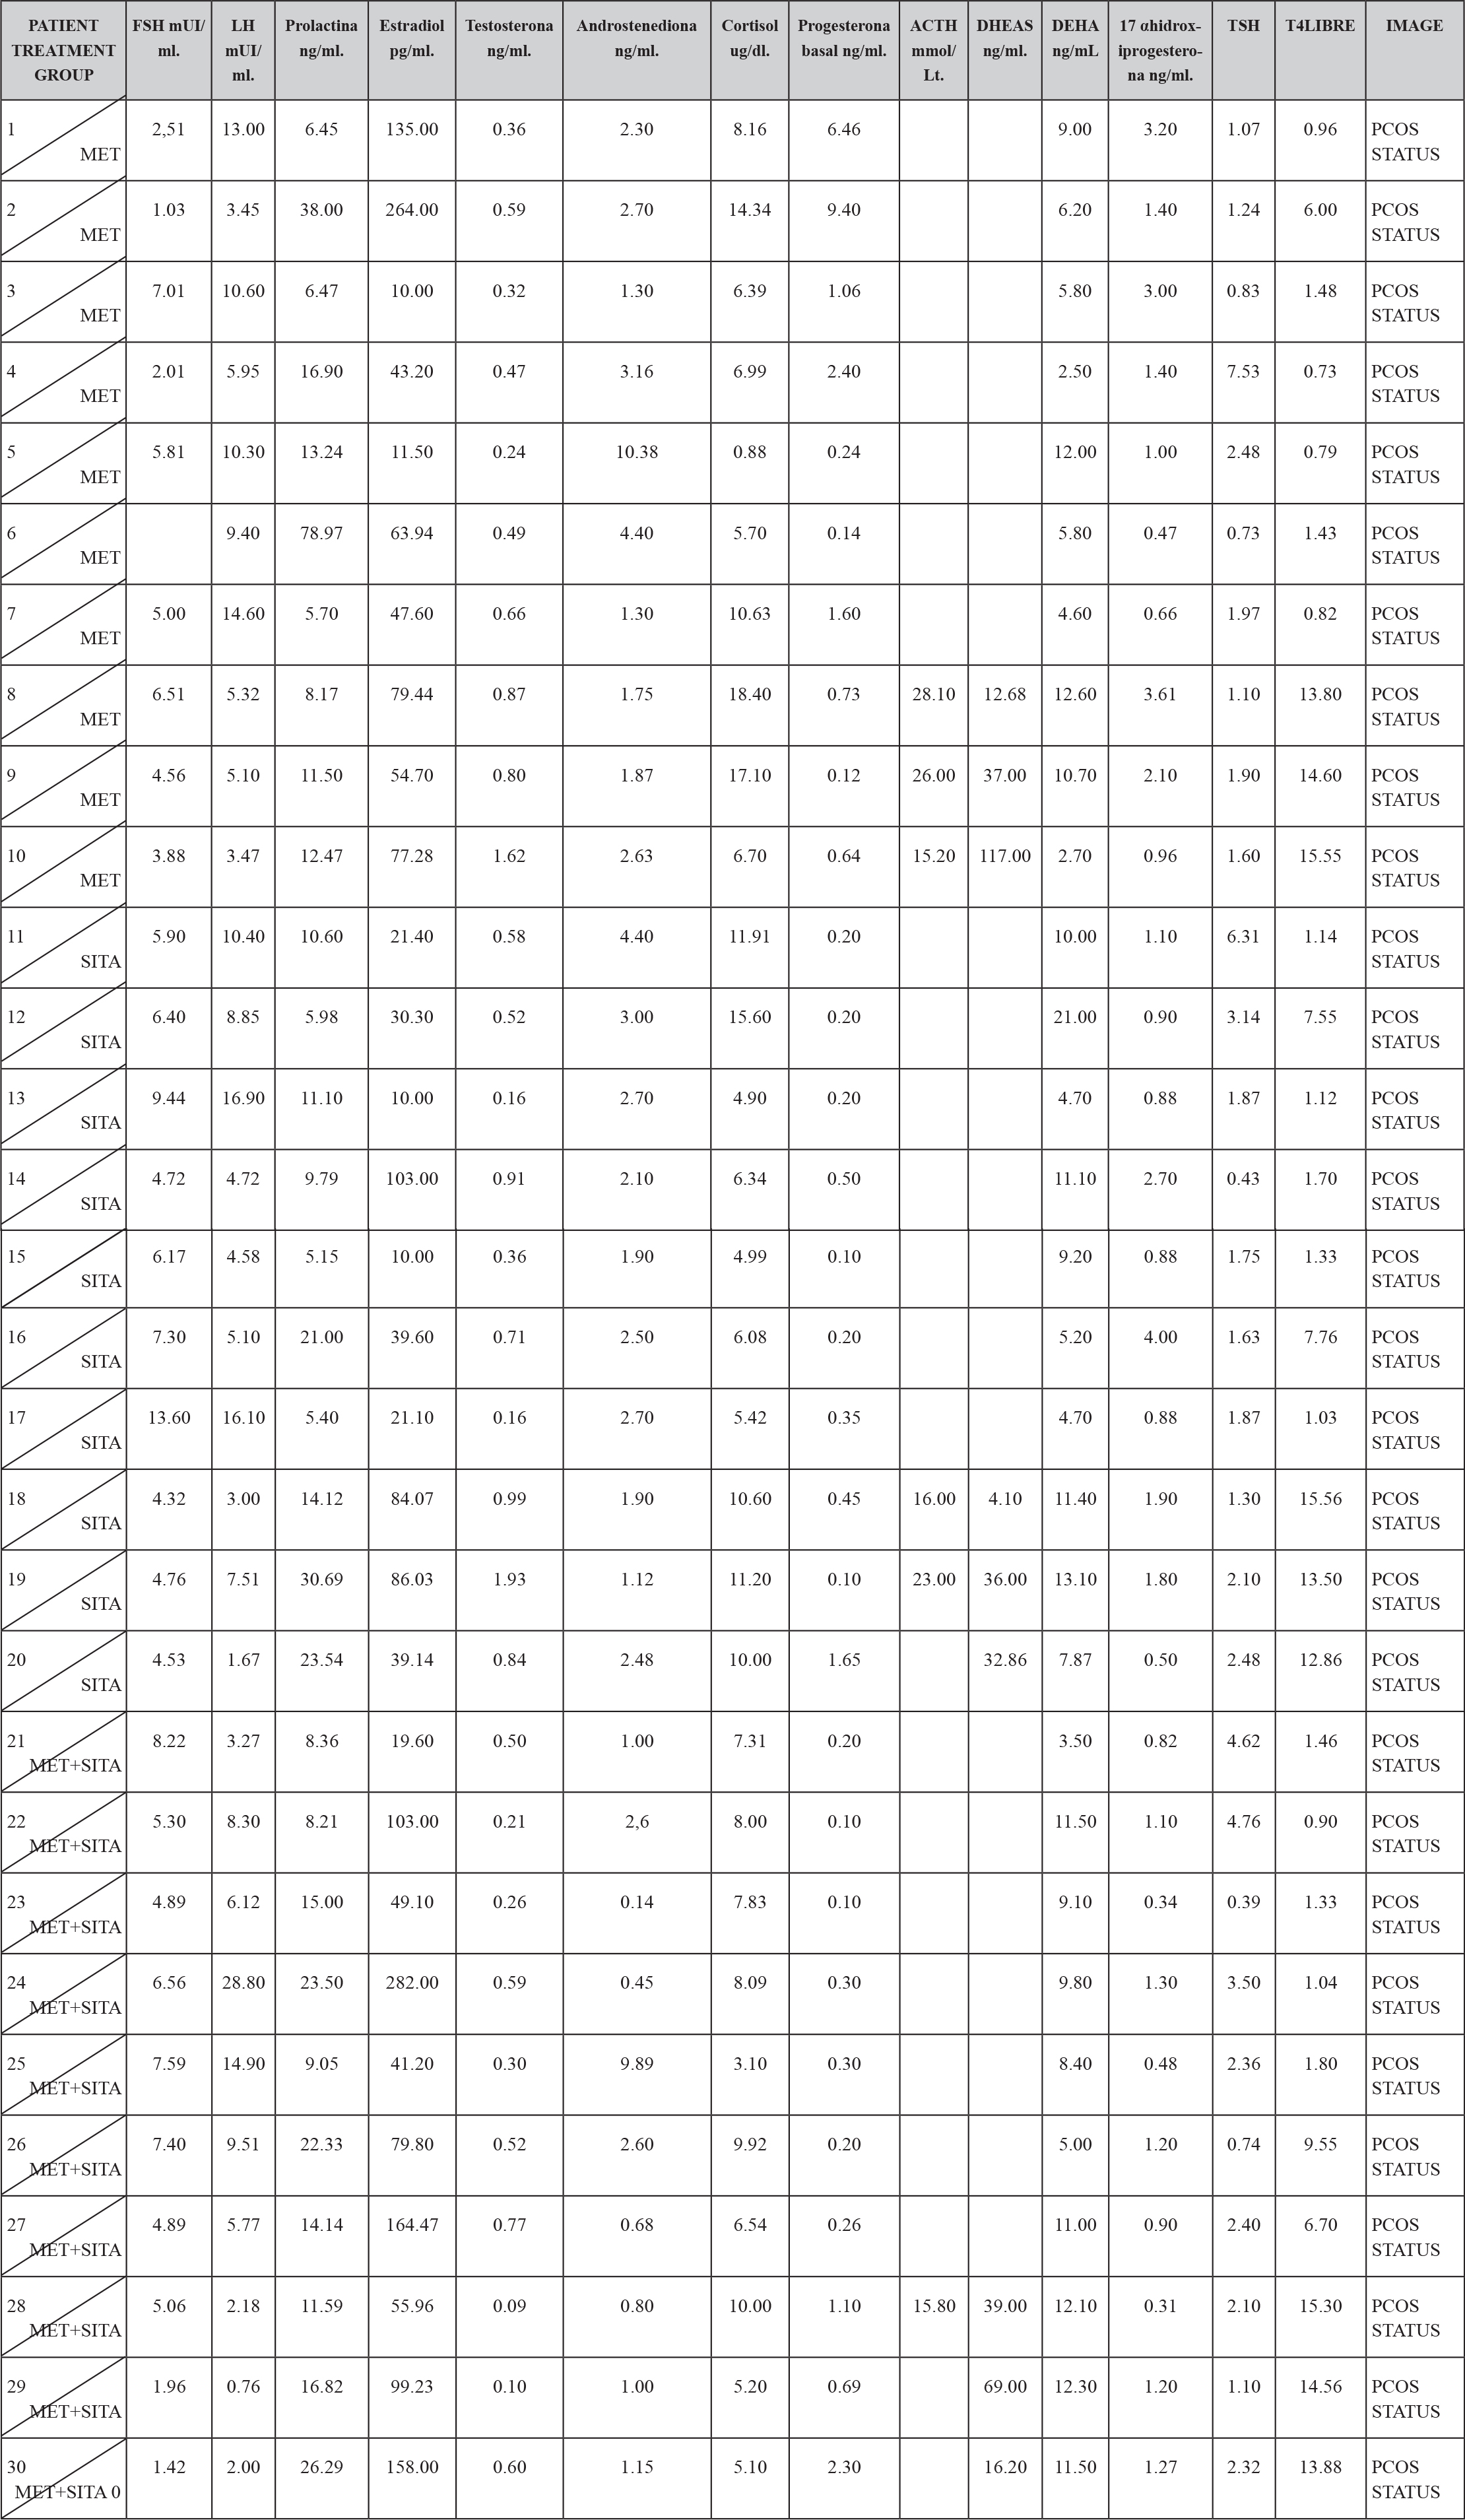
In the hormonal characteristics of the study patients it was observed that 12 patients (4%) presented the characteristic dissociation of LH and FSH and 2 patients (0.6%) presented testosterone concentrations compatible with androgen-producing ovarian tumor, which was discarded by ultrasonography, It is also to be noted that all the patients had a normal TSH concentration except two to which they were given the treatment and still continued with criteria to establish the diagnosis of PCOS; and all patients had a concentration of 17OHP4 (17 hydroxyprogesterone) below 4 ng / mL which is the cut-off point for suspecting 21-hydroxylase deficiency. (TABLE 2)

TABLE 2. BASAL HORMONAL CHARASTERISCTIC BY TREATMENT GROUP.
EDMJ Juan Carlos Paredes Palma_F16

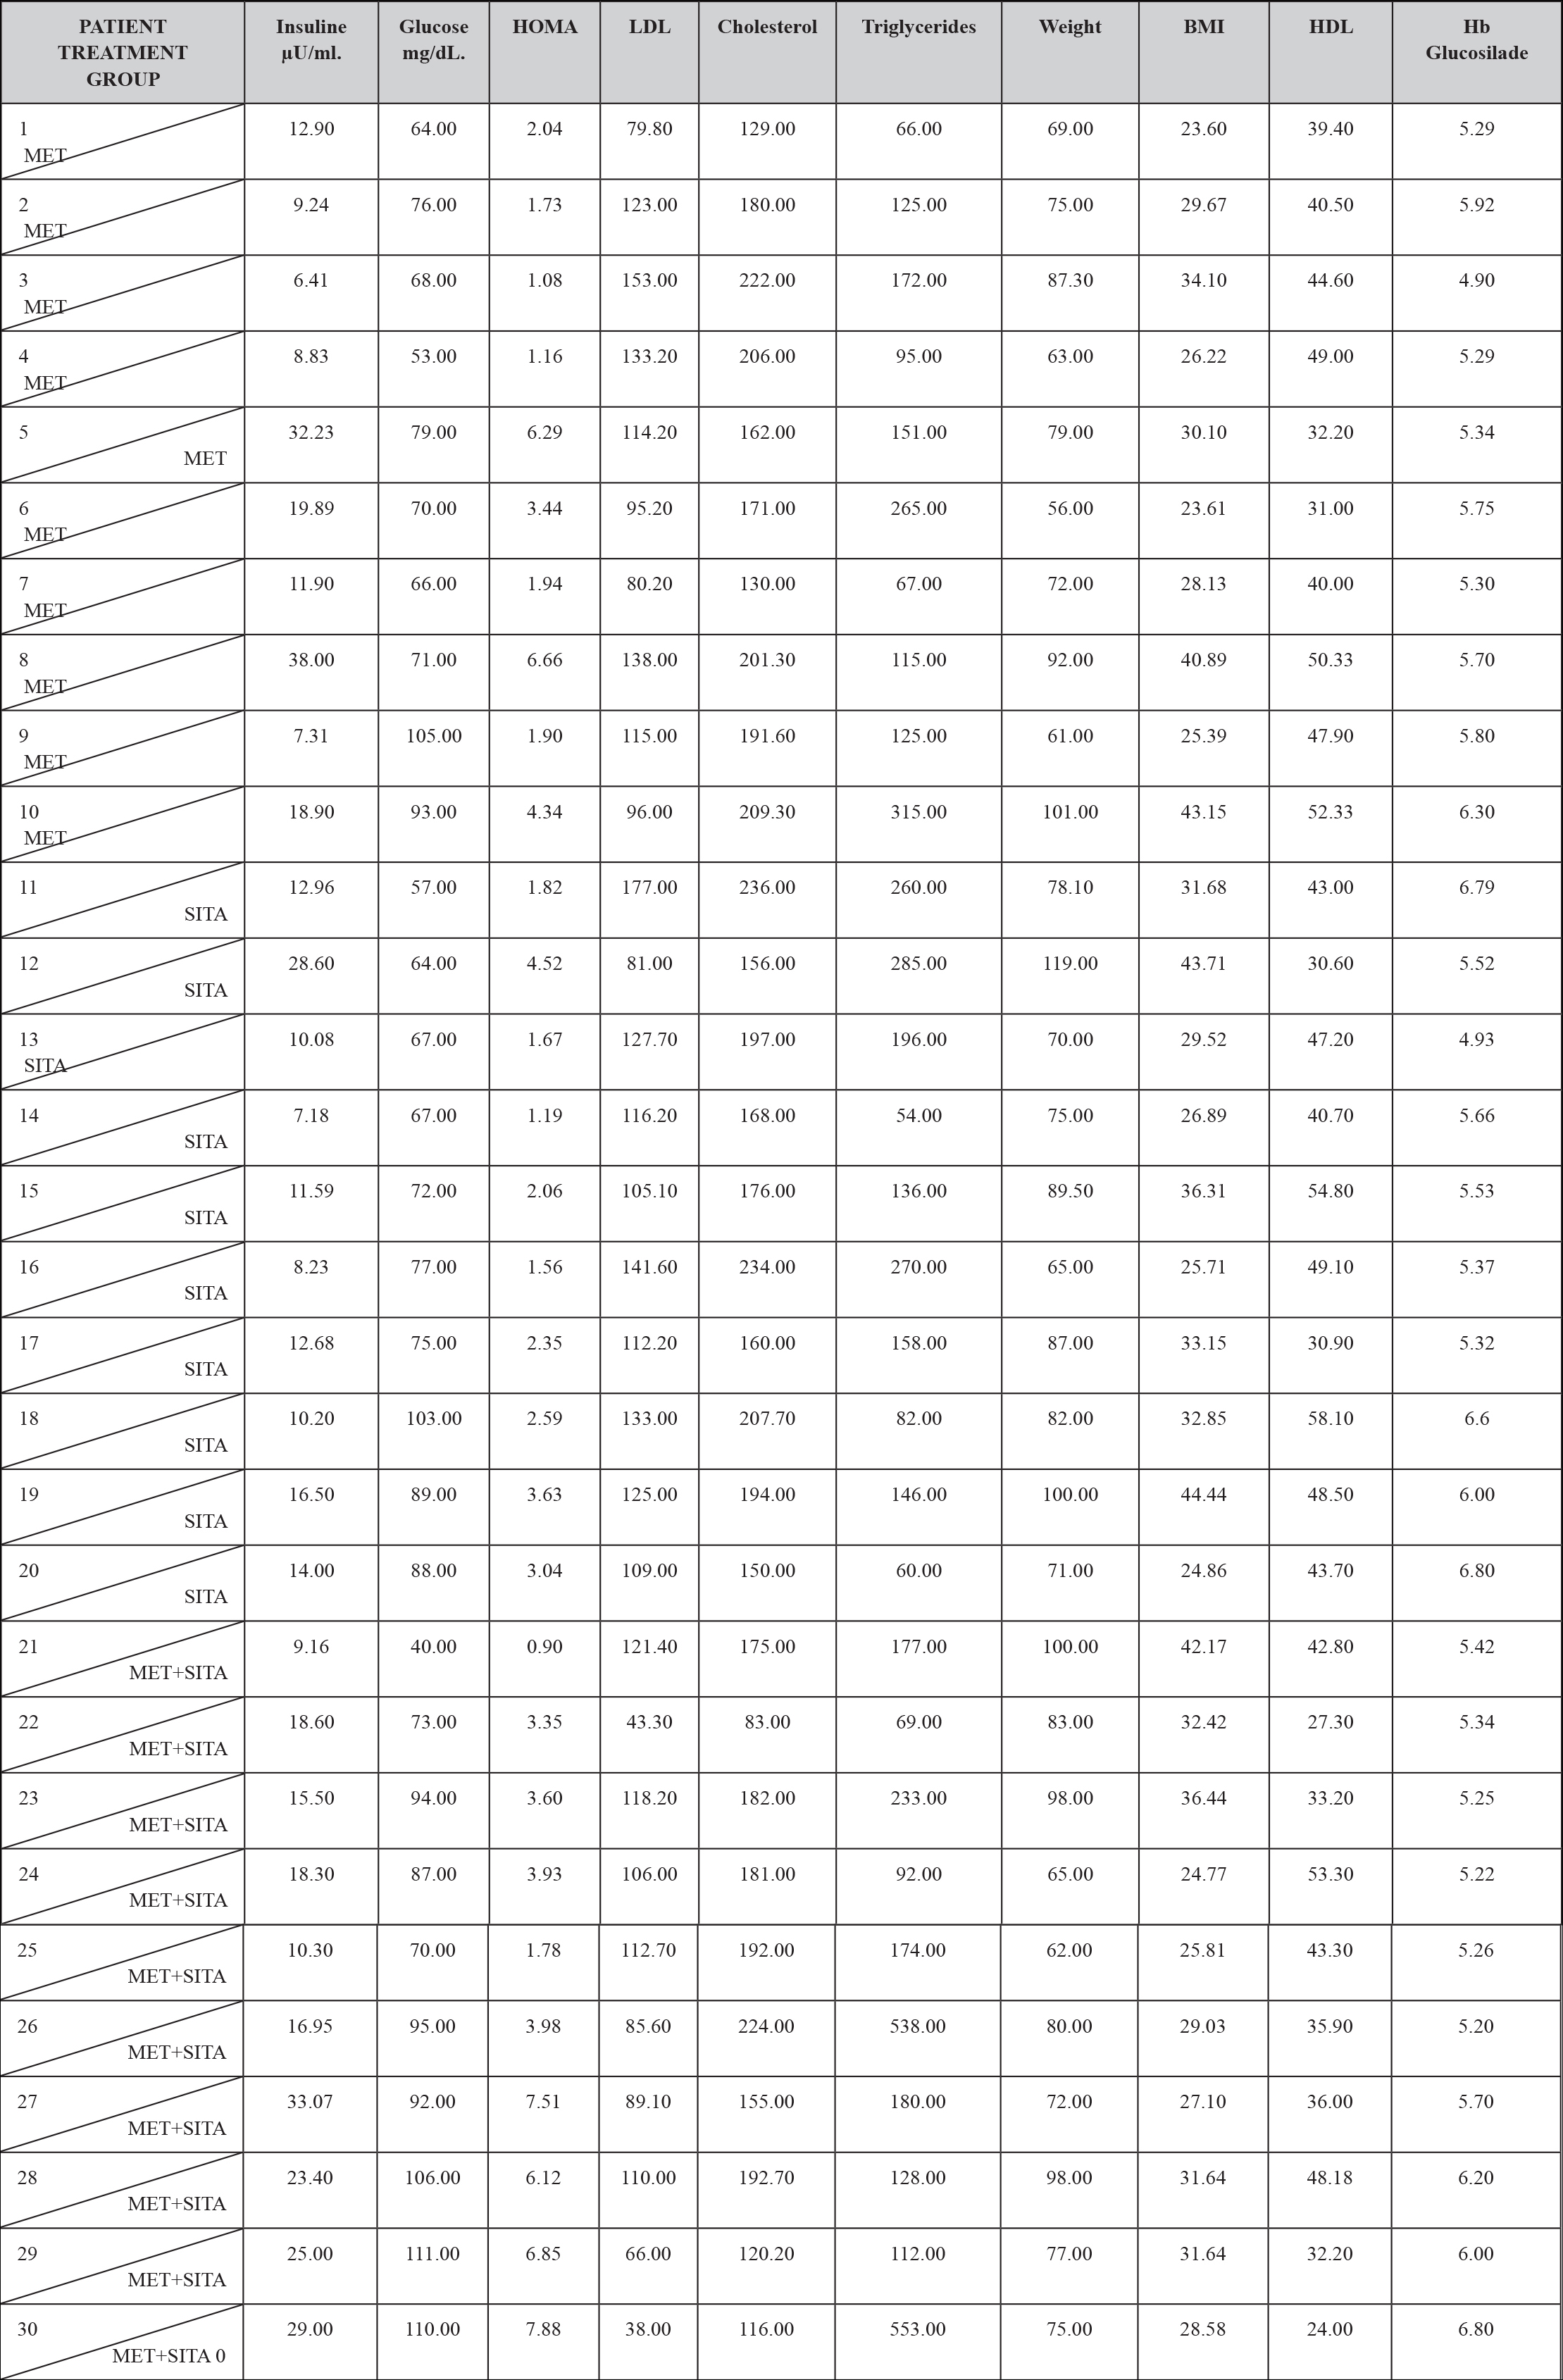
In the metabolic characteristics of the patients under study, it should be mentioned that 21 patients (7%) presented hypercholesterolemia, 15 patients (5%) presented hypertriglyceridemia, 20 patients (6.6%) presented LDL hypercholesterolemia, 8 patients (2.6%) presented abnormally low concentrations of HDL cholesterol.

On the other hand 5 patients (1.6%) had fasting altered glycemia, as well as 20 patients (6.6%) had basal hyperinsulinemia and 7 patients (2.3%) had insulin resistance and 28 patients (9.33%) disinsulinism.
Regarding the glycosylated hemoglobin in the 30 patients (100%), the value was normal, so the diagnosis of Diabetes Mellitus was ruled out by this criterion. (TABLE 3)

TABLE 3. BASAL METABOLIC CHARACTERISTICS BY TREATMENT GROUP.
EDMJ Juan Carlos Paredes Palma_F17

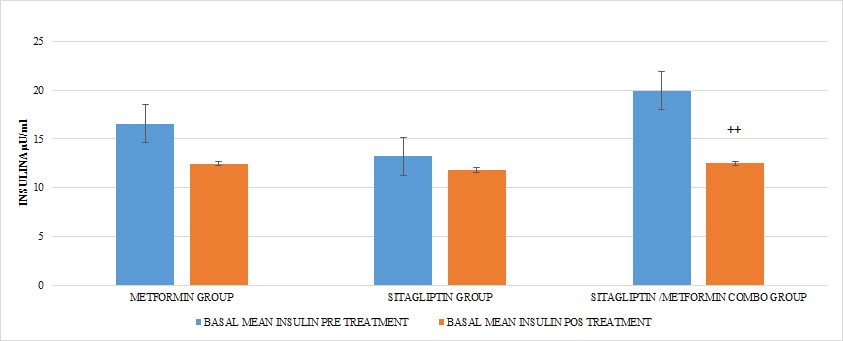
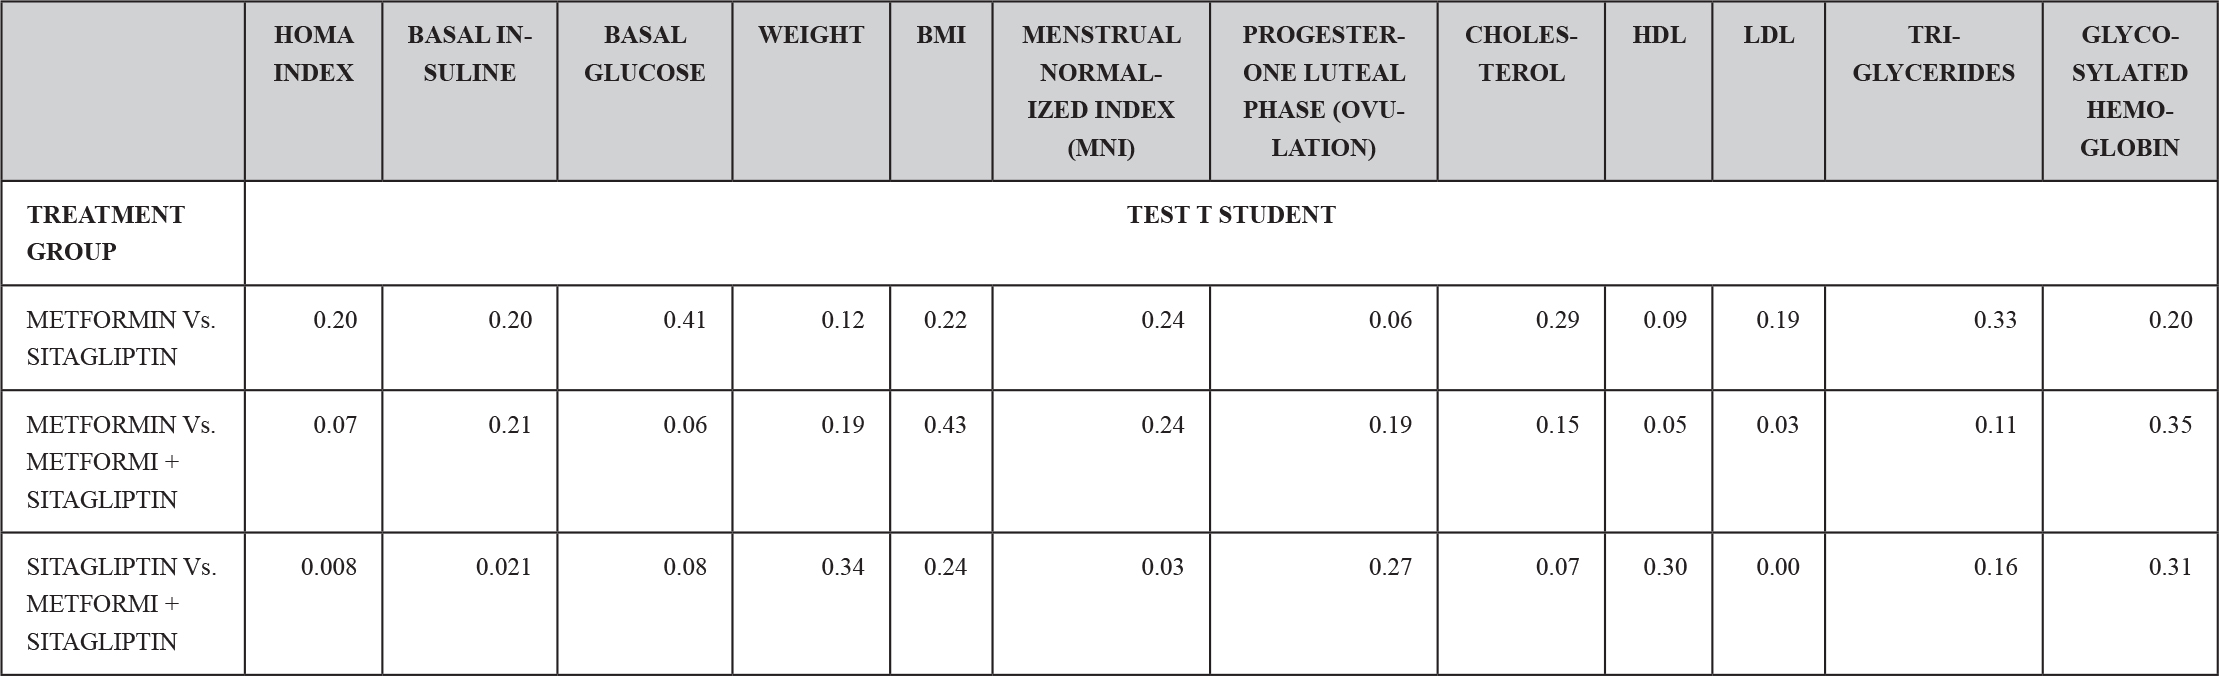
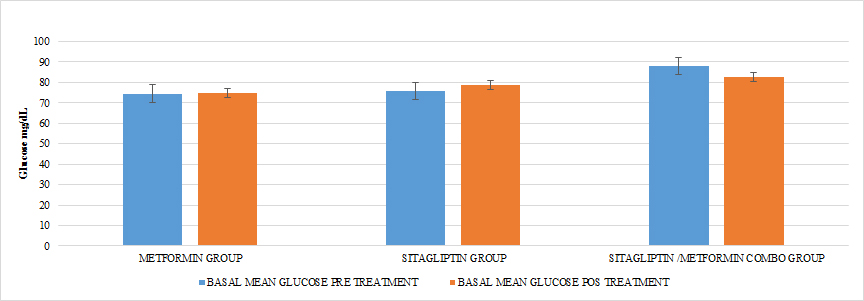
Ten patients were located in the group treated with metformin, ten patients in the group treated with sitagliptin and ten patients in the group treated with metformin + sitagliptin. The hormonal, anthropometric and metabolic characteristics between the groups were homogeneous at the beginning of the study except that in the combo group (MET + SITA) pretreatment vs the Sitagliptin group pre-treatment, initiation with greater insulin resistance (P <0.05) as well as the average basal insulin (p <0.05) but with a homogeneous index of menstruations in the three groups (P> 0.05), a condition that must be taken into account when analyzing the results for this group. (TABLE 4) (GRAPH 1)(GRAPH 2)

TABLE 4. TEST OF HOMEGENEITY OF THE TREATMENT GROUPS BEFORE THE CLINICAL ASSAY.
EDMJ Juan Carlos Paredes Palma_F18

EDMJ Juan Carlos Paredes Palma_F1

GRAPH 1. BASAL INSULINE PRE Y POST TREATMENT
EDMJ Juan Carlos Paredes Palma_F2

GRAPH 2. BASAL GLUCOSE PRE AND POST TREATMENT

Although the patients were given counseling for the aspects of nutrition and exercise; only the recommendations of the international guidelines were proposed as part of the SOP management and it was sought that they had an adequate attachment, all the patients in each group reported having adhered to these recommendations in a percentage greater than 90%, so the effect of the intragroup and intergroup absolute weight loss and in the BMI, represents the effect of the medication in the corresponding group.
In all treatment groups there was a decrease in weight associated with the use of the medication, (p <0.05), with the percentage of change (5.8%) being higher for the metformin group and lower for the sitagliptin group (2.5%). The percentage of change for the COMBO group was 3.45%. There were significant differences in the intra-group reduction (p <0.05) in all the groups and in the comparison between groups a greater effect of the metformin group Vs sitagliptin (p <0.05) and in Metformin Vs Combo (p <0.05) was observed without having Differences between the sitagliptin group and the COMBO
(GRAPH 3)

In terms of BMI in all groups there was a statistically significant reduction intragroups (p <0.05) not so between groups (p> 0.05) after 6 months of treatment (GRAPH 4)
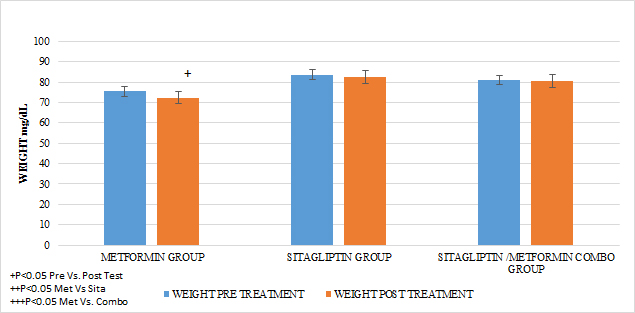
EDMJ Juan Carlos Paredes Palma_F3

GRAPH 3. WEGHT PRE AND POST TREATMENT
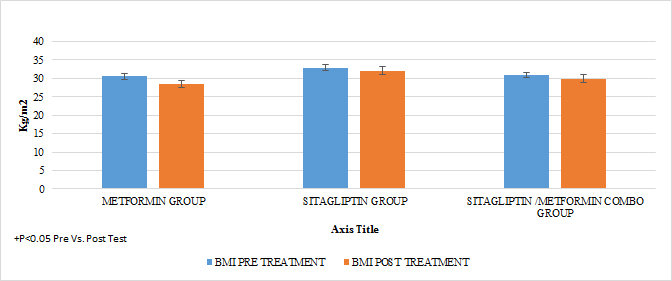
EDMJ Juan Carlos Paredes Palma_F4

GRAPH 4. MASS BODY INDEX BMI PRE AND POST TREATMENT

A reduction in the statistically significant intra-group abdominal circumference was observed in that of metformin and COMBO (P <0.05), but not in that of sitagliptin and the metformin group showed a greater difference in the reduction of statistically significant BMIs Vs the group of sitagliptin and COMBO .
In the case of the normalized menstruation index, it was found that there was a statistically significant intragroup increase in each of the treatments. The group with the highest percentage of change was that of sitagliptin with 127%, followed by metformin with 87.5% and then COMBO with 60%. When comparing the effect of the treatment after 6 months, no statistically significant differences were found between Metformin Vs Sitagliptin, nor between Metformin vs. Combo. But the effect of the COMBO Vs Sitagliptin group was greater. (Student T test p 0.05) (GRAPH 5)
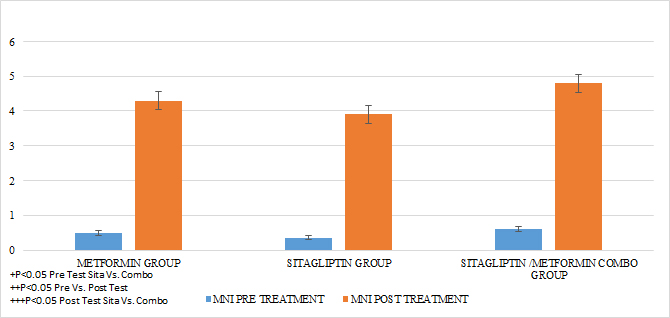
EDMJ Juan Carlos Paredes Palma_F5

GRAPH 5. MENSTRUAL NORMALIZED INDEX (MNI) PRE AND POST TREATMENT

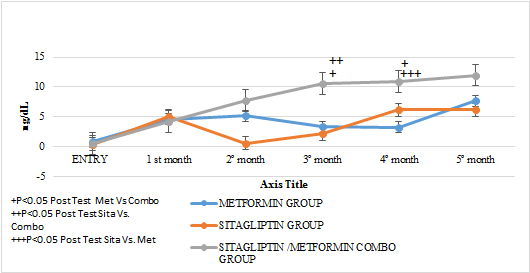
An increase in the number of ovulations was observed in all the groups reflected in progesterone concentrations as the treatment time was completed (P <0.05). It should be noted that none of the groups had statistically significant differences in the mean progesterone concentrations at entry into the study. No statistically significant differences were observed when comparing after 6 months of treatment between Metformin Vs Sitagliptin. But if greater effect between the group COMBO Vs Metformin and Vs Sitagliptin respectively. (GRAPH 6) (GRAPH 7)
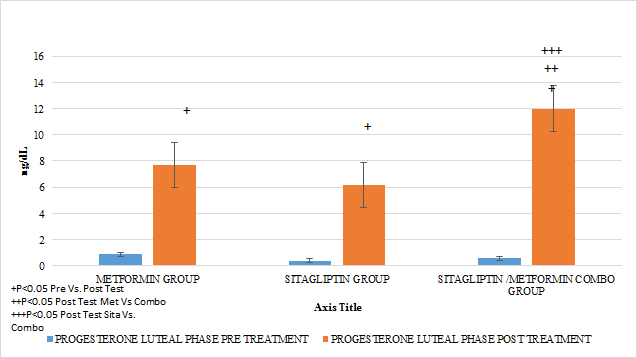
EDMJ Juan Carlos Paredes Palma_F6

GRAPH 6. PROGESTERONE LUTEAL PHASE (OVULATION) PRE Y POST TREATMENT
EDMJ Juan Carlos Paredes Palma_F7

GRAPH 7. PROGESTERONE LUTEAL PHASE MEAN FROM 21 AND 24 DAYS (OVULATION) MONTHLY FOLLOW UP

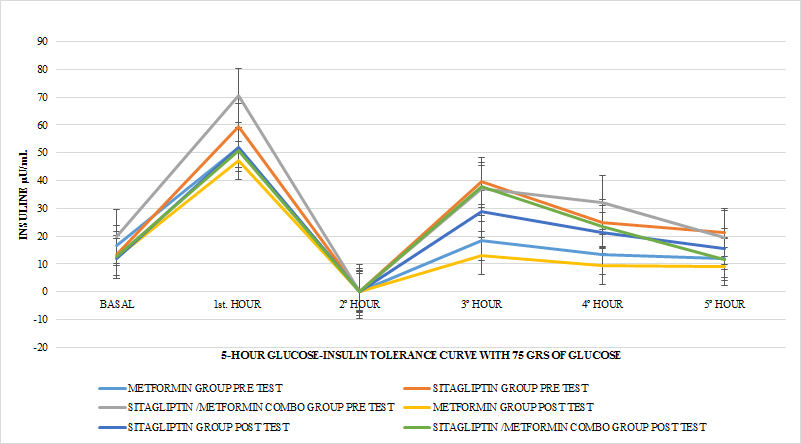
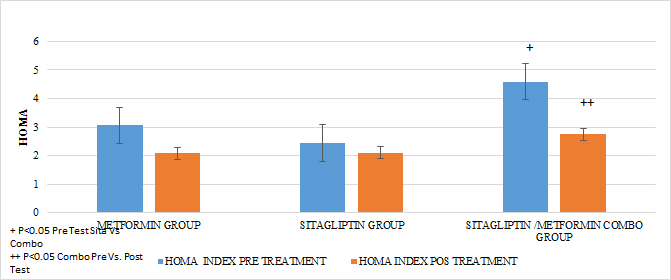
Regarding the effect of the drugs in each treatment group in terms of the HOMA pre Vs after treatment, in all the groups a tendency of decrease of the resistance was observed only reaching the statistically significant difference in the COMBO group, there were no statistically significant differences compare the effect on insulin resistance between the treatment groups (GRAPH 8). In the secretion of insulin it was observed that both in the group of metformin and sitagliptin there was a decrease in the average concentrations of insulin, especially in the middle and final part of the secretion curve. However, a greater delta of change was observed in the sitagliptin group, especially in the 2nd, 3rd and 4th hours of secretion. (7, 9 and 9 μU / ml of insulin respectively). Compared to 4.6, 0 and 6 μU / ml of insulin at the same times for metformin. In the case of the COMBO group, a reduction in secretion was observed at all times of the curve with a delta change of 6, 19, 0.8 and 6 μU / ml of insulin in each of the hours of determination. The statistical tests for the group of Metformin and Sitagliptin showed no differences in the intragroup change (paired T> 0.05) as well as between each secretion moment between groups (ANOVA p> 0.05). (GRAPH 9) In the case of the COMBO group I present statistically significant differences intragroup but not when compared with the other two treatments. (GRAPH 1)
EDMJ Juan Carlos Paredes Palma_F8

GRAPH 8. HOMA PRE AND POS TREATMENT

EDMJ Juan Carlos Paredes Palma_F9

GRAPH 9. INSULIN INTEGRATED SECRETION IN 5 HOURS PRE AND AFTER TEST

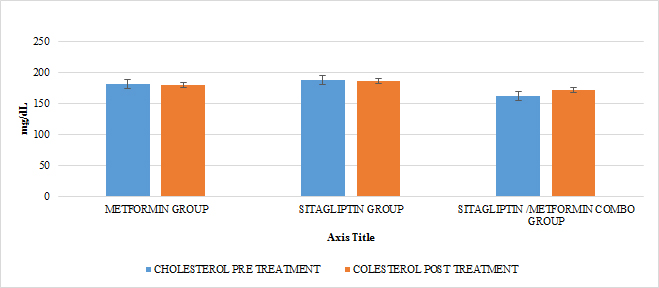
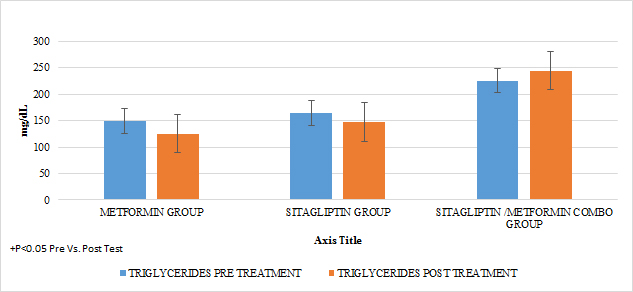
In lipids there was no effect of any of the treatments only in the case of metformin in terms of triglycerides if there was a statistically significant reduction (paired T-test p <0.05) with a delta of change of 24.04gr / dl decrease (16 %). An increase in HDL cholesterol was also observed in this group with a change delta of 6.38 (14.9%) (Paired T test p <0.05) (GRAPH 10–13)
EDMJ Juan Carlos Paredes Palma_F10

GRAPH 10. CHOLESTEROL PRE AND POST TREATMENT
EDMJ Juan Carlos Paredes Palma_F11

GRAPH 11. TRIGLYCERIDES PRE Y POST TREATMENT
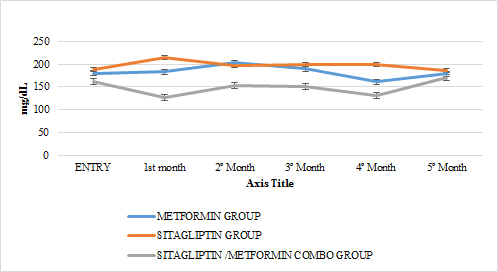
EDMJ Juan Carlos Paredes Palma_F12

GRAPH 12. TOTAL CHOLESTEROL MONTHLY FOLLOW UP
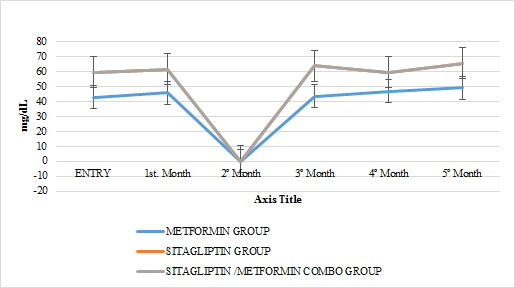
EDMJ Juan Carlos Paredes Palma_F13

GRAPH 13. CHOLESTEROL HDL MONTHLY FOLLOW UP
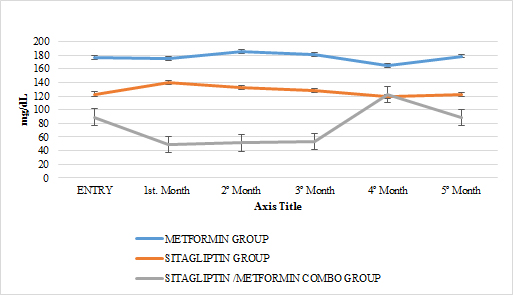
EDMJ Juan Carlos Paredes Palma_F14

GRAPH 14. CHOLESTEROL LDL MONTHLY FOLLOW UP

Discussion

The group of patients with PCOS had homogeneous characteristics and no statistically significant differences. In the case of the COMBO group at the beginning, significantly greater resistance to insulin was found than the Sitagliptin group, part of the effect that was observed 6 months after the start of the treatment superior to sitagliptin could have been due to this fact. The INM Menstruation Normalized Index did not show statistically significant differences between the groups at the beginning of the treatment. It is noteworthy that within the groups of sitagliptin vs metoformine the biochemical, clinical and hormonal characteristics did not show statistically significant differences and the effect on increased frequency of menses is comparable to that observed in the metformin group, considering that the basal rate of menstruation was greater in the sitagliptin group. Although the trend suggests that sitagliptin would have a greater effect on the increase in the frequency of their menses, no significant differences were found after 6 months. This stands out from the pilot study carried out by Paredes et al., Where the group with the highest delta change was metformin and this study coincides with the fact that no statistically significant differences were found after 6 months of treatment. These changes may be due to the greater number of samples in the present work. In the case of the COMBO group, the effect on the frequency of menses also reached group significance and after 6 months had a greater effect than sitagliptin, unlike those found in the pilot study, the latter can also be explained by the greater amount of patients included in the sample of this study. In the case of the Elkind-Hirsch K. study, in which metformin vs exenetide vs COMBO was compared, an increase in the frequency of menses was observed in all groups, however between groups there were also significant differences for weight loss. that the effect of exenetide on the frequency of menses can be due to this phenomenon [16].

In the case of our study, statistically significant differences in weight were observed before and after any treatment group, so we observed in terms of increased frequency of menses and ovulation could be attributed to this fact, however the percentage delta of change in minor weight of the group of sitagliptin Vs Metformin and the fact that after 6 months of treatment there was greater statistically significant weight loss in the group of Metformin Vs Sitagliptin and Vs COMBO and before the results of finding greater effect of sitagliptin in the INM and in terms of ovulation leads us to think that in the case of sitagliptin the effect in the treatment should be explained by other phenomena besides weight loss, at a certain moment we would have to carry out a study evaluate the presence of receptors and their mechanisms of action of sitagliptin within the ovary or within the reg ulation of the pituitary-ovary axis. This also highlights what was found in the pilot study where none of the treatment groups presented differences in weight, supporting the previous statement of the need to study other possible sites of action of sitagliptin in the reproductive regulation of women with PCOS. . It is noteworthy that although the COMBO group was less efficient in terms of increasing the frequency of menses, its effect on ovulation was greater than in other treatment groups, which could suggest that it is due to the additive effect that sitagliptin provides to the treatment. . In the Paredes et al pilot study, the findings were consistent with the above. In terms of insulin secretion, it should be noted that although sitagliptin is not considered an insulin sensitizer, it has been observed that it decreases insulin plasma concentrations, perhaps by influencing a better functioning of the pancreatic beta cell, in our studies showed a significant decrease in insulin secretion, even with delta change greater than in the metformin group in the first part of the secretion curve, but without reaching differences statistically between both groups, these findings are consistent with the observed in the weight loss in the treatment groups as well as with the behavior of the HOMA, where the intra-group trend was observed in all the treatments, the tendency to reduction after 6 months of treatment and with greater effect in the COMBO group, however, there is to consider that this group started with a higher degree of insulin resistance compared to other groups, so its greatest effect can be explained by this cause. This has also been observed in a study conducted by Kazaka Aoki et al [15]. In the case of the lipid profile, the only treatment that showed a pleiotropic effect for triglyceride reduction and an increase in statistically significant HDL cholesterol was Metformin, an effect that seems independent of weight reduction and insulin resistance. In many other studies, there has also been no effect of sitagliptin and even metformin on lipid metabolism [9,8,10,11,15], even in the pilot study conducted by Paredes et al [20].

Conclusion

Sitagliptin improves ovarian cyclicity and ovulation in women with PCOS in comparable terms with respect to metformin and the metformin sitagliptin combination. The combination of sitagliptin metformin is more effective in terms of ovulation than the other two treatments alone. However, sitagliptin showed that it can influence the reproductive and intra-ovarian aspect. Similarly, it showed that it can improve the metabolism of insulin in patients with PCOS, so it would be interesting to show if it could be a treatment that not only improves the clinical, metabolic and reproductive conditions of patients with PCOS, but also prevents the development of Diabetes. Mellitus, a highly frequent consequence of these patients. The weight did not change the results of the findings.

References

  1. John E. Nestler, M.D. Metformin for the treatment of the polycystic Ovary Syndrome. N ENG J MED; 2008; (358): 47–54.
  2. Moran C, et al. Prevalence of Polycystic Ovary Syndrome and related disorders in Mexican women. Gynecol Obst Invest. 2010; 69(4): 274–280.
  3. Kelsey E.S., et al. Position Statement: Glucose Intolerance in Polycystic Ovary Syndrome – A Position Statement of the Androgen Excess Society. JCEM 2007; 92(12): 4546–4556.
  4. The Rotterdam ESHRE/ASRM-Sponsored PCOS Consensus Workshop Group; Revised 2003 consensus on diagnostic criteria and long-term health risk related to polycystic ovary syndrome; Fer Ster 2004; 81: 19–24.
  5. David A. Ehrmann, M.D. Polycistic Ovary Syndrome. N ENGL J MED 2005; 352: 1223–1236.
  6. Evanthia Diamanti-Kandarakis, et al.; Molecular mechanisms of insulin resistance in polycystic ovary syndrome; Trends Mol Med 2006; 12 (7): 324–332.
  7. Mario Ciampelli1, et al. Human Reproduction. 1998; 13 (4): 847–851.
  8. Christian RC, et al.; Prevalence and predictors of coronary artery calcification in women with polycystic ovary syndrome. J Clin Endocrinol Metab 2003; 88: 2562–8
  9. Daniel J. Drucker, MD. Enhancing Incretin Action for the treatmen of type 2 Diabetes. Diab Care 2003; 26.
  10. Chee W. Chia, Jophine M. Egan. Incretin-Based Therapies in type 2 Diabetes Mellitus, J Clin Endoc Metab 2008; 93: 3703–3716.
  11. Jana Vrbikova, et al.; Incretin levels in polycystic ovary syndrome; Eur J End 2008; 159: 121–127
  12. Charalambos Pontikis et al.; the Incretin Effect and Secretion in Obese and Lean Women with Polycystic Ovary Syndrome: A Pilot Study. J Women’s Health 2011; 20 (6).
  13. Oscar Velázquez Monroy, Agustín Lara Esqueda, Roberto Tapia Conyer.  Metformina y Síndrome Metabólico. Secretaria de Salud 2002.
  14. Bruno et al.; Comparison of two doses of metformin (2.5 y 1.5 g/day) for the treatment of polycystic ovary syndrome and their effect on body mass index and waist circumference; Fertil Steril 2007; 88 (2): 510–512.
  15. Kazutaka A, et al.; Effects of miglitol, sitagliptin or their combination on plasma glucose, insulin and incretin levels in non-diabetic men; Endo J 2010; 57 (8): 667–672.
  16. Karen Elkind-Hirsch, et al.; Comparision of Single and Combined treatment with Exenatide and Metformin on Menstrual Cyclicity in Overweight Women with Polycystic Ovary Syndrome. JCEM 2008; 93: 2670–2678.
  17. Leigh P. et al.; Incretin action maintains insulin secretion, but not hepatic insulin action, in people with impaired fasting glucose; Diab Res Clin Prac 2010; 90: 87–94.
  18. Solomon C. et al.; Long or Highly irregular menstrual cycles as a marker for risk of type 2 Diabetes Mellitus 2001; JAMA; 286: 2421–2426.
  19. Desiletes A. et al.; Rle of Metformina for weight management in patients without type 2 Diabetes; Ann Pharmacother 2008; 42: 817–826.
  20. PAREDES JC et al: Comparative treatment between Sitagliptin vs. Metformin, alone or in combination, in patients with Polycystic Ovarian Syndrome. A clinical entity with a high risk of developing diabetes mellitus and gestational diabetes; Rev Med Hosp Gen Mex 2018; 81(1): 15–26.

Nucleoprotein Assembly Mediated Transfection

DOI: 10.31038/NAMS.2019213

Abstract

Ordered DNA methyltransferases covalently bound to Y-junction DNA were spontaneously taken up mammalian cells in culture, where a nuclear localization signal carried by the bound methyltransferases caused the fluorescently labeled nucleoprotein complex to decorate the nucleus of several mammalian cell lines. We report proof of concept experiments demonstrating that the Y-junction nucleoprotein assembly can be modified to carry gene expression cassettes that permit spontaneous transfection and expression of a desired protein in mammalian cells.

Introduction

Ordered nucleoprotein assemblies have been developed for a variety of applications in Nanofabrication [1]. Many protein bearing nanoparticles have been shown to target mammalian cells where they can be selectively internalized [2,3].   Bacterial DNA methyltransferases covalently bound to Y-junction DNA have also been shown to be spontaneously taken up by mammalian cells in culture [4].  Further, those experiments showed that the nuclear localization signal carried by the bound methyltransferases caused the fluorescently labeled nucleoprotein complex to decorate the nucleus of several mammalian cell lines. Here we report proof of concept experiments using Green Fluorescent Protein (GFP) expression to demonstrate that the Y-junction nucleoprotein assembly can be modified to carry gene expression cassettes that permit spontaneous transfection and expression of a desired protein in mammalian cells.

Materials and Methods

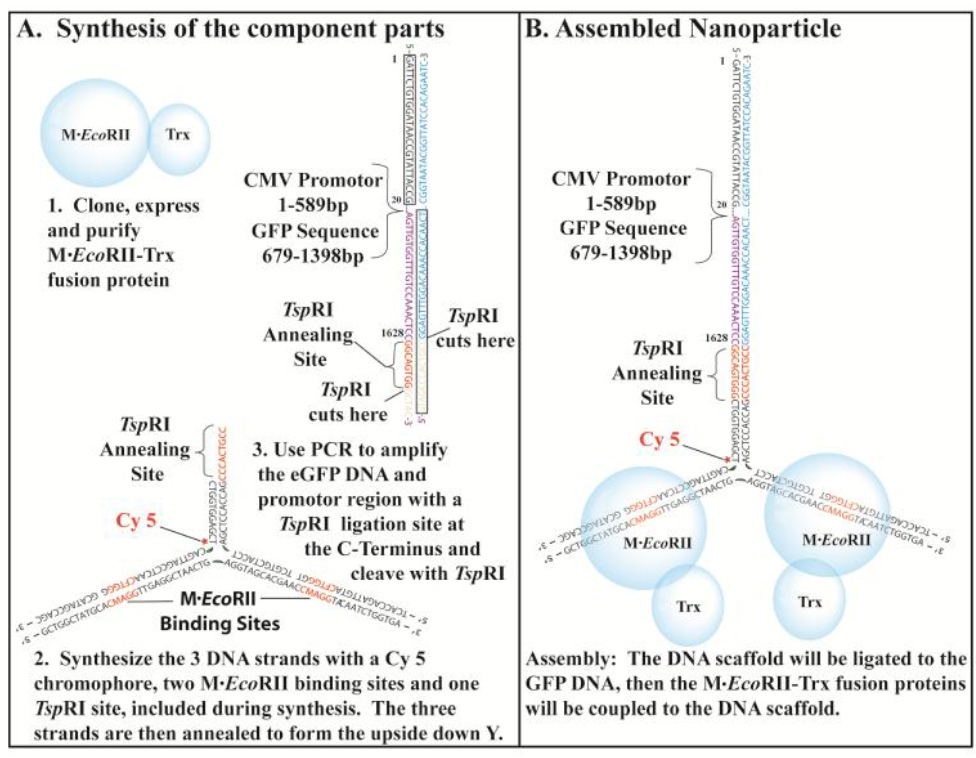
Cell Culture conditions, EcoRII DNA methyltransferase purification, flurocytidine containing DNA Y-junction synthesis and construction, as well as the construction of the thioredoxin-linked nanoparticle have all been described in detail [4–6].  The Y-Junction was modified for expression cassette delivery as described in figure 1.

NAMS 2019-104 - Steven Smith USA_F1

Figure 1. The NP-Trx2-GFP-DNA was assembled from the component parts.

Synthesis of the component parts. 1.  The EcoRII Methyltransferase fusion protein was cloned, expressed and purified from E. coli.   2. The DNA scaffold is composed of three DNA strands with a Cy 5 tag added during the synthesis. The sequences for two M.EcoRII binding sites and one Tsp RI Ligation site are designed into the sequences. 3.  The GFP DNA was generated by PCR, which will include the GFP open reading frame and the eukaryotic promoter sequence.  A Tsp RI sequence was included in the N-terminal region of the GFP DNA.   B.  The assembly consists of three steps.  First the three strands of the DNA scaffold were annealed. Then the GFP DNA was ligated to the DNA scaffold.  Finally the EcoRII Methyltransferase fusion proteins were coupled to the EcoRII Methyltransferase binding sites.

Transfection Conditions: Comparison of NP-Trx2-GFP -DNA Mediated GFP Delivery with Lipid Mediated Transfection.

We compared the effectiveness of delivering NP-Trx-GFP-DNA to DU145 cells with a traditional transfection reagent (e.g. Lipofectamine™ (Invitrogen)). Cells were plated at 5,000 cells per plate (Costar) before delivery without antibiotics and grown to 50–70% confluence. The media was removed from each well and the cells were washed with PBS.  Then 1.0 µM NP-Trx2-GFP-DNA was added to the cells and incubated for multiple time points at 37oC in 5% CO2. The transfected cells were observed by fluorescent microscopy and fluorimetry for the frequency of green fluorescent protein expression in viable cells per input viable cell. The emission wavelength of Cy5.5 at 707nm, which is on the DNA Y-Junction (Figure1), did not interfere with the appearance of fluorescence from GFP at 509nm.  Following incubation, the cells were washed with PBS and growth media was added and the cells were incubated to permit growth.  The cells were monitored using an inverted fluorescent microscope over the next 10 days for internalization at 707nm and for the appearance of GFP fluorescence at 509nm indicating successful expression of GFP.

Results and Discussion

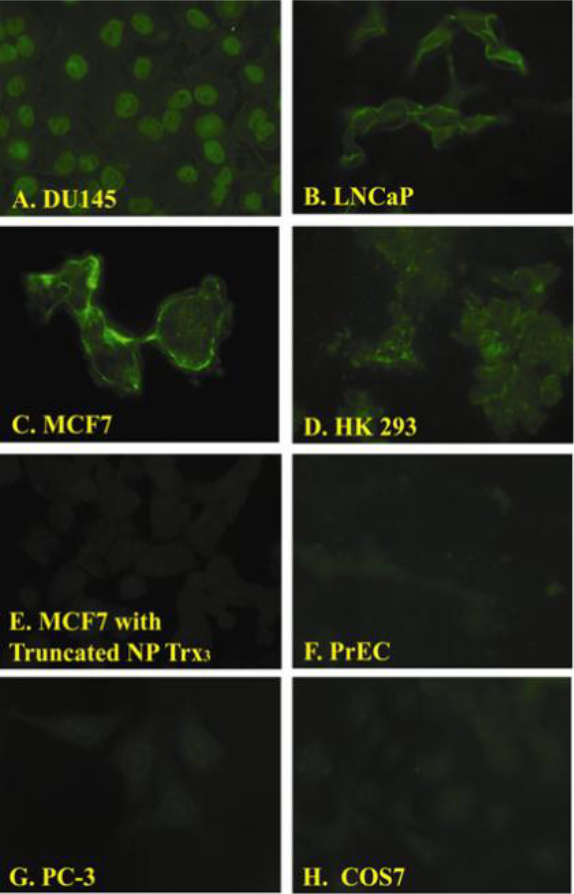
As noted above the trisubstituted nanoparticle was found to spontaneously enter mammalian cell lines of several types (Figure 2).  Among those, the DU145 cell line, which showed significant uptake in the nucleus and HK293, which showed weak uptake were selected for further work in this proof of concept report.

NAMS 2019-104 - Steven Smith USA_F2

Figure 2. Fluorescent images of cell lines exposed to the NP-Trx3.

We observed differential binding of the NP-Trx3 prepared as described in [4] with different cell lines.  Fluorescence was observed in DU145 (Panel A), LNCaP (Panel B), MCF-7 (Panel C), HK293 (Panel D) but not MCF7cells exposed to Y-Junction DNA without the targeting ligand (Eco RII DNA methyltransferase) (Panel E), Primary Prostate Epithelial Cells (PrEC) (Panel F), PC-3 (Panel G) and COS7.

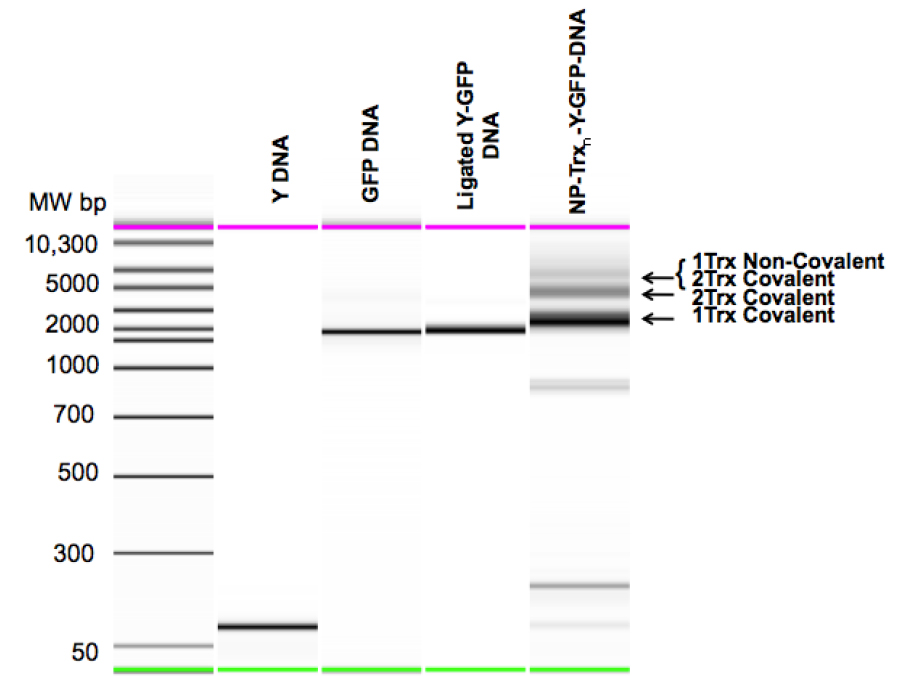
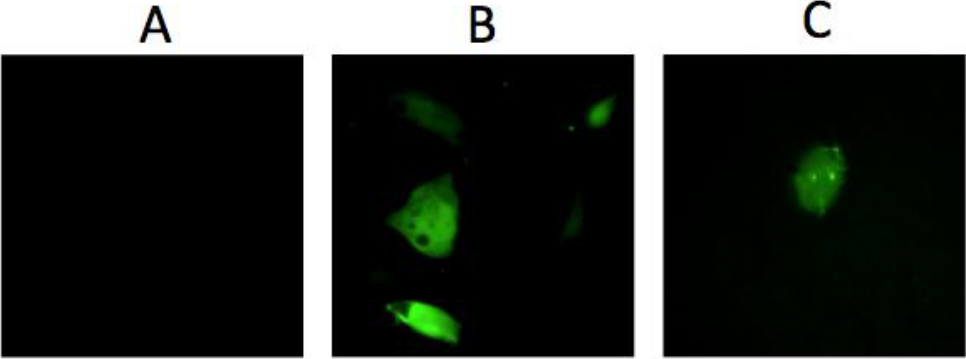
Final assembly of the carrier nanoparticle (NP-Trx2-GFP-DNA) was carried out as described in materials and methods. Each stage in the process was tested using microfluidics mobility shift analysis [7]. The results of a typical mobility shift analysis are depicted in Figure 3.Transfection efficiency was monitored by GFP fluorescence after transfection.  Nuclear fluorescence indicating GFP expression was observed with DU145 cells using Y-GFP DNA and Lipofectamine mediated transfection or with purified NP-Trx2-Y-GFP-DNA without Lipofectamine mediation.  The mixture of unreacted components of the nanoparticle (Y-DNA, GFP-DNA, and EcoRII-Trx) did not yield GFP expression (Figure 4).  Unpurified Np-Trxn-Y-GFP-DNA was found to exhibit GFP expression without Lipofectamine mediation suggesting that the nanopaticle might support transfection with a single EcoRII-Trx molecule acting as targeting ligand.  HK293 Cells were also found to support NP-Trx2-Y-GFP-DNA without Lipofectamine mediation although with lower efficiency than DU145 cells.

NAMS 2019-104 - Steven Smith USA_F3

Figure 3. Mobility Shift analysis of the Steps in Carrier Nanoparticle Assembly.

Y DNA: Purified Y-Junction. GFP DNA: Purified TspR1 cleaved GFP expression cassette. Ligated Y-GFP DNA: Purified Y-DNA GFP DNA ligation product. NP-Trxn-Y-GFP-DNA: Unpurified EcoRII-Txn + Y-GFP reaction products, showing DNA carrying one or two covalently bound EcoRII-Txn molecules and two covalently bound and one non-covalently bound EcoRII-Txn molecules.

NAMS 2019-104 - Steven Smith USA_F4

Figure 4. GFP Expression after transfection.

A: Lack of GFP expression after exposing DU145 cells to the mixture unreacted components of the nanoparticle (Y-DNA, GFP-DNA, and EcoRII-Trx). B: GFP expression after Lipofectamine mediated transfection of DU145 cells with 300nM Y-GFP-DNA.  C: GFP expression after exposing DU145 cells to 300nM purified NP-Trx2-Y-GFP-DNA alone.

Expression was seen to be transient with the number of fluorescent nuclei diminishing steadily over a period of ten days, suggesting that the DNA from the nanoparticle did not become integrated. Transfection efficiency was comparable to that observed with Lipofectamine mediation transfection, and depended on the cell line used for transfection.

For DU145 cells 38% transfection was observed with Nanoparticle mediated or Lipofectamine mediated transfection assuming the input transfectant was not replicated. However, the efficiency was adequate for most purposes and avoids the undesirable cellular stress of Lipofectamine exposure [8]. We also noted that purification of the NP-Trx2-Y-GFP-DNA DNA was unnecessary since simply allowing the reaction between the Y-GFP-DNA and EcoRII-Trx to occur in 30 min incubation at 37oC resulted in comparable transfection levels. We were not concerned that uncoupled EcoRII activity might alter gene expression by methylating non CG methylation sites since previous work with this enzyme showed that this does not occur [9].  Further, given the ability of the of the nanoparticle to spontaneously enter the cytoplasm of certain cells (e.g. LNCaP see Figure 2B) the system can be modified to carry siRNA by repurposing the truncated Y-Junction so as to permit hybridization of a double stranded siRNA molecule to the nucleoprotein complex, thereby avoiding the deleterious effects of the Lipofectamine transfection generally employed in siRNA transfection [8].

References

  1. M.Niemeyer C (2010) Halbsynthetische DNA-Protein-Konjugate fur Biosensorik und Nanofabrikation. Angewandte Chemie 122: 1220–1238.
  2. Lidke DS, Nagy P, Heintzmann R, Arndt-Jovin DJ, Post JN, et al. (2004) Quantum dot ligands provide new insights into erbB/HER receptor-mediated signal transduction. Nat Biotechnol 22: 198–203.
  3. Mortensen MW, Bjorkdahl O, Sorensen PG, Hansen T, Jensen MR, et al. (2006) Functionalization and cellular uptake of boron carbide nanoparticles. The first step toward T cell-guided boron neutron capture therapy. Bioconjug Chem 17: 284–290.
  4. Singer EM, Crocitto LE, Weiss LM, Loera S, Imam SA, et al. (2011) Biomarker Identification with Ligand-Targeted Nucleoprotein Assemblies Nanomedicine (London) 6: 659–668.
  5. Clark J, Singer EM, Korns DR, Smith SS (2004) Design and analysis of nanoscale bioassemblies. Biotechniques 36: 992–996, 998–1001.
  6. Singer EM, Smith SS (2006) Nucleoprotein assemblies for cellular biomarker detection. Nano Lett 6: 1184–1189.
  7. Clark J, Shevchuk T, Swiderski PM, Dabur R, Crocitto LE, et al. (2003) Mobility-shift analysis with microfluidics chips. Biotechniques 35: 548–554.
  8. Dalby B, Cates S, Harris A, Ohki EC, Tilkins ML, et al. (2004) Advanced transfection with Lipofectamine 2000 reagent: primary neurons, siRNA, and high-throughput applications. Methods 33: 95–103.
  9. Shevchuk T, Kretzner L, Munson K, Axume J, Clark J, et al. (2005) Transgene-induced CCWGG methylation does not alter CG methylation patterning in human kidney cells. Nucleic Acids Res 33: 6124–6136.

The Effects of Nicardipine on the Onset Time and Intubating Conditions of Cisatracurium

DOI: 10.31038/JCRM.2019233

Abstract

Purpose: Both Cisatracurium and Rocuronium are intermediate-acting, neuromuscular blocking agents, commonly used worldwide. Nicardipine has been reported to shorten the onset time of Rocuronium. However, the molecular structure of Cisatracurium is different from that of Rocuronium, thus, the aim of this study is to examine the effects of Nicardipine on the onset time and intubating conditions of Cisatracurium.

Methods: Ninety-nine patients were randomized into one of three groups; NSS (C group), Nicardipine 10 mcg/kg (N10 group), and Nicardipine 20 mcg/kg (N20 group). After which, these patients were received the study drugs, according to the group they were assigned as, intravenously before the induction of anesthesia. Train of Four (TOF) ratio or count, blood pressure, pulse rate, laryngoscopic view, grade of intubation, intubating conditions, minimal mean arterial pressure, total propofol, and vasopressors doses were recorded.

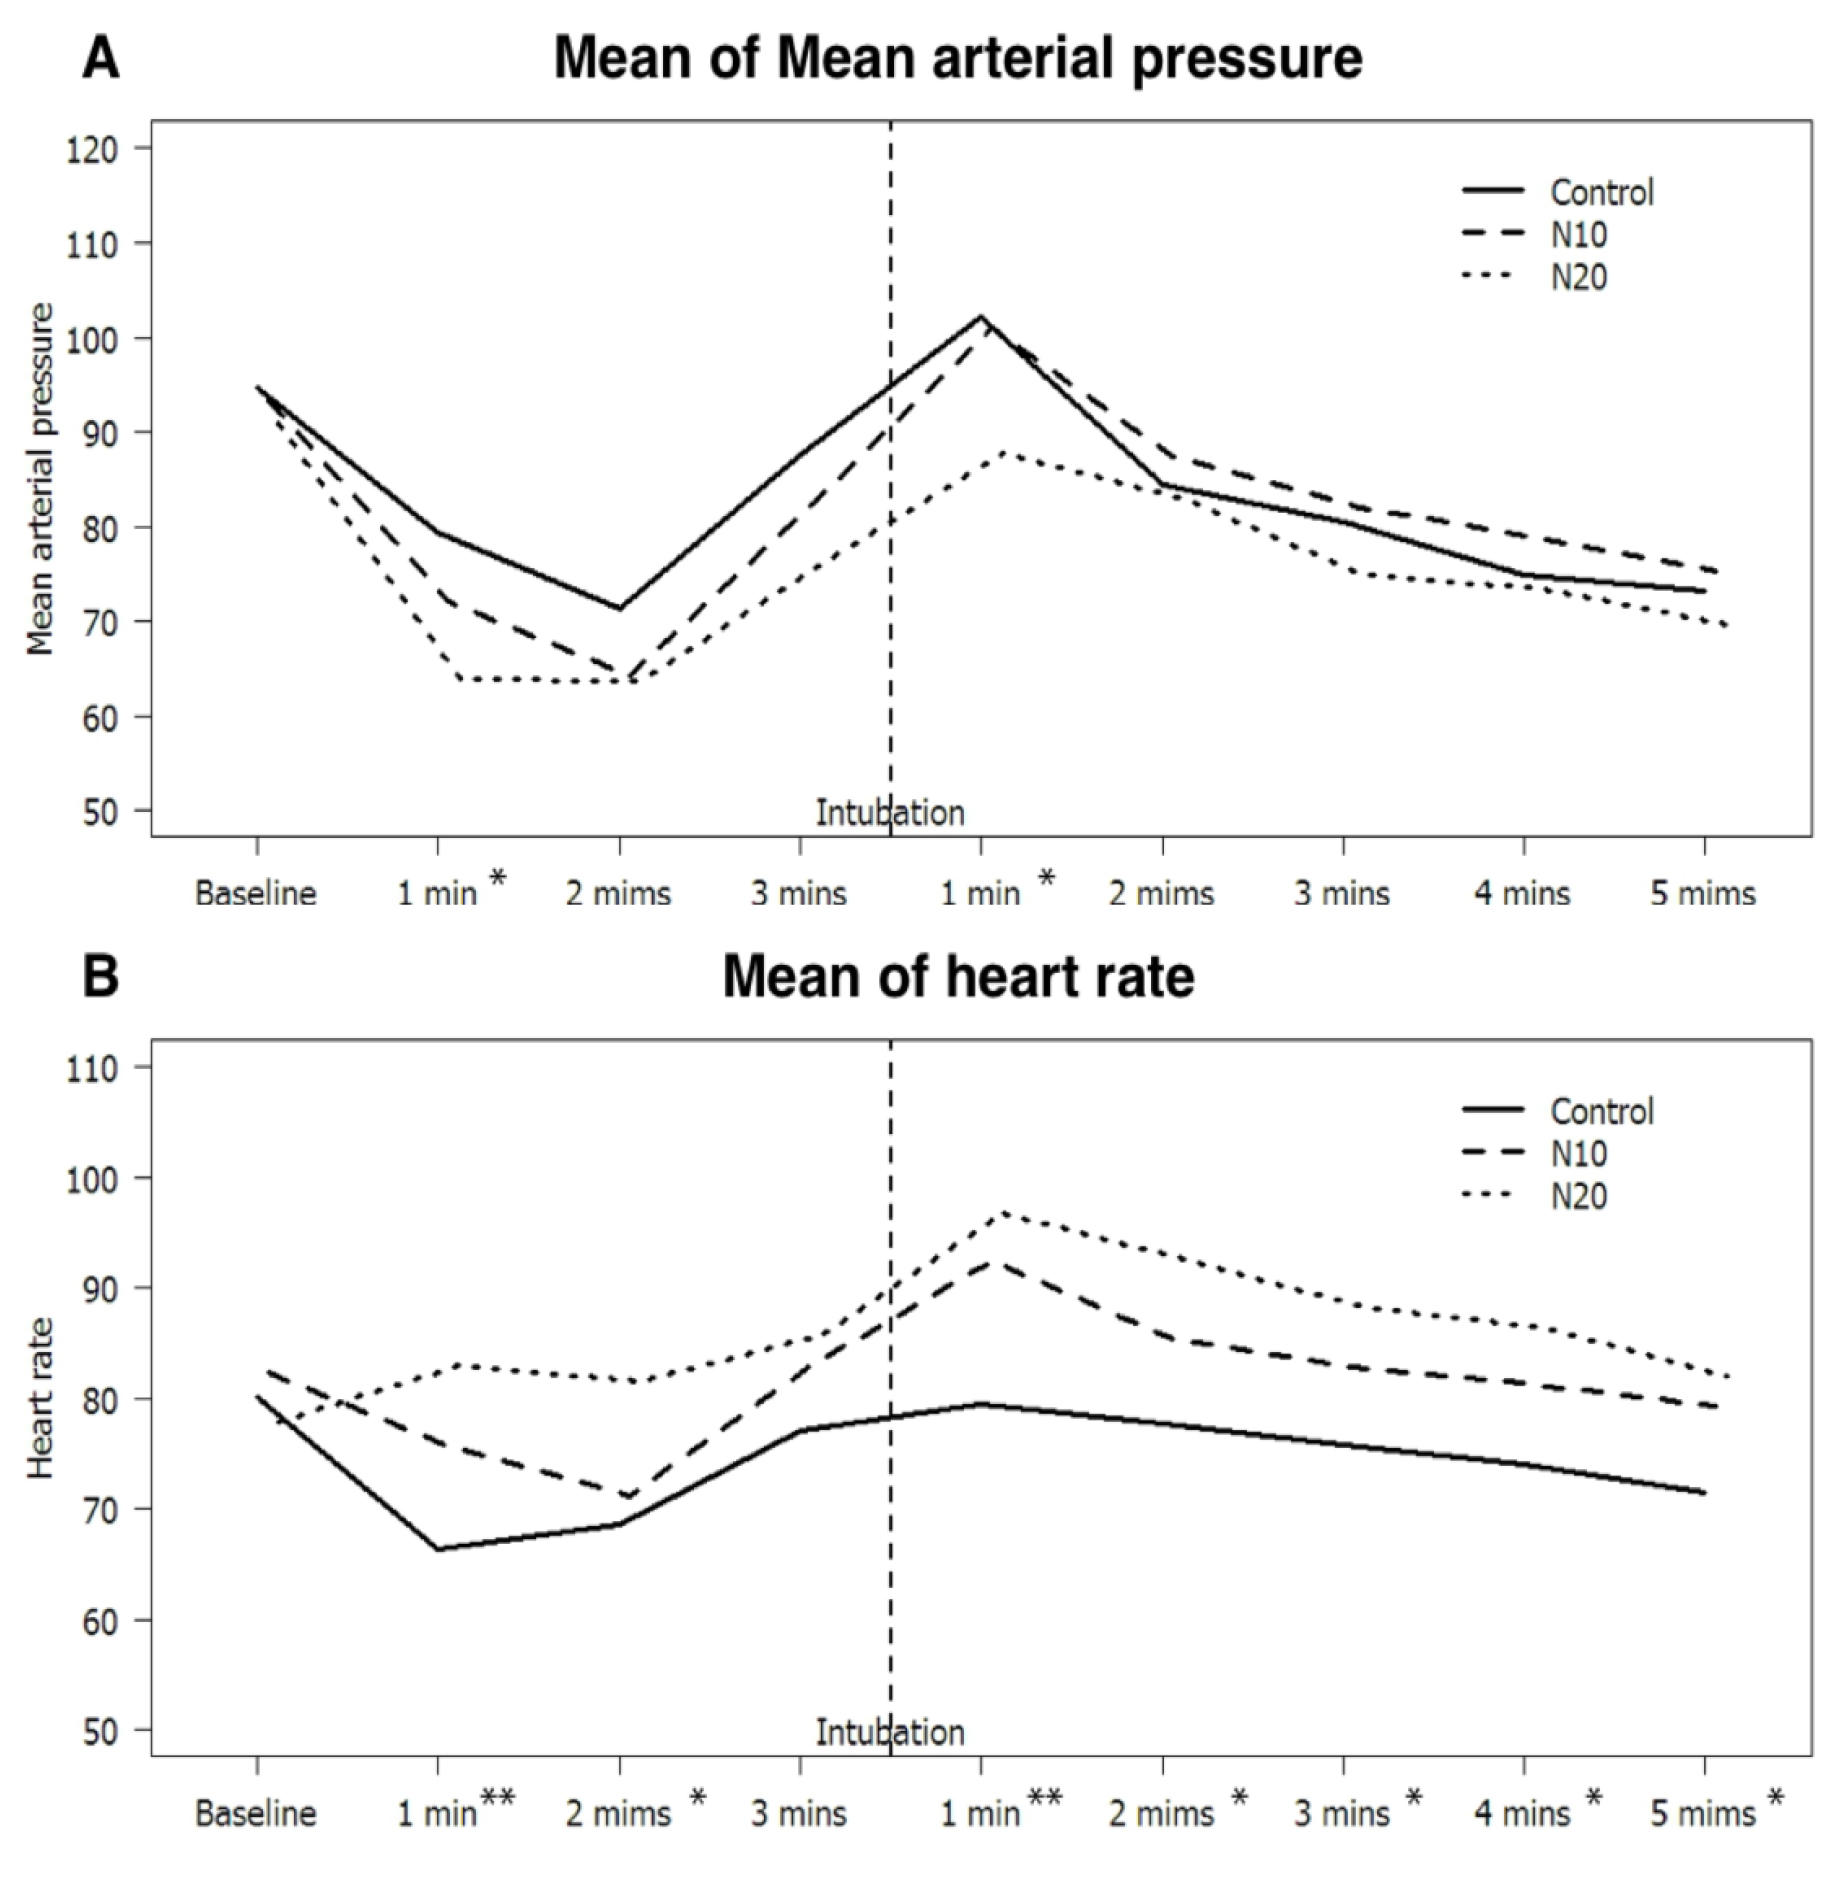
Results: The onset times of Cisatracurium were 420, 420, and 360 seconds in the C, N10, and N20 groups respectively, with a p-value of 0.636, while, intubating conditions were acceptable in 93.8, 96.8 and 100% respectively with a p-value of 0.771. Heart rates were higher in the N10 and N20 groups than that of those in the C group. Additionally, mean arterial pressures were lower in N20 group than both N10 and C groups, which were comparatively the same. Total propofol, ephedrine and atropine doses were similar within all groups.

Conclusions: The use of Nicardipine neither reduces the onset time, nor improves intubating conditions of Cisatracurium. However, Nicardipine, probably, attenuates a hypertensive response after intubation.

Keywords

Cisatracurium, Nicardipine, Onset time, Intubation, Intubating condition

Introduction

Both cisatracurium and rocuronium are intermediate-acting, neuromuscular blocking agents, commonly used worldwide. Cisatracurium has a unique elimination property, with no histamine release, however, it has slow onset time. Several techniques have been reported to shorten the onset time of cisatracurium such as high dose cisatracurium [1], cisatracurium priming [2], rocuronium priming [3,4], ephedrine [5], and ketamine [6]. These techniques were associated with their own limitations such as prolonged duration [1-4], or the need to use combination drugs [5,6].

Multiple in-vitro and animal studies showed that calcium channel blockers potentiated non-depolarizing neuromuscular block, possibly by blocking L-type calcium channel or altering presynaptic calcium or altering acetylcholine release or postjunctional interaction [7-9]. Nicardipine has been shown to reduce the onset time of rocuronium [10], and improve hemodynamic stability after intubation [11]. However, the structure of cisatracurium differs from rocuronium. Thus, the aim of this study is to examine the effects of nicardipine on the onset time, and intubating conditions of cisatracurium.

Methods

After the approval from Office of Human Research Ethics Committee, faculty of medicine, Prince of Songkla University (REC 59-402-08-1) and study had been approved for registration at Thai Clinical Trial Registry (TCTR2017328002). This study was conducted at the operating theater of Songklanagarind Hospital, Thailand, from April 2017 to September 2017. Subjects were chosen from the elective schedule of the operations which required general anesthesia with oroendotracheal tube. The eligible patients were 18-65 years old, had ASA physical status 1 or 2, and normal blood pressure. The exclusion criteria were patients with cardiac diseases, history of allergy to nicardipine or cisatracurium, history of malignant hyperthermia or neuromuscular diseases, pregnant or morbidly obese (BMI ≥ 35 kg/m2) patients, and patients who could not communicate.

The informed consent was obtained by the research team. All patients were received pre-medication as appropriate. The patients were then randomized into 3 groups: control group (C group), nicardipine 10 mcg/kg (N10 group), and nicardipine 20 mcg/kg (N20 group). The study drugs were prepared by the research team, not involving in the patient care. The solution of the control group was normal saline (NSS) 10 mL, while the solution of the other two groups were calculated nicardipine based on the patients’ actual body weight, diluted with NSS to the total volume of 10 mL. The diluted mixture had clear color, similar to NSS. The patients were randomized by block-of-six randomization. Upon arriving at the operating theater, pulse oximetry, noninvasive blood pressure, 3-lead electrocardiograms, and nerve stimulator (TOF-Watch SX®, Organon, Ireland) were monitored. The site of the nerve stimulator was at the adductor pollicis muscle.

A bolus of 7 mL/kg of isotonic crystalloid were given to all patients, while they were being pre-oxygenated with 100% oxygen for 5 minutes. Then, the patients were received the study drugs according to their groups. After one minute, the patient was induced with fentanyl 1.5 mcg/kg, propofol 2 mg/kg intravenously. Additional propofol could be added by the attending anesthesiologist, if the depth of anesthesia was inadequate. When the patients lost their consciousness, manual face-mask ventilation was performed, three breaths of end tidal Carbon dioxide were identified as adequate ventilation, at this moment cisatracurium 0.15 mg/kg was injected intravascularly.

During the induction, the vital signs were recorded at 1 minute interval until five minutes after intubation. The Train of Four (TOF) ratio or counts were recorded after cisatracurium injection every 15 seconds twice then every 30 seconds until 3 minutes after cisatracurium injection. The intubation commenced when TOF count = 0 or at 3 minutes after cisatracurium injection if TOF count was still present. If the intubation happened before TOF count = 0, additional TOF ratio would be recorded at 1-minute interval until 6 minutes after the intubation. The intubation was performed by anesthesia providers with at least a year of experience in anesthesia service, using a Macintosh size 3 laryngoscopic blade, and an appropriate size of endotracheal tube. After the intubation, anesthesia was maintained with sevoflurane in a gas mixture of air and oxygen, and fentanyl or morphine with target of end tidal sevoflurane of 1 MAC age-adjusted value.

Hypotension, defined as Mean Arterial Pressure (MAP) <20% of baseline for 60 seconds, was treated with norepinephrine 5-10 mcg or ephedrine 3-6 mg intravenous bolus. Bradycardia, defined as heart rate <50 bpm for 60 seconds, was treated with atropine 0.3-0.6 mg intravenous bolus. Total propofol, ephedrine, norepinephrine, and atropine doses within 30 minutes were recorded. Also, minimum blood pressure within 30 minutes after cisatracurium injection was recorded.

Laryngoscopic view was graded using Cormack-Lehane classification, while intubating condition was graded as excellent, good or poor [12] (Table 1). Excellent and good intubating conditions were classified as clinically acceptable, while poor intubating condition was clinically unacceptable.

Table 1. Evaluation of intubating conditions

Variable assessed

Clinically acceptable

Not clinically acceptable

Excellent

Good

Poor

Laryngoscopy

Easy

Fair

Difficult

Vocal cords position

Abducted

Intermediate/

moving

Closed

Reaction to insertion of the tracheal tube and cuff inflation

(Diaphragmatic movement/

coughing)

None

Slight

Vigorous/sustained

The primary outcome of this study was the onset time of cisatracurium, which was defined as a duration since cisatracurium injection until the TOF count = 0. Secondary outcomes were intubation grades, intubating conditions, and hemodynamic value after intubation.

The sample size was calculated by two independent means, two-tailed test, formula; based on previous data [10]. Those authors reported that nicardipine 20 mcg/kg could shorten the onset of rocuronium from 204 seconds to 141.2 seconds. Alpha error was 0.05, whilst ß error was 0.2. The calculated sample size per group was 30, after adding 10% dropout the final sample size was 33 subjects per group. Since the study of the 10 mcg/kg of nicardipine group was not available, similar sample size was inferred. Data was analyzed by repeated measured analysis, performed by R language, version 2.13.0. Categorical variables were compared by Chi-square or Fisher’s exact test, whilst continuous variables were compared by ANOVA F-test, or Kruskal Wallis test. A p-value of less than 0.05 was considered statistically significant.

Results

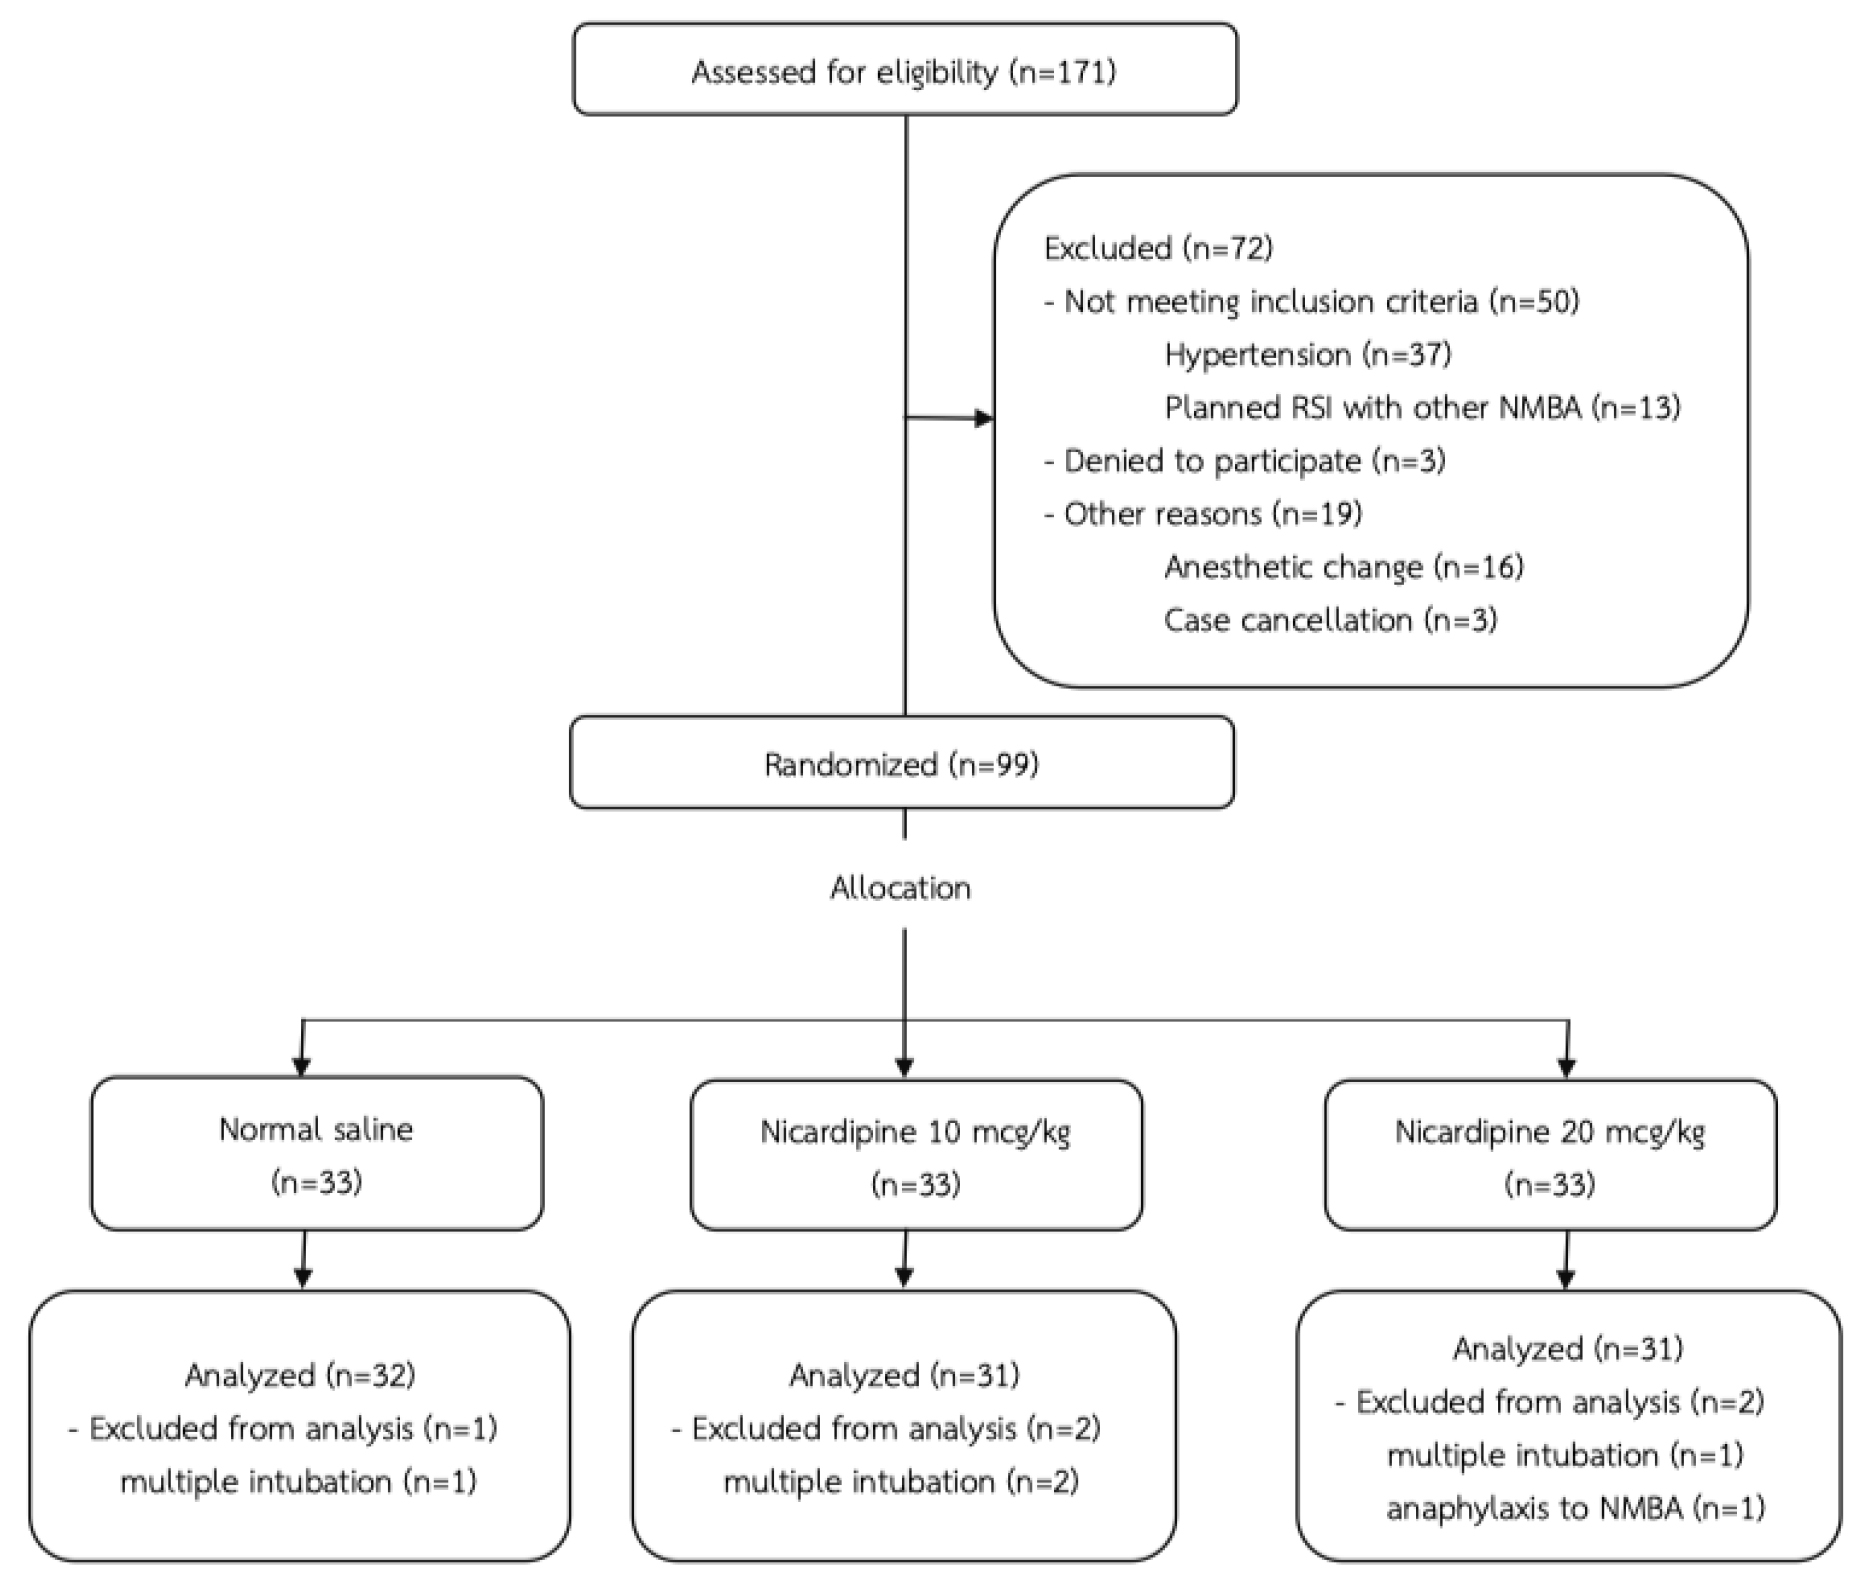
Ninety-nine patients were enrolled in this study. The drop-out rates and reasons are shown in Figure 1. A patient in the N20 group, was excluded from the study due to the clinical suspicion of anaphylaxis including hypotension, rash and wheezing. Later, she was confirmed to be allergic to cisatracurium by skin prick test. Other patients’ exclusion was due to multiple intubation attempts. Patients’ characteristics were similar among three groups, except that there were more male patients in the N10 group (Table 2).

Table 2. Patients characteristics

C
(n=32)

N10
(n=31)

N20
(n=31)

p-value

Sex

0.032

Male

5 (15.6%)

14 (45.2%)

8 (25.8%)

Female

27 (84.4%)

17 (54.8%)

23 (74.2%)

Agea

46.3 ± 11.9

45.7 ± 12.2

41.5 ± 11.2

0.211

Body weighta (kg)

59.6 ± 10

59.7 ± 19.8

60.5 ± 7.1

0.922

Heighta (cm)

158.7 ± 6.3

159.7 ± 7.8

160.5 ± 7.9

0.558

BMIa (kg/m2)

23.6 ± 3.5

23.6 ± 3.6

23.5 ± 2.9

0.988

ASA classification

0.520

1

9 (28.1%)

5 (16.1%)

7 (22.6%)

2

23 (71.9%)

26 (83.9%)

24 (77.4%)

Intubator experienceb (years)

3 (2,5)

3 (2.5,5)

3 (2.5,5)

0.961

Operation type

0.582

General surgery

6 (18.8%)

10 (32.3%)

5 (16.1%)

Otolaryngologic surgery

5 (15.6%)

9 (29%)

5 (19.4%)

Urologic surgery

1 (3.1%)

1 (3.2%)

3 (9.7%)

Plastic surgery

1 (3.1%)

0 (0%)

2 (6.5%)

Gynecologic surgery

12 (37.5%)

8 (25.8%)

11 (35.5%)

Orthopedic surgery

3 (9.4%)

0 (0%)

1 (3.2%)

Eye surgery

4 (12.5%)

3 (9.7%)

3 (9.7%)

Data are presented as frequency (percentage) format unless stated otherwise.
a Data are presented as mean ± Standard Deviation
b Data are presented as median (Interquartile range)

JCRM 2019-111 - Pornwicha Chumak Thailand_F1

Figure 1. CONSORT flow diagram

RSI = Rapid Sequence Induction, NMBA = Neuromuscular Blocking Agent

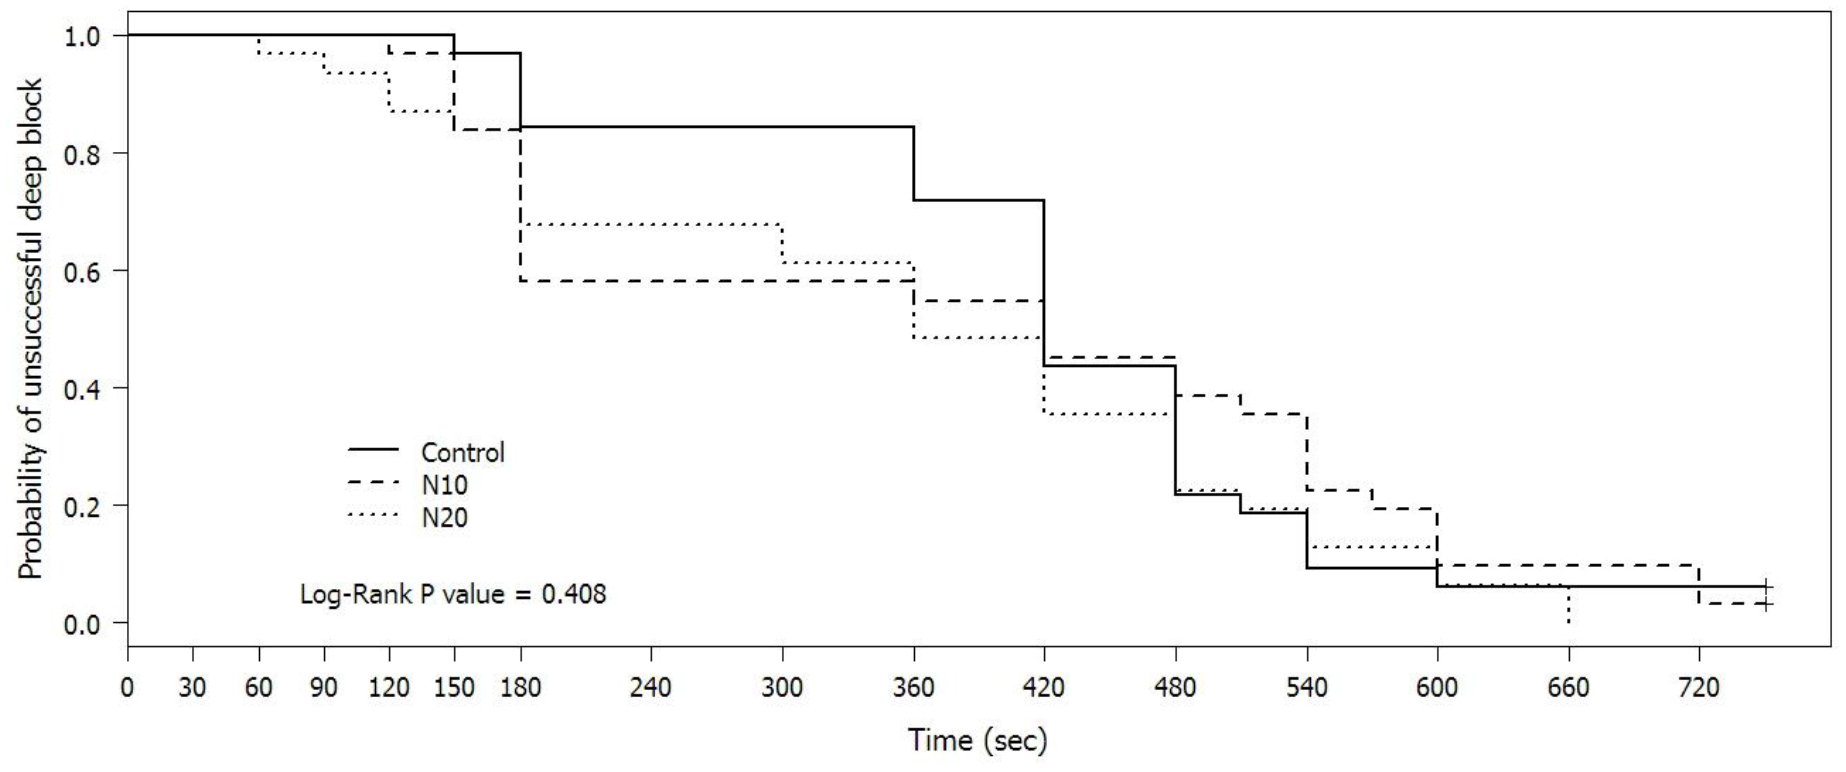
Although, the onset time was shortest in the N20 group, the onset times were not statistically different among the three groups. Interestingly, within 5 minutes after cisatracurium injection, the probability that the TOF would be zero were 18.6%, 41.9%, and 38.7% in the C, N10, and N20 groups respectively with a p-value of 0.0498. By comparing the N10 and C groups, the p-value was 0.042, while comparing the N20 and C groups, the p-value was 0.075 (Figure 2). Intubating conditions were improved in the N10 and N20 groups, however, with no statistically significance. Laryngoscopic views were also similar among three groups. Only two patients received atropine 0.3 and 0.6 mg in the N20 group. While one patient received norepinephrine 10 mcg in both N10 and N20 groups. Also, propofol doses were comparable (Table 3).

Table 3. Comparisons of outcomes

C
(n=32)

N10
(n=31)

N20
(n=31)

p-value

Onset timeb (seconds)

420 (360,480)

420 (180,540)

360 (180,480)

0.636

Laryngoscopic view

0.918

Grade 1

18 (56.2%)

18 (58.1%)

20 (64.5%)

Grade 2

12 (37.5%)

11 (35.5%)

9 (29%)

Grade 3

1 (3.1%)

2 (6.5%)

2 (6.5%)

Grade 4

1 (3.1%)

0 (0%)

0 (0%)

Intubation grade

0.112

Excellent

19 (59.4%)

26 (83.9%)

25 (80.6%)

Good

11 (34.4%)

4 (12.9%)

6 (19.4%)

Poor

2 (6.2%)

1 (3.2%)

0 (0%)

Intubating condition

0.771

Clinically acceptable

30 (93.8%)

30 (96.8%)

31 (100%)

Not clinically acceptable

2 (6.2%)

1 (3.2%)

0 (0%)

Total propofol doseb (mg)

150 (130,185)

150 (126,160)

150 (130,190)

0.683

Total ephedrine doseb (mg)

0 (0,0)

0 (0,6)

0 (0,3)

0.587

Lowest MAPa* (mmHg)

64.2 ± 11.2

64 ± 10.9

61.5 ± 12.6

0.596

Data are presented as frequency (percentage) format unless stated otherwise.
MAP = Mean Arterial Pressure
* Lowest MAP stated here is the lowest MAP within 30 minutes after the study drug injection
a Data are presented as mean ± Standard Deviation
b Data are presented as median (Interquartile range)

JCRM 2019-111 - Pornwicha Chumak Thailand_F2

Figure 2. Probability of unsuccessful deep block

defining as TOF count > 0 after cisatracurium injection

JCRM 2019-111 - Pornwicha Chumak Thailand_F3

Figure 3. (A) Mean Arterial Pressure, (B) and heart rate since after induction Changes in (A) Mean Arterial Pressure, (B) and heart rate since after induction until 5 minutes after intubation, the numbers before the intubation are the duration after injection of study drugs, while the numbers after the intubation are the duration after intubation.

* p-value <0.05 when compared group N20 vs C
** p-value <0.05 when compared group N20 vs C and group N10 vs C

Blood pressures, heart rates after induction were shown in Figure 3. Mean Arterial Pressure (MAP) at baseline were 94.8, 93.4, and 90.9 mmHg in the C, N10, and N20 groups, respectively, while baseline heart rate (HR) were 80.1, 82.5, and 77.9, respectively. Mean MAP in the N20 group was significantly lower at 1 minute after induction and at 1 minute after intubation than those in the C group, which were 63.8, and 87.7 mmHg versus 79.5, and 102.1 mmHg respectively (p-value <0.001, and 0.014).

For heart rate comparison, between the N20 and C groups, the heart rates were significantly greater except at 3 minutes after induction (p-value <0.05). While, the heart rates in the N10 group were faster than those in the C group only at 1 minute after induction and 1 minute after intubation, which were 75.7, and 92.5 versus 66.4, and 79.5 beats per minute (p-value < 0.05).

Discussion

Overall, our results show that nicardipine could not significantly shorten the onset time of cisatracurium, whereas previous data reported that nicardipine 20 mcg/kg administered at 1 minute before induction could shorten the onset time of rocuronium [10, 13]. Surprisingly, when considering only within 5 minutes after cisatracurium injection, nicardipine at the dose of 10 mcg/kg improved the probability of successful deep block. We proposed 2 possible explanations. First, we had not chosen the optimal dose to produce the neuromuscular blockade potentiation. Second, nicardipine may only work with the aminosteroidal structure, but not the benzyl-isoquinolinium structure of cisatracurium.

Baseline patients’ characteristics were similar among the three groups, except for the gender in the N10 group. There were slightly more male patients in the N10 group. Despite this imbalance, the results seemed not to be affected. Adamus M and colleagues demonstrated that gender did not affect either onset or duration of cisatracurium [14].

Regarding the intubating conditions, our results showed that clinically acceptable intubating conditions in the N20 group were slightly better than other groups. Additionally, more subjects achieved excellent intubation grades in both the N10 and N20 groups. Unfortunately, these effects did not reach the statistically significance threshold. Our results support previous findings in the literature by Lee JH and colleagues, when they used lidocaine 1 mg/kg in their study [13]. In contrast, Lee SY and colleagues found that nicardipine improved intubating conditions of rocuronium [10]. It should be noted that they did not use either fentanyl or lidocaine in their study. Thus, from these results, it seemed that nicardipine provided no added benefit in improving intubating conditions, when either fentanyl or lidocaine were used.

Nicardipine at the dose of 20 mcg/kg in our study decreased MAP after intubation, with concomitant tachycardia, in contrast, the dose of 10 mcg/kg failed to produce the same effect. This result was consistent with the previous reports [10, 11, 13, 15-17]. It should be noted that the patterns of blood pressure changes were similar in every group. From these results, it seemed that nicardipine at the dose of 20 mcg/kg had attenuated the hypertensive response after intubation, however it produced a tachycardia response instead.

Our study has several strengths, the two different doses of nicardipine were used to investigate their effects. Also, our actual sample size is adequate even after the dropout. Finally, our study was a double-blinded randomized controlled study, and the study drugs were carefully prepared so the color of the drugs cannot be visually distinguished.

One downside regarding our methodology is that the anesthesia personnels who intubated the patients, consisted of anesthesiologists, anesthesia residents, and nurse anesthetists. The different level of experiences may affect the laryngoscopy difficulty, even the working experience years were similar in all groups. Furthermore, our study consists of only ASA physical status 1 and 2 patients only, so the results should not be generalized to patients with cardiovascular diseases. Finally, we choose to monitor TOF response at the adductor pollicis muscles to follow the guideline [12]. Although the onset of the neuromuscular blockade would be faster if we choose the orbicularis oculi muscles [18], the intubating conditions in our study would be different [19]. Thus, our absolute value of the onset time of cisatracurium need to be interpreted with caution.

In conclusion, nicardipine at the dose of 10, and 20 mcg/kg can neither shorten the onset time of cisatracurium nor improve intubating conditions of cisatracurium, although the dose of 20 mcg/kg may attenuate hypertensive response after intubation. Higher probability of successful deep block within 5 minutes by nicardipine at the dose of 10 mcg/kg is an interesting issue for future research.

Acknowledgements: First and foremost the authors would like to express our sincere gratitude to all of our colleagues for their cooperation. This study could not have been successfully completed without their kind support, especially Nannapat Pruphetkaew who helped us calculate the sample size.

Conflict of Interest Statement: This research did not receive any specific grant from funding agencies in the public, commercial, or not-for-profit sectors.

References

  1. Lighthall GK, Jamieson MA, Katolik J, Brock-Utne JG. (1999) A Comparison of the Onset and Clinical Duration of High Doses of Cisatracurium and Rocuronium. J Clin Anesth. 11: 220-5. [Crossref]
  2. Deepika K, Kenaan CA, Bikhazi GB, Martineau DB. (1999) Influence of the Priming Technique on Pharmacodynamics and Intubating Conditions of Cisatracurium. J Clin Anesth. 11: 572-5. [Crossref]
  3. Mak PH, Irwin MG. (2004) The effect of cisatracurium and rocuronium on cisatracurium precurarization and the priming principle. J Clin Anesth. 16: 83-7. [Crossref]
  4. Lin SP, Chang KY, Chen YJ, Lin SM, Chang WK, Chan KH, et al. (2008) Priming with Rocuronium to Accelerate the Onset Time of Cisatracurium During Intubation. J Chin Med Assoc. 72: 15-9. [Crossref]
  5. Leykin Y, Dalsasso M, Setti T, Pellis T. (2010) The effects of low-dose ephedrine on intubating conditions following low-dose priming with cisatracurium. J Clin Anesth. 22: 425-31. [Crossref]
  6. Ahn BR, Kim SH, Yu BS, Lim KJ, Sun JJ. (2012) The effect of low dose ketamine and priming of cisatracurium on the intubating condition and onset time of cisatracurium. Korean J Anesthesiol. 63: 308-13. [Crossref]
  7. Sekerci S, Tulunay M. (1996) Interactions of calcium channel blockers with non-depolarising muscle relaxants in vitro. Anaesthesia. 51: 140-4. [Crossref]
  8. Anderson KA, Marshall RJ. (1985) Interactions between calcium entry blockers and vecuronium bromide in anaesthetized cats. Br J Anaesth. 57: 775-81. [Crossref]
  9. Bikhazi GB, Leung I, Flores C, Mikati HM, Foldes FF. (1988) Potentiation of neuromuscular blocking agents by calcium channel blockers in rats. Anesth Analg. 67: 1-8. [Crossref]
  10. Lee SY, Kim YH, Ko YK, Park SI, Lee JU, Chung WS, et al. (2016) Effects of nicardipine on the onset time and intubation conditions of rocuronium-induced neuromuscular blockade. J Clin Anesth. 32: 112-8. [Crossref]
  11. Song D, Singh H, White PF, GAdhiali M, Griffin JD, Klein KW. (1997) Optimal Dose of Nicardipine for Maintenance of Hemodynamic Stability After Tracheal Intubation and Skin Incision. Anesth Analg. 85: 1247-51. [Crossref]
  12. Fuchs-Buder T, Claudius C, Skovgaard LT, Eriksson LI, Mirakhur RK, Viby-Mogensen J. (2007) Good clinical research practice in pharmacodynamic studies of neuromuscular blocking agents II: the Stockholm revision. Acta Anaesthesiol Scand. 51: 789-808. [Crossref]
  13. Lee JH, Kim Y, Lee KH, Rim SK, Lee JY, Lee C. (2015) The effects of nicardipine or esmolol on the onset time of rocuronium and intubation conditions during rapid sequence induction: a randomized double-blind trial. J Anesth. 29: 403-8. [Crossref]
  14. Adamus M, Gabrhelik T, Marek O. (2008) Influence of gender on the course of neuromuscular block following a single bolus dose of cisatracurium or rocuronium. Eur J Anaesthesiol. 25: 589-95. [Crossref]
  15. Omote K, Kirita A, Namiki A, Iwasaki H. (1992) Effects of nicardipine on the circulatory responses to tracheal intubation in normotensive and hypertensive patients. Anaesthesia. 47: 24-7. [Crossref]
  16. Wig J, Sharma M, Baichoo N, Agarwal A. (1994) Nicardipine and verapamil attenuate the pressor response to laryngoscopy and intubation. Can J Anaesth. 41: 1185-8. [Crossref]
  17. Mikawa K, Obara H, Kusunoki M. (1990) Effect of nicardipine on the cardiovascular response to tracheal intubation. Br J Anaesth. 64: 240-2. [Crossref]
  18. Donati F, Meistelman C, Plaud B. (1990) Vecuronium neuromuscular blockade at the diaphragm, the orbicularis oculi, and adductor pollicis muscles. Anesthesiology. 73: 870-5. [Crossref]
  19. Lee HJ, Kim KS, Jeong JS, Cheong MA, Shim JC. (2009) Comparison of the adductor pollicis, orbicularis oculi, and corrugator supercilii as indicators of adequacy of muscle relaxation for tracheal intubation. Br J Anaesth. 102: 869-74. [Crossref]

Patient-oriented Biobanking for Cancer Research

DOI: 10.31038/CST.2019434

Commentary

Research studies aimed at advancing cancer prevention, diagnosis, and treatment depend on a number of key resources, including a ready supply of high-quality annotated biospecimens that can be used to test new drugs, assess the validity of prognostic biomarkers, and develop tailor-made therapies. The development of more effective interventions against cancer requires a better understanding of its molecular basis and a more rapid translation of laboratory findings into improved patient care. One of the most precious resources for patient-directed cancer research is the collection of biospecimens that are appropriately stored in a biobank or biorepository. When donated with informed consent, thereby respecting patient confidentiality and privacy, such samples enable examination of the molecular basis of disease in addition to the identification of novel biological targets. In order to achieve essential added value, research data must be correlated to clinic-pathological and survival data. As the area of molecular diagnostics and personalized medicine is rapidly increasing and is central to identifying new targeted therapies for lung cancer patients, the participation of patients in the biobanking process is of important significance. This broad definition therefore includes all collections that are associated with research projects, studies, clinical trials or formal infrastructure projects. Patients and the general public are both key to the success of such initiatives. Patients consent to the use of biological samples on which current and future research is based, and importantly play at key role in relation to influencing public and government opinions. Therefore, one of the essential roles of a biobank is to ensure that people understand how their contributions, together with the development of research excellence, will be of benefit to them and future generations.

Biospecimens are obtained through biobanking which can encompass many steps including patient enrolment and consent, biospecimen collection, processing, annotation, storage, and distribution. The ways in which these are conducted continue to change as research advances and new assays and technologies become available [1]. However, advances in technology have meant that the value of biospecimens, such as frozen tissue, are diminishing, in contrast to access of formalin-fixed and paraffin-embedded cell and tissue blocks in pathology archives which are growing [2]. Pathology archives themselves are becoming a highly valued biobank resource for discovery phase research in addition to other phases. A current and novel theme in translational phase research for example, is the exploration of blood plasma factors such as circulating tumor DNA in gene mutation analysis and targeted therapies [3].

More personalized decisions together with greater access to targeted therapies which are guided by more informative biomarkers, have brought the era of personalised medicine to the forefront of cancer medicine in which biobanks have played, and continue to play, a role in this process [4]. In a study by Castillo-Pelayo et al [5], grants received (2010–2011) by investigators from the Cancer Research Society (CRS), a Canadian organization that funds studies across the spectrum of cancer research were selected. Publications arising from these grants between 2010 and 2014 were analysed and categorized by a number of factors such as research area, the acknowledged source of funding, specific scientific focus and the presence of any data that involved specific indicators. These incorporated human biospecimens, cell lines, animal models, advanced microscopy, flow cell sorters, and next generation sequencing. Publications involving biobanking were classified by biospecimen provenance and the type of biospecimen used. The authors reported that biorepositories that coordinate the activity of biobanking rank amongst the most important of established health research infrastructures as contributors to research publications. Furthermore, the study suggested that biospecimen-derived data was obtained directly from biorepositories in approximately 30% of publications. Of interest, biorepositories that coordinated the use of biobanks, as indicated by the use of human biospecimens, ranked second only to cell culture facilities and had a similar level of importance to the use of animal care facilities when considered relative to these and other better recognized forms of health research infrastructures. The Biobanking and BioMolecular Resources Research Infrastructure-European Research Infrastructure (BBMRI-ERIC) consortium provides fair access to quality-controlled human biological samples and associated biomedical and biomolecular data, thereby enabling the investigation of basic mechanisms underlying diseases such as cancer. Such consortia are indispensable for the development of new biomarkers and drugs.

In the last decade, the importance of biobanks in the field of cancer research has increased with the emergence of big data collection [6]. Maintaining privacy and confidentiality while protecting and conserving personal data are all fundamental duties of a biobank. Impacting on biobanks within Europe is the European General Data Protection Regulation (GDPR) which came into force in May 2018. While this directive aspires to providing a high level of protection to safeguard individuals’ personal data, this in turn has the potential to incur considerable constraints on scientific and clinical research involving biobanks. Some of the more restrictive impositions of local regulations in specific European countries are the issues surrounding re-consenting, which in the long term, could pose a serious threat to health research progression and subsequent treatments for patients affected by a wide variety of health conditions such as cancer [7].

If human biospecimens are as commonly used and important to the generation of data in translational cancer research as are animal models and cell lines, one would envisage biobanking to be governed in such a way that facilitates improved access, utilization, standardization and quality of samples while biorepositories should become a central component of the health research infrastructure across all medical and research institutions.

References

  1. Cole A, Cheah S, Dee S, Hughes S, Watson PH. Biospecimen use correlates with emerging techniques in cancer research: Impact on planning future biobanks. Biopreserv Biobank 2012; 10: 518–525.
  2. Gaffney EF, Riegman PH, Grizzle WE, Watson PH. Factors that drive the increasing use of FFPE tissue in basic and translational cancer research. Biotech Histochem 2018; 93: 373–386.
  3. Wan JCM, Massie C, Garcia-Corbacho J, Mouliere F, Brenton JD, Caldas C, Pacey S, Baird R, Rosenfeld N. Liquid biopsies come of age: Towards implementation of circulating tumour DNA. Nat Rev Cancer 2017; 17: 223–238.
  4. Rush A, Matzke L, Cooper S, Gedye C, Byrne JA, Watson PH. Research Perspective on Utilizing and Valuing Tumor Biobanks. Biopreserv Biobank. 2018; 1–11.
  5. Castillo-Pelayo T, Babinszky S, LeBlanc J, Watson PH. The importance of biobanking in cancer research. Biopreserv Biobank. 2015; 13: 172–177.
  6. Hofman P, Dagher G, Laurent-Puig P, Marquette CH, Barlesi F, Bibeau F, Clément B. Tumor banks and complex data management: Current and future challenges. Ann Pathol. 2019; 39(2): 137–143.
  7. Clarke N, Vale G, Reeves EP, Kirwan M, Smith D, Farrell M, Hurl G, McElvaney NG. GDPR: an impediment to research? Ir J Med Sci. 2019; doi.org/10.1007/s11845-019-01980-2.

Quantitative Imaging Features of Habitats in Soft Tissue Sarcomas are Associated with Treatment Response: A Pilot Study

DOI: 10.31038/CST.2019433

Abstract

Objective: To determine if tumor habitat perfusion and diffusion characteristics are related to treatment response in soft tissue sarcoma patients.

Methods: Eight patients (58.6 ± 10.2 y/o) with soft tissue sarcomas underwent pre-treatment Dynamic Contrast Enhanced- (DCE-) and Diffusion Weighted-MRI and post-treatment resection allowing pathology to determine treatment response. Tumors were manually segmented from T1-weighted post-contrast images. Tumor habitats, classified as well-perfused, hypoxic and necrotic, were determined from DCE-MRI using a pattern recognition technique. Each habitat was characterized with pharmacokinetic parameters, kep and Ktrans, calculated from the DCE-MRI sequence and the apparent diffusion coefficients from the co-registered Diffusion Weighted-MRI. The quantitative imaging features were examined for associations with treatment response. Patients were classified as responders and nonresponders based on histopathology.

Results: Using unsupervised clustering on the imaging features, the patients were divided accurately between responders and nonresponders. Out of all determined features, kep (p = 0.04), Ktrans (p < 0.01), and percent volume (p = 0.02) for well-perfused habitats were significantly lower in nonresponders, whereas volume (p = 0.04) and percent volume (p < 0.01) for necrotic habitats were significantly higher in responders.

Conclusion: Prediction of treatment response in soft tissue sarcoma patients yielded promising results when utilizing differences in Dynamic Contrast Enhanced- and Diffusion Weighted-MRI features between unique tumor habitats.

Keywords

Pattern Recognition; DCE-MRI; DW-MRI; mpMRI; Soft Tissue Sarcoma

Introduction

Soft tissue sarcomas are a rare but diverse form of cancer with over 50 different subtypes [1]. Due to the heterogeneity of sarcomas, patients often require personalized treatment plans involving radiation, chemotherapy, and surgery, but treatment often is ineffective with a five year survival rate of 64% [2]. Methods to evaluate and monitor soft tissue sarcomas are needed to improve management of the disease. Among potential prognostic factors, the amount of necrosis in soft tissue sarcoma tumors has been found to be predictive of local outcome and recurrence based on resected tumor samples [3]. An in vivo technique to identify tumor composition would potentially allow prediction of patient response to treatment. In imaging, the concept of “habitats” was introduced to map tumor heterogeneity and quantify amounts of each different microenvironment [4–6].

Several studies have explored the use of Dynamic Contrast Enhanced-MRI (DCE-MRI) for prediction of treatment response in soft tissue sarcoma patients [7–10]. DCE-MRI measures perfusion by observing the flow of contrast through tissue over time, producing signal-versus-time curves. Pharmacokinetic fitting of signal-versus-time curves in tumor voxels revealed parameters that allowed prediction of treatment response with promising results [7, 9, 10]. Another functional technique, Diffusion Weighted Imaging (DWI), may provide additional predictive parameters. DWI offers a measure of cellularity by observing water diffusion patterns in tissue, producing Apparent Diffusion Coefficient (ADC) values. DWI has never been demonstrated on pre-treatment prediction of response in sarcoma patients but has shown promise in treatment monitoring [11–15]. However, analyses of both DCE-MRI and DWI datasets in these studies are still performed on the whole tumor ROI, considering the tumor as a homogenous region. The presence of heterogeneous habitats could potentially be masked by an analysis averaging over the entire area of the tumor.

Consideration of signal-versus-time curves and ADC values from different tumor habitats would offer additional features for prediction while providing a more accurate depiction of tumor state than grouping curves from different habitats in the same analyses. Using pattern recognition techniques, a method to determine the location and distribution of tumor habitats from DCE-MRI datasets has been previously demonstrated [5]. Well-perfused, hypoxic, and necrotic habitats were determined in pre-clinical prostate and brain tumor models, as well as in clinical sarcoma and prostate datasets. Habitat quantitative features, extracted from DCE-MRI and DWI sequences, could potentially be associated with the treatment outcomes of soft tissue sarcomas through a radiomics approach. Radiomics data have proven capable for building descriptive and predictive models relating image features to outcomes, including in sarcomas [16].

In this paper, we utilize knowledge of the location and volumes of tumor habitats in soft tissue sarcomas to generate habitat-specific features for use in prediction of treatment response. Features include pharmacokinetic parameters from modeling of signal-versus-time curves from DCE-MRI and ADC values. The use of multiple features and features native to individual habitats is explored to provide more accurate prediction that may facilitate effective treatment management for soft tissue sarcoma patients.

Methods

Study Protocol

All procedures performed in studies involving human participants were in accordance with the ethical standards of the institutional and/or national research committee and with the 1964 Helsinki declaration and its later amendments or comparable ethical standards. Eight patients (58.6 ± 10.2 y/o) diagnosed with soft tissue sarcomas were enrolled in an Institutional Review Board-approved study. For this retrospective study, informed consent was waved. DCE- and DWI sequences were acquired for each patient, prior to receiving neoadjuvant chemo/radiation therapy. Pathology was performed upon resection of tumors, revealing percent necrosis of sample by which response was determined and by which results from MRI analysis could be compared. Patients’ clinical information and treatment response are described in Table 1.

Table 1. Patient clinical information and treatment response.

Patient

Response

Age

Gender

Diagnosis

% Necrosis on Path

Treatment

1

y

56

F

Extraskeletal osteosarcoma

99

4 cycles neoadjuvant chemo

2

y

65

F

Pleomorphic fibrosarcoma

100

unplanned excision then got chemo/XRT

3

y

67

F

Myxofibrosarcoma

100

neoadjuvant chemo/XRT

4

y

56

F

Pleomorphic Rhabdomyosarcoma

30

VAI cycle

5

n

67

M

Extraskeletal osteosarcoma

25

history of unplanned excision then Carboplatin/Adriamycin

6

y

67

M

Pleomorphic fibroblastic sarcoma

40

neoadjuvant chemo/XRT then amputation

7

n

53

F

Synovial sarcoma

10

neoadjuvant chemo

8

n

38

M

Fibrosarcoma

10

3 cycles adriamycin/ifos and 2 cycles gem/tax then amputation

MRI Protocol

Imaging parameters for DW and DCE-MRI scans for each patient are listed in detail in Table 2. Briefly, were carried out either on a 3T Skyra or 1.5T Symphony MR Scanner (Siemens, Erlangen, Germany).

Table 2. Patient imaging parameters.

Patient

1

2

3

4

5

6

7

8

MRI

Siemens Trio

Siemens Trio

Siemens Symphony

Siemens Trio

Siemens Trio

Siemens Trio

Siemens Skyra

Siemens Skyra

Field (T)

3

3

1.5

3

3

3

3

3

DCE-MRI

TR/TE (ms)

6.87/3.15

6.87/3.15

5.05/2.4

6.95/3.05

6.85/3.2

6.85/3.2

4.1/1.87

4.1/1.87

Image Cube

192 × 174 × 32

192 × 174 × 40

256 × 256 × 60

192 × 114 × 36

192 × 174 × 28

174 × 192 × 28

384 × 384 × 52

384 × 384 × 52

Voxel Size (mm)

1.35 × 1.35 × 5

1.35 × 1.35 × 5

0.86 × 0.86 × 3.5

1.88 × 1.88 × 5

1.20 × 1.20 × 5

1.20 × 1.20 × 5

0.52 × 0.52 × 5

0.52 × 0.52 × 3.5

Flip Angle (deg)

10

10

10

10

10

10

10

10

Time Between Scans (s)

10

11

40

8

14

8

25

25

Number of Image Sets

32

34

11

25

23

44

13

13

Scan Duration (min)

5.2

6.1

6.7

3.2

5.1

5.7

5

5

Time Before Contrast (min)

~0.5

~0.5

~1.5

~0.5

~0.5

~0.5

~1

~0.5

DW-MRI

TR/TE (ms)

4200/71

4411/71

5800/94

5900/63

4600/85

3500/71

5500/59

6470/84

Image Cube

128 × 128 × 30

128 × 128 × 32

256 × 256 × 40

128 × 78 x50

128 × 128 × 20

128 × 128 × 25

160 × 160 × 30

160 × 160 × 33

Voxel Size (mm)

1.88 × 1.88 × 6

1.88 × 1.88 × 6

0.86 × 0.86 × 7.2

2.81 × 2.81 × 5

1.56 × 1.56 × 5

1.88 × 1.88 × 5

1.38 × 1.38 × 7.2

1.38 × 1.38 × 4

Flip Angle (deg)

180

102

90

180

180

180

180

180

b-value

0, 400

0, 400

0, 450

0, 400

0, 400

0, 400

0, 600

0, 600

Abbreviations: TR = Repetition time; TE = Echo time.

DCE-MRI analysis

Tumor Volumes of Interest (VOIs) for each patient were contoured manually in MIM (MIM, Cleveland, Ohio) by an experienced skeletomuscular radiologist (T.S.). DCE-MRI signal-versus-time curves from VOIs were analyzed using Constrained Non-Negative Matrix Factorization (cNMF), as detailed in previous publications [5, 17], to reveal the distribution of habitats. The method uncovers the main patterns underlying the signal-versus-time curves and the weights of these constituent patterns in each voxel. The number of these patterns, associated with different tumor habitats was set to three to account for well-perfused, hypoxic, and necrotic habitats.

To assign voxels to specific habitats, a threshold of 60% was applied to the cNMF weights, whereby voxels containing a given habitat at a greater fraction than the threshold were assigned to that habitat. For instance, if for a given voxel the fraction of hypoxic, necrotic and well-perfused habitats were 10%, 20% and 70%, the voxel was considered part of the well-perfused habitat. Conversely, if the contribution of the habitats were 30%, 30% and 40%, the voxel was not assigned to any habitat. The signal-versus-time curves for the voxels corresponding to a given habitat were averaged together, producing a representative curve for each habitat. Pharmacokinetic modeling was performed on these representative curves using a Tofts model [18, 19]. Using the synthetic Parker fixed population average Arterial Input Function (AIF) [20] the volume transfer constant between plasma and Extracellular Extravascular Space (EES), Ktrans (related to perfusion and permeability per unit volume of tissue), the fractional volume ve of the EES and kep, the ratio of Ktrans and ve, also known as the efflux rate constant, were quantified. In addition, the volume of each habitat was determined and also divided against the overall tumor volume to obtain percent volume of habitats.

ADC analysis

DCE-MRI and ADC maps were co-registered in MIM. The same tumor VOIs and tumor habitats determined from the DCE-MRI analysis were applied to the ADC. Average ADC values for voxels corresponding to well-perfused, hypoxic, and necrotic habitats were determined.

Prediction of patient response

The association between (i) the imaging features for each habitat: Ktrans, kep, volume, percent from tumor volume, and ADC and (ii) patient response to neoadjuvant therapy was investigated using hierarchical clustering of patient features. Features involving habitats that were not present in a given tumor were set to 0. The final two clusters at the top level of the clustergram were determined to be the groups of patients corresponding to patients predicted to be responders and nonresponders.

Results

Quantitative measures, including habitat-specific Ktrans, kep, volume, percent volume, and mean ADC for well-perfused, hypoxic, and necrotic habitats are listed in Table 3. Three habitats were identified in 7 patients and 2 habitats in one patient. Roughly, similar fractions of necrotic habitats were determined between the present approach and pathology. An example of habitat locations and signal-versus-time curves in a patient is shown in Figure 1. Ktrans showed an increasing trend from necrotic to hypoxic to well-perfused habitats, which generally contained voxels with curves with the highest Ktrans. Similarly, kep showed a decreasing trend from necrotic to hypoxic to well-perfused habitats, which generally contained voxels with curves with the lowest kep. Volume, percent volume, and mean ADC did not have an apparent trend with habitat type.

Table 3. Quantitative measures for patients based on analysis of DCE-MRI data.

Patient

1

2

3

4

5

6

7

8

AUCs

ADC P

1698.80

1068.13

1661.21

1409.64

895.34

1174.13

1228.84

869.90

0.87

ADC H

1799.99

893.60

1699.28

1579.02

1094.47

1373.16

858.20

0.87

ADC N

1981.61

773.29

1803.19

1427.77

824.05

1042.94

1531.73

992.00

0.67

kep P

0.29

0.04

0.23

0.40

0.31

0.33

0.89

1.23

0.87

kep H

0.34

0.07

0.19

0.71

0.48

0.59

0.88

0.60

kep N

0.09

0.41

0.10

0.26

0.13

0.01

0.10

0.50

0.67

Ktrans P

0.05

0.00

0.23

0.04

0.31

0.05

0.49

0.40

1.00

Ktrans H

0.03

0.00

0.19

0.03

0.05

0.16

0.28

0.60

Ktrans N

0.01

0.00

0.10

0.01

0.10

0.01

0.06

0.14

0.87

Tumor Vol

180.94

45.93

215.40

386.74

15.09

362.08

40.37

64.00

0.93

P Vol

18.40

6.86

38.82

46.59

6.24

33.49

8.51

15.91

0.87

H Vol

24.90

5.99

42.23

53.42

91.92

7.32

13.74

0.87

N Vol

137.64

33.74

134.34

286.74

8.85

236.66

11.61

15.44

1.00

P Per

0.10

0.15

0.18

0.12

0.41

0.09

0.21

0.25

1.00

H Per

0.14

0.13

0.20

0.14

0.25

0.18

0.21

0.53

N Per

0.76

0.73

0.62

0.74

0.59

0.65

0.29

0.24

1.00

Abbreviations: P = Well-perfused; H = Hypoxic; N = Necrotic; Vol = Volume; Per = Percent Volume.

CST 2019-114 - Radka Stoyanova USA_F1

Figure 1. (A) Axial DCE-MRI of responding 56 year-old extraskeletal osteosarcoma female patient post-treatment. Well-perfused, hypoxic, and necrotic habitats determined in the patient are overlaid with red, green, and blue respectively. Early enhancing image from DCE-MRI (left) and ADC (right) are shown in inset from left to right. (B) Axial DCE-MRI of nonresponding 53 year-old synovial sarcoma female patient post-treatment. Well-perfused, hypoxic, and necrotic habitats determined in the patient are overlaid with red, green, and blue respectively. Early enhancing image from DCE-MRI (left) and ADC (right) are shown in inset from left to right. (C) Corresponding average signal-versus-time curves for each habitat are shown below for Fig. 1a. (D) Corresponding average signal-versus-time curves for each habitat are shown below for Fig. 1b.

Hierarchical clustering was performed on subject data using the quantitative measures described above (Figure 2). Two clusters were readily apparent, separating responding from non-responding patients. Parameters which were significantly correlated with response after correction for multiple comparison with Tukey’s honest significant difference test were kep well-perfused (p = 0.04), Ktrans well-perfused (p < 0.01), volume necrotic (p = 0.04), percent well-perfused (p = 0.02), and percent necrotic (p < 0.01). The well-perfused habitat’s characteristics: kep, Ktrans, and percent volume were lower in responders whereas volume necrotic and percent necrotic were higher in responders.

CST 2019-114 - Radka Stoyanova USA_F2

Figure 2. Heatmap showing hierachical clustering of 8 patients using quantitative imaging features. Nonresponders, patients 5, 7, and 8, are shown to be in a separate cluster from responders, patients 1, 2, 3, 4, and 6.

Discussion

In this feasibility study, a radiomics approach utilizing perfusion, diffusion and volumetric information from unique tumor habitats was applied to the prediction of treatment response in soft tissue sarcoma patients. Patients from a small sample set were correctly classified into responders and nonresponders, and habitat-related features were identified that had differentiating potential for the two populations. The success of the approach suggests that consideration of tumor heterogeneity is important for treatment prediction and that the state of the tumor may not be accurately represented by analyses of the whole tumor.

This importance of analysis of unique habitats to prognosis has primarily been recognized in breast cancer tumors. DCE-MRI studies of breast cancer have shown tumors with a larger proportion of voxels with fast washin and a steady plateau of washout, corresponding to the shape of curves in well-perfused habitats, are more likely to be malignant [21]. Numerous studies on breast cancer tumors have focused analyses on these ‘hot spots’ in tumors [22–27], determined by looking for contiguous ROIs of high enhancement in DCE-MRI datasets. Similar analyses have been performed on soft tissue sarcoma tumors [9, 28]. However, although ‘hot spot’ methods begin to consider the heterogeneity in tumors, they only focus on well-perfused habitats, whereas identification and analysis of additional tumor habitats can provide additional discriminatory features for treatment prediction as in the present study and offer a broader understanding of circumstances in the tumor. In addition, common problems with analysis of ‘hot spots’ include the selected ROIs are often manually contoured [22–26, 28] although semi-automated [29, 30] and automated methods [27] have been proposed. Manual contours produce significant variability in measurements derived from selected ROIs [30]. Analysis of ‘hot spots’ also often precludes the inclusion of anatomical features as only the highest enhancing voxels are selected, which may not extend to the whole extent of the habitat. The present approach has the benefit of addressing the two issues by automating delineation of tumor habitats, avoiding variability with manual selection of ROIs. The approach also allows detection of habitats at a subpixel resolution [5], leading to more accurate determination of habitat locations and allowing the analysis of both habitat-specific pharmacokinetic and anatomical parameters. Specifically, in sarcoma, a similar pattern recognition approach on DCE-MRI data has been applied with good agreement between determined habitats and histopathology [31].

Significant differences were seen in perfusion, diffusion and volumetric parameters from necrotic and well-perfused habitats between responders and nonresponders. The relation of treatment response with features in necrotic habitats may be expected due to the correlation of response to necrosis in pathological samples [3]. Percent volume and volume of necrosis directly relate to the amount of necrosis in tumors, whereas kep and Ktrans of necrotic habitats may represent how ‘necrotic’ those areas are, with lower values representing greater extent of cell death. Similarly, features associated with well-perfused regions may be expected to correlate with response based on past DCE-MRI findings. As mentioned, in breast cancer tumors, a greater proportion of well-perfused habitats have correlated with a greater chance of malignancy [21]. Since vascularity is necessary for growing tumors, well-perfused habitats would offer a window into the ‘health’ of tumors. In the case of sarcomas, lower kep and Ktrans in well-perfused habitats indicate slower diffusion from vessels into the extracellular space, suggesting a tumor lagging in growth and potentially less active. In the present study, no significant differences in parameters from DW-MRI, namely ADC, were found between responders and responders. Given prior work linking ADC to treatment monitoring in soft tissue sarcoma patients [11–15], the lack of discriminatory ability for ADC was unexpected. A possible explanation may the use of multiple b-values across multiple MR systems in DW-MRI acquisition. Different patients would potentially have datasets with different diffusion weighting and signal-to-noise confounding ADC values between responders and nonresponders. Standardized imaging parameters would allow more definitive assessment of the value of ADC to prediction of treatment response.

The study has several limitations that are typical for such pilot investigations. It is retrospective and includes a small number of patients. The analyzed patients had different types of sarcoma and varying treatment plans and imaging exam parameters. However, despite the heterogeneity in the dataset, results are promising on the limited samples. The nature of the approach provides quantitative measures robust to the variety of cases likely to be seen in sarcoma patients. Both ADC and pharmacokinetic parameters are derived to measure true physiological characteristics of the tumor (diffusion, contrast-to-tissue exchange rates) and thus can be assumed to be relatively independent from the imaging sequences.

The appeal of the proposed approach is the non-invasive way it can identify tumor habitats in vivo. For this purpose, a pattern recognition method was utilized that was previously validated on pre-clinical [5, 32] and clinical data [5]. The method assumed the presence of three habitats in tumors which corresponded well with results seen in the pre-clinical model [5, 32] as well as with literature where three shapes of curves have been observed in tumors [21]. Finally, patients enrolled in the study had heterogeneous presentations of sarcomas, including location, tissue types, and stage of sarcomas. Although differences in the patient population could provide a confounding factor in prediction of treatment response, these differences should serve to negatively impact prediction as prediction would be more difficult on a diverse set of patients.

In conclusion, in this pilot study the feasibility for prediction of treatment response in soft tissue sarcoma patients was demonstrated based on identification and analysis of tumor heterogeneity from mpMRI. Pharmacokinetic and anatomical information extracted from unique tumor habitats provided features that could separate responders and nonresponders, the combination of which provided more discriminatory ability than a single feature. A more extensive study will be needed in the future to validate the performance of this approach. For soft tissue sarcomas which encompass a broad range of tumors, additional information derived from the state and characteristics of tumor habitats may lead to a more accurate prediction of treatment response in patients.

Funding: NEI F30-EY027162 (sponsor had no role in the study design; in the collection, analysis and interpretation of the data; in the writing of the report; and in the decision to submit the paper for publication).

References

  1. In GK, Hu JS, Tseng WW (2017) Treatment of advanced, metastatic soft tissue sarcoma: latest evidence and clinical considerations. Ther Adv Med Oncol 9: 533–550.
  2. Society AC (2017) Cancer facts & figures. 2017.
  3. Eilber FC, Rosen G, Eckardt J, Forscher C, et al. (2001) Treatment-induced pathologic necrosis: a predictor of local recurrence and survival in patients receiving neoadjuvant therapy for high-grade extremity soft tissue sarcomas. J Clin Oncol 19: 3203–3209.
  4. Gatenby RA1, Grove O, Gillies RJ (2013) Quantitative imaging in cancer evolution and ecology. Radiology 269: 8–15. [crossref]
  5. Chang YC, Ackerstaff E, Tschudi Y, Jimenez B, et al. (2017) Delineation of Tumor Habitats based on Dynamic Contrast Enhanced MRI. Sci Rep 7: 9746.
  6. Tschudi Y, Pollack A, Punnen S, Ford JC, et al. (2018) Automatic Detection of Prostate Tumor Habitats using Diffusion MRI. Scientific Reports 8: 16801.
  7. Huang W, Beckett BR, Tudorica A, Meyer JM, Afzal A, et al. (2016) Evaluation of Soft Tissue Sarcoma Response to Preoperative Chemoradiotherapy Using Dynamic Contrast-Enhanced Magnetic Resonance Imaging. Tomography 2: 308–316. [crossref]
  8. Xia W, Yan Z, Gao X (2017) Volume fractions of DCE-MRI parameter as early predictor of histologic response in soft tissue sarcoma: A feasibility study. Eur J Radiol 95: 228–235.
  9. Alic L, van Vliet M, van Dijke CF, Eggermont AM, Veenland JF, et al. (2011) Heterogeneity in DCE-MRI parametric maps: a biomarker for treatment response? Phys Med Biol 56: 1601–1616. [crossref]
  10. Guo J, Reddick WE, Glass JO, Ji Q, et al. (2012) Dynamic contrast-enhanced magnetic resonance imaging as a prognostic factor in predicting event-free and overall survival in pediatric patients with osteosarcoma. Cancer 118: 3776–3785.
  11. Baunin C, Schmidt G, Baumstarck K, Bouvier C, et al. (2012) Value of diffusion-weighted images in differentiating mid-course responders to chemotherapy for osteosarcoma compared to the histological response: preliminary results. Skeletal Radiol 41: 1141–1149.
  12. Oka K, Yakushiji T, Sato H, Hirai T, et al (2010) The value of diffusion-weighted imaging for monitoring the chemotherapeutic response of osteosarcoma: a comparison between average apparent diffusion coefficient and minimum apparent diffusion coefficient. Skeletal Radiol 39: 141–146.
  13. Dudeck O, Zeile M, Pink D, Pech M, et al. (2008) Diffusion-weighted magnetic resonance imaging allows monitoring of anticancer treatment effects in patients with soft-tissue sarcomas. J Magn Reson Imaging 27: 1109–1113.
  14. Hayashida Y, Yakushiji T, Awai K, Katahira K, et al. (2006) Monitoring therapeutic responses of primary bone tumors by diffusion-weighted image: Initial results. Eur Radiol 16: 2637–2643.
  15. Thoeny HC, De Keyzer F, Chen F, Vandecaveye V, et al. (2005) Diffusion-weighted magnetic resonance imaging allows noninvasive in vivo monitoring of the effects of combretastatin a-4 phosphate after repeated administration. Neoplasia 7: 779–787.
  16. Crombé A, Périer C, Kind M, De Senneville BD, et al. (2018) T2 -based MRI Delta-radiomics improve response prediction in soft-tissue sarcomas treated by neoadjuvant chemotherapy. J Magn Reson Imaging. [crossref]
  17. Stoyanova R, Huang K, Sandler K, Cho H, et al. (2012) Mapping Tumor Hypoxia In Vivo Using Pattern Recognition of Dynamic Contrast-enhanced MRI Data. Transl Oncol 5: 437-U114.
  18. Tofts PS (1997) Modeling tracer kinetics in dynamic Gd-DTPA MR imaging. J Magn Reson Imaging 7: 91–101. [crossref]
  19. Tofts PS, Brix G, Buckley DL, Evelhoch JL, et al. (1999) Estimating kinetic parameters from dynamic contrast-enhanced T(1)-weighted MRI of a diffusable tracer: standardized quantities and symbols. J Magn Reson Imaging 10: 223–232.
  20. Parker GJ, Roberts C, Macdonald A, Buonaccorsi GA, et al. (2006) Experimentally-derived functional form for a population-averaged high-temporal-resolution arterial input function for dynamic contrast-enhanced MRI. Magn Reson Med 56: 993–1000.
  21. Kuhl CK, Mielcareck P, Klaschik S, Leutner C, et al. (1999) Dynamic breast MR imaging: are signal intensity time course data useful for differential diagnosis of enhancing lesions? Radiology 211: 101–110.
  22. Dongfeng H, Daqing M, Erhu J (2012) Dynamic breast magnetic resonance imaging: pretreatment prediction of tumor response to neoadjuvant chemotherapy. Clin Breast Cancer 12: 94–101.
  23. Su MY, Cheung YC, Fruehauf JP, Yu H, et al. (2003) Correlation of dynamic contrast enhancement MRI parameters with microvessel density and VEGF for assessment of angiogenesis in breast cancer. J Magn Reson Imaging 18: 467–477.
  24. Pickles MD, Manton DJ, Lowry M, Turnbull LW (2009) Prognostic value of pre-treatment DCE-MRI parameters in predicting disease free and overall survival for breast cancer patients undergoing neoadjuvant chemotherapy. Eur J Radiol 71: 498–505.
  25. Nagashima T, Sakakibara M, Nakamura R, Arai M, et al. (2006) Dynamic enhanced MRI predicts chemosensitivity in breast cancer patients. Eur J Radiol 60: 270–274.
  26. Hayes CP, A.R.; Leach, M.O. (2002) Assessing changes in tumour vascular function using dynamic contrast-enhanced magnetic resonance imaging. NMR Biomed 15: 154–163.
  27. Chen W, Giger ML, Bick U, Newstead GM (2006) Automatic identification and classification of characteristic kinetic curves of breast lesions on DCE-MRI. Med Phys 33: 2878–2887.
  28. van Rijswijk CS, Geirnaerdt MJ, Hogendoorn PC, Peterse JL, et al. (2003) Dynamic contrast-enhanced MR imaging in monitoring response to isolated limb perfusion in high-grade soft tissue sarcoma: initial results. Eur Radiol 13: 1849–1858.
  29. Liney GP, Sreenivas M, Gibbs P, Garcia-Alvarez R, et al. (2006) Breast lesion analysis of shape technique: Semiautomated vs. manual morphological description. Journal of Magnetic Resonance Imaging 23: 493–498.
  30. Mussurakis S, Buckley DL, Horsman A (1997) Dynamic MRI of invasive breast cancer: assessment of three region-of-interest analysis methods. J Comput Assist Tomogr 21: 431–438.
  31. Venianaki M, Salvetti O, de Bree E, Maris T, et al. (2018) Pattern recognition and pharmacokinetic methods on DCE-MRI data for tumor hypoxia mapping in sarcoma. Multimedia Tools and Applications 77: 9417–9439.
  32. Stoyanova R, Huang K, Sandler K, Cho H, et al. (2012) Mapping Tumor Hypoxia In Vivo Using Pattern Recognition of Dynamic Contrast-enhanced MRI Data. Transl Oncol 5: 437–447.

Ovicidal Activity and Repellent of Essential Oils on the Oviposition of Aedes Aegypti and Aedes Albopictus (Diptera: Culicidae)

DOI: 10.31038/IJVB.2019314

Abstract

Background and aims: The evaluation of the insecticidal activity of plants constitutes a novel approach for the development of new natural and bioavailable products for the control of vectors. The objective of this work was to evaluate the ovicidal activity and the repelllency to oviposition of Aedes aegypti and Aedes albopictus  at different breeding sites of six essential oils; Bursera graveolens (Kunth) Triana & Planch, Citrus aurantium L., Eucalyptus globulus Labill, Melaleuca quinquenervia (Cav.) ST Blake, Ocimum basilicum L., Piper aduncum subsp ossanum (C. DC.) Saralegui.

Methods: Two strain of Ae. aegypti (susceptible and one from the field), one strain of Ae. albopictus collected in one municipality of Havana province and six essential oil were used during the study. The ovicidal activity and the repellency for the selection of the oviposition sites of the oils were determined following the methodology described by the literature.

Results: There was low ovicidal activity of all the evaluated oils, on Ae. aegypti and Ae. albopictus. All the essential oils generated repellency to the oviposition in both species, being C. aurantium and P. aduncum subsp ossanum those that showed a total repellence.

Conclusions: With knowledge of the behavior of oviposition of mosquitoes and the mode of action of essential oils from Cuban flora, formulations could be developed to contribute to the ovicidal action and / or to discourage the oviposition of these insects.

Keywords

Mosquitoes, Piper, Citrus, Bursera, Eucalyptus, Ocimum, Melaleuca, chemoreception

Introduction

In the last decade, arboviruses such as, dengue, chikungunya and zika show a tendency to increase their incidence and spread to new geographic areas [1], including the reemergence of yellow fever in several countries of the Americas [2]. One of the causes of the spread of these viruses is attributed to the geographic expansion of Aedes aegypti (Linnaeus, 1762) which is an effective vector of various arboviruses. Its major epidemiological importance is linked to its role as a transmitter of dengue and yellow fever, in addition to Zika [1]. On the other hand Aedes albopictus (Skuse, 1895) is another mosquito of great epidemiological importance. This species has been detected naturally infected with DENV-1 and DENV-2 in Colombia [3–4] and in Ceará, Brazil by DENV-2 and DENV-3 [5], so its participation in the dynamics of transmission of dengue to humans is not it can be discarded. It was also linked to chikungunya outbreaks in Reunion Island, French Republic [6] in 2003 and with outbreaks in 2007 in northern Italy [7] and Spain [8] as a result of the invasion and expansion of this species since the beginning of the 2000s in these countries.

Unfortunately, due to the lack of effective vaccines (except for yellow fever) that allow us to protect the human population, the application of insecticides is the most widely used strategy to reduce the incidence of the rest of arboviruses diseases [9–10].

Despite the availability of chemical formulations and equipment [11], in many geographical areas, the chain of transmission cannot be stopped. Among the elements that propitiate it are; operational factors, the lack of involvement of the community, the resistance of the vectors to available insecticides, among others [12]. The World Health Organization (WHO) motivates the search and implementation of new control alternatives [13], so that the development of new products natural and bioavailable for our country constitutes a novel approach with possible practical applications in Cuba.

Some authors study the insecticidal activity of plants, but there are few studies on the ovicidal activity of plant extracts and essential oils as a form of vector control [14], without discarding the repellent effect that a natural product could cause in the selection of oviposition sites [15].

Due to this, the objective in this work was to evaluate the ovicidal activity of six essential oils on eggs of Ae. aegypti and Ae. albopictus, in addition to the repellency in the selection of oviposition sites by both mosquito species.

Materials and Methods

Biological material used in the research

For the study eggs from the:

  • Rockefeller strain (Ae. aegypti): reference strain susceptible to insecticides, supplied by the Center for Disease Control and Prevention (CDC), San Juan, Puerto Rico, 1996.
  • Marianao population 2013 (Ae. aegypti): collected in larva and pupa stages, in low tank containing temefos, Marianao municipality, Finlay health area, Havana, Cuba, in 2013 during an intensive phase of vector control.
  • Fraga 2012 population (Ae. albopictus): larvae and pupa collected in a surveillance device (larvitrampa) in Juan de Dios Fraga neighborhood, Pulido Humaran health area, La Lisa, Havana, Cuba, 2012.

The plants used in the study were the following:

  • Bursera graveolens (Kunth) Triana & Planch. (Burseraceae) Common name: Sasafrás. It was collected in La Lisa, Havana, 2014. The herborization was taken as reference [16] because it is a sample, from the same source.
  • Citrus aurantium L. (Rutaceae), common name: sweet orange. The oil was obtained industrially in the Combinado Citrícola Victoria de Girón, Jagüey Grande, Matanzas (Lot 13700, year 2016).
  • Eucalyptus globulus Labill (Myrtacaeae) Common name: eucalyptus. It was collected, between the months of November and December of the year 2014 in the IFAL. A representative specimen was herborized and deposited in the Institute of Ecology and Systematics HB 88667.
  • Melaleuca quinquenervia (Cav.) S. T. Blake (Myrtaceae) common name: melaleuca. It was collected in the Laguna del Tesoro, Ciénaga de Zapata, 2011. A representative specimen was herborized and deposited in the Institute of Ecology and Systematics with the identification HB 42678.
  • Ocimum basilicum L. (Lamiacaeae), common name: basil. It was collected, between the months of December of the year 2014 in the IFAL. A representative specimen was herborized and deposited in the National Botanical Garden HFC-087057.
  • Piper aduncum subsp ossanum (C. DC.) Saralegui (Piperaceae) common name: platanillo. It was collected, between the months of September of the year 2013 in the Artemisa province. A representative specimen was herborized and deposited in the National Botanical Garden HFC-87641.

The essential oils of B. graveolens, E. globulus, O. basilicum and P. aduncum subsp ossanum were extracted by hydrodistillation and M. quinquenervia was extracted by steam trawling from the aerial parts. Citrus aurantium, was obtained by expression, from the pericarp of the fruit. The methods used to obtain the oils were governed by the ISO 65–71: 84 standard of the Ministery of Public Health in Cuba [17]. The essential oils were kept at 4°C until the preparation of the solutions for the corresponding bioassays.

The chemical composition of the essential oils was determined by gas chromatography coupled to mass spectrometry (GC-MS), in a gas chromatograph of the series Agilent 6890 with an injector of the type “split splitless” (split ratio 20: 1) coupled with a mass spectrometer of the Agilent 05973 series (both from Agilent Technologies, Palo Alto, CA, USA). The identification of the compounds was carried out through the combined use of the automated databases NBS-NISTASCI and Wiley 275 and the Atlas Registry of Mass Spectra Dat

Determination of the ovicidal activity of essential oil solutions against Ae. aegypti and Ae. albopictus.

The ovicidal activity was determined following the methodology of Prajapathi et al., [18]. Filter paper strips were used that contained an average of 300 oviposited eggs a week previously observed under the stereoscope to confirm the absence of collapse and the presence in appearance of the embryo. The filter paper strips with eggs were exposed to the lethal concentration of the oils that caused 90% mortality of the previously treated individuals from each population (CL90) (Table 1). The eggs were immersed in containers containing 1 mL of each oil solution (those prepared in ethanol) in 99 mL of dechlorinated water for 24 hours. A control was used, which consisted of exposing eggs to 1 mL of ethanol in 99 mL of dechlorinated water. 1 control and three replications were used for oil. Later the strips with eggs were extracted from the medium, placed to dry in a tray at 25oC and the total number of eggs hatched under a stereoscope was counted.

Table 1. Lethal concentrations values CL90 (mg / L) and reliability limits  obtained in previous studies with the Rockefeller strain and the populations Marianao 2013 (Ae. aegypti) and Fraga 2012 (Ae. albopictus).

Essentials Oils

Rockefeller
(Ae. aegypti)

Marianao 2013
(Ae. aegypti)

Fraga 2012
(Ae. albopictus)

Bursera graveolens

27,4
(9,2–33,7)

64,3
(60,1–66,3)

58,5
(46,5–171,3)

Ocimun  basilicum

87,6
(60,7–95,7)

93,3
(63,1–70,1)

27,0
(17,8–30,5)

Melaleuca quinquenervia

59,2
(56,4–62,8)

140
(75,5–155,3)

89,4
(84,3–94,2)

Eucalyptus globulus

81,8
(86,2–92,2)

15,5
(14,7–17,2)

128,7
(108,6–3283)

Piper aduncum subsp. ossanum

63,5
(60,4–75,5)

64,8
(59,8–71,6)

82,3
(76,2–84,3)

Citrus aurantium

19,5
(18,5–21,5)

22,3
(20,4–25,6)

52,5
(39,8–143,1)

For the analysis of the normality of the data the Shapiro Wilk test was used and for the analysis of the data an ANOVA (p <0.05). The Statistica version 7 program was used.

Determination of oviposition repellency in populations of Ae. aegypti and Ae. albopictus before essential oil solutions.

To determine the oviposition repellency before oil solutions, 3 replicas were used for each population and for oil. In each cage, 25 females and 25 males were placed and three containers containing:

  1. 500 mL dechlorinated water,
  2. 500 mL dechlorinated water with 20 second stage larvae to simulate hatchery
  3. Another container containing 1 mL of oil solution in 499 mL of dechlorinated water.

They were given blood feed for 3 hours 2 times a week. A strip of paper was placed on the containers to collect the egg. The paper filter strips with eggs were extracted and placed on a wet surface in trays for 24 hours to allow the proper development of embryogenesis and then put to dry at 25 oC. Subsequently, they were placed in dechlorinated water with 0.1 g of fishmeal to promote hatching. At 24 hours, under a stereoscope, the total number of eggs was recorded as fecundity and the fraction of eggs hatched as fertility. The “Student’s T” test was applied to compare the mean of the eggs laid and hatched for each species (p <0.05), using the statistical package Statistica 7.0

Results

Ovicidal activity of essential oils on Ae. aegypti and Ae. albopictus

When submitting eggs from the populations of Ae. aegypti and Ae. albopictus at CL90, a significant difference was found in the hatching percentage of the controls with respect to those exposed (Figure 1). Although hatching was greater than 50%, no larvae survived the exposed concentrations.

IJVB 2019-106 - María del Carmen Marquetti Cuba_f1

Figure 1. Ovicide activity of essential oils on eggs of the Rockefeller strain and the Marianao 2013 (Ae. aegypti) and Fraga 2012 (Ae. albopictus) populations F (10,30) = 4,27 p = 0,00094. Stocks with a common letter are not significantly different (p> 0.05)

Oviposition repellency of Ae. aegypti and Ae. albopictus before solutions of essential oils.

In the study carried out, significant differences were found regarding oviposition in the solutions of the different essential oils (F =, 06625 p = 1.0000). The populations used preferred egg laying in dechlorinated water and dechlorinated water containing larvae, rather than placing the eggs in solutions of the essential oils (Figure 2). Citrus aurantium and P. aduncum subsp.ossanum provoked total oviposition repellency on the part of the females of both Aedes species. Oviposition in the solutions of the rest of the oils occurred with an increasing trend in B. graveolens, O. basilicum, E. globulus and M. quinquenervia but at very low percentages, mostly less than 8%.

The chromatographic analysis of the samples showed that C. aurantium oil, used in this study, showed a relative abundance of 97.5% for limonene and 1.5% myrcene. For B. graveolens, the compounds with the highest relative abundance (> 1%), limonene (21.8%) and β-elemene (12.5%) were identified. For E. globulus, eucalyptol and p-cymene accounted for 63.1% of the oil, followed by γ terpinene (16.7%), 4-terpineol (6.6%) and thymol (1.4%). In the essence of O. basilicum evaluated, estragole (50.8%), linalool (30.3%) and 1,8-cineol (6.2%) were identified as major components. For M. quinquenervia we identified 1.8 cineol (28.8%),viridiflorol (25.3%), together with α-pinene (8.9%), β-pinene (2.2%), and limonene (13.6%). The oil of P. auncum subsp ossanum highlighted a relative abundance of linalool (32.6%), estragole (43.4%), 1,8 cineol (5.9%)

IJVB 2019-106 - María del Carmen Marquetti Cuba_f2

Figure 2. Oviposition repellency against different oil solutions on eggs of the Rockefeller strain and the Marianao 2013 (Ae. aegypti) and Fraga 2012 (Ae. albopictus) populations used in the study. F (21,184) = 0.66 p = 1.0000. Stocks with a common letter are not significantly different (p> 0.05)

Discussion

Ovicide activity of essential oil solutions on Ae. aegypti and Ae. albopictus

The high percentage of hatching at the dose used showed low ovicidal action of the oils evaluated. With P. aduncum, B. graveolens and E. globulus, no studies were found that allowed us to compare our results. Studies carried out with O. basilicum [20,21] show that this oil inhibited the hatching of Ae. aegypti and Cx. quinquefasciatus to different in 45 and 79% respectively.

Some authors suggest that the mechanism of general action that essential oils possess is given by their lipophilic nature [20]. The components present in the oils interact with cellular lipid membranes, destabilizing their integrity and that of other structures rich in lipopolysaccharide molecules. It has also been proposed the spontaneous formation of molecular complexes that facilitate an increase in cellular permeability favoring the circulation of ions and macromolecules and causing death due to functional failure in the organism [22,23].

The mosquito eggs have an outer membrane called chorion that confers protection to the embryo, which allows, among other functions, the exchange of gases and water with the outside through the aeropils [24,25]. It has been described that the ovicidal compounds can cross this barrier, block the hatching of the egg or interrupt the development of the embryo, and thus the survival of the larva inside the egg [26]. Most of the studies with essential oils evaluating the ovicidal activity, pose the bioactivity found, but not the mechanism by which this effect is provoked [27,28]. However, what was previously raised by other authors about the lipoficity of oils and the interaction with lipid membranes [21] could be related to the mechanism of action.

Studies carried out by Jarial et al. (2001) showed that the non-detachment of the exocorion in the eggs after being exposed to extracts of Allium sativum caused the non-hatching of the embryos [29]. Some authors [30,31] suggest that once the eggs harden, they are waterproofed, so the ovicidal action becomes more difficult as the time of oviposition increases, achieving an inversely proportional relationship between concentration and hatching in young eggs. De Lima Santos et al., (2013) [32] propose the interaction between the lectin of M. oleifera with the chitin present in the oocytes and the chorion of the eggs as an ovicidal mode of action, achieving the dissolution of the embryo in eggs of different times of life and subjected to the ovicide solution for 72 hours.

The doses used in this work, caused a high percentage of hatching of the exposed eggs and caused the subsequent death of the newly hatched larvae. We can infer that the essential oil solutions studied were able to cross the barriers of the chorion, causing the larvae to emerge as a survival mechanism. However, the same condition that led to the emergence was the same medium for which they emerged, which caused the death of first-stage individuals as a secondary effect. Although there are no studies of ovicidal activity with isolated compounds, several authors report activity on mosquito larvae of compounds present in the oils studied. Metabolites such as limonene and 1,8 cineol [34], estragole and linalool [35,36], b-elemeno [37] and p-cimeno [36] manifest insecticidal activity on immature stages of mosquitoes. In depth studies should be done later with lower doses and their effect on embryos.

Oviposition repellency of Ae. aegypti and Ae. albopictus before essential oil solutions

In the case of adult mosquitoes, the capacity for chemo-perception is well established through their tarsals and maxillary palps, which allows them to capture synthetic and natural chemicals at oviposition sites [38–40]. In the present investigation, the oil of C. aurantium, totally inhibited the oviposition by females of Ae. aegypti, however, like the rest of the oils evaluated, did not act as an ovicide. Kassir et al., (1989) [41] suggested that water treated with limonene (the majority compound present in this essence) was unfavorable for the oviposition of Cx. quinquefasciatus females. Similar results were found for Ae. Aegypt I [42].

The oil of P. aduncum subsp. ossanum showed similar results as C. aurantium. The essential oil obtained from P. nigrum, showed a moderate degree of dissociation at oviposition (82%) and P. marginatum, although it showed effectiveness as a larvicide, it did not interfere significantly in the oviposition of Ae. Aegypti [43–44].

Other studies have shown a high dissociation of oviposition with Melaleuca cajeputi (87.9%) on Ae. Aegypti [43]. Warikoo et al., (2011) found a directly proportional relationship between the evaluated concentration of O. basilicum and the effective repellency of Ae. aegypti to oviposit19. Similarly, it was found in studies with the essential oils of Lippia alba ((Mill.) NEBr. Ex Britton & P. Wilson), Corymbia citriodora ((Hook.) KD Hill & L.A.S Johnson) and Cananga odorata ((Lam.) Hook.f. & Thomson) that gravid females of Ae.aegypti showed some repellency to deposit their eggs in the treatments when compared with the controls15.

Studies carried out with the oil of M. quinquenervia produced a repellent and dissociative effect of the minced [45], and yet in our results offered partial repellency in the oviposition vessel. This result coincides with studies with the hexanic extract of leaves of Moringa oleifera Lamarck where they reported repellency to the bite of An. stephensi [46], while other studies [32] found a moderate dissociation to the oviposition of the lectin isolated from this plant against Ae. aegypti.

The variations in the repellent responses can be modulated mainly by the chemical composition of the oils and their major components, in addition to the response to the chemical signals received by the sensory organs that can vary according to the species of mosquito. There are families of plants that show high repellent activity [47] given by compounds such as α-pinene, limonene, citronellol, citronellal, camphor and thymol [48] where the presence of major and minor active compounds can generate additive or synergistic effects within the oils [49–50].

Conclusion

The doses used in this work proved to be effective in the protection of containers that these vectors use for their breeding, since it discourages females from continuing oviposition and in the event that an oviposition occurs in unprotected containers, at the time of application It will be able to favor the hatching of the eggs and eliminate the newly emerged larvae. With knowledge of the behavior of oviposition of mosquitoes and the mode of action of essential oils from Cuban flora, formulations could be developed to contribute to the ovicidal action and / or to discourage the oviposition of these insects.

References

  1. PAHO (2017) Pan American Health Organization / World Health Organization. Zika – Epidemiological Report Cuba. Washington, D.C.: PAHO/WHO; 2017.
  2. OPS Organización Panamericana de la Salud / Organización Mundial de la Salud. Actualización Epidemiológica: Fiebre amarilla,7 de diciembre de 2018, Washington D.C. OPS/OMS. 2018.
  3. Méndez F, Barreto M, Árias JF, Rengifo G, Muñoz J, et al. (2006) Human and mosquito infections by dengue viruses during and after epidemics in a dengue-endemic region of Colombia. Am JTrop Med Hyg 74: 678–683.
  4. Gómez-Palacio A, Suaza-Vasco J, Castaño S (2017) Infección de Aedes albopictus (Skuse, 1894) con el genotipo asiático-americano del virus del dengue serotipo 2 en Medellín y su posible papel como vector del dengue en Colombia. Biomédica 37: 135–142.
  5. Martins VE, Alencar CH, Kamimura MT, de Carvalho Araújo FM, De Simone SG, et al. (2012) Occurrence of natural vertical transmission of dengue-2 and dengue-3 viruses in Aedes aegypti and Aedes albopictus in Fortaleza, Ceará, Brazil. PLoS One 7: 41386.
  6. Pialoux G, Gaüzère BA, Jauréguiberry S, Strobel M (2007) Chikungunya, an epidemic arbovirosis. Lancet Infect Dis 7: 319–327. [crossref]
  7. Seyler T, Rizzo C, Finarelli AC, Po C, Alessio P, et al. (2008) Autochthonous chikungunya virus transmission may have occurred in Bologna, Italy, during the summer 2007 outbreak. Euro Surveill 13 (Suppl 3).
  8. Sánchez-Seco MP, Negredo AI, Puente S, Pinazo MJ, Shuffenecker I, et al. (2009) Diagnóstico microbiológico del virus chikungunya importado en España (2006–2007): detección de casos en viajeros. Enferm Infecc Microbiol Clin 27: 457–461.
  9. WHO Global strategic framework for integrated vector management. WHO, Geneva, Switzerland http://whqlibdoc.who.int/hq/2004/WHO_CDS_CPE _PVC_ 2004_10.pdf
  10. WHO. Global insecticide use for vector-borne disease control 5th ed. WHO/HTM /NTD /VEM/WHOPES/2011.6.
  11. WHO Equipment for vector control specification guidelines, second edition WHO/CDS/NTD/WHOPES/2018.02.
  12. George L, Lenhart A, Toledo J, Lazaro A, et al. (2015) Community-effectiveness of temephos for dengue vector control: a systematic literature review. PLoS Negl Trop Dis 9: e0004006.
  13. WHO (2017) Integrating neglected tropical diseases into global health and development: fourth WHO report on neglected tropical diseases.2017 http://www.who.int/neglected_diseases/en WHO/HTM/NTD/2017.01
  14. Gnankine O, Bassole IHN (2017) Essential oils as an alternative to pyrethroids’resistance against anopheles species complex giles (Diptera: Culicidae). Molecules 22: 1321.
  15. Castillo RM, Stashenko E, Duque JE (2017) Insecticidal and repellent activity of several plant-derived essential oils against Aedes aegypti. J Amer Mosq Control Assoc 33: 25–35.
  16. Monzote L, Hill GM, Cuellar A, Scull R, Setzerb WN (2012) Chemical Composition and Anti-proliferative Properties of Bursera graveolens. Essential Oil Natural Product Communications 7.
  17. ISO International Standarization Organization. ISO 65–71. Spices, condiments and herbs. Determination of volatile oil content. 1984. (Norma ISO).
  18. Prajapathi V, Tripathi AK, Aggarwall KK, Kanuja SP (2005) Insecticidal repellent and oviposition-deterrente activity of selected essential oils against An. stephensi, Ae. aegypti and Cx. quinquefasciatus. Bioresour Technol 96: 1749–57.
  19. Warikoo R, Wahab N, Kumar S (2011) Oviposition-altering and ovicidal potentials of five essential oils against female adults of the dengue vector, Aedes aegypti L Parasitol Res 109: 1125–1131. [crossref]
  20. Valarmathy D, Govindaraj M, Elumalai K (2011) Studies on Ovicidal activity of plant essential oil frommulation against the eggs of important vector mosquitoes, Anopheles stephensi (Liston), Culex quinquefasciatus (Say) and Aedes aegypti (L.) at laboratory condition. Int J Curren Res 6: 378–381.
  21. Lomonaco, D, Santiago, GMP, Ferreira, YS, Arriaga, AMC, et al.  (2009) Study of technical CNSL and its main components as newgreen larvicides. Green Chem 11: 31–33.
  22. Toloza AC, Zygadlo J, Cueto GM (2006) Fumigant and repellent properties of essential oils and component compounds against permethrin resistant Pediculus humanus capitis (Anoplura: Pediculidae) from Argentina. J Med Entomol 43: 889–895.
  23. Isman M, Miresmailli S, Machial C (2011) Commercial opportunities for pesticides based on plant essential oils in agriculture, industry and consumer products. Phytochem Rev 10: 197–204.
  24. Russell BM, Kay BH, Shipton W (2001) Survival of Aedes aegypti (Diptera: Culicidae) eggs in surface and subterranean breeding sites during the Northern Queensland dry season. J Med Entomol 38: 441–445.
  25. Moreira MF, Dos Santos AS, Marotta HR, Mansur JF, Ramos IB, et al. (2007) A chitin-like component in Aedes aegypti eggshells, eggs and ovaries. Insect Biochem Mol Biol 37: 1249–1261. [crossref]
  26. Govindarajan M, Mathivanan T, Elumalai K, Krishnappa K, Anandan A (2011) Ovicidal and repellent activities of botanical extracts against Culex quinquefasciatus, Aedes aegypti and Anopheles stephensi (Diptera: Culicidae). Asian Pacific J Trop Biom 1: 43–48.
  27. Krishnappa K, Elumalai K (2013) Mosquitocidal properties of Basella rubra and Cleome viscosa against Aedes aegypti (Linn.) (Diptera:Culicidae) European Review for Medical and Pharmacological Sciences 17: 1273–1277.
  28. Reegan AP, Gandhi MR, Paulra MG, Ignacimuthu S (2015) Ovicidal and Oviposition deterrent activities of medicinal plant extracts against Aedes aegypti L. and Culex quinquefasciatus Say mosquitoes (Diptera: Culicidae) Osong Public Health Res Perspect 6: 64–69
  29. Jarial MS (2001) Toxic Effect of Garlic Extracts on the Eggs of Aedes aegypti (Diptera: Culicidae): A Scanning Electron Microscopic Study. J Med. Entomol 38: 446–450.
  30. Govindarajan M, Jebanesan A, Pushpanathan T (2008) Larvicidal and ovicidal activity of Cassia fistula Linn. leaf extract against filarial and malarial vector mosquitoes. Parasitol Res 102: 289–292.
  31. Kuppusamy C, Murugan K (2008) Mosquitocidal effect of Euphorbia heterophylla Linn. against the bancroftian filariasis vector, Culex quinquefasciatus Say. (Diptera: Culicidae). Int J Intg Boil 4: 34–39.
  32. De Lima Santos ND, Santana K, Napoleao TH, Novais Santos G, Breitenbach LC, et al. (2013) Oviposition stimulant and ovicidal activities of Moringa oleifera lectin on Aedes aegypti. Plos One 7: 44840.
  33. Santos G, Dutra K, Lira C, Lima B, Napoleão Th, et al. (2014) Effects of Croton rhamnifolioides essential oil on Aedes aegypti oviposition, larval toxicity and trypsin activity. Molecules 19: 16573–16587.
  34. Zahran HEDM, Abd El Galeil SAM (2011) Insecticidal and developmental inhibitory properties of monoterpenes on Cx. pipiens L. (Diptera: Culicidae). J Asia Pacific Entomol 14: 46–51.
  35. Govindarajan M (2010) Chemical composition and larvicidal activity of leaf essential oil from Clausena anisata (Willd.) Hook. f. ex Benth (Rutaceae) against three mosquito species. Asian Pacific Journal of Tropical Medicine 874–877.
  36. Giatropoulos A, Kimbaris A, Michaelakis A, Papachristos D, Polissiou MG, et al. (2018) Chemical composition and assessment of larvicidal and repellent capacity of 14 Lamiaceae essential oils against Aedes albopictus. Parasitol Res 117: 1953–1964.
  37. Govindarajan M, Rajeswary M, Arivoli S (2016) Larvicidal and repellent potential of Zingiber nimmonii (J. Graham) Dalzell (Zingiberaceae) essential oil: An eco-friendly tool against malaria, dengue, and lymphatic filariasis mosquito vectors? Parasitol Res 115: 1807–1816.
  38. Davis EE, Bowen MF (1994) Sensory physiological basis for attraction in mosquitoes. J Am Mosq Control Assoc 10: 316–325.
  39. Olagbemiro TO, Birkett MA, Mordue AJ, Pickett JA (1999) Production of (5-R, 6-S)-6-acetoxy-5-hexadecanolide, the mosquito oviposition pheromone, from the seed oil of the summer cypress plant, Kochia scoparia (Chenopodiaceae). JAgric Food Chem 47: 3411–3415.
  40. Geetha I, Pailey P, Padmanaban V, Balaraman K (2003) Oviposition,response of the mosquito, Culex quinquefasciatus to the secondary metabolite(s) of the fungus, Trichoderma viridae. Mem Inst Oswaldo Cruz 98: 223–26.
  41. Kassir JT, Mohsen ZH, Mehdi NS (1989) Toxic effects of limonene against Culex quinquefasciatus Say larvae and its interference with oviposition. Anz Schidlingskde, Pflanzenschutz, Umweltschutz 62: 19–21.
  42. Araujo FDO, Ribeiro-Paes J, Telles de Deus J, Holanda Cavalcanti SC, de Souza Nunes R, et al. (2016) Larvicidal activity of Syzygium aromaticum (L.) Merr and Citrus sinensis (L.) Osbeck essential oils and their antagonistic effects with temephos in resistant populations of Aedes aegypti. Mem Inst Oswaldo Cruz 111: 443–449.
  43. Tawatsin AA, U Thavara, P Wongsinkongman, J Bansidhi, T Boonruad, et al. (2006) Repellency of essential oils extracted from plants in Thailand against four mosquito vectors (Diptera: Culicidae) and oviposition deterrent effects against Aedes aegypti (Diptera: Culicidae). S Asian J Trop Med Public Health 37: 915–931.
  44. Autran ES, Nevesb IA, da Silva CSB, GKN, Santosa CAG, da Câmarab D, Navarroa MAF (2009) Chemical composition, oviposition deterrent and larvicidal activities against Aedes aegypti of essential oils from Piper marginatum Jacq. (Piperaceae). Biores Techn 100: 2284–2288.
  45. Amer A, Mehlhorn H (.2006 b) Repellency effect of forty-one essential oils against Aedes, Anopheles, and Culex mosquitoes. Parasitol Res 99: 478–490.
  46. Prabhu K, Murugan K, Nareshkumar A, Ramasubramanian N, Bragadeeswaran S (2011) Larvicidal and repellent potential of Moringa oleifera against malarial vector, Anopheles stephensi Liston (Insecta: Diptera: Culicidae). Asian Pacific J Trop Biomed 1: 124–29.
  47. Gillij YG, Gleiser RM, Zygadlo JA (2008) Mosquito repellent activity of essential oils of aromatic plants growing in Argentina. Biores Techn 99: 2507–2515.
  48. Nerio LS, Olivero-Verbel J, Stashenko E (2010) Repellent activity of essential oils: A review. Biores Technol 101: 372–378.
  49. Regnault-Roger C, Vincent C, Arnason JT (2012) Essential oils in insect control: low-risk products in a high-stakes world. Annu Rev Entomol 57: 405–424. [crossref]
  50. Koul O, Singh R, Kaur B, Kanda D (2013) Comparative study on the behavioral response and acute toxicity of some essential oil compounds and their binary mixtures to larvae of Helicoverpa armigera, Spodoptera litura and Chilo partellus. Ind Crops Prod 49: 428–436.

Ultrasound Localization of Intercostal Perforating Vessels Reduces Skin Necrosis Complications from Nipple-Sparing Mastectomy

DOI: 10.31038/JCRM.2019232

Synopsis

Skin necrosis of the nipple-areolar complex (NAC), as a result of ischemia is a well-documented complication of nipple-sparing mastectomy. Ultrasound localization of the intercostal perforating vessels, which are essential to NAC viability, can reduce necrosis complications.

Abstract

Background: Complications of nipple-sparing mastectomy (NSM) are well documented, particularly skin necrosis of the nipple-areolar complex (NAC), as a result of ischemia. The intercostal perforating vessels (IPV) provide a significant proportion of the blood supply to the NAC. We propose that ultrasound (US) localization of the IPV will reduce the incidence and severity of NAC necrosis following NSM.

Methods: 168 mastectomies were performed in 101 patients between Feb. 2015 and Feb. 2017. In Feb. 2016, prospective data was collected in 35 NSM with US localization of the IPV. Rate and severity of skin or NAC necrosis was objectively measured using the skin ischemic necrosis (SKIN) score. Retrospective data and SKIN score were obtained on 52 consecutive historical control NSM from the prior 12 month period.

Results: 20 women underwent 35 NSM with US localization. Preservation of the localized IPV was 100% with significant variability observed in the intercostal space location. Comparison of SKIN scores between the study group and historical controls demonstrated a trend towards fewer and less severe complications with utilization of US localization. Grouping clinically significant complications together for statistical comparison with no or minimal complications did not show statistical significance (p=0.77).

Conclusions: Our prospective study demonstrates that US localization of the IPV can reduce NAC and skin necrosis complications in NSM. Although grouping of the data into clinically meaningful categories did not show evidence of statistical significance, reduced rates of necrosis, as measured by SKIN score, were observed.

Introduction

Complications of nipple-sparing Mastectomy (NSM) are well documented, particularly skin necrosis of the nipple-areolar complex (NAC), as a result of ischemia. NAC necrosis rates are reported in the literature from 20–43% 1 [1–3]. Carlson et al. reported a 28.2% rate of partial nipple necrosis in 71 consecutive NSM [1]. Cho et al. performed an analysis of 85 women undergoing NSM [2].Thirty-six total cases of NAC necrosis occurred at a rate of 43.4% among the patients. A nipple necrosis rate of 20% was reported by Gould et al. in a series of 113 NSM [3].Risk factors for NAC necrosis include: age, smoking, prior radiation therapy (RT), body mass index (BMI), incision location, and cancer versus prophylactic procedure [1–4].

The intercostal perforating vessels (IPV) have been demonstrated to provide a significant proportion of the blood supply to the NAC [4–7]. O’Dey et al. performed a microdissection study to better understand vascular reliability of NAC pedicles on six different arterial sources: the internal mammary artery, the highest thoracic artery, the anterior and posterior intercostal artery branches, the thoracoacromial artery, the superficial thoracic artery, and the lateral thoracic artery [8]. While acknowledging the considerable variability among individuals in arterial development and vascular reliability of the NAC, this study produced findings consistent with others— namely, in most cases the lateral thoracic and internal mammary arteries are the most important suppliers of blood to the NAC. The complexity and variability of NAC vascularity are well-demonstrated in the comprehensive review of anatomical studies by van Deventer and Graewe [9]. They emphasize in their review that an awareness of the vascular anatomy and its variability will be helpful to reduce the risk of NAC necrosis.

To our knowledge, no data has been published on US localization of the vasculature to the NAC to reduce skin necrosis in NSM. A recent report suggested that identification of blood supply to the NAC on preoperative MRI could limit necrosis rates in NSM [10].

Our objective is to reduce the significant rates of NAC necrosis observed in NSM, even in lower risk individuals. We propose that US localization of the IPV will reduce the incidence and severity of NAC necrosis following NSM.

Materials and Methods

Approval for our study was obtained from our local IRB. 168 mastectomies were performed by the author in 101 patients between Feb. 2015 and Feb. 2017. Of these, 90 NSM (54%) were performed in 51 patients. Starting in Feb. 2016, prospective data collection was performed in all women scheduled for NSM and providing consent for the study. US was performed at the beginning of the procedure, with a Sonosite™ US, 5–12 mHz transducer, using the Doppler mode. The IPV were identified by scanning each intercostal space near the sternal border. If an IPV was clearly identified (Figure 1), the skin was marked at that location as an aid to the surgeon during dissection. All incisions were performed in the lateral infra-mammary fold (IMF). Data monitored included: age, smoking history, BMI, prior RT, reconstruction technique, success of localization, location of IPV, and success of preservation of IPV during the procedure. Rate and severity of necrosis of the skin or NAC was objectively measured using the skin ischemic necrosis (SKIN) score [11]. Retrospective data was collected from our dedicated breast cancer database and electronic medical records on 52 consecutive NSM in 29 patients from the prior 12 month period to provide a historical control group. Statistical analysis was performed comparing none or superficial necrosis (SKIN A1 and B2) with major necrosis (SKIN B3, C2, C3, D3) in the historical controls versus the study group using Fisher’s Exact Test.

Results

38 NSM were performed in 22 patients during the study period. Two women (3 NSM) (8%) declined participation in the study, thus, the study group consisted of 20 women undergoing 35 NSM who had US for localization of the IPV. The indication for surgery overall was malignancy in 18 (51%) and prophylaxis in 17 (49%). The control and study groups were well-matched for known risk factors including: age, prior RT, history of smoking (current or >10 pk./yrs.), BMI, reconstruction technique, and indication (Table 1). Localization was successful in 33 (96%), the two failed localizations occurred in the same woman. Preservation of the localized IPV was 100%. We identified significant variability in the location of the primary IPV: nearly equal frequency in the 2nd intercostal space (ICS) (37%) and 3rd ICS (34%); multiple ICS locations in 14.3%, and less commonly, in the 1st ICS (8.6%) (Table 2). These findings are consistent with previously published anatomical studies [5–9]. Complication rates and severity, as measured by SKIN score, are shown in Table 3. Rates of necrosis observed in the control group were consistent with the published literature [1–3]. No NAC or skin necrosis was observed in 63% of the study group compared with 42% of the controls. A SKIN score of B2, representing minimal, uncomplicated superficial necrosis, was observed in 23% of women having US localization versus 38% in the control group. Rates of more significant necrosis (SKIN scores B3, C2, C3, & D3) were found in 14% of the study cases compared with 20% of the controls. The data demonstrates a trend towards fewer and less severe complications in NSM cases utilizing US localization of the IPV. We elected to group more clinically significant complications (SKIN B3, C2, C3, & D3) together for statistical comparison with no or minimal complications (SKIN A1 & B2). The results of this analysis are presented in Table 4. No statistically significant difference was observed in this analysis. (p = 0.77)

Table 1. Risk Factor Matching

Study

Control

Age (average)

45.1

46.0

(standard deviation)

8.0

8.7

Age>65

2

1

BMI (average)

24.4

24.8

(standard deviation)

4.1

5.1

Prior RT

6%

6%

Smoking (Current or >10 pack/years)

14%

13%

Reconstruction Technique

Tissue Expander

83%

83%

Direct Implant

14%

17%

Autologous

3%

0%

Indication

Malignancy

51%

54%

Prophylaxis

49%

46%

Table 2. Ultrasound Localization of Intercostal Perforator Vessel

Localization Success

Yes

33

96%

No

2

4%

Primary ICS Location

3

13

37.1%

2

12

34%

1

3

8.6%

Multiple

5

14.3%

NA

2

5.7%

Table 3. Skin ischemic necrosis (SKIN) score

SKIN Score
n

Study

Control

%

n

%

None or Minor

None (A1)

22

63%

22

42%

B2

8

23%

20

38%

Major

B3

4

11%

6

12%

C2

1

3%

3

2%

C3

0

0%

0

0%

D3

0

0%

1

6%

Table 4. Statistical analysis of none or minor necrosis with major necrosis

None or superficial necrosis (A1 or B2)
Major necrosis (B3, C2, C3, D3)

SKIN Score Category

Total

Use of Ultrasound in the Nipple Sparing Mastectomy?

No

n

42a

10a

52

(Control Group)

%

80.8%

19.2%

100.0%

Yes

n

30a

5a

35

 (Study Cohort)

%

85.7%

14.3%

100.0%

Total
%

n

72

15

87

82.8%

17.2%

100.0%

a denotes subset of SKIN Score Category categories whose column proportions do not differ significantly from each other at the 0.05 level. Fisher’s Exact Test: p = 0.77

Discussion

Previous evidence suggests that skin and NAC necrosis rates are significant in the range of 20–40% [1–3]. Our personal experience with these complications is that many occurrences are superficial and resolve with minimal intervention, however a significant proportion are significant and can have devastating effects. Risk factors are well established for NAC necrosis in NSM [1–4]. We have selected NSM candidates carefully for these risk factors in our practice as evidenced by the younger age, lower incidence of smoking history or prior RT, relatively lower BMI, and use of infra-mammary incisions. Our objective was to monitor our NAC necrosis complications and continually adopt or develop methodologies to reduce these complications.

The importance of the IPV to reducing NAC complications is historically founded in the plastic surgery literature as relates to developing vascular pedicles for aesthetic surgery. The advent of contemporary NSM reintroduced the importance of preservation of the IPV to reduce NAC complications. Recognizing the importance of the IPV and well-documented variability, we developed the US localization procedure to aid in the identification and preservation of these vessels to reduce NAC complications in NSM.

Our study has several limitations. Although we have a prospective design, use of historical controls introduces potential inaccuracies related to retrospective data collection. We did not control for several different plastic surgeons and the potential for variability in their technique including fill volume of tissue expanders. We did not examine cost effectiveness of our technique. However, we believe that reducing NAC necrosis complications is inherently cost effective. Lastly, in our statistical analysis of two grouped categories, no or minor complications versus major complications, we did not achieve statistical significance.

We did demonstrate a reduction in the number of women experiencing necrosis and more severe types of necrosis as measured by SKIN score. Localization was highly successful and performed with equipment already available in the operating room. Many surgeons who regularly perform breast surgery are adept at US and would be capable of readily employing this technique.

Conclusions

Our prospective study provides preliminary evidence that US localization of the IPV can reduce NAC and skin necrosis complications in NSM. Localization of the IPV was highly successful with US suggesting that surgeons facile with breast US can readily employ this technique to reduce skin necrosis and related complications. The observed variable location of the primary IPV, consistent with previously published literature, contributes to the value of localization. Although grouping of the data into clinically meaningful categories did not show evidence of statistical significance, reduced rates of necrosis, as measured by SKIN score, were observed in women undergoing NSM with US localization of the IPV. The findings are consistent with our hypothesis that localization of the IPV leads to preservation of the primary vasculature of the NAC and reduced necrosis. Future efforts will be directed at performing US localization pre-operatively to improve efficiency, incorporation of indocyanine green fluorescence angiography to further reduce necrosis rates of NSM, and examining the effect of pre-pectoral implant placement.

Acknowledgment

We would like to acknowledge Todd Foster, Isaac Janson, and Jessica Wolfe, St. Vincent Hospital, Indianapolis, IN for their input and kind assistance with the statistical analysis.

References

  1. Carlson GW, Chu CK, Moyer HR, Duggal C, Losken A. (2014) Predictors of nipple ischemia after nipple sparing mastectomy. Breast J. 20(1): 69–73. [Crossref]
  2. Cho JW, Yoon ES, You HJ, Kim HS, Lee BI, Park SH. (2015) Nipple-Areola Complex Necrosis after Nipple-Sparing Mastectomy with Immediate Autologous Breast Reconstruction. Arch Plast Surg. 42(5): 601–7. [Crossref]
  3. Gould DJ, Hunt KK, Liu J, Kuerer HM, Crosby MA, Babiera G, Kronowitz SJ. (2013) Impact of surgical techniques, biomaterials, and patient variables on rate of nipple necrosis after nipple-sparing mastectomy. Plast Reconstr Surg. 132(3): 330e-8e. [Crossref]
  4. Frey JD, Alperovich M, Levine JP, Choi M, Karp NS. (2017) Does Smoking History Confer a Higher Risk for Reconstructive Complications in Nipple-Sparing Mastectomy? Breast J. [Crossref]
  5. Stone K, Wheeler A. (2015) A Review of Anatomy, Physiology, and Benign Pathology of the Nipple. Ann Surg Oncol 22: 3236–3240. [Crossref]
  6. Skandalakis J. Breast. In: Skandalakis J, editor. (2004) Skandalakis’ surgical anatomy: the embryologic and anatomic basis of modern surgery. Athens: PMP; pp. 106–107.
  7. Palmer JH, Taylor GI. (1986) The vascular territories of the anterior chest wall. Br J Plast Surg. 39: 287–99. [Crossref]
  8. O’Dey D, Prescher A, Pallua N. (2007) Vascular reliability of nipple-areola complex-bearing pedicles: an anatomical microdissection study. Plast Reconstr Surg. 119(4): 1167–77. [Crossref]
  9. van Deventer PV, Graewe FR. (2016) The Blood Supply of the Breast Revisited. Plast Reconstr Surg. 137(5): 1388–97. [Crossref]
  10. Bahl M, Pien I, Buretta K, Hwang S, Greenup, R, Ghate S, Hollenbeck S. (2016) Can Vascular Patterns on Preoperative Magnetic Resonance Imaging Help Predict Skin Necrosis after Nipple-Sparing Mastectomy? J Am Coll Surg 223(2): 279–85. [Crossref]
  11. Lemaine V, Hoskin T, Farley D, Grant C, Boughey J, Torstenson T, Jacobson S, et al. (2015) Introducing the SKIN Score: A Validated Scoring System to Assess Severity of Mastectomy Skin Flap Necrosis. Ann Surg Oncol 22: 2925–2932. [Crossref]

Ribosomal S6 Kinase 2 Promotes Survival of Triple- Negative Breast Cancer Cells to Apoptotic Stimuli

DOI: 10.31038/CST.2019432

Abstract

Triple-negative breast cancers (TNBC) lack estrogen receptor (ER), progesterone receptor and epidermal growth factor receptor HER2 and share many features of basal-like breast cancer (BLBC). Therefore, these patients have to rely on chemotherapy. The mechanistic target of rapamycin complex 1 (mTORC1) as well as its downstream targets p70 S6 kinase (S6K1) and S6K2 have been implicated in breast cancer. The 40S ribosomal protein S6 kinase 2 (S6K2) has been associated with endocrine resistance. We have previously shown that S6K2 protects against apoptotic cell death in ER-positive breast cancer cells. In the present study, we investigated if S6K2 could serve as a potential target for TNBC. Our analysis of TCGA dataset as well as immunohistochemistry of patient samples revealed that S6K2 is overexpressed not only in ER-positive but also in TN breast tumors compared to normal breast tissues. Silencing of S6K2 by siRNA enhanced sensitivity of BLBC MCF10CA1d cells to chemotherapeutic drugs cisplatin and doxorubicin. S6K2 knockdown also increased sensitivity of BLBC MCF10CA1a and TNBC HCC1395 cells to TRAIL. While S6K2 knockdown alone had little effect on apoptosis, it enhanced TRAIL-induced apoptosis as judged by the increase in caspase-3 activity, PARP cleavage and annexin V/PI staining. Overexpression of constitutively-active S6K2 construct in MDA-MB-231 cells protected against TRAIL-induced apoptosis. These results suggest that S6K2 also promotes survival of TNBC. Therefore, targeting S6K2 in combination with chemotherapeutic agents could improve therapy of TNBC.

Keywords

Triple-negative breast cancer, basal-like breast cancer, S6K2, chemotherapeutic drugs, apoptosis

Introduction

Breast cancer is the second leading cause of cancer-related death among women in the United States. The major breast cancer subtypes include hormone receptor-positive, human epidermal growth factor receptor 2 (HER2)-enriched and triple-negative or basal-like breast cancer [1]. Triple-negative breast cancers (TNBC), which account for approximately 20% of all breast cancers, are a highly aggressive form of breast cancer with high mortality and poor prognosis [2]. They share many features of basal-like breast cancer (BLBC) subtype and they are often used synonymously [3]. No targeted therapy exists to treat majority of patients with TNBC because they lack estrogen receptor (ER), progesterone receptor (PR) and HER2/neu [4, 5].

The PI3K/Akt/mTOR pathway is most frequently altered in breast cancers and has been associated with drug resistance [6, 7]. The mechanistic target of rapamycin (mTOR), which acts downstream of PI3K/Akt, is an important target for breast cancer therapy since it is frequently deregulated in breast cancers and plays a critical role in tumorigenesis [8]. mTOR forms complexes with either raptor (mTORC1) or rictor (mTORC2). mTORC1 mediates its function via its downstream targets ribosomal S6 kinase (S6K1 and S6K2) and 4E-binding protein 1 (4E-BP1) [9].

40S ribosomal protein S6 kinase 2 or S6K2 encoded by RPS6KB2 is localized on chromosome 11q13 [10, 11], which constitutes a high-risk subgroup of ER-positive breast cancers [12]. RPS6KB2 gains/amplifications have been associated with poor prognosis and resistance to endocrine therapy [10, 11]. A recent study showed high levels of S6K2 was associated with ER-positive breast cancers [13]. We have shown that S6K2 promotes survival of ER-positive breast cancers to apoptotic stimuli [14].

 The PI3K/Akt/mTOR pathway is also frequently deregulated in TNBC [2]. Since chemotherapy continues to be the standard-of-care treatment for TNBC but unacceptable side effects are major problems in the treatment, we examined if targeting S6K2 could enhance sensitivity of TNBCs to chemotherapeutic agents. Our results show that S6K2 is overexpressed in TNBC and depletion of S6K2 sensitized TNBC cells to apoptotic stimuli.

Methods and Materials

Cell Culture

The MCF-10A series developed by Dr. Fred Miller and colleagues [15], was purchased from the Barbara Ann Karmanos Cancer Institute (Detroit, MI). MCF10A, MCF10AT and MCF10AT3G cells were cultured as described previously [16]. MCF-10CA1a and MCF10-CA1d cells were maintained in DMEM-F12 medium supplemented with 5% horse serum. MDA-MB-231 and HCC1395 (obtained from Drs. Adi Gazdar and John Minna, UT Southwestern Medical Center) cells were maintained in RPMI 1640 medium supplemented with 5% fetal bovine serum and 2 mM glutamine. Cells were kept in a humidified incubator at 370C with 95% air and 5% CO2.

Transfection

Cells were transfected with control non-targeting or target-specific siRNAs (GE Dharmacon, Chicago, IL) using Lipofectamine RNAiMax transfection reagent (Invitrogen, Carlsbad, CA) as described before [17]. We overexpressed S6K2 in MDA-MB-231 cells. We purchased pcDNA3 S6K2 E388 D3E (a gift from Dr. John Blenis) from Addgene plasmid#17731; http: //n2t.net/addgene: 17731; RRID: Addgene_17731) [18] and cloned into pLVX-mCherry-C1 lentiviral vector (Clontech). MDA-MB-231 cells were infected with either the empty vector pLVX or vector containing S6K2 construct. The extent of gene knockdown or overexpression was determined by Western blot analysis.

Immunoblot Analysis

Cells were harvested by trypsinization, washed twice with PBS and lysed in buffer containing 20 mM Tris-HCl, pH 7.4, 0.15 M NaCl, 1 mM EGTA, 1 mM EDTA, 1.0% Triton X-100, 0.5% Nonidet-40, 10 mM β-glycerophosphate, protease inhibitor cocktail and phosphatase inhibitor cocktail (Calbiochem/EMD-Millipore, Bedford, MA). Equivalent amounts of total proteins were electrophoresed by SDS-PAGE and transferred electrophoretically to polyvinylidene difluoride membrane (EMD Millipore, Bedford, MA). Immunoblot analyses were performed with 1: 1, 000 dilution of S6K1, P-S6 (Cell Signaling Technology, Danvers, MA) and S6K2 (R&D Systems, Minneapolis, MN) or 1: 5, 000 dilution of PARP (Pharmingen, San Diego, CA) and actin antibodies (Sigma, St. Louis, MO) as described before [19]. 1: 10, 000 dilution of horseradish-peroxidase-conjugated donkey anti-rabbit or goat anti-mouse secondary antibodies (Jackson ImmunoResearch Laboratories, Inc., West Grove, PA) were used. The blots were visualized using the enhanced chemiluminescence detection kit (Amersham, Arlington Heights, IL) and the manufacturer’s protocol. The intensities of immunoreactive proteins were quantified using ImageJ software. The blots were probed with actin to control for equal loading.

Immunohistochemistry (IHC)

Formalin-fixed paraffin-embedded tissue microarrays (TMA) obtained from US BioMax, Inc. were deparaffinized with successive washes of xylene and ethanol, and rehydrated. The endogenous peroxidase was blocked by incubation with 0.3% H2O2 and antigen retrieval was performed by heating in citrate buffer (pH 6.0). Immunohistochemistry was performed with anti-S6K2 antibody and immunodetection was performed using a Vecstatin ABC Elite kit and a DAB peroxidase substrate kit from Vector laboratories according to the manufacturer’s protocol.

Caspase activity assay

Cells transfected with control non-targeting or S6K2 siRNA were treated with or without TRAIL. DEVDase activity was determined at 370C using an Ac-DEVD-AFC assay kit (BioVision, Palo Alto, CA, USA) and the manufacturer’s protocol [19]. The fluorescence liberated from DEVD-AFC was measured using a SpectraMax GeminiXS fluorometer and SOFTmax PRO 3.1.1 software (Molecular Devices, Sunnyvale, CA, USA) with an excitation wavelength of 400-nm and emission wavelength of 505 nm.

Annexin V/Propidium Iodide Binding Assay

Cells were treated with or without 0.1 nM TRAIL (R&D Systems, Minneapolis, MN) for 14 h. At the end of the incubation, both detached and attached cells were collected and washed with phosphate-buffered saline. Cells were then stained with annexin V-Alexa 488 conjugate and propidium iodide (Molecular Probes, Eugene, OR) according to the manufacturer’s protocol and analyzed using a flow cytometer (Coulter Epics) [14].

Statistical analysis

Statistical significance was determined by paired Student’s t-test using Microsoft Excel. A p-value < 0.05 was considered statistically significant.

Results

Comparison of S6K2 expression in ER-positive and triple-negative breast cancers

Both S6K1 and S6K2 have been implicated in breast cancer [20, 21]. Therefore, we compared the expression of S6K1 and S6K2 in breast tumor tissues. We analyzed 106 normal and 813 breast tumor tissues from TCGA dataset. The expression of S6K2 but not S6K1 is increased by approximately 2-fold in breast tumor tissues (Fig. 1A), including both ER-positive (n=575) and triple-negative (TN) (n=118) subtypes (Fig 1B). This correlation holds true when tumor tissues are compared with matched normal tissues (Fig. 1C).

CST 2019-115 - Alakananda Basu USA_F1

Figure 1. Analysis of S6K1 and S6K2 expression in the TCGA dataset. mRNA expression was measured by RNA-seq in TCGA breast tissue samples. A, S6K1 and S6K2 in all breast tumors (789) and normal (103) samples. B, S6K2 in either ER+ (ER) or triple-negative (TN) subtypes (ER+, N=575, TN, N=118) comparing with those in the normal samples from ER+ (73) or TN (12) patients. C, S6K2 in matched tumor-normal sample pairs of ER+ (73) and TN (12) patients. The error-bar shows the standard deviation of mRNA level. Except for the comparison of S6K1 between normal and tumors samples, all of the comparison for S6K2 levels between tumor and normal samples are significant (p-value < 0.0005), with the fold-change near two (1.74~1.92).

We also analyzed 112 breast tumor specimens and 12 normal tissues in a tissue microarray (TMA) by immunohistochemistry (IHC) (Fig. 2). S6K2 staining is low in normal mammary epithelial cells (Fig. 2A). The staining of S6K2 was intense in both ER-positive (Fig. 2B) and TN (Fig. 2C) breast cancer cells. Thus, analysis of both TCGA and IHC show that S6K2 level is elevated not only in ER-positive breast cancer but also in TNBC.

CST 2019-115 - Alakananda Basu USA_F2

Figure 2. S6K2 expression in normal versus breast tumor tissues. IHC was performed with tissue microarrays. Representative images are shown. A, Cancer adjacent normal breast tissue; B, ER-positive breast tumor (Stage IIb); C, TNBC (Stage IIb). We did not counterstain the slides with hematoxylin since it may obscure S6K2 staining.

We then examined the status of S6K2 in several breast cancer cell lines. We have used progressive basal-like MCF10A series, which include immortalized but non-tumorigenic MCF10A cells as well as highly aggressive metastatic MCF10CA1a and MCF10CA1d variants. These cells do not express hormone receptors. We also included TNBC MDA-MB-231 and ER-positive MCF-7 cells in our comparison. S6K2 but not S6K1 level was increased modestly in MCF10CA1a and MCF10CA1d cells (Fig. 3). In contrast, S6K2 level was low in MDA-MB-231 cells. p70S6K1 gene is amplified in MCF-7 cells and the upper band represents the p85 form of S6K1. Both Akt which acts upstream of mTOR as well as P-S6 which acts downstream of mTORC1/S6K were elevated in MCF10CA1a and MCF10CA1d cells compared to non-tumorigenic MCF10A cells, suggesting that mTORC1 signaling is activated in these cells. In subsequent studies, we depleted S6K2 from MCF10CA1a and MCF10CA1d cells and overexpressed S6K2 in MDA-MB-231 cells.

CST 2019-115 - Alakananda Basu USA_F3

Figure 3. Comparison of Akt and S6K levels in breast cancer cells. Western blot analysis was performed with the indicated antibodies with total cell lysates. The upper band in S6K1 blot represents the p85 form of S6K1.

Effect of S6K2 knockdown on the sensitivity of TNBC cells to apoptotic stimuli

We examined if depletion of S6K2 enhances cell death in TNBC cells by monitoring the cleavage of PARP, a substrate for caspase-3 and -7. Figure 4 shows that while silencing of S6K2 by siRNA alone had little effect on PARP cleavage, it increased the levels of cleaved PARP in response to chemotherapeutic drugs cisplatin and doxorubicin.

CST 2019-115 - Alakananda Basu USA_F4

Figure 4. Depletion of S6K2 enhanced cisplatin- and doxorubicin-induced PARP cleavage in MCF10CA1d breast cancer cells. MCF10CA1d cells transfected with control non-targeting or S6K2 siRNAs were treated with or without indicated concentrations of cisplatin or doxorubicin and Western blot analysis was performed with indicated antibodies.

We then examined if depletion of S6K2 increases sensitivity of MCF10CA1a cells to another apoptotic stimulus TRAIL (TNF-related apoptosis-inducing ligand). Knockdown of S6K2 increased TRAIL-induced PARP cleavage as well as the level of cleaved caspase-9 (Fig. 5A), suggesting that S6K2 depletion increased TRAIL-induced apoptosis. To directly determine the effect of S6K2 knockdown on apoptosis, we monitored caspase-3 activity by using fluorogenic DEVD-AFC substrate. Cells transfected with control non-targeting or S6K2 siRNA were treated with TRAIL and the time-course of caspase-3 activation was monitored. As shown in Figure 5B, S6K2 knockdown alone (unfilled triangle) caused a slight increase in caspase-3 activity as compared to control siRNA-transfected cells (unfilled circle). While TRAIL treatment had little effect on caspase-3 activity in control siRNA-transfected cells (filled circle), it dramatically enhanced time-dependent increase in caspase-3 activity in S6K2 siRNA-transfected cells (filled triangle).

PowerPoint Presentation

Figure 5. Depletion of S6K2 enhanced TRAIL-induced apoptosis in MCF10CA1a cells. A, MCF10CA1a cells were transfected with control non-targeting or S6K2 siRNA and treated with or without TRAIL. Western blot analysis was performed with indicated antibodies. B, MCF-10CA1a cells transfected with control non-targeting (circle) or S6K2 (triangle) siRNA were treated without (unfilled) or with (filled) TRAIL. Caspase activity assay was performed with DEVD-AFC as the substrate. Fluorescent intensity was calculated for equal amount of protein.

To further examine the effect of S6K2 knockdown on apoptosis, we examined the consequence of S6K2 knockdown on TRAIL-induced apoptosis in HCC1395 cells, which were derived from patients with TNBC. Figure 6 shows that knockdown of S6K2 caused a modest increase in TRAIL-induced PARP cleavage. Similar results were obtained when we monitored apoptosis by Annexin V/PI dye binding assay (Fig. 5B).

PowerPoint Presentation

Figure 6. Depletion of S6K2 enhanced TRAIL-induced apoptosis in HCC1395 cells. HCC1395 cells were transfected with control non-targeting or S6K2 siRNA and treated with indicated concentrations of TRAIL. A, Western blot analysis was performed with indicated antibodies. B, Annexin V/PI staining was performed to determine cell death by flow cytometry.

Effect of S6K2 overexpression on the sensitivity of TNBC cells to apoptotic stimuli

To further demonstrate the effect of S6K2 on apoptosis, we overexpressed S6K2 in MDA-MB-231 cells, which express low levels of S6K2. We used an S6K2 construct in which Thr388 was mutated to Glu, and Ser residues at 410, 417 and 423 were mutated to Asp. This phosphomimicking constitutively active form of S6K2 is resistant to mTORC1 inhibitor rapamycin. As shown in Figure 7A, overexpression of S6K2 attenuated TRAIL-induced PARP cleavage. Moreover, while treatment of MDA-MB-231 cells with TRAIL caused a substantial increase in caspase-3 activity, overexpression of S6K2 blunted this increase. These results suggest that S6K2 protects MDA-MB-231 cells against apoptotic stimuli.

PowerPoint Presentation

Figure 7. Overexpression of S6K2 attenuated TRAIL-induced apoptosis in MDA-MB-231 cells. MDA-MB-231 breast cancer cells expressing either control vector or rapamycin-resistant (RR) S6K2 were treated with or without TRAIL. A, Western blot analysis was performed with indicated antibodies. B, Caspase activity assay was performed with DEVD-AFC as the substrate.

Discussion

There has been significant advancement in the treatment of breast cancer. The presence of hormone receptors in ER-positive breast cancers suggests a favorable prognosis since the patients can be treated with anti-estrogens or aromatase inhibitors [22]. Similarly, HER2-enriched breast cancers could be treated with herceptin (tratuzumab), a monoclonal antibody against HER2 receptors. TNBCs remain a clinical challenge due to lack of appropriate FDA-approved targeted therapies for most patients with TNBC [3, 4]. Chemotherapy continues to be the standard-of-care treatment for systemic therapy in TNBC patients [23]. However, progression-free survival is short and patients often advance to aggressive metastatic disease [3]. In addition, unacceptable toxicity of cytotoxic chemotherapeutic drugs is a serious problem in the management of the disease.

The PI3K/Akt/mTOR pathway is frequently deregulated in breast cancers and there have been numerous attempts to target this pathway albeit with limited efficacy [24, 25]. While mTORC1 and its downstream target S6K1 have been studied extensively, little attention has been paid to S6K2 [26, 27]. Because of the high degree of homology between S6K1 and S6K2, it was generally believed that the function of these two homologs is similar [26, 27]. Emerging studies identified S6K2 as a novel candidate oncogene and overexpression of S6K2 was associated with poor prognosis and resistance to endocrine therapy [10, 11]. We have shown that S6K1 and S6K2 have opposite effect on the survival of ER-positive breast cancers [14]. Knockdown of S6K2 but not S6K1 enhanced cell death in response to apoptotic stimuli in ER-positive breast cancer cells [17].

The results of our present study show that S6K2 also plays an important role in promoting the survival of TNBC. Based on the analysis of the TCGA dataset, the expression of S6K2 but not S6K1 is increased in both ER-positive and TN breast cancers. Consistent with the TCGA data, immunohistochemical staining of patient samples also revealed that S6K2 protein expression was higher in both ER-positive and TN subtypes. Moreover, in the progressive MCF10A breast cancer model, S6K2 levels appear to be higher in aggressive cell lines compared to non-malignant cells. However, S6K2 level was low in MDA-MB-231 cells, which may rely on other oncogenic signaling pathways for survival.

We found that depletion of S6K2 alone had little effect on cell death but S6K2 knockdown enhanced cell death in MCF10ACA1a, MCF10CA1d and HCC1395 cells that lack ER, PR and HER2/neu. We have used chemotherapeutic drugs, such as doxorubicin and cisplatin that act via the mitochondrial pathway as well as TRAIL, which acts via the receptor-initiated pathway. S6K2 knockdown enhanced cell death by apoptosis as evident by the cleavage of PARP, caspase-3 activity and annexin V/PI staining. Furthermore, overexpression of S6K2 in MDA-MB-231 cells attenuated TRAIL-induced apoptosis reinforcing our notion that S6K2 promotes survival in TNBC cells.

The PI3K/Akt and Ras/MAPK pathways are often deregulated in breast cancers [22, 30]. We have previously shown that S6K2 promotes survival of ER-positive breast cancer MCF-7 cells partly via activation of the Akt signaling pathway [14]. It remains to be seen if S6K2 promotes survival of TNBC cells via Akt-dependent or -independent pathway. P-Akt could be detected in malignant MCF10ACA1a and MCF10CA1d cells but not in non-malignant MCF10A cells. During the generation of MCF-10CA1a cells, MCF10A cells were transfected with T24 Ha-Ras [15]. Therefore, ERK signaling pathway is also activated in these cells. Thus, the observation that S6K2 KD induced cell death in MCF10CA1a and MCF10CA1d cells with activated Akt/mTOR and Ras/Raf/MAPK pathway [16] is significant.

Given that chemotherapy continues to be the major treatment option for TNBC patients and S6K2 knockout mice are viable and exhibit normal development and homeostasis [26, 28–30], intervention with S6K2 in combination with other chemo- or biological therapeutic agents is expected to provide a novel non-toxic therapy for TNBCs.

Author Contributions: AB and SS designed and performed experiments, ZX analyzed TCGA dataset, AB wrote the manuscript and SS edited the manuscript.

Abbreviations:

BC, Breast cancer;

BLBC, Basal-like breast cancer;

4E-BP1, Eukaryotic translation initiation factor 4E (eIF4E)-binding protein 1;

ERK, Extracellular signal-regulated kinase;

ER, Estrogen receptor;

HER2, Human epidermal growth factor receptor 2;

IHC, Immunohistochemistry;

mTORC1, Mechanistic target of rapamycin complex 1;

PARP, Poly (ADP-ribose) polymerase;

PI, Propidium iodide;

PI3K, Phosphatidylinositol-3-kinase;

PR Progesterone receptor;

p70 S6 kinase 1 (S6K1);

S6K2, 40S ribosomal protein S6 kinase 2;

TCGA, The cancer genome atlas;

TNBC, Triple-negative breast cancer;

TMA, Tissue microarray;

TNF, Tumor necrosis factor-α;

TRAIL, TNF-related apoptosis-inducing ligand;

References

  1. Perou CM, Sorlie T, Eisen MB, van de Rijn M, Jeffrey SS, Rees CA, et al. Molecular portraits of human breast tumours. Nature. 2000; 406: 747–52.
  2. Costa RLB, Han HS, Gradishar WJ. Targeting the PI3K/AKT/mTOR pathway in triple-negative breast cancer: a review. Breast cancer research and treatment. 2018; 169: 397–406.
  3. Carey L, Winer E, Viale G, Cameron D, Gianni L. Triple-negative breast cancer: disease entity or title of convenience? Nature reviews Clinical oncology. 2010; 7: 683–92.
  4. Bayraktar S, Gluck S. Molecularly targeted therapies for metastatic triple-negative breast cancer. Breast cancer research and treatment. 2013; 138: 21–35.
  5. Foulkes WD, Smith IE, Reis-Filho JS. Triple-negative breast cancer. The New England journal of medicine. 2010; 363: 1938–48.
  6. Bahrami A, Khazaei M, Shahidsales S, Hassanian SM, Hasanzadeh M, Maftouh M, et al. The Therapeutic Potential of PI3K/Akt/mTOR Inhibitors in Breast Cancer: Rational and Progress. Journal of cellular biochemistry. 2018; 119: 213–22.
  7. Guerrero-Zotano A, Mayer IA, Arteaga CL. PI3K/AKT/mTOR: role in breast cancer progression, drug resistance, and treatment. Cancer metastasis reviews. 2016; 35: 515–24.
  8. Mita MM, Mita A, Rowinsky EK. Mammalian target of rapamycin: a new molecular target for breast cancer. Clinical breast cancer. 2003; 4: 126–37.
  9. Sabatini DM. mTOR and cancer: insights into a complex relationship. Nature Reviews Cancer. 2006; 6: 729–34.
  10. Karlsson E, Perez-Tenorio G, Amin R, Bostner J, Skoog L, Fornander T, et al. The mTOR effectors 4EBP1 and S6K2 are frequently coexpressed, and associated with a poor prognosis and endocrine resistance in breast cancer: a retrospective study including patients from the randomised Stockholm tamoxifen trials. Breast cancer research : BCR. 2013; 15: R96.
  11. Karlsson E, Waltersson MA, Bostner J, Perez-Tenorio G, Olsson B, Hallbeck AL, et al. High-resolution genomic analysis of the 11q13 amplicon in breast cancers identifies synergy with 8p12 amplification, involving the mTOR targets S6K2 and 4EBP1. Genes Chromosomes Cancer. 2011; 50: 775–87.
  12. Curtis C, Shah SP, Chin SF, Turashvili G, Rueda OM, Dunning MJ, et al. The genomic and transcriptomic architecture of 2, 000 breast tumours reveals novel subgroups. Nature. 2012; 486: 346–52.
  13. Bostner J, Karlsson E, Eding CB, Perez-Tenorio G, Franzen H, Konstantinell A, et al. S6 kinase signaling: tamoxifen response and prognostic indication in two breast cancer cohorts. Endocrine-related cancer. 2015; 22: 331–43.
  14. Sridharan S, Basu A. S6 kinase 2 promotes breast cancer cell survival via Akt. Cancer research. 2011; 71: 2590–9.
  15. Santner SJ, Dawson PJ, Tait L, Soule HD, Eliason J, Mohamed AN, et al. Malignant MCF10CA1 cell lines derived from premalignant human breast epithelial MCF10AT cells. Breast cancer research and treatment. 2001; 65: 101–10.
  16. Kim SH, Miller FR, Tait L, Zheng J, Novak RF. Proteomic and phosphoproteomic alterations in benign, premalignant and tumor human breast epithelial cells and xenograft lesions: biomarkers of progression. International journal of cancer. 2009; 124: 2813–28.
  17. Basu A, Sridharan S. Regulation of anti-apoptotic Bcl-2 family protein Mcl-1 by S6 kinase 2. PLoS One. 2017; 12: e0173854.
  18. Lee-Fruman KK, Kuo CJ, Lippincott J, Terada N, Blenis J. Characterization of S6K2, a novel kinase homologous to S6K1. Oncogene. 1999; 18: 5108–14.
  19. Basu A, Akkaraju GR. Regulation of caspase activation and cis-diamminedichloroplatinum(II)-induced cell death by protein kinase C. Biochemistry. 1999; 38: 4245–51.
  20. Barlund M, Monni, O., Kononen, J., Cornelison, R., Torhorst, J., Sauter, G., Kallioniemi, O.P., and Kollioniemi, A. Multiple Genes at 17q23 Undergo Amplification and Overexpression in Breast Cancer. Cancer Res. 2000; 60: 5340–4.
  21. Perez-Tenorio G, Karlsson E, Waltersson MA, Olsson B, Holmlund B, Nordenskjold B, et al. Clinical potential of the mTOR targets S6K1 and S6K2 in breast cancer. Breast cancer research and treatment. 2010.
  22. Yamamoto-Ibusuki M, Arnedos M, Andre F. Targeted therapies for ER+/HER2- metastatic breast cancer. BMC Med. 2015; 13: 137.
  23. Bianchini G, Balko JM, Mayer IA, Sanders ME, Gianni L. Triple-negative breast cancer: challenges and opportunities of a heterogeneous disease. Nature reviews Clinical oncology. 2016; 13: 674–90.
  24. Dey N, De P, Leyland-Jones B. PI3K-AKT-mTOR inhibitors in breast cancers: From tumor cell signaling to clinical trials. Pharmacol Ther. 2017; 175: 91–106.
  25. Sivendran S, Agarwal N, Gartrell B, Ying J, Boucher KM, Choueiri TK, et al. Metabolic complications with the use of mTOR inhibitors for cancer therapy. Cancer Treat Rev. 2014; 40: 190–6.
  26. Pardo OE, Seckl MJ. S6K2: The Neglected S6 Kinase Family Member. Front Oncol. 2013; 3: 191.
  27. Tavares MR, Pavan IC, Amaral CL, Meneguello L, Luchessi AD, Simabuco FM. The S6K protein family in health and disease. Life Sci. 2015; 131: 1–10.
  28. Fenton TR, Gout IT. Functions and regulation of the 70kDa ribosomal S6 kinases. The international journal of biochemistry & cell biology. 2011; 43: 47–59.
  29. Pende M, Um SH, Mieulet V, Sticker M, Goss VL, Mestan J, et al. S6K1(-/-)/S6K2(-/-) mice exhibit perinatal lethality and rapamycin-sensitive 5’-terminal oligopyrimidine mRNA translation and reveal a mitogen-activated protein kinase-dependent S6 kinase pathway. Molecular and cellular biology. 2004; 24: 3112–24.
  30. Shima H, Pende M, Chen Y, Fumagalli S, Thomas G, Kozma SC. Disruption of the p70(s6k)/p85(s6k) gene reveals a small mouse phenotype and a new functional S6 kinase. The EMBO journal. 1998; 17: 6649–59.

Depression and Anxiety Analysis from Elder Population in A Beijing Rural Area

DOI: 10.31038/ASMHS.2019331

Abstract

The paper aims to investigate the mental health status of elderly people in Beijing rural area, and look for possible factors that affect the depression and anxiety levels. 204 ordinary elderly residents over 60 years old without major diseases are randomly selected from a rural area of Beijing. The factors influencing the level of depression and anxiety of the sample are investigated by the Daily Living Ability Scale, the Marital Attachment Questionnaire and the Social Support Rating Scale. Our results show that the degree of depression is influenced by 12 factors (including age, marriage, education, monthly income, source of income, type of health care, daily living ability, number of chronic diseases, couple attachment, parent-child contact, social support and frequency of Internet use), among which the top three most significant factors are social support, marriage and couple attachment. The degree of anxiety is generally influenced by 10 factors (age, marriage, education, monthly income, source of income, daily living ability, number of chronic diseases, couple attachment, social support and frequency of Internet use), among which the top three most significant factors are the number of chronic diseases, age and daily living ability. Our results indicate that the depression level is affected by the relationship between oneself and other people; while the anxiety degree is mainly affected by the basic daily life and relationship between oneself. Our research results suggest that, the society shall focus on especially the vulnerable elderly groups with poor daily living ability and many chronic diseases, and efforts should be made to optimize primary medical care services for the aged population; family and society emotional support for the elderly should be strengthened to relieve the depression level.

Keywords:

Mental Health; Depression; Anxiety; Elderly People; Influencing Factors; Uni-variable Analysis; Dependent Variable; Independent Variable; SPSS

Preface

Aging is a principle trend of population development in the world today. In China, one of the most populous countries in the world, the problem of population aging began to appear gradually since the 1980s, and showed accelerating velocity nowadays. The aggravation of population aging has an important impact on the function and management of the society. In comparison to the developed countries in the western world, the aged population in China has a large base, which develops even rapidly, while the system for elderly care and medical service is obviously lagging behind. With the development of social environment, the family structure also has a rapid transformation, weakening the original intergenerational support and care ability. This requires the elderly not only to deal with the physiological and psychological pressure brought by their aging but also to face the problems including insufficiency of family and social support, which lead them easily to fall into depression, anxiety and other psychological problems [1–4]. The mental health problem of the elderly not only bring painful experience to themselves and their families, but also increase the economic burden of the whole society and eventually slow down the development, therefore it becomes to be a more and more severe social problems and cannot be ignored. This paper focuses on two basic mental health problems: depression and anxiety, and attempts to find out the main factors that affect them.

The research of mental health of the elderly began much earlier in western countries, which divided the factors affecting the mental health of the elderly mainly into demographic factors, socio-economic factors, lifestyle factors, diseases and medical and health care factors [5–9].

From the domestic research in China, Wu Zhenyun pointed out that the mental health of the elderly is affected by factors which can generally be summarized as objective factors and subjective factors [10]. Objective factors mainly include the demographic characteristics and health status of the elderly number of diseases, number of life events and other social factors (such as family, economic status, etc.) Subjective factors include mainly a variety of measures on feeling of satisfaction and happiness [10, 11]. Besides, Yang Jingjing addressed that intergenerational relationship has an important impact on the mental health of the elderly, and a harmonious and intimate intergenerational relationship helps to improve the degree of happiness and satisfaction for the elder population [5, 12].

The sample of the research object is generally selected in a certain region, and questionnaire survey is carried out for the data collection, then the empirical and quantitative analysis is implemented [10, 13–15]. In this work, the same working paradigm is applied, and the research content mainly includes the following sections. Firstly, we evaluate of the present situation of depression and anxiety levels of the elderly by the survey result and questionnaire analysis; secondly, we analyze the influencing factors of the depression and anxiety of the elderly and find out the sequence of significance of affecting factors and differentiate the affecting factors for depression and anxiety; finally we suggest potential policies and possible strategy to improve the mental health level of the elderly.

Objects and Methods

As the conceptions of mental health are difficult to quantify, international experts have developed certain scales to measure mental health, such as the Symptom CheckList-90(SCL-90) [6], Self-rating Depression Scale [7,8], Activities of Daily Living Scale (ADL) [9].Research on mental health in China started in the 1960s and the scales developed by domestic experts include Social Support Rating Scale (SSRS) [16],Daily Living Ability Scale [3], mental health questionnaire for the elderly [10] and couple relationship questionnaire [5]. These scales and questionnaires are abstracted and simplified by the researchers and easy to carry out, which greatly promote the research process. In this work, both international and domestic scales and questionnaires have been adopted and integrated.

To better understand the mental health status of elderly, 204 ordinary elderly local residents without major diseases (from 60 to 84 years old) are randomly selected from a rural area of Beijing with a well-off level of economic status as research objects. The household questionnaire survey has been carried out from door to door and interviews were made. The content of the questionnaire mainly contains questions related to mental health measurement (GDS and SAS) and factors affecting depression and anxiety levels, including demographic factors, economic basis, physiological health condition, living environment support and new factors. In specific, demographic factors include gender, age, marriage and education. Economic basis is measured by monthly income, source of income and type of medical insurance. Physical health condition is measured by daily living ability and the number of chronic diseases. Living environment support includes couple attachment, parent-child contact and social environment support. The frequency of Internet use is considered as the new factor. The scales used mainly include Daily Living Ability Scale, Couple Attachment Questionnaire and Social Support Rating Scale (SSRS). The results from questionnaire are collected into Excel and processed by SPSS software.

Results

Basic Results

The statistical data of basic conditions of the sample and the scores of depression and anxiety are shown in (Table 1). The proportion of male in the survey is slightly higher than that of female. The results show that the average score of depression in the elderly is 10.42 ± 9.712, and the average score of anxiety is 49.23 ± 16.468. Among them, 60.3% of the population is normal without depression, 22.5% is mild depressed, and 17.2% is moderate-severe depressed. On the other hand, 56.4% of the population is normal without anxiety, 19.6% is with mild anxiety, 8.8% is with moderate anxiety, and 15.2% is with severe anxiety, as can be seen in Table 1.

Table 1. Statistical results of basic conditions and scores of depression and anxiety of the elderly.

Item

Amount

Percentage

Average score of depression

Average score of anxiety

Age

1(60~64)

63

30.9%

6.70 ± 8.462

40.38 ± 11.715

2(65~69)

71

34.8%

9.17 ± 9.307

47.15 ± 12.478

3(70~74)

14

6.9%

9.93 ± 8.810

42.36 ± 12.659

4(75~79)

35

17.2%

14.40 ± 9.802

60.11 ± 14.766

5(80+)

21

10.3%

19.52 ± 7.366

69.24 ± 19.611

Gender

1(male)

106

52.0%

11.12 ± 10.476

47.39 ± 16.493

2(female)

98

48.0%

9.66 ± 8.801

51.22 ± 16.289

Marriage

1(married and the spouse is alive)

141

69.1%

7.00 ± 7.727

45.77 ± 14.005

2(married but the spouse is dead)

48

23.5%

16.06 ± 9.447

57.77 ± 19.750

3(not married)

15

7.4%

24.53 ± 5.527

54.40 ± 16.190

Education

1(have never attended school)

31

15.2%

19.06 ± 9.764

59.97 ± 18.691

2(primary education)

66

32.4%

11.47 ± 8.692

54.62 ± 17.601

3(junior high school education)

43

21.1%

10.35 ± 9.786

46.93 ± 13.165

4(senior high school education)

62

30.4%

5.37 ± 7.205

40.02 ± 9.915

5(bachelor and above)

2

1.0%

0.00 ± 0.000

40.00 ± 1.414

Monthly income

1(1000 yuan and below)

89

43.6%

14.43 ± 9.886

55.79 ± 44.05

2(1000~3000 yuan)

78

38.2%

8.99 ± 9.357

44.05 ± 13.013

3(3000~5000 yuan)

36

17.6%

3.92 ± 4.087

44.47 ± 15.219

5(10000 yuan and above)

1

0.5%

0.00 ± 0.000

41.00 ± 0.000

Source of income

1(oneself)

132

64.7%

8.83 ± 9.307

44.51 ± 13.301

2(spouse)

26

12.7%

7.31 ± 6.632

49.08 ± 14.419

3(children)

40

19.6%

16.13 ± 9.952

62.30 ± 18.287

4(society)

6

2.9%

20.83 ± 7.757

66.67 ± 20.156

Type of medical insurance

1(medical insurance for urban employees)

66

32.4%

4.82 ± 5.162

45.83 ± 14.730

2(medical insurance for urban and rural residents)

138

67.6%

13.10 ± 10.235

50.86 ± 17.049

Daily living ability

1(normal)

142

69.6%

8.14 ± 9.142

43.12 ± 12.246

2(mild living obstacle)

37

18.1%

8.73 ± 6.119

53.00 ± 11.477

3(obvious living obstacle)

25

12.3%

19.42 ± 8.025

68.85 ± 16.114

Number of chronic diseases

0(0 kind)

69

33.8%

8.00 ± 9.191

37.90 ± 10.062

1(1 kind)

73

35.8%

8.19 ± 8.896

48.08 ± 11.791

2(2 kinds)

33

16.2%

11.33 ± 8.612

54.94 ± 13.306

3(3 kinds and above)

29

14.2%

20.79 ± 7.098

72.59 ± 15.394

Couple attachment

1(normal)

93

45.6%

5.86 ± 6.924

43.87 ± 12.168

2(mild)

29

14.2%

8.90 ± 7.494

50.76 ± 16.745

3(moderate-severe)

13

6.4%

13.62 ± 10.548

49.69 ± 16.825

4(no spouse)

69

33.8%

16.61 ± 10.182

55.72 ± 18.992

Parent-

child contact

1(living together)

74

36.3%

11.11 ± 9.518

47.58 ± 16.120

2(contact every few days)

115

56.4%

8.14 ± 8.627

49.62 ± 16.699

3(have no child)

15

7.4%

24.53 ± 5.527

54.40 ± 16.190

Social support

1(lower)

50

24.5%

20.82 ± 8.166

59.26 ± 18.074

2(normal)

109

53.4%

8.30 ± 7.727

47.37 ± 15.261

3(higher)

45

22.1%

4.00 ± 6.175

42.60 ± 12.157

 Frequency of Internet use

0(never)

166

81.4%

12.08 ± 9.856

51.59 ± 16.818

1(occasionally)

9

4.4%

5.89 ± 6.716

40.22 ± 8.452

2(often)

29

14.2%

2.34 ± 2.832

38.52 ± 10.045

Depression

1(normal)

123

60.3%

2(mild)

46

22.5%

3(moderate-severe)

35

17.2%

Anxiety

1(normal)

115

56.4%

2(mild)

40

19.6%

3(moderate)

18

8.8%

4(severe)

31

15.2%

The Influence of Demographic Characteristics on Depression and Anxiety of the Elderly

It can be seen from table 1 that age, marital status and education have significant influence on the degrees of depression and anxiety. With the growth of age, the depression degree of the elderly tends to deepen, while the anxiety degree declines in the middle but generally becomes more severe. Specifically, the depression scores of the elderly in the two stages of 65–69 and 70–74 years old are almost the same. However, age 75 seems to be a dividing line, people older than 75 years old have their scores of depression and anxiety significantly higher than those who are younger than 75. In terms of marital status, people who have a spouse but his/her spouse is already dead have the highest level of anxiety, scoring even higher than those who never have a spouse. To certain extent, our result indicates that the death of a spouse increases the feeling of loneliness and anxiety. The highest score of depression is found in the elderly without a spouse, whose average score is significantly higher than those with a spouse (regardless of whether the spouse is alive or not), indicating that the level of depression is significantly increased in the elderly living without a spouse. From the aspect of education, with the improvement of the education level, the level of depression and anxiety tends to decline. Among them, the elderly who have never attended school account for about 15%, and their anxiety and depression degrees are significantly higher than those who have received primary education and above. Primary education can be seen as a dividing line. The scores of anxiety and depression of the elderly group with primary and junior middle school education are similar without significant difference. The depression score of the elderly with senior high school education is significantly lower than those with primary and middle school education.

The Influence of Economic Basis on Depression and Anxiety Status of the Elderly

Monthly income, source of income and type of medical insurance have significant influence on depression degree of the elderly, while monthly income and source of income have significant influence on anxiety degree of the elderly. With the increase of monthly income, the depression degree of the elderly tends to decrease, while the anxiety degree increases in the middle but generally declines. It is worth pointing out that the degrees of anxiety and depression in the elderly group with a monthly income of less than 1,000 yuan are significantly enhanced. It may indicate that monthly income of 1,000 yuan can provide basic living security, while there is basically no difference in anxiety scores of the elderly group with a monthly income of 1000–3000 and 3000–5000. With different sources of income, the elderly have different degrees of depression: when the economic source is not from oneself, the depression and anxiety levels of the elderly tend to increase. It may suggest that the income dependency on children or the society would induce certain strange and complex psychological feelings, a certain amount of guilt, insecurity and so on, which could enhance the level of anxiety and depression. In terms of type of medical insurance, the depression degree of the elderly covered by medical insurance for urban employees is much lower, the depression score of the elderly covered by medical insurance for urban and rural residents is significantly higher (while the anxiety level is just a little bit higher) than those covered by medical insurance for urban employees.

Influence of Physical Health on Depression and Anxiety Status of the Elderly

Daily living ability and the number of chronic diseases have significant influences on the depression and anxiety degree of the elderly. People with higher daily living ability and less number of chronic diseases, their depression and anxiety degrees of the elderly is lower. Among them, the depression score of the elderly with obvious living obstacles, which seriously affect the psychological and health level, is more than twice compared to those with normal status and mild living obstacles. The anxiety score of the elderly with chronic diseases of 1–2 types are basically similar, while the scores of depression with 3 or more types of chronic diseases are much higher than those with 2 types of chronic diseases. Therefore, the physical health condition of the elderly people has a very important impact on mental health. Anxiety degree increases with the number of chronic diseases.

Influence of Living Environment on Depression and Anxiety Status of the Elderly

The relationship between husband and wife, parent-children contact, as well as social support have significant influence on the depression degree of the elderly; while the relationship between husband and wife and social support have significant influence on the anxiety degree of the elderly. The weaker the couple attachment is, the higher the depression and anxiety levels tend to be. 45.6% of the surveyed elderly have normal couple relationship, with the lowest scores for anxiety and depression degree, and 33.8% of the population with no spouse have the highest scores for depression and anxiety degree, indicating the deepest feelings of loneliness. When children contact their parents every few days, the elderly has the lowest depression level, even lower than those who are living with their children, indicating that the elderly also need certain personal space, and living with their children is not necessarily the most appropriate. It suggests that children should come home every several days to visit their parents, which will reduce parents’ depression level. In addition, the higher the social support level is, the lower the degrees of depression and anxiety of the elderly become.

The Influence of Internet Use on Depression and Anxiety Status of the Elderly

Due to the small number of the elderly who use the Internet in the sample, which only accounts for 18.6%, the relationship between the time and purpose of Internet use and the mental health of the elderly cannot be concluded effectively. Therefore, we will not draw a conclusion on this point.

Uni-variable Analysis for Top Significant Factors

The Uni-variable Analysis

Taking depression and anxiety scores of the elderly as the dependent variables, the factors influencing mental health (age, gender, marriage, education, monthly income, source of income, type of medical insurance, daily life ability, the number of chronic disease, couple attachment, parent-child contact, social support and Internet use frequency) as the independent variables, we carry out the uni-variable analysis. Because the independent variables include ordered categorical and disordered categorical ones, while the dependent variable is the ordered categorical variables, uni-variance analysis requires the dependent variable to be a continuous variable obeying normal distribution. Therefore, we use chi-square test to determine whether there will be significant changes in dependent variable when independent variables take different values, namely, whether there is a significant correlation between independent variables and dependent variable. The higher the chi-square value, the greater the correlation is.

The Top Three Highest Correlation Factors to Depression

Uni-variable analysis is carried out on the depression analysis. The correlation between depression degree and various factors is shown in (Table 2). Age, marriage, education, monthly income, source of income, type of medical insurance, daily living ability, the number of chronic diseases, couple attachment, parent-child connection, social support and Internet use frequency are the significant factors influencing the depression status of elder people. However, the top three factors that have the most significant influence on depression is social support, marriage, and couple attachment. Even though number of chronic diseases and daily living ability list at the fourth and fifth in the order of significance, the degree of depression is mainly connected to how to deal with relationship between oneself and the others. This indicates that dealing well with the relationship between oneself and society or intimate relationship with spouse is a key factor for depression prevention.

Table 2. The factors which are influencing the mental health of the elderly.

Influence factors

Depression

Anxiety

χ2

P

χ2

P

Age

36.651

0.000

96.734

0.000

Gender

2.934

0.231

6.321

0.097

Marriage

58.047

0.000

29.891

0.000

Education

43.829

0.000

55.848

0.000

Monthly income

40.714

0.000

29.961

0.000

Source of income

41.812

0.000

58.070

0.000

Type of medical insurance

42.169

0.000

7.437

0.059

Daily living ability

44.114

0.000

87.451

0.000

The number of chronic disease

46.542

0.000

122.624

0.000

Couple attachment

48.341

0.000

35.927

0.000

Parent-child contact

33.782

0.000

5.058

0.536

Social support

85.435

0.000

37.795

0.000

Internet use frequency

25.932

0.000

25.750

0.000

The Top Three Highest Correlation Factors to Anxiety

Uni-variable analysis is carried out on the anxiety analysis. As can be seen in the Table 2, age, marriage, education, monthly income, source of economy, daily life ability, number of chronic diseases, couple attachment, social support and frequency of Internet use are important factors influencing anxiety status of the elderly. Gender, Parent-child contact and type of medical insurance are not significant in the result of anxiety measurement, and are excluded from the significance group. The top three most significant factors are the number of chronic diseases, age and the daily living ability. It indicates that the top significant factors are much about the ability of daily life, and the relation between oneself, and anxiety level is more related to the concerning of a person himself and his daily life. The source of income and education level which are the fourth and fifth significant factors are also important but not as basic as the top three factors.

Discussion

Special Attentions Need To Be Paid To Vulnerable Population

Based on the analysis of demographic factors, the elderly population with advanced ages, low education level and widowed have relatively poor mental health status, which can be regarded as the vulnerable groups in the elderly population. Due to the physiological decline, the cognitive, autonomous and interpersonal skills of elderly people with advanced ages are declining, and a variety of negative events are increasing, which are prone to psychological maladjustment. Elderly people who live alone are less likely to receive timely medical care, and probably lack family life and feel much lonely. In terms of education level, the elderly with lower education level have relatively low vision and ability to adjust their anxiety state. For the vulnerable groups, they should be given more attention and special care in policy, including more concern and assistance from social and family levels, so as to promote their positive self-health management and enhance their feeling of happiness. It is necessary to further improve the system of social assistance to carry oout functions of family mutual assistance by the mode of social assistance for the aged. We vigorously advocate the traditional virtues of respecting, supporting and helping the elderly from the Chinese tradition, and develop young volunteers to participate in community support and services for them, so as to provide convenience for the elderly living alone and to reduce their loneliness. The government and academic groups should actively provide the elderly with opportunities for continuing education, help them to access the Internet and other new technologies, and encourage the elderly with low education level to fully improve their cognitive functions in a large amount of free time in order to increase their degree of happiness in life.

Economic Condition of the Elderly Needs To Be Improved

The economic basis has a significant impact on depression degree of the elderly. With higher monthly income, more stable economic source, and with the medical insurance for urban employees, the elderly have higher mental health level. With the new type of social insurance for rural residents and urban residents gradually merged, the endowment insurance coverage is quite extensive in China.

However, the growth rate of the pension for employee received by most of the elderly at the grass-roots level is far behind the currency inflation, plus the rural pension is even much lower. Adhering to the principle of ‘ensuring basic care, providing broad coverage, being flexible and sustainable’, the new rural social pension insurance has a low starting point and slow growth rate, making it difficult to meet the living needs of the elderly. In order to improve the elderly’s ability to support themselves and reduce their living and mental burden, it is necessary to raise the level of endowment insurance by taking into account the currency inflation rate, the growth rate of real wages and the allowable scope of financial capacity. When talking about the economic security of the elderly, not only the basic expenditure of food and daily necessities, but also the expenditure of cultural activities that can keep the mental health of the elderly should be gradually taken into consideration. In particular, retirement pensions and basic subsistence allowances for rural residents should be increased to gradually narrow the gap between urban and rural social security levels. Besides, we can also consider encouraging capable elderly to participate in more social activities and get remuneration through their capability to improve economic income and enrich spiritual life.

Primary Medical and Nursing Services Need To Be Improved

Our results show that there is a significant correlation between the number of chronic diseases and mental health, and the daily living ability has a significant impact on the anxiety level of the elder people. The main reason for the poor mental health of the elderly is the unsatisfactory physical health condition. Accordingly, first of all, we need improve the level of medical services for the elderly at the primary level, and increase the total supply of medical services, thus to narrow the gap in the distribution of medical resources among institutions between different levels and different regions, and to provide more adequate, high-quality and equal medical supplies for the elder populations. Secondly, in terms of chronic disease management, we should take advantage of information technology and accelerate the construction of hierarchical diagnosis system; we need make full use of the doctors from community, the countryside hospital as well as family doctors to strengthen daily monitoring of the physical condition for the elderly; we need encourage the elder people to exercise and make a healthy diet; intervention and control of chronic diseases should be put into action, so as to reduce depression, anxiety degrees. Finally, for the elderly who do not have the ability to live a normal daily life, such as those who have lost the ability of self-care, including super-aging and disabled people, we need to explore an appropriate caring mode of family and social combination.

Living Environment Should Be Optimized and Social Supports Should Be Strengthened

Family and social emotional support are indispensable for everyone, and it has significant influence for the mental health of the elder population, too. Harmonious marital relationship and frequent parent-child contact can significantly reduce the degree of depression and anxiety of the elderly. More participation in social activities can also protect the elderly from depression and anxiety.

Since family interactions and social activities are very important to the elderly, we need to take a multi-pronged approach to strengthen the emotional support for the elderly from both family and society. First of all, the public attitude should be changed in recognizing the problems related to mental disorders, more open and active discussion of related topics in public shall be promoted, and mental health knowledge should be popularized, such that the elderly should be encouraged to discover mental health problems as early as possible, and take the initiative to seek medical treatment. Secondly, we should promote activities to enrich the cultural life of the elderly in the community and township levels, in order to eliminate their loneliness and depression, to help them to develop a sense of belonging and enjoy the benefits brought by society progress. Thirdly, efforts should be made to develop social work organizations of community staffs with mental health knowledge to communicate with the elderly regularly, and especially for the elderly in vulnerable groups. In such a way, the elderly with mental problems or potential anxiety and depression tendencies could be provided with better social environment support.

Conclusion

Through uni-variable analysis of depression and anxiety in the elderly, this study found that depression degree was affected by 12 factors among which the top three significant factors are social support, marriage and couple attachment, which are mainly related to the relationship between oneself and others. The anxiety level was affected by 10 factors, among which the top three significant factors are number of chronic diseases, age and daily living ability, which are mainly related to how to deal with one in the basic daily life. Improvement of their mental health requires the participation of individuals, families, society and the government.

References

  1. Chen Lixin, Chen Gong, Zheng Xiaoying (2008) Depression symptoms and influencing factors of widowed elderly in Beijing. Chinese Journal of Gerontology, 28: 696–698.
  2. Chen Minxia (2018) Research on the influence of income on self-rated health status of the elderly. Master Thesis. Capital University of Economics and Business.
  3. Han Xueqing, Feng Feng, Chen Jian, Shang Lan, Li Juan (2005) Definition of dementia value assisted by daily living ability scale. Chinese tissue engineering study 9: 13–15.
  4. Li Juan (2018) Effects of family interaction and social activity participation on depression in the elderly. Master Thesis. Capital University of Economics and Business.
  5. Zhai Xiaoyan, Li Chunhua, Wei Hong, Wang Dahua (2010) Preparation of attachment questionnaire for elderly couples. Psychological Development and Dducation 26: 197–204.
  6. Derogatis LR (1992) SCL-90-R, administration, scoring and procedures manual-II for the Revised version and other instruments of the Psychopathology Rating Scale Series. Clinical Psychometric Research by Townson.
  7. Zung, WWK (1965) A self-rating depression scale. Archives of General Psychiatry 12: 63–70.
  8.  Zung WW (1969) A cross-cultural survey of symptoms in depression. Am J Psychiatry 126: 116–121. [crossref]
  9. Lawton MP, Brody EM (1969) Assessment of older people: self-maintaining and instrumental activities of daily living. Gerontologist 9: 179–186. [crossref]
  10. Wu Zhenyun (2013). Connotation, evaluation and research overview of mental health of the aged. Chinese Journal of Gerontology 33: 799–801.
  11. Wu Wenyuan (2001) Anxiety self-rating scale. See Zhang Zuoji (Ed.). Manual of behavioral medicine scale (pp.124–125). Beijing: China medical electronic audio and video publishing company.
  12. Yang Jingjing, Zheng Yong (2010) Intergenerational relationship: a new perspective on mental health of the elderly. Chinese Journal of Gerontology 30: 2875–2878.
  13. Liu Jiwen, li Fuye, Lian Yulong (2008) Reliability and validity of social support rating scale. Journal of Xinjiang Medical University 31: 1–3.
  14. Liu Mengqi (2018) Research on influencing factors of mental health of the elderly in China and policy Suggestions -based on the follow-up survey of health and old-age care in China in 2015. Master Thesis. Zhejiang University?
  15. Qi Yuling, Gao Hang, Zhang Xiumin (2017). Mental health status of elderly people in urban communities and its influencing factors. Nursing research 31: 26–28.
  16. Xiao Shuiyuan (1994) Theoretical basis and research application of «Social Support Rating Scale». Clinical Psychiatry medical Journal 4: 98–99.