DOI: 10.31038/CST.2019433
Abstract
Objective: To determine if tumor habitat perfusion and diffusion characteristics are related to treatment response in soft tissue sarcoma patients.
Methods: Eight patients (58.6 ± 10.2 y/o) with soft tissue sarcomas underwent pre-treatment Dynamic Contrast Enhanced- (DCE-) and Diffusion Weighted-MRI and post-treatment resection allowing pathology to determine treatment response. Tumors were manually segmented from T1-weighted post-contrast images. Tumor habitats, classified as well-perfused, hypoxic and necrotic, were determined from DCE-MRI using a pattern recognition technique. Each habitat was characterized with pharmacokinetic parameters, kep and Ktrans, calculated from the DCE-MRI sequence and the apparent diffusion coefficients from the co-registered Diffusion Weighted-MRI. The quantitative imaging features were examined for associations with treatment response. Patients were classified as responders and nonresponders based on histopathology.
Results: Using unsupervised clustering on the imaging features, the patients were divided accurately between responders and nonresponders. Out of all determined features, kep (p = 0.04), Ktrans (p < 0.01), and percent volume (p = 0.02) for well-perfused habitats were significantly lower in nonresponders, whereas volume (p = 0.04) and percent volume (p < 0.01) for necrotic habitats were significantly higher in responders.
Conclusion: Prediction of treatment response in soft tissue sarcoma patients yielded promising results when utilizing differences in Dynamic Contrast Enhanced- and Diffusion Weighted-MRI features between unique tumor habitats.
Keywords
Pattern Recognition; DCE-MRI; DW-MRI; mpMRI; Soft Tissue Sarcoma
Introduction
Soft tissue sarcomas are a rare but diverse form of cancer with over 50 different subtypes [1]. Due to the heterogeneity of sarcomas, patients often require personalized treatment plans involving radiation, chemotherapy, and surgery, but treatment often is ineffective with a five year survival rate of 64% [2]. Methods to evaluate and monitor soft tissue sarcomas are needed to improve management of the disease. Among potential prognostic factors, the amount of necrosis in soft tissue sarcoma tumors has been found to be predictive of local outcome and recurrence based on resected tumor samples [3]. An in vivo technique to identify tumor composition would potentially allow prediction of patient response to treatment. In imaging, the concept of “habitats” was introduced to map tumor heterogeneity and quantify amounts of each different microenvironment [4–6].
Several studies have explored the use of Dynamic Contrast Enhanced-MRI (DCE-MRI) for prediction of treatment response in soft tissue sarcoma patients [7–10]. DCE-MRI measures perfusion by observing the flow of contrast through tissue over time, producing signal-versus-time curves. Pharmacokinetic fitting of signal-versus-time curves in tumor voxels revealed parameters that allowed prediction of treatment response with promising results [7, 9, 10]. Another functional technique, Diffusion Weighted Imaging (DWI), may provide additional predictive parameters. DWI offers a measure of cellularity by observing water diffusion patterns in tissue, producing Apparent Diffusion Coefficient (ADC) values. DWI has never been demonstrated on pre-treatment prediction of response in sarcoma patients but has shown promise in treatment monitoring [11–15]. However, analyses of both DCE-MRI and DWI datasets in these studies are still performed on the whole tumor ROI, considering the tumor as a homogenous region. The presence of heterogeneous habitats could potentially be masked by an analysis averaging over the entire area of the tumor.
Consideration of signal-versus-time curves and ADC values from different tumor habitats would offer additional features for prediction while providing a more accurate depiction of tumor state than grouping curves from different habitats in the same analyses. Using pattern recognition techniques, a method to determine the location and distribution of tumor habitats from DCE-MRI datasets has been previously demonstrated [5]. Well-perfused, hypoxic, and necrotic habitats were determined in pre-clinical prostate and brain tumor models, as well as in clinical sarcoma and prostate datasets. Habitat quantitative features, extracted from DCE-MRI and DWI sequences, could potentially be associated with the treatment outcomes of soft tissue sarcomas through a radiomics approach. Radiomics data have proven capable for building descriptive and predictive models relating image features to outcomes, including in sarcomas [16].
In this paper, we utilize knowledge of the location and volumes of tumor habitats in soft tissue sarcomas to generate habitat-specific features for use in prediction of treatment response. Features include pharmacokinetic parameters from modeling of signal-versus-time curves from DCE-MRI and ADC values. The use of multiple features and features native to individual habitats is explored to provide more accurate prediction that may facilitate effective treatment management for soft tissue sarcoma patients.
Methods
Study Protocol
All procedures performed in studies involving human participants were in accordance with the ethical standards of the institutional and/or national research committee and with the 1964 Helsinki declaration and its later amendments or comparable ethical standards. Eight patients (58.6 ± 10.2 y/o) diagnosed with soft tissue sarcomas were enrolled in an Institutional Review Board-approved study. For this retrospective study, informed consent was waved. DCE- and DWI sequences were acquired for each patient, prior to receiving neoadjuvant chemo/radiation therapy. Pathology was performed upon resection of tumors, revealing percent necrosis of sample by which response was determined and by which results from MRI analysis could be compared. Patients’ clinical information and treatment response are described in Table 1.
Table 1. Patient clinical information and treatment response.
|
Patient |
Response |
Age |
Gender |
Diagnosis |
% Necrosis on Path |
Treatment |
|
1 |
y |
56 |
F |
Extraskeletal osteosarcoma |
99 |
4 cycles neoadjuvant chemo |
|
2 |
y |
65 |
F |
Pleomorphic fibrosarcoma |
100 |
unplanned excision then got chemo/XRT |
|
3 |
y |
67 |
F |
Myxofibrosarcoma |
100 |
neoadjuvant chemo/XRT |
|
4 |
y |
56 |
F |
Pleomorphic Rhabdomyosarcoma |
30 |
VAI cycle |
|
5 |
n |
67 |
M |
Extraskeletal osteosarcoma |
25 |
history of unplanned excision then Carboplatin/Adriamycin |
|
6 |
y |
67 |
M |
Pleomorphic fibroblastic sarcoma |
40 |
neoadjuvant chemo/XRT then amputation |
|
7 |
n |
53 |
F |
Synovial sarcoma |
10 |
neoadjuvant chemo |
|
8 |
n |
38 |
M |
Fibrosarcoma |
10 |
3 cycles adriamycin/ifos and 2 cycles gem/tax then amputation |
MRI Protocol
Imaging parameters for DW and DCE-MRI scans for each patient are listed in detail in Table 2. Briefly, were carried out either on a 3T Skyra or 1.5T Symphony MR Scanner (Siemens, Erlangen, Germany).
Table 2. Patient imaging parameters.
|
Patient |
1 |
2 |
3 |
4 |
5 |
6 |
7 |
8 |
|
|
MRI |
Siemens Trio |
Siemens Trio |
Siemens Symphony |
Siemens Trio |
Siemens Trio |
Siemens Trio |
Siemens Skyra |
Siemens Skyra |
|
|
Field (T) |
3 |
3 |
1.5 |
3 |
3 |
3 |
3 |
3 |
|
|
DCE-MRI |
TR/TE (ms) |
6.87/3.15 |
6.87/3.15 |
5.05/2.4 |
6.95/3.05 |
6.85/3.2 |
6.85/3.2 |
4.1/1.87 |
4.1/1.87 |
|
Image Cube |
192 × 174 × 32 |
192 × 174 × 40 |
256 × 256 × 60 |
192 × 114 × 36 |
192 × 174 × 28 |
174 × 192 × 28 |
384 × 384 × 52 |
384 × 384 × 52 |
|
|
Voxel Size (mm) |
1.35 × 1.35 × 5 |
1.35 × 1.35 × 5 |
0.86 × 0.86 × 3.5 |
1.88 × 1.88 × 5 |
1.20 × 1.20 × 5 |
1.20 × 1.20 × 5 |
0.52 × 0.52 × 5 |
0.52 × 0.52 × 3.5 |
|
|
Flip Angle (deg) |
10 |
10 |
10 |
10 |
10 |
10 |
10 |
10 |
|
|
Time Between Scans (s) |
10 |
11 |
40 |
8 |
14 |
8 |
25 |
25 |
|
|
Number of Image Sets |
32 |
34 |
11 |
25 |
23 |
44 |
13 |
13 |
|
|
Scan Duration (min) |
5.2 |
6.1 |
6.7 |
3.2 |
5.1 |
5.7 |
5 |
5 |
|
|
Time Before Contrast (min) |
~0.5 |
~0.5 |
~1.5 |
~0.5 |
~0.5 |
~0.5 |
~1 |
~0.5 |
|
|
DW-MRI |
TR/TE (ms) |
4200/71 |
4411/71 |
5800/94 |
5900/63 |
4600/85 |
3500/71 |
5500/59 |
6470/84 |
|
Image Cube |
128 × 128 × 30 |
128 × 128 × 32 |
256 × 256 × 40 |
128 × 78 x50 |
128 × 128 × 20 |
128 × 128 × 25 |
160 × 160 × 30 |
160 × 160 × 33 |
|
|
Voxel Size (mm) |
1.88 × 1.88 × 6 |
1.88 × 1.88 × 6 |
0.86 × 0.86 × 7.2 |
2.81 × 2.81 × 5 |
1.56 × 1.56 × 5 |
1.88 × 1.88 × 5 |
1.38 × 1.38 × 7.2 |
1.38 × 1.38 × 4 |
|
|
Flip Angle (deg) |
180 |
102 |
90 |
180 |
180 |
180 |
180 |
180 |
|
|
b-value |
0, 400 |
0, 400 |
0, 450 |
0, 400 |
0, 400 |
0, 400 |
0, 600 |
0, 600 |
Abbreviations: TR = Repetition time; TE = Echo time.
DCE-MRI analysis
Tumor Volumes of Interest (VOIs) for each patient were contoured manually in MIM (MIM, Cleveland, Ohio) by an experienced skeletomuscular radiologist (T.S.). DCE-MRI signal-versus-time curves from VOIs were analyzed using Constrained Non-Negative Matrix Factorization (cNMF), as detailed in previous publications [5, 17], to reveal the distribution of habitats. The method uncovers the main patterns underlying the signal-versus-time curves and the weights of these constituent patterns in each voxel. The number of these patterns, associated with different tumor habitats was set to three to account for well-perfused, hypoxic, and necrotic habitats.
To assign voxels to specific habitats, a threshold of 60% was applied to the cNMF weights, whereby voxels containing a given habitat at a greater fraction than the threshold were assigned to that habitat. For instance, if for a given voxel the fraction of hypoxic, necrotic and well-perfused habitats were 10%, 20% and 70%, the voxel was considered part of the well-perfused habitat. Conversely, if the contribution of the habitats were 30%, 30% and 40%, the voxel was not assigned to any habitat. The signal-versus-time curves for the voxels corresponding to a given habitat were averaged together, producing a representative curve for each habitat. Pharmacokinetic modeling was performed on these representative curves using a Tofts model [18, 19]. Using the synthetic Parker fixed population average Arterial Input Function (AIF) [20] the volume transfer constant between plasma and Extracellular Extravascular Space (EES), Ktrans (related to perfusion and permeability per unit volume of tissue), the fractional volume ve of the EES and kep, the ratio of Ktrans and ve, also known as the efflux rate constant, were quantified. In addition, the volume of each habitat was determined and also divided against the overall tumor volume to obtain percent volume of habitats.
ADC analysis
DCE-MRI and ADC maps were co-registered in MIM. The same tumor VOIs and tumor habitats determined from the DCE-MRI analysis were applied to the ADC. Average ADC values for voxels corresponding to well-perfused, hypoxic, and necrotic habitats were determined.
Prediction of patient response
The association between (i) the imaging features for each habitat: Ktrans, kep, volume, percent from tumor volume, and ADC and (ii) patient response to neoadjuvant therapy was investigated using hierarchical clustering of patient features. Features involving habitats that were not present in a given tumor were set to 0. The final two clusters at the top level of the clustergram were determined to be the groups of patients corresponding to patients predicted to be responders and nonresponders.
Results
Quantitative measures, including habitat-specific Ktrans, kep, volume, percent volume, and mean ADC for well-perfused, hypoxic, and necrotic habitats are listed in Table 3. Three habitats were identified in 7 patients and 2 habitats in one patient. Roughly, similar fractions of necrotic habitats were determined between the present approach and pathology. An example of habitat locations and signal-versus-time curves in a patient is shown in Figure 1. Ktrans showed an increasing trend from necrotic to hypoxic to well-perfused habitats, which generally contained voxels with curves with the highest Ktrans. Similarly, kep showed a decreasing trend from necrotic to hypoxic to well-perfused habitats, which generally contained voxels with curves with the lowest kep. Volume, percent volume, and mean ADC did not have an apparent trend with habitat type.
Table 3. Quantitative measures for patients based on analysis of DCE-MRI data.
|
Patient |
1 |
2 |
3 |
4 |
5 |
6 |
7 |
8 |
AUCs |
|
ADC P |
1698.80 |
1068.13 |
1661.21 |
1409.64 |
895.34 |
1174.13 |
1228.84 |
869.90 |
0.87 |
|
ADC H |
1799.99 |
893.60 |
1699.28 |
1579.02 |
– |
1094.47 |
1373.16 |
858.20 |
0.87 |
|
ADC N |
1981.61 |
773.29 |
1803.19 |
1427.77 |
824.05 |
1042.94 |
1531.73 |
992.00 |
0.67 |
|
kep P |
0.29 |
0.04 |
0.23 |
0.40 |
0.31 |
0.33 |
0.89 |
1.23 |
0.87 |
|
kep H |
0.34 |
0.07 |
0.19 |
0.71 |
– |
0.48 |
0.59 |
0.88 |
0.60 |
|
kep N |
0.09 |
0.41 |
0.10 |
0.26 |
0.13 |
0.01 |
0.10 |
0.50 |
0.67 |
|
Ktrans P |
0.05 |
0.00 |
0.23 |
0.04 |
0.31 |
0.05 |
0.49 |
0.40 |
1.00 |
|
Ktrans H |
0.03 |
0.00 |
0.19 |
0.03 |
– |
0.05 |
0.16 |
0.28 |
0.60 |
|
Ktrans N |
0.01 |
0.00 |
0.10 |
0.01 |
0.10 |
0.01 |
0.06 |
0.14 |
0.87 |
|
Tumor Vol |
180.94 |
45.93 |
215.40 |
386.74 |
15.09 |
362.08 |
40.37 |
64.00 |
0.93 |
|
P Vol |
18.40 |
6.86 |
38.82 |
46.59 |
6.24 |
33.49 |
8.51 |
15.91 |
0.87 |
|
H Vol |
24.90 |
5.99 |
42.23 |
53.42 |
– |
91.92 |
7.32 |
13.74 |
0.87 |
|
N Vol |
137.64 |
33.74 |
134.34 |
286.74 |
8.85 |
236.66 |
11.61 |
15.44 |
1.00 |
|
P Per |
0.10 |
0.15 |
0.18 |
0.12 |
0.41 |
0.09 |
0.21 |
0.25 |
1.00 |
|
H Per |
0.14 |
0.13 |
0.20 |
0.14 |
– |
0.25 |
0.18 |
0.21 |
0.53 |
|
N Per |
0.76 |
0.73 |
0.62 |
0.74 |
0.59 |
0.65 |
0.29 |
0.24 |
1.00 |
Abbreviations: P = Well-perfused; H = Hypoxic; N = Necrotic; Vol = Volume; Per = Percent Volume.
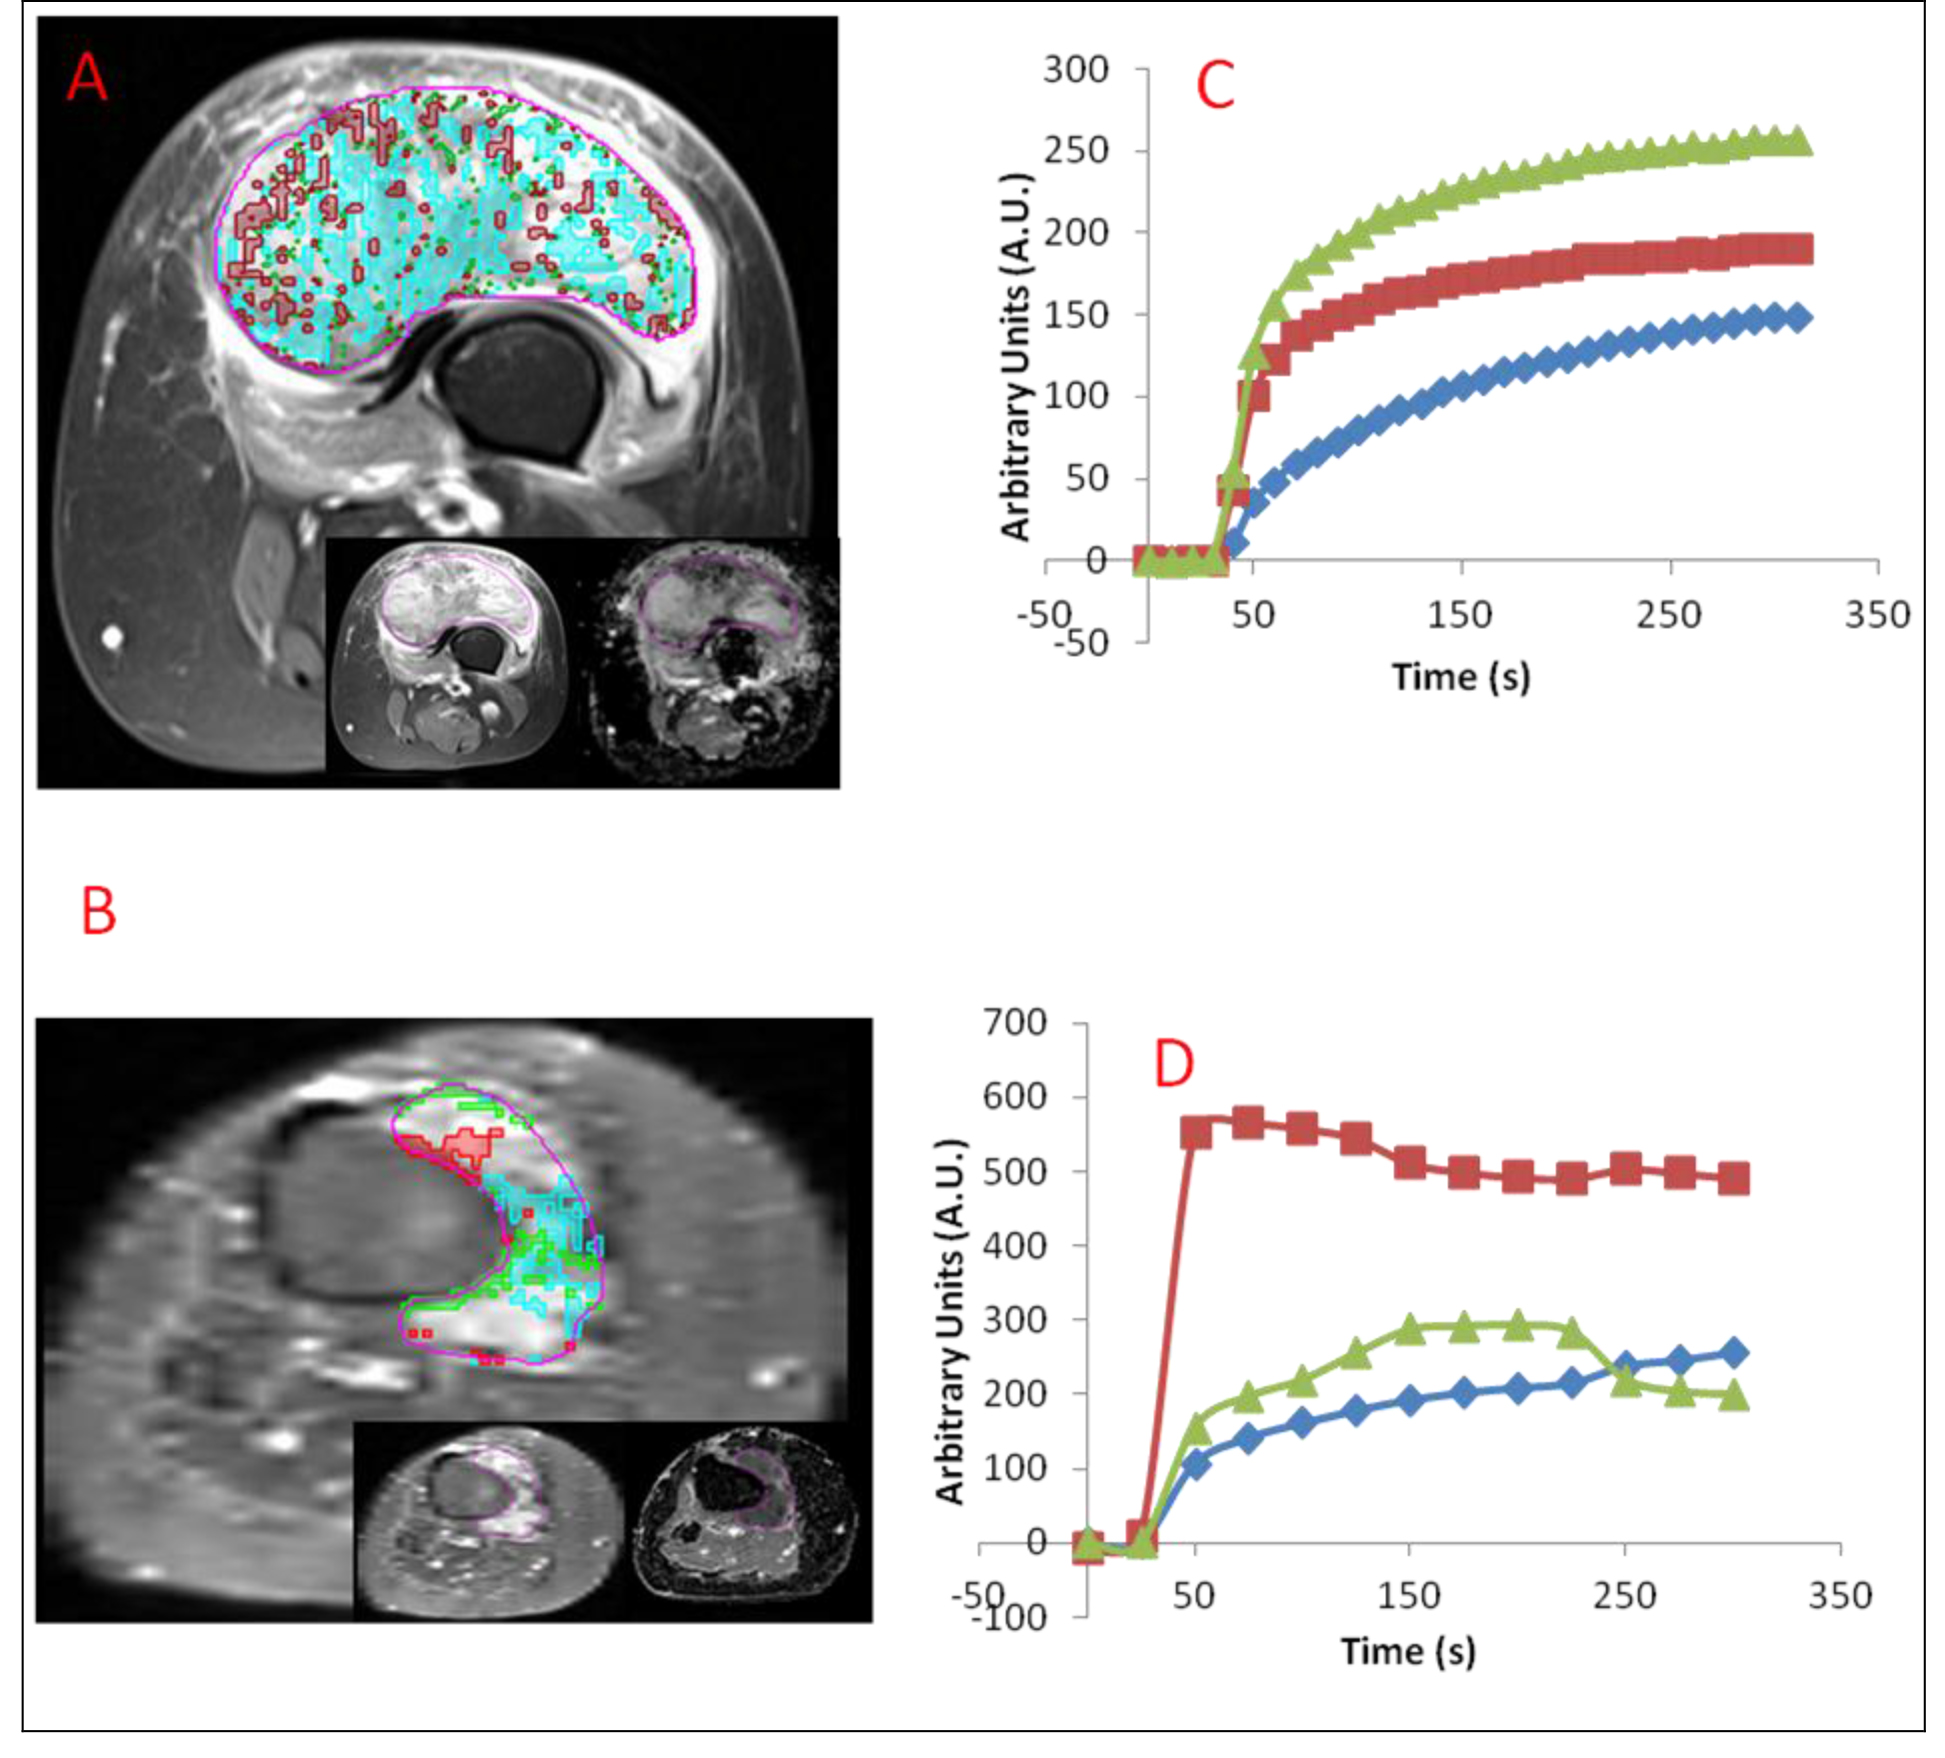
Figure 1. (A) Axial DCE-MRI of responding 56 year-old extraskeletal osteosarcoma female patient post-treatment. Well-perfused, hypoxic, and necrotic habitats determined in the patient are overlaid with red, green, and blue respectively. Early enhancing image from DCE-MRI (left) and ADC (right) are shown in inset from left to right. (B) Axial DCE-MRI of nonresponding 53 year-old synovial sarcoma female patient post-treatment. Well-perfused, hypoxic, and necrotic habitats determined in the patient are overlaid with red, green, and blue respectively. Early enhancing image from DCE-MRI (left) and ADC (right) are shown in inset from left to right. (C) Corresponding average signal-versus-time curves for each habitat are shown below for Fig. 1a. (D) Corresponding average signal-versus-time curves for each habitat are shown below for Fig. 1b.
Hierarchical clustering was performed on subject data using the quantitative measures described above (Figure 2). Two clusters were readily apparent, separating responding from non-responding patients. Parameters which were significantly correlated with response after correction for multiple comparison with Tukey’s honest significant difference test were kep well-perfused (p = 0.04), Ktrans well-perfused (p < 0.01), volume necrotic (p = 0.04), percent well-perfused (p = 0.02), and percent necrotic (p < 0.01). The well-perfused habitat’s characteristics: kep, Ktrans, and percent volume were lower in responders whereas volume necrotic and percent necrotic were higher in responders.
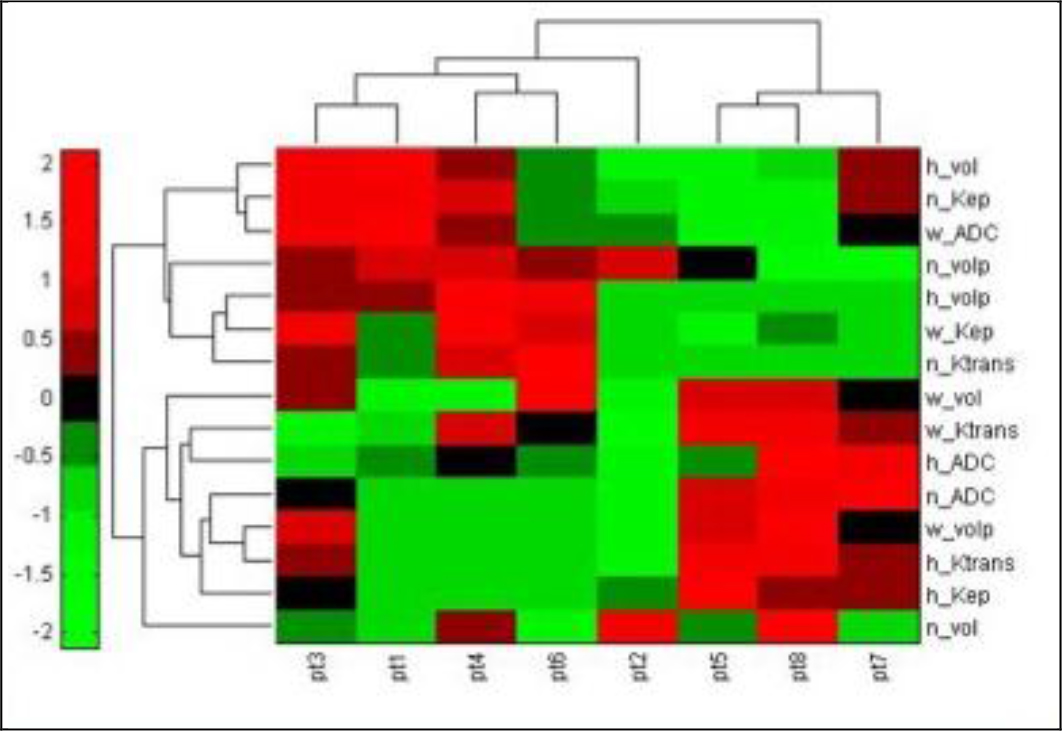
Figure 2. Heatmap showing hierachical clustering of 8 patients using quantitative imaging features. Nonresponders, patients 5, 7, and 8, are shown to be in a separate cluster from responders, patients 1, 2, 3, 4, and 6.
Discussion
In this feasibility study, a radiomics approach utilizing perfusion, diffusion and volumetric information from unique tumor habitats was applied to the prediction of treatment response in soft tissue sarcoma patients. Patients from a small sample set were correctly classified into responders and nonresponders, and habitat-related features were identified that had differentiating potential for the two populations. The success of the approach suggests that consideration of tumor heterogeneity is important for treatment prediction and that the state of the tumor may not be accurately represented by analyses of the whole tumor.
This importance of analysis of unique habitats to prognosis has primarily been recognized in breast cancer tumors. DCE-MRI studies of breast cancer have shown tumors with a larger proportion of voxels with fast washin and a steady plateau of washout, corresponding to the shape of curves in well-perfused habitats, are more likely to be malignant [21]. Numerous studies on breast cancer tumors have focused analyses on these ‘hot spots’ in tumors [22–27], determined by looking for contiguous ROIs of high enhancement in DCE-MRI datasets. Similar analyses have been performed on soft tissue sarcoma tumors [9, 28]. However, although ‘hot spot’ methods begin to consider the heterogeneity in tumors, they only focus on well-perfused habitats, whereas identification and analysis of additional tumor habitats can provide additional discriminatory features for treatment prediction as in the present study and offer a broader understanding of circumstances in the tumor. In addition, common problems with analysis of ‘hot spots’ include the selected ROIs are often manually contoured [22–26, 28] although semi-automated [29, 30] and automated methods [27] have been proposed. Manual contours produce significant variability in measurements derived from selected ROIs [30]. Analysis of ‘hot spots’ also often precludes the inclusion of anatomical features as only the highest enhancing voxels are selected, which may not extend to the whole extent of the habitat. The present approach has the benefit of addressing the two issues by automating delineation of tumor habitats, avoiding variability with manual selection of ROIs. The approach also allows detection of habitats at a subpixel resolution [5], leading to more accurate determination of habitat locations and allowing the analysis of both habitat-specific pharmacokinetic and anatomical parameters. Specifically, in sarcoma, a similar pattern recognition approach on DCE-MRI data has been applied with good agreement between determined habitats and histopathology [31].
Significant differences were seen in perfusion, diffusion and volumetric parameters from necrotic and well-perfused habitats between responders and nonresponders. The relation of treatment response with features in necrotic habitats may be expected due to the correlation of response to necrosis in pathological samples [3]. Percent volume and volume of necrosis directly relate to the amount of necrosis in tumors, whereas kep and Ktrans of necrotic habitats may represent how ‘necrotic’ those areas are, with lower values representing greater extent of cell death. Similarly, features associated with well-perfused regions may be expected to correlate with response based on past DCE-MRI findings. As mentioned, in breast cancer tumors, a greater proportion of well-perfused habitats have correlated with a greater chance of malignancy [21]. Since vascularity is necessary for growing tumors, well-perfused habitats would offer a window into the ‘health’ of tumors. In the case of sarcomas, lower kep and Ktrans in well-perfused habitats indicate slower diffusion from vessels into the extracellular space, suggesting a tumor lagging in growth and potentially less active. In the present study, no significant differences in parameters from DW-MRI, namely ADC, were found between responders and responders. Given prior work linking ADC to treatment monitoring in soft tissue sarcoma patients [11–15], the lack of discriminatory ability for ADC was unexpected. A possible explanation may the use of multiple b-values across multiple MR systems in DW-MRI acquisition. Different patients would potentially have datasets with different diffusion weighting and signal-to-noise confounding ADC values between responders and nonresponders. Standardized imaging parameters would allow more definitive assessment of the value of ADC to prediction of treatment response.
The study has several limitations that are typical for such pilot investigations. It is retrospective and includes a small number of patients. The analyzed patients had different types of sarcoma and varying treatment plans and imaging exam parameters. However, despite the heterogeneity in the dataset, results are promising on the limited samples. The nature of the approach provides quantitative measures robust to the variety of cases likely to be seen in sarcoma patients. Both ADC and pharmacokinetic parameters are derived to measure true physiological characteristics of the tumor (diffusion, contrast-to-tissue exchange rates) and thus can be assumed to be relatively independent from the imaging sequences.
The appeal of the proposed approach is the non-invasive way it can identify tumor habitats in vivo. For this purpose, a pattern recognition method was utilized that was previously validated on pre-clinical [5, 32] and clinical data [5]. The method assumed the presence of three habitats in tumors which corresponded well with results seen in the pre-clinical model [5, 32] as well as with literature where three shapes of curves have been observed in tumors [21]. Finally, patients enrolled in the study had heterogeneous presentations of sarcomas, including location, tissue types, and stage of sarcomas. Although differences in the patient population could provide a confounding factor in prediction of treatment response, these differences should serve to negatively impact prediction as prediction would be more difficult on a diverse set of patients.
In conclusion, in this pilot study the feasibility for prediction of treatment response in soft tissue sarcoma patients was demonstrated based on identification and analysis of tumor heterogeneity from mpMRI. Pharmacokinetic and anatomical information extracted from unique tumor habitats provided features that could separate responders and nonresponders, the combination of which provided more discriminatory ability than a single feature. A more extensive study will be needed in the future to validate the performance of this approach. For soft tissue sarcomas which encompass a broad range of tumors, additional information derived from the state and characteristics of tumor habitats may lead to a more accurate prediction of treatment response in patients.
Funding: NEI F30-EY027162 (sponsor had no role in the study design; in the collection, analysis and interpretation of the data; in the writing of the report; and in the decision to submit the paper for publication).
References
- In GK, Hu JS, Tseng WW (2017) Treatment of advanced, metastatic soft tissue sarcoma: latest evidence and clinical considerations. Ther Adv Med Oncol 9: 533–550.
- Society AC (2017) Cancer facts & figures. 2017.
- Eilber FC, Rosen G, Eckardt J, Forscher C, et al. (2001) Treatment-induced pathologic necrosis: a predictor of local recurrence and survival in patients receiving neoadjuvant therapy for high-grade extremity soft tissue sarcomas. J Clin Oncol 19: 3203–3209.
- Gatenby RA1, Grove O, Gillies RJ (2013) Quantitative imaging in cancer evolution and ecology. Radiology 269: 8–15. [crossref]
- Chang YC, Ackerstaff E, Tschudi Y, Jimenez B, et al. (2017) Delineation of Tumor Habitats based on Dynamic Contrast Enhanced MRI. Sci Rep 7: 9746.
- Tschudi Y, Pollack A, Punnen S, Ford JC, et al. (2018) Automatic Detection of Prostate Tumor Habitats using Diffusion MRI. Scientific Reports 8: 16801.
- Huang W, Beckett BR, Tudorica A, Meyer JM, Afzal A, et al. (2016) Evaluation of Soft Tissue Sarcoma Response to Preoperative Chemoradiotherapy Using Dynamic Contrast-Enhanced Magnetic Resonance Imaging. Tomography 2: 308–316. [crossref]
- Xia W, Yan Z, Gao X (2017) Volume fractions of DCE-MRI parameter as early predictor of histologic response in soft tissue sarcoma: A feasibility study. Eur J Radiol 95: 228–235.
- Alic L, van Vliet M, van Dijke CF, Eggermont AM, Veenland JF, et al. (2011) Heterogeneity in DCE-MRI parametric maps: a biomarker for treatment response? Phys Med Biol 56: 1601–1616. [crossref]
- Guo J, Reddick WE, Glass JO, Ji Q, et al. (2012) Dynamic contrast-enhanced magnetic resonance imaging as a prognostic factor in predicting event-free and overall survival in pediatric patients with osteosarcoma. Cancer 118: 3776–3785.
- Baunin C, Schmidt G, Baumstarck K, Bouvier C, et al. (2012) Value of diffusion-weighted images in differentiating mid-course responders to chemotherapy for osteosarcoma compared to the histological response: preliminary results. Skeletal Radiol 41: 1141–1149.
- Oka K, Yakushiji T, Sato H, Hirai T, et al (2010) The value of diffusion-weighted imaging for monitoring the chemotherapeutic response of osteosarcoma: a comparison between average apparent diffusion coefficient and minimum apparent diffusion coefficient. Skeletal Radiol 39: 141–146.
- Dudeck O, Zeile M, Pink D, Pech M, et al. (2008) Diffusion-weighted magnetic resonance imaging allows monitoring of anticancer treatment effects in patients with soft-tissue sarcomas. J Magn Reson Imaging 27: 1109–1113.
- Hayashida Y, Yakushiji T, Awai K, Katahira K, et al. (2006) Monitoring therapeutic responses of primary bone tumors by diffusion-weighted image: Initial results. Eur Radiol 16: 2637–2643.
- Thoeny HC, De Keyzer F, Chen F, Vandecaveye V, et al. (2005) Diffusion-weighted magnetic resonance imaging allows noninvasive in vivo monitoring of the effects of combretastatin a-4 phosphate after repeated administration. Neoplasia 7: 779–787.
- Crombé A, Périer C, Kind M, De Senneville BD, et al. (2018) T2 -based MRI Delta-radiomics improve response prediction in soft-tissue sarcomas treated by neoadjuvant chemotherapy. J Magn Reson Imaging. [crossref]
- Stoyanova R, Huang K, Sandler K, Cho H, et al. (2012) Mapping Tumor Hypoxia In Vivo Using Pattern Recognition of Dynamic Contrast-enhanced MRI Data. Transl Oncol 5: 437-U114.
- Tofts PS (1997) Modeling tracer kinetics in dynamic Gd-DTPA MR imaging. J Magn Reson Imaging 7: 91–101. [crossref]
- Tofts PS, Brix G, Buckley DL, Evelhoch JL, et al. (1999) Estimating kinetic parameters from dynamic contrast-enhanced T(1)-weighted MRI of a diffusable tracer: standardized quantities and symbols. J Magn Reson Imaging 10: 223–232.
- Parker GJ, Roberts C, Macdonald A, Buonaccorsi GA, et al. (2006) Experimentally-derived functional form for a population-averaged high-temporal-resolution arterial input function for dynamic contrast-enhanced MRI. Magn Reson Med 56: 993–1000.
- Kuhl CK, Mielcareck P, Klaschik S, Leutner C, et al. (1999) Dynamic breast MR imaging: are signal intensity time course data useful for differential diagnosis of enhancing lesions? Radiology 211: 101–110.
- Dongfeng H, Daqing M, Erhu J (2012) Dynamic breast magnetic resonance imaging: pretreatment prediction of tumor response to neoadjuvant chemotherapy. Clin Breast Cancer 12: 94–101.
- Su MY, Cheung YC, Fruehauf JP, Yu H, et al. (2003) Correlation of dynamic contrast enhancement MRI parameters with microvessel density and VEGF for assessment of angiogenesis in breast cancer. J Magn Reson Imaging 18: 467–477.
- Pickles MD, Manton DJ, Lowry M, Turnbull LW (2009) Prognostic value of pre-treatment DCE-MRI parameters in predicting disease free and overall survival for breast cancer patients undergoing neoadjuvant chemotherapy. Eur J Radiol 71: 498–505.
- Nagashima T, Sakakibara M, Nakamura R, Arai M, et al. (2006) Dynamic enhanced MRI predicts chemosensitivity in breast cancer patients. Eur J Radiol 60: 270–274.
- Hayes CP, A.R.; Leach, M.O. (2002) Assessing changes in tumour vascular function using dynamic contrast-enhanced magnetic resonance imaging. NMR Biomed 15: 154–163.
- Chen W, Giger ML, Bick U, Newstead GM (2006) Automatic identification and classification of characteristic kinetic curves of breast lesions on DCE-MRI. Med Phys 33: 2878–2887.
- van Rijswijk CS, Geirnaerdt MJ, Hogendoorn PC, Peterse JL, et al. (2003) Dynamic contrast-enhanced MR imaging in monitoring response to isolated limb perfusion in high-grade soft tissue sarcoma: initial results. Eur Radiol 13: 1849–1858.
- Liney GP, Sreenivas M, Gibbs P, Garcia-Alvarez R, et al. (2006) Breast lesion analysis of shape technique: Semiautomated vs. manual morphological description. Journal of Magnetic Resonance Imaging 23: 493–498.
- Mussurakis S, Buckley DL, Horsman A (1997) Dynamic MRI of invasive breast cancer: assessment of three region-of-interest analysis methods. J Comput Assist Tomogr 21: 431–438.
- Venianaki M, Salvetti O, de Bree E, Maris T, et al. (2018) Pattern recognition and pharmacokinetic methods on DCE-MRI data for tumor hypoxia mapping in sarcoma. Multimedia Tools and Applications 77: 9417–9439.
- Stoyanova R, Huang K, Sandler K, Cho H, et al. (2012) Mapping Tumor Hypoxia In Vivo Using Pattern Recognition of Dynamic Contrast-enhanced MRI Data. Transl Oncol 5: 437–447.