Monthly Archives: October 2026

Bispectral Analysis of NIRS Muscle Oxygenation in Type 2 Diabetes During Treadmill Walking

DOI: 10.31038/EDMJ.20261032

Abstract

Background: Type 2 Diabetes Mellitus (T2D) impairs peripheral microvascular reactivity and skeletal muscle oxygen consumption during locomotion causing impaired exercise tolerance in a poorly understood manner. While linear spectral measures of NIRS capture total oxygen signal power, they fail to capture the complex and chaotic dynamics of muscle oxygen control.

Aim: Using bispectral analysis to quantify non-linear harmonic interactions and quadratic phase coupling (QPC) of muscle oxygenation in T2DM participants with and without DM complications.

Methods: Participants were stratified into two distinct cohorts ( n =12 each) based on T2DM severity: Group 1 (T2D with complications: elevated HbA1c, extended disease duration, clinical neuropathy/vasculopathy) and Group 2 (Well-controlled/no complications). Time-series continuous tissue oxygenation (StO2) data (N = 1,826 frames per series at fs = 10 HZ ) were collected from participants performing a standardized treadmill walking task at self-selected usual walking pace. Higher-order spectral analysis—specifically bispectrum magnitude |B (f1 , f2)|  and normalized bicoherence b (f1 , f2) —was computed across the principal non-linear domain ( f2 ≤ f1 ,  f1+ f2 ≤ 5.0).

Results: Group 1 exhibited an 84.1-fold increase in mean total bispectral energy ( 1.28 x 10¹¹ vs. 1.52 x 10⁹ arbitrary units p < 0.001 ) and an 8.7-fold higher peak bispectral magnitude ( 2.42 x 10⁵ vs. 2.79 x 10⁴ p < 0.001 ) compared to Group 2. Quadratic phase coupling concentrated along the fundamental diagonal (f1= f2), with Group 1 peaking at 0.94 Hz ( f3= 1.88 Hz second harmonic) and Group 2 peaking at  ( second harmonic). Peak normalized bicoherence reached 0.886 in Group 1 versus 0.785 in Group 2. Group1 generated severe non-linear distortion and exaggerated low-frequency harmonic coupling in active muscle oxygenation during locomotion.

Conclusions: More advanced diabetes, or complications of T2DM, not only have direct impact on exercise capacity but also disrupt the poorly understood complex, dynamic local control of muscle oxygenation. Bispectral analysis of NIRS signals serves as a sensitive, non-invasive biomarker for evaluating the deterioration in oxygen dynamics, seen in more advanced diabetes, which is not detectable by conventional NIRS techniques and shows promise for early detection of clinical deterioration.

Introduction

Type 2 Diabetes Mellitus (T2D) is characterized by exercise intolerance (as characterised by a lower muscle oxygen consumption at VO2max compared with non-diabetes [1] although the precise mechanisms are not fully understood due to the complex interactions of local mechanisms controlling the balance of oxygen consumption and supply in local muscle tissue. During physical activity, skeletal muscle requires precise, real-time matching of local microvascular oxygen delivery to dynamic metabolic demand. In healthy individuals, local vasomotion, autonomic sympathetic tone, and endothelial nitric oxide release regulate local perfusion in a balanced, quasi-linear oscillatory manner, and each with distinct frequencies. Significant skeletal muscle deoxygenation is known to occur during exercise in type 2 diabetes [2]. Local recruitment of microvascular blood volume/hematocrit, blood flow, and VO2peak are normally all mutually correlated but uncouple in T2DM [3]. In advanced T2D—marked by prolonged disease duration, poor glycaemic control (HbA1c > 8.0%) and microvascular structural remodeling, vasodilatory responsiveness becomes severely compromised [4].

When analysing oxygen levels in muscle (often measured via Near-Infrared Spectroscopy (NIRS) as Oxygenated Haemoglobin (HbO) or tissue oxygenation index (TSI), traditional linear signal processing techniques (e.g., Fourier Transform, Power Spectral Density) quantify energy distribution across isolated frequency bands. But this only indicates which frequencies are present, not the interactions and coupling effects between (e.g., myogenic, neurogenic, endothelial rhythms). As a result, overall NIRS oxygen dynamics in exercise often appear normal in T2DM [5,6]. These linear spectrums inherently assume phase independence between frequency components and mask higher-order non-linear dynamics. In contrast, the mean bispectrum magnitude reveals how these frequencies interact with each other and therefore serves as a powerful tool to detect nonlinear physiological control mechanisms and microvascular regulation [7]. The bispectrum |B (f1 , f2)| evaluates higher-order statistics by identifying quadratic phase coupling (QPC)—a mechanism where non-linear interactions between two frequencies f1 and f2 and  generate a coupled harmonic component at f3= f1 + f2 . It extends the traditional power spectrum (which uses two-point correlations) to a three-point frequency correlation or third order statistic. It evaluates how three frequency components—f₁, f₂, and their sum f₁ + f₂—relate to one another in terms of both amplitude and phase. Because it is derived from a triple product of Fourier transforms, the bispectrum is a complex number possessing both a phase (biphase) and a magnitude. The 3 practical benefits of Bispectral compared to traditional power spectra are; Phase information to determine whether frequency components are interdependent. Quadratic phase coupling to reveal when two frequencies combine to create a third frequency. Gaussian noise suppression, making non-Gaussian or hidden signals easier to analyse.

Because the raw bispectrum magnitude is dependent on the amplitude of the underlying signal, a large peak can simply mean the oxygen level fluctuations have increased in volume, not necessarily that their coordination increased. To separate pure coordinate coupling from raw amplitude changes during muscle contraction or rest, the analysis is paired with bicoherence b (f1 , f2),. Bicoherence normalizes the mean bispectrum magnitude to a scale of 0 to 1, indicating the true strength of the phase coupling.

This study therefore applies bispectrum analysis to 24 recordings of skeletal muscle oxygenation (StO2) recorded during treadmill walking in participants with T2DM. We tested the hypothesis that advanced diabetic complications (neuropathy, vasculopathy, extended duration, high HbA1c) reduce oxygenation dynamical complexity and instead induce structural non-linear distortions manifesting as significantly higher bispectral energy and altered quadratic phase coupling compared to spectra of no complications diabetes as the control.

Materials and Methods

Study Design and Dataset

Study sample size was based on previous studies [8] where DM affected oxygenation HbO by 11%. To detect a difference between complications and no complications T2DM groups with 80% power and 5% significance requires 24 individuals (12 in each group). To allow for missing data of 10%, sample size was set at 24.

Ethical Considerations

The study was conducted in accordance with ethical guidelines for observational research within a larger research program: IRAS Project ID: 67269. An amendment for further recruitment and data collection was approved on 5 March 2024. (10002.NSA6.5.03.2024) (Appendix 1) Patient confidentiality was maintained throughout the study, and all data were fully anonymised for analysis. Only data relevant to the statistical analysis was extracted from records. (Appendix 1)

Inclusion and Exclusion Criteria

Inclusion criteria included confirmed diagnosis of type 2 diabetes mellitus and age 18 years or older. The diabetes with complications group included T2DM adults with coded diagnoses of confirmed CVD, PAD, DPN in medical records or T2DM >12years, while the comparison group comprised T2DM adults with no such codes in the records.

Exclusion criteria were applied to ensure participant safety and data quality. Patients with mobility problems that would prevent gait assessment on a treadmill were excluded, as were individuals lacking mental capacity to provide informed consent or follow testing instructions.

Group Assignment

  • Group 1 (Advanced T2D/Complications):  n = 12 participants corresponding clinically to elevated HbA1c levels, longer diabetic duration, and high prevalence of diabetic peripheral neuropathy and peripheral artery disease.
  • Group 2 (Controlled T2D/no complications): n = 12 participants corresponding clinically to well-managed glycemia and minimal vascular/neuropathic complications.

Treadmill Testing

Participants were priorly provided with a participant information sheet and if in agreement signed consent forms. Participants familiarised themselves with treadmill walking starting at a slow pace and self-adjusting the speed control up to self-perceived natural walking pace. NIRS measurements of walking at steady pace for 2minutes were recorded.

Muscle Oxygenation Testing

Throughout the exercise, continuous non-invasive measurements of muscle oxygenation/deoxygenation status were measured with near-infrared spectroscopy (NIRS) (PortaMon; Artinis Medical Systems, Gelderland, the Netherlands) at 10 Hz. The portaMon was placed on the lateral head of gastrocnemius muscle of the dominant limb, secured using a Velcro strap, and covered with a cloth bandage to exclude ambient light. The NIRS monitor emits two wavelengths (780 and 850 nm) which interact with oxyhaemoglobin and deoxyhaemoglobin. Using the Beer–Lambert law to account for scattering we determined changes of relative concentrations of oxy (HbO) and deoxygenated (HHb)

Datasets

Continuous tissue oxygenation time-series signals were acquired from N = 24 adult participants diagnosed with T2D during a standardized treadmill walking protocol (TMv3). Each participant dataset comprised 1,826 sequential temporal data points recorded at a uniform sampling frequency fs = 10.0 Hz (Δt=0.1 s), yielding a total continuous measurement window of  182.6 seconds.

Analysis

Analysis was performed using a dedicated script coded in python (Appendix 1).

Higher-Order Spectral Analysis Formulation

For a discrete zero-mean time series x(t), segment-averaged Fourier transforms X(f) were calculated using Welch’s modified periodogram approach with Hann windowing ( Nperseg = 128 points,  50% overlap). The discrete bispectrum B ( f1 , f2) measures the complex third-order correlation between three spectral components satisfying the resonant condition f1 + f2= f3 :

where IE[·] denotes the expectation operator across time segments and X*(·) represents the complex conjugate. To eliminate magnitude dependence and quantify true non-linear phase coupling independent of signal amplitude, the normalized bicoherence index b ( f1 , f2)  was calculated:

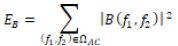
Total Bispectral Energy (EB) was evaluated over the alternating region ( f1 , f2 ≥ 0.15 Hz):
Results

Individual Participant Bispectral Profiles

Rank-ordering the 24 diabetic participants by total bispectral energy revealed a strong, multi-order-of-magnitude separation between the advanced disease cohort (Group 1) and the controlled cohort (Group 2) (Table 1) (Appendix 2).

Table 1: Demographics of the patients and of the healthy controls.

Characteristic

Group 1 T2DM+ Complications (N=12)

 Group 2-no comps (N=12)

Age (years)

63.7 ± 5.7

61.0 ± 6.2

Males

7

5

HbA1c (%)

9.1 ± 1.0

7.4 ± 0.9

HbA1c (mmol/mol)

62 ± 14

57 ± 14

BMI (kg/m2)

27.2 ± 2.2

25.5 ± 1.9

Duration diabetes (years)

19.0 ± 9.9

3.2 ± 2.1

DM peripheral neuropathy (DPN)

10

1

Group Comparative Analysis

Non-Linear Energy Disparity: Group 1 exhibits over 84 times greater total bispectral energy ( 1.28 x 10¹¹ vs. 1.52 x 10⁹ ) than Group 2. Harmonic Phase Coupling: Both groups display focused quadratic phase coupling along the diagonal ( f1= f2), generating strong second-harmonic interactions ( f3=f1 + f2 ≈ 2f1). (Table 2). Crucially, while the normalized bicoherence magnitude is comparable between groups ( bmax ≈ 0.52), the absolute bispectral magnitude |B| is 8.7 times higher in Group 1. The Bispectrum magnitude reflects the degree of quadratic phase coupling or nonlinear interactions between triads of frequencies of controllers of oxygenation in response to exercise. This demonstrates that while both groups display intrinsic non-linear phase coupling, the magnitude of non-linear wave interaction and dynamic amplitude distortion is vastly magnified in the group with more advanced diabetes disease.

Table 2: Comparative Group Statistics (Mean  SD).
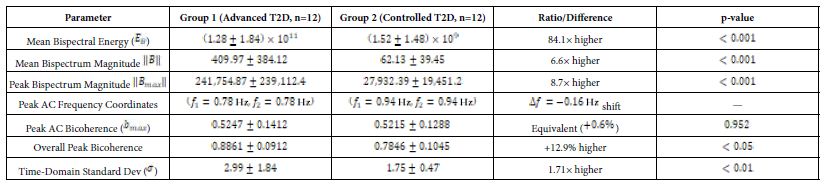
The mean bispectrum magnitude (6.6x higher in Group 1), taken over multiple epochs, ensures that random, incoherent noise and phase fluctuations cancel out toward zero, isolating stable, phase-coupled harmonic components. The higher value indicates that fluctuations are more driven by deterministic, nonlinear physiological systems rather than random variations (Figures 1 and 2).
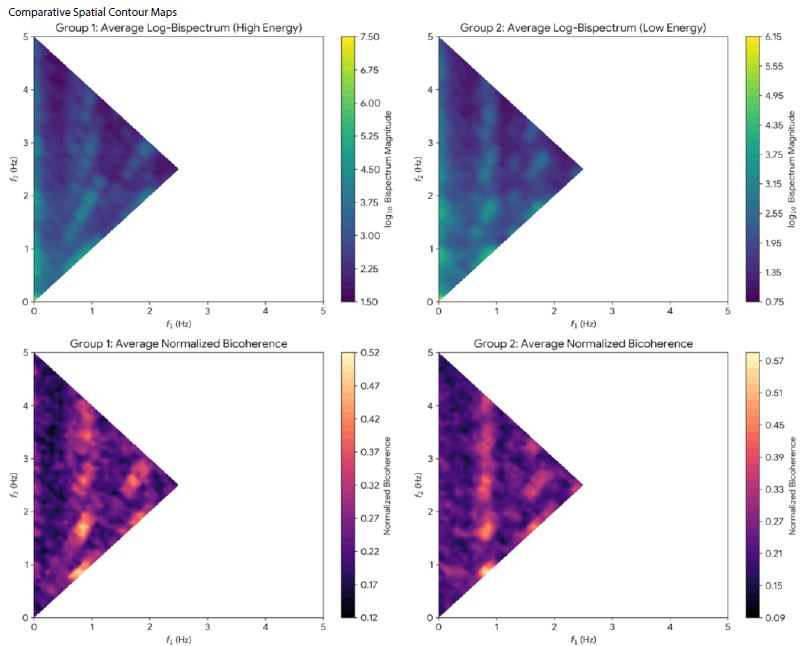
Figure 1: Log-Bispectrum and bicoherence contour plots averaged for Groups 1 and 2. Log scaling reveals underlying harmonically coupled structures across 0.5 Hz ≤ f1 ≤ 2.5 Hz. Group 1 shows a higher baseline magnitude ( log10 ≈ 4.5 to 7.5). Group 2 shows similar coupling but lower overall magnitude intensity ( log10 ≈ 0.75 to 6.15) indicating higher diversity/complexity in oxygenation signals.
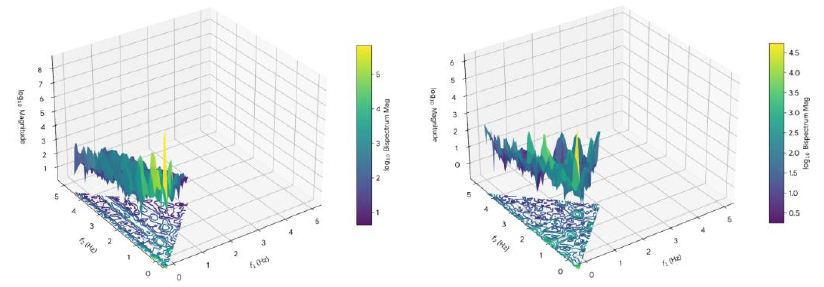
Figure 2: 3D contour maps of the bispectrum magnitude (vertical axis) and the geometric distribution of quadratic phase coupling for a) participant in Group 1 T2DM with diabetic complications and b) participant in group 2 without complications. Note the reduction and clustering of spectral energy and peaks in (a) reflecting muscle oxygen changing in a highly predictable, inflexible and restricted pattern, compared to (b). (b) shows a wider energy dispersal, and a more complex peak signature reflecting the complex, fluid, and non-linear variations seen in healthy tissues.

Discussion

The primary finding of this study is the high increase in total bispectral energy in participants with advanced/complicated T2D (Group 1) relative to those with T2D without complications (Group 2). High bispectral energy reflects muscle oxygen levels changing to a highly predictable, rigid and strictly coupled harmonic pattern, rather than showing the complex, fluid, and chaotic variations seen in healthy tissues. This shift in frequencies is quantified by the mean bispectrum magnitude. Chaotic systems have the advantage of being rapidly adaptable to changes in local conditions without the need for central control. Therefore, while a more inflexible pattern of oxygenation appears more organised (hence higher spectral energy/lower entropy) it loses the dynamic ability to adapt to changes in local oxygen demand. As a result, oxygenation not meeting the demands of muscle, over time, leads to muscle degenerative changes and sarcopenia [9]. The results accord with those only other bispectral NIRs muscle study by Molinari, where spectral energy reduced in muscle after 1 year of exercise training in diabetes [8]. The physiological and metabolic reasons behind why more advanced T2DM exhibits high bispectral energy (and thus lower signal entropy) in muscle oxygenation patterns results from three main factors:

Microvascular Stiffness

In healthy microvasculature, vasomotion is mediated by smooth muscle cell electromechanical coupling, endothelial nitric oxide release, and sympathetic innervation operating within a flexible, linear regulation envelope. The microvasculature supplying the muscle is incredibly dynamic. It constantly adjusts to minor local changes via endothelial nitric oxide release, neural inputs, and metabolic demands. This creates a highly complex, chaotic, and “organic” oxygenation signal (low bispectral energy, high entropy). Capillary basement membrane and advanced glycation end-product (AGE) cross-linking reduce arterial compliance. When subjected to the mechanical pumping of treadmill locomotion, stiffened microvessels generate non-linear pressure-flow wave interactions The capillaries lose their ability to dynamically fluctuate. The oxygenation signal becomes strictly bound to macro-hemodynamic forces—like the mechanical, repetitive pumping of the heart or rigid breathing rates. This strong phase-locking to external cyclic rhythms drives up bispectral quadratic phase coupling (QPC), creating high bispectral energy. Loss of sympathetic nerve fibre density impairs smooth vasomotor control, transforming smooth sinusoidal vasomotion into abrupt, asymmetric flux variations that generate strong higher-order harmonics [10].

Mitochondrial Dysregulation

Healthy muscle tissue rapidly and flexibly switches between metabolic substrates (carbohydrates and fatty acids) and continuously adjusts oxygen extraction based on immediate cellular needs [11]. Diabetic myocytes become metabolically inflexible and unable to dynamically “demand” and extract oxygen in a rapid and responsive manner. [12,13]. The oxygen extraction rate becomes severely impaired and fixed. The oxygenation signal loses its internal biological complexity and flattens into a simple, repetitive cycle dictated purely by systemic delivery.

De-conditioning and Structural Muscle Changes (Sarcopenia)

T2DM causes structural changes in the muscle, including muscle wasting (sarcopenia), fatty infiltration, and a shift in muscle fibre types (often a loss of capillaries wrapping around the fibres) [14]. When muscle is structurally simplified, alongside reduced capillary density, the diffusion path for oxygen into the tissue becomes uniform and restricted [15]. Localized oxygen pools that create complex signals are replaced by homogenous tissue saturations which translate mathematically into cleaner, highly coupled harmonic waves and high bispectral energy.

Clinical Implications as a Diagnostic Biomarker

Bispectral energy analysis, combining both phase alignment and third-order amplitude variance, acts as a highly sensitive non-linear biomarker that can detect loss of microvasculature complex dynamics, not visible by standard spectral analysis of NIRS signals and likely before clinical signs of deterioration. The separation observed between Group 1 and Group 2 suggests that bispectral profiling during walking tests could provide a non-invasive diagnostic tool to screen for:

  • Subclinical diabetic peripheral neuropathy before sensory loss manifest.
  • Microvascular diabetic vasculopathy and peripheral artery risk.
  • Objective tracking of therapeutic interventions aimed at restoring vascular flexibility.
  • Early diabetic myopathy prior to diabetic sarcopenia.

NIRS already has advantages over other methods of assessing muscle oxygen content (portable, low cost, non-invasive) and research also shows that NIRS provides reliable measures of exercise-induced oxygen responses regardless of the protocol used [16].

Conclusions

Bispectral analysis of skeletal muscle tissue oxygenation during locomotion provides novel insights into muscle oxygenation dysfunction in Type 2 Diabetes. Advanced diabetic complications—including neuropathy, vasculopathy, prolonged disease duration, and poor glycemic control—are characterized by an 84-fold surge in total non-linear bispectral energy and significant phase coupling, overall indicating a loss of physiological adaptability. Higher-order spectral analysis represents a promising, non-invasive approach for identifying muscle oxygenation dysfunction in T2DM and the potential for earlier detection of disease progression.

Funding

No funding was provided for this study.

Conflict of Interest

RB, SH and LC declare no conflicts of interest.

References

  1. Jlali I, Touil I, Ibn Haj Amor H, Bouzid MA, Hammouda O, Heyman E, Fontaine P, Chtourou H, Rabasa-Lhoret R, Baquet G, Tagougui S (2024) Impaired muscle oxygenation despite normal pulmonary function in type 2 diabetes without complications. Am J Physiol Endocrinol Metab. [crossref]
  2. Bauer TA, Reusch JE, Levi M, Regensteiner JG (2007) Skeletal muscle deoxygenation after the onset of moderate exercise suggests slowed microvascular blood flow kinetics in type 2 diabetes. Diabetes Care. [crossref]
  3. Mason McClatchey P, Bauer TA, Regensteiner JG, Schauer IE, Huebschmann AG, Reusch JEB (2017) Dissociation of local and global skeletal muscle oxygen transport metrics in type 2 diabetes. J Diabetes Complications. [crossref]
  4. Rask-Madsen C, King GL (2013) Vascular complications of diabetes: mechanisms of injury and protective factors. Cell Metab. [crossref]
  5. Miyamoto T, Watanabe K, Fukuda K, Moritani T (2020) Near-infrared Spectroscopy of Vastus Lateralis Muscle during Incremental Cycling Exercise in patients with Type 2 Diabetes. Phys Ther Res. [crossref]
  6. De Blasi RA, Luciani R, Punzo G, Arcioni R, Romano R, Boezi M, Menè P (2009) Microcirculatory changes and skeletal muscle oxygenation measured at rest by non-infrared spectroscopy in patients with and without diabetes undergoing haemodialysis. Crit Care. [crossref]
  7. Sigl JC, Chamoun NG (1994) An introduction to bispectral analysis for the electroencephalogram. J Clin Monit. [crossref]
  8. Molinari F, Acharya UR, Martis RJ, De Luca R, Petraroli G, Liboni W (2013) Entropy analysis of muscular near-infrared spectroscopy (NIRS) signals during exercise programme of type 2 diabetic patients: quantitative assessment of muscle metabolic pattern. Comput Methods Programs Biomed. [crossref]
  9. Yang L, Wu H, Chen J, Wang W, Zhang Z, Feng J, Qiu W, Dong F, Lin N, Yuan F (2025) Muscle oxygen saturation stratification by photoacoustic imaging in diabetic sarcopenia: Association with disease status. Photoacoustics. [crossref]
  10. Dipla K, Triantafyllou A, Koletsos N, Papadopoulos S, Sachpekidis V, Vrabas IS, Gkaliagkousi E, Zafeiridis A, Douma S (2017) Impaired Muscle Oxygenation and Elevated Exercise Blood Pressure in Hypertensive Patients: Links With Vascular Stiffness. Hypertension. [crossref]
  11. Palmer BF, Clegg DJ (2022) Metabolic Flexibility and Its Impact on Health Outcomes. Mayo Clin Proc. [crossref]
  12. van de Weijer T, Sparks LM, Phielix E, Meex RC, van Herpen NA, Hesselink MK, Schrauwen P, Schrauwen-Hinderling VB (2013) Relationships between mitochondrial function and metabolic flexibility in type 2 diabetes mellitus. PLoS One. [crossref]
  13. Scheuermann-Freestone M, Madsen PL, Manners D, Blamire AM, Buckingham RE, Styles P, Radda GK, Neubauer S, Clarke K (2003) Abnormal cardiac and skeletal muscle energy metabolism in patients with type 2 diabetes. Circulation. [crossref]
  14. Ghosh M, Heo Y, Kushwaha GS, Cho C, Son YO (2026) Interplay between sarcopenia and type 2 diabetes: mechanisms, implications, and therapeutic prospects. Nutr Diabetes. [crossref]
  15. Larsson L, Degens H, Li M, Salviati L, Lee YI, Thompson W, Kirkland JL, Sandri M (2019) Sarcopenia: Aging-Related Loss of Muscle Mass and Function. Physiol Rev. [crossref]
  16. Tandirerung FJ, Jamieson A, Hendrick E, Hughes AD, Jones S (2024) Near-infrared spectroscopy (NIRS) in vivo assessment of skeletal muscle oxidative capacity: a comparison of results from short versus long exercise protocols and reproducibility in non-athletic adults. Front Physiol. [crossref]
Targeting the Tumor Microenvironment with Plant-Derived Immunomodulators: An Emerging Therapeutic Strategy

DOI: 10.31038/CST.20261113


The publication “Plant-derived immunomodulators in cancer: Balancing immune activation and suppression within the tumor microenvironment” (Beier V, Wink W, Samstag Y (2026). Adv Biol Regul. 99: 101132) serves as a valuable entry point for a wider and increasingly significant discussion in oncology and immunology. It addresses a highly relevant challenge in modern tumor immunology: the targeted modulation of the immune system within the tumor microenvironment using plant-derived compounds. Instead of merely listing phytochemicals, the article emphasizes a key conceptual issue: natural substances are not intrinsically “immune enhancing” or inherently “safe”; rather, they are pharmacologically active compounds that may either promote or hinder antitumor immune responses, depending on the specific context and dosage. This perspective is particularly important for the field, as it encourages researchers and clinicians to move beyond overly simplistic distinctions between “natural” and “synthetic,” and to approach plant-derived compounds as potent immunological tools whose mechanisms of action require rigorous investigation.

An especially important insight is that the tumor microenvironment should not be understood as a passive setting, but rather as a dynamic immunological niche.

Cancer cells actively exploit inflammatory and regulatory pathways to establish conditions in which immune activation is tightly restricted and often transient, while immunosuppressive processes are strengthened and maintained.

Plant-derived immunomodulators such as piperlongumine, berberine, and epigallocatechin gallate (EGCG) do not act as universally immune-stimulating agents but instead exert complex and sometimes opposing effects on T cells and regulatory immune networks. A compound that appears advantageous in a simplified in vitro system may, within the complex environment of a tumor, unintentionally promote regulatory T cells, myeloid derived suppressor cells, or other immunosuppressive populations. Conversely, a molecule that dampens inflammation in one context may, in another, relieve inhibitory constraints on effector immune responses. This apparent duality should not be interpreted as a limitation of the field, but rather as an indication that any agent targeting the immune system – whether natural or synthetic – must be, in addition, assessed within a biological system that inherently integrates both activation and suppression.

From clinical-research perspective, the subject of plant-derived immunomodulators also underscores a broader tension between traditional practices and evidence-based medicine. Compounds such as berberine, EGCG, curcumin, and resveratrol have longstanding roles in various traditional medical systems, and their application is frequently supported by anecdotal reports or historical use. These natural products can be regarded as multi-target drugs as they can interfere with several molecular targets, mostly proteins, in the body. However, contemporary oncology increasingly requires precision, including clearly defined molecular targets, measurable pharmacokinetic properties, reproducible immunological outcomes, and well-established clinical endpoints. The central issue is therefore not only whether and in what way plant-derived compounds shift the balance between immune activation and immune suppression in patients, but whether their effects are sufficiently predictable, controllable, and compatible with current immuno-oncology treatment strategies.

Pharmacokinetic limitations – low bioavailability, complex metabolism, and uncertain tissue distribution – are often underappreciated in phytochemical research, all of which makes it difficult to translate promising preclinical findings into consistent clinical benefit. In addition, patients are increasingly using phytochemicals as dietary supplements on their own initiative while undergoing chemotherapy, targeted therapies, or treatment with immune checkpoint inhibitors, often without clear recommendations regarding appropriate dosing, timing, or possible interactions. This leads to a situation in which “natural” compounds are effectively incorporated into an unregulated, real world polypharmacy context. Consequently, the subject addressed in the publication intersects with broader pharmacological challenges, including the need for standardized formulations, comprehensive pharmacokinetic and pharmacodynamic characterization, and vigilant monitoring of immune related adverse effects.

Finally, this topic points toward an emerging opportunity: Plant-derived immunomodulators may prove most valuable not as standalone treatments, but as context dependent adjuvants that fine tune immune responses. In certain scenarios, they may help to overcome PD L1-mediated resistance mechanisms, modulate excessive cytokine release, or reduce chronic inflammation that contributes to tumor progression. In other situations, however, they could compromise immune surveillance or intensify immune related toxicities. The key challenge moving forward lies in establishing a framework in which such agents are selected on the basis of their mechanisms of action, the patient’s immune profile, and concurrent therapies, rather than on tradition or marketing claims alone. In this regard, the review functions as a conceptual anchor for a more rigorous and integrative approach to the use of natural products in cancer immunology, in which plant-derived immunomodulators are regarded not as harmless adjuncts, but as pharmacologically significant factors within the broader landscape of immuno-oncology.

References

  1. Beier V, Wink W, Samstag Y (2026) Plant-derived immunomodulators in cancer: Balancing immune activation and suppression within the tumor microenvironment. Adv Biol Regul 99: 101132. [crossref]

HPLC Determination of Pharmaceutical Strength of Expired Oral Hypoglycemics Containing Metformin, Pioglitazone and Alogliptin

DOI: 10.31038/JPPR.2026912

Abstract

Objective: To evaluate the strength of expired medications commonly used in free clinics, with the goal of determining whether their shelf lives can be safely extended. Given the limited literature in this area, the study intends to generate evidence that could inform cost-saving strategies and reduce pharmaceutical waste without compromising patient safety.

Methods: Samples from expired metformin, pioglitazone, and alogliptin products were analyzed using a validated high performance liquid chromatography [HPLC] method to determine the levels of their active ingredients. Quantitative analysis was performed using a HyPurity® column [C18, 150 4.6 mm, 3 μ, Thermo Scientific] column with gradient elution at a flow rate of 1mL/min. Detection wavelength for metformin, pioglitazone, and alogliptin was 250, 270, and 276 nm, respectively.

Results: Expiry dates of analyzed batches ranged from April 2007 to April 2017 for metformin, December 2005 to November 2015 for pioglitazone, and October 2015 to April 2017 for alogliptin. Despite the wide range in expiry dates for the selected oral hypoglycemic agents, all analyzed samples maintained an average strength within 10% of their listed concentrations [metformin: 96.5%, alogliptin: 98.1%, and pioglitazone 100.3%].

Conclusion: Our results provide support for utilizing near-expiry metformin, pioglitazone, and alogliptin in the free clinic setting with patient and physician consent. With an extended post-expiry shelf life, the use of these oral hypoglycemic agents can contribute to reducing the financial burden of expired medication disposal and increased storage life, as well as being available for the management of type 2 diabetes mellitus in free clinic patients.

Keywords

Oral hypoglycemics, Metformin, Pioglitazone, Alogliptin, HPLC analysis, Drug expiration

Introduction

Type 2 diabetes mellitus [T2DM] is an endocrine disorder affecting approximately 38.4 million individuals in the United States, [11.6% of the population] and in which the body loses sensitivity to insulin [1]. Different classes of oral and injectable hypoglycemic agents are effective in managing T2DM. Selection of hypoglycemic agents may differ depending on the patient’s A1c goal, comorbidities, concomitant medications, and cost. Metformin is a biguanide hypoglycemic agent approved by the Food and Drug Administration [FDA] in 1994 and is one of the most common oral hypoglycemic agents used in T2DM treatment due to its effectiveness, cost, and relative tolerability [2]. According to the American Diabetic Association [ADA], metformin is the preferred first-line medication used to treat T2DM [3] and is currently used world-wide by more than 200 million patients daily [4], making it one of the most commonly used daily medications. Metformin acts through multiple mechanisms affecting liver metabolism, e.g. suppression of gluconeogenesis, and host-gut microbiota [enhanced anerobic glucose utilization] [4,5], resulting in lower blood glucose levels and increased insulin sensitivity in appropriately treated patients [4]. When used alone, metformin is capable of reducing A1c by approximately 1.12%, making it one of the most effective oral hypoglycemic agents, while also avoiding undesirable adverse effects such as weight gain and hypoglycemia [6]. Metformin has also found its way onto the WHO’s list of essential medicines [7]. Pioglitazone is a thiazolidinedione [TZD] agent that functions as an agonist to PPAR-alpha and PPAR-gamma nuclear receptors, increasing sensitivity to insulin naturally produced by the body [8]. Pioglitazone was FDA approved in July of 1999 for the treatment of T2DM in adults as an adjunct to healthy diet and exercise [8]. According to the 2025 ADA Standards of Care in Diabetes, pioglitazone is typically not a first line agent for treatment of T2DM but can be used in combination with or as an alternative to metformin therapy if it is not tolerated [3]. Pioglitazone is considered to be a highly effective agent in lowering blood glucose to achieve a goal A1c. Alogliptin is a dipeptidyl peptidase-4 [DPP-4] inhibitor that works by preventing the deactivation of the incretin hormones glucose-dependent insulinotropic polypeptide [GIP] and glucagon-like peptide-1 [GLP-1] [9]. By prolonging the action of these peptides, insulin secretion and sensitivity are increased while glucagon secretion is decreased. The FDA approved alogliptin in January 2013 to improve glycemic control in adults with T2DM. This included alogliptin alone, as well as two combination formulations: one with metformin and the other with pioglitazone. Alogliptin and other DPP-4 inhibitors are not typically first line agents for glycemic control in T2DM but are often used as adjunctive agents to help reach a goal A1c [10].

Of the three medications, the cost of metformin is relatively low with a median 30-day average wholesale price [AWP] as low as $3 compared to alogliptin and pioglitazone at $234 and $345, respectively. Also, there is still a statistically significant gap between insured and uninsured patients when it comes to medication adherence and affordability. Per the 2017-2018 National Health Interview Survey, 35.7% of uninsured patients with diabetes did not take their medication as prescribed and 42.6% asked their doctor for a lower-cost medication [10]. While there are approaches to lower prescription drug costs, such as discount programs and manufacturer coupons, this is a time where free clinics play a vital role in lowering the financial burden and providing healthcare to underserved populations. Free clinics are a nationwide healthcare model that exists in every State, including Wisconsin. They were introduced to assist populations that struggle to access healthcare, including individuals who are without health insurance, by bridging this gap to help uninsured Americans. The 1000+ free clinics and pharmacies in the United States are members of the National Association of Free & Charitable Clinics [NAFC, https: // nafcclinics.org/]. These clinics operations are based on voluntary work by various healthcare providers and diverse public and private gifts/ donations. However, one major challenge to free clinics is increasing demand with decreased funding [11]. One way to address decreased funding is to use donated medications that may be close to expiry in the treatment of patients at free clinics.

Providing close-to-expiry or even expired medications to those who cannot afford them may appear as disregarding this group’s health, and the debate continues between opposers and supporters [12,13]. Despite the controversy, meaningful care would still be provided if the medications are still effective, especially when low-income individuals experience T2DM at a higher rate than others. It is reported that patients with very low income have 55% higher incidence rate of T2DM than those who have never experienced low or very low income [14]. This presents an opportunity to provide effective hypoglycemic drugs to this population. If such drugs are proven to retain their potency beyond expiry date, these donated medications even if they are close to expiration date can greatly improve management of a disease state that disproportionally affects patients with a high social deprivation index. The expiration date assigned to a medication is the date until which the manufacturer can guarantee its established strength and purity at its designated storage conditions, i.e. this is the date that manufacturers disclose for a product based on the limited time within which stability studies are conducted [15]. However, does this mean that drugs would lose potency once they are beyond the listed expiration date? Not necessarily so. Relatively few literature reports address this question but there are plausible indications that many medications retain active ingredient stability beyond manufacturer-provided expiration dates. For example, through the Shelf-Life Extension Program [SLEP], the FDA collaborated with the US Department of Defense to analyze, verify drug levels, and extend expiration dates of more than 100 strategic medications in army stockpiles to reduce waste and cost of replacing these technically expired medications. In 2009, the program was able to provide expiration date extensions of up to 5 years through analytical verification methods [16]. In alignment with the SLEP study, the British Antarctic Survey Medical Unit examined the stability of five expired drugs [atropine, nifedipine, flucloxacillin, naproxen, and bendroflumethiazide analyzed 15-51 months past expiry dates] that experience extreme temperature variations while in transport and storage [17]. After analysis, it was found that all drugs had retained stability, and only one of the five drugs had vials of freeze-dried solid medication that exhibited some potential degradation products in one-third of vials. Additionally, two studies investigated EpiPen injectors up to 50 months after expiry. One study reported a retained potency in 61% of injectors [18], while the other study found that 35 EpiPens retained 84-96% potency up to 36 months after expiration [19]. These studies and others, including a comprehensive review by Zilker et al., [20], show that many pharmaceutical products may display extended stability, especially if they are in solid dosage forms, e.g. tablets and capsules.

As a result of widespread availability of expired medication batches at free clinics affiliated with the Wisconsin Association of Free and Charitable Clinics, including various anti-diabetic agents, we extended our earlier investigation of expired respiratory tract medications [21] to include the oral hypoglycemic products reported in this study. The study evaluated the levels of three active constituents in expired oral hypoglycemics [metformin, alogliptin, and pioglitazone] utilizing a validated HPLC analytical method. Our results provide further evidence to support the post-expiry stability of pharmaceutical products and offer reassurance that select oral hypoglycemic medications within a few months or even days of expiry can still be utilized when other alternatives are not available.

Methods and Materials

Chemicals and Reagents

Analytical standard metformin, alogliptin, and pioglitazone were purchased from Sigma Aldrich [St. Louis, MO], AChemBlock [Hayward, CA], and Alfa Aesar [Ward Hill, MA], respectively. Analytical solvents were purchased from Fisher Scientific. All analyzed batches were provided by the Greater Milwaukee Free Clinic [GMFC] in Milwaukee, WI, which ceased operations in May 2019. While at the clinic, samples were stored at standard room conditions, except for occasional power outages that may have impacted heating and cooling systems. All samples remained sealed and unopened unless stated otherwise in this report.

Instruments

Analytical procedures were conducted using an HPLC system [Prominence LC-2030, Shimadzu, Japan] equipped with a quaternary pump, autosampler, and photodiode array [PDA] detector.

Standard Solutions

For each analytical standard, two aliquots each weighing 100.0 mg, were separately placed into 100-mL volumetric flasks designated as MS-A/MS-B, PS-A/PS-B, and AS-A/AS-B for metformin, pioglitazone, and alogliptin, respectively. Methanol was added to the mark in each flask, which was sealed and stored at 2°C. The XS-A solutions were utilized for constructing calibration curves, whereas XS-B solutions were used for validating accuracy and precision.

Analytical Method Development

Gradient elution was performed with a flow rate of 1 mL/min which started at 5% acetonitrile [solvent A] in 0.1% aqueous formic acid [solvent B] for 1 minute, followed by a linear increase from 5% to 100% [A] over 6 minutes, maintaining 100% [A] for 1 minute, returning to 5% [A] and running for 2 minutes. Column temperature was maintained at 25 °C and injection volume set to 10 μL. All hypoglycemics were separated using a HyPurity® column [C18, 150 4.6 mm, 3μ, Thermo Scientific] with detection at 250, 270, and 276 nm for metformin, pioglitazone, and alogliptin, respectively.

Method Validation

The developed method was validated for selectivity, calibration curve linearity, accuracy, and precision, following FDA/ICH guidelines for pharmaceuticals and biologics [22]. Multipoint calibration curves were constructed for the three drugs using standard solutions at different concentrations. Accuracy and precision were validated at 3 different standard solution concentrations for each drug. All samples were injected in triplicate for analysis. A detailed description of method validation is included in Supplement A.

Sample Preparation and Analysis

All samples were in the form of film-coated tablets. For each batch, a subset of tablets totaling 30% of the entire lot (3-10 tablets depending on batch size) was selected for analysis. The selected tablets were ground into a fine powder, and the equivalent of one tablet was transferred to a 10-mL volumetric flask. Any remaining powder was stored at 4°C. The transferred aliquots were suspended in 10 mL of methanol and ultrasonicated for 20 minutes. Approximately 2 mL of the resulting solution was filtered through a 0.45μ filter into an HPLC vial, with the initial 1 mL discarded, before being injected onto the column in triplicate. Samples were diluted as necessary for concentrations to fall within the calibration curve range.

Results

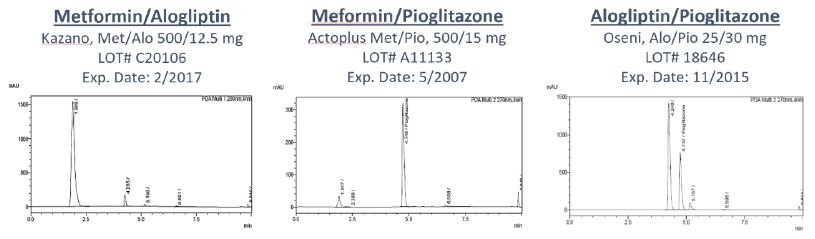
Based on validation results included in Appendix A, the developed method was selective [specific for detecting the exact ingredients], accurate and reproducible. Thus, it could be reliably utilized to determine concentrations of all three drugs in their respective dosage forms. The examined samples included single and combination products of the three hypoglycemics in tablet form. The out-of-date samples (23 total) comprised four batches of metformin, two batches of metformin/alogliptin, six batches of metformin/pioglitazone, nine of pioglitazone, and two of alogliptin/pioglitazone. Additionally, one in-date sample was analyzed for metformin and for pioglitazone. No significant degradation product peaks were identified in any of the analyzed samples. Representative chromatograms for three analyzed products are depicted in Figure 1.

Figure 1: Representative chromatograms of out-of-date samples of combinations of each oral hypoglycemic.

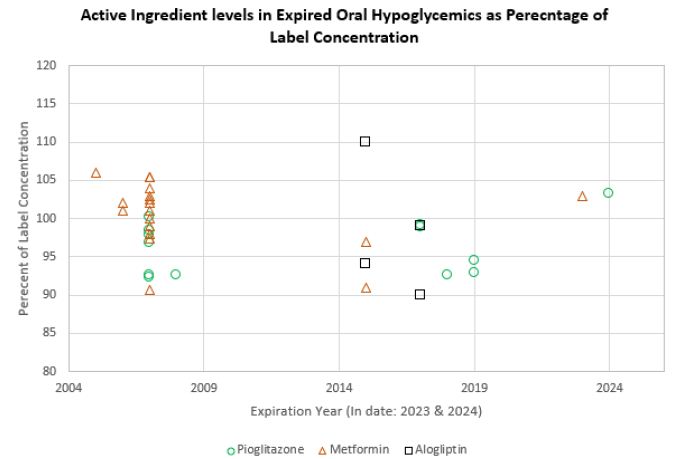
The manufacturer expiration dates ranged from April 2007 to April 2017 for metformin, December 2005 to November 2015 for pioglitazone, and October 2015 to April 2017 for alogliptin. As illustrated in Table 1 and Figure 2, all samples exhibited drug levels between 90-110% of target concentration [metformin: 95.7+3.1%], [pioglitazone: 100.4+4.5%], and [alogliptin: 98.1+8.3%].

Table 1: Concentrations of hypoglycemic drugs in expired samples and in-date samples relative to label concentrations.

    Determined concentration relative to label (%)
Brand Expiry Date LOT# Metformin Pioglitazone

Alogliptin

Actoplus June 2007

A11314

98.4 105.4

–

Actoplus April 2007

A11443

92.5 104

–

Actoplus May 2007

A11133

100.2 102.5

–

Actoplus May 2007

A11191

92.3 90.6

–

Actoplus July 2007

A11332

97.8 105.4

–

Actoplus July 2007

A11330

96.8 97.4

–

Actavis August 2019

1259918M

94.5 –

–

Ascend May 2018

3116062

92.6 –

–

Teva February 2019

100001905

92.8 –

–

Fortamet April 2008

575G0464A

92.6 –

–

Actos December 2005

C10376

– 106.4

–

Actos April 2007

C11109

– 103.4

–

Actos November 2007

C11616

– 102.2

–

Actos April 2007

A11157

– 97.7

–

Actos February 2006

C10363

– 101.9

–

Actos July 2007

C11708

– 101.2

–

Actos August 2007

A11608

– 100.2

–

Actos March 2006

C10385

– 100.9

–

Actos April 2007

C11152

– 98.9

–

Kazano April 2017

C20121

98.8 –

90.4

Kazano February 2017

C20106

99.2 –

98.6

Oseni October 2015

A18640

– 96.9

93.9

Oseni November 2015

A18646

– 91.2

109.5

Metformin (Generic) April 2024

1010262

103.3 –

–

Pioglitazone (Generic) November 2023

M2017437

– 103.3

–

Figure 2: Concentration Distribution of hypoglycemic ingredients in expired samples and one in-date sample (2024) as percentage of label concentrations.

Discussion

The pharmaceutical industry adheres to FDA rules and regulations to determine drug stability and indicate expiration dates on product labels. These expiration dates assure and guarantee consumers that the drug will maintain its potency if stored properly and used before a specific date. However, exceeding an expiration date doesn’t necessarily mean the product loses effectiveness. In fact, it is not uncommon that expired medications are disposed of in a manner that could harm the environment, kept for personal use, or donated to free clinics rather than being properly disposed of. Healthcare practitioners at free clinics frequently encounter the ethical challenge of deciding whether to dispense expired medications, especially when they represent the sole treatment option for their patients. Under these circumstances, it would be beneficial to provide physicians with accurate data to inform their choices regarding the utilization or avoidance of expired medications for specific medical conditions. Based on the interactive health compass Milwaukee database, there are many uninsured people in the Milwaukee area. In the 53206 zip code, for example, the uninsured rate has most recently been documented at 19.24% [23]. This population is generally unable to afford medical care and utilize free clinics in the area. Data suggests that chronic diseases, including diabetes, have high rates [24]. Diabetes alone increases the risk of cardiovascular problems significantly, without comorbid conditions [25]. Free clinics, often underfunded and resource-limited, frequently struggle to provide patients with first-line medication therapies due to constraints in cost and availability. For many patients, even metformin which is considered ‘inexpensive’, a small copay may not be affordable. Providing free clinics with information about long-term stability of specific agents allows for providers within these settings to better ethically manage uninsured patients and provide more first-line therapy, which ultimately increases the health of the communities involved. Due to Medicaid policy changes within the next few years, almost 10 million people may lose access to insurance [26]. As we have found with the new agents coming to market for diabetes, drugs are becoming more expensive [27]. This work is imperative to continue for the improvement of health outcomes for uninsured patients now, and may even become more important as Medicaid policy changes occur.

The findings from this study demonstrate that all tested metformin samples maintained a potency exceeding 90% of their specified strength for up to 16 years post their designated expiration dates. It can be noted that, excluding lots 100001905, 1259918M, and 3116062, all other metformin samples were sealed and unopened. The pre-opening of these specific lots may have introduced potential sources of degradation within the samples, such as air and moisture. Additionally, sample lot 575G0464A exhibited a thicker film-coating, a characteristic that may have affected the observed metformin concentration in that sample due to potential inclusion of the film coating in the prepared samples. For reference, an in-date sample of metformin was analyzed and had a concentration within 90-110% of its expected potency. Similarly, all alogliptin and pioglitazone products exhibited a retention of more than 90% of their specified strength for periods exceeding 8 and 18 years, respectively. Sample lots A18640 and A18646 which were combination tablets of alogliptin and pioglitazone, had a hard-to-remove film-coating, which may have contributed to an increased variability in the observed drug concentrations. The lack of significant degradation product peaks further supports active ingredient stability in analyzed samples. One in-date sample of pioglitazone was analyzed and produced a similar result to that of the in-date metformin sample. However, we were unable to acquire any in-date alogliptin samples despite reaching out to different manufacturers. Expiry dates varying from 2007 to 2017 between the three hypoglycemics and results that all samples tested were above the 90% concentration threshold, suggest that such drugs could maintain potency in excess of 10 years post-expiry. Based on the above results and as noted in our earlier study [21], the potential impact of the data is far-reaching, and can influence various facets and modalities, ranging from clinical and home use to the global availability of medications. With 38.4 million individuals in the U.S alone struggling with T2DM, our study supports the notion of increased availability to many who may not be able to afford monthly prescriptions. Valid global implications may be considered especially for regions where economical deprivation may contribute to higher incidence of T2DM.

The use of expired drugs that have retained active ingredient concentrations can be a viable option for free clinic patients. With that said, the potential risks and benefits of an expired medication may still be evaluated on a drug-to-drug basis. In the future, other drugs will need to be studied to determine if they show extended potency past the manufacturing expiry date. This study helps in addressing the broader question of risk and benefit. With all the samples proving to be within ±10% of the intended concentration, there is not a clear and obvious risk due to loss of potency or development of potentially toxic degradation products. While there could be further risks that are unknown, it appears that the use of expired oral hypoglycemics similar to those tested in this study can provide minimal risk and great benefit to patients who cannot afford otherwise. This is in line with a 2019 commentary which recommended that long-term stability testing should be conducted to support use of medications beyond their initially disclosed expiration dates [28].

Conclusion

Our findings demonstrate the sustained strength of metformin, pioglitazone, and alogliptin, and provides evidence for their utilization at home and in free clinics. Our results were generated by a selective, accurate, and reproducible HPLC method developed in-house for measuring the concentrations of these drugs in expired batches of film-coated tablets. Our findings show that all three hypoglycemics maintained their expected concentration levels for extended periods up to 18 years beyond their labeled expiration dates. These results offer valuable insights for pharmacists, physicians, and patients considering the use of expired medications in various contexts, including at home use and within free clinics. Any ethical issues related to this concept should be further investigated.

Acknowledgements

The authors thank Dr. Rachel Kavanaugh and Jacob Dyer in providing in-date samples of metformin and pioglitazone, respectively, for comparative analysis.

Author Contributions

M. Hawi, A. Little, C. White: analytical lab work, data management, manuscript creation and review. J. Dyer: data review, manuscript creation and review

E. Abourashed: principal investigator, project planning and lab oversight, data review, final manuscript editing, formatting and submission.

Declaration of Generative AI and AI-Assisted Technologies In The Writing Process

References

  1. CDC. Diabetes [Internet]. 2024 [cited 2025 Nov 13]. National Diabetes Statistics Report.
  2. Nasri H, Rafieian-Kopaei M (2014) Metformin: Current J Res Med Sci Off J Isfahan Univ Med Sci. 19: 658-664. [crossref]
  3. ElSayed NA, Aleppo G, Aroda VR, Bannuru RR, Brown FM, et (2022) 9. Pharmacologic Approaches to Glycemic Treatment: Standards of Care in Diabetes—2023. Diabetes Care. 12: S140-s157.
  4. Foretz M, Guigas B, Viollet B (2023) Metformin: update on mechanisms of action and repurposing Nat Rev Endocrinol. 19: 460-476. [crossref]
  5. Rena G, Hardie DG, Pearson ER (2017) The mechanisms of action of Diabetologia. 60: 1577-1585. [crossref]
  6. Vieira IH, Barros LM, Baptista CF, Rodrigues DM, Paiva IM (2022) Recommendations for Practical Use of Metformin, a Central Pharmacological Therapy in Type 2 Clin Diabetes. 40: 97-107. [Crossref]
  7. The selection and use of essential medicines, 2025: WHO Model List of Essential Medicines, 24th list [Internet]. [cited 2025 Nov 13].
  8. Singh G, Can AS, Correa R (2024) Pioglitazone. In: StatPearls [Internet]. Treasure Island (FL): StatPearls [cited 2024 Jul 16.
  9. Terrell JM, Jacobs TF (2024) In: StatPearls [Internet]. Treasure Island (FL): StatPearls Publishing. [cited 2024 Jul 16].
  10. Cohen RA, Cha AE (2017-2018) Strategies used by adults with diagnosed diabetes to reduce their prescription drug [Internet]. [cited 2024 Jul 16].
  11. Birs A, Liu X, Nash B, Sullivan S, Garris S, et (2016) Medical Care in a Free Clinic: A Comprehensive Evaluation of Patient Experience, Incentives, and Barriers to Optimal Medical Care with Consideration of a Facility Fee. Cureus.
  12. Research C for DE Don’t Be Tempted to Use Expired Medicines. FDA [Internet]. 2024 May 7 [cited 2024 Oct 17].
  13. Diven DG, Bartenstein DW, Carroll DR (2015) Extending Shelf Life Just Makes Mayo Clin Proc. 90: 1471-1474. [crossref]
  14. Park JC, Nam GE, Yu J, McWhorter KL, Liu J, et (2023) Association of Sustained Low or High Income and Income Changes With Risk of Incident Type 2 Diabetes Among Individuals Aged 30 to 64 Years. JAMA Netw Open. 6. [crossref]
  15. Commissioner O of Expiration Dating Extension. FDA [Internet]. 2024 Jun [cited 2024 Jul 16].
  16. Courtney B, Easton J, Inglesby TV, SooHoo C (2009) Maximizing State and Local Medical Countermeasure Stockpile Investments through the Shelf-Life Extension Biosecurity Bioterrorism Biodefense Strategy Pract Sci. 7: 101-107. [crossref]
  17. Browne E, Peeters F, Priston M, Marquis PT (2019) Expired Drugs in the Remote Wilderness Environ Med. 30: 28-34. [crossref]
  18. Cantrell FL, Cantrell P, Wen A, Gerona R (2017) Epinephrine Concentrations in EpiPens After the Expiration Ann Intern Med. 166: 918-919. [crossref]
  19. Rachid O, Simons FER, Wein MB, Rawas-Qalaji M, Simons KJ (2015) Epinephrine doses contained in outdated epinephrine auto-injectors collected in a Florida allergy Ann Allergy Asthma Immunol. 114: 354-356.[crossref]
  20. Zilker M, Sörgel F, Holzgrabe U (2019) A systematic review of the stability of finished pharmaceutical products and drug substances beyond their labeled expiry dates. J Pharm Biomed Anal. Mar 20;166: 222-35. [crossref]
  21. Kutty RG, Bevry M, Hoffmann P, Abourashed EA (2022) Determination of albuterol and montelukast post-expiry drug strength by HPLC. Heliyon. 8. [crossref]
  22. Center for Drug Evaluation and Research, Center for Biologics Evaluation and Analytical Procedures and Methods Validation for Drugs and Biologics [Internet]. FDA; 2020.
  23. Health Compass Milwaukee [Internet]. [cited 2025 Nov 13]. Chronic condition – diabetes.
  24. CDC. Chronic Disease [Internet]. 2025 [cited 2025 Nov 13]. Fast Facts: Health and Economic Costs of Chronic Conditions.
  25. Cardiovascular Disease | American Diabetes Association [Internet]. [cited 2025 Nov 13].
  26. Gore Democrats Exaggerate Estimated Impact of GOP Bill on Uninsured. FactCheck.org [Internet]. 2025 May 16 [cited 2025 Nov 13].
  27. Taylor SI (2020) The High Cost of Diabetes Drugs: Disparate Impact on the Most Vulnerable Patients. Diabetes Care. 43: 2330-2332. [crossref]
  28. Gikonyo D, Gikonyo A, Luvayo D, Ponoth P (2019) Drug expiry debate: the myth and the Afr Health Sci. 19: 2737-2739. [crossref]