Abstract
Background: Type 2 Diabetes Mellitus (T2D) impairs peripheral microvascular reactivity and skeletal muscle oxygen consumption during locomotion causing impaired exercise tolerance in a poorly understood manner. While linear spectral measures of NIRS capture total oxygen signal power, they fail to capture the complex and chaotic dynamics of muscle oxygen control.
Aim: Using bispectral analysis to quantify non-linear harmonic interactions and quadratic phase coupling (QPC) of muscle oxygenation in T2DM participants with and without DM complications.
Methods: Participants were stratified into two distinct cohorts ( n =12 each) based on T2DM severity: Group 1 (T2D with complications: elevated HbA1c, extended disease duration, clinical neuropathy/vasculopathy) and Group 2 (Well-controlled/no complications). Time-series continuous tissue oxygenation (StO2) data (N = 1,826 frames per series at fs = 10 HZ ) were collected from participants performing a standardized treadmill walking task at self-selected usual walking pace. Higher-order spectral analysis—specifically bispectrum magnitude |B (f1 , f2)| and normalized bicoherence b (f1 , f2) —was computed across the principal non-linear domain ( f2 ≤ f1 , f1+ f2 ≤ 5.0).
Results: Group 1 exhibited an 84.1-fold increase in mean total bispectral energy ( 1.28 x 10¹¹ vs. 1.52 x 10⁹ arbitrary units p < 0.001 ) and an 8.7-fold higher peak bispectral magnitude ( 2.42 x 10⁵ vs. 2.79 x 10⁴ p < 0.001 ) compared to Group 2. Quadratic phase coupling concentrated along the fundamental diagonal (f1= f2), with Group 1 peaking at 0.94 Hz ( f3= 1.88 Hz second harmonic) and Group 2 peaking at ( second harmonic). Peak normalized bicoherence reached 0.886 in Group 1 versus 0.785 in Group 2. Group1 generated severe non-linear distortion and exaggerated low-frequency harmonic coupling in active muscle oxygenation during locomotion.
Conclusions: More advanced diabetes, or complications of T2DM, not only have direct impact on exercise capacity but also disrupt the poorly understood complex, dynamic local control of muscle oxygenation. Bispectral analysis of NIRS signals serves as a sensitive, non-invasive biomarker for evaluating the deterioration in oxygen dynamics, seen in more advanced diabetes, which is not detectable by conventional NIRS techniques and shows promise for early detection of clinical deterioration.
Introduction
Type 2 Diabetes Mellitus (T2D) is characterized by exercise intolerance (as characterised by a lower muscle oxygen consumption at VO2max compared with non-diabetes [1] although the precise mechanisms are not fully understood due to the complex interactions of local mechanisms controlling the balance of oxygen consumption and supply in local muscle tissue. During physical activity, skeletal muscle requires precise, real-time matching of local microvascular oxygen delivery to dynamic metabolic demand. In healthy individuals, local vasomotion, autonomic sympathetic tone, and endothelial nitric oxide release regulate local perfusion in a balanced, quasi-linear oscillatory manner, and each with distinct frequencies. Significant skeletal muscle deoxygenation is known to occur during exercise in type 2 diabetes [2]. Local recruitment of microvascular blood volume/hematocrit, blood flow, and VO2peak are normally all mutually correlated but uncouple in T2DM [3]. In advanced T2D—marked by prolonged disease duration, poor glycaemic control (HbA1c > 8.0%) and microvascular structural remodeling, vasodilatory responsiveness becomes severely compromised [4].
When analysing oxygen levels in muscle (often measured via Near-Infrared Spectroscopy (NIRS) as Oxygenated Haemoglobin (HbO) or tissue oxygenation index (TSI), traditional linear signal processing techniques (e.g., Fourier Transform, Power Spectral Density) quantify energy distribution across isolated frequency bands. But this only indicates which frequencies are present, not the interactions and coupling effects between (e.g., myogenic, neurogenic, endothelial rhythms). As a result, overall NIRS oxygen dynamics in exercise often appear normal in T2DM [5,6]. These linear spectrums inherently assume phase independence between frequency components and mask higher-order non-linear dynamics. In contrast, the mean bispectrum magnitude reveals how these frequencies interact with each other and therefore serves as a powerful tool to detect nonlinear physiological control mechanisms and microvascular regulation [7]. The bispectrum |B (f1 , f2)| evaluates higher-order statistics by identifying quadratic phase coupling (QPC)—a mechanism where non-linear interactions between two frequencies f1 and f2 and generate a coupled harmonic component at f3= f1 + f2 . It extends the traditional power spectrum (which uses two-point correlations) to a three-point frequency correlation or third order statistic. It evaluates how three frequency components—f₁, f₂, and their sum f₁ + f₂—relate to one another in terms of both amplitude and phase. Because it is derived from a triple product of Fourier transforms, the bispectrum is a complex number possessing both a phase (biphase) and a magnitude. The 3 practical benefits of Bispectral compared to traditional power spectra are; Phase information to determine whether frequency components are interdependent. Quadratic phase coupling to reveal when two frequencies combine to create a third frequency. Gaussian noise suppression, making non-Gaussian or hidden signals easier to analyse.
Because the raw bispectrum magnitude is dependent on the amplitude of the underlying signal, a large peak can simply mean the oxygen level fluctuations have increased in volume, not necessarily that their coordination increased. To separate pure coordinate coupling from raw amplitude changes during muscle contraction or rest, the analysis is paired with bicoherence b (f1 , f2),. Bicoherence normalizes the mean bispectrum magnitude to a scale of 0 to 1, indicating the true strength of the phase coupling.
This study therefore applies bispectrum analysis to 24 recordings of skeletal muscle oxygenation (StO2) recorded during treadmill walking in participants with T2DM. We tested the hypothesis that advanced diabetic complications (neuropathy, vasculopathy, extended duration, high HbA1c) reduce oxygenation dynamical complexity and instead induce structural non-linear distortions manifesting as significantly higher bispectral energy and altered quadratic phase coupling compared to spectra of no complications diabetes as the control.
Materials and Methods
Study Design and Dataset
Study sample size was based on previous studies [8] where DM affected oxygenation HbO by 11%. To detect a difference between complications and no complications T2DM groups with 80% power and 5% significance requires 24 individuals (12 in each group). To allow for missing data of 10%, sample size was set at 24.
Ethical Considerations
The study was conducted in accordance with ethical guidelines for observational research within a larger research program: IRAS Project ID: 67269. An amendment for further recruitment and data collection was approved on 5 March 2024. (10002.NSA6.5.03.2024) (Appendix 1) Patient confidentiality was maintained throughout the study, and all data were fully anonymised for analysis. Only data relevant to the statistical analysis was extracted from records. (Appendix 1)
Inclusion and Exclusion Criteria
Inclusion criteria included confirmed diagnosis of type 2 diabetes mellitus and age 18 years or older. The diabetes with complications group included T2DM adults with coded diagnoses of confirmed CVD, PAD, DPN in medical records or T2DM >12years, while the comparison group comprised T2DM adults with no such codes in the records.
Exclusion criteria were applied to ensure participant safety and data quality. Patients with mobility problems that would prevent gait assessment on a treadmill were excluded, as were individuals lacking mental capacity to provide informed consent or follow testing instructions.
Group Assignment
- Group 1 (Advanced T2D/Complications): n = 12 participants corresponding clinically to elevated HbA1c levels, longer diabetic duration, and high prevalence of diabetic peripheral neuropathy and peripheral artery disease.
- Group 2 (Controlled T2D/no complications): n = 12 participants corresponding clinically to well-managed glycemia and minimal vascular/neuropathic complications.
Treadmill Testing
Participants were priorly provided with a participant information sheet and if in agreement signed consent forms. Participants familiarised themselves with treadmill walking starting at a slow pace and self-adjusting the speed control up to self-perceived natural walking pace. NIRS measurements of walking at steady pace for 2minutes were recorded.
Muscle Oxygenation Testing
Throughout the exercise, continuous non-invasive measurements of muscle oxygenation/deoxygenation status were measured with near-infrared spectroscopy (NIRS) (PortaMon; Artinis Medical Systems, Gelderland, the Netherlands) at 10 Hz. The portaMon was placed on the lateral head of gastrocnemius muscle of the dominant limb, secured using a Velcro strap, and covered with a cloth bandage to exclude ambient light. The NIRS monitor emits two wavelengths (780 and 850 nm) which interact with oxyhaemoglobin and deoxyhaemoglobin. Using the Beer–Lambert law to account for scattering we determined changes of relative concentrations of oxy (HbO) and deoxygenated (HHb)
Datasets
Continuous tissue oxygenation time-series signals were acquired from N = 24 adult participants diagnosed with T2D during a standardized treadmill walking protocol (TMv3). Each participant dataset comprised 1,826 sequential temporal data points recorded at a uniform sampling frequency fs = 10.0 Hz (Δt=0.1 s), yielding a total continuous measurement window of 182.6 seconds.
Analysis
Analysis was performed using a dedicated script coded in python (Appendix 1).
Higher-Order Spectral Analysis Formulation
For a discrete zero-mean time series x(t), segment-averaged Fourier transforms X(f) were calculated using Welch’s modified periodogram approach with Hann windowing ( Nperseg = 128 points, 50% overlap). The discrete bispectrum B ( f1 , f2) measures the complex third-order correlation between three spectral components satisfying the resonant condition f1 + f2= f3 :

where IE[·] denotes the expectation operator across time segments and X*(·) represents the complex conjugate. To eliminate magnitude dependence and quantify true non-linear phase coupling independent of signal amplitude, the normalized bicoherence index b ( f1 , f2) was calculated:

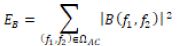
Total Bispectral Energy (EB) was evaluated over the alternating region ( f1 , f2 ≥ 0.15 Hz):
Results
Individual Participant Bispectral Profiles
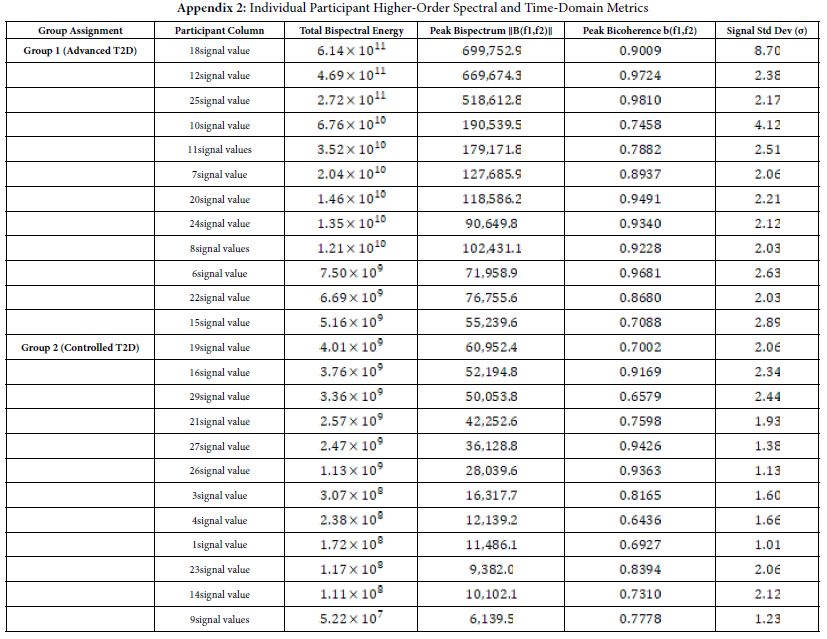
Rank-ordering the 24 diabetic participants by total bispectral energy revealed a strong, multi-order-of-magnitude separation between the advanced disease cohort (Group 1) and the controlled cohort (Group 2) (Table 1) (Appendix 2).
Table 1: Demographics of the patients and of the healthy controls.
|
Characteristic |
Group 1 T2DM+ Complications (N=12) |
Group 2-no comps (N=12) |
| Age (years) |
63.7 ± 5.7 |
61.0 ± 6.2 |
| Males |
7 |
5 |
| HbA1c (%) |
9.1 ± 1.0 |
7.4 ± 0.9 |
| HbA1c (mmol/mol) |
62 ± 14 |
57 ± 14 |
| BMI (kg/m2) |
27.2 ± 2.2 |
25.5 ± 1.9 |
| Duration diabetes (years) |
19.0 ± 9.9 |
3.2 ± 2.1 |
| DM peripheral neuropathy (DPN) |
10 |
1 |
Group Comparative Analysis
Non-Linear Energy Disparity: Group 1 exhibits over 84 times greater total bispectral energy ( 1.28 x 10¹¹ vs. 1.52 x 10⁹ ) than Group 2. Harmonic Phase Coupling: Both groups display focused quadratic phase coupling along the diagonal ( f1= f2), generating strong second-harmonic interactions ( f3=f1 + f2 ≈ 2f1). (Table 2). Crucially, while the normalized bicoherence magnitude is comparable between groups ( bmax ≈ 0.52), the absolute bispectral magnitude |B| is 8.7 times higher in Group 1. The Bispectrum magnitude reflects the degree of quadratic phase coupling or nonlinear interactions between triads of frequencies of controllers of oxygenation in response to exercise. This demonstrates that while both groups display intrinsic non-linear phase coupling, the magnitude of non-linear wave interaction and dynamic amplitude distortion is vastly magnified in the group with more advanced diabetes disease.
Table 2: Comparative Group Statistics (Mean SD).
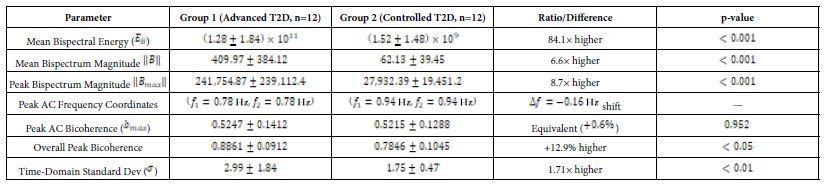
The mean bispectrum magnitude (6.6x higher in Group 1), taken over multiple epochs, ensures that random, incoherent noise and phase fluctuations cancel out toward zero, isolating stable, phase-coupled harmonic components. The higher value indicates that fluctuations are more driven by deterministic, nonlinear physiological systems rather than random variations (Figures 1 and 2).
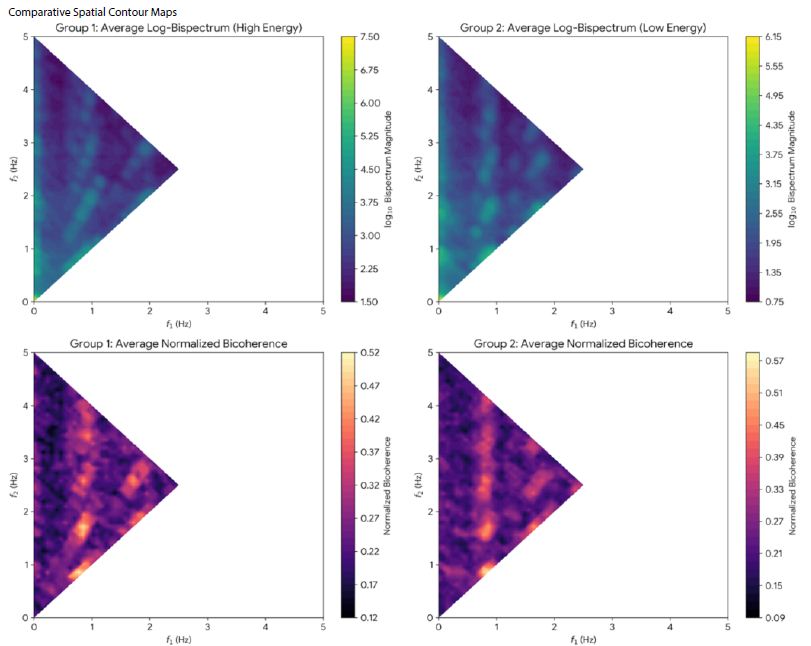
Figure 1: Log-Bispectrum and bicoherence contour plots averaged for Groups 1 and 2. Log scaling reveals underlying harmonically coupled structures across 0.5 Hz ≤ f1 ≤ 2.5 Hz. Group 1 shows a higher baseline magnitude ( log10 ≈ 4.5 to 7.5). Group 2 shows similar coupling but lower overall magnitude intensity ( log10 ≈ 0.75 to 6.15) indicating higher diversity/complexity in oxygenation signals.
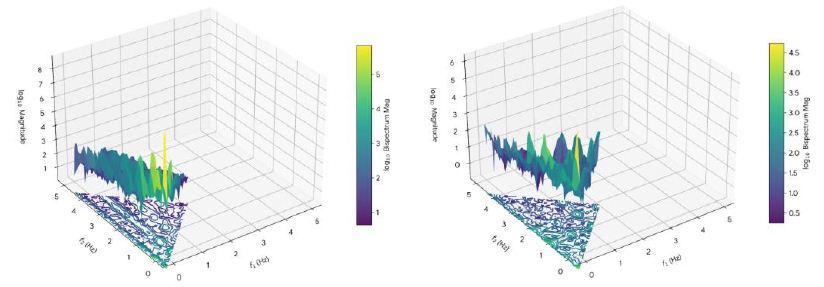
Figure 2: 3D contour maps of the bispectrum magnitude (vertical axis) and the geometric distribution of quadratic phase coupling for a) participant in Group 1 T2DM with diabetic complications and b) participant in group 2 without complications. Note the reduction and clustering of spectral energy and peaks in (a) reflecting muscle oxygen changing in a highly predictable, inflexible and restricted pattern, compared to (b). (b) shows a wider energy dispersal, and a more complex peak signature reflecting the complex, fluid, and non-linear variations seen in healthy tissues.
Discussion
The primary finding of this study is the high increase in total bispectral energy in participants with advanced/complicated T2D (Group 1) relative to those with T2D without complications (Group 2). High bispectral energy reflects muscle oxygen levels changing to a highly predictable, rigid and strictly coupled harmonic pattern, rather than showing the complex, fluid, and chaotic variations seen in healthy tissues. This shift in frequencies is quantified by the mean bispectrum magnitude. Chaotic systems have the advantage of being rapidly adaptable to changes in local conditions without the need for central control. Therefore, while a more inflexible pattern of oxygenation appears more organised (hence higher spectral energy/lower entropy) it loses the dynamic ability to adapt to changes in local oxygen demand. As a result, oxygenation not meeting the demands of muscle, over time, leads to muscle degenerative changes and sarcopenia [9]. The results accord with those only other bispectral NIRs muscle study by Molinari, where spectral energy reduced in muscle after 1 year of exercise training in diabetes [8]. The physiological and metabolic reasons behind why more advanced T2DM exhibits high bispectral energy (and thus lower signal entropy) in muscle oxygenation patterns results from three main factors:
Microvascular Stiffness
In healthy microvasculature, vasomotion is mediated by smooth muscle cell electromechanical coupling, endothelial nitric oxide release, and sympathetic innervation operating within a flexible, linear regulation envelope. The microvasculature supplying the muscle is incredibly dynamic. It constantly adjusts to minor local changes via endothelial nitric oxide release, neural inputs, and metabolic demands. This creates a highly complex, chaotic, and “organic” oxygenation signal (low bispectral energy, high entropy). Capillary basement membrane and advanced glycation end-product (AGE) cross-linking reduce arterial compliance. When subjected to the mechanical pumping of treadmill locomotion, stiffened microvessels generate non-linear pressure-flow wave interactions The capillaries lose their ability to dynamically fluctuate. The oxygenation signal becomes strictly bound to macro-hemodynamic forces—like the mechanical, repetitive pumping of the heart or rigid breathing rates. This strong phase-locking to external cyclic rhythms drives up bispectral quadratic phase coupling (QPC), creating high bispectral energy. Loss of sympathetic nerve fibre density impairs smooth vasomotor control, transforming smooth sinusoidal vasomotion into abrupt, asymmetric flux variations that generate strong higher-order harmonics [10].
Mitochondrial Dysregulation
Healthy muscle tissue rapidly and flexibly switches between metabolic substrates (carbohydrates and fatty acids) and continuously adjusts oxygen extraction based on immediate cellular needs [11]. Diabetic myocytes become metabolically inflexible and unable to dynamically “demand” and extract oxygen in a rapid and responsive manner. [12,13]. The oxygen extraction rate becomes severely impaired and fixed. The oxygenation signal loses its internal biological complexity and flattens into a simple, repetitive cycle dictated purely by systemic delivery.
De-conditioning and Structural Muscle Changes (Sarcopenia)
T2DM causes structural changes in the muscle, including muscle wasting (sarcopenia), fatty infiltration, and a shift in muscle fibre types (often a loss of capillaries wrapping around the fibres) [14]. When muscle is structurally simplified, alongside reduced capillary density, the diffusion path for oxygen into the tissue becomes uniform and restricted [15]. Localized oxygen pools that create complex signals are replaced by homogenous tissue saturations which translate mathematically into cleaner, highly coupled harmonic waves and high bispectral energy.
Clinical Implications as a Diagnostic Biomarker
Bispectral energy analysis, combining both phase alignment and third-order amplitude variance, acts as a highly sensitive non-linear biomarker that can detect loss of microvasculature complex dynamics, not visible by standard spectral analysis of NIRS signals and likely before clinical signs of deterioration. The separation observed between Group 1 and Group 2 suggests that bispectral profiling during walking tests could provide a non-invasive diagnostic tool to screen for:
- Subclinical diabetic peripheral neuropathy before sensory loss manifest.
- Microvascular diabetic vasculopathy and peripheral artery risk.
- Objective tracking of therapeutic interventions aimed at restoring vascular flexibility.
- Early diabetic myopathy prior to diabetic sarcopenia.
NIRS already has advantages over other methods of assessing muscle oxygen content (portable, low cost, non-invasive) and research also shows that NIRS provides reliable measures of exercise-induced oxygen responses regardless of the protocol used [16].
Conclusions
Bispectral analysis of skeletal muscle tissue oxygenation during locomotion provides novel insights into muscle oxygenation dysfunction in Type 2 Diabetes. Advanced diabetic complications—including neuropathy, vasculopathy, prolonged disease duration, and poor glycemic control—are characterized by an 84-fold surge in total non-linear bispectral energy and significant phase coupling, overall indicating a loss of physiological adaptability. Higher-order spectral analysis represents a promising, non-invasive approach for identifying muscle oxygenation dysfunction in T2DM and the potential for earlier detection of disease progression.
Funding
No funding was provided for this study.
Conflict of Interest
RB, SH and LC declare no conflicts of interest.
References
- Jlali I, Touil I, Ibn Haj Amor H, Bouzid MA, Hammouda O, Heyman E, Fontaine P, Chtourou H, Rabasa-Lhoret R, Baquet G, Tagougui S (2024) Impaired muscle oxygenation despite normal pulmonary function in type 2 diabetes without complications. Am J Physiol Endocrinol Metab. [crossref]
- Bauer TA, Reusch JE, Levi M, Regensteiner JG (2007) Skeletal muscle deoxygenation after the onset of moderate exercise suggests slowed microvascular blood flow kinetics in type 2 diabetes. Diabetes Care. [crossref]
- Mason McClatchey P, Bauer TA, Regensteiner JG, Schauer IE, Huebschmann AG, Reusch JEB (2017) Dissociation of local and global skeletal muscle oxygen transport metrics in type 2 diabetes. J Diabetes Complications. [crossref]
- Rask-Madsen C, King GL (2013) Vascular complications of diabetes: mechanisms of injury and protective factors. Cell Metab. [crossref]
- Miyamoto T, Watanabe K, Fukuda K, Moritani T (2020) Near-infrared Spectroscopy of Vastus Lateralis Muscle during Incremental Cycling Exercise in patients with Type 2 Diabetes. Phys Ther Res. [crossref]
- De Blasi RA, Luciani R, Punzo G, Arcioni R, Romano R, Boezi M, Menè P (2009) Microcirculatory changes and skeletal muscle oxygenation measured at rest by non-infrared spectroscopy in patients with and without diabetes undergoing haemodialysis. Crit Care. [crossref]
- Sigl JC, Chamoun NG (1994) An introduction to bispectral analysis for the electroencephalogram. J Clin Monit. [crossref]
- Molinari F, Acharya UR, Martis RJ, De Luca R, Petraroli G, Liboni W (2013) Entropy analysis of muscular near-infrared spectroscopy (NIRS) signals during exercise programme of type 2 diabetic patients: quantitative assessment of muscle metabolic pattern. Comput Methods Programs Biomed. [crossref]
- Yang L, Wu H, Chen J, Wang W, Zhang Z, Feng J, Qiu W, Dong F, Lin N, Yuan F (2025) Muscle oxygen saturation stratification by photoacoustic imaging in diabetic sarcopenia: Association with disease status. Photoacoustics. [crossref]
- Dipla K, Triantafyllou A, Koletsos N, Papadopoulos S, Sachpekidis V, Vrabas IS, Gkaliagkousi E, Zafeiridis A, Douma S (2017) Impaired Muscle Oxygenation and Elevated Exercise Blood Pressure in Hypertensive Patients: Links With Vascular Stiffness. Hypertension. [crossref]
- Palmer BF, Clegg DJ (2022) Metabolic Flexibility and Its Impact on Health Outcomes. Mayo Clin Proc. [crossref]
- van de Weijer T, Sparks LM, Phielix E, Meex RC, van Herpen NA, Hesselink MK, Schrauwen P, Schrauwen-Hinderling VB (2013) Relationships between mitochondrial function and metabolic flexibility in type 2 diabetes mellitus. PLoS One. [crossref]
- Scheuermann-Freestone M, Madsen PL, Manners D, Blamire AM, Buckingham RE, Styles P, Radda GK, Neubauer S, Clarke K (2003) Abnormal cardiac and skeletal muscle energy metabolism in patients with type 2 diabetes. Circulation. [crossref]
- Ghosh M, Heo Y, Kushwaha GS, Cho C, Son YO (2026) Interplay between sarcopenia and type 2 diabetes: mechanisms, implications, and therapeutic prospects. Nutr Diabetes. [crossref]
- Larsson L, Degens H, Li M, Salviati L, Lee YI, Thompson W, Kirkland JL, Sandri M (2019) Sarcopenia: Aging-Related Loss of Muscle Mass and Function. Physiol Rev. [crossref]
- Tandirerung FJ, Jamieson A, Hendrick E, Hughes AD, Jones S (2024) Near-infrared spectroscopy (NIRS) in vivo assessment of skeletal muscle oxidative capacity: a comparison of results from short versus long exercise protocols and reproducibility in non-athletic adults. Front Physiol. [crossref]