Author Archives: author

The Challenge of Integrated Care

DOI: 10.31038/IMROJ.2021625

Introduction

Serious and continuing illnesses have risen to prominence everywhere with generally increased life expectancy and somewhat fewer threats to health and life due to acute illness [1]. Health care systems that invest heavily in acute hospitals are recognising the need to repurpose services to include care beyond their walls to where people with prevalent chronic illnesses live. Multiple services – both medical and social and often low-tech – are required by patients with multiple morbidities, not the stock-in-trade of many major hospitals.

Now, the intention is to provide care for the patient as an individual rather than as a recipient of separate programs of care for his or her several separate medical problems (arthritis, heart disease and mild dementia). Anecdotes tell of four cars parked outside the home of a patient with multimorbidity, each bearing a therapist for one aspect of the patient’s problems. Chronic diseases such as those mentioned are the leading cause of death in Australia, with over 51% of hospitalisations and 89% of deaths associated with chronic disease [1]. They also cause a large out-of-pocket burden for many, with as many as 78% of Chronic Obstructive Pulmonary Disease (COPD) patients experiencing economic hardship while managing their illness [2]. Many chronic diseases are preventable [3], but despite this, preventative health makes up only 1.3% of all health spending [4], begging the question ‘Is it time we evaluated our current system?’.

‘Integrated care’ refers to the concern to improve the overall patient experience, from prevention to post-discharge care, and attain both greater value and efficiency from our health delivery model. It aims to address the fragmentation which often occurs in patient services; through integrated care the hope is that now the patient will benefit from a more holistic, joined-up service so that useless duplication and inappropriate admissions to hospital will be reduced.

In Australia, which enjoys high levels of health and generous financial investment in health care, much experimentation has occurred with different configurations of integrated care (as this joined-up pattern of hospital and community care is termed). In western Sydney, two programs (among many) conducted in recent years give insights into what can be done with modest investment and decisive management to improve the quality of life of patients with multiple chronic problems. The two small examples with which we are familiar, do not provide a clear set of directions about what to do in providing integrated care. Rather, because of our marginal involvement in them we been able to observe their operation and note what works well.

The Respiratory Ambulatory Care Service (RACS)

To assist patients with severe chronic obstructive lung disease (and usually other problems as well), this program was established by Professor John Wheatley, a respiratory physician at Westmead Hospital, ably assisted by Mary Roberts, a nurse practitioner, at Blacktown Hospital in 2001 with NSW Health Chronic and Complex Care funding. Over the years it was modified to meet the needs of the population [5]. The program had 8 pulmonary rehabilitation classes a day across Western Sydney Local Health District, with 12 patients enrolled in each class, with a text message support service which had over 100 patients enrolled in the Breathlessness Clinic. These patients were assessed at Blacktown Hospital by a physician, a physiotherapist, and a nurse.

Initially starting as a pure pulmonary rehabilitation program, it developed into a comprehensive COPD management program with a 24-hour helpline with COPD action plans [6]. A ten-week program of exercises and support was arranged for each patient. They were then cared for at home by the ambulatory team with regular visits by the nurses. A laptop-based medical record was maintained for each patient. The laptop passed to the duty nurse each night. Each patient was encouraged to contact the team by phone if they had a problem, and many did, especially at night when an attack of breathlessness might lead to panic which, without the support of the RACS, usually led to an ambulance call to take them to the hospital emergency department.

A conversation at 2 am with a nurse who knew the patient and had their electronic record in front of them on their laptop, could help decide if hospital admission (the default option in the absence of someone to speak to, with massive social dislocation to the patient and expense to the health service) is required or whether the patient can be ‘talked down’ and reassured to go back to bed, their problem to be fully explored, at home, in daylight. Past patients also had access to this 24-hour helpline which was utilised by patients who had not been in years, and a monthly subscription newsletter for education and information.

The program has been fully described in publications [6] SRL assisted for two years as a respiratory physician, servicing a clinic once a week and occasionally accompanying the nurses on home visits.

The program was established by Wheatley because he saw how patients once beyond the hospital could easily flounder for lack of specialised support. General practitioners often did not have the time or the access to resources available to the RACS team. By maintaining strong links between the specialists and the nurse led RACS team, integration was achieved. The results of the program were impressive with hospital admissions halved among program participants in the year after enrolment compared with the year before. Furthermore, during ongoing the COVID-19 pandemic, RACS was altered to provide telehealth and tele-education, as well as text messaging support. This not only is a great example of how such a system can evolve to suit the needs of the population, but a potential glimpse into the future.

Perhaps the most important caution is that health service managers should not be seduced into supporting integrated care programs because they believe they save money (they may) but rather should support them because they lead to a better quality of life for enrolled patients, albeit often at increased cost. It is misleading in the long-term to promise without evidence that ‘integrated care reduces hospital costs by keeping people out of hospital.’

Worldwide, the demand for hospital beds is such that if a bed is emptied because a chronically ill patient is cared for in the community instead, it is quickly filled by someone else (say, with a femoral neck fracture) and the costs to the health system remain unchanged. Clinicians know this and their interest in integrated care is because it is good medicine, not because it is cheap. In recruiting clinical staff to integrated care programs it is important to make this point strongly.

The Western Sydney Integrated Care Demonstrator Project

In 2016, the New South Wales (NSW) Ministry of Health provided affirmative funding to several health districts to support demonstration projects in integrated care. An allocation to the Western Sydney Local Health District enabled the development, again with a nurse manager and this time an extensive team of health professionals of different disciplinary skills and interests from both the hospital and the community, in relation to the care of patients with diabetes, heart disease and cardiovascular problems.

Although these three disease themes were developed relatively independently, they were linked through patient recruitment and documentation. Hospital specialists were critical to the development and implementation of the project as were local general practitioners. Nurses played a pivotal role in making the program happen, assisting greatly in the recruitment of patients both in Westmead Hospital and the western Sydney community through general practice.

This was a more complex program than RACS and required more managerial effort because of the number and diversity of practitioners involved and because the motivation for the program was ‘top down’, i.e., it came from NSW Health primarily rather than from practitioner concerns for better care of their patients. Practitioners needed education and support to be persuaded to participate.

The program used several strategies, including care facilitators, extensive use of IT, action plans for specialist care, shared care plans, the establishment of a rapid access and stabilisation service for patients that avoided them having to use the Emergency Department if they deteriorated, support payments to general practices to enrol and document the progress of enrolees, and promotion of the concept of a patient centred medical home.

Qualitative evaluation of the program was conducted, and the results are detailed in two papers by the principal evaluation research person [7,8]. SRL chaired the evaluation research advisory committee for the program.

Conclusion

There are several takeaway messages from these two programs. First, there is a big challenge in bringing the multiple players, both in the community and in the hospital, into a harmonious and productive team. This requires sensitivity and professional management. Effective integrated care relies on negotiation among several professional groups and separate government agencies, e.g., health and social services. Second, the recruitment of patients to these programs necessitates patient explanation and a responsiveness to questions that patients will have about their continuing care. People who are sick are frequently anxious not only about their health but also about the adequacy and dependability of their care. Familiarity with one or more carers, often a nurse, is important to achieve continued participation by patients and their carers.

Third, integrated care programs must be well organised and managed and this requires resources both in terms of workforce and money. The lines of responsibility (and accountability) are often long and intertwined and it is unusual for this arrangement to proceed smoothly in every respect. Negotiation is needed at many points in the program and once again time and patience are needed. The development of tailored IT arrangements to enable integrated care is critical and time-consuming.

Fourth – and there is a serious risk here – the program may be hijacked by managers who are ignorant of the detail of effective integrated care and see it as a way to save money. This is implausible [9] and can lead to program failure. Advocacy for the program is essential at all stages. In this regard it is very helpful to have leadership in the management of the program by senior and respected clinicians, both in the hospital and also in the community.

Fifth, the evaluation of integrated care programs is difficult because of the complexity of the relations among different groups of players. Comparison of patients managed conventionally and via integrated care is hard to engineer to the rigorous standards of a randomised controlled trial. The outcomes desired from integrated care often have to do with marginal improvement in quality of life. Even using an end-point such as reductions in hospital admissions can miss the point: some patients may need more rather than fewer admissions if the integrated care program brings to light problems that were previously not managed or not managed well.

In conclusion, the use of integrated care for the optimal management of patients with complex, serious, and continuing illness offers advantages especially for those living outside institutions and not in hospitals or care homes. An effective integrated care program should include aspects of an increased focus on preventative and population health, changes to the patients experience while admitted in hospitals, and higher levels of community support and care for patients outside of hospital walls [10]. Although in its early stages of development, it is attracting great interest among patients, their carers and families, and clinicians seeking to offer them the best quality of care.

References

  1. Australian Institute of Health and Welfare 2020. Australia’s health 2020: in brief. Australia’s health series no. 17 Cat. no. AUS 232. Canberra: AIHW.
  2. Essue B, Kelly P, Roberts M, Leeder S, Jan S (2011) We can’t afford my chronic illness! The out-of-pocket burden associated with managing chronic obstructive pulmonary disease in western Sydney, Australia. J Health Serv Res Policy 16: 226-231. [crossref]
  3. Australian Institute of Health and Welfare 2014 Australia’s health 2014. Australia’s health series no. 14. Cat. no. AUS 178. Canberra: AIHW.
  4. HJ, AS (2017) Preventive health: How much does Australia spend and is it enough? Canberra: Foundation for Alcohol Research and Education.
  5. Smith TA, Roberts MM, Cho J-G, Klimkeit E, Luckett T, et al. (2020) Protocol for a Single-Blind, Randomized, Parallel-Group Study of a Nonpharmacological Integrated Care Intervention to Reduce the Impact of Breathlessness in Patients with Chronic Obstructive Pulmonary Disease. Palliative Medicine Reports 1: 296-306.
  6. Roberts MM, Leeder SR, Robinson TD (2008) Nurse-led 24-h hotline for patients with chronic obstructive pulmonary disease reduces hospital use and is safe. Intern Med J 38: 334-340. [crossref]
  7. Trankle SA, Usherwood T, Abbott P, Roberts M, Crampton M, et al. (2019) Integrating health care in Australia: a qualitative evaluation. BMC Health Services Research 19: 954.
  8. Trankle SA, Usherwood T, Abbott P, Roberts M, Crampton M, et al. (2020) Key stakeholder experiences of an integrated healthcare pilot in Australia: a thematic analysis. BMC Health Services Research 20: 925. [crossref]
  9. Nolte E, Pitchforth E (2014) What is the evidence on the economic impacts of integrated care? Copenhagen Ø, Denmark: World Health Organisation.
  10. Baxter S, Johnson M, Chambers D, Sutton A, Goyder E, et al. (2018) The effects of integrated care: a systematic review of UK and international evidence. BMC Health Services Research 18: 350. [crossref]

Chemical Composition Similarity Relationships among the Various Organs of the Ilex cornuta Lindl. & Paxton Based on the Analysis of Hydrophilic Volatile Compounds

DOI: 10.31038/IMROJ.2021624

Abstract

In performing molecular profiling of secondary metabolites, a lot of research has focused on biogenic volatile organic compounds with medium to low polarity. In this study, chemical composition similarity relationships among the various organs of the Ilex cornuta Lindl. & Paxton were assessed based on the analysis of hydrophilic volatile compounds. GC-MS analysis was conducted to characterize and classify the chemical compounds. A total of 36, 46, 42, 25, 64, 26 compounds have been respectively extracted from the root, stem, stem skin, leaf, flower and fruit. The six organs have 3 common compounds and large percentages of exclusive compounds ranging from 36.0% to 62.5% with a mean of 49.8%, indicating substantial component differences among the different organs. The percentage of overlapping compounds between each of the two organs ranges from 10.9% to 44.0%, which is relatively small, further demonstrating the strong organ specificity of the chemical composition. The overlapping index is used to reveal the similarity among the organs. The stem shares the maximum similarity while the fruit the minimum similarity with the other organs. Aside from fruit, the average overlapping indices between each of the other two organs correlate well to their physical proximity. In conclusion, hydrophilic volatile metabolites are a class of natural products that are rarely investigated but constitute a significant part of the plant chemical composition. Chemical profiling of these metabolites could provide a valuable tool for the plant taxonomy and help understand the chemically mediated biological phenomena.

Keywords

Chemical composition similarity, GC-MS, Hydrophilic volatile compounds, Ilex cornuta Lindl. & Paxton, Plant taxonomy

Introduction

Plant taxonomy is traditionally conducted based on macroscopic and microscopic morphological characteristics. Growing evidence suggests that many biologically relevant entities could be missed in the studies that rely solely on morphological traits, particularly since speciation is not always accompanied by morphological change [1,2]. In recent years, plant chemical taxonomy has been developed to perform classification based on a wide array of biologically active secondary metabolites [3]. The expression of secondary metabolites could vary due to convergent evolution or differential gene expression [4], suggesting that the metabolite content of plants may reveal more information on the bioactive pattern of plants in comparison to morphology characterization [5].

In performing molecular profiling of secondary metabolites, a lot of research has focused on biogenic volatile organic compounds with medium to low polarity [6-9]. Volatile compounds are secreted and part of them are volatilized immediately after secretion [10,11]. The remaining part is stored in the special structure of the plant as in the case of essential oils [12-14]. Additionally, Berlinck and collaborators found that the vast majority of new compounds from natural sources reported in recent literature are compounds of medium to low polarity. Water-soluble, volatile, minor and photosensitive natural products are yet poorly known. One of the possible reasons for this trend could be that organic solvents of medium to low polarity used in isolation procedures require less time and less sophisticated instrumentation to be evaporated [15]. The author speculates that there is a class of hydrophilic volatile compounds in plants that are dispersed or dissolved in the water phase, evaporated with water vapor, and whose polarity and volatility are somewhere between essential oils and water-soluble compounds. To protect this type of ingredients from loss during extraction, water vapor distillation is used to collect volatile compounds that are dispersed or dissolved in the plant’s water phase. The root, stem, stem skin, leaf, flower and fruit of the Ilex cornuta Lindl. & Paxton were analyzed as study samples. Volatile essential oils were removed by using Soxhlet extraction method. Hydrophilic volatile compounds obtained by water reflux extraction are characterized and classified by quantitative GC-MS. The study revealed the potential use of hydrophilic volatile metabolites in the plant taxonomy and understanding the chemically mediated biological phenomena.

Materials and Methods

Material

Ilex cornuta Lindl. & Paxton was collected in Nanjing, China. Its roots, stems, stem skins, leaves, flowers and fruits were washed, cut into pieces, dried at 30°C and stored at 2-8°C prior to use.

Chemicals and Reagents

Ethyl acetate was purchased from Xilong Chemical Co., Ltd (Shantou, China). Hexane was purchased from Shanghai Titan Scientific Co., Ltd (Shanghai, China). Activated carbon was purchased from Shanghai Chemical Reagent Procurement Center (Shanghai, China). C7-C40 saturated alkanes standard was purchased from Anpel Laboratory Technologies Inc. (Shanghai, China).

Sample Preparation

Each sample was sliced and dried at 30°C. After ground into powder, the samples were sieved through 80 mesh followed by 180 mesh. Approximately 6 g of the sample were subjected to Soxhlet extractor method with hexane for 24 hrs to remove essential oils and other lipophilic compounds. The remainder was then removed and dried at 30°C in the ventilation cabinet. Approximately 4 g of the dried powder was then added into a 6 x 7 cm nonwoven bag together with three glass balls of 4 cm diameter. At least 3 segments of thread were used to separate and tighten the bag into 3 parts, each containing a glass ball and even amount of the dried powder. The bag was then placed in a flask and 2100 mL of water was subsequently added to soak the powder for about 2 hrs. After reflux extraction for 6 hrs, 2 L of distilled water was collected. The same reflux extraction was repeated to collect another 1 L of distilled water for a total of 3 L. After cooling, activated carbon (4 g) was added to absorb the active ingredients from the 3 L of distilled water for about 8 hrs. The activated carbon containing the active ingredients was then filtered and dried at 30°C for 12 hrs. Ethyl acetate was subsequently added to isolate the active ingredients from the activated carbon using Soxhlet extractor method for 8 hrs. The resulting ethyl acetate extract was left in the ventilation cabinet to dry at 30°C. The dried active ingredients were finally re-dissolved using ethyl acetate, filtrated through 0.22 µm filter and analyzed using GC-MS.

GC-MS Analysis

Analysis of hydrophilic volatile compounds was performed using Shimadzu GCMS-QP2010 Single Quadrupole GC-MS (Kyoto, Japan). A Rxi-1 ms GC capillary column (30 cm length, 0.25 mm inner diameter and 0.25 µm thick film) from Shimadzu (Kyoto, Japan) was used for analysis.

One microliter of sample was injected in split mode with split ratio of 5 to 1. GC inlet temperature is set at 280°C. High purity nitrogen (≥99.999%) was used as carrier gas in constant flow mode at 1 mL/min. The initial temperature of the GC oven is set at 60°C and held for 1 min, then ramped at 4°C/min to 160°C and held for 3 mins, followed by 2°C/min to 280°C and held for 6 mins. Finally, the temperature is raised to 300°C at 4°C/min and held for 6 mins. The mass spectrometer was operated in positive electron ionization mode at 70 eV and all spectra were recorded in full scan with a mass range of 40-700 Da. The interface temperature is set at 280°C and ion source temperature is set at 250°C.

Data Processing and Compound Identification

The GC-MS data processing was done with Shimazdzu GCMS Solution software. Compound identification was performed by applying several assignments, e.g., reference standard analysis, retention index calculation, and by NIST08 Spectrum Library comparison. Only peaks with area greater than 3 million are analyzed. The overlapping percentage is calculated by the number of overlapping compounds divided by the total number of hydrophilic volatile compounds from each of the two organ and times 100. Overlapping index is calculated by the number of overlapping compounds squared and divided by the total number of hydrophilic volatile compounds from each of the two organs. In addition, hierarchical clustering analysis was performed with Python to assess the similarities between each of the two organs by analyzing the number of overlapping hydrophilic volatile compounds.

Results and Discussion

The root, stem, stem skin, leaf, flower and fruit of the Ilex cornuta Lindl. & Paxton contain compounds that are water soluble and can volatilize with water vapor. These hydrophilic compounds do not separate from the water phase and possess greater polarity than essential oils. The largest number (64) of hydrophilic volatile compounds are isolated from the flower and the smallest (25) from the leaf, indicating that the number of hydrophilic volatile compounds varies greatly from organ to organ. The hydrophilic volatile compounds include aromatics, fatty acids, furans, heterocycle, esters, alkanes, ketones, halogens and other types of small molecular compounds. This is a diverse group of molecules that could contribute to the expression of biological information about the plant. Tables 1-6 present the lists of hydrophilic volatile compounds identified from the root, stem, stem skin, leaf, flower and fruit, respectively. The bold and italic fonts in the table are used to refer to exclusive compounds that are only found in the specific organ and not contained in any other organ.

Table 1: List of the hydrophilic volatile compounds identified from the root of the Ilex cornuta Lindl. & Paxton.

No RT RI Compound Formula
1 8.434 1041 2(3H)-Furanone, dihydro-4-hydroxy- C4H6O3
2 8.555 1044 2-Oxo-n-valeric acid C5H8O3
3 8.623 1047 2,3-Anhydro-d-galactosan C6H8O4
4 9.159 1064 Acetic acid, hexyl ester C8H16O2
5 9.767 1084 2-Cyclopenten-1-one, 3-ethyl-2-hydroxy- C7H10O2
6 12.753 1173 Octanoic Acid C8H16O2
7 13.662 1199 2-Furancarboxaldehyde,5-(hydroxymethyl)- C6H6O3
8 16.053 1269 Nonanoic acid C9H18O2
9 19.301 1364 Benzaldehyde, 4-(methylthio)- C8H8OS
10 23.459 1492 1H-2-Benzopyran-1-one, 3,4-dihydro-8-hydroxy-3-methyl- C10H10O3
11 23.660 1498 3-Acetoxydodecane C14H28O2
12 25.161 1546 7-Hydroxy-3-(1,1-dimethylprop-2-enyl) coumarin C14H14O3
13 25.496 1557 Dodecanoic acid C12H24O2
14 25.696 1564 Estra-1,3,5(10)-trien-17. beta. – ol C18H24O
15 26.109 1577 Butyric acid, 3-tridecyl ester C17H34O2
16 26.829 1600 Hexadecane C16H34
17 27.305 1613 Ethanone, 1-[2-(5-hydroxy-1,1-dimethylhexyl)-3-methyl-2-cyclopropen-1-yl]- C14H24O2
18 28.020 1631 Thieno[3,2-c]pyridin-4(5H)-one C7H5NOS
19 28.671 1649 Dodecanoic acid, 3-hydroxy- C12H24O3
20 30.636 1700 2-Bromotetradecane C14H29Br
21 32.780 1750 7-Methyl-Z-tetradecen-1-ol acetate C17H32O2
22 35.860 1821 1,2-Benzenedicarboxylic acid, bis(2-methylpropyl) ester C16H22O4
23 37.894 1867 2a-isopropyl-9,10a-dimethyl-6-methylenedodecahydro-1H-cyclopenta[4′,5′]cycloocta[1′,2′:1,5]cyclopenta[1,2-b]oxiren-4-ol C20H32O2
24 39.903 1912 1,2-Benzenedicarboxylic acid, butyl octyl ester C20H30O4
25 41.687 1951 n-Hexadecanoic acid C16H32O2
26 49.181 2119 7-Hexadecenal, (Z)- C16H30O
27 50.098 2139 9-Octadecenamide, (Z)- C18H35NO
28 50.483 2148 Octadecanoic acid C18H36O2
29 59.601 2362 2-Methyloctadecan-7,8-diol C19H40O2
30 65.148 2499 1,2-Benzenedicarboxylic acid, diisooctyl ester C24H38O4
31 73.761 2726 13-Docosenamide, (Z)- C22H43NO
32 77.825 2840 3-Phenyl-2-ethoxypropylphthalimide C19H19NO3
33 83.874 3017 9,10-Secocholesta-5,7,10(19)-triene-3,24,25-triol, (3.beta.,5Z,7E)- C27H44O3
34 89.708 3197 Heptanoic acid, docosyl ester C29H58O2
35 92.123 3265 Isophthalic acid, allyl pentadecyl ester C26H40O4
36 102.267 3561 Benzenepropanoic acid, 3,5-bis(1,1-dimethylethyl)-4-hydroxy-, octadecyl ester C35H62O3

Note: The bold and italic fonts are used to refer to exclusive compounds. RT: Retention time. RI: Reflex index.

Table 2: List of the hydrophilic volatile compounds identified from the stem of the Ilex cornuta Lindl. & Paxton.

No RT RI Compound Molecular
1 13.608 1198 2-Furancarboxaldehyde, 5-(hydroxymethyl)- C6H6O3
2 19.258 1363 4-Hydroxy-2-methoxybenaldehyde C8H8O3
3 21.565 1433 Cyclopentanemethanol,.alpha.-(1-methylethyl)-2-nitro-, [1.alpha.(S*),2.alpha.]- C9H17NO3
4 23.85 1504 4,8-Decadienal, 5,9-dimethyl- C12H20O
5 24.743 1533 Megastigmatrienone C13H18O
6 25.469 1556 Dodecanoic acid C12H24O2
7 25.681 1563 1-Cyclohexene-1-methanol, .alpha.,2,6,6-tetramethyl- C11H20O
8 26.105 1577 Pentanoic acid, 2,2,4-trimethyl-3-carboxyisopropyl, isobutyl ester C16H30O4
9 26.245 1581 Phenol, 3,4,5-trimethoxy- C9H12O4
10 26.495 1589 2-Methyl-4-(2,6,6-trimethylcyclohex-1-enyl)-but-2-en-1-ol C14H24O
11 27.127 1608 Benzaldehyde, 4-hydroxy-3,5-dimethoxy- C9H10O4
12 27.37 1614 Ethanone, 1-[2-(5-hydroxy-1,1-dimethylhexyl)-3-methyl-2-cyclopropen-1-yl]- C14H24O2
13 27.88 1628 Thieno[3,2-c]-pyridin-4(5H)-one C7H5NOS
14 28.27 1638 Spiro-[4.5]-decan-7-one, 1,8-dimethyl-8,9-epoxy-4-isopropyl- C15H24O2
15 28.685 1649 2-Bromo dodecane C12H25Br
16 29.172 1662 Ethanol, 2-(octadecyloxy)- C20H42O2
17 29.971 1683 1-(2-Hydroxy-4,5-dimethoxy-phenyl)-ethanone C10H12O4
18 30.271 1691 2-Propenal, 3-(4-hydroxy-3-methoxyphenyl)- C10H10O3
19 30.399 1694 Butanol, 1-[2,2,3,3-tetramethyl-1-(3-methyl-1-penynyl)-cyclopropyl]- C17H30O
20 30.641 1700 Heptadecane C17H36
21 31.037 1710 Hexadecane, 2,6,10,14-tetramethyl- C20H42
22 31.345 1717 4a-Dichloromethyl-4,4a,5,6,7,8-hexahydro-3H-naphthalen-2-one C11H14Cl2O
23 31.75 1726 Adamantane, 1-thiocyanatomethyl- C12H17NS
24 32.052 1733 9-(3,3-Dimethyloxiran-2-yl)-2,7-dimethylnona-2,6-dien-1-ol C15H26O2
25 32.512 1744 1-Decanol, 2-hexyl- C16H34O
26 32.788 1750 Cyclopropane, 1-(1-hydroxy-1-heptyl)-2-methylene-3-pentyl- C16H30O
27 33.683 1771 3-Isobutyryl-6-isopropyl-2,3-dihydropyran-2,4-dione C12H16O4
28 34.92 1800 Heneicosane C21H44
29 35.489 1813 Heptadecane, 2,6,10,15-tetramethyl- C21H44
30 35.86 1821 1,2-Benzenedicarboxylic acid, bis(2-methylpropyl) ester C16H22O4
31 37.316 1854 1-Hexadecanol C16H34O
32 37.898 1867 2a-isopropyl-9,10a-dimethyl-6-methylenedodecahydro-1H-cyclopenta[4′,5′]-cycloocta[1′,2′:1,5]-cyclopenta-[1,2-b]oxiren-4-ol C20H32O2
33 39.907 1912 1,2-Benzenedicarboxylic acid, butyl 8-methylnonyl ester C22H34O4
34 41.693 1951 n-Hexadecanoic acid C16H32O2
35 43.899 2000 Eicosane C20H42
36 49.179 2119 12-Methyl-E,E-2,13-octadecadien-1-ol C19H36O
37 50.464 2148 Octadecanoic acid C18H36O2
38 59.603 2362 2-Methyloctadecan-7,8-diol C19H40O2
39 65.152 2499 1,2-Benzenedicarboxylic acid, diisooctyl ester C24H38O4
40 73.757 2726 13-Docosenamide, (Z)- C22H43NO
41 83.861 3016 Ethyl iso-allocholate C26H44O5
42 89.711 3197 Heptanoic acid, docosyl ester C29H58O2
43 92.16 3266 Isophthalic acid, allyl pentadecyl ester C26H40O4
44 92.66 3280 17-(1,5-Dimethylhexyl)-10,13-dimethyl-3-styrylhexadecahydrocyclopenta[a]phenanthren-2-one C35H52O
45 94.571 3331 4-Norlanosta-17(20),24-diene-11,16-diol-21-oic acid, 3-oxo-16,21-lactone C29H42O4
46 102.263 3561 Benzenepropanoic acid, 3,5-bis(1,1-dimethylethyl)-4-hydroxy-, octadecyl ester C35H62O3

Note: The bold and italic fonts are used to refer to exclusive compounds. RT: Retention time. RI: Reflex index.

Table 3: List of the hydrophilic volatile component identified from the stem skin of the Ilex cornuta Lindl. & Paxton.

No RT RI Compound Molecular
1 12.765 1173 Octanoic Acid C8H16O2
2 13.818 1204 2-Furancarboxaldehyde, 5-(hydroxymethyl)- C6H6O3
3 19.283 1364 Benzaldehyde, 3-hydroxy-4-methoxy- C8H8O3
4 21.526 1432 2H-Pyran-2-one, 5,6-dihydro-6-pentyl- C10H16O2
5 23.372 1489 4,6-di-tert-Butyl-m-cresol C15H24O
6 23.599 1496 12-Oxa-[tetracyclo[5.2.1.1(2,6).1(8,11)]]dodecan-10-ol, 3-acetoxy- C13H18O4
7 23.856 1504 2,6-Dimethoxybenzoquinone C8H8O4
8 25.171 1547 1H-Benzocyclohepten-7-ol, 2,3,4,4a,5,6,7,8-octahydro-1,1,4a,7-tetramethyl-, cis- C15H26O
9 25.317 1551 2(5H)-Furanone, 4-methyl-5,5-bis(2-methyl-2-propenyl)- C13H18O2
10 25.462 1556 Dodecanoic acid C12H24O2
11 25.694 1564 2-Oxabicyclo[3.3.0]oct-7-en-3-one, 7-(1-hydroxypentyl)- C12H18O3
12 25.922 1571 Dodecane, 2,6,10-trimethyl- C15H32
13 26.114 1577 Pentanoic acid, 2,2,4-trimethyl-3-carboxyisopropyl, isobutyl ester C16H30O4
14 26.335 1584 3-Butyl-4-nitro-pent-4-enoic acid, methyl ester C10H17NO4
15 26.514 1590 2-Dodecen-1-yl(-)succinic anhydride C16H26O3
16 26.838 1600 Heptadecane C17H36
17 27.227 1611 Benzaldehyde, 4-hydroxy-3,5-dimethoxy- C9H10O4
18 27.929 1629 2,6,10,10-Tetramethyl-1-oxaspiro-[4.5]decan-6-ol C13H24O2
19 28.288 1638 4-Isobenzofuranol, octahydro-3a,7a-dimethyl-, (3a.alpha.,4.beta.,7a.alpha.)-(.+-.)- C10H18O2
20 29.187 1662 Ethanol, 2-(hexadecyloxy)- C18H38O2
21 29.827 1679 2-Cyclohexen-1-one, 3-(3-hydroxybutyl)-2,4,4-trimethyl- C13H22O2
22 29.956 1682 Cyclopentanone, 2-(1-adamantyl)- C15H22O
23 30.308 1692 alpha. Isomethyl ionone C14H22O
24 30.649 1700 2-Bromotetradecane C14H29Br
25 31.047 1710 Hexadecane, 2,6,10,14-tetramethyl- C20H42
26 31.774 1727 Adamantane, 1-thiocyanatomethyl- C12H17NS
27 32.083 1734 E,E-6,8-Tridecadien-2-ol, acetate C15H26O2
28 32.522 1744 1-Decanol, 2-hexyl- C16H34O
29 32.801 1751 7-Methyl-Z-tetradecen-1-ol acetate C17H32O2
30 33.682 1771 7-Bromo-3a,6,6-trimethyl-hexahydro-benzofuran-2(3H)-one C11H17BrO2
31 35.475 1813 Heptadecane, 2,6,10,15-tetramethyl- C21H44
32 35.876 1822 1,2-Benzenedicarboxylic acid, bis(2-methylpropyl) ester C16H22O4
33 37.903 1867 Dodecane, 1,2-dibromo- C12H24Br2
34 39.916 1912 Dibutyl phthalate C16H22O4
35 41.653 1951 n-Hexadecanoic acid C16H32O2
36 65.178 2500 1,2-Benzenedicarboxylic acid, diisooctyl ester C24H38O4
37 73.760 2726 13-Docosenamide, (Z)- C22H43NO
38 93.411 3301 1,2-Benzenedicarboxylic acid, diundecyl ester C30H50O4
39 93.650 3307 Isophthalic acid, allyl pentadecyl ester C26H40O4
40 100.522 3505 9-Octadecenoic acid (Z)-, phenylmethyl ester C25H40O2
41 101.150 3525 2,6-Lutidine 3,5-dichloro-4-dodecylthio- C19H31Cl2NS
42 102.301 3562 Benzenepropanoic acid, 3,5-bis(1,1-dimethylethyl)-4-hydroxy-, octadecyl ester C35H62O3

Note: The bold and italic fonts are used to refer to exclusive compounds. RT: Retention time. RI: Reflex index.

Table 4: List of the hydrophilic volatile component of the leaf of the Ilex cornuta Lindl. & Paxton.

No RT RI Compound Molecular
1 13.543 1196 2-Furancarboxaldehyde, 5-(hydroxymethyl)- C6H6O3
2 14.110 1212 2-Furancarboxaldehyde, 6-(hydroxymethyl)- C6H6O4
3 14.318 1218 2-Furancarboxaldehyde, 7-(hydroxymethyl)- C6H6O5
4 25.089 1544 Bicyclo[3.2.0]heptan-6-one, 2-acetyl-3,3-dimethyl-7-(1-methylethyl)- C14H22O2
5 25.453 1556 Dodecanoic acid C12H24O2
6 25.692 1564 trans-Z-.alpha.-Bisabolene epoxide C15H24O
7 26.117 1577 4,6,10,10-Tetramethyl-5-oxatricyclo[4.4.0.0(1,4)]dec-2-en-7-ol C13H20O2
8 26.493 1589 7-Heptadecene, 1-chloro- C17H33Cl
9 26.831 1600 Hexadecane C16H34
10 28.088 1633 3-Pyridinecarboxylic acid, 1,6-dihydro-4-hydroxy-2-methyl-6-oxo-, ethyl ester C9H11NO4
11 30.644 1700 Heptadecane C17H36
12 31.038 1710 Hexadecane, 2,6,11,15-tetramethyl- C20H42
13 32.440 1742 2-Cyclohexen-1-one, 4-hydroxy-3,5,6-trimethyl-4-(3-oxo-1-butenyl)- C13H18O3
14 32.801 1751 7-Methyl-Z-tetradecen-1-ol acetate C17H32O2
15 34.479 1790 Pentadecyl trifluoroacetate C17H31F3O2
16 34.925 1800 Heptadecane, 2,6,10,15-tetramethyl- C21H44
17 35.476 1813 Nonadecane C19H40
18 35.872 1822 1,2-Benzenedicarboxylic acid, bis(2-methylpropyl) ester C16H22O4
19 41.601 1949 n-Hexadecanoic acid C16H32O2
20 43.458 1991 1-Nonadecene C19H38
21 59.608 2362 2-Methyloctadecan-7,8-diol C19H40O2
22 73.760 2726 13-Docosenamide, (Z)- C22H43NO
23 92.239 3268 Isophthalic acid, allyl pentadecyl ester C26H40O4
24 93.235 3296 1,2-Benzenedicarboxylic acid, 2-butoxyethyl butyl ester C18H26O5
25 94.006 3317 Phthalic acid, propyl octadecyl ester C29H48O4

Note: The bold and italic fonts are used to refer to exclusive compounds. RT: Retention time. RI: Reflex index.

Table 5: List of the hydrophilic volatile component identified from the flower of the Ilex cornuta Lindl. & Paxton.

No RT RI Compound Molecular
1 9.359 1070 2,2-Dimethyl-3-vinyl-bicyclo[2.2.1]heptane C11H18
2 9.987 1091 Cyclohex-3-enecarboxaldehyde, 2,4,6-trimethyl-, oxime C10H17NO
3 12.197 1156 Phenol, 3-ethyl- C8H10O
4 12.649 1170 Benzoic acid C7H6O2
5 12.797 1174 Glucosamine, N-acetyl-N-benzoyl- C15H19NO7
6 13.333 1190 Benzothiazole C7H5NS
7 15.613 1256 Phenol, 2,3,5-trimethyl- C9H12O
8 16.214 1273 5H-Inden-5-one, 1,2,3,6,7,7a-hexahydro- C9H12O
9 16.640 1286 Hydroquinone C6H6O2
10 17.145 1300 Cyclohexanol, 1-methyl-4-(1-methylethylidene)- C10H18O
11 17.280 1304 Cyclohexanol, 2-methyl-5-(1-methylethenyl)-, (1.alpha.,2.beta.,5.alpha.)- C10H18O
12 17.772 1319 2,7-Octadiene-1,6-diol, 2,6-dimethyl- C10H18O2
13 18.160 1330 trans-Z-.alpha.-Bisabolene epoxide C15H24O
14 18.430 1338 (3S,4R,5R,6R)-4,5-Bis(hydroxymethyl)-3,6-dimethylcyclohexene C10H18O2
15 19.298 1364 4-Hydroxy-2-methoxybenaldehyde C8H8O3
16 19.508 1370 2-Cyclopenten-1-one, 4-hydroxy-3-methyl-2-(2-propenyl)- C9H12O2
17 21.040 1417 Phenol, 2-pentyl- C11H16O
18 21.311 1425 2-Propen-1-ol, 2-methyl-3-(2,6,6-trimethyl-2-cyclohexen-1-yl)-, (E)- C13H22O
19 21.602 1434 3-(2-Hydroxy-cyclopentylidene)-2-methyl-propionic acid C9H14O3
20 21.838 1442 5-​Benzofuranacetic acid, 6-​ethenyl-​2,​4,​5,​6,​7,​7a-​hexahydro-​3,​6-​dimethyl-​α-​methylene-​2-​oxo-​, methyl ester C16H20O4
21 23.259 1486 8-Methylenecyclooctene-3,4-diol C9H14O2
22 23.514 1494 1-(3,6,6-Trimethyl-1,6,7,7a-tetrahydrocyclopenta[c]pyran-1-yl)ethanone C13H18O2
23 24.011 1509 1-Acetamido-1,2-dihydro-2-oxopyridine C7H8N2O2
24 24.675 1531 cis-Z-.alpha.-Bisabolene epoxide C15H24O
25 24.767 1534 Cyclopentan-1-al, 4-isopropylidene-2-methyl- C10H16O
26 25.085 1544 Ethanone, 1-(1a,2,3,5,6a,6b-hexahydro-3,3,6a-trimethyloxireno[g]benzofuran-5-yl)- C13H18O3
27 25.514 1558 Dodecanoic acid C12H24O2
28 25.685 1563 Bicyclo[3.3.1]nonan-9-one, 1,2,4-trimethyl-3-nitro-, (2-endo,3-exo,4-exo)-(.+-.)- C12H19NO3
29 25.899 1570 2-Cyclohexen-1-one, 3-(3-hydroxybutyl)-2,4,4-trimethyl- C13H22O2
30 26.127 1578 Ledol C15H26O
31 26.498 1590 1-Hexadecanol C16H34O
32 26.840 1600 Hexadecane C16H34
33 27.155 1609 Spiro[androst-5-ene-17,1′-cyclobutan]-2′-one, 3-hydroxy-, (3.beta.,17.beta.)- C22H32O2
34 27.486 1617 Bicyclo[3.1.0]hexane-6-methanol, 2-hydroxy-1,4,4-trimethyl- C10H18O2
35 28.099 1634 3-Pyridinecarboxylic acid, 1,6-dihydro-4-hydroxy-2-methyl-6-oxo-, ethyl ester C9H11NO4
36 28.615 1647 Bromoacetic acid, dodecyl ester C14H27BrO2
37 28.684 1649 Chloroacetic acid, 4-tetradecyl ester C16H31ClO2
38 29.178 1662 2-Dodecen-1-yl(-)succinic anhydride C16H26O3
39 29.777 1678 2-Hydroxy-1,1,10-trimethyl-6,9-epidioxydecalin C13H22O3
40 29.951 1682 1-Cyclopropene-1-pentanol, .alpha.,.epsilon.,.epsilon.,2-tetramethyl-3-(1-methylethenyl)- C15H26O
41 30.651 1701 2-Bromotetradecane C14H29Br
42 31.045 1710 Tetradecane, 1-chloro- C14H29Cl
43 31.355 1717 5.beta.,7.beta.H,10.alpha.-Eudesm-11-en-1.alpha.-ol C15H26O
44 31.582 1722 7-Hexadecenal, (Z)- C16H30O
45 31.771 1727 Pentane-2,4-dione, 3-(1-adamantyl)- C15H22O2
46 32.092 1734 Butanol, 1-[2,2,3,3-tetramethyl-1-(3-methyl-1-penynyl)-cyclopropyl]- C17H30O
47 32.468 1743 Pyrrolo[1,2-a]pyrazine-1,4-dione, hexahydro-3-(2-methylpropyl)- C11H18N2O2
48 32.769 1750 Tetradecanoic acid C14H28O2
49 33.645 1771 1-Decanol, 2-hexyl- C16H34O
50 34.485 1790 Pentadecyl trifluoroacetate C17H31F3O2
51 34.932 1801 Heptadecane, 2,6,10,15-tetramethyl- C21H44
52 35.479 1813 1-Octanol, 2-butyl- C12H26O
53 35.873 1822 1,2-Benzenedicarboxylic acid, bis(2-methylpropyl) ester C16H22O4
54 36.928 1845 5,10-Diethoxy-2,3,7,8-tetrahydro-1H,6H-dipyrrolo[1,2-a;1′,2′-d]pyrazine C14H22N2O2
55 37.910 1867 2-Hexadecene, 3,7,11,15-tetramethyl-, [R-[R*,R*-(E)]]- C20H40
56 39.389 1900 Nonadecane C19H40
57 41.675 1951 n-Hexadecanoic acid C16H32O2
58 43.480 1991 1-Nonadecene C19H38
59 46.996 2069 3-Chloropropionic acid, heptadecyl ester C20H39ClO2
60 48.984 2114 9,12-Octadecadienoic acid (Z,Z)- C18H32O2
61 49.228 2120 9-Octadecenal, (Z)- C18H34O
62 50.660 2152 Ethyl iso-allocholate C26H44O5
63 52.394 2192 9-Tricosene, (Z)- C23H46
64 73.770 2727 13-Docosenamide, (Z)- C22H43NO

Note: The bold and italic fonts are used to refer to exclusive compounds. RT: Retention time. RI: Reflex index.

Table 6: List of the hydrophilic volatile component identified from the fruit of the Ilex cornuta Lindl. & Paxton.

No RT RI Compound Molecular
1 9.133 1063 Mequinol C7H8O2
2 9.303 1069 Phenol, 4-methyl- C7H8O
3 9.430 1073 Hexane, 3-bromo- C6H13Br
4 9.923 1089 Phenylethyl Alcohol C8H10O
5 10.510 1107 4-Acetylbutyric acid C6H10O3
6 12.643 1169 Benzoic acid C7H6O2
7 13.559 1196 2-Furancarboxaldehyde, 5-(hydroxymethyl)- C6H6O3
8 15.378 1249 1,5-Cyclooctadien-4-one C8H10O
9 17.652 1315 Phenol, 2,6-dimethoxy- C8H10O3
10 19.180 1361 Benzaldehyde, 3-hydroxy-4-methoxy- C8H8O3
11 21.852 1442 2-Ethoxyphenylacetonitrile C10H11NO
12 22.103 1450 Benzeneacetonitrile, 4-hydroxy- C8H7NO
13 22.466 1461 Coumarin, 8-methyl- C10H8O2
14 25.187 1547 1,4-Benzenediol, 2-(1,1-dimethylethyl)- C10H14O2
15 25.508 1558 Dodecanoic acid C12H24O2
16 25.876 1569 3,5-Octadienoic acid, 7-hydroxy-2-methyl-, [R*,R*-(E,E)]- C9H14O3
17 25.938 1571 2-Cyclopenten-1-one, 4-hydroxy-3-methyl-2-(2-propenyl)- C9H12O2
18 26.125 1577 1b,5,5,6a-Tetramethyl-octahydro-1-oxa-cyclopropa[a]inden-6-one C13H20O2
19 26.492 1589 4-Chloro-3-n-hexyltetrahydropyran C11H21ClO
20 27.323 1613 Ethanone, 1-[2-(5-hydroxy-1,1-dimethylhexyl)-3-methyl-2-cyclopropen-1-yl]- C14H24O2
21 30.643 1700 Heptadecane C17H36
22 32.760 1750 Tetradecanoic acid C14H28O2
23 35.878 1822 1,2-Benzenedicarboxylic acid, bis(2-methylpropyl) ester C16H22O4
24 41.694 1952 n-Hexadecanoic acid C16H32O2
25 48.863 2111 9,12-Octadecadienoic acid, methyl ester C19H34O2
26 49.244 2120 9-Octadecenal, (Z)- C18H34O

Note: The bold and italic fonts are used to refer to exclusive compounds. RT: Retention time. RI: Reflex index.

As shown in Table 7, the total number of hydrophilic volatile compounds isolated from the six organs ranges from 25 to 64. There are 3 common compounds in the six organs, i.e. Dodecanoic acid, 1,2-Benzenedicarboxylic acid, bis(2-methylpropyl) ester and n-Hexadecanoic acid. This accounts for 12.0% of total hydrophilic volatile compounds for the leaf and 4.7% for the flower with an average of 8.4% for all the six organs, indicating the little commonality of the six organs. Each organ also has its exclusive compounds which are not found in any other organ. The percentage of exclusive compounds follows the order of flower > fruit > stem skin > root > stem > leaf. The flower has the largest number and percentage of the exclusive compounds, 40 and 62.5%, respectively. The leaf has the smallest number and percentage of the exclusive compounds, 9 and 36.0%, respectively. The stem and stem skin display medium numbers of exclusive compounds. The average percentage of the exclusive compounds in the six organs was 49.8%, nearly half, indicating strong organ specificity. These results provide evidence to support the practice of the traditional herbal medicine to treat the diseases using either the whole plant or part of the plants depending on which part contains the substances that can be used for therapeutic purposes.

Table 7: The number and percentage of the common and exclusive hydrophilic volatile compounds identified from the six organs.

Organ Root Stem Stem Skin Leaf Flower Fruit
Total Compounds 36 46 42 25 64 26
Common Compounds 3
Percentage of Common Compounds 8.3% 6.5% 7.1% 12.0% 4.7% 11.5%
Exclusive Compounds 17 21 21 9 40 15
Percentage of Exclusive Compounds 47.2% 45.7% 50.0% 36.0% 62.5% 57.7%

Table 8 presents the number of overlapping compounds, overlapping percentage and overlapping index. The stem and stem skin share the largest number (15) of overlapping compounds. The overlapping percentage is calculated to be 32.6% for the stem and 35.7% for the stem skin. The smallest number (5) of overlapping compounds are found between root and fruit, leaf and fruit. The percentage of overlapping compounds between each of the two organs ranges from 10.9% to 44.0%, which is relatively small, further demonstrating substantial component differences among the different organs. The overlapping index is used to reveal the similarity among the organs. Two organs share the same number of overlapping compounds, but the overlapping index could be different if the total number of the hydrophilic volatile compounds differs. The more total number of the hydrophilic volatile compounds, the less the percentage of the overlapping compounds and smaller the overlapping index. That is why the average overlapping indices between the two organs is introduced to normalize the difference. In addition, total average overlapping indices is derived to calculate the mean of the average overlapping indices between each organ and the other five organs. Based on Table 8, the total average overlapping indices for each organ follows the order of stem > stem skin > root > leaf > flower > fruit. The total average overlapping indices for the stem is the greatest at 3.056, indicating the stem share the maximum similarity with the plant. The total average overlapping indices for the fruit was the smallest at 1.090, indicating that the fruit share the minimum similarity with the plant. And there is not much difference in the average overlapping indices between fruit and the other five organs. Except fruit, the average overlapping indices between each of the two organs correlate well to their physical proximity. The root, stem and stem skin are the organs that the plant survive and grow, and their total average overlapping indices are greater than 2.5. The overlapping index differences among these three organs are small, and they share the most in common. As an evergreen plant, the leaf is symbiotically related to the plant although the relationship between each leaf and the plant is cyclical, so the leaf is secondarily related to the plant. The flower and fruit are also cyclically related to the plant and have the most distant relationship. The leaf, flower and fruit are necessary but not survival organs for the growth of the plant. The relationship between the organs and the plant generated from the analysis of the hydrophilic volatile compounds is consistent with their biological function.

Table 8: The number of overlapping compounds, overlapping percentage and overlapping index.

Organ1 Organ 2 Number of overlapping compounds Overlapping percentage Overlapping index for Organ 1 Overlapping index for Organ 2 Average overlapping indices between organ 1 and 2 Total average overlapping Indices
Root Stem 14 38.9% 5.444 4.261 4.853

2.522

Stem skin 11 30.6% 3.361 2.881 3.121
Leaf 9 25.0% 2.250 3.240 2.745
Flower 7 19.4% 1.361 0.766 1.064
Fruit 5 13.9% 0.694 0.962 0.828
Stem Root 14 30.4% 4.261 5.444 4.853

3.056

Stem skin 15 32.6% 4.891 5.357 5.124
Leaf 9 19.6% 1.761 3.240 2.501
Flower 10 21.7% 2.174 1.266 1.720
Fruit 6 13.0% 0.783 1.385 1.084
Stem skin Root 11 26.2% 2.881 3.361 3.121 2.710
Stem 15 35.7% 5.357 4.891 5.124
Leaf 9 21.4% 1.929 3.240 2.585
Flower 10 21.4% 1.929 1.266 1.598
Fruit 6 14.3% 0.857 1.385 1.121
Leaf Root 9 36.0% 3.240 2.250 2.745

2.435

Stem 9 36.0% 3.240 1.761 2.501
Stem skin 9 36.0% 3.240 1.929 2.585
Flower 11 44.0% 4.840 1.891 3.366
Fruit 5 20.0% 1.000 0.962 0.981
Flower Root 7 10.9% 0.766 1.361 1.064

1.844

Stem 10 15.6% 1.563 2.174 1.859
Stem skin 10 14.1% 1.266 1.929 1.598
Leaf 11 17.2% 1.891 4.840 3.366
Fruit 7 10.9% 0.766 1.885 1.326
Fruit Root 5 19.2% 0.962 0.694 0.828

1.090

Stem 6 23.1% 1.385 1.000 1.193
Stem skin 6 23.1% 1.385 0.857 1.121
Leaf 5 19.2% 0.962 1.000 0.981
Flower 7 26.9% 1.885 0.766 1.326

Conclusion

The root, stem, stem skin, leaf, flower and fruit of the Ilex cornuta Lindl. & Paxton contain hydrophilic volatile compounds that are evenly distributed in the water phase of the various organs of the plant and can volatilize with water vapor. The number and type of hydrophilic volatile compounds vary from organ to organ. There is only a small number of common compounds among the six organs and the number of overlapping compounds between each of the two organs is also relatively small. In addition, there are large number of exclusive compounds from each organ. Therefore, it is possible to identify the plant through the assessment of the hydrophilic volatile compounds isolated from each individual organ.

In conclusion, we found that hydrophilic volatile metabolites are a class of natural products that are rarely investigated but constitute a significant part of the plant chemical composition. Chemical profiling of these secondary metabolites could provide a valuable tool for identification and authentication of the plant samples, as well as resolving taxonomic problems and understanding the chemically mediated biological phenomena.

References

  1. Bickford D, Lohman DJ, Sodhi NS, Ng PKL, Meier R, et al. (2007) Cryptic species as a window on diversity and conservation. Trends Ecol Evol 22: 148-155. [crossref]
  2. Heinrichs J, Kreier HP, Feldberg K, Schmidt AR, Zhu RL, et al. (2011) Formalizing morphologically cryptic biological entities: New insights from DNA taxonomy, hybridization, and biogeography in the leafy liverwort Porella platyphylla (Jungermanniopsida, Porellales). Am J Bot 98: 1252-1262. [crossref]
  3. Ludwiczuk A (2014) Fingerprinting of secondary metabolites of liverworts: chemosystematic approach. J of AOAC Int 97: 1234-1243.
  4. Wink M (2003) Evolution of secondary metabolites from an ecological and molecular phylogenetic perspective. Phytochemistry 64: 3-19. [crossref]
  5. Liu K, Abdullah AA, Huang M, Nishioka T, Altaf-Ul-Amin M, et al. (2017) Novel Approach to Classify Plants Based on Metabolite-Content Similarity. BioMed Res Int. doi: 10.1155/2017/5296729
  6. Ghaste M, Narduzzi L, Carlin S, Vrhovsek U, Shulaev V, et al. (2015) Chemical Composition of Volatile Aroma Metabolites and Their Glycosylated Precursors that Can Uniquely Differentiate Individual Grape Cultivars. Food Chem 188: 309-319. [crossref]
  7. Peters K, Treutler H, Doll S, Kindt ASD, Hankemeier T, et al. (2019) Chemical Diversity and Classification of Secondary Metabolites in Nine Bryophyte Species. Metabolites 9: 222. [crossref]
  8. Staszek D, Orlowska M, Rzepa J, Wrobel MS, Kowalska T (2014) Fingerprinting of the Volatile Fraction from Selected Thyme Species by Means of Headspace Gas Chromatography with Mass Spectrometric Detection. J of AOAC Int 97: 1250-1258. [crossref]
  9. Tundis R, Peruzzi L, Menichini F (2014) Phytochemical and biological studies of Stachy Species in Relation to Chemotaxonomy: A Review. Phytochemistry 102: 7-39. [crossref]
  10. Peñuelas J, Llusià J (1999) Seasonal emission of monoterpenes by the Mediterranean tree Quercus ilex in field conditions: Relations with photosynthetic rates, temperature and volatility. Physiol Plant 105: 641-647.
  11. Llusia J, Penuelas J (2000) Seasonal patterns of terpene content and emission from seven mediterranean woody species in field conditions. Am J Bot 87: 133-140. [crossref]
  12. Ormeo E, Goldstein A, Niinemets ü (2011) Extracting and trapping biogenic volatile organic compounds stored in plant species. TRAC-Trend Anal Chem 30: 978-989.
  13. Claudia G, Roberta A, Daniela L, Giacomo T, Laura S, et al. (2018) Salvia verticillata: Linking glandular trichomes, volatiles and pollinators. Phytochemistry 155: 53-60.
  14. Wei X, Song M, Chen C, Tong H, Liang G, et al. (2018) Juice volatile composition differences between Valencia orange and its mutant Rohde Red Valencia are associated with carotenoid profile differences. Food Chem 245: 223-232. [crossref]
  15. Berlinck RGS, Monteiro AF, Bertonha AF, Bernardi DI, Gubiani JR, et al. (2019) Approaches for the isolation and identification of hydrophilic, light-sensitive, volatile and minor natural products. Nat Prod Rep 36: 981-1004. [crossref]

Mechanisms of Anti-Melanogenic and Proliferative Effects of Colla Corii Asini (E’jiao)

DOI: 10.31038/IMROJ.2021623

Abstract

Natural compounds have been reported for the development of cosmetic skin care products but it remains a challenge to find safe and useful ones. Colla corii asini (E’jiao), or donkey-hide gelatin (DHG) prepared by concentrating stewed Equus asinus L. donkey hide, has been useful in traditional Chinese medicine. However, its anti-melanogenic and skin care effects have not been explored. In this study, the biological effect of DHG was tested on murine B16-F10 melanocytes and human HaCaT keratinocytes. The cell signal pathway mechanisms by DHG were also examined by western blot assay. The results showed that DHG was not cytotoxic to cells and had an anti-melanogenic effect by inhibiting tyrosinase activity and reducing melanin contents in B16-F10 melanocytes. It also showed an anti-oxidative effect of reducing ROS generation in H2O2-stressed HaCaT keratinocytes. DHG dose-dependently enhanced phosphorylation of ERK, but reduced p-JNK and p-p38 proteins in B16-F10 cells under the UV stress. This is consistent with the results of other anti-melanogenic agents. Therefore, this suggested DHG had a potential for skin whitening and skin care applications.

Keywords

Anti-melanogenesis, Donkey-hide gelatin, E’jiao, Proliferation, UV stress

Introduction

Medicinal products have been used for centuries to promote healthy skin. Skin care products have gained a competitive market not only for clinical applications but also for esthetical purpose. Despite the widespread use of natural ingredients, the discovery of biologically active compounds, the development of these substances into new cosmetic products remain an important challenge [1]. Skin pigmentation is caused by melanins, which are synthesized by melanocytes [2]. Tyrosinase is an enzyme that catalyzes two rate-limiting reactions in melanogenesis including hydroxylation of L-tyrosine into L-3,4-dihydroxyphenylalanine (L-DOPA) and further oxidation of L-DOPA into dopaquinone, while highly reactive dopaquinone can spontaneously polymerize to form melanin [3]. Many tyrosinase inhibitors from natural or synthetic sources have been reported to include polyphenols, benzaldehyde and benzoate derivatives, long-chain lipids and steroids, other natural or synthetic inhibitors, and irreversible inhibitors [4]. However, few tyrosinase inhibitors are applied in cosmetic and medicinal fields for skin-lightening due to their toxicity or potential hazards [5]. Therefore it is necessary to search a natural anti-melanogenic agent without significant side effects.

Colla corii asini (E’jiao), donkey-hide gelatin (DHG) prepared by concentrating stewed Equus asinus L. donkey hide, is a traditional Chinese medicinal ingredient. It has been used in China for antianemic therapy for over 2,000 years [6,7]. The chemical constituents of Colla corii asini include amino acids, proteins/gelatins, polysaccharides, volatile substances, and inorganic substances. It has been reported as having anti-aging, antitumor, immunomodulatory, anti-inflammatory effects [8,9]. However, its potential for skin care or skin whitening has not been explored.

In this study, the antimelanogenic effect of DHG was evaluated in murine B16-F10 melanoma cells and the antioxidative effect in human HaCaT keratinocytes. Because the extracellular signal-regulated kinase (ERK) and phosphatidylinositol 3-kinase (PI3K)/Akt signaling pathways have been shown to negatively regulate melanogenesis in melanocytes and melanoma cells [10,11], we also investigated the effect of DHG on these signaling pathways. The beneficial mechanisms of DHG on these cells were examined for its potential application on the skin care.

Materials and Methods

Chemicals

Donkey hide gelatin (Colla corii asini, DHG or e-jiao) was purchased from Dong-E-E-Jiao Co., Ltd. (Dong’E, Shangdon, China). Mushroom tyrosinase (3320 units/mg), 3,4-dihydroxy-L-phenylalanin (L-dopa), sodium hydroxide (NaOH) and other reagents were obtained from Sigma-Aldrich (St. Louis, MO, USA). Murine melanoma cell-line, B16-F10 (BCRC60031) and human keratinocytes HaCaT cell-line were gifts of Dr. Chih-Cheng Lin and originally obtained from the Bioresource Collection and Research Center (BCRC, Hsinchu, Taiwan). Fetal bovine serum (FBS), penicillin/streptomycin (P/S), and Dulbecco’s modified Eagle’s medium (DMEM) were purchased form Hyclone (Logan, UT, USA). A TD-3D skin analyzer with whole spectrum, cross-polarized, and UV lighting was used to record and measure surface and subsurface skin conditions. The analyzer was obtained from Hofonchu Corp (New Taipei, Taiwan).

Cell Culture and Viability Assay

The B16-F10 cells and HaCaT keratinocytes were cultured in DMEM medium with 10% FBS, 50 mg/ml P/S at 37°C with a 5% CO2 incubator. The B16-F10 cells or HaCaT cells were seeded in 24-well plates at a density of 5 × 10⁵ cells/well. DHG extract was prepared with either double distilled (RO) water or ethanol (1 g/10 ml). After 24 h of incubation, the culture medium was replaced with fresh culture medium containing various concentrations of DHG and further incubated for another 24 h. The cell viability was determined by using the 3-(4,5-dimethylthiazol-2-yl)-2,5-diphenyltetrazolium bromide (MTT) method. The culture was washed with phosphate buffered saline (PBS) and replaced with MTT solution, and then incubated at 37°C for 1 h. The formazan formed by dimethyl sulfoxide (DMSO) solubilized cells was determined at an absorbance of 540 nm using an ELISA reader (Molecular Devices, Sunnyvale, CA, USA).

Skin Analysis

DHG was grinded with normal saline (1 g/9 ml) for 5 min and centrifuged at 3000 g for 10 min. One ml of the supernatant was added to the filter paper (9 × 9 cm2). The filters containing either DHG or RO water were then laid on a volunteer’s left and right cheek, respectively, for 15 min. After rinsing with RO water, gently dry cheek with lens paper, waiting for 5 min, and the volunteer’s facial skin was assessed with a TD-3D skin analyzer. Stain, wrinkles, and skin texture were analyzed for the effects of DHG. Since tyrosinase is a significant key in melanogenesis, tyrosinase inhibition is a common method to avoid melanin biosynthesis. The effect of DHG on tyrosinase activity of B16-F10 cells was determined [12]. The cells were seeded at 1~3 × 10⁵ with 10 ml DMEM complete medium (10% FBS, 50 mg/ml P/S) in 24-well plates and treated with various concentrations of DHG for 48 h. The cells were then harvested by using a lysis buffer (0.1 M PBS, pH 6.8, containing 1% Triton X-100 and protease inhibitor). Cells were then disrupted by repeatedly freezing and thawing five times. Cell lysates were centrifuged at 14,000 g for 15 min. The protein concentration in the supernatant from cell lysate was determined by using Bradford assay (Bio-Rad, Richmond, CA, USA) and normalized. After pre-heated to 37°C, an aliquot of 50 μl of each samples was transferred into a well of the 96-well plate and reacted with 50 μl of 1 mg/ml L-DOPA at 37°C for 1 h. Tyrosinase activity was then determined by measurement of the absorbance at 475 nm dynamically within 30 min. The molar absorbance coefficient 3700 (mol/l·cm)-1 was used to calculate tyrosinase activity. Tyrosinase activity unit was defined as the amount of enzyme required to oxidize 1 µM min-1of the substrate (L-DOPA) under standard assay conditions. The inhibition rate of tyrosinase activity (%) = (A-B) / A × 100%.

A: Absorbance of the non-treated sample, B: Absorbance of the DHG-treated sample

Measurement of Melanin Content

B16-F10 cells were seeded at a density of 5 × 10⁵ cells/ml in the 24-well culture plates and incubated at 37°C with 5% CO2 for 24 h. The B16-F10 cells were treated with various concentrations of DHG for 24 h under 100 mJ of UV exposure. After washed with PBS, the culture was centrifuged for 30 min at 12000 g, and treated with 100 μl of 1 N NaOH solution for 30 min at 60°C. For the melanin content, an aliquot of 80 μl of culture medium was transferred to a microplate and determined at an absorbance of 405 nm with a melanin standard curve [13].

Measurement of Reactive Oxygen Species (ROS)

ROS was determined with H2DCF-DA [10]. This nonfluorescent compound accumulates within cells upon deacetylation. H2DCF then reacts with ROS to form fluorescent dichlorofluorescein (DCF). HaCaT cells were plated in 96-well plates and grown for 24 h before the addition of DMEM plus 10 μM H2DCF-DA and various concentrations of DHG, incubation for 1 h at 37°C, and treatment with 800 μM H2O2 for 60 or 120 min. Cells were then washed twice with room temperature Hank’s balanced salt solution (HBSS without phenol red). Cellular fluorescence was monitored on a Fluoroskan Ascent fluorometer (Labsystems Oy, Helsinki, Finland) using an excitation wavelength of 485 nm and emission wavelength of 538 nm. The inhibition of ROS was calculated as the previous formula.

Western Blot Assay

B16-F10 cells and HaCaT cells were plated in 24-well plates and grown for 24 h. Then both types of cells were incubated with various concentration of DHG for 1 h at 37°C, but only B16-F10 cells were under UV (100 mJ) stress. Extracted protein samples from each treatment group (containing 50 μg of protein) were separated on 12% sodium dodecyl sulfate-polyacrylamide gels and transferred to immobile polyvinylidene difluoride membranes (Millipore, Billerica, MA). The membranes were incubated for 1 h with 5% dry skim milk in TBST buffer (0.1M Tris-HCl, pH 7.4, 0.9% NaCl, 0.1% Tween-20) to block non-specific binding. Then, they were incubated with rabbit antibodies against AKT, p-JNK, p-ERK, p-p38 (Abcam, Cambridge, UK), and anti-β-actin (Jackson, West Grove, PA, USA). Subsequently, the membranes were incubated with the conjugated affinity goat anti-rabbit IgG (Jackson). Expression of these proteins was detected by a chemiluminescence detection system according to the manufacturer’s instructions (ECL, Amersham, Berkshire, UK) [10].

Results

Effect of DHG on Cell Viability

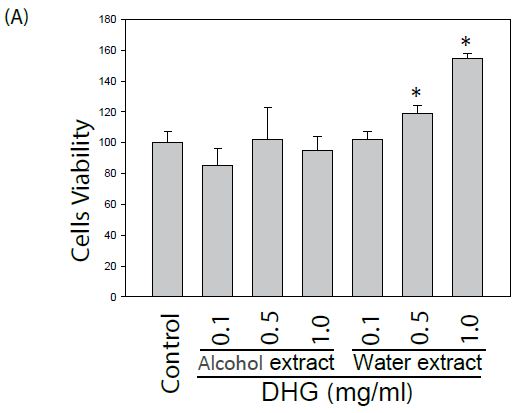
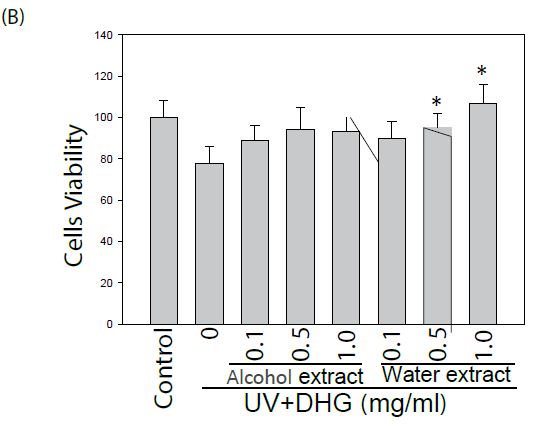
The effect of DHG on cell viability of human keratinocyte HaCaT cells and murine B16-F10 cells was evaluated. Cells treated with various concentrations were examined for cell viability by MTT assay. As shown in Figure 1, DHG from water extract did not exhibit a cytotoxic effect. Instead, it demonstrated a proliferative effect on HaCaT cells at concentrations of 0.5~1.0 mg/ml. Likewise, DHG at these ranges did not exhibit a cytotoxic effect on B16-F10 cells.

fig 1a

fig 1b

Figure 1: Effect of DHG on the cell viability by MTT assay. Human keratinocyte HaCaT cells or murine B16-F10 melanocytes were treated with various concentrations of DHG for 24 h and examined for cell viability. Each value is the mean + SE from three experiments. *p < 0.05 as compared with the HaCaT control (A), or UVB-treated control of B16-F10 cells (B).

Effect of DHG on Skin Test

A brief treatment of DHG showed a skin care effect. Skin analysis showed that the facial skin texture, pores, wrinkles, and red spots were significantly improved in ten healthy volunteers after DHG treatment (Table 1).

Table 1: Effect of DHG treatment on facial skin analysis.

Items

Control (Water)

DHG (0.1 g/ml)

Texture

37 ± 5

26 ± 3*

Pore

25 ± 4

17 ± 3*

Wrinkles

14 ± 3

 8 ± 3*

Erythema

40 ± 7

25 ± 7*

Glossy

48 ± 11

49 ± 9

Color

20 ± 6

19 ± 6

Skin tone

20 ± 5

41 ± 7

Stain

54 ± 11

55 ± 13

Effect of DHG on Tyrosinase Activity

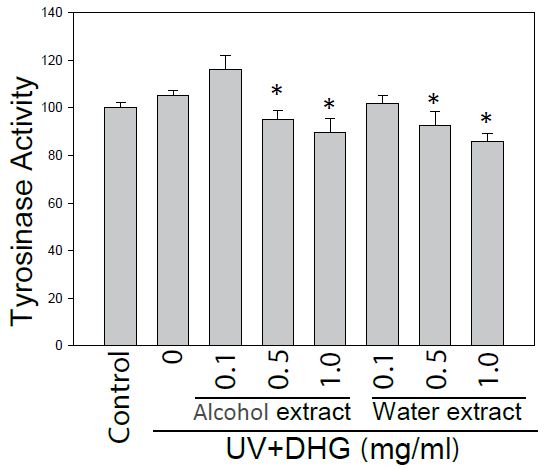
The DHG-treated B16-F10 cells under 100 mJ of UVB exposure were compared for tyrosinase activity. The results showed that both extracts of DHG (at 1 mg/ml) inhibited tyrosinase activities of 10.7 to 14.1% as compared to that of the UVB group (Figure 2).

fig 2

Figure 2: Inhibition of tyrosinase activity by DHG treatment. Tyrosinase activity of B16-F10 cells was compared for the treatment with and without DHG for 48 h. Each value is the mean + SE from three experiments. *p < 0.05 as compared with the UVB-treated control of B16-F10 cells.

Effect of DHG on Melanin Content of B16–F10 Cells

To further evaluate the potential of DHG as an anti-melanogenic agent, the melanin content from DHG-treated B16-F10 cells under 100 mJ of UVB exposure was determined. At 24 h post-treatment, the melanin content measured an absorbance at 405 nm. The result showed that water extract of DHG (1 mg/ml) had a melanin inhibitory activity of 16.4% (Figure 3).

fig 3

Figure 3: Inhibition of the melanin generation by DHG treatment. The melanin content of B16-F10 cells was assessed for 24 h treatment with and without DHG. Each value is the mean + SE from three experiments. *p < 0.05 as compared with the UVB-treated control.

Effect of DHG on ROS Generation

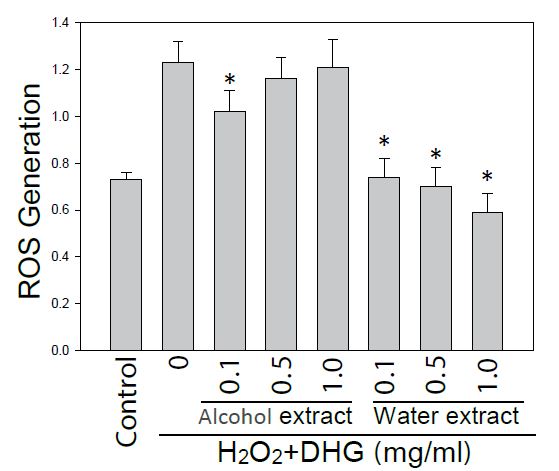
Since DHG had a skin care effect on texture, pores, and wrinkles, it was necessary to examine its effect on the cells under oxidative stress. Therefore HaCaT cells pretreated with10 μM H2DCF-DA and DHG were under H2O2 stress for 60 or 120 min. Cellular fluorescence was monitored for ROS generation. As we expected, the result showed that ROS was dose-dependently reduced by treatments of water extract of DHG (from 0.5 to 1 mg/ml) (Figure 4).

fig 4

Figure 4: Effect of DHG on ROS generation. HaCaT cells pretreated with H2DCF-DA and DHG were exposed to H2O2 for 60 min. Each ROS value is the mean + SE from three experiments. *p < 0.05 as compared with the H2O2-treated control.

Effect of DHG on Cell Signaling Pathways

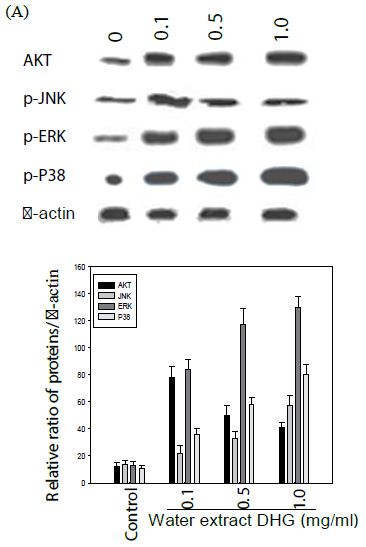
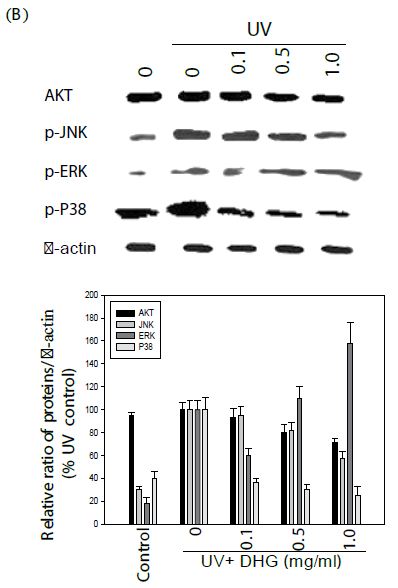
The cells were treated with various concentration of DHG for 1 h at 37°C, but B16-F10 cells were treated under UVB (100 mJ) stress. The results showed that DHG enhanced the phosphorylation of ERK significantly, but moderately on JNK, ERK, and p38 proteins in HaCaT cells. Interestingly, DHG dose-dependently enhanced phosphorylation of ERK, but reduced p-JNK and p-p38 proteins in B16-F10 cells under the UV stress (Figure 5).

fig 5a

fig 5b

Figure 5: Effect of DHG on cell signaling pathways. HaCaT cells were treated DHG and B16-F10 cells were treated with DHG and under UVB (100 mJ) stress for 1 h at 37°C. Representative data of AKT, phosphorylation of JNK, ERK, and p38 proteins are shown in HaCaT cells (A) and B16-F10 cells (B).

Discussion

The results show that DHG has no cytotoxic effect on the cell viability of HaCaT keratinocytes and B16-F10 melanoma cells. This is consistent with the use donkey hide in traditional Chinese medicine, which has been used for over 2,000 years for its unique therapies. The results showed that DHG has an anti-melanogenic effect by inhibiting tyrosinase activity and reducing melanin contents in B16-F10 melanocytes. These results suggest that DHG from donkey hide can be a potential candidate for development as an anti-pigmenting agent. Interestingly, DHG dose-dependently enhanced the proliferation of HaCaT keratinocytes and B16-F10 melanocytes. It has been reported that keratinocytes from the epidermis participates wound repair in the skin [14,15]. Keratinocytes contribute to melanocyte activity by influencing their microenvironment, partly through the secretion of endothelin-1 proteins [16]. In addition, DHG reduced H2O2-induced ROS generation significantly. Since there is a close relationship between oxidative stress and ageing [17], these results suggest that DHG together with other compounds [12,18,19], might help to preserve a healthy epidermis and dermis and prevent the visible signs of skin aging. This was also demonstrated by a short-term treatment of DHG on healthy volunteers’ facial skin textures, pores, wrinkles, and red spots.

One of the key amino acids of Colla corii asini is glycine [20]. Two human major collagen peptides, prolyl-hydroxyproline (Pro-Hyp) and hydroxyprolyl-glycine (Hyp-Gly enhance cell proliferation. In addition, Pro-Hyp enhances the production of hyaluronic acid by dermal fibroblasts [16]. Glycine functions as a building block in the production of proteins. Glycine is a non-essential amino acid, which means it can be synthesized within the human body, therefore cosmetics and skin care products, glycine primarily functions as an anti-ageing ingredient based on its ability to improve moisture retention, increase collagen production, and promote skin repair and regeneration. Other bioactive compounds from Colla corii asini may also contribute its anti-aging, antitumor, immunomodulatory, anti-inflammatory and anti-anemic effects [21,22].

Melanogenesis in melanocytes is regulated by a very complex system [6]. ERK and PI3K/Akt signaling pathways have been shown to negatively regulate melanogenesis in melanocytes and melanoma cells [3,23]. Our results show that DHG dose-dependently enhanced phosphorylation of ERK, but reduced p-JNK and p-p38 proteins in B16-F10 cells under the UV stress. This is in agreement with a report that ceramide inhibits melanogenesis by activation of ERK and inhibition of ERK and Akt causes an increase in pigmentation in human melanocytes [12]. Similarly, imidazole derivative and thaginin A can inhibit tyrosinase and activate the ERK pathway [19,24-26].

Conclusion

In summary, DHG was not cytotoxic to cells and had an anti-melanogenic effect by inhibiting tyrosinase activity and reducing melanin contents in B16-F10 melanocytes. It also showed an antioxidative effect of reducing ROS generation in H2O2-stressed HaCaT keratinocytes. DHG dose-dependently enhanced phosphorylation of ERK, but reduced p-JNK and p-p38 proteins in B16-F10 cells under the UV stress. These beneficial mechanisms suggest its potential application in skin care.

Acknowledgement

The authors wish to thank the Testing and Analysis Center at Yuanpei University of Medical Technology (Hsinchu, Taiwan) for the HPLC analysis.

References

  1. Ando H, Kondoh H, Ichihashi M, Hearing VJ (2007) Approaches to identify inhibitors of melanin biosynthesis via the quality control of tyrosinase. Journal Investigative Dermatology 127: 751-761. [crossref]
  2. Birch-Machin MA, Bowman A (2016) Oxidative stress and ageing. British Journal of Dermatology 2: 26-29. [crossref]
  3. Chan CF, Lai ST, Guo YC, Chen MJ (2014) Inhibitory effects of novel synthetic methimazole derivatives on mushroom tyrosinaseand melanogenesis. Bioorganic & Medicinal Chemistry 22: 2809-2815.
  4. Chang TS (2009) An updated review of tyrosinase inhibitors. International Journal of Molecular Science 10: 2440-2475. [crossref]
  5. Claudinot S, Nicolas M, Oshima H, Rochat A, Barrandon Y (2005) Long-term renewal of hair follicles from clonogenic multipotent stem cells. Proceedings of the National Academy of Sciences of the United States of America 102: 14677-14682.
  6. Costin GE, Hearing VJ (2007) Human skin pigmentation: melanocytes modulate skin color in response to stress. The FASEB J 21: 976-994. [crossref]
  7. Dorni AC, Amalraj A, Gopi S, Varma K, Anjana SN (2017) Novel cosmeceuticals from plants – an industry guided review. Journal of Applied Research on Medicinal and Aromatic Plants 7: 1-26.
  8. Hameury S, Borderie L, Monneuse JM, Skorski G, Pradines D (2019) Prediction of skin anti-aging clinical benefits of an association of ingredients from marine and maritime origins: Ex vivo evaluation using a label-free quantitative proteomic and customized data processing approach. Journal of Cosmetic Dermatology 18: 355-370. [crossref]
  9. Hou CW, Chen YL, Chuang SH, Wang JS, Jeng KC (2014) Protective effect of a sesamin derivative, 3-bis (3-methoxybenzyl) butane-1, 4-diol on ischemic and hypoxic neuronal injury. Journal of Biomedical Science 21: 15. [crossref]
  10. Huang CC, Hsu BY, Wu NL, Tsui WH, Lin TJ, et al. (2010) Anti-photoaging effects of soy isoflavone extract (aglycone and acetylglucoside form) from soybean cake. International Journal of Molecular Science 11: 4782-4795. [crossref]
  11. Kim DS, Kim SY, Chung JH, Kim KH, Eun HC, et al. (2002) Delayed ERK activation by ceramide reduces melanin synthesis in human melanocytes. Cellular Signalling 14: 779-785. [crossref]
  12. Peng LH, Liu S, Xu SY, Chen L, Shan YH, et al. (2013) Inhibitory effects of salidroside and paeonol on tyrosinase activity and melaninsynthesis in mouse B16F10 melanoma cells and ultraviolet B-induced pigmentation in guinea pig skin. Phytomedicine 20: 1082-1087. [crossref]
  13. Huang JH, Huang CC, Fang JY, Yang C, Chan CM, et al. (2010) Protective effects of myricetin against ultraviolet-B-induced damage in human keratinocytes. Toxicology In Vitro 24: 21-28. [crossref]
  14. Hyter S, Coleman DJ, Ganguli-Indra G, Merrill GF, Ma S, et al. (2013) Endothelin-1 is a transcriptional target of p53 in epidermal keratinocytes and regulates ultraviolet-induced melanocyte homeostasis. Pigment Cell & Melanoma Research 26: 247-258. [crossref]
  15. Inoue N, Sugihara F, Wang X (2016) Ingestion of bioactive collagen hydrolysates enhance facial skin moisture and elasticity and reduce facial ageing signs in a randomised double-blind placebo-controlled clinical study. Journal of the Science of Food and Agriculture 96: 4077-4081. [crossref]
  16. Ito M, Liu Y, Yang Z, Nguyen J, Liang F, et al. (2005) Stem cells in the hair follicle bulge contribute to wound repair but not to homeostasis of the epidermis. Nature Medicine 11: 1351-1354. [crossref]
  17. Kim DS, Lee HK, Park SH, Chae CH, Park KC (2009) AVS-1357 inhibits melanogenesis via prolonged ERK activation. Die Pharmazie 64: 532-537. [crossref]
  18. Wang D, Ru W, Xu Y, Zhang J, He X, et al. (2014) Chemical constituents and bioactivities of Colla corii asini. Drug Discoveries & Therapeutics 8: 201-207. [crossref]
  19. Shen L, Chen H, Zhu Q, Wang Y, Wang S, et al. (2016) Identification of bioactive ingredients with immuno-enhancement and anti-oxidative effects from Fufang-Ejiao-Syrup by LC–MS(n) combined with bioassays. Journal of Pharmaceutical and Biomedical Analysis 117: 363-371. [crossref]
  20. Wu H, Ren C, Yang F, et al. (2016) Extraction and identification of collagen-derived peptides with hematopoietic activity from Colla Corii Asini. Journal of Ethnopharmacology 182: 129-136.
  21. Oka M, Nagai H, Ando H, et al. (2000) Regulation of melanogenesis through phosphatidylinositol 3-kinase-Akt pathway in human G361 melanoma cells. Journal of Investigative Dermatology 115: 699-703.
  22. Kim JH, Baek SH, Kim DH, Choi TY, Yoon TJ, et al. (2008) Downregulation of melanin synthesis by haginin A and its application to in vivo lightening model. Journal of Investigative Dermatology 128: 1227-1235.
  23. Lee SY, Baek N, Nam T-g (2016) Natural, semisynthetic and synthetic tyrosinase inhibitors. Journal Enzyme Inhibition and Medicinal Chemistry 31: 1-13. [crossref]
  24. Lv P, Zhao YJ, Qi F, Zhou XS, You JH, et al. (2011) Authentication of equine DNA from highly processed donkey-hide glue (Colla corii asini) using sine element. Journal of Food and Drug Analysis 19: 123-130.
  25. Wang D, Liu M, Cao J, Cheng Y, Zhuo C, et al. (2012) Effect of Colla corii asini (E’jiao) on D-galactose induced aging mice. Biological and Pharmaceutical Bulletin 35: 2128-2132. [crossref]
  26. Wu HZ, Yang F, Cui SY, Qin YF, Liu JW, et al. (2007) Hematopoietic effect of fractions from the enzyme digested colla corii asini on mice with 5-fluorouracil induced anemia. The American Journal of Chinese Medicine 35: 853-866. [crossref]

Chemical Characterization and Anti-Microbial Evaluation of the Eastern Nigerian Specie of African Mistletoe (Loranthus micranthus) Sourced From Citrus sinensis

DOI: 10.31038/IMROJ.2021622

Abstract

This present study is aimed at determining phytochemical constituents with the aid of GCMS technique and in vitro screening of crude methanol extract of the leaves of Loranthus micranthus Linn parasitic on Citrus sinensis tree sourced from Nsukka, in the eastern part of Nigeria for their antimicrobial activity against six human pathogens. Preliminary phytochemical screening was carried out on the crude extract. The results of the phytochemical analysis showed positive for tannins, flavonoids, steroids, alkaloids, triterpenes/sterols, glycosides and saponins. GCMS analysis revealed nine bioactive compounds in the crude methanol extract of Loranthus micranthus, which includes; Benzoic acid, 3,4,5-trimethoxy-, trimethylsilyl ester, 1,3,5-Triazine, 2,4,6-tris[(trimethylsilyl)oxy]-, Gallic acid, Beta-Amyrin, Beta-Sitosterol, Lup-20(29)-en-3-one. The crude methanol extract of Loranthus micranthus was subsequently partitioned into four solvents to obtain n-hexane, chloroform, ethyl acetate and methanol fractions respectively. The crude extract and the four fractions were observed for antimicrobial activities on the following pathogens; Escherichia coli, Pseudomonas aeruginosa, Bacillus subtilis, Aspergillums niger, Staphylocoocus aureus and Candida albicans at various concentrations using agar diffusion method. The results of the antimicrobial activity proved the ability of the crude methanol extract and the obtained fractions of Loranthus micranthus to inhibit these pathogens. Different bacterial species and fungi exhibited different sensitivities with variable extent towards the extract/fractions. The order of activity against selected bacteria was Candida albicans> Bacillus subtilis> Staphylococcus aureus> Escherichia coli. Only the crude methanol extract at a concentration of 25 mg/ml inhibited Pseudomonas aeruginosa. While Aspergillums niger was resistant to both the extract and fractions. The n-hexane and the methanol fractions of Loranthus micranthus exerted maximum antimicrobial activity against Candida albicans with an MIC of 1.25 and 0.625 mg/ml respectively. An indication that the plant possesses very potent antifungal activities The MIC for Bacillus subtilis was 1.25 for n-hexane and methanol fractions respectively. There is good evidence that the plant is more active against gram positive bacteria.

Keywords

Antimicrobial, Gas chromatography-Mass spectrometry analysis, Loranthus micranthus Linn, Phytochemical

Introduction

Citrus sinensis belongs to the Rutaceae family, commonly known as sweet orange, which is a much sought after fruit worldwide with immense cultural and historical significance. The fruit’s origin dates back to its mention in the Chinese literature of 314 BC [1]. Orange trees thrive in both tropical and subtropical climates, making the plant; one of the most cultivated globally [2]. In the last decade, sweet orange accounted for 70% of the citrus fruits cultivated [2]. Currently, the production of oranges has hit 73 million tonnes, with Brazil, China and India leading in the production of oranges [3]. The fruit is a major source of vitamin C, which led to the massive cultivation of oranges along trade routes of European sailors in the discovery age. There has been numerous reports on the bioactivities of sweet oranges by many scholars. The anti-oxidant activities have received immense attention; similarly, the antimicrobial activities of the essential oil, the juice and the peels have equally been documented. However, the bioactivity of the mistletoes parasitic on oranges has very scanty reports, owing to the obvious fact that orange tree rarely bear host to parasitic plants such as mistletoe. A literature search revealed that the anti-microbial activities of Loranthus micranthus from Citrus sinensis has not been carried out, despite the plethoral of anti-microbial activities attributed to Citrus sinensis. While the mistletoes of many host trees such as Pentaclethra macrophylla, Persea americana, Kola nitida, Kola acuminata and Hevea brasiliensis have been investigated and shown to possess numerous activities, which includes: antioxidant, antimicrobial, antidiarrhoeal, immunomodulatory, antidiabetic, antihypertensive, and hypolipidemic activities [4]. The Citrus sinensis mistletoe has not been investigated.

In my previous work, it was observed that mistletoes parasitic on the host trees with significant bioactivity possessed some of the reported activities of their host trees. While the mistletoes parasitic on the host trees with few significant bioactivities also showed less significant bioactivities [5]. In this current work, the chemical characterization and antimicrobial evaluation of Loranthus micranthus (LM) parasitic on Citrus sinensis is reported.

Materials and Methods

Plant Material

Fresh leaves of LM parasitic on Citrus sinensis were obtained in Oba in Nsukka LGA of Enugu State. The plant was identified by a botanist in the Department of Botany, University of Nigeria, Nsukka, after which a voucher specimen was deposited in the department.

Extraction Procedure

The LM leaves were dried at room temperature under a shade, and pulverized. Weighed quantities of the LM were extracted with aqueous methanol using soxhlet extractor. The obtained methanol extract was subsequently partitioned into the following four solvents: N-hexane, Chloroform, Ethyl acetate and Methanol sequentially.

Preliminary Screening

The phytochemical constituents of the methanol extracts were determined according to the method prescribed by Trease and Evans [6].

GC-MS Analysis of the Crude Extracts

The gas chromatography mass spectrometry (GC-MS) analysis of the crude methanol extract of the leaves of Loranthus micranthus parasitic on C. sinensis was quantitatively determined using an Agilent 7890B GC system coupled with an Agilent 5977A MSD with a Zebron-5MS column (ZB-5MS 30 m × 0.25 mm × 0.025 μm) (5%-phenylmethylpolysiloxane). The GC-grade helium served as the carrier gas at a constant flow rate of 2 mL/min. The crude extract was dissolved with ethanol and filtered before use. The column temperature was maintained at 60°C and gradually increased at 10°C per minute until a final temperature of 300°C was reached. The time taken for the GC-MS analysis was 30 min. The compounds were identified based on computer matching of the mass spectra with the NIST 11 MS library (National Institute of Standards and Technology library).

Materials for Anti-microbial Assay

Equipment: Microscope, autoclave, incubator, wire loop, Bunsen burner, markers, petri dish test tubes and McCartney bottle.

Reagents

Nutrient agar and broth, Sabourand’s dextrose agar and broth, dimethyl sulfoxide (DMSO), sterile distilled water.

Test Organisms

All organisms used were clinical isolates obtained from the laboratory of pharmaceutical microbiology, University of Port Harcourt. The research utilized two gram positive bacteria, two gram negative bacteria and two fungi. The organisms were; Escherichia coli, Pseudomonas aeruginosa, Bacillus subtilis, Aspergillums niger, Staphylocoocus aureus and Candida albicans. The organisms were sub cultured and standardized before use.

Anti-Microbial Assay Method

Agar diffusion by cup plate method was adopted as described [7]. The entire agar used was prepared according to the manufacturer’s specification. The glass wares were thoroughly washed and sterilized, suspensions of the test organisms were made and 0.05 ml of 0.5 McFarland standard of the test organism concentration were dispensed each in the plate and 20 ml of the sterile molten agar each were added, mixed and allowed to set/gel, using two fold serial dilution. Different concentration of the methanol extract, the fractions and standard antibiotic used were made. Holes were bored on the agar using cock bore and labeled properly. 0.05 ml of each concentration was added into the respective holes with the aid of sterile syringe and allowed to diffuse for 15-20 minutes, then incubated at 37°C (bacterial), 25°C (fungi) for 24 hours. The zone of inhibition was determined against concentration with the aid of a meter rule to the nearest millimeter. Positive control for bacteria was Ciprofloxacin 100 mg/100 ml. Ketoconazole at a dose of 100 mg/ml served as the positive control for the fungi. The extract and fractions were solubilized in DMSO. A concentration of 50 mg/ml of the plant extracts were used for the antimicrobial assay. This concentration was serially diluted seven times to yield a minimal concentration of 0.78125 mg/ml. The MIC of the fractions which showed activity, were determined using the already diluted concentrations, 10 mg/ml, 5 mg/ml, 2.5 mg/ml, 1.25 mg/ml, 0.625 mg/ml 0.3125 mg/ml and 0.15625 mg/ml. The MIC was obtained as the least concentration that had a zone of inhibition.

Statistical Analysis

Each test was carried out in triplicate. The values were expressed as mean ± standard error of mean (SEM). The Dunnett one way analysis (ANOVA) was used to determine the significant differences among all columns against control and the P value < 0.05 was considered as significant. All statistical analysis was performed using Graph Pad Prism version 8.0 software.

Results

Table 1 shows the result of phytochemical analysis of the crude methanol extract of LM. The pharmacologically important classes of secondary metabolites are contained in the mistletoe. There is a heavy presence of flavonoids, saponins and tannins in the plant compared to the phytoconstituents. Similarly, the phytochemical analysis of the peels of C. sinensis have been documented to possess alkaloid, flavonoids, terpenoids, reducing sugars, saponins, tannins and amino acid [8].

Table 1: Results from the Phytochemical Screening.

Phytochemical Constituents

Qualitative Assessment

Flavonoids

Shinoda Reduction Test


++

Saponins

Frothing Test


++

Tannins

Ferric chloride test


++

Alkaloids

Mayer’s test


+

Proteins

Million’s Test


+

Fats and oil

Oil Stain test


+

Terpenoids/Sterols

Salkwoski’s Test


+

Carbohydrates

Molisch test


+

Glycosides

Keller-killiani


+

Reducing sugar

Fehlings test


+

Resins

Copper acetate solution


Trace

The GCMS chemical characterization of the crude methanol extract was carried out and the results presented in Table 2. Nine compounds were identified from a spectral match with the NIST library of the equipment. There were some unidentified peaks in the GCMS chromatogram, but of the nine identified compounds, some pharmacological-active compounds with antimicrobial activities were recorded.

Table 2: GCMS Analysis Results.

No.

Compounds Retention time (RT) % Peak Area
1 Benzoic acid, 3,4,5-trimethoxy-, trimethylsilyl ester 18.061

0.64

2

1,3,5-Triazine, 2,4,6-tris[(trimethylsilyl)oxy]- 18.670 1.24
3 Benzoic acid, 3,4,5-tris(trimethylsiloxy)-, trimethylsilyl ester (gallic acid) 19.580

9.98

4

Beta.-Amyrin trimethylsilyl ether (Beta.-Amyrin) 27.060 3.52
5 Beta.-Sitosterol trimethylsilyl ether (Beta.-Sitosterol) 27.300

5.84

6

Lup-20(29)-en-3-one 27.900 15.62
7 Antra-9,10-quinone, 1-(3-hydrohy-3-phenyl-1-triazenyl)- 28.990

12.18

8

4-Dehydroxy-N-(4,5-methylenedioxy-2-nitrobenzylidene)tyramine 29.008 3.63
9 2-Thiophenecarboxylic acid, 4-methyl-5-nonadecyl-, methyl ester 29.600

2.55

The antimicrobial activities of the crude methanol extract are disclosed in Table 3. The results showed that the extract had pronounced anti-fungal activity. The results further demonstrated that the extract had less impact on gram negative bacteria in comparison to gram positive bacteria.

Table 3: Antimicrobial assay result of the crude Methanol extract.

Methanol extract

Concentration (mg/ml) /Diameter of zone of inhibition (mm) (Mean values ± SEM)
Test Organism 50 25 12.5 6.25 3.125 1.5625

0.78125

S. aureus

7.0 ± 0.0 5.3 ± 0.3 4.0+0.0 + + + +
E. coli 8.0+0.0 6.0+0.0 4.6+0.3 3.0+0.0 + +

+

B. subtilis

9.0+0.0 7.0+0.0 5.0+0.0 4.0+0.0 3.0+0.0 + +
P. aeruginosa 4.0+0.00 2.0+0.0 + + + +

+

C. albicans

11.7+0.3 10.0+0.0 8.0+0.0 6.0+0.0 4.0+0.0 2.0+0.0 +
A.niger + + + + + +

+

The fractions obtained from the crude methanol extract were evaluated for their antimicrobial activities at a lower concentration to determine their potency. These results obtained are presented in Table 4. Significantly, all the fractions had no activity against P. aeruginosa and A. niger. However, various degrees of inhibitions were recorded against the tested pathogens.

Table 4: Inhibition Zone Diameter Exhibited By The Fractions At Different Concentrations.

Fraction Conc (mg/ml)

Test Organisms
S. aureus E. coli B. subtilis P. aeruginosa C. albicans

A.niger

n-Hexane 10

5

2.5

1.25

0.625

0.3125

0.15625

6.0+0.0

4.0+0.0

3.0+0.0

+

+

+

+

5.0+0.0

3.0+0.0

+

+

+

+

+

6.0+0.0

5.0+0.0

4.0+0.0

3.0+0.0

+

+

+

+

+

+

+

+

+

+

7.0+0.0

5.0+0.0

4.0+0.0

3.0+0.0

+

+

+

+

+

+

+

+

+

+

Chloroform 10

5

2.5

1.25

0.625

0.3125

0.15625

4.0+0.0

2.9+0.1

+

+

+

+

+

+

+

+

+

+

+

+

6.0+0.0

4.0+0.0

2.0+0.0

+

+

+

+

+

+

+

+

+

+

+

6.0+0.0

4.0+0.0

3.0+0.0

2.0+0.0

+

+

+

+

+

+

+

+

+

+

Ethyl acetate 10

5

2.5

1.25

0.625

0.3125

0.15625

6.0+0.0

4.0+0.0

+

+

+

+

+

4.0+0.0

2.3+0.3

+

+

+

+

+

+

+

+

+

+

+

+

+

+

+

+

+

+

+

6.0+0.0

5.0+0.0

4.0+0.0

3.0+0.0

2.0+0.0

+

+

+

+

+

+

+

+

+

Methanol 10

5

2.5

1.25

0.625

0.3125

0.15625

4.0+0.0

2.0+0.0

+

+

+

+

+

6.0+0.0

4.0+0.0

2.0+0.0

+

+

+

+

6.0+0.0

5.0+0.0

4.0+0.0

2.0+0.0

+

+

+

+

+

+

+

+

+

+

8.0+0.0

6.0+0.0

5.0+0.0

3.0+0.0

2.0+0.0

+

+

+

+

+

+

+

+

+

Ciprofloxacin

1 mg/ml

11.3±0.3 17.3±0.6 19.7±0.3 + +
Ketoconazole

1 mg/ml

+ + + + 16.3±0.3

DMSO

+ + + + +

+

Ciprofloxacin: Positive control for bacteria; Ketoconazole: Positive control for Fungi; DMSO: Negative control; +: No inhibition.

The analysis of the MIC of the crude methanol extract and fractions are portrayed in Table 5. The key observation is that both the crude extract and the fractions exercised antifungal activities against C albicans. Except the crude methanol extract at a concentration of 25 mg/ml, all the fractions had no activity over P. aeruginosa.

Table 5: MIC of Crude methanol Extract and Fractions.

Extract/Fraction

MIC of Test Organisms

S. aureus E. coli B. subtilis P. aeruginosa

C. albicans

Methanol extract

12.5

6.25 3.125 25

1.5625

n-Hexane fraction

2.5

5 1.25 +

1.25

Chloroform fraction

5

+ 2.5 +

1.25

Ethyl acetate fraction

5

5 + +

0.625

Methanol fraction

5

2.5 1.25 +

0.625

Discussion

The citrus mistletoe is rich in flavonoids which are known to demonstrate antibacterial, anti-inflammatory and antifungal activities [9]. The presence of phenolic compounds has been attributed to antioxidant activities [10]. Flavonoids have both antifungal and antibacterial activity and anti-inflammatory properties [9]. Similarly, therapeutic benefits from alkaloids [11]and saponins [12] have been documented in literature.

The GCMS analysis of the Crude methanol extract revealed a number of peaks from which nine compounds were identified as Benzoic acid, 3,4,5-trimethoxy-, trimethylsilyl ester; 1,3,5-Triazine, 2,4,6-tris[(trimethylsilyl)oxy]-; Benzoic acid, 3,4,5-tris(trimethylsiloxy)-, trimethylsilyl ester (gallic acid); Beta-Amyrin trimethylsilyl ether (Beta-Amyrin); Beta-Sitosterol trimethylsilyl ether (Beta-Sitosterol); Lup-20(29)-en-3-one; Antra-9,10-quinone, 1-(3-hydrohy-3-phenyl-1-triazenyl)-; 4-Dehydroxy-N-(4,5-methylenedioxy-2-nitrobenzylidene)tyramine and 2-Thiophenecarboxylic acid, 4-methyl-5-nonadecyl-, methyl ester. It was discovered that the citrus mistletoe contained lupine-type triterpenes which have demonstrated significant cytotoxicities on human leukemias, melanomas and neuroblastomas. One analogue- Lup-28-al-20(29)-en-3-one, a close structural analogue of Lup-20(29)-en-3-one was the most bioactive [13].

Again the presence of gallic acid and its derivative Benzoic acid, 3,4,5-trimethoxy-, trimethylsilyl ester, strongly supports the antimicrobial activity of this mistletoe. Previous studies have documented the antimicrobial activities of gallic acid derivatives on Potato Bacterial Wilt Pathogen with 3,5-dihydroxy-4-methoxybenzoic acid shown to be the most potent one with a MIC value of 0.47 mg/ml [14].

Beta-amyrin (β-amyrin), another bioactive compound present in citrus mistletoe has been evaluated on clinical pathogens. The activity when compared with standard drugs was found to be comparable with the standard drug used [15].

β-sitosterol is the major phytosterols, found abundantly in plants is also present in citrus mistletoes. Many in vitro and in vivo studies have demonstrated various biological actions such as antimicrobial, anti – inflammatory, analgesic, immunomodulatory, anticancer, lipid lowering effect, anxiolytic & sedative effects, hepatoprotective, protective effect against NAFLD and respiratory diseases. Other effects include: wound healing effect, antioxidant and anti-diabetic activities [16]. The antimicrobial studies of novel series of 2,4-bis(hydrazino)-6-substituted-1,3,5-triazine and their Schiff base derivatives was carried using S. aureus, and E. coli among the pathogens evaluated. The 1,3,5-triazine were found to demonstrate significant activity on bacteria in microgram/ml range, but no antifungal activity was observed. It may be suggested that the presence of 1,3,5-triazine in the mistletoe contributed to the observed activity against the gram positive bacteria [17].

Conclusion

The results of the analyses shown earlier have demonstrated that the leaves of L. micranthus Linn parasitic on Citrus sinensis possess very potent antifungal activities against C. albicans and thus could be used as a therapeutic preparation in treatment of fungal Infections. Also, from the results the fractions displayed varying degree of antimicrobial activity against S. aureus, E. coli and B. subtilis. While P. aeruginosa and A. niger could not be inhibited by the fractions at the test concentrations. This suggests that the extracts had more activity against gram positive bacteria than against gram negative bacteria. The antimicrobial activity of the citrus mistletoe merits further research as the plant has potentials for development into antimicrobial agent that can be used in treating infections. Again, given that the plant contains some reported antimicrobial compounds, this might be exploited in the design and development fungicidal and bactericidal drugs.

Conflict of Interest

No potential conflict of interest was reported by the authors.

References

  1. Xu Q, Chen LL, Ruan X, Chen D, Zhu A, et al. (2013) “The draft genome of sweet orange (Citrus sinensis)”. Nature Genetics 45: 59-66. [crossref]
  2. “Citrus sinensis” (2017) Germplasm Resources Information Network (GRIN). Agricultural Research Service (ARS), United States Department of Agriculture (USDA).
  3. Production, Crops, World Regions (2018) United Nations, Food and Agricultural Organization, FAO Statistics.
  4. Moghadamtousi SZ, Hajrezaei M, Abdul Kadir H, Zandi K (2013) Loranthus micranthus Linn.: Biological Activities and Phytochemistry. Evidence-Based Complementary and Alternative Medicine 2013: 273712. [crossref]
  5. Osadebe PO, Johnson-Ajinwo OR (2010) A Review of the Bio-Activity Relationship of Mistletoes and the Leaves of their Host Trees. Nigerian Journal of Pharmaceutical Research 8: 145-150.
  6. Evans WC, Evans D, Trease GE (2002) Trease and Evans’ Pharmacognosy. 15th Edition, Publisher: WB Saunders, Edinburgh ; New York.
  7. Seeley HW, Van Denmark PJ (1975) “Microbes in action” in A Laboratory manual of Microbiology. 2nd ed. Bombay: D B. Taraporewala Sons and Co 55-80.
  8. Baba J, Mohammed SB, Ya’aba Y, Umaru FI (2018) Antibacterial Activity of Sweet Orange (Citrus sinensis) on some Clinical Bacteria Species Isolated from Wounds. J Family Med Community Health 5: 1154
  9. Iwu MW, Duncan AR, Okunji CO (1999) New antimicrobials of plant origin. In: Janick J (Ed.), perpectives on New uses. ASHS press Alexandria. VA, 457-462.
  10. Gomez-Alonso S, Fregapane G, Salvador MD, Gordon MH (2003) Changes in phenolic composition and antioxidant activity of virgin olive oil during frying. Agric. Food Chem 51: 667-672. [crossref]
  11. Njoku PC, Akumefula MI (2007) Phytochemical and Nutrient Evaluation of Spondias mombin Leaves. Parkistan Journal of Nutrition 6: 613-615.
  12. Rabe T, van Staden J (2000) Isolation of an antibacterial sesquiterpenoid from Warburgia salutaris. Ethnopharmacol 73: 171-174. [crossref]
  13. Keishi H, Kazuyuki H, Hironobu O, Takahashi S (2003) Anti-leukemia activities of Lup-28-al-20(29)-en-3-one, a lupane triterpene. Toxicology Letters 143: 1-7. [crossref]
  14. Mohamed A, Farag Dalia A, Al-Mahdy R, El Dine S, Fahmy S, et al. (2015) Structure Activity Relationships of Antimicrobial Gallic Acid Derivatives from Pomegranate and Acacia Fruit Extracts against Potato Bacterial Wilt Pathogen. Chemistry & Biodiversity 12: 955-962. [crossref]
  15. Ogwuche CE, Amupitan JO, Ndukwe IG, Ayo RG (2014) Isolation and Biological Activity of the Triterpene Β-Amyrin from the Aerial Plant Parts of Maesobotrya Barteri (Baill). Med chem 4: 729-733.
  16. Babu S, Jayaraman S (2020) An update on β-sitosterol: A potential herbal nutraceutical for diabetic management. Biomedicine & Pharmacotherapy 131: 110702. [crossref]
  17. Al-Rasheed HH, Sholkamy EN, Al Alshaikh M, Mohammed RH, Siddiqui MRH, et al. (2018) Synthesis, Characterization, and Antimicrobial Studies of Novel Series of 2,4-Bis(hydrazino)-6-substituted-1,3,5-triazine and Their Schiff Base Derivatives. Hindawi Journal of Chemistry 2018: 8507567.

The Status Quo in Health Risk Assessment of Chronic Diseases and Challenges Faced by China

DOI: 10.31038/IMROJ.2021621

Abstract

As a key technology for chronic disease management, risk assessment plays an important role in chronic disease prevention and control. This paper aims to summarize the status quo in risk assessment of chronic disease in recent years in hope of providing guidance for chronic disease assessment in China.

Keywords

Challenges, Chronic diseases, Health risk assessment

Introduction

The mortality due to chronic diseases accounted for about 70% of the total deaths [1-3]. In 2012, deaths from chronic diseases accounted for 86.6% of the total deaths in China, higher than the global average over the same period [4]. Due to the slow onset and long incubation of the chronic disease, prevention and early intervention, which screen high-risk patients by studying the health risk factors, are recognized as effective ways to reduce the incidence. Health risk assessment, which aims to study the relationship of the risk factors with incidence and case fatality rate as well as the inherent laws, is a basic technology and the core for screening the patients with chronic disease.

The Status Quo in Chronic Disease Risk Assessment at Home and Abroad

In 1967, the National Institutes of Health of the United States established the Framingham risk model [5]. Risk factors for cardiovascular disease (CVD), including age, systolic blood pressure etc., were included in the model to predict the risk of coronary heart disease in the next 10 years of individual patients. Framingham model is a milestone in the history of chronic disease risk assessment, promoting the innovation of risk assessment technology. After a series of improvements [6-8], the prediction ability of the model has been further improved. Other common CVD assessment models include the National Cholesterol Education Program Adult Treatment Panel III (NCEP-ATP III) [9]; QRISK risk score [10]; Reynolds Risk Score [11]; ischemic cardiovascular disease (ICVD) risk assessment in China [12]; and Chinese CMCS model [8].

Based on 2 large cohort studies, the Harvard Cancer Risk Index Working Group developed a risk assessment tool for cancers, which can be used to assess the risk of cancer in the population aged over 40 [13]. This method is simple, fast and widely accepted. In addition, Gail Model [14], as a comparatively accurate breast cancer assessment model, can assess the risk of breast cancer within 5 years or throughout the life of an individual patient, and is widely used in clinical practice [15]. In 2018, based on Framingham model, Southwest Hospital in Chongqing, China, developed a risk assessment model for asymptomatic cancer which integrates cancer statistics in 2015 and 2018 in China, and the data on chronic disease risk assessment and standardization project of preventive medicine. Currently the model is in clinical trial.

Over the past 50 years, remarkable progress has been made in the prevention of chronic disease by risk assessment: the mortality rate of chronic disease has been significantly reduced in many countries worldwide [16]. Since the 1980s, China has gradually built ICVD risk assessment and CMCS model [8,12], a lifetime risk assessment model for cardiovascular disease and stroke [17,18] and China-PAR model [19-21], which conformed with the national situation. However, most of the existing risk assessment models in China lack external validation, and thus the application of the models is limited [22]. As for early screening for cancer, many expert consensuses have been reached [23-25], but the risk assessment model based on multiple risk factors is still in the pilot stage.

The Challenges with Health Risk Assessment in China

  1. There is a lack of high-quality data. Large cohort studies are an important source of high-quality data; At present, there are China kadoorie biobank (CKB) and prospective follow-up studies on factors impacting development of cardiovascular disease and its mortality, but they are still in early phase.
  2. The standards for health data have not been unified. Basic data for health risk assessment may come from diversified sources, such as smart watches and wearable devices etc. However, the standards of health management data have not been developed to meet the real needs in China.
  3. The modeling method is not innovative enough. The main risk factors included were lifestyle-related and metabolic risk factors [26], such as smoking and BMI, while other factors, including the time sequence of chronic diseases [27], characteristics of disease evolution in population [28], environmental factors and social determinants, have not been considered [29]. In addition, support vector machine [22], classification and regression tree etc. are less frequently used.
  4. Promotion is limited. There is a lack of a sound health education system for chronic diseases, the public have limited knowledge about chronic diseases, their attitude towards chronic disease risk assessment is ambiguous, and the compliance is not high.

Competing Interests Statement

The authors declare that they have no conflicts of interest.

References

  1. WHO (2020) Disease burden and mortality estimates: cause-specific mortality, 2000-2016. https://www.who.int/healthinfo/global_burden_disease/estimates/en/
  2. WHO (2018) World health statistics 2018: monitoring health for the SDGs. Geneva: World Health Organization.
  3. NCD Countdown 2030 collaborators (2018) NCD Countdown 2030: worldwide trends in non-communicable disease mortality and progress towards Sustainable Development Goal target 3.4. Lancet 392: 1072-1088.
  4. Zhu XL, Luo JS, Zhang XC, Zhai Y, Wu J (2017) China’s efforts on management, surveillance, and research of noncommunicable diseases: NCD Scorecard Project. Ann Glob Health 83: 489-500. [crossref]
  5. Truett J, Cornfield J, Kannel W (1967) A multivariate analysis of the risk of coronary heart disease in Framingham. J Chronic Dis 20: 511-524. [crossref]
  6. Kannel WB, Mc Gee D, Gordon T (1976) A general cardiovascular risk profile: the Framingham Study. Am J Cardiol 38: 46-51. [crossref]
  7. Wilson PW, D’Agostino RB, Levy D, Belanger AM, Silbershatz H, et al. (1998) Prediction of coronary heart disease using risk factor categories. Circulation 97: 1837-1847. [crossref]
  8. Liu J, Hong Y, DAgostino RB, Wu Zh, Wang W, et al. (2004) Predictive value for the Chinese population of the Framingham CHD risk assessment tool compared with the Chinese Multi-Provincial Cohort Study. JAMA 291: 2591-2599. [crossref]
  9. National Cholesterol Education Program Expert on Detection, Evaluation, and Treatment of High Blood Cholesterol in Adults (2001) Executive summary of the third report of the National Cholesterol Education Program (NCEP) Expert Panel on Detection, Evaluation, and Treatment of High Blood Cholesterol in Adults(Adults Treatment Panel III). JAMA 285: 2486-2497. [crossref]
  10. Hippisley CJ, Coupland C, VinogradovaY Robson J, Margaret M, Brindle P (2007) Derivation and validation of QRISK, a new cardiovascular disease risk score for the United Kingdom: Prospective open cohort study. BMJ 7611:136-141. [crossref]
  11. Ridker PM, Buring JE, Rifai N, Nancy RC (2007) Development and validation of improved algorithms for the assessment of global cardiovascular risk in women: The Reynolds Risk Score. JAMA 297: 611-619. [crossref]
  12. Wu YF, Liu XQ, Li X, Li Y, Zhao LC, et al. (2006) Estimation of 10-year risk of fatal and nonfatal ischemic cardiovascular diseases in Chinese adults. Circulation 114: 2217-2225. [crossref]
  13. Kim DJ, Rockhill B, Colditz GA (2004) Validation of the Harvard cancer risk index: a prediction tool for individual cancer risk. J Clin Epidemiol 57: 332-340. [crossref]
  14. Li X, Yang XX, Li M (2011) Research progress and clinical application of breast cancer risk assessment model Cancer Research on Prevention and Treatment 5: 604-606.
  15. He DD, Wu F, Wen XS, Tang H, Fang H (2016) Progress in Gail models for breast cancer risk assessment. Tumor 36: 1389-1394.
  16. NCD Countdown 2030 collaborators (2020) NCD Countdown 2030: pathways to achieving Sustainable DevelopmentGoal target 3.4. Lancet 26: 396: 918-934. [crossref]
  17. Wang Y, Liu J, Wang W, Wang M, Qi Y, et al. (2015) Lifetime risk for cardiovascular disease in a Chinese population: the Chinese Multi-Provincial Cohort Study. Eur J PrevCardiol 22: 380-388. [crossref]
  18. Wang Y, Liu J, Wang W, Wang M, Yue Qi, et al. (2016) Lifetime risk of stroke in young-aged and middle-aged Chinese population: the Chinese Multi-Provincial Cohort Study[J]. J Hypertens 34: 2434-2440. [crossref]
  19. Yang X, Li J, Hu D, Chen JC, Li Y, et al. (2016) Predicting the 10-year risks of atherosclerotic cardiovascular disease in Chinese population: the China-PARproject (prediction for ASCVD risk in China). Circulation 134: 1430-1440. [crossref]
  20. Yang XL, Chen JC, Li JX, Cao J, Lu XF, et al. (2016) Risk stratification of atherosclerotic cardiovascular disease in Chinese adults[J]. Chronic Dis Transl Med 2: 102-109. [crossref]
  21. Liu F, Li J, Chen J, Hu DH, Li Y, et al. (2018) Predicting lifetime risk for developing atherosclerotic cardiovascular disease in Chinese population: the China-PAR project. Sci Bull 63: 779-787.
  22. Li ZY, Shi TX, Huang XX, Shi JW, Huang JL, et al. (2020) Research status of chronic disease risk assessment at home and abroad and analysis of breakthrough in China. Chinese Health Resources 23: 49-54.
  23. Zhuan Liao, Tao Sun, Hao Wu, Yang F, Zou W B (2014) Consensus on screening and endoscopic diagnosis and treatment of early gastric cancer in China. Chinese Journal of Gastroenterology 7: 408-427.
  24. Li P, Wang YJ, Chen GY, Xu CQ (2015) Consensus on screening, diagnosis and treatment of early colorectal cancer and precancerous lesions in China. Chinese Journal of Practical Internal Medicine 3: 211-227.
  25. National Digestive Endoscopy Improvement Systems (2019) Expert consensus on screening of early esophageal cancer and precancerous lesions in China. Chinese Journal of Digestive Endoscopy 11: 793-801. [crossref]
  26. World Health Organization (2010) Global Status Report on Non-Communicable Diseases. Geneva.
  27. Liu R, Shi JW, Yu DH, Zhuang SQ, Dong ZB, et al. (2017) Bottleneck of chronic disease trend prediction and construction of optimization model [J]. Chinese Journal of Public Health 33: 1552-1555.
  28. Damen JA, Hooft L, Schuit E, Debray T, Collins G, et al. (2016) Prediction models for cardiovascular disease risk in the general population: systematic review[J]. BMJ 353: i2416. [crossref]
  29. AdjayeGK, Vaughan M (2019) Reframing NCDs? An analysis of current debates. Glob Health Action 12: 1-11. [crossref]

Cancer Donation: Integrating Homo emotionalis with Homo economicus

DOI: 10.31038/CST.2021632

Abstract

Data from a Mind Genomics cartography for Stand Up to Cancer, executed in 2008, were analyzed 13 years later to demonstrate the power of systematized and data based studies of communication. The Mind Genomics effort, executed in a 72-hour period, retained the value for creating a base of insights for donation behavior, as well as a searchable database for suggestions 13 years later. The value of systematic exploration was confirmed by a published report in 2010, suggesting that the 2008 study led to the most successful of the Standard Up To Cancer Simulcasts. Moving beyond the analysis of 2008, the paper demonstrates new ways to extract value from Mind Genomics data, through databasing, and through deeper, more up-to-date analyses of the study results.

Introduction

The files of corporations and individual researcher are filled with studies, many of which will never see the light of day. All too often the effort expended to answer a question is so focused that without the question and the contemporaneity of the problem to be solved, the research is simply a set of numbers, interesting when the study was run, but then quickly losing its relevance. In the words of a colleague at Tropicana (Division of Pepsi) in 1996: “I have warehouses of data, but it’s all irrelevant now, after the issue has been tackled.”

To a great extent, industrial-based research about consumers comprises the concerted effort to answer a minor question, such as ‘this idea, concept’ crate enough interest in the prospective buyer to get the customer to buy? Most of these efforts, whether dealing with products or communication, end up answering the question, but providing little additional value. The data, the report, the actual effort is all treated respectfully, with corporate guidelines issued about how to ‘close out a project,’ the appropriate paperwork to complete, and how to document what the study was about, in case someone from the corporation will need to consult the data at a later date. The process, for example, at the General Foods Corporation (Now Mondelez), was so detailed that a person had to be hired specifically to monitor the close-out process.

At the same time, however, many of the studies in industry have retained their value, far beyond the early years. Conversations with Michael Supran at the Campbell Soup Company in the 1990’s revealed that data studying the systematic variations of Prego Pasta Sauce, developed in 1982, was still being used 16 years later in 1998 to guide product development (Supran, personal communication, 1998). The same was true for other efforts as well in the food industry, up to at least 2006 (Judy Zauenbrecher, Welches’s, personal communication, 2006).

What seemed to emerge from these and other conversations was the fact that research done in a systematic manner to uncover rules about behavior often maintained value of years, even decades. What was of little value was the study so tightly focused that it yielded only a factoid rather than these rules. The realization led to the recognition that industrial, or better applied research, would do well to incorporate the effort to find rules. Indeed, in their 2007 book, Selling Blue Elephants authors [1] entitled the effort ‘Rule Development Experimentation.’ It was clear by 2007 that these studies, some twenty and thirty years old, would still yield value information to guide thinking, communication efforts, and product developments, decades later. In some respects, these rule-developing experiments were creating a sort of ‘scientific literature’ of a topic, albeit from the point of view of a corporation, and a specific application.

The reason for this introduction is to lay the groundwork for the additional information which can emerge from these studies, information that may be presented in a cursory manner to managers tasked with the job of creating the event. Yet, Mind Genomics provides an opportunity to develop a database of deeper knowledge and insight, both to create better telethons in the future, but also to understand the topic in far greater depth, an understanding which can become systemic. It is the further exploration of data, now about 13 years old, an exploration into the principles and patterns, which Mind Genomics provides as the foundation for the future.

The Stand Up To Cancer (SU2C) Project of 2008

In 2008, Stand Up To Cancer (SU2C) was just in its infancy. The vision was to fund scientists, accepting support from the ordinary citizen and business, as well as the entertainment community. The goal was to drive the solution to cancer by funding novel cancer research and promising cancer researchers [2].

The 2008 plan, the first, was to host a ‘Simulcast,’ broadcast simultaneously on the main networks. The objective was to raise awareness and to solicit donations to the charity [3]. At the time, the management of SU2C approached author Onufrey, with a request that he consider donating his time and efforts to helping SU2C discover the most impactful language. The request was made because of a family relationship of the author Onufrey with one of the key people of SU2C, and the opportunity for SU2C to avail itself of known expertise for optimizing their messages [4].

Figure 1 shows the introductory page to the report. The actual project itself was done; start to finish, in a period of 72 hours. The speed of the project was made possible by the underlying discipline and formatted output of the technology, Mind Genomics (at that time, and for that project having a different name ‘Addressable Minds’) As a consequence of the accelerated timetable, the project results were communicated in depth, and the television simulcast went on as planned. This was the positive outcome of the project, which raised the planned amount of money. At the same time, however, it was becoming increasingly clear that the project itself created a wealth of new, useful and indeed valuable information on the ‘mind of the donor.’ As happens so often, the project was filed away in summer 2008, to be resuscitated in 2021, at the time of this writing. The new objective was to extract the learning, not so much about the particular target (Stand Up To Cancer), but a base of knowledge for giving to a cancer-related cause. The disciplined experiment, the nature of the design, and the analyses provide a wealth of information about how people respond to these requests for donations.
fig 1

Figure 1: The introductory page to the project summary, showing the goals of the project, the timetable, and the tactics.

The process as described here followed the specifications of the Mind Genomics process [5-7]

The study proceeded very quickly. Author Onufrey worked with the SU2C team to create a set of 36 different messages. These messages are shown in Table 1. The rapid pace of the project (front to back in three days maximum) forced the creation of messages, followed by some polishing and then insertion into a matrix. Usually the groups comprise coherent questions and the series of such questions ‘tell a simple story.’ The virtually breakneck speed of message creation allowed for some polishing of the elements, improving the quality of the messages before the actual research. The messages required about four hours to develop, and two hours to polish. The field portion, with respondents, lasted a day and a half, and the report was finished the last night.

Table 1: The 36 elements for the study.

Group 1
A1 Because someone close to you has cancer
A2 Invest for life-changing results
A3 Every day, 1,500 people in America die from cancer
A4 Support research into ALL forms of cancer
A5 Every sixty seconds someone in America dies of cancer
A6 Your help provides support and programs for caregivers of cancer patients
Group 2
B1 Track and report progress… all who donate can see how their participation creates real change
B2 One in three women will get cancer in her lifetime
B3 Donating time, money and effort makes a difference
B4 You can make a difference
B5 Ensure the quality of life for those suffering from cancer
B6 Collecting the top experts in cancer research to work collaboratively
Group 3
C1 Volunteer!
C2 Accelerate the development of life saving cancer prevention, detection and treatment
C3 Just when science is on the verge of the breakthroughs that can end cancer, the will and the funding are disappearing from the national agenda
C4 Put together the best and the brightest minds in cancer research — those on the edge of accomplishment
C5 Every year, 2,300 children in America die of cancer
C6 We are close to scientific breakthroughs in the prevention, detection, treatment and reversal of cancer
Group 4
D1 A new movement to stop cancer once and for all
D2 There are 10.8 million cancer survivors in America
D3 Because everyone knows good health is important
D4 We can now target the genes and pathways that turn normal cells into cancerous ones
D5 Other organizations have made good progress in cancer research and programs… this program brings all the strengths together to reach the ultimate goal
D6 To provide support for finding a cure
Group 5
E1 Because… cancer is a major health issue that affects everyone
E2 Support the organization by purchasing items it sells or needs
E3 We conquered Polio and Smallpox… we CAN conquer Cancer
E4 Government funding for cancer research is declining… this fills the void
E5 We have the science, the technology, the tools… all we need is YOU
E6 One in two men will get cancer in his lifetime
Group 6
F1 Make sure that a strong interest in Fighting Cancer remains a priority
F2 Because you want to honor a loved one
F3 Push scientific breakthroughs to the finish
F4 We now understand the biology that drives cancer… we are on the brink of scientific breakthroughs
F5 Cancer is a war we can actually win
F6 Act before cancer takes another life away

The conventional research approach would have been either to test these elements one-at-a-time (so-called promise testing), or to test a limited number of combinations created by the researcher or by a marketing specialist with a ‘sensibility of what the listener needs to hear to drive donation.’ These methods are hallowed in the research community because they introduce the ‘voice of the consumer.’

The reality of most research is that no one knows which elements will perform very well. It is fairly easy to spot losing elements, especially after the promise testing study is completed. These ‘losing’ elements may be adequate in and of themselves, but they don’t do well because they may be trite, or ‘off strategy.’ After the performance of each element, or the entire concept, is published for everyone to see, the opinions will emerge as to why the elements failed, alongside new and better elements.

The messages were combined by an underlying experimental design, creating 48 unique vignettes (combinations of messages), 36 comprising four elements (two questions not contributing), and the remaining 12 comprising 3 elements (three questions not contributing). The Mind Genomics experiment was set up so that the respondent was shown a vignette and had to assign two ratings, one for Question 1 dealing with probability of donating, and the second for Question 2, dealing with the amount to be donated.
fig 2

Figure 2: Example of a 3-element vignette, and rating question #2 (amount that would be donated, based upon reading the vignette).

To the untrained eye, and in fact even to someone who knows how the vignettes were developed, the combinations seem to be combined in a way that one might call constrainedly haphazard [8] All vignettes had a limited number of elements, and each element ended up appearing an equal number of times. The vignettes were created by a specially constructed experimental design, which was rotated to create hundreds of isomorphic permutations—combinations which were identical in a mathematical sense, but whose combinations were different.

These custom created experimental designs are the workhorses of Mind Genomics. They ensure that the respondent is exposed to each element the same number of times (five) in 48 vignettes, absent the same number of times (43), and that the 36 elements are statistically independent of other. The underlying experimental design ensured that each respondent evaluated a unique combination of 48 vignettes [9], and that each set of 48 vignettes suffices to estimate the contribution of each of the 36 elements both to propensity to donate (question #1) and amount expected to donate (question #2)

  1. Probability of Donating – The first scale shows an anchored 1-9 scale, with the rating 1 anchored at ‘would not donate’ and the rating 9 anchored at ‘definitely would donate’. This is a Likert scale. It’s meaning is simple intuitively, but the scale must be anchored at both ends.
  2. Amount donated – The second scale comprises nine numbers, each number corresponding to an amount of money. This second scale is easy to use.

To make the analysis easier, we converted the first scale (probability) of donating to nine values, ranging from a probability of 0% (original rating of 1, definitely not donate) to a probability of 100% (original rating of 9, definitely will donate). The nine points were considered to be equally spaced, so that a rating of 5, for example, was considered to be a probability of 50%, a rating of 6 a probability of 62.5% etc.

The first analysis looks at the distribution of ratings. Even before we look at the linkage between the different messages and donations (probability, amount, respectively), we can ask a simpler question, namely what is the relation between the probability of donating and the amount donated?

Table 2 shows a two-way cross tabulation. The numbers in the body of the table are the percent of times that the specific pair appears in the data (specific probability of donating, and amount donated).

Table 2: Distribution of probability of donating and amount donated. The numbers in the body of the table are percentages of all the responses.
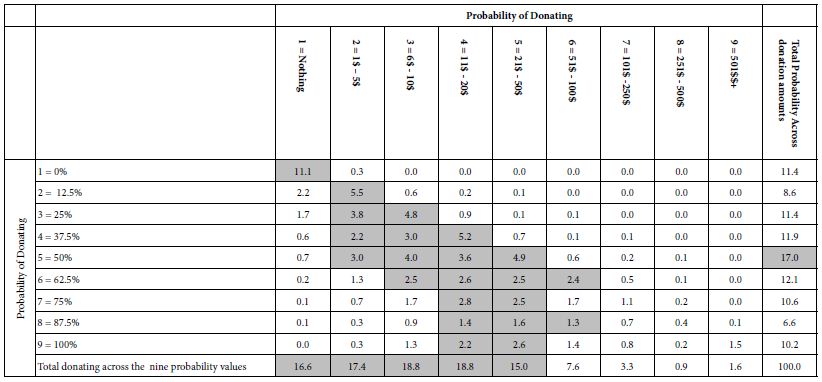
table 2

The far-right column in Table 2, labelled Total Probability, shows the distribution or probabilities of donating. Thus, 11.4% of the responses are ‘not donate,’ whether due to the respondents or to the messages. The source of the probability value is not clear. The most frequent response is ‘5’ (50% probability of donating), but that is only 17% of the responses. We can see that the percents not donating or donating (ratings 1-4) sum to 43% and the percents probably or definitely donating (ratings 6-9) total a bit over 40%,

The bottom row in Table 2, labelled Total Donating suggests, in contrast, that most donations are either 0 or less than 50$.

Is There a Discernible Relation between the Likelihood of Donating and Amount Donated?

Table 2 suggests that the relation between probability of donation and amount of donation exists, albeit in very rough and noisy form. Not surprisingly, there are more darkened cells towards the left side of the table, where the amount donated is lower, but there is not a correspondingly clearly shaded area when it comes to probability of donating.

We can create a less noisy data set by estimating the average donations and probability of donations for each of the 354 respondents. Figure 3 shows a plot of the averages, and suggests that with increasingly average likelihood of donating, there is a slight increase in the amount to be donated. The relation is noisy, however. It is clear, however, that when, on average the respondent is not interested in donating (low value of the abscissa), the respondent does not choose moderate to high amount of money to ‘not donate.’ This congruence of low donation probability and low/no donation amount, provides one indication of validity, in this case face validity. The pattern seems intuitively understandable.
fig 3

Figure 3: Relation between average rating of likely to donate and average amount to be donated. Each point is an average from 48 observations. There are 354 averages, one for each respondent.

Do Respondents Change Their Ratings as They Continue Rating Vignettes?

In the research community, and especially among applied research in a business setting, there is the ongoing dispute about the change in the criteria of judgment a respondent uses when judging a concept (vignette) or a product several times. Of course the concept or the product should be changed, but one can measure the effect of putting the concept or the product in the first position, the middle positions, or the last position. There is no end to the disputes about biases proposed by the purists who feel that every applied test of this type should be evaluated purely by itself, so-called pure monadic. There are others who feel that only with repeated experience does the respondent become able to validly rate the product. If the researcher relies only on the pure monadic, there is a great deal of extraneous variability, due to the proclivities and biases of the individual respondents.

The Mind Genomics approach attracts interest because the typical respondent evaluates as many as 24-48 vignettes, in short period of time, and without much consideration. The point of view espoused by a number of researcher is one of questioning the consistency of the data with repeated evaluations [10-14].

One of the analyses presented here looks at the change of the rating assigned by a respondent as the evaluations proceed from the first to the 48th. Independent of the specific elements in a vignette, can we demonstrate a systematic bias, viz. that the average rating of the probability of donating will increase with repeated rating, or the amount given will increase with repeat rating?

Figure 4 shows an order ‘effect, both in terms of probability (likelihood) of donating (left panel), and amount of money to be donated (right panel). The two plots were created simply by averaging the rated likelihood to donate by ‘test order,’ and amount to be donated, also by ‘test order.’ For both likelihood and probability to donate, and for amount to donate, we see the upward pattern, suggesting that as the evaluations move on, respondents feel more generous. Respondents may not realize that they are being more generous, and the degree of generosity is not marked, but there is a noticeable increase.
fig 4

Figure 4: Average probability of donating (question #1) and average amount to be donated (question #2) versus the test order. Later vignettes are uprated on both ratings.

The foregoing analysis shown in Figure 3 suggests that on average, individuals become increasingly generous in terms of both likelihood and probability of donating, and amount to be donated. Does this pattern hold for the average individual? The slopes of the curves in Figure 3 provide us the answer. What does this slope look like on an individual basis? The answer appears in Figure 4. Each point corresponds to a respondent. The slopes were computed separately for the data of each respondent. Figure 5 shows the two slopes on a scatterplot. Slopes near zero mean no change. High positive slopes mean a strong positive increase in the rating with repeated evaluation. Negative slopes mean a decrease in the rating with repeated evaluation.

We conclude from Figure 4 that repeating the evaluation 48 times with new combinations ends up increasing the stated likelihood to donate, and the amount to be donated. The strength of the effect (slope) varies by respondent to respondent. There is only one respondent who strongly decreases the amount donated and the probability of donation, as the respondent progresses. Most respondents fall into the right half, and the top half, suggesting either a modest increase in probability of donating (to the right on the abscissa), or a modest increase in the amount to be donated (upwards on the ordinate). There is no clear pattern, however. As the person moves through the 48 vignettes, evaluating each, the person might increase the rated probability of donating, increase the rated amount to be donated, increase both, or increase neither.

Relating the Elements to the Ratings

Most research works with numbers to identify patterns. The preliminary, viz., surface analysis of the data, shown in Table 2 and Figures 3-5 tell us a lot about the respondent, in terms of likelihood to donate, response to repeated messages, etc. Yet, the deepest information is yet to be obtained, information which can only emerge when the stimuli are ‘cognitively rich.’
fig 5

Figure 5: Distribution of changes in likelihood of donating (abscissa) and amount to be donated (ordinate), as shown by the slopes (versus test order). Numbers above 0 mean an increase in the likelihood or donating or the amount to be donated. Each point corresponds to one of the respondents.

Table 1 shows the 36 elements, with the underlying experimental design combining these elements into vignettes which communicate information about the efforts of SU2C. Table 2 shows us that respondents differentiate among these different vignettes. Beyond the effects of order, the underlying experimental design allows us to uncover the linkage between the specific element and the rating, either of probability to donate or amount to be donated.

The tool to be used is OLS (ordinary least-squares) regression analysis. OLS works regression with the underlying experimental design, deconstructing the rating assigned to the combination into the part-worth contributions of the elements. The experimental design was applied separately create the set of 48 vignettes for each respondent, allowing OLS regression to estimate, at either the level of the respondent or the level of the group, the part-worth contribution of each element.

We express the relation between the dependent variable and the independent variable by the simple equation: Dependent Variable = k0 +k1(A1) + k2(A2) … k36(F6)

The foregoing equation is easy to interpret. The equation for the dependent variables begins with an additive constant, k0, which is the estimated value of the dependent variable when there are no elements in the vignettes. This situation is purely hypothetical because the underlying experiment ensured that EACH vignette created would have a precise set of either three elements or four elements, respectively. The additive constant, k0, can thus be considered to be a baseline, the estimated value of the dependent variable without any other information.

  1. Probability of donating – the baseline likelihood to donate to SU2C in the absence of any elements.
  2. Estimated amount donate – the baseline amount that would be donated to SU2C, in the absence of any elements.
  3. Expected value – the ‘adjusted’ amount that would be donated, defined as the amount to be donated, multiplied by the probability of the donation, again in the absence of any elements.

The OLS regression requires preparation of the data so that all of the data are in the proper format. The 36 independent variables, on for each elements, are coded as ‘1’ when the element is present in the vignette, and coded ‘0’ when the element is absent from the vignette. For statistical validity, the OLS regression approach requires more observations (viz., vignettes) than there are independent variables. Each respondent was presented with 36 independent variables, viz. our 36 elements, taking on the value 0 (absent) or 1 (present), and contributed 48 such cases or observations to the data set. Even at the level of the individual respondent, therefore, the OLS regression will run, delivering the coefficients.

As a side note, the study used three dependent variables. Each value was ‘adjusted’ by the additional of a very small random number (<10-5), ensuring that there would be some slight variation in the dependent variable, and thus prevent a crash if the respondent assigned the same rating to each of the 48 vignette. This done not happen very often, but it is always better to add a bit of random variation to the dependent variable and prevent crashes.

We now move to the actual data itself, with the equations estimated using the data from the entire panel. Despite the apparent blooming buzzing confusion, a phrase that one might use to describe the person’s reaction to the vignettes, the results emerge quite clearly, or if not clearly, at least tell a story.

Table 3 shows two sets of three models—parameters for the equations. The first set is computed using all 36 elements, and estimating the additive constant, and the value of the individual coefficients. We can liken this first set of equations (columns A, B, and C) to a statue comprising two parts, a base, and then the statue part. The additive constant is the base, and the 36 elements are the parts of the statue. The height of the statue is estimated by adding together the magnitude of the additive constant and the coefficients of the particular, limited number of elements to be incorporated into a new vignette.

Table 3: The part-worth contribution of each of the elements to donations. The table shows the contributions when the model is estimated with an additive constant (baseline), and when the model is estimated without an additive constant (no baseline).


Additive Constant

No Additive Constant
    A B C D E

F


Probability Donate

Amount Donated Expected Value Probability Donate Amount Donated

Expected Value

 Additive constant (all elements absent)

41

$23 $17 NA NA

NA

B2 One in three women will get cancer in her lifetime

3

$6 $6 14 $12

$10

A3 Every day, 1,500 people in America die from cancer

5

$7 $5 16 $13

$10

B4 You can make a difference

4

$6 $5 15 $12

$10

B5 Ensure the quality of life for those suffering from cancer

4

$6 $5 15 $12

$9

A6 Your help provides support and programs for caregivers of cancer patients

5

$5 $4 17 $11

$8

B3 Donating time, money and effort makes a difference

3

$4 $4 14 $10

$8

D5 Other organizations have made good progress in cancer research and programs… this program brings all the strengths together to reach the ultimate goal

2

$4 $4 13 $10

$8

A1 Because someone close to you has cancer

3

$4 $3 14 $10

$7

A5 Every sixty seconds someone in America dies of cancer

3

$4 $3 14 $10

$8

B6 Collecting the top experts in cancer research to work collaboratively

3

$4 $3 14 $10

$8

C1 Volunteer!

2

$3 $3 13 $9

$7

C2 Accelerate the development of life saving cancer prevention, detection and treatment

3

$3 $3 13 $9

$7

C3 Just when science is on the verge of the breakthroughs that can end cancer, the will and the funding are disappearing from the national agenda

3

$3 $3 14 $9

$7

D3 Because everyone knows good health is important

2

$4 $3 13 $10

$8

F2 Because you want to honor a loved one

3

$3 $3 14 $10

$7

A2 Invest for life-changing results

4

$3 $2 15 $9

$7

B1 Track and report progress… all who donate can see how their participation creates real change

1

$2 $2 12 $8

$6

C4 Put together the best and the brightest minds in cancer research — those on the edge of accomplishment

2

$2 $2 13 $8

$6

C5 Every year, 2,300 children in America die of cancer

2

$2 $2 13 $8

$6

C6 We are close to scientific breakthroughs in the prevention, detection, treatment and reversal of cancer

1

$2 $2 12 $8

$6

D1 A new movement to stop cancer once and for all

2

$2 $2 12 $8

$6

D2 There are 10.8 million cancer survivors in America

2

$2 $2 12 $8

$7

D4 We can now target the genes and pathways that turn normal cells into cancerous ones

1

$3 $2 12 $9

$7

E1 Because… cancer is a major health issue that affects everyone

1

$3 $2 12 $8

$6

E6 One in two men will get cancer in his lifetime

2

$2 $2 12 $8

$6

F1 Make sure that a strong interest in Fighting Cancer remains a priority

1

$2 $2 12 $8

$6

A4 Support research into ALL forms of cancer

2

$2 $1 13 $8

$6

D6 To provide support for finding a cure

2

$1 $1 13 $8

$5

E2 Support the organization by purchasing items it sells or needs

1

$0 $1 11 $6

$5

E4 Government funding for cancer research is declining… this fills the void

1

$2 $1 11 $8

$6

E5 We have the science, the technology, the tools… all we need is YOU

1

$2 $1 11 $7

$6

F3 Push scientific breakthroughs to the finish

2

$2 $1 14 $8

$6

F4 We now understand the biology that drives cancer… we are on the brink of scientific breakthroughs

-1

$1 $1 10 $7

$5

F6 Act before cancer takes another life away

0

$1 $1 11 $7

$5

E3 We conquered Polio and Smallpox… we CAN conquer Cancer

0

$1 $0 10 $7

$5

F5 Cancer is a war we can actually win

-1

-$2 -$1 10 $5

$3

In contrast to the estimates of the coefficients in a model with an additive constant, we can choose to leave out the additive constant. Columns D, E, and F show the corresponding (and much larger) coefficients. Figure 6 shows, however, that there is little loss of relative information. The corresponding pairs of coefficients (viz., A & D, for probability of donating) are very highly related to each other, as are the other two corresponding pairs. Figure 6 shows the strong correlation.
fig 6

Figure 6: Scatterplots for each of the three dependent variables, showing the strong correlation between the 36 coefficients estimated with an additive constant (abscissa), and the 36 coefficients estimated but without an additive constant (ordinate).

Equations with the additive constant are estimated for those cases when there is a sense of a baseline ‘feeling,’ in the absence of elements. The judgments made based on the coefficients will be the same, because they line up so strongly in the same way.

Table 4 makes it easy for managers to understand what is working. We need only sort the table to find those elements which generate high probabilities of donating, and/or high amounts of donated money, and/or high expected value.

Table 4 shows us that the additive constant for probability of donating is a base of 41%. The two elements which drive donation most strongly, here operationally defined as an addition 5%, are A3 and A6. In turn the additive constant for amount to be donated ins 23$ in the absence of elements. One can get an addition 6-7 dollars, however by the correct choice of elements. Finally, when we look at the expected value, combining probability and amount, we end up with an additive constant of 17$. Looking across Table 4, the manager of the campaign would be advised to choose combination of A3 and B2.

Table 4: Strong performing elements for the three dependent variables, and the recommended combination.
table 4

The Allure of Mind-Sets

A continuing theme in Mind Genomics is the discovery of underlying groups of respondents, distinguished not so much by WHO they are, but by how they think. Marketers call these psychographic segments. The segments are typically created on the basis of variables such as age, gender, geography. These geo-demographic variables are relative blunt measures, because people who resemble each other in their geo-demographics often think in radically different ways. One need only visit a neighborhood food store to see the array of different flavors of the same food, sold to people of similar geo-demographic profiles.

A better way is to discover how people think about a topic. There are various approaches for identifying groups of people, who are demonstrated to think differently on a set of related topics such as lifestyle. The problem with these methods of dividing the population is that the methods come from the top down, showing differences in the way people think about large topics. How does one translate membership in a big lifestyle segment to the exact words one needs to use for a targeted campaign, with limited focus, and even more limited budget?

Mind Genomics works from the bottom-up, creating mind-sets or groups of people, based exclusively on the patterns of their reactions to the important stimuli, namely the messages. The key benefit provided by Mind Genomics is the ability to create an equation or model for each respondent, based upon the responses to the 48 vignettes. One can then cluster the 354 respondents based upon the pattern of the coefficients. The actual clustering method is left to the researcher.

Mind Genomics follows a simple process to discover mind-sets.

    1. Run three parallel analyses, one for each dependent variable; probability of donating, amount donated, expected value. The clustering analysis was thus done three times, once for each dependent variable.
    2. Choose the dependent variable (e.g., Probability of Donating). For the chosen dependent variable create the 354 individual level models, using OLS regression. For this specific study on messaging, the models were estimated without an additive constant. As Figure 6 shows, the same pattern of coefficients appears whether the researcher incorporates or does not incorporate the additive constant.
    3. Cluster the 354 respondents based upon the respondents’ patterns of coefficients, created using k-means clustering (Likas et. al., 2003). Individuals with similar patterns of 36 coefficients were put into the same cluster. The cluster will become the ‘mind-set’.
    4. Extract three clusters of mind-sets and assign each of the 354 respondent to the appropriate mind-set.
    5. Note that when we do the foregoing exercise three times, once for each dependent variable, the composition of the three mind-sets will change. That is, the composition of the three mind-sets or clusters, differs by the dependent variable.
    6. The foregoing steps have now created three new groupings for every dependent variable. These groups are the mind-sets. For every dependent variable, every one of the 354 respondents is assigned to exactly one of the three mind-sets.

Now, consider one dependent variable, e.g., probability of donating. Each respondent fits into only one of the three mind-sets. We analyze the data on a mind-set basis.

  1. Compute the average rating (or expected value) for each mind-set across all the respondents in the mind-set and all the 48 vignettes for each respondent. This average gives a sense of how the mine-set feels about the topic.
  2. Once again, run the equation for the dependent variable selected (viz., Probability of Donating, dependent variable 1). This time, estimate the equation using the additive model. Run the OLS regression analysis three times, once incorporating all the data from the respondents assigned to the mind-set for that dependent variable.
  3. Lay out the result and select only the strong-performing elements for each mind-set. The definition of ‘strong performing’ is a coefficient above a certain cutoff. The cutoff is operationally specified by the researcher.
  4. If an element fails to perform strongly for all three mind-sets, then eliminate the element. This action will eliminate most of the elements, allowing only the most promising elements. These are elements which do well for at least one mind-set. Tables 5shows the strong performing elements for each of the three mind-sets for a dependent variable.
  5. For purposes of selecting the correct messages for the proposed SU2C, Table 5 presents the relevant information from which to craft messages.
  6. For systematized understanding and data-basing in a ‘wiki of the mind,’ the original motivation for this reanalysis of the data 13 years later, Table 5 present the necessary information to better understand the mind of the donor, and to create a Mind Genomics of donation.

Table 5: Summary results for three mind-sets emerging for each dependent variable, and the strong performing elements for each mind-set. The recommended messages to use are shown in shaded cells.
table 5(1)

table 5(2)

table 5(3)

Discussion and Conclusions

At the time of writing Selling Blue Elephants (2006 for the 2007 publication deadline), the realization emerged that one could do studies for companies and other groups, studies which would answer the question, but studies which would have great residual value. It was in this spirit that many studies were run, studies which created these so-called rules. The question then was asked: Can these studies be reopened a significant time later, when the issue had been long answered, and in turn, can these studies ‘teach.’ If so, the opportunity was emerging to create studies whose value would be immediate AND long term. It is to that issue that we addressed this paper, with a case history about what was done, and what was learned 13 years later of a general nature.

By their very nature, Mind Genomics study provides valuable information years, even decades after they have been executed. The reason for the retained value is two-fold. First, the raw material, the elements, is cognitively rich. A database of the type shown in Tables 4 and 5 but comprising all 36 elements rather than just ‘strong performers’, becomes a valuable. The database can be searched, and new facts and insights can be discovered. One can imagine a world where there are millions or even hundreds of millions of these databases created each year, and available for search to broaden our understanding. The result is a Wikipedia of the Mind, produced at the level of local issues, at the level of granularity.

There is a second use, as well. That is as a database from which one can extract meta-patterns, such as average ratings of subgroups, or change in response patterns over time. This second use pales, of course, when compared to the first application above, the Wikipedia of the Mind at the level of granular, everyday experience. Yet, when we emerge from the euphoria of what could be, we realize that it is this less-exciting second use which corresponds to today’s archival sciences. Information, but without the systematized, cognitive richness so readily available from Mind Genomics.

The final question is very simple. Was the study effective? Here is a direct quote from 2010. Although one might not attribute the massive success of SU2C, the fact that those running the simulcast in 2008 knew ‘what to say’ should be taken into account as a factor in the success of SU2C, in its effort to change the perception of cancer, and to highlight the efforts being made to treat it, control it, and cure it.

Stand Up to Cancer

LOS ANGELES—A look at some of the statistics culled from the Stand Up to Cancer (SU2C) Sept. 10 broadcast may seem to indicate that the fundraising and cancer awareness effort fell somewhat short of its original milestones two years before: The 2010 show announced that $80 million had been pledged, whereas in 2008 the number was approximately $100 million. ….

The first show was seen on only ABC, CBS, and NBC, which for this year’s show were joined by many more collaborative network and cable partners including Fox, Bio, Current TV, Discovery Health, E!, G4, HBO, HBO Latino, MLB Network, mun2, Showtime, Smithsonian Channel, the Style Network, TV One, and VH1…..(Source… [11]).

References

  1. Moskowitz HR, Gofman A (2007) Selling Blue Elephants: How to Make Great Products That People Want Before They Even Know They Want Them. Pearson Education.
  2. Christen SP, Levine AJ (2019) Facilitating cross-disciplinary interactions to stimulate innovation: Stand Up To Cancer’s matchmaking convergence ideas lab. In Strategies for Team Science Success. Springer.
  3. Charlesworth D (2016) Stand Up to Cancer 2012 and 2014: The medical telethon as UK public service broadcasting in a neo-liberal age. Critical Studies in Television 11: 217-229.
  4. Gabay G, Moskowitz H, Gere A (2019) Understanding the donating mind and optimizing messaging – public hospitals. In: 12th Annual Conference of the EuroMed Academy of Business.
  5. Gere A, Radvanyi D, Moskowitz H (2017) The Mind Genomics metaphor – from measuring the every-day to sequencing the mind. International Journal of Genomic Mining.
  6. Mehta-Shah N, Mehta S, Zemel R (2021) Mind Genomics (BimiLeap) to create new ideas. In Consumer-based New Product Development for the Food Industry. Royal Society of Chemistry 119-131.
  7. Moskowitz HR, Gofman A, Beckley J, Ashman H (2006) Founding a new science: Mind Genomics. Journal of Sensory Studies 21: 266-307.
  8. Ryan TP, Morgan JP (2007) Modern experimental design. Journal of Statistical Theory and Practice 1: 501-506.
  9. Gofman A, Moskowitz H (2010) Isomorphic permuted experimental designs and their application in conjoint analysis. Journal of sensory studies 25: 127-145.
  10. Schwarz N, Hippler HJ, Noelle-Neumann E (1992) A cognitive model of response-order effects in survey measurement.” In Context Effects in Social and Psychological Research. Springer 187-201.
  11. Rosenthal ET (2010) Stand Up to Cancer 2010: Qualitative Success Transcends Quantitative Numbers Oncology Times 32: 20-23.
  12. Fortunato J (2013) Sponsorship activation and social responsibility: How MasterCard and major league baseball partner to stand up to cancer. Journal of Brand Strategy 2: 300-311.
  13. Likas A, Vlassis N, Verbeek J (2003) The global k-means clustering algorithm. Pattern Recognition, Elsevier 36: 451-461.
  14. Milutinovic V, Salom J (2016) Mind Genomics: A Guide to Data-Driven Marketing Strategy. Springer.
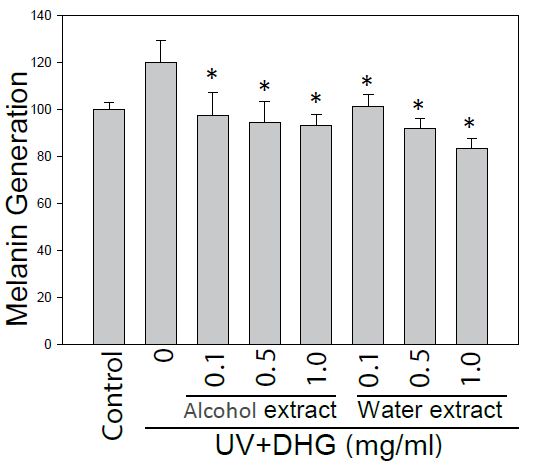
Psychological Problems of COVID-19 Sufferers

DOI: 10.31038/PSYJ.2021332

Abstract

COVID-19 has increased all over the world. It has brought a significant change around the world. Although the COVID-19 infected patients are mainly suffering from infection but there are other areas to concern about. The burden of mental health problems of pre and post-COVID-19 has become a major concern to address. Lockdown, quarantine, social distancing have already raised questions regarding mental health problems. This review demonstrates the psychological impacts of all of these on a healthy individual.

Keywords

COVID-19, Healthcare management, Psychological problems

Introduction

The continuous increasing rate of COVID-19 around the world has isolated the people from their normal life. There is still no hope of changing the situation immediately. Various safety initiatives are taken by the government of several countries. These include the lockdown, quarantine of people, maintaining social distances, wearing masks, etc. These are actually found effective to prevent the spread of viruses. But these initiatives have also raised questions regarding the mental health. The psychological impacts of these initiatives on healthy individuals are found very much negative. This is exactly how COVID-19 has caused a public health danger and it has become a global health challenge. Now the mental health problems of people tend to be higher than the death of COVID-19 infected people. We have seen it in the past also. Whenever, a infectious disease becomes epidemic or pandemic, it gives rise various psychological diseases, mental stress, fear, illness, anxiety, boredom [1,2]. We have seen how people’s mental health was hampered during the period of Middle East respiratory syndrome (MERS) and severe acute respiratory syndrome (SARS). This review will provide necessary information on how the COVID-19 pandemic is causing a public health crisis inducing mental health problem [3].

The people who are getting infected by SARS-COV-2 are the biggest sufferers of COVID-19. The COVID-19 infected patient are not only undergoing physical damage in the body but also facing several mental problems in the post COVID-19 period. But this is actually not the end of the suffering scenario. The suffering is divided into pre and post-COVID-19 mental sufferings. This mental trauma is not only limited to the people infected by SARS-COV-2, it includes the healthcare professionals also. The people who are not yet infected by SARS-COV-2, also undergoing through a mental trauma. Staying in the house day after day during lockdown, making social distancing everywhere, using mask everywhere have distracted them from their normal life. Besides they are always in the fear of getting infected by SARS-COV-2 anytime. This is actually letting them down mentally. Because the fear largely accelerates the level of anxiety and stress that leads to the intensification of the symptoms of those with pre-existing psychiatric disorders [4-6]. The older people aged above 60 are in the highest risk position because of their more physically weak condition than any other age group [7]. They are undergoing through depression, anxiety, stress, emotional exhaustion very frequently. China recently conducted a study on the psychological/mental problems of COVID-19. The report stated that 53.8% of the participants among the general public were severely or moderately psychologically affected having depression, anxiety and stress [8]. The quarantine period is a very difficult period for the people to stay alone although it is effective to prevent the spread of viruses. But loneliness often takes place during this period. So the quarantine period has some bad psychological impacts on individuals which are confirmed by Lancet in a report. According to Lancet, long quarantine often induces post-traumatic stress symptoms, confusion, and anger. Stressors included longer quarantine duration, infection fears, frustration, boredom, inadequate supplies, inadequate information, financial loss, and stigma. This review was done using three electronic databases. Of 3166 papers found, 24 are included in this review [9]. The social distancing or social isolation is one of the hardest things to do for the people although it is effective to prevent the spread of virus. It often triggers loneliness that induces mental health problems due to arise of anxiety, depression, stress, fear, etc. [10]. Depression, anxiety, loneliness often induces the commitment of suicides [11,12]. Anxiety, insomnia, anger, boredom, loneliness of people are the results of the recent COVID-19 pandemic according to report of several studies [13]. A study, published in The Lancet Psychiatry journal, stated that one in 5 COVID-19 patients suffer from mental illness within 90 days after testing for COVID-19. This mental illness most likely includes anxiety, depression and insomnia. It also reported that having a pre-existing mental illness causes 65% more chance to be infected with COVID-19 than those without [14]. The healthcare professionals are not out of this COVID-19 induced mental problems. They are under tremendous mental pressure as the rate of COVID-19 patients is increasing day by day. They are unable to meet their family and friends for a long time. Several studies reported about the mental problems they are dealing with at the moment. The appearance psychiatric symptoms among the healthcare professionals are now clear according to the reports of some studies. A report in the Journal of Psychiatric Research stated that the healthcare professionals are in extreme working pressure that induces psychological distress. Anxiety, irritability, insomnia, fear and anguish are among them. The systemic review was made based on the PRISMA protocol [15]. Again, several studies confirmed the fact that the healthcare professionals are suffering from high rates of stress, anxiety as well as mental disorders [16,17].

Conclusion

The world is undergoing through a tough situation due to COVID-19 pandemic. Both physical and mental health of people are getting equally affected due to COVID-19. But the mental health issues are less focused. The COVID-19 pandemic has created this mental health challenge. This review Suggests the identification of the factors associated with COVID-19 induced mental health problems and making of specific and necessary guidelines to overcome this challenge.

References

  1. Reardon S (2015) Ebola’s mental-health wounds linger in Africa: Health-care workers struggle to help people who have been traumatized by the epidemic. Nature 519: 13-15. [crossref]
  2. Shin J, Park HY, Kim JL, Lee JJ, Lee H, et al. (2019) Psychiatric Morbidity of Survivors One Year after the Outbreak of Middle East Respiratory Syndrome in J Korean Neuropsychiatr Assoc 58: 245-251.
  3. Lee AM, Wong JG, McAlonan GM, Cheung V, Cheung C et al. (2007) Stress and Psychological Distress among SARS Survivors 1 Year after the Can J Psychiatry, 52: 233-240. [crossref]
  4. Garcia R (2017) Neurobiology of fear and specific phobias. Learn Mem 24: 462-471. [crossref]
  5. Shin LM, Liberzon I (2010) The neurocircuitry of fear, stress, and anxiety disorders. Neuropsychopharmacology 35: 169-191. [crossref]
  6. Shigemura J, Ursano RJ, Morganstein JC, Kurosawa M, Benedek DM (2020) Public responses to the novel 2019 coronavirus (2019-nCoV) in Japan: mental health consequences and target populations. Psychiatry Clin Neurosci 74: 281-282. [crossref]
  7. Kim, J (2020) Clinical Feature of Coronavirus Disease 2019 in Elderly. Korean J Clin Geri 21: 1-8.
  8. Wang C, Pan R, Wan X, Tan Y, Xu L (2020) Immediate Psychological Responses and Associated Factors during the Initial Stage of the 2019 Coronavirus Disease (COVID-19) Epidemic among the General Population in China. Int J Environ Res Public Health, 17.
  9. Brooks SK, Webster RK, Smith LE, Woodland L, Wessely S, et al. (2020) The psychological impact of quarantine and how to reduce it: rapid review of the evidence. Lancet. 395: 912-920. [crossref]
  10. Gerst-Emerson K, Jayawardhana J (2015) Loneliness as a Public Health Issue: The Impact of Loneliness on Health Care Utilization Among Older Adults. Am J Public Health 105: 1013-1019. [crossref]
  11. Xiang YT, Yang Y, Li W, Zhang L, Zhang Q, Cheung T et al. (2020) Timely mental health care for the 2019 novel coronavirus outbreak is urgently needed. Lancet Psychiatry 7: 228-229. [crossref]
  12. Maunder R, Hunter J, Vincent L, Bennett J, Peladeau N, Leszcz M et al. (2003) The immediate psychological and occupational impact of the 2003 SARS outbreak in a teaching hospital. CMAJ 168: 1245-1251. [crossref]
  13. Shigemura J, Ursano RJ, Morganstein JC, Kurosawa M, Benedek DM (2020) Public responses to the novel 2019 coronavirus (2019-nCoV) in Japan: mental health consequences and target populations. Psychiatry Clin Neurosci 74: 281-282. [crossref]
  14. One in 5 COVID-19 patients develop mental illness within 90 days – study. Reuters. 10 November 2020.
  15. Flaviane CristineTroglio da Silva, Caio ParenteBarbosa (2021) THE IMPACT OF THE COVID-19 PANDEMIC IN AN INTENSIVE CARE UNIT (ICU): PSYCHIATRIC SYMPTOMS IN HEALTHCARE PROFESSIONALS – A SYSTEMATIC REVIEW. Journal of Psychiatric Research. March 25.
  16. Huang JZ, Han MF, Luo TD, Ren AK, Zhou XP (2020) [Mental health survey of 230 medical staff in a tertiary infectious disease hospital for COVID-19]. Zhonghua Lao Dong Wei Sheng Zhi Ye Bing Za Zhi 38: 192-195. [crossref]
  17. Kang L, Li Y, Hu S, Chen M, Yang C, et al. (2020) The mental health of medical workers in Wuhan, China dealing with the 2019 novel coronavirus. Lancet Psychiatry [crossref]

Huge Retroperitoneal Mass: Ginecologic-Type Leiomyoma

DOI: 10.31038/CST.2021631

Abstract

Uterine leiomyomas are the most common gynecological tumors in women of reproductive age. However, there are cases of atypical localization, which could represent a diagnosis and treatment challenge. We describe the case of a 54-year-old female patient, with the finding of a large intra-abdominal mass, compatible with gynecological-type leiomyoma, located at the upper retroperitoneum, successfully diagnosed and treated with laparoscopic surgery.

Keywords

Retroperitoneal tumors, Ginecologic-type leiomyoma, Surgery, Laparoscopic surgery

Introduction

Uterine leiomyomas (also called myomata or fibroids) are the most common pelvic neoplasms in women [1,2]. They arise from the smooth muscle cells of the myometrium and extrauterine locations are extremely rare. Although they are histologically benign, in the presence of an atypical presentation, they could mimic malignant tumors at imaging and may become a diagnostic and treatment challenge that will require a multidisciplinary approach [3,4].

The case of a 54-year-old female patient, diagnosed with a large intra-abdominal mass, compatible with gynecological-type leiomyoma, located at the upper retroperitoneum, is presented.

Case Presentation

A 54-year-old female patient, with a history of hysterectomy for uterine fibroids, was diagnosed with an asymptomatic giant retroperitoneal mass, detected by ultrasound, as part of medical follow-up. In order to better assess this finding, a Magnetic Resonance Image (MRI) was carried out showing a left retroperitoneal lesion of 142 x 88 x 86 mm, of probable mesenchymal origin, causing displacement of the splenic vein, tail of the pancreas, kidney and spleen, with no clear dependence on any organ (Figure 1A and 1B).

fig 1

Figure 1: MRI (A: Axial and B: coronal views) showing an heterogeneous retroperitoneal mass of 142 x 88 x 86 mm.

The case was discussed on a multidisciplinary committee and based on the size and unknown origin of the lesion, she was considered a candidate for resection. The patient was placed in a lateral decubitus position and a laparoscopic approach was performed. Retroperitoneum was accessed by previously dissecting the sigmoid colon in a lateral to medial fashion. After identification of the mass, a complete resection was performed emphasising not to open the tumor´s capsule (Figure 2). The postoperative course was uneventful and the patient was discharged on the third postoperative day. Pathological analysis of the resected specimen revealed a nodular lesion constituted by a proliferation of elongated, fusiform cells of typical  muscle appearance without marked mitotic activity (<1 mitosis in 50 HPF) (Figure 3A). Hormonal receptors (Estrogen and Progesterone) showed intense and diffuse positivity (Figure 3B). These findings are consistent with gynecologic type retroperitoneal leiomyoma.

fig 2

Figure 2: Laparoscopic image showing retroperitoneal mass (black arrow), sigmoid colon (yellow asterisk), left kidney (green asterisk) (A, B and C). After complete dissection, the extraction was performed in a protective bag through a pfannenstiel incision (D).

fig 3

Figure 3: A: Gynecologic-type leiomyoma of retroperitoneum. Hematoxylin-Eosin (H-E) staining sections show intersecting fascicles of slender tapered smooth muscle cells arranged in a whorled pattern separated by well vascularized connective tissue. B: Gynecologic-type leiomyoma of retroperitoneum. Estrogen receptor protein (ER) nuclear staining shows irregular packets and fascicles of spindle cells.

Discussion

Leiomyomas represent the most common gynecologic and uterine neoplasms, diagnosed in up to 70% of women during their lifetime [5]. They originate primarily from smooth muscle cell proliferation in the myometrium and extrauterine locations are extremely rare [6]. Although they are histologically benign, extrauterine leiomyomas may mimic malignant tumors at imaging and may become a diagnostic challenge [6,7].

Analyzing the differential diagnoses to be taken into account when facing a retroperitoneal mass, a wide range of tumors can be found, both benign and malignant. Generally, they are divided into solid or cystic, based on the different imaging modalities [8]. In turn, each subgroup is subdivided into neoplastic and non-neoplastic [9,10]. The real incidence of each of these pathologies is unknown [11]. However, it has been shown that 80% of primary retroperitoneal neoplasms are malignant [12]; in fact the retroperitoneal space is the second most frequent location, followed by the lower extremities, where malignant mesenchymal tumors arise. Approximately, one third of retroperitoneal tumors are sarcomas [13]. The most frequent sarcomas are liposarcoma, malignant fibrous histiocytoma, and leiomyosarcoma [14,15]. Given that treatment options vary, it is useful to be able to noninvasively distinguish these masses, this is why preoperative imaging including MRI must be performed [16]. Nevertheless, is a fact, that most of the times it will not be possible to define the tumor`s nature [17]. Due to the lack of diagnostic accuracy, using currently available radiologic modalities, prompt surgical intervention will usually be indicated; more if we take into account that these tumors are usually asymptomatic and they may become huge masses before diagnose.

A laparoscopic approach is technically feasible and safe, and should be considered for this cases, given the well described advantages of this approach such as less postoperative pain, rapid recovery, and better cosmetic results [10,18]. However, the size and location could potentially be factors to hinder laparoscopic feasibility. If adequate safety margins cannot be ensured, and risk of opening the tumor´s capsule is present, an open procedure should be performed [19].

Conclusion

The relevance of the present case lies in the unusual presentation of a gynecologic type leiomioma as a retroperitoneal mass. As mentioned before, it must be taken into account in the differential diagnosis of retroperitoneal masses, especially when the patient has a history of leiomyoma.

Acknowledgments

The authors would like to thank the pathology department of the Hospital Italiano de Buenos Aires, for their services.

Conflicts of Interest

The authors declare not having any conflicts of interest.

Ethical Disclosures

Protection of Human and Animal Subjects

The authors declare that no experiments were performed on humans or animals for this study.

Confidentiality of Data

The authors declare that they have followed the protocols of their work center on the publication of patient data.

Right to Privacy and Informed Consent

The authors have obtained the written informed consent of the patients or subjects mentioned in the article. The corresponding author is in possession of this document.

References

  1. Stewart EA, Cookson CL, Gandolfo RA, Schulze-Rath R (2017) Epidemiology of uterine fibroids: a systematic review. BJOG: An International Journal of Obstetrics & Gynaecology 124: 1501-1512. [crossref]
  2. Victory R, Romano W, Bennett J, Diamond MP (2015) Uterine leiomyomas: epidemiology, diagnosis, and management. Clinical Gynecology 223-252.
  3. Fasih N, Shanbhogue AKP, Macdonald DB, Fraser-Hill MA, Papadatos D, et al. (2008) Leiomyomas beyond the uterus: Unusual locations, rare manifestations. Radiographics 28: 1931-1948. [crossref]
  4. Poliquin V, Victory R, Vilos GA (2008) Epidemiology, Presentation, and Management of Retroperitoneal Leiomyomata: Systematic Literature Review and Case Report. Journal of Minimally Invasive Gynecology 15: 152-160. [crossref]
  5. Giuliani E, As-Sanie S, Marsh EE (2020) Epidemiology and management of uterine fibroids. J. Gynaecol. Obstet 149: 3-9. [crossref]
  6. Chin H, Ong XH, Yam PKL, Chern BSM (2014) Extrauterine fibroids: a diagnostic challenge and a long-term battle. BMJ Case Rep 2014: 2014204928. [crossref]
  7. Takeda T, Asaoka D, Fukumura Y, Watanabe S (2017) Asymptomatic giant retroperitoneal mass detected at a medical checkup. Clin Case Rep 5: 2148-2150. [crossref]
  8. Rajiah P, Sinha R, Carlos C, Dubinsky TJ, Bush WHJ, et al. (2011) Imaging of Uncommon Retroperitoneal Masses. RadioGraphics 31: 949-976. [crossref]
  9. Osman S, Lehnert BE, Elojeimy S, Cruite I, Mannelli L, et al. (2013) A Comprehensive Review of the Retroperitoneal Anatomy, Neoplasms, and Pattern of Disease Spread. Current Problems in Diagnostic Radiology 42: 191-208. [crossref]
  10. Wee-Stekly WW, Mueller MD (2014) Retroperitoneal Tumors in the Pelvis: A Diagnostic Challenge in Gynecology. Frontiers in Surgery 1: 49.
  11. Scali EP, Chandler TM, Heffernan EJ, Coyle J, Harris AC, et al. (2015) Primary retroperitoneal masses: what is the differential diagnosis? Abdom Imaging 40: 1887-1903. [crossref]
  12. Neville A, Herts B (2004) CT Characteristics of Primary Retroperitoneal Neoplasms. Critical Reviews in Computed Tomography 45: 247-270. [crossref]
  13. Clark MA, Fisher C, Judson I, Meirion Thomas J (2005) Soft-Tissue Sarcomas in Adults. New England Journal of Medicine 353: 701-711.
  14. Francis IR (2005) Retroperitoneal sarcomas. Cancer Imaging 5: 89-94.
  15. Gupta AK, Cohan RH, Francis IR, Sondak VK, Korobkin M (2000) CT of Recurrent Retroperitoneal Sarcomas. American Journal of Roentgenology 174: 1025-1030. [crossref]
  16. Shah JD, Kirshenbaum M, Shah KD (2008) CT Characteristics of Primary Retroperitoneal Tumors And the Importance of Differentiation From Secondary Retroperitoneal Tumors. Contemporary Diagnostic Radiology 31: 1-5.
  17. Fasih N, Shanbhogue AKP, Macdonald DB, Fraser-Hill MA, Papadatos D, et al. (2008) Leiomyomas beyond the Uterus: Unusual Locations, Rare Manifestations. RadioGraphics 28: 1931-1948. [crossref]
  18. Tsivian M, Ami Sidi A, Tsivian A (2009) Laparoscopic Management of Retroperitoneal Masses: Our Experience and Literature Review. World Journal of Laparoscopic Surgery with DVD 1-5.
  19. Cadeddu MO, Mamazza J, Schlachta CM, Seshadri PA, Poulin EC (2001) Laparoscopic Excision of Retroperitoneal Tumors. Surgical Laparoscopy, Endoscopy & Percutaneous Techniques 11: 144-147. [crossref]

Analysis of the New Prescriptions Created in Our Organization during the First Twelve Months after the Declaration of the State of Alarm Due to SARS-CoV-2

DOI: 10.31038/JIPC.2021112

Commentary

One year after the declaration of the state of alarm due to SARS-CoV-2 in Spain (March 14, 2020) the authors wanted to know the impact that the changes implemented in the health system have had on the creation of new prescriptions in our organization (Integrated Health Organization (IHO) Bidasoa). Bidasoa IHO is a health organization belonging to Osakidetza, it serves more than 85,000 inhabitants and is composed of 3 health centers and a regional hospital.

This is the continuation of the analysis made of the first 3 months after the declaration of the state of alarm [1] and analyzes the new prescriptions made from March 14, 2020 to March 13, 2021 (one year since the declaration of the first state of alarm due to the pandemic in Spain) and compares them with those started between March 14, 2019 and March 13, 2020 (one year earlier). The prescriptions created by Primary Care physicians (family doctors, pediatricians, and doctors of Continuing Care Points and nursing homes), hospital outpatient clinics and outpatient consultations, and the hospital emergency services have been reviewed. All the data were obtained from the OAS (Oracle Analytics Server) tool, which records the electronic prescriptions [2].

In the Bidasoa IHO during this period 231,876 new prescriptions were created compared to 171,830 a year earlier, which represents a reduction of 25.9% (Table 1).

Table 1: Prescriptions initiated between March 14, 2020 and March 13, 2021 in Bidasoa IHO, compared to the same period of the previous year [2].

New prescriptions

2019/2020

2020/2021

Variation

Total

231.876

171.830

-25,9%

Acute

94.837

69.318

-26,9%

Chronic

137.039

102.512

-25,2%

On demand

168.076

117.909

-29,8%

Gender: Men

41.033

35.529

-13,4%

            Women

22.767

18.392

-19,2%

During the first twelve months after the declaration of the state of alarm, there have been substantial changes in the way of working in health care, including an increase in telephone consultations and a decrease in face-to-face consultations, or the successive automatic extensions of many of the chronic and on demand treatments. These facts are emerging as the most plausible reasons for the decrease in the new prescriptions initiated in this period.

The total number of medication containers dispensed in pharmacy offices between March 2020 and February 2021 compared to the same period of the previous year, has been reduced by 3% [3]. In other words that means that, in the same period in which there was a 25.9% reduction in the creation of new prescriptions, only 3% less medication was dispensed in pharmacies. This difference could be explained, among other reasons, by the successive automatic extensions of the treatments that have been carried out in the last year, which could mean that fewer treatment reviews have been carried out for chronic patients.

New prescriptions were analyzed by therapeutic groups and 3 groups stand out in terms of their reduction: in group R (respiratory) new prescriptions were reduced by 42.9%, in group M (musculoskeletal) by 35.4 % and in group J (anti-infectives for systemic use) by 34.6% (Figure 1).

fig 1

Figure 1: Start of prescriptions by therapeutic group March 14, 2020 to March 13, 2021 vs. same period of the previous year [2].

Likewise, some therapeutic subgroups have been reviewed and it is observed that in the vast majority of subgroups there is a reduction in the initiation of new prescriptions. The reduction is greater than 30% compared to the previous year in some subgroups such as: agents affecting bone structure and mineralization (M05) 41.9%, agents against obstructive airways conditions (R03) 39.4 %, systemic antibiotics (J01) 36.4%, opioids (N02A) 36.3%, NSAIDs (M01A) 35.9%, other analgesics and antipyretics (N02B) 31.6%, otologicals (S02) 31.1%, lipid modifiers (C10) 30.9% and calcium channel blockers (C08) 30%. On the contrary, an increase in the creation of new prescriptions was detected in the following subgroups: insulins (A10A) 52.9%, diuretics (C03) 1.4% and direct-acting anticoagulants (B01AE and B01AF) 10.5% (Table 2).

Table 2: Variation in the initiation of prescriptions in some therapeutic groups under the study period [2].

Therapeutic subgroup

2019

2020

Variation

A02. Antacids

8.664

6.931

-20,0%

A10A. Insulins

408

624

52,9%

A10B. Non-insulin antidiabetics

1.439

1.053

-26,8%

A11. Vitamins

2.105

1.611

-23,5%

B01. Antithrombotics

3.577

3.103

-13,2%

B01AE and B01AF. Direct-acting anticoagulants

218

241

10,5%

B03. Antianemics

3.370

2.752

-18,3%

C02. Antihypertensives

126

102

-19,0%

C03. Diuretics

1.776

1.801

1,4%

C07. Beta-blockers

885

799

-9,7%

C08. Calcium channel blockers

874

612

-30,0%

C09. Inhibitors of the renin-angiotensin system

3.490

2.573

-26,3%

C10. Lipid modifiers

1.631

1.127

-30,9%

J01. Systemic antibiotics

30.599

19.469

-36,4%

M01A. Nonsteroidal anti-inflammatory drugs

28.591

18.327

-35,9%

M05. Agents for bone structure and mineralization

363

211

-41,9%

N02A. Opioids

9.634

6.135

36,3%

N02B. Other analgesics and antipyretics

24.128

18.487

-23,4%

N02C. Anti-migraine

472

323

-31,6%

N03. Antiepileptics

2.547

2.329

-8,6%

N04. Antiparkinsonians

159

116

-27,0%

N05. Antipsychotics

13.840

13.319

-3,8%

N05B and N05C. Benzodiazepines

11.010

10.463

-5,0%

N06A. Antidepressants

4.879

4.529

-7,2%

R03. Agents for obstructive airway conditions respiratorias

7.600

4.595

-39,5%

R06A. Systemic antihistamines

6.380

4.535

-28,9%

S01. Ophthalmology

8.101

5.764

-28,8%

S02. Otologic

2.464

1.698

-31,1%

In some of the therapeutic subgroups, we found it interesting to go down to the level of active ingredients. In the NSAID group, there have been significant decreases in the initiation of new prescriptions in all the most prescribed active ingredients, highlighting ibuprofen (Table 3).

Table 3: Active ingredients of the group of NSAID with the highest number of starts of prescriptions in the study period[2].

Non-steroidal anti-inflammatory drugs

2019/20

2020/21

Variation

Celecoxib

632

538

-14,9%

Dexketoprofen

4.050

3.183

-21,4%

Diclofenac (including associations)

2.695

1.786

-33,7%

Etoricoxib

1.133

891

-21,4%

Ibuprofen (including ibuprofeno arginine)

15.102

8.341

-44,8%

Naproxen (including association with esomeprazole)

4.364

3.238

-25,8%

Systemic antibiotics have also suffered a significant decrease in the number of prescriptions created during the year that followed the declaration of the state of alarm, with several active ingredients with a reduction of around or more than 60% reduction compared to the previous year (amoxicillin, azithromycin, phenoxymethylpenicillin, levofloxacin or moxifloxacin). Cefuroxime and, to a lesser degree, fosfomycin, have increased the new prescriptions in this period (Table 4).

Table 4: Active ingredients of the group of systemic antibiotics with the highest number of prescription starts in the period under study [2].

Systemic antibiotics

2019/20

2020/21

Variation

Amoxicillin

7.905

3.154

-60,1%

Amoxicillin/clavulanate

7.558

5.074

-32,9%

Azithromycin

4.268

1.786

-58,1%

Cefuroxime

1.245

1.515

21,7%

Ciprofloxacin

1.519

1.392

-8,4%

Clarithromycin

355

221

-37,7%

Phenoxymethylpenicillin

165

56

-66,1%

Fosfomycin

3.831

3.873

1,1%

Levofloxacin

1.560

614

-60,6%

Moxifloxacin

235

88

-62,5%

The profile of new antibiotic prescriptions in pediatrics was also analyzed (Table 5). The reduction in new antibiotic prescriptions in pediatrics is even more pronounced than in the case of adults, and has remained so during these 12 months.

Table 5: Active ingredients of the group of systemic antibiotics with the highest number of prescription starts in the period under study [2].

Systemic antibiotics (pediatrics)

2019/20

2020/21

Variation

Amoxicillin

1.999

456

-77,2%

Amoxicillin/ clavulanate

714

431

-39,6%

Azithromycin

563

186

-67,0%

Total antibiotics

3.402

1.190

-65,0%

Finally, we wanted to check whether the significant decrease in new NSAID prescriptions could have shifted to other analgesics, such as paracetamol or metamizole. This was not the case in the periods analyzed previously and does not appear to be the case at present (Table 6).

Table 6: New prescriptions of non-NSAID analgesics in the study period [2].

N02B – Other analgesics and antipyretics

2019/20

2020/21

Variation

Metamizole

8.689

7.483

-13,9%

Paracetamol alone

15.388

10.983

-28,6%

Paracetamol with codeine

4.434

1.343

-69,7%

In summary, the creation of new prescriptions in the last year compared to the previous year has been reduced by 25.9%; however, the dispensing of drugs in pharmacy offices has only been reduced by 3%. This means that the medication consumed by the Bidasoa IHO population has been quantitatively similar to that of the previous year, probably due to the successive automatic extensions of medications that have been applied during this time.

References

  1. Mendizabal Olaizola A, Valverde Bilbao E (2020) Impacto de la pandemia SARS-CoV-2 en el inicio de las prescripciones. J Healthc Qual Res 402-403.
  2. Data obtained from Osakidetza’s OAS (Oracle Analytics Server) tool.
  3. Data obtained from Health Department’s OBIEE (Oracle Business Intelligence Enterprise Edition) tool.

How and Why Choirs May Promote Health and Wellbeing?

DOI: 10.31038/IJNM.2021223


Recent research confirm that longevity and a healthy life is strongly influenced by belonging to closely knit communities or groups, that can give you a sense of meaning and of mastering in collective activities like nature and culture experiences. Increasingly more emphasis has been put on nature and cultural activities for maintaining health and quality of life [1-3], and may be linked to the building of social capital in local communities [4]. Health promotion is carried out by and with people, which improves both the ability of individuals to take action, and the capacity of groups, organizations or communities to influence the determinants of health (WHO, 1997). “Settings for health” represent the organizational base of the infrastructure required for health promotion. New health challenges mean that new and diverse networks need to be created to achieve intersectoral collaboration. Such networks should provide mutual assistance within and between countries and facilitate exchange of information on which strategies are effective in which settings. Public health research and practice should focus not only on factors causing disease and injuries (pathogenesis), but also on factors promoting health (salutogenesis) in the perspective of health promotion and prevention in different settings. Creative arts initiatives can be an effective way of meeting the growing calls for a shift of emphasis in mental health services, enhancing the significance of relationships and social support in the context of the well-being agenda. An adequate grasp of mutuality and social relationships is also important in addressing recent policy initiatives around loneliness [5]. Choral singing contributes to people changing their self-perception or maintaining their identity despite life affecting challenges or changes in living conditions [6]. Choral singing practice can be seen from a salutogenetic perspective that is, as something which promotes health and strengthens the healthy aspects of an individual in states of ease or dis-ease [7]. Singing can also be beneficial for those in the wider community who are affected by non-communicable diseases such as cancer [8]. Vitality was improved in those with a cancer diagnosis, and anxiety was reduced in cares and the bereaved. To use resources and capacities in communities by strengthening empowerment of the individuals that suffer from mental disorders and diseases, mostly anxiety and depression would also underline the importance of giving priority to the topic Public Mental Health Promotion in the light of new epigenetic research [3].

Non-Pharmaceutical Interventions

Quite often people would rather be prescribed non-pharmaceutical interventions than medication The Lancet Commission on Culture and Health states that as it is increasingly recognized that wellbeing has both biological and social elements, health care providers can only improve outcomes if they accept the need to understand the sociocultural conditions that enable people to be healthy and make themselves healthier – that is, to feel well [9], and then possibly recommend non-pharmaceutical interventions. Seven years of research by the James Lind Alliance into the clinical research priorities of patients, carers, and clinicians indicated that 72% (103/126) of treatment priorities were non-pharmacological and that often people would rather be prescribed non-pharmaceutical interventions than medication [10]. Marmot has described social exclusion as “deprivation on stilts” [11] to accentuate how damaging it is for the individual and society. He advocates for any changes that could help tackle social exclusion, and it could be argued how choirs would be 2 fertile grounds for further research for a potential role in health promotion by facilitating a pathway to social inclusion. In response to this, ‘social prescribing’ is becoming more prevalent, whereby people presenting to primary care are linked with various sources of support within the local community, from gardening projects to table tennis clubs, and choirs can act as another potential non-pharmacological ‘tool’ [12]. Leisure time is increasingly important for emotional wellbeing, informal learning and identity formation among children and youth. Contemporary societies are characterized by increasing individualization, affecting identity formation, well-being and sense of coherence and belonging. The institutionalization of childhood and education/knowledge has increasingly compartmentalized children and young people into exclusive spheres set apart from the adult world, placing them in an age-segregated social order, at the cost of being included in an intergenerational social order [13]. Health benefits from musicking[1] [14] may reduce stress, anxiety, depression by building coping capabilities, resilience social inclusion and renewed strength [15].

Future Studies

Despite widespread anecdotal evidence that singing has a positive effect on health and wellbeing, and the burgeoning number of studies suggesting potential benefits in many diverse fields, recent systematic reviews have identified that the quality of evidence is sometimes poor. McNamara’s Cochrane review of the singing and COPD literature suggested that the quality of evidence is low to very low. This was thought to be due to the small size and the low number of randomized controlled trials [16]. Other methodological limitations have meant that outcome measures vary or there are no consistent changes in outcome measures. Randomised controlled trials of singing interventions suffered from attrition as people who wanted to sing were not allocated it, or the singing ‘intervention’ offered was too short, too finite, or simply not appealing. Clark and Harding’s [17] systematic review of the psychosocial outcomes of singing interventions concluded that more qualitative studies were needed. The results of the six studies that have been carried out since then are interesting, convergent, but (naturally) inconclusive. In order to explore such ecological functions of choral singing, participant observation is a good strategy in addition to the ethnographic interview. Through participant observation of the choral singing practice and events, we can investigate how choral singing is imbricated into their social networks and how it expands their social world.

[1] Musicking: To music is to take part, in any capacity, in a musical performance, whether by performing, by listening, by rehearsing or practicing, by providing material for performance (what is called composing) or by dancing. (Small, 1998:9). See also David Elliott’s definition of Musicing: all human action related to [music.]” [14].

Reference

  1. Hansen E, Sund E, Krokstad S (2015) Cultural activity participation and associations with self-perceived health, life-satisfaction and mental health: the Young HUNT Study, Norway. BMC Public Health
  2. Cuypers K, Krokstad S, Holmen TL, Margunn SK, Lars OB, et al. (2013) Patterns of receptive and creative cultural activities and their association with perceived health, anxiety, depression and satisfaction with life among adults: the HUNT study, Norway. J Epidemiol Community Health 66 : 698-703. [crossref]
  3. Tellnes G, Batt-Rawden KB, Christie WH (2018). Nature Culture Health Promotion as Community building. Journal “Herald of the International Academy of Science. #1. Russian Section” (HIAS.RS). Herald of the International Academy of Science. Russian Section”. vol. 1 (1).
  4. Campbell C, Gillies P (2001) Conceptualizing ‘social capital’ for health promotion in small local communities: a micro-qualitative study. Journal of Community & Applied Social Psychology. 11 : 329-346.
  5. Sturgeon S (2006) Promoting mental health as an essential aspect of health promotion. Health Promotion International 21 : 36-41. [crossref]
  6. Balsnes AH (2010) Choir research – a Norwegian perspective. In : Geisler U, Johansson K (eds.), Choir in Focus. Pg : 16 – 19, Bo Ejeby Publisher.
  7. Clift S, Jennifer N, Raisbeck M, Whitmore C, Morrison I (2010) Group singing, wellbeing and health: A systematic mapping of research evidence. UNESCO Observatory, Faculty of Architecture, Building and Planning, The Melbourne Refereed E-journal 2 .
  8. Batt-Rawden KB, Andersen S (2018) “Singing has empowered, enchanted and enthralled me” Choirs for Wellbeing?”. Health Promotion International 3.
  9. Napier D, et al (2011) Culture and Health Lancet Commission. The Lancet.
  10. Crowe S, Fenton M, Hall M, Cowan K, Chalmers I (2015) Patients’, clinicians’ and the research communities’ priorities for treatment research: there is an important mismatch. Research Involvement and Engagement 1.
  11. Marmot M (2015) The Health Gap: the Challenge of an Unequal World. Bloomsbury, London, UK.
  12. Ruud E (2013) Can music serve as a “cultural immunogen”? An explorative study. International journal of qualitative studies on health and well-being. 8 : 205-209. [crossref]
  13. Beynon C, Lang J (2018) The More We Get Together, The More We Learn: Focus on Intergenerational and Collaborative Learning Through Singing. Journal of Intergenerational Relationships 16 : 45-63.
  14. Small C (1998) Musicking. The Meanings of Performing and Listening. Weslyan Press. London.
  15. Batt-Rawden KB (2018) The fellowship of Health Musicking: A Model to Promote Health and Well-Being. Music and Public Health – A Nordic Perspective. Bonde LO, Theorell T (eds) Springer Verlag.
  16. Williams E, Dingle G, Clift S (2018) A systematic review of mental health and wellbeing outcomes of group singing for adults with a mental health condition. European Journal of Public Health 28 : 1035-1042. [crossref]
  17. Clark I, Harding K (2012) Psychosocial outcomes of active singing interventions for therapeutic purposes: A systematic review of the literature. Nordic Journal of Music Therapy 21 : 80-98.