Author Archives: author

Pediatric COVID-19

DOI: 10.31038/JPPR.2021423


Virus Description

Corona is a common viral disease that can be transmitted between humans and different types of animals, meaning it can be transmitted between different races and types of living organisms. It is characterized as having broad-spectrum disease symptoms that differ from one patient to another in their severity and type. In the last months of 2019, a storm of infection with the Corona virus appeared in the Chinese city of Wuhan, with symptoms that were almost different in severity and led to deaths in some infections. The virus was characterized by its rapid spread among people, which surprised researchers, doctors and people in that city and in China in general. Which challenged Chinese researchers and scientists to investigate the type and nature of the causative agent, so they were able to diagnose Corona virus (Cove 2).

Keywords

SARS cov2, Coronavirus, Children, COVID-19, Viral infection, Respiratory signs, Pfizer/BioNTech, Moderna and Johnson & Johnson vaccines

COVID 19 Susceptible Age of Children

In December 2019, a novel coronavirus (severe acute respiratory syndrome coronavirus 2 [SARS-CoV-2]) emerged in China and has spread globally, creating a pandemic. Information about the clinical characteristics of infected patients who require intensive care is limited. The 2019 novel coronavirus (SARS-CoV-2) has been responsible for more than 54000 000 infections and 1,200 000 deaths worldwide, but data regarding the epidemiologic characteristics and clinical features of infected children are limited [1,2]. The largest study so far, published in pediatrics J. included analysis of 2,143 children with COVID-19 documented from Jan. 16 to Feb. 8 in China. It found that symptoms of the disease were generally less severe in children and teens compared with adults. Specifically, 4.4 percent had no symptoms, 50.9 percent had mild disease and 38.8 percent had moderate symptoms. Of the children with symptoms, only 0.6 percent developed acute respiratory distress syndrome or multiple organ dysfunction. Of note, however, young children—particularly infants under one year of age—had a higher risk for significant illness. Ten percent of infants had severe disease, compared with 3 percent of teens over age 15.

How Likely are Children to Get Coronavirus Disease 2019 (COVID-19)?

Although all children can be infected with the virus that causes COVID-19, they are not as frequent as adults. Children rarely encounter serious illnesses from COVID-19. Although there have been many large-scale outbreaks around the world, few children have died. According to the US Centers for Disease Control and Prevention (CDC), between February 12 and April 2, of the nearly 150,000 COVID-19 cases in the United States, only 2500, or 1.7%, were children. This is similar to outbreaks in other countries such as China and Italy. The hospitalization rate of children is much lower than that of adults [3]. However, people of any age with certain underlying diseases (such as type 2 diabetes) have a higher risk of serious illnesses from COVID-19. In addition, children with congenital heart disease, genetic diseases, or diseases that affect the nervous system or metabolism are also at higher risk of serious illnesses from COVID-19. Discuss with them what happened and assure them that most situations are mild. Your child will get tips from you, so it’s also important to stay calm.

How Does COVID-19 have an Effect on Kids?

Children, together with very younger kids, can infected with COVID-19. Many of them don’t have any signs and symptoms. But those who do get the infection generally tend to show milder signs and symptoms which includes low to mild fever, exhaustion, and cough. Some kids have had marked fitness situations can be at expanded hazard for intense illness. A doubtlessly acute and perilous sequel can appear on kids. This case defined as multisystem inflammatory syndrome in children (MIS-C), it may result in life-threatening issues with the coronary heart and different organs with inside the frame. In this condition, exceptional frame parts, which includes the coronary heart, lungs, kidneys, brain, skin, eyes, or gastrointestinal organs, can end up inflamed.

Symptoms of MIS-C can Include

  • Fever lasting more than a couple of days
  • Rash
  • Bloodshot eyes (redness of the white part of the eye)
  • Stomach ache
  • Vomiting and/or diarrhea
  • A large, swollen lymph node in the neck
  • Neck pain
  • Red, cracked lips
  • A tongue that is redder than usual and looks like a strawberry
  • Swollen hands and/or feet
  • Irritability and/or unusual sleepiness or weakness.

Why do Children React Differently to COVID-19?

The answer is unclear. Some experts suggest that children may not be severely affected by COVID-19 because there are other coronaviruses that spread in the community and cause illness, such as the common cold. Since children often catch colds, they may have antibodies to protect them against COVID-19. Children’s immune systems may also interact differently with adults’ immune systems. Some adults get sick because their immune system seems to overreact to the virus, causing more damage to their bodies. This may be unlikely to occur in children. Although rare, children under 1 year old (infants) have a higher risk of serious illness from COVID-19. This may be due to their immature immune system and small respiratory tract, which makes them more susceptible to respiratory problems caused by respiratory viral infections. Between late December and early February, more than 2,100 children with suspected or confirmed COVID-19 in China were studied, and the results showed that less than 11% of infants had serious or severe illnesses. In contrast, the prevalence of severe or severe illness is about 7% for children aged 1 to 5 years, 4% for children 6 to 10 years old, 4% for children 11 to 15 years old, and 3% for children 16 years and older. New born babies may be infected with the virus that causes COVID-19 when they come into contact with sick caregivers during or after delivery. The American Academy of Pediatrics recommends special care for new-borns born to women who have confirmed or suspected COVID-19. This may include temporarily separating the mother from the new born to reduce the risk of infecting the baby, monitoring the baby for signs of infection, and, if available, testing the new born for COVID-19 [4,5].

Do Children and Adults have Different Symptoms of COVID-19?

When you see some mild symptoms on your son or daughter and feel or suspect that these symptoms are similar to those of COVID 19, you should take quick steps to isolate your child in a special room where all the comforts and conditions of health are available and prevent contact with him from the rest of the family and tell his or her doctor or health care providers and following the procedures recommended by the World Health Organization. COVID-19 symptoms in children and adults experience similar symptoms of COVID-19, while children’s symptoms tend to be mild and cold. Most children will recover within one to two weeks. Their symptoms may include: fever Runny nose cough fatigue Muscle pain Vomiting diarrhoea. When children and adolescents get COVID-19, their symptoms seem to be milder than adults. Among the American population under 19, almost no one is hospitalized. Studies have shown that more than 90% of sick children have mild to moderate cold-like symptoms, including: fever Runny nose cough Vomiting diarrhoea. Some children and adolescents have been admitted to the hospital due to childhood multiple system inflammatory syndrome (MIS-C) or pediatric multiple system inflammatory syndrome (PMIS).

Coronavirus in Sick Children if Some Children have Other Diseases

They may be at higher risk of more serious diseases: asthma diabetes Blood disease Heart or liver disease Kidney disease requiring dialysis Weakened immune system. Doctors are still learning about it, but they think it is related to the new coronavirus. Symptoms include fever, abdominal pain, vomiting, diarrhea, skin rash, headache, and confusion. They are similar to toxic shock syndrome or Kawasaki disease, which causes inflammation of blood vessels in children. Serious problems are rare. If your child has any of the following symptoms, seek medical help immediately. Difficulty breathing Can’t let the liquid flow down Changes in skin tone, including blue lips or face Confused or trouble waking up Serious problems are rare. If your child has any of the following symptoms, seek medical help immediately: Difficulty breathing Can’t let the liquid flow down Confused or trouble waking up Blue lips or face.

When Will Youngsters be Capable of Get the COVID-19 Vaccine?

Pfizer/BioNTech and Moderna are already carrying out age de-escalation researches, wherein the vaccines are examined in different categories of children of descending age. Johnson & Johnson plans to do the same. Currently, the Pfizer/BioNTech COVID-19 vaccine is permitted to be used in teenagers sixteen years and older, but the Moderna and Johnson & Johnson vaccines are given a permission for the young in 18 years and older. In March 2021, Pfizer/BioNTech introduced promising effects for a Phase three trial trying out its vaccine in youngsters a while 12 to 15. Experiments were conducted on 2,260 voluntaries teenagers, half of whom were given mRNA vaccine and the rest were given Normal Saline or Placebo. The antibody reaction within side the vaccinated adolescent categories turned into even more potent than that during vaccinated sixteen- to 25-year-olds enrolled in an in advance study. In addition, a complete of 18 symptomatic instances of COVID-19 have been said at some point of the trial, all within the placebo group. Vaccine-associated signs and symptoms have been slight and akin to older corporations enrolled in in advance study. The effects have been introduced in a press release, now no longer in a peer-reviewed, posted study. Pfizer/BioNTech has submitted their facts to the FDA with a request to make bigger emergency use authorization to youngsters a while 12 to 15. The enterprise has additionally commenced trying out the vaccine in children more youthful than 12 years. Moderna is carrying out vaccines study — one in adolescents a while 12 to 17, the alternative in children among a while of 6 months and 12 years. The age de-escalation research is achieved to verify that the vaccines are secure and powerful for every age category. They additionally pick out the most reliable dose, which ought to be powerful, however with tolerable facet effects. The adult trail is a greater than the age de-escalation study in the children; in addition of recruiting many thousands of contributors, they may recruit between 2,000-3000 participants in every age category. Look like the adult studies, a few children in every study gets a placebo. The FDA will evaluation facts from the de-escalation trials to determine whether or not to authorize the vaccines for every age category.

References

  1. World Health Organization. Coronavirus disease 2019 (COVID-19): situation report — 50.
  2. Guan W, Ni Z, Hu Y, Wen-hua Liang, Chun-quan OU, et al. (2020) Clinical characteristics of coronavirus disease 2019 in China. N Engl J Med 382: 1708-1720.
  3. Bialek S, Boundy E, Bowen V, et al. (2020) CDC COVID-19 Response Team. Severe outcomes among patients with coronavirus disease 2019 (COVID-19)—United States, February 12–March 16, 2020. MMWR Morb Mortal Wkly Rep 69: 343-346.
  4. Ng Y, Li Z, Chua YX, et al. (2020) Evaluation of the effectiveness of surveillance and containment measures for the first 100 patients with COVID-19 in Singapore—January 2–February 29, 2020. MMWR Morb Mortal Wkly Rep 69: 307-311.
  5. The Novel Coronavirus Emergency Response Epidemiology Team (2020) The epidemiological characteristics of an outbreak of 2019 novel coronavirus diseases (COVID-19)—China. China CDC Weekly 2: 113-122.

The Importance of a Community Health Network: An Ethnoanthropological Approach, the Experience of Teaching Demoethnoanthropology of the Degree Course in Nursing at the University of Parma

DOI: 10.31038/IJNM.2021222


Although Italy has a long history of migration behind it, it seems unable to convey the long experience accumulated over 150 years on its territory. There seems to be a lack of a network of contacts and relationships with communities of different cultures and social distress in the area of health, where there is a virtuous experiment, even well functional, but not really structured in a network. The COVID-19 Pandemic has shown that the inherent weaknesses in the sphere of migration and social hardship, which have worsened in the absence of a community health network; cultural, linguistic, social barriers, of knowledge of services and institutions, have been widened due to the impossibility of travel and the lack of individual institutional references that could provide indications, information and guidance. The creation of a network of contacts for the teaching of Demoethnoanthropology of the Nursing Studies course at the University of Parma has shown how a culturally competent and correct anthropological approach can provide communities with a channel of orientation and adherence through pre-built direct contact.  The network of contacts built by the demo-ethnoanthropology course was born in the year 2013, when a discussion of involvement of the communities of different cultures of the territory is initiated, in a part of the training course of the course. The idea was to exploit university indications regarding the “Third Mission” by involving the cultural diversity of the area in an interaction between the university, students and communities both in the representative offices of the communities and in the university classrooms. The initiative, much appreciated by the representatives and members of the communities, involved a large part of those present in the territory of the city of Parma and the province. The first meetings brought in the classrooms representatives with an important university education, but also young university students and more. In 2015 we created that series of events known as “Cultural coffee” of the nursing study course, unique cultural encounters in Italy for this type of course held within a hospital dining area, therefore in a context outside the classrooms and open to the public in fact we added an element that was required by the Emilia Romagna region that is, bringing events with multicultural characteristics into common places among ordinary people. Over the years, public meetings and going with students to the associative centers of the communities, including the Islamic culture center of Parma, the Gurdwara Singh Saba associative headquarters, the Zoe pentecostal mission of Parma have increased institutional knowledge of the course and created a vast network of relationships. In order to build community involvement with an intention that is also inclusive, an institutional relationship more dedicated to health has also been initiated, since the same communities, aware of our dual role as teachers and nurses, have begun to ask us questions and requests in this regard. to health, to the approach to care, exposing basic care needs, effectively communicating the lack of an interconnection between community and health institution and seeing in our professional figure a simpler channel of approach.

It has happened that in several cases, single individuals have been advised and guided towards the healthcare receptivity of the hospital structure in particular towards complex operating units (cardiac surgery, cardiology, orthopedics, neurosurgery and others), through simple indications, or help in understanding and solution bureaucratic elements that are more difficult to understand. We have provided indications and advice with a correct approach towards the cultural dimension, taking into account the social, cultural context, of habits and customs, views and interpretation of health with respect to the culture of origin. We well know that care and health can be interpreted and seen not according to a standard, on the other hand health is not a static car in its being, but can be interpreted and welcomed on the basis of very diversified social and cultural rules, but which go and should be always considered competently to be correct. Our undergraduate training in anthropology has been for an advantage, both in building trust and networking relationships, as well as in the help and support of care and health and what at first appeared to be a great openness and trust. Towards us, it has also proved very valuable during the COVID-19 Pandemic the measure of trust was also increased by some particular institutional events, such as the meetings for the creation of the room of worship and silence that saw us present on 3 different occasions together with the representatives of the communities and the general managers of the two health companies of the territory, where we became spokesman and link between the two realities and in this regard I want to remember that the city of Parma alone has the presence of 31,000 people of foreign origin on a housing reality of 200,000 inhabitants, with as many as one hundred and 137 different nationalities , and more than 40 associations of different cultures. It is also true that a relationship of trust of a personal nature has been created, but the fact remains that we have presented ourselves to the communities also as institutions, university and hospital together. Was there even a time when we had some doubts about this, was this personal approach also correct? Could it be an advantage or could it become a double-edged sword, with the risk of creating expectations and even disappointments?

The answers came from a meeting with the former prefect of Parma, Dr. Giuseppe Forlani who removed all doubts, he already Central Director of Civil Services for Immigration and Asylum within the Department for Civil Liberties and immigration from the Ministry of the Interior, thus coming from a training similar to ours but with a very vast and particular background of experience in the field, advised us to continue on the path taken and gave us answers and advice, with an important indication or that the institutions must go to the communities and therefore we were doing this, that the personal relationship that has been created is above all an institutional relationship because in this way we entered the communities a personal form is fine too but it is the input context that unconsciously dictated the rules of the relationship. According to his vision, the extraordinary nature of the relationship of trust could be of great help and importance in the future and we are talking about the summer of 2019. created a moment of important meeting between institutions, the municipality, the prefecture, health authorities and the community itself. There was also a similar request arrived a few weeks later by the Ahmadiyya Muslim Jama’at Italia Association which asked us to help them organize an event of presentation and comparison between the religious, community, philosophical and secular diversity of the territory for thus building a relationship of trust and having a link with hospitals through our people. The event scheduled for March 26,2020 has been postponed due to the COVID-19 Pandemic. But what may appear as a building of relationships of trust, as the prefect had foreseen, in the Pandemic moment demonstrated all the potential of the network, of how the correct anthropological approach, respectful and culturally competent and prepared, had in fact filled a void dictated by an inexperience of the institutions. The communities have contacted us on many occasions, asking us to help them for particular situations, including indications on prevention systems and methods, such as, on our advice, the closure of the Sikh temple in Parma, the first cult institution in Italy to close the ‘access to the faithful, a week before the government decree which imposed an absolute ban on access to places of worship. But there are still many requests for the recovery of the bodies or to understand the procedures for managing them and personal effects. But again the participation in the construction of the dedicated site www.oltreemergenze.com in which we provided part of the communications in a different language and we placed ourselves as referents for some procedures. These are just a few examples of the work done.

What does all this prove? First of all, that cultural diversities are in fact largely outside the information context of care and health, that the absence of a system of interconnection between institutions and communities has created a vacuum, which has become a major problem in receiving information and providing actions. at a time when it was in the most complete lockdown. This demonstrated the need for territorial community healthcare, which not only approaches cultural diversity but also social discomfort, as demonstrated by Emergency NGO. The reality of the NGO of which i’m also a volunteer on the project in Milano, shows that in order not to leave anyone behind, there is a need for an institution that enters into community realities, that knows the cultures, that is culturally formed and prepared, that has a solid basis to be able to relate correctly with these. The structure as it is today, demonstrates that at the base there is a void, holes in the institutional mesh that puts in difficulty the realities of different cultures and beyond, that the simple approach with the brochure or flyer in the language is not enough. The construction of a network of relationships with a strong anthropological and intercultural characteristic in the small of a reality like Parma, with only two individuals myself and my colleague Murekabiri with the help of the communities and the network of built relationships, has shown that an intercultural service on the territory, which embraces cultural diversity and social discomfort, can guarantee people not only the possibility of real and correct information but above all equality in care and assistance, remembering that it is from the territory, from the fabric of this that you can improve access to care, adherence to it and also create a valid system of social inclusion. In a small way, this experience has shown that the method used, which in fact is the Canadian one, can be functional, and is required of us, even before the pandemic by the WHO 2020/2030 agenda and is moreover in the directives of the UN. Therefore, concluding if the network built with an anthropological and intercultural approach system has given good results even if in the small of our experience in a medium-sized city, the same system increased through culturally competent elements, organized at an institutional and service level, can achieve important local, regional and national results.

Identifying Possible Risk Factors of Poorly Understood Cancers – The Case for Using Health Information Technology

DOI: 10.31038/PEP.2021233

Introduction

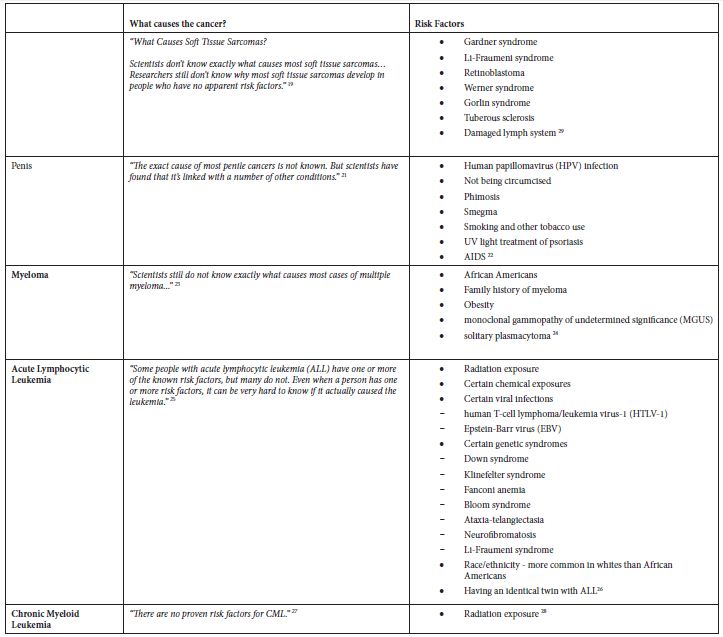
Worldwide, cancer is the second leading cause of death, with one of every six deaths caused by cancer [1]. There were 17 million new cases and 9.6 million cancer deaths worldwide in 2018, including approximately 1.7 million new U.S. cases and 600,000 U.S. cancer deaths [3]. The total financial cost of cancer in 2010 was estimated at 1.16 trillion U.S. dollars [1].

There have been significant reductions in cancer mortality, thanks to improved screening, early detection, and better treatment [1]. However, the worldwide incidence of cancer is expected to increase to 27.5 million per year by 2040 [28], a 62% increase from 2018. The U.S. expects an increase to over 1.9 million new cases per year by 2020, largely due to an aging Caucasian population and a growing African American population [5].

The World Health Organization states that “30-50% of all cancer cases are preventable. Prevention offers the most cost-effective long-term strategy for the control of cancer” [26]. Cancer can be prevented by reducing exposure to environmental risk factors, modifying lifestyle factors that are linked to cancers, and protecting against the effects of risk-factor exposures [26].

Tobacco is one of the most widely known and most modifiable risk factors for cancer and the process in determining this illustrates the value of the systematic study of cancer causes [15]. Lung cancer is the most common cancer in the world after skin cancer and the most deadly [24]. Before smoking became widespread, lung cancer was rare; however, as cigarette production and smoking increased, lung cancer became much more common. Smoking tobacco was found to be associated with lung cancer around the mid-20th century when a study showed that smokers were more likely to have cancer than non-smokers [15]. This relationship was confirmed by epidemiological and prospective studies, experiments, pathological observations, and chemical analyses [15]. Smoking was also found to be a risk factor for many other types of cancers and diseases, and tobacco is now understood to be associated with 33% of cancers and 22% of cancer-related deaths worldwide [28]. Cigarette smoking is associated with 80%-90% of lung cancer deaths in the U.S. [25]. Deaths caused by smoking cigarettes have an average latency of about 25 years; lung cancer deaths are expected to reach about 2 million per year during the 2020s or the 2030s [15].

As a result of the overwhelming evidence that smoking is a causal factor for cancer, there have been many anti-smoking initiatives. These efforts include preventing smoking initiation, helping smokers quit the habit, and reducing exposure to second-hand smoke [11]. Smoking cessation reduces cancer risk and can improve outcomes for cancer patients. Smoking cessation can reduce lung cancer risk by as much as 85% after 16 years of cessation compared to non-cessation [13]. Due to tobacco control measures that were implemented in the U.S. in the mid-1950s, about 32% (795,851) of the lung cancer deaths that would have occurred during 1975-2000 were prevented; the benefits of these measures will continue [11]. These huge reductions in deaths, suffering, and costs were possible because good epidemiological evidence uncovered the link between smoking and cancer.

Other cancer-prevention strategies that have grown out of accumulating epidemiological studies include reducing alcohol consumption [10], vaccinating against certain viruses [17], and improving diet and exercise [4]. The International Agency for Research on Cancer (IARC) determined that alcohol was carcinogenic after reviewing studies that showed an association between alcohol consumption and certain cancers [8]. One study involving eight European countries estimated that for 2008, 3% of cases in women and 10% of cases in men were due to alcohol consumption [20]. A U.S. study determined that 3.2% – 3.7% (18,200 to 21,300) of all cancer deaths in 2009 were attributable to alcohol consumption [12].

Many viruses have been shown to cause or be associated with certain cancers [17]. Individuals and health care providers can take preventive steps such as vaccinations, follow-up treatment to minimize the risk of developing cancer, and screening to maximize chances of early detection of cancer [17]. And because obesity, diet, and sedentariness have proven to be risk factors that are related and modifiable, individuals can make lifestyle changes to reduce their cancer risk while gaining other health benefits [4].

There have been improvements in cancer survival rates due to improvements in cancer detection and treatment, but the progress made applies to relatively few cancers [16]. Also, this does not spare patients the ordeal, financial cost, and disability of cancer treatment. Screening guidelines are available for very few cancer types, so many cancers are detected at later stages and, therefore, have a lower survival rate [9]. In addition, incidence rates of some of these poorly understood cancer types are increasing. Cancer prevention is the least costly and most desirable approach to combat the expected increase in cancer incidence [26]. However, to achieve this we need epidemiological research that focuses on identifying risk factors for poorly understood cancer types.

A traditional epidemiological approach, such as the “Cancer Prevention Studies” (CPS), requires a large enough study group, long follow-up, and is costly [7]. Therefore, this approach is limiting, especially for poorly understood cancers, which tend to be rarer cancers. In addition, the research landscape has changed significantly. Information technology was one of the most significant technological developments of the twentieth century and has affected every aspect of our lives. It has made us very interconnected to people, activities, and the environment. Determining any effect of these connections is difficult due to the complexity and numerosity. Fortunately, these technological developments have also made significant advances that can be applied to health research. We have, are generating, and are capturing more data about many different aspects of our lives than ever before. We need to use current technology and data to overcome the limitations of the traditional epidemiological approach. We must develop reliable, efficient, and cost-effective research methods to identify possibly risk factors for poorly understood cancers.

Purpose

Our main objective in this study was to identify cancer types that represent a health burden, but for which environmental and lifestyle risk factors are poorly understood (i.e., without an established causal risk factor). We used a combination of inclusion and exclusion criteria to identify these cancers. The inclusion criteria were cancer types 1) without screening guidelines; 2) with low survival rates; and 3) with increasing incidence. Cancer screening aims to detect cancer before the individual becomes symptomatic, and early detection usually results in more successful treatment and greater survival [27]. Currently, only four types of cancer – breast, cervical, colorectal, and lung – have broadly accepted screening recommendations [16]. The cancers with low survival rates tend to be cancers that are more difficult to detect and to treat. An upward trending cancer indicates a growing concern that should be investigated to identify risk factors and reduce incidence. The primary exclusion criterion was cancer types with established causal risk factors. By default, cancer types with screening guidelines, without low survival rates, and/or without increasing incidence were excluded.

Secondarily, we propose a new methodological approach to study the etiology of these rare cancers that maximizes data utilization without the need for costly epidemiological studies, such as the “Cancer Prevention Studies”. This design allows exploration of the relationships of selected cancer with various potential risk factors without the financial and feasibility barriers of traditional epidemiological designs.

Methods

We used data from the National Cancer Institute’s (NCI’s) Surveillance, Epidemiology, and End Results (SEER) Program. The SEER Program collects cancer incidence and survival data for every cancer case reported from population-based cancer registries covering approximately 34 percent of the U.S. population spanning 19 geographic areas. The program started in 1975 with nine registries and now collects data from twenty-one registries. Based on the broad coverage area, the data collected by the SEER Program is representative of the U.S. population [21].

SEER data are coded to ICD-O-3 and are grouped by major cancer site/histology [22]. The data have 102 groups in a hierarchical format, ranging from all sites to miscellaneous. SEER incidence data have both the rate (per 100,000 and age-adjusted to the 2000 U.S. population) and count. Survival data provide observed, expected, and relative rates. Incidence trend data show overall percent change, annual percent change (APC), and the rate for each year. For this study, we used incidence data for 2011 through 2016 and survival data for the five-year period 2011 to 2015.

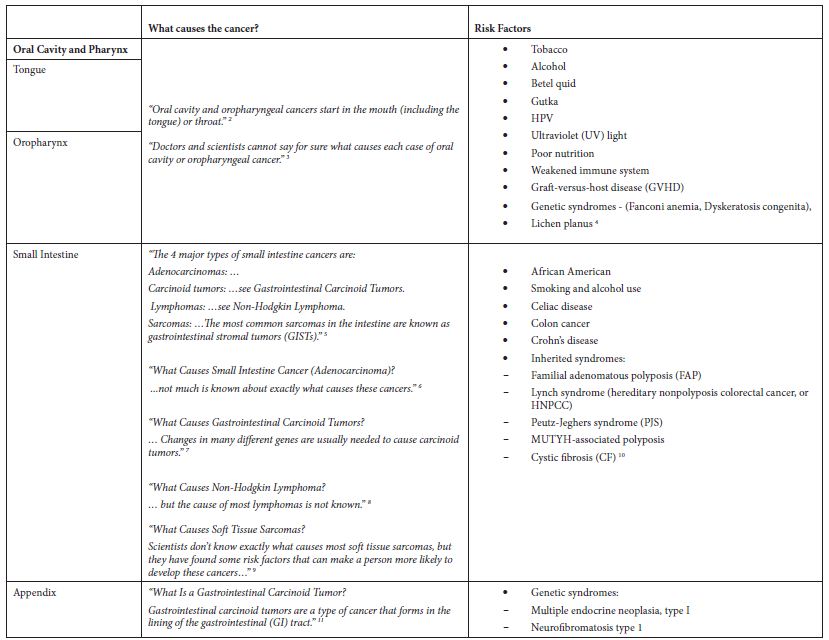
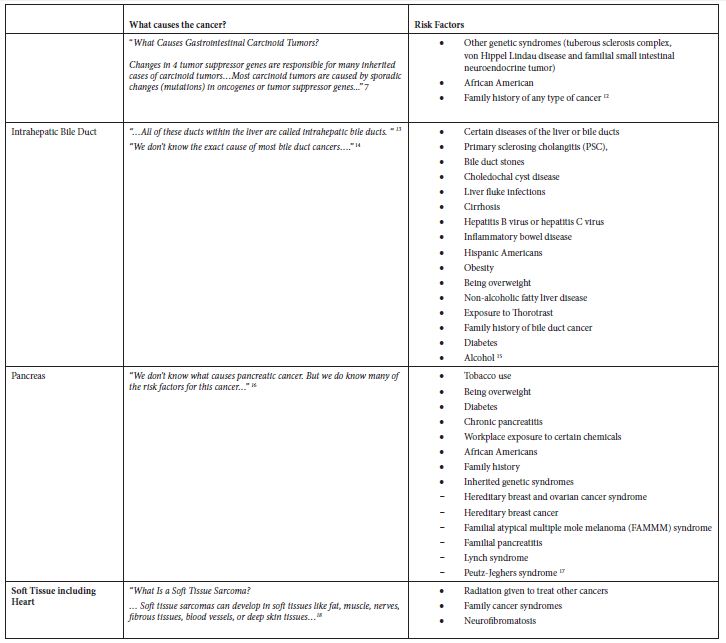
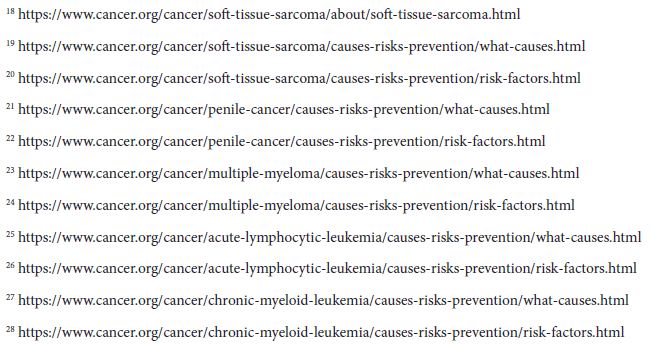
Starting with all 102 groups of cancers from the SEER database, we compiled data for incidence, survival rate, and trend. We added data on whether the cancers had recommended screening guidelines. Our selection criteria for cancer groups representing a health burden were groupings that do not have recommended screening guidelines, had a positive APC over the 6-year period (2011 to 2016), and had a 5-year relative survival rate of less than 70%. From the cancers meeting all three criteria, we removed groupings that were poorly defined, groupings containing “Other” or “Not Otherwise Specified”, and groupings that were too broadly defined (e.g., “Female Genital System”). We removed “Liver and Intrahepatic Bile Duct” since it includes the sub-category “Liver” that did not meet the criteria, but the sub-category “Intrahepatic Bile Duct” is in the final list (Table 1). We implemented the primary exclusion criterion by reviewing the websites of the American Cancer Society (ACS) (Cancer.org) and the National Cancer Institute (NCI) (Cancer.gov) to identify risk factors, causal and non-causal, for each of the cancers initially selected based on epidemiological measures. None of the cancers that met the inclusion criteria had established causal factors, so none were excluded (Table 2).

Table 1: Cancers meeting inclusion criteria

table 1

1Rate per 100,000 population, age-adjusted to the 2000 U.S. standard population.
Shaded groupings were removed for reasons stated above

Table 2: Application of exclusion criterion using information from the ACS website

table 2 (1)

footer 1

table 2 (2)

footer 2

table 2 (3)

footer 3

Results

The main epidemiological measures for the 12 groupings of poorly understood cancers are presented in Table 1. The grouping of “Oral Cavity and Pharynx” is a major grouping with sub-groupings “Tongue” and “Oropharynx”, and all three are in the final list. There are four groupings of the digestive system – “Small Intestine”, “Appendix”, “Intrahepatic Bile Duct”, and “Pancreas”. There are two leukemias – “Acute Lymphocytic Leukemia” and “Chronic Myeloid Leukemia”. The other groupings are “Soft Tissue including Heart”, “Penis”, and “Myeloma”.

The cancers included in the final list have varying statistics (Table 1). The age-adjusted incidence rates of poorly understood cancers in the final list range from 0.40 to 12.23 cases per year per 100,000 population. The incidence rates for all the 102 original groupings ranged from 0.00063 to 85.28 cases per year per 100,000 population. The final list of cancers has 5-year survival rates ranging from 7.67% for Pancreatic Cancer to 69.13% for Cancer of the Appendix. Cancer of the Appendix has the highest upward incidence trend (APC=16.46), followed by Intrahepatic Bile Duct (APC=8.70), Oropharynx (APC=2.62), and Tongue (APC=1.76). The other cancers have upward incidence trends of less than 1.00% APC. While there are some known risk factors for these cancers, there are no known causal risk factors.

Some of these cancers, such as soft tissue cancer including heart, have a more robust set of potential risk factors in the ACS classification of risk factors but a substantially larger number of potential risk factors classified by NCI. Others like “Acute Lymphocytic Leukemia” have a large number of potential risk factors in both ACS and NCI classifications. Tobacco, infections, radiation, and immunosuppressive medications were stated more as general risk factors for many of these poorly understood cancers. Some cancer-specific risk factors are viruses, diseases, syndromes, and poor nutrition, but the overall opinion is that very little is known about the causes of these cancers.

Discussion

Our study identified 12 cancers as poorly understood because a causal risk factor has not yet been identified. These 12 cancers, though not among the cancers with highest health burden in the United States and worldwide — a ranking mostly reserved for lung, colorectal, prostate, breast and cervical cancer — represent a moderate health burden if their count is taken in aggregate. Therefore, preventing these cancers and improving population health will be possible if we identify their causal risk factors (exposures).

Identifying associations between exposures and cancer can be done through cohort or case-control studies [18, 19]. A cohort study can provide strong evidence of causal associations. ACS’ Cancer Prevention Studies (CPS-I, CPS-II, CPS-3) are large scale, prospective, cohort studies [7]. These studies required large scale recruitment of subjects, survey completion by the subjects, and long follow-up periods. Initially, the aim was to determine the relationship between smoking and mortality from diseases. CPS-3 aims to determine the causes and protectants of cancer by looking at lifestyle, exposure, biology, and environment [7]. The results of CPS-I and II have identified significant factors that affect health and diseases progression. This information identified the areas to focus resources in order to combat diseases. These studies have provided valuable information that has helped to improve health; however, they require significant manpower and follow-up time. CPS-I had 68,000 volunteers in 25 states, a cohort of almost one million participants (men and women) and ran from 1959 through 1972. The CPS-II cohort was established in 1982 through recruitment of 1.2 million men and women in 50 states by 77,000 volunteers. CPS-3, with over 30,000 volunteers, enrolled over 304,000 participants from across the United States and Puerto Rico from 2006 through 2013. CPS-II and CPS-3 are still ongoing [7, 14].

Two common features of the poorly understood cancers identified in this study are they are rare and have low survival rates (< 70%). These features limit the choices of study designs; however, the low survival rates indicate their severity and justify the need for studying these cancers. A cohort study of these cancers would be challenging. The first challenge for studying these cancers is finding a large enough number of eligible, willing subjects to form a reliable study group. Second, based on the long follow-up required, the expected loss of study subjects might make any results obtained unreliable. Third, these challenges would increase the costs of studying these cancers. In addition, any study results obtained might not be useful due to low power. This justifies a case-control approach to investigating these cancers. A case-control approach selects subjects based on the outcome (e.g., presence/absence of one of these rare cancers) and measures the prior exposure event retrospectively. Compared to a cohort study, this approach would require fewer subjects, less time, and less funding.

We intend to use a case-control design and informatic-derived analytical techniques to identify potential risk factors for these poorly understood and somewhat rare cancers. Our aim is to combine various secondary datasets that traditionally have not been analyzed together for the purpose of performing exploratory data analyses and subsequent generation of hypotheses about unknown risk factors for these cancers. We believe this approach is novel due to the use of only secondary data and informatic-derived imputation methods and analyses. Using logistic regression to impute missing attributes in the dataset will produce a more complete dataset with sociodemographic, behavioral, and environmental attributes.  The application of geographic information system (GIS) analyses, association mining, cluster analyses, and contrast mining to this dataset could reveal valid relationships.

The term “poorly understood” is often used to describe many different aspects of diseases, ranging from etiology to outcomes. However, criteria for assigning the term to any aspect of disease have not been established. There is research on individual cancer types and sub-types that are termed “poorly understood”, but the publications do not provide objective justification for assigning the term. We believe this approach is also relatively novel due to the use of set measures for selecting poorly understood cancers.

We aim to include in the study multiple types of factors (environmental, behavioral, sociodemographic, clinical) against multiple types of poorly understood cancers as in the Environmental Public Health Tracking Network (EPHTN) of Wisconsin conducted by Hanrahan et al, 2004. The Wisconsin EPHTN was established to generate and test hypotheses for environmental causes of childhood cancers [6]. However, by using more types of factors, this proposed study can also examine interactions of the factors against cancer type(s) in all age groups.

Using data from the Missouri Cancer Registry, University of Missouri (MU) Healthcare, U.S. Census, Behavioral Risk Factor Surveillance System, and the Environmental Protection Agency, we will create datasets that have data on cancer incidence, health care records, demographics, behavioral risk factors, and environmental factors.

We will start by identifying the records of new cases of the cancers of interest in the Missouri Cancer Registry (i.e., incidence cancer cases). We will then identify if these patients also exist in the MU Healthcare electronic health records (EHR). For these matches, we will link and merge the records for the individuals, including cancer diagnosis and all available sociodemographic attributes, in both datasets as well as medications and procedure information from the MU healthcare system dataset. From the EHR dataset, we will also select un-matched patients (non-cancer patients or patients without a cancer of interest) that have similar demographic characteristics to the matched subjects. The selected patients will form control pools from which we will select our controls.

The data for the individual subjects and controls will lack values for many sociodemographic, behavioral, and environmental attributes of interest in this research but will have geographic identifiers that will be used to impute such values. Using demographic, behavioral, and environmental attributes from individuals in similar sociodemographic categories as the study cancer cases but from other datasets and the geographical identifiers available in both datasets, an imputation process will be used to ascribe values of these attributes to the study cancer cases. These geographic identifiers will be used to ascribe extrapolated and imputed values of demographic and environmental attributes to the cancer cases. We will use logistic regression for this imputation analysis. The resulting datasets will be significantly enriched for hypothesis generation analyses of the associations between cancer and potential risk factors that otherwise could not have been studied. This type of analytical approach is only hypothesis generating because of the many possible biases originating from the extrapolation and imputation processes.

We will also analyze the enriched dataset using geographic information system (GIS) analyses, association mining, cluster analyses, contrast mining, and statistical analyses. GIS analyses can determine the proximity to regulated environmental activities. Association mining will identify associations between cancer(s) and the attributes within the dataset. Cluster analysis will be used to group cancers based on similarities and might identify different cancers that have one or more common factors. Contrast mining will be used to identify differences among different cancers and cancer groups by comparing the factors associated with each. Statistical analyses will be used to model relationships within the dataset and determine the odds ratios and 95% confidence intervals for associations within the dataset.

The results of this design and analyses approach are expected to benefit prevention and control strategies for these rare cancers. Currently, the rarity of these cancers and the prohibitive costs of established epidemiological studies of cancer etiology make it infeasible for research-funding institutions to support studies of these cancers. The findings of this study and the accompanying big-data driven case-control study should help guide research agencies’ decisions to fund further investigation into specific cancers and risk factors relationships they postulate.

If progress is not made regarding cancer prevention and control, the medical cost of cancer in the U.S. could rise to $207 billion by 2020 [2]. The increasing burden of cancer will have an even greater impact on low- and middle-income countries. These countries already bear the burden of 70% of cancer deaths, are at a financial disadvantage due to the significant financial cost of cancer, and lack the resources to detect and adequately treat cancer [1, 23].

Conclusion

This study is a first step toward our overall research goal to identify possible causal risk factors for poorly understood cancers. This first step systematically identified the cancer types that are severe and trending up but for which the risk factors are poorly understood. A major limitation is the low incidence for these cancers. This low power makes it highly infeasible to study these specific cancers using cohort studies. We propose a novel approach to generate hypotheses for the associations of these poorly understood cancers with multiple risk factors. This approach circumvents historical limitations of cost and feasibility of implementation that culminated with these cancers being currently classified as poorly understood.

We propose to use current health information technology and data to develop methods to overcome the limitations of the traditional epidemiological approach and identify possible risk factors for these poorly understood cancers. A big-data driven approach to identifying risk factors maximizes the size of the study group, is more cost effective than the traditional approach, eliminates the problem of lost study subjects, and reduces the time to obtain results. We believe it is the least costly and most feasible approach to identify risk factors for poorly understood cancers.

References

  1. Cancer (2012, September 8) World Health Organization. https://www.who.int/news-room/fact-sheets/detail/cancer.
  2. Cancer costs projected to reach at least $158 billion in 2020 (2011, January 11) National Institutes of Health (NIH). https://www.nih.gov/news-events/news-releases/cancer-costs-projected-reach-least-158-billion-2020
  3. Cancer Facts & Figures 2018 | American Cancer Society. (2018) Cancer Facts & Figures 2018. https://www.cancer.org/research/cancer-facts-statistics/all-cancer-facts-figures/cancer-facts-figures-2018.html
  4. Cancer Prevention Overview (PDQ®)–Patient Version—National Cancer Institute (nciglobal,ncienterprise) (2009, June 22) [PdqCancerInfoSummary]. https://www.cancer.gov/about-cancer/causes-prevention/patient-prevention-overview-pdq
  5. CDC – Expected New Cancer Cases and Deaths in 2020 (2019, January 31). https://www.cdc.gov/cancer/dcpc/research/articles/cancer_2020.htm
  6. Hanrahan, L. P., Anderson, H. A., Busby, B., Bekkedal, M., Sieger, T., Stephenson, L., Knobeloch, L., Werner, M., Imm, P., & Olson, J (2004) Wisconsin’s Environmental Public Health Tracking Network: Information Systems Design for Childhood Cancer Surveillance. Environmental Health Perspectives 112(14), 1434–1439. https://doi.org/10.1289/ehp.7150 [crossref]
  7. History of the Cancer Prevention Studies. (n.d.). American Cancer Society. Retrieved October 7, 2019, from https://www.cancer.org/research/we-conduct-cancer-research/behavioral-and-epidemiology-research-group/history-cancer-prevention-study.html
  8. Humans, I. W. G. on the E. of C. R. to. (2010) Summary of Data Reported. In Alcohol Consumption and Ethyl Carbamate. International Agency for Research on Cancer. https://www.ncbi.nlm.nih.gov/books/NBK326555/ [crossref]
  9. Late-stage cancer detection in the USA is costing lives—The Lancet (2010, December 4). The Lancet. https://www.thelancet.com/journals/lancet/article/PIIS0140-6736(10)62195-2/fulltext
  10. Limit Alcohol Consumption. (n.d.). American Institute for Cancer Research. Retrieved October 7, 2019, from https://www.aicr.org/cancer-prevention/recommendations/limit-alcohol-consumption/
  11. Moolgavkar, S. H., Holford, T. R., Levy, D. T., Kong, C. Y., Foy, M., Clarke, L., Jeon, J., Hazelton, W. D., Meza, R., Schultz, F., McCarthy, W., Boer, R., Gorlova, O., Gazelle, G. S., Kimmel, M., McMahon, P. M., de Koning, H. J., & Feuer, E. J (2012) Impact of Reduced Tobacco Smoking on Lung Cancer Mortality in the United States During 1975–2000. JNCI Journal of the National Cancer Institute 104(7), 541–548. https://doi.org/10.1093/jnci/djs136
  12. Nelson, D. E., Jarman, D. W., Rehm, J., Greenfield, T. K., Rey, G., Kerr, W. C., Miller, P., Shield, K. D., Ye, Y., & Naimi, T. S (2013) Alcohol-Attributable Cancer Deaths and Years of Potential Life Lost in the United States. American Journal of Public Health 103(4), 641–648. https://doi.org/10.2105/AJPH.2012.301199 [crossref]
  13. Novello, A. C. (1990) Surgeon General’s report on the health benefits of smoking cessation. Public Health Reports 105(6), 545–548. [crossref]
  14. Patel, A. V., Jacobs, E. J., Dudas, D. M., Briggs, P. J., Lichtman, C. J., Bain, E. B., Stevens, V. L., McCullough, M. L., Teras, L. R., Campbell, P. T., Gaudet, M. M., Kirkland, E. G., Rittase, M. H., Joiner, N., Diver, W. R., Hildebrand, J. S., Yaw, N. C., & Gapstur, S. M (2017) The American Cancer Society’s Cancer Prevention Study 3 (CPS-3): Recruitment, study design, and baseline characteristics. Cancer 123(11), 2014–2024. https://doi.org/10.1002/cncr.30561. [crossref]
  15. Proctor, R. N (2012) The history of the discovery of the cigarette–lung cancer link: Evidentiary traditions, corporate denial, global toll. Tobacco Control 21(2), 87–91. https://doi.org/10.1136/tobaccocontrol-2011-050338.
  16. Recommendations (2017, September) U. S. Preventive Services Taskforce. https://www.uspreventiveservicestaskforce.org/uspstf/topic_search_results?topic_status=P&category%5B%5D=15&type%5B%5D=5&searchterm=cancer+screening
  17. Risk Factors: Infectious Agents – National Cancer Institute (nciglobal,ncienterprise) (2015, April 29) [CgvArticle]. https://www.cancer.gov/about-cancer/causes-prevention/risk/infectious-agents.
  18. Rothman, Kenneth J (1998a) Case-Control Studies / Kenneth J. Rothman, Sander Greenland. In Modern epidemiology / Kenneth J. Rothman, Sander Greenland ; with 15 contributors (2nd ed., pp. 93–114). Lippincott-Raven.
  19. Rothman, Kenneth J (1998b) Cohort Studies / Kenneth J. Rothman, Sander Greenland. In Modern epidemiology / Kenneth J. Rothman, Sander Greenland ; with 15 contributors (2nd ed., pp. 79–92). Lippincott-Raven.
  20. Schütze, M., Boeing, H., Pischon, T., Rehm, J., Kehoe, T., Gmel, G., Olsen, A., Tjønneland, A. M., Dahm, C. C., Overvad, K., Clavel-Chapelon, F., Boutron-Ruault, M.-C., Trichopoulou, A., Benetou, V., Zylis, D., Kaaks, R., Rohrmann, S., Palli, D., Berrino, F., … Bergmann, M. M (2011). Alcohol attributable burden of incidence of cancer in eight European countries based on results from prospective cohort study. BMJ 342. https://doi.org/10.1136/bmj.d1584.
  21. pdf. (n.d.). Retrieved June 7, 2020, from https://seer.cancer.gov/about/factsheets/SEER_Overview.pdf.
  22. Site Recode—SEER Recodes. (n.d.). Surveillance, Epidemiology, and End Results Program. Retrieved October 7, 2019, from https://seer.cancer.gov/siterecode/icdo3_dwhoheme/index.html.
  23. Torre, L. A., Siegel, R. L., Ward, E. M., & Jemal, A. (2016) Global Cancer Incidence and Mortality Rates and Trends—An Update. Cancer Epidemiology and Prevention Biomarkers 25(1), 16–27. https://doi.org/10.1158/1055-9965.EPI-15-0578 [crossref]
  24. Ultraviolet (UV) radiation and skin cancer (2017, October 16). https://www.who.int/news-room/q-a-detail/ultraviolet-(uv)-radiation-and-skin-cancer. [crossref]
  25. What Are the Risk Factors for Lung Cancer? | CDC (2019, November 18). https://www.cdc.gov/cancer/lung/basic_info/risk_factors.htm
  26. WHO | Cancer prevention (2019) WHO; World Health Organization. http://www.who.int/cancer/prevention/en/
  27. Why is early diagnosis important? (2015, April 2) Cancer Research UK. https://www.cancerresearchuk.org/about-cancer/cancer-symptoms/why-is-early-diagnosis-important
  28. Worldwide cancer statistics (2019). Cancer Research UK. https://www.cancerresearchuk.org/health-professional/cancer-statistics/worldwide-cancer

Utilization of Co-evaporation Technique for Enhancement the Solubility and Dissolution Rate of Etodolac

DOI: 10.31038/JPPR.2021422

Abstract

Etodolac (ETD), a member of non-steroidal anti-inflammatory drugs (NSAIDs), has a poor aqueous solubility. Long term administration of ETD causes severe gastrointestinal disturbances such as peptic ulcer and bleeding. The enhancement of its solubility and dissolution profile is expected to improve its bioavailability and reduce its side effects. In the present study, we tried to enhance the aqueous solubility and dissolution rate of ETD by two co-evaporation techniques. The first one is the formation of solid dispersion with different hydrophilic carriers, including polyethelene glycol (PEG 4000), polyvinyl pyrrolidones (PVP K25 and PVP K90) and urea. The second method is the formation of solid adsorbates using inert carriers such as avecil PH 101, bentonite and aerosil 200 as adsorbents. Co-evaporates were prepared at (1:1 w/w), (1:3 w/w) and (1:5 w/w) ETD to carrier ratios and the corresponding physical mixtures were also prepared. The solubility and dissolution studies of all formulations were measured. Moreover, the physicochemical properties of the modified co-evaporates were characterized using different techniques including, differential scanning calorimetry (DSC), infrared spectroscopy and X-ray diffractometry (XRD) analysis. The results showed that the co-evaporates exhibited higher dissolution rate than the corresponding physical mixtures and both showed higher dissolution rate than the unmodified drug. Increase polymer concentration led to increase in the dissolution rate of drug. Plus, the dissolution rate was enhanced by increasing the temperature of the dissolution medium. Avecil PH 101 exhibited the highest dissolution rate over all other polymers. Infrared studies showed no interaction between the drug and the investigated carrier. The DSC and XRD studies indicated the conversion of ETD to an amorphous state. The enhancement of the drug solubility may be attributed to the increase of drug surface area, the wettability, formation of hydrogen bonds and the conversion to amorphous state.

Keywords

Etodolac, Co-evaporate, Solubility, Dissolution rate, Solid dispersion, Adsorbate, Hydrophilic carriers

Introduction

Rheumatoid arthritis is a chronic and systemic inflammatory disorder that primarily affects joints [1]. Such disease could be revealed by using one of the non-steroidal anti-inflammatory drugs (NSAIDs) which are considered as a classical treatment for such rheumatic disorders. Etodolac is a non-steroidal anti-inflammatory drug (NSAID) with anti-inflammatory, analgesic and antipyretic properties. The mechanism of action of such drug based on its ability to inhibit prostaglandin biosynthesis. It is indicated for the relief of signs and symptoms of rheumatoid arthritis and osteoarthritis [2]. Etodolac appears to be associated with a higher incidence of adverse effects, mainly irritation to the stomach, compared to other NSAIDs. Therefore, this issue limits its use for the treatment of patients for whom other NSAIDs have been ineffective [3]. According to the Biopharmaceutical Classification System (BCS), ETD belongs to class II drugs which are characterized by low solubility (69 mg/L) and high permeability. Therefore, there is an urgent need for the enhancement of ETD solubility and dissolution profile, which ultimately lead to a significant reduction of gastric residence time after oral administration. Consequently, this will be very useful for both the reduction of drug side effects to the stomach and improvement of its bioavailability [4,5]. There are several techniques utilized for improving the aqueous solubility and dissolution rate of poorly water soluble drugs such as inclusion complexation [6], micronization [7], recrystallization [8], co-melting [9], co-grinding [10], lyophilization [11] and co-evaporation techniques including solid dispersion [12] and surface adsorption [13]. Especially, the co-evaporation technique using different hydrophilic polymers (solid dispersion) or inert adsorbents (adsorbates) has attracted a considerable interest as an efficient mean for improving the dissolution rate and hence the bioavailability of wide range of poorly water soluble drugs without changing the parent drug. Once the solid co-evaporate was exposed to aqueous media, the drug was released as very fine colloidal particles [14]. The solubility enhancement of drug was related to different reasons, including the improvement of drug surface area, wettability and porosity as well as the reduction of its crystallinity [15,16]. Regarding solid dispersion, there are several types of hydrophilic carriers that could be used in the preparation of solid dispersion systems such as polyethylene glycols (PEGs) [17], polyvinyl pyrollidones (PVPs) [18], cellulose derivatives [19], urea [20], sugars (lactose, mannitol and sorbitol) [21] and organic acids such as citric acid [22-24]. Alternatively, several insoluble inert carriershave been used for drugs deposition (surface adsorption), including disintegerants [25], microcrystalline cellulose (Avicel) [26], colloidal silicon dioxide (Aerosil 200) [27], porous calcium silicates (Florite R) [28], magnesium aluminum silicate (kaolin) [29] and colloidal hydrated aluminum silicate (Bentonite) [30]. Solid co-evaporates of ETD with different excipients can be characterized by different physicochemical methods such as powder x-ray diffraction analysis (XRD), IR spectroscopy, ultraviolet spectrophotometry [15] and thermal analysis such as the differential scanning calorimetry (DSC), thermo mechanical analysis (TMA), hot stage microscopy (HSM) and thermogravimetry (TG). PEGs and PVPs are the most commonly used carriers due to their excellent water solubility and a wide range of molecular weights, ranging from 200 Da to 300,000 Da in case of PEGs and from 2,500 Da to 3,000,000 Da in case of PVPs [31]. The main purpose of the present work was to increase the aqueous solubility of ETD using solid co-evaporation technique. Two different methods were utilized or preparation of drug co-evaporates. The first one is solid dispersion method using PEG 4000, PVP k25, PVP k90 and urea as hydrophilic carriers. On the other hand, the second technique based on the preparation of ETD co-adsorbates with Avicel PH 101, Aerosil 200 and Bentonite as inert carriers. Also, the effect of drug/polymer ratio was studied by preparing different drug to polymer ratios. The enhancement of the dissolution rate was evaluated using in vitro dissolution studies. Moreover, the effects of these excipients on the physicochemical properties of drug were studied by different analytical methods such as IR, DSC and XRD patterns which used to investigate drug/carrier interactions and their effect on the dissolution rate of the drug.

Materials and Methods

Materials

Polyethylene glycol 4000 (PEG 4000) and polyvinyl pyrolidones (PVP K25 and PVP k90) were purchased from Fluka Bio Chemika (Switzerland). Urea was obtained from Chemajet Co. (Alexandria, Egypt). Microcrystalline cellulose (Avicel PH 101), Colloidal silicon dioxide (Aerosil 200) were obtained from Sigma Aldrich (Degussa Frankfurt, Germany). Bentonite was purchased from Nile Co. for Pharmaceutical and Chemical Industry (Cairo, Egypt). Etodolac was obtained by Pharco Pharmaceutical Co. (Alexandria, Egypt). Methanol and ethanol were purchased from El-Nasr Pharm. Chem. Co., (Cairo Egypt).

Phase Solubility Studies

The solubility of ETD was examined in distilled water, at different polymer concentrations (2.5-10% w/v)according to the method previously reported by Higuchi and Connors [32]. The selected hydrophilic polymers were PEG 4000, PVP K25, PVP K90 and urea. An excess amount of ETD (20 mg) was added to 20 ml stoppered glass tubes containing 10 ml of carrier solutions. The tubes were sonicated for 1 hr then transferred to a water bath previously adjusted at required temperatures 25°C and 37°C ± 1. Aliquots were withdrawn after 48 hours (equilibrium time), then filtered through a 0.45 µm membrane filter, and the filtrate was assayed spectrophotometrically at λ max 280 nm. The results are the mean values of three determinations ± standard deviation.

Preparation of Etodolac Co-evaporates

Co-evaporate of ETD with the selected hydrophilic carriers (PEG 4000, PVP K25, PVP K90 and urea) or solid inert carriers (Avicel PH 101, Aerosil 200 and Bentonite)were prepared at (1:1), (1:3) and (1:5) drug: carrier ratios using solvent evaporation technique. The calculated amount of each carrier was added to the ethanolic solution of ETD to give the desired drug/carrier ratios and the mixture was stirred for 30 minutes. The solvent was allowed to evaporate at room temperature and the residue was kept for 24 h in a desiccator containing anhydrous calcium chloride at room temperature. The resultant solid co-evaporate was scraped out, crushed and passed through sieve No. 60 (250 μm pore size) before packing in a tightly closed container [33]. The fraction of particle size range (125-250) µm was collected and used in the experimental studies.

Preparation of Physical Mixtures

Physical mixtures of ETD and the investigated carriers corresponding to co-evaporate were prepared by simple mixing using mortar and pestle.

Characterization of the Prepared Etodolac Co-evaporate Systems

Measurement of Drug Content. Known amounts of the prepared mixtures were dissolved in ethanol and then the drug concentration was evaluated spectrophotometrically at 280 nm. The drug content was calculated for each sample by using the following formula [34]:

% 𝒐𝒇 𝒅𝒓𝒖𝒈 𝒄𝒐𝒏𝒕𝒆𝒏𝒕 = 𝑨𝒄𝒕𝒖𝒂𝒍 𝒂𝒎𝒐𝒖𝒏𝒕 𝒐𝒇 𝒕𝒉𝒆 𝒅𝒓𝒖𝒈 𝒊𝒏 𝒕𝒉𝒆 𝒇𝒐𝒓𝒎𝒖𝒍𝒂/𝑻𝒉𝒆𝒓𝒐𝒕𝒊𝒄𝒂𝒍 𝒂𝒎𝒐𝒖𝒏𝒕 𝒐𝒇 𝒕𝒉𝒆 𝒅𝒓𝒖𝒈 𝒊𝒏 𝒕𝒉𝒆 𝒇𝒐𝒓𝒎𝒖𝒍𝒂 𝑿 𝟏𝟎𝟎

In vitro Dissolution Studies

Dissolution studies were carried out in triplicate using 6 paddles Hanson dissolution tester (Hanson Research Co., USA) for co-evaporates, physical mixtures and unmodified ETD. The dissolution test was performed at 37±0.5°C using the paddle method at 50 rpm. Experiments were run with certain USP modifications, whereby samples equivalent to 20 mg of ETD were placed in the dissolution medium (500 ml distilled water). The dissolution profiles were constructed from samples of 5 ml withdrawn after different time intervals and immediately followed by addition of an equal volume of fresh dissolution medium maintained at same temperature, to keep the volume of dissolution media constant [35]. The withdrawn samples were filtered through a membrane filter (0.45 µm), and the corresponding concentrations of ETD were analyzed spectrophotometrically at 280 nm. All results are the average of three measurements ± SD.

Differential Ultraviolet Absorption Study

This study was carried out in order to indicate the presence of any interference which may be raised from the investigated carriers on the maximum absorbance of the drug in the used dilution range [36]. So, A 1% solution of each polymer in distilled water was scanned in the presence and absence of the drug using distilled water as a blank.

Infrared Spectroscopy (IR)

The IR spectra of pure drug, carriers, physical mixtures and different prepared system with different carriers were measured using Shimadzu IR-476 spectrophotometer (Japan) at a range of 4000-400 cm-1 using KBr disk method. The samples were mixed with KBr and compressed into discs using IR compression machine [37].

Differential Scanning Calorimetry (DSC)

DSC analysis was performed using Shimadzu-Thermal analyzer DSC-T50 (Japan) calibrated with indium. The temperature range for the thermogram was 30 to 200°C, and the samples were heated at rate of 10°C/min [38]. Thermal analysis was carried out using TA 50 PC system with Shimadzu software program.

X-ray Diffraction (XRD) Studies

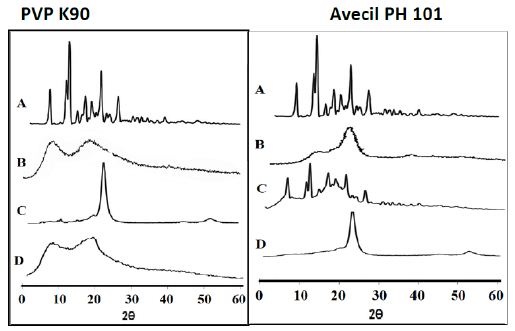
The powder X-Ray diffraction measurement was carried out using Philips PW1710 X-Ray diffractometer, USA. Typically, the investigated samples were irradiated by mono-chromatised Cu-Kα radiation with copper X-ray source (λ = 1.5406 Å) at 40 mA and 40 KV. Then, the obtained XRD patterns were collected over the 2θ range of 4-60° at a scan rate of 0.06°/sec [38].

Results and Discussion

Solubility Studies

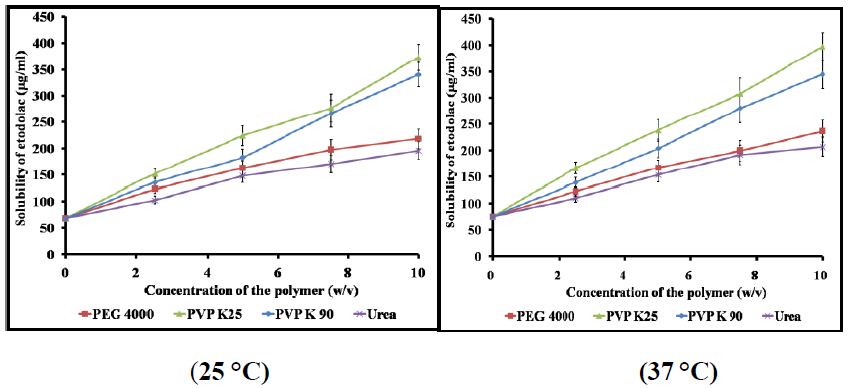
With an aqueous solubility of 69 mg/L (at 25°C), ETD is clearly considered as a poor water soluble drug. The results showed that the apparent solubility of ETD increased with the increaseof either temperature or carrier concentration. At the highest concentration (10% w/v), PVP K25 exhibited the highest value of solubilized drug [397.4 mg/l (5.8-fold)]. While as, urea showed a 3-fold increase in the solubility among the other investigated carriers at 37°C. The increase in ETD solubility by the investigated carriers was ranked in the following descending order: PVP K25 > PVP K90 > PEG 4000 > Urea (Figure 1).

fig 1

Figure 1: Aqueous solubility of ETD in the presence of different concentrations of the selected hydrophilic carriers at 25°C and 37°C.

Characterization of the Prepared ETD Solid Co-evaporate Systems

Differential Ultraviolet Absorption Study. It was found that the carriers used in this study showed no absorbance at the specified λ max of the drug (280 nm). By other words, the scanning of the drug in the presence of different carriers revealed that there is no change in neither the peak positions nor absorbance values of the drug, indication that there is no interference in measurement upon using such polymers.

Drug Content Measurement

The drug content for all the prepared systems was estimated using the following equation [39]; Conc. = Abs. x P.C x d.f (Where P.C is the procedural constant and d.f is the dilution factor). The obtained results showed that all the formulations were found to have drug contents in the range of 95.1-104.8% which are considered for further experiments.

In vitro Dissolution Studies

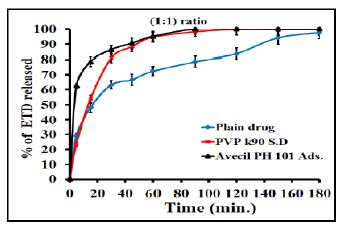
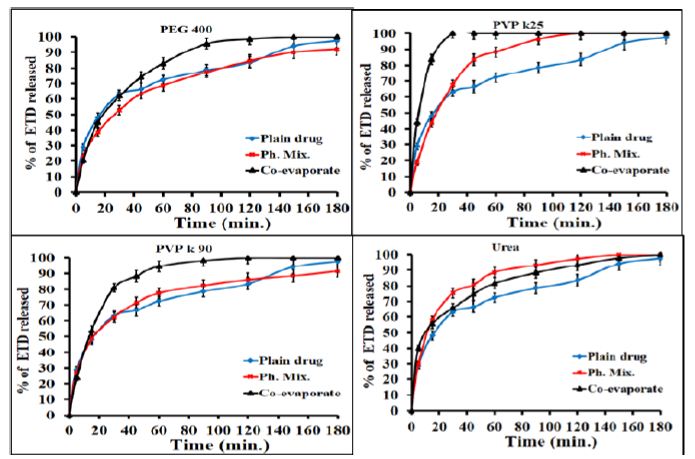
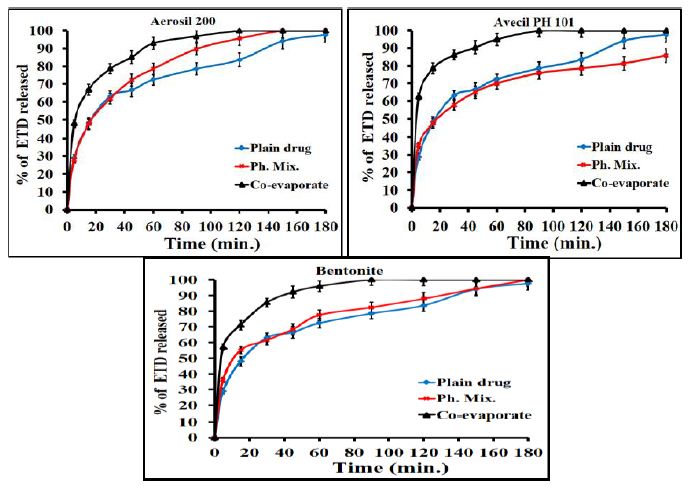
Generally, the rate of dissolution of pure ETD is very low when compared with that of the prepared systems and the rate of dissolution of ETD varied with the nature of the carrier used. More specifically, the results, illustrated in Figure 2, showed that co-evaporate of ETD/polymer exhibited a higher dissolution rate than the corresponding physical mixture at the same drug polymer ratio. Collectively, it could be concluded that the dissolution rate of ETD from either its co-evaporates or physical mixtures was arranged in a descending order as follows: (PVP K90 < PEG 4000 < PVP K25 < urea). The observed increase in the dissolution of ETD from different solid co-evaporates, compared to unmodified drug, could be attributed to improved wettability, dispersability, local solubilization, drug particles size reduction or formation of high energy amorphous phase [40]. Similarly, the adsorbates showed higher dissolution rate than the corresponding physical mixtures and the unmodified drug as illustrated in Figure 3.

fig 2

Figure 2: Dissolution profiles of ETD co-evaporates and physical mixture with PEG 4000, PVP K25, PVP K90 and urea at (1:1) w/v drug/polymer ratio.

fig 3

Figure 3: Dissolution profiles of ETD adsorbate (co-evaporates) and physical mixture with Avecil PH101 and aerosil 200 and bentonite at (1:1) w/v drug/carrier ratio.

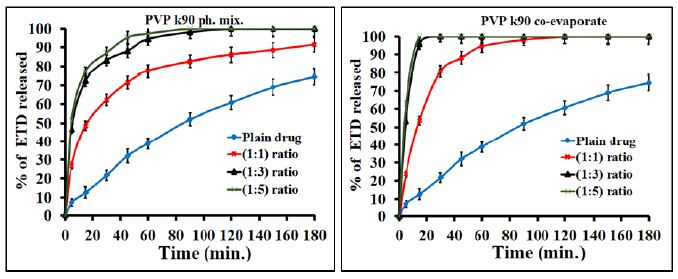
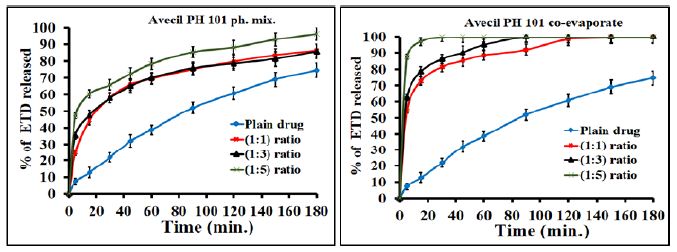
The effect of polymeric ratio on drug dissolution was studied and illustrated in figure. The results showed that the increase of polymer concentration led to an increase in the dissolution rate of drug since the effect is very clear in the case of co-evaporates compared to the physical mixtures. For example PVP K90 at (1:1), (1:3) and (1:5) w/w ratios exhibited faster dissolution of about 53.8%, 95.8% and 100%, respectively after 15 minutes as compared with 12.6% of pure drug (Figure 4). Regarding the adsorbate, illustrated in Figure 5, Avecil PH 101 showed dissolution rate of about 72.7, 78.5 and 100% after 15 min. corresponding to the ratios (1:1), (1:3) and (1:5) w/w ratios. In addition, the results, illustrated in Figure 6, showed that the dissolution rate of drug adsorbate with avecil PH 101 at (1:1) ratio was higher than that of drug PVP K90 solid dispersion at the same ratio.

fig 4

Figure 4: Dissolution profiles of ETD co-evaporates and physical mixture with PEG PVP K90 as a function of polymer concentration.

fig 5

Figure 5: Dissolution profiles of ETD adsorbate (co-evaporates) and physical mixture with Avecil 101 as a function of polymer concentration.

fig 6

Figure 6: Dissolution profiles of ETD co-evaporates with PVP k90 (solid dispersion) and Avecil 101 (adsorbate) at (1:1) w/v drug/carrier ratio.

Regarding the effect of temperature on the drug solubility, the results indicated that the increase of temperature led to increase of the drug solubility (Table 1). The obtained results may be attributed to that the increase of temperature led to decrease of the intermolecular forces.

Table 1: Solubility of etodolac in the presence of different concentrations of the selected hydrophilic carriers at 25°C and 37°C.


Carrier conc. (%w/v)

Solubility of etodolac (µg/ml)

PEG 4000

PVP K25 PVP K90

Urea

25°C 37°C 25°C 37°C 25°C 37°C 25°C

37°C

 0

68.97 ± 4.3 75.96 ± 2.5 68.97 ± 4.3 75.96 ± 2.5 68.97 ± 4.3 75.96 ± 2.5 68.97 ± 4.3 75.96 ± 2.5
2.5 123.58 ± 3.7 122.75 ± 3.4 151.52 ± 3.7 166.22 ± 5.5 135.79 ± 3.7 138.9 ± 3.9 103.29 ± 4.3 110.12 ± 2.6

 5

162.5 ± 4.6 166.64 ± 3.9 223.97 ± 3.8 238.46 ± 5.6 182.16 ± 4.5 203.27 ± 3.2 147.38 ± 5.4 153.8 ± 4.3
7.5 197.48 ± 6.3 199.13 ± 4.8 276.55 ± 4.1 308.02 ± 6.4 266.2 ± 4.7 280.28 ± 4.1 170.15 ± 3.9

191.27 ± 4.5

 10

218.18 ± 5.8 236.39 ± 4.9 373.01 ± 5.3 397.44 ± 7.4 340.31 ± 5.2 344.66 ± 4.8 195.82 ± 6.2

207 ± 4.9

IR Spectroscopy

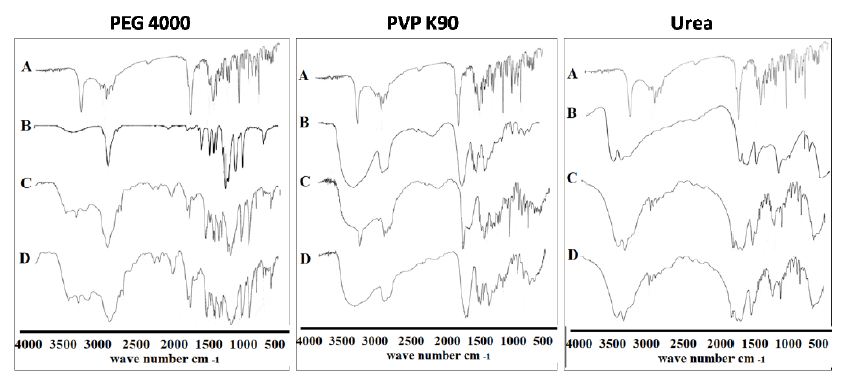
The IR spectra were recorded to illustrate the possible interaction between the drug and the selected carriers in the solid state. The IR spectrum of the drug, illustrated in Figures 7 and 8, band A, showed characteristic bands at wave number 1746 cm-1 which is corresponding to (C=O) stretching vibration of the carboxylic group, 3344 cm-1 due to single -NH stretching vibration of amine group and 2971 cm-1 for C-H stretching. Moreover, ETD which is present as ether form showed other characteristic bands corresponding to the C–O stretching vibration at 1034 cm-1. These data are in a good accordance with those reported previously [41-43]. Especially the two bands of (C=O) and (-NH) stretching will be highlighted in the present study in order to determine the possibility of interaction of ETD with the selected carriers. Also, the results showed no significant difference in the positions of the absorption bands indicating no marked chemical interaction between ETD and the tested polymer in the solid co-evaporate at the selected drug to polymer ratios. However, the spectra of PVP K25 and PVP K90 solid co-evaporates showed marked shifting of C-H stretching band from 2971 cm–1 for plain drug to 2954 cm–1. Furthermore, an intensive broad band was observed at 3417 cm-1 and 3428 cm–1 for PVP K25 and PVP K90 solid co-evaporates, respectively, which may be attributed to the presence of moisture in the PVP molecule [44] (Figure 7, band B). The most important finding, regarding IR spectra of PVPs co-evaporate, is the complete disappearance of carbonyl group (C=O) absorption band. This result was attributed to the existence of higher polymer concentration (1:3 for PVP K25 and 1:5 for PVP K90) which leads to overlapping of a broad peak of the polymer on the carbonyl group of ETD which present at the same region (Figure 7, band D).

fig 7

Figure 7: The IR absorption spectra of ETD co-evaporate and physical mixture with different hydrophilic carriers where: (A) Plain drug, (B) Hydrophilic carrier, (C) Physical mixture and (D) Co-evaporate.

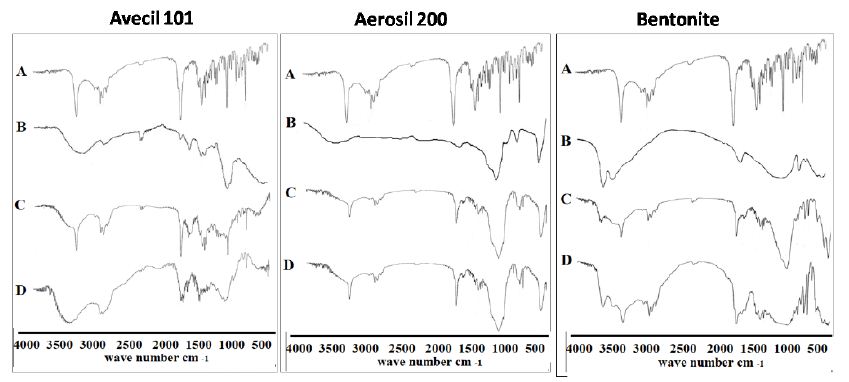
Similarly, the IR spectra of ETD adsorbate systems with different adsorbents were illustrated in Figure 8. The IR apectra of Avicel PH 101 showed major broad peak at 3409 cm−1, corresponding to (-OH) stretching (Figure 8, trace B). The spectra of physical mixtures should, ideally, be equivalent to the addition spectrum of drug and adsorbent (Figure 8, trace C). In the case of ETD/Avicel PH 101 adsorbate spectra, the bands corresponding to (C=O) stretching and (-NH) stretching of the drug are disappeared (Figure 8, trace D). This may be due to hydrogen bonding between these functional groups of drug and the hydroxyl groups of Avicel PH 101 [45]. This finding, also, indicates the adsorption of the drug molecules on the surface of Avicel PH 101 which has high adsorption capacity due to its large surface area. With respect to the IR absorption spectra of ETD/Aerosil 200 systems in (1:1) ratio, the presence of a broad prominent peak at 1107 cm-1 corresponding to strong (Si-O) linkage is characteristic to Aerosil 200. The characteristic peaks of the drug in both adsorbate and physical mixture are still present at the same position as plain drug but with an apparent reduction in the intensity, confirming the absence of any suspected interaction between the drug and Aerosil 200. Regarding the IR absorption spectrum of ETD/Bentonite system which is characterized by complete absence of infrared absorption bands of bentonite due to its inorganic nature (aluminum phyllosilicate), the drug bands are still present at the same position but with low intensity.

fig 8

Figure 8: The IR absorption spectra of ETD adsorbate and physical mixture with different adsorbents where: (A) Plain drug, (B) Hydrophilic carrier, (C) Physical mixture and (D) Co-evaporate.

Differential Scanning Calorimetry (DSC)

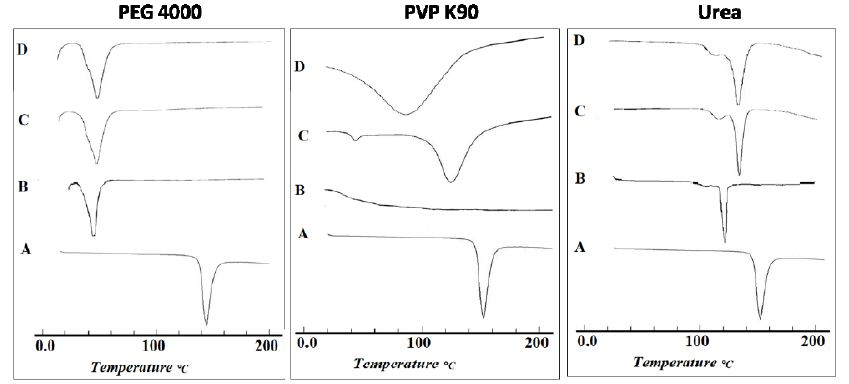
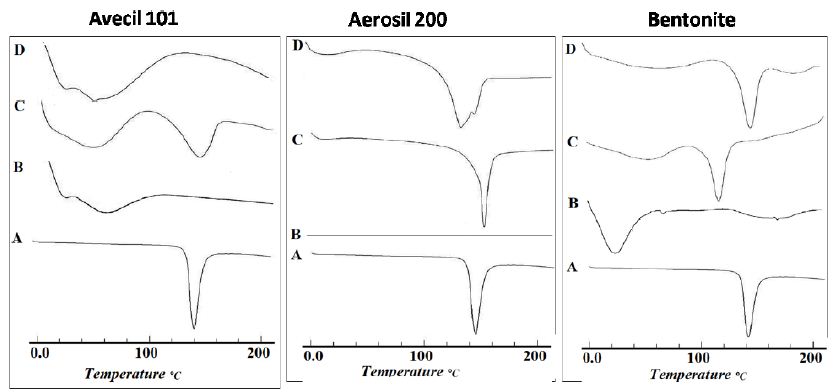
The DSC thermograms of the drug before and after modification were illustrated in Figure 9. Regarding the untreated drug (Figure 9, band A), the results showed an endothermic peak at 152.3°C, corresponding to the melting point of the drug. The observed sharp melting endotherm confirms the crystallinity of the drug [43]. Also, PEG 4000 showed a single endothermic peak at 58.2°C, corresponding to its melting point (Figure 9, band B). On the other hand, physical mixture (Figure 9, band C) and solid co-evaporate (Figure 9, band D) of ETD with PEG 4000, showed complete disappearance of endothermic peak of the drug and the appearance of new endothermic peaks at both 58.9°C and 61.3°C for solid co-evaporate and physical mixture, respectively. The disappearance of ETD peak in case of physical mixture could be explained on the basis that the drug was dissolved in the molten polymer [46]. However, the complete disappearance of the endothermic peak of the ETD in its solid co-evaporate with PEG 4000 may be, also, attributed to the formation of the amorphous form of the drug [47]. Regarding to DSC thermogram of ETD/PVPs system, it was clear that PVP band showed a shallow, broad endothermic peak ranging from 80 to 120°C due to the presence of residual moisture contents in PVP which is in agreement with the previously obtained results [48]. Physical mixture of ETD/PVPs showed a marked reduction of the drug which is accompanied with a partial shift to lower melting points, 125.9°C in the case of PVP K25 and 102.9°C in the case of PVP K90. This result indicated that the drug still present in crystalline form, however the lower melting point may indicate a formation of different crystalline polymorph at higher temperature. On the other hand, solid co-evaporate of ETD binary systems with both PVP K25 and PVP K90 showed the complete disappearance of drug characteristic endothermic peak and, only, the characteristic peak of the polymer still present. This finding indicated the conversion of the drug to amorphous state. The obtained results and interpretations were in a good accordance with those obtained previously [44,48,49]. Also, Figure 9 showed the DSC thermograms of ETD solid co-evaporate and physical mixture with urea. The characteristic peak of ETD is still present but shifted to a lower temperature, 131.7°C and 132.5°C for solid co-evaporate and physical mixture, respectively. This finding may be attributed to the existence of crystalline nature of urea and its higher melting point 134°C which is in agreement with the previously obtained finding [50]. Regarding the DSC thermograms of ETD adsorbate systems with different adsorbents, Figure 9 illustrated the thermograms of drug/Avicel PH 101 in (1:1) ratio adsorbate, physical mixture and the individual components. The DSC of Avicel PH 101 exhibited a shallow broad endothermic peak at about 85 ℃, which might correspond to the volatilization of adsorbed water [45]. In case of ETD/Avicel PH 101 adsorbate, the melting endothermic peak of the drug was completely disappeared indicating transformation of the drug to amorphous state. On the other hand, thermogram of the corresponding physical mixture revealed the crystallinity of the drug. Regarding to DSC of pure Aerosil 200, it did not show any peaks in the thermogram proving that this adsorbent was almost in an amorphous state. Also, it was clear that the endothermic peak of the drug still presents in both physical mixture and loaded adsorbate. These results indicate a weak or no interaction between drug and adsorbent. Finally, DSC thermograms of ETD/Bentonite (1:1) ratio prepared systems and individual components were illustrated, also, in Figure 10. The endothermic peak of the drug still present in both physical mixture and adsorbate with the apparent shifting to the lower melting temperature in the case of physical mixture.

fig 9

Figure 9: DSC thermograms of ETD co-evaporate with different hydrophilic carriers where: (A) Plain drug, (B) Hydrophilic carrier, (C) Physical mixture and (D) Co-evaporate.

fig 10

Figure 10: DSC thermograms of ETD adsorbate and physical mixture with different adsorbents where: (A) Plain drug, (B) Hydrophilic carrier, (C) Physical mixture and (D) Co-evaporate.

X-ray Diffraction Analysis (XRD)

In an attempt to get further evidence on the solid state changes, x-ray diffraction spectra were carried out on drug alone, carrier alone, ETD/carrier binary systems (co-evaporates and corresponding physical mixtures) which was illustrated in Figure 11. The results showed the presence of numerous distinct peaks in the x-ray diffraction spectrum of ETD at diffraction angles of 2θ at 9.16°, 13.6°, 14.38°, 18.58°, 22.9° and 27.28° with relative intensities of 44, 54, 100, 35, 65 and 30, respectively, indicating the crystalline nature of the drug (Figure 11, band A). In contrast, the X-ray diffraction spectrum of PVP K90 showed no diffraction peaks, indicating the existence of the polymer in an amorphous state. The XRD pattern of ETD/PVP K90 physical mixture showed the absence of some diffraction peaks of pure drug, indicating the partial crystallinity of ETD in physical mixture. This finding may be attributed to the dilution factor of high polymer ratio (Figure 11, and C). On the other hand, no diffraction peak was observed in the case of the corresponding solid co-evaporate indicating the complete conversion of ETD to amorphous form (Figure 11, and D). The obtained results and interpretations were in a good agreement with the previously reported data [44]. Similar results were obtained in the case of ETD Avicel-PH 101. The X-ray diffraction spectrum of Avicel showed no diffraction peaks, indicating the existence of the carrier in an amorphous state (band B). The characteristic peaks of ETD are clearly noticed in physical mixture of ETD and Avicel PH 101 indicating the crystallinity of the drug in the physical mixture (band C). The phase transformation of crystalline ETD to the amorphous form in the case of adsorbate system with Avicel PH 101 (band D) was explained by adsorption of the drug within the pores of the carrier matrix. Adsorption may take place via Vander Waals forces or through formation of hydrogen bonds between the (-NH) or (=CO) groups of the drug and (-OH) group of the carrier as confirmed by IR results [51].

fig 11

Figure 11: The x-ray powder diffraction patterns of ETD co-evaporate with PVP K90 and Avecil PH 101 where: (A) Plain drug, (B) Hydrophilic carrier, (C) Physical mixture and (D) Co-evaporate.

Conclusion

The solid dispersion and adsorbates of ETD were prepared by co-evaporation method and characterized by IR, DSC and X-ray. The solubility of ETD was enhanced markedly in the presence of different investigated polymers since PVPk90 and Avicel PH 101 exhibited the highest effect. Generally, all co-evaporates showed higher dissolution rate than the corresponding physical mixtures. However, both co-evaporate and physical mixtures exhibited higher dissolution rates than the unmodified ETD. The increase in polymer concentration led to an increase in the drug dissolution rate. The enhancement of drug solubility and dissolution rate was attributed to the reduction of the particle size, enhanced wettability and the conversion of drug from crystalline form to amorphous one as proved by XRD and DSC analysis.

Declaration of Interest

The authors report no conflicts of interest in this work.

References

  1. Guo Q, Qiang G, Yuxiang W, Dan Xu, Johannes N, Nathan J, et al., (2018) Rheumatoid arthritis: pathological mechanisms and modern pharmacologic therapies. Bone Research 6: 1-14.
  2. Pareek, A, Nitin Chandurkar,Tenpe SR, Yeole PG (2014) research article Evaluation of anti-inflammatory activity of etodolac and colchicine combination in experimental animals. International Journal of Clinical Pharmacology and Therapeutics.
  3. Harirforoosh S, W Asghar, F Jamali (2013) Adverse effects of nonsteroidal antiinflammatory drugs: an update of gastrointestinal, cardiovascular and renal complications. Journal of Pharmacy & Pharmaceutical Sciences 16: 821-847.
  4. Khaleel NY, et al., (2011) Solubility and dissolution improvement of Ketoprofen by solid dispersion in polymer and surfactant using solvent evaporation method. International Journal of Pharmacy and Pharmaceutical Sciences 3: 431-435.
  5. Buckley ST, Kerstin JF, Gert F, Martin B, et al., (2013) Biopharmaceutical classification of poorly soluble drugs with respect to “enabling formulations”. European Journal of Pharmaceutical Sciences 50: 8-16. [crossref]
  6. Chaudhary V, Patel J (2013) Cyclodextrin inclusion complex to enhance solubility of poorly water soluble drugs: A review. International Journal of Pharmaceutical Sciences and Research 4.
  7. Rasenack N, Müller BW (2002) Dissolution rate enhancement by in situ micronization of poorly water-soluble drugs. Pharmaceutical Research 19: 1894-1900. [crossref]
  8. Chiou WL, Chen SJ, Athanikar N (1976) Enhancement of dissolution rates of poorly water‐soluble drugs by crystallization in aqueous surfactant solutions I: Sulfathiazole, prednisone, and chloramphenicol. Journal of Pharmaceutical Sciences 65: 1702-1704. [crossref]
  9. Otsuka M, Ofusa T, Matsuda Y (1998) Dissolution improvement of water-insoluble glybuzole by co-grinding and co-melting with surfactants and their physicochemical properties. Colloids and Surfaces B: Biointerfaces. 10: 217-226.
  10. Rascioni R (2016) Effect of particle size reduction and crystalline form on dissolution behaviour of nimesulide. Journal of Thermal Analysis and Calorimetry 123: 2213-2223.
  11. Dhore PW, Vivek SD, Suprit DS, Yamini SB, Connor Mack, et al. (2017) Enhancement of the aqueous solubility and permeability of a poorly water soluble drug ritonavir via lyophilized milk-based solid dispersions. Pharmaceutical Development and Technology. 22: 90-102. [crossref]
  12. Chokshi RJ, Hossein Z, Harpreet KS, Navnit HS, Waseem AM et al., (2007) Improving the dissolution rate of poorly water soluble drug by solid dispersion and solid solution—pros and cons. Drug Delivery 14: 33-45. [crossref]
  13. Friedrich H, Bernd F, Karl K, Roland B et al., (2006) Dissolution rate improvement of poorly water-soluble drugs obtained by adsorbing solutions of drugs in hydrophilic solvents onto high surface area carriers. European Journal of Pharmaceutics and Biopharmaceutics 62: 171-177. [crossref]
  14. Sharma D (2016) Solubility enhancement strategies for poorly water-soluble drugs in solid dispersions: A review. Asian Journal of Pharmaceutics (AJP): Free full text articles from Asian J Pharm 1.
  15. Das SK, Abha Doshi, Bhagyashri Joshi, Vandana Wankhede, Jesal Doshi, et al., (2012) Solid dispersions: an approach to enhance the bioavailability of poorly water-soluble drugs. International Journal of Pharmacology and Pharmaceutical Technology. 1: 37-46.
  16. Zayed G (2014) Dissolution Rate Enhancement of Ketoprofen by Surface Solid Dispersion with Colloidal Silicon Dioxide. Unique J. Pharm. and Bio. Sci 1: 33-38.
  17. Biswal S, J Sahoo, PN Murthy, RP Giradkar, JG Avari (2008) Enhancement of dissolution rate of gliclazide using solid dispersions with polyethylene glycol 6000. AAPS PharmSciTech 9: 563-570. [crossref]
  18. Balata G, M Mahdi, Rania AB (2011) Bakera, Improvement of solubility and dissolution properties of clotrimazole by solid dispersions and inclusion complexes. Indian Journal of Pharmaceutical Sciences. 73. [crossref]
  19. Xie T, L.S. Taylor (2016) Improved release of celecoxib from high drug loading amorphous solid dispersions formulated with polyacrylic acid and cellulose derivatives. Molecular Pharmaceutics 13: 873-884.
  20. Kuharski RA, Rossky PJ (1984) Solvation of hydrophobic species in aqueous urea solution: a molecular dynamics study. Journal of the American Chemical Society. 106: 5794-5800.
  21. Saha R, et al., (2002) Solubility enhancement of nimesulide and ibuprofen by solid dispersion technique. Indian Journal of Pharmaceutical Sciences 64.
  22. Lima,ÁA, et al. (2011) The use of solid dispersion systems in hydrophilic carriers to increase benznidazole solubility. Journal of Pharmaceutical Sciences 100: 2443-2451.
  23. Thenmozhi K, Yoo YJ (2017) Enhanced solubility of piperine using hydrophilic carrier-based potent solid dispersion systems. Drug Development and Industrial Pharmacy 43: 1501-1509. [crossref]
  24. Waghmare A, Pore Y, Kuchekar B (2008), Development and characterization of zaleplon solid dispersion systems: a technical note. Aaps Pharmscitech 9: 536-543.
  25. Law S, Chiang C (1990) Improving Dissolution Rates of Griseofulivin by Deposition on Disintegrants. Drug Development and Industrial Pharmacy. 16: 137-147.
  26. Ismail A, K Saleh, S Khalaf (2004) Preparation and evaluation of naproxen adsorbate as an attempt to improve drug dissolution characteristics. Drugs 9.
  27. Chella N, N Shastri, RR Tadikonda (2012) Use of the liquisolid compact technique for improvement of the dissolution rate of valsartan. Acta Pharmaceutica Sinica B 2: 502-508.
  28. Qian KK, RH Bogner (2012) Application of mesoporous silicon dioxide and silicate in oral amorphous drug delivery systems. Journal of Pharmaceutical Sciences 101: 444-463.
  29. Srikanth M et al., (2013) Dissolution rate enhancement of bicalutamide by adsorption process. African Journal of Pharmacy and Pharmacology 7: 1357-1362.
  30. Putra, E.K., Ramon P, Jaka S, Nani I, Suryadi I et al., (2009) Performance of activated carbon and bentonite for adsorption of amoxicillin from wastewater: Mechanisms, isotherms and kinetics. Water Research 43: 2419-2430.
  31. Leuner C, Dressman J (2000) Improving drug solubility for oral delivery using solid dispersions. European Journal of Pharmaceutics and Biopharmaceutics 50: 47-60. [crossref]
  32. Higuchi T, Connors K (1965) Phase solubility diagram. Adv. Anal. Chem. Instrum,. 4: p. 117-212.
  33. S Singh , RS Baghel, L Yadav, (2011) A review on solid dispersion. International Journal of Pharmacy & Life Sciences 2.
  34. Sharma A, Jain C (2010) Preparation and characterization of solid dispersions of carvedilol with PVP K30. Research in Pharmaceutical Sciences 5.
  35. Kumar SGV, Mishra DN (2006) Preparation, characterization and in vitro dissolution studies of solid dispersion of Meloxicam with PEG 60001. Yakugaku Zasshi 126: 657-664.
  36. Everaerts M, Van den Mooter G (2019) Complex amorphous solid dispersions based on poly (2-hydroxyethyl methacrylate): Study of drug release from a hydrophilic insoluble polymeric carrier in the presence and absence of a porosity increasing agent. International Journal of Pharmaceutics 566: 77-88.
  37. Ibrahim M, et al., (2010) Formulation and evaluation of ketorolac tromethamine-Eudragit solid dispersions of potential sustained-release properties. STP Pharma Pratiques 20.
  38. Ismail , El-Mahdy M, Al-Kubati S (2009) Enhancement of solubility and dissolution of nimesulide using solubilization, solid dispersion and complexation techniques. Bulletin of Pharmaceutical Sciences. Assiut 32: 321-338.
  39. Swinehart D (1962) The beer-lambert law. Journal of Chemical Education 39.
  40. Bobe K, Cr Subrahmanya, Sarasija Suresh, Dinanath Gaikwad, et al., (2011) Formulation and evaluation of solid dispersion of Atorvatstatin with various carriers. Int J Comp Pharm 1: 1-6.
  41. Dwivedi A, Misra N (2010) Quantum chemical study of Etodolac (Lodine). Der Pharma Chemica,. 2: 58-65.
  42. Al-Shammary F, Mian N, Mian M (1992) Analytical Profiles of Drug Substances and Excipients. Ed. Brittain HG Academic Press Inc. USA,.
  43. Abdelbary A, et al., (2013) Influence of Various Polymers on the Improvement of Etodolac Solubility and Dissolution Rate via. Solid Dispersion Technique. Inventi Impact: Pharm Tech.
  44. Ismail S, El-Mahdy M, Al-Kubati S (2009) Enhancement of solubility and dissolution of nimesulide using solubilization, solid dispersion and complexation techniques. Pharm. Sci 32: 321-338.
  45. Ambike AA, Mahadik K, Paradkar A (2005) Spray-dried amorphous solid dispersions of simvastatin, a low T g drug: in vitro and in vivo evaluations. Pharmaceutical Research 22: 990-998.
  46. Moseson DE, Andrew SP, Christopher JG, Andrew AS, Stephen PB et al., (2019) Dissolution of indomethacin crystals into a polymer melt: Role of diffusion and fragmentation. Crystal Growth & Design 19: 3315-3328.
  47. Patil MP, Gaikwad NJ (2009) Preparation and characterization of gliclazide-polyethylene glycol 4000 solid dispersions. Acta Pharmaceutica 59: 57-65.
  48. Wu K, Jing L, Wayne W, Denita AW (2009) Formation and characterization of solid dispersions of piroxicam and polyvinylpyrrolidone using spray drying and precipitation with compressed antisolvent. Journal of Pharmaceutical Sciences 98: 2422-2431. [crossref]
  49. Yoshioka M, Hancock BC, Zografi G (1995) Inhibition of indomethacin crystallization in poly (vinylpyrrolidone) coprecipitates. Journal of Pharmaceutical Sciences 84: 983-986. [crossref]
  50. Chiou WL, Niazi S (1971) Phase diagram and dissolution‐rate studies on sulfathiazole‐urea solid dispersions. Journal of Pharmaceutical Sciences 60: 1333-1338. [crossref]
  51. Li Y, Huishi P, Zhefei G, Ling L, Yixuan D, et al., (2014) Interactions between drugs and polymers influencing hot melt extrusion. Journal of Pharmacy and Pharmacology 66: 148-166. [crossref]

Defining Science in the Minds of Generation Z

DOI: 10.31038/PSYJ.2021331

Introduction

An up-and-coming new group of young adults collectively referred to as Generation Z is beginning to enter the workforce and have the opportunity to pave the future of science evolution. This paper presents a study using the methodology of Mind Genomics to understand what science means to Generation Z, from both a personal and global perspective. This study was performed in the context of the American public being inundated with scientific content. Seeking to filter through the noise, we explored the mindsets of members of Generation Z regarding what science is, what science does, and what sources of science are trustworthy. Understanding how to best channel Generation Z perspectives on scientific information will enable anyone working with this cohort to be more informed about their views of science. Additionally, it can help Generation Z situate themselves in relation to scientific perspectives and put them in a position to be the catalyst for change.

The Mind Genomics Process

Mind Genomics is an empirical method for understanding the dimensions of ordinary, everyday experiences, by identifying mindsets into which people can be classified, based on their responses to information and messages. First, we create a survey on a given topic, in this case Science, which consists of 16 statements or elements pertaining to the topic. The 16 statements are categorized into one of four silos, each encompassing four statements. Each silo is in the form of a question designed to stimulate critical thinking for the researcher. The silos also prevent similar elements from being shown together in the same vignette. A vignette is a quickly digestible story consisting of two, three, or four elements. In total, the respondent will see twenty-four vignettes, or twenty-four unique groupings of these sixteen statements, which the respondent rates as if they are flashed on the screen. By design, there is very little thinking time, which makes it more of a gut-level response. The rating for each of the twenty-four responses can be captured using a five-point, seven-point, or nine-point Likert scale. For this particular study, the 5-point Likert scale chosen entails:

5 – Precisely what my idea of what science IS

4 – Sort of my idea of what science IS

3 – Can’t really tell

2 – Sort of my idea of what science is NOT

1 – Precisely my idea of what science is NOT

Following this rating, the Likert scale is converted into a binary scale where 1-3 becomes a 0, and 4 & 5 are converted into 100. In the event that the researcher is seeking insights related to disinterest, the Likert to binary scale is re-coded where 4 & 5 are converted to 0 and 1, 2, and 3 are converted to 100. After this respondent rating conversion, an ordinary least squares linear regression analysis is performed, where the independent variables are the 16 statements ranging from A1-D4 and the dependent variables are the binary scale ratings received from the respondent. This statistical calculation results in various regression coefficients, which inform the researcher of two to three unique mindsets amongst the respondents, in this case all coming from Generation Z, and which messages drive interest or disinterest. In order to classify new respondents into the identified mindsets, there is also an option of creating a new study called The Personal Viewpoint Identifier, comprising six survey questions (based on the top 2 elements in each mindset). In summary, the Mind Genomics process is an experimental approach integrating sociology, psychology, and statistics and enabling researchers to determine how to tailor messages most effectively (gathering information about what to say, how to say it, and to whom to say it).

Constructing the Current Study

In categorizing the 16 elements, the four silos include:

Silo A: What does science do for me?

Silo B: What does science do for the world? Silo C: Where does science come from?

Silo D: Who provides science in your community?

Results

The results of this Mind Genomics study have provided insightful data regarding three mindsets as show in Figure 1 below.

fig 1

Figure 1: Data of Mind Genomics study

Analysis of Figure 1

Mindset One: Global Change Seekers

The first mindset places the importance of science on a high pedestal from both a personal and global perspective. From a personal standpoint, there lies a near even balance between science being within or beyond one’s control. When science is perceived as falling within one’s control, an optimistic and resilient viewpoint of a brighter future awaits. Forming this future does not occur on the sideline. Rather, they may want to be involved in scientific discovery used to improve the world. To further such discovery, mindset one is determined to advance innovation in the fields of technology, healthcare, and the environment. In this respect, they are convinced that science improves the world, and they are seekers of change. In some cases, they may feel science falls outside their control. Science being out of one’s control can hold true regardless of valiant efforts. For example, COVID-19 has put us in a position of uncertainty where we can do our part and control the spread of COVID-19 by getting a vaccine, wearing a mask, and social distancing. However, we unfortunately cannot control the behaviors of others to do the same. In this respect, science can be out of our control. Mindset one is also less trusting of scientific information that is brought to them, regardless of the source. They seem conflicted about their own ability to engage in science, which probably has something to do with their distrust of other people as sources of scientific information. Overall, they seem to like science for what it can do for our world, but they feel separated from the process.

Mindset Two: The Followers of Science

Mindset two is less interested in what science is and what it can accomplish than in how scientific information is received. For these individuals, it is important to identify what mechanisms trigger trust and belief, and from which sources the science is being communicated. Similar to previously described silos, the science can come from a global perspective by following sources of origin such as subject matter experts, scientific organizations, university publications, and mainstream media/pop culture.

Alternatively, the science can come from a more personal and local perspective by listening to members within one’s community. This includes examples related to trusting family/friends, medical professionals, politicians, and educators. For this particular mindset, Generation Z are likely to be the most impacted by what they hear from people within their community rather than engaging on where scientific material is coming from. They tend to trust the medical community most but are generally trusting of personal connections, policymakers, and educators, as well. Understanding that trust forms on a local scale allows one to imagine that members of mindset two are believers in what science can do for the community. This thought process is an excellent segue into mindset three.

Mindset Three: Local Change Seekers and Followers

Mindset three shares the reliance on gathering information from trusted members within their community. While they do trust educators and policymakers, personal connections are most trusted. Alongside trusting people closest to them, they are also believers in what science can do for the community. However, rather than watching and believing the impact science will have on their community, they are engaging as change-seekers in ways similar to the description of mindset one. These change-seekers operate on a smaller scale in comparison to mindset one, focusing on a grassroot initiative of improving science within their community. Since this initiative is on a smaller scale, science is perceived as being more within their control and less beyond their control, in comparison to the global efforts portrayed in mindset one. Overall, this group feels connected to science as a process in which they can engage and through which they can discover how to make improvements. With engagement in believing and seeking scientific change, mindset three is a combination of mindset one and two.

What is Science to Generation Z

Despite each segment carrying a distinct perception towards Science, there is a key commonality in the additive constant amongst all mindsets. Referring to the metric scale below, the additive constant for each mindset falls within the range of 41-60. This indicates that in the absence of any elements the meaning of Science only has a typical base interest to Generation Z. Science can attract higher interests upon introducing elements that have a regression coefficient of 8 and above. These elements explain a story whereby science is the future in terms of how we listen to it and/or act upon it.

Norms for the additive constant:

0-20: Little Base Interest

21-40: Modest Base Interest

41-60: Typical Base Interest

61-80: High Base Interest

81+: Very High Base Interest

COVID-19 Severe Pneumonia in Mexico City – First Experience in a Mexican Hospital

DOI: 10.31038/IDT.2021213

Abstract

Mexico has been widely affected by COVID-19. There are no data describing the epidemiology and treatment of this disease in Mexican population. We conducted a retrospective cohort study of patients with severe or critical COVID-19 pneumonia hospitalized at a third-level care private hospital in Mexico City, from March 13th to April 13th, 2020. A total of 33 hospitalized patients were included, twenty-one patients with severe and 12 with critical COVID-19 pneumonia. The mean age was 60.6 years and 23 (70%) were males. Twenty-three patients (70%) were overweight or obese. All patients in the critical pneumonia group (12/33, 36%) required mechanical ventilation. The extubation rate was high (92%) and the mortality was low (3%). This is the first case series reported from a middle-income country where only one patient died despite the high prevalence of variables associated with worse prognosis such as obesity and/or chronic medical conditions.

Keywords

COVID-19; Coronavirus; Hospital epidemiology

Introduction

In December 2019, an outbreak of atypical pneumonia was reported in Wuhan, China. Soon after, a novel coronavirus was identified and named severe acute respiratory syndrome coronavirus 2 (SARS-CoV-2) while the disease itself has been worldwide recognised as coronavirus disease 2019 (COVID-19) [1]. As the pandemic evolves, having accurate local and international information has become remarkably important. In the first weeks after the description of cases, the flow of information arose mainly from China and Europe but it rapidly evolved to a World pandemic. While there is no available epidemiological information from Mexico, some characteristics of the Mexican population, such as the Hispanic background and the high rates of obesity, may provide additional valuable information. Both obesity and Hispanic race have been recognised as risk factors for COVID’s pneumonia bad outcome [2]. Herein, we described the first case series of hospitalised COVID-19 patients in Mexico City, with special focus on treatment and prognosis.

Methods

Setting and Study Population

We conducted a retrospective cohort study of hospitalised patients with severe or critical COVID-19 pneumonia admitted to the American British Cowdray (ABC) Medical Center in Mexico from 13 March to 13 April 2020.All patients were admitted to the Intensive Care Unit (ICU) or the high-dependency unit. The ABC Medical Center is a tertiary-level care private hospital in Mexico City with 124 beds, of which 40 correspond to the ICU and high dependency unit. From the beginning of the pandemic, our hospital has been devoted exclusively to the care of COVID-19 patients. The ABC Medical Center has two campuses in Mexico City, the authorities from our hospital decided to convert one campus to COVID-19 only and let one campus free of COVID-19. This decision was made in order to continue providing regular medical care to our patients in a COVID-19 free hospital. In our hospital, only severe and critical pneumonia COVID-19 patients were hospitalised. Critical cases were admitted to the ICU and severe cases to the high dependency unit. Adults were classified, depending on their clinical presentation, in severe or critical pneumonia [3]. We did not have any pregnant women or children admitted with COVID-19 pneumonia.

Data Sources

We obtained demographic, clinical, laboratory and radiologic data at admission and during the patients’ hospitalisation from the electronic health record. The laboratory data and information on the treatment given were collected for all patients up to the time of the data cut, which occurred on 19 April 2020. Data were anonymised before analysis. Informed consent was waived by the ethics committee because all the information in the present work is anonymized. The institutional ethics and research committee approved the protocol (ABC-20-12).

Study Definitions

A confirmed case of COVID-19 was defined by a positive result on a reverse transcriptase–polymerase chain reaction (RT-PCR) assay of a specimen collected on a nasopharyngeal swab or a patient presenting with clinical and radiological signs compatible with COVID-19 despite at least two consecutive negative SARS-CoV-2 RT-PCR determinations. Overweight and obesity were defined by the body mass index (BMI), according to World Health Organization, where overweight is considered a BMI greater than or equal to 25 and Obesity a BMI greater than or equal to 30. We divided patients into two groups according to the Chinese Clinical Guidance for COVID-19 Pneumonia Diagnosis and Treatment [3]:

  1. Severe disease was defined as patients presenting with dyspnoea, a respiratory rate of more than 30/min, peripheral capillary oxygen saturation (SpO2) of 90% breathing ambient air and/or a PaO2/Fio2 ratio less than 231 (in agreement with the Mexico City altitude);
  2. Critical disease was defined as severe pneumonia with respiratory failure requiring invasive mechanical ventilation, shock and/or other organ dysfunctions requiring admission to the intensive care unit (ICU). Patients with critical COVID-19 pneumonia had acute respiratory distress syndrome [4].

Specimen Collection and Testing

Clinical specimens for SARS-CoV-2 diagnostic testing were obtained in accordance with the Center for Disease Control and Prevention guidelines. Different kits targeted the SARS-CoV-2 E-gene and the RdRP gene, including the RN easy Mini Kit (Qiagen), and the Light Cycler II Z480 (Roche®) with Light Mix Modular detection system (TIB Molbiol, Roche) targeted the CoV E-gene, the CoV N-gene and the CoV RdRP gene were employed [5]. Upon hospital admission, routine laboratory tests were performed: complete blood count, and chemistry including electrolytes, liver function tests, C-reactive protein, procalcitonin as well as cardiac enzymes, D-Dimer, ferritin and IL-6 levels. Other tests performed at initial evaluation included: Influenza a virus detection by PCR and respiratory pathogen panel by multiplex PCR. If the patient had a productive cough a sputum sample was sent for bacterial and fungal culture. Regarding imaging studies, a chest CT scan was performed in all but one patient. We could not take a CT scan of this particular patient because it was unsafe to transfer due to hemodynamic instability. Laboratory blood analyses were repeated daily or at physician’s discretion. Chest X ray and EKG were done on a daily basis. All patients who required invasive mechanical ventilation had at least one bronchial aspirate for microbiological analysis, including bacterial and fungal culture as well as galactomannan.

Antiviral, Anti-inflammatory and Antibiotic Treatment

Treatment was chosen at the attending physician’s discretion. Antiviral drugs included one or more of the following options: Lopinavir/ritonavir, hydroxychloroquine, interferon beta-1b and azithromycin. Afterwards, and only for analysis purposes, the patients were classified according to the medications received into the following groups:

  1. Lopinavir/ritonavir (LPV/r) 400 mg/100 mg twice daily (BID) for 7 days + Interferon beta-1b (IFNb-1b) 0.25 mg every 48 h for 3 to 7 doses + Azithromycin (AZI) 500 mg initial dose and 250 mg daily for 5 days.
  2. LPV/r 400 mg/100 mg (BID) for 7 days + IFNb-1b 0.25 mg every 48 h for 3 to 7 doses + AZI 500 mg initial dose and then 250 mg daily for 5 days + Hydroxychloroquine (HCQ) loading dose of 400 mg BID and then 200 mg BID for 5 to 10 days.
  3. LPV/r 400 mg/100 mg BID for 7 days + AZI 500 mg initial dose and then 250 mg daily for 5 days + HCQ loading dose of 400 mg BID and then 200 mg BID for 5 to 10 days.
  4. AZI 500 mg initial dose and then 250 mg daily for 5 days + HCQ loading dose of 400 mg BID and then 200 mg 3 times a day (TID) for 5 to 10 days.

Before starting antiviral treatment, an EKG was routinely performed and repeated on a daily basis or more often if the patient was under treatment with a drug known to prolong the QT interval. Tocilizumab was used as an anti-inflammatory agent in those patients who fulfilled the following criteria: Patient with severe pneumonia and high interleukin-6 (IL-6) level (defined as a that greater of 40 pg/ml) as well as radiologic progression of pulmonary infiltrates or progressive respiratory failure or persistent elevation of C-reactive protein, D-Dimer or ferritin levels. Tocilizumab could be added to the antiviral treatment and the dose consisted of an IV dose of 400 mg in patients weighted below 75 kg or 600 mg if weight was above 75 kg) above. A second and final dose could be given according to clinical response (fever), oxygen needs and C-reactive protein level. Before the tocilizumab infusion was administered, patients had a complete assessment to discard active non-viral infection with serum procalcitonin, as well as, blood, respiratory and urine cultures. Also, several blood analyses were performed, such as HIV test, viral hepatitis panel and QuantiFERON-TB Gold. Patients could also receive antibiotics at their physician’s discretion, this was most commonly ceftriaxone. All the patients or patients’ relatives gave their informed consent for the compassionate use of antiviral drugs and tocilizumab.

Anticoagulation and Thromboprophylaxis

All patients were treated with enoxaparin as thromboprophylaxis at a 1 mg/kg once a day. If the patient had radiological evidence of pulmonary embolism or a D-dimer level above 3000 ng/ml, enoxaparin was given at a 1 mg/kg twice daily. This guideline was made by a consensus of our group as many other centers recommend therapeutic-intensity anticoagulation in critically ill COVID-19 patients.

Mechanical Ventilation

We adhered to the Berlin definitions regarding the severity of respiratory failure, and if clinical situation required it, alternatives modalities were implemented, including the prone position [6].

Statistical Analysis

We used descriptive statistics expressed as numbers (percentages) for categorical variables. Continuous variables were expressed as mean and standard deviation (SD) or median with interquartile range (IQR) values in accordance with their distribution. The Student’s t-test or the Mann-Whitney tests were performed to compare the differences between the continuous variables according to their distribution. The Kolmogorov–Smirnov test was used as evidence of normality. Significant differences between categorical variables were evaluated using the Chi-square test. The ANOVA test was used to evaluate the differences between different treatment schemes and the length of stay. A p-value less than 0.05 was considered statistically significant. All statistical analyses were performed using SPSS version 22.0 (IBM Corp., Armonk, NY, USA).

Results

Patient Characteristics

We included all patients that were admitted to the COVID ward in the month following the first admission, which was on March 12th, 2020. All of them had severe or critical pneumonia. The clinical characteristics upon hospital arrival are depicted in Table 1. A total of 21 patients were classified in the severe pneumonia group (SPG) and 12 met criteria for the critical pneumonia group (CPG) during their hospitalisation. Most (87.9%) of the patients had at least one positive nasopharyngeal RT-PCR for SARS-CoV2, whereas 4 patients had a negative RT-PCR though they had classical radiological and clinical characteristics for COVID-19 pneumonia.

Table 1: Clinical characteristics of the patients at admission and treatment given.


Severe Pneumonia

n = 21

Critical Pneumonia

n = 12

p

Mean age

57.6 ± 13.2

65.8 ± 9.2

NS

Sex – n (%)

Male

Female


14 (66.7)

7 (33.3)


9 (75)

3 (25)


NS

Mean body mass index

26.3 ± 3.4

30.1 ± 6.1

< 0.05

SARS-CoV2 positive RT-PCR

n (%)


18 (85.7)


11 (91.7)


NS

Symptoms – n (%)

Fever

Cough

Diarrhoea

Headache

Malaise


16 (76.2)

13 (61.9)

5 (23.8)

8 (38.1)

18 (85.7)


9 (75)

8 (66.7)

3 (25)

6 (50)

10 (83.3)


NS

NS

NS

NS

NS

Median respiratory rate (IQR)

22 (20–23)

22 (20–27)

NS

Mean PaO2/FiO2 ratio

207 ± 25.1

137 ± 76.5

NS

Comorbidities – n (%)

Any

Overweight or Obesity

Smoking

Hypertension

ACE or ARB treatment

Diabetes mellitus

Cardiopathy

COPD

Immunosuppression


12 (57.1)

11 (52.4)

7 (33.3)

5 (23.8)

3 (14.3)

4 (19)

2 (9.5)

3 (14.3)

1 (4.7)


11 (91.7)

11 (91.7)

6 (50)

7 (58.3)

6 (50)

4 (33.3)

1 (8.3)

2 (16.7)

1 (50)


< 0.05

< 0.05

NS

< 0.05

< 0.05

NS

NS

NS

NS

Mean duration of symptoms before admission – days (SD)

7.6 ± (4.3)

6.3 ± (1.9)

NS

Treatment* – n (%)

LPV/r + IFNb-1b + AZI

LPV/r + IFNb-1b +HCQ + AZI

LPV/r + HCQ + AZI

HCQ + AZI

Tocilizumab in addition to previous treatment


2 (9.5)

6 (28.6)

4 (19)

9 (42.9)

7 (33.3)


2 (16.7)

3 (25)

5 (41.7)

2 (16.7)

10 (83.3)


NS

NS

NS

NS

< 0.05

IQR: interquartile range, NS: not statistically significant, PaO2/FiO2:, RT-PCR: reverse transcriptase–polymerase chain reaction.
*LPV/r: Lopinavir/ritonavir, IFNb 1b: Interferon beta-1b, HCQ: Hydroxychloroquine, AZi: Azithromycin.

Overall, the patients’ mean age was 60.6 years (SD 12.68 years), and 23 (70%) were males. The median duration of symptoms before admission was 7 (IQR 5–8) days. The most common symptoms were general malaise, (84.8%) followed by fever (75.8%) cough, (63.6%) headache (42.4%) and (24.2%) diarrhoea. In a sub-group analysis for those who were RT-PCR negative, we found that diarrhoea was more common in this group compared to those with a positive RT-PCR (75% vs. 17.2%, p<0.01). One patient presented with rhabdomyolysis that was managed with aggressive fluid resuscitation. Twenty-three (70%) patients had at least one comorbidity. Thirteen (39.3%) patients were current smokers. Twenty-three (70%) patients were overweight or obese. Twelve (35.3%) patients had hypertension, and only 9 (27%) were being treated with ACE or ARB drugs.

We found a higher BMI in the CPG compared to the SPG (26.3 ± 3.4 vs. 30.1 ± 6.1, p<0.05). Also, a greater proportion of patients in the CPG had comorbidities compared to those in the SPG (91.7% vs. 57.1%, p<0.05). Interestingly, hypertension and ACE or ARB treatment were also more common in the CPG. At admission, patients in the SPG had a higher PaO2/FiO2 ratio (207 ± 25.12 vs. 137 ± 76.45) compared to those in the CPG, though this difference was not significant. Of the 33 patients, thirty-one were also tested for influenza A/B by PCR or had a multiplex PCR panel for respiratory pathogens. Two patients were co-infected with influenza A and one with rhinovirus. All patients were started on antiviral treatment within the first 24 hours after admission once the diagnosis of COVID-19 pneumonia was confirmed. There were multiple combinations of antiviral therapy that are summarized as follows: four patients were treated with lopinavir/ritonavir and interferon beta-1b, and nine patients received this combination plus hydroxychloroquine. Another nine patients were prescribed lopinavir/r and hydroxychloroquine, and eleven patients were treated with hydroxychloroquine monotherapy. All the patients were on azithromycin. There was no difference between the treatment options and the length of stay.

Tocilizumab was given to 17 (51.5%) patients: 10 (83.3%) patients in the CPG and 7 (33.3%) in the SPG. On average, patients received tocilizumab 3.3 ± 2.2 days after admission. All patients did not have chronic viral hepatitis or HIV. All patients received enoxaparin for thromboprophylaxis.

Laboratory and Radiologic Findings

Laboratory and radiologic findings upon patients’ arrival to the hospital are shown on Table 2. Troponin I and procalcitonin were significantly higher in CPG than in the SPG. Also, ferritin, lactic dehydrogenase and IL-6 levels were more elevated in CPG, however these differences were not statistically significant. All the patients had bilateral infiltrates in the computed tomography scan (CT-scan). Eleven (52.4%) patients with severe pneumonia had bilateral ground-glass infiltrates, while 9 (75%) patients with critical pneumonia had bilateral mixed infiltrates (alveolar occupation and ground-glass infiltrates).

Table 2: Laboratory data at hospital admission and radiology findings.


Severe Pneumonia Patients n = 21

Critical Pneumonia Patients n = 12

p

White blood cell per mm3

Median (IQR)


4.8 (4–8.1)


6.7 (4.5-12.6)


NS

Lymphocyte count per mm3

Mean (SD)


0.99 (0.49)


1.17 (0.62)


NS

Creatinine mg/dL
Median (SD)
 

0.98 (0.39)


1.21 (0.46)


NS

Ferritin mg/dL
Median (IQR)
 

930 (407-1528)


1341 (398-2692)


NS

Lactic dehydrogenase mg/dL Mean (SD)  

260.7 (96.4)


340.9 (122.2)


NS

D-Dimer mg/dL
Mean (SD)
 

802.4 (451.2)


939.9 (407.2)


NS

Troponin I mg/dL
Median (IQR)
 

5 (3.5-9.1)


17.3 (7-29.3)


< 0.05

IL-6 mg/dL
Median (IQR)
 

47.4 (21.6-92.3)


173 (46-231)


NS

C-reactive protein mg/dL Mean (SD)

8.38 (7.82)

13.34 (9.53)

NS

Procalcitonin mg/dL

Mean (SD)


0.08 (0.04-0.15)


0.2 (0.1-1.91)


< 0.05

CT findings – n (%)

Bilateral ground-glass opacification

Bilateral alveolar infiltrates

Bilateral mixed infiltrates (ground-glass and alveolar)


11 (52.4)

1 (4.8)

9 (42.9)


1 (8.3)

2 (16.7)

9 (75)


< 0.05


CT: computed tomography, IL6: interleukin-6, IQR: interquartile range, NS: not statistically significant, SD: standard deviation.

Critical Pneumonia Group

Twelve patients had critical pneumonia, 8/12 (66.6%) patients had critical pneumonia or developed it in the first 48 hours after admission and4/12 (33.3%) 48 hours after admission. All the critical patients required mechanical invasive ventilation. All the patients had at least one session of 16 hours of prone position in order to improve their PaO2/FiO2.The median duration of the mechanical ventilation was 12 ± 2.6 days. All the patients were extubated except one who required a tracheostomy. The patient who could not be extubated had previous chronic obstructive pulmonary disease (COPD). Among the 12 patients who had critical pneumonia, 10 (83.3%) received tocilizumab.

Complications

We only documented two drug-related adverse reactions. One patient in the CPG stopped lopinavir/ritonavir on the fifth day because of a considerable increase in bilirubin (total bilirubin 6.6 mg/dl, direct bilirubin 4.5 mg/dl) with normal alkaline phosphatase. After discontinuation, the bilirubin went back to normal within 3 days. Another patient in the CPG stopped azithromycin because of atrial fibrillation and a prolonged QT interval (468 mseg). Three patients developed ventilator-associated pneumonia with extended spectrum beta-lactamase Escherichia coli, non MDR Pseudomonas aeruginosa and Stenotrophomonas maltophilia. The deceased patient had Stenotrophomonas maltophilia infection. One patient developed invasive pulmonary aspergillosis, diagnosed by a positive galactomannan in bronchoalveolar lavage (BAL). This last patient with pulmonary aspergillosis, had a positive tuberculosis culture on BAL reported four weeks after being discharged. All the patients with bacterial or fungal positive cultures had received tocilizumab. Two patients developed subsegmental pulmonary emboli despite low-molecular-weight heparin thromboprophylaxis. One of them in each group. Two patients required re-intubation, one because of life-threatening abdominal bleeding that required vascular surgery and the other one because of complete right lung atelectasis. Both patients were extubated in the next 72 hours after the bleeding and atelectasis resolved.

Outcomes

Table 3 depicts the major outcomes of our cases. All patients were followed up until hospital discharge or death. The median length of stay was 7 days (4.5-8.5) for the SPG and 25 days (22-33) for the CPG. All the patients in the SPG and 11 (91.6%) patients in the CPG were discharged. Among the 12 patients who required invasive mechanical ventilation, only one died (8.3%). The deceased patient was in his seventies, and suffered from hypertension, diabetes mellitus and moderate COPD. This patient required mechanical ventilation 48 hours after admission and was admitted after five days of illness. We were unable to progress mechanical ventilation, so he required a tracheostomy. The patient died 54 days after admission due to acute myocardial infarction and sepsis, in his late days he had ventilator-associated pneumonia due to Stenotrophomonas maltophilia.

Table 3: Outcomes

Characteristics

Severe Pneumonia Patients n = 21

Critical Pneumonia Patients n = 12

p

Patients that progressed to critical pneumonia after 48 hours of admission n (%)

4 (33.3)

Maximum oxygen support during the hospital stay n (%)

Low-flow oxygen by nasal cannula and/or face tent

High-flow nasal cannula

Non-invasive positive pressure ventilation

Invasive mechanical ventilation


19 (90.5)

2 (9.5)

0 (0)

0 (0)


12 (100)


Median length of stay – days (IQR)

7 (4.5-8.5)

25 (22-33)

< 0.05

Vasopressor support (norepinephrine and/or vasopressin) – n (%)

0 (0)

10 (83)

< 0.05

Duration of mechanical ventilation in patients who were extubated Mean (IQR) – days

12 (9-15)

NS

Extubated – n/total number (%)

11/12 (91.6)

NS

Discharged from hospital – n (%)

25 (100)

7 (91.6)

NS

Died in hospital – n (%)

0 (0)

 1 (8.3)

NS

IQR: interquartile range, NS: not statistically significant, SD: standard deviation.

Discussion

This single-centre experience describes the epidemiology, treatment and outcome of 33 patients with severe or critical COVID-19 pneumonia admitted to the ICU and the high dependency unit during the first month at the beginning of the COVID-19 epidemics in Mexico. We found that most of our patients were overweight or obese males and had at least one comorbidity, similar to other reports [1,7]. Patients who required invasive mechanical ventilation had a high extubation rate despite a prolonged time of mechanical ventilation. Unexpectedly, we found a lower mortality rate (3%) compared to other series of patients with severe and critical COVID-19 pneumonia. In our cohort, four patients (12%) were RT-PCR negative for SARS-CoV-2, this finding is in agreement with previous reports that have shown that false-negative rate of oropharyngeal RT-PCR range from 10-40%. RT-PCR sensitivity depends on several factors as days since the symptoms started, site of specimen collection and viral load [8]. We did not take any sample from BAL to perform RT-PCR because of the aerosolization risk and because initially those patients were not under mechanical ventilation. So, we could not compare the positivity from upper and lower respiratory tract samples.

The critical group had a higher prevalence of hypertension compared to the severe group, also a higher proportion of patients were under ACE or ARB treatment. This finding has previously been proposed as a risk factor to develop COVID-19 pneumonia, though there is little evidence to support this hypothesis [9,10]. Obesity and metabolic syndrome are chronic inflammatory diseases that make patients more prone to infectious complications and are known increase the mortality of COVID-19 [11]. In our case series, all but one of the patients in the critical group had overweight or were obese, and those in the critical group had a higher BMI compared to those in the severe group. The mean BMI in both groups was higher than those reported previously by Liu et al. [12]. This is an expected finding, since the prevalence of overweight and obesity in Mexico is one of the highest in the World, with 75.2% of the adult population living with a BMI above 25 [13]. The pathophysiology underlying the more severe clinical picture of COVID-19 in obese patients is linked to a chronic inflammatory and prothrombotic state, higher ACE2 concentrations in the alveolar epithelium plus a compromised pulmonary physiology [14]. Moreover, adipose tissue has been known to be a reservoir for some viruses, such as HIV and CMV, but its role as a tissue reservoir of SARS-CoV-2 remains to be studied [15]. Fever and cough were the most common presenting symptoms with a mean duration of 7 days before hospital admission, as previously reported in other series [16]. Patients in the critical group had a lower PaO2/FiO2 ratio at admission, but this difference was not statistically significant because some patients in the critical group had higher PaO2/FiO2 ratio at admission and later progressed to the critical phase. This is a well-known marker of serious respiratory illness [17].

We found that ferritin and lactic dehydrogenase levels tend to be higher at baseline in patients with critical pneumonia at admission. As described in Chinese and Italian reports, higher ferritin and lactic dehydrogenase levels at admission were also significantly associated with critical pneumonia [18,19]. Moreover, we found a higher IL-6 concentration in patients with critical pneumonia. This finding has previously been reported by Chen X et al. [20]. Also, Interleukin-6 has recently been proposed as an early predictor of respiratory failure in COVID-19 patients [21]. It is important to mention that the CPG had a significantly higher troponin I (cTnI) level at admission compared to the SPG. This finding has been described more commonly in sicker patients with an intense inflammatory response and it has been recognized as a biomarker to identify possible myocardial damage [22]. All of our patients were treated with different drug regimens with potential antiviral activity against SARS-CoV2. The medication was started within 24 hours of admission and around one week of symptom onset. Remarkably, tocilizumab was given to a half of our patient. The rationale for such a decision was based on observational data implicating the overwhelming systemic inflammatory cascade as a culprit in the physiopathology of this new and poorly understood disease and the plausible role for immunomodulation in these populations [23,24]. Regrettably, we did not find any effect of the administration of tocilizumab in the length of hospitalization and other outcome variables (data not shown). A recent report from Wadud N et al. described lower mortality in patients who received tocilizumab, and also a longer hospital stay compared to those who did not receive anti IL-6 therapy [25]. This, like in our experience, can probably be explained by the fact that critical patients who required mechanical ventilation are sicker and take longer time to recover. Currently, there are several ongoing clinical trials that will hopefully give us more answers regarding the role of tocilizumab in severe COVID-19. Nowadays, only a cohort study has reported the possible positive effect of this therapy [26].

All patients with critical COVID-19 pneumonia required mechanical ventilation with a mean duration of 12 days, similar to the report of critically ill patients in Seattle, where the duration of mechanical ventilation was 10 days, or in the New York City series, where the duration was 18 days [27,28]. Noteworthy is that our extubation rate was higher (91.6%) than in other series. However, this is only our first month experience, patients arrived early and had access to a full intensive care support as at that point the hospital was not overwhelmed. Moreover, we had a fatality rate of (8.3%) within patients who required invasive mechanical ventilation. This particular finding contrast with other series that have reported higher mortality, as the series from Cummings et al. in New York City with a fatality ratio of 39% or the Seattle series in which 50% of patients died [27,28].

Regarding infectious complications, there were 3 cases of ventilator-associated pneumonia and only one with a multidrug resistant bacteria, an extended spectrum beta-lactamase E. coli. Secondary bacterial infection has been related to longer hospital stays and worse outcomes [18]. Only one patient was diagnosed with probable invasive pulmonary aspergillosis, a fungal coinfection described in another reports [29]. Finally, with respect to viral coinfections, most of our patients were tested for other respiratory pathogens by molecular analysis, yet we only found only two patients with influenza and one with a rhinovirus coinfection. In contrast with other series that describe up to 20% of respiratory virus coinfection [30].

Pulmonary embolism was observed in two patients, despite receiving low molecular weight heparin thromboprophylaxis. Severe COVID-19 pneumonia can be complicated with prothrombotic coagulopathy, causing both major thromboembolic events and microthrombi in end-organ capillary beds. Therefore, it is currently recommended that all patients (unless contraindicated) should receive thromboprophylaxis, and those with elevated coagulation markers (specifically D-dimer) should receive full dose anticoagulation, as it appears to be associated with lower mortality. Our patients were managed following these recommendations, that have been associated with lower mortality [31,32]. Our study has several limitations: it is a small descriptive case series report, and there may be confounders in the analysis of the results, in concordance with most described data in the current literature. Another disadvantage is the lack of generalisability because out data in from a well-resourced hospital in Mexico City. However, the strength of this work is the fact that all patients were followed-up until discharge or death, so the current results on in-hospital mortality, extubation rate and outcome are not underestimated. Also, this to our best knowledge is the first series of well-characterised patients in a Mexican hospital. Our findings bring valuable information about the local epidemiology of severe and critical COVID-19 patients in lower-middle income countries.

Acknowledgement

The authors thank Aurora de la Peña and Carlos Cervera for important discussion and insights. Also, to all the residents and nurses from the ABC Medical Center.

Funding

The authors received no specific funding for the present work.

References

  1. Guan WJ, Ni ZY, Hu Y, Liang WH, Ou CQ, et al. (2020) Clinical Characteristics of Coronavirus Disease 2019 in China. N Engl J Med 382: 1708-20.
  2. Severe Outcomes Among Patients with Coronavirus Disease 2019 (COVID-19) – United States, February 12-March 16, 2020. MMWR Morb Mortal Wkly Rep 69: 343-6. [crossref]
  3. National Health Commission of the Peoples Republic of China (2020). The diagnosis and treatment guide of COVID-19 pneumonia caused by new coronavirus infection. http://www.nhc.gov.cn/xcs/zhengcwj/202003/46c9294a7dfe4cef80dc7f5912eb1989.shtml
  4. World Health Organization (2020). Clinical management of severe acute respiratory infection when novel coronavirus (nCoV) infection is suspected: interim guidance. https://www.who.int/publications/i/item/clinical-management-of-severe-acute-respiratory-infection-when-novel-coronavirus-(ncov)-infection-is-suspected
  5. Corman VM, Landt O, Kaiser M, Molenkamp R, Meijer A, et al. (2020) Detection of 2019 novel coronavirus (2019-nCoV) by real-time RT-PCR. Euro Surveill 25: 2000045. [crossref]
  6. González MFJ, Salame KL, Olvera GCI, Valente AB, Aguirre SJ, et al. (2020) Posición prono en pacientes con síndrome de insuficiencia respiratoria progresiva aguda por COVID-19. Med Crítica 34: 73-77.
  7. Wu C, Chen X, Cai Y, Xia J, Zhou X, et al. (2020) Risk Factors Associated With Acute Respiratory Distress Syndrome and Death in Patients With Coronavirus Disease 2019 Pneumonia in Wuhan, China. JAMA Intern Med 180: 934-943.
  8. Weissleder R, Lee H, Ko J, Pittet MJ (2020). COVID-19 diagnostics in context. Sci Transl Med 12: eabc1931.
  9. Fang L, Karakiulakis G, Roth M (2020) Are patients with hypertension and diabetes mellitus at increased risk for COVID-19 infection? Lancet Respir Med 8: e21. [crossref]
  10. Rico-Mesa JS, White A, Anderson AS (2020) Outcomes in Patients with COVID-19 Infection Taking ACEI/ARB. Curr Cardiol Rep 22: 31.
  11. Peng YD, Meng K, Guan HQ, Leng L, Zhu RR, et al. (2020) [Clinical characteristics and outcomes of 112 cardiovascular disease patients infected by 2019-nCoV]. Zhonghua Xin Xue Guan Bing Za Zhi 48: 450-455. [crossref]
  12. Liu M, He P, Liu HG, Wang XJ, Li FJ, et al. (2020) [Clinical characteristics of 30 medical workers infected with new coronavirus pneumonia]. Zhonghua jie he he hu xi za zhi 43: E016. [crossref]
  13. Encuesta Nacional de Salud y Nutrición 2018 Ensanut. Available from: https://ensanut.insp.mx/encuestas/ensanut2018/doctos/informes/ensanut_2018_presentacion_resultados.pdf
  14. Zhou P, Yang XL, Wang XG, Hu B, Zhang L, et al. (2020) A pneumonia outbreak associated with a new coronavirus of probable bat origin. Nature 579: 270-3. [crossref]
  15. Bourgeois C, Gorwood J, Barrail-Tran A, Lagathu C, Capeau J, et al. (2019) Specific Biological Features of Adipose Tissue, and Their Impact on HIV Persistence. Front Microbiol 10: 2837. [crossref]
  16. Wang D, Hu B, Hu C, Zhu F, Liu X, et al. (2020) Clinical Characteristics of 138 Hospitalized Patients With 2019 Novel Coronavirus-Infected Pneumonia in Wuhan, China. JAMA 323: 1061- 1069. [crossref]
  17. Hudson LD, Milberg JA, Anardi D, Maunder RJ (1995) Clinical risks for development of the acute respiratory distress syndrome. Am J Respir Crit Care Med 151: 293-301. [crossref]
  18. Zhou F, Yu T, Du R, Fan G, Liu Y, et al. (2020) Clinical course and risk factors for mortality of adult inpatients with COVID-19 in Wuhan, China: a retrospective cohort study. Lancet 395: 1054-62. [crossref]
  19. Henry BM, de Oliveira MHS, Benoit S, Plebani M, Lippi G (2020) Hematologic, biochemical and immune biomarker abnormalities associated with severe illness and mortality in coronavirus disease 2019 (COVID-19): a meta-analysis. Clin Chem Lab Med 58: 1021-1028. [crossref]
  20. Chen X, Zhao B, Qu Y, Chen Y, Xiong J, et al. (2020) Detectable serum SARS-CoV-2 viral load (RNAaemia) is closely correlated with drastically elevated interleukin 6 (IL-6) level in critically ill COVID-19 patients. Clin Infect Dis. https://doi.org/10.1093/cid/ciaa449
  21. Herold T, Jurinovic V, Arnreich C, Hellmuth JC, von Bergwelt-Baildon M, et al. (2020) Level of IL-6 predicts respiratory failure in hospitalized symptomatic COVID-19 patients. medRxiv. Available from: http://medrxiv.org/content/early/2020/04/10/2020.04.01.20047381.abstract
  22. Lippi G, Lavie CJ, Sanchis-Gomar F (2020) Cardiac troponin I in patients with coronavirus disease 2019 (COVID-19): Evidence from a meta-analysis. Prog Cardiovasc Dis 63: 390-391. [crossref]
  23. Mehta P, McAuley DF, Brown M, Sanchez E, Tattersall RS, et al. (2020) COVID-19: consider cytokine storm syndromes and immunosuppression. Lancet 395: 1033-1034.
  24. Xu Z, Shi L, Wang Y, Zhang J, Huang L, et al. (2020) Pathological findings of COVID-19 associated with acute respiratory distress syndrome. Lancet Respir Med 8: 420-422. [crossref]
  25. Wadud N, Ahmed N, Shergil M, Khan M, Krishna M, et al. (2020) Improved survival outcome in SARs-CoV-2 (COVID-19) Acute Respiratory Distress Syndrome patients with Tocilizumab administration. medRxiv. https://www.medrxiv.org/content/10.1101/2020.05.13.20100081v1.full.pdf
  26. Xu X, Han M, Li T, Sun W, Wang D, et al. (2020) Effective treatment of severe COVID-19 patients with tocilizumab. Proc Natl Acad Sci 117: 10970-10975. [crossref]
  27. Bhatraju PK, Ghassemieh BJ, Nichols M, Kim R, Jerome KR, et al. (2020) Covid-19 in Critically Ill Patients in the Seattle Region — Case Series. N Engl J Med 382: 2012-2022. [crossref]
  28. Cummings MJ, Baldwin MR, Abrams D, Jacobson SD, Meyer BJ, et al. (2020) Epidemiology, clinical course, and outcomes of critically ill adults with COVID-19 in New York City: a prospective cohort study. Lancet 395: 1763-1770. [crossref]
  29. Alanio A, Dellière S, Fodil S, Bretagne S, Megarbane B (2020) High prevalence of putative invasive pulmonary aspergillosis in critically ill COVID-19 patients. SSRN. Available from: https://ssrn.com/abstract=3575581
  30. Kim D, Quinn J, Pinsky B, Shah NH, Brown I (2020) Rates of Co-infection Between SARS-CoV-2 and Other Respiratory Pathogens. JAMA 323: 2085-2086.
  31. Kollias A, Kyriakoulis KG, Dimakakos E, Poulakou G, Stergiou GS, et al. (2020) Thromboembolic risk and anticoagulant therapy in COVID-19 patients: Emerging evidence and call for action. Br J Haematol 189: 846-847. Available from: http://doi.wiley.com/10.1111/bjh.16727
  32. Barrett CD, Moore HB, Yaffe MB, Moore EE (2020) ISTH interim guidance on recognition and management of coagulopathy in COVID‐19: A comment. J Thromb Haemost 18: 2060-2063 [crossref]

Fluid Inclusions and Metallogenic Conditions of the Dashuigou Tellurium Deposit, Tibet Plateau, Southwest China

DOI: 10.31038/GEMS.2021331

Abstract

By thoroughly researching the microscopic characteristics and compositions of fluid inclusions in various minerals of the Dashuigou independent tellurium deposit in Southwest China, the authors of this paper uncover metallogenic conditions of the only independent tellurium deposit in the world. The principal compositions of the metallogenic hydrothermal fluids are Na+, K+, Ca2+, Mg2+, SO42-, Cl, F, H2O, CO2, CH4, H2, N2, CO and C2H6. The salinity of fluid inclusions within the metallogenic epochs varies between 13.8%-36.2%, which falls into a medium-high salinity range. The salinity of quartz samples associated with tellurides formed during the tellurium epoch is 14.9%-18.7%, which is within the medium salinity range. Metallogenic pressure is calculated at 0.647-1.020 Kbar, and the corresponding mineralization depth is 4.08-2.16 km. Mineralization temperatures of the deposit’s early and late metallogenic epochs are respectively 336.0-406.0 and 216.9-229.0°C. The metallogenic hydrothermal solutions are SO42- – Ca2+ type, or SO42- – Na+ – K+ – Ca2+ type, especially during the early Pyritic Epoch, and Na+-K+-Cl-SO42- type during the late metallogenic epoch. The metallogenic hydrothermal solutions of the deposit are of moderate salinity, mesothermal and mesogenetic.

Keywords

Metallogenic condition; Fluid inclusion; Homogenization temperature; Decrepitation temperature; Metallogenic epoch; The Dashuigou tellurium deposit; Tibet Plateau

Introduction

Tellurium (Te) is usually categorized as a scattered or dispersed element (abbreviated as SM). SM are those metals, semimetals and/or nonmetals that have similar geochemical characteristics with Clark values too low to enrich into independent deposits, but that play very important roles in modern science, industry, national defense and at the frontiers of technology. It is thought in the traditional theory of mineral deposits and geochemistry that Te could not form independent deposits, but only exist as associated components in other metallic deposits. The abundance of Te in the Earth’s Crust is very low. According to Li [1], the average content of Te in the Earth’s crust is 2.0 x 10⁻⁸ in China, and only 1.34 x 10⁻⁹ worldwide. At present, the world’s supply of refined tellurium is mainly recovered from Te-bearing minerals including pyrite, sphalerite, chalcopyrite, galena, pyrrhotite, volcanogenetic sulfur, bismuthinite, arsenopyrite, and cassiterite, etc. Generally speaking, only sulfide ores containing more than 0.002% Te can be used. As a result, the amount of refined tellurium that can be recovered is very limited. Most of the recoverable Te in the world is from copper deposits, and it is estimated that only 0.065 kg of Te can be produced in the refining process of one ton of copper [2,3]. The Dashuigou tellurium deposit is the only independent tellurium deposit in the world. Since its discovery in 1992, it has aroused widespread concern from domestic geologists. Chen [4] believed that tellurium mineralization is related to Yanshanian alkaline intrusive rocks, while Luo [5,6] believed that the mineralization is related to Yanshanian granitic magma activity. Yin [3,7,8] proposed that scattered elements including tellurium and bismuth originated from gas blown off from the deep Earth and enriched through nano-effect. Wang [9] summarized the metallogenic process of the Dashuigou tellurium deposit as follows: a volcanic eruption deposit was formed on the ancient seafloor with magmatic eruption in the late Proterozoic. Then, the deposit was strongly superimposed and reconstructed by the Mesozoic multistage regional metamorphic hydrothermal activities.

Regional Geology

The Dashuigou tellurium deposit is located in the transitional belt between the Yangtze Platform and Songpan-Ganzi folded belt, as part of the Tibetan Plateau (Figure 1). The deposit is nestled in the convergence between the Indian, Eurasian and Pacific Plates. The crust-mantle structures and properties in the region are the result of tectogenesis through various geological times. It implies the turning boundary of the Earth’s crust’s thickness. It is also a gravity gradient zone which controls not only the production and development of earthquakes and tectonomagmatic events, but also the distribution of a series of mineral deposits. Geophysical data indicates that the upper mantle below the region uplifts obviously. As a result, the area possesses high heat flow geophysical characteristics [3,5,6,10,11].
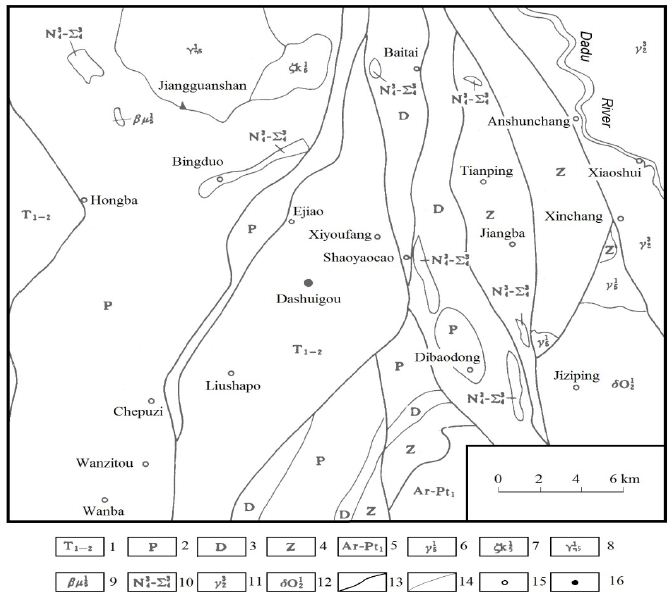
fig 1

Figure 1: Regional geology (after Yin, 1996).

1. The lower and middle Triassic metamorphic rocks; 2. The Permian metamorphic rocks; 3. The Devonian metamorphic rocks; 4. Metamorphic rocks of the Sinian system; 5. Metamorphic base complex of the Archean Kangding group; 6. Plutonic granite of the Indosinian orogeny; 7. Plutonic alkaline syenite of the Indosinian orogeny; 8. Plutonic monzonitic granite of the Indosinian orogeny; 9. Hypabyssal sillite of the Indosinian orogeny; 10. The late Hercynian basic-ultrabasic rocks; 11. The late Proterozoic plutonic granite; 12. The early Proterozoic-Archean plutonic quartz diorite; 13. The deep and large fault; 14. The geological boundary; 15. Village and/or town; 16. The tellurium deposit. There is also a low-velocity, low resistivity zone in the middle crust that is interpreted as a decollement. The abnormal mantle exists under the crust in the region. It has properties of both geosyncline and platform, as well as its own special characteristics. The belt is a geo-tectonically active zone with very complicated igneous rock structures. According to the regional geophysical data, the region’s characteristics exhibit high velocity, high density, high resistance, high geothermal flow, high magnetism as well as well-developed earthquakes and mantle’s uplift. In summary, this region is both geologically very active and a very important south-north trending tectonomagmatic-mineral belt [3-6]. The strata, igneous rocks and structures trend south-northward. The strata are low-grade metamorphic rocks of the Silurian, Devonian, Permian systems and middle-lower Triassic series. A large amount of Archaean metamorphic rocks of the Kangding Group emerge to the southeast of the deposit. The well-developed igneous rocks in the region include ultrabasic, basic, neutral, acid and alkaline, produced in different geological times. Different types of mineral resources in the region are very rich; many of these are well known, including Ti, V, Cu, Pb, Zn, SM, REE, coal, asbestos and the Panzhihua Vanadium Titano-magnetite deposit [3-6].

Mine Geology

The strata of the area are low-grade metamorphic rocks of the lower-middle Triassic age, including marble, slate and schist. The main wall-rocks of the ore bodies are schist and slate. All of the Triassic strata make up a NNE-trending dome. The geological and geochemical characteristics in the area indicate that the protolith of the tellurium ore veins’ direct wall-rocks is poorly differentiated mantle-derived basalt (Figure 2).
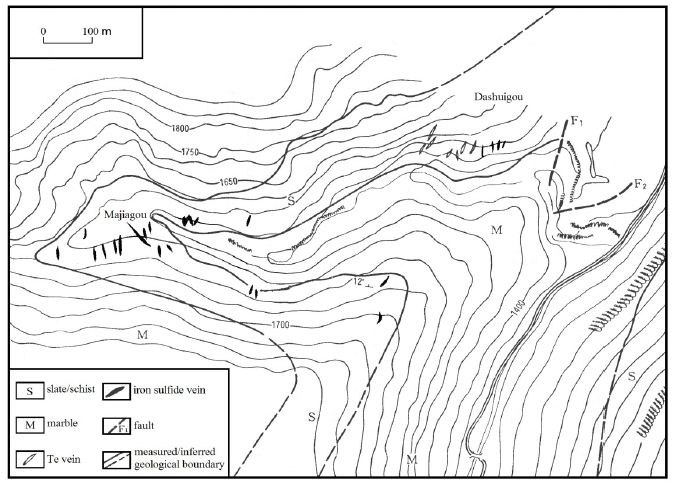
fig 2

Figure 2: Mine geology (after Yin, 1996).

Both faults and folds are well-developed in the area. The annular and linear structures together make up special “Ø” pattern structures, which control the formation of different types of endogenetic mineral deposits, including the Dashuigou tellurium deposit. No intrusive rocks emerge within a 5 km radius around the deposit. Only two small Permian ultrabasic-basic rock bodies emerge within a 10 km range of the deposit. Large neutral, acid and alkaline intrusive bodies exist beyond 10 km, which are unrelated to the deposit (Figure 1). Quantitative chemical analyses of Te, Bi, Se, As, Au, Ag, Cu, Pb and Zn were conducted on different rock samples including granites, metamorphic rocks, altered rocks, and carbonate veins of different geological times. The main findings are summarized below [3,12-15]. The Te content in the granites is under 1 x 10⁻⁷, which is similar to its Clark value in the Earth’s crust. Te in the metamorphic rocks is slightly higher than in the granites and varies slightly between metamorphic rocks of different geological times, while being relatively higher in the Triassic metamorphic rocks. Of the metamorphic rocks in the same geological time, the Te content in the slate and schist is higher than in the marble. Te content in rocks of the same stratohorizon of the same geological time also varies; namely, it is higher in rocks within the mining area than in those beyond the mining area. Te content is closely related to the intensity of alterations; that is, the ore-forming elements are not derived from the country rocks, but instead from the mantle. The deposit is located at the northeastern end of the Triassic metamorphic dome. The ore bodies are controlled by and fill a group of shear fractures. Ten tellurium ore veins have been discovered, which strike from 350 to 10 degrees and dip at 55 to 70 degrees westward. Widths of the ore bodies vary between 25 and 30 cm. The narrow ore bodies are in the shape of lenticular veins and have sharp contact with the wall rocks (Figures 3 and 4).
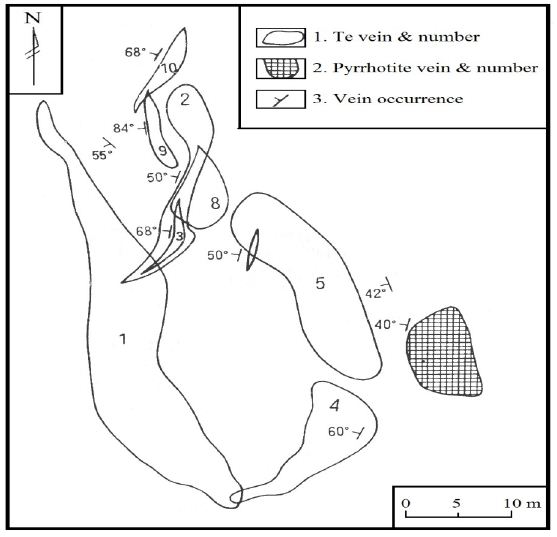
fig 3

Figure 3: Horizontal projection of the telluride veins of the Dashuigou deposit (after Yin, 1996).
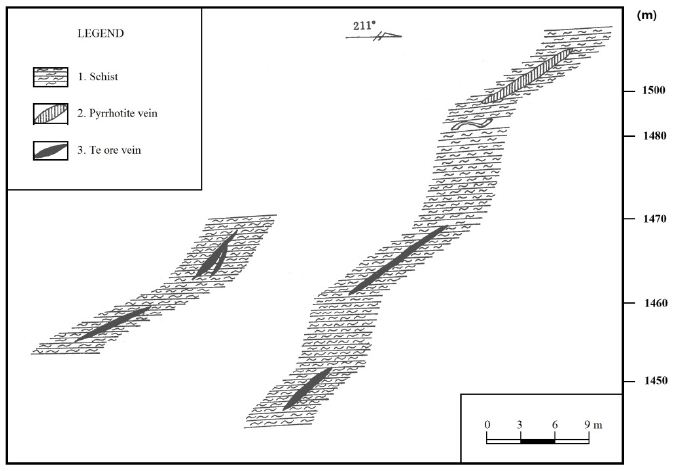
fig 4

Figure 4: Longitudinal section the telluride and pyrrhotite veins of the Dashuigou deposit (after Yin, 1996).

The altered rocks occur in narrow bands ranging between several centimeters and one meter in thickness. Altered zones beside the massive ore veins are narrower, at only several centimeters wide. The dominant alterations include dolomitization, silicification, biotitization, muscovitizaion, tourmalinization, sericitizaion, greisenization, and chloritization [3,7,14-20]. Approximately thirty minerals are identified in the ore, which include tetradymite, pyrrhotite, pyrite, dolomite, quartz, chalcopyrite, tsumoite (BiTe), tellurobismuthite (Bi2Te3), galena, magnetite, gold, silver, electrum, ilmenite, calcite, calaverite, siderite, mannesite, rutile, muscovite, biotite, sericite, hornblende, chlorite, plagioclase, K-feldspar, tourmaline, hematite, garnet, apatite, and epidote. The first five minerals are the most important and comprise 85% of the ore, though generally tetradymite is so rare that many monographs on mineralogy do not have any related data on it [3,10,19-22]. Replacement, remnant, reaction border, and granular are the dominating textures of the ore. Massive, vein/veinlet, stockwork veins are the dominating structures of the deposit (Figures 5 and 6).
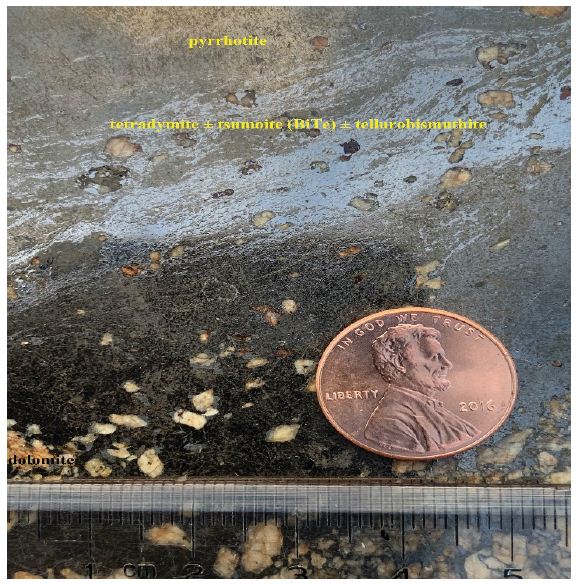
fig 5

Figure 5: Lead grey-silvery colored tetradymite ± tsumoite (BiTe) ± tellurobismuthite (Bi2Te3) fine veinlets in massive pyrrhotite (dark colored background) + dolomite (brownish white) from the deposit (sample #: SD40, Ore body #I-1 in Drift 3).
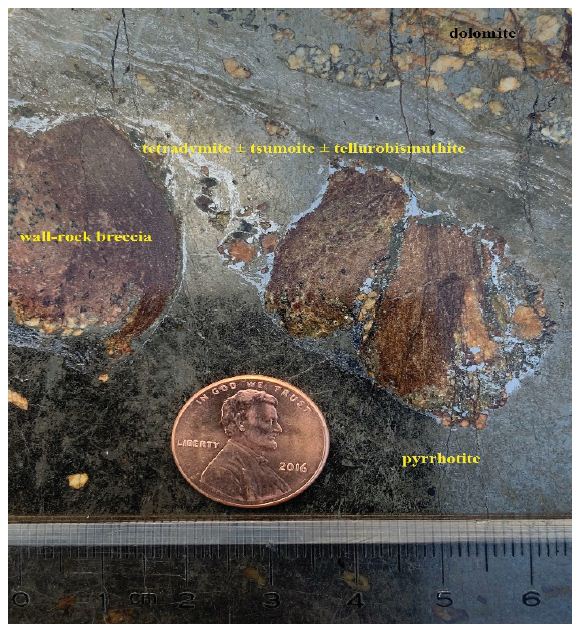
fig 6

Figure 6: Lead grey-silvery colored tetradymite ± tsumoite (BiTe) ± tellurobismuthite (Bi2Te3) fine veinlets in massive pyrrhotite (dark colored) + dolomite (brownish white) + wall rock (dark brown) from the deposit (sample #: SD34, Ore body #I-1 in Drift 3).

The most important ores are massive and the secondary ores are disseminated. The Te content in the ore varies between 0.01% and 34.58%.

Two mineralization epochs and five stages exist in the deposit [3,8,23]:

  • Pyrrhotite epoch (177.7~165.1 Ma): including three mineralization stages: carbonate stage (I) → pyrrhotite stage (II) → chalcopyrite stage (III) (from early to late).
  • Tellurium epoch (91.71~80.19 Ma): including two mineralization stages, namely: tetradymite stage (I) → tsumoite (BiTe0.97) stage (II).

Mineralization Epoch and Mineral Sequence

Based on the mutually crosscutting relationships of various veins/veinlets in the deposit, including those of pyrrhotite, chalcopyrite, tetradymite, tsumoite, dolomite and quartz, in addition to the features of microscopic texture and structure between gangue and ore minerals, the mineralization epochs and stages as well as mineral sequence are summarized in Figure 7 [3,8,23].
fig 7

Figure 7: Mineralization epochs & stages and mineral sequence of the deposit.
Note: * – mineral inclusion homogenization temperature (dolomite for carbonate stage, quartz for tsumoite stage), please refer to Tables 1 and 2 for more detailed information; ** – mineral inclusion decrepitation temperatures of the corresponding stages (that of the pyrrhotite stage is the average of decrepitation temperatures of both the pyrite and pyrrhotite of the pyrrhotite stage.

Table 1: Decrepitation temperatures of fluid inclusion in the minerals from the deposit.
table 1

Table 2a: Characteristics of fluid inclusions in the minerals from the deposit.
table 2a

Table 2b: Characteristics of fluid inclusions in the minerals from the deposit (cont’d).
table 2b

Carbonate Stage

A large quantity of iron-dolomite, quartz and lesser calcite veins/veinlets occurred within this stage, which are brown and/or yellowish brown broken coarse-grained due to iron staining (Figures 5 and 6). Decrepitation temperatures of the fluid inclusions in the dolomite, one of the dominant minerals of this stage, are listed in the corresponding table of this paper.

Pyrrhotite Stage

The largest quantity of pyrrhotite formed during this stage. Some coarse- to very coarse-grained pentagonal pyrite can be seen in the anhedral crystals of pyrrhotite. Decrepitation temperatures of the fluid inclusions in both the pyrrhotite, one of the dominant minerals, and pyrite of this stage are listed in the corresponding table of this paper.

Chalcopyrite Stage

Many chalcopyrite veins/veinlets formed within this stage, filling in fractures of pyrrhotite and/or crosscutting pyrrhotite. Part of the chalcopyrite is within telluride minerals in the vermicular form. Decrepitation temperatures of the fluid inclusions in the chalcopyrite, the dominant mineral of this stage, are listed in the corresponding table of this paper.

The three prior mineralization stages consist of the early metallogenic epoch of the deposit, the pyritic epoch (177.7-165.1 Ma) of the early Yanshan orogeny. The following two mineralization stages consist of the tellurium metallogenic epoch (91.71-80.19 Ma) of the late Yanshan orogeny [3,24].

Telluride Stage

Large quantities of massive/semi-massive telluride veins formed during this stage, associated with clean, milky-white quartz, dolomite, calcite, muscovite/sericite and native gold. Decrepitation temperatures of the fluid inclusions in the tetradymite, the dominant mineral, and part of the associated dolomite of this stage are listed in the corresponding table of this paper.

Tsumoite Stage

Tsumoite and chalcopyrite together consist of emulsion droplets and/or vermicular immixing of solid solution texture at the contacts between tetradymite and pyrrhotite (Figures 5, 6 and 8).
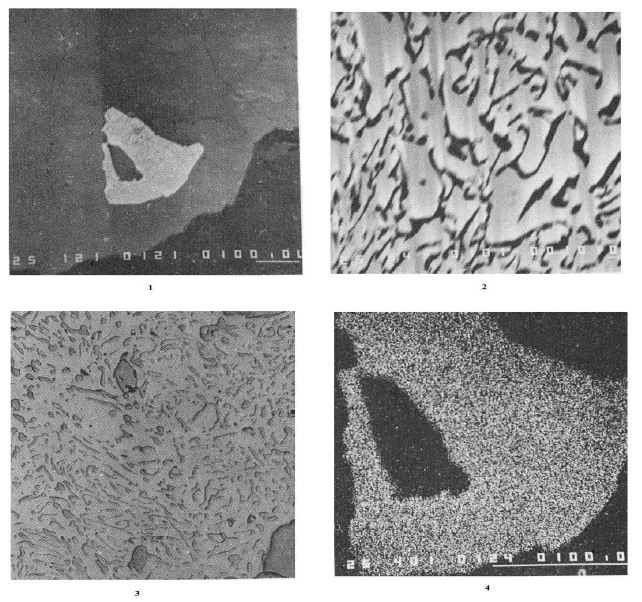
fig 8

Figure 8: 1~3: Reflection color and their mutual relationships between tsumoite (bright white), tetradymite (white), and pyrrhotite (grey) in the back scattered electron (composition) image from the deposit (thin section (-) (Note: 1 (×120), 2 (×540), & 3 (×200)). 4: Te Kα X ray image indicating chemical composition distributions of telluride including tetradymite and tsumoite (white): the denser the white spots, the higher the Te content; the black colored background is pyrrhotite from the deposit (×400).

The mineralization temperatures of this stage shown in Figure 7 are based on the homogenization temperatures of the fluid inclusions in the quartz associated with tsumoite. Please refer to the corresponding table of this paper for more detailed information.

Sampling and Analytical Methodology

Field Sampling

Samples were collected from proper locations of the deposit’s typical ore bodies and wall rocks in the study area. They were described in detail on site, then properly labeled or numbered and wrapped with waxed paper to avoid cross contamination with other samples in the same sample box, and finally packed and shipped to the work laboratory.

Lab Sampling and Preliminary Processing

In the lab, all samples were sorted, air-dried, stage crushed to 6-Tyler mesh, well homogenized, and then rotary split into 1 kg assay aliquots. One assay aliquot was wet screened into different sized fractions, and the -10 mesh+65 mesh fraction was used for this study. After being crushed and screened through different sizes of mesh, the corresponding minerals in fraction from 10 to 65 mesh to be used for further analyses were then manually separated and picked up under binocular microscope, and their crystal forms and other physical mineralogical characteristics were observed and described in detail. Next, the selected mineral samples were pulverized to 90% passing 75 μm for further research and testing, in order to help reveal the mineralization mechanism of the corresponding deposit.

Analytical Methodology

The gaseous components of the fluid inclusions in quartz were analyzed via both the Raman spectroscopy and gas chromatographic methods. The Raman spectroscopy technique has a wide field of applications, ranging from qualitative detection of solid, liquid and gaseous components to identification of polyatomic ions in solution. It is also a versatile non-destructive technique for fluid inclusion analysis and is commonly used to calculate the density of CO2 fluids, the chemistry of aqueous fluids, and the molar proportions of gaseous mixtures present as inclusions… The main advantages of this technique are the minimal sample preparation required and its high versatility. The particle size of the 99.9% purity mineral samples was controlled to 0.5-1.0 mm to avoid damaging the fluid inclusions. According to their respective burst temperatures, the primary inclusions in the minerals were opened by thermal explosion, and the fluid components obtained by heat-blast-leaching. The released gas-phase components such as H2O, CO2, CO, H2, N2, and CH4 were measured by gas chromatography. Decrepitated mineral was added with deionized water, and ultrasonic extraction was then conducted. The extract liquor was measured by atomic absorption spectrometer for K+, Na+, Ca2+, Mg2+ and other cationic components in the solution, while anion components such as F, Cl, SO42-, etc. were determined through ion chromatography or spectrophotometry. In addition, Fe, Cu, Pb, Zn, Sb, Hg, Au, Ag and other related ore-forming metal elements can be determined by the atomic absorption flameless method as required. Then, the gas and liquid phase components in the mineral inclusions were converted into the mass concentration of each component contained in the mineral inclusion aqueous solution. Conversion of liquid components: At room temperature, 1 ml of water weighs about 1 gram. First, the mass of water in the analysis result is converted into the volume VH2O, and the mass concentration ρB of each ion in the inclusion water is calculated via the following formula [25,26]:

The volume of inclusion water VH2O = ωH2O/1000. Mass concentration of ions in liter of water ρB = ωB/VH2O.

For the measurement data of vapor phase components H2O, CO2, CO, H2, and CH4, a relevant diagram [27] was applied to estimate the temperature, pressure, oxygen fugacity, carbon dioxide fugacity, reduction coefficient, and other geochemical parameters such as pH and Eh of the equilibrium among the components in the mineral inclusions.

Characteristics of the Fluid Inclusions

General Characteristics

The fluid inclusion characteristics of part of the deposit’s gangue and ore minerals are summarized in Tables 2 and 3 and discussed as follows. Fluid inclusions are well developed in most of the deposit’s minerals, but their characteristics differ from each other within different host minerals. Dolomite usually has less liquid inclusions than both calcite and quartz. The sizes of fluid inclusions in dolomite and calcite are usually between 3-5 µm, which is smaller than those in quartz, which is usually 5-10 µm (Table 2). Fluid inclusions in both dolomite and calcite are mainly liquid and usually scattered without any orientation in mineral distribution, with a gas-liquid ratio of less than 5%. Those in quartz, which are mainly gaseous-liquid inclusions within the deposit, are more complicated than those in both dolomite and quartz; either scattered without any orientation in distribution, or in zonal distribution in certain orientations (Figure 6). Fluid inclusions in the tourmaline-quartz vein collected from the periphery of the deposit are mainly gaseous-liquid inclusions and differ from those of quartz within the deposit; a few 3 phase inclusions could be seen in the quartz vein collected around the deposit.

Fluid inclusions in both dolomite and calcite are usually oval and/or polygon in shape, while those in quartz are either oval, polygon, irregular, strip and/or tubular. A few perfect cubic NaCl crystals could be seen in several of the fluid inclusions in quartz (Figure 9).
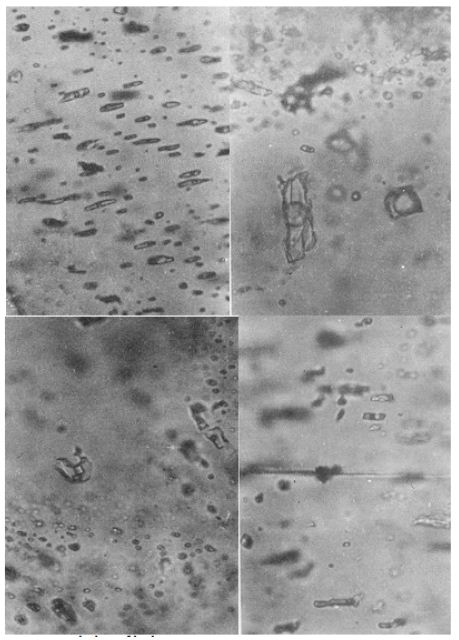
fig 9

Figure 9: Fluid inclusions in quartz and calcite of the deposit. A: gaseous-liquid inclusions in quartz from #I-4 Ore Body (X 400), B: gaseous inclusions in quartz from #I-4 Ore Body (X 400), C: cubic NaCl crystal in gaseous-liquid inclusions in quartz from #I-7 Ore Body (X 400), D: gaseous-liquid inclusions in calcite from coarse grained marble of the lower Triassic strata of the deposit (X 400).

Chemical Compositions

Chemical compositions of the fluid inclusions of part of the gangue and ore minerals are listed in Table 3. It can be seen from the table that cations in the fluid inclusions include Na+, K+, Ca2+ and Mg2+, while anions include SO42-, Cl and F, and the major gaseous compositions include H2O and CO2, with smaller CH4, H2, N2, CO and C2H6. Na+/K+ ratios of the fluid inclusions of the region’s minerals are either above or below 1.0, meaning that compositions of the hydrothermal solutions are not homogeneous. Ca2+/ Mg2+ ratios of the fluid inclusions are all above 1.0, meaning that the metallogenic solutions are rich in Ca2+ but poor in Mg2+. Both SO42-/Cl and Cl/F ratios are over 1.0, meaning that the metallogenic solutions are richest in SO42-, moderate in Cl, but poor in F. Most of the samples had H2O/ CO2 ratios of over 1.0, meaning the solutions are richer in H2O than in CO2. (CO2 + H2 + CH4)/N2 values of all samples are over 1.0, showing that the hydrothermal solutions are rich in CO2, H2 and CH4.

Table 3a: Chemical compositions of the gaseous-liquid fluid inclusions in the minerals.
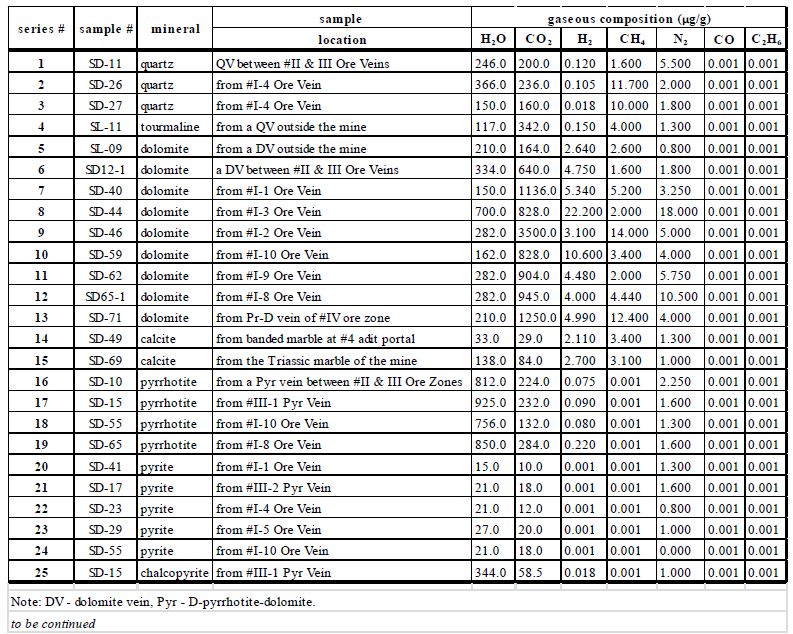
table 3a

Table 3b: Chemical compositions of the fluid inclusions in the minerals (cont’d).
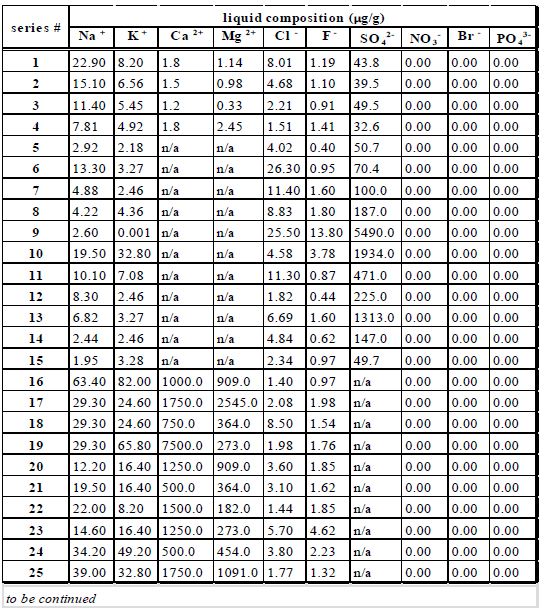
table 3b

Table 3c: Chemical compositions of the fluid inclusions in the minerals (cont’d).
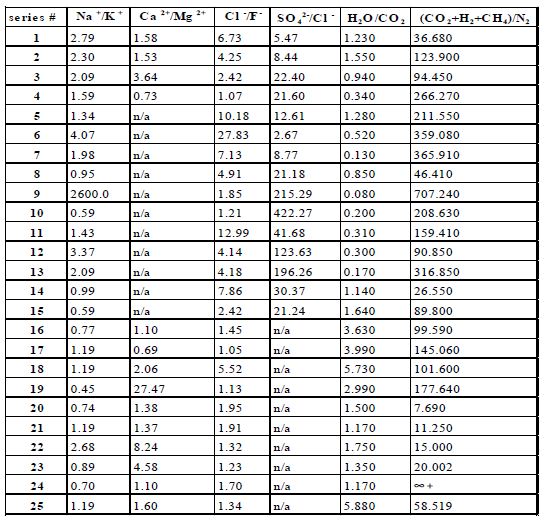
table 3c

Discussion

Previous research on the ore-forming fluid of the Dashuigou tellurium deposit is roughly divided into the magma hydrothermal theory [4-6,10,11,26,28,29], the metamorphic hydrothermal theory [30,31], and the mixed hydrothermal theory [5,9,30] obtained the study of gas-liquid inclusions and found that the ore-forming temperature of the Dashuigou tellurium deposit varied between 350 and 120°C. The salinity is 7.2 wt% ~ 35 wt% NaCl, of which the salinity value in the early and late quartz veins can be as high as 20 wt% to 35 wt% NaCl, the oxygen fugacity is fO2 = -42.26 ~ -45.49, and the ore-forming hydrothermal fluid is weakly acidic and neutral (pH = 6.32 ~ 6.29). The CO2/H2O ratio in the quartz is 0.137 ~ 0.208, and the CH4 content is 12.61 ~ 24.85 ml/100 g. Based on uniform temprature measurement of the gas-liquid inclusions in the deposit’s dolomite and quartz, Li [29] and Cao [10-11] concluded that the uniform temperature of each mineralization stage is roughly similar: 221 ~ 259°C, average 239°C for Stage I; 215 ~ 256°C, average 235°C for Stage II; 192 ~ 243°C, average 224°C for Stage III. The corresponding metallogenic pressure is 823.684 × 10⁵ Pa ~ 965.409 × 10⁵ Pa, with an average of 884.156 × 10⁵ Pa. Both CO2 and H2O-CO2 inclusions are abundant, reflecting that mineralization occurs under relatively closed conditions. The metallogenic depth estimated by the static rock pressure model is 3,339 m, which is equivalent to the thickness of the measured overlying strata (3650 m). Since the characteristics of inclusion types in each mineralization stage are not substantially different, they are considered to have similar metallogenic depths. According to the ore-forming pressure and salinity, the temperature correction value was found to be about 80°C, so the metallogenic temperatures of stages I, II, and III were 319°C, 315°C, and 304°C, respectively. The salinity of ores from this deposit varies widely, with NaCl content ranging from 7.17% to 33.27%. Among them, the rock salt gas-liquid water inclusions have the highest salinity, while the gas-liquid water inclusions and liquid-liquid H2O-CO2 inclusions have lower salinity and are basically the same. The salinity of fluids in each mineralization stage is roughly similar, where the NaCl content in stage I is 16.5% ~ 30.83%, with an average of 21.21%; stage II is 17.66% ~ 33.27%, with an average of 25.77%; stage III is 7.17% ~ 32.34%, with an average of 17.55%. The gas phase composition is mainly H2O, followed by CO2, and containing a small amount of H2, CO and CH4. According to observation under a microscope, the fluid inclusions in the minerals from this deposit are mainly H2O-CO2 and CO2. The fO2 of the mineralization fluid is: stage Ⅰ 10.0 × 10⁵ ~ 34. 0 × 105 Pa, stage Ⅱ10.0 × 10⁵ ~ 34.8 × 10⁵ Pa, stage Ⅲ10.0 × 10⁵ ~ 35.6 × 10 5Pa. The pH value of the hydrothermal solution during the tellurium mineralization stage is 5.91 ~ 5.87. Through study of gas-liquid inclusions from the same deposit, Chen [28] concluded that the inclusions are rich in CO2, CO2-H2O (low salinity fluid), and CO2-H2O-NaCl (high salinity fluid); namely, three systems of fluid inclusions exist in the deposit, of which tellurium mineralization is related to the first two systems. Most of the inclusions leak and/or burst before being homogenized. The metallogenic temperature of the pyrrhotite stage is around 500°C and that of the telluride stage is 400°C. The fluid density changes between 1.04 ~ 0.76 g/cm3, and the metallogenic pressures are respectively 450 ~ 500 MPa and 240 ~ 300 MPa. Mineralization occurs under high temperature and high pressure. The results of this paper are as follows: fluid inclusion homogenization temperatures vary greatly (Table 2): those of quartz formed in pre-tellurium mineralization and collected outside the deposit are between 339.0 and 369.4°C. These samples include series #1, 2, 4 and 5 in Table 2. Other quartz samples in Table 2 are associated with telluride veins and their fluid inclusion homogenization temperatures should be at typical values when tellurium ore bodies emplaced, or between 180.0-250.0°C. This range includes part of the decrepitation temperatures of those minerals formed during the tellurium epoch mentioned earlier in this paper. The salinity of fluid inclusions within the whole metallogenic epochs varies between 13.8%-36.2%, which falls into a medium-high salinity range. That of minerals formed during the tellurium epoch, for instance three quartz samples associated with tellurides and collected from #I-4 Ore Vein in Table 2, is between 14.9%-18.7%, well within the medium salinity range. The formation pressures of mineral fluid inclusions correlate positively with homogenization temperatures (Table 2). Pressures of the series #6 through #9 samples in the table, acquired from minerals formed during tellurium mineralization, vary between 0.647-1.02 Kbar. This should be the pressure at which point telluride veins emplaced in the deposit. The corresponding mineralization depth is 4.08-2.16 km, while mineralization temperatures of the early and late metallogenic epochs of the deposit are respectively 336.0-406.0 and 216.9-229.0°C. Fluid inclusion compositions in both pyrrhotite and pyrite that formed in the same mineralization stage of the metallogenic epoch are similar to each other. Those of fluid inclusions in quartz samples collected from the deposit are also alike. Compositions of fluid inclusions of dolomite and calcite have both similarities and differences, especially those of dolomite and calcite collected from outside the deposit compared to those collected within the deposit. Differences also exist between dolomite from wall-rock marble and from dolomite veins. This may mean that compositions of fluid inclusions vary from one host mineral to another, and minerals formed in different environments or across different geological events have different fluid inclusion compositions. The metallogenic hydrothermal solutions, which are not homogeneous, are richest in SO42-, richer in H2O than in CO2, rich in Ca2+, CO2, H2, and CH4, moderate in Cl, but poor in Mg2+ and F.

Conclusion

Based on the discussions above, preliminary conclusions of the Dashuigou independent tellurium mine’s metallogenic conditions are summarized as follows: The metallogenic hydrothermal solutions are SO42- – Ca2+ type, or SO42- – Na+ – K+ – Ca2+ type, especially during the early metallogenic Pyritic Epoch, and Na+ – K+ – ClSO42- type during the late metallogenic epoch. The hydrothermal solutions of the deposit are mesothermal and of moderate salinity, as well as mesogenetic. Principal compositions of the metallogenic hydrothermal fluids are Na+, K+, – Ca2+, Mg2+, SO42-, Cl, F H2O, CO2, CH4, H2, N2, CO and C2H6; Salinity of the fluid inclusions within the metallogenic epochs varies between 13.8%-36.2%, which falls into the medium-high salinity range; that of minerals formed during tellurium epoch, for instance, three quartz samples associated with tellurides and collected from #I-4 Ore Vein in Table 2, is 14.9%-18.7%, which is within the medium salinity range. Metallogenic pressure is between 0.647-1.020 Kbar and the corresponding mineralization depth is 4.08-2.16 km. Mineralization temperatures of the early and late metallogenic epochs of the deposit are respectively 336.0-406.0 and 216.9-229.0°C.

Acknowledgement

Support for this study was received from the China National Postdoctoral Foundation, Orient Resources Ltd., and Bureau Veritas Commodities Canada Ltd. Additional support was provided respectively by Prof. R. Pei of the Chinese Academy of Geological Sciences, also an Academician of the Chinese Academy of Engineering, Prof. Y. Zhai of China University of Geosciences in Beijing, also an Academician of the Chinese Academy of Sciences, Prof. J. Zhou of the Chinese Academy of Geological Sciences, and Prof. Y. Zhang of the College of Earth Sciences, Jilin University in Changchun of China, all of whom provided insightful discussions and critical reviews of this manuscript. All measurements and chemical analyses, including the back scattered electron (composition) and Te Kα X ray images of the thin section from the deposit, included in this article were carried out in the labs of the Chinese Academy of Geological Sciences in Beijing. The authors very much appreciate the time invested respectively by D. S. Yin and S. Daly, for their review and editorial work on this contribution.

Data Availability

The data that support the findings of this study is available from the authors upon reasonable request; see authors’ contributions for specific data sets below.

Contributions

The whole research included in the paper was proposed and done by the first author J. Yin. The chemical compositions of fluid inclusions were sorted and researched by the second author Hongyun Shi of this paper. Both authors prepared and reviewed the manuscript and approved the final version of the manuscript. Author Contributions. Conceptualization, JIANZHAO YIN; Investigation, JIANZHAO YIN and Hongyun Shi; Project administration, JIANZHAO YIN; Writing – original draft, JIANZHAO YIN.

Competing Interests

The authors declare no competing interests.

References

  1. Li T (1976) Abundance of chemical elements in the Earth. Geochemistry 3: 167-174.
  2. Yin, JZ, Chen, YC, Zhou, JX (1995) Introduction of tellurium resources in the world. Journal of Hebei College of Geology 18: 348-354.
  3. Yin, JZ (1996) On the metallogenic model and mineralizing mechanism of the Dashuigou independent tellurium deposit in Shimian County, Sichuan Province, China-the first and only independent tellurium deposit in the world. Chongqing: Chongqing Publishing House, 190pp.
  4. Chen YC, Mao JW, Luo YN, Wei JX, Cao, ZM. (1996) Geology and Geochemistry of the Dashuigou tellurium (gold) deposit in Western Sichuan, China. Beijing: Atomic Energy Press 146pp
  5. Luo, YN, Fu DM, Zhou, SD (1994) Genesis of the Dashuigou tellurium deposit in Sichuan Province of China. Bulletin of Sichuan Geology 14: 101-110.
  6. Luo YN, Cao ZM, Wen, CQ (1996) Geology of the Dashuigou independent tellurium deposit. Chengdu: Southwest Communication University Publishing House 30-45.
  7. Yin JZ (1996) The metallogenic model and mineralizing mechanism of the Dashuigou independent tellurium deposit in Shimian County, Sichuan – the first and only independent tellurium deposit in the world. Acta Geoscientia Sinica special issue 93-97.
  8. Yin JZ, Shi HY (2019) Nano effect mineralization of rare elements–taking the Dashuigou tellurium deposit, Tibet Plateau, Southwest China as the example. Academia Journal of Scientific Research 7: 635-642.
  9. Wang RC, Lu, JJ, Chen XM (2000) Genesis of the Dashuigou tellurium deposit in Sichuan Province, China. Bulletin of Mineralogy, Petrology and Geochemistry 4: 348~349.
  10. Cao ZM, Luo YN (1994) Mineral sequence and ore genesis of the Sichuan telluride lode deposit in China. In: New Research Progresses of the Mineralogy, Petrology and Geochemistry in China. Lanzhou: Lanzhou University Publishing House pg: 476-478.
  11. Cao ZM, Wen CQ, Li BH (1995) Genesis of the Dashuigou tellurium deposit in Sichuan Province of China. Science China (B) 25: 647-654.
  12. Yin, JZ, Zhou JX, Yang BC (1994) Geological characteristics of the Dashuigou tellurium deposit in Sichuan Province, China. Earth Science Frontiers 1: 241-243.
  13. Yin, JZ, Chen, YC and Zhou, JX (1995) Original rock of the host rock of the Dashuigou independent tellurium deposit in Sichuan Province, China. Bulletin of Mineralogy, Petrology and Geochemistry 2: 114-115.
  14. Yin JZ, Chen YC, Zhou JX (1996) Geology and geochemistry of host rocks of the Dashuigou independent tellurium deposit in Sichuan Province, China. Journal of Changchun University of Earth Sciences 26: 322-326.
  15. Yin JZ, Chen YC, Zhou JX (1996) Geology and geochemistry of altered rocks of the Dashuigou independent tellurium deposit in Sichuan Province, China. Journal of Xi’an College of Geology, 18: 19-25.
  16. Chen YC, Yin JZ, Zhou JX (1994) The first and only independent tellurium ore deposit in Dashuigou, Shimian County, Sichuan Province, China. Geol. Sinica 3: 109-113.
  17. Chen YC, Yin JZ, Zhou, JX (1994) Geology of the Dashuigou independent tellurium deposit of Sichuan Province. Acta Geoscientia Sinica 29: 165-167.
  18. Yin JZ, Zhou JX, Yang BC (1994) Rock-forming minerals and ore-forming minerals of the Dashuigou tellurium ore deposit unique in the world – A preliminary study. Geol. Sinica 3: 197-210.
  19. Yin, JZ, Chen YC, Zhou JX (1994k) Mineralogical research of the Dashuigou independent tellurium deposit in Sichuan Province, China. Bulletin of Mineralogy, Petrology and Geochemistry 3: 153-155.
  20. Yin JZ (1996) New mineralogical data of telluride. Bulletin of Mineralogy, Petrology and Geochemistry 15: 246-248.
  21. Liu AP, Zhong ZC, Tang JW (1996) Geochemical characteristics of the Dashuigou tellurium deposit in Sichuan Province of China. Geochemistry 25: 365~371.
  22. Shi HY, Chen YC,Yin JZ, Zhou JX (1996) X-ray diffraction data of telluride. Journal of Mineralogy and Petrology 16: 31-33.
  23. Yin JZ, Shi HY (2020) Mineralogy and stable isotopes of tetradymite from the Dashuigou tellurium deposit, Tibet Plateau, southwest China. Scientific Reports 10.
  24. Yin JZ, Chen YC, Zhou JX (1995) K-Ar isotope evidence for age of the first and only independent tellurium deposit. Chinese Science Bulletin 40: 1933-1934.
  25. Li BH, Cao ZM, Wen CQ (2000) Fluid inclusion type and geological characteristics of the Dashuigou tellurium deposit in Sichuan Province, China. Bulletin of Mineralogy, Petrology and Geochemistry 4: 346-347.
  26. Li TY, Liu JQ (2000) Discussion of analytical methods of grouped fluid inclusion compositions. Geology and Mineral Resources of South China 4: 64-67.
  27. Li BL (1986) Physical chemistry diagram of gas components of fluid inclusions in minerals. Geochemistry 2: 126-137.
  28. Chen PR, Lu JJ, Wang RC (1998) Study on the fluid inclusions of the Dashuigou independent tellurium deposit in Shimian County, Sichuan Province, China. Mineral Deposit 17: 1011-1014.
  29. Li BH, Cao ZM, Jin JF, Wen CQ (1999) Physicochemical conditions of the tellurium deposit in Dashuigou, China. Scientia Geologica Sinica 34: 463-472.
  30. Wang RC, Shen WZ, Xu XJ, Lu JJ, Chen XM, et al. (1995) Isotopic Geology of the Dashuigou tellurium deposit in Sichuan Province, China. Journal of Nanjing University (Natural Sciences) 31: 617-624.
  31. Shen WZ, Xu XJ, Wang RC (1997) Origin of the fluid inclusions of the Dashuigou tellurium deposit in Sichuan Province, China – hydrogen and oxygen isotope evidence. Journal of Nanjing University (Natural Sciences) 33: 77-83.
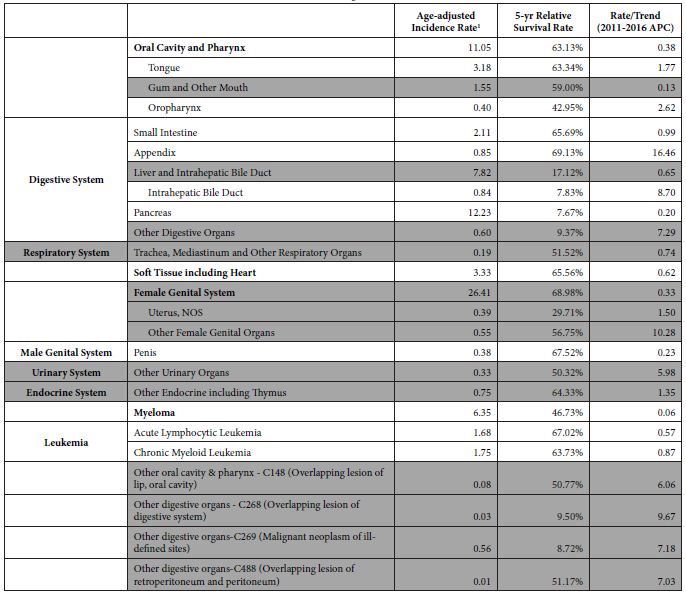
Studying End of Life Conversations: Challenges and Strategies

DOI: 10.31038/IJNM.2021221


End-of-life (EOL) conversations continue to be challenging for patients, families, and healthcare providers (HCPs) [1-3]. Although these dialogues can be emotionally charged, they are critical to ensure that care is aligned with patient preferences. Interventions directed at improving communication about EOL care have been shown to improve patient outcomes. Nurses are in a unique position to assist patients and families with advocating for EOL conversations [4,5]. Advance care planning studies are prominent in EOL literature with the intent of clarifying life sustaining treatment preferences of patients. Unfortunately, most EOL decisions are still made without direct input from patients but rather loved ones are burdened with deciding whether or not to continue life sustaining interventions. In addition, family members report that they were unaware of their loved ones wishes and values with all of the treatment options [6]. More research is needed to develop practical approaches and strategies to enhance EOL conversations to properly align patients’ priorities of care. But conducting these studies remains challenging.

Challenges: First, recruitment can be extremely problematic if the study is targeting patients with specified prognosis. Most HCPs are uncomfortable and lack the knowledge to prognosticate accurately. They are uncomfortable with approaching eligible patients. Additionally, due to variability in patient conditions, availability of patients due to treatments and tests, it is often difficult to schedule interviews. Loved ones are often unavailable during the regular daytime hours. Nurse and HCPs are frequently busy caring for patients. The interviewers are often faculty university members with busy teaching and/or clinical schedules. Other challenges of clinician and stakeholder engagement include the struggle to find convenient, uninterrupted interview times for patients, loved ones and nurses. Furthermore, even if the above challenges are overcome, the interviewers may have discomfort in initiating EOL discussions with both patients and loved ones. Strategies: With the proper study inclusion criteria education and support from more confident, experienced colleagues, nurses can be coached to identify appropriate participants for EOL research. Providing a script to begin the conversations has been shown to be valuable. EOL investigators should expect participant recruitment challenges and plan for ongoing education and support of referral staff. Researchers should plan regularly scheduled debriefing sessions with interviewers to provide emotional support and encouragement to minimize distress. Allocating resources to infuse research into the workplace should involve flexible staffing for participant referral identification and time allocation for interviews of patients and nurses. Providing a scripted approach such as the Patient Preferences About Serious Illness (PASI) [7-9] to introduce the topic may ease HCPs discomfort and allows patients the opportunity to have open, honest dialogues. Ultimately, ongoing discussions between the patient, loved ones and HCPs are the goal throughout the course of the serious illness. More research is needed to improve the process of eliciting EOL discussions between patients and their HCPs and in designing tools such as the PASI. By acknowledging and anticipating the difficulties of having honest EOL dialogues, researchers can tailor strategies to minimize the barriers while promoting opportunities to engage patients, loved ones and HCPs.

References

  1. Trachsel M, Irwin SA, Biller-Andorno N, Hoff P, Riese F (2016) Palliative psychiatry for severe persistent mental illness as a new approach to psychiatry? Definition, scope, benefits, and risks. BMC Psychiatry 16: 1-7.
  2. Scott J, Owen-Smith A, Tonkin-Crine S, Hugh Rayner, Paul Roderick, et al. (2018) Decision-making for people with dementia and advanced kidney disease: A secondary qualitative analysis of interviews from the Conservative Kidney Management Assessment of Practice Patterns Study. BMJ Open [crossref]
  3. Abdul-Razzak A, Heyland DK, Simon J, Ghosh S, Day AG, You JJ (2019) Patient-family agreement on values and preferences for life-sustaining treatment: results of a multicentre observational study. BMJ Support Palliat Care [crossref]
  4. Torke AM, Hickman SE, Hammes B, Steven R Counsell, Lev Inger, et al. (2019) POLST Facilitation in Complex Care Management: A Feasibility Study. Am J Hosp Palliat Med. 36: 5-12. [crossref]
  5. Shaw M, Shaw J, Simon J (2020) Listening to Patients’ Own Goals: A Key to Goals of Care Decisions in Cardiac Care. Can J Cardiol. 36: 1135-1138. [crossref]
  6. Foglia MB, Lowery J, Sharpe VA, Tompkins P, Fox E (2019) A Comprehensive Approach to Eliciting, Documenting, and Honoring Patient Wishes for Care Near the End of Life: The Veterans Health Administration’s Life-Sustaining Treatment Decisions Initiative. Jt Comm J Qual Patient Saf 45: 47-56. [crossref]
  7. Whitehead PB, Clark RC (2016) Addressing the challenges of conducting research with end-of-life populations in the acute care setting. Appl Nurs Res. 30: 12-15. [crossref]
  8. Whitehead PB, Carter KF (2017) A model for meaningful conversation in serious illness and the patient preferences about serious illness instrument. J Hosp Palliat Nurs.
  9. Whitehead PB, Ramalingam N, Carter KF, Katz K, Harden S (2016) Nurse practitioners’ perspectives on the patient preferences about serious illness instrument. J Hosp Palliat Nurs.

Squamous Cell Carcinoma in a Dog (Canis familiaris) Treated by the Viscum album Therapy – Case Report

DOI: 10.31038/IJVB.2021533

Abstract

Squamous Cell Carcinoma is defined as a common malignant neoplasm in the clinical routine of small animals. The treatment of choice includes surgical removal, chemotherapy, radiotherapy, cryosurgery, most of which result in mutilation, deformation, side effects, metastases, and recurrences. Therapy failure is reported by several authors and depends on the disease stage and the patient’s age and health condition. The need for developing new therapies for cancer treatment is well-known, aiming the prophylaxis, treatment, and, when possible, cure of the disease. Under this scope, the Viscum album therapy has been used for more than 100 years by human medicine with reported success in several types and stages of cancer. Therefore, this work describes the administration of ultra-diluted Viscum album in a dog diagnosed with oral SCC. The disease was successfully cured, which was later confirmed by histopathology analysis.

Keywords

Cancer, Viscum album, Dog, Therapy

Introduction

Squamous Cell Carcinoma (SCC) is defined as a relatively common malignant neoplasm, accounting for 5% of all skin tumors. It is considered the second most common oral cancer type (31%) in dogs and cats [1], behind oral melanoma (44%) and prior to oral fibrosarcoma (25%) [2]. However, SCC can arise in various locations in the body [1,3]. In humans, it accounts for 20% of all skin cancers, resulting in 1 million cases in the United States each year. Most cutaneous SCCs are treated locally. However, there is a high incidence of recurrences, metastases, followed by death [3].

The SCC resulting from the oral mucosa epithelium is locally invasive, being considered a severe disease and directly dependent on the stage of the disease’s evolution. It is considered a deforming pathology due to the rapid infiltration of neoplastic cells in the tissues, orofacial destruction, and possible metastases [4].

The SCC etiology is probably multifactorial. Several risk factors are involved, including the use of flea collars and history of industrialized feeding in cats [1,5].

The treatment of choice for oral SCC is surgical, which is considered the best option. However, most of the time, patients are mutilated [5]. Early SCC diagnosis and treatment are essential since initial stage tumors are the most amenable to treatment and with the best prognosis [1]. Surgery, radiotherapy, chemotherapy, and their combinations are also possible options for this treatment. Nevertheless, they have already been tested and rarely presented a satisfactory response. An integrative treatment approach appears to be a better option for successful therapy in these cases [5]. In addition, one must consider animals in advanced stages of the disease and those in palliative care. These patients can benefit from such therapies with regard to improving their quality of life until their death, providing them dignity. In situations like those mentioned above, an approach within integrative therapies would probably offer a better chance of success due to the limitations of the treated patients [5].

Within this context, Valle and Carvalho [6] refer to administering the Viscum album therapy for prophylaxis, treatment and/or cure of cancer patients in its various stages, including animals in palliative care. Viscum album is an excellent treatment option for cancer patients as it has a bidirectional action stimulating the immune system of patients and selectively exerting cytotoxicity against tumor cells [7]. Besides that, it does not have side effects on the body. For this reason, the Viscum album therapy has been used for more than 100 years by human medicine with reported success in several types and stages of cancer [8]. This study aimed to report the case of a 16-year-old female dog with a diagnosis of oral SCC, treated using an ultra-diluted Viscum album.

Case Report

A 16-year-old female Maltese dog weighing 3.9 kg, fed with commercial food, was seen at NaturalPet Clinic in Brasilia, DF, Brazil. The patient was diagnosed with a well-differentiated SCC (60%; Figure 1) four weeks before the veterinary appointment at NaturalPet. The biopsy report carried out by the Histopato Laboratory (Brasilia, DF, Brazil) details that approximately 60% of the analyzed fragment was affected by neoplastic, hypercellular, homogeneous, infiltrated, not well-demarcated, and non-encapsulated lesion. The neoplastic cells were arranged in cohesive blocks bordering concentric and cohesive keratin sheets (keratin pearl). The cells were polygonal with moderate and eosinophilic cytoplasm, rounded nucleus, dispersed chromatin, single and evident nucleolus. Vessels and margins were affected by neoplastic cells.

fig 1

Figure 1: Photomicrograph A. Arrow: Keratin pearl. B. Arrow: Vascular involvement by neoplasm (Photo: Laboratory of Pathology – Histopato, Brasilia-Brazil).

On physical examination, the patient showed aggressive behavior and, at the slightest attempt to touch, she already reacted in a very hostile way. Therefore, the examination was performed very carefully. The animal had normal-colored mucous membranes, CPT 2″, cardiac and respiratory auscultation within the expected range for age and species, hydration conditions within the normal range, moderate sialorrhea accompanied by halitosis. An ulcerated lesion was observed, and the fur was stained with blood around it. The lesion was located below the upper lip, exacerbating gingival mass (Figure 2). The impossibility of manipulating the patient made the examination difficult, but the tutor helped with the procedure. A protocol was instituted using the Viscum album therapy, and it consisted of the first application of Viscum album D3 (1 X 10⁻³), intravenously, every seven days, for four weeks, associated with the administration of Viscum album D3, subcutaneously, one ampoule (1.1 mL), once a day, on alternate days, initially for 30 days. The subcutaneous applications were performed by the tutor. In addition, it was recommended to replace the commercial diet with a natural diet consisting of a low-carbohydrate recipe (15%). Blood was also collected for laboratory tests of complete blood count and biochemical measurements of alanine aminotransferase (ALT), alkaline phosphatase (AP), urea, and creatinine.

fig 2

Figure 2: Appearance of the initial lesion. Blue arrow: increased volume of the upper lip with edema. Yellow arrow: mass adhered between upper lip and gum, diagnosed by biopsy and histopathology as squamous cell carcinoma.

Results

The results of the blood tests showed – Red blood cells: 7,200,000/uL; Hemoglobin: 15.9 g/dL; Hematocrit: 45%; MCV: 62.5 fL; MCHC: 35.33 g/dL; Leukocytes: 27.400/uL; Platelets: 308.000/uL; ALT – 58 U/L; AP: 61 U/L; Creatinine: 0.61 mg/dL; Urea: 32 mg/dL.

The patient returned to the clinic for the second Viscum album intravenous application, and the mass had surprisingly reduced about 90% of its total size, compared to the initial lesion, remaining only a slight edema on the upper lip (Figure 3). The tutor reported improvement in the animal’s overall condition, improved appetite, sleep quality, and mood. The animal also returned to show interest in playing as she previously used to do. After 30 days of treatment, the affected site was completely restored (Figure 4).

fig 3

Figure 3: Appearance of the lesion after seven days of treatment with Viscum album subcutaneous applications on alternate days. Blue arrow: residual edema in the upper lip.

fig 4

Figure 4: Appearance of the region previously diagnosed with SCC. Result of the treatment 30 days after Viscum album applications. Both images demonstrate the disappearance of the tissue between the upper lip and gum, previously seen, and the edema reduction in the superior lip.

Eight months after the complete reestablishment, the animal returned to the clinic for dental prophylaxis. On this occasion, a new fragment was collected of the region previously affected and diagnosed as SCC. The sample was sent for histopathology analysis to the VetPat Laboratory in Campinas, SP, Brazil. The result showed the presence of fibroconjunctive tissue with the prevalence of scar tissue. Thus, the medication (Viscum album D3) was maintained, but only once a day, three times a week, subcutaneously. However, the animal died (acute renal disease) six months after the dental prophylaxis procedure, at 17 years.

Discussion

Cancer is the primary cause of death or euthanasia in veterinary patients. The oral cavity is in fourth place with the highest incidence, being behind only the mammary gland, genitals, and skin. In general, oral tumors are only noticed when the disease is already in an advanced clinical stage [9,10].

Among oral neoplasms, SCC has been considered a malignant and ulcerative epidermal tumor with a poor prognosis, depending on the stage of the disease evolution [11]. SCC is considered the second most common oral malignant neoplasm in dogs [2] and one of the most commonly diagnosed tumors in humans [12]. It has already been described in the lips, gums, tonsils, oral mucosa, and tongue [13,14]. In many cases, metastasis occurs by lymphatic vessels, mainly to the mandibular region and/or retropharyngeal lymph nodes and lungs [14]. However, in the case here reported, no sign of metastasis was observed in the physical evaluations performed while the animal was monitored until the day of its death. This fact could probably be due to the well-differentiated characteristic of the tumor since metastasis seems to be related to the differentiation degree of neoplastic cells, the most likely occurrence in tumors with little differentiation [15].

The treatment for cancer patients aims primarily at the eradication of the affected tissue, prioritizing the preservation of the functional structure of the affected area, and when possible, its aesthetic appearance [10]. Several options are available for treating this disease in small animals, such as surgical excision, systemic and/or intralesional chemotherapy, radiotherapy, cryosurgery, and immunotherapy [16]. According to Wiggs and Lobprise [17] and Gioso [18], surgery therapy is the most efficient among these options.

However, most conventional treatments do not contemplate the total cure of the disease, nor do they excel in the patient’s life quality, causing, several times, various side effects and the occurrence of metastases. In contrast to the therapies of choice or conventional therapies, this report affirms the effectiveness of treatment here used for treating SCC, which did not have side effects on the patient and resulted in the total cure of the disease, improving the patient’s quality of life, as stated by the tutor.

According to Gioso [18], a favorable prognosis with no or reduced tumor recurrences would demand surgical resection with a wide safety margin. Such procedures may cause significant deformations, mutilations, altering the functional structure of the organ affected. There are also complications associated with the postoperative period of maxillary or mandibular resection, which may include anorexia, tongue projection, difficulty in grasping food, palatal ulcer due to malocclusion, dehiscence of the surgical wound, infection, oronasal fistula, epistaxis, disorders in the salivary gland ducts, and excessive salivation [19]. Contrasting these authors, the prognosis of the present case indicated that depending on the tumor stage the Viscum album therapy should be considered a real option for treating cancer patients, either as a palliative treatment or even aiming at the patient’s cure.

The findings here reported corroborate with Valle and Carvalho [6], who referred to the healing of ulcerated lesions caused by SCC in the breast in a patient in palliative care. However, this study not only showed the resolution of an ulcerated lesion but also demonstrated the complete cure of the process, which was confirmed by an incisional biopsy performed ten months after the initial SCC diagnosis and by the absence of metastasis recurrence.

Conclusion

These data meet the need for new treatment options for cancer patients at different disease stages. The ultra-diluted Viscum album has been shown to be an excellent treatment option for these patients, whether in search of a cure for cancer or just in search of palliative care. Further studies are still needed to confirm the effectiveness of such effects in patients in the various stages of the disease.

Conflict of Interest

The authors declare that there is no conflict of interest in this case report.

References

  1. Webb JL, Burns RE, Brown HM, LeRoy BE, Kosarek CE (2009) Squamous cell carcinoma. Compend Contin Educ Vet 31: 133-142.
  2. Gardner DG (1996) Spontaneous squamous cell carcinomas of the oral region in domestic animals: a review and consideration of their relevance to human research. Oral Dis 2: 148-154. [crossref]
  3. Waldman A, Schmults C (2019) Cutaneous Squamous Cell Carcinoma. Hematol Oncol Clin North Am 33: 1.
  4. Thomson PJ (2018) Perspectives on oral squamous cell carcinoma prevention-proliferation, position, progression and prediction. J Oral Pathol Med 47: 803-807. [crossref]
  5. Bilgic O, Duda L, Sánchez MD, Lewis JR (2015) Feline Oral Squamous Cell Carcinoma: Clinical Manifestations and Literature Review. J Vet Dent 32: 30-40. [crossref]
  6. Valle ACV, Carvalho AC (2021) Homeopathic Viscum Album on the Treatment of Scamous Cell Carcinoma Lesion in a Dog (Canis familiaris) – Case Report. Integr J Vet Biosc 5: 1-3.
  7. Valle ACV, Carvalho AC, Andrade RV (2021) Viscum Album – Literature Review. Int J Sci Res 10: 63-71.
  8. Valle ACV (2020) In vitro and in vivo evaluation of the ultra-diluted Viscum album efficacy and safety. Doctorate dissertation. Catholic University of Brasilia – UCB, Brasilia-DF, Brazil, 78.
  9. Cotran RS, Kumar V, Collins T (2000) Neoplasia. In: Structural and functional pathology. 6th ed. Rio de Janeiro: Guanabara Koogan 233-241.
  10. Howard PE (2002) Maxillary and mandibular neoplasms. In Bichard SJ, Sherding RG (Eds) Saunders Manual – Small animal clinic. 2nd ed. Roca: São Paulo 1181-1189.
  11. Rodaski S, Werner J (2008) Skin neoplasms. In Daleck CR, De Nardi AB, Rodaski S (Eds) Oncology in dogs and cats. Roca: São Paulo 253-279.
  12. Uma RS, Naresh KN, D ́Cruz AK, Mulherkar R, Borges AM (2007) Metastasis of squamous cell carcinoma of the oral tongue is associated with down-regulation of epidermal fatty acid binding protein (E-FABP). Oral Oncol 43: 27-32. [crossref]
  13. Dhaliwal RS, Kitchell BE, Maretta SM (1998) Oral tumors in dogs and cats. Part I. Diagnosis and clinical signs. Compend Continuing Educ Vet 20: 1011-1021.
  14. Meuten DJ (2002) Tumors of the alimentary tract. Tumors of domestic animals. 4th ed. Iowa: Iowa State Press 509-546.
  15. Denis MM, Ehrhart N, Duncan CG, Barnes AB, Ehrhart EJ (2006) Frequency and risk factors associated with lingual lesions in dogs: 1,196 cases (1995-2004). J Am Vet Med Assoc 228: 1533-1537. [crossref]
  16. Mayer MN, Anthony JM (2007) Radiation therapy for oral tumors: Canine acanthomatous ameloblastoma. Can Vet J 48: 99-101. [crossref]
  17. Wiggs RB, Lobprise HB (1997) Veterinary Dentistry, Principles and Practice. Philadelphia: Lippncott-Raven 748.
  18. Gioso MA (2007) Neoplasia da cavidade oral. In: Veterinary odontology for the small animal clinician. 2nd ed. Sao Paulo: Manole 91-100.
  19. Kessler M (2006) Mandibulectomy and maxillectomy as a treatment for bone invasive oral neoplasia in the dog – a retrospective analysis of 31 patients. Europ J Comp Anim Pract 16: 73-82.

COVID Face Masks and the Wuhan Lab Escape Theory: An Update

DOI: 10.31038/JNNC.2021422

Developments Concerning the Wuhan Lab Leak Theory

Only a few months ago, a commentary, with supporting evidence, and a supporting quotation from the former head of the CDC, that the Wuhan lab leak theory for the origin of the COVID-19 epidemic “is a rational, reasonable, and scientifically grounded theory” could have been characterized as a conspiracy theory [1]. Now, a few months later, the Wuhan lab leak theory is being acknowledged widely in the mainstream media as just that – rational, reasonable, and scientifically grounded [2,3]. The fact that Chinese military experiments have been conducted at the Wuhan Institute of Virology has recently been confirmed by Mike Pompeo, a former US Secretary of State and former Director of the CIA [3], and is stated on a US Government website [4]: “Despite the WIV presenting itself as a civilian institution, the United States has determined that the WIV has collaborated on publications and secret projects with China’s military. The WIV has engaged in classified research, including laboratory animal experiments, on behalf of the Chinese military since at least 2017.” https://ge.usembassy.gov/fact-sheet-activity-at-the-wuhan-institute-of-virology/

A few months ago, such a statement would have been dismissed as a conspiracy theory. The mainstream media is now pointing out that gain of function research on coronaviruses at the Wuhan Institute of Virology was funded by the NIH and NIAID [2,3]. In 2015, researchers from the United States and the Wuhan Institute of Virology published a paper in a medical journal stating that gain of function research at the Wuhan Institute of Virology was funded by the NIH and NIAID [5]. Several quotations from this paper confirm this fact: “In addition to offering preparation against future emerging viruses, this approach must be considered in the context of the US government–mandated pause on gain-of-function (GOF) studies. (p. 1512) On the basis of these findings, scientific review panels may deem similar studies building chimeric viruses based on circulating strains too risky to pursue, as increased pathogenicity in mammalian models cannot be excluded. (p 1512) In developing policies moving forward, it is important to consider the value of the data generated by these studies and whether these types of chimeric virus studies warrant further investigation versus the inherent risks involved. (p. 1513)”

The paper describes the contributions to this gain of function research by coauthor Xing-Ye Ge at the Wuhan Institute of Virology. Despite this paper being published in 2015, until recently anyone claiming that the NIH and NIAID funded gain of function research on coronaviruses at the Wuhan Institute of Virology would have been dismissed as a conspiracy nut, and likely as a racist xenophobe. In a February, 2021 article [6], Dr Peter Ben Embarek, speaking as a member of the WHO investigation team on the origins of the COVID-19 pandemic, was quoted as dismissing the Wuhan lab leak theory. Dr. Embarek is the President of Eco Health Alliance which acted as a conduit for the NIH and NIAID funding of coronavirus gain of function research at the Wuhan Institute of Virology [2]. Funding of this research by Eco Health Alliance is acknowledged by the authors of the 2015 paper reporting that research [7].

Former US Secretary of State and Director of the CIA, Mike Pompeo was quoted as saying in a May 25, 2021 [8] article that: “It was outrageous to see scientists, even government, U.S. government scientists who were denying this when they surely must have seen the same information that I had seen,” Pompeo said. “That includes certainly Dr. Fauci as well.” https://www.foxnews.com/politics/pompeo-outrageous-fauci-lab-leak-theory. Dr. Fauci has been denying that NIAID funded gain of function research at the Wuhan Institute of Virology. He and Dr. Francis Collins, Director of the NIH both denied this in recent testimony to the US House Appropriations Committee. A video of Dr. Fauci making this denial is available along with a May 25, 2021 article on the topic [5]. There are only two possible explanations for Dr. Fauci’s denial of NIH and NIAID funding of coronavirus gain of function research as the Wuhan Institute of Virology: 1) he is not telling the truth, or 2) he has no idea what is going on at NIAID. Gain of function research means modifying viruses to make them more infectious and more deadly. Need we ask why the Chinese military has been funding research at the same lab in the same time period? The United States government has funded such research at the Wuhan Institute of Virology, so the US should not be pointing a finger at China.

It is an important question whether the COVID-19 pandemic originated due to the virus jumping from bats to humans in the wild or from a leak at the Wuhan Institute of Virology. However, it is more important to investigate the disinformation originating from medical leadership in the United States and the discrediting of anyone who questions government public health policies concerning COVID-19 – the discrediting is done with charges of being anti-scientific, a conspiracy nut, a racist, and a xenophobe. Curiously, but not surprisingly, the charge of anti-science is often brought against ‘conspiracy nuts’ by people who themselves are anti-scientific.

Things are changing, however. A May 28, 2021 article [9] discusses a paper in press at Quarterly Reviews of Biophysics Discovery [10] that provides compelling evidence that the COVID-19 virus was engineered at the Wuhan Institute of Virology as part of gain of function research conducted there. According to the author of the May 28 article, this research by Sorensen, Susrud and Dalgleish, who have previously published in the same journal [11], was rejected by a number of journals before finally being published. The May 28 article states that: [Sorensen, Susrud and Dalgleish] said they tried to publish their findings but were rejected by major scientific journals which were at the time resolute that the virus jumped naturally from bats or other animals to humans.

Even when former MI6 chief Sir Richard Dearlove spoke out publicly saying the scientists’ theory should be investigated, the idea was dismissed as ‘fake news.’ Over a year later, leading academics, politicians and the media finally flipped, and have begun to contemplate the possibility that COVID-19 escaped from the Wuhan Institute of Virology in China – a lab where experiments included manipulating viruses to increase their infectiousness in order to study their potential effects on humans. Soon, hopefully, physicians and researchers will no longer be blackballed for taking the Wuhan lab leak theory seriously.

Licensing Body Sanctions against Physicians Who Question Public Health Policies about Face Masks

We are now moving into a phase of the COVID-19 pandemic in which centralized government and regulatory bodies are threatening physicians with sanctions if they question public health policies concerning face masks for COVID-19 protection. The College of Physicians and Surgeons of Ontario recently issued a Statement concerning COVID-19 [12]: The College is aware and concerned about the increase of misinformation circulating on social media and other platforms regarding physicians who are publicly contradicting public health orders and recommendations. Physicians hold a unique position of trust with the public and have a professional responsibility to not communicate anti-vaccine, anti-masking, anti-distancing and anti-lockdown statements and/or promoting unsupported, unproven treatments for COVID-19. Physicians must not make comments or provide advice that encourages the public to act contrary to public health orders and recommendations. Physicians who put the public at risk may face an investigation by the CPSO and disciplinary action, when warranted. When offering opinions, physicians must be guided by the law, regulatory standards, and the code of ethics and professional conduct. The information shared must not be misleading or deceptive and must be supported by available evidence and science.”

It is a scientifically proven fact that face masks have no effect on the transmission of viruses in public and no effect on rates of disease [13-16]. This fact is based on multiple randomized controlled trials and meta-analyses. Any Ontario physician who tells patients this scientific fact is now in danger of being censored and sanctioned by the Ontario College of Physicians and Surgeons of Ontario. Perhaps, in another year, leading physicians will be stating that mandating of face masks was a well-intentioned social control tactic but is not supported by science. Perhaps medical authorities will be citing non-existent ‘newly emerging data’ as a justification for no longer requiring face masks in public, even for unvaccinated persons. Or perhaps not. Perhaps we will be stuck with a pandemic of iatrogenic anxiety based on fears about no longer wearing face masks.

A concluding question: what is the difference between a conspiracy theory and the truth? Answer: 6-12 months.

References

  1. Ross CA (2021) Misinformation concerning face masks and the Wuhan lab leak. Journal of Neurology Neurocritical Care 4: 1-3.
  2. Knapton A (2021) Why the Covid Wuhan lab escape theory, dead and buried months ago, has risen again. https://www.yahoo.com/news/why-covid-wuhan-lab-escape-152301731.html.
  3. Shaw A (2021) Pompeo says Wuhan lab was engages in military activity alongside civilian research. https://www.yahoo.com/news/pompeo-says-wuhan-lab-engaged-154413535.html.
  4. https://ge.usembassy.gov/fact-sheet-activity-at-the-wuhan-institute-of-virology/
  5. Chamberlain S (2021) Fauci admits ‘modest’ NIH funding of Wuhan lab but denies ‘gain of function’. https://nypost.com/2021/05/25/fauci-admits-nih-funding-of-wuhan-lab-denies-gain-of-function/.
  6. Newey S (2021) Expert from WHO origins investigation warns against relying -too much on US intel’ on COVID-19. https://www.telegraph.co.uk/global-health/science-and-disease/expert-origins-investigation-warns-against-relying-much-us-intel/
  7. Menachery VD, Yount BL Jr, Debbink K, Agnihothram S, Gralinski LE, et al. (2015) A SARS-like cluster of circulating bat coronaviruses shows potential for human emergence. Nature Medicine 21: 1508-1513. [crossref]
  8. Olson T (2021) Pompeo says it’s ‘outrageous’ US officials, including Fauci, dismissed lab leak theory. https://www.foxnews.com/politics/pompeo-outrageous-fauci-lab-leak-theory.
  9. Boswell J (2021) Covid-19 ‘has NO credible natural ancestor’ and WAS created by Chinese scientists who then tried to cover their tracks with ‘retro-engineering’ to make it seem like it naturally arose from bats, explosive new study claims. https://www.dailymail.co.uk/news/article-9629563/Chinese-scientists-created-COVID-19-lab-tried-cover-tracks-new-study-claims.html.
  10. Sorensen B, Susrud A, Dalgleish AG (in press) A reconstructed aetiology of the SARS-Coronavirus-2 spike. Quarterly Reviews of Biophysics Discovery.
  11. Sorensen B, Susrud A, Dalgleish AG (2020) Biovacc-19: A candidate vaccine for Covid-19 (SARS-CoV-2) developed from analysis of its general method of action for infectivity. Quarterly Reviews of Biophysics Discovery. doi: 10.1017/qrd.2020.8.
  12. College of Physicians and Surgeons of Ontario. https://www.cpso.on.ca/News/Key-Updates/Key-Updates/COVID-misinformation.
  13. Ross CA (2020) Differences in evaluation of hydroxychloroquine and face masks for SARS-CoV-2. Journal of Neurology and Neurocritical Care 3: 1-3.
  14. Ross CA (2020) Thoughts on COVID-19. Journal of Neurology and Neurocritical Care 3: 1-3.
  15. Ross CA (2020) Facemasks are not effective for preventing transmission of the coronavirus. Journal of Neurology and Neurocritical Care 3: 1-2.
  16. Ross CA (2020) How misinformation that facemasks are effective for reducing COVID-19 is transmitted. Journal of Neurology Neurocritical Care 3: 1-2.