Commentary
One year after the declaration of the state of alarm due to SARS-CoV-2 in Spain (March 14, 2020) the authors wanted to know the impact that the changes implemented in the health system have had on the creation of new prescriptions in our organization (Integrated Health Organization (IHO) Bidasoa). Bidasoa IHO is a health organization belonging to Osakidetza, it serves more than 85,000 inhabitants and is composed of 3 health centers and a regional hospital.
This is the continuation of the analysis made of the first 3 months after the declaration of the state of alarm [1] and analyzes the new prescriptions made from March 14, 2020 to March 13, 2021 (one year since the declaration of the first state of alarm due to the pandemic in Spain) and compares them with those started between March 14, 2019 and March 13, 2020 (one year earlier). The prescriptions created by Primary Care physicians (family doctors, pediatricians, and doctors of Continuing Care Points and nursing homes), hospital outpatient clinics and outpatient consultations, and the hospital emergency services have been reviewed. All the data were obtained from the OAS (Oracle Analytics Server) tool, which records the electronic prescriptions [2].
In the Bidasoa IHO during this period 231,876 new prescriptions were created compared to 171,830 a year earlier, which represents a reduction of 25.9% (Table 1).
Table 1: Prescriptions initiated between March 14, 2020 and March 13, 2021 in Bidasoa IHO, compared to the same period of the previous year [2].
| New prescriptions |
2019/2020 |
2020/2021 |
Variation |
| Total |
231.876 |
171.830 |
-25,9% |
| Acute |
94.837 |
69.318 |
-26,9% |
| Chronic |
137.039 |
102.512 |
-25,2% |
| On demand |
168.076 |
117.909 |
-29,8% |
| Gender: Men |
41.033 |
35.529 |
-13,4% |
|
Women |
22.767 |
18.392 |
-19,2% |
During the first twelve months after the declaration of the state of alarm, there have been substantial changes in the way of working in health care, including an increase in telephone consultations and a decrease in face-to-face consultations, or the successive automatic extensions of many of the chronic and on demand treatments. These facts are emerging as the most plausible reasons for the decrease in the new prescriptions initiated in this period.
The total number of medication containers dispensed in pharmacy offices between March 2020 and February 2021 compared to the same period of the previous year, has been reduced by 3% [3]. In other words that means that, in the same period in which there was a 25.9% reduction in the creation of new prescriptions, only 3% less medication was dispensed in pharmacies. This difference could be explained, among other reasons, by the successive automatic extensions of the treatments that have been carried out in the last year, which could mean that fewer treatment reviews have been carried out for chronic patients.
New prescriptions were analyzed by therapeutic groups and 3 groups stand out in terms of their reduction: in group R (respiratory) new prescriptions were reduced by 42.9%, in group M (musculoskeletal) by 35.4 % and in group J (anti-infectives for systemic use) by 34.6% (Figure 1).
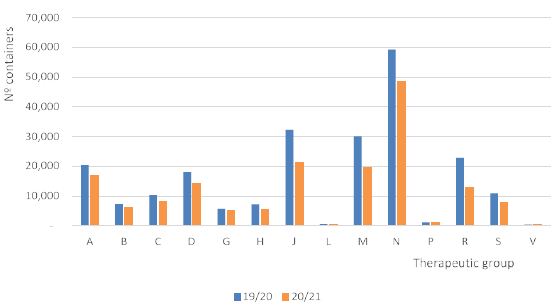
Figure 1: Start of prescriptions by therapeutic group March 14, 2020 to March 13, 2021 vs. same period of the previous year [2].
Likewise, some therapeutic subgroups have been reviewed and it is observed that in the vast majority of subgroups there is a reduction in the initiation of new prescriptions. The reduction is greater than 30% compared to the previous year in some subgroups such as: agents affecting bone structure and mineralization (M05) 41.9%, agents against obstructive airways conditions (R03) 39.4 %, systemic antibiotics (J01) 36.4%, opioids (N02A) 36.3%, NSAIDs (M01A) 35.9%, other analgesics and antipyretics (N02B) 31.6%, otologicals (S02) 31.1%, lipid modifiers (C10) 30.9% and calcium channel blockers (C08) 30%. On the contrary, an increase in the creation of new prescriptions was detected in the following subgroups: insulins (A10A) 52.9%, diuretics (C03) 1.4% and direct-acting anticoagulants (B01AE and B01AF) 10.5% (Table 2).
Table 2: Variation in the initiation of prescriptions in some therapeutic groups under the study period [2].
| Therapeutic subgroup |
2019 |
2020 |
Variation |
| A02. Antacids |
8.664 |
6.931 |
-20,0% |
| A10A. Insulins |
408 |
624 |
52,9% |
| A10B. Non-insulin antidiabetics |
1.439 |
1.053 |
-26,8% |
| A11. Vitamins |
2.105 |
1.611 |
-23,5% |
| B01. Antithrombotics |
3.577 |
3.103 |
-13,2% |
| B01AE and B01AF. Direct-acting anticoagulants |
218 |
241 |
10,5% |
| B03. Antianemics |
3.370 |
2.752 |
-18,3% |
| C02. Antihypertensives |
126 |
102 |
-19,0% |
| C03. Diuretics |
1.776 |
1.801 |
1,4% |
| C07. Beta-blockers |
885 |
799 |
-9,7% |
| C08. Calcium channel blockers |
874 |
612 |
-30,0% |
| C09. Inhibitors of the renin-angiotensin system |
3.490 |
2.573 |
-26,3% |
| C10. Lipid modifiers |
1.631 |
1.127 |
-30,9% |
| J01. Systemic antibiotics |
30.599 |
19.469 |
-36,4% |
| M01A. Nonsteroidal anti-inflammatory drugs |
28.591 |
18.327 |
-35,9% |
| M05. Agents for bone structure and mineralization |
363 |
211 |
-41,9% |
| N02A. Opioids |
9.634 |
6.135 |
36,3% |
| N02B. Other analgesics and antipyretics |
24.128 |
18.487 |
-23,4% |
| N02C. Anti-migraine |
472 |
323 |
-31,6% |
| N03. Antiepileptics |
2.547 |
2.329 |
-8,6% |
| N04. Antiparkinsonians |
159 |
116 |
-27,0% |
| N05. Antipsychotics |
13.840 |
13.319 |
-3,8% |
| N05B and N05C. Benzodiazepines |
11.010 |
10.463 |
-5,0% |
| N06A. Antidepressants |
4.879 |
4.529 |
-7,2% |
| R03. Agents for obstructive airway conditions respiratorias |
7.600 |
4.595 |
-39,5% |
| R06A. Systemic antihistamines |
6.380 |
4.535 |
-28,9% |
| S01. Ophthalmology |
8.101 |
5.764 |
-28,8% |
| S02. Otologic |
2.464 |
1.698 |
-31,1% |
In some of the therapeutic subgroups, we found it interesting to go down to the level of active ingredients. In the NSAID group, there have been significant decreases in the initiation of new prescriptions in all the most prescribed active ingredients, highlighting ibuprofen (Table 3).
Table 3: Active ingredients of the group of NSAID with the highest number of starts of prescriptions in the study period[2].
| Non-steroidal anti-inflammatory drugs |
2019/20 |
2020/21 |
Variation |
| Celecoxib |
632 |
538 |
-14,9% |
| Dexketoprofen |
4.050 |
3.183 |
-21,4% |
| Diclofenac (including associations) |
2.695 |
1.786 |
-33,7% |
| Etoricoxib |
1.133 |
891 |
-21,4% |
| Ibuprofen (including ibuprofeno arginine) |
15.102 |
8.341 |
-44,8% |
| Naproxen (including association with esomeprazole) |
4.364 |
3.238 |
-25,8% |
Systemic antibiotics have also suffered a significant decrease in the number of prescriptions created during the year that followed the declaration of the state of alarm, with several active ingredients with a reduction of around or more than 60% reduction compared to the previous year (amoxicillin, azithromycin, phenoxymethylpenicillin, levofloxacin or moxifloxacin). Cefuroxime and, to a lesser degree, fosfomycin, have increased the new prescriptions in this period (Table 4).
Table 4: Active ingredients of the group of systemic antibiotics with the highest number of prescription starts in the period under study [2].
| Systemic antibiotics |
2019/20 |
2020/21 |
Variation |
| Amoxicillin |
7.905 |
3.154 |
-60,1% |
| Amoxicillin/clavulanate |
7.558 |
5.074 |
-32,9% |
| Azithromycin |
4.268 |
1.786 |
-58,1% |
| Cefuroxime |
1.245 |
1.515 |
21,7% |
| Ciprofloxacin |
1.519 |
1.392 |
-8,4% |
| Clarithromycin |
355 |
221 |
-37,7% |
| Phenoxymethylpenicillin |
165 |
56 |
-66,1% |
| Fosfomycin |
3.831 |
3.873 |
1,1% |
| Levofloxacin |
1.560 |
614 |
-60,6% |
| Moxifloxacin |
235 |
88 |
-62,5% |
The profile of new antibiotic prescriptions in pediatrics was also analyzed (Table 5). The reduction in new antibiotic prescriptions in pediatrics is even more pronounced than in the case of adults, and has remained so during these 12 months.
Table 5: Active ingredients of the group of systemic antibiotics with the highest number of prescription starts in the period under study [2].
| Systemic antibiotics (pediatrics) |
2019/20 |
2020/21 |
Variation |
| Amoxicillin |
1.999 |
456 |
-77,2% |
| Amoxicillin/ clavulanate |
714 |
431 |
-39,6% |
| Azithromycin |
563 |
186 |
-67,0% |
| Total antibiotics |
3.402 |
1.190 |
-65,0% |
Finally, we wanted to check whether the significant decrease in new NSAID prescriptions could have shifted to other analgesics, such as paracetamol or metamizole. This was not the case in the periods analyzed previously and does not appear to be the case at present (Table 6).
Table 6: New prescriptions of non-NSAID analgesics in the study period [2].
| N02B – Other analgesics and antipyretics |
2019/20 |
2020/21 |
Variation |
| Metamizole |
8.689 |
7.483 |
-13,9% |
| Paracetamol alone |
15.388 |
10.983 |
-28,6% |
| Paracetamol with codeine |
4.434 |
1.343 |
-69,7% |
In summary, the creation of new prescriptions in the last year compared to the previous year has been reduced by 25.9%; however, the dispensing of drugs in pharmacy offices has only been reduced by 3%. This means that the medication consumed by the Bidasoa IHO population has been quantitatively similar to that of the previous year, probably due to the successive automatic extensions of medications that have been applied during this time.
References
- Mendizabal Olaizola A, Valverde Bilbao E (2020) Impacto de la pandemia SARS-CoV-2 en el inicio de las prescripciones. J Healthc Qual Res 402-403.
- Data obtained from Osakidetza’s OAS (Oracle Analytics Server) tool.
- Data obtained from Health Department’s OBIEE (Oracle Business Intelligence Enterprise Edition) tool.