Author Archives: author

Rate of Patient’s Recruitment and Recruitment Derivatives and External Factors – Population, Living Area and Density of Living Area

DOI: 10.31038/JCRM.2021432

Abstract

Absence of recruitment in clinical trials reached 80% which lead to failures of clinical trials and needed drug do not reach the patients. To find out the reasons of failures in recruitment the authors is considering many factors. A factors which are decreasing the recruitment is very diverse and there is no the classification of it. We suggested the simple classification and investigated the rate of recruitment in the light of some factors using parameters reflecting the recruitment progress on the site’s level.

Materials and methods: Data of four clinical trials II-III phases in oncology and hematology, conducted since 2007 to 2017 years has been used for retrospective analysis.

Study objectives: To investigate the study recruitment rate using different parameters and it’s changes along with acting of factors; to develop new parameters and values (derivatives) which could be sensitive for evaluation of factor’s action.

Statistical analysis: Data had been collected from feasibility questionnaires, open statistical sources.

Results: It was determined rate of recruitment and it’s derivatives where was acting internal factors.

Discussion: Recruitment been undergone the internal factors. The way of action is multidirectional and could boost the recruitment and in opposite to decrease one and knowing it is important in success of recruitment and clinical trial itself eventually.

Introduction

Chin Feman P. – [1] found that factors influencing to recruitment is quite diverse and difficult to estimate due to highly variable. It is found more than 30 factors influencing to recruitment and much of them can ruin the trials due to fail of recruitment (D. Fogel, 2018). The possibility to predict the recruitment based on the acting of factors is said by M. Rutger at al., (2017) and they also found more than 30 factors acting differently to recruitment. These authors used the feasibility questionnaire to collect the data. There is no universal classification of the factors and authors as a rule being limited by just the listing of the factors. To estimate the way of factors action’s the authors using figures of recruitment at least at the start of the study (M. Kabby, 2011) and at the end of the study. The comprehensively spread ratio is the ratio of parameters to evaluate the involvement of gender and some social groups and much known is enrollment fraction [2-6]  that is the number of enrollees divided by the number of potential subjects to determine age, sex and race of patients involved to studies.

Methods and Materials

We investigated data observed by 70 clinical centers participating in II – III phases trials in oncology and hematology in three countries – Russia, Ukraine and Belorussia for the period from July 01, 2008 to December 31, 2017 in order to determine the factors which is influencing to recruitment, to determine the parameters and values which is changing under influence of this factors. The collection of data was done out from questionnaires at the stage of searching for centers, from the results obtained at the end of the research, from open statistical sources.

We also took our classification of sites based on recruitment and speed of recruitment

– Silence sites – rate of recruitment – 0 patients per month;

– Low-recruiting – rate of recruitment by 0,01 to 0,19 patients per months;

– Middle-recruiting – by 0,20 to 0,89 per months;

– High-recruiting – by 0,90 to 3 patients per months.

The amount of involved cities, involved sites and protocol required patients are presented in Table 1.

Table 1: Etymology of studies, amount of cities where centers opened, amount of centers opened, number of patients to be involved according to protocol.

Nosology The number of cities in which centers were opened Number of clinical centers

Study power – required number of patients (N)

1 2

3

4

5

1 Lung cancer

25

27

450

2 Colorectal cancer

19

19

340

3 Idiopathic purpura

15

15

69

4 Head and neck cancer

9

9

982

Total

68

70

1841

We divided the factors associated to recruitmet according to attitude to participatnts human being (investigators and patients) and have got external and internal factors presented in Tables 2 and 3.

Table 2: Internal factors.

Internal factors

1 2
1. Disease (of protocol)
2. Experience of investigators
3. Planned (proposed) patients in stage of feasibility

Table 3: External Factors.

External factors

1 2
1. Country
2. City (infrastructure)
3. Population
4. Living area
5. Density of living area (one factor like for item 4)
6. Income
7. Morbidity (new cases per year)

Parameters we took to investigate the undergone of recruitment is following:

    1. Type of site (based on final recruitment)

. is high recruited site. Appointed range 4

. middle recruited sites. Appointed range 3

. law recruited sites. Appointed range 2

. non-recruited sites (silence sites). Appointed range 1.

    1. Time from first contact of site to first reply
    2. Duration of recruitment in days
    3. Speed of recruitment
    4. Target recruitment (proposed or planned by investigator in the beginning of the study)
    5. Target speed of recruitment
    6. Percentage of performance of target recruitment
    7. Expirience of investigator

RATIO of parameters like

  1. Target recruitment to study population (maximum figure of patients to be recruited by the protocol)
  2. Time of first reply to target recruitment
  3. 1 to time of reply
  4. 1 to target recruitment
  5. Ratio of 1 to time of reply to ratio 1 to target recruitment

Statistical Analysis

Following done:

  • Calcuation of mean and error, moda and mediana for choosen parameteres (more than 1960),
  • Dispersion analysis
  • Pirson and Sperman correlation
  • Calculation of Student t-criterium

Results

We studied studies that were conducted in cities with different populations. We have divided them into 3 categories – 1) less than 1 million residents; 2) from 1 million to 2 million and 3) more than 2 million residents. The distribution is shown in Table 4.

Table 4: Dependence of the efficiency of patient recruitment on the number of residents.

Number of city residents

Enrollment effectivity of sites involved in the study (in %)
Silent sites Low-recruiting sites Middle-recruiting sites High-recruiting sites

Total

1

2

3 4 5

6

< 1 мln

52

42 6 0

100

1-2 мln

11

44 33 12

100

>2 мln

40

22 14 24

100

It can be seen that in cities with a population of more than 1 million, the number of centers with a high enrollment of patients is twice as high, which is most likely due to the developed infrastructure and confirms the literature data [7,8]. Statistical values presented below in Table 5.

Table 5: Rate of recruitment presented depends of population presented.

Parameter, p-value Parameters according to population,

X ± m

1 – up to 1 mln 2 – 1 – 2 mln

3 – more than 2 mln

1 2

3

4

5

1. Type of site

1,78 ± 0,14

2,69 ± 0,28

2,12 ± 0,24

2.  Time from first contact till reply, days

P 1/2<0,01;

2/3<0,01;

24,16 ± 3,1

11 ± 1,48

31 ± 5,53

3. Speed of recruitment

P 1/2<0,05;

0,14 ± 0,05

0,57 ± 0,2

0,47 ± 0,16

4. Protocol planned recruitment rate per month

0,33 ± 0,02

0,31 ± 0,02

0,37 ± 0,02

5. Recruitment amount final per site

P 1/2<0,01

3,75 ± 1,24

15,08 ± 5,06

12,24 ± 4,15

6. Patients to be planned per site

12 ± 1,44

18,53 ± 3,24

20,48 ± 3,9

7. Percentage of performance

30,189 ± 9,56

111,7 ± 42,5

81,2 ± 25,02

8. Experiences of PI in clinical trial in years

5,8 ± 0,32

5,69 ± 0,59

5,52 ± 0,47

9. RATIO-Planned/maximum pats per protocol

5,37 ± 0,71

5,68 ± 1,1

5,58 ± 0,75

10. RATIO – time of first reply/planned patients

P 1/2<0,01;

2/3<0,01;

2,81 ± 0,45

0,7 ± 0,11

2,3 ± 0,47

11. 1/time to reply

0,08 ± 0,02

0,17 ± 0,07

0,13 ± 0,05

12. 1/planned patients

P 1/2<0,01;

1/3<0,01;

0,12 ± 0,02

0,07 ± 0,009

0,07 ± 0,006

13. ratio 1 ((1/time to reply)/(1/planned patients))

1,02 ± 0,26

2,46 ± 0,8

3,3 ± 1,69

Analysis of table showed following statistical differences:

  • Time of first contact has a statistcial differences in group 2 two more time lesst than ingroups 1 and 3, that is the optimal infrusctructue and population is 1 – 2 mln to have a quick reply.
  • Speed of recruitment also was statistically higher in area of 1-2 mln people as well as final recruitment.
  • RATIO time of first reply to planned pats and 1 divided by planned pats also has a statistial significance. Wich means that these ratios quite sensitive to this parameter.

The living area, density of living area where being investigating the medicinal product definitely has an influence to recruitment.

Parameters of recruitment presented on Table 6. From the analysis of the Table 6, it can be seen that the population density of up to 4000 people is enough for the enrollment of patients to be high enough, however, with a population density of more than 4000 people, the percentage of silent sites is minimal in relation to the percentage of highly recruited ones.

Table 6: Parameters of recruitment and Density of population.

Density of population

Efficacy of recruitment (% N=70 центров)
1 2 3 4 5

6

People on km2

Non-recruiting sites

Low-recruiting sites Middle-recruiting sites High-recruiting sites

Total

< 2000

4 (6%)

5 (7%) 0 0

9 (13%)

2001-4000

17 (24%)

14 (19%) 7 (10%) 5 (7%)

43 (60%)

>4000

5 (7%)

4 (6%) 4 (7%) 5 (7%)

18 (27%)

Density of population

Efficacy of recruitment (% N=70 центров)

1 2 3 4 5

6

People on km2

Non-recruiting sites

Low-recruiting sites Middle-recruiting sites High-recruiting sites

Total

< 2000

4 (6%)

5 (7%) 0 0

9 (13%)

2001-4000

17 (24%)

14 (19%) 7 (10%) 5 (7%)

43 (60%)

>4000

5 (7%)

4 (6%) 4 (7%) 5 (7%)

18 (27%)

Analysis of Table 7 revealed that:

Table 7: Parameters of recruitment depends of living area, density of living area.

Parameter, p-value Parameters according to density of living area,

X ± m

1 – up to 2000 2 – 2000-4000

3 – more than 4000

1

2 3 4

5

1. Type of site

1,56 ± 0,17

2 ± 0,15

2,5 ± 0,28

2. Time from first contact till reply, days

28,22 ± 6,84

21,47 ± 2,79

28,56 ± 6,52

3. Speed of recruitment

P 1/2<0,01;

1/3<0,01;

0,03 ± 0,01

0,31 ± 0,09

0,53 ± 0,17

4. protocol planned recruitment rate per month

0,3 ± 0,02

0,34 ± 0,01

0,35 ± 0,03

5. Recruitment amount final per site

P 1/2<0,01;

1/3<0,01;

0,89 ± 0,34

8,33 ± 2,38

14,22 ± 4,38

6. Patients to be planned per site

11,22 ± 2,08

16,7 ± 2,34

17,67 ± 3,35

7. Percentage of performance

P 1/2<0,01;

1/3<0,01;

7,56 ± 3,47

56,39 ± 14,84

108,65 ± 33,68

8. Experiences of PI in clinical trial in years

5,89 ± 0,3

5,6 ± 0,3

5,78 ± 0,61

9. RATIO-Planned/maximum pats per protocol

4,38 ± 1,23

5,91 ± 0,6

5,09 ± 0,89

10. RATIO – time of first reply/planned patients

3,66 ± 1,22

1,87 ± 0,28

2,42 ± 0,55

11. 1/time to reply

0,06 ± 0,01

0,13 ± 0,03

0,11 ± 0,05

12. 1/planned patients

0,13 ± 0,03

0,08 ± 0,01

0,1 ± 0,02

13. ratio 1 ((1/time to reply)/(1/planned patients))

0,64 ± 0,16

2,47 ± 0,92

2,01 ± 1,05

– Speed of recruitment mush less in first group

– Final recruitment also has a statistical differences

– Percentage of performance has a statistical differences

– RATIO planned pats to maximum pats per protocol also has a differences.

– RATIO- time first screening / TIME first reply has a statistical differences.

The density definitely has a clear evidence that the more density of people the more recruitment and speed of it being expected.

Cumulative figure of investigated of three parameters presented below in Figures 1-5.

fig 1

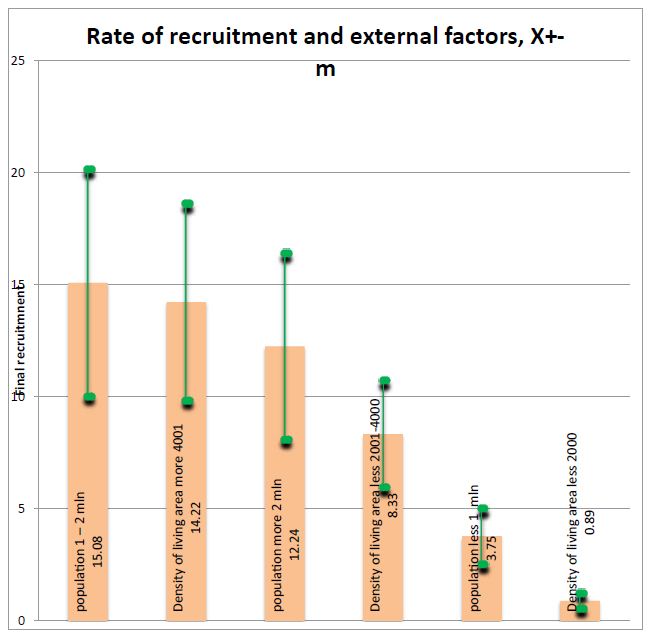
Figure 1: Rate of recruitment and external factors. Figure is show that obviously the less density and people in area of conductning the clincial trials the less rate of recruitment.

fig 2

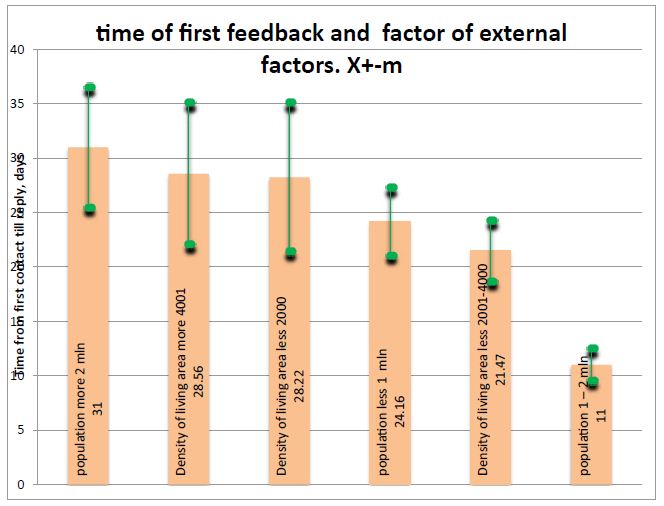
Figure 2: Time of first feedback and external factors. Clearly is seeing that very fast reply is seeing in population 1-2 mln people.

fig 3

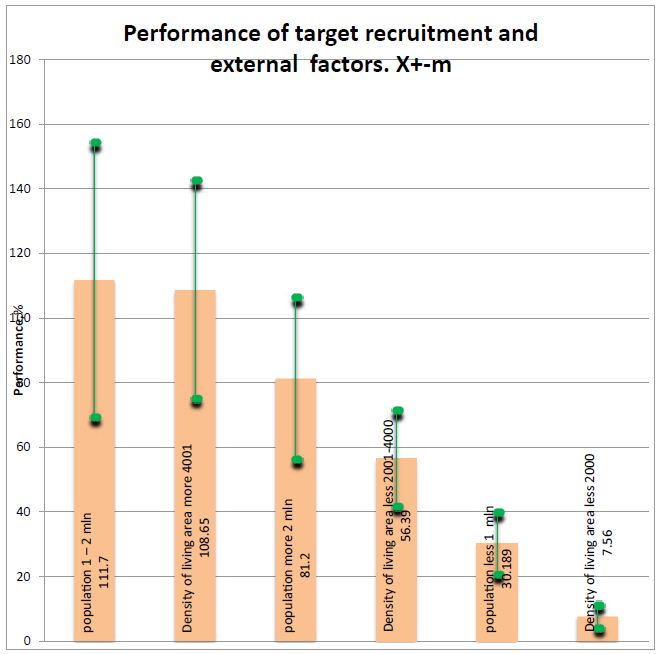
Figure 3: Performance of target recruitment and external factors (please refer to table above). Figure 3 show that performance if very low where low density of population.

fig 4

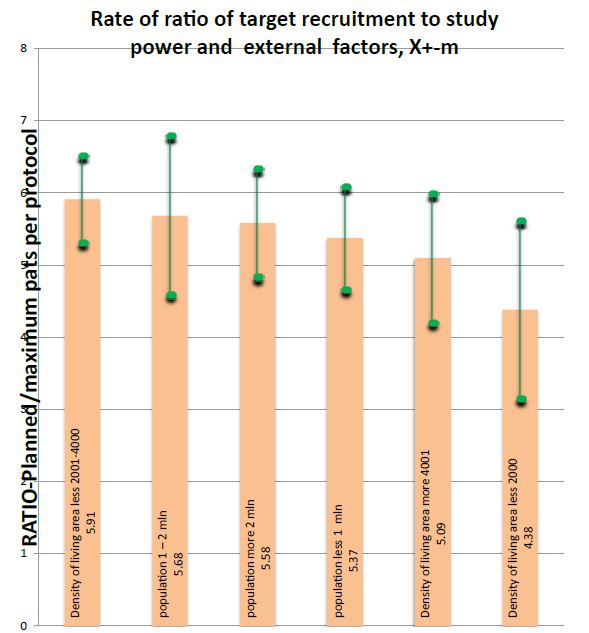
Figure 4: Rate of ratio of target recruitment to study power and external factors

fig 5

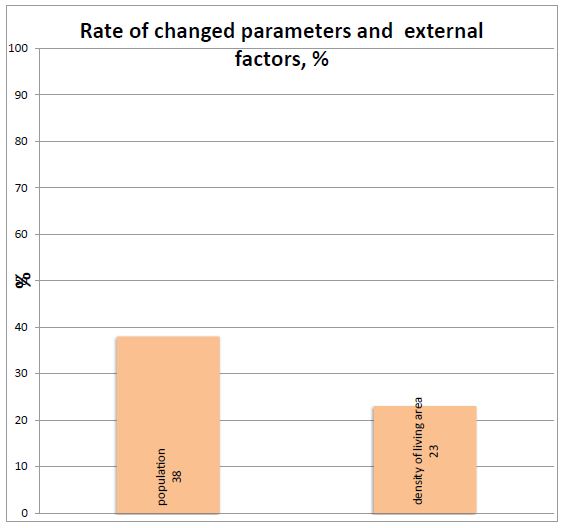
Figure 5: Rate of changed parameters and external factors. Figure shows that this ratio is not sensitive during acting of population and density. The percentage of changed parameter and ratio under influence of population and density of people presented in this figure.

Short Discussion

Authors [9] did not find the correspondence beetwen the rate of recruitment and the actual population and we found also that mostly of parameters do not changing, but we firstly showed a new ratios which sensitive to the investigated factors. We found like some authors [10-19] that sites in area with high amount of people has more expectation to perform the recruitment.

Therefore, the following investigation of different factors will support the clinical trial industry in moire efective clinical trials.

References

  1. Chin FP, Nguyen LT, Quilty MT, Kerr CE, Nam BH, et al. (2008) Effectiveness of recruitment in clinical trials: an analysis of methods used in a trial for irritable bowel syndrome patients. Clin. Trials 29: 241-251. [crossref]
  2. Fouad MN, Lee JY, Catalano PJ, Vogt TM, Zafar, et al. (2013) Enrollment of patients with lung and colorectal cancers onto clinical trials. Oncol. Pract. 9: 2 e40-47.[crossref]
  3. Murthy VH, Krumholz HM, Gross CP. (2004) Participation in cancer clinical trials: Race-, sex-, and age-based disparities. JAMA 291: 2720-2726 [crossref]
  4. Stewart JH, Bertoni AG, Staten JL, et al. (2007) Participation in surgical oncology clinical trials: Gender-, race/ethnicity-, and age-based disparities. Ann Surg Oncol 14: 3328-3334.[crossref]
  5. Du W, Gadgeel SM, Simon MS (2006) Predictors of enrollment in lung cancer clinical trials. Cancer 106: 420-425.[crossref]
  6. Nass SJ, Moses HL, Mendelsohjn J (eds). (2010) A National Cancer Clinical Trials System for the 21st Century. Washington, DC, National Academies Press. [crossref]
  7. Lovato LC, Hill K, Hertert S, Hunninghake DB, Probstfield JL (1997) Recruitment for controlled clinical trials: literature summary and annotated bibliography. Clin. Trials 18: 328-352.[crossref]
  8. McNeely EA, Clements SD (1994) Recruitment and retention of the older adult into research studies. Neurosurg. Nurs. 26: 57-61.[crossref]
  9. Hill NS, Preston IR, Roberts KE (2008) Patients with pulmonary arterial hypertension in clinical trials. Who are they? Am. Thorac. Soc. 5: 603-609
  10. van den Bor RM, Grobbee DE, Oosterman BJ, Vaessen PWJ, Roes KCB (2017) Predicting enrollment performance of investigational centers in phase III multicenter clinical trials. Contemp Clin Trials Comm 7: 208-216.[crossref]
  11. L´opez Jaimes. A, Zapotecas Mart´ınez S, Coello CoelloAn CA (2009) Introduction to Multiobjective Optimization Techniques. Nova Science Publishers, Inc., pg: 1-26.
  12. McDonald AM, Knight RC, Campbell MK, Entwistle VA, Grant AM, et al. (2006) What influences recruitment to randomised controlled trials? A review of trials funded by two UK funding agencies, Trials 7.
  13. Fletcher B, Gheorghe A, Moore D, Wilson S, Damery S (2012) Improving the recruitment activity of clinicians in randomized controlled trials: a systematic review. BMJ Open 2: e000496 [crossref]
  14. Joan FBB, Brescia (2007) Reinventing Patient Recruitment: Revolutionary Ideas for Clinical Trial Success. Gower Publishing, Surrey, UK.
  15. LovatoLC, Hill K, Hertert S, Hunninghake DB, Probstfield JL (1997) Recruitment for controlled clinical trials: literature summary and annotated bibliography. Control Trials 18: 328-357.
  16. Friedman LM, Furberg CD, DeMets DL (2010) Fundamentals of Clinical Trials, fourth , Springer.
  17. Myles PS, Williamson E, Oakley J, et al. (2014) Ethical and scientific considerations for patient enrollment into concurrent clinical trials. Trials 15: 470. [crossref]
  18. Robert S. Bienkowski and Norman M. Goldfarb. (2008) Screen Failures in Clinical Trials: Financial Roulette or the Cost of Doing Business? Journal of clinical research best practices Vol.4: 7.
  19. Rahman S, Majumder AA, Shaban SF, Rahman N, Ahmed M. (2011) Physician participation in clinical research and trials: issues and approaches, Med. Educ. Pract. 2: 85-93.[crossref]

A Review on the Main Antibiotic Drugs Used in Fish Farming: Ecotoxicity, Characterization and Remediation

DOI: 10.31038/AFS.2021351

Abstract

Aquaculture is a growing industry with a high demand mainly due to its significant contribution to the food sector. One of the main challenges of aquaculture is the prevention and treatment of fish diseases through the extensive application of antibiotics. However, information on the various consequences of pharmaceuticals in fish farms remains limited to this day. Based on the existing scientific literature, this report aims to give an overview of the most commonly used antibiotics in aquaculture, which belong to the groups of quinolones, sulfonamides, tetracyclines, amphenicols and macrolides. This review paper summarizes the information available on the characterization, ecotoxicology and application of florfenicol, erythromycin, furazolidone, oxolinic acid, ciprofloxacin, ofloxacin, sulfadiazine, sulfadimethoxine, sulfamethoxazole, oxytetracycline and tetracycline.

Keywords

Veterinary drugs, Antibiotics, Characterization, Ecotoxicity, Treatment

Introduction

Aquaculture is the food production sector with the strongest growth, as farming, trading, and processing of marine products are of major social, economic, and environmental importance. Global fish production has reached 179 million tons in 2018, where aquaculture accounted for 46% of the total production. China is by far the major fish producer with 35% of the worldwide production [1]. The recent expansion of aquaculture raises concerns related to the destruction of natural habitat, the utilization of potentially harmful synthetic compounds, the effect of escapees on wild stocks, wasteful production of fishmeal and fish oil, and social and cultural effects on aquaculture laborers and communities. Fish farming requires extensive use of veterinary drugs, including antibiotics. Some of these pharmaceuticals are only partially metabolized, and then excreted, entering the aquatic environment in their native form or as metabolites and showing considerable persistence [2]. Quinolones, amphenicols, macrolides, tetracyclines, and sulfonamides are the most widely used groups of antibiotics [3-6]. The 10 drug molecules that are the most commonly used to prevent and treat fish diseases are: florfenicol, erythromycin, furazolidone, oxolinic acid, ciprofloxacin, ofloxacin, sulfadiazine, sulfadimethoxine, sulfamethoxazole, oxytetracycline and tetracycline [7]. Due to their variety and accumulation in the environment, aquatic organisms are exposed to various antibiotics that can be found as mixtures with potentially enhanced “cocktail effect”, which have not been studied in-depth to this day. The main concerns associated to the use of veterinary drugs are the development of antibiotic resistance, mutagenicity, and inhibition or acute toxicity of aquatic organisms [8]. In natural settings, prolonged exposure to low doses of antibiotics can lead to the selective proliferation of resistant bacteria, which can transfer their resistance genes to other bacterial species, including pathogenic bacteria [9]. Despite their low concentrations, the bioaccumulation and biomagnification of pharmaceuticals can have a significant impact on the aquatic ecosystem and even human health (Pan et al., 2019). Furthermore, additional sources of pharmaceuticals have to be considered for extensive environmental evaluation and implementation of possible control measures. These sources include pharmaceutical facilities, hospitals, and households, as a significant percentage of drugs is not fully eliminated by conventional water treatment technologies [10]. In fish farming, drugs are usually coated (mostly with fish oil, gelatin, or vegetable oil) and gradually added to the fish food. The coating agent helps to prevent the drug from entering the water in the fish farm [11], but effluents containing unconsumed food pellets with high levels of antibiotics are released into the aquatic environment without any treatment [12]. There is a limited knowledge about the fate and consequences of antibiotics once they reach the environment. This report aims at compiling information on available analytical methods to detect and identify low concentrations of antibiotics in the environment, summarize potential ecotoxicological risks, and ultimately to propose possible treatment technologies to effectively eliminate them.

This review paper is divided into four parts. The first one describes the most commonly employed molecules, their use and the associated drawbacks. The second part is devoted to their ecotoxicity. The third part reviews the current methods used for the analysis of these pharmaceuticals in various environmental matrices. The last part discusses the water treatment processes currently applied to remove and/or degrade these compounds.

Main Drugs Used in Fish Farming

This part reviews the six main families of drugs usually used in fish farming, their main properties and their mode of administration: cyclins, amphenicols, sulfonamides, quinolones, macrolides and nitrofurans.

Tetracycline

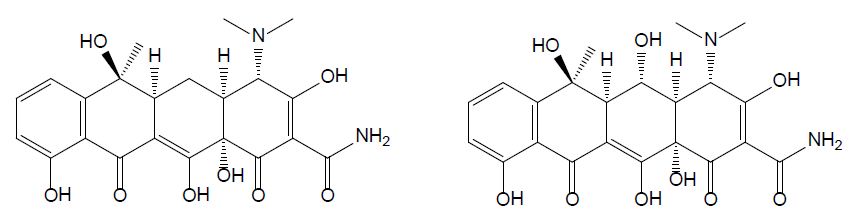
Tetracyclines were discovered in the 1940s and showed activity against a wide range of microorganisms. They are inexpensive and applied for the treatment of human and animal infections as well as in animal feed to promote growth. Tetracycline (TET) is one of the most common type of antibiotics used in medicine, agriculture, and animal husbandry; its chemical structure comprises a fused linear tetracyclic nucleus to which various functional groups are attached as shown in Figure 1 [13]. Due to its widespread application, a growing number of pathogens are developing resistance to tetracycline, therefore decreasing its efficiency. Oxytetracycline (OTC) is a broad-spectrum antibiotic used in veterinary medicine to treat, among others, diseases in fish [8]. It has a role as an antibacterial and anti-inflammatory drug, protein synthesis inhibitor, and antimicrobial agent (ChEBI 27701). OTC is active against gram-positive bacteria, gram-positive bacilli, and gram-negative organisms [14]. In the past decades, the use of OTC increased with the development of aquaculture and livestock production [15] and thanks to its low cost and its broad-spectrum efficacy in treating infections [14]. There are three main ways to administer OTC to farmed fish: through the feed, bath treatment, and injection. Among these options, the incorporation of the antibiotic in food for oral administration is the most common and the one with the least risk in terms of environmental pollution [8]. OTC is only minimally metabolized and is mainly excreted through urine.

fig 1

Figure 1: Chemical structures of tetracycline (left) and oxytetracycline (right).

Amphenicols

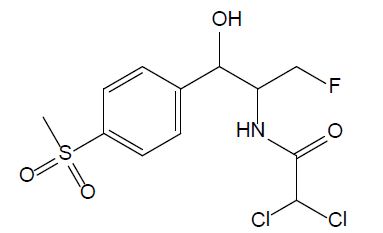
Amphenicols are important veterinary antibiotics with wide-spectrum antimicrobial activity. Florfenicol (FF, see Figure 2) is an antimicrobial agent, which is extensively used in fish farming. Grave et al. investigated the use of antimicrobial drugs in Norwegian aquaculture from 2000 to 2005 by analyzing prescription data, in close relation with the national data of the sold antimicrobial drugs. FF has long been the most abundant drug prescribed for halibut farming in Norwegian aquaculture [16]. In 2013, 0.3 tons and 300 tons of FF were used in fish farming in Norway and Chile, respectively. In 2016, it was reported that over 1000 tons of FF were used in China. Temperature, exposure time, coating agent, and pellet size are the important factors that influence release of FF into the water [11]. According to the EU Council directive, the maximum residue limit value of the sum of FF and florfenicol amine in muscle and skin in natural proportions of healthy fish was given as 1,000 μg/kg (Commission Regulation EU No 37/2010). FF is bacteriostatic, which means it prevents the bacteria from protein synthesis [11]; it is usually used for respiratory and intestinal infections [17].

fig 2

Figure 2: Chemical structure of chloramphenicol.

Sulfonamides

Sulfonamides are used as chemotherapeutics to treat various bacterial infections in veterinary medicine [5]. Due to their broad-spectrum antimicrobial activity and low cost, they were among the most applied antibiotics and thus, commonly detected in aquaculture wastewater [18]. Currently, only a few drugs belonging to sulfonamides are used due to the developed resistance in previously susceptible microorganisms. Sulfadiazine (SDZ) and sulfadimethoxine (SDM) are the most used antibiotics in fish farming; their chemical structures are displayed Figure 3. When applied to animals, sulfadiazine, is excreted in its native form and its N4-acetyl metabolite [19]; it is often considered as a representative antibiotic of sulfonamides due to its wide presence in the environment with low hydrophobicity and high water solubility in [20]. Sulfadimethoxine (SMX – Figure 4) is a broad-spectrum antibiotic used in human therapy, aquaculture, livestock, and veterinary medicine. Although its use is decreasing in humans, its low cost secures its popularity in veterinary medicine [21].

fig 3

Figure 3: Chemical structures of sulfadiazine (left hand), sulfamethoxine (middle) and sulfamethoxazole (right hand).

fig 4

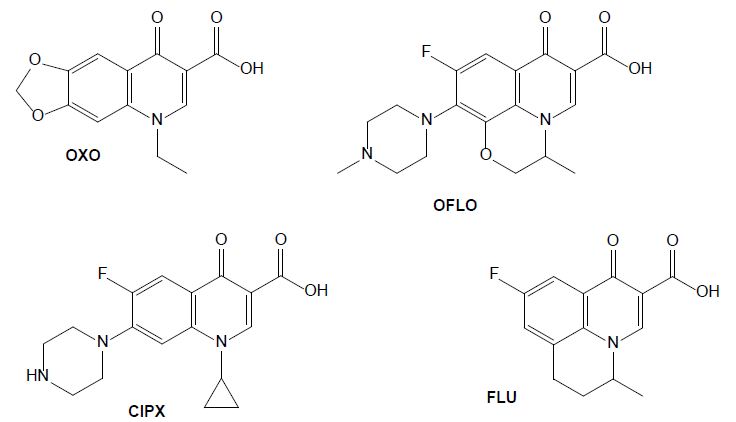
Figure 4: Chemical structures of some quinolone drugs: oxolinic acid (OXO), ofloxacin (OFLO), ciprofloxacin (CIPX) and flumequine (FLU).

Quinolones

The antibiotics from the group of quinolones are widely used in human and veterinary medicines to treat infectious diseases and to promote livestock growth (Yang et al., 2020). They directly inhibit DNA replication by interacting with two enzymes. Oxolinic acid (OXA) is efficient against a gram-negative bacterium that causes diseases such as vibriosis, yersiniosis, and furunculosis. It has been administrated to farm fishes as a prophylactic and chemotherapeutic agent acting as anti-infective, antibacterial and enzyme inhibitor [22]. Its use in humans is now prohibited in several countries but is still frequently used in veterinary medicine to treat urinary infections, and it was detected in animal excreta [23]. Ofloxacin (OFLO) is a quinolone that was previously used for human health, for the therapy of mild to moderate bacterial infections, it has since been replaced by more potent and less toxic antibiotics, however it is still used in aquaculture. In the group of quinolones, ciprofloxacin (CIPX) is considered as a representative drug against gram-negative bacteria; it has been detected in marine environment, as well as in freshwater. In aquatic environments it affects the metabolism of some bacteria carbon sources and is toxic to fishes (Yang et al., 2020). Flumequine (FLU), as a first generation quinolone, is structurally related to nalidixic and oxolinic acid [24]. Oxidation experiments carried out on flumequine led to a total of 19 transformation products issued from hydroxylation, dehydrogenation, hydroxyl substitution, decarboxylation, demethylation, and ring opening transformation pathways [25].

Macrolides

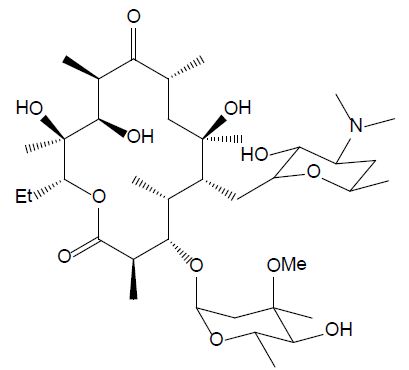
The group of macrolides refers to macrocyclic lactone ring structures; they are used for their immunomodulatory and antibacterial functions (Yang et al., 2020). In addition to their antibacterial action, macrolides can have an anti-inflammatory effect by decreasing the activity of immune cells and altering bacterial cells. Erythromycin (ERY, see Figure 5) is efficient against gram-positive bacteria, as streptococcus species. However, most of the microorganisms that cause infection in fish are gram-negative, so this compound should only be utilized after fish culturing and sensitivity test results should affirm its viability. Additionally, erythromycin is not efficient in bath treatment and must be administered by injection or in the feed [26].

fig 5

Figure 5: Chemical structure of erythromycin.

Nitrofurans

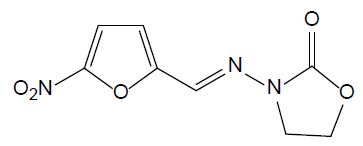
Nitrofurans are antimicrobial agents which have been used for animal production. They have strong impact on gram-negative and gram-positive bacteria and act against protozoa as well. In 1993, their application has been banned by EU due to their potential mutagenic effect. Furazolidone (FUR, see Figure 6) is a nitrofuran antibiotic widely used in human and aquaculture medicine against protozoal and Helicobacter pylori infections. Its biodegradation leads to 3-amino-2-oxazolidone and β-hydroxyethylhydrazine [27]. It is still utilized in developing countries, although it is banned in developed countries.

fig 6

Figure 6: Chemical structure of furazolidone.

Ecotoxicology of the Main Drugs Used for Fish Farming

Table 1 presents a summary of the ecotoxicological data available for veterinary drugs mainly used in fish farming. The data are discussed below, for each pharmaceutical family.

Table 1: Ecotoxicology data for the veterinary drugs mainly used in fish farming

Drug

Ecotoxic effect

Reference

Tetracycline & oxytetracycline, 24 h-EC50 for Stentor coeruleus and Stylonychia lemnae were 94.4 mg/L and 40.1 mg/L, respectively Magdaleno et al., 2017
Florfenicol Inhibiting growth rate of Corbicula fluminea at concentrations higher than 1.8 mg/L Guillermino et al., 2017
Sulfadiazine LC50 of 1.884 mg/L for Daphnia magna Duan et al., 2020
Sulfamethoxazole IC50 = 12.56 ± 4.48 mg/L for A. fischeri Drzymała & Kalka, 2020
Sulfadimethoxine EC50 of 248 mg/L for daphnia magna Tkaczyk et al., 2021
Oxolinic acid 4.6 mg/L EC50 for Daphnia magna Tkaczyk et al., 2021
Ofloxacin Chronic toxicity and drug resistant bacteria H. Guo et al., 2021
Ciprofloxacin Concentrations greater than or equal to 10 μg/L: ecotoxic for development, growth, detoxification and oxidative stress enzymes Białk-Bielińska et al., 2011
Flumequine Affecting growth rate of Daphnia magna at 23% across generation De Liguoro et al., 2019
Erythromycin EC50 values in the range of 10 -30 mg/L for Vibrio fischeri Liu et al., 2018
Furazolidone Very toxic to Alivibrio fischeri with an EC50 of 2.05 mg/L Lewkowski et al., (2019)

Tetracyclines

In aquaculture, oxytetracycline is one of the most used antibiotics that raises concerns due to its effects on human and animal health, and environmental pollution [8]. In the marine environment, oxytetracycline and quinolones are photochemically degraded and form divalent cationic complexes in the presence of Ca2+ and Mg2+ ions, causing a loss in antibacterial activity. In freshwater, the antimicrobial activity of tetracyclins is of bigger concern due to the development of antibiotic resistance [28]. OTC inhibits the growth of two species of algae: pseudokirchneriella subcapitata (the international standard species for evaluation of inhibition) and Ankistrodesmus fusiformis (native from Argentina). The former was the most sensitive with an EC50 of 0.92±0.30 mg/L [29]. OTC can also affect nitrification since the main bacteria responsible for biofilters – nitrosomonas that promote the conversion of ammonia to nitrite and Nitrobacter that convert nitrite to nitrate – are gram-negative. Li et al. investigated the toxic effect of tetracycline and tetracycline hydrochloride on two model ciliates: Stentor coeruleus and Stylonychia lemnae. The 24 h-EC50 of tetracycline for Stentor coeruleus and Stylonychia lemnae were 94.4 mg/L and 40.1 mg/L, respectively. For tetracycline hydrochloride, the EC50 for Stentor coeruleus and Stylonychia lemnae were 8.39 mg/L and 14.0 mg/L, respectively [15]. This shows that tetracycline hydrochloride is more toxic than tetracycline in these test organisms. Both compounds deteriorate the ultra-cell structure and inhibit the cell growth rate [29].

Amphenicols

Florfenicol (FF) restrains the bacterial protein synthesis efficiency by binding to 50S subunit and 70S ribosome, and it is listed as the top-priority monitoring compounds in veterinary drugs in South-Korea [30]. FF also inhibits the hematopoietic system [31] and deteriorates the mobility, regeneration, and population increase of the tropical Cladocera silvestrii [32]. It also decreases egg hatchability and hinders the development of the cardiovascular system [33]. Guilhermino et al. showed that a FF concentration in water greater than 1.8 mg/L can inhibit the growth of the mollusk Corbicula fluminea [34].

Sulfonamides

The chronic and acute toxicity of sulfadiazine on the crustacean Daphnia magna was investigated and the LC50 value was determined as 1.884 mg/L [35]. The exposition of zebrafish to some sulfonamides, including sulfadiazine, caused an increased heart rate and abnormal swimming. This investigation also proved that sulfadiazine was a typical inducer of metabolic enzymes and suggested a potential ecotoxicological risk [36]. It is important to consider that sulfadiazine can have an impact on biological water treatment processes. Li et al. studied the effects of this antibiotic on a sequencing batch biofilm reactor (SBBR). They found that a sulfadiazine concentration higher than 6 mg/L inhibits COD (Chemical Oxygen Demand) and ammoniacal nitrogen removal within the SBBR when treating aquaculture waste [37]. Sulfadiazine promotes the secretion of extracellular polymeric substances by the microorganisms and impacts the biofilm composition, it has a direct impact on nitrification and the removal of organic matter. Sulfamethoxazole has been studied in a microcosmos composed of water, sediment and zebrafishes. The drug concentration decreased gradually in water while increasing over time in sediment and zebrafish. Bioaccumulation in zebrafish was reduced by 13-28% in the presence of sediment particles in the water; it was further reduced (24-33%) when increasing the water salinity [38]. In the study conducted by [39], sulfadimethoxine was considered to be moderately toxic with an EC50 towards the green algae Chlorella vulgaris of 4.24 mg/L in fresh water, which was measured to be higher (11.2 mg/L) in salt water [39].

Quinolones

According to a study by Tkaczyk et al., oxolinic acid EC50 was 4.6 mg/L EC50 for Daphnia magna [40]. Sun et al. investigated the bioaccumulation of ofloxacin in crucian carp and showed that fluorine increases the bioaccumulation of the antibiotic; higher bioaccumulation potential appears at a low concentration of drug, mostly in the liver [41]. De Liguoro et al. evaluated the effect of continuous and alternate exposure of flumequine at 2 mg/L on Daphnia magna survival, growth, and reproduction. At this concentration, mortality was observed at a rate of 23  ± 14% across generation [42].

Macrolides

Erythromycin has shown medium risk for algae, but bacteria are the main target of antibiotics such as erythromycin. Erythromycin can cross the cell membrane of the bacteria and bind to 50S subunit ribosome [43]. It is also very persistent in the environment due to having aromatic rings, which makes it refractory [44].

Nitrofurans

Lewkowski et al. investigated the effect of furazolidone on growth of oat, radish Sativus, and Alivibrio fischeri bacteria. Their results indicated that furazolidone is very toxic to Alivibrio fischeri with an EC50 of 2.05 mg/L [45]. The accumulation of furazolidone metabolites have been reported in the literature [5]; its use is prohibited by the Food and Drug Administration due to being a nitrofuran compound and inhibiting monoamine oxidase [46].

Methods for Characterization of Drugs Used in Fish Farming

Table 2 presents a summary of the analytical approaches employed for the detection and quantification of veterinary drugs mainly used in fish farming; protocols and methods are discussed below.

Table 2: Analytical methods reported for the detection and quantification of the main antibiotic veterinary drugs used in fish farming

Drug type

Matrix Characterization methoda MS typeb Sample preparationc Analytical column LC Mobile phased

Reference

Tetracyclins including OTC Feeds HPLC-UVD/FLD LLE using acetonitrile and Na2EDTA-Mcllvaine buffer solution C18 Hypersil GoldTM (250 x 4.6 mm, 5 μm) Phase A: H2O + sodium acetate CaCl2 + EDTA

Phase B: ACN

Phase C: MeOH

Han et al., 2020
Antibiotic drugs

Including SMX, SDZ, SMZ, CIPX, OFLO, TET and ERY

Wastewater UPLC-MS/MS TQ SPE using an Oasis HLBTM cartridge) C18 BEHTM (50 x 2.1 mm, 1.7 µm) Phase A: H2O + FA

Phase B: ACN or MeOH

Li et al., 2009
Sulfonamides, fluoroquinolones, tetracyclines and other veterinary drugs Seafood samples UPLC-MS/MS TQ QuEChERS procedure C18 Hypersil GoldTM (100 × 2.1 mm, 1.9 μm) Phase A: H2O / MeOH + FA

Phase B: ACN + FA

Dinh et al., 2020
Metabolites of nitrofurans and FUR Shrimp body LC-MS/MS TQ Hydrolysis + double LLE using ethyl acetate C18 SymmetryTM (150 x 2.1 mm, 3.5 μm) Phase A: ACN

Phase B: H2O + FA

Douny et al., 2013
4 tetracyclines including TET, OTC; quinolones including FLU, CPIX and OXA Fish muscles LC-MS/MS TQ Liquid extraction with trichloroacetic acid C18 Zorbax Eclipse XDBTM (150 × 4.6 mm, 5.0 µm) Phase A: H2O + HFBA

Phase B: ACN

Guidi et al., 2018
OTC Sol interstitial water LC-MS/MS TQ Centrifugation, filtration C18 Xterra MSTM (100 x 21 mm, 3.5 µm) Phase A: MeOH + FA

Phase B: MeOH / H2O + FA

Halling-Sørensen et al., 2003
FF Water in recirculating aquaculture system HPLC-PDA SPE using an Oasis HLBTM cartridge Hypersil GOLDTM (250 x 4.6 mm, 5 μm) Phase A: ACN

Phase B: H2O

Zhang et al., 2020
FF and its residues Beef meat LC-MS/MS TQ SPE using an Oasis MCXTM cartridge C18 Inertsil ODS-4TM (150 × 2.1 mm, 3-μm) Phase A: H2O + acetic acid

Phase B: ACN

Saito-Shida et al., 2019
FF Fish feed LC-MS/MS TQ Centrifugation with ACN addition C18 SBTM (50 x 2.1 mm, 1.8 µm) Phase A: H2O + acetic acid

Phase B: ACN / MeOH

Barreto et al., 2018
14 sulfonamide antibiotic residues 309 marine products HPLC-PDA


UPLC-MS/MS

TQ Centrifugation with ACN addition C18 CapcellpakTM (250 x 4.6 mm, 5 ㎛) for HPLC-PDA


C18 Acquity UPLC BEHTM (100 x 2.1 mm, 1.7 µm) for UPLC-MS/MS

Phase A: H2O + KH2PO4

Phase B: MeOH

for HPLC-PDA


Phase A: H2O + FA

Phase B: ACN + FA

for UPLC-MS/MS

Won et al., 2011
20 antibiotics including FF, SDZ, SMX, CPIX, TET, OTC and ERY Surface waters UPLC-MS/MS TQ SPE using an Oasis HLBTM cartridge C18 HSS T3TM (100 x 2.1 mm, 1.8 µm) Phase A: H2O + FA

Phase B: ACN + FA

Yan et al., 2013
19 sulfonamides including SDZ, SDM and SMX Ebro river, WWTP samples LC-MS/MS QqLIT on-line SPE using Oasis HLBTM or Oasis MCXTM cartridges C18 AtlantisTM (150 × 2.1 mm, 3 µm Phase A: H2O + FA

Phase B: ACN + FA

García-Galán et al., 2011
73 pharmaceuticals including TET, OTC, SDZ, SMX, OFLO, FLU, CPIX and ERY River water, WWTP influent and effluent LC-MS/MS QqLIT on-line SPE using a Oasis HLBTM cartridge C18 Purospher Star RP-18TM endcapped column (125 × 2.0 mm, 5 μm) Phase A:

ACN / MeOH

Phase B: H2O

Gros et al., 2009
20 antibiotics including

CIPX, ERY, SMZ, SMX, TET and OTC

Raw influent, treated effluent, surface water LC-MS/MS TQ on-line SPE using a combination of SBTM and HR-XTM cartridges C18 Poroshell 120 ECTM (100 x 3.0 mm, 2.7 μm) Phase A: H2O + FA

Phase B: ACN + MeOH

Tran et al., 2016
SMX and its photoproducts Aquatic organisms LC-MS/MS TQ No sample preparation C18 Zorbax eclipse plusTM (50 x 2.1 mm, 1.8 µm) Isocratic mobile phase H2O / ACN Li et al., 2020
OTC, FF, OXA and FLU Marine sediments HPLC-PDA-FLD LLE (using oxalic acid in methanol) assisted by sonication Kromasil PhenylTM (250 x 4.6 mm, 5 µm) Phase A: H2O + TFA

Phase B: MeOH + TFA Phase C: ACN + TFA, with or without gradient

Norambuena et al., 2013
46 antimicrobial drug residues including sulfonamides, tetracyclines, quinolones, macrolides, nitrofurans and phenicols Aquatic matrices, pond water UPLC-HRMS OrbitrapTM SPE using an Oasis HLBTM cartridge C18 Hypersil GoldTM (100 × 2.1 mm, 1.9 μm) Phase A: H2O + TFA

Phase B: MeOH + TFA

Goessens et al., 2020
11 fluoroquinolones including OFLO and CIPX Wastewater and sludges UPLC-MS/MS Q-trap SPE using molecularly imprinted polymer cartridges C18 Proshell 120 SBTM (100 × 2.1 mm, 2.7 µm) Phase A: H2O + FA

Phase B: MeOH + FA

Yu et al., 2020
Fluoroquinolone residues Sewage samples LC-MS/MS TQ on-line SPE with micellar desorption C18 SymmetryTM (150 x 3.9 mm, 4 µm) Isocratic mobile phase consisting of H2O + MeOH Montesdeoca-Esponda et al., 2012
FLU and OXA Aquatic sediments and agricultural soils HPLC-FLD MAE C8 InertsilTM (250 × 4.6 mm, 5 µm) Isocratic mobile phase consisting of H2O + oxalic acid buffer + ACN Prat et al., 2006
FLU Ultrapure water, tap water, secondary clarifier effluent and river water HPLC-FLD


LC-MS/MS

Q-TOF Microfiltration C18 BDS HypersilTM (250 x 4,6 mm, 5 μm) Phase A: H2O + FA

Phase B: MeOH

Qui et al., 2019

a LC: liquid chromatography, HPLC: high performance liquid chromatography, UPLC: ultrahigh performance liquid chromatography, UVD: UV detector, FLD: fluorescence detector, PDA: Photodiode array detector, MS/MS: tandem mass spectrometry, HR-MS: high resolution mass spectrometry
b Q: quadrupole, TQ: triple quadrupole, q: collision cell, TRAP: ion trap, LIT: linear ion trap, TOF: time-of-flight
c LLE: liquid-liquid extraction, SPE: solid phase extraction, QuEChERS: sample preparation method (Quick, Easy, Cheap, Efficient, Rugged and Safe), MAE : microwave assisted extraction
d ACN: acetonitrile, MeOH: methanol, EDTA: ethylenediaminotetraacetic acid, FA: formic acid, TFA: trifluoro acetic acid

The first step of the analytical process consists in sample preparation, which includes extraction of analytes from the matrix, purification and concentration. When imposed by the analytical technique, a derivation step is added at the end of the process. Solid phase extraction (SPE) has been extensively reported as a tool for choice for the extraction of the pharmaceuticals mainly used in fish farming because (i) it is suitable for very complex matrices, (ii) it is highly selective, and (iii) it permits significant pre-concentration. Furthermore, SPE can be installed on-line with a chromatographic system and automated, which allows high throughput analysis; this is the case for some studies reported in Table 2 [47]. Oasis HLB™ are the most used cartridges in the reported studies, as they are suitable for the simultaneous extraction of compounds from various families: sulfonamides (SMX, SDZ, SMZ), tetracyclines (TET, OTC), quinolones (OFLO, FLU, CPIX), macrolides (ERY), nitrofurans and phenicols (FF) [15,23,47]. Apart from SPE-based approach, various sample preparation processes have been reported, including liquid-liquid extraction (LLE) with or without sonication or microwave assistance (Norambuena et al., 2013; Prat et al., 2006). In a general way, acetonitrile appears as the solvent of choice for the extraction of these molecules.

In most of the studies devoted to drugs used in fish farming, analytes are separated using liquid chromatography. High-performance liquid chromatography (HPLC) is the most widely applied technique to detect veterinary drugs with great accuracy and reliability [48]; it is nevertheless more and more replaced by UPLC (Ultrahigh Performance Liquid Chromatography), which uses a new generation of columns filled with small particles of hybrid material (diameter at the μm scale) and operates with a much higher column pressure (up to 15,000 psi) than HPLC. UPLC considerably reduces runtime and thus increases sample throughput; it performs also much better in terms of resolution, sensitivity, and separation efficiency; it is almost always coupled with a mass spectrometer (see below). Li et al. developed a rapid, sensitive, and reliable UPLC-MS/MS method for the determination of 21 antibiotics belonging to 7 classes in different wastewater matrixes (Li et al., 2009). Yu et al. reported a selective and sensitive method to measure 11 antibiotics in water by UPLC-MS/MS; it was successfully used to identify ofloxacin in wastewater and sludge samples [49]. Dinh et al. used UPLC-MS/MS to find different veterinary drugs including furazolidone, with a limit of detection of 1.5-3 μg/kg for the later [5]. Whatever the chromatographic system (HPLC or UPLC), most of the studies were conducted using reverse phase chromatography. Many brands and geometries were tested but at the end the retained columns are almost all C18-types. The mobile phase is almost always a very classical one in the following type of configuration: a binary gradient made of an aqueous phase (ultrapure water) and an organic one (ACN or MeOH), both acidified with a small organic acid (acid formic, acetic, trifluoroacetic…) generally at 0.1%. Among all the studies listed in Table 2, the only one that uses a non C18 stationary phase (phenylpropylsilane phase) is that by Norambuena et al., devoted to the analysis of oxytetracycline, florfenicol, flumequine and oxolinic acid in marine sediments (Norambuena et al., 2013). In this work, HPLC was equipped with a PDA (photodiode array detector). HPLC with PDA detection was also used for the detection of florfenicol in water by Zhang et al. and that of sulfonamide residues by Won et al. [50,51]. HPLC-PDA has been also reported for the detection of sulfadiazine in South-Korean marine products, although SDZ was only identified in 2 of the 10 samples analyzed [51]. Han et al. reported a combination of UVD (UV detector) and FLD (fluorescence detector) for the analysis of tetracyclines in feeds [48]. Studies reporting the detection of flumequine and oxolinic acid by HPLC-FLD in sediments, soils and various types of water have been also reported [25]. In a general way “classical” HPLC detectors tend to be gradually replaced by mass spectrometers, which are today recognized as the best detectors in terms of sensitivity, specificity and selectivity.

In almost all of the studies conducted using LC-MS coupling, the liquid chromatograph (HPLC or UPLC) is coupled with a triple quadrupole (TQ) operated in the MRM (multiple reaction monitoring) mode on two transitions. Tandem mass spectrometry (MS/MS) is preferred to simple MS as it strongly reduces the risk of false negatives when performing analysis of complex matrices (Bouchonnet, 2013). Hybrid mass spectrometers associating a quadrupole, a collision cell, and an ion trap have been also reported; their principle of operation is quite similar to that of TQs except that the ion trap permits ion accumulation before detection [47,49]. Among all the studies listed in Table 2, only that by Goessens et al. refers to a high-resolution mass spectrometer (Orbitrap™), which has been employed to analyze 46 antimicrobial drug residues including sulfonamides, tetracyclines, quinolones, macrolides, nitrofurans and phenicols in aquatic matrices [23]. Since it allows the differentiation of isobaric ions, high-resolution mass spectrometry (HRMS) constitutes a tool of choice for structural elucidation of metabolites and by-products; it also significantly reduces interferences during routine analysis of very complex matrices. The use of MS/MS and/or HRMS enables the development and validation of multi-residue methods able to detect and quantify many molecules in one unique run. Even if the number of analytes remains limited in comparison with methods reported for pesticide residue dosages (hundreds of analytes), some of the methods reported for the analysis of veterinary antibiotics allows the simultaneous detection of tens of drugs. For instance, Gros et al. developed a LC-MS/MS method for the one run detection of 73 pharmaceuticals including tetracycline, oxytetracycline, sulfadiazine, sulfamethoxazole, ofloxacin, flumequine, ciprofloxacin and erythromycin in river water and WWTP influent and effluent while a LC-HRMS was developed by Goessens et al. for the analysis of 46 antimicrobial drug residues including sulfonamides, tetracyclines, quinolones, macrolides, nitrofurans and phenicols in aquatic matrices [23].

A few analytical approaches were developed apart from traditional separative processes such as liquid chromatography. For example, an aptaprobe was used for the detection of sulfadimethoxine; it simply and conveniently detects SDM with accuracy in the range of 94.2-113% in seawater and 104-118% in fish [52]. A dichromatic label-free aptasensor detects SDM presence through fluorescent emission and color changes of gold nanoparticles. This aptasensor can be applied to the rapid detection in fish and water samples with accuracies between 99.2 and 102% for fish, 99.5 and 100.5% for water [53]. Almeida et al. also developed a new low-cost plastic membrane electrode that detects low concentrations of SDM in aquaculture waters. To test this device, sulfadimethoxine was added to aquaculture waters and the results showed a good agreement between added and measured drug amounts with recoveries ranging from 96.8% to 101%, with a relative error between -0.7% and 3.5%, which suggests that it constitutes a good method that could be extended to the determination of other pharmaceuticals in water [54].

Treatment Processes

Once they reach the environment, micropollutants are subjected to three main degradation processes: biodegradation, hydrolysis, and photolysis [8]. Due to their own antibacterial activity, antibiotics are poorly or not degraded by natural biotic processes. Chemical and physical processes – natural or industrial – can be considered as a better option to remove these refractory veterinary drugs. As we will see below, many treatments have been considered for their degradation and/or removal from aqueous media; they include membrane anodic Fenton, advanced oxidation processes, heterogeneous photocatalysis, and electrocoagulation [55]. Table 3 lists some treatments applied for the removal of veterinary pharmaceuticals considered individually.

Table 3: Various treatment methods for the removing of the veterinary drugs mainly used in fish farming from aqueous media

Treatment process

Drug

Reference

H2O2/Fe + UV treatment Tetracycline, oxytetracycline Zhao et al., 2020
CaO2/UV Florfenicole Zheng et al., 2019
Photodegradation with TiO2, Sulfadiazine He et al., 2016
Batch culture of c. vulgaris microalgae Sulfamethoxazole Y.-Y. Peng et al., 2020
Ozonation Sulfadimethoxine

Erythromycin

A.Y.-C. Lin et al., 2009
Heterogeneous photocatalysis with suspended TiO2 Oxolinic acid Giraldo et al., 2010
Ultraviolet / peroxydisulfate Ofloxacin Zhu et al., 2020
Reverse osmosis membrane Ciprofloxacin Alonso et al., 2018
Electrochemical cathode degradation, Magnetic biochar Furazolidone Kong et al., 2015; Gurav et al., 2020

Using a pilot drinking water treatment plant, Vieno et al. observed the elimination of some pharmaceuticals with a process consisting in ferric salt coagulation, rapid sand filtration, ozonation, and two-stage granular activated carbon filtration. Most pharmaceuticals ceased to be quantifiable at the end of ozonation; only ciprofloxacin passed all treatment steps almost unaffected [56]. No treatment appears as a universal solution at this day. For instance, classical wastewater treatments are known to be inefficient for the elimination of sulfonamides [47]. Tetracycline is hard to degrade using conventional wastewater treatments such as activated sludge, which might be due to tetracyclines’ strong hydrophilic properties related to their stable naphthalene ring structure (Zhao et al., 2020). The biological degradation of oxytetracycline is limited due to its broad-spectrum antimicrobial properties, which are considered responsible for the development of antibiotic resistance genes in the environment (Xie et al., 2016). OTC fails to be degraded into non-toxic transformation products by most abiotic processes; therefore sonocatalytic degradation has been proposed to form less toxic intermediates [57].

Most of the alternative approaches for the removal of the most resistant molecules are based on photocatalytic or electrochemical approaches. For instance, sulfamethoxazole is not efficiently removed in conventional wastewater treatment plants [47] but it is susceptible to photodegradation in aqueous solutions along several pathways [58]. UV-photolysis appears as a treatment of choice for many micropollutants, especially in the presence of a catalyst that increases both the kinetics and yields of the degradation reaction. UV-irradiation induces the formation of hydroxyl radicals from water and dissolved oxygen; these highly reactive radicals are responsible for the oxidation of micropollutants. The addition of hydrogen peroxide, alone or with a metal has been frequently reported. Zhao et al. evaluated the effect of H2O2/Fe addition to the UV treatment of tetracycline. They found out that optimum concentrations of H2O2 (0.5 mM) and Fe(II) (0.05 mM) promote the degradation of TET. Also, a higher pH level facilitated the UV-attenuation of TET (Zhao et al., 2020) while a lower pH helped its degradation under ozonation conditions. Ming Zheng et al. utilized CaO2/UV as an advanced oxidation process to remove FF and other active pharmaceutical compounds from wastewater. CaO2 is considered as the “solid form” of H2O2 with an advantage of being more stable than H2O2 in presence of base or catalyst. CaO2 can produce .OH And O2. radicals and oxidize complex chemical compounds. The highest removal of FF happened at 0.1 g.L-1 of CaO2. The addition of CaO2 also allows reducing the irradiation time and so decreasing the consumption of energy [31]. Titanium oxide appears as a widely used photocatalyst for the removal of pharmaceuticals. UV-irradiation with TiO2 removed 99% of sulfadiazine under the following conditions: initial concentrations of sulfadiazine at 5.0 mg/L and TiO2 at 0.08 g/L, pH = 7, radiation intensity of 1000 μw/cm2 and reaction time of 50 min [59]. SDZ can be also effectively degraded using gamma irradiation, the elimination efficiency being improved under acidic conditions [60]. Degradation of sulfamethoxazole under ultraviolet light with TiO2 reached 96%. TiO2 is the most suitable catalyst due to its stability, non-toxicity, and high catalytic activity [59]. Oxolinic acid was degraded using heterogeneous photocatalysis with titanium dioxide suspended on particles. After 30 min under optimal conditions both the substrate and the microbial activity were eliminated [61] and the residual byproducts did not show antibacterial activity [62]. Organic matter can both hinder and activate the photodegradation. For instance, oxolinic acid persistence is lower in ultrapure water than in environmental water, especially in the presence of high salinity values. The presence of organic matter can decrease the photodegradation rate in freshwater by acting as a light filter and hydroxyl radicals scavenger [63]. An ultraviolet/peroxydisulfate system was reported for the degradation of ofloxacin in synthetic seawater and in synthetic marine aquaculture water; the global toxicity (including toxicities of reagents and by-products) induced by such a process is lower than that induced with traditional approaches using NaClO [64]. Traditional removal processes only based on chemical reactions tend to be replaced by the so-called AOPs (advance oxidation processes) but some of them remains in use. For instance, [21] demonstrated that sulfadimethoxine can be removed by potassium permanganate in water. The degradation is affected by the pH of the solution and a higher temperature is also beneficial for the removal [21]. The use of zero-valent iron-activated persulfate has been developed to remediate antibiotic-contaminated wastewater since it removes 69% and 74% of SDM from filtered and unfiltered discharge water, respectively [65]. It has to be kept in mind that in a general way catalysis is hardly applied to complex matrices (water containing high levels of dissolved organic matter for instance) as it becomes quite inefficient in the presence of large amounts of organic and inorganic species. Furthermore, altering the pH when necessary can be very costly.

Electro-Fenton technology is also an advanced oxidation process that produces hydroxyl radicals to degrade refractory pollutants. However, this process may be inefficient due to the high dissociation energy of some chemical bonds, such as C-F in florfenicol. On the other hand, UV light has shown to be capable of cleaving such bonds, and the combination of Electro-Fenton with UV could be an efficient technology. Jiang et al. coupled the photoelectrochemical reaction in a sequential filtration system to degrade and mineralize FF. Their study revealed 78.1 ± 9.1% mineralization of FF at a low concentration of 14 µM [66]. Various technologies have been studied to remove furazolidone from wastewater samples; among them, Kong et al. used an electrochemical system to degrade FUR in a cathode compartment. Their study evaluated the effect of different cathode potentials, initial antibiotic concentration, and cathode buffer solution on FUR degradation. Different cathode potentials resulted in different degradation products, and different buffer solutions and initial concentrations of furazolidone had just an obvious effect on its removal efficiency [67].

Ozonation has also been reported as a powerful tool for micropollutants abatement. For example, it allowed the degradation of tetracycline at 99.5% with 40% of mineralization (C. Wang et al., 2020). Sulfadimethoxine showed to be completely removed from water by ozone bubbling within 20 minutes; this strong efficiency was partially explained by the presence of one or several aromatic rings on which the O3 molecule can fix itself before hydrolysis and/or ring opening [68]. Ozonation at an application rate of 0.17 g O3/min was able to remove some antibiotics in about 20 min, although the degradation of erythromycin was slower, and more effective at a high pH or with H2O2 addition [68].

As ciprofloxacin is particularly refractory to conventional wastewater treatments, special attention has been paid to its removal using alternative processes. Reverse osmosis was successfully tested for the removal (99.96% removal) of CPIX in seawater [69]. Additionally, ciprofloxacin removal by electrosorption has been successfully demonstrated using graphite felt electrodes [70].

Finally, and despite their microbial activity, some veterinary drugs were submitted to treatments involving biological processes. In two sewage treatment plants in Guangzhou, more than 85% of ofloxacin was removed in the effluents after activated sludge [71]. A novel microalgae biofilm membrane photobioreactor (MBMP) was developed for the cultivation of microalgae and the removal of sulfonamides from residual wastewater of aquaculture. The reduction of sulfadiazine in the MBMP during its stable operation was up to 61-79.2%. It can be considered that the performance of the MBMP is higher than the one achieved by traditional batch cultivation [18]. The removal of sulfamethoxazole by a batch culture of microalgae c. vulgaris was 34.07% after 12 days of concentration in marine aquaculture wastewater (against 3.33% without microalgae). Gurav et al. used a magnetic biochar to remove furazolidone from wastewater; they showed that the magnetic biochar had a higher surface area as compared to normal biochar, and possessed a much better removal efficiency [27].

Conclusion

Aquaculture is a booming industry, which by necessity uses drugs to prevent and treat diseases in fish farms. The current literature has been mainly focused on the possible adverse effects on human health due to the possible remnants of these drugs in fish. In recent years, the presence of drugs in environmental matrices has become more evident but the effects of aquaculture waste on the environment have been poorly documented. Thanks to the continuous improvement of analytical methods, it is now possible to successfully determine veterinary pharmaceuticals at trace amounts in complex matrices. The most common analytical processes rely on solid phase extraction and liquid chromatography – HPLC or UHPLC – coupled with mass spectrometry. Current efforts are aimed at developing multiresidue methods for the simultaneous analysis of various drugs from different families. In any case, the literature directed specifically to the water discarded by aquaculture is very scarce. Although most of the analytical methods are focused on separative processes, recent ventures successfully tested aptasensors and aptaprobes to quickly and efficiently measure low concentrations of antibiotics in water.

Waste from agriculture and aquaculture usually reaches the environment directly, without being previously treated. Currently, there is more knowledge about the toxic effects of pharmaceuticals in humans and animals than about their environmental impact. A good evaluation of their potential ecotoxicological impact should consider factors such as the presence of sediments, the stability of water and other substances with which the drugs can interact since all these parameters may affect the final result of the investigations [72]. It is known that contamination by antibiotics includes the development of resistance in the aquatic pathogens, direct toxicity to microflora and microfauna, and even possible risks to human health due to the consumption of non-target contaminated benthic fauna [73]. For this reason, ways to treat or eliminate these pollutants are still under investigation given that conventional wastewater treatment plants are not fully efficient – and sometimes quasi inefficient – for their removal. The antimicrobial activity of pharmaceuticals makes their treatment through biotic processes difficult and advanced oxidation processes appear as a tool of choice for their removal. Photocatalysis and electrochemistry are not really viable on a wide scale to this day but ozonation and UV/H2O2 oxidation are much more applicable. In a general way, it is of first importance to mitigate the ecotoxicological risks associated with aquaculture waste released into the sea, by (i) selecting the proper veterinary drugs, (ii) limiting the amount of waste release from fish farming and (iii) setting efficient solutions for the removal of pharmaceuticals once or before they reach the environment [74-77].

References

  1. FAO (2020) The State of World Fisheries and Aquaculture 2020. FAO.
  2. Castilla-Fernández D, Moreno-González D, Bouza M, Saez-Gómez A, Ballesteros E, et al. (2021) Assessment of a specific sample cleanup for the multiresidue determination of veterinary drugs and pesticides in salmon using liquid chromatography/tandem mass spectrometry. Food Control 130: 108311.
  3. Chokmangmeepisarn P, Thangsunan P, Kayansamruaj P, Rodkhum C (2021) Resistome characterization of Flavobacterium columnare isolated from freshwater cultured Asian sea bass (Lates calcarifer) revealed diversity of quinolone resistance associated genes. Aquaculture 544: 737149.
  4. Pastor-Belda M, Campillo N, Arroyo-Manzanares N, Hernández-Córdoba M, Viñas P (2020) Determination of amphenicol antibiotics and their glucuronide metabolites in urine samples using liquid chromatography with quadrupole time-of-flight mass spectrometry. Journal of Chromatography B 1146: 122122.
  5. Dinh QT, Munoz G, Vo Duy S, Tien Do D, Bayen S, et al. (2020) Analysis of sulfonamides, fluoroquinolones, tetracyclines, triphenylmethane dyes and other veterinary drug residues in cultured and wild seafood sold in Montreal, Canada. Journal of Food Composition and Analysis 94: 103630.
  6. Du J, Li X, Tian L, Li J, Wang C, et al. (2021) Determination of macrolides in animal tissues and egg by multi-walled carbon nanotube-based dispersive solid-phase extraction and ultra-high performance liquid chromatography–tandem mass spectrometry. Food Chemistry 365: 130502.
  7. Lulijwa R, Rupia EJ, Alfaro AC (2019) Antibiotic use in aquaculture, policies and regulation, health and environmental risks: A review of the top 15 major producers. Reviews in Aquaculture 12: 640-663.
  8. Leal JF, Santos EBH, Esteves VI (2018) Oxytetracycline in intensive aquaculture: Water quality during and after its administration, environmental fate, toxicity and bacterial resistance. Reviews in Aquaculture 11: 4.
  9. Archundia D, Duwig C, Lehembre F, Chiron S, Morel MC, et al. (2017). Antibiotic pollution in the Katari subcatchment of the Titicaca Lake: Major transformation products and occurrence of resistance genes. Science of The Total Environment 576: 671-682.
  10. Krzeminski P, Tomei MC, Karaolia P, Langenhoff A, Almeida CMR, et al. (2019) Performance of secondary wastewater treatment methods for the removal of contaminants of emerging concern implicated in crop uptake and antibiotic resistance spread: A review. Science of The Total Environment 648: 1052-1081. [crossref]
  11. Barreto FM, da Silva MR, Braga PAC, Bragotto APA, Hisano H, et al. (2018) Evaluation of the leaching of florfenicol from coated medicated fish feed into water. Environmental Pollution 242: 1245-1252. [crossref]
  12. Kim W, Lee Y, Kim SD (2017) Developing and applying a site-specific multimedia fate model to address ecological risk of oxytetracycline discharged with aquaculture effluent in coastal waters off Jangheung, Korea. Ecotoxicology and Environmental Safety 145: 221-226. [crossref]
  13. Chopra I, Roberts M (2001) Tetracycline Antibiotics: Mode of Action, Applications, Molecular Biology, and Epidemiology of Bacterial Resistance. Microbiology and Molecular Biology Reviews 65: 232-260. [crossref]
  14. Lee PT, Liao ZH, Huang HT, Chuang CY, Nan FH (2020) β-glucan alleviates the immunosuppressive effects of oxytetracycline on the non-specific immune responses and resistance against Vibrio alginolyticus infection in Epinephelus fuscoguttatus × Epinephelus lanceolatus hybrids. Fish & Shellfish Immunology 100: 467-475. [crossref]
  15. Li Z, Qi W, Feng Y, Liu Y, Ebrahim S, et al. (2019) Degradation mechanisms of oxytetracycline in the environment. Journal of Integrative Agriculture 18: 1953-1960.
  16. Grave K, Hansen MK, Kruse H, Bangen M, Kristoffersen AB (2008) Prescription of antimicrobial drugs in Norwegian aquaculture with an emphasis on “new” fish species. Preventive Veterinary Medicine 83: 156-169. [crossref]
  17. Wang Y, Li X, Fu Y, Chen Y, Wang Y, et al. (2020) Association of florfenicol residues with the abundance of oxazolidinone resistance genes in livestock manures. Journal of Hazardous Materials 399: 123059.
  18. Peng YY, Gao F, Yang HL, Wu HWJ, Li C, et al. (2020) Simultaneous removal of nutrient and sulfonamides from marine aquaculture wastewater by concentrated and attached cultivation of Chlorella vulgaris in an algal biofilm membrane photobioreactor (BF-MPBR). Science of The Total Environment 725: 138524. [crossref]
  19. Al-Ansari MM, Benabdelkamel H, Al-Humaid L (2021) Degradation of sulfadiazine and electricity generation from wastewater using Bacillus subtilis EL06 integrated with an open circuit system. Chemosphere 276: 130145. [crossref]
  20. Cheng L, Chen Y, Zheng YY, Zhan Y, Zhao H, et al. (2017) Bioaccumulation of sulfadiazine and subsequent enzymatic activities in Chinese mitten crab (Eriocheir sinensis). Marine Pollution Bulletin 121: 176-182. [crossref]
  21. Zhuang J, Wang S, Tan Y, Xiao R, Chen J, et al. (2019) Degradation of sulfadimethoxine by permanganate in aquatic environment: Influence factors, intermediate products and theoretical study. Science of the Total Environment 671: 705-713. [crossref]
  22. (2020) Oxolinic acid. National Center for Biotechnology Information.
  23. Goessens T, Huysman S, De Troyer N, Deknock A, Goethals P, et al. (2020) Multi-class analysis of 46 antimicrobial drug residues in pond water using UHPLC-Orbitrap-HRMS and application to freshwater ponds in Flanders, Belgium. Talanta 220: 121326.
  24. Barmpa A, Frousiou O, Kalogiannis S, Perdih F, Turel I, et al. (2018). Manganese (II) complexes of the quinolone family member flumequine: Structure, antimicrobial activity and affinity for albumins and calf-thymus DNA. Polyhedron 145: 166-175.
  25. Qi, Y, Qu R, Liu J, Chen J, Al-Basher G, et al. (2019) Oxidation of flumequine in aqueous solution by UV-activated peroxymonosulfate: Kinetics, water matrix effects, degradation products and reaction pathways. Chemosphere 237: 124484.
  26. Yanong RPE (2019) Use of Antibiotics in Ornamental Fish Aquaculture. Fisheries and Aquatic Sciences.
  27. Gurav R, Bhatia SK, Choi TR, Park YL, Park JY, et al. (2020) Treatment of furazolidone contaminated water using banana pseudostem biochar engineered with facile synthesized magnetic nanocomposites. Bioresource Technology 297: 122472. [crossref]
  28. Sreejith S, Shajahan S, Prathiush PR, Anjana VM, Viswanathan A, et al. (2020) Healthy broilers disseminate antibiotic resistance in response to tetracycline input in feed concentrates. Microbial Pathogenesis 149: 104562. [crossref]
  29. Magdaleno A, Carusso S, Moretton J (2017) Toxicity and Genotoxicity of Three Antimicrobials Commonly Used in Veterinary Medicine. Bulletin of Environmental Contamination and Toxicology 99: 315-320. [crossref]
  30. Zhang Y, Zhang X, Guo R, Zhang Q, Cao X, et al. (2020) Effects of florfenicol on growth, photosynthesis and antioxidant system of the non-target organism Isochrysis galbana. Comparative Biochemistry and Physiology Part C: Toxicology & Pharmacology 233: 108764. [crossref]
  31. Zheng M, Daniels KD, Park M, Nienhauser AB, Clevenger EC, et al. (2019) Attenuation of pharmaceutically active compounds in aqueous solution by UV/CaO2 process: Influencing factors, degradation mechanism and pathways. Water Research 164: 114922.
  32. Freitas EC, Rocha O, Espíndola ELG (2018) Effects of florfenicol and oxytetracycline on the tropical cladoceran Ceriodaphnia silvestrii: A mixture toxicity approach to predict the potential risks of antimicrobials for zooplankton. Ecotoxicology and Environmental Safety 162: 663-672.
  33. Hu D, Meng F, Cui Y, Yin M, Ning H, et al. (2020) Growth and cardiovascular development are repressed by florfenicol exposure in early chicken embryos. Poultry Science 99: 2736-2745. [crossref]
  34. Guilhermino L, Luís R Vieira, Diogo Ribeiro, Ana Sofia Tavares, Vera Cardoso (2017) Uptake and effects of the antimicrobial florfenicol, microplastics and their mixtures on freshwater exotic invasive bivalve Corbicula fluminea. The Science of the Total Environment 622-623: 1131-1142. [crossref]
  35. Duan Y, Deng L, Shi Z, Liu X, Zeng H, et al. (2020) Efficient sulfadiazine degradation via in-situ epitaxial grow of Graphitic Carbon Nitride (g-C3N4) on carbon dots heterostructures under visible light irradiation: Synthesis, mechanisms and toxicity evaluation. Journal of Colloid and Interface Science 561: 696-707.
  36. Lin T, Yu S, Chen Y, Chen W (2014) Integrated biomarker responses in zebrafish exposed to sulfonamides. Environmental Toxicology and Pharmacology 38: 444-452. [crossref]
  37. Li Z, Chang Q, Li S, Gao M, She Z, et al. (2017) Impact of sulfadiazine on performance and microbial community of a sequencing batch biofilm reactor treating synthetic mariculture wastewater. Bioresource Technology 235: 122-130.
  38. Chen Y, Zhou JL, Cheng L, Zheng YY, Xu J (2017) Sediment and salinity effects on the bioaccumulation of sulfamethoxazole in zebrafish (Danio rerio). Chemosphere 180: 467-475. [crossref]
  39. Borecka M, Białk-Bielińska A, Haliński ŁP, Pazdro K, Stepnowski P, et al. (2016) The influence of salinity on the toxicity of selected sulfonamides and trimethoprim towards the green algae Chlorella vulgaris. Journal of Hazardous Materials 308: 179-186. [crossref]
  40. Tkaczyk A, Bownik A, Dudka J, Kowal K, Ślaska B (2021) Daphnia magna model in the toxicity assessment of pharmaceuticals: A review. Science of The Total Environment 763: 143038. [crossref]
  41. Sun Y, Zhang L, Zhang X, Chen T, Dong D, et al. (2020) Enhanced bioaccumulation of fluorinated antibiotics in crucian carp (Carassius carassius): Influence of fluorine substituent. Science of The Total Environment, 748, 141567. [crossref]
  42. De Liguoro M, Maraj S, Merlanti R (2019) Transgenerational toxicity of flumequine over four generations of Daphnia magna. Ecotoxicology and Environmental Safety 169: 814-821. [crossref]
  43. Sendra M, Moreno-Garrido I, Blasco J, Araújo CVM (2018) Effect of erythromycin and modulating effect of CeO2 NPs on the toxicity exerted by the antibiotic on the microalgae Chlamydomonas reinhardtii and Phaeodactylum tricornutum. Environmental Pollution 242: 357-366.
  44. Hua T, Li S, Li F, Ondon BS, Liu Y, et al. (2019) Degradation performance and microbial community analysis of microbial electrolysis cells for erythromycin wastewater treatment. Biochemical Engineering Journal 146: 1-9.
  45. Lewkowski J, Rogacz D, Rychter P (2019) Hazardous ecotoxicological impact of two commonly used nitrofuran-derived antibacterial drugs: Furazolidone and nitrofurantoin. Chemosphere 222: 381-390. [crossref]
  46. Sun Y, Waterhouse GIN, Xu L, Qiao X, Xu Z (2020) Three-dimensional electrochemical sensor with covalent organic framework decorated carbon nanotubes signal amplification for the detection of furazolidone. Sensors and Actuators B: Chemical 321: 128501.
  47. García-Galán MJ, Díaz-Cruz MS, Barceló D (2011) Occurrence of sulfonamide residues along the Ebro river basin: Removal in wastewater treatment plants and environmental impact assessment. Environment International 37: 462-473. [crossref]
  48. Han J, Jiang D, Chen T, Jin W, Wu Z, et al. (2020) Simultaneous determination of olaquindox, oxytetracycline and chlorotetracycline in feeds by high performance liquid chromatography with ultraviolet and fluorescence detection adopting online synchronous derivation and separation. Journal of Chromatography B 1152: 122253. [crossref]
  49. Yu R, Chen L, Shen R, Li P, Shi N (2020) Quantification of ultratrace levels of fluoroquinolones in wastewater by molecularly imprinted solid phase extraction and liquid chromatography triple quadrupole mass. Environmental Technology & Innovation 19: 100919.
  50. Zhang Q, Guo R, Zhang Y, Zhang X, Mostafizur RMD, et al. (2020) Study on florfenicol-contained feeds delivery in Dicentrarchus labrax seawater recirculating and flowing aquaculture systems. Aquaculture 526: 735326.
  51. Won SY, Lee CH, Chang HS, Kim SO, Lee SH, et al. (2011) Monitoring of 14 sulfonamide antibiotic residues in marine products using HPLC-PDA and LC-MS/MS. Food Control 22: 1101-1107.
  52. Chen XX, Lin ZZ, Hong CY, Yao QH, Huang ZY (2020) A dichromatic label-free aptasensor for sulfadimethoxine detection in fish and water based on AuNPs color and fluorescent dyeing of double-stranded DNA with SYBR Green I. Food Chemistry 309: 125712. [crossref]
  53. Chen XX, Lin ZZ, Yao QH, Huang ZY (2020) A practical aptaprobe for sulfadimethoxine residue detection in water and fish based on the fluorescence quenching of CdTe QDs by poly(diallyldimethylammonium chloride). Journal of Food Composition and Analysis 91: 103526.
  54. Almeida SAA, Montenegro MCBSM, Sales MGF (2013) New and low cost plastic membrane electrode with low detection limits for sulfadimethoxine determination in aquaculture waters. Journal of Electroanalytical Chemistry 709: 39-45.
  55. Nariyan E, Aghababaei A, Sillanpää M (2017) Removal of pharmaceutical from water with an electrocoagulation process; effect of various parameters and studies of isotherm and kinetic. Separation and Purification Technology 188: 266-281.
  56. Vieno NM, Härkki H, Tuhkanen T, Kronberg L (2007) Occurrence of pharmaceuticals in river water and their elimination in a pilot-scale drinking water treatment plant. Environmental Science & Technology, 41: 5077-5084. [crossref]
  57. Kumar Subramani A, Rani P, Wang P.-H, Chen B.-Y, Mohan S et al. (2019) Performance assessment of the combined treatment for oxytetracycline antibiotics removal by sonocatalysis and degradation using Pseudomonas aeruginosa. Journal of Environmental Chemical Engineering 7: 103215.
  58. Moore DE (1998) Mechanisms of photosensitization by phototoxic drugs. Mutation Research/Fundamental and Molecular Mechanisms of Mutagenesis 422: 165-173.
  59. He Z, Cheng X, Kyzas GZ, Fu J (2016) Pharmaceuticals pollution of aquaculture and its management in China. Journal of Molecular Liquids 223: 781-789.
  60. Guo Z, Zhou F, Zhao Y, Zhang C, Liu F, et al. (2012) Gamma irradiation-induced sulfadiazine degradation and its removal mechanisms. Chemical Engineering Journal 191: 256-262.
  61. Giraldo AL, Peñuela GA, Torres-Palma RA, Pino NJ, Palominos RA, et al. (2010) Degradation of the antibiotic oxolinic acid by photocatalysis with TiO2 in suspension. Water Research 44: 5158-5167. [crossref]
  62. Pereira JHOS, Reis AC, Queirós D, Nunes OC, Borges MT, et al. (2013) Insights into solar TiO2-assisted photocatalytic oxidation of two antibiotics employed in aquatic animal production, oxolinic acid and oxytetracycline. Science of The Total Environment 463-464: 274-283. [crossref]
  63. dos Louros VL, Silva CP, Nadais H, Otero M, Esteves VI, et al. (2020) Oxolinic acid in aquaculture waters: Can natural attenuation through photodegradation decrease its concentration? Science of The Total Environment 749: 141661. [crossref]
  64. Zhu Y, Wei M, Pan Z, Li L, Liang J, et al. (2020) Ultraviolet/peroxydisulfate degradation of ofloxacin in seawater: Kinetics, mechanism and toxicity of products. Science of The Total Environment 705: 135960. [crossref]
  65. Chokejaroenrat C, Sakulthaew C, Angkaew A, Satapanajaru T, Poapolathep A, et al. (2019) Remediating sulfadimethoxine-contaminated aquaculture wastewater using ZVI-activated persulfate in a flow-through system. Aquacultural Engineering 84: 99-105.
  66. Wen-Li J, Yang-Cheng D, Muhammad Rizwan H, Han JL, Liang B, et al. (2019) A novel TiO2/graphite felt photoanode assisted electro-Fenton catalytic membrane process for sequential degradation of antibiotic florfenicol and elimination of its antibacterial activity. Chemical Engineering Journal 391: 123503.
  67. Kong D, Liang B, Yun H, Ma J, Li Z, et al. (2015) Electrochemical degradation of nitrofurans furazolidone by cathode: Characterization, pathway and antibacterial activity analysis. Chemical Engineering Journal 262: 1244-1251.
  68. Lin AYC, Lin CF, Chiou JM, Hong PKA (2009) O3 and O3/H2O2 treatment of sulfonamide and macrolide antibiotics in wastewater. Journal of Hazardous Materials 171: 452-458. [crossref]
  69. Alonso JJS, El Kori N, Melián-Martel N, Del Río-Gamero B (2018) Removal of ciprofloxacin from seawater by reverse osmosis. Journal of Environmental Management 217: 337-345. [crossref]
  70. Divyapriya G, Mohanalakshmi J, kumar KV, Nambi IM (2020) Electro-enhanced adsorptive removal of ciprofloxacin from aqueous solution on graphite felt. Journal of Environmental Chemical Engineering 8: 104299.
  71. Peng X, Wang Z, Kuang W, Tan J, Li K (2006) A preliminary study on the occurrence and behavior of sulfonamides, ofloxacin and chloramphenicol antimicrobials in wastewaters of two sewage treatment plants in Guangzhou, China. Science of The Total Environment 371: 314-322. [crossref]
  72. Isidori M, Lavorgna M, Nardelli A, Pascarella L, Parrella A (2005) Toxic and genotoxic evaluation of six antibiotics on non-target organisms. Science of The Total Environment 346: 87-98.
  73. Rigos G, Nengas I, Alexis M, Troisi GM (2004) Potential drug (oxytetracycline and oxolinic acid) pollution from Mediterranean sparid fish farms. Aquatic Toxicology 69: 281-288. [crossref]
  74. Barmpa A, Frousiou O, Kalogiannis S, Perdih F, Turel I, et al. (2018). Manganese (II) complexes of the quinolone family member flumequine: Structure, antimicrobial activity and affinity for albumins and calf-thymus DNA. Polyhedron 145: 166-175.
  75. Commission Regulation (EU) No 37/2010 of 22 December 2009 on pharmacologically active substances and their classification regarding maximum residue limits in foodstuffs of animal origin.
  76. Drzymała J, Kalka J (2020) Ecotoxic interactions between pharmaceuticals in mixtures: Diclofenac and sulfamethoxazole. Chemosphere 259: 127407. [crossref]
  77. Guo H, Li Z, Lin S, Li D, Jiang N, et al. (2021) Multi-catalysis induced by pulsed discharge plasma coupled with graphene-Fe3O4 nanocomposites for efficient removal of ofloxacin in water: Mechanism, degradation pathway and potential toxicity. Chemosphere 265: 129089.

Inguinal Hernias Repair by Laparascopy (TEP)

DOI: 10.31038/IMROJ.2021653

Summary

Introduction: The hernia affection is one of the processes that has been studied into much detail and whose treatment pursues excellence, although many controversies are still yet to be resolved. Laparoscopy repair of inguinal hernia is a treatment method that improves the quality of management given to our patients.

Objective: To identify perioperative events, surgical complications and to evaluate the pain referred for the patients who have had inguinal hernia repair by the laparoscopic method (TEP).

Methods: A prospective and descriptive study was done on 80 patients who have had endoscopic (TEP) repair of inguinal hernias between January 2013 and December 2020.

Results: We performed 100 hernioplastias by laparocoscopy in 80 patients. The male sex predominated in a 5:1 ratio and the surgical time average was, 53.5 minutes for unilateral hernias and 71.3 minutes for the bilateral ones. The most frequent complication in the transoperatory stage was ¨minor bleeding¨. At 15 days after surgery, 86.3% of the operated did not complain of pain, but social and laboral reintegration was at a 34% of the total.

Conclusions: Laparoscopic inguinal hernioplasty is a good therapeutic option, mainly in patients with bilateral and reproduced inguinal hernias.

Keywords

Hernia recurrence, Inguinal hernia, Laparoscopic hernioplasty

Introduction

Since the concept of endoscopic inguinal hernia repair was first described by Ger in 1982, endoscopic techniques have been modified; It was a time when failures and complications – coupled with high cost – outweighed initial enthusiasm [1]. Laparoscopic hernioplasty (LH) has gained popularity in the last decade and numerous controlled studies appear in the literature comparing laparoscopic techniques with conventional ones. [2] In recent years, HL, despite being one of the most controversial laparoscopic procedures, has established itself as a therapeutic option to consider. The advantages of this method are demonstrated in bilateral, recurrent hernias and in the labor-active subject, who requires early return to work [3].

Method

Between January 2013 and December 2020, a prospective, descriptive, longitudinal-cut study was carried out in 80 patients operated on by endoscopy (PET) with the diagnosis of inguinal hernia, at the General Teaching Hospital “Enrique Cabrera”. All patients who agreed with the type of surgical intervention, the study and who gave their informed consent were included; patients older than 30 years classified ASA I-III, without anesthetic contraindications for laparoscopic intervention and patients classified as Nyhus III and IV. Patients with previous surgical wounds in the inguinal region, to operate, not dependent on reproduced inguinal hernias and patients with complicated, irreducible or slipped inguinal hernias; they were excluded. The surgical techniques were: totally extraperitoneal laparoscopic inguinal hernioplasty (TEP). The PET technique was performed with some variants such as: no use of the balloon trocar, the preperitoneal space was decolorized by means of the 0º laparoscope and the insufflation of CO2 at 13 mmHg. In patients with large hernial rings, a polypropylene cone was placed in the hernial defect and subsequently a 15 x 12 cm polypropylene prosthesis. There was no need to fasten the meshes with clips [4]. In the immediate postoperative period, the visual pain scale analog scale (VAS) was applied and a pain value was assigned by means of “little faces”, which starts from very happy (I value) to very sad (X value). Pain quantification was repeated in consultation 7 days, 15 days and one month after the operation.

Results

100 hernias were operated on in 80 patients (20 patients [25%] had bilateral hernias, 85 primary hernias, and 15 reproduced hernias). The average age was 55.6 years, the youngest patient was 30 years old and the oldest was 77 years old, but the majority (14 patients) belonged to the fifth decade of life. The male sex predominated in 84%, which represented a male/female ratio of 5: 1. 43% of the patients made great physical efforts on a regular basis.

Table 1 shows that 36 patients had the habit of smoking, which represents 45% of the total and 17 consumed alcohol for 21.2%.

Table 1: Toxic habits and personal pathological history (APP).

Toxic habits and (APP)

Frequency

%

Chronic Cough

6

7,5

COPD

4

5,0

Constipation

7

8,7

Heart disease

7

8,7

Diabetes Mellitus

7

8,7

Smoking

36

45,0

Alcohol consumption

17

21,2

N= 80 COPD: Chronic obstructive pulmonary disease.

Table 2 shows that right hernias were more frequent in 54.0% of the total; the indirect variety with great dilation of the annulus and destruction of the posterior wall (IIIb) was the most frequent (41 hernias). Nine femoral hernias and 15 recurrent hernias were operated on.

Table 2: Distributión according classificatión to the Nyhus [5].

Classifica-tión

Right Left Total
Frequency % Frequency

%

IIIa

19

33,1 16 34,7

35(35,0%)

IIIb

21

37,8 20 50,0

41(41,0%)

IIIc

6

14,1 3 10,8

9 (9,0%)

IV

8

14,8 7 13,0

15(15,0%)

Total

54

54,0 46 46,0

100(100%)

The total is 100 hernias operated on in 80 patients.

The 100 surgeries were performed by PET technique (100.0%). Two of the patients in whom a PET technique was started had to be converted to a conventional prosthetic technique due to accidental perforation of the peritoneum, passing CO2 into the peritoneal cavity, and consequently, the loss of the preperitoneal surgical space, and another was the conversion of a failed PET technique.

The mean surgical time for unilateral hernias was 53.5 min, with a minimum time of 25 min and a maximum of 120 min. In bilateral repairs, the average surgical time was 71.3 min, with a minimum of 40 min and a maximum of 110 minutes. The hospital stay was less than 24 hours in 70 patients (87.5%), in 5 patients it extended from 24 to 48 hours and in 5 patients it lasted more than 48 hours.

Table 3 shows minor bleeding as the most frequent complication in the intraoperative period, in 22 repairs (22.0%) that originated 13 hematomas (13.0%). No complications were observed after the second week, but two patients suffered recurrences (2.0%) more than two months after the operation.

Table 3: Complications.

Complications

Intraoperative complications

2 weeks

After 1 month

Minor bleeding

22 (22%)

Accidental opening of the peritoneum

9 (9,0%)

Hematomas

13 (13,0%)

Seromas

4 (4,0%)

Recurrences

2 (2,0%)

Table 4 shows the pain classification according to the VAS scale. In the immediate postoperative period, after the patient recovered from anesthesia, 75 individuals (93.7%) were classified as VAS I and 5 patients as VAS II. At 24 h after the operation, 19 patients (23.7%) were classified as VAS I, 50 (62.5%) as VAS II, 7 patients as VAS III, and 4 as VAS IV. In the first week postoperative consultation, 52 patients (65.0%) were classified as VAS I and 15 as VAS II, and two patients with moderate pain (VAS V) appeared in this period. At 15 days after surgery, 69 patients (86.3%) were VAS I and at one month 73 (91.3%) were. The incorporation to the usual activities, including work, was of 3 patients (3.7%) a week after the operation, after 15 days there were 23 patients (28.7%) and at month 54 patients, for 67, 5% of the total.

Table 4: Evaluatión of the Visual Analog Scale (VAS) [6].

VAS

Inmediate preoperative

First day First week 15 Days

First month

Vas I

75 (93,7%)

19 (23,7%) 52 (65,0%) 69 (86,3%)

73 (91,3%)

VAS II

54 (6,3%)

50 (62,5%) 15 (18,7%) 11 (13,7%)

VAS III

7 (8,7%) 5 (6,3%)

VAS IV

4 (5,1%) 4 (5,0%)

7 (8,7%)

VAS V

4(5,0%)

Discussion

Currently, with the improvement of laparoscopic techniques, inguinal hernia surgery is emerging as safe, feasible and as a good therapeutic option, regardless of the age of the patient; However, the preoperative evaluation of the individual must be correct and thorough, specifically the cardiorespiratory function, since with the TEP method a working space is created between the sheets of the transverse lamina, richly vascularized, so that the absorption and elimination of the CO2 is greater than that produced in the peritoneal cavity during pneumoperitoneum [5-7].

Although men predominated, there was a slight increase in women in the series with respect to other authors [8] In laparoscopic practice, the finding of hernial defects diagnosed during the intraoperative period is frequent, in men and women, the latter essentially with a history gynecological disorders.

Although the usefulness of hernia repairs in asymptomatic patients is questioned in some articles, the authors consider that it would be beneficial for the patient, if conditions permit, to repair the hernial defect by the TAPP method [9].

The relationship between hernial disease and physical exertion has been classic since Cooper’s time. In the series, 68% of the patients performed physical activities that involved great and medium efforts and also analyzing the multifactorial nature in the pathogenesis of hernia disease, it is striking that approximately half of the operated patients were smokers, a factor that influences in collagen metabolism, significantly linked to hernia recurrences [10].

Most of the repairs were by means of the TEP technique and we consider, like other authors, that although the TAPP technique brings us closer to the area from a perspective familiar to the surgeon (peritoneal cavity) and facilitates the so-called “learning curve”; Hernia disease – because it is considered a parietal defect- should be given a solution from this same plane, to avoid the probability of serious complications of the intra-abdominal organs and to leave the transperitoneal method as a tactical resource when the totally extraperitoneal method is unsuccessful [11].

Average surgical time was similar to other series [12]. It is known that this tends to decrease when the surgical team gains in experience. The longest operating time recorded was in a patient, who started with a PET technique, but due to technical difficulties, he was converted to a conventional posterior repair.

The main complications were related to minor intraoperative bleeding and postoperative hematomas. In 3 patients it was necessary to drain the hematoma due to the discomfort caused, however, in the rest of the patients with hematomas and seromas they were treated with conservative measures. In two patients, recurrence occurred 2 months after the operation, which was interpreted as a technical error [13,14].

Our results coincide with numerous studies that affirm less postoperative pain with the use of minimal access techniques, as well as a prompt socio-occupational reincorporation of patients [1,3,9,15] Despite the fact that 70% and 93.3% of the patients at 1 week and 15 days after surgery, respectively, had no pain or minimal discomfort; only 18 individuals (30%) started their usual activities before 15 days. These results contrast with other studies that report a return to work and social activities between 10-15 days postoperatively, although it is likely that some sociocultural factors are influencing these results [1,16].

In the series there were no major intraoperative or postoperative complications, only minor bleeding and bruising. In most of the patients, before 2 weeks postoperatively, the pain disappeared, however, the return to social work activities after 15 days was low.

Conclusions

Laparoscopic inguinal hernioplasty was an effective therapeutic option, especially for patients with bilateral and reproduced hernias. It provided benefits to patients and families, the former joining work and social activities early.

Conflicts of Interest

The authors do not declare any conflicts of interest.

References

  1. Ruiz-Funes Map, Farell Rj, Marmolejo Ca, Sosa Laj, Cruz Za (2020) Abordaje De Hernias Poco Frecuentes Por Cirugía De Mínimo Acceso: Serie De Casos. Rev Mex Cir Endoscop 21: 6-14.
  2. Magnus H, Anders B, Westerdahl J (2008) Laparoscopic Extraperitoneal Inguinal Hernia Repair Versus Open Mesh Repair: Long-Term Follow-Up Of A Randomized Controlled Trial. Surgery 143: 313-317. [crossref]
  3. Bittner R, Bain K, Bansal Vk, Berrevoet F, Bingener-Casey J, et al. (2019) Update Of Guidelines For Laparoscopic Treatment Of Ventral And Incisional Abdominal Wall Hernias (International Endo Hernia Society (Iehs))-Part A. Surg Endosc 33: 3069-3139. [crossref]
  4. Cruz Alonso Jr. La Endohernioplastia. Detalles Técnicos. Arch Cir Gen Dig [Serie En Internet]. 2007 [Citado 10 De Diciembre De 2010].
  5. Carbonell Tatay F (2001) Hernia Inguinocrural. Valencia: Ethicon, 141-142.
  6. Deloach Lj, Higgins Ms, Caplan Ab, Stiff Jl (1998) The Visual Analog Scale In The Immediate Postoperative Period: Intrasubject Variability And Correlation With A Numeric Scale. Anesth 86:102-106. [crossref]
  7. Halligan S, Parker Sg, Plumb Aa, Windsor Ac (2018) Imaging Complex Ventral Hernias, Their Surgical Repair, And Their Complications. Eur Radiol 28: 3560-3569. [crossref]
  8. Henriksen Na, Kaufmann R, Simons Mp Et Al (2020) Ehs and Ahs Guidelines For Treatment Of Primary Ventral Hernias In Rare Locations Or Special Circumstances. Bjs Open 4: 342-353. [crossref]
  9. León González Oc, López Rodríguez Pr, Danta Fundora Lm, Satorre Rocha Ja, García Castillo E, Ceruto Ortiz La (2019) Inguinal Hernia Repair By Laparascopy. Surg Cas Stud Op Acc J 3: 2.
  10. Bórquez Mp, Garrido Ol, Manterola Dc, Peña P, Schlageter C, Orellana J (2003) Estudio De Fibras Colágenas Y Elásticas Del Tejido Conjuntivo De Pacientes Con Y Sin Hernia Inguinal Primaria. Rev Méd Chile 131: 1273-1279.
  11. Díaz Martínez J, Ramírez Colin G (2017) Hernioplastia Inguinal Endoscópico Total Extraperitoneal (Tep). Experiencia De Nuestros Primeros 100 Casos En El Hospital De Segundo Nivel. Cir Endos 18: 125-134.
  12. Martin Gómez M (2018) Cirugía Laparoscópica De La Hernia Inguinal. Cir Andal 29: 174-177.
  13. Palmisano Em, Martínez Jd, García Mm, González Jd (2018) Maniobras Claves Y Trucos En Tep. Rev Hispanoamerican Hernia 6: 86-90.
  14. Hernia Surge Group (2018) International Guidelines For Groin Hernia Management. Hernia 22: 1-165. [crossref]
  15. Liu J, Zhu Y, Shen Y, Liu S, Wang M, Zhao X (2017) The Feasibility Of Laparoscopic Management Of Incarcerated Obturator Hernia. Surg Endosc 31: 656-660. [crossref]
  16. Morera Pérez M, Roque González R, González León T, Sánchez Piñero Ro, Olivé González Jb (2019) Cirugía Abdominal En El Adulto Mayor. Rev Cubana Cir 58.

COVID-19 and Its Impact on Health of Children and Adolescents: A Review

DOI: 10.31038/IGOJ.2021443

Abstract

Actually, COVID-19 is a risk for all human populations (men, women, children and adolescents), with medical, economic and social importance. So, we have as objectives in this manuscript to contribute to knowledge of the impact of this viral disease on the children and adolescents’ health.

Keywords

Coronavirus, COVID-19, Pediatric infections, SARS Coronavirus 2, SARS-Co2

Introduction

COVID-19 is a viral disease whose causative agent was identified in Wuhan-China, as a novel coronavirus, severe acute respiratory syndrome coronavirus2 (SARS-CoV-2) [1]. After, 15 April 2020, COVID-19 has caused more than two million confirmed cases and more than 128,000 deaths globally, including 82,295 confirmed cases and 3,342 deaths in China [2].

The Chinese government has locked Wuhan city, since 23 January 2020, and implemented a series of social distancing measures such as: strict traffic restrictions; prohibition of social gatherings, and closure of residential communities [3].

In [4] the authors have indicated:

1) That “the purpose of the review is to summarize the most relevant evidence of COVID-19 in children highlighting similarities and differences with adults.

2) As results and conclusions:

Of the 266 articles considered as relevant in that research, the authors have retrieved the following information:

“(i) Children were mainly family clusters of cases and have relatively milder clinical presentation compared with adults, and they were reported to have better outcomes with a significantly lower mortality rate; (ii) Studies determining why the manifestations of SARS-CoV.2 infection are so variable may help to gain a better understanding of the disease and to accelerate the vaccines and therapies.”

In [5] the authors have referred that: (i) “at present, SARSCoV-2 is still rampant in the world; (ii) Zhengzhou City in Henan Province serves as an example, 102 people have been confirmed to be infected with SARSCoV-2 (at 24:00 on February 5th, 2020), including three children, the youngest is 4 years old.”

Conclusions

  1. We think that it was here demonstrated that COVID-19 has an impact on children and adolescents.
  2. We hope that with the attention that is being given to this viral disease it is possible, in a short/medium time, to obtain
  3. More knowledge, concerning the virus, the treatment and the
  4. Vaccines, so that with this knowledge is possible a control of all viral variants circulating in the world.
  5. To combat COVID-19, it is necessary:

i)   To have persons specialized for the different types of combat;

ii)  The collaboration between countries at world level;

iii) The collaboration of the person, in general, for the execution of the rules established by health services of their countries;

iv)  The collaboration between different governmental services;

v)  The collaboration between different community services that have responsibility, in the context of public health, such as town halls, health centers and hospitals.

vi)  Staff working in crèches, have to be attentive for occurrence of signals and symptoms of COVID-19 in the children under its protection.

References

  1. Archived: WHO Timeline – COVID-19, 27 April 2020- who.int World Health Organization. Novel coronavirus – China. Geneva, Switzerland: Word Health Organization httpps.//www.who.int/csr/don/12-january-2020-novelcoronavirus-china/en/. [2020-01-12]
  2. COVID-19 – Global Health, COVID-19: What you need to know about the coronavirus pandemic in 15 April. weform.org
  3. Wuham lockdown: a year of Chinas fight against the COVID pandemic – 22 January, Corona virus pandemic bbc.com
  4. Perikleous E, Tsalkidis A, Bush A, Paraskakis E (2020) Coronavirus global pandemic: An overview of current findings among pediatric patients. Pediatric Pulmonology 1-16. [crossref]
  5. Li Y, Guo F, Cao Y, Li L, Guo Y (2020) Insight into COVID-2019 for pediatricians. Pediatric Pulmonology 55: E1-E4. [crossref]

Alcohol and Health: Social Evolution, Production and Control

DOI: 10.31038/IMROJ.2021652

Abstract

Alcohol drinking has been intrinsic to human social evolution certainly from the period when change from hunter-gather to farmer took place, which in many societies dates from 10,000 or more years ago. Throughout much of that time the risk of water-borne diseases such as enteric fever was such that there were undoubted health benefits to consumption of alcoholic beverages, such as mead, beer, cider and wine, in preference to contaminated water. Further benefit may also be that fermented drinks provided a means of storing food energy when preservation methods such as freezing had yet to be developed. These benefits were no longer critical once efficient sanitation and safe water supplies and food storage technologies had been developed from the mid-19th century. The study of fermentation has contributed enormously to medicine providing drugs or their precursors as diverse as antibiotics and statins. During human cultural evolution alcohol has frequently been a key part of religious and fertility rites and of social activities, such as feasting. However, the introduction of cheap, distilled, alcoholic drinks, such as gin, in the late 17th century was damaging to society and in modern times evidence for any health advantages to drinking alcohol is lacking. The threshold consumption below which no harm can be observed is low or non-existent. Whereas prohibition can be effective in theocracies as demonstrated by transnational statistics on alcohol consumption, historically, attempts to enforce prohibition solely by legislation have generally been disastrous in non-sectarian societies. The scale of the industries producing alcohol is vast and many drinks, particularly wine are intimately ingrained into many cultures. Taxation is a traditional means of curbing excess consumption and there may be a case for banning certain types of alcoholic products and advertising, but draconian measures will lead to increased crime through illegal drinking and the misuse of other recreational drugs. It should not be assumed that lessons from the success in reducing smoking can be directly translated into limitation of alcohol use to improve health.

Introduction

Alcohol production and consumption has been a key element in human social evolution and acculturation, certainly since the late stone-age. Beliefs about whether this is beneficial or harmful to health both of individuals and societies have fluctuated throughout history. In adopting a rational policy towards alcohol use and abuse [1], it is essential to understand not just recently, but historically, how it has come to occupy such an important place in many civilisations and whether claims that it has some health-giving properties are likely to be true or is it simply an instrument of pleasure with the potential through over-indulgence to cause harm?

History

Stone-Age

There is a school of thought these days that we were healthier as hunter-gatherers. Most of human genetic evolution had occurred by the time we had reached that stage in our social evolution. The idea is thus that our metabolism is best suited to the diet and energy expenditure of a Stone Age man after which it has not changed much, if at all. Presumably the life of a hunter-gatherer involved collecting shellfish from the beach, catching the occasional animal and seasonally eating the odd nut, wild fruit or root [2]. Certainly this diet included no more than a trace of alcohol, but equally certainly it did not often include the five portions of ‘fruit and veg’ of the type we are now frequently advised to eat. The fruit and veg of the hunter-gatherer would have been the diminutive specimens, not the florid vegetables we eat today as the result of artificial selection (selective breeding). However, our hunter-gatherer ancestors, who it is claimed were so fit, lived in small, nomadic groups, which does have its advantages. They did not have to worry too much about sewage mixing with drinking water, if they were regularly on the move. Enteric fever became a major problem in the settled communities where farming developed from the end of the last ice age about 12,000 years ago. Successful farming depended on artificial selection to create cereal crops, vegetables, fruit and farm animals, leading eventually to the diet we have today, and to major changes in society, including the predilection for feasting. The major production of mead, wine and beer also probably began around 10,000 years ago with the development of apiaries and the cultivation of grapes and cereals. It would have been facilitated by the development of pottery vessels in the late Neolithic period (around 11000BC). Industrial alcohol production probably did not begin in Europe, but probably in Asia minor.

Impetus to Develop Production of Alcoholic Beverages

Usually it is assumed that the intoxicant property of alcohol was the major inducement for its production, but there were clear health benefits in former times. Beverages, such as wine, were a means of storing food energy and thus contributed to the avoidance of starvation during the winter months. Importantly too, fermented alcoholic drinks provided a safe water supply and thus prevented enteric fever [3]. Typhoid and other water-borne causes of enteric fever were the commonest cause of death, killing half of the population even as late as the mid-19th C. Perhaps it is not surprising, therefore, that wine or beer even at breakfast, were widely consumed in preference to water well into Victorian times. Interestingly the temperance movement made little headway until the mid-19th C when improvements in sanitation, as the result of advances in public health engineering and the allocation of civic funding for it, ensured a safe water supply [4]. Being teetotal was before that a risky business.

Mead

The discovery that fermentation could produce intoxication may have been made by early man after consuming rotting honey from bee colonies. Presumably, attempts to replicate its pleasing intoxicant effect led to deliberate fermentation of honey. Mead is probably therefore the earliest widely consumed alcoholic beverage [5]. Thus mead was the ambrosia of the ancient Greeks, but its production declined in the south of Europe and Asia Minor, when grapes were discovered as a more easily produced, more predictable source of sugar for alcohol production by fermentation. Bees are, however, ubiquitous. Thus, in the north, where vine fruits were less available, the popularity of mead continued. In Norse/Aryan mythology a draught of mead, delivered by beautiful, divine maidens, was the reward for warriors who reached Valhalla. Celtic mythology tells of a river of mead running through paradise, while Anglo-Saxon culture regaled mead as the bestower of immortality, poetry and knowledge. The word “honeymoon” comes from the ancient tradition of giving bridal couples a month’s worth of mead to ensure a fruitful union

Beer

Grain cultivation from a variety of plants developed in many locations from 11000BC and so also did beer-making. In some ways the history of beer is more interesting than wine, because it was developed in many different civilisations and cultures widely separated geographically [6]. In antiquity beer would travel less well than wine. Thus, exchange of knowledge concerning its manufacture, may have been largely responsible for its spread. However, beer-drinking might also have developed in some cultures at a time before they were likely to receive migrants or travellers from beer-producing regions. Therefore, it is tempting to speculate that the discovery of beer occurs at a particular stage of social evolution concurrently or shortly after the development of cereal crops. Babylonian clay tablets from c 4300 BC describe recipes for beer. Noah’s provisions for the Ark included beer. Beer was a vital part of the Babylonian, Assyrian, Egyptian, Hebrew, Chinese, and Inca cultures. Different grains were used in different cultures: Africa used millet, maize and cassava, North America used persimmon (although agave was used in Mexico), South America used corn (although sweet potatoes were used in Brazil), Japan used rice to make sake, China used wheat to make samshu, other Asian cultures used sorghum, Russians used rye to make quass or kvass and Egyptians used barley and may have cultivated it strictly for brewing as it made poor bread.

Cider

The origins of cider are obscure. Apples are known to have been cultivated in the Nile delta as early as 1300 BC, but they may have been grown much earlier in China [7]. Cider was, however, a novelty to the Romans on their first visit to Britain in 55BC. Its production by the Normans (of Viking descent) was undoubtedly on an industrial scale by the time of their conquest of Britain in 1066. The Viking diaspora of which Normandy was part extended at various times from the 8th to the 11th century AD not only to the Atlantic and Baltic coasts of Europe, but also the Mediterranean and Black Sea coastal regions of Europe, North Africa and Asia minor [8]. However, the spread of cider was more limited until modern times. Currently, the UK has the world’s highest per capita consumption, as well as its largest cider-producing companies. Cider is also popular in some other European countries including Ireland and some regions of Portugal, France, and Spain. Germany also has its own types of cider, a particularly tart version known as apfelwein.

Wine

As early as 6000BC there is evidence of wine production with the wild grapes (Vitis vinifera sylvestris) indigenous to the Transcaucasian region between the Black and Caspian Seas embodying parts of present day Turkey and Azerbajan (ancient Armenia), Georgia and Iran. The earliest cultivated grape seeds (Vitis vinifera vinifera) together with jars and other artefacts for bulk wine production dating to 4100BC were discovered in a cave in Armenia [9-11]. Trade in wine led to the spread of grape cultivars and wine-making knowledge and technology south to Mesopotamia (Iraq, Syria and Kuwait) and Phoenicia (coastal Syria and Lebanon) and west through Bulgaria and Macedonia to Greece. Sea-going Phoenician traders and the expansion of the Greek Empire extended the culture of wine more widely still. The cults of Bacchus and Dionysus incorporated wine into religious rites in the Greek world. Cleopatra (from the dynasty of Greek rulers of Egypt) is said by Pliny to have drunk a goblet of wine in which she had dissolved a priceless pearl to impress Mark Anthony by consuming the most extravagant tipple in history. The wine, itself, must not have travelled well: it must largely have deteriorated to vinegar to convert calcium carbonate to acetate [12]. Under Rome the transport of wine improved and viniculture spread throughout its empire as far as the south of England and Germany [13]. Improvements in ceramic and glass technology were crucial to this. With the collapse of Rome’s control of its former empire, European wine production would have been seriously threatened had it not been for the expansion of the Catholic Church. The belief that red wine is the blood of the Gods goes back to a pre-Christian tradition, but its consumption and production by monastic orders was way beyond its role in the eucharist. The Benedictines followed by the Cistercians were the greatest wine producers. Many persisting aspects of viniculture derive from this period. Dom Perignon (1638–1715), a Benedictine monk introduced many blending techniques and preservation methods, including secondary fermentation in which wine was preserved by carbon dioxide under pressure and thus fizzed when its cork was released. This provided an alternative to fortification with higher proof spirits, such as brandy (see distillation) to permit wine to travel well as, for example port and sherry. Thus champagne joined port and brandy in British society. Wine was taken to Central and South America by the Conquistadors and vines brought from Spain and Portugal were introduced and cultivated by their monasteries in Mexico and much of South America including California, Argentina and Chile. Jan van Riebeeck, a Dutch ship’s doctor who believed wine could cure scurvy introduced wine production to South Africa after taking vine cuttings to Cape Town. Vines for wine production were brought to Australia in the 1830’s and to New Zealand at about the same time or possibly a few years earlier from collections of French grapes in English hot houses.

The artificial selection of grape vine variants with desirable distinctive characteristics for wine production has been practised for several thousand years. Cross-fertilising these with other varieties to create good wine-producing hybrid vines is, however, a tedious business with only a small proportion being homozygotes for all of the desirable characteristics and several generations reaching maturity might be necessary to confirm this. Therefore the practice was to graft the new vines on to rootstock of wild-type vines, thus circumventing the need for sexual reproduction. However, in the 1860’s the wine industries of France were devastated by Phylloxera vastatrix, an aphid imported from North America [14]. In France this infestation caused withering and destruction of vine roots. The scarcity of wine in France led to an increase in the drinking of absinthe. Soon after the vine disease began the microbial cause was identified by Jules-Emile Planchon, using microscopy and influenced by Louis Pasteur’s work [15]. That the microbe was a stage in the metamorphosis of an aphid already known in North America, Daktulosphaira vitifoliae, and imported from there, was, however, not appreciated and his work was initially ignored. Although less devastating outside France, Phylloxera spread to Austro-Hungary, Germany, Spain, Italy, Portugal and Madeira. Eventually, Pasteur, himself, was put in charge of the investigation of the cause of vine disease (1885). His reputation had by then been built with his famous proof that fermentation was due to yeast microbes and his saving of the the French silk worm industry from the ravages of a microbial disease [16]. However, his attempts at a chemical (pesticide) approach to control the blight failed. Ironically North America proved to be both the cause and the remedy. The wild vines from there were relatively unaffected by Daktulosphaira vitifoliae. Thus grafting the old vines onto rootstock from American varieties in countries affected by Phylloxera provided the eventual solution . Pasteur, of course, went on to make many more contributions to organic chemistry, germ theory, antisepsis and immunisation.

The Discovery of Distillation and the Production of Spirits

The widespread abstinence current throughout the Arab Muslim world is a comparatively recent adoption. As Omar Kayyam (1048–1131) remarks to his lover, ‘A book of verses underneath the bough, a flask of wine, a loaf of bread and thou….’. The word ‘alcohol’ is derived from an Arabic word and it was Arab alchemists who separated it from wine. The most famous of these, Jābir ibn Hayyān (721-815), devised apparatus for distillation in the 8th century [17]. Distillation permitted the production of spirits with much higher alcohol content than was possible by fermentation alone and the use of inferior ingredients and techniques for the initial fermentation, which prior to distillation would produce an undrinkable liquid. Not only was production thus cheap, but the product was more easily transported than wine and beer. It could be issued to armies and navies and sold to the multitudinous poor. Huge quantities of gin (barley malt), rum (sugar cane), scotch whiskey (barley malt), bourbon whiskey (corn, rye, wheat, barley malt), brandy (grapes and other fruits) and vodka (potatoes, cereals) were produced commercially by the 18th century in Europe and countries with populations of European origin [18]. Drunkeness became rife: signs outside gin shops in the proletariat parts of London read, ‘Drunk for a penny; dead drunk for two pennies; clean straw for nothing’.

Temperance: Taxation, Legislation and Religion

In Britain, a series of parliamentary acts from 1729 onwards were required to ameliorate the gin craze. Historically, attempts to outlaw alcohol generally either for reasons of morality or to increase the industrial productivity of the nation’s workforce have generally failed dismally. Taxation (excise duty) on the other hand has proved highly successful for governments. Alcohol was first taxed in 1643 and by 1713 had overtaken land tax as the government’s main source of revenue [19]. Often the declared motivation for increases in excise duty was to pay for the armed forces. Issues of religion, improved health and providing a better society were not the main motivation, at least until the growth of the temperance movement. A policy of prohibition might not only make a political party unsuccessful electorally, but also cut off its major revenue source, should it achieve office. In Britain in 1914 a movement to prohibit alcohol supported by Lloyd George and King George 5th failed to gain popular support, although a ban persisted in the Royal Household until the war ended in 1918 and licensing hours were introduced on the grounds that they would increase productivity. Tsar Nicolas 2nd did succeed in banning alcohol in 1914 (ineffectively and with the loss of considerable revenue for his government) throughout his empire, a ban which persisted longer than he did, being cancelled by the Bolsheviks in 1925. In the USA prohibition was enacted as the 18th amendment to the constitution in 1920, but was rescinded in 1933, not least due to the uncontrolled rise in crime that resulted. Many other nations have briefly attempted to abolish alcohol consumption including Iceland, Norway, Finland Australia and New Zealand. Currently most of the nations where alcohol is illegal are Muslim. Examples are Yemen, Saudi Arabia, Maldives, Kuwait, Iran, Brunei and Afghanistan. The Koran is clear that intoxication is irreligious. Although specific mention of alcohol is not made, the current generally accepted belief is that ‘Whatever intoxicates in large quantities, a small quantity of it is forbidden’. Thus, the consumption of alcohol is frowned upon in Muslim societies, even in those that have stopped short of a state ban. With the loss of European influence in such societies dramatic changes have occurred with Algeria being the most extreme example. Until independence from France in 1962 it was the world’s largest exporter of wine, whereas today its production has dwindled to almost none [20]. Christian denominations vary greatly in the degree to which they denounce alcohol with the reformed churches, such as the Presbyterian, Quaker, Methodist and Baptist denominations at the forefront of abolition. The predominant religion undoubtedly influences national alcohol consumption (Table 1).

Table 1: Wine and alcohol consumed (litres of pure alcohol per person aged 15 or more years in 2016 or latest year for which figures were available) published by the World Health Organisation [1]. Data for selected countries are arranged in descending order of wine consumption. The difference between the sum of the wine and beer consumption is generally due to intake of spirits. Data from Spain may be influenced by its tourist industry.

Country

Alcohol consumption Alcohol consumed as wine

Alcohol consumed as beer

Portugal

12.3

7.5

3.2

France

12.6

7.4

2.4

Italy

7.5

4.9

1.9

Greece

10.4

4.7

3.3

Belgium

12.1

4.6

5.4

UK

11.4

4.1

4.1

Australia

10.6

3.9

4.2

Germany

13.4

3.8

7.1

Austria

 11.6

3.7

6.1

Ireland

13.0

3.6

6.1

New Zealand

10.7

3.5

4.0

Netherlands

8.7

 3.1

4.2

Norway

7.5

2.7

3.3

Canada

 8.9

2.2

4.0

USA

 9.8

1.8

4.6

Spain

10.0

1.8

5.4

Russia

 11.7

1.5

 4.6

China

 7.2

0.2

 2.2

 India

 5.7

 <0.1

 0.5

Egypt, Kuwait, Pakistan, Iran

 ≤1

 <0.02

 <0.5

Benefits Derived from Scientific and Technical Advances in Brewing

Fermentation due to yeasts or bacteria in the gut is vital for our digestive system. Fermentation is also widely used in the production and storage of foods as diverse as bread, cheese, pickles, yoghurt, vegetables (eg kimchi), fish (surströmming) and, of course, alcoholic beverages. This form of food preservation largely exploits the preservative effects of ethanol, lactic acid, acetic acid and carbon dioxide produced during fermentation, but other chemicals can be produced, depending on the micro-organism chosen. Despite its wide use for many thousand years it was not generally accepted until the latter part of the 19th century following the findings of Pasteur that fermentation is a metabolic process ( involving living microorganisms) that produces chemical changes in organic substrates through the action of enzymes [21]. As the range of organic compounds produced by fermentation was investigated, techniques employed in the brewing and wine-making industries were modified for the large scale production of organic compounds otherwise difficult to synthesise in quantity. This received considerable impetus when Chaim Weizmann (the father of industrial fermentation and first president of Israel) working in Manchester scaled up the knowledge that Clostridium acetobutylium yielded acetone from starch. Many tons of acetone necessary for cordite production were thus manufactured in the First World War. For this, sanctioned by Churchill and Lloyd George, six British distilleries were requisitioned.

The availability of industrial techniques for bulk culture of selected naturally occurring micro-organisms has subsequently led to the manufacture of a huge range of therapeutic drugs from antibiotics to statins [22]. More recently, the creation of genetically modified organisms has extended the array of therapeutic agents as diverse as recombinant proteins and monoclonal antibodies. Whatever the evils of alcohol, knowledge gained from its production continues to contribute hugely to advances in medicine. The benefits of alcohol consumption on the other hand are more questionable.

Units of Alcohol

Quantities of alcohol in medical reports can be confusing. Quite simply, 1 unit is equivalent to 10 ml of pure alcohol. With this knowledge it is easy to convert the alcohol content shown as vol/vol on the label of wine (and other alcoholic beverages) to units. For example 12% alcohol means 12 ml per 100 ml of wine. Thus, a 750 ml bottle contains 12 × 750 ÷ 100 = 90 ml or 9 units of alcohol.

Alcohol and Health in Contemporary Times

Epidemiology

Alcohol is currently largely viewed as a cause of ill health. The catalogue of woe resulting from heavy alcohol consumption is well known and includes loss of social inhibition beyond conviviality, accidents, recklessness, suicide, violence and other criminal behaviour, excessive sedation and inhalation of vomit, dependence, acute and chronic liver disease, acute and chronic pancreatitis, acute and chronic gastritis, carcinoma of the breast, liver, pancreas, oesophagus and intestine, encephalopathy, myopathy, neuropathy, gout, rhinophymoma, pseudo-Cushing’s syndrome, gonadal atrophy, hypertriglyceridaemia and teratogenicity. Heavy alcohol consumption is also a cause of excess cardiovascular mortality due to dysrhythmias, especially atrial fibrillation, but also ventricular dysrhythmias, cardiomyopathy and, often overlooked, it can be a major contributor to hypertension. So does alcohol have any health benefits nowadays? It could be argued, we should not ignore its role in simply making life more enjoyable as long as it adds to and does not detract from the quality of the life. As Dean Martin said, ‘I’d hate to be a teetotaller. Imagine getting up in the morning and knowing that’s as good as you’re going to feel all day’.

Moreover, there has been an ongoing debate since the 1980’s about whether moderate alcohol consumption is associated with lower rates of coronary heart disease than those in non-drinkers [23,24]. The relationship between alcohol consumption and mortality is J-shaped. This has been attributed by some to lower rates of coronary heart disease (CHD) in moderate drinkers than in abstainers [23] and by others to pre-existing disease prompting alcohol abstention [24]. Meta-analysis of prospective observational studies has revealed that the J-shaped relationship with CHD and all-cause mortality is a highly reproducible finding [25,26]. In the largest meta-analysis the effect of alcohol was associated with decreased likelihood of fatal and non-fatal myocardial infarction [26]. The risk of death from heart failure, stroke and non-cardiovascular disease increased with alcohol consumption so that overall the lowest mortality was associated with consumption of around 100 g per week (12.5 units) in both men and women. In a more recent study of over 80,000 Chinese industrial workers around 25 g per week (3.1 units) was associated with the lowest incidence of death [27]. Any benefit from alcohol thus seems to occur below currently recommended ‘safe’ limits (see later).

Mendelian Randomisation

Any association between moderate drinking and longer life expectancy could be because moderate drinkers are healthier than non-drinkers for reasons other than their alcohol consumption. This confounding might be because modest drinkers are, for example, likely to be restrained in other potentially unhealthy behaviours, perhaps smoking less, or they may be from a higher socioeconomic group, which is associated with better health. Statistical adjustment to allow for confounding is of limited validity.

Ideally, of course, cause and effect should be established by a randomised trial. This is what has been done to establish the clinical efficacy of drugs, such as a cholesterol- or blood pressure-lowering medication. Participants are randomly assigned to receive the active drug or to be controls often given placebo to blind the patient and the investigator as to whether treatment is active or not until the end of the trial. After a few years, the incidence of heart attacks and other clinical events in the active treatment and control groups is compared. This is impossible with alcohol. You can hardly expect drinkers to be assigned to the non-drinking control group and vice versa. The same dilemma faced investigators trying to persuade governments that smoking was unhealthy.

Mendelian randomisation is a development which has been hailed as in some cases providing a substitute for randomised clinical trials. If an element of the exposure to a risk factor is genetically determined and there are variants of that gene which have a predictable effect on its penetrance, then it is possible to test for causality by assessing whether the disease is associated with the gene variant(s) linked to the greatest exposure. The method relies on the assumption that the gene variant itself contributes causally to exposure and on the assumption that, during meiosis (gametogenesis), which one of each parent’s pair of genes coding for a particular characteristic a gamete receives is random (a matter of chance). In the case of alcohol exposure two genes have been the subject of particular interest in determining alcohol consumption. One codes for alcohol dehydrogenase, which converts ethanol to acetaldehyde. The second is acetaldehyde dehydrogenase which metabolises the acetaldehyde. Acetaldehyde causes flushing, headaches and many of the features of a hangover. It has been reported that lower activity polymorphisms of alcohol dehydrogenase slow down the rate of formation of acetaldehyde and that high activity polymorphic variants of aldehyde dehydrogenase limit the rise in its circulating levels. Inheritance of genes coding for low activity alcohol dehydrogenase and for high activity aldehyde dehydrogenase is associated with greater alcohol consumption and with increased rates of alcoholism and binge-drinking [28,29]. Alcohol dehydrogenase activity increases in heavy drinkers. So, acquired factors make it unsuitable for a Mendelian randomisation study. However, aldehyde dehydrogenase gene variants associated with increased alcohol consumption have been frequently been examined in relation to disease outcomes in Mendelian randomisation studies [29-31]. No benefit from any degree of alcohol consumption has been reported in these investigations. However, it has been questioned whether this type of genetic polymorphism influences consumption sufficiently to categorise participants reliably [32]. Claims that they exclude a role for low as opposed to low to moderate alcohol consumption in preventing CHD are likely to be unfounded, but on the other hand conventional epidemiology does not prove modest consumption causes such protection.

Causality and Plausibility

Alcohol in General

There is a plethora of mechanisms both for harm and benefit from alcohol. Alcohol exerts its acute effects directly and by, acetaldehyde to which it is rapidly converted. Some chronic effects such as degeneration of cerebral tissue and oesophageal cancer and gastritis may be due to repeated direct exposure to these. The likelihood of complications may be enhanced by nutritional factors, such as thiamine deficiency (wet beri beri) and by toxins contained in the particular beverage.

Thus certain alcoholic beverages may once have given rise to particular syndromes in specific groups of drinkers such as Marchiofava Bignami syndrome in chianti drinkers [33], oesophageal carcinoma in calvados drinkers [34] and cardiomyopathy when cadmium was used in beer production [35]. On the positive front, effects of alcohol on risk factors known to cause coronary heart disease has been a popular topic for research [36]. Experimental evidence undoubtedly confirms that alcohol increases high density lipoprotein (HDL), which in many epidemiological studies is inversely associated with the incidence of atherosclerotic cardiovascular disease. Experimentally alcohol also decreases fibrinogen, the major cause of thrombosis which occurring on atheromatous arteries is the usual cause of heart attacks. One should be cautious in the interpretation of the effect of the alcohol-induced increase in HDL on atherosclerosis risk following the failure of cholesteryl ester transfer inhibitor drugs, which raise HDL far more than alcohol, to ameliorate atherosclerotic cardiovascular disease incidence [37]. Furthermore excess alcohol also causes triglyceride levels to rise. Although it has also been suggested that moderate alcohol consumption is associated with a decreased likelihood of developing type 2 Diabetes mellitus, that these are causally related has been questioned in a recent meta-analysis [38].

Wine vs. Other Types of Alcoholic Beverage

Wine has come to occupy a place of veneration amongst alcoholic beverages, perhaps because of its southern European connections, significance in Christian culture, association with class, aestheticism, high-living and chique. ‘Wine is one of the most civilized things in the world and one of the most natural things of the world that has been brought to the greatest perfection, and it offers a greater range for enjoyment and appreciation than, possibly, any other purely sensory thing’ (Ernest Hemingway. Death in the Afternoon). It has also since ancient times been recommended by certain physicians to improve health. Can something enjoyable be healthy? Physicians rarely recommend anything pleasurable as part of a healthier lifestyle, but is there reason to be more optimistic about at least some types of alcoholic beverages?

The effect of alcohol on biomarkers, such as HDL cholesterol and fibrinogen, is similar whatever the alcoholic beverage and seems to depend on the alcohol itself. However, the notion that wine, particularly red wine, may have more health-giving properties than other alcoholic drinks has been around for some while. The usual reason for advancing this hypothesis is the so-called French paradox: some parts of Southern Europe have relative freedom from coronary disease, despite in the case of the South of France, enjoying a relatively fatty diet [39]. Typical alcohol consumption is similar in France and Ireland with its much higher CHD incidence (Table 1). In France, however, wine comprises a much higher proportion of the alcohol consumed. Studies of people resident in Toulouse and in Belfast reveal that HDL is higher in Toulouse [40], but there is no evidence that wine has a greater effect on HDL than any other source of alcohol [39]. Thus other aspects of the French diet, such as olive oil, and genetic differences may have contributed to the higher HDL in Toulouse and its relatively low CHD incidence. However, there is no denying that the contribution of wine to the alcohol consumed in France, Portugal and Italy is higher than in the UK, Ireland and North America (Table 1) where coronary rates are substantially greater. Red wine has been the subject of most interest as protecting against CHD, because it contains copious quantities of polyphenolic flavonoids, which are potent antioxidants [39] However, randomised trials of antioxidant vitamins have been unsuccessful in preventing heart disease [41]. It could, nevertheless, be argued that antioxidant vitamins used in these trials are not the antioxidants in red wine. It is possible too that some other mechanism could mediate the postulated protective effect of flavonoids in red wine against atherothrombosis [42]. However, it has also been questioned whether these substances are absorbed from the intestine in sufficient quantity [43].

J-Shaped Relationship with Mortality

Why does the CHD benefit of alcohol disappear with higher consumption? In large part because it can lead to obesity, particularly the more dangerous central obesity (brewers’ goitre) which is linked to high blood pressure, to deteriorating lipid levels and to diabetes [44]. Wiry alcoholics do not escape cardiovascular consequences, because excessive alcohol can directly damage the heart leading to dysrhythmias [45] and cardiomyopathy [46]. Furthermore, the fibrinogen-decreasing effect of alcohol may not be beneficial, if blood pressure also rises secondary to alcohol overindulgence, because it can cause strokes due to cerebral haemorrhage [47], Tom Sharpe’s Porterhouse Blue effect.

Mortality from non-cardiovascular disease increases directly with alcohol consumption particularly chronic liver disease, chronic and acute pancreatitis and neoplastic disease (particularly oropharynx, oesophagus, stomach and pancreas, but also tissues less directly exposed such as colorectum and breast) [48].

Safe Limits for Alcohol Consumption

There is a dichotomy of views about whether advice to the public about health and alcohol should be to consume the quantity associated with the lowest mortality or to recommend an upper limit above which mortality exceeds the average. There is thus considerable variation in what are considered safe limits in different nations [49]. Logically, if there is an upper limit, there should be a lower limit. However, there is no national guidance to drink small amounts of alcohol rather than abstain.

The general health recommendation in the UK, which attempted to balance the benefits of alcohol against its ill-effects, was for men not to exceed 21 or women 14 units weekly. This is no more than one third of a bottle a day for men and rather less for women. Women, although less likely than men to become alcohol-dependent, are more susceptible to alcohol-related disease [50]. This seems to make sense because they generally have a smaller surface area and liver than men, but on the other hand they are more likely to underestimate their consumption, creating the impression that their health has been damaged at lower levels of intake. Recently 14 units weekly for both men and women has become the NHS recommendation. This was influenced by the Mendelian randomisation studies. In practice, a medical history should ideally contain information about individual alcohol intake to detect drinking likely to damage health [51], but whereas it is easy to tell a patient who smokes any tobacco product to stop, it is lengthy and complicated to discuss precise quantities of alcohol and may distract from other parts of the history about which it is necessary for the patient to be frank if alcohol intake is not germane to the main purpose of the consultation. Rather than record ‘socialIy’ or some such euphemism (‘not enough’ one lady told me) it is better in general to ask whether any alcohol is consumed in a typical week and if so how much in terms of pints of beer, glasses of wine etc, bearing in mind that 14 units is around 5 pints of beer or 5 glasses of wine per week.

Prevention of Harmful Alcohol Consumption

  1. On present evidence it can be concluded beyond doubt that binge drinking is harmful. This is particularly worrying when it is encouraged by the supply of cheap alcohol to young people.
  2. That alcohol itself is the cause of decreased mortality in modest drinkers is unproven. On the other hand it cannot be said that it is harmful. Moderate consumption can contribute to the enjoyment of life.
  3. Obviously, the medical profession should advise against regular drinking when it occurs at a level which may be harmful to health. To decide at what level this is the case is difficult (see previous discussion).
  4. The most effective means of limiting alcohol intake is on religious grounds enforced by government and by social stigmatisation (including informants to religious and state authorities). In societies which can worship freely this is clearly impossible.
  5. Legally banning alcohol sales and manufacture has never proved successful and indeed may lead to serious crime.
  6. Taxation has proved to be the most effective means of preventing inappropriate drinking.
  7. Medical assistance such as provision for drying out, psychiatric support and Alcoholics Anonymous are clearly helpful in some individuals [52], but do not prevent excessive drinking in society as a whole to the detriment of health or the creation of addicts.
  8. The information in this review invites comparison with another social addiction, namely smoking, which has declined greatly in recent times [53]. Both alcohol and smoking are widespread social addictions, but alcohol has been available for thousands of years longer in which time it has become intimately linked with culture and tradition and has in the past had health benefits, whereas cigarette smoking, the most harmful form, was a phenomenon largely of the 20th century [54]. Alcohol is deeply ingrained into European culture and societies adopting European customs. The link between smoking even in moderation and carcinoma of the bronchus is strong, but on the other hand smoking does not cause disinhibition and inappropriate behaviour. Passive smoking and social stigmatisation has contributed greatly to the decline in smoking as has financial cost due to high taxation. The tobacco industry is huge and has responded by increasing its sales in Asia and by diversification. The alcohol industry is vast even compared to tobacco, but its opportunities to expand into markets in Asia are limited. Both industries have relied heavily on promotion including advertising and sponsorship. This has been limited much more in the case of smoking by legal restriction and by the adverse publicity which organisations accepting sponsorship might receive. Smoking has largely disappeared from films and television and tobacco sponsorship of sport or medical research is more likely to lead to disapprobation than promotional opportunity. Despite the opposition which would ensue from the public relations machine representing the alcohol industry, it might be possible to do more to prevent the promotion of drunkenness by bars, clubs and entertainment providers. Cheap alcoholic beverages are frequently used as loss leaders to entice shoppers: minimum pricing per unit of alcohol could prevent this practice.
  9. A coherent policy must be one of limiting excessive drinking. Historically, it has come to be regarded as normal to over-indulge on certain social occasions. Initiation of the young into over-consumption can be reduced by taxation, discouragement of provision of cheap alcohol and by educational and professional bodies not including it as part of their ritual.
  10. People can be persuaded to modify their habits when not only their own health, but that of others, is at risk. Potential harm from passive smoking undoubtedly was a major factor in banning smoking from public places. Young women are highly likely to give up both smoking and alcohol during preganancy. Driving and many types of work whilst under the influence of alcohol are banned by legal and contractual restraints. Protecting the NHS has been a main plank of persuading people to avoid behaviour likely to spread COVID infection. Perhaps it should be more widely publicised that in at least a fifth of acute hospital admissions over-indulgence in alcohol is largely responsible [55].
  11. To promote the message that all smoking is dangerous is probably easier than to promote moderation in alcohol. Advice to drink alcohol responsibly almost certainly requires more cooperation from the alcohol industry than banning smoking in public places did from the tobacco industry, but a clearer mutually acceptable definition of what is meant by responsible is required [56,57].

Conclusion

What we can learn from epidemiology is more limited than is often claimed. More should be done to curb excessive drinking, which is both unpleasant and unhealthy. Abstinence can be encouraged, indeed legislated for, in certain limited circumstances, but an outright ban for the whole population can do more harm than good. Our current knowledge about alcohol and health can best be summarised in the words of Marie Lloyd, ‘A little of what you fancy does you good’.

Acknowledgment

The authors acknowledge support from Lipid Disease Fund and The National Institute for Health Research/Welcome Trust Clinical Research Facility.

References

  1. Global status report on alcohol and health 2018. Geneva: World Health Organisation. Licence CC BY-NC-SA 3.0 IGO.
  2. Gibbons A. The evolution of diet. https://www.nationalgeographic.com/foodfeatures/evolution-of-diet/
  3. Basnyat B, Qamar FN, Rupali P, Ahmed T, Parry CM (2021) Enteric fever. BMJ 26: 372:n437. [crossref]
  4. Great stink. https://en.wikipedia.org/wiki/Great_Stink
  5. Heritage Daily. History of mead. https://www.heritagedaily.com/2020/03/history-of-mead/126299
  6. Smith G (1995) Beer: a history of suds and civilisation from Mesopotamia to microbreweries. London: Harper Collins.
  7. Juniper BE, Mabberley DJ (2019) The extraordinary story of the apple. London: Kew Publishing.
  8. Oliver N (2012) Vikings.London: Weidenfeld and Nicolson.
  9. Barnard H, Dooley AN, Arashian G, Gasparyan B, Faull KF (2011) Chemical evidence for wine production around 4000BC in the Late Chalolithic Near Eastern highlands. J Arch Sci 38: 977-984.
  10. This P, Lacombe T, Thomas MR (2006) Historical origins and genetic diversity of wine grapes. Trends in Genetics 22: S11-19. [crossref]
  11. McGovern PE et al. (1996) Neolithic resinated wine. Nature 381: 480-481.
  12. Bartowsky EJ, Henschke PA (2008) Acetic acid bacteria spoilage of bottled red wine — a review. Int J Food Microbiol 125: 60-70. [crossref]
  13. Lukacs P (2013) Inventing wine: a new history of one of the World’s most ancient pleasures. New York: WW Norton and Co.
  14. White K (2017) The Devastator: Phylloxera Vastatrix & The Remaking of the World of Wine 2017.
  15. Planchon JE (1875) Les vignes Americaines: Leur culture, leur resistance au Phylloxera et leur avenir en Europe. Montpelier: Academie des Sciences et Lettres.
  16. Casco J (2017) Heroes of wine: Louis Pasteur (1822-1895) 2017.
  17. Amir SS, Tbakhi A, Jabir ibn Hayyan (2007) Ann Saudi Med 27: 53-52.
  18. Forsyth M (2017) A short history of drunkenness. London: Viking.
  19. Yeomans, H orcid.org (2018) Taxation, State Formation and Governmentality: The Historical Development of Alcohol Excise Duties in England and Wales. Social Science History 42: 269-293.
  20. Meloni G, Swinnen J (2014) The Rise and Fall of the World’s Largest Wine Exporter-And Its Institutional Legacy. Journal of Wine Economics 9: 3-33.
  21. Schlenk F (1997) Early research on fermentation – a story of missed opportunities. In New Beer in an Old Bottle: Eduard Buchner and the Growth of Biochemical Knowledge, pp: 43-50, ed. A. Cornish-Bowden, Universitat de València, Spain.
  22. Demain AI, Sanchez S (2009) Microbial drug discovery: 80 years of progress. J Antibiot 62: 5-16. [crossref]
  23. Pham JV et al (2019) A review of the microbial production of bioactive natural products and biologics. Front Microbiol.
  24. Marmot MG, Rose G, Shipley MJ, Thomas BJ (1981) Alcohol and mortality: a U-shaped curve. Lancet 14: 580-583. [crossref]
  25. Shaper AG, Wannamethee G, Walker M (1998) Alcohol and mortality in British men: explaining the U-shaped curve. Lancet 2: 1267-1273. [crossref]
  26. Zhao J, Stockwell T, Roemer A, Naimi T, Chikritzhs T (2017) Alcohol Consumption and Mortality From Coronary Heart Disease: An Updated Meta-Analysis of Cohort Studies. J Stud Alcohol Drugs 78: 375-386. [crossref]
  27. Wood AM, et al. (2018) Risk thresholds for alcohol consumption: combined analysis of individual-participant data for 599 912 current drinkers in 83 prospective studies. Lancet 391: 1513-1523.
  28. Zhang X, Liu Y, Li S, Lichtenstein AH, Chen S, et al. (2021) Alcohol consumption and risk of cardiovascular disease, cancer and mortality: a prospective cohort study. Nutr J 20: 13.
  29. Quertemont E (2004) Genetic polymorphism in ethanol metabolism: acetaldehyde contribution to alcohol abuse and alcoholism. Molecular Psychiatry 9: 570-581. [crossref]
  30. Edenberg HJ, Xuei X, Chen HJ, Tian H, Wetherill LF, et al. (2006) Association of alcohol dehydrogenase genes with alcohol dependence: a comprehensive analysis. Hum Mol Genet 15: 1539-1549. [crossref]
  31. Chikritzhs TN, Naimi TS, Stockwell TR, Liang W (2015) Mendelian randomisation meta-analysis sheds doubt on protective associations between ‘moderate’ alcohol consumption and coronary heart disease. Evid Based Med 20: 38. [crossref]
  32. Holmes MV, Dale CE, Zuccolo L, et al. (2014) Association between alcohol and cardiovascular disease: Mendelian randomisation analysis based on individual participant data. BMJ 349: g4164. [crossref]
  33. Mukamal KJ, Stampfer MJ, Rimm EB (2020) Genetic instrumental variable analysis: time to call mendelian randomization what it is. The example of alcohol and cardiovascular disease. Eur J Epidemiol 35: 93-97. [crossref]
  34. Arbelaez A, Pajon A, Castillo M (2003) Acute Marchiafava-Bignami disease: MR findings in two patients. AJNR Am J Neuroradiol 24: 1955-1957. [crossref]
  35. Linderborg K, Joly JP, Visapää JP, Salaspuro M (2008) Potential mechanism for Calvados-related oesophageal cancer. Food Chem Toxicol 46: 476-479. [crossref]
  36. Morin Y, Daniel P (1967) Quebec beer-drinkers’ cardiomyopathy: etiological considerations. Can Med Assoc J 97: 926-928. [crossref]
  37. Brien SE, Ronksley PE, Turner BJ, Mukamal KJ, Ghali WA (2011) Effect of alcohol consumption on biological markers associated with risk of coronary heart disease: systematic review and meta-analysis of interventional studies. BMJ 342: d636.
  38. Rohatgi A, Westerterp M, von Eckardstein A, Remaley A, Rye KA (2021) HDL in the 21st Century: A Multifunctional Roadmap for Future HDL Research. Circulation 143: 2293-2309. [crossref]
  39. Knott CS, Britton A, Bell S (2018) Trajectories of alcohol consumption prior to the diagnosis of type 2 diabetes: a longitudinal case-cohort study. Int J Epidemiol 47: 953-965. [crossref]
  40. Goldberg IJ, Mosca L, Piano MR, Fisher EA (2001) Nutrition Committee, Council on Epidemiology and Prevention, and Council on Cardiovascular Nursing of the American Heart Association. AHA Science Advisory: Wine and your heart: a science advisory for healthcare professionals from the Nutrition Committee, Council on Epidemiology and Prevention, and Council on Cardiovascular Nursing of the American Heart Association. Circulation 103: 472-475. [crossref]
  41. Mackness B, Mackness MI, Durrington PN, Arrol S, Evans AE, et al. (2000) Paraoxonase activity in two healthy populations with differing rates of coronary heart disease. Eur J Clin Invest 30: 4-10. [crossref]
  42. Clarke R, Armitage J (2002) Antioxidant vitamins and risk of cardiovascular disease. Review of large-scale randomised trials. Cardiovasc Drugs Ther 16: 411-415. [crossref]
  43. Galinski CN, Zwicker JI, Kennedy DR (2016) Revisiting the mechanistic basis of the French Paradox: Red wine inhibits the activity of protein disulfide isomerase in vitro. Thromb Res 137: 169-173. [crossref]
  44. Goldberg DM, Yan J, Soleas GJ (2003) Absorption of three wine-related polyphenols in three different matrices by healthy subjects. Clin Biochem 36: 79-87. [crossref]
  45. Piano MR (2017) Alcohol’s Effects on the Cardiovascular System. Alcohol Res 38: 219-241. [crossref]
  46. Tonelo D, Providência R, Gonçalves L (2013) Holiday heart syndrome revisited after 34 years. Arq Bras Cardiol 101: 183-189. [crossref]
  47. Piano MR, Mazzuco A, Kang M, Phillips SA (2017) Cardiovascular Consequences of Binge Drinking: An Integrative Review with Implications for Advocacy, Policy, and Research. Alcohol Clin Exp Res 41: 487-496. [crossref]
  48. Roerecke M, Kaczorowski J, Tobe SW, Gmel G, Hasan OSM, et al. (2017) The effect of a reduction in alcohol consumption on blood pressure: a systematic review and meta-analysis. Lancet Public Health 2: e108-e120.
  49. Klein WMP, Jacobsen PB, Helzlsouer KJ (2020) Alcohol and Cancer Risk: Clinical and Research Implications. JAMA 323: 23-24. [crossref]
  50. Ceylan-Isik AF, McBride SM, Ren J (2010) Sex difference in alcoholism: who is at a greater risk for development of alcoholic complication? Life Sci 87: 133-138. [crossref]
  51. Jonas DE, Garbutt JC (2017) Screening and Counseling for Unhealthy Alcohol Use in Primary Care Settings. Med Clin North Am 101: 823-837. [crossref]
  52. Kelly JF, Abry A, Ferri M, Humphreys K (2020) Alcoholics Anonymous and 12-Step Facilitation Treatments for Alcohol Use Disorder: A Distillation of a 2020 Cochrane Review for Clinicians and Policy Makers. Alcohol Alcohol 55: 641-651.
  53. Alberg AJ, Shopland DR, Cummings KM (2014) The 2014 Surgeon General’s report: commemorating the 50th Anniversary of the 1964 Report of the Advisory Committee to the US Surgeon General and updating the evidence on the health consequences of cigarette smoking. Am J Epidemiol 179: 403-412. [crossref]
  54. Smoking and Health (1962) A report of the Royal College of Physicians. London: Pittman Medical Publishing Co.
  55. Vardy J, Keliher T, Fisher J, Ritchie F, Bell C, et al. (2016) Quantifying alcohol-related emergency admissions in a UK tertiary referral hospital: a cross-sectional study of chronic alcohol dependency and acute alcohol intoxication. BMJ Open 6: e010005. [crossref]
  56. Haider N (2013) Contesting Intoxication. Islamic Law and Society 20: 48-89.
  57. Ruling on beer with 0.5% alcohol. https://www.islamweb.net/en/fatwa/299059/ [crossref].

Deoxynivalenol and Deepoxy-Deoxynivalenol- Induced Alterations in Theca Cell Function as a Major Cause of Infertility in Dairy Cows

DOI: 10.31038/IJVB.2021543

Abstract

Background: Tricothecene mycotoxins such as Deoxynivalenol (DON) and its metabolite deepoxy-DON (DOM-1), can alter major intracellular signaling pathways within theca cells that can perturb normal folliculogenesis in the ovary resulting in infertility in dairy cows. They function through the activation of a specific tyrosine kinase receptor that transduces the signal by activating several intracellular signaling pathways.

Materials and Methods: In our experimental study, the bovine ovarian theca cells were collected from adult cows during the follicular phase of the estrous cycle and were cultured at a density of 500 000 viable cells for 5 days. The cells were treated on day 5 of the culture with 1 ng/mL DON and DOM-1 for 30 minutes and used mass spectrometry (MS) approach to identify changes in the proteome profile of the cells.

Results: We identified approximately 93 peptides were phosphorylated, and 254 peptides were dephosphorylated in response to DON and DOM-1 compared with non-treated control cells. Gene ontology (GO) analysis indicated that the abundance of proteins associated with cell proliferation such as MAPK3/1, MAPK14, GNGT1, EDN1 and YWHAB were up-regulated in the DON and DOM-1 compared to the control group.

Conclusion: This study reports for the first time that DON and DOM-1 at sub-toxic level can activate major mitogen-induced proliferative molecules within theca cells that can stimulate tumorigenesis in the ovary.

Keywords

Bovine ovary, Deepoxy-deoxynivalenol, Deoxynivalenol, Proteome, Theca cells

Introduction

Fertility in dairy cows has decreased worldwide over the last several decades [1]. Female reproductive function can be affected by numerous environmental factors, including toxins of plant or fungi-associated mycotoxins [2]. Mycotoxins are toxic metabolites produced by some mold species such as Fusarium, Aspergillus and Penicillium that can contaminate food at all stages of the feed chain [3]. Among mycotoxins, deoxynivalenol (DON) produced by Fusarium species, is commonly detected in cereal crops, including wheat, barley and maize and is the most abundant trichothecenes in animal food [4]. DON (vomitoxin) causes acute and chronic toxicity in different internal organs of humans and animals [5] and exerts its toxicity mainly through binding to the ribosome, inhibiting protein and nucleic acid synthesis that triggers ribotoxic stress response, activation of MAPKs and their downstream signaling pathways [6]. According to the studies on human and mice, bacteria are able to de-epoxidize or epimerize DON, to deepoxy-deoxynivalenol (DOM-1) or 3-epi-deoxynivalenol (3-epi-DON), respectively which are substantially less toxic than DON. They only form two hydrogen bonds and subsequently altered their interaction with the ribosome and do not activate MAPKs [7]. In ruminant species, ruminal microorganisms are able to detoxify DON by converting it to the DOM-1, however despite this biochemical degradation DON-associated subclinical health problems are still occurring in dairy cows [8]. Nevertheless, the impact of DON and DOM-1 on reproductive system has not been well explored. This study for the first time investigated the effect of mycotoxins on ovarian theca cell function. Although theca cells consist major part of the follicular structure, their role in follicular function has not well studied, however there is no doubt about their contribution in coordinating some signaling networks between pituitary gland, oocyte, granulosa cells and endothelial cells within the ovary. They have receptor for LH and produce androgens that can be converted to estrogens by granulosa cells, thus any alteration in the normal physiologic function of these cells can have significant impact on follicular development and ovulation process resulting in infertility [9]. Thus, the objective of the present study was to shed light on the mechanism of action of DON and DOM-1 in bovine theca cells by their effects in the phospho-proteome alterations. Therefore, we used mass spectrometry approach, to evaluate the intracellular pathways of bovine theca cells activated following exposure to the sub-toxic doses of mycotoxins-DON and DOM-1.

Materials and Methods

Cell Culture

Our study was experimental. All materials were obtained from Life Technologies Inc. (Thermo Fisher Scientific, Burlington, ON, Canada) unless otherwise stated. Bovine theca cells were cultured in serum-free conditions that maintain testosterone, progesterone secretion and responsiveness to LH [10]. Bovine ovaries were obtained at the slaughterhouse from adult cows, independently of the stage of the estrous cycle, and transported to the laboratory at 30 ºC in phosphate-buffered saline (PBS) containing penicillin (100 IU) and streptomycin (100 µg/mL) [11]. Follicles (4–6 mm diameter) were bisected within the ovarian stroma, gently scraped to remove granulosa cells, and the theca ‘shells’ were peeled from the ovarian stroma with forceps. Pooled theca layers were incubated with collagenase (type IV, 1 mg/mL; Sigma-Aldrich, Oakville, ON, Canada) and trypsin inhibitor (100 ng/mL; Sigma) in a water bath at 37 ºC for 45 min with agitation every 10 min. The resulting supernatant was filtered through a 150 mesh steel sieve (Sigma-Aldrich), centrifuged (800 g for 10 min) and the pellet resuspended in PBS before being subjected to an osmotic shock treatment to remove red blood cells [12]. After washing, cells were resuspended in culture medium McCoy’s 5A modified medium supplemented with 100 IU/mL penicillin, 100 µg/mL streptomycin, 1 µg/mL fungizone, 10 ng/mL bovine insulin, 2 mM L-glutamine, 10 mM HEPES, 5 µg/mL apotransferrin, 5 ng/mL sodium selenite, and 0.1 % BSA (all purchased from Sigma-Aldrich) and LH [13]. Cell viability was assessed by trypan blue dye exclusion, seeded into 24-well tissue plates (Sarstedt Inc., Newton, NC, USA) at a density of 500,000 viable cells in 1 mL, and cultured at 37 ºC in 5 % CO2, 95 % air for a total of 6 days with medium changes every 2 days.

Experimental Treatments In Vitro

Certified Biopure Standard grade DON and DOM-1 in acetonitrile were purchased from Romer Labs (Tullin, Austria), and were reconstituted in methanol for cell culture studies. To assess the effect of DON and of DOM-1 on intracellular pathway activation, cells were treated on day 5 of culture with 1 ng/mL DON and DOM-1 for 30 minutes, and cells were recovered in RIPA buffer to measure the phosphorylation status of key protein kinases. Control cell group was run into two separate groups including solvent (acetonitrile) and the other without solvent and DON or DOM-1. All experiments were run on three separate replicates composed of pools of theca cells obtained from the slaughterhouse in different occasion.

Phosphopeptide Extraction

Proteins (50 µg) were isolated of cells by precipitation with 50 µL of ethanol, centrifuged at 9,000 g for 10 min, and the protein pellet was dried for 20 min in a vacuum centrifuge set at 60 ˚C. The protein pellet was dissolved in 50 µL of 100 mM ammonium bicarbonate (pH 8.5) and the solution was sonicated for 30 min at maximum intensity to improve protein dissolution [14]. The proteins were denatured by heating at 120 ˚C for 10 min, cooled for 15 min at room temperature, and proteins were reduced with 20 mM DTT at 60 ˚C for 60 min. Then proteins were alkylated with 40 mM IAA (Iodoacetamide) at room temperature for 30 min. One µg of proteomic-grade trypsin (i.e. ratio 1:50) was added and the mixture incubated at 40 ˚C for 24 h. The protein digestion was quenched by adding 50 µL of a 1% TFA solution (trifluoroacetic acid), followed by centrifugation at 9,000 g for 10 min, and supernatants were transferred into injection vials for analysis [15]. Phosphopeptide enrichment was performed with the Titansphere ᵀᴹPhos-Tio Kit, which is based on titanium dioxide (TiO2) enrichment. After equilibration of the TiO2 matrix by sequencial washing with Buffer A (2% TFA in acetonitrile solution 1:4 vol:vol) and Buffer B (provided in the kit),then  peptide sample (15 µL) was diluted in 50 µL Buffer B and centrifuged through the TiO2 three times at 1000 g for 10 min to adsorb phosphopeptides to the matrix. Non-phosphorylated peptides were sequential washed off the matrix by Buffer B, Buffer A, and phosphopeptides which were eluted 5% ammonium hydroxide followed by 5% pyrrolidine solution [16].

Mass Spectrometry

A Thermo Scientific Q-Exactive Orbitrap Mass Spectrometer (San Jose, CA, USA) was interfaced with a Thermo Scientific UltiMate 3000 Rapid Separation UHPLC system using a pneumatic assisted heated electrospray ion source. The chromatography was achieved using a gradient mobile phase along with a C8 column (Thermo Biobasic 100 × 1 mm) with a particle size of 5 μm. The initial mobile phase condition consisted of acetonitrile and water (both fortified with 0.1% of formic acid) at a ratio of 5:95. From 0 to 1 min, the ratio was maintained at 5:95. From 2 to 62 min, a linear gradient was applied up to a ratio of 50:50 and maintained for 3 min. The mobile phase composition ratio was reverted at the initial conditions and the column was allowed to re-equilibrate for 15 minutes for a total run time of 80 minutes. The flow rate was fixed at 75 µL/min and 2 µL of samples were injected. MS detection was performed in positive ion mode and operating in scan mode at high-resolution, and accurate-mass (HRAM). The default scan range was set to m/z 400-1500. Data was acquired at a resolving power of 140,000 FWHM (or full width at half maximum) using automatic gain control target of 3.0×10⁶ and maximum ion injection time of 200 msec [17].

Bioinformatic Analyses

Database searching was performed on Proteome Discoverer software (version 1.4) with Uniprot bovine protein database (extracted FASTA file). Mass tolerance of precursor and fragment were set at 5 ppm and 10 ppm, respectively. Phosphorylation at Y and T amino acids was set as a variable post-translational modification. Quantification was based on MS1 ion intensity and peptide identification was based on precursor ion (MS1) and at least three characteristic (MS2). Data from all experimental groups were analyzed using SIEVE (Thermo Scientific, San Jose Ca), a label-free differential expression software that aligns the MS spectra over time from different data sets and then determines structures in the data (m/z and retention time pairs) that differ. The following parameters were set to align the retention time and generate the frames needed for abundance calculations. Alignment Parameters; Alignment Bypass = False, Correlation Bin Width = 1, RT Limits for Alignment = True, Tile size = 300, Max RT Shift = 0.2, m/z Min = 400, m/z Max = 1,500, Frame time Width (min) = 2.5 min, Frame m/z width = 10 ppm, Retention Time Start = 2.0 min, Retention Time Stop = 65 min, Peak Intensity threshold = 100,000.

Statistical Analysis

Significance was calculated within SIEVE using a student’s t test. A p-value of less than 0.05 was considered statistically significant. A fold change threshold (> 2 for up-regulation or < 2 for down-regulation) were used to assess differentially expressed peptides [18]. Identification of gene ontology (GO) annotation terms and analysis of networks between differentially phosphorylated proteins were performed based on the biological process [19] and molecular function by Reactome [20] and illustrated by STRING [21] protein interaction software.

Results

A total of 93 peptides were phosphorylated (Table S2), while 254 peptides were dephosphorylated (Table S3) in response to DON and DOM-1 compared with non-treated control cells. There was not different significantly between DON and DOM-1 group.

Differential Regulation of Proteins Expression in DON

A volcano plot of phosphopeptides detected after treatment with DON is presented in Figure 1A. Identified proteins with significantly increased and decreased phosphorylation status are illustrated in Figure 1B. In this graph the values greater than +1 and lower than -1 represent more than 2-fold increase or decrease in phosphorylation, respectively (P < 0.05).

fig 1a

fig 1b

Figure 1: A volcano graph illustrating distribution of different upregulated and downregulated fragment peptides in bovine theca cells exposed to DON. Fold change threshold >2 (log2=1) for up-regulation or <2 for down-regulation) were used to assess differentially expressed proteins. The Y axes indicate significance levels. Graph A illustrates all the phosphorylated proteins inside the cells. Identified proteins with significantly increased and decreased phosphorylation status are illustrated in graph B. The core MAPKs 1, 13 and 14 are shown as red triangles, diamonds and squares, respectively.

Differential Regulation of the Phosphopeptides Expression in DOM-1

A volcano plot of phosphopeptides detected after treatment with DOM-1 is presented in Figure 2A. Identified proteins with significantly increased and decreased phosphorylation status are illustrated in Figure 2B. In this graph the values greater than +1 and lower than -1 represent more than 2-fold increase or decrease in phosphorylation, respectively (P < 0.05).

fig 2a

fig 2b

Figure 2: A volcano graph illustrating distribution of different upregulated and downregulated fragment peptides in bovine theca cells exposed to DOM-1. Fold change threshold >2 (log2=1) for up-regulation or <2 for down-regulation) were used to assess differentially expressed proteins. The Y axes indicate significance levels. Graph A illustrates all the phosphorylated proteins inside the cells. Identified proteins with significantly increased and decreased phosphorylation status are illustrated in graph B. The core MAPKs 1, 13 and 14 are shown as red triangles, diamonds and squares, respectively.

Biological Functions Associated with Mycotoxin Exposure

The most predominant biological functions associated with mycotoxin exposure were regulation of kinase activity and cellular response to growth factor stimuli. The most predominant molecular functions were receptor of signaling protein serine/threonine kinase activity and MAP kinase activity (Table 1). Table 1 showed that the most predominant molecular functions were receptor signaling protein serine/threonine kinase activity and MAP kinase activity. Identification of gene ontology (GO) annotation was performed by Reactome, and illustrated by STRING protein interaction software.

Table 1: Gene ontology annotation of major biological and molecular functions associated with proteins phosphorylated or dephosphorylated in theca cells by mycotoxin exposure.

Pathway description

Count in gene set

False discovery rate

Biological function:

Regulation of kinase activity


8

0.00178

Regulation of cellular response to heat

4

0.00253

Protein folding

5

0.00269

Cellular response to growth factor stimulus

7

0.00269

Regulation of protein kinase activity

7

0.00295

Molecular function:

Receptor signaling protein serine/threonine kinase activity


5

1.13e-05

MAP kinase activity

3

0.000311

Significance was calculated within SIEVE using a standard t-test. Statistical significance was set at a P value < 0.05.

Network analysis with STRING shows the active interactions between these signaling molecules in the form of nodes and edges (Figure 3). In this model, network nodes represent proteins and each node represents all the proteins produced by a single, protein-coding gene locus. Small nodes illustrate protein of unknown 3D structure and the large nodes illustrate proteins of known (or predicted) 3D structure. The green nodes represent the proteins whose phosphorylation was upregulated in response to DON and DOM-1 and the red nodes represent proteins whose phosphorylation was downregulated in response to these mycotoxins. The edges represent the protein-protein associations. The blue edges represent associated from curated database and is a characteristic of gene co-occurrence. The violet edges identify genes that are homologous and are co-expressed. This STRING network shows a clear cluster of known or predicted interactions between MAPK1, MAPK13, MAPK14, EDN1, GNGT1 and YWHAB, which were hyperphosphorylated in response to DON and DOM-1.

fig 3

Figure 3: A string model of different intracellular signaling pathways activated by DON and DOM-1. MAPKs are the core signaling molecules in this network green and red nodes indicate upregulated and downregulated molecules respectively. The edges are also representative of various interactions.

There was another cluster of interactions between PTGES3 and CHORDC1, EIF5A and RANBP2, involving hyperphosphorylation of CHORDC1 and EIF5A but hypophosphorylation of PTGES3 and RANBP2. Based on the statistical importance of these interactions, the proteins with increased phosphorylation and their functions are listed in Table 2. This Table showed that Both DON and DOM-1 induce simultaneous upregulation of ERK1/2, MAPK14 (p38alpha), MAPK13 (p38delta), GNGT1, EDN1 and YWHAB. They mostly regulate cell proliferation pathways and are involved in biosynthesis of lipid and carbohydrates (>2-fold; P<0.01). Table 3 demonstrated the differential proteomic analysis of hypophosphorylated proteins in response to DON and DOM-1 in bovine ovarian theca cells. Both DON and DOM-1 induce simultaneous downregulation of CALR3, PTGES3, RAD21, ACVR2B, and TGFBR1. They mainly activate or deactivate apoptotic processes and are involved in glucose and choline metabolism (>2-fold; P<0.01).

Table 2: Up-regulated phosphorylated Proteins of bovine ovarian theca cells in response to DON and DOM-1.

Protein name

Peptide Sequence Fold increase by DON Fold increase by DOM-1

Function

MYCBP TKLAQYEPPQEEKR

12

7

Stimulates activation of E-box-dependent transcription by MYC, a proto-oncogen protein
CALML4 YDEFIQKLTIPVRDY

12

9

Ca+2 ion binding protein, correlates with MYO5A, B and 1G, involves in cell malignancy
LAMTOR4 MTSALTQGLER

5

5

An amino acid sensing molecule and activator of TORC1 family members, which are carcinogens, promotes cell growth in response to growth factors
CXCL11 TEVIITLK

4

4

A chemotactic for interleukin-activated T-cells, involves in tumor angiogenesis
MAPK1 VADPDHDHTGFLTEYVATR

2.4

2.2

Main component of Ras/Raf/MEK/ERK cascade, mediates cell growth and survival, participates also in a signaling cascade initiated by activated KIT and KITLG/SCF.
MAPK14 HTDDEMTGYVATR

5.1

6.5

One of the four p38 MAPKs, cellular response to pro-inflammatory cytokines and physical stress
MAPK13 HTDVEMTGYVVTR


7.7


4.9


MAPK activity, one of the four p38 MAPKs, cellular response to pro-inflammatory cytokines and physical stress, activation of transcription factors such as ELK1 and ATF2
GNGT1 MPVINIEDLTEKDKLK

2.1

2.2

Signal-transducer activity, GTPase activity
EDN1 LKAQLYRDK


2.8

3.1

Positive regulation of mitotic nuclear division, protein kinase C-activating G-protein coupled receptor signaling pathway
YWHAB VFYLKMKGDYFR


4.7

5.8

Blocks the nuclear translocation of the phosphorylated form (by AKT1) of SRPK2 and antagonizes its stimulatory effect on cyclin D1
CHORDC1 SYVTMTATKIEITMRK

3.1

2.3

Involved in stress response, regulates centrosome duplication, acts as co-chaperone for HSP90
TOMM5 EDVISSIR


2.1

1.7

Mitochondrial outer membrane translocase complex, responsible for the degradation of active cytoplasmic enzyme and organelles during nutrient starvation
EIF5A IVEMSTSKTGK

2.2

2.3

mRNA-binding protein involves in translation elongation, regulates also TNF-alpha-mediated apoptosis
NDUFB3 DPWGRNEAWRYMGGFANNVSFVGALLK

2.5

2.9

Electron transform from NADH to the respiratory chain (ubiquitin), integral component of the membrane
ACLY SGASLKLTLLNPKGR


2.8

2.1

Acetyl-CoA biosynthetic process, citrate metabolic process, lipid biosynthetic process
PDIA3 GFPTIYFSPANKKQNPK


2.8

3.1

Catalyzes the rearrangement of -S-S- bonds in proteins, responds to endoplasmic reticulum stress

Significance was calculated within SIEVE using a standard t-test. Statistical significance was set at a P value < 0.05.

Table 3: Down-regulated phosphorylated Proteins of bovine ovarian theca cells in response to DON and DOM1.

Protein name

Peptide Sequence Fold decrease by DON Fold decrease by DOM-1

Function

THEM4 SIWALRGR

-33

-33

A thioestrase that involves in mitochondrial fatty acid metabolism
PDP1 LRPQDKFLVLATDGLWETMHR

-22

-22

Catalyzes the dephosphorylation of the α-subunit of the E1 component of the pyruvate dehydrogenase complex
ST6GAL2 GEDGERLYSSMSRALLR

-20

-20

Transfers sialic acid from the substrate CMP-sialic acid to galactose containing acceptor substrates from oligosaccharides
PPARG LNHPESSQLFAKLLQKMTDLR

-10

-16

Regulates β-oxidation of fatty acids, negative regulator of cholesterol storage
HNRNPA1 VVEPKRAVSR

-7

-7

Packaging of pre-mRNA into hnRNP particles, transports poly (A) mRNA from nucleous to the cytoplasm
CALR3 GKTLIIQYTVKHEQK

-7.1

-7.7

Ca+2 binding, cell differentiation
PTGES3 SILCCK

-5.6

-6.7

Cell proliferation, PGE synthase activity
MDH1B ELEKESLK

-5.6

-2.7

TCA cycle, malate dehydrogense activity
RAD21 KLIVDSVKELDSK

-5.0

-6.3

Apoptotic process, cell division, RNA polymerase II transcription regulatory, region sequence-specific binding
ENPP6 HSEIYNKVRR

-5.0

-5.3

Phosphodiesterase activity, choline metabolic process, lipid catabolic process
RANBP2 SGLKDFKTFLTNDQTK

-5.0

-5.3

Regulation of gluconeogenesis, involved in cellular glucose homeostasis, ligase activity
ACVR2B SVNGGTDCLVSLVTSVTNDLPK

-4.0

-6.7

ATP binding, metal ion binding, receptor signaling protein Ser/Thr kinase activity
TGFBR1 IELPTVGKPSSGLGPVLAVEEAGPVCFVCISLAMVAC

-2.4

-4.8

A receptor signaling protein with ser/thr kinase, activity, transforming growth factor beta binding, activation of MAPKK activity, pathway-restricted SMAD protein phosphorylation, positive regulator of apoptosis

Significance was calculated within SIEVE using a standard t-test. Statistical significance was set at a P value < 0.05.

Discussion

Analysis of biological processes and functions indicated that 30 min exposure to DON or DOM-1 activated MAPK activity and growth factor signaling pathways in the bovine theca cells. This is consistent with the known ability of DON to rapidly increase phosphorylation of MAPK3/1, and demonstrated in numerous cell type including granulosa cells [22].

According to an in vitro study, human and porcine lymphocytes responded differently when they were exposed to DON, in which exposure to low doses (30 nM) and high doses (100 nM) for 24h activated and suppressed mitogen induced proliferation of lymphocytes respectively [23]. In another study, the in vitro exposure of the porcine lymphocytes to low doses of DON (less than 10 ng/mL) stimulated immune system function by upregulation of cytokines, chemokines and inflammatory genes expression whereas at high doses (100 to 250 ng/mL ) DON suppressed immune system by activating apoptotic pathways [24].

Our result showed that three of the most significantly increased phosphoproteins were MAPK1, MAPK3 and, MAPK14. MAPK1 (also known as ERK2) is a Ser/Thr kinase which is phosphorylated by MAP2K1/MEK1 and MAP2K2/MEK2 on thr-185 and tyr-187 in response to external stimuli, and mediates many biological functions such as cell growth, survival, differentiation and apoptosis [25]. This protein is a critical component of the Ras-Raf-MEK-ERK signal transduction cascade. The ERK cascade is highly upregulated in human cancers, and is typically activated by growth factor stimulation of cell surface receptor tyrosine kinases (RTKs) and other signaling molecules with known oncogenic potential [26]. Reactome analysis suggested significant association of the MAPKs with endothelin 1 (EDN1) which is an endothelium-derived vasoconstrictor peptide. EDN1 has 2 receptors, EDNRA and EDNRB, that subsequently activate G proteins-coupled receptors [27] However, EDNRA also activates Ras-Raf-MEK-ERK signaling pathway and the upstream signaling molecules [28]. EDN1 receptors initiate intracellular signaling pathways leading to activation of MAPK3/1, MAPK14 and JNK1 [29]. In cattle the EDNR was identified in luteal, granulosa and thecal cells, and the luteal EDNRA and EDNRB mRNA levels were increased between day 1 and 10 of the estrous cycle. Moreover, the expression of EDNRA was greater in bovine theca cells than granulosa cells [30]. In contrast, follicular EDNRA and EDNRB mRNA decrease in super-ovulated cows treated with GnRH [31]. The phosphorylation of EDN1 by DON and DOM-1 treatment may account at least in part to the contribution of EDN1 in stimulating folliculogenesis. The YWHAB, also known as a 14-3-3 protein β, has a role in the Ras-signal transduction pathway and is a positive regulator of MAPK activity. It blocks the nuclear translocation of AKT1 and antagonizes the stimulatory effect of AKT on cyclin D1 expression, and eventually blocks apoptosis [32]. If indeed EDN1 and YWHAB are upstream of MAPK activity, these data suggest that DON and DOM-1 may act through these pathways. The increase in phosphorylation of these proteins in response to the DON and DOM-1, may be an initial protective response of the cells to these agents, however, there is no clear evidence for interactions between these molecules and DON. Some signaling molecules were dephosphorylated after addition of DON and DOM-1, including molecules such as transforming growth factor-β receptor type 1 (TGFBR1). This molecule is a potent inhibitor of epithelial and hematopoietic cell growth and proliferation [33]. The dephosphorylation of this protein is inconsistent with the simultaneous increase in MAPK phosphorylation observed after DON and DOM-1 treatment, although it is likely that the timing of changes of these proteins phosphorylation is not the same as the MAPKs [34]. Decreased phosphorylation of this molecule would be expected to favor proliferative pathways, which is inconsistent with the actions of DON and DOM-1 on theca cells in higher doses. A detailed time-course may also allow the determination of the sequence of intracellular pathway activation in response to DON and DOM-1.

The bottom-up mass spectrometry approach used in this study is however limited by the phosphor-enrichment strategy. The enrichment chemistry is not infallible, and it is likely that some phospho-peptides are not efficiently retained on the titanium solid phase. An alternative approach would be to separate proteins on SDS gel and perform in-gel tryptic digestion of narrow molecular mass bands containing proteins of interest. For example, MAPK1, MAPK3 and MAPK14 are between 38 and 44 kDa in size and could be easily isolated and examined without phospho-enrichment. The functional biology of the putative interactions of MAPK, EDN1, GNGT1 and YWHAB warrant exploration. Initial experiments would include the use of MAPK inhibitors to determine if MAPK activation is necessary for DON-induced changes in EDN1, GNGT1 and/or YWHAB phosphorylation.

Conclusion

This study has revealed that exposure of theca cells to low (sub-toxic) doses of DON and DOM-1 results in increased activation of several major MAPK signaling pathways similar to that of immune system cells. We concluded that both DON and DOM-1 have the potential to upregulate distinct MAPKs and downregulate specific signaling pathways that eventually stimulate bovine ovarian theca cell proliferation.

Acknowledgements

This research work was supported by NSERC Canada. We would like to thank Thermo Fisher Scientific for providing access to a Q-Exactive Quadrupole-Orbitrap Mass Spectrometer.

Supplementary Information Legends

Supplementary Table S1: The list of phosphorylated peptides in DON and DOM-1 vs. control group.

Supplementary Table S2: The list of dephosphorylated peptides in DON and DOM-1 vs. control group.

References

  1. Nani JP, Rezende FM, Peñagaricano FJ (2019) Predicting male fertility in dairy cattle using markers with large effect and functional annotation data. BMC Genomics 20: 258-259.
  2. Liu H, Liu Z, Meng L, et al. (2019) Toxic effects of 1-(N-methyl-N-nitrosamino)-1-(3-pyridinyl)-4-butanal on the reproduction of female mice. Ecotoxicology and Environmental Safety 181: 370-380. [crossref]
  3. Darwish AJMB (2019) Fungal mycotoxins and natural antioxidants: Two sides of the same coin and significance in food safety. Microbial Biosystems 4: 1-16.
  4. Kos J, Hajnal EJ, Šarić B, et al. (2017) The influence of climate conditions on the occurrence of deoxynivalenol in maize harvested in Serbia during. Food Control 73: 734-740. [crossref]
  5. Pestka JJ (2010) Deoxynivalenol: mechanisms of action, human exposure, and toxicological relevance. Archives of Toxicology 84: 663-679. [crossref]
  6. De Loubresse NG, Prokhorova I, Holtkamp W, et al. (2014) Structural basis for the inhibition of the eukaryotic ribosome. Nature 513: 517-522. [crossref]
  7. Pierron A, Mimoun S, Murate LS, et al. (2016) Microbial biotransformation of DON: molecular basis for reduced toxicity. Scientific Report 6:1-3. [crossref]
  8. Bertero A, Moretti A, Spicer LJ, et al. (2018) Fusarium molds and mycotoxins: Potential species-specific effects. Toxins 10: 244-245. [crossref]
  9. Young J, McNeilly AS (2010) Theca: the forgotten cell of the ovarian follicle. Reproduction 140: 489-490. [crossref]
  10. Spicer LJ, Aad PY, Allen DT, et al. (2008) Growth differentiation factor 9 (GDF9) stimulates proliferation and inhibits steroidogenesis by bovine theca cells: influence of follicle size on responses to GDF9. Biol Reprod 78: 243-253. [crossref]
  11. Kim H, Cho S, Choe C, et al. (2006) Effect of concentration and exposure duration of fetal bovine serum on parthenogenetic development of porcine follicular oocytes. Reproduction, Fertility and Development 19: 208-209.
  12. Allegrucci C, Hunter M, Webb R, et al. (2003) Interaction of bovine granulosa and theca cells in a novel serum-free co-culture system. Reproduction-Cambridge 126: 527-538. [crossref]
  13. ŞİMŞEK Ö, Mihm M (2014) Activity of 3\beta-hydroxysteroid dehydrogenase associated with progesterone production in bovine granulosa cells cultured under different concentrations of serum, insulin-like growth factor I, and gonadotropin. Turkish J Vet and Anim Scie 38: 358-362.
  14. You M, Matsumoto M, Pacold CM, et al. (2004) The role of AMP-activated protein kinase in the action of ethanol in the liver. Gastroenterology 127: 1798-1808.
  15. Ma J, Hart GW (2017) Analysis of Protein O-GlcNAcylation by Mass Spectrometry. Current Protocols in Protein Science 87: 24-10. [crossref]
  16. Tóth G, Bugyi F, Sugár S, et al. (2020) Selective TiO2 Phosphopeptide Enrichment of Complex Samples in the Nanogram Range. Separations 7: 74-75.
  17. Aminmarashi F, Torabi A, Beaudry F (2018) Effects of fibroblast growth factor 8 and 18 on ovine ovarian granulosa cell function. Int J Reprod Biomed 17: 435-442.
  18. Biau DJ, Kernéis S, Porcher R (2008) Statistics in brief: the importance of sample size in the planning and interpretation of medical research. Clin Orthop Relat Res 466: 2282-2288. [crossref]
  19. Ferreira D, Santarosa B, Monteiro-Toma C, et al. (2013) Anatomorphological, radiographic and tomographic studies of Schistosomus reflexus in Dorper breed sheep: case report. Arq Bras Med Vet Zootec 65: 1096-1102.
  20. Fabregat A, Sidiropoulos K, Garapati P, et al. (2015) The reactome pathway knowledgebase. Nucleic Acids Research 44: 481-487.
  21. Chang D, Nalls MA, Hallgrímsdóttir IB, et al. (2017) A meta-analysis of genome-wide association studies identifies 17 new Parkinson’s disease risk loci. Nature Genetics 49: 1511-1516. [crossref]
  22. Pestka JJ (2007) Deoxynivalenol: toxicity, mechanisms and animal health risks. Animal Feed Science and Technology 137: 283-298.
  23. Taranu I, Marin DE, Burlacu R, et al. (2010) Comparative aspects of in vitro proliferation of human and porcine lymphocytes exposed to mycotoxins. Arch Anim Nutr 64: 383-393. [crossref]
  24. Pestka JJ (2008) Mechanisms of deoxynivalenol-induced gene expression and apoptosis. Food Addit Contam 25: 1128-1140. [crossref]
  25. Kyriakis JM, Avruch JJ (2012) Mammalian MAPK signal transduction pathways activated by stress and inflammation: a 10-year update. Physiological Reviews 92: 689-737. [crossref]
  26. Pritchard AL, Hayward NKJCCR (2013) Molecular pathways: mitogen-activated protein kinase pathway mutations and drug resistance. Clinical Cancer Research 19: 2301-2309. [crossref]
  27. Minchenko DO, Tsymbal DO, Riabovol OO, et al. (2019) Hypoxic regulation of EDN1, EDNRA, EDNRB, and ECE1 gene expressions in ERN1 knockdown U87 glioma cells. Endocr Regul 53: 250-262. [crossref]
  28. Lee HJ, Wall B, Chen S (2008) G‐protein‐coupled receptors and melanoma. Pigment Cell & Melanoma Research 21: 415-428. [crossref]
  29. Stow LR, Jacobs ME, Wingo CS, et al. (2011) Endothelin-1 gene regulation. J FACEB 25: 16-28. [crossref]
  30. Ervin J, Schütz L, Spicer L (2017) Current status of the role of endothelins in regulating ovarian follicular function: a review. Anim Reprod Sci 186: 1-10. [crossref]
  31. Takagi M, Yamamoto D, Ogawa S, et al. (2008) Messenger RNA expression of angiotensin-converting enzyme, endothelin, cyclooxygenase-2 and prostaglandin synthases in bovine placentomes during gestation and the postpartum period. J Veterinary 177: 398-404. [crossref]
  32. Zheng P, Zhong Q, Xiong Q, et al (2012) QUICK identification and SPR validation of signal transducers and activators of transcription 3 (Stat3) interacting proteins. J Proteom 75: 1055-1066.
  33. Zhang J-Q, Gao B-W, Guo H-X, et al. (2020) miR-181a promotes porcine granulosa cell apoptosis by targeting TGFBR1 via the activin signaling pathway. Mol Cell Endocrinol 499: 110-115. [crossref]
  34. Shav-Tal Y, Lapter S, Parameswaran R, et al. (2001) Activin receptors: Cytokine Reference (Online book edition). Academic Press 283: 113-118.

The Shopper’s Desired Cosmetic-Counter Experience: A Mind Genomics Cartography of Emotions

DOI: 10.31038/AWHC.2021454

Abstract

The study explores the mind of the shopper from the inside out, focusing on motives and interests emerging from the respondent’s own perception of herself with respect to an ideal skincare shopping experience. A Mind Genomics cartography (experiment) investigated the phrases that a female cosmetic shopper would use to describe herself in terms of the ultimate skincare shopping experience. Respondents evaluated sixty-three unique vignettes, created from 35 different phases, vignettes created according to a permuted experimental design. The analysis focused on the discovery of ‘mind-sets’, groups of respondents who showed similar patterns in the element which they felt best escribed them. Three mind-sets emerged: Ebullient, Insecure, and Perfectionist, respectively. A second analysis (scenario analysis) looked at the way five different emotional outcomes (e.g., pleasurable, informative) interacted with the remaining elements. Four of the five emotional outcomes (pleasurable, informative, glamorizing, and therapeutic) interacted with other element, but only among two mind-sets (Ebullient, Perfectionists). There were no interactions for the third mind-set, Insecure, or interactions when the emotional outcome was stated as ‘transformative.’ The paper shows the potential of deep analysis when the data are collected in a systematized fashion, using permutable experimental designs, and individual-level modeling.

Introduction

If we were to go back 70 years ago, to the beginning of the 1950’s, visiting companies manufacturing and marketing cosmetics, we might find an interesting, albeit strange world. It would be a world where there were people whom today we call ‘giants,’ people whose names are on the door, and who are revered for their vision, their inventiveness, their marketing prowess, and for the fact that they are no longer around to prove the opposite. The 1950’s, and the war period just before, was the era of the great person. These early giants ‘knew’ at an intuitive level what the customer wanted, and how to approach the customer. The head of the company might not know how to formulate the product but knew what the customer would like One might do research on customers, perhaps to see who buys, but not for creative purposes. The research would be labelled as sales research, the recitation of ‘what happened,’ and perhaps ‘why’.

At the same time, the advertising industry was promoting the cult of expert as well, not in the creation of the vision for the product, and certainly not the product itself, but rather in the presentation of the product to the public. What to say about the product, what to show about the product, how to communicate the hard-to-communicate emotions and benefits of the cosmetic were left up to the brilliant advertisers of the 1950’s, so-called creative geniuses.

The foregoing is by way of introducing our study, something from the middle of the second decade of this 21st century, 60 years later, the span of two-three professional lifetimes, after many of the great cosmetic founds and the legendary advertising genius, built the business, and retired. The focus of this paper is not the past, but the knowledge of today’s cosmetic consumer, the ‘she’ who buys in these still early years of the 21st century.

Asking a Respondent about Herself

Consumer researcher have realized that people differ dramatically from each, not necessarily in who they are as defined by conventional demographics, but by what they do, and in a much deeper way by who they are. What people do in the world of shopping for cosmetics can be further broken down into where they shop, their self-described motives and shopping behavior, and what they end up buying. For many products, this knowledge suffices. Whether cosmetics enjoy their greatest success at the counter, and should be sold that way, is hard to answer. The success of selling high end cosmetics on the Internet may address the fact that one does not need a profoundly deep understanding of people’s mind.

There are papers addressing cosmetic sales at the store counter, and in some case contrasting the sales process with that occurring online. The issue is that the papers give a sense of general differences, but they do not give the specificity, or the insight needed to be translated into business [1,2]. For example, we know from the published literature that people define themselves by the products they buy, and in the case of cosmetics, the products that women purchase have symbolic meanings, with these meanings transferred to the purchaser when she uses the product. For example, a superior cosmetic product may enhance a woman’s self-esteem when she uses it [3]. Furthermore, as Wu & Lee (2016) wrote in their paper on impulse buying in cosmetics marketing “Cosmetics differ from other retail goods in so far as the ‘consumption situation’ must influence consumers’ ‘impulse buying behaviour’ through ‘experiential marketing’ [4]. “ In other words, for at least one group (female, unmarried, age 30-35, university degree), it is the experience at the cometic counter in a store which often leads to an impulse purchase.

The foregoing discoveries tell us that it is important to give the cosmetic customer the ‘right experience’ at the cosmetic counter. That information is helpful. It is in the form of a sociological report or anthropological report. We now know the behavior, observing from the outside in. We know what happens; we know that there is a regular pattern. What we do not know is the specifics, the words, the phrases which address the external behaviors, and perhaps even drive them.

It was towards the goal of a profound understood of the high-end shopper of cosmetics and fragrances that this study was addressed. The reality was that a great deal about how women shop for cosmetics and fragrances were already known, but the different activities, appearing to be similar to each in other when looked at against the vast array of behaviors, were actually radically different. The study was to answer the very practical question of what a high-end shopping experience should be like in the mind of the customer. The approach, Mind Genomics [5] had already been used to explore the ‘High End’ of semi-luxury items [6], as well as High End perfumes [7].

Mind Genomics

Mind Genomics is an emerging branch of science focusing on the experience of the everyday, a topic that has not been well explored, despite its ubiquity. The topics of everyday, such as the purchase of cosmetics, are often topics left to business (recording what people buy), to advertising (what persuades), to formulation (what works), and the trade (how to move the product into the hands of the customer). These different groups, business, advertising, and so forth, are not oriented towards developing systematic knowledge of an archival sort, shareable with others, simply because cosmetics are sold for the benefit of the company.

Mind Genomics moves on a different path. With part of its history traceable to experimental psychology, the goal of Mind Genomics is to relate aspects of a topic such as cosmetics to the way people respond. The research strategy is experimentation, where the independent variable is a description of the one’s experience with cosmetics, and the dependent variable is a rating [8,9]. In this project the focus is on the way the cosmetic experience is described, and the response of people as to whether the description applies to them.

Beyond the experimentation is the use of statistical methods to create ecologically valid test stimuli, viz. combinations, and vignettes. In the ordinary research world, the respondent would be presented with statements about the cosmetic experience, especially the purchasing experience. The statements would be presented one statement at a time The respondent would then rate each phase, each statement about the shopping experience, using a scale to show the degree to which the ‘statement applies to me’. The problem with the one-at-a-time stimulus is that it forces the respondent to intellectualize the evaluation. Each phrase or test stimulus must be evaluated on the same scale, although the phrases might be of different types (e.g., how I feel when i put on makeup vs what type of experience do i want to when i go shopping). Respondents have a very difficult time maintaining the same criterion for different types of elements. An easier way is to mix the different statements, create small combinations, vignettes, acquire the reactions to the vignettes and deconstruct the reactions to the contributions of the individual elements. This activity might seem convoluted, but it gets around the problem of forcing the respondent to maintain a constant evaluation criterion with radically different elements. The reason the vignette approach works is because the compound description defies simple classification. The respondent ends up using the same criterion for all vignettes, and generally stops trying to outwit the system [10].

Learning ‘Who I am as a Cosmetic Shopper’ within the Design and Analytic Framework of Mind Genomics

At the time of the research, qualitative studies with high end shoppers emerged with the obvious finding that shoppers go into stores with different objectives. The earlier work had focused on things under the store’s control, and under the manufacturer’s control. The focus was on what was being sold, and the messages communicated to different types of customers. The typing of customers was based on then standard psychographics thinking, viz., that there are a limited number of basic ‘minds or ‘mind-set’ who do the shopping. The objective was to identify these basic groups, and to assign each woman shopper to one of these basic groups. Bringing the topic forward, the objective of the study reported here is to understand how the respondent defines herself as a cosmetic shopper, but a shopper who goes to buy cosmetics for different reasons. So, we are interested in the combination WHO she is, and the emotional OUTCOME.

Given the foregoing issues, it appeared possible to apply the Mind Genomics approach with a slight change. The world view of Mind Genomics is the analysis of decisions made about the world of the everyday. The standard Mind Genomics process defines the topic, creates a set of questions which tell a story about the topic, and then generate sets of answers to each question. In most studies the Mind Genomics procedure creates short descriptions of a product or service by combining the answers or elements, doing according to an experimental design. The respondent reads the set of descriptions, the offerings, and responds by separately rating each vignette in the set. The evaluation is usually ‘good/bad’, ‘go/no go’, etc. The analysis of Mind Genomics deconstructs the evaluative rating into the part-worth contributions of the different answers, the different elements. The process is simple, all of the elements are of the same type, and there is no ambiguity.

When all of elements are ‘external’ there is no issue. The respondent would be presented with the different combinations messages about the cosmetic purchase situation and instructed to rate the degree to which the combination fits the respondent. The deconstruction of the ratings show how strongly element fits the respondent. The e research ‘twist’ in this paper involves the measurement of statements about the respondent’s predilections, the nature of the behavior at the cosmetic counter, and a phrase about one off five internalized states of feeling about what the purchase experience should create.

During the early phases of the project, it became increasingly clear that the same person could shop for different reasons at different times. The five different end uses emerged as a range of alternative ‘psychological states’ that on person might have, albeit at different times. Whether these five states of mind could be separately experienced by one shopper was not of interest. It was sufficient to find out what messages described a person who was in one of the five states. That information was new to the marketing team. The five states about the ultimate skincare shopping experience were pleasurable, informative, glamorizing, therapeutic, or transformative, respectively.

The additional requirement was that the research should not call direct attention to any overall feeling about the shopping experience. The overall feeling should be an element in the study, on par with the other elements. The concern was that in a standard approach using today’s tools of market research, the researcher might simply create a matrix, the columns corresponding to the five states of ultimate shopping experience (viz., pleasurable .. transformative), the rows corresponding to different statements about the experience, and then for each column (state of experience), instruct the respondent to check every element which applies, or rate the fit of each element to the each of the five ultimate states of shopping experience. That approach would provide data, it always does. The question was whether the data would be meaningful. Simply asking the respondent to do something, having the respondent fulfill the request, and analyzing the data does not necessarily make the results meaningful.

Research and Analytic Steps Applied by Mind Genomics

Step 1: Define the Raw Material, Specifically Topic, Questions, and Elements (Answers to the Questions)

Mind Genomics works by presenting combinations of messages to the respondent and getting the answer. The steps involve the topic, questions which ‘tell a story’, and a variety of stand-alone phrases which answer questions.

The topic is ‘What describes ME’. Table 1 shows the seven questions, and the five answers to each question. These questions attempt to tell a story. The requirement to ‘tell a story’ Is not an absolute requirement. Rather, the idea of telling a story is to provide a framework wherein information can be presented to the respondent in a meaningful and seemingly rational format.

Table 1: The raw material for the study, comprising seven questions and five elements (answers) for each question.

table 1(1)

table 1(2)

Mind Genomics is flexible. Occasionally, ‘stray elements’ with no home find themselves inserted into a question. Thus, Question 1 (Describe your skin – what you have, what you want), has four elements about the skin (A1-A4), and room for a fifth element. In that case, A5 was put in (A5: For me it’ about staying sexy).It makes no difference as long as the element does not clearly contradict elements from other questions. The structure of questions and answers is done for bookkeeping purposes, and as an aid to the underlying experimental design. The respondents never see the questions. They only see answers, or more accurately, they only see combinations of answers.

The seventh question is the key to the study because it presents five ways of thinking about the ideal experience. There are five such ways of thinking, which will play an important role in the analysis. However, at this time, at the start of the study, when the elements are being assembled, Question 7 (What would you say is your ultimate skincare shopping experience) is simply a question, and the answers are simply elements.

Step 2: Create 63 Vignettes or Combinations of Elements Using an Experimental Design

It is at this point that Mind Genomics departs from more conventional methods. It will be these small combinations of 2-5 elements each that will be evaluated by the respondent, rather than the single element. Figure 1 shows an example of a vignette.

fig 1

Figure 1: Example of a four-element vignette.

The experimental design ensures that each of the 63 vignettes comprises the appropriate number of elements and the specific combination of elements. The experimental design is nothing more than a prescription for what elements will be combined. The experimental design is created to allow the 63 ratings, one per vignette, from each respondent to be analyzed by OLS (ordinary least-squares) regression at the level of each individual respondent. At the level of the individual respondent all elements appear equally often, no vignette comprises fewer than two elements nor more than five elements, and each respondent evaluates different combinations, because the elements are permuted. That is, the permutation simply changes the code, so that A1 might become A3, A2 become A4, A5 becomes A2 etc. [11].

Figure 1 shows an example of a four-element vignette. The elements are put together without any connectives. The structure of the vignette itself is a set of texts put one below the other, all centered It is easy to graze across the text and assign a rating. The structure of the vignette prevents it from become a densely worded concept. The respondent has no trouble le ‘grazing’ through the vignette, assigning a rating, and then going on to the next vignette.

Step 3: Create a Rating Scale, and an Orientation Page

Figure 2 shows the orientation page, and the rating scale. The respondent does not need an introduction to the topic, other than knowing the name of the study, the rating scale (How well does this concept describe YOU?), and some additional house-keeping information. The vignette gives away a little as possible about the nature of the design.

fig 2

Figure 2: The orientation page with the rating scale.

Step 4: Invite Respondents to Participate

The respondents comprise individuals who sign up for so-called ‘online panels.’ The individuals provide information about which they are their interests, etc. and ‘opt in’ to participate. With the increasing number of online surveys, working with these panelists has become the preferred method for research. The respondents do the surveys for compensation, but the specific agreement remains a matter between the individual and the online panel company. As a cautionary note, it is usually easier to work with these online panel providers than to source panelists oneself.

Step 5: Acquire the Data and Transform the Data into a Form Usable for Subsequent Analyses

The actual interview lasts about 10 minutes, with the respondent reading the orientation, and rating the 63 vignettes, followed by a self-profiling questionnaire.

The respondents rated each of the vignettes on a 9-point scale. Managers who use the data from these types of studies often express difficulty understanding what the ratings mean. Indeed, such difficulties are more widespread than one would like to believe. It is easy to work with an anchored Likert Scale, such as our 1-9 scale, but what does a rating of 4 or 6 or 7 mean? The question is profound. S.S. Stevens, legendary psychophysicist at Harvard University in Experimental Psychology during the years 1938 to 1973, often stated as much, when he averred that one of the hardest problems in science is to convert a continuum to a yes/no (Stevens, 1968, personal communication to author) The issue of the ‘best’ conversation is deceptively simple until the researcher is faced with a practical issue such as communicating with managers.

The common practice by consumer researchers is to divide this anchored Likert or category scale into two parts, corresponding to NO and YES, respectively. The division point is a matter of personal preference. For this study, the focus was on a stringent definition of ‘fits me’. The stringent criterion led to this division: Ratings 1-7 transformed to 0, and Ratings 8-9 transformed to 100. Following the transformation, a vanishingly small random number was added to the transformed ratings. The magnitude of the number (<10-5) is such that it adds the requisite variation to the rating in case all ratings from a respondent would end up being 1-7 (all transformed to 0) or 8-9 (all transformed to 100). In that case the regression program would simply crash without the miniscule variation introduced by the random number.

Figure 3 shows a preview of the data that will be used for rest of the analysis. A total of 251 women, cosmetic shoppers participated, each evaluated 63 different vignettes. Each respondent generates an average transformed value, which shows us the degree to which the respondent feels that the vignette describes her. The distribution of this average is shown by graph. The average ranges from 0 to 100, again with each circle corresponding to a respondent.

fig 3

Figure 3: Distribution of average Top2 ratings, by vignettes comprising 2, 3, 4 and 5 elements, respectively. Each point in the graph corresponds to one of the 251 respondents.

The figure is broken out into the averages of each of the 251 respondent for those vignettes comprising two elements, three elements, four elements, and five elements, respectively. As the number of elements in the vignette increases, there is a sense conveyed by the graph that a greater number of respondents feel on average that the vignette DOES NOT DESCRIBE THEM (viz., the distribution skews to the left, and the lower averages). As yet, however, we do not know anything about the ‘internals’ of the vignettes, viz., which elements drive a feeling of ‘describes me’.

Step 6: Create a Data Matrix Ready for OLS (Ordinary Least-squares) Regression Analysis

The data matrix comprises 63 rows for each respondent or 15,813 rows for the total panel of 251 respondents. Each row corresponds to a specific vignette, an a specific respone.t

The columns are set up as following:

Column 1 = Column order in the matrix. This is very important, when the researcher wishes to sort the data, and do analyses on certain parts of the matrix. Giving each row an order number allows the researcher to sort the data at the end of the analysis, so the matrix can be returned to its original form.

Column 2 = Respondent identification number (101-351). The respondent identification number is repeated 63 times, once for each vignette.

Column 3 = Order of testing for that panelist (1-63).

Column 4-38 = One column for each element (A1-G5). There are 35 columns for the elements. For each row, the cells in columns 4-38 either have the number ‘0’ when the element is missing from the vignette corresponding to the row, or the number ‘1’ when the element is present in the vignette corresponding to the row.

Column 39 -Rating assigned by the respondent on the 9-point scale

Column 40 – The transformed rating from column 39, being either 0 or 100 added to the vanishingly small random number. For ratings of 1-7 the transformed value is 0. For ratings of 8-9 the transformed value is 100.

Column 41 – Membership of the respondent in a two-mind-set solution, explained below

Column 42 – Membership of the respondent in a three-mind-set solution, explained below

Remaining columns – classification information about the respondent (age, products used, stores shopped, education, income, etc.).

Step 6: Create a Grand Model for the Full Set of Respondents

Recall that the variable TOP2 takes on the value 0 when the vignette was assigned the rating 1-7 and takes on the value of 100 when the vignette was assigned the rating 8-9. The model using all the data is expressed as: TOP2 = k1(A1) + k2(A2) … k35(G5).

The foregoing equation comprises 35 terms, one term for each of the 35 elements. The coefficients are the weighting factors. The model does not use an additive constant, the reason being that the model will be used in several different ways, and the elements must have coefficients that are directly comparable to each other, without the contribution of an additive constant. In this way there is no other influence on the magnitude of the coefficients. It is important to note that the coefficients estimated with an additive constant show very similar patterns to the coefficients estimated without an additive constant, as Figure 4 shows.

fig 4

Figure 4: The 35 coefficients for the total panel estimated with an additive constant in the model (abscissa) versus without an additive constant (ordinate).

Table 2 shows the strong performing elements for the total panel. For these models or equations without the additive constant, coefficients of 15 or higher are ‘meaningful’ from previous observations. Surprisingly, out of 35 elements selected by professionals in the cosmetic business, only three elements emerge as strong performers, strong definers of oneself. This is a remarkable finding. One would have thought that there would be many more strong-performing elements. As the data will suggest, the paucity of strong performing elements may be the consequence of the existence of underlying mind-sets, with different points of view, which end up neutralizing each other in the data from the total panel.

Table 2: Strong performing elements for the total panel.

table 2

Step 6: Create 251 Individual-level Models, Cluster the Individuals Using the Models, Extract Two and then Three Clusters (Mind-Sets)

A hallmark of Mind Genomics is the use of the data to extract mind-sets, groups of individuals with similar patterns of coefficients. The coefficients, in turn, show how the respondent ‘weights’ each of the 35 elements to drive the rating of TOP2 (viz., the rating of 100 after the transformation).

A key benefit of the underlying experimental design is that each respondent from the 251 respondents evaluated the precise elements so that the researcher can apply OLS regression to the data from each respondent. This approach produces a matrix of 251 rows, one per respondent, and 35 columns, one per element.

The matrix becomes the basis for clustering, to identify basic groups. Before the clustering, however, the matrix was further subject to statistical analysis, using principal components factor analysis. The 35 variables, viz. the coefficients, were reduced to five independent factors. Each respondent was assigned by the factor analysis to a location in the new five-dimensional space. The locations are defined by the ‘factor scores’ which differ by respondent, and map to the original 35 coefficients.

The final step in the clustering was to apply k-means clustering to the newly created data matrix comprising 251 rows (one row per respondent) and five columns (one column for each newly created factor). The clustering computed a distance between each pair of the 251 respondents, and located the respondents first into two groups, and then into three groups [12]. The two groups (clusters, mind-sets) could not be easily interpreted because there were too many ‘stories’ intertwined. The three groups were far more easily to interpret.

Table 3 suggests three different and easy to name mind-sets, each again showing fewer than 35 elements which perform strongly, viz., with a coefficient of 15 or higher. The three mind-sets are distributed across age and income (Table 4).

Table 3: Strong performing elements for three emergent mind-sets.

table 3

Table 4: Age and income of the total panel and the three mind-set.

table 4

MS 1 (Exuberant) – A sense of a woman who loves life, and wants to look it, and live it.

MS2 (Insecure) – A person who wants to feel secure. Surprisingly, this mind-set reacts strongly to only one element.

MS3 (Perfectionist) – A person who wants to know what she is doing, and ‘get it right’.

Interaction – How end uses acts as ‘directors’ of the performance of other elements

Ewald & Moskowitz (2007) introduced the of scenario analysis to understand the interactions among variables [13]. The idea is that elements may interact with each other, affecting the way that respondents respond to the vignette. For example, when the item can have one of several different brands, having one brand in the vignette can set an expectation, whereas having a different brand in the vignette will set a different expectation. The way to discern the effect of the brand on the performance of the elements is to separate the vignettes by brand, thus creating strata, and run the study for each stratum separately in that way it is possible to see how the coefficients of all of the non-brand elements change when the brand changes.

In our study on cosmetics, we have one group of elements, those in Question G, on one’s ideal skincare shopping experience. There are five different statements about ultimate experience, ranging from Pleasurable (G1) to Transformative (G5). Tables 2 and 3 suggest that these are not important elements in the mind of the respondent to describe oneself, a perfectly plausible result. The elements deal with the state of mind. Perhaps one does not feel that the ultimate skincare shopping experience is relevant as a descriptor of oneself.

In this final analysis of the data, we revisit the ultimate skincare shopping experience, not as an element which varies in competition with four other elements, but rather as a constant, present in all vignettes in a stratum. The process is straightforward. W first creates six strata of vignettes from the raw data. A stratum comprises all vignettes containing one specific elements from Question G on ideal experience This first step in the scenario analysis is means creating one stratum each for vignettes comprising G1, a second stratum for vignettes comprising G2, etc., and finally a sixth stratum for vignettes absent an element from G, by design.

We run the six regression equations, with only 30 elements (A1-F5). The elements G1-G5 are fixed in a stratum. We look at the strong performing elements, operationally defined as 30 or higher. When we do this analysis, we find the following:

  1. For each of the five described ultimate skin care shopping experiences, no element reaches 30 when we look at the total panel across the six experiences (G0 and G1-G5).
  2. When we look at mind-sets, one experience, ‘transformative’, fails to produce any element with coefficient of 30 above.
  3. When we look at the mind-sets, each mind-set shows specific strong-performing elements.
  4. We conclude that there is more to creating mind-sets about what elements drive strong responses. There is the distinct possibility that the focus must be on the combination of topic, mind-set and situation, as shown by Table 5, specifically by strong performing elements for a mind-set which change according to the stated ultimate skincare shopping experience.

Table 5: Scenario analysis, showing how the ultimate skincare shopping experience, when directly stated in the vignette, can increase the likelihood of a respondent saying, ‘it describes me’.

table 5

Discussion and Conclusions

Mind Genomics cartographies were designed for rapid scans of a product or service category, at first to identify what ideas as messages work, but then as way to understand the topic of how a person makes a decision within a specific, granular aspect of life. The early studies, of which this is an example, having been run about ten years ago, in 2012, required the managers, marketers, researchers and sales individuals to structure their thinking, and forced a systematized approach onto what had previously been the domain of the artist marketer or creative advertising professional.

It became clear over time with this study and with others that the experts had a great more knowledge than they were even aware of. There were ideas about what words and phrases worked, and senses of how these strong words and phrases were appropriate or not appropriate for given situations. What became also increasingly obvious was that the knowledge about the desired cosmetic experience was unorganized in the minds of the experts The knowledge was there, as well as the realization that there were profound differences among women in the way they shopped. Knowledge of this profound knowledge emerged as anecdotal, for the simple reason that the world of cosmetics (and fragrances) operated at two levels. At the very concrete level, there were product tests, and attitude and usage questions about brands, and feelings. The product tests were done on an as-needed basis, with technical reporting needed for product design and development. At a higher level was the tracking studies, about products used, feelings toward products, towards the category, and so forth. The results of these high-level studies emerged as charts, with a lot of trends, but very little specific information that could be used ‘as needed’, in an off-the-shelf format.

The data tables in this paper suggest immediately that there is a fertile field to be planted and tilled. This field comprises the systematic analysis of messaging, not simply to show to the ‘client’ that one’s creative ‘works, but rather a database which can drive new and important insights. The time has now arrived for the business community to invest in the systematic data basing of communications, phrases, not at the level of 20,000 feet, couched in generalities and endless tables, but rather in simple-to-use data created at the level of granular experience. The contribution of Mind Genomics to that prospect is a simple system, template (see www.BimiLeap.com), with rapid turnaround (hours), and of low cost and low risk. The study on cosmetics is simply one more example of what can be accomplished in a short time, with little effort.

References

  1. Hong BS, Kwon YJ, Park SH, Paik IS (2008) The effects of relational benefits and commitment on word-of-mouth intention and repurchase intention for cosmetic purchaser in internet shopping mall. Journal of the Korean Society of Clothing and Textiles 32: 1202-1212.
  2. Tajuddin K, Nikdavoodi JN (2014) Cosmetic buying behavior: examining the effective factors. Journal of Global Scholars of Marketing Science 24: 395-410.
  3. Kalender GI (2021) The symbol of cosmetic products as social distinction and the false needs of shopping for cosmetics at department stores aroused by women’s magazines. Advances in Journalism and Communication 9: 1-11.
  4. Wu P, Lee CJ (2016) Impulse buying behaviour in cosmetics marketing activities, Total Quality Management & Business Excellence 27: 1091-1111.
  5. Moskowitz HR, Gofman A (2007) Selling Blue Elephants: How to Make Great Products that People Want Before They Even Know They Want Them. Pearson Education.
  6. Bevolo M, Gofman A, Moskowitz HR (2012) Premium by Design: How to Understand, Design and Market High End Products. Gower Publishing, Ltd.
  7. Horoszko N, Moskowitz D, Moskowitz H (2018) Discovering and pinpointing the brand DNA of five great perfume brands. In Understanding the Marketing Exceptionality of Prestige Perfumes (pp. 26-73). Routledge.
  8. Milutinovic V, Salom J (2016) Mind Genomics: A Guide to Data-Driven Marketing Strategy. Springer.
  9. Moskowitz HR, Gofman A, Beckley J, Ashman H (2006) Founding a new science: Mind genomics. Journal of Sensory Studies 21: 266-307.
  10. Porretta S, Gere A, Radványi D, Moskowitz H (2019) Mind Genomics (Conjoint Analysis): The new concept research in the analysis of consumer behaviour and choice. Trends in Food Science & Technology 84: 29-33.
  11. Gofman A, Moskowitz H (2010) Isomorphic permuted experimental designs and their application in conjoint analysis. Journal of Sensory Studies 25: 127-145.
  12. Likas A, Vlassis N, Verbeek JJ (2003) The global k-means clustering algorithm. Pattern Recognition 36: 451-461.
  13. Ewald J, Moskowitz HR (2007) Market forces: The push-pull of marketing and advertising in the new product business. Chapter 8 103-122.In: Accelerating New Food Product Design and Development (ed. J.H. Beckley, M.M. Foley, E.J. Topp, J.C. Huang & W. Prinyawiwatkul), Blackwell Publishing and the Institute of Food Technologists, Chicago.

Recent News in Medical Nutrition Therapy

DOI: 10.31038/NRFSJ.2021423

Abstract

Medical nutrition is essential part of the medical therapy. Undernourished patients predict worse outcome in various disease states and higher costs for the healthcare system. Research activity and presentation of best practices ensure the continuous development of this discipline. Here, some selected news are introduced from the last 4-6 years. The GLIM criteria serve as internationally accepted uniform tool for assessment of patients nutritional status instead of the several assessment tools applied before. In the field of parenteral nutrition huge development was the introduction of the GLP-2 agonist teduglutide that help short bowel patients to the gut adaptation. An other discovery was the indicator function of citrulline in the same patient group. Some new recognitions in the field of macronutrients amino acids and lipid emulsions are also discussen. Finally three preactical innovations of enteral nutrition are negotiated: the recommended use of supplemental parenteral nutrition for patients where planned macronutrient supply can not be reached via enteral nutrition, the bioavailability of amino acids administered orally or enterally which is wors than previously conceived and the use of citrulline in the oral and enteral nutrition is recommended due to its multiple benefits and good bioavailability.

Keywords

Medical nutrition, Parenteral nutrition, Enteral nutrition, GLIM criteria, Teduglutide, Amino acid, Fat emulsion, Citrulline

Introduction

Nutrition therapy is a dinamically developing specialty. One important part of it, the medical nutrition therapy obviously must be part of the therapeutic armamentarium because undernutrition definitively worsens patients outcome, elongate recovery time and increase treatment costs. Some of the recent findins influenced the strategy and/or daily practice of this discipline. Also, appearance of precision medicine influenced the doctors attitude in this aspect; therapeutic consideration became more accurate and carefull. Here we gethered highlights of the nutrition therapy of the last ca. 5 years and present in a condensed form focusing to the parenteral and enteral nutrition.

Assessment of Nutritional Status of Patients

During the past decades many assessment tools have been developed. Most used ones are the NSN2000, the NRS-2002, the SGA, the MUST, the MNA and mini-MNA, etc. Most of them are specifically good in certain patient population and bear weaknesses in other fields. Internationally, in 2016 started a discussion among leaders of various potent nutrition-oriented scientific societies about development of a new tool enabling global use with global consensus. By 2019 GLIM criteria was elaborated [1].

GLIM criteria (Global Leadership Initiative on Malnutrition) is a two-step evaluation of patients’ parameters having risk of undernutrition. First step is an assessment of patients’ parameters with one of the previously used screening methods. Those who are at risk for undernutition according to these assesments, should be subjects of the second assesment. In this 2nd phase three phenotypic and two ethiologic criteria are assessed. Just one criterion should be present from both group of criteria to declare diagnosis of undernutrition. Phenotypic criteria are either accidental and tendencious loss of weight or BMI under 18.5 or reduction of muscle mass. Ethiologic criteria are reduced food intake or inflammation or presence of devastating disease.

The usefulness of this tool has been tested in various patient and disease categories during the last 2 years and are running as well [2-4]. To date, the correspondence with empirical results and declaration of undernutrition according to the GLIM Criteria has been confirmed [5].

Parenteral Nutrition

Parenteral Nutrition (PN) is one of the most risky way of antificial nutrition even if this risk is less than that of several intravenous medications. Parenteral nutrition may provide a more risky nutritional form than Enteral Nutrition (EN), terefore EN is the preferred route of administration however, in certain situation this is unavoidable and certainly more efficient that EN. The very first example of this PN-dependent condition is the Small Bowel Syndrome (SBS). In this theme most recent development was the introduction of teduglutide.

Introduction of Teduglutide into the Daily Routine

Teduglutide is a synthetic analogue of glucagon like peptide-2 (GLP-2). Very similar to GLP-1 agonists, which are successfully used for ca. a decade in the diabetes therapy, as this incretine hormone is produced in the small intestine. The GLP-2 hormone is also produced in the enteroendocrine L-cells of the lower Gastrointestinal Tract (GIT), closer in the ileum and colon and its receptors are located in the same gut-segment. GLP-1 and GLP-2 are synergistically help the organism respond to nutrient availability but their main target differ. Teduglutide slows down proximal motility of the GIT, drives crypt cell proliferation by facilitation of the receptors and thus it increases the development of enterocytes, regenerates the intestinal musosa and helps enlarge the mucosal surface by rising villus height that shrink in absence of enteral feeding, on a whole it drive restoration of integrity of the gut wall [6].

Clinical results of use of teduglutide are fairly good: 20-24% of patients on exclusive Total Parenteral Nutrition (TPN) can get rid of it and more than half of the patients can decrease the dependence on daily TPN [7]. The success depends mostly on the remaining size of ileum and colon. Who has no one centimetre of these gut segments has no chance to improve gut adaptation with teduglutide therapy because the cells producing this hormone and its receptors are missing after the resection.

Nevertheless, beside the benefits due to the facilitation of the enterocytes accidental developments of polyps and increased tumorigenesis has been detected. Therefore a careful monitoring is required in SBS patients being on teduglutide therapy.

Selection of Parenteral Amino Acids

Amino Acids (AAs) are essential component of parenteral nutrition admixtures. As amino acids are crystalline and provision of combination of minimally 12-14 amino acids is needed to ensure building bricks for endogenous protein synthesis, industrially manufactured amino acid mixtures are used to make parenteral nutrition admixtures aseptically in the hospital pharmacy laboratory. After the 1980s, most of European hospital pharmacies had an aseptic „mixing unite” preparing individual parenteral nutrition mixtures. These laboratories, due to the introduction of industrial parenteral mixtures (2 and 3 chamber bags or „convenience systems”) have been closed, mostly based on uneconomical operation. Today, hospital based individual parenteral admixtures are present in the USA in a proportion of ca. 65-70%. In Europe, majority of Total Parenteral Nutrition (TPN) is provided in form of industrially manufactured multichamber bags, which would be suitable for ca. 82% of the patients. In case of the rest compromise is needed.

In the era of precision medicine, more attention is paid to the tailor-made therapeutic solutions. In this context personalized nutrition admixtures would be more and more required, especially in the intensive care and, in the neonatology. This tendency has recently been started [8]. The composition of amino acids has an impact víz. the effectiveness of a given TPN is linked to the proportion of essential amino acids, rather than to the total AA content [9]. Recently a tendency to open mixing laboratories is detectable in Europe as well. Moreover, lately many publications support the fact that amino acids are underdosed in a remarkable mass of patients. Inadequate protein provision results in protein deficiency with extensive negative impact [10]. This bad practice partly numerous reasons, among others it can be deducted from the erroneous judgement that protein need is equal to amino acid need of a patient. However, due to the water production during the peptid bond formation 100 g amino acid intake results in 83 g protein only. In case of enteral nutrition, where the peptide-component is usually whey proteine, the loss is higher because the enterally administered protein must be decomposed to amino acids before endogenous protein synthesis covers the needed of new proteins.

Selection of Fat Emulsions

Fat emulsions are needed to ensure essential fatty acids, to increase caloric density of the nutrition admixtures and, since today fish oil is mandatory component of the lipid emulsion mixtures, to improve n3/n6 ratio. Moreover, fish oil pure emulsion for parenteral use is available thus any TPN can be augmented with n3 Fatty Acids (FAs). The impact of n3 FAs in the prevention of inflammatory reaction mostly in the arachidonic cascade (competition of n6 and n3 fatty acids for the enzymes in their metabolic cascade) is well known. However, the importance of Eicosapentaenic Acid (EPA) and Docosapentaenic Acid (DHA) in the restoration of inflammatory process via resolvins and the partial prevention of release and action of inflammatory mediators by protectins and maresins are just recently recognized benefits. These discoveries are comparable benefits to those effected by the inhibition of proinflammatory reactions [11].

Citrulline as Indicator

In case of short bowel syndrome (status after removal of the majority of the gut) long term or life long parenteral nutrition (in form of home parenteral nutrition) is needed for majority of patients due to lack of absorbtive surface for food/nutrients. As certain adaptation of the remaining piece of gut exists: after a while many patients will be able to take up certain amounts of nutrients enterally thus partially can be feed again enterally or orally. The time frame and the extent of this adaptation is uncertain because the state of the gut could not be measured and clinicians regularly make challenge to see the patients reaction to enteral feeding. Some 10 years ago it has been discovered that the non-essential amino acid citrulline can be used as indicator of gut function [12]. Citrulline is produced almost exclusively by the duodenum and the upper intestinal (jejunal) enterocytes from glutamine and arginine. It has been documented that serum-citrulline (se-C) levels are in close correlation with the full amount of enterocytes thus with the function of the jejunum which is the main field of nutrient absorption. Randomized Clinical Studies (RCTs) and meta-analyses of RCTs demonstrated that the need of PN is inversely correlate with the se-C and so this can display the odds for the successfull enteral nutrition [13,14]. This discovery has multiple benefits because by this technique EN-challenges, that are uncomfortable for the patients, become causeless and the the PN-dependence of the patient decreases moreover the cost of EN is much lower than that of PN.

Enteral Nutrition

Enteral nutrition (tube feeding) was and still is the first choice administration route in the medical nutrition if patients are not able to drink/eat per mouth proper amounts of macro- and micronutrients. As even recent studies confirm that the measured and /or calculated amounts of nutrients are not taken up orally/enterally by significant number of partients, supplemental nutrition is required.

Supplemental PN to EN

In the last two-three decades enteral nutrition bacame declared as optimal route of feeding in patients not being able to feed orally. The old routin was that patients get either EN or, if EN was not enough or got impossible, PN. This line-up has fundamentally changed during the past 4-6 years [15]. It has been demonstrated, that most of the patients in the intensive care units don’t get the calculated (needed) amounts of nutrients. Reasons are restricted absorption, high residual volumen, poor motility, etc. In case patients can be insufficiently nourished enterally, Supplemental Parenteral Nutrition (SPN) is necessary. The only way of supplying further protein and sources of energy in such cases is administration of supplemental intravenous delivery of nutrients. By this way one can administer higher amounts of nutrients and pharmaconutrients as well [16]. As most patients on enteral nutrition have no central venous access, this type of medical nutrition can also be administered as peripheral parenteral nutrition. SPN is a safe and cost-effective way of supplying the missing energy and amino acids for patients having nutritional deficits after enteral nutrition [17]. Randomized clinical trials demonstrated that short term catabolism can be stopped in high proportions of severly malnourished (intensive care) patients by this hybrid way of nutrition with additional benefits in decrease of nosocomial infections as well [18]. SPN can and should be given to non-intensive care patients as well, if nutritional data indicate it. This type of additional nutrition usually indicated transitionally only.

Bioavailability of AA

In patients with undernutrition protein catabolism dominates and during their nutrition support they get artificial protein sources (EN-formulas) to ensure successful endogenous protein synthesis preferably by oral or enteral nutrition. Unfortunately, in many hospitals patients do not receive sufficient protein supplementation [19,20]. Among the many reasons misconception could play a role, too. In the past clinicians calculated with 100% bioavailability. The measured or calculated need of the patient had to be cover with identical protein-content of nutrition solutions. In this case declared protein-content of the nutrition solution was applied as basis for the calculation of necessary dose. Recent studies draw attention to the wastage in nutrients during the enteral nutrition. In 2002, van der Schoor and his team published the study to demonstrate the splanchnic first-pass effect affecting the bioavailability of the ingested protein but in the past 20 years clinicians and dieticians forgot about this loss [21]. Liebau and co-workers recently demonstrated the discrepancies between amounts of amino acids enterally administered and appeared in patients systemic circulation [22]. This loss may reach 15-20% as well. In this light the hyperalimentation concept of the sixties-seventies of the last century was not a big failure in the field of enteral and oral medical nutrition. Moreover, this is the time to rethink calculation technics of the daily routine in medical enteral nutrition and to use more frequently SPN.

Citrulline Fortification

Several efforts have been made to fortify enteral nutrition formulas with non-essential amino acids and conditionally essential amino acids in order to improve anabolic effect of feeding tube meals. One important example is arginin-enrichment. This type of pharmaconutrition is especially favorable in acceleration of wound healing [23,24]. Unfortunately, arginine has a high immediate metabolism in the liver (first pass effect) therefore the dose has been elevated in time. The successfull arginine-fortified formulas have in certain aspects some negative results because in high doses many patients presented adverse or toxic reactions. The change of arginine to citrulline could avoid these adverse effects, because it is direct precursor of arginine and the switch to citrulline resulted in much higher arginine blood levels than arginine administartion. Citrulline has exceptionally high bioavailability, too. Its urinary loss is minimal in comparison to arginine. Moreover, citrulline administration improved systemic amino acid availability, in genereal [25]. Further, clinical studies demonstrated its positive effects in sarcopenia and cardiovascular diseases, the latter is under investigations yet [26]. According tot he recent publications it seems citrullin will enter into the composition of EN formulas in the near future.

Discussion

Clinical nutrition is regarded as stepchild in the medical therapy, however its benefits are not to be queried. Its development is part of the global progress of medicine.

Identification of undernutrition is essential part of the patient hospital admisson. Here we displayed the novel globally accepted tool called GLIM criteria to diagnose undernutrition. This is an important advancement in the frame of international research activity because earlier the undernutrition determined on various assessment base could not ensure the comparability of the study results.

Parenteral nutrition is the most effective mode of artificial nutrition. Its unique benefit is that it can be used in patients with gastrointestinal failure. Typical example for dependence on parenteral nutrition is the increasing number of Short Bowel Syndrome (SBS). These patients often use PN life long (home parenteral nutrition), but some of them (who has more than 1,5-2m gut) are able to adapt their intestine to higher absorption rate within several months or years. This adaptation can be accelarated by the hormonal GLP-2 agonist teduglutide. Integration of this medicine into the treatment of SMS patients gives the chance of weaning off PN in a certain proportion of patients. Whether the induction of gut enteocytes successfull is, measurement of serum level of circulating citrulline became a good indicator. Both innovation basically influence home parenteral nutrition care and the quality of life of patients.

Macronutrients plays a pivotal role in medical nutrition therapy. Determination how much macronutrients (energy and protein sources) are needed to restore the patients’ anabolism after the disease-induced catabolism needs sophisticated measurements and calculations. Recent recognitions helped clinicians to refine computation of optimal amino acid supplementation. Some of the macronutrients also have pharmacological activity as well therefore this type of nutrition is called pharmaconurtition. In case of lipid emulsions new research results opened new vistas in fighting against inflammation. By this way optimal combination of various fat emulsions may improve effectiveness of medical nutrition intervention. But there are news in the field of the first choice medical nutritional mode, the EN as well. Some misbeliefs were elucidated recently. The accurate control of patients on EN revealed that there are several reasons why patients don’t get calculated amounts of EN on the wards. As adequate nutrition is prerequisit of proper healing, introduction of periperal parenteral nutrition for those who don’t tolerate higher amounts (>80% of calory and protein need) of EN, is strongly recommended. Moreover the calculation of daily dose of enteral formulas should be changed due to the hidden loss of ingested protein source. Finally the impact of introduction of novel nutrients should be stressed. Recent appearance of precision medicine force the professionals of medicine and medical nutrition to reevaluate details of daily routine and the used tools, inclusive the medicines and enteral tube feeds. One can find the way to individualized nutrition as well, especially if nutrition support teams are working in the healthcare settings. Multidisciplinaty thinking bring the new ideas and the solutions.

Summary

Lifelong learning is imperativus for healthcare professionals as well. New materials and technics may improve medical diagnosis and medical interventions. Here we displayed some of the recent news in the sphere of medical nutrition. Use of teduglutide and citrulline improve quality of life of the short bowel patients. Recent news on amino acids and fat emulsions may provide better optimalization of parenteral nutrition therapy. Novelties in the field of enteral nutrition also contribute to better service within the healthcare system. This selection of news based on a subjective decision but for those not living in this medium may demonstrate the progress of a segment of clinical nutrition.

References

  1. Jensen GL, Cederholm T, Correia MITD, Gonzalez MC, Fukushima R, et al. (2019) GLIM Criteria for the diagnosis of malnutrition: a consensus report from the global clinical nutrition community. Clin Nutr 39: 1-9. [crossref]
  2. Fiorindi C, Luceri C, Dragoni G, Piemonti G, Scaringi S, et al. (2020) GLIM Criteria for malnutrition in surgical IBD patients: a pilot study. Nutrients 12: 2222. [crossref]
  3. Allard JP, Keller H, Gramlich L, Jeejeebhoy KN, et al. (2020) GLIM Criteria has fair sensitivity and specificity for diagnosing malnutrition when using SGA as comparator. Clin Nutr 39: 2771. [crossref]
  4. Keller H, de van der Schueren MAE, GLIM Consortium, Cederholm T, Barazzoni R, et al. (2020) Global Liedership Initiative on Malnutrition (GLIM): Guidance on validation of the operational criteria for the diagnosis of protein-energy malnutrition in adults. JPEN 44: 992. [crossref]
  5. Zhang X, Tang M, Zhang Q, Zhang K-P, Guo ZQ, et al. (2021) The GLIM criteria as an effective tool for nutrition assessment and survival prediction in older adult cancer patients. Clin Nutr 40: 1224. [crossref]
  6. Kandjani OJ, Alizadeh AA, Moosavi-Movahedi AA, Kheradmand SS, et al. (2021) Expression, purification and molecular dynamics simulation of extracellular domain of glucagon-like peptide-2 receptor linked to teduglutide. Int J Biol Macromolecules 184: 812.
  7. Chen K, Joly F, Mu F, Kelkar SS, et al. (2021) Predictors and timing of response to teduglutide in patients with short bowel syndrome dependent on parenteral support. Clin Nutr 43: 420. [crossref]
  8. Ginguay A, De Brandt J-P, Cynober, L (2016) Indication and contraindications for infusing specific amino acids (leucine, glutamine, arginine, citrulline and taurine) in critically illness. Curr Opin Clin Nutr Metab Care 19: 161-169. [crossref]
  9. Iacone R, Scanzano C, Santarpia L, Cioffi I, Contaldo F, et al. (2020) Macronutrients in parenteral nutrition: amino acids. Nutrients 12: 772. [crossref]
  10. Hsu C-C, Sun C-Y, Tsai C-Y, Chen C-Y, Wang SY, et al. (2021) Metabolism of proteins and amino acids in critically illness: from physiological alterations to relevant clinical practice. J Multidiscipl Healthcare 14: 11071117. [crossref]
  11. Calder PC, Waitzberg DL, Klek S, Martindale RG (2020) Lipids in parenteral nutrition: biological aspects. JPEN 44: S21-27. [crossref]
  12. Cynober L, Moinard C, De Bandt J-P (2010) The 2009 ESPEN Sir David Cuthbertson. A new major signaling molecule or just another player in the pharmaconutrition game? Clin Nutr 29: 545-551. [crossref]
  13. Jeppesen PB, Gabe SM, Seidner DL, Lee H-M, Olivier C (2020) Citrulline correlations in short bowel syndrome – intestinal failure by patient stratification: analysis of 24 weeks of teduglutide treatment from a randomized controlled study. Clin Nutr 39: 2479-2486. [crossref]
  14. Proli F, Faragalli A, Talbotec C, Bucci A, et al. (2021) Variation of plasma citrulline as a predictive factor for weaning off long-term parenteral nutrition in children with neonatal short bowel syndrome. Clin Nutr 40: 4941-1947.
  15. Oshima T, Pichard C (2015) Parenteral nutrition: never say never. Crit Care 19: S5. [crossref]
  16. Singer P, Bendavid I, Mesilati-Stahy R, Green P, Rigler M, et al. (2021) Enteral and supplemental parenteral nutrition enriched with omega-3 polyunsaturated fatty acids in intensive care patients – a randomized controlled, double-blind clinical trial. Clin Nutr 40: 2544-2554. [crossref]
  17. Pradelli L, Graf S, Pichard C, Berger MM (2018) Supplemental parenteral nutrition in intensive care patients: a cost saving strategy. Clin Nutr 37: 573-579.
  18. Alsharif DJ, Alsharif FJ, Aljuraiban GS, Abulmeaty MMA (2020) Effect of supplemental parenteral nutrition versus enteral nutrition alone on clinical outcomes in critically ill adult patients: a systematic review and meta-analysis of randomized controlled trials. Nutrients 12: 2968. [crossref]
  19. Osooli F, Abbas S, Farsaei S, Adibi P (2019) Identifying critically ill patients at risk of malnutrition and underfeeding: a prospective study at an academic hospital. Adv Pharm Bull 9: 314. [crossref]
  20. Rougier L, Preiser JC, Fadeur M, Verbrugge AM, et al. (2021) Nutrition during critical care: an audit on actual energy and protein intakes. JPEN 45: P951.
  21. Van der Schoor SR, Reeds PJ, Stoll B, Henry JF, et al. (2002) The high metabolic cost of a functional gut. Gastroenterology 123: 1931-1940. [croosref]
  22. Liebau F, Király E, Olsson D, Werneman J, et al. (2021) Uptake of dietary amino acids into anterial blood during continuous enteral feeding in critically ill patients and healthy subjects. Clin Nutr 40: 912-918.
  23. Stechmiller JK, Childress B, Cowan L (2005) Arginine supplementation and wound healing. Nutr Clin Pract 20: 52-61.
  24. Liu P, Shen W-Q, Chen H-L (2017) Efficacy of arginine-enriched enteral formulas for the healing of pressure ulcers: a systematic review. J Wound Care 26: 319-326. [crossref]
  25. Bouillanne O, Mekchior J-C, Faure C, Paul M, Canouï-Poitrine F, et al. (2019) Impact of 3-week citrulline supplementation on postprandial protein metabolism in malnourished older patients: the Ciproage randomized controlled trial. Clin Nutr 38: 564-574. [crossref]
  26. Papadia C, Osowska S, Cynober L, Forbes A (2018) Citrulline in health and disease. Review on human studies. Clin Nutr 37: 1823-1828. [crossref]

From Evolutionary Medicine to Precision Medicine in the Hypertension Treatment in Africa

DOI: 10.31038/IMROJ.2021651

Abstract

In ancient humans from Africa populations the hot, dry, and salt-scarce climate have almost certainly selected an efficient capacity to perspire and the development of mechanisms for the conservation of sodium in the kidneys. The more recent development of African cities following western lifestyles is revealing these selected compensatory mechanisms by means of hypertension. Africa expands from North to South (70° latitude), presenting an enormous diversity  of  climates  and  natural  environments  associated  with  different  selective  pressures.  In  order  to  improve  hypertension  treatment  in Africa it is needed to obtain new genomic data from the different African ethnic groups, as this is the only way we can put into practice precision  medicine based on evolutionary medicine.

Traditional medicine restricts itself to the study of causality inserted in a short period of time, most often dealing with the present symptomatology (acute symptoms), or sometimes also considering the natural history of the disease and the associated chronic symptomatology. Hereditary and genetically predisposed diseases further extend this time window, including the study of several generations of the patient’s family. However, when the approach to medicine is evolutionary, the time factor changes scale, as the search for causality invokes adaptive processes inherent to evolutionary mechanisms, such as natural selection.

After the emergence of the genus Homo in Africa, hominids occupied a wide variety of environments. It is now believed that Homo sapiens has originated in Africa about 500,000 to 300,000 years ago, according to a “Pan-African” model, in which gene exchange was possible through sporadic crossbreeding between geographically distinct populations of Homo sapiens or even other hominids [1-4]. Regions located near the equator have higher diversity of pathogens, and consequently have been the scene for outbreaks of meningitis, Ebola and malaria [5-7]. Some genetic variants that confer resistance to malaria are classic examples of the selection of alleles that, in homozygosity, predispose individuals to severe genetic diseases, such as sickle cell disease. Here, the existence of a large availability of food, delayed industrialization in Africa, once compared to the other cities of western culture. Africa’s later urban development has had a profound impact on health, especially in countries with the highest rates of development. For example, regarding high blood pressure, it occurs more frequently, earlier and more severely in African individuals or individuals of African descent [8]. Hypertension is a relevant public health problem, being a risk factor for cardiovascular disease and kidney failure. Hypertension affects about 25% of the adult population in the world and It is known to have a genetic [9,10].

From an evolutionary perspective, there is evidence that susceptibility to hypertension may be ancestral, and that part of the differences presented are explained by exposure to different selective pressures. The desire for salt and water and vascular reactivity, key components of susceptibility to hypertension, must have been adaptively acquired in the ancestral African environment characterized by a hot, dry and salt-scarce climate [11]. Heat dissipation is essential in hot environments and is achieved most efficiently through its   loss through evaporation, consequently humans have developed an enormous capacity to perspire. However, excessive transpiration can lead to significant losses of salt and water, which together with the low availability of salt in tropical climates, results on one hand in an increased demand for salt and on the other in the development of mechanisms for the conservation of sodium in the kidneys. In fact, it turns out that humans and non-human primates from tropical regions have a greater desire for salt and water [12-15]. Another consequence of excessive sweating is the loss of blood volume, with a subsequent increase in arterial tone and cardiac contraction in order to guarantee blood pressure and effective perfusion in the organs [16]. Thus, the genetic variation associated with these compensatory mechanisms related to the increase in arterial and cardiac contractility must certainly have constituted an advantage in the environmental context of human evolution in its most primordial phase.

Originating in Africa, our species ended up conquering new territories, expanding to other regions of the globe, at different latitudes, facing different environments. Then there was a need to adapt to new thermodynamic control mechanisms, in which the objective progressively stopped being the dissipation of heat, but rather its conservation. On the other hand, selection by demand for salt and water and cardiovascular reactivity decreased [17,18]. Thus, the greater susceptibility to hypertension  in  African  populations,  compared  to the non-African ones, results from physiological adaptations to different environments that were progressively imprinted in the genomes for about 30,000 years [19]. The most recent development of African metropolises, associated with a more stressful lifestyle, an increase in the consumption of fast-food products, with high levels of salt and promoters of overweight/obesity, highlighted the health problems that these populations face in the area of hypertension and cardiovascular diseases, revealing the synergistic effects of exposure to new lifestyles with the evolutionary processes encrypted in their genomes [19].

Currently, several genes with polymorphic variation that code for proteins involved in compensatory mechanisms of volume change and vascular reactivity, secondary to salt loss, have been identified [19]. For example, the haptoglobin gene, which has polymorphic variation only in humans, codes for  an  acute-phase  protein  that has been associated with high levels of sodium-sensitive blood pressure for more than 30 years. Population studies have shown similar allelic frequencies between two countries located at similar latitudes – Honduras (Central America) and Mozambique (Africa) [20]. In this case, it is interest to observe that the Native American population (Honduras), despite being more recent and coming from cold-adapted populations from North  Asia,  is  genetically  similar to the more ancestral one (Mozambique), reflecting a more recent adaptation that occurred in less than 20,000 years, demonstrating the strength of selection by latitude. Another gene traditionally associated with hypertension, the GNB3, has been shown to contribute to the disease in a latitude-dependent manner [19]. Evidence of selection by latitude was also found in mitochondrial genes linked to oxidative phosphorylation, and therefore also in the production of heat by cells, essential for adaptation to external temperatures [21].

The genetic variability between populations fixed by selective pressures is particularly relevant when it is intended to implement precision medicine, in which a  more  personalized  treatment,  which considers the individual’s genetic profile, allows for a more targeted therapeutic intervention. This approach is very relevant when dealing with multifactorial diseases (such as hypertension), in which several genes in partnership with the environment shape the individual’s phenotype. Precision medicine tends to use information obtained through new mass sequencing technologies. However, the few technological resources that exist in Africa, limit the collection of these data [22]. Only a small number of health and/or research institutions contribute with data, but often targeting only already known genes, thus limiting the discovery of variants in new genes [22]. In fact, an analysis of several genome-wide studies revealed that Africa is underrepresented, despite having a large number of associations between genetic variants and various diseases [23]. The relevance of these studies grows if we consider the great genetic diversity that exists within this continent. Africa expands from North to South (70° latitude), presenting an enormous diversity of climates and natural environments associated with different selective pressures. The African diaspora that happened about 70,000 years ago, occurred via a population bottleneck effect, as it is estimated that only about 1,000 individuals of East African descent have achieved this effect [24,25]. In this way, the African populations, more ancestral, end up presenting a greater genetic diversity compared to others. Then, there is an urgent need to obtain genomic data from the different African ethnic groups, as this is the only way we can put into practice precision medicine based on evolutionary medicine.

References

  1. Hublin J-J, Ben-Ncer A, Bailey SE, Freidline SE, Neubauer S, et (2017) New fossils from Jebel Irhoud, Morocco and the pan-African origin of Homo sapiens. Nature 546: 289-292.
  2. Scerri EML, Thomas MG, Manica A, Gunz P, Stock JT, et (2018) Did Our Species Evolve in Subdivided Populations across Africa, and Why Does It Matter? Trends in Ecology & Evolution 33: 582-594. [crossref]
  3. Schlebusch CM, Malmström H, Günther T, Sjödin P, Coutinho A, et al. (2017) Southern African ancient genomes estimate modern human divergence to 350,000 to 260,000 years Science 358: 652-655. [crossref]
  4. Stringer C (2016) The origin and evolution of homo sapiens. Philosophical Transactions of the Royal Society B: Biological Sciences 371.
  5. Alexander KA, Sanderson CE, Marathe M, Lewis BL, Rivers, CM, et (2015) What factors might have led to the emergence of Ebola in West Africa? PLoS Neglected Tropical Diseases 9: e0003652. [crossref]
  6. Cairns ME, Walker PGT, Okell LC, Griffin JT, Garske T, et al. (2015) Seasonality in malaria transmission: implications for case-management with long-acting artemisinin combination therapy in sub-Saharan Malaria Journal 14: 321.
  7. Zhao S, Lin Q, He D, Stone L (2018) Meningitis epidemics shift in sub-Saharan belt. International Journal of Infectious Diseases : IJID : Official Publication of the International Society for Infectious Diseases 68: 79-82.
  8. Burt VL, Whelton P, Roccella EJ, Brown C, Cutler JA, et al. (1995) Prevalence of hypertension in the US adult population: results from the Third National Health and Nutrition Examination Survey, 1988-1991. Hypertension 25: 305-313. [crossref]
  9. Kearney PM, Whelton M, Reynolds K, Muntner P, Whelton PK, et (2005) Global burden of hypertension: analysis of worldwide data. Lancet 365: 217-223. [crossref]
  10. Luft FC (2021) [Molecular genetics of human hypertension]. Der Internist 62: 223-235. [crossref]
  11. Bicho M (2018) Genetic predisposition for essential hypertension, based on studies of genetic polymorphisms in modern global human populations: The perspective of evolutionary Revista Portuguesa de Cardiologia 37: 509-510.
  12. Baker EH, Ireson NJ, Carney C, Markandu ND, MacGregor GA (2001) Transepithelial sodium absorption is increased in people of African origin. Hypertension 38: 76-80. [crossref]
  13. Brier ME, Luft FC (1994) Sodium kinetics in white and black normotensive subjects: possible relevance to salt-sensitive The American Journal of the Medical Sciences 307: S38-42. [crossref]
  14. Moskowitz DW (1996) Hypertension, thermotolerance, and the “African gene”: an hypothesis. Clinical and Experimental Hypertension 18: 1-19.
  15. Vollmer WM, Sacks FM, Ard J, Appel LJ, Bray GA, et (2001) Effects of diet and sodium intake on blood pressure: subgroup analysis of the DASH-sodium trial. Annals of Internal Medicine 135: 1019-1028. [crossref]
  16. Newman RW (1970) Why man is such a sweaty and thirsty naked animal: A speculative review. Human Biology 12-27. [crossref]
  17. Cardillo C, Kilcoyne CM, Cannon RO, Panza JA (1999) Attenuation of cyclic nucleotide-mediated smooth muscle relaxation in blacks as a cause of racial differences in vasodilator Circulation 99: 90-95. [crossref]
  18. Stein CM, Lang CC, Singh I, He HB, Wood AJ (2000) Increased vascular adrenergic vasoconstriction and decreased vasodilation in blacks Additive mechanisms leading to enhanced vascular Hypertension 36: 945-951. [crossref]
  19. Young JH, Chang Y-PC, Kim JD-O, Chretien J-P, Klag MJ, Levine MA, et al. (2005) Differential susceptibility to hypertension is due to selection during the out-of-Africa expansion. PLoS Genetics 1: e82. [crossref]
  20. Silva AP, Damasceno A, Ricchiuti V, Polónia J, Fisher N, Bicho (2012) Revista Portuguesa de Hipertensão e Risco cardiovascular 34.
  21. Starikovskaya EB, Sukernik RI, Derbeneva OA, Volodko NV, Ruiz-Pesini E, et al. (2005) Mitochondrial DNA diversity in indigenous populations of the southern extent of Siberia, and the origins of Native American Annals of Human Genetics 69: 67-89. [crossref]
  22. Pereira L, Mutesa L, Tindana P, Ramsay M (2021) African genetic diversity and adaptation inform a precision medicine Nature Reviews Genetics 22: 284-306. [crossref]
  23. Gurdasani D, Barroso I, Zeggini E, Sandhu MS (2019) Genomics of disease risk in globally diverse Nature Reviews Genetics 20: 520-535.
  24. Gravel S, Henn BM, Gutenkunst RN, Indap AR, Marth GT, et (2011) Demographic history and rare allele sharing among human populations. Proceedings of the National Academy of Sciences of the United States of America 108: 11983-11988.
  25. Macaulay V, Hill C, Achilli A, Rengo C, Clarke D, et (2005) Single, rapid coastal settlement of Asia revealed by analysis of complete mitochondrial genomes. Science 308: 1034-1036. [crossref]

Modified Dachaihu Decoction Regulates FOXO3a Acetylation Activated Autophagy and Relieving Insulin Resistance in Obesity

DOI: 10.31038/EDMJ.2021542

Abstract

Background: The previous studies of our research group indicate that the weakening of mitochondrial autophagy function is the key mechanism of obesity-induced insulin resistance, and Mitochondrial autophagy mediated by PINK1/Parkin pathway can reverse mitochondrial dysfunction. Recently, we found that FOXO3a, as an upstream regulator of PINK1, has been found to play a key role in regulating mitochondrial autophagy.However,FOXO3a is regulated by deacetylation.

Objective: To explore whether Modified Dachaihu Decoction can regulate liver mitochondrial autophagy mediated by the PINK1/Parkin signal pathway by regulating the expression of FOXO3a acetylation.

Methods: Establish cell models. They were divided into three groups (blank control group, model control group, and Modified Dachaihu Decoction group). The supernatant was extracted and determined by a biochemical method; The insulin sensitivity of each group was evaluated by a 3H-D-glucose incorporation test; MDA and TNFα、IL-6 in the supernatant were detected by ELISA level; The level of SOD was detected by spectrophotometry.The expression of mitochondrial autophagy-related proteins and the expression of FOXO3a and ace-FOXO3a were measured by Western blot.

Results: Compared with the model control group, the Modified Dachaihu Decoction group increased insulin sensitivity, and The levels of TNF- α、IL-6, and MDA decreased, while the activity of SOD increased (P < 0.05). Western blot showed that compared with the model control group, the expression of mitochondrial autophagy-related proteins and FOXO3a in the Modified Dachaihu Decoction group increased, and the expression of ace-FOXO3a decreased (P < 0.05).

Conclusions: we speculate that in this experiment, Modified Dachaihu Decoction may regulate mitochondrial autophagy mediated by PINK1/ Parkin signal pathway by downregulating the expression of FOXO3a acetylation, to reduce Hepatic Insulin Resistance in Obesity.

Keywords

FOXO3a Acetylation, Autophagy, Hepatic Insulin Resistance