Abstract
Absence of recruitment in clinical trials reached 80% which lead to failures of clinical trials and needed drug do not reach the patients. To find out the reasons of failures in recruitment the authors is considering many factors. A factors which are decreasing the recruitment is very diverse and there is no the classification of it. We suggested the simple classification and investigated the rate of recruitment in the light of some factors using parameters reflecting the recruitment progress on the site’s level.
Materials and methods: Data of four clinical trials II-III phases in oncology and hematology, conducted since 2007 to 2017 years has been used for retrospective analysis.
Study objectives: To investigate the study recruitment rate using different parameters and it’s changes along with acting of factors; to develop new parameters and values (derivatives) which could be sensitive for evaluation of factor’s action.
Statistical analysis: Data had been collected from feasibility questionnaires, open statistical sources.
Results: It was determined rate of recruitment and it’s derivatives where was acting internal factors.
Discussion: Recruitment been undergone the internal factors. The way of action is multidirectional and could boost the recruitment and in opposite to decrease one and knowing it is important in success of recruitment and clinical trial itself eventually.
Introduction
Chin Feman P. – [1] found that factors influencing to recruitment is quite diverse and difficult to estimate due to highly variable. It is found more than 30 factors influencing to recruitment and much of them can ruin the trials due to fail of recruitment (D. Fogel, 2018). The possibility to predict the recruitment based on the acting of factors is said by M. Rutger at al., (2017) and they also found more than 30 factors acting differently to recruitment. These authors used the feasibility questionnaire to collect the data. There is no universal classification of the factors and authors as a rule being limited by just the listing of the factors. To estimate the way of factors action’s the authors using figures of recruitment at least at the start of the study (M. Kabby, 2011) and at the end of the study. The comprehensively spread ratio is the ratio of parameters to evaluate the involvement of gender and some social groups and much known is enrollment fraction [2-6] that is the number of enrollees divided by the number of potential subjects to determine age, sex and race of patients involved to studies.
Methods and Materials
We investigated data observed by 70 clinical centers participating in II – III phases trials in oncology and hematology in three countries – Russia, Ukraine and Belorussia for the period from July 01, 2008 to December 31, 2017 in order to determine the factors which is influencing to recruitment, to determine the parameters and values which is changing under influence of this factors. The collection of data was done out from questionnaires at the stage of searching for centers, from the results obtained at the end of the research, from open statistical sources.
We also took our classification of sites based on recruitment and speed of recruitment
– Silence sites – rate of recruitment – 0 patients per month;
– Low-recruiting – rate of recruitment by 0,01 to 0,19 patients per months;
– Middle-recruiting – by 0,20 to 0,89 per months;
– High-recruiting – by 0,90 to 3 patients per months.
The amount of involved cities, involved sites and protocol required patients are presented in Table 1.
Table 1: Etymology of studies, amount of cities where centers opened, amount of centers opened, number of patients to be involved according to protocol.
|
№ |
Nosology | The number of cities in which centers were opened | Number of clinical centers |
Study power – required number of patients (N) |
| 1 | 2 |
3 |
4 |
5 |
| 1 | Lung cancer |
25 |
27 |
450 |
| 2 | Colorectal cancer |
19 |
19 |
340 |
| 3 | Idiopathic purpura |
15 |
15 |
69 |
| 4 | Head and neck cancer |
9 |
9 |
982 |
| Total |
68 |
70 |
1841 |
We divided the factors associated to recruitmet according to attitude to participatnts human being (investigators and patients) and have got external and internal factors presented in Tables 2 and 3.
Table 2: Internal factors.
|
№ |
Internal factors |
| 1 | 2 |
| 1. | Disease (of protocol) |
| 2. | Experience of investigators |
| 3. | Planned (proposed) patients in stage of feasibility |
Table 3: External Factors.
|
№ |
External factors |
| 1 | 2 |
| 1. | Country |
| 2. | City (infrastructure) |
| 3. | Population |
| 4. | Living area |
| 5. | Density of living area (one factor like for item 4) |
| 6. | Income |
| 7. | Morbidity (new cases per year) |
Parameters we took to investigate the undergone of recruitment is following:
- Type of site (based on final recruitment)
. is high recruited site. Appointed range 4
. middle recruited sites. Appointed range 3
. law recruited sites. Appointed range 2
. non-recruited sites (silence sites). Appointed range 1.
- Time from first contact of site to first reply
- Duration of recruitment in days
- Speed of recruitment
- Target recruitment (proposed or planned by investigator in the beginning of the study)
- Target speed of recruitment
- Percentage of performance of target recruitment
- Expirience of investigator
RATIO of parameters like
- Target recruitment to study population (maximum figure of patients to be recruited by the protocol)
- Time of first reply to target recruitment
- 1 to time of reply
- 1 to target recruitment
- Ratio of 1 to time of reply to ratio 1 to target recruitment
Statistical Analysis
Following done:
- Calcuation of mean and error, moda and mediana for choosen parameteres (more than 1960),
- Dispersion analysis
- Pirson and Sperman correlation
- Calculation of Student t-criterium
Results
We studied studies that were conducted in cities with different populations. We have divided them into 3 categories – 1) less than 1 million residents; 2) from 1 million to 2 million and 3) more than 2 million residents. The distribution is shown in Table 4.
Table 4: Dependence of the efficiency of patient recruitment on the number of residents.
|
Number of city residents |
Enrollment effectivity of sites involved in the study (in %) | ||||
| Silent sites | Low-recruiting sites | Middle-recruiting sites | High-recruiting sites |
Total |
|
| 1 |
2 |
3 | 4 | 5 |
6 |
| < 1 мln |
52 |
42 | 6 | 0 |
100 |
| 1-2 мln |
11 |
44 | 33 | 12 |
100 |
| >2 мln |
40 |
22 | 14 | 24 |
100 |
It can be seen that in cities with a population of more than 1 million, the number of centers with a high enrollment of patients is twice as high, which is most likely due to the developed infrastructure and confirms the literature data [7,8]. Statistical values presented below in Table 5.
Table 5: Rate of recruitment presented depends of population presented.
|
№ |
Parameter, p-value | Parameters according to population,
X ± m |
||
| 1 – up to 1 mln | 2 – 1 – 2 mln |
3 – more than 2 mln |
||
| 1 | 2 |
3 |
4 |
5 |
| 1. | Type of site |
1,78 ± 0,14 |
2,69 ± 0,28 |
2,12 ± 0,24 |
| 2. | Time from first contact till reply, days
P 1/2<0,01; 2/3<0,01; |
24,16 ± 3,1 |
11 ± 1,48 |
31 ± 5,53 |
| 3. | Speed of recruitment
P 1/2<0,05; |
0,14 ± 0,05 |
0,57 ± 0,2 |
0,47 ± 0,16 |
| 4. | Protocol planned recruitment rate per month |
0,33 ± 0,02 |
0,31 ± 0,02 |
0,37 ± 0,02 |
| 5. | Recruitment amount final per site
P 1/2<0,01 |
3,75 ± 1,24 |
15,08 ± 5,06 |
12,24 ± 4,15 |
| 6. | Patients to be planned per site |
12 ± 1,44 |
18,53 ± 3,24 |
20,48 ± 3,9 |
| 7. | Percentage of performance |
30,189 ± 9,56 |
111,7 ± 42,5 |
81,2 ± 25,02 |
| 8. | Experiences of PI in clinical trial in years |
5,8 ± 0,32 |
5,69 ± 0,59 |
5,52 ± 0,47 |
| 9. | RATIO-Planned/maximum pats per protocol |
5,37 ± 0,71 |
5,68 ± 1,1 |
5,58 ± 0,75 |
| 10. | RATIO – time of first reply/planned patients
P 1/2<0,01; 2/3<0,01; |
2,81 ± 0,45 |
0,7 ± 0,11 |
2,3 ± 0,47 |
| 11. | 1/time to reply |
0,08 ± 0,02 |
0,17 ± 0,07 |
0,13 ± 0,05 |
| 12. | 1/planned patients
P 1/2<0,01; 1/3<0,01; |
0,12 ± 0,02 |
0,07 ± 0,009 |
0,07 ± 0,006 |
| 13. | ratio 1 ((1/time to reply)/(1/planned patients)) |
1,02 ± 0,26 |
2,46 ± 0,8 |
3,3 ± 1,69 |
Analysis of table showed following statistical differences:
- Time of first contact has a statistcial differences in group 2 two more time lesst than ingroups 1 and 3, that is the optimal infrusctructue and population is 1 – 2 mln to have a quick reply.
- Speed of recruitment also was statistically higher in area of 1-2 mln people as well as final recruitment.
- RATIO time of first reply to planned pats and 1 divided by planned pats also has a statistial significance. Wich means that these ratios quite sensitive to this parameter.
The living area, density of living area where being investigating the medicinal product definitely has an influence to recruitment.
Parameters of recruitment presented on Table 6. From the analysis of the Table 6, it can be seen that the population density of up to 4000 people is enough for the enrollment of patients to be high enough, however, with a population density of more than 4000 people, the percentage of silent sites is minimal in relation to the percentage of highly recruited ones.
Table 6: Parameters of recruitment and Density of population.
|
Density of population |
Efficacy of recruitment (% N=70 центров) | |||||
| 1 | 2 | 3 | 4 | 5 |
6 |
|
|
People on km2 |
Non-recruiting sites |
Low-recruiting sites | Middle-recruiting sites | High-recruiting sites |
Total |
|
| < 2000 |
4 (6%) |
5 (7%) | 0 | 0 |
9 (13%) |
|
| 2001-4000 |
17 (24%) |
14 (19%) | 7 (10%) | 5 (7%) |
43 (60%) |
|
| >4000 |
5 (7%) |
4 (6%) | 4 (7%) | 5 (7%) |
18 (27%) |
|
|
Density of population |
Efficacy of recruitment (% N=70 центров) |
|||||
| 1 | 2 | 3 | 4 | 5 |
6 |
|
|
People on km2 |
Non-recruiting sites |
Low-recruiting sites | Middle-recruiting sites | High-recruiting sites |
Total |
|
| < 2000 |
4 (6%) |
5 (7%) | 0 | 0 |
9 (13%) |
|
| 2001-4000 |
17 (24%) |
14 (19%) | 7 (10%) | 5 (7%) |
43 (60%) |
|
| >4000 |
5 (7%) |
4 (6%) | 4 (7%) | 5 (7%) |
18 (27%) |
|
Analysis of Table 7 revealed that:
Table 7: Parameters of recruitment depends of living area, density of living area.
|
№ |
Parameter, p-value | Parameters according to density of living area,
X ± m |
|||
| 1 – up to 2000 | 2 – 2000-4000 |
3 – more than 4000 |
|||
|
1 |
2 | 3 | 4 |
5 |
|
| 1. | Type of site |
1,56 ± 0,17 |
2 ± 0,15 |
2,5 ± 0,28 |
|
| 2. | Time from first contact till reply, days |
28,22 ± 6,84 |
21,47 ± 2,79 |
28,56 ± 6,52 |
|
| 3. | Speed of recruitment
P 1/2<0,01; 1/3<0,01; |
0,03 ± 0,01 |
0,31 ± 0,09 |
0,53 ± 0,17 |
|
| 4. | protocol planned recruitment rate per month |
0,3 ± 0,02 |
0,34 ± 0,01 |
0,35 ± 0,03 |
|
| 5. | Recruitment amount final per site
P 1/2<0,01; 1/3<0,01; |
0,89 ± 0,34 |
8,33 ± 2,38 |
14,22 ± 4,38 |
|
| 6. | Patients to be planned per site |
11,22 ± 2,08 |
16,7 ± 2,34 |
17,67 ± 3,35 |
|
| 7. | Percentage of performance
P 1/2<0,01; 1/3<0,01; |
7,56 ± 3,47 |
56,39 ± 14,84 |
108,65 ± 33,68 |
|
| 8. | Experiences of PI in clinical trial in years |
5,89 ± 0,3 |
5,6 ± 0,3 |
5,78 ± 0,61 |
|
| 9. | RATIO-Planned/maximum pats per protocol |
4,38 ± 1,23 |
5,91 ± 0,6 |
5,09 ± 0,89 |
|
| 10. | RATIO – time of first reply/planned patients |
3,66 ± 1,22 |
1,87 ± 0,28 |
2,42 ± 0,55 |
|
| 11. | 1/time to reply |
0,06 ± 0,01 |
0,13 ± 0,03 |
0,11 ± 0,05 |
|
| 12. | 1/planned patients |
0,13 ± 0,03 |
0,08 ± 0,01 |
0,1 ± 0,02 |
|
| 13. | ratio 1 ((1/time to reply)/(1/planned patients)) |
0,64 ± 0,16 |
2,47 ± 0,92 |
2,01 ± 1,05 |
|
– Speed of recruitment mush less in first group
– Final recruitment also has a statistical differences
– Percentage of performance has a statistical differences
– RATIO planned pats to maximum pats per protocol also has a differences.
– RATIO- time first screening / TIME first reply has a statistical differences.
The density definitely has a clear evidence that the more density of people the more recruitment and speed of it being expected.
Cumulative figure of investigated of three parameters presented below in Figures 1-5.
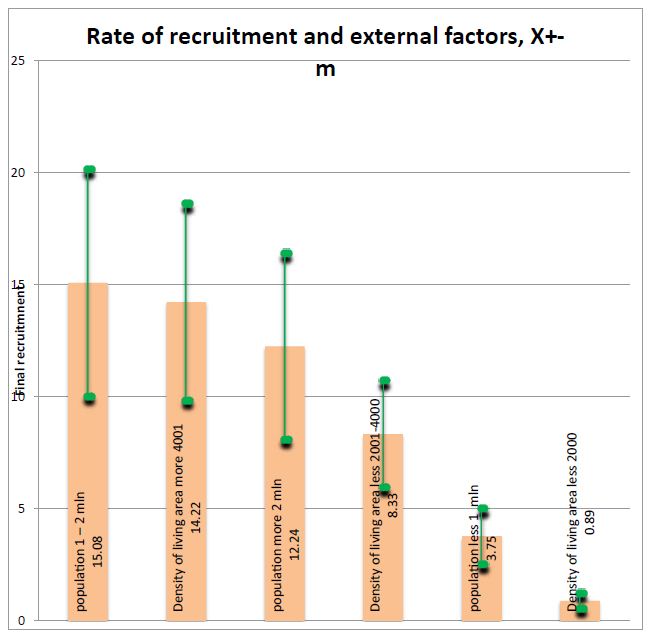
Figure 1: Rate of recruitment and external factors. Figure is show that obviously the less density and people in area of conductning the clincial trials the less rate of recruitment.
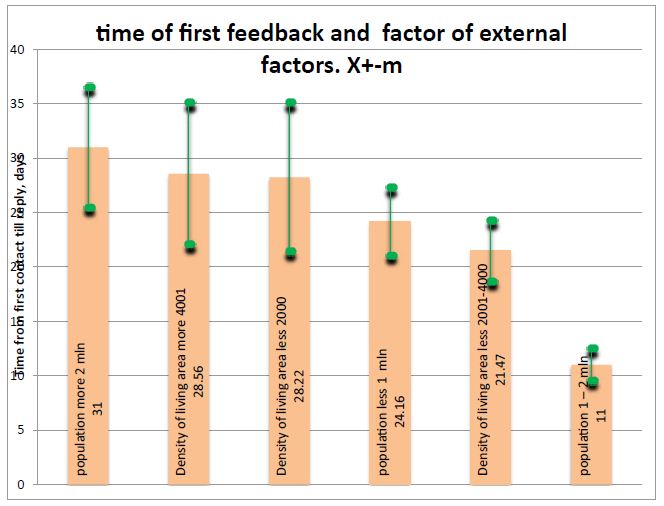
Figure 2: Time of first feedback and external factors. Clearly is seeing that very fast reply is seeing in population 1-2 mln people.
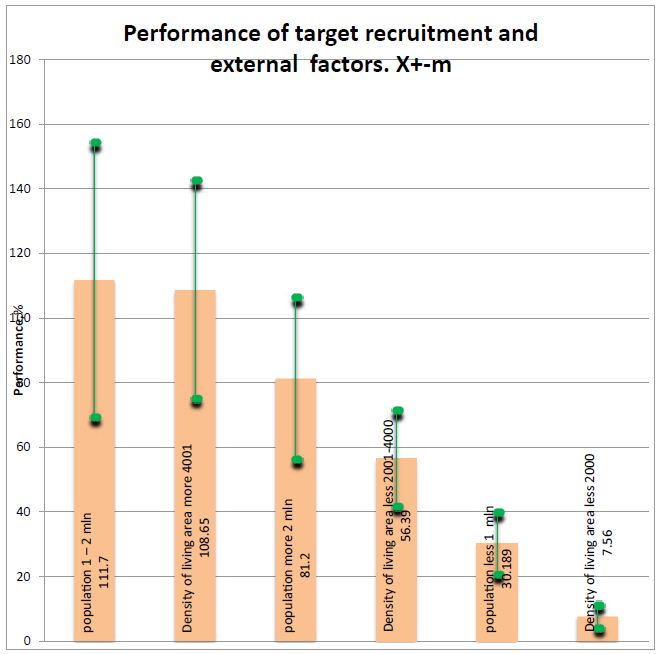
Figure 3: Performance of target recruitment and external factors (please refer to table above). Figure 3 show that performance if very low where low density of population.
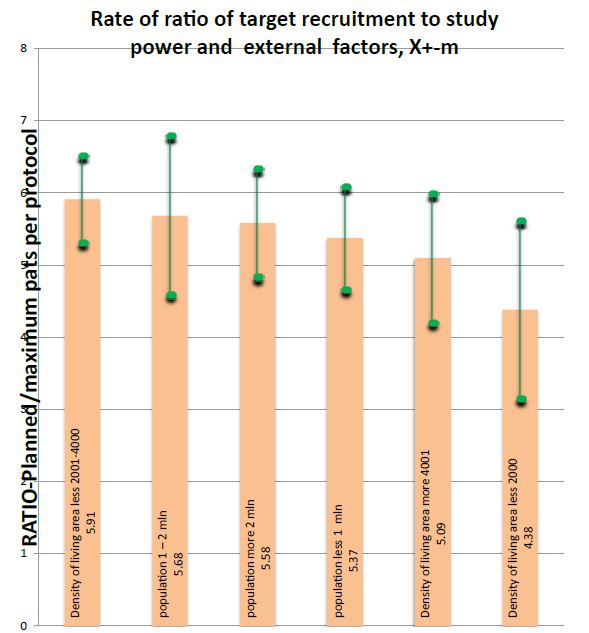
Figure 4: Rate of ratio of target recruitment to study power and external factors
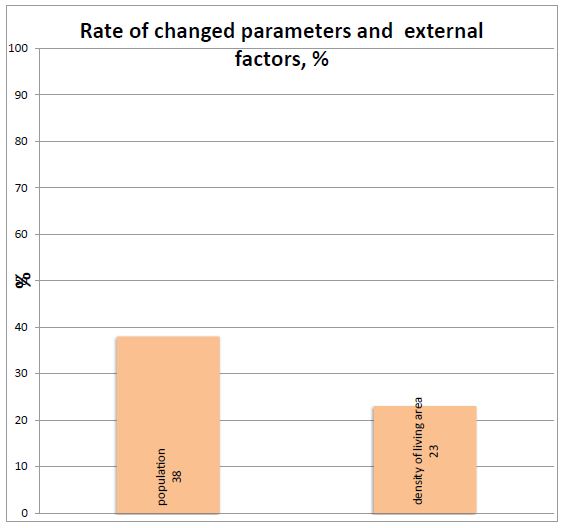
Figure 5: Rate of changed parameters and external factors. Figure shows that this ratio is not sensitive during acting of population and density. The percentage of changed parameter and ratio under influence of population and density of people presented in this figure.
Short Discussion
Authors [9] did not find the correspondence beetwen the rate of recruitment and the actual population and we found also that mostly of parameters do not changing, but we firstly showed a new ratios which sensitive to the investigated factors. We found like some authors [10-19] that sites in area with high amount of people has more expectation to perform the recruitment.
Therefore, the following investigation of different factors will support the clinical trial industry in moire efective clinical trials.
References
- Chin FP, Nguyen LT, Quilty MT, Kerr CE, Nam BH, et al. (2008) Effectiveness of recruitment in clinical trials: an analysis of methods used in a trial for irritable bowel syndrome patients. Clin. Trials 29: 241-251. [crossref]
- Fouad MN, Lee JY, Catalano PJ, Vogt TM, Zafar, et al. (2013) Enrollment of patients with lung and colorectal cancers onto clinical trials. Oncol. Pract. 9: 2 e40-47.[crossref]
- Murthy VH, Krumholz HM, Gross CP. (2004) Participation in cancer clinical trials: Race-, sex-, and age-based disparities. JAMA 291: 2720-2726 [crossref]
- Stewart JH, Bertoni AG, Staten JL, et al. (2007) Participation in surgical oncology clinical trials: Gender-, race/ethnicity-, and age-based disparities. Ann Surg Oncol 14: 3328-3334.[crossref]
- Du W, Gadgeel SM, Simon MS (2006) Predictors of enrollment in lung cancer clinical trials. Cancer 106: 420-425.[crossref]
- Nass SJ, Moses HL, Mendelsohjn J (eds). (2010) A National Cancer Clinical Trials System for the 21st Century. Washington, DC, National Academies Press. [crossref]
- Lovato LC, Hill K, Hertert S, Hunninghake DB, Probstfield JL (1997) Recruitment for controlled clinical trials: literature summary and annotated bibliography. Clin. Trials 18: 328-352.[crossref]
- McNeely EA, Clements SD (1994) Recruitment and retention of the older adult into research studies. Neurosurg. Nurs. 26: 57-61.[crossref]
- Hill NS, Preston IR, Roberts KE (2008) Patients with pulmonary arterial hypertension in clinical trials. Who are they? Am. Thorac. Soc. 5: 603-609
- van den Bor RM, Grobbee DE, Oosterman BJ, Vaessen PWJ, Roes KCB (2017) Predicting enrollment performance of investigational centers in phase III multicenter clinical trials. Contemp Clin Trials Comm 7: 208-216.[crossref]
- L´opez Jaimes. A, Zapotecas Mart´ınez S, Coello CoelloAn CA (2009) Introduction to Multiobjective Optimization Techniques. Nova Science Publishers, Inc., pg: 1-26.
- McDonald AM, Knight RC, Campbell MK, Entwistle VA, Grant AM, et al. (2006) What influences recruitment to randomised controlled trials? A review of trials funded by two UK funding agencies, Trials 7.
- Fletcher B, Gheorghe A, Moore D, Wilson S, Damery S (2012) Improving the recruitment activity of clinicians in randomized controlled trials: a systematic review. BMJ Open 2: e000496 [crossref]
- Joan FBB, Brescia (2007) Reinventing Patient Recruitment: Revolutionary Ideas for Clinical Trial Success. Gower Publishing, Surrey, UK.
- LovatoLC, Hill K, Hertert S, Hunninghake DB, Probstfield JL (1997) Recruitment for controlled clinical trials: literature summary and annotated bibliography. Control Trials 18: 328-357.
- Friedman LM, Furberg CD, DeMets DL (2010) Fundamentals of Clinical Trials, fourth , Springer.
- Myles PS, Williamson E, Oakley J, et al. (2014) Ethical and scientific considerations for patient enrollment into concurrent clinical trials. Trials 15: 470. [crossref]
- Robert S. Bienkowski and Norman M. Goldfarb. (2008) Screen Failures in Clinical Trials: Financial Roulette or the Cost of Doing Business? Journal of clinical research best practices Vol.4: 7.
- Rahman S, Majumder AA, Shaban SF, Rahman N, Ahmed M. (2011) Physician participation in clinical research and trials: issues and approaches, Med. Educ. Pract. 2: 85-93.[crossref]