Author Archives: author

Introduction to Vital Biological and Regenerative Factors Myxocyprinus asiaticus

DOI: 10.31038/AFS.2021343

Abstract

It will not be possible to get the biological course and to know the biological species without a comprehensive knowledge of different species, especially their important species from different landscapes. Chinese high-fin banded shark is a species of biological and geogeological importance about which little resources and research have been done. This fish is also of special importance from an evolutionary point of view. The present article tries to examine the general characteristics, general needs, and methods required.

Keywords

Biological, Geogeological, Evolution

Introduction

Myxocyprinus asiaticus is a freshwater fish native to China and the only member of the family, Catostomidae, in Asia [1]. This species is an important commercial fish and has an important role in archaeological and geogeographical studies [2]. It is also used as an ornamental fish due to its colorful body. However, the wild population of this fish has decreased tragically in recent decades due to overfishing, water pollution and other anthropogenic effects [3]. Chinese sucker is an endangered species that is the second most endangered species in China [4].

Systematic and Morphological

It is the only member of the Catostomidae family in Asia [5]. A large freshwater fish with a slightly long and compact body on both sides, small and short head, short snout, and curved mouth upwards, full lateral line, lack of Barbel on jaw and smooth abdominal surface 48-53 scales on lateral line, long base of dorsal fin Which is close to the second fin. It has three stripes on the sides and a panda-like dark spot on the edge of the eye in adult species [6].

Distribution

They are distributed only in the Yangtze and Min Jiang rivers in China [7].

Maintain and Expand Reserves

This species is an endangered fish, which is in the second category of endangered aquatic and terrestrial animals in China [8].

Controlling abandoned populations and preventing population decline through factors such as disease is inevitable. One of the most reliable methods of disease control in aquaculture is the preventive use of immune stimulants [9]. Immune stimuli can increase survival against pathogens by enhancing the nonspecific defense mechanism [10]. Also, in a study on thermal marking of fish pebbles, which was performed by exposing Chinese high-fin banded shark larvae to temperature regimes from hot water 28°C to cold water 16°C, it was found that the incremental patterns of pebbles were different in each group. In this way, by controlling the duration of presence in hot water, narrower or wider incremental patterns could be obtained. A deep and positive relationship between the width of the incremental pattern and the duration of cultivation in hot water in each cycle of water temperature fluctuation could be seen. Unusually, it is proposed as a solution to distinguish breeding people from species grown in nature [11]. Studies have also shown that those in the 24-hour temperature cycle provided clear, high-contrast patterns compared to constant-temperature findings [12].

Genetics

The Catostomidae family is thought to have evolved from a cyprinid-like ancestor in Asia [13]. Although most members of this family of about 60 species are now confined to North America, only two species include Catostomus catostomus rostarus (a subspecies of C. c. Catostomus in North America; sometimes both of these fish as a subspecies). Single species are classified as C. c. Catostomus in eastern Siberia and Myxocyprinus asiaticus in China, native to Eurasia. Tetraploidy has been confirmed in North American suckers [14,15]. A study also found that tetraploidy of this family was found in Asia and not in North America [16].

Nutrition

The Chinese high-fin banded shark actively collects food from the floor and seems to need 30 minutes to complete one dimension [17]. Chinese high-fin banded shark is an omnivorous species that is bred in China due to its delicious meat and uniform growth. These resources are difficult to store and easily reduce water quality and even spread diseases [18]. It is important to know the sources and principles of fish nutrition in their impact on various factors such as growth, productivity, survival and fertility, as well as providing alternative or complementary methods and food sources. Some important sources of nutrition will be listed.

Phosphorus

Phosphorus is an important component of the internal skeleton of fish, with more than one-third found in phospholipids, nucleic acids, cell membranes, and energy-rich compounds [19]. Although fish have the ability to absorb minerals from water [20], food is the main source of phosphorus due to its low concentration in salt and fresh water. Analyzes have shown that the minimum amount of phosphorus for optimal growth of this species of fish is 7.4 grams per kilogram of body mass [21]

Protein

Knowing the amount of protein needed is a necessity for formulating balanced diets. So far, only a few studies have been performed on Chinese suckling infants. Information [22,23] about the protein required in the diet of this fish is scarce. According to a study, about 460 grams per kilogram of body weight of protein fish in a diet Food can be the optimal level for the maximum growth of M. asiaticus [24]. In general, one of the main components of fish mixed foods is fish meal or fish meal, although recently the price of fish meal has increased sharply with a decrease in resources [25-28]. Therefore, the need to look for sustainable alternatives is felt. For decades, aquatic nutritionists have evaluated plant protein sources to replace some or all of fishmeal [29-32]. One of these alternatives is Soybean meal (SBM). According to research, fermented soybean meal (FSBM) is a plant protein suitable for replacing up to 35% of the protein in fish diet without significant adverse effects on growth, survival, FCR, PER and body composition [33].

Vitamin C

Vitamin C, also known as L-ascorbic acid, is a powerful reducing agent that facilitates iron absorption [34]. Vitamin C is also a cofactor in the hydroxylation of proline and lysine to hydroxyproline and hydroxy-lysine [35]. Research has shown that growth factors for nutritional survival and nutritional productivity are improved by adding vitamin C to food at a maximum of 2.125 mg per kilogram of fish body weight. Also, the minimum amount of vitamin C for optimal growth of M. asiaticus is 84.6 g/kg body weight of fish [36].

Conclusion

The importance and danger of this species makes it a species of interest. The importance of nutrition and disease prevention and policy for the population of this fish is well known. It is also noteworthy that this fish is a creature to follow the evolutionary path.

References

  1. Nelson EM (1976) Some notes on the Chinese sucker. Copeia 3: 594-595.
  2. Wang S, Yue PQ, Chen YY (1998) China red data book of endangered animals: pisces. Science Press, Beijing, China. 247. [In Chinese].
  3. Zhang CG, Zhao YH, Kang JG (2000) A discussion on Resources status of Myxocyprinus asiaticus (Bleeker) and their Conservation and the recovery. Natl. Resour 2: 155-159.
  4. Zhang, C. 2007. Microstructures of the liver and the gall Bladder of Myxocyprinus asiaticus. Journal of South-West University 29: 134-139.
  5. Sattari M (2008) Ichthyology (2).
  6. Chen Z (2005) the biological characteristic and breeding Technology of Chinese sucker, Myxocyprinus asiaticus. Fishery Guide to be Rich 22: 44-46 (in Chinese)
  7. Gao Z, Li Y, Wang W (2008) Threatened fishes of the world: Myxocyprinus asiaticus Bleeker 1864(Catostomidae). Environmental Biology of Fishes 83 345-346.
  8. Yalsuyi AM, Vajargah MF (2017) Recent advance on aspect of fisheries: A review. Journal of Coastal Life Medicine 5: 141-148.
  9. Robertsen B (1999) Modulation of the non-specific defence of fish by structurally Conserved microbial polymers. Fish Shellfish Immunol 9: 269-290.
  10. Zhang G, Gong S, Yu D, Yuan H (2009) Propolis and Herba Epidemii extarcts enhance the non-specific immune response and disease resistance of Chinese sucker, Myxocyprinus asiaticus. Fish Shellfish Immunol 26: 467-472. [crossref]
  11. Song Z, He C, Fu Z, Shen D (2008) Otolith thermal marking in larval Chinese sucker, Myxocyprinus asiaticus. Environmental Biology of Fishes 82: 1-7.
  12. Chunlin H, Zidong F, Danzhou S, B Y,Song Z (2009) Effects of tempreture, starvation and photoperiod on otolith increments in larval Chinese sucker, Myxocyprinus asiaticus. Environmental biology of fishes 84: 159-171.
  13. Miller RR (1959) 0rigin and affinities of the fresh Water fish fauna of western North America. 187-222 in C. L. Hubbs, ed. Zoogeography. Ameri- Can Assoc. For the Advancement of Science.
  14. Beamish RJ, Tsuyuki H (2011) A biochemical And cytological study of the longnose sucker (Calostomus calostomus) and large and dwarf forms of the white sucker. J Fish Res Bd Can 28: 1745-1748.
  15. Uyeno T, Smith GR (1972) Tetraploid origin of the karyotype of catostomid Gshes. Science 175: 644-646. [crossref]
  16. Ueno K, Nagase A, Yun-Juan Ye (1988) Tetraploid Origin of the Karyotype of the Asian sucker, Myxocyprinus asiaticus. Japanese Journal of Ichthyology 34: 512-514.
  17. Yuan YC, Gong SY, Yang HJ, Lin YC, Yu DH, et al. (2011) Effects of supplementation of crstalline or coated lysine and/or methionine on growth performance and feed utilization of the Chinese sucker, Myxocyprinus asiaticus. Aquaculture 316: 31-36.
  18. Yuan YC, Gong SY, Yang HJ, Lin YC, Yu DH, et al. (2010) Apparent digestibility of selected feed ingredients for Chinese sucker, Myxocyprinus asiaticus. Aquaculture 306: 238-243.
  19. Vajargah MF (2021) A Review on the Effects of Heavy Metals on Aquatic Animals. J Biomed Res Environ Sci 2: 865-869.
  20. Vajargah MF, Sattari M, Namin JI, Bibak M (2021) Predicting the Trace Element Levels in Caspian Kutum (Rutilus kutum) from south of the Caspian Sea Based on Locality, Season and Fish Tissue. Biological Trace Element Research 200: 354-363.
  21. Yuan YC, Yang HJ, Gong SY, Luo Z, Yu DH, et al. (2011) Dietary phosphorus requirement of juvenile Chinese sucker, Myxocyprinus asiaticus. Aquaculture Nutrition 17: 159-169.
  22. Wan Q, Lai NY, Liu YB, Shen BP, Sun WX, et al. (2006) Study on intensive cultivation of Myxocynricus asiaticus fingerling fed with mixed feed. Anhui Agri. Sci 18: 4605-4606.
  23. Sattari M, Bibak M, Bakhshalizadeh S, Forouhar Vajargah M (2020) Element accumulations in liver and kidney tissues of some bony fish species in the Southwest Caspian Sea. Journal of Cell and Molecular Research 12: 33-40.
  24. Zhang G, Gong S, Yuan Y, Chu Z, Yuan H (2009) Dietary protein reqirement for juvenile Chinese sucker (Myxocyprinus asiaticus). Journal of Applied Ichthyology 25: 715-718.
  25. Forouhar Vajargah M, Imanpoor MR, Shabani A, Hedayati A, Faggio C (2019) Effect of long‐term exposure of silver nanoparticles on growth indices, hematological and biochemical parameters and gonad histology of male goldfish (Carassius auratus gibelio). Microscopy research and technique 82: 1224-1230. [crossref]
  26. Forster IP, Dominy W, Smiley S, Bechtel P, Hardy R, et al. (2004) Recent advances in utilization of fish by-prod-Ucts in aquaculture feeds. Abstracts Book. Aquaculture 1–5 Honolulu, Hawaii, USA.
  27. Samocha T, Davis DA, Saoud IP, DeBault K (2004) Sub-Stitution of fish meal by co-extruded soybean poultry by-product Meal in practical diets for the Pacific white shrimp, Litopenaeus Vannamei. Aquaculture 231: 197-203.
  28. Kristofersson D, Anderson JL (2006) is there a relationship between fisheries and farming Interdependence of fisheries, ani-mal production and aquaculture. Marine Policy 30: 721-725.
  29. Vajargah MF, Yalsuyi AM, Hedayati A (2018) Effects of dietary Kemin multi-enzyme on survival rate of common carp (Cyprinus carpio) exposed to abamectin. Iranian J of Marine Sciences 17: 564-572.
  30. Montajami S, Vajargah MF, Hajiahmadyan M, Zarandeh HAS, Mirzaie FS, et al. (2012) ASSESSMENT OF THE EFFECTS OF FEEDING FREQUENCY ON GROWTH PERFORMANCE AND SURVIVAL RATE OF TEXAS CICHLID LARVAE (CYANOGUTTATUS HERICHTHYS). J of Fisheries International 7: 51-54.
  31. Hajiahmadian M, Vajargah MF, Farsani HG, Chorchi MM (2012) Effect of Spirulina platensis meal as feed additive on growth performance and survival rate in golden barb fish, Punius gelius (Hamilton, 1822). Journal of Fisheries International 7: 61-64.
  32. Montajami S, Hajiahmadyan M, Forouhar Vajargah M, Hosseini Zarandeh AS, Shirood Mirzaie F, et al. (2012) Effect of symbiotic (Biomin imbo) on growth performance and survival rate of Texas cichlid (Herichthys cyanoguttatus) larvae. Global Veterinaria 9: 358-361.
  33. Yuan YC, Lin YC, Yang HJ, Gong Y, Gong SY, et al. (2012) Evaluation of fermented soybean meal in the practical diets for juvenile Chinese sucke, Myxocyprinus asiaticus. Aquaculture Nutrition 19: 74-83.
  34. Hsu T, Shiau S (1998) Comparison of vitamin C require-Ment for maximum growth of grass shrimp, Penaeus mon-Odon, with L-ascorbyl-2-monophosphate-Na and L-ascorbyl-2-monophosphate-Mg. Aquaculture 163: 203-213.
  35. Sandell LJ, Daniel JC (1988) Effects of ascorbic acid on collagen mRNA levels in short term chondrocyte Cultures. Connective Tissue Research 17: 11-22. [crossref]
  36. Feng Huang, Fan Wu, Song Zhang, Ming Jiang, Wei Liu, et al. (2015) Dietary Vitamin C requirement of juvenile Chinese sucker, Myxocyprinus asiaticus. Aquaculture research 163: 203-213.

A Breast Pump with a Compression Component is the Breast Pump of the Future

DOI: 10.31038/IGOJ.2021441

Introduction

Breastfeeding, due to its nutritional and immunological aspects, is the best source of food for the newborn [1]. In situation where is not possible to breastfeed a baby, for example, where the mother has returned to work or is otherwise temporarily separated from her baby, it is necessary for her to express breast milk for storage period of separation using a breast pump. Also, if an infant is unable to effectively draw out the milk, for example, due to premature birth, illness, or underdeveloped nursing reflex, it may be necessary to express the milk from the mother’s breast using a breast pump [2]. To achieve lactation success before a baby’s suckling can ensure the effective extraction of milk, breast pumps must meet specific physiological and mechanical requirements. In particular, breast pumps:1) must effectively stimulate the mechanoreceptors in areola to promote maternal secretion and milk-ejection reflex, 2) must effectively remove milk from the breast, at the same time, pumping should not be painful or lead to damage to the nipples and areola 3) should remove high quality milk.

It should be noted here that milk excretion by the baby is studied in detail [1,3-5]. It is shown that the baby, creating a pulsating vacuum in the mouth, additionally performs mechanical compression of the areolar region of the breast with gums and tongue. However, during the operation of the vacuum breast pump, these mechanical effects on the nipple-areolar region of the mammary gland are not used, and until recently there was no experimental data on the role of such compression in the process of milk excretion. Based on the assumption that the mechanical compression plays an important role in the milk excretion process, a breast pump has been developed that performs mechanical squeezing of the areolar region during milk excretion, along with exposure to pulsed vacuum (the device was called “Lactopuls”). Currently, a number of important advantages of the Lactopuls apparatus over modern vacuum breast pumps have been proved. These data are presented in this article.

Materials and Methods

Thirty lactating women 25-34 years old, 5-8 weeks lactation who volunteered to be included in this study were examined. Six of them were primiparous breastfeeding mothers and three were multiparous mothers. All infants were born in term. The informed consent of the women was obtained according to the Declaration of Helsinki.

Breast Pump with Compression Stimuli

Just like vacuum electric breast pumps, the breast pump “Lactopuls” consists of a control unit with a compressor and a removable funnel-shaped cup that is placed on the breast of a woman. Schematically, the removable funnel-shaped cup is shown in Figure 1A. It consists of conical and cylindrical part (3). However, unlike vacuum breast pumps, the cup is made an elastic material, such as silicone rubber. The cone part is placed on the breast (1). On two opposite external sides, rigid plates (4) are contact with the elastic cone, which are fixed at the front ends of the levers (5). The rear parts of the levers are connected to the movable membranes (9) of the pneumatic piston (8), to which excessive pressure pulse are supplied from control unit through the pneumatic hoses (10). The pneumatic piston is placed in the rigid body (7), to which a cylindrical part of the cup is attached on the outside on special movable ledge (6). The pump works as follows. Vacuum and compression (overpressure) stimuli are applied in certain sequence to the removable funnel-shaped cup from the control unit. Just as when milk is excreted by a child, at the beginning a vacuum acts on the mammary gland, which enters the cup via a pneumatic hose and the areola of the breast (2) begins to stretch, stimulating the skin stretching receptors. At the same time, under influence vacuum, milk begins to flow out of the ducts. After the same amount vacuum inside the elastic cone tube reaches the maximum value, positive pressure stimuli are applied to the piston. The movement of the piston membrane is transmitted to the levers (Figure 1B), and the rigid plates compress the conical part cup and areola, area where milk located. It is important to note here, that just as a child, the amplitude of compression and vacuum stimuli can independently regulate.

fig 1

Figure 1: Action of the compression and vacuum component in the milk breast pump.
A. Positive pressure pulse is not turned on. B. Positive pressure pulse is on.
1- mammary gland, 2- breast areola, 3-elastic cone, 4- rigid plates, 5- levers, 6- movable ledge, 7-solid body, 8- pneumatic pistons, 9- pneumatic pistons membranes, 10- pneumatic hose.

Recording the Intraglandular Pressure

In 11 women, the intraglandular pressure was recorded during expressing in the breast not being expressed. The breast was washed with anticeptic solution and one of the ducts was dilated with a special duct dilator. A metallic catheter with an outside diameter 0.5mm was introduced into the duct as far as 2 cm approximately. The catheter was connected to the pressure gauge by means of polyethylene tube 0.7mm in diameter. Before measuring, the whole system was filled with sterile saline (0.9% NaCl) solution. The electric signal from the pressure gauge was conveyed to the amplifier and then to polygraph H-338 (Russia).

Milk Analysis of Macronutrients

Milk analysis of macronutrients (fat, proteins, carbohydrates) and energy value in the samples was performed 1-1.5 hours after milk ejection with a mid-infrared human analyzer Miris AB Uppsala, Sweden.

Statistical Analуsis

Student s t-test was used for statistical analysis. In milk analysis experiments statistical analуsis was performed using test two-way ANOVA. Large differences in nutrient concentrations in milk were found in women. Therefore, data for each woman were normalized relative to the concentration value of the first sample ejected from the breast by vacuum stimuli. Statistical significance was set as p<0.05

Results

Breast Pumps with Compression Component Effectively Stimulate the Mechanoreceptors in Areola to Promote Maternal Milk-ejection Reflex

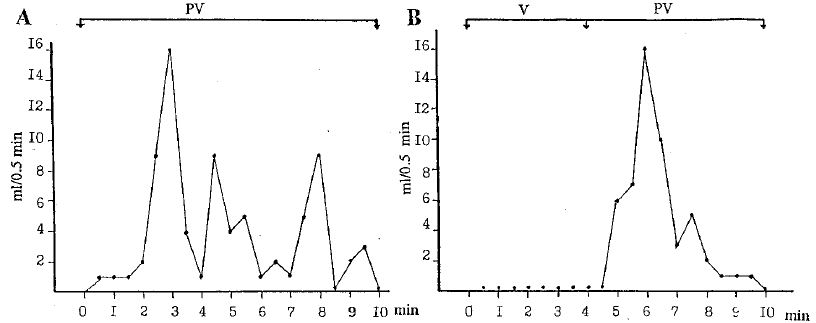
The normal functioning of the breast pump «Lactopuls» that is when vacuum and compression stimuli are applied to the nipple and areola resulted in milk flow in all the women. This could be clearly observed. Once the funnel attachment of the breast pump was applied to the breast milk began drip from the other breast after 0.5-1 min. Where the other breast was catheterized, an increase in intraglandular pressure occurred (Figure 2A). It should be noted that throughout the experiment visual observation revealed the pulsed character of milk removal in women. The periods of the absence of milk removal could be as long as 0.5-1 min. Yet graphically the pulsed character of milk removal was evident only when recording the milk volume with intervals of less than 1 min (Figure 2B). It was thought interesting to compare the pulsatory character of milk removal with intraglandular pressure. On comparing the graph Figure 2A and 2B it can be seen that the maximum milk removal rate coincides with the intraglandular pressure. Switching off the compression stimuli changed the dynamics of milk expression. The influence on milk removal of switching off the compression stimuli in women, who had difficulty expressing breast milk manually, was especially noticeable. The data from one woman presented in Figure 3 serves as an example. In the normal mode of the breast pump, that is when vacuum and compression stimuli are applied to the nipple and areola, the first peak of milk removal was reached in approximately 1.5 min. During expression 6 peaks of milk flow were recorded in one woman (Figure 3A). When the compression stimuli were switched off milk did not appear for 4 min (Figure 3B(V)).When compression was again switched on milk removal began in 0.5 min (Figure 3B(PV)), the maximum rate of the first peak reached 16 ml/ 0.5 min, as it had been in the first case (Figure 3A).

fig 2

Figure 2: The change in intramammary pressure (A) and the rate of milk removal (B) Pressure in mm Hg, time in min.

fig 3

Figure 3: The change in volume of milk removed under different operating conditions of the breast pump. For A and B, the rate of milk removal ml/ 0.5 min; time in min. In each graph the horizontal line shows the period of milk removal by means of the breast pump. PV, breast pump action in normal mode with both compression and vacuum stimuli; V, breast pump action with compression stimuli switched off (vacuum only).

Compression stimuli increase the efficacy of the breast pump which is not only due to the effective formation milk ejection reflex, but also directly to an additional squeezing the milk from the breast. At the same time, breast pump does not cause pain and does not damage the nipple and the areola of the breast.

Mechanical stimulation of mechanoreceptors of the areola releases oxytocin from the central nervous system into the bloodstream, which produces periodic increases in the intraductal mammary pressure. These serve to increase the rate of milk ejection (Figure 2). Evidently it is difficult to comparatively evaluate the effects of vacuum and vacuum–compression stimuli in milk ejection. We work out the method that allows us to reveal the difference in volume of milk expressed by applying purely vacuum and by applying vacuum-compression stimuli in relation to changes in intraductal pressure. This method will allow us to assess how the compressive force imposed on the mammary glands directly correlates with the volume of expressed milk.

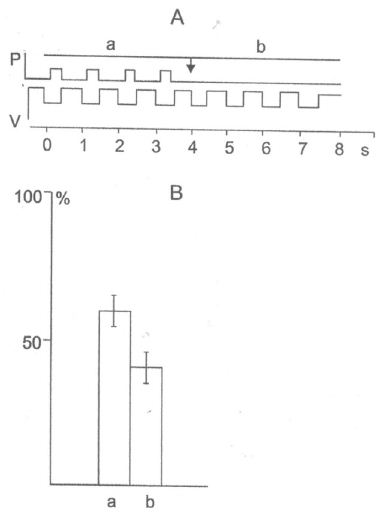
According to the method, the nipple and areola were alternately affected by short (4s) series of 0.5 s vacuum stimuli with compression pulse of 0.27 s. The amplitude of the vacuum pulses was within -120 and -140 mm Hg, i.e. less than the maximum comfortable vacuum amplitude of -191,3 ± 6,5 mm Hg [6]. Accordingly, the milk ejected to various milk collectors: (a) when pumping together with vacuum and compression stimuli and (b) when pumping only with vacuum stimuli (Figure 4A).

When pumping milk alternatively with vacuum pulses and vacuum with compression pulse, the volume of milk expressed together with the help of vacuum and compression exceeded the amount of milk expressed single vacuum. However, the difference in volume varied in different patients in the range of 10%-46%. On average , as follows from histograms (Figure 4B), the amount milk of expressed by one vacuum was 40.5±5%, and the vacuum with compression stimuli was 59,5±5%.

fig 4

Figure 4: Influence of compression components on the amount milk removal.
A. Scheme of effects of vacuum and compressive stimuli on the mammary gland. (a) Simultaneous action of vacuum and compression stimuli, the milk enters the milk collectors (a); (b) action of vacuum stimuli, milk enters the milk collector (b). Ordinate, P (positive pressure), V (vacuum); abscissa, time (s). (B) The amount of milk as a percentage of the total volume of milk removal together by means of vacuum and compression pulses and by means of vacuum only (B). The ordinate: the amount of milk as percentage.

In addition, according to Figure 5B, the volume of expressed milk equals40.5-1.03% at vacuum milking and 59.5-1.07% at vacuum–compression milking. In this series of experiments, we additionally conducted comparative experiments on the expression milk of breast pump “Lactopuls” and one of the best vacuum breast pump Medela Symphony. It was found that the average values of the volume milk expressed with “Lactopuls” were 14% higher, than volume of milk expressed with «Medela Symphony».

Milk ejection with vacuum and compression stimulus in breast pump increases amount of fat and protein in breast milk.

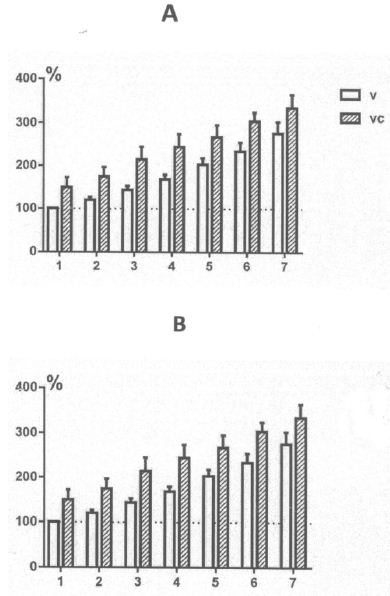
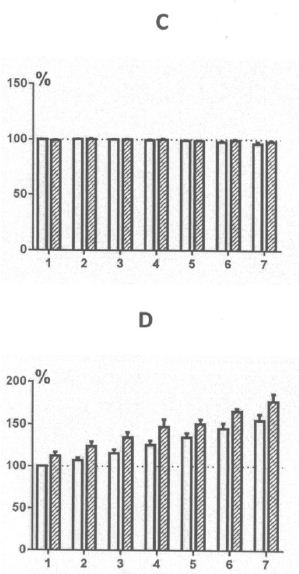
During observations among women, marked variations were found in the amount of milk ejected and in the concentration of milk nutrients studied. At the same time, the dynamics of nutrient concentrations in the process of milk ejection did not depend on the mode of operation of the apparatus and was similar for all women. Figure 5А shows graphs of changes in fat concentrations as well as the protein of milk (B) in 10 ml samples during the ejection milk during the whole session of milk ejection. The largest changes in milk samples were observed in fat concentration (Figure 5A). The fat content in milk increased in each subsequent sample and in the latter samples exceed its content in the initial samples by 2-3,5 times. The total amount of ejected fat was about 25% more when milk ejected by vacuum with compression, than when milk ejected only by vacuum. When determining the protein concentration in milk samples, an increase in its concentration was also found during milk ejection, but on 10-20% (Figure 5B). The increase in protein concentration occurred evenly during the entire ejection time. In contrast to the dynamics of fat and protein concentrations, the concentration of carbohydrates did not change in all women during of the milk ejection (Figure 5C).

The energy of milk is determined by the content of fat, protein, carbohydrates. It is easy to note that the graphs of changes in the energy value of milk (Figure 5D) have a great resemblance to the graphs of changes in the fat content of milk (Figure 5A).

fig 5(1)

fig 5(2)

Figure 5: Change in the amount fat (A), protein (B), carbohydrates (C), and energy value (D) in woman in samples throughout the milk ejection session.

Discussion

Рresented experimental material shows that breast pump with compression component more effectively removes milk, and the quality of milk is also higher than milk extracted using vacuum. It can be assumed that one of the main reasons is the effective stimulation of the milk ejection reflex in a woman due to more adequate stimulation of the areola mechanoreceptors and, accordingly, an increase in oxytocin output [1]. An increase in the concentration of oxytocin will cause a more intensive сontraction of the myoepithelial cells of the alveoli, which will “squeeze” more milk from the alveoli, including more caloric, i.e. with an increased fat and protein content, “hind milk”. In addition to increasing the rate of milk excretion by increasing the pressure of milk in the ductal system of the gland (Figures 2 and 3) compression stimuli increase milk volume by compressing the expanded sections of the milk: “milk sinuses” located in the area of the areola mammary gland.

Observation during pumping indicate that the difference in the volume of expressed milk depend on anatomical characteristics of the breast. According to ultrasound studies, 6-14 milks ducts are suitable for the nipple, which at a distance of 8-9 mm from the base of the nipple have a maximum diameter of 1-5 mm (“milk sinuses”) [7]. However, when the milk ducts pass into the milk ducts of the nipple, they narrow by five to ten times [8]. Moreover, the diameter of the milk ducts along the length of the nipple varies. So, when approaching the tip of the nipple (1mm from the tip), the diameter of the ducts is the smallest and about 0.1mm. To the outlet, the ducts in most cases expand in the form of funnel with an increase in diameter by 1,5-3 times. When moving deep into the nipple (3.5-4mm from the tip) in different women, the diameter of the ducts increases and reaches 0.4-0.8 mm. Then the diameter decreases again to an average of 0.4mm [9,10]. Since the resistance to the movement of liquid in the tube is inversely proportional to the area of its cross-section, nipples with thin milk ducts will inhibit the output of milk to a greater extent, and in this case, the mammary glands are classified as “tight”. In addition, in the first 4 days after birth, when colostrum is present in the ductal system, the viscosity of which is higher than that of transitional and mature milk, difficulties with milk excretion are aggravated. To overcome the “tightness” of the gland, it is necessary to increase the pressure difference between the environment and the milk inside the milk ducts, for example, to increase the vacuum. However, as clinical studies have shown, high vacuum causes pain in the nipple, which inhibits the formation of the milk ejection reflex and consequently slows down the milk output. The child gets out of position by adding compression impulses to the vacuum stimuli so that the overall pressure difference between the environment and the milk inside the milk ducts increases markedly. In particular, when removing milk, the child can create a maximum vacuum of 197±10 mm Hg. The maximum amplitude of the compression pulses could reach 70 mm Hg. Thus, when added together, the total pressure difference will be about 270 mm Hg, which will significantly increase the efficiency of removing milk from the “tight” gland. At the same time, the woman will not experience discomfort, since when the child creates vacuum and compression stimuli, the values of vacuum and compression for the woman will be comfortable. The combination of vacuum and compression stimuli in the executive mechanism of the pump was also effective. Surveys have shown that compression stimuli against the background of vacuum stimuli -120, -140 mmHg can increase the output of milk from the gland by 46%. Compression stimuli made a particularly noticeable contribution when pumping “tight” mammary glands and mammary glands in the first days of lactation filled with colostrum. Here it is interesting to note the results of surveys of Morton J [11]. In this work, against the background of sucking milk using a Medela Symphony breast pump, the fingers were additionally compressed in the area of the breast in front of the edge of the hard cup. As a result of the combination of vacuum and compression, the amount of milk produced increased significantly (up to 48%). This method was especially effective when removing colostrum from the gland.

However, in the case of equal volume of milk expressed by vacuum and vacuum with compression pulses, examinations showed that the patient’s breast was very “light”. Through the transparent cover, it was clearly visible that the milk began to be released from the breast in trickles already under the influence of a vacuum of 60-70 mm Hg, i.e. half the established amount. Moreover, the milk as a result of the reflex of milk excretion began to drip quite intensively from the neighboring breast. In this case, the milk ducts in the nipple probably had a maximum diameter (0.6-0.8 mm) and a vacuum stimulus, before the compressing stimulus took effect, removed most of the milk. In this regard, it is interesting to note the results of a study of the process of removing milk from bottles, the nipples of which have holes for the exit of milk of different diameters (Eishima, 1991). It was discovered that the child had the greatest compressive effect tongue and gums on the nipples without holes or nipples with a very small diameter exit hole, which when you turn the bottle in vertical position water is dripping at a speed of 0.04 ml/h. If the whole diameter was increased so that water dripped at a rate of 0.1ml/sec, the nipple compression was significantly weakened.

Here it should also be noted that when the milk was removed by a breast pump with a compression component, there was no compaction and puffiness of the areolar area of the breast. Massage of the areola with compressive stimuli as the milk is withdrawn, as well as in the case of milk withdrawal by a child, did not allow for compaction and puffiness of the areola. Therefore, the use of the breast pump in clinical practice with a compression component was effective in eliminating postpartum breast engorgement, as well as in the case of elimination of edema in lactostases. Thus, the use of milk-removing devices and especially devices with a compression component is an effective non-drug means of increasing the productivity of lactating women and increasing their lactation period.

References

  1. Alekseev NP (2019) Physiology of human female lactation. Springer
  2. Fewtrell MS, Lucas P, Collier S, Singhal A, Ahluwalia JS, et al. (2001) Randomized trial comparing the efficacy of a novel manual breast pump with a standard electric breast pump in mothers who delivered preterm infants. Pediatrics 107: 1291-1297. [crossref]
  3. Ardran GM, Kemp FH, Lind J (1958) A сineradiographic study of breast feeding. Br J Radiol 31: 156-162. [crossref]
  4. Mizuno K, Ueda A (2001) Development of sucking behavior in infants with Down’s syndrome. Acta Paediatr 90: 1384-1388. [crossref]
  5. Elad D, Kozlovsky P, Blum O, Laine AF, Po MJ, et al. (2014) Biomechanics of milk extraction during breast-feeding. Proc Natl Acad Sci USA 111: 5230-5235. [crossref]
  6. Mitoulas LR, Lai CT, Gurrin LC, Larsson M, Hartmann PE (2002) Effect of vacuum profile on breast milk expression using an electric breast pump. J Hum Lact 18: 353-360. [crossref]
  7. Prime DK, Geddes DT, Spatz DL, Robert M, Trengove NJ, et al. (2009) Using milk flow rate to investigate milk ejection in the left and right breasts during simultaneous breast expression in women. Int Breastfeed J 4: 1-10. [crossref]
  8. Ramsay DT, Kent JC, Hartmann RA, Hartmann PE (2005) Anatomy of the lactating human breast redefined with ultrasound imaging. J Anat 206: 525-534. [crossref]
  9. Going JJ, Mohun TJ (2006) Human breast duct anatomy, the ‘sick lobe’ hypothesis and intraductal approaches to breast cancer. Breast Cancer Res Treat 97: 285-289. [crossref]
  10. Rusby JE, Brachtel EF, Michaelson JS, Koerner FC, Smith BL (2007). Breast duct anatomy in the human nipple: three-dimensional patterns and clinical implications. Breast Cancer Res Treat 106: 171-179. [crossref]
  11. Morton J, Hall JY, Wong RJ, Thairu L, Benitz WE, et al. (2009) Combining hand techniques with electric pumping increases milk production in mothers of preterm infants. J Perinatol 29: 757-764. [crossref]

Phoenix Tree, Phoenix and Empress: Empress Historical-Cultural Symbol of Phoenix Tree and its Good Environmental Civilized Value

DOI: 10.31038/AFS.2021342

Abstract

This paper is intended to analyze the interrelation, mutual influence and integration of phoenix tree, phoenix and empress in ecological and cultural terms. The study indicates the historical-cultural symbolical meaning of Empress Wu of phoenix tree, and the ecological value. Empress Wu is the incarnation of dragon, rebirth of Maitreya Buddha with godship. From aspect of theology, phoenix stays at phoenix tree that is a myth by means of phoenix tree; phoenix and dragon keep abreast, phoenix represents outstanding woman, and Empress Wu is the incarnation of phoenix (super holy bird). Phoenix liked to stay on phoenix tree (super sacred tree), therefore, phoenix tree represents the body of empress. In Buddhism, phoenix tree’s imagery being the sacred tree of Chinese Buddhism is its feature, which is formed when the tree is cultivated in religious temple. Empress Wu is a human with humanity. In forest culture, imagery of phoenix tree is of aesthetic culture which represents pure love subjective intention by means of phoenix tree in gardens planting of past dynasties and composition of poetry. Love imagery of phoenix tree and phoenix symbolizes human emotion of Empress Wu. Lofty imagery of phoenix tree symbolizes the only one empress in China. That falling leaves of phoenix tree shows autumn comes symbolized Empress Wu lost her Kingship and became queen for the rest of her life. Aesthetic cultural connotation, consisting of nobleness and hope of phoenix and misery and sad of phoenix tree, symbolized people’s comment to Empress Wu in the past one thousand and three hundred years. Ecological value of phoenix imagery: nine holy birds which perch at bronze divine trees of Sanxingdui, and Sunbird of the Jinsha Site gives an impression that golden bird carries the sun to soar in the universe; in human’s mental concept, phoenix tree symbolizes habitat for humanity of ecological civilization, and phoenix symbolizes human’s dream of flying. Phoenix likes to stay on phoenix tree, which symbolizes harmonious civilization of human and human’s earnest hope for good life.

Keywords

Phoenix tree; Phoenix; Sacred tree of Chinese Buddhism; Empress culture

Phoenix tree and phoenix culture are well-known in China. It is of profound practical significance to associate the phoenix tree and phoenix with Empress Wu, the only empress in Chinese history, and thus to study the empress culture. The composite image of phoenix tree and phoenix contains Empress Wu’s divinity, emperor and female humanity as a “the incarnation of dragon” and “rebirth of Maitreya Buddha with godship”, full of mystery, solemnity, humanity and historical and cultural sense. Phoenix tree and phoenix culture and the empress culture are integrated with each other, so that the phoenix tree blends into people’s subjective sentiments and aesthetic ideals of Empress Wu [1], and becomes an aesthetic image to examine the empress culture.

Phoenix Tree, Phoenix and the Empress

The Phoenix Tree

The phoenix tree, also known as Qingtong, Chinese phoenix tree, Biwu, Qingyu, and Tingwu, belongs to the deciduous tree of the Sycamonaceae family. “The fertile soil is suitable for planting phoenix trees.” Phoenix trees have long become garden ornamental trees and important greening trees in China. They are suitable for lawns, courtyards, front houses, slopes, roadsides, solitary planting around lakes or cluster planting. The phoenix tree, collocated with palm, bamboo, plantain, etc. could convey a sense of harmony. “A tranquil house may have phoenix trees planted in the front, and green bamboos at the back. The front eave provides space to take a leisure walk under it. Covert windows are set in the north, which are closed in spring and winter to protect the room from wind and rain. While in summer and autumn, they are opened to get the room ventilated. Planting phoenix trees is full of joy: in spring and winter, sunlight fall through the sparse branches, bathing the people sitting against the trunk in the warmth, while in summer and autumn, the dense branches form a canopy for people to seek shade from the scorching sun.” [2] There are extremely abundant scientific culture and poetry creations about the phoenix tree, forming a unique phoenix tree culture [3].

The Phoenix

The oldest phoenix pattern found in China has a history of 7,400 years. Dragon and Phoenix are the two totem systems of the Chinese nation. The ancients used an animal, a plant, or a creature in the nature as a symbol to represent the lineage of a clan or group, and respected it as a patron to worship. Such a symbol is called a “totem”. The phoenix is a totem image evolved from the patron imagined by the ancients. It is said that the Shang tribe among the descendants of the Yellow Emperor used to be the bird totem tribe, and this bird was called the “Phoenix Bird”. The Book of Songs · Song of Shang · Xuan Niao says, “The emperor ordered Xuan Niao (another name of phoenix in ancient times) to come to the world and give birth to Qi, who later established the Shang Dynasty.” The ancestor of the Shang Dynasty, Qi, was born by Xuan Niao, who later established a powerful Shang Dynasty. Xuan Niao is the Phoenix. From the bronzes unearthed in the Shang and Zhou dynasties, we can see the carved phoenix pattern. “The singing phoenix in Qishan mountain heralds a prosperous era of Zhou” “Blowing flute to attract the phoenix.” So the phoenix bird became the holy bird that blessed the people of Zhou. The allusion of “the phoenix sings in Qishan mountain” made the phoenix a symbol of Zhou’s prosperity. This is why there are a lot of phoenix patterns in the bronzes of the Western Zhou Dynasty. There is a sentence in The Book of Songs · Daya, “The phoenix flies to the sky in the wind…The phoenix sings on the high hills, heralding auspiciousness.” It also talks about the allusion about “the phoenix sings in Qishan mountain”. Therefore, in the Western Zhou Dynasty, the phoenix was regarded as a mystical mascot. Later, as the tribes united or annexed each other, various totems were compounded for many times, thereby resulting in totems with strange images such as dragons and phoenixes. The phoenix and the dragon are always inseparable till today. The holy bird, phoenix, is beautiful, auspicious, kind, peaceful, virtuous, and blessing of the nature. For Chinese, worshiping phoenixes is a strong national complex in that the phoenix is a symbol of nobility and dignity.

As the incarnation of the royal woman’s mascot, “Phoenix” was first seen in an allusion. According to the legend, when Yao abdicated to Shun, and Shun abdicated to Yu, all of people celebrated and all the beasts also came to congratulate, including the phoenix. The “Dragon and Phoenix Pattern” painted pottery flask was unearthed at the Yangshao Cultural Site in Beishouling, Baoji, Shaanxi. This shows that both the dragon and the phoenix originated in the Neolithic period, which is seven to eight thousand years ago. The phoenix and the dragon have gradually become a pair in the legend, and they complement each other. The dragon has many changes while the phoenix has good virtues. From the Neolithic Age to the Spring and Autumn and the Warring States Periods when the theory of Yin and Yang and the Five Elements (metal, wood, water, fire and earth, held by the ancients to compose the physical universe) was popular, the phoenix almost appeared as something “yang”. While in the early stages of its formation, the dragon is basically something “yin”. The combination of dragon and phoenix reflects the view of yin and yang of the ancients. During the Warring States Period, a group of patterns that the dragon and phoenix entangle appeared. Later, the dragon symbolized the sun, and the phoenix, which was originally divided into yin and yang, gradually became a representative of yin after being contrast with the dragon. The emperors call themselves dragons, the queens call themselves phoenixes. Throughout the ages, the queen’s appearance has been called “Feng Zi” and “Feng Yi”(that is the posture of phoenix); the crown worn by the queen is called “phoenix clothes with superb power”; the children born are called “the sons of the phoenix”; the edict issued by the queen is called “phoenix edict”; the cart used by the queen is called “fengche” or “fengnian”(that is the cart taken by the phoenix); the pavilion in the imperial palace is called “phoenix pavilion”; in the imperial room, the executive secretariat, which is the closest to the emperor’s central institution in charge of the imperial court, is called “phoenix pool”.

The Empress

Although Empress Wu is a woman, she took the throne successfully. For 1,380 years after her death, she has become the focus of attention and research by later generations. Just like the mausoleum with no inscription, there’re no definite conclusions for her whole life. Hence, a unique historical and cultural phenomenon of the empress was derived.

Empress Wu’s father, Wu Shiyue, run timber business, thereby the family of Wu gained fame and fortune. Later, Wu Shiyue got to know Li Yuan, and followed him closely with his whole heart. After the founding of the Tang Dynasty, he was named the founding earl, and rose to the official ranking of minister of the Ministry of Works [4,5]. Emperor Li Yuan designated Yang, the daughter of a prominent family in the Sui Dynasty, to marry Wu Shiyue. Later, Wu Shiyue was promoted to the governor of Lizhou (now Guangyuan, Sichuan). His wife, Yang, was pregnant with Empress Wu while boating on the Jiangtan Lake. Later, she gave birth to the baby in Lizhou [6]. Empress Wu’s nickname was Yuanhua and Meiniang. When she was born, “the golden phoenix came to congratulate.” Empress Wu entered the imperial palace at the age of 14 as a Cairen(a rank of ladies-in-waiting), and later became Zhaoyi(a kind of concubines of the emperor in ancient China), queen, empress dowager, and eventually became the emperor. She collected a treasure map in Luoshui River and claimed it as a gift given by the God, and described herself as the reincarnation of Maitreya Buddha in Mahamegha Sutra. Relying on the historical condition, specific marriage, and personal talents, Empress Wu wrote a glorious empress history. From the nomination of the queen in 655 AD, to 690 when she enthroned herself emperor, she audited politic affairs behind the curtain (historically known as two emperors in the imperial court) for 35 years. From 690 to 705 AD, Empress Wu changed the dynasty and enthroned herself emperor, ruling for 15 years. During her half-century rule, she was in charge of all over the country, maneuvered among various political groupings. She made the profound achievements that could be on a par with the rule of Zhenguan and lay a solid foundation for the prosperous rule of Kaiyuan [7,8].

The Historical and Cultural Symbol of the Empress of the Phoenix Tree

Phoenix Symbolizes Empress Wu

Phoenix Tree and the Phoenix

Firstly, legend has it that mankind has a dream of flying to the sky, the phoenix bird is the holy bird, and the bronze is the holy tree. The phoenix tree is regarded as a holy tree by the ancients. The bronze holy tree unearthed in Sanxingdui is a holy tree with compound characteristics. Its branches are divided into three layers, and there are 9 holy birds in it. It is just like the situation that “nine suns live on the branches below” (From the Book of Mountains and Seas). At the top of the bronze holy tree that was broken when it was unearthed, it is speculated that there should also be a holy bird symbolizing “a sun on the top branch” (The author believes that “the bronze” pronounces the same with the word “phoenix tree”, the holy bird living in the holy tree is exactly the symbol of the phoenix living in the phoenix tree.).

Secondly, the ancients used the woods of phoenix trees to make the musical instrument. The ancients believed that music was related to the wind and the wind (Feng in Chinese pronunciation) sounds like the word “phoenix” (feng in Chinese pronunciation). Hence, it is believed that the phoenix lives in the phoenix tree.

Thirdly, since the phoenix is a bird, it must be connected with the tree, that is, the phoenix tree. The image of the phoenix is a synthesis of several natural objects. The roc mentioned in ancient books is also a phoenix. The Book of Mountains and Seas says, “There is a bird, shaped like a chicken, with colorful feathers all over its body, and its name is Phoenix.”—The phoenix, the king of birds, governs the birds all over the world. The phoenix trees are luxuriant, densely shaded, and extremely tall, which have accumulated rich cultural connotations. The phoenix knows the rise and fall of a nation, boasts good virtues, and dwells exclusively on phoenix trees, thereby the phoenix trees are regarded as auspicious trees in the past dynasties. The well-off family in history often planted phoenix trees in their yards because the phoenix trees are not only vigorous, but also the symbol of auspiciousness. There is a saying in The Book of Songs that the phoenix tree grows luxuriantly, causing the phoenix to sing. During the Spring and Autumn period, King Wu, Fuchai, built a phoenix garden in the yard. “The phoenix garden is in the Wu Palace. It’s the old garden of King Wu, also named Qinchuan.”(A Wonder and Tangle Wood Tales, Liang Renfang). During the Warring States Period, in Zhuangzi · Waipian · Qiushui, there is “The phoenix sets off from the South Sea and flies to the North Sea. It only inhabits when it encounters phoenix trees. It only eats bamboo and only drinks sweet springs”, which reflects the phoenix does not live with the common birds, and shows the nobleness of the phoenix tree. The Zhou dynasty has been crowned the first place among the dynasties for it lasts 800 years. And the reason for that is also related to the phoenix tree. Shuyu is the younger brother of King Zhou Cheng. One day, Shuyu played with King Cheng. King Cheng cut a leaf of the phoenix tree into the shape of a Jade Tablet and said to Shuyu: “I will give you the seal of Jade Tablet.” Shuyu was happy and told this to Zhou Gong. …Therefore, King Zhou Cheng bestowed Jin as a fief to Shuyu (Springs and Autumns of Master Lü · Zhongyan) The ancient kings valued the phoenix tree, which was called the gentleman of the book. King Zhou Cheng planted the phoenix trees in the courtyard, and cut the leaf and bestowed a fief to his brother [9].

After observation, the author believes that phoenix living in the phoenix tree is a human association of the ecological pictogram of the phoenix tree. The phoenix tree belongs to the terminal panicle. In late June, flowers of phoenix trees appear in temples, royal palaces, parks, courtyards, roadsides, and jungles. They are calm and noble, indisputably beautiful. They are like phoenixes living in the top of the tree, or holy birds flying into the sky, with both spiritual charm and royal temperament, which makes people stunned and respectful. Perhaps this is the original ecological image of “Planting a phoenix tree and attracting the phoenix”!

Phoenix and the Empress

Empress Wu described herself as a phoenix, and was the incarnation of phoenix, so she enthroned herself emperor. There are also many images, myths and legends of Empress Wu as a phoenix. The memorials and cultural customs of later generations also regard her as a phoenix.

  1. From the analysis of natural geomantic omen in Lizhou where Empress Wu was born, the dragon is in the Wulong Mountain and phoenix is in the Phoenix Mountain, and both of them are auspicious. The author observes that the water of the Jialing River flows between the Wulong and Phoenix mountains, through the Wulong Lake, and then joins with the two waters of the Nanhe River. The whole view is just like the picture of Yin-Yang Fishes, which integrates the spirit of heaven and earth, and presents a magical golden triangle, namely the beautiful ancient city of Lizhou. When the phoenix flew out of here, it was named Phoenix Mountain.
  2. From the legend that Empress Wu was born “from the reincarnation of the phoenix”, this story was first spread in Empress Wu’s hometown, Lizhou (Guangyuan), and was included in writings by some literati after the Mid-Tang Dynasty. The following is about the legend: At that time, his parents and some people were having fun on the river boating. Suddenly, a dragon jumped into the sky from the Xishan Mountain, rushed straight to their boat, and flew around the ship and then flew to Chang’an. After that, Ms. Yang became pregnant. The legend has been passed down to today. After Li Shangyin, a poet of the late Tang Dynasty, came to Lizhou in 851 AD, he visited the place where Ms. Yang was pregnant and wrote the poem “Lizhou Jiangtan Lake” and noted that it was “the place where Ms. Yang was pregnant with Empress Wu”. The poem vividly depicts the scene of the dragon and man mingling and becoming pregnant with Empress Wu. Empress Wu was deeply affectionate with her hometown. So Wu’nu Mountain was changed into Wulong Mountain, and Jiangtan Lake into Wulong Lake.
  3. Yuan Tiangang made an astrology. Yuan Tiangang, a master of astrology, concluded that there would be the emperor of the new dynasty born in Langzhong. Therefore, he cut into the mountain at the dragon neck of Panlong Mountain where the image of the dragon was formed, so as to stop this omen. It is said that after the dragon neck was sawed off, the omen went to Guangyuan. In the early years of the Tang Dynasty, he went south from the capital of Chang’an to Shu (Sichuan), and arrived at Lizhou City on the day of Dragon Boat Festival. Suddenly, a dragon sprang from the depths of the river and flew towards the Xishan Mountain; at the same time, a phoenix sang on the top of the Dongshan Mountain, and then flew to the north. Yuan Tiangang said, “This is called the prosperity brought by the dragon and the phoenix, and there must be an important man born here.” In the first month of the next year, the wife of Governor Wu gave birth to a girl. Governor Wu asked Yuan Tiangang to look up the physiognomy for her. At that time, Empress Wu was wearing a boy’s costume and held by a wet nurse. After looking at her for a while, Yuan Tiangang exclaimed, “The center of the frontal bone shows some emperor’s temperament. Her eyes are similar to those of a dragon and the neck is like that of a phoenix, which is the look of the most distinguished person.” When he learned that it was a girl, he exclaimed and asserted, “This girl may become the ruler of the country!”
  4. Yuan Tiangang met a phoenix at Chaotian Pass. On the Double Ninth Festival, Yuan Tiangang saw a woman with a red ribbon fluttering around her transformed into a colorful phoenix surrounded by nine golden dragons, and the colorful phoenix changed into an emperor wearing a golden crown and holding an imperial jade seal. Astonished, Yuan Tiangang fallen off and shouted, “Your Majesty, Heaven’s order is hard to violate!” It turns out that it is Meiniang on the plank road. Decades later, Empress Wu enthroned herself on the Double Ninth Festival and changed the Tang Dynasty to Zhou Dynasty, and the reign title was “Tianshou”.
  5. The imagination of Empress Wu when she entered the imperial palace for the second time. When Empress Wu entered the palace for the second time, she seemed to see a colorful phoenix singing and there were other birds singing around the phoenix. So being the empress in the palace became her goal.
  6. Empress Wu’s calligraphy is “Feibai calligraphy with phoenix figure” [7]. She used to be “Wu Zhaoyi”. Her mother Yang’s Shun Mausoleum is called “Wangfengtai”, and its mausoleum is called “Wangfengtai Stele” in history.
  7. Empress Wu was the queen first, then the empress dowager, and finally took the throne. She referred to herself as the phoenix. The empress dowager met the petition team that supported her as the emperor in the gate tower. According to legend, something auspicious was observed. Someone saw a phoenix flying out of Mingtang and landing on the phoenix tree on the Suzhengtai (the supervisory agency in Tang Dynasty) of Shangyang Palace in Luoyang. Empress Wu hurriedly led the crowd to Mingtang and watched this scene. The phoenix flew southeast once it saw Empress Wu. But the rosefinches gathered in the hall, dancing for a long time and refused to leave…. Seeing this, a minister immediately knelt down, and explained to Empress Wu, “The phoenix symbolizes you, and these rosefinches just represent us. It flies to the Suzhengtai and leaves as soon as seeing you, which is to imply that you should be enthroned. If you still do not take the throne, it will go against the will of God, the rosefinches will not leave, and we will kneel down forever!” Finally, Empress Wu conformed to the so-called will of God. On September 9th, 690, Wearing the imperial robe, she boarded the Zetian Gate Tower and announced the start of the enthronement ceremony. Later, she ordered an amnesty for the country. And rosefinches flew away as expected [10-12]. The model that a phoenix controls nine dragons in Mingtang symbolizes her Wu Zhou regime, which is exactly the portrayal of Empress Wu.

Phoenix Tree and the Empress

Guangyuan is the birthplace of Empress Wu where verdant phoenix trees are widely planted. The phoenix tree contains Empress Wu’s nostalgia complex. 1,380 years ago, the story from Mrs. Yang’s “Being Pregnant on the Jiangtan Lake” to “Golden Phoenix Brings Good Fortune” and “Paranormal Things Echo” took place here. From the standpoint of historical materialism, myths and legends are spread by later generations. They describe that Empress Wu took the throne as “the unity of Heaven and Humanity”. It is this legendary and paranormal story that makes this place fascinating. The phoenix brings auspiciousness and peace and Empress Wu brings safe and sound. Although the phoenix had gone, today we can still see the phoenix trees in the Five Buddha Towers in Huangze Temple in Guangyuan where Mrs. Yang was pregnant with Empress Wu. The phoenix trees on the Phoenix Mountain are verdant and tall, with legends of immortality. Based on Empress Wu’s nostalgia complex, the phoenix tree in Guangyuan embodies the profound historical and cultural implication of the empress.

Phoenix Tree Symbolizes the Body of the Empress as a Sacred Tree of Buddhism

Phoenix Tree—Sacred Tree of Chinese Buddhism, Phoenix—Chinese Buddhist Bird

Phoenix tree becomes the sacred tree of Chinese Buddhism because Chinese Buddhist disciples have chosen this tree, which adapts to the local climate and has many similarities with the bodhi (“pu ti” in Pinyin) tree, to replace the bodhi tree.

According to history, in 502 AD, the monk Zhiyue Sanzang brought the bodhi tree back from Xizhu (India) and planted it in Guangzhou. Real bodhi trees are only planted in the tropics and subtropics, but in the temperate zone and the vast northern regions of China, it is difficult for bodhi trees to survive the winter [13]. In China, only the south and southeast coastal areas are suitable for growth. Therefore, in history, Chinese Buddhist disciples had to choose some tree species that could adapt to the local climate instead of bodhi trees. The phoenix tree is tall and straight with big and green leaves and deep shade. It has been widely planted in various provinces and regions in China for more than 2,000 years, so it has become the best choice for the replacement.

On the other hand, because the phoenix tree has many similarities with the bodhi tree, so it becomes one of the sacred trees of Chinese Buddhism with the ginkgo and horse chestnut trees. First of all the similar religious connotations of the phoenix tree and the bodhi tree. “Pu ti” is the transliteration of the ancient Hindi language “Bodhi”, which means enlightenment and wisdom. In plant taxonomy, the Latin name of bodhi tree is “Ficus religiosa”, which means sacred religion. The phoenix tree also has the meaning of nobility and enlightenment. Second, the temporal and spatial distribution. Bodhi trees are widely planted in jungle temples in India, Sri Lanka and Myanmar. Devout Buddhists regard them as sacred trees and admire them very much. Phoenix trees are also widely distributed in China’s courtyards, palaces and jungle temples, and are regarded as sacred and auspicious trees. Third, the individual characteristics. The bodhi tree is a tall tree with smooth or slightly angled bark. The crown is round or obovate, and the ground was covered by the luxuriant branches and leaves. The leaf base is heart-shaped, ark green, with clear net-like veins called “Bodhi yarn”, which is regarded as a sacred tree. The phoenix tree is a tall tree with the green bark, the luxuriant branches, and the round crown. The petiole is nearly the same length as the leaf, the broad leaf is like a lotus, and the heart-shaped leaf base is like the heart of the Buddha, which is elegant and delightful. The clear net-like veins are especially like “Bodhi yarn.” Fourth, the plant characteristics. The trunk of bodhi tree and phoenix tree is stout and majestic. The crown is like a pavilion, which is huge. The leaf is heart-shaped, and the surface is smooth. Fifth, the cultivation methods. Both bodhi trees and phoenix trees can be cultivated by cuttings with beautiful appearance and gorgeous leaves. Finally, the similar uses of the two. Their leaves, flowers, and bark can be used in medicine [14].

In ancient Chinese legend, the phoenix was formed by the golden-winged bird of Buddhism. In addition, it is said that the peacock once swallowed the Tathagata, and the Tathagata came out of her back. The Tathagata wanted to kill her, but was discouraged by the Lantern Buddha, saying that since you came out of her body, and you killed her like killing your mother. So the Tathagata forgave the peacock and named her “Mahā-mayūrī-vidyā-rājñī” (means the Great King of the Peacock). This shows that phoenix is also a Buddhist bird in Chinese myths.

Empress Wu — Buddhist Body

  1. Empress Wu has been inextricably bound to Buddhism since she was a child. Her mother, Yang, believed in Buddhism since she was young, and even prayed for her father in Buddhism for more than a decade, so that she didn’t get married until she was in her forties. It is said that when Wu was born, in Zhengjia Mountain (Lotus Village) outside Lizhou, the withered lotus leaves in late autumn regenerated new leaves, and golden lotus blossomed out, and large tracts of beautiful auspiciousness suddenly floated in the sky. Further research shows that Empress Wu’s real name is “Wu Yuanhua” [7]. “Yuanhua” is the meaning of the initial light and unique youth. “Yuanhua” is close to “Mahavairocana”, which reminds people of the Buddhist scene that the sun and the moon are in the sky and the light is so bright.
  2. Wu believed in Buddhism from an early age, facing the ancient Buddha with a lantern, chanting and worshiping. In her youth, she also used to be a nun with “Mingkong” as her Buddhist name. When she was 21, Wu worked as a nun at a Buddhist temple. Her name was “Ming Kong”, which means the Dharma and all void space-directions, which is very similar to the Buddhist situation. This is also the reason why she created the words “Ming and Kong” into the word “Zhao” after she became empress. The meaning of Yuanhua-Ming Kong-Zhao is same.
  3. When she was queen, Wu donated 20,000 pieces of private storage to carve a “Locanabuddha” at Fengxian Temple in Longmen, Luoyang, and personally attended the opening ceremony of it. Locanabuddha totally has the facial features of oriental women and is known as “the most beautiful Buddha in the world”. After research, the “Locanabuddha” of Fengxian Temple is Wu’s appearance when she was in Xianheng for three years (672) and was about 4 years old [7]. The Buddha, also known as “Maha^vairocana”, is a transformation of the Buddha. In China, it is often regarded as “sambhogakaya”, meaning the “prevailing light”. Locana means vast wisdom and prevailing light, and its image is a vivid embodiment of Buddhist teachings and an example of the perfect combination of divinity and human nature.
  4. Wu is the rebirth of Maitreya Buddha. As a politician, Wu is a theist. She highly values Buddhism, not only believing in it, but also making use of it. She was favored, murdered people to obtain the position, coerced into resignation, and served the imperial power with the help of theocracy. The Buddhist theory of reincarnation found the basis for Wu as a female emperor. Under the banner of Maitreya Buddha, the Queen Wu instructed to annotate and promote Dayun Scriptures which said that “the Buddha tells a heavenly maiden named “Jingguang” that she will transform the Bodhisattva, that is, the female will be the king.” In Dayunjing Shu, Feng Xiaobao directly stated that Wu was the reincarnation of Maitreya Buddha, transforming the Tang Dynasty into Zhou. “She was the ruler of the world”, and then finally became a Buddha.
  5. The stone statue of the Queen Wu of Huangze Temple in Guangyuan is a Bodhisattva statue carved according to Wu’s face in her old age, implying the historical fact that she was the rebirth of Maitreya Buddha and ascended to the throne in her later years.

Phoenix Tree Symbolizes the Only Female Emperor

  1. The trunk of Phoenix tree is straight and tall, with few branches, symbolizing that Wu has taken a firm step towards the ultimate goal of life since her parents named “Yuanhua”. Phoenix tree symbolizes the only female emperor in the era of patriarchal rule, with a woman as the system and the emperor. It can be said that she was the only person in ancient and modern times, walking alone for thousands of years. From entering the palace to becoming the empress, Wu basically relied on personal struggle and continuous self-improvement along the way. She had an indomitable will to do everything, the lofty words of “enforcing justice on behalf of heaven”, and an ambition to achieve a great cause. She is aggressive, resourceful, resolute, decisive, unafraid, and indomitable, and has a fierce personality that is not afraid of everything. At that time, the focus of the political struggle in the Tang Dynasty focused on the interior of the imperial court. Empress Wu encountered very strong opposition forces in the process of her uproar in the Tang Dynasty. Liu Shuang, Changsun Wuji, Han Yi, Yu Zining, Pei Yinjian, Laiji, Shangguan Yi and so on hurt Wu before, Xu Jingye in Yangzhou, Li Yuanjia in Jiangzhou, and Li Zhen in Runan [7] armed against Wu later, however, they all failed to defeat her.
  2. The phoenix tree is tall and straight, with a graceful posture and the natural and imposing demeanor. Its magnificent beauty is just what Empress Wu likes. The phoenix tree with green branches is lush and elegant, and the shade of dense leaves relieves the heat of summer, symbolizing Empress Wu’s life of benefiting the world and the people. Empress Wu had “a wisdom of knowing people and a heart of loving talent.” She employed the right people, listened to the right words, used civil and military methods, and made great achievements, which can be called an iron-handed monarch in Chinese history [7,15]. Empress Wu’s attitude towards the Manifesto Against Wu Jao in the mutiny in Yangzhou shows her capacity; the opening of disciplines to select scholars reflects her wisdom of knowing people; and her control of villains and gentlemen embodies her skill of employing people.
  3. The phoenix tree stands in the wind, not afraid of the cold, symbolizing that the life of Empress Wu is a vigorous life, a rebellious life, and a life of subverting patriarchal political thought. Mr. Lu Xun once said “who dares to say men are superior to women when Wu became the emperor?” In the feudal society in which men were superior to women, Empress Wu was stigmatized as “a hen crowing in the morning”, which always belittled the empress consciously [16,17]. Today, history has objectively evaluated this great woman.

Phoenix Symbolizes the Affection of the Empress

Phoenix symbolizes love which refers to the affection of the empress. Empress Wu was a ruthless monarch who murdered countless people, but she was also an affectionate woman who loves so much. She went to the palace at the age of 14 to be a talented scholar for Emperor Taizong, Li Shimin, but was not spoiled by Taizong. “The leaves of the phoenix tree by the well are getting yellow, and you can know the frost in the night without rolling the pearl curtain. The smoked cage and jade pillow looks like a haggard face, lying down and listening to the voice from the South Palace.” (The Poem of the Changxin Palace by Wang Changling). “The rain drenched on the leaves of the phoenix tree at the night, full of autumn, and beat on the plantains, making people sorrowful. In the middle of the night, I returned to my hometown in my dream.” (Double Tone · Water Fairy · Night Rain by Xu Zaisi). This poem cannot stopping the melancholy thoughts of young Wu in the palace. In the period of loss and loneliness, Wu was dressed in court dress and wrote a love poem Set to the Tune Ruyi Niang in Ganye Temple: “Watching red turn to green, my thoughts entangled and scattered. I am disheveled and torn from my longing for you, my lord. If you fail to believe that of late I have constantly shed tears, open the chest and look for the skirt of pomegranate-red.” [10] This poem is so sorrowful, even Li Bai had a lot of emotion after reading it, and felt inferior to himself. Empress Wu, who trained a steed with a dagger, missed her lover day and night, and her eyes were dim with tears, regarding the red flowers as green phoenix tree leaves.

“The autumn rain in the midnight falls on the phoenix tree leaves, and the sound of the leaves tells of separation.” (Zhegutian · A Little Bit of Red is Dying by Zhou Zizhi). The pronunciation of “Wu (means phoenix)” and “Wu (means I), and “Tong (means phoenix)” and “Tong (means together)” is similar. The tall phoenix tree symbolizes that the emperor Gaozong, Li Zhi, and Wu Yuanhua made an oath to weep when they met under the phoenix tree in Ganye Temple. Because of missing Li, Wu was awakened by the rain of phoenix tree in autumn night after falling into a dream. There is no doubt that the phoenix tree becomes a symbol of love between Li and Wu. At the age of 27, Wu became the queen of Li. The green leaves and branches of Phoenix tree symbolize her good relationship with Li. When she was 55 years old, Li died of illness in Zhenguan Hall in Luoyang. Before his death, he wrote in the edict that “if there is anything that cannot be decided on military and national affairs, listen to the decision of the empress.” The final decision-making power of the empire was handed over to Empress Wu. At the age of 62, she became the emperor of the Great Zhou Dynasty and still had her own emotional world in the cruel political struggle. The empress, who was over 70, was still alone, and she was eager to be a “Ruyi Niang” again. Thus, the Phoenix tree symbolizes her complex emotional life.

The Falling Leaves of Phoenix Tree in Autumn Shows that Empress Wu Lost Her Kingship and Became Queen

The leaves of phoenix tree are luxuriant, but they fall earliest in autumn. “One leaf of phoenix tree falls, the whole world knows autumn to come.” (Erruting Qunfangpu by Wang Xiangjin). Fallen leaves are not declining, which is a natural response of plants to adapt to the environment, so the phoenix tree is a symbol of the autumn. Empress Wu, who abdicated from the throne in Shangyang Palace in Luoyang, stood in the cold autumn wind and looked at the shade of sparse phoenix trees under the moonlight in the deep courtyard. She sighed her glorious past and returned Zhou to Tang Dynasty. When she was dying, she removed to the Kingship and said she was still the queen. That is to say, Empress Wu finally gave up the independence of women and returned to the male power society, which was inevitable at that time, and was what she had to do. The leaves of phoenix tree fall to know autumn, and the leaves return to their roots. Although Empress Wu conquered numerous challenges, she could not escape the secular convention in the end.

Ecological Significance of the Images of Phoenix Tree, Phoenix, and Empress

The interpretation of the ecological significance of the images of phoenix tree, phoenix and empress can guide people to deepen the study of the empress culture in the forest culture. The image of phoenix tree and empress culture does not exist alone, it can form a compound image with phoenix, or it can be used individually. At the same time, when we interpret the image of phoenix tree and empress culture, we must put it in the whole historical and cultural atmosphere, and combine other images to grasp it as a whole. Only in this way can we better interpret the image of phoenix tree, which has the connotation of empress culture [18]. At the same time, we can carry forward phoenix culture and empress culture to create a characteristic forest cultural creative park, build a forest cultural city, and promote their ecological civilization value [19]. We can plant phoenix trees in the countryside of Guangyuan, in front and back of the courtyard, on both sides of the road, and in urban gardens. The green lines of roads, railways and rivers make up the phoenix, and the large green areas around the city set off the flying phoenix, which can enhance the image of the city. Phoenix tree symbolizes ecological civilization, and phoenix symbolizes human dream of flying into the sky, so phoenix tree and phoenix share a harmonious and wonderful life desire. In this beautiful city, as the king of birds, phoenix is the embodiment of truth, goodness and beauty. As its only habitat and auspicious tree species,phoenix tree can bring happiness and good luck to residents and tourists, so as to enhance the tourism charm of Guangyuan City.

Acknowledgment

Professor Chen Jiancheng and Professor Zheng Xiaoxian of Beijing Forestry University, Director Jiang Dayong of Sichuan Forestry Department, Director Chen Yang of Guangyuan City Library, Director Bai Chaomao of Fenghuangshan Park Management Office of Guangyuan City, Pu Zhitian, a senior engineer from the Landscape Department of Guangyuan Construction Bureau, Director Bai Jian of Guangyuan Culture Bureau, Li Qianxiu, the chairman of the Lizhou District of CPPCC and Writers’ Association, etc. Thank all of you for your help!

References

  1. Jiang Kongyang, Zhu Liyuan (1999) Aesthetic Principles [M]. Shanghai: East China Normal University Press.
  2. Chen Jiru (2007) Sketches by the Little Window [M]. Tianjin: Baihua Literature and Art Publishing House.
  3. Guan Chuanyou (2007) Historical and Cultural Implication of Planting Phoenix Trees in China. China Urban Forestry 5: 40-41.
  4. Xin Mo (1988) Wu Zetian and Huangze Temple [M]. Chengdu: Sichuan Art Publishing House 36-39.
  5. Ma Yunhuan (2000) Guangyuan Trip to Shu Road, Jianmen [M]. Xi’an: Taibai Literature and Art Publishing House 11: 12.
  6. Hu Ji (1986) Biography of Wu Zetian [M]. Xi’an: Sanqin Publishing House.
  7. Chen Yang (2009) Decrypt of Wu Zetian [M]. Beijing: Popular Literature and Art Publishing House.
  8. Li Qianxiu (2000) Wu Qianqiu [M]. Chengdu: Sichuan People’s Publishing House 2-4.
  9. [9] Liu Zongyuan (1987) Discrimination of Giving Leaves of Phoenix Tree to Brother [M]. Changsha: Yuelu Book Society 1987: 203-205.
  10. Meng Man (2008) Meng Man Talking about the Tang Dynasty: Wu Zetian [M]. Nanning: Guangxi Normal University Press 2, 3, 27, 185, 186.
  11. Zhang Wendi (2006) Poems about the Empress’s Hometown [M]. Beijing: Popular Literature and Art Publishing House 175.
  12. Shi Yongtao (2007) From Daming Palace to Luoyang Mingtang [N]. Urban Economic Bulletin 5: 6-26.
  13. Yu Liangxiu (2002) Chengdu Landscape Plants [M]. Chengdu: Sichuan Science and Technology Publishing House.
  14. Chen Youmin (1990) Landscape Dendrology [M]. Beijing: China Forestry Publishing House 400-403: 570, 571.
  15. Hui Huanzhang, Wu Qiao (2002) 100 Secrets of Wu Zetian [M]. Xi’an: Xi’an Publishing House 75-78.
  16. Li Daming (2005) Twenty-five Histories [M]. Chengdu: Bashu Publishing House 511-514.
  17. He Kaisi (2008) The Light of Women under the Five-ring Flag” [N]. Sichuan Daily 08-15 (B4).
  18. Su Zurong (2001) Introduction to Forest Aesthetics [M]. Shanghai: Xuelin Publishing House 275: 316.
  19. Wu Zhiwen (2008) Development of Forest Culture, Forestry Creative Industry and New Forestry Economic Growth Point. World Forestry Research 9: 184-192.

Proficiency Monitoring of Allergen-Specific IgE macELISA – 2021

DOI: 10.31038/IJVB.2021541

Abstract

The purpose of this study was to evaluate the reproducibility of results yielded using a macELISA for detection of allergen specific IgE in dogs and cats when run by eleven different individuals in seven separate affiliated laboratories. Samples of 24 different sera samples were independently evaluated in each laboratory by differing operators in a single blinded fashion. For evaluations completed by multiple operators in a single laboratory, the average intra-operator variance was calculated to be 4.6% (range=0.8%-8.7%) while the average inter-operator variance was 5.7% (range=1.4%-7.8%). The average intra-assay variance among reactive assay calibrators in all laboratories was 5.3% (range=0.8%-12.6%). The overall inter-assay inter-laboratory variance evident with reactive calibrators was consistent among laboratories and averaged 10.1% (range=4.4%-12.8%). All laboratories yielded similar profiles and magnitudes of responses for replicate unknown samples; dose response profiles observed in each of the laboratories were indistinguishable. Correlation of EAU observed for individual allergens between and among all laboratories was strong (r>0.90, p<0.001). Collectively, the results demonstrated that ELISA for measuring allergen specific IgE is reproducible, and documents that consistency of results can be achieved not only in an individual laboratory, but among different operators and between laboratories using the same ELISA.

Keywords

IgE, ELISA, Proficiency, Atopy, Allergy, Immunotherapy, Cross-reactive carbohydrate

Introduction

Stallergenes Greer maintains a proficiency monitoring program for laboratories that routinely run macELISA [1] for evaluation of allergen specific IgE in serum samples. The foundation for this program is based on the desire for inter-laboratory standardization and quality control measures that ensure the uniformity, consistency, and reproducibility of results among laboratories that perform the assays. This program is designed to evaluate the proficiency of laboratories and ensures that individual operators yield consistent and reproducible results. The inaugural proficiency evaluations, initiated in 2009 and repeated in 2010, in six different laboratories documents that inter-laboratory standardization and quality control measures in the veterinary arena are on the immediate forefront and that uniformity, consistency, and reproducibility of results between laboratories is achievable [2]. Similarly, reproducibility of results among different laboratories was documented in the subsequent proficiency evaluations completed in 2013 [3], 2016 [4], 2018 [5], 2019 [6], and 2020 [7]. The results presented herein summarize the comparative results observed in the affiliate laboratories for the most recent proficiency evaluations that were completed in August 2021. The 2021 proficiency evaluation is the third documentation of the assay reproducibility since adopting a cross-reactive carbohydrate inhibitor in the sample diluent [7,8].

Materials and Methods

All serum samples, buffers, coated wells, calibrator solutions, and other assay components were aliquants of the respective lots of materials manufactured at Stallergenes Greer’s production facilities (located in Lenoir, NC, USA) and supplied as complete kits to the participating laboratories along with the exact instructions for completing the evaluations.

Participating Laboratories

Seven independent Veterinary Reference Laboratories (VRLs) participated in the 2021 proficiency evaluation of macELISA. Participating laboratories included three separate IDEXX laboratories located in Memphis, Tennessee, Kornwestheim, Germany, and Markham, Ontario Canada. Other affiliated European laboratories that participated in this evaluation included Agrolabo (Scarmagno, Italy), Laboratories LETI Pharma (Barcelona, Spain), and Ceva Biovac (Beaucouzé, France). Stallergenes Greer Laboratories (Lenoir, NC) served as the prototype for evaluation of the macELISA; the 2021 evaluations included results reported by three separate and independent operators. Because the performance characteristics of macELISA in Stallergenes Greer’s VRL have been well documented for use over an extended period [1-6], all results observed in the other participating laboratories were compared directly with the results observed in Stallergenes Greer’s reference laboratory.

Serum Samples

Separate pollen and mite reactive serum pools or non-reactive sera pools were prepared from cat and dog serum samples that previously had been evaluated using the macELISA for detection of allergen specific IgE. The reactivity of each sera pool ranged from nonreactive to reactive for multiple pollen or mite allergens. These sera pools and admixtures of the pools were used to construct a specific group of samples that exhibited varying reactivity to the allergens included in the evaluation panel. Twenty-four samples were included in the blinded evaluation conducted by each laboratory. Identical replicates of the high, low, and negative controls routinely used in the assay were also included as unknown samples. Also included in the array of samples was a five tube three-fold serial dilution of a highly pollen reactive pool, diluted into non-reactive sera, which served to document the dose response evident within the assay. All samples were stored at -20°C for the interim between testing.

Calibrators

Mite reactive calibrator solutions of predetermined reactivity in the macELISA were prepared as three-fold serial dilutions of a sera pool highly reactive to Dermatophagoides farinae, Acarus siro, and Tyrophagus putrescentiae. Replicates of each were evaluated in each assay run and served as a standard response curve for normalizing results observed with the various samples. All results were expressed as ELISA Absorbance Units (EAU) which are background-corrected observed responses expressed as milli absorbance.

Buffers

The buffers used throughout have been previously described,1-7 and included: a) well coating buffer: 0.05 M sodium carbonate bicarbonate buffer, pH 9.6; b) wash buffer: phosphate buffered saline (PBS), pH 7.4, containing 0.05% Tween 20, and 0.05% sodium azide; c) reagent diluent buffer: PBS, pH 7.4, containing 1% fish gelatin, 0.05% Tween 20 and 0.05% sodium azide. The buffer used for dilution of serum samples was identical to the reagent diluent buffer, but it has been supplemented (2.5 mG/mL) with a cross-reactive carbohydrate inhibitor derived from the carbohydrate components present in bromelain (BROM-CCD)7. BROM-CCD was prepared in house and remains a proprietary product of Stallergenes Greer (Lenoir, NC, USA).

Allergen Panel

The allergen panel was a 24 allergen composite derived from the array of allergens that are included in the specific panels routinely evaluated in the various laboratories; the composite allergen panel consisted of 4 grasses, 6 weeds, 6 trees, 5 mites, and 3 fungi. The protocol for coating and storage of wells has been previously described [1-7]. Immulon 4HBH flat bottom 12 well strip assemblies (Thermo Electron Corporation, Waltham, MA) were used throughout and served as the solid phase for all assays. The individual extracts were diluted in bicarbonate buffer (pH 9.6) and 100 µL was added to each assigned well. Following overnight incubation at 4-8°C, the wells were washed with PBS, blocked with 1% monoethanolamine (pH 7.5) then air dried and stored at 4-8°C in Ziploc bags until used.

Sample Evaluations – macELISA

The operational characteristics and procedures for the macELISAs have been previously described [1-6]. Following incubation of allergen coated wells with an appropriately diluted serum sample, allergen-specific IgE is detected using a secondary antibody mixture of biotinylated monoclonal anti-IgE antibodies, streptavidin alkaline phosphatase as the enzyme conjugate, and p-nitrophenylphosphate (pNPP) as substrate reagent. Specific IgE reactivity to the allergens is then estimated by determining the absorbance of each well measured at 405 nM using an automated plate reader. All results are expressed as ELISA Absorbance Units (EAU), which are background-corrected observed responses expressed as milli absorbance [8-13].

To evaluate the stability of stored wells, the reactivity of wells coated in April 2019 and in April 2021 was assessed by Stallergenes Greer technicians. The storage stability of the anti-IgE-biotin reagent was assessed by comparing the reactivity of a preparation of reagent that was prepared in January 2017 with that of one that was prepared in April 2020.

Statistics

A coefficient of variation was calculated as the ratio of standard deviation and means of the responses observed for the calibrator solutions within different runs in multiple laboratories. Pearson’s correlation statistic was used for inter-laboratory comparison among individual allergens. Statistical analyses were conducted using EXCEL (2016; Microsoft; Redmond, WA, USA).

Results

The assay variance (% CV) observed with the calibrator solutions in the different laboratories are presented in Table 1 and are representative of the assay reproducibility in the various laboratories. The average intra-assay % CV among positive calibrators (#1-5) was 5.3% (range=0.8%-12.6%); differences among laboratories or between assays and within assay runs were not detected. No substantial difference in results among various operators was revealed. The average intra-operator variance documented for Stallergenes Greer technicians was calculated to be 4.6% (range=0.8%-8.7%) while the average inter-operator variance was 5.7% (range=1.4%-7.8%). The average inter-assay variance (% CV) observed in Stallergenes Greer’s laboratory with the positive calibrators from multiple runs over a one year period has been documented at 8.9% (range 7.1% -9.7%), and the inter-laboratory % CV among reactive calibrators also remained relatively constant (average 12.1%; range=11.2%-13.4%). The results of the current evaluation (Table 1) are consistent with these unpublished findings; the inter-assay variance among positive calibrators for all laboratories included in this evaluation was calculated to be 10.1% (range=4.4%-12.8%). Similar to previously published studies [1-7], the intra-assay variability was higher with the calibrators containing lesser amounts of allergen specific IgE, and a similar increased intra-assay variability was evident with the background ODs (average 8.6%; range=2.0%-18.1%). A negative response is classified as anything with an EAU below 150 [1]. Any analysis of results below this threshold, especially when looking at %CV and relative differences should be done cautiously.

Table 1: Calculated variance of macELISA calibrator solutions observed with different laboratory runs by multiple operators during the 2021 Proficiency evaluation.

                                                           Calibrator % CV BG % CV

Variance

N

#1 #2 #3 #4

#5

Inter-Laboratory

352

4.4 10.0 12.8 12.2 10.8

19.8

Inter-Assay (Stallergenes Greer)

160

1.4 6.2 7.8 6.7 6.6

7.7

Intra-Assay
Stallergenes Greer #1

32

1.3 6.1 5.9 4.5 3.7

3.8

Stallergenes Greer #2

32

1.2 3.4 6.8 4.5 6.5

2.0

Stallergenes Greer #3

32

1.3 6.7 7.9 4.8 6.1

9.9

Stallergenes Greer #4

32

0.8 4.1 4.2 5.0 3.9

4.9

Stallergenes Greer #5

32

1.1 4.7 4.6 8.7 7.0

7.9

IDEXX Memphis

32

3.3 6.9 12.2 7.0 10.9

14.6

IDEXX Canada

32

1.5 3.0 5.2 4.2 3.5

9.4

IDEXX Germany

32

2.0 6.6 11.1 7.5 4.0

9.9

Agrolabo

32

1.0 3.2 5.7 6.9 12.6

18.1

Biovac

32

2.6 7.2 6.6 6.3 6.8

6.0

LETI

32

2.2 4.5 8.9 6.7 7.3

7.6

* Calibrator #1 was prepared as a dilution of a sera pool which is highly reactive to mite allergens; Calibrators #2 – #5 are prepared as a serial 3-fold dilution of calibrator #1.
† Background responses observed with diluent in place of serum sample.

To evaluate the strength of association with the magnitude of EAU results observed for each allergen among the different laboratories a Pearson’s correlation coefficient was determined (Microsoft Excel 2016) for each laboratory pair. Because the macELISA is designed to yield comparable responses in dog and cat samples, comparison of results among affiliate laboratories included both cat and dog samples as a single population of sera samples [5-7]. These results (Table 2) demonstrate that very high inter-laboratory correlation (r>0.90; p<0.001) is evident between the results observed in Stallergenes Greer laboratory and those observed in six affiliate laboratories for all pollen, mite, and fungi allergens. The overall correlation of results observed in the various laboratories is summarized in Table 3; a very strong correlation (r>0.90, p<0.001) was demonstrated between and among the results of the participating laboratories.

Table 2: Inter-laboratory correlation of macELISA results observed with individual allergens in Stallergenes Greer Laboratory and the results observed in the individual affiliate laboratories.

Allergens

Inter-Laboratory Coefficient of Correlation Stallergenes Greer vs
IDEXX Memphis IDEXX Germany IDEXX Canada Ceva Biovac Agrolabo

LETI

Mites
Acaris siro

0.996

0.995

0.981 0.988 0.995

0.972

Dematophagoides farinae

0.992

0.993 0.998 0.984 0.994

0.972

Dematophagoides pteronyssinus

0.990

0.982 0.971 0.980 0.976

0.882

Lepidoglyphus destructor

0.971

0.967 0.893 0.953 0.974

0.838

Tyrophagus putrescentiae

0.993

0.986 0.975 0.992 0.991

0.956

Grasses
June Grass (Poa pratensis)

0.995

0.990 0.997 0.988 0.990

0.937

Meadow fescue (Festuca pratensis

0.989

0.987 0.983 0.983 0.987

0.908

Orchard Grass (Dactylis glomerata)

0.984

0.982 0.993 0.984 0.984

0.904

Perennial Rye (Lolium perenne)

0.985

0.984 0.988 0.983 0.986

0.899

Trees
Birch (Betula pendula)

0.977

0.978 0.965 0.908 0.964

0.900

Cypress (Cupressus sempervirens)

0.981

0.972 0.904 0.948 0.898

0.926

Hazelnut (Corylus avellana)

0.978

0.970 0.983 0.977 0.955

0.915

Olive (Olea europaea)

0.980

0.972 0.991 0.964 0.965

0.889

Populus mix (P.nigra, P. tremula, P. alba)

0.976

0.970 0.988 0.975 0.964

0.894

Willow Black (Slix discolor)

0.971

0.962 0.963 0.976 0.968

0.927

Weeds
English Plantain (Plantago lanceolata)

0.988

0.974 0.979 0.985 0.977

0.905

Lambs Quarter (Chenopodium album)

0.981

0.961 0.944 0.933 0.934

0.916

Mugwort (Artemisia vulgaris)

0.977

0.967 0.980 0.971 0.953

0.915

Pellitory (Parietaria officinalis)

0.985

0.974 0.986 0.981 0.977

0.914

Ragweed (Ambrosia trifida, A. artemisifolia)

0.999

0.992 0.996 0.997 0.989

0.994

Sheep Sorrel (Rumex acetosella)

0.990

0.982 0.986 0.988 0.980

0.931

Fungi
Alternaria alternata

0.953

0.991 0.977 0.977 0.945

0.931

Aspergillus fumigatis

0.993

0.995 0.994 0.958 0.998

0.950

Cladosporium herbarum

0.995

0.992 0.843 0.914 0.994

0.944

Overall

0.991

0.986 0.977 0.987 0.983

0.956

*Pearson Correlation Coefficient (r); Good Correlation (r > 0.8, p<0.001)

Table 3: Inter-laboratory correlation of macELISA results observed among individual affiliate laboratories.

Interlaboratory Coefficient of Correlation
Laboratory Stallergenes Greer IDEXX Memphis IDEXX Germany IDEXX Canada Ceva Biovac Agrolabo

LETI

Stallergenes Greer

1

0.991 0.986 0.977 0.987 0.983

0.956

IDEXX Memphis

0.991

1 0.990 0.980 0.989 0.986

0.967

IDEXX Germany

0.986

0.990 1 0.967 0.981 0.994

0.956

IDEXX Canada

0.977

0.980 0.967 1 0.978 0.962

0.955

Biovac

0.987

0.989 0.981 0.978 1 0.974

0.969

Agrolabo

0.983

0.986 0.994 0.962 0.974 1

0.948

LETI

0.956

0.967 0.956 0.955 0.969 0.948

1

*Pearson Correlation Coefficient (r); Good Correlation (r > 0.8, p<0.001)

For an evaluation of the dose response in this ELISA, a five tube three-fold serial dilution of a reactive dog sera pool was prepared using a negative cat sera pool as diluent. Each of the dilutions was then evaluated by all of the participating laboratories as unknown independent samples. Similar responses were yielded by all of the laboratories and the results observed within the various laboratories are encompassed by the acceptable variance limits [1-3] (±20%) established for macELISA. Further, the magnitude of responses observed in each laboratory was reduced in direct proportion to dilution. Consequently, the dose responses for the individual allergens are presented as aggregate responses. The results presented in Figure 1 confirm the sera pool was highly reactive to mites as well as grass, weed, and tree pollen allergens, but it was not reactive to fungi. To be expected, the magnitude of responses observed in each laboratory was reduced in direct proportion to dilution. Results from the final tube in the dilution scheme yielded results that were indistinguishable from negative responses, indicating a dilution extinction of detectable response.

fig 1(1)

fig 1(2)

fig 1(3)

Figure 1: Dose response evident in macELISA with a pollen reactive serum pool.

The final objective for the current evaluation was to document the stability of the anti-IgE biotin reagent and the allergen coated wells. For these evaluations two separate lots of each assay component were reciprocally assessed. The two lots of allergen coated wells were manufactured in April 2019 and April 2021 and stored in zip closure plastic bags at 4-8°C until used. The separate anti-IgE reagent lots were manufactured in January 2017 and April 2021 and were store at -10°C in alkaline phosphatase stabilizing buffer containing 50% glycerin. All evaluations were completed in July 2021.

The results present in Table 4 demonstrate that similar responses are yielded with calibrators when evaluated with either lot of anti-IgE biotin. The average intra assay variance (% CV) observed with the two reagent lots were evaluated by two separate technicians and calculated to be 5.5% (range=0.9%-11.9%). The average inter-assay variance for the two reagent lots was calculated to be 7.1% (range=1.1%-12.0%); whereas the average inter-lot/inter-operator variance was 12.1% (range=2.2%-17.9%). To be expected, the greatest variance was noted for calibrator solutions that yielded signals of lesser magnitude.

Table 4: Correlation of responses observed with calibrator solutions when evaluated with separate lots of anti-IgE biotin that were stored for 3 or 55 months.

Anti-IgE Biotin Calibrator % CV*
Variance Lot # Storage(Months) N #1 #2 #3 #4 #5

BG % CV

Inter-Lot/ Operator

1 & 2

3 & 55 160 2.2 9.8 15.7 17.9 15.0

9.5

Inter-Assay

1

55 96 1.5 7.6 6.3 7.0 7.8

7.0

2

3 96 1.1 5.7 10.6 12.0 11.2

10.3

Intra-Assay
Operator #1

1

55 64 1.6 9.0 4.9 4.0 3.1

4.0

2

3 64 0.9 3.2 6.7 5.5 7.4

3.8

Operator #2

1

55 32 1.2 3.4 6.8 4.5 6.5

6.8

2

3 32 1.2 6.3 10.1 11.9 11.5

11.4

* Calibrator #1 was prepared adilution of a sera pool which is highly reactive to mite allergens; Calibrators #2 – #5 are prepared as a serial 3-fold dilution of calibrator #1. Background responses observed with diluent in place of serum sample.
† Anti-IgE biotin was stored at -10 °C in alkaline phosphatase stabilizing buffer containing 50% glycerin

The final endeavor of the present study was to document the storage stability of the individual allergen coated wells along with the anti-IgE biotin conjugate stability. For these evaluations a single dilution of each of the sera included in the proficiency panel were evaluated separately by two technicians on both lots of wells using each of the anti-IgE biotin lots. Because the magnitude of signals evident with the individual allergens between the two technicians was indistinguishable all results were treated as a single population for each allergen. The results present in Table 5 demonstrate a very high correlation (Pearson’s) of results for each of the allergen coated wells and for each lot of anti-IgE biotin (r>0.900, p<0.001).

Table 5: Correlation of results observed with proficiency sera samples when evaluated with two separate lots of anti-IgE biotin stored for 3 or 55 months using allergen coated wells that were stored for 3 and 24 months.

                                                                           Coefficient of Correlation

Allergens  Wells*
Apr 2019     vs      Apr 2021

  Biotin+
Jan 2017    vs     Apr 2020

Mites

Biotin
Jan 2017
Biotin
Apr 2020
Wells

Apr 2019

Wells
Apr 2021

Ascaris siro

0.993

0.992 0.995

0.994

Dermatophagoides farinae

0.999

0.999 0.996

0.993

Dermatophagoides pteronyssinus

0.987

0.985 0.995

0.988

Lepidoglyphus destructor

0.959

0.975 0.987

0.976

Tyrophagus putrescentiae

0.988

0.987 0.996

0.991

Grasses
June Grass (Poa pratensis)

0.995

0.997 0.965

0.946

Meadow fescue (Festuca pratensis

0.998

0.998 0.956

0.937

Orchard Grass (Dactylis glomerata)

0.990

0.996 0.952

0.926

Perennial Rye (Lolium perenne)

0.993

0.997 0.956

0.929

Trees
Birch (Betula pendula)

0.997

0.971 0.903

0.960

Cypress (Cupressus sempervirens)

0.874

0.918 0.956

0.962

Hazelnut (Corylus avellana)

0.998

0.998 0.944

0.947

Olive (Olea europaea)

0.999

0.995 0.935

0.950

Populus mix (P.nigra, P. tremula, P. alba)

0.995

0.992 0.942

0.949

Willow Black (Slix discolor)

0.983

0.973 0.931

0.953

Weeds
English Plantain (Plantago lanceolata)

0.995

0.985 0.957

0.982

Lambs Quarter (Chenopodium album)

0.996

0.992 0.952

0.962

Mugwort (Artemisia vulgaris)

0.980

0.985 0.954

0.950

Pellitory (Parietaria officinalis)

0.997

0.996 0.940

0.953

Ragweed (Ambrosia trifida, A. artemisifolia)

0.999

0.990 0.997

0.992

Sheep Sorrel (Rumex acetosella)

0.999

0.991 0.942

0.963

Fungi
Alternaria alternata

0.989

0.993 0.986

0.969

Aspergillus fumigatis

0.997

0.998 0.996

0.993

Cladosporium herbarum

0.932

0.923 0.974

0.966

Overall

0.972

0.975 0.974

0.975

*Allergen coated wells were air dried then stored at 4-8 °C in plastic bags
† Anti-IgE biotin was stored at -10 °C in alkaline phosphatase stabilizing buffer containing 50% glycerin

Discussion

Consistent with previous proficiency evaluations of laboratories that routinely run the monoclonal antibody cocktail based enzyme linked immunoassay (macELISA) manufactured by Stallergenes Greer [1-6], the results of the present study demonstrated that the intra-assay variance observed with the positive calibrators remains relatively low and indistinguishable among the various laboratories. Likewise, the inter-assay variance within each laboratory remained relatively constant and the results from all laboratories was demonstrably similar and the CV of the positive responses was relatively constant across the entire range of reactivity tested. The results demonstrated that the variability between and among the affiliate laboratories and technicians are indistinguishable from the results evident within and between runs completed in the laboratory of Stallergenes Greer. Thus, all laboratories and technicians included in the study were equally proficient in providing consistent results for all allergens tested and the results were well within the acceptable variance limits (±20%) established for this assay and reflects the robustness of the assay [1].

During the 2020 proficiency evaluations, we documented the stability of allergen specific IgE in serum samples stored frozen for at least one year. In the present study we have documented the stability of allergen coated wells that have been stored for at least 24 months. In addition, we have shown that our anti-IgE reagent maintain functional utility for at least 55 months when stored at -10°C in an alkaline phosphatase stabilized buffer containing 50% glycerin.

There was no compelling evidence that the level of allergen specific IgE correlates with severity of clinical disease [14-17]. However, an evaluation that purports to measure allergen specific IgE should have a reduction in signal that is directly proportional to the dilution factor of the test ligand [18]. Similar responses were yielded by all of the laboratories for the samples that comprised the dose response and the results observed within the various laboratories are encompassed by the acceptable variance limits (±20%) established for macELISA [1-3]. Further, the magnitude of responses observed in each laboratory was reduced in direct proportion to dilution. Consequently, the dose responses for the individual allergens are presented as aggregate responses (Figure 1). The responses of greatest magnitude were evident with the grass pollen allergens, and these responses were reduced in direct proportion to dilution; the magnitude of responses ranged from near maximum to those that were indistinguishable from background responses. The reaction profiles for grass allergens also appear to be parallel and quite similar in magnitude of response. Whether or not these like responses result because of a similar level of co-sensitization or allergen epitope similarity combined with cross-reaction remains to be determined. Although the responses evident to differing tree and weed allergens are more variable in magnitude of response, the observed response in each laboratory was reduced in direct proportion to dilution. The positive response profiles evident with these allergens also appear to be parallel and, it becomes evident that the detectability of allergen specific IgE within this assay spans at least a 150-fold dilution range. Substantial responses to A siro, D farinae, and T putrescentiae were noted in the original sample and these responses decreased in direct proportion to dilution. Reactivity to fungal allergens were lacking in the original sample. We have demonstrated a continued reliability and reproducibility of our macELISA with the open publication of our proficiency testing procedures and results [1-6]. We encourage other groups to determine and document similar findings; however, we emphasize the importance of identifying results below the cutoff of 150 EAU merely as non-reactive and consequently negative responses. The reproducibility of the assay for these responses should be defined only as negative and their numerical values become meaningless; comparison of EAU values are meaningful for reactive samples only (EAU>150). Because the magnitude of specific responses is dependent on the concentration of allergen-specific IgE that can span a wide range, a better means of comparison of repeat results for individual samples in an assay of this sort should be to evaluate the correlation (perhaps Pearson statistic) of results that might exist.

The lack of a regulatory mandated quality assurance program for serum allergen specific IgE testing in companion animals, that independently monitors performance of all laboratories and assay formats, prompts Stallergenes Greer to focus on its continued evaluation of laboratories that routinely use the company’s assays. Information presented herein documents the continued commitment of Stallergenes Greer and its affiliate laboratories to providing a stream of information relating these results to the veterinary community.

Funding

Funding for this study was provided by Stallergenes Greer.

References

  1. Lee KW, Blankenship KD, McCurry ZM, Esch RE, et al. (2009) Performance characteristics of a monoclonal antibody cocktail-based ELISA for detection of allergen-specific IgE in dogs and comparison with a high affinity IgE receptor-based ELISA. Vet Dermatol 20: 157-64. [crossref]
  2. Lee KW, Blankenship KD, McCurry ZM, Kern G, et al. (2012) Reproducibility of a Monoclonal Antibody Cocktail Based ELISA for Detection of Allergen Specific IgE in Dogs: Proficiency Monitoring of macELISA in Six US and European Laboratories. Vet Immunol Immunopathol 148: 267-275.
  3. Lee, K.W, Blankenship, K, McKinney, B, Kern, G, et al. (2015) Proficiency monitoring of monoclonal antibody cocktail–based enzyme-linked immunosorbent assay for detection of allergen-specific immunoglobulin E in dogs. Journal of Veterinary Diagnostic Investigation 27: 461-469. [crossref]
  4. Lee K, Blankenship K, McKinney B, Kern G, et al. (2017) Continued Proficiency Monitoring of Monoclonal Antibody Cocktail-Based Enzyme-Linked Immunosorbent Assay for Detection of Allergen Specific Immunoglobulin E in Dogs – 2016. Integr J Vet Biosci 1: 1-10.
  5. Lee K, Blankenship K, McKinney B, Kern G, et al. (2018) Proficiency Monitoring of Allergen Specific IgE macELISA ̶ 2018. Integr J Vet Biosci 2: 1-6.
  6. Enck K, Lee K, Blankenship K, McKinney B, et al. (2019) Proficiency Monitoring of Allergen-Specific IgE macELISA – 2019. Integr J Vet Biosci 3: 1-6.
  7. Enck K, Lee K, McKinney B, Lillard J, et al. (2020) Proficiency Monitoring of Allergen-Specific IgE macELISA – 2020. Integr J Vet Biosci 4: 1-7.
  8. Lee KW, Blankenship KD, McKinney BH, Morris, DO (2020) Detection and Inhibition of IgE for cross-reactive carbohydrate determinants evident in an enzyme linked immunosorbent assay for detection of allergen specific IgE in the serum of dogs and cats. Vet Dermatol. [crossref]
  9. Altmann F (2016) Coping with cross-reactive carbohydrate determinants in allergy diagnosis. Allergo J Int 25: 98-105. [crossref]
  10. Holzweber F, Svehla E, Fellner W. Dali T, et al. (2013) Inhibition of IgE binding to cross-reactive carbohydrate determinants enhances diagnostic selectivity. Allergy 68: 1269-1277. [crossref]
  11. Yokoi H, Yoshitake H, Matsumoto Y, Kawada M, et al. (2017) Involvement of cross-reactive carbohydrate determinants-specific IgE in pollen allergy testing. Asia P ac Allergy 7: 29-36.
  12. Kaulfürst-Soboll H, Mertens M, Brehler R, von Schaewen A, et al. (2011) Reduction of cross-reactive carbohydrate determinants in plant foodstuff: elucidation of clinical relevance and implications for allergy diagnosis. PLoS One 6: 17800.
  13. Ito K, Morishita M, Ohshima M, Sakamoto T, et al. (2005) Cross-reactive carbohydrate determinant contributes to the false positive IgE antibody to peanut. Allergol Int 54: 387-392.
  14. Mari A, Iacovacci P, Afferni C, Barletta B, et al. (1999) Specific IgE to cross-reactive carbohydrate determinants strongly affect the in vitro diagnosis of allergic diseases. J Allergy Clin Immunol 103: 1005-1011. [crossref]
  15. DeBoer DJ, Hillier A (2001) The ACVD task force on canine atopic dermatitis (XVI): laboratory evaluation of dogs with atopic dermatitis with serum-based “allergy” tests. Vet Immunol Immunopathol 81: 277-87. [crossref]
  16. Gorman NT, Halliwell, REW (1989) Atopic Diseases. In: Halliwell REW, Gorman NT. ed. Veterinary Clinical Immunology pp 232-52. WB Saunders, Philadelphia.
  17. Griffin CE, DeBoer DJ (2001) The ACVD task force on canine atopic dermatitis (XIV): clinical manifestation of canine atopic dermatitis. Vet Immunol Immunopathology 81: 255-269. [crossref]
  18. Griffin CE, Hillier A (2001) The ACVD task force on canine atopic dermatitis (XXIV): allergen-specific immunotherapy. Vet Immunol Immunopathol 81: 363-383. [crossref]

Reaching a Meaningful Agreement among Diverse Parties: The Potential Contribution of Mind Genomics to an Iterated, Optimal Policy

DOI: 10.31038/PSYJ.2021343

Abstract

Mind Genomics was used to assess the response of ordinary people to different prospective strategies involved with the nuclear deal with Iran, in 2016. Each respondent read a unique set of 25 small vignettes comprising systematically varied messages about the nuclear deal, rating each on likelihood for an agreement, and expected emotional response from Iran. From the set of 20 elements only seven elements performed strongly, but not among the total panel, only among emergent mind-sets. These were MS1 (Focus on military aspects, specifically prevention, n = 29 respondents), MS2 (Focus on economic development, n=45), and MS 3 (Focus on effective negotiations and diplomacy, n=11). Most of the emotional reactions were negative. The paper suggests that Mind Genomics be used as an iterative, low cost, rapid fashion, to identify strong negotiating points, base upon the mind of the average citizen. The iterations each lasting 3-4 hours, with several iterations possible in a day at low cost, and with deep learning may radically change the process of negotiation. Mind Genomics identifies what specific messages ‘work’. The process can evolve to a joint effort by both parties to the disagreement, and by so doing craft an agreement attractive to both sides, an agreement emerging from the positive responses of the citizens of both sides

Introduction

The world of US policy the domain of the three branches of the government, and in practice the domain of a host of consultants and others helping to formulate the policy. Often the policy seems well thought out, other times the policy seems to be either poorly thought out, or more of concern, the influence of various parties which dictate aspects of policy for their own interest.

The topic of this paper is the introduction of a tool, Mind Genomics, to help formulate policy by understanding the ‘mind’ of the average citizen, in a way that could tap into the ‘wisdom of the crowd’, and become an iterative, affordable, rapid tool to help policy formulation.

We illustrate the approach by a study run five years ago on responses to policy about Iran. The objective of the study was to demonstrate the potential of what one could learn in a matter of two days, a time that would be shortened to period of 2-4 hours as of this writing (Fall, 2021). The topic of what to do with the fractious government of Iran continues to rear its head. At the original time of the experiment, the last months of the Obama administration, the issue was raised as to what could be done to deal effectively with Iran. Donald Trump was in the midst of pre-election efforts. The research was done to identify key issues and what people wanted as support for the Republican party.

Formulation of Public Policy with the Aid of Polls

Public policy is often announced by a spokesperson for the committee putting forward that policy. It is obvious from the reports both before, and during the birth of the policy, that the policy was ‘crafted’ by a group, and that often the group is bipartisan. There is the phrase ‘horse-trading’ to discuss the back-and-forth negotiations.

At the same time, in the world of politics, whether for candidates or for political issues there are two worlds intertwined. One world is the world of experts, such as individuals from so-called think tanks, who come up with the recommendations. In the United States these individuals are disparaging called ‘Beltway Bandits’, because are housed near Washington. The experts are highly paid to work with the lawmakers and policy makers, to give advice (Alden & Aran, 2016; [1]. Occasionally, scientists enter the process as well because the issue is technical [2].

At the same time there are the pollsters, who measure public opinion, attitude. The emphasis here is on accurate measurement. Occasionally these pollsters might be asked to consult on policy, but their expertise is accurate measurement. The measurement may occur with well conducted local and national polls, focus groups, individual depth interviews, perhaps coupled with their own observations of what is happening at the time they are doing the research [3].

There are two languages in policy, the language of artisanship in the creation, and the language of statistics and measurement in people’s response to the creatin. The language of policy creation is the language of the artisan shop, where the policy is ‘crafted,’ ‘hammered out’, etc., through the interactions and efforts of the individuals involved. The policy is ‘created’ by those tasked with the job. We can contrast this policy of ‘artisanship’ with the language used in measuring responses to the policy, the language of statistics, polls, degree of confidence, measurement of trends, and assignment of reasons for specific patterns of people’s response to the policy. Furthermore, he two languages do not overlaps. There is not much published in terms of scientifically guided iterations in the development of the artisan-crafted policy. The two worlds are different, creation and measurement.

In contrast to the above is the world of product design, especially the world of software design, but engineering in general. The product may be created by an artisan, but that product is special, one time. The true effort is to create products which work, products that have been created by iterations, with the creation coming first, then the testing, then the revision, and the testing again [4]. The key word is ‘testing as part of the iteration,’ something that is not heard publicly in the world of government policy

A search through the literature reveals a moderate number of papers on policy, but almost none on measurement during the course of policy development in the way that one might iterate in the creation of software. We might we be in different worlds. Policy again and again seems to be crafted as a one-tine reaction, rather than being quickly evolved from iterations and testing propositions in the policy. It is that opportunity, creation and optimization through iteration, which constitutes the contribution of this paper.

Beyond Polls to Experimentation

The notion of experimentation in political science seems at first strange, simply because one thinks of the political order as an emergent, resulting from the confluences of forces and the ‘Zeitgeist,’ the spirit of the times. Philosophers have debated the nature of the political orders, the classes of political orders, and of course both the assumed ‘original political order of man’ (if there ever was one), and the most appropriate political order for a society. The important thing to note is that political order is so critical that it begs for study, whether for itself or knowledge of which allows one to achieve one’s goals.

At the same time, during the past decades there has emerge a notion of experimentation, and the idea of an experimental political science, perhaps of the same type as experimental psychology. The difference is where the material is published, and the nature of the published material. Experimental psychology began to emerge in Germany almost two centuries with the publication of Ebbinghaus’ book ‘On Memory’. The book was filled with the results of experiments, with data that could be studied, reanalyzed, challenged, and ultimately replicated or not.

We can contrast the early beginnings of experimental psychology with the beginnings of experimental political science, whose material appears in book after book, as points of view, substantiated with one or two experiments, or better rethinking of data [5,6]. There are no standard experiments in political science, experiments which constitute the basis of the science. Rather, there is talk, philosophical point of view, the need and from time-to-time re-presenting data, cast in this new light of experimentation. In other words, experimental political science is very much alive, but as hope for the future, not as a daily, simple, scalable system for producing data and knowledge. We are just not ready although the interest is certainly real, as shown by the intellectual vibrancy of the topic, a ‘must’ for breaking through into new territory [7-9].

The Mind Genomics Approach

Mind Genomics is an emerging science with roots in experimental psychology, marketing research and public polling. The fundamental nature of Mind Genomics is of a science of experimentation which discovers the mind of people with respect to a specific micro-topic. The key word is micro-topic, a focus on easy-to-understand ideas. The objective is to quantify decision making from the bottom up, and identify coherent groups, ‘mind-genomes’, based upon different, recurring patterns describing how individuals make judgments about the world of the everyday [10,11].

The part of Mind Genomics emerging from experimental psychology is the focus on the measurement of ideas, the inner psychophysics as it was called by modern day psychophysics pioneer, S.S. Stevens of Harvard University. Psychophysics itself is the search for lawful relations between physical stimuli and subjective responses, so-called outer psychophysics. It is the aspects of psychophysics to which most scientists familiar with psychology and referring to when they refer to psychophysics. Inner psychophysics, Stevens’ dream, was to apply metrics to ideas, to measure ideas.

The part of Mind Genomics emerging from consumer is the use of mixtures of test stimuli which simulate real world stimuli have cognitive meaning. One of the tools of consumer research, coincidentally developed by experimental psychologists Luce and Tukey is ‘conjoint measurement,’ the evaluation of mixtures of stimuli, and the estimation of the contribution of each element in the mixture to the overall response. In the world of commerce, mixtures are importance. They are the substance of which products and services are composed. We don’t buy single ideas, but rather combinations of features and benefits embedded in a product or a service.

The Seven Steps

Mind Genomics follows a templated process comprising seven steps. The steps begin with the creation of raw material, and finish with the identification of strong performing elements, among defined groups of respondents, including new-to-the-world groups of respondents who can be shown to think alike on this topic. The output of the Mind Genomics study may find use in driving a better program of communication of one’s product, or part of an academic effort to create the ‘wiki of the mud for a set of related issues’

Step 1: Define the Problem, Create the ‘Raw Material’, Defined as a Set of ‘Questions’, and a Specified Number of Answers to Each Question

The Mind Genomics effort is an experiment, rather than a questionnaire, although Mind Genomics has often been defined in public terms as a survey’.

The essence of Mind Genomics is to measure responses to defined stimuli, viz., combinations of messages, these combinations called vignettes. The vignettes are combinations of statements about the topic, in our case policy towards Iran. As a consequence, the Mind Genomics process prescribes the raw material, namely the topic (Iran), a set of ‘questions’ or ‘categories’ which in sequence describe or tell a story, and for each question or category, an equal number of ‘answers.’

The approach for finding the raw material may range from sheer expertise and ‘off the cuff’ to serious research into what is in published. With the growing interest in Mind Genomics as a fast, iterative process, the movement is towards simple, superficial ideas, some based upon what has been seen or read in public sources, the others based upon one’s own ideas, or the ideas of a creative group, thinking about the topic.

Table 1 shows the list of elements. The structure of the table, four questions, five answers per question, is based on the one of the designs of the Mind Genomics system. The elements were created by author Bitran based upon his on strategic analysis work with his program, Enterprizer(r). It is important to keep in mind that Mind Genomics is a tool which puts the elements to a hard test, as we will see below. The iterative nature of Mind Genomics will allow strong elements to emerge. At the same time, however, the Mind Genomics system is not ‘creative’. And so, a good knowledge of the topic is helpful but not a requirement.

Table 1: The five questions (categories) and four answers (elements) for each question.

Question Non-Aggression Pact
A1  Non-aggression pact signed by ALL countries … those affiliated with Iran and as well those left out. Examples of affiliated – Syria, Lebanon, Palestine. Examples of those left out – Egypt, Israel, Saudi Arabia, Arab Emirates
A2 Non-aggression pact signed by ALL countries NOT AFFILIATED with Iran and Egypt, Israel, Saudi Arabia, Arab Emirates
A3  Bilateral non-aggression pact between all pairs of Arab countries involved
A4 Bilateral non-aggression pact between all pairs of Arab countries involved, and with Israel as well
B – Middle East Security Agreement
B1 Innovative US Policy … advancing economic prosperity & security (for Egypt, Israel, Jordan, Saudi, Emirates)
B2  Create strategic alliances among the group (Egypt, Israel, Jordan, Saudi, Emirates)
B3 Cyber Protection Policy to protect the signing group from cyber disruptions of critical national ‘infrastructure’
B4 Regular meetings to understand current situations and threats, with feedback to improve policy
C – Middle East Free Trade Region (Egypt, Israel, Saudi, Emirates, with Iran option)
C1 Middle East Free Trade Area can include Iran if it signs new agreement
C2 No BDS (Boycott, Divestment, Sanctions) among Egypt, Israel, Saudi, Emirates
C3 Economic development initiatives… job creation through small / medium companies
C4  International innovation zones in each country…attract corporations & startups
D – US Foreign Assistance to Promote American Values
D1 US Foreign assistance only when receiving governments commit to promote no racism & anti-Semitism in trade and education systems
D2 You get foreign aid from the US – forbid BDS against Israel (Boycott, Divestment, Sanctions)
D3 All conditions must be part of every US foreign and defense program
D4  American Values …. Projects/policies have to contain them
E – Renegotiate Iran Deal
According to a recent survey by United Against Nuclear Iran, a large majority of American registered voters view Iran as the greatest state threat facing the United States.
E1 Close consultations by US with Egypt, Israel, Jordan, Saudi, Arab Emirates, who will also publicly sign the new agreement
E2 Deal with Iran…Strict, REAL, proactive enforcement by IAEA (International Atomic Energy Agency). No Iranian ‘self-inspection’
E4 Deal with Iran…. Forbid Iran to transfer ballistic missiles and related technology
E4 Deal with Iran …Exclude Iranian Revolutionary Guard Corps (IRGC), so they have no official standing

Step 2: Create Short Vignettes Using Experimental Design

The world of science works by identifying a phenomenon of interest, defining aspects of the phenomenon to be studies, and when possible, isolating those aspects of interest, and measuring them. The aim is to determine the nature of the variable of interest. Doing so means reducing the haze around the variable, the random variation which hides that nature of the variable. The variability itself is unwanted and eliminated through research. The two strategies are to isolate the variable, eliminating extraneous forces which lead to variation, or measure the variable many times, under different situations, and average out the unwanted variation.

When we deal with issues of foreign policy and break out the issues into elements such as those shown in Table 1, the typical research strategy would be to polish each element so that each element is as clear as possible, and as simple to understand as possible. That corresponds to the first effort, measuring the variable which has been made as simple as possible, so other factors do not affect the results. The second is to test that single idea with hundreds of people, one idea at a time with each of the hundreds of people. Averaging the results from the large group should provide a stable measure of the response to the variable.

The one-at-a-time method dictates that the researcher presents the respondent with each of the elements, one element at a time as the phrase says. The respondent is instructed to maintain the same criterion, and with that one criterion rate the element. It does matter whether the element is positive, negative, deals with peace, deals with conflict; the respondent is to use the same rating scale all the time.

An ongoing problem in the on-at-time research is the unnaturalness of single elements. There is no context. The rating is easier when all of the test stimuli, the elements, are of the same type, such as military alliances, or economic alliances, educational strategies, and so forth. The respondent reads the elements, all of the same time, and has no problem evacuating the elements themselves. They are commensurate with each other. The problem arises when the elements are different. The differences may be vast, such as economic policy versus military policy. Although the researcher can instruct the respondent to use the same criterion, it is not clear that the respondent can actually do so.

A better approach, one which removes some of the artificiality of the one-at-a-time method, works by creating combinations of ideas. This is the approach used by Mind Genomics. Rather than forcing the respondent to maintain the same criterion with palpably different types of statements, Mind Genomics puts together the ideas or statements into small easy to read combinations, such as that shown in Figure 1. There is no effort to polish the combination, or to create connectives so that the combination is even more natural looking, appearing like the paragraphs that the respondent is comfortable evaluating. Although the critic might aver that the combination is not polished, that there are no connectives, that some of the laws of grammar are violated, the reality is that the combination forces the respondent to adopt one criterion and keep it b3cuase it is impossible in a Mind Genomics experiment to continue to shift judgment criteria to match what ends up seeming to be an ever-changing set of random combinations of ideas. The easiest way is to maintain one’s judgment criteria in the face of ever-changing combinations.

fig 1

Figure 1: Example of a four-element vignette. Each respondent evaluates 25 unique vignettes. The vignettes for each respondent differ from each other.

The combinations themselves may appear to the respondent to be utterly random. Nothing can be further from the truth. The combinations are created according to an experimental design (Gofman & Moskowitz, 2010). The experimental design comprises specific combinations, allowing the variables to interact, but making sure that the 20 elements in this particular case are presented iso that they are statistically independent of each other. That statistical independence is accomplished by the specific combinations. The design comprises 25 combinations or vignettes. Each vignette has a specified number of elements, at most one element or answer from any question.

The vignette structure is:

Two elements in the vignette – 2 of 25 vignettes

Three elements in the vignette – 4 of 25 vignettes

Four elements in the vignette – 11 of 25 vignettes

Five elements in the vignette – 8 of 25 vignettes

Although some critics might aver that the vignette has to be complete, with one element from each of the five categories, the reality is that respondent have no problem dealing with the sparser vignettes. The problem is the attitude of the researcher who wants completeness.

The basic design of 20 element embedded in 25 vignettes is a very efficient design. The breakthrough is design came around 1998, when the notion emerged of a permutable design. That is, one could create the basic mathematical structure of the design, specifying the combinations, and so forth. Once this was done, i was simple and straightforward to create a basic design, and then permute it, changing the elements, but maintaining the design structure. That meant renumbering the elements but keeping the elements in the same category. Thus, A1 would become A2, A5 would become A4, and so forth. The renumber would be done for all elements. This strategy, described in detail by Gofman and Moskowitz (2010), maintained the structural integrity of the experimental design, but recrafted the design slightly to cover many more of the possible combinations.

Figure 1 shows an example of a four-element vignette. The physical layout is simple, one phrase atop the other. There is no indication of categories or questions, simply a combination of the elements. No effort is made to connect the combinations.

Step 3 -Execute the Study (viz., Experiment) Online

The actual study was executed through an on-line panel provider, specializing in recruiting respondents and providing them for these studies. The company, Luc.id Inc., in Louisiana, USA, is an aggregator of respondents from various panels. Working with a panel provider such as Lucid. makes the process easy. Over the past two decades it has become increasingly difficult to recruit one’s own panelists, especially for interview or experiments lasting 10+ minutes. The refusal rate has skyrocketed. As a consequence, the panel providers can deliver a group of respondents, generally filling easy specifications, for a reasonable price.

The respondents were invited to participate. The respondents were shown the following orientation. Note that a link was given for further reading about the JCPOA.

box

By way of background Wikipedia as this this writing (Fall 2020) presents a background to the JCPOA, the Joint Comprehensive Plane of Action, which was signed in 2015.

Under the JCPOA, Iran agreed to eliminate its stockpile of medium-enriched uranium, cut its stockpile of low-enriched uranium by 98%, and reduce by about two-thirds the number of its gas centrifuges for 13 years. For the next 15 years, Iran will only enrich uranium up to 3.67%. Iran also agreed not to build any new heavy-water facilities for the same period of time. Uranium-enrichment activities will be limited to a single facility using first-generation centrifuges for 10 years. Other facilities will be converted to avoid proliferation risks. To monitor and verify Iran’s compliance with the agreement, the International Atomic Energy Agency (IAEA) will have regular access to all Iranian nuclear facilities. The agreement provides that in return for verifiably abiding by its commitments, Iran will receive relief from the U.S., European Union, and United Nations Security Council nuclear-related sanctions.

https://en.wikipedia.org/wiki/Joint_Comprehensive_Plan_of_Action

The study was complete by 85 respondents, recruited by Luc.id. The base size of 85 suffices for a simple but often deep focus on the topic. The reason for the need for fewer than the hundreds of respondents in conventional survey work is that the research is searching for patterns, not for a precise measure of one point.

Step 4: Prepare the Data for Analysis by Creating New Binary Variables

The Mind Genomics exercise produces a great deal of data, since each of 85 respondents evaluated 25 different vignettes on two types of attributes, a degree of belief in the meaningful agreement (1=Definitely No … 9 = Definitely yes) and a selection of the emotion that would be felt by Iran, if Iran were a person.

Our goal is to link the 20 elements to the ratings and the emotions. We do that in the next section. In this first section we transform the 9-point rating to a no/yes scale. Managers find it easier to work with binary scale, rather than to talk in percentages. Following the convention of previous efforts with Mind Genomics and the 9-point scale, we recode ratings of 1-6 to 0 (low probability), and ratings of 7-9 to 100 (high probability). The recoding could be made more stringent or less stringent. There is no ‘right answer,’ just appeal to previous processes. We do the same type of recoding for the emotions. We recode emotions as positive) negative). (Positive: Happy, Relieved, Victorious; Negative: Defeated, Fearful)

Thus, each vignette ends up with three numbers. One for the binary recode for probability of meaningful agreement, one for a positive emotion, and the complement for a negative emotion. The numbers are either 0 or 100. When it comes to the positive versus negative emotion, one of the two variables will take on the value 100, and the other by definition will take on the value 0

Finally, vanishingly small random number is added to every newly created binary scale. This random number does not affect the results but does avoids a problematic statistical issue emerging from OLS (ordinary least0squares) regression occurring when the respondent selects all ratings for question 1 (meaningful agreement) either 1-6 or 7-9 (all 0’s or all 100’s across the 25 vignettes) or select all emotions as positive or all emotions as negative.

Step 5: Compute Means for to Better Understand the Patterns of Responses

By Step 5 we have already put the data into a form that makes it easy to compare average ratings (the focus of this step), and to link the elements to response (focus of Step 6).

We can explore the quality of the data by computing averages, considering both the number of elements in a vignette as a stratifying variable, and considering the order of testing as a stratifying variable. Even without knowing which elements are present in a vignette, we can ask whether there are any differences in the average ratings assigned to vignettes of 2,3,4 or 5 elements respectively, in terms of the binary transform of likelihood of agreement (TOP 3), and for the average Positive and average Negative emotions.

To answer the foregoing questions means simply to identify each vignette in two ways, first by the number of elements (2, 3, 4 or 5, respectively), and second by the position in the respondent’s sequence (first third, second third, final third).

Table 2 that there is no difference by position in terms of how it covaries with either likelihood to reach agreement (Q1) of emotion selected.

Table 2: Average values for TOP3 (likelihood of an agreement), and emotions selected (positive, negative) versus order of testing, and the number of elements in a vignette.

Q1 Top 3

Positive Emotion

Negative Emotion

Order in the sequence of 25
Vignettes 1-8

35

48

52

Vignettes 9-16

30

47

53

Vignettes 17-25

32

48

52

Number of elements
2

38

55

45

3

33

53

47

4

31

48

52

5

32

42

58

Table 2 also shows no effect of number of elements in terms of affecting the likelihood to reach agreement. There is, however, a quite strong and inverse covariation between the number of elements in the vignette and the selection of a positive emotion. Shorter vignettes are perceived as more likely to generate a positive emotional response by Iran, perhaps because the terms are defined, and the permission is direct. That is, shorter vignettes may leave less ‘wiggle room’, ‘and less ‘fine print’ in the agreement.

The final topic of our surface is analysis is to get a sense of how the respondents feel about what they are reading. Question 1 allows us a sense of whether respondents feel optimistic about the process, viz., that it will happen, or feel pessimistic. Question 2 give us a sense of their emotions. Let us average the ratings from their reactions to their own 25 vignettes, independent of what is in the vignettes. (Although, we know that each element appears equally often in the 25 vignettes; it’s just the combinations which vary).

Figure 2 shows a scatterplot of the average score for ‘reach agreement’ (% rating 7-9) vs. the average percent of selections of a positive emotion. Figure 2 shows a concentration of respondents on the left, with low average value of TOP3. We conclude from this that the individual respondents, on average, feel that the agreement will not be reached. There is no sense, however of a preponderance of emotions. Respondents simply do not seem to be able to figure out what the feelings of the Iranians will be a finding which should not surprise. Response can feel strongly about the outcome but not feel strongly about the expected feelings emerging from that outcome.

fig 2

Figure 2: Scatterplot showing the average ratings for reach agreement (abscissa, TOP3) versus the percent of times that a positive emotion will be experienced by the Iranians.

Step 6 –Relate the Elements to the Ratings

As of today’s state-of-the-art, the pinnacle of the analysis is the ability to relate the presence / absence of the 20 elements to the response, whether the response be the TOP3 (strong likelihood of that there will be an agreement), or the selection of a positive emotion, and finally the selection of a negative emotion. Mathematically, the selection of positive versus the selection of negative emotions are complements of each other. We will be dealing with both, because in our presentation of data will look only at strong performing elements driving positive emotions, and strong performing emotions driving negative emotions, and in turn NOT presenting data from elements which do not strongly engage of or the other.

The experimental design allows us to create both group models and individual-level models relating the presence/absence of the 20 elements to the response. The original design was set up to allow a simple regression equation to describe the data: Response = k0 + k1(A1) + k2(A2) … k20(E4). Recall that each respondent evaluated a unique set of 25 vignettes, comprising a permuted variation of the original design, a variation known to ‘work’, viz., to mathematically identically to the original design.

The first analysis created models relating the presence/absence of the elements to the actual rating of Question 1 on the 9-point scale. Although we will be looking at a transformed variable (TOP3 instead of the 9-point rating), it is instructive to see the degree to which our 85 respondents generate data which is consistent. We measure consistency by estimating the equation, and computing the goodness of fit, the multiple R, the multiple correlation. The multiple R goes from 0.00 (no fit of the variables to the ratings; totally inconsistent results) to +1.00 (perfect fit of the variables to the ratings, totally consistent results which trace the ratings precisely to the presence/absence of the elements).

Figure 3 shows the distribution of the 85 ratings. We can feel confident about the data. Even though most respondents feel that they are ‘guessing’, that they cannot figure out the ‘correct answer,’ our estimation of consistency suggests that the results are reasonably consistent.

fif 3

Figure 3: Consistency of the results for the 85 respondents, shown by the Multiple R statistic estimated from the individual-level multiple linear regressions.

Step 7: Divide the Respondents by the Pattern of the Coefficients to Create Mind-sets

Our last analysis divides the respondents by the pattern of their coefficients. For each respondent we create a model or equation whose dependent variable is TOP3, previously defined as taking on one of two values. The values depend upon the original rating of Q1, the probability of reaching an agreement. Recall that ratings of Q1 1-6 were coded 0, ratings of 7-9 were coded 100.

The database generated from the individual-level regressions comprises 85 rows, one row corresponding to each respondent. Each row comprises 21 columns, one column for the additive constant, and 20 columns for the 20 coefficients. The objective of clustering is to divide this group of 85 ‘objects,’ viz respondents into a limited number of non-overlapping groups, the clusters or mind-sets, based upon a mathematical criterion. The criterion does not require the researcher to know the ‘meaning’ of the measures, viz., in this case the coefficients, but simply to have each object quantified on each measure. Thus, we have 85 objects (people) on 20 measures (coefficients). We do not consider the additive constant in the process.

The clustering program is a heuristic. There are many different clustering programs. The program used here is k-means (Likas et. al., 2003), with the objective of putting the 85 people into either two groups (analytic pass 1) or three groups (analytic pass 2). The criteria are that the profiles of the 20 averages (one per coefficient A1-E4) should be ‘far away from each other’, and the distance between the objects or people in a cluster should be as small as possible. The criterion for distance is (1-Pearson Correlation Coefficient, R). The Pearson R shows the strength of a linear relation between two variables, taking on the value +1 (viz., Distance = 0) when they are perfectly linearly related, and taking on the value -1 (viz., distance = 2) when they are perfectly inversely related Our criteria for choosing the ‘best’ number of clusters combines a desire for parsimony (fewer clusters are better than more clusters), and interpretability (the clusters must tell a coherent story, and the stories of the clusters must differ from one another).

The two-cluster solution, although parsimonious, seemed too jumbled. There was no clear story. The three-cluster solution seemed a bit better. A four-cluster solution was virtually no different in types of groups than the three-cluster solutions. That is, two of the clusters in the four-cluster solution seemed quite similar. The decision was to work with a three-cluster solution.

In the language of Mind Genomics, the cluster becomes a mind-set, a way of responding to a limited set of related stimuli. The min-sets are constructed from the patterns of the coefficients form the 85 respondents who participated in this study. Over the years, the mind-sets which emerge from these focused, quite small studies, continue to repeat. The repetition comes about because when we abstract the type of individual based upon the pattern of responses, we end up with just a few really quite different groups. The psychologists called the ‘archetypes’, but the archetypes emerging from Mind Genomics are based on small, single-focus studies. Yet, again and again, these mind-sets continue to appear in many different ways. The great anthropologist, Joseph [12], would call this the ‘hero with a thousand faces.’

Step 8 – The Total Panel and the Mind-sets

The Mind Genomics effort naturally brings with it many numbers, for this study 21 numbers for each group, or 84 numbers for the combination of total panel and the three mind-sets. The objective of these studies is to find patterns, and not to overwhelm ourselves with numbers which may end up disguising the patterns in the dense undergrowth of numbers. To counteract the death by wall of numbers were show only positive coefficients of 8or higher. These strong performer in a Mind Genomics study. We may be losing some information by this stringent cutoff, but a coefficient of +8 or higher is strongly significant from the regression modeling, with a t statistic approaching 2.0.

Table 3 shows the total panel and the three mind-sets, created for the results from Question 1, on the likelihood of an agreement. The cluster uses the coefficient emerging when TOP3 is the dependent variable. The table shows base size first, then the additive constant, and then the strong performing elements for each mind-set.

Table 3: Performance of the strong performing elements for total panel and three emergent mind-sets. Only the seven elements with coefficients of +8 or higher are shown.

table 3

The additive constants are 32-38 meaning that without additional information, but just knowing that there are negotiations, about one in three responses to the vignettes are 7-9. We know this because the additive constant tells us the likelihood of a rating of 7-9 in the absence of elements, and is a purely theoretical, computed value. Nonetheless, the additive constant gives us a good sense of basic response. It is remarkable that all three mind-sets agree so well. This is unusual. The agreement means we are dealing with specifics.

When we look at the column for total panel, we find NO strong performing elements that disappointing finding does not mean that we failed in this attempt, although it might mean failure. Our success in the study comes after we deconstruct the total panel into the three groups, based upon patterns of coefficients, not upon magnitude of coefficients. That is, our three mind-sets would have emerged if all of the coefficients were equally reduced by 20 points. In such a case three mind-sets would emerge from the patterns, but NO elements would emerge as being strong.

Before we go into the three mind-sets, which is now quite simple, it’s worth remarking that we began with 20 elements, the best guesses from people involved. Yet, only seven of the 20 elements emerged as strong, no elements emerged as strong for total, and surprisingly, each strong performing element appeared strong only in one of the three mind-sets.

The min-sets are easy to describe. One simply looks at the strongest element.

Mind-Set 1 = Focus on military aspects (prevention) – 29 of the 85 respondents

Mind-Set 2 Focus on economic development – 45 of the 85 respondents

Mind-Set 3 – Focus on effective negotiations and diplomacy – 11 of the 85 respondents.

We move now to the elements which drive strong positive and strong negative responses. The coefficients in Table 4 emerge from six regressions. The six regression comprised three regressions for the selection of a net positive emotion, and three regressions for the selection of a net negative, in both cases two regressions for each mind-set, respectively. The regression model was run without the additive constant, because of the previously conventions in Mind Genomics practice, that emotions and other selections emerging from the nominal scales are estimated without coefficients.

Table 4: Strong positive and negative emotions selected by the respondents from the three mind-sets as they think about the feeling emerging from Iran, as driven by the element. Only coefficients of +16 or higher are shown.

table 4(1)

table 4(2)

This time we look only the elements which drive a percent selection of 16% or more, for either a positive or a negative emotion. Table 4 shows us that only one mind-set, MS1 (focus on military aspects, prevention) feel that there will a strong positive response. All three mind-sets feel that there will be a strong negative emotion from Iran.

Discussion and Implications

When this study was executed in 2016, Mind Genomics was just beginnings its broader application to international relations, having begun in 2012 with studies of the Israeli Palestinian conflict. The realization at that time, confirmed by many subsequent studies in a variety of areas, is the relative paucity of solid information about the mind of the citizen in the world of social issues, the mind of the customer in the world of commerce, the mind of the patient in medicine, the mind of the client in legal and business issues, and so forth. There were dozens of polls, dozens of learned volumes on key issues, the ongoing broadcasting, and increasing ‘natter’ of the media with ‘talking head’ proclaiming the same new, spun one or another way.

A cursory content analysis of the literature, of the media, and so forth brings out facts, histories, opinions, and the voice of the citizen. The voice of the citizen, however, appears to be limited to simple factoids, statements, voting on issues. Furthermore, there seemed to be a desire to compare changes, and by that comparison to get a sense of where things were going. In other words, the focus was on the macro, with little content, and the depth was assumed to emerge by observing the path of the macro trends over time, perhaps with an effort to see how the trend covaries with exogenous factors, like world order world economics, and so forth. And perhaps even the world’s ‘Zeitgeist’ although Zeitgeist might be more the bias of the analyst than the reality of the items. There are examples of iterated efforts, such as China’s policy [13], but these iterations are large-scale, in the manner of iterating products, rather than ideas.

Enter Mind Genomics, here presented as the first experiment on international relations, at a time when Mind Genomics was conceived of as a one-off process, requiring a lot of thinking, a great deal of expertise for choosing the ‘right material’, and the careful efforts which accompany a scientific project. There were 85 respondents, rather than the customary hundreds of respondents, but that is not a problem. the problem here is the fact that the Mind Genomics study at that time was considered as a final effort, a one time ‘deep dive’ into the mind of the citizen. And the results are what they were, pointing to different mind-sets, but with remarkably few elements performing strongly, either in terms of driving agreement or driving emotions.

The methods of Mind Genomics have been proven again and again, in the legal, [14] medical [15] and commercial realms [16]. In those realms, the efforts of Mind Genomics have evolved from one-off, large-scale studies with 36 elements down to the current size of 16 elements (four questions and four answers to each question). The notion of the ‘final experiment’ has given way to Mind Genomics as a fast, iterative, learning=based process. Within that world-view, this study would be updated by a series of short studies, each requiring about 60 minutes to set up on publicly available program (www.BimiLeap.com), and then executed with 50-100 respondents automatically with 60-90 minutes, and the entire data set totally analyzed 10 minutes, and returned to the researcher. One might imagine the use of the iteration as a way both to arrive at good ideas, acceptable to both sides, as well as a consensus-building method, wherein both sides cooperate, and thus build good will.

In the evolution of political science, and the evolution of knowledge of people, these early studies by Mind Genomics of political issues show the potential of a systematic exploration of a topic. When that exploration becomes inexpensive, quick, easy to execute on the internet, and most importantly, ITERATIVE, we have the potential a new political science, one based upon data, extending across many countries, many people, over time, and many topics [17-19]. What was one study in 2016 could well generate a wiki of the mind for the topic of dealing with Iran, that ‘wiki’ filled with data, topic-related, and searchable for specific results and for general patterns [20-22].

Acknowledgments

The author would like to acknowledge the help of four associates who helped to design the study.

References

  1. Garrison JA (2003) Foreign policy analysis in 20/20: a symposium. International Studies Review 5: 155-202.
  2. Rametsteiner E, Pülzl H, Alkan-Olsson J, Frederiksen P (2011) Sustainability indicator development—Science or political negotiation? Ecological Indicators 11: 61-70.
  3. Gadarian SK (2010) The politics of threat: How terrorism news shapes foreign policy attitudes. The Journal of Politics 72: 469-483.
  4. Wynn DC, Eckert CM (2017) Perspectives on iteration in design and development. Research in Engineering Design 28:153-184
  5. Druckman JN, Greene DP, Kuklinski JH, Lupia A eds., (2011) Cambridge Handbook of Experimental Political Science. Cambridge University Press.
  6. Morton RB, Williams KC (2010) Experimental political science and the study of causality: From nature to the lab. Cambridge University Press.
  7. Kinder DR, Palfrey TR (1993) On behalf of an experimental political science. In: Experimental Foundations of Political Science (Kinder, D.R. and Palfrey, T.R. eds). 1-39,
  8. Kittel B, Luhan W, Morton R eds., (2012) Experimental political science: Principles and practices. Springer.
  9. McDermott R (2002) Experimental methods in political science. Annual Review of Political Science 5: 31-61.
  10. Gere A Radvanyi D, Moskowitz H (2017) The Mind Genomics Metaphor-From Measuring the Every-Day to Sequencing the Mind. International Journal of Genomics Data Mining IJGD-110. DOI, 10.
  11. Moskowitz HR, Gofman A, Beckley J, Ashman H (2006) Founding a new science: Mind Genomics. Journal of Sensory Studies 21: 266-307.
  12. Campbell J (1949) The Hero with a Thousand Faces, New York, Pantheon.
  13. Leutert W (2021) Innovation through iteration: Policy feedback loops in China’s economic reform. World Development 138: 105-173.
  14. Wren JE, Williams TC (2009) Selling blue elephants to the jury: Potential application of rule developing experimentation in litigation. Baylor Law Review 61: 1.
  15. Gabay G, Moskowitz HR (2019) “Are we there yet?” Mind-Genomics and data-driven personalized health plans. In: The Cross-Disciplinary Perspectives of Management: Challenges and Opportunities. Emerald Publishing Limited.
  16. Milutinovic V, Salom J (2016) Mind Genomics: A Guide to Data-Driven Marketing Strategy. Springer.
  17. Kaarbo, J., 2003. Foreign policy analysis in the twenty-first century: back to comparison, forward to identity and ideas. International Studies Review 5: 156-202.
  18. Horiuchi Y, Smith DM, Yamamoto T (2018) Measuring voters’ multidimensional policy preferences with conjoint analysis: Application to Japan’s 2014 election. Political Analysis 26: 190-209
  19. Rapport A (2017) Cognitive Approaches to Foreign Policy Analysis. In Oxford Research Encyclopedia of Politics.
  20. Garrison JA (2003) Foreign policy analysis in 20/20: a symposium. International Studies Review 5: 155-202.
  21. Likas A, Vlassis N, Verbeek JJ (2003) The global k-means clustering algorithm. Pattern Recognition 36: 451-461.
  22. Radványi D, Gere A, Moskowitz HR (2020) The Mind of Sustainability: A Mind Genomics Cartography. International Journal of R&D Innovation Strategy (IJRDIS) 2: 22-43.

Talking Across Divisions Inside a Community, and Across Lines of Hatred: The Contribution of Mind Genomics

DOI: 10.31038/MGSPE.2022212

Abstract

We present the results of two Mind Genomics cartographies, each focusing on the discovery of common points of view in areas of political disagreement (discussions about Israel among New York City Jews), and areas of open hostility (discussions about what is needed to stop hostilities and begin a peaceful future enjoyed by Palestinians and Israelis). The cartographies searched for specific messages which drive respondents to feel that these messages ‘will work.’. We suggest that an iterative, inexpensive, rapid set of such cartographies can quickly reveal common mind-sets in mutually argumentative and even openly hostile populations. The promise of such iteration is the discovery of topics of mutual interest and agreement in a manner which is practical, which increases insight and wisdom, and which can produce reference databases about the mind of the antagonist, becoming a guide for productive negotiations. We suggest that the effort to find the ‘right messages’ through extensively reasoned efforts followed by an effort to validate these messages be replaced by a mechanistic, iterative, rapid, inexpensive system requiring just a few hours from start-to-finish for each iteration.

Introduction

The world of people is no stranger to difficult issues. Whether the issues are people vs. the environment (viz., global warming), people vs. economic realities (we all cannot really live equally well), or people vs. people (long standing political disagreements, quick starting personal disagreements), there are always conflicts. And there are no prospects for the conflicts to end, or even to be resolved simply. Efforts as grand as the League of Nations and the United Nations, or as intimate as couples counseling continue to reveal the almost absolute impossibility of imposing harmony in an environment when there are different goals, different viewpoints, different levels of power and influence.

The foregoing is a truism. Anyone reading newspapers, sitting in a political debate, or sitting in a home with adolescent children and their parents know about the need to find ways to have meaningful conversations. The real issue is how to do it. Conversations themselves will not solve problems, but without the conversations the problems will never be solved, except through force. And force will not keep the problem solved when the balance of power shifts, when the anger builds. Conversations will help the parties involved come to an agreement, accepting each other. This paper focuses on two difficult problems, one involving the New York Community of identified Jewish people, and the other involving Palestinians and Israelis. The objective of both studies was to assess whether one apply a method hitherto used by marketers (Mind Genomics) to issues of public discourse, and specifically, divisions about Israel. The first was from the point of view of Jews in the United States, where there are many opinions about Israel, not all positive, not all negative [1-5]. The second was from the point of view of self-described Israelis and Palestinians [6-9]. The two projects were run during the two-year period 2012-2014 to determine what Mind Genomics might contribute.

Moving from Opinion to Experiment

It is obvious to anyone who observes the behavior of people, whether dealing in the worlds of goods or services that people differ from each other. Differences can end up being a simply a nagging reality which gets in the way of efficient activities, whether social, economic, and so forth. Indeed, there is an old French proverb, translated into English as ‘Of taste one does not dispute.’ The smart professional knows these differences exist, the experienced professional knows about the nature of these differences, and the effective professional knows how to work with these differences to achieve objectives. In their minds people live in different worlds; one size does not fit all. People need to hear different things. The smart marketer recognizes these different worlds, often establishing them by one or another research effort such as focus groups, in-depth interviews, surveys, and now more recently observing the behavior of a person over time in terms of what the person searches for or how the person shops on the Internet. The smart marketer then digests this information and feeds back a (presumably) motivating offer to the individual using messages which seem to be in line with what the person has done, said, or even looked at.

How can this knowledge-based approach be used in situations where there is natural disagreement, conflict? Is there a way to deeply understand the mind of people in conflict, whether the conflict is open and mutually aggressive, like war, or simple civil disagreement? In other words, if the knowledge-based approach can be used to sell soap, can it be used to sell or at least to message ‘peace’.

The Mind Genomics Worldview

In the 1960’s mathematical psychologists R. Duncan Luce and Patrick Suppes introduced what then was an esoteric paper, presented in the first issue of the Journal of Mathematical Psychology, and as the first paper of that issue. The title of the paper was daunting: Simultaneous conjoint measurement: A new type of fundamental measurement [10]. The focus of psychologists in the 1960’s was to establish the science of measurement, doing so in what was called the ‘axiomatic measurement’. The elegance was at first mathematical. Over the years, the importance of the thinking behind this new method, conjoint measurement, would overshadow the mathematical elegance. This then-esoteric approach would be a way to deep, often profound knowledge about how people think, knowledge that could be applied in a practical way to problems of everyday life. Conflict is one of those problems.

The basic idea behind conjoint measurement is that one could ‘measure’ ideas by putting them in combinations, getting responses to the combinations, and somehow deconstructing the response to the contribution of the separate ideas. The mathematics of the approach, the various postulates, lemmas, and so forth, are no longer of interest to most people, although remain of great import to mathematical psychologists. What is important is the notion that by measuring responses to combinations which simulate ‘reality’, one can deduce the part-worth contribution of each component of the combination.

The immediate importance of this discovery comes from the realization that the typical approach in science including social science, is to isolate the factors, control everything, and measure the response to those factors. Thus, in a study of conflict, for example, or in a study of tomato sauce in contrast, one might look at a set of single factors in a questionnaire and ask how important the factor is to drive negotiations for conflict or drive acceptance for tomato. The process breaks down for tomato sauce because tomato sauce is meaningless unless the mixture is created. Asking a person ‘how important is sweetness’ in tomato sauce is meaningless because the taste profile and smell and appearance profiles must be correctly balanced. So, when it comes to products, importance is not a meaningful topic. It is the mixture.

Moving now to conflict, it is hard to understand how to rate ‘openness to negotiation’ vs. rating ‘Having evidence about one’s point of view’, in terms of importance. It can be done. Most questions about ‘importance’ and aspects of the topic rely on this one-at-a-time effort. The effort certainly does not work for products, although it may work for more complete descriptions of products. The effort may or may not work for the topic of ‘discussions’, although showing that the one-at-a-time approach does not work for topics of ‘discussions’ and ‘arguments’ is harder to prove because we are dealing with simple ideas which have meaning.as.

Evolving from Compound Mixtures to Systematic Variation – The Contribution of Mind Genomics

Mind Genomics emerged in the early 1980’s, with work done under contract for a number of companies, one of which deserves both acknowledgment and thanks. This was the Colgate Palmolive Company of Canada, and its visionary general manager at the time, the late Mr. Court Shepard. As the general manager, it was Mr. Shepard’s simple objective to increase the company’s sales, rather than to simply do his job well and protect his job in any way he could. Mr. Shepard confessed at a meeting that he did not know what to say about Colgate Dental Cream to increase sales, a statement which led to the discussion of how a ‘different’, and possibly more complex but powerful method might help. The method involved mixing messages together in a systematized way using the statistical discipline of experimental design, presenting the combinations, obtaining ratings to the combinations, deconstructing the ratings to the contribution of the different messages, and then discovering which messages ‘worked’. To his credit, Mr. Shepard said ‘yes’, and within a week the study was run, analyzed, and the results implemented. Sales increased. The lesson from that early experiment, fall, 1980, was that systematics work. The respondent, the person evaluating the test combinations need not be an expert. In fact, what happened was that the respondent became disinterested in the task, and answered almost ‘automatically’, without thinking.

The approach ended up descending deeply into the mind of the respondent, even for such a mundane product as toothpaste or dental cream. What becomes important in this regard is that the results could not be faked. There could emerge a ‘stance,’ driven by one’s conscious beliefs. The mixtures of messages prescribed by experimental design, whether of dental cream or of social issues and feelings, were simply too hard to disentangle at an intellectual level. When the messages comprised three or four different ideas, seemingly thrown together, even the person who wants to ‘fake’ the study cannot figure out what to do to bias the results. One could answer randomly, but that is quickly revealed by a statistical analysis of how well the ratings co-vary with the presence/absence of the elements. In the end, the respondent relaxes, and in a somewhat bored way, reads the vignettes, and ‘guesses’.

To summarize the first part of the Mind Genomics effort emerged from the creation of mixtures of messages (elements) using experimental design, the evaluation of these mixtures by respondents, and then the deconstruction of the responses to the contributory impacts of the separate elements. There is a second part of this, one which is just as important. This second part is the discovery of mind-sets, of groups of people who respond in similar ways to sets of elements. These groups, mind-sets, are not necessarily similar in who they are, or what they buy. They are similar in the pattern of their responses to the elements but may be radically different otherwise. Yet, knowing these mind-sets allows the marketer to tailor the messages to a mind-set. That knowledge would prove invaluable for marketers, because it was simple to change the message in a knowing way to appeal to the mind-set. The discovery seemed to be like having an experienced salesperson involved in every messaging effort, a person who would know ‘what works.’ Only there was no person, just a simple algorithm to create these mind-sets, and then to uncover these mind-sets in new populations, groups who may never even have been encountered before.

Applications of Mind Genomics

The foregoing presented the theory of Mind Genomics. The two experiments presented here show the approach of Mind Genomics to issues of prospective conversations about Israel first, and then the Palestinians and Israel. The objective of the two experiments, both done around 2012, ten years ago, was to identify the common topics of conversation which could heal potential fractures in the relationship of people. The Mind Genomics process follows a set design and analysis approaches, created to produce ‘actionable’ data sets in days, and thus be amenable to continual improvement, at low cost, and in a speedy, efficient, knowledge-building way.

The background and processes of Mind Genomics have been written about for more than 15 years, and can be found in a variety of papers, some dealing with the general method and applications (e.g., [11]) others dealing in more depth with specific applications, such as the law [12], charity donations [13], environmental considerations [14], digital marketing [15], and so forth. Some of the seminal experiences in the formation of the emerging science of Mind Genomics appeared almost 15 years ago in a book Selling Blue Elephants: How to Make Great Products that People Want Before They Even Know They Want Them [16].

The Mind Genomics process follows these seven steps:

Step 1 – Define the Topic, Create a Set of Questions Which Elaborate the Topic, and for Each Question Create a Set of Answers

The Mind Genomics ‘template’ provides a structured system to focus the researcher’s effort. For these two projects presented in this paper, the experimental design comprises a topic, six questions elaborating the topic, and in turn six answers to each question. It is important to keep in mind that the Mind Genomics effort lends itself naturally to fast feedback and iteration. Thus, the elements need not be worked and reworked until ‘perfect.’ Rather, it suffices to have a reasonable set of elements. It is very straightforward to run the study, considering it as a first iteration. The results, when returned, can always be improved, and the study re-run in a few hours using new elements to replace the elements which did not perform well.

Step 2: Create Vignettes, Combinations of Elements

The vignettes are put together according to an underlying plan, the so-called experimental design [17]. The design for these studies prescribed precisely 48 combinations, vignettes, 36 of these vignettes comprising four elements, 12 of these vignettes comprising 3 elements. Each element appears exactly five times in 48 combinations and absent from the remaining 43 combinations.

An important feature of Mind Genomics is the ability to cover as much of the design space as possible. The design space is another way of describing the many possible combinations that could emerge from creating 48 vignettes, and it is in this precise point that Mind Genomics differs from conventional research. Conventional research would create 48 vignettes, and then have many respondents test the same 48 vignettes, with the objective of reducing the variability of measurement. That is, conventional research implicitly limits the focus of the effort, creating what is thought to be correct, and spending the time, money, and effort on validating the guess. There is little learning to be gained as one goes along the research path. The hope is that the research can ‘intuit’ what to do next when the effort fails, recognizing that the research steps are not iterative, but rather evaluative. Iteration thinking is not built in, but rather becomes an unwanted necessary step when the research fails to confirm the ingoing intuitions manifested in the test stimuli, here the 48 vignettes combining the 36 elements.

In contrast to the above, Mind Genomics takes as its cue the approach represented by the MRI, the magnetic resonance imaging, used in medicine. The MRI takes many pictures of the underlying tissue, each picture from a different angle. Afterwards, through a computer program, the MRI combines these pictures to get a better idea of the underlying tissue, one in three dimensions. No single ‘picture’ is right. Each picture is ‘noisy’, and not useful by itself, but it is the pattern emerging after combining the pictures which is realistic.

Step 3: Define the Rating Scale

The rating scale is the way that the respondent can communicate with the research and give her or his opinion. In these two studies, the rating scales were 9-point scales (Likert or category scales), anchored at each end.

The 9-point scale is simple, easy to use. The ratings for the scale, however, the nine points, are hard to understand for the manager, despite being easy and widely accepted by researchers. Common practice for the past decades is to transform the scale to a binary scale, a yes/no scale. Managers can easily understand the scale. Ratings of 1-6 were transformed to 0; ratings of 7-9 were transformed to 100. This transform converted the scale to a format that managers can more easily understand. The transformation is accompanied by the addition of a vanishingly small random number (~ 10-4). This small number prevents the analysis program (OLS, ordinary least-squares regression) from ‘crashing’ when it tried to deal with a set of data all of which have either value 0 (all vignettes had been rated 1-6), or values of 100 (all vignettes had been rated 7-9).

Step 4: Invite the Respondents to Participate

The respondents are invited by professional groups, called online panel providers. It is always tempting to save money and provide panelists from one’s ‘network’, but the reduced cost turns of out to be one of the most expensive ‘savings.’ With 304 respondents participating for the New York study, and with 158 respondents for the Israel Palestine study (about half Israelis, half Palestinians), the judicious approach is to hire a professional organization to provide the panelists. The organization does so at a reasonable fee, which allowed each study to be completed in less than 24-48 hours, without effort by the researcher.

Step 5: Orient the Respondents in the Task

It is best to provide as little information as possible about what is really expected, and instead simple introduce what the study is about, and some of the necessary information, such as the length of the interview (very important), the fact that the all the vignettes are different, and that there are either one or two rating scales. Often respondents who participate, evaluating 48 vignettes, feel sure that they have ‘seen this vignette before.’ They could not have, but it matters little, and it is important to assure them that they are seeing stimuli that have been meaningfully crafted.

Step 6: Create Equations (Models) Relating the Presence/Absence of the 36 Elements to the Binary Ratings (0/100)

The equation is written as: Dependent Variable (Top 3) = k0 + k1(A1) + k2(A2) … k36(F6). The foregoing equation deconstructs the response to the vignettes, so that we begin with an additive constant, and then estimate the part-worth contribution of each element to the dependent variable. The additive constant is the estimated value of the dependent variable (0 or 100), in the absence of any of the 36 elements.

The additive constant is a purely estimated parameter. It has no real existence, but it can be used to estimate the proclivity of the respondent to rate a vignette as 7-9 in the absence of elements. Of course, by design, all of the vignettes comprised 3-4 elements, so the additive constant cannot really exist. Nonetheless, as we will see, the additive constant gives us a sense of the degree to which a respondent is ‘ready’ to say something, even without evidence.

When we see high additive constants, we can be sure that the respondents feel strongly and positively towards the topic. In contrast when we see low additive constants, we can feel strongly that the respondent is not predisposed to rate the vignettes high but rather waits for the momentum imparted by just the right elements to carry matters forward.

The 36 coefficients each reflect the marginal, or part-worth contribution of the individual element to the value of TOP3. When the coefficient is 0, we conclude that the element has no ability to drive the response. When the coefficient is positive, we conclude that adding the element to a vignette increases the percent of respondents rating that vignette 7-9. For example, a coefficient of +5 for an element means that when the element appears in the vignette, an addition 5% of the responses will be 7-9. In contrast, when the coefficient turns out to be -5, we conclude that when the element appears in the vignette, 5% fewer of the responses will be 7-9. We don’t know whether the 5% fewer will migrate to very strong negatives (viz., 1-3) or migrate to mere indifferences (viz., ratings of 4-6).

From the point of view of statistics, the coefficients usually end up with standard errors of approximately 4-5, meaning that we should pay strong attention to elements with coefficients of 8 or greater. We should pay attention to all positive coefficients, but the elements with high positive coefficients, 8 or greater are really important.

The Mind Genomics method ends up producing many numbers. For example, just looking at the total panel coefficient can be overwhelming. There are 37 numbers to consider when searching for a pattern, the additive constant and be coefficient for each element A good practice, one adopted here, is to present only those coefficients that are noticeably positive (2 or higher) and ignore those coefficients which are 1 or lower. Furthermore, when an element has no coefficients for any group which are positive, it is not instructive to present that element. The element ends up taking up room, and not teaching anything. In the data tables presented later in this paper many elements do not appear because they fail to produce impactful statements.

Step 7: Create Individual Level Models and Use the Coefficients as Inputs to Clustering

Clustering will identify new-to-the-world groups (mind-sets) based on the patterns of responses to the messages. We are taught to think of people in terms of who they ARE, what they DO, and what they say they THINK/BELIEVE. Marketers call this segmentation.

The standard ways of dividing people, so-called geo-demographics, can generate a large vector of information about a person, based upon gender, age, income, education, marital status, and so forth. In the 1960’s, William Wells, a market researcher working in advertising introduced the notion of psychographic segmentation [18], a way to divide people by the pattern of what they believed when the topics were lifestyle, beliefs, etc., so-called macro-topics. Today’s technologies allow people to be divided by more micro-patterns, such as the way they search on the Internet for specific ‘things.’

In the spirit of dividing people, Mind Genomics looks for groups as well, but this time groups based upon the pattern of responses to a limited, focused issue. These are called mind-sets. A mind-set comprises individuals who think alike in a limited topic, such as the patterns of discussions that they prefer (viz. mind-sets emerging from Study 1 on Jewish discussions or mind-sets emerging from Study 2 on positive outcomes in the conflict between Israelis and Palestinians). The mind-sets are obtained from the pattern of coefficients of the respondents who participated. Recall that each respondent evaluated a unique set of vignettes, but that the mathematical structure of the 48 combinations evaluated by each respondent was the same. The 48 combinations sufficed for a valid experimental design that one creates the set of coefficients for each respondent separately. It is the set of 36 coefficients for each respondent in the study which becomes the basis on which individuals are separated into mind-sets. Individuals with ‘similar’ patterns of 36 coefficients are put into a cluster or mind-set by a mathematical algorithm (k-means; [19]). The outcome is a small set of clusters, which comprise individuals within a cluster having similar patterns of coefficients, and with the patterns of averages of the 36 coefficients different from cluster to cluster. One might envision this as a set of globes, far away from each other (the clusters or mind-sets), but a group of points (respondents) swirling around inside the globe and being close to each other. The number of such mind-sets is left to the researcher. Two criteria have been used to select the number of clusters, parsimony and interpretability, respectively. Parsimony refers to the number of clusters or mind-sets. Fewer is better. Interpretability refers to the fact that the pattern of coefficients, the strong performing elements are similar, and tell a ‘coherent story.’ Not a perfect story, of course, but something which seems to make sense.

As the number of clusters increases, parsimony decreases, but interpretability increases. The act of clustering respondents calls into play a balancing act between creating sets of respondents whose data can be easily understand, and creating at the same time a large number of such groups, so that at the end of the process one is not sure whether the clusters or mind-sets are ‘real’ They may tell interesting stories, but there may be simply too many clusters on which to make generalizations.

We now move to the two studies, first the study of a cohesive group, the Jewish population of New York, and then study of two historically opposed populations, Palestinians and Israelis. Both studies are about discussion, about finding common ground, the first with New York City Jews to bring an ethnic group together, the second with Palestinians and Israelis to reduce tension, and begin to bring the groups together.

Study 1: Search for Common Ground for Discussions about Israel among NYC Self-defined Jews

This study was run under to aegis of Dr. Jonathan Cummings of the Jewish Community Relations Council of New York to determine the features of a venue for productive conversations. We show the elements, the mind-sets, and then where relevant information about the mind-sets (for study 2). Table 1 presents the elements.

Table 1: Elements for the Mind Genomics study regarding common ground for discussions about Israel among NY self-defined Jews.

Question A: What kind of activity is it?
A1 A highly structured single meeting… where people feel free to disagree with each other
A2 People sharing ideas/feelings during a highly structured single meeting
A3 People sharing ideas/feelings during a single meeting with no clear structure
A4 Several highly structured meetings…where people feel free to disagree with each other
A5 People sharing ideas/feelings during several highly structured meetings
A6 People sharing ideas/feelings during several meetings with no clear structure
Question B: Who provides the content?
B1 Group members give presentations… then open the discussion to everyone
B2 A facilitator presents a topic… then opens it up for discussion
B3 A prestigious speaker is invited to the meeting… then every gets a chance to present their views or ask questions
B4 No preparation… whatever is the hot topic of the day
B5 Studying important historical texts… then open discussion
B6 Current events about Israel… then open to Q&A
Question C: What is talked about?
C1 Discuss the peace process between Israelis and Palestinians
C2 Talk about the American Jewish community… their views, their concerns, what’s near and dear to their heart
C3 Talk about the Israel you love!
C4 Discuss how you can stop American Jews from fighting about Israel
C5 Discuss how Israel is part of my Jewish identity or heritage
C6 Discuss Israeli arts and culture as a way to understand Israel better
Question D: Who should be in this conversation?
D1 With people who have a different perspective
D2 With people who want to get to know you personally…to really understand how you think
D3 With people who are very knowledgeable about Israel’s history and current affairs
D4 With people who already have a strong standpoint about Israeli
D5 With individuals who rarely consider Israel in their day-to-day lives
D6 With individuals who are concerned about the divisions in the Jewish community about Israel
Question E: What are the outcomes?
E1 After the meeting, you decide who’s right and who’s wrong
E2 Hear other people’s views and learn how they think about a particular issue
E3 Get to meet and mingle with interesting people
E4 Understand the range of feelings and thoughts on a particular topic
E5 You continue to meet and work together on Israel activities
E6 Nothing changes, but you enjoy it nevertheless
Question F: Where is the venue?
F1 In someone’s living room
F2 In a classroom
F3 At a synagogue
F4 In a conference room at someone’s office
F5 In a restaurant
F6 Over dinner in your home

The orientation was simple, focusing primarily on the process, and providing few specifics about the topic. It is the topic which will be ‘particularized through the elements.

Today you will be taking a survey regarding conversations about Israel in New York’s Jewish Community. Sometimes, talking about Israel can be difficult. Sometimes, we may not want to talk about Israel at all. We are interested in finding out what might make those conversations more satisfying and would like to know your opinion regarding different kinds of conversations with others in the local Jewish community, outside of your inner circle of contacts and friends. It will take you between 10-15 minutes to complete the survey. During this survey, we will show you several scenarios describing different conversations in various discussion settings. Although they may seem similar, please note that each screen combination is UNIQUE.

You will be asked the same question for each test screen: How satisfying would a conversation about Israel be with members of the Jewish community with whom you do not generally converse based on the above: 1 = not at all satisfying…, 9 = very satisfying

Figure 1 shows a sample vignette that the respondent would see, except for the boxed information on the left. These are the ‘questions’, which the respondent never sees. The role of the question is to provide a stimulus for the six different answers.
fig 1

Figure 1: Example of a 4-element vignette shown to the respondent. The respondent does not see the boxed information on the left.

The study was run with 304 respondents. Table 2 shows the strong performing elements. Table 2 suggests that:

Table 2: Result from models for the conversations about Israel among NYC Jews (Study 1).
table 2

  1. The basic level of expected satisfaction from the conversation (additive constant) is moderate for total, for Mind-Set 1 and Mind-Set 2, but quite low for Mind-Set 3
  2. No element drives a feeling of strong satisfaction when we look at the total panel of 304 self-identified Jews in the New York region. The 304 respondents would be considered a homogeneous group, discussing a topic of concern among Jews.
  3. The data suggests dramatically different mind-sets. What appear to be irrelevant elements at the level of the total panel end up being strong performers for the mind-sets?

Study 2: Discussion among Palestinians and Israelis Regarding What Will It Take to End the Conflict (Question 1) and Create Lasting Peace (Question 2)

The objective of Study 2 was to develop a system which could deal with conflicts in a way consonant with the vision of Mind Genomics, namely treat the issue as the conflict of different mind-sets. The second study was run, under the aegis of Professor Peter Coleman and his associates at Teacher’s College, in Columbia University, and under the aegis of Professor Martin Braun of Queens College, City University of New York. The study was run 2011-2012, a decade ago, using the same experimental design as had been used for Study 1 on Discussions about Israel.

The elements appear in Table 3. The elements were created by the team led by Naira Musallam at Teacher’s College. They were designed to be short, easy to read ideas. The elements were created through a process involving depth interviews, ethnography, brainstorming, competitive analysis. Finally, the elements were developed with a psychodynamic and psychoanalytic orientation, dealing with different aspects of needs, wants, and perceptions.

Table 3: Elements for the Mind Genomics study regarding cessation of hostilities and lasting peace.

Question A: What are individual benefits?
A1 Lasting peace will allow me to fulfill my personal dreams and aspirations
A2 Lasting peace will help improve my physical and mental health
A3 Lasting peace will ensure a better future for my children and grandchildren
A4 Lasting peace will allow me to live a much more fulfilling life
A5 Lasting peace will improve my personal economic situation
A6 Imagine what our life would be like if the conflict and occupation had ended 10 years ago
Question B: What positive events are happening or could happen?
B1 Israelis and Palestinians are increasingly working together to address the pending water crisis in the region
B2 The safety and security of our children are completely dependent on the safety and security of their children, and vice-versa
B3 Lasting peace and justice in Israel-Palestine will only happen when Israelis and Palestinians are working together
B4 There are currently many areas of economic, technological, cultural and educational cooperation between Israelis and Palestinians
B5 Israelis and Palestinians both have much to gain from negotiating an end to the conflict and a lasting peace
B6 A solution to the conflict and compromise over Jerusalem and the refugees is possible
Question C: What are the benefits of lasting peace
C1 Lasting peace will bring great economic prosperity to the region
C2 Lasting peace will enhance everyone’s health and well being
C3 Lasting peace here will stand as a beacon of hope for all societies suffering from violent conflict
C4 Lasting peace will lead to vast improvements in the education of our children
C5 Lasting Peace will bring more stability and security to the region
C6 Once a peace agreement is reached, the UN, US, Arab League, NGO’s and the International Community will work together to help maintain a lasting peace
Question D: What are the benefits of ceasing violence?
D1 Freedom from violence and oppression are individual human rights
D2 Committing acts of violence and oppression always have unintended consequences that eventually come back to haunt you
D3 I don’t believe everything I am told by our leaders about the history of the conflict and the occupation
D4 I am eager for a more safe, just, and peaceful life
D5 I believe that Palestinians and Israelis can coexist without oppressing and killing one another
D6 I have a great deal to gain personally from ending the occupation and building a lasting peace
Question E: How can we build a community to incorporate both groups, and what will be the benefits?
E1 Parents would be increasingly able to raise their children in a safe, secure home and community
E2 Communities would be increasingly working to increase fairness, safety, security, and non-violence
E3 Our communities would do more to limit hate speech against members of other groups
E4 The Internet and social media provide ideal places for young Palestinians and Israelis to communicate and share their experiences and interests
E5 Ongoing community exchanges between Israeli and Palestinian youth help our situations
E6 The schools would improve the accuracy and reduce the bias with which history is taught to our children
Question F: What is happening on an international scale
F1 The UN/US/EU and Regional Arab nations are working together to establish less unjust processes for allocation of scarce resources such as land and water
F2 Increasing signs of cooperation are emerging between the Arab League, the UN, US, and EU
F3 More and more people everywhere are developing a stronger sense that they are all members of one global community
F4 Thee UNB/US/EU and Regional Arab nations are increasingly working together to fight crime and corruption in our region.
F5 GPS mapping is showing a significant increase in joint Jewish/Arabic development projects in the region
F6 The increasing number of projects by businesses that encourage entrepreneurship by our youth will substantially improve our economic future.

It is important to note that there is no fixed process for developing ideas. in the end, it is always a matter of creative thinking, of merging the richness of language to describe and the need to portray what should be described.

The respondents read the test vignettes, but this time rated the vignette on two rating scales. The first was the likelihood that this described the situation where the mutual hostilities would stop. The second scale was whether this described a situation which would move to lasting peace. One can look at these two sales as intellectual and emotional, as evaluating what will happen, and what could happen.

Half the respondents were Palestinians, recruited by friends, and half the respondents were Israelis, also recruited by friends. There was no pre-screening about attitude. Rather, the respondents simply were introduced to the topic with an explanation of the scale.

The study was set up so that the 158 different experimental designs were divided, so that the first set of unique designs was allocated to the Palestinians (with study totally in Arabic), the second set of unique designs was allocated to the Israelis (with study totally in Hebrew), and then the process repeated. The data for the Palestinians and for the Israelis were treated as one large group, both for clustering into mind-sets, and for reportage of results. This is possible because to the computer we are dealing with 158 respondents, all evaluate vignettes from the same large design.

Once again, the focus of the study is the identification of groups of like-minded individuals existing in groups which are in conflict.

Figure 2 shows the orientation pages in Hebrew and Arabic. Figure 3 shows examples of what the respondents saw in terms of vignettes. Since there were two rating questions, the vignette remained on the screen, the rating question changed. When the respondent completed the second rating, the vignette changed to the next prescribed by the underlying experimental design.

fig 2(1)

fig 2(2)

Figure 2: The orientation screen in both Hebrew and Arabic.

fig 3(1)

fig 3(2)

Figure 3: Example of a screen showing a vignette and the rating scale, in Hebrew and Arabic.

After the vignettes were completed, the respondents completed a short, self-profiling questionnaire, with some results shown in Table 5.

Table 5: Self-profile of the respondents in the two key mind-sets who are enthusiasts: Mind-set 3 (End conflict enthusiasts) and Mind-Set 2 (Peace enthusiasts).

End Conflict & Peace Enthusiasts (Combined) %

Age
18-29

47

30-38

22

39-44

16

45-52

13

53-64

2

Political Affiliation
Rightist

16

Centrist

38

Leftist

16

No Answer

31

How many years have you been living in Israel/Palestine
11-15 years

6

16-20 years

6

21-25 years

16

More than 25 years

69

I do not live in….

3

Were you or any members of your family harmed by the Palestinian-Israeli conflict
Yes, I was personally harmed

9

Yes, someone from my family was harmed

25

Yes, someone I know (not family) was harmed

19

No

47

Table 4 shows the significantly positive elements and the strong performing elements. The respondents were clustered simultaneously on ratings for Question 1 (cessation of hostilities) and Question 2 (lasting peace). This joint clustering was done by combining the two sets of coefficients to create a vector of 72 numbers, to which the k-means clustering was applied.

Table 4: Result from models for ending the conflict (Q1) and establishing long-lasting peace (Q2), from Israelis and Palestinians. Each mind-set comprises both Israelis and Palestinians.
table 4

The results suggest four interpretable mind-sets. Across both questions Mind-Set 2 appears to respond to elements which are positioned as ‘end the hostilities’ and Mind-Set 1 appears to respond to elements which are positioned as peace.

It is striking and somewhat disconcerting that in Table 4 that most of the cells are blank, having generated coefficients of +7 or lower. To help the patterns emerge, we show only those cells with strong performance, viz., coefficients of +8 or higher dramatically, we look only for strong performing elements.

The four mind-sets each comprise a mix of Palestinians and Israelis. This is important, because it gives hope that there can be found like-minded individuals in hostile populations, with perhaps some of the mind-sets capable of negotiation.

The total panel contains no strong performing elements at all. Nor do Mind-Sets 3 and 4, comprising 67 of the 158 respondents. There are, however, strong responses in the mind-sets, viz., suggesting that there are areas of agreement. All that we have to is find them.

The messages which drive interest for ending the conflict are:

  1. Freedom from violence and oppression are individual human rights
  2. Ongoing community exchanges between Israeli and Palestinian youth help our situation
  3. More and more people everywhere are developing a stronger sense that they are all members of one global community

The messages which drive work for peace (Mind-Set 1) are:

  1. Lasting peace and justice in Israel-Palestine will only happen by Israelis and Palestinians working together
  2. There are currently many areas of economic, technological, cultural and educational cooperation between Israelis and Palestinians
  3. A solution to the conflict and compromise over Jerusalem and the refugees is possible

The traditional approach to understanding people is to create a surface understand of their minds, and in turn probe deeply into who they are. Table 5 shows a breakdown of self-profiling classification of mind-sets 2 (End Conflict enthusiasts) and mind-set 3 (Peace enthusiasts). The information is enlightening, but the important information is missing, viz., the reason for the strong performing messages. We know about the enthusiasts, but would never have predicted which elements in Table 4 would have performed well

Discussion and Conclusions

At the start of the efforts underlying these two studies a decade ago, the vision for Mind Genomics was to identify the ‘optimum messaging.’ The size of the study, 36 elements (six questions, each with six answers) provided a large array of possible ideas to include in the study. The rapid turn-around time, less than a day, was not considered a particularly strong ‘positive’, but the possibility of testing many messages was a positive. The notion was that Mind Genomics provided a testing platform for many well-thought-out ideas, rather than one or two ideas. The worldview that accuracy, even with long cycle times, was critical. It was better to expend a great effort, to get deep thinking, and then to do the study.

The outcomes of the studies, reported here, were “interesting” but failed to find a receptive audience. Part of the failure was lack of visibility of the results. Another part was lack of knowledge about what Mind Genomics was, and what Mind Genomics could deliver. The target audiences, those in policy, those in academia, were stuck on the traditional methods, the slow, often tedious, eventually self-correcting, one-at-a-time thinking.

Over the decade, however, Mind Genomics has evolved to an iterative system, one providing virtually instantaneous results, at very low prices, with the objective of creating an ongoing database, the wiki of the mind. Coupled with this is the recognition that the traditional methods of science, the tortuous one-at-a-time hypothetical-deductive system, the creation of hypotheses and careful testing, does not work well in a world of language and feelings, where there are many ways to express winning ideas, and many more ways to express losing ideas. Furthermore, speed, once a negative because ‘if it is so fast it can’t be particularly good!’ has been supplanted by a culture of speed.

There is something, so obvious that it may be boggling. A continuing finding of Mind Genomics is that virtually no one really ‘knows what will work.’ These studies, run today, often show a lot of blank cells, not so much for products and services which are tangible, but rather for social issues which have been the food and drink of policy makes for generations. A better system was needed. The plethora of empty ‘data’ cells in Tables 2 and 4 are witness to the fact that the ‘best guess’ elements from experts do not drive the response. People in the business of ‘knowing’ may not know. This is not a criticism. The same plethora of empty cells for results occurs for marketing services and products, as well as social issues, legal statements in litigation or patients in the hands of medical professionals looking for guidance in the way which is most appropriate to their mind-sets.

Some of the answer to ‘fewer empty cells’ comes from the use of Mind Genomics, perhaps in a more abbreviated, simper form, not with 36 elements (6×6; 48 combinations) but with fewer than half that number, 16 elements (4×4; 24 combinations). There are three aspects to the opportunity all embodied in a publicly available tool, BimiLeap (www.BimiLeap.com).

Up-front Thinking

It may be daunting to have to think of 36 elements, but to think of 16 elements should be a far simpler task.

Speed, Collapsing the Process to Minutes and Hours

The second is to produce a system with collapsed timelines, a system which is templated, so that the Mind Genomics Project’ can be set in up in 15 minutes, launched, and the fully analyzed reports, ready for presentation,, emerge within 15 minutes, or at most minutes.

Change from Confirming to Iterating

Analysis paralysis, one of the banes of progress, perhaps the cause of the results here, emerges from the dutiful action of ‘measuring nine times, cutting once’. It might be better to think quickly, iterate quickly, update, and iterate again. Each iteration, in turn, to be done from front to back in the space of 60-90 minutes, at low cost, with ongoing updating, keeping and expanding the good, throwing away the ‘bad’, the ‘poor’, the irrelevant.

The prospect of going from no knowledge at 9am to nine iterations by 9pm or earlier, is simply ‘game changing.’ One can just imagine the number of elements which emerge over time as potentially strong messages, as the researcher iterates to better and better messages, simply by the mechanical effort of testing, evaluating, discarding, expanding, and retesting. Furthermore, the proof is immediate, manifested in the number of ‘filled cells,’ the magnitude of the positive coefficients, and the practical results from messaging.

One last part of the vision from 2012 deserves mention, a vision which is now becoming almost a trivial application of the above. As noted above segmentation and the use of mind-sets has been the domain of the world of marketers. But would about databases of mind-sets for conflicts around the world? What if each conflict could be studies with an iteration of 20 studies, as noted above, so that one arrives as a database of elements which reveal what can be agreed upon? It is quite likely that the results will require mind-sets. What if the process of iterating could be continued, the strong performing elements validated, and then a ‘PVI’, personal viewpoint identifier incorporated into the database [20]. The PVI would allow people in the conflict on both sides to be assigned to one of the mind-sets involved in the conflict. From there, negotiations could begin between antagonists on the two sides who happen to share the same mind-set, a mind-set which holds a point of view allowing for peace. One can imagine a library of 100 books, the Library of Today’s Conflicts, one book for each conflict, created in weeks, at low cost, from 10-20 iterations, and with its own PVI!

Acknowledgments

The authors wish to acknowledge the support and encouragement of these individuals a decade ago who made the studies possible, both through financial support, and through direct participation.

Peter Coleman, Columbia University, Teacher’s College, New York, USA

Jonathan Cummings, Jewish Community Relations Council of New York, New York, USA

Naira Mussallem, Columbia University, Teacher’s College New York, USA,

Janna Kaminsky, Moskowitz Jacobs, Inc. White Plains, USA

John Lightstone, Lightstone Capital (Deceased), White Plains, USA

Taly Marian, Teacher College, Columbia University, New York, USA

Nora el Zokm, Teacher’s College, Columbia University, New York, USA

Steven Onufrey, The Onufrey Group (Deceased), Philadelphia, USA

Note: The current (free) program for Mind Genomics is located at www.BimiLeap.com. The only fees are processing fees on a per respondent basis.

References

  1. Cohen SM (2002) Relationships of American Jews with Israel: What we know and what we need to know. Contemporary Jewry 132-155.
  2. Coleman PT, Bass B (2019) Facing uncertain times together: Strengthening intercultural connections. Journal of Intercultural Communication 22: 1-14.
  3. Dessel AB, Yazbak Abu Ahmad M, Dembo R, Ben Hagai E (2017) Support for Palestinians among Jewish Americans: The importance of education and contact. Journal of Peace Education 14: 347-369.
  4. Keysar A (2010) Distancing from Israel: Evidence on Jews of no religion. Contemporary Jewry 30: 199-204.
  5. Waxman D (2010) The Israel lobbies: A survey of the pro-Israel community in the United States. Israel Studies Review 25: 5-28.
  6. Ben Hagai E, Zurbriggen EL (2019) Bridging narratives: Predictors of Jewish American and Arab American support for a two‐state solution to the Israeli–Palestinian conflict. Analyses of Social Issues and Public Policy 19: 177-203.
  7. Hagai EB, Zurbriggen EL, Hammack PL, Ziman (2013) Beliefs predicting peace, beliefs predicting war: Jewish Americans and the Israeli-Palestinian conflict. Analyses of Social Issues and Public Policy 13: 286-309.
  8. Mearsheimer JJ, Walt SM (2009) Is it love or the lobby? Explaining America’s special relationship with Israel. Security Studies 18: 58-78.
  9. Rosenthal ST (2001) Irreconcilable differences? The waning of the American Jewish love affair with Israel. Brandeis University Press.
  10. Luce RD, Tukey JW (1964) Simultaneous conjoint measurement: A new type of fundamental measurement. Journal of mathematical psychology 1: 1-27.
  11. Moskowitz HR (2012) ‘Mind Genomics’: The experimental, inductive science of the ordinary, and its application to aspects of food and feeding. Physiology & behavior 107: 606-613. [crossref]
  12. Wren JE, Williams TC (2009) Selling blue elephants to the jury: Potential application of rule developing experimentation in Litigation. Baylor Law Review. Rev 61: 1.
  13. Gabay G, Moskowitz H, Gere A (2019) Understanding the donating mind and optimizing messaging- public hospitals. In 12th Annual Conference of the EuroMed Academy of Business.
  14. Gere A, Zemel R, Papajorgij P, Radványi D, Moskowitz H (2020) Public driven and public perceptible innovation of environmental sector. In: Innovation Strategies in Environmental Science 69-106.
  15. Salom J (2021) Mind Genomics with big data for digital marketing on the internet. In: Handbook of Research on Methodologies and Applications of Supercomputing. IGI Global 282-289.
  16. Moskowitz HR, Gofman A (2007) Selling Blue Elephants: How to Make Great Products that People Want Before They Even Know They Want Them. Pearson Education.
  17. Gofman A, Moskowitz H (2010) Isomorphic permuted experimental designs and their application in conjoint analysis. Journal of Sensory Studies 25: 127-145.
  18. Wells WD (1975) Psychographics: A critical review. Journal of Marketing Research 12: 196-213.
  19. Kaufman L, Rousseeuw PJ (2009) Finding groups in data: an introduction to cluster analysis (Vol. 344). John Wiley & Sons.
  20. Gere A, Moskowitz H (2021) Assigning people to empirically uncovered mind-sets: A new Horizon to understand the minds and behaviors of People. In: Consumer-based New Product Development for the Food Industry 132-149.
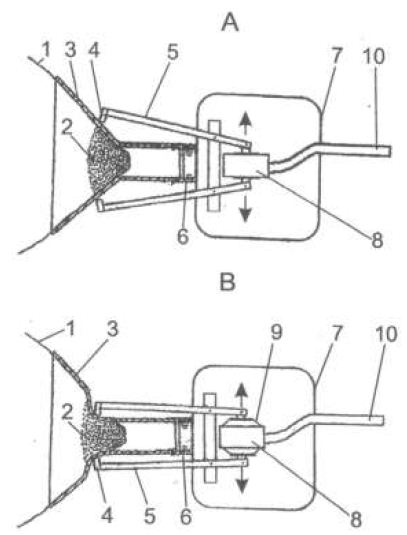
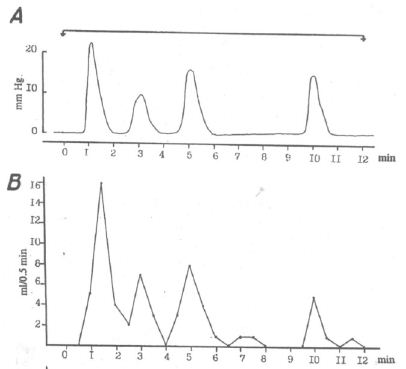
Messages for Giving to Education Causes: A Mind Genomics Cartography of Responses to Different Recipients

DOI: 10.31038/MGSPE.2022211

Abstract

In six parallel studies, selected as relevant for education from a total of 35 studies about ‘giving’ (Give It! project), respondents evaluated the appeal of messages for donations to education causes. These specific causes included, respectively, Importance of Reading, Education about Art, Technical Education, Art in Education, Alumni Efforts and University Scholarships. In each study, respondents recruited by an online panel recruited provide 70-80 respondents in each study. Each respondent selected the study of interest from a list and participated in the study they selected. Respondents each evaluated unique sets of 60 vignettes, created from 36 elements, presented in different combinations for each respondent, with the vignettes created according to an underlying design, permuted for each respondent. The pattern of results revealed three different mind-sets cutting across the six studies. These three mind sets were: MS1 (Commitment) Because I Care….it’s about what I can personally do to make the issue better; MS2 (Actions) Showing Support It takes more than just effort and good wishes to make things change… it takes money, time, items’; MS3 (Effect) It Makes a Difference….it’s about what can be done to help those affected by the issue. The discovery of mind-sets, and their presence in different proportions in the six studies, suggest that on a practical level communications seeking donations for the various education causes would be best served by mixing together strong performing and mutually compatible messages appealing to each mind-set.

Introduction

In 2002 author Moskowitz along with Jacquelyn Beckley and Hollis Ashman of the Understanding and Insight Group, Inc. created a set of studies called ‘Give It!’ The objective was to use the emerging science of Mind Genomics to create a database of patterns of response to messages about ‘charitable donations.’ The focus of these then-called ‘It!” studies was to explore the way people responded to these messages with the aim of uncovering basic mind-sets in the population. The previous studies in the It! series dealt with foods (Crave It!), beverages (Drink It!), and insurance (Protect It!), as well as anxiety (Deal With It!), and shopping (Buy It!). The Give It! studies, funded by the O’Grady Foundation, broke new ground in understanding the messages which would drive people to say that they were intrigued. The focus was not to drive giving, but rather to find out the messages that would put people into a positive frame of mind for a specific cause.

The rationale underlying the It! studies was the recognition that our knowledge of what drives donations is extensive, but piecemeal. In the words of a recently published paper [1]:

“Charities operate in a highly fragmented environment with many players competing for individuals’ support. The limited resources available for campaign development (creative, filming) and execution (media planning, on-air time) means that charity marketers need to use the most effective principles to ensure return on investment. Commercial marketers can use clear guidelines published on how to execute the brand to enhance advertising effectiveness and, more specifically, brand recall and recognition. Whether such guidelines are adhered to by charity marketers is unclear as no known research exists on this topic.”

A glance into the academic literature through Google Scholar® for the phrase charitable donation messaging reveals 21,200 as of this writing (Fall, 2021), with the academic literature focusing on general theory of why people give, and in turn, messaging which works. This focus on trying to understand the deeper WHY something works is admirable because it increases our understanding of the mind of people. Thus, it should come as no surprise that the academic literature focuses on the general types of messages used for different causes, the modes of donating e.g., Chen [2], and of course the nature of the giver. As in most academic studies of these social issues, the objective is to work from the top down, from general classes of ideas to the effectiveness of those ideas in particular uses [3]. Thus, one might see studies focusing on ‘guilt’ as a topic of the message, and its effectiveness. For example, consider crowd funding for a cause. Chen [4] reported that three types of messages work best: guilt, utilitarian products, and emotion messaging, respectively. Do we find this troika reflected in giving for causes?. Occasionally one might encounter papers dealing with specific phrasing, but the focus on the performance of such phrase is motivated by the fact that the phrase itself is unusual (e.g., even a penny will help; Shearman) [5].

Moving further, from the general to the particular, we find that in a great deal of the scientific literature there does not seem to be a systematic review of the power of specific messages, as a focus of the research, although one might speculate that such information is a staple of private databases used for seeking donations. It is there, in the world of the everyday specifics, the world of the granular, that Mind Genomics makes its mark, and its contribution.

The Mind Genomics Approach

To understand Mind Genomics and the large topic of ‘giving’ we first turn to the world of conventional research and specifically the types of experiments that are done. In the world of conventional research, a typical experiment to understand the mind of the ‘giver’ for creates an experiment with one or two conditions, often exaggerated changes of what might occur in everyday life, executes the experiment, and determines which antecedent method drives the greater amount of the criterion response. This traditional approach creates its knowledge base by aggregating together the results of such isolated experiments, establishing the pattern by a meta-analysis of these many findings. There may be a desire to create a library of practical information, ‘vetted’ by science, but the one-at-a-time process allows such library to emerge years, often decades after the data has been collected, the individual experiments reported, and then re-considered as a totality to create the library.

Mind Genomics differs from the conventional methods in worldview, execution, and types of data collected, and types of inferences made, respectively. Mind Genomics focuses on decision rules emerging from systematic experiments with many variables, doing so in ways which have become rapid, scalable, affordable, and amenable to iteration. Mind Genomics presents the respondent with many systematically varied messages, each respondent evaluating a different set of messages. It is the pattern of responses to the set of systematically varied combinations which provides the necessary data, but only after the pattern id deconstructed into the contribution of the individual messages. At a more global level, Mind Genomics looks for patterns across stimuli, and for emergent groups in the same topic area who show meaningfully different patterns of responses to the same set of stimuli. These are so-called mind-sets, appearing again and again across all topics explored by Mind Genomics, with the natures of the mind-sets driven by the topic itself [6-8]. These mind-sets vary in nature by category (nature of product, nature of service), and most important, clearly transcend most conventional ways of dividing people (viz., gender, age, country etc.). During the past 30 years, since 1993, Mind Genomics have evolved from a one-off system for research, based on conjoint analysis, to a templated system set up so that anyone can become a researcher. We present here the template adapted to the set of studies run in 2002 [9-11]. Note that processes which started out manual, such as combining files for the ‘reporting’ have become totally automated as of this writing.

The Mind Genomics Research Process Applied to the World of Giving

Step 1 – Select the Topics about ‘Giving’ to Explore

Figure 1 shows the 35 topics. At the time of the actual study the respondent would select the topic of interest, go to the study, and then participate. The topic would ‘disappear’ from the wall after a certain number of respondents completed the study. Unknown to the respondent, the ‘test material’ viz., the ‘elements, ‘ viz., phrases, full set of studies were almost mirror image of each other across the 35 different studies except for eight of 36 elements which were specific to the topic.

fig 1

Figure 1: The wall of 35 Give It! studies. The respondent selected the study and was led to the actual Mind Genomics experiment corresponding to the study

Step 2 – Create the Basic Structure of the Experiment, Comprising a Specific Number of ‘Questions, and a Specific Number of Answers’ for Each Question

The IT! studies conducted during the first five years 2001-2005 used four questions, each with nine answers, or in the language of today’s Mind Genomics, four questions, and nine elements (answers). The choice of this 4×9 experimental design was based upon the joint desire to acquire as much information as possible, and the popularity of Mind Genomics designs around 2003, the early phrase of the internet in consumer research.

The designs had to fall into the class of permuted experimental designs, which could be created in the hundreds, so that each respondent would evaluate answers (elements), albeit in different combinations. That structure, allowing for strong individual-level analysis, pre-determined the set of viable design structures. Table 1 presents the 36 different messages, groups into four categories, or in today’s usage, four questions. Each category (or question) comprises nine elements (or answers). It is critical that a group of related elements, viz., elements of the same type but which may carry different information, just appear in the same category or question. This requirement is a ‘bookkeeping device’ to ensure that two elements of the same type, but containing mutually contradictory information, can never appear together, since the vignette specifies as much. The elements or answers are direct statements, painting a word picture. As the vignettes will show below, simple one- or two-word answers to a question do not suffice to paint a word picture. The objective was to create answers or elements, which in combination, painted such a word picture without the need of a question to set the stage.

Table 1: The 4 questions or categories, and the 36 answers or elements, nine per question/category. The elements pertain to supporting alumni efforts.

Code What is the goal of giving?
A1 You can make a difference
A2X Sharing a love of your college/university with others
A3X Ensuring that students become productive citizens
A4 Your support ensures strong communities and strong families
A5X To provide tools for complete learning
A6X Because everyone knows that supporting schools is important
A7X To enhance the quality of life on campus
A8X To ensure the richness of culture
A9 Helping to maintain standards of excellence
How do you give?
B1 You can give by cash or check donations
B2 You can even use your credit card to donate
B3 Show your support by attending special events
B4 Having a gift matched by your employer
B5 Show your support through a pledge program
B6 Offer your support through regular attendance
B7 Support the organization by purchasing items they sell or need
B8 Volunteer!
B9X You support an individual trying to impact higher education
How do you and how do the recipient benefit?
C1 Gain an association with the organization
C2 Build a connection to other donors
C3 Get the benefits of a tax deduction
C4 Participate in group endeavor
C5 Encouraging yourself and others to participate in a worthwhile project
C6 Giving is a part of your family tradition
C7 Fulfilling a religious obligation to help others
C8 Realizing your personal belief
C9 Preserving the vitality and the future of the program
What are emotional and real outcomes?
D1 Because you want to “DO” good
D2 Be seen, be heard, be an active part!
D3 Be appreciated
D4 A great way to network
D5 Be associated with an organization you believe in
D6X Ensure that a strong interest in supporting alumni efforts remains a priority
D7 Because you want to honor a loved one
D8 Donating time, money and effort makes a difference
D9 Be with people who share your interests

It is important to keep in mind that any large-scale investigation of a vertical, such as donations with Give It!, must sacrifice a great deal of the specifics of a cause in the interests of comparability of causes. The objective of Mind Genomics applied to the vertical is to discover general patterns from sets of common elements. The alternative approach, doing individual studies for each topic, would provide deeper information, but the meta-analysis of the results might require a great deal more effort, and require involve luck at the end, rather than planning at the start. In Table 1, eight of the 36 elements have an ‘x’ added to their code. These are elements which are similar across the six different mind-sets, but also contain topic-specific language that was changed in a minor fashion from study to study.

Step 3 – Create Small, Easy to Read Vignettes, Using an Experimental Design

Step 3 creates the test stimuli, the combinations f messages. In the language of Mind Genomic, these combinations are called vignettes. Figure 2 shows an example of a vignette. The stimuli comprise 60 different combinations, all similar in format to Figure 2, except that some comprised two elements, some three elements, and some four elements. The spacing and design of the vignette is such that the respondent could easily read the vignette. Experience with Mind Genomics suggest that the combination of messages in a spare form, with open space allows the respondent to quickly ‘graze’ the information and make a rating. The design of the test stimulus in Figure 2 goes contrary to approaches, which present the respondent with a crafted paragraph. In the end, comments from respondents who, having been presented with these spare looking vignettes like that of Figure 2, concur that it is easier, less fatiguing, less frustrating to deal with form of design when rating many vignettes, rather than working one’s way through what a dense paragraph.

fig 2

Figure 2: Example of a vignette comprising four elements

The vignette is created according to an underlying experimental design [11]. The design prescribes the exact composition of each vignette, specifying which specific elements are combined. To the novice unfamiliar with the design structure, such as the respondent, the vignette looks as if the elements had been thrown together at random. The truth is precisely the opposite. The compositions are carefully crafted to ensure that each element appears equally often, that each element is statistically independent of every other element, and that there are sufficient of compositions or vignettes which lack one or two elements. The latter feature of the experimental design ensures the data can be used by OLS (ordinary least=squares ) regression to deconstruct the response into the contribution of the individual 36 elements. Furthermore, the built-in incompleteness of some vignettes prevents the statistical problem of multi-collinearity, which would eventuate in the crash of the statistical analysis for that data set. Finally, and most important, the coefficients emerging from the OLS regression have ratio-scale values, and are comparable from study to study, from period to period, and even across different individuals. Two other features of the experimental design are important to note. The first is that no question or category can contribute more than one element to a vignette. The rationale for this constraint is that quite often the question or category comprises elements which mutually contradict each other. Were these mutually contradictory elements to appear in the same vignette they would corrupt the response to the vignette. The second significant feature in the Mind Genomics system is the permutation of the basic design, so that the mathematical structure is identical, but the actual combinations differ from one another. The use of the permuted design at first seems to be merely a statistical enhancement, but the reality is that it is a frontal attack on some of the thinking of conventional science, and an alternative to the oft-quoted proverb ‘measure nine times and cut once.’ This permuted design (Gofman and Moskowitz) emerged out of a recognition that the standard research approaches are based on reducing statistical error by repeating the same experiment with dozens or hundreds of people. The implicit assumption of the conventional research procedure is that the ‘correct answer’ is known, and that the research is going to confirm or disconfirm that guess. Yet, the ‘reality on the ground’ is that no one really knows what messages will work, and what messages will fail to work. Thus, the choice of the messages and the combinations becomes one’s best guess. The permuted design avoids the need to select a limited set of vignettes, or test combinations at the start of the study. The key benefits of the permuted design used by Mind Genomics are ability to explore a wide number of alternative ideas (36 in this study), and at the same time explore a great deal of the underlying ‘design space’ of different combinations. Each respondent evaluated a unique set of 60 vignettes. Across the approximate 70-80 respondents, this means that for each topic (e.g., technical education), the Mind Genomics experiment investigated the response to many different vignettes, albeit each vignette evaluated just a few times The creation of a model relating the presence/absence of the elements to the ratings was stabilized because of the many different combination. Even if one or several, or several dozen were mis-judged, the weight of the approximate 60×75, viz. 4500 judgments of different combinations sufficed to ensure that no systematic error could affect the result. In contrast, conventional research testing the same 60 vignettes 75 times each might be well advised to make sure that the 60 vignettes are the correct vignettes. Choosing the wrong single vignette to test or having an aberrant reaction to that vignette is not quite as serous in Mind Genomics as it is for conventional research. To summarize this point, it should thus be kept in mind that the permutation of the combinations ensures a wide coverage of the possible combinations, producing a better experiment. It is simply very difficult to introduce a strong bias when the combinations change all the time. It is the underlying pattern, emerging for 4800+ vignettes which is critical.

Step 4: Invite the Respondent to Participate, Introduce the Respondent to the Subject, and Execute the Actual Interview

The It! studies were run with the Canadian on-line panel, Open Vue Ltd. Their panel comprised both USA respondent and Canadian respondents, among many others. The respondents were selected to be residents of the United States. Open Vue sent out email invitations to its panelists. Those who answered were led to the screen shown in Figure 1, where they selected a study of interest to them. During this early period of research with Mind Genomics and with the It! studies, it became obvious that an efficient way to do 35 studies with approximately similar numbers of respondents was to let the respondent choose the study. Once the study quota was filled, the study disappeared from the available choices. Figure 3 shows the orientation screen for the study. Most of the screen is taken up with bookkeeping details, about the length of the study, the fact that the screens (viz., the vignettes) differ, the rating question, and the expected time of the study. During this early period of internet research, the respondents were not yet saturated by requests to participate in simple studies or evaluations of their experience, and thus were more likely to donate 15 minutes of their time to the study. Nonetheless, it was important to incentivize the respondent with a monetary reward, a drawing for a prize. The three prizes were the incentive across all 35 studies. That is, all respondents across all studies were entered into the drawing, and three respondents were selected as winners.

fig 3

Figure 3: The orientation page for the Give It! studies. Each study was introduced by the same page, with the only difference being the specific topic.

Step 5- Transform the Rating to a Binary Dependent Variable and Create Individual-level Models

The respondent rated each vignette on the simple scale ‘How much does this giving situation appeal to you?’ Note that the respondent was not asked to state whether or not the respondent would donate, or how much, although those could have been legitimate questions to ask. Rather, the respondent was asked a question about feelings, about a sense of ‘appeal to me.’

The 9-point scale, a category or Likert Scale, can be easily analyzed. The problem with the scale, however, is how to interpret the scale. When managers receive data, they often ask the simple question ‘what do these ratings MEAN?’. To a manager, the fact that one can easily analyze the data with sophisticated statistics means very little when the results cannot be easily understood and acted upon. Thus, it has become standard procedure to transform these Likert scales, usually to a binary scale, yes/no. The manager using the data has no problem understanding yes/no. The transformation is straightforward. Standard practice has evolved to transforming the ratings of 1-6 to 0, and ratings of 7-9 to 100. This division of the scale makes thee interpretation easier. As a prophylactic measure, we add a vanishingly small, random number to every transformed variable to ensure that the transformed variable, viz., the newly created binary variable, has some minimal variation. If the respondent were to rate all 60 vignettes as 7-9, or as 1-6, respectively, then the transformation as just specified would create a set of 60 number, all 100, or all 0, respectively. The analysis of the data by OLS (ordinary least squares) regression would immediately crash. Adding a vanishingly small random number to the newly created binary value ensures that this unhappy event does not occur. Every vignette will have its own number, around 100 or around 0, respectively, depending upon the original rating assigned to the vignette. Once the data have been transformed the 60 rows of data from each respondent is subjected to an OLS (ordinary least squares) regression. The regression is called ‘dummy variable’, because each of the 36 element corresponds to an independent variable, and takes on only one of two values, 0 or 1, as follows: The element is either present in or absent from a vignette, so its corresponding independent variable is coded ‘1’ when present, or coded ‘0’ when absent.

The equation is: Binary (0/100) = k0 + k1(A1) + k2(A2) .. k36 (D9)

The regression analysis created 60 rows of input data for each respondent. Each row comprised 37 numbers, additive constant (k0) and the 36 coefficients, k1-k36. With 453 respondents participating, the regression analysis generated 453 rows of coefficients. It would be these 453 rows of coefficients that would be used to create mind-sets. The 453 rows, viz. the full data set, was subject to k-means clustering, the inputs for the clustering being the 36 coefficients k1-k36. The additive constant was not used for the clustering. To make the analysis easier, we extracted three clusters, a number usually found to reveal strong patterns, but not unwieldy to analyze. The clustering was done by the k-means method [12], which looks at the distance between each pair of respondents and tries to put respondents into a set of mutually exclusive groups so that the distance between the respondents in a cluster is small, while at the same time the distance between the centroids of the three clusters is large. The clustering does not take into account any of the ‘meaning’ of the elements, but simply tries to satisfy a mathematical criterion. Table 1 shows eight elements with the element code having an ‘x’ as the suffix. These were elements deemed too specific to the topic and were not included in the clustering. The rationale was that the clustering should comprise only those elements common in meaning to the six different topics of giving. These eight elements did not satisfy that criterion of being ‘topic-agnostic.’ They will, however, be presented in the results. Within any group, whether total, donation topic, mind-set or topic x mind-set, the corresponding additive constants and 36 coefficients were averaged to generate the results shown in the data tables. More recent approaches simply combine data together for the respondents in a defined group and rerun the regression model on the total data for the relevant group. The results are similar for both forms of analysis.

Results

Total Panel and the Six Different Topics

The Mind Genomics analysis generates a substantial amount of summary data. Our objective is to discover patterns and generalities, not to show all of the data, which would hide the patterns which exist. In order to make the discovery task simpler, we will eliminate from consideration all elements with coefficients of +7 or lower and report the element when it has a coefficient of +8 or higher. The element will not appear at all in the case that all of the coefficients for the key subgroups are lower than +8. This pruning action brings the really important elements into the foreground. Table 2 presents the results from the total panel, combining the six studies, and all of the respondents. The additive constant is 41, meaning that on average two of five responses to the vignettes will be rated as appealing (viz., rated 7-9 on the nine-point sale). The messages range from belief in the organization (D5) to affiliation (A2X), to focus on the recipient (A3X). These are the key messages that any organization seeking donations should incorporate.

Table 2: Strong performing elements from the total panel, combining all respondents across the six studies.


Total

  Additive Constant

41

D5 Be associated with an organization you believe in

9

A2X Sharing a love of your TOPIC with others

9

A3X Ensuring that TOPIC become productive citizens

8

The array of strong performing elements increases when we move from combining all the data into one group (Total) and do the analysis on a topic-by-topic basis. The results appear in Table 3. Once again the table shows only those elements which generate at least one coefficient of +8 or higher. Thee first data column shows the sum of the strong performing coefficients and used to sort the elements from strongest performing elements to the weakest performing elements. In addition, the six studies are sorted by the magnitude of the additive coefficient, viz., the likelihood to find the vignette appealing in the absence of elements. Stated differently, the additive constant might be considered to represent the basic proclivity of the respondent towards the topic.

Table 3: Strong performing elements for each of the six giving topics.

table 3

The additive constants suggest that the most appealing topic is ‘importance of reading’, the least, but still strong being university connected topics, ‘alumni efforts’; and ‘university scholarships’, respectively. One of the properties of Mind Genomics is the fact that the coefficients have ratio scale properties. Thus, we can conclude that ‘importance of reading’ is 50% more appealing than the two university topics. Table 3 is characterized by a great number of blank spaces, suggesting that the strong performing elements do not transcend the different topics. No element drives strong appeal to more than three of the six topics The two strongest elements appear to focus on different directions, first a focus on the topic itself (D6X), and second a focus on the social aspects (A2X). There is a third focus, that of helping the person who is associated with the giving cause. These three directions suggest three different foci of appeal, directions which will emerge as mind-sets

D6X: Ensure that a strong interest in TOPIC remains a priority

A2X Sharing a love of your TOPIC with others

A3X: Ensuring that TOPIC become productive citizens

Moving from Total to Mind-sets

Table 3 hinted at the possibility that there might be different ways of evaluating the messages. Although at first glance we might consider the key factor to be the recipient of the donation so that certain topics are more attractive than another, there might be a far deeper factor at work, mind-sets. The hallmark of Mind Genomics is the discovery of these different patterns of response to messaging. The metaphor is white light, which seems to be colorless, but when the light is diffracted through a prism, the spectrum of colors emerges. We see white perhaps because the different colors interfere with each other. Mind Genomics posits that for virtually all conventional aspects of daily experience, there are different patterns of focus, of importance. What one person thinks to be important (viz., more is better) another person might as consider to be utterly irrelevant, even off-putting. The discovery of these groups, so-called mind-sets, it a matter of experiment. Furthermore, once these mind-sets are established through analysis, some of the data begins to make more sense. We may hypothesize about the possible mind-sets, but an easier way to establish these mind-sets is through a set of experiments, such as the experiments run here. The analysis to establish these mind-sets is simple OLS regression as we have done, followed by clustering to create groups of individuals with similar patterns of responses. The set of individual coefficients comprises raw material for the creation (or discovery) of these mind-sets, the permuted experimental design provides us with what we need to create the individual-level set of coefficients. As discussed above, the OLS regression analysis was straightforwardly able to create an individual level model for each of the 453respondents. The OLS regression estimated the additive constant and the value of each of the 36 coefficients, one coefficient for each element. Table 1 showed the expression of the elements for the topic of Alumni Efforts. Eight of the 36 elements appear to be specific to the topic and are marked with an ‘X’ in the element code. As noted above, these eight elements will not be used to establish the mind-sets by clustering, but then will be included in the later analyses after the mind-sets are created. The clustering method of k-means created two clusters for the 453 respondents, and then created three clusters for the same 454 respondents. The clustering procedures are a purely objective one, attempting to satisfy certain mathematical criteria. The criteria previously adopted for Mind Genomics studies for choosing the appropriate number of clusters (now called mind-sets) are not statistical, but rather qualitative. The two criteria are that there be as few clusters or mind-sets as possible (parsimony), and that each mind-set tells a story (interpretability). The criteria suggested a three-cluster solution, rather than a two-cluster solution. These clusters become the mind-sets. The clustering itself was done, as noted, on 28 of the 36 elements. Once each respondent was assigned to a cluster or mind-set, it was straightforward to estimate the additive constant and the value of the coefficient for each of the original 36 elements. That is, we resort to the 28 ‘general’ elements ONLY to create the clusters or mind-sets, and then revert back to the full set of data for further interpretation.

Three segments emerged, based on a qualitative ‘sense’ of what is communicated by the strong preforming elements. No element is strong across all six giving topics, so the interpretation of the meaning of the mind-sets become a simple heuristic with which to discuss the results. Furthermore, the clustering does not dramatically separate the three mind-sets. It’s a matter of emphasis. This is important. The dynamics of appealing to the heart of the donor become a matter of combining messages of different types, rather than focusing on one specific factor, such as EFFECT (viz., the benefit to the recipient).

MS1 (Commitment) Because I Care….it’s about what I can personally do to make the issue better.

MS2 (Actions) Showing Support It takes more than just effort and good wishes to make things change… it takes money, time, items,

MS3 (Effect) It Makes a Difference….it’s about what can be done to help those affected by the issue.

The Baseline Proclivity of the Mind-sets towards ‘What Appeals’

The additive constant tells us the estimated rating of 7-9 (appeal to me), in the absence of elements. Although the additive constant is a purely estimated parameter, it can be used to indicate the proclivity of the respondents to say ‘appeals to me’. Table 4 presents the additive constants estimated separately for the six different causes, and the three mind-sets that were developed for all the causes combined. The additive constants are sorted by average, first in descending order of cause by averaged across the three mind-sets, and then by mind-set averaged across causes. There are remarkable differences in the additive constant of the three mind-sets and in the six studies. The strongest ‘pull’ emerges from donations to help teach reading (average 50), and the weakest from alumni efforts (average 34) and university scholarship (32). This teaches us that the strongest pull, on average, is exerted by causes which pull toward young people, to give them an opportunity. Universities will have a more difficult time reaching the donors’ heartstring. In terms of the three mind-sets, we also see radical differences. Mind-Set 1 (commitment) shows the strongest proclivity to feel positive (additive constant 50), As the array is presented, there is also clear evidence for some interactions, specifically for reading. Mind-Set 2 (actions) finds its strongest pull with reading.

Table 4: Additive constants for the three mind-sets and the six donation ‘causes’, sorted by cause and by mind-set.

Additive Constant

MS1 (Commitment)

MS3 (Effect) MS2 (Actions)

 Average

Reading

49

41 60

50

Tech Education

58

45 34

46

Ed in Arts

51

40 44

45

Arts Ed

45

36 39

40

Alumni Efforts

47

41 13

34

University Scholarship

51

30 14

32

Average

50

39 34

What Elements ‘Drive’ Positive Feelings about Giving for the Three Mind-sets?

Tables 5-7 show the strong performing elements for each of the three mind-sets. Note again that the tables present only the strong performing elements for at least one of the three mind-sets, and that all elements were considered for inclusion. In the case of the eight elements which were topic-specific, the topic is replaced by the word ‘TOPIC.’ One gets a sense of the specific thrust of the communication by reading the complete element, even with the word ‘TOPIC’ replacing the actual topic.

Table 5: Mind-Set1: The table shows the strong performing elements for MS1, labelled ‘COMMITMENT’’.

table 5

Table 6: Mind-Set 2. The table shows the strong performing elements for MS1, labelled ‘ACTIONS’.

table 6

Table 7: Mind-Set 3 . The table shows the strong performing elements for MS3, labelled ‘EFFECTS’.

table 7

The Composition of the Three Mind-sets

A hallmark of conventional research is that WHO a person is often covaries with what a person does or what a person believes. It is for this reason that so many consumer researchers spend a great deal of time collecting so-called classification questions about the respondent. What attracts many conventional researchers is the possible covariation of the easy-to-measure-behavior with additional information about the respondent.

In the world of Mind Genomics, the focus is on a better understanding of the individual. Only secondarily is the focused on establishing the relation between who a person IS versus, what the person THINKS To a great degree the lack of focus on the covariation between mind-set and behavior is due to the belief that the most pressing task is to understand the mind-sets, rather than to link the scarcely understood mind-sets to other variables. The It! studies captured a great deal of individual level data regarding attitudes and behaviors involving ‘giving’. Some of the data appears in in Table 8. Table 8 shows the complicated relationship between the three mind-sets and both WHO the person is, as well as how the person BEHAVES with respect to donating to causes. There are many patterns emerging, depending upon the way the respondent self-classifies, but no simple pattern which can be said to be common to the mind-sets.

Table 8: The percent of respondents in each of the three mind-sets, the range of percentages across the three mind-sets, and the base size. Each row constitutes a classification variable in the self-profiling classification.

table 8(1)

table 8(2)

Discussion and Conclusions

The academic study of ‘giving’ typically focuses on higher level motive, looking at the individual material from either actual campaigns, or creating an experiment. The important thing to note is that these studies generate a certain kind of knowledge, understanding the general drivers of donations. That information is important to understand donating to causes in the context of theories about why people do what they do. Being able to put a person’s ‘giving’ behavior, or response to different appeals allows the academic to understand yet another part of the mind of the person, for the world of the everyday. The Mind Genomics approach presented here, with its focus on the specific messages, give us a different point of view. The goal of Mind Genomics is to work with the stimuli of the everyday, in this study the stimuli being ‘messages.’ Rather than look for underlying patterns to fit into a theory, the effort is to identify what really works, and then point to what might be happening. Mind Genomics is atheoretical, but systematized experimentation. There is no theory in which to place the response patterns of giving, or at least no theory which drives the effort. Rather, the objective of the study is to see ‘what works’, with the test material being the type of messages that would be used in actual campaigns. The important results from this study are simple to summarize, namely that most of the messages really don’t work very well in terms of the ratings by respondents, and that the nature of the mind-sets which emerge is not a case of ‘polarization’ but rather ‘emphases. It’s not that the mind-sets respond only to one type of message, but rather the mind-sets respond to the messages, the elements, but some messages are stronger for one mind-set, and still positive but weaker for another mind-set. There is a strong practical side to the data presented here. That side is the fact that the patterns emerging from messages can be used immediately. There is no need to translate the test messages used in the experiment to actual messages that might be useful in a practical situation. The messages from the Mind Genomics experiment come from actual campaigns, although edited to have general application. Finally, the finding emerges once again that although there are mind-sets that are clearly different, there do not seem to be any simple co-variation of the mind-sets with who the respondent IS, or the self-stated patterns of involvement with the world of giving. It is that finding, a continuing revelation, which continues to surprise. The practice has always been to stratify the efforts by dividing people by WHO they are, assuming that people who appear similar on the criteria of who they are or how they involve themselves with the world of giving will be similar in their response to messages about giving. It just not the case.

Acknowledgments

These studies were run under the aegis of It! Ventures, Inc. The authors acknowledge the contribution of the late Hollis Ashman, as well as the contribution of Jacquelyn Beckley of the Understanding and Insight Group, New Jersey, USA. The studies were sponsored by Kathleen O’Grady of the O’Grady Foundation.

References

  1. Nguyen C, Faulkner M (2020) In pursuit of effective charity advertising: Investigating the branding and messaging execution tactics used by charity marketers. Third Sector Review 26: 66-87.
  2. Chen W, Givens T (2013) Mobile donation in America. Mobile Media & Communication 1: 196-212.
  3. Duncan T (1995) Why mission marketing is more strategic and long-term than cause marketing. In: 1995 AMA Winter Educators Conference: Marketing Theory and Applications, Vol. 6, (eds: Stewart D, David W, Vilcassim N, Chicago: American Marketing Association) 469-75.
  4. Chen S, Thomas S, Kohli C (2016) What really makes a promotional campaign succeed on a crowdfunding platform?: Guilt, utilitarian products, emotional messaging, and fewer but meaningful rewards drive donations. Journal of Advertising Research 56: 81-94.
  5. Shearman SM, Yoo JH ( 2007) “Even a penny will help!”: Legitimization of paltry donation and social proof in soliciting donation to a charitable organization. Communication Research Reports 24: 271-282.
  6. Luckow T, Moskowitz HR, Beckley J, Hirsch J, Genchi S (2005) The four segments of yogurt consumers: preferences and mind-sets. Journal of Food Products Marketing 11: 1-22.
  7. Foley M, Beckley J, Ashman H, Moskowitz HR (2009) The mind-set of teens towards food communications revealed by conjoint measurement and multi-food databases. Appetite 52: 554-560.
  8. Rabino S, Moskowitz H, Katz R, Maier A, Paulus K, et al. (2007) Creating databases from cross‐national comparisons of food mind‐ Journal of Sensory Studies 22: 550-586.
  9. Moskowitz HR, Gofman A, (2007) Selling Blue Elephants: How to make Great Products that People Want Before They Even Know They Want Them. Pearson Education.
  10. Moskowitz, H.R., Gofman, A., Beckley, J. & Ashman, H., (2006) Founding a new science: Mind genomics. Journal of Sensory Studies 21: 266-307.
  11. Lundstedt T, Seifert E, Abramo L, Thelin B, Nyström Å, et al. (1998) Experimental design and optimization. Chemometrics and Intelligent Laboratory Systems 42: 3-40.
  12. Likas A, Vlassis N, Verbeek JJ (2003) The global k-means clustering algorithm. Pattern Recognition 36: 451-461.

Mind-Sets for Senior Dining: the Contrast between Homo ‘Emotionalis’ and Homo ‘Intellectualis’

DOI: 10.31038/NRFSJ.2021422

Abstract

Respondents rated vignettes (combinations of elements, viz., statements) describing the different features of senior communal dining. Each of 108 senior respondents (age 65+) rated unique sets of 50 vignettes, combinations of 2-5 elements created according to a permuted experimental design, ensuring that the 50 combinations differed for each respondent. Each vignette was rated on both importance of, and emotional response to, the combination of the specific elements presented in the vignette. Deconstruction based on ratings of importance revealed different mind-sets, focusing on food, service, and ambiance, respectively In terms of emotions, few elements were delighters. Most elements did not strongly drive either positive or negative emotions. The one consistently important message was ‘warm food out of the oven’, but it was not a delighter. The one element consistently driving negative emotions was ‘high noise level’. Groups of mind-sets emerged, showing different patterns of importance (Mind-Sets 1-3) and emotion (Mind-Sets 4-6). The mind-sets distribute across the population, suggesting simple knowledge of WHO the respondent is in terms of age, marital status, and so forth does not clearly predict what will be important to any specific senior diner.

Introduction

As the nation ages, there are an increasing number of group or community living facilities, designed for healthy, aging seniors [1]. These communities have group dining facilities. The issue becomes one of finding what is important to a senior. The obvious answer is food, companionship, and service [2]. But what exactly is entailed by each of these? And furthermore, are there differences in the importance of these three general factors?.

The usual approach to answering these questions is for the respondent to rate or rank these factors, either in the abstract, or after having experienced a certain community, so that the specific community is rated on satisfaction with respect to these three or more general factors. The rating or ranking factors requires that the respondent evaluate the general factors in isolation, and in general terms. Sometimes the researcher recognizes that the general factor, e.g., service, might be better assessed by first specifying the question in terms of defined behaviors, or food specified in terms of defined dishes and/or method of preparation.

As popular as the ‘one-at-a-time’ evaluation has been, it suffers from at least two defects which limit its usefulness. One is that the respondent may unconsciously adjust the judgment criterion when dealing with the different factors, when evaluating one element at a time. For example, the same rating scale for food versus service may mean different things. The researcher does not know that. Second, the one-at-a-time strategy fails to recognize that people rate things more readily and easily when what they are rating is less abstract, more concrete. It is more natural to rate combinations of ideas which represent a situation, a vignette, than to rate each idea separately.

This paper presents the results of a Mind Genomics cartography, an investigation of different ideas, so-called elements, which might be relevant to older adults eating in communual dining situations, such as retirement homes. The objective is understand senior communal dining from the ‘inside-out.’ The strategy maps out what might be important to the senior diner, doing so by presenting the respondent with different ‘vignettes’, viz., combinations of features describing a senior dining situation. Through the response to these vignettes, rated both as describing something important, and as eliciting an emotion, the researcher uncovers both what is important, and what produces an emotional response, respectively. The approach differs dramatically from the one-at-a-time approach, used to in conventional research [3,4].

The background of Mind Genomics can be found in the confluence of statistics (experimental design; [5], patterns emerging from the study of consumer opinions [6], and the change in focus from a sociological viewpoint (outside-in) to a psychological viewpoint (inside-out). The underlying world-view of Mind Genomics is the vision of the science as a tool to ‘map the mind’, focusing on the ordinary aspects of life, rather than setting up experiments configured to test a hypothesis. The Mind Genomics science comes from a history of psychophysics, with the objective to discover patterns, regularities in nature, rather than from the hypothetico-deductive system, which assumes the world works a certain way, and seeks to confirm or to disconfirm that assumption through experiment. Thus, the study reported here was done in the spirit of an exploration of the mind of what senior feel about the various aspects of communal dining.

Dining behavior is a well-explored areas of foodservice. Most studies of dining among adults focus on the choice of restaurant, and the dimensions of food and service, topics which are relevant in a situation where the diner eats and pays, even in the world of senior dining [7]. In contrast, there has been less focus on institutional communal dining, and much less on communal dining among seniors.

Focus on Emotions and Feelings

This study focused on the response of older, relatively healthy adults (age 65+) to different messages about senior communal dining. The objective was to identify which elements were important to them (viz., homo intellectualis) and which elements generated positive or negative feelings (viz., homo emotionalis). The latinized terms intellectualis and emotionalis were coined for this paper.

Rather than instructing the respondent to rate the importance of, and the emotional response to, single elements, Mind Genomics proceeds in another direction, one that might seem less direct, but one that cannot be gamed, and thus provides robust information. The respondent reads a set of messages or elements, created according to a specific recipe plan (experimental design). For this study, comprising 35 elements in 50 vignettes, the combinations primarily comprise vignettes containing 3-4 elements, but a few containing 2 elements, or 5 elements. Each element appeared five times, always in combination with other elements. The experimental design is set up so that no two respondents evaluate the same set of vignettes, allowing the Mind Genomics experiment assess many of the possible combinations [8]. This property makes Mind Genomics unusual because it directly measures many of the possible stimuli, rather than forcing the researcher to ‘know’ what will work before the experiment is done. The goal is to avoid the folk wisdom which prescribes the cautionary ‘measure nine times, cut once,’ a way of thinking which subtly transforms research to confirmation, rather than allowing research to explore the ‘new’.

Method

The Mind Genomics approach to knowledge follows a structured, formatted pattern, in recent years put into the form of a computer-aided process (see www.BimiLeap.com). The study reported here was done a few years before the automated system was developed, but the actual creation, presentation, of the vignettes, and analysis were reasonably automated, although not from beginning to end as they are as of this writing (Fall, 2021).

Step 1 – Select the Topic, Ask the Questions, and Provide Answers in the Form of Simple Declarative Sentences

Table 1 shows the five questions and the seven answers for each question. The underlying mathematics of Mind Genomics prescribes certain combinations of questions (or categories) and answers (or elments). The rationale for the five questions and seven answers is that it is a specific array which fits into the prescribed experimental designs of Mind Genomics. Those prescribed designs are important because they allow each respondent to test the same elments, but each respondent testing a different set of actual combinations. This is a permuted design, and will be discussed below [8].

It is important to note in Table 1 that the focus is on word pictures, on specifics, ratherr than general ideas. The underlying reason is that the Mind Genomics effort attempts to paint ‘word pictures’ about the situation (here adult communal dining). To paint these word pictures requires that the researcher move beyond simple, general statement, and focus on the particular, even if the particular is something ‘new’ to the respondent.

Table 1: The raw material comprising five questions, and seven answers for each question.

Question A: Describe the ambiance

A1 Adequate lighting at the table
A2 The overall volume of noise in the dining room is high
A3 Eating with a group of friends
A4 Eating by yourself
A5 Listening to music during a meal
A6 Lots of stimulating conversation during a meal
A7 Table settings (plates, silverware, tablecloth etc.) makes for an enjoyable meal

Question B: Describe the service

B1 Friendly waiters can really make for an enjoyable meal
B2 Waiters who are knowledgeable about the food help you select items from the menu
B3 Family style service with bowls of food to pass around the table
B4 Speedy service is important for your enjoyment
B5 Waiters let you substitute items such as sides and salads not included in the menu item description
B6 You are given the choice to sit anywhere in the dining room
B7 Waiters remember the type of food or drink you like

Question C: Describe the information provided on the menu regarding the items

C1 Nutritional information on the menu to help you make your selections
C2 Total calories for each item listed on the menu to help you make your selections
C3 The amount of sodium for each item listed on the menu will help you make a choice
C4 Listing the amount of fat in menu items helps you decide what to order
C5 Clear and simple wording on the menu makes it easy to decide what you will order
C6 You select menu items with exotic or foreign sounding descriptions
C7 Having the option for ordering smaller portions of the items on the menu
C8 You love fresh uncooked vegetables (salads for example) at every meal

Question D: Describe a specific food

D1 You enjoy vegetables that are thoroughly cooked
D2 Fresh fruit at every meal
D3 If it contains chicken, you will like it
D4 Red meat is your choice every time
D5 You can’t go wrong with a simply prepared fish dish
D6 You like large portions of food

Question E: Describe the sensory aspect of the food

E1 The aromas of herbs or spices you love
E2 Foods with soft textures are your preference
E3 You choose food with vibrant colors
E4 You prefer food that is under-salted
E5 Food is served hot out of the oven every time
E6 You prefer food that is served warm
E7 You enjoy hot and spicy flavors

Step 2 – Combine the Elements into Small, Easy to Read Vignettes Using an Underlying Experimental Design

This experimental design for this study (5×7) generated an experimental design or set of combinations totally 50 different combinations or vignettes, all but three vignettes comprising either three or four elements. The remaning three vignettes encompassed two elements or five elements. Each element appears five times in the 50 different combinations.

The important thing about the underlying 5×7 design, like others of its class, is that the experimental design is complete at the level of each respondent. This means that the 50 cases or observations from one respondent can be used to estimate the contribution of each element to the rating. Such analysis at the level of the individual respondent becomes important when we create equations for each individual and then combine individuals on the basis of similar patterns of individual-level coefficients to discover mind-sets.

It is at Step 2 where Mind Genomics departs radically from the conventional approaches, which are founded on the principle of ‘isolate and study’. The objective of conventional research is to quantify the basic dimensions, such as ambiance, service, information, food, and so forth. Conventional research looks for the general principles. It is usually the evaluation of elements one-at-a-time which allow the researcher to rank order the different general aspects. There are situations when the topic requires the combination of different aspects, but in those situations the actual combination itself is important, and treated as a ‘single’ element by itelf, even though it comprises a composition. That composition is fixed, and analyzed as a single item. The fact that the stimulus is a composition is not relevant for the analysis.

The ingoing approach of Mind Genomics is the opposite of the conventional approach. The basic interest remains the performance of the individual element, and from that performance the understanding of how the respondent, the older adult, makes a decision. The strategy is different, however, working with combinations, and from the response to these combinations estimating the performance of the individual elements, the messages.

Figure 1 shows an example of the vignette. The vignette was shown twice, first instructing the respondent to assign a rating of importance, and second insructing the respondent to choose a feeling/emotion. To the respondent it appeared that the vignette did not change, only the insrtructioins did.

fig 1

Figure 1: Hows an example of a 4-element vignette, with the two rating scales.

There are at least three clear advantages emerging from a Mind Genomics study.

Ecological Validity

The combination of elements is ecologically more valid because it describes something that could be real. People are accustomed to reading combinations of ideas in everyday life, whether in advertisements, or hearing the description in a story told to them, etc. We call this ‘ecological validity’ because it is that to which they people are accustomed.

Inability to ‘game the experiment’

The continually changing combinations of elements make it virtually impossible for the respondent to find a ‘right answer.’ The vignettes appear to comprise elements put together in a haphazard order. Most respondents feel that the combinations are, in fact, random. When asked about their experience, many respondents said that they could not figure out the ‘correct answer’ from the pattern of vignettes, and simply ‘guessed.’ This ‘guessing’ is actually not the case, because otherwise the responses would not correlate with the ratings, which they do. Figure 2 show the adjusted multiple R (Pearson Correlation), a meaure of the goodness of fit of the 108 models, one per respondent, with the models predicting the response from the elements. Were the respondents actually ‘guessing’, the adjusted multiple R across the 108 respondents would cluster around 0 – 0.3. There are a number of respondents with adjusted multiple R values of 0. These respondents were no doubt guessing. The data from the other respondents can be said to be consistent.

fig 2

Figure 2: Distribution of adjusted multiple R statistic for 108 respondents. R values near 1.0 suggest a strong, consistent relation between the presence/absence of elements and the 9-point rating. R values near 0 suggest no relation between presence/absence of elements and the 9 point rating.

No need to ‘know’ the right test stimuli at the start of the session

Mind Genomics was created with the idea that one need not know the ‘correct combinations’ at the inception of the experiment. All- too-often the research preparation focuses on weaker than optimal efforts to narrow the range of possible combinations of ideas, such narrowing done by qualitative discussion. Only when the researcher feels that the correct combinations have been identified does the researcher then use the experment to ‘validate’ the guess about what elements are really important. This effort is self-defeating. Conventional research makes ‘the perfect the enemy of the good.’ It is better to have an inexpensive, rapid, iterative system which allows quick screening of messages, viz. in the form of vignettes, with the poor performers eliminated, and new performers inserted, for the next iteration.

Step 3 – Invite Respondents to Participate

Good practice dictates that the respondents be selected by a third party, based upon the research specifications. The increasingly popular use of the Internet as the reearch venue has spurred the growth of many providers who specialize in such online studies. The respondents in this study were recruited using a local US panel provider. The respondents were ‘double opt-in’, viz., agreed to participate in these types of studies. The identify of the respondents was never disclosed to the research team performing the study.

The panel provider sent a link to the respondents with the topic, doing so to adults 65 and older. The records kept by the provider ensured the age. The respondents who agreed to participate were introduced to the the study by the screen shown in Figure 3. The majority of the introduction is ‘bookkeeping’, informing the respondents about the topic, but spending more time about the nature of the vignettes, the approximate amount of time, and the rating questions. These instructions have been significantly shortened at the time of this writing (2021). The standard Mind Genomics study has been reduced in size from 35 messages in 50 combinations to 16 messages in 24 combinations.

fig 3

Figure 3: The orientation page to the communal dining study for seniors.

Analysis and Results

Converting the Data to Usable Formats

Each respondent evaluated 50 vignettes, rating every vignette on two scales, as noted above. The first scale was the Likert scale for importance, anchoared at 1 (Definitely NO) and 9 (Definitely YES). The second question is called a nominal scale. Each of the seven scale points corresponds to a feeling/emotion. The scale itself has no intrinsic numerical properties for analysis. The numbers are placeholders, corresponding to different words.

It is common in the world of consumer research and political polling to reduce the scales to a binary scale, yes/no. The binary scale makes it easy to communicate the findings. It is a matter of understanding what a number ‘means.’ ‘No’ versus ‘Yes’ is understandable. A rating of a 4 versus a 7 is less understandable, other than what was rated 7 had ‘more’ of the attribute than what was rated ‘4.’

The transformation was straightforward. TOP2 (Important) – Ratings of 1-7 were transformed to 0 to denote ‘not important.’ Ratings of 8-9 were transformed to 100 to denote ‘important.’ The usual transformation is 1-6 and 7-9, but the interest here was to identify the ‘really imporant’ messages. Thus, the range corresponding to ‘important’ was narrowed. This first transformation produced the necessary data for the subsequent analysis by OLS (ordinary least-squares) regression, which would relate the presence/absence of the 35 elements to the binary rating.

The second transformation creates two new binary variables, POS (positive emotion), and NEG (negative emotion), respectively. When the respondent selected either the feeling ‘interested’ or ‘happy,’ POS took on the value ‘100’, and NEG took on the vaue ‘0’. When the respondent selected any other feelings, POS took on the value ‘0’ and NEG took on the value ‘100.’ This second transformation also produced the necessary format of data for OLS regression.

One final transformation, or better prophylactic action was done to ensure that each dependent variable (TOP2, POS, NEG) was always different from 0, and that the different. A small random number (<10-5) was added to each transformed value, to create slight variation across the responses of a single respondent. This process ensured that the OLS regression would never encounter the situation that all observations for a dependent variable (viz., all TOP2, or POS or NEG) for a given respondent would be the same value. OLS (ordinary least squares) regression requires some vanishingly small variation in the dependent variable.

Mean Ratings

The simplest, most direct analysis involves computing the average rating assigned by the different groups of respondents. By different groups we refer to the total panel, to gender, age, married versus single, number of meals per day eaten by the respondent, order of testing the vignettes, and to three newly created groups of mind-sets, the criteria for which are presented below. For this first analysis the focus is on whether there are dramatic differences across the defined respondent subgroups in the averages of TOP2 (what is important), and the emotions selected (Positive, POS; Negative NEG).

Table 2 shows us the averages ratings across all respondents which fall into a particular group. Thus the Total Panel comprises the averages of all 108×50 or 5,400 vignettes. We get a sense of the proclivity of the groups to consider vignettes important, respectively, as well as generating a positive feeling or a negative feeling.

Table 2: Averages for the four key dependent variables, by different groups of respondents or different orders of testing.

table 2

For the most part, the averages are similar across key subgroups. For groups of respondents defined by who they say they are, and by what they do, we see a few patterns which are interesting. There are more group to group differences when the respondent subgroups are created from the pattern of ratings (emergent mind-sets, discussed below).

The most notworthy differnence is the average rating of TOP2 (importance) for two groups defined by how frequently they eat. Those who eat two meals a day thought the vignettes to be far less important, on average, and those who eat three meals a day thought the vignettes to be more important (28 vs 40).

The second noteworthy difference is the emotional response by age. When rating the feeling after reading the vignette, the younger respondents chose the positive emotion slightly more frequently than did the the older respondents (67 versus 62).

Relating the Presence/Absence of the 35 Elements to the Three Newly-created Dependent Variables

Beyond simple averages and the discovery of some interesting differences lies the opportunity to link the elements and the ratings, and by so doing create a deeper undertanding because the elements themselves are ‘cognitively rich’. Table 2 showed us ‘averages,’ but Table 2 cannot tell us whether the patterns we see correspond to anything more deep. That deeper understanding will emerge from the linking exercise. We will more deeply understand the mind of the respondents because the strong performing elements, those with the deeper linkage, will have meaning in and of themselves.

The initial linking is done by regression modeling. The modeling creates an equation relating the presnece/absence of the 35 elements to the binary rating. The equation states simply that the binary dependent variable is the sum of an additive constant (baseline) and individual contribution of each element, respectively.

The equation is written as follows: Binary Dependent Variable = k0 + k1(A1) + k2(A2) … k35(E7)

The additive constant, k0, is the expected value of the binary dependent variable (e.g., TOP2 for important, POS for positive emotion, NEG for negative emotion), estimated in the absence of all 35 elements. The experimental design ensures that all vignettes comprise 2-5 elements, primarily 3-4 elements as noted above. Thus, the additive constant is a purely computed, theoretical parameter, an ‘adjustment factor.’ The additive constant is the baseline, the basic likelihood to choose a rating.

Table 3 shows the results from the first application of the modeling, result from the Total Panel. Table 3 is short, allowing us a sense of what really makes a difference. We present only those elements which have a TOP2 coefficient of +8 or more, or a POS or NEG coefficient of +10 or more. These cut-points are selected to focus our search for patterns on those elements which perform ‘strongly,’ viz., are statistically ‘significant’ (p<0.05), in the language of interential statistics.

Table 3: Strong performing elements for the Total Panel.

Total Panel


TOP2

Additive Constant

39

E5 Food is served hot out of the oven every time

10

POS

NEG

Additive Constant

74

26

E2 Foods with soft textures are your preference

10

E7 You enjoy hot and spicy flavors

12

D5 Red meat is your choice every time

12

A4 Eating by yourself

21

A2 The overall volume of noise in the dining room is high

27

Total Panel – Importance: 39% likehood of being saying something is important. Warm food is important.

Total Panel – Feelings: Strong basic positivity (74%), but no ‘delighters’. There are are strong negatives, however; eating by oneself and eating with noise, respectively.

Does More Information in the Vignette Affect the Coefficients?

The respondent population in this study was 65 years or older. It is very likely that most of the respondents would never have participated in an experiment quite like the Mind Genomics experiment presented in the previous data. One of the issues which continues to arise is just ‘how’ do the respondents actually form their judgments, and are the judgments affected by the complexity of the test stimulus? That is, most people are accustomed to answering questions one question at a time, with one topic, even though in the introduction we suggested that this one-at-a-time approach might lead to biased data because the respondent would attempt to provide what is believed to be ‘the correct answr’

The data collected here can address one issue, namely are we likely to see the patterns of coefficients change when we base our analysis only on the vignettees comprising three elements, versus only on the vignettes comprising four elements. Recall that in the set-up, most of the vignettes comprised either three or four elements. Only three of the vignettes comprised 2 or 5 elements, respectively.

The robustness of the data from the total panel emerges from Figure 3. The data were divided into two strata, those vignettes comprising three elements, and those vignettes comprising four elements. These two data sets were analyzed in parallel, by computing a simple equation relating the presence;absence of the 35 elements to the response (Top2, Positive Emotion, Negative Emotion, respectively). To make the comparison easier, the euqations were estimated without an additive constant, so that one could directly compare the coefficients to each other.

The equation is written as: Dependent Variable = k1(A1) +k2(A2) … k35(E7)

Each anaysis generated 35 coefficients. Figure 4 shows three scatterplots. The abscissa shows the 35 coefficients estimated using only those vignettes comprising three elements. The ordinate shows the same 35 coefficients, this time estimated using only those vignettes comprising four coefficients. There are remarkably high correlations, even though at an element by element basis basis there might be some slight difference in the value of the oefficient for that element. The patterns and decisions would be the same, suggesting remarkable stability of judgment.

fig 4

Figure 4: Values of the coefficients estimated using only vignettes comprising three elements (abscissa) versus using only vignettes comprising four elements (ordinate).

Gender

Table 4 shows the strong performing elements by gender. The gender differences are clear.

Table 4: Strong performing elements for Males vs Females.


TOP2

Males

Additive Constant

41

E5 Food is served hot out of the oven every time

8

Females

Additive Constant

38

C7 Having the option for ordering smaller portions of the items on the menu

14

E5 Food is served hot out of the oven every time

12

C5 Clear and simple wording on the menu makes it easy to decide what you will order

11

B5 Waiters let you substitute items such as sides and salads not included in the menu item description

9

E1 The aromas of herbs or spices you love

9

B2 Waiters who are knowledgeable about the food help you select items from the menu

8


POS

NEG

Males

   
Additive Constant

74

26

D4 If it contains chicken you will like it

10

D5 Red meat is your choice every time

12

A4 Eating by yourself

19

A2 The overall volume of noise in the dining room is high

27

Females

   
Additive Constant

75

25

C7 Having the option for ordering smaller portions of the items on the menu

11

B5 Waiters let you substitute items such as sides and salads not included in the menu item description

10

D7 You like large portions of food

10

D6 You can’t go wrong with a simply prepared fish dish

12

E2 Foods with soft textures are your preference

14

D5 Red meat is your choice every time

14

E7 You enjoy hot and spicy flavors

19

A4 Eating by yourself

23

A2 The overall volume of noise in the dining room is high

26

In terms of what is important, for males it is only warm food, out of the oven. For females, there are five elements covering portion size, warmth, simplicity of ordering, flexibility, and sensory aspects (2).

In terms of positive emotions, delighters, no elements stand out for males. Two elements stand out as delighters for females:

Having the option for ordering smaller portions of the items on the menu

Waiters let you substitute items such as sides and salads not included in the menu item description

Age

Table 5 shows the strong performing elements by the two age groups.The two age groups are similar to each other. There are some differences, but in degree, and not very large.

Table 5: Strong performing elements for Males vs Females.


TOP2

Age 65-70
Additive Constant

38

E5 Food is served hot out of the oven every time

10

Age71+

Additive Constant

41

E5 Food is served hot out of the oven every time

11

POS

NEG

Age 65-70

Additive Constant

73

27

E7 You enjoy hot and spicy flavors

10

D4 If it contains chicken you will like it

10

D5 Red meat is your choice every time

13

A4 Eating by yourself

20

A2 The overall volume of noise in the dining room is high

26

Age 71+

Additive Constant

71

29

C7 Having the option for ordering smaller portions of the items on the menu

10

E4 You prefer food that is under-salted

10

D5 Red meat is your choice every time

11

E2 Foods with soft textures are your preference

12

A4 Eating by yourself

15

E7 You enjoy hot and spicy flavors

18

A2 The overall volume of noise in the dining room is high

26

Both ages want ‘Food is served hot out of the oven every time’. In terms of emotion, there is only one delighter, that for the older respondent: Having the option for ordering smaller portions of the items on the menu

Mind-sets Based on the Patterns for Importance, and the Patterns for Emotions

The foregoing analysis of the models suggests that there are modest differences between complementary groups, when these groups are self-defined. A fundamental principle of Mind Genomics is that people differ from each other in terms of patterns of judgment about the events of the everyday. Mind Genomics looks at inter-individual variation from the ‘bottom-up’, viz., for the particular topic [9].

When applied to the topic of senior communal dining, we can divide the respondents by either the pattern of what is important, the pattern of what drives positive and negative emotions, or a combination of both. The computational approach is the same; create individual level models relating the presence/absence of the elements to the dependent variable and then cluster the respondents on the basis of the patterns of the coefficients.

There are a few modifications to the modeling done to make the results simpler to work with.

  1. Begin with the data from importance (TOP2). Estimate the individual-level models without an additive constant. The coefficients correlate highly when the models are estimated with an additive constant versus without an additive constant.
  2. Using the coefficients for TOP2 (importance), cluster the 108 respondents into two groups, and then three groups, based upon the k-means algorithm [10]. Clustering simply divides the respondents (or other objects) into a set of non-overlapping groups, based upon the pattern of their coefficients. The two-cluster solution was hard to interpret. The three cluster solution was easier. These become the three mind-sets, MS1, MS2, and MS3, respectively
  3. Move to the emotion data (POS, NEG). For each repondent estimate the coefficients for POS and for NEG separately. Again, do not estimate the additive constant. Combine the two sets of 35 coefficientsm to create a set of 70 coefficients. Extract three clusters, or mind-sets; MS4, MS5, and M6 respectively.
  4. Combine the coefficients for TOP2 (#1) with the coefficients for emotion (#3), to create a set of 105 coefficients. For this third analysis, reduce the 105 coefficients to a set of 14 statistically independent variables using principle components factor analysis [11]. The analysis creates 14 new variables, the factors, with each respondent located on these newly created variables, according to the 14 factor scores for each respondent. Then cluster the 108 respondents on these 14 new variables, to create a third group of mind-sets (MS7, MS8, MS9).

The results from the clusteriong the mind-sets appear in Tables 6-8.

Mind-Sets Created on the Basis of Importance

We focus only on groups emerging for importance, to see how they differ. The first mind-set feels that many things are important. The additive constant is 58, showing that they believe that the topic of senior communal dining to be important. Fve of the elements are important, based upon the requirement that the coefficient be +8 or higher. These respondents feel that it is service (Table 6).

Table 6: Strong performing elements based upon the coefficients for mind-sets defined by different patterns of importance (TOP2).


TOP2

Mind-Set 1 – Service is important

 
Additive Constant

58

B5 Waiters let you substitute items such as sides and salads not included in the menu item description

13

E5 Food is served hot out of the oven every time

12

B7 Waiters remember the type of food or drink you like

10

B1 Friendly waiters can really make for an enjoyable meal

9

B4 Speedy service is important for your enjoyment

8

Mind-Set 2 – Make the meal simple – just warm out of the oven, and that’s all

Additive Constant

26

E5 Food is served hot out of the oven every time

10

Mind-Set 3 – The experience is importance

Additive Constant

27

A3 Eating with a group of friends

10

E5 Food is served hot out of the oven every time

9

C5 Clear and simple wording on the menu makes it easy to decide what you will order

9

A7 Table settings (plates, silverware, tablecloth etc.) makes for an enjoyable meal

9

C3 The amount of sodium for each item listed on the menu will help you make a choice

8

The second mind-set shows a much lower additive coefficient, 26. They are not likely to think of anything as really important, except the food be warm out of the oven. The third mind-set also shows a low additive constant, 27. The elements which are important revolve around the experience itself.

The one common element which is important is E5: Food is served hot out of the oven every time.

Mind-Sets Created on the Basis of Emotional Response

Table 7 show the strong performing elements for both POS and NEG. The three mind-sets which emerge show similar additive constants. As in the case of segmenting on importance, the mind-sets differ on the elements, but the picture is less clear.

Table 7: Strong performing elements based upon the coefficients for mind-sets defined by different patterns emotions (POS, NEG).


POS NEG

Mind-Set 4 – Picky eater, does not want to be alone

   
Additive Constant

75

25

D4 If it has chicken, you will like it

11

D5 Red meat is your choice every time

13

A4 Eating by yourself

33

A2 The overall volume of noise in the dining room is high

39

Mind-Set 5 – A good sensory experience engenders a warm feeling, but hold off on providing too much information

Additive Constant

73

27

E1 The aromas of herbs or spices you love

12

E5 Food is served hot out of the oven every time

12

C3 The amount of sodium for each item listed on the menu will help you make a choice

10

C4 Listing the amount of fat in menu items helps you decide what to order

10

C6 You select menu items with exotic or foreign sounding descriptions

14

D6 You can’t go wrong with a simply prepared fish dish

14

A2 The overall volume of noise in the dining room is high

18

Mind-Set 6 – Good service, good food, good company all make for a great meal, but don’t go into specifics about the food

Additive Constant

68

32

B5 Waiters let you substitute items such as sides and salads not included in the menu item description

11

B7 Waiters remember the type of food or drink you like

10

E4 You prefer food that is under-salted

10

E3 You choose food with vibrant colors

10

D5 Red meat is your choice every time

15

A4 Eating by yourself

16

A2 The overall volume of noise in the dining room is high

17

E6 You prefer food that is served warm

18

E2 Foods with soft textures are your preference

25

E7 You enjoy hot and spicy flavors

33

The one common element is A2, The overall volume of noise in the dining room is high’. This element consistently drives a negative emotion.

The three mind-sets do not share the same elements as delighters, viz., drive a strong positive emotional response.

Mind-Set 4 shows no delighters

Mind-Set 5 suggests delight with sensory experience

Mind-Set 6 suggests delight with good service

Avoid specifics.

It is important to emphasize that the segmentation by pattern of emotional response fails to reveal many delighters, at least among this age group. There are, however, many elements which drive a negative emotion.

Is there any Benefit to Segmenting by Both Intellectual and Emotional Responses at the Same Time?

We need not limit cluster anaoysis to one type of variable, e.g., importance or emotion, respectively. What happens when we create a profile for each, and do the analysis simultaneously? Table 7 shows the third set of three mindsets, created from considering importance and emotion jointly. Rather than providing a richer set of results, combining two measures, importance and emotion, ends up generating a demostrably more sparse set of results, harder to understand. There is nothing new which emerges. The same delighters emerge (viz., choice in what one orders). These results suggest it is better to work separately with intellectual dimensions (viz., importance) and with emotional dimensions, respectively.

Composition of the Mind-sets

An onpoing issue in consumer research is the whether there is a strong relation between standard demographics and other information gathered for a respodent and membership in a specific mind-set. One might expect there to be, but the data from 30+ years of Mind Genomics and its predecessor research suggest that the simple co-variation is not the case. Who a person IS does not covary in a simple way with how a person THINKS. One might be able to create a predictive model using statistics, but the model is usually descriptive, works in a limited way, and does not necessarily have any value other than ability to predict.

Table 8 shows once again that although one can readily create apparently meaningful mind-sets from the coefficients (viz., the underlying response patterns), but there is little in the way of covariation of these mind-sets with the different ways of dividing the respondent as the respondent identifies herself or himself; gender, age, marital status, eating patterns, or health issues (Table 9).

Table 8: Strong performing elements based upon the coefficients for both importance (TOP2) and emotional response (POS, NEG).

TOP2

Mind-Set 7 – Joint Mind-Set (Service and warm food)

Additive Constant

42

B1 Friendly waiters can really make for an enjoyable meal

12

E5 Food is served hot out of the oven every time

11

Mind-Set 8 – Joint Mind-Set (warm food)

Additive Constant

32

E5 Food is served hot out of the oven every time

15

Mind-Set 9 – Joint Mind-Set (Easy to decide and to customize)

Additive Constant

40

C5 Clear and simple wording on the menu makes it easy to decide what you will order

11

B5 Waiters let you substitute items such as sides and salads not included in the menu item description

9


POS

NEG
Mind-Set 7 – Joint Mind-Set (Service and warm food)


Additive Constant

81

19

B5 Waiters let you substitute items such as sides and salads not included in the menu item description

11

A2 The overall volume of noise in the dining room is high

34

A4 Eating by yourself

41

Mind-Set 8 – Joint Mind-Set (Warm food)

Additive Constant

72

28

E5 Food is served hot out of the oven every time

14

C7 Having the option for ordering smaller portions of the items on the menu

11

C1 Nutritional information on the menu to help you make your selections

11

A2 The overall volume of noise in the dining room is high

14

C6 You select menu items with exotic or foreign sounding descriptions

15

E7 You enjoy hot and spicy flavors

18

Mind-Set 9 – Joint Mind-Set (No delighters)

Additive Constant

61

39

A4 Eating by yourself

10

E7 You enjoy hot and spicy flavors

11

D2 You enjoy vegetables that are thoroughly cooked

14

D4 If it contains chicken, you will like it

15

D6 You can’t go wrong with a simply prepared fish dish

15

E2 Foods with soft textures are your preference

16

D7 You like large portions of food

18

D5 Red meat is your choice every time

27

A2 The overall volume of noise in the dining room is high

31

Table 9: Composition of the mind-sets based on how the respondent self-defines herself or himself.

Mind-Sets based on Importance

Mind-Sets based on POS NEG Emotions
 Base Sizes Total MS1 MS2 MS3 MS4 MS5

MS6

Total Panel

108

41 36 31 44 32

32

Gender
Male

66

29 22 15 26 22

18

Female

42

12 14 16 18 10

14

Age
Age 65-70

72

28 21 23 25 21

26

Age 71+

25

7 11 7 13 8

4

Marital Status
Married

66

27 24 15 27 17

22

Single

42

14 12 16 17 15

10

Frequency of Eating
Day/3 Meals

59

27 18 14 24 14

21

Day/2 Meals

43

13 15 15 18 15

10

Health Issues
Cholesterol

108

41 36 31 21 15

16

Blood Pressure

56

18 19 19 21 14

21

Heart Disease

20

3 7 10 7 5

8

Gastrointestinal discomfort

19

10 7 2 8 8

3

Discussion and Conclusions

As the population ages, more of the population may be expected to move to community facilities, where the respondents will be eating food prepared by a central kitchen. Unlike community feeding in schools, the communal meals of adults may be expected to be more difficult. Adults will have had a lifetime of experience choosing their own foods. Subtle issues of satisfaction may not revolve around the food at all, but around the ambiance.

The data suggest a panoply of individual differences. For most of the world of food service, individual differences in preference end up being an annoying factor, something which reduces the ability of the food service ‘system’ to satisfy and thus to achieve a high satisfaction score [12]. When it comes to satisfaction, however, it may well turn out that the key to satisfaction is to understand the specifics of what to do, rather than the general categories of what is done. For example, Cluskey (2001) suggested that three meals rather than two meals might increase satisfaction, a suggestion which is specific, and which finds confirmation in these data [13]. Undoubtedly, there are many more such suggestions that have been made, which are lying around dormant, but potentially game-changing.

The data in this study once again suggest the need for exploratory research, with ‘cognitively rich’ material as the stimuli. Asking respondents to rate stimuli which are not specific runs the risk of missing what is really important. The research process embodied in Mind Genomics can provide a database about elements, and what is important. When the respondents evaluate the combinations, they do so in a repeatable fashion, and appear to do so validly. Yet, and suprisingly, few people appear to ‘know’ what is really important, despite experience in community foodservce. The elements selected here were chosen on the basis of what was thought to be important, but surprisingly, the results suggest only a few elements stand out, not many delighters, and some but not many which are important.

As a closing note, it is worth noting that the Mind Genomics platform, as constituted as of this writing (Fall, 2021) makes it feasible, straightforward, easy and affordable to do dozens, if not hundreds of similar studies in a short period of time, to create a wiki of the mind for ‘senior communal feeding.’ The opportunity for such an effort is being recognized as the natural outgrowth of qualitative research, and quantitative research [14-16].

Acknowledgment

The data for this paper were first presented at the Pangborn Conference, Toronto, Canada, September, 2011, and then reanalyzed for this paper. The authors wish to acknowledge the original contributions of Christopher Loss of Cornell University, for the original work presented in 2011.

References

  1. Brecht SB, Fein S, Hollinger-Smith L (2009) Preparing for the future: Trends in continuing care Retirement Communities. Seniors Housing & Car Journal 17: 1.
  2. Seo S, Shanklin CW (2006) Important food and service quality attributes of dining service in continuing care retirement communities. Journal of Foodservice Business Research 8: 69-86.
  3. Moskowitz HR (2012) ‘Mind genomics’: The experimental, inductive science of the ordinary, and its application to aspects of food and feeding. Physiology & Behavior 107: 606-613. [crossref]
  4. Moskowitz HR, Gofman A, Beckley J, Ashman H (2006) Founding a new science: Mind genomics. Journal of Sensory Studies 21: 266-307.
  5. Hinkelmann K, Kempthorne O (2007) Design and analysis of experiments, volume 1: Introduction to experimental design. John Wiley & Sons.
  6. Becker-Suttle Cheri B, Pamela A Weaver, Simon Crawford-Welch (1994) A pilot study utilizing conjoint analysis in the comparison of age-based segmentation strategies in the full service restaurant market.” Journal of Restaurant & Foodservice Marketing 1: 71-91.
  7. Sun YHC, Morrison AM (2007) Senior citizens and their dining-out traits: Implications for restaurants. International Journal of Hospitality Management 26: 376-394.
  8. Gofman A, Moskowitz H (2010) Isomorphic permuted experimental designs and their application in conjoint analysis. Journal of Sensory Studies 25: 127-145.
  9. Saulo AA, Moskowitz HR (2011) Uncovering the mind-sets of consumers towards food safety messages. Food quality and preference 22: 422-432.
  10. Likas A, Vlassis N, Verbeek JJ (2003) The global k-means clustering algorithm. Pattern Recognition 36: 451-461.
  11. Ringnér M (2008) What is principal component analysis?. Nature Biotechnology 26: 303-304.
  12. Seo SH (2006) Perception of foodservice quality attributes of older adults: compared by lifestyle and dining frequency in continuing care retirement communities. Korean Journal of Community Nutrition 11: 261-270.
  13. Cluskey M (2001) Offering three-meal options in continuing care retirement communities may improve food intake of residents. Journal of Nutrition for the Elderly 20: 57-62.
  14. Porretta S (2021) The changed paradigm of consumer science: From focus group to Mind Genomics. In: Consumer-based New Product Development for the Food Industry, 21-39. Royal Society of Chemistry.
  15. Bakar AZA (2013) Dining at continuing care retirement communities: A social interaction view. Kansas State University. PhD thesis.
  16. Christine Sun YH (2008) Dining-in or dining-out: Influences on choice among an elderly population. Journal of Foodservice Business Research 11: 220-236.

Fast, Cheap, Objective: A Mind Genomics DIY (Do It Yourself) Cartography Using Third Parties to Evaluate Options in Business Negotiations

DOI: 10.31038/MGSPE.2021114

Abstract

As preparation for a negotiation involving the merger of two corporations through direct purchase, an experiment was conducted to determine whether the negotiations could be enhanced by understanding how ‘uninvolved third parties’ felt about the different aspects to be negotiated. These aspects were topics such as dividing shares of the merged company, and policy toward retaining employees and assets. The research effort was to assess the operational viability of a process which required about an hour from beginning to end to provide that ‘third party view of the issues. Aspects of the merger were surfaced and combined into vignettes comprising 2-4 element, and evaluated by an outside panel of respondents, unknown to the negotiating parties. The panel responses to the elements were deconstructed into the potential ability of each element to drive agreement (MERGE – YES) or disagreement (MERGE – NO). The process quickly revealed the elements on which there would probably be agreement, and elements over which there might be conflict. A segmentation of the test respondents showed two different mind-sets, uncovering types of sticking points for each mind-set.

Introduction

A great deal of the practice of the law involves negotiation and coming to an agreement. The negotiations may be left to the parties, to a professional negotiator/mediator, to the lawyers involved, and so forth. When there are opposing parties with different interests, how can negotiations be expedited, using knowledge, to reduce time, and reduce expense? Is there room for an application of the scientific method, which can provide a sense of what the parties can agree upon? Discussions with law professionals continue to suggest problems with ‘access to the law’ [1,2]. By access to the law is meant an easy, affordable, rapid way to get legal advice. Many lawyers are happy to give a free hour or so of consultation before they take on the case and request payment for their legal services. Despite this gesture, which is often welcome by businesspeople making deal as well as by parties seeking to sue another, the access to the law is not what it could be. The lawyer or the legal aid group must put time against the situation, understand it, and then decide whether there is a sufficient opportunity to monetize the time put against the effort. One unhappy consequence is that the ordinary small efforts are given short shrift. Sometimes the unhappy result is the oft-heard plaint ‘the only ones who made money from the situation were the lawyers.’ As denigrating as the statement might seem, it is hard to refute, especially when one tries to look at what the law provides for the small issues. The literature on negotiation, whether for business transactions or legal issues, continues to grow. The value of sensitivity in negotiation is obvious, and serves the negotiator well [3]. In fact, the importance of such sensitivity, and its practical application are subjects taught in law schools and business schools [4-6], as well as in the world of medicine. What then might be an appropriate technology or at least technique to introduce into the world of law to create a way to access the law? The approach might have to avoid taking up the time of a legal professional, because that defeats the purpose, especially when the case or situation is relative minor. The equivalent would be to find an approach to access knowledge in a set of printed material, without having to involve a librarian or even a legal assistant. In other words, the approach would have to rely on automatic computing, and analysis, to some people bordering or actually using ‘artificial intelligence.’ The idea of having technology assist in the negotiation process is not a new one. With the advent of computers and the recognition that there can be decision support systems of an electronic nature, interest has focused on the features of such a system [7-9].

The foregoing problem has been the focus of author HRM for 20 years, since 2001. The issues then, twenty years ago, were to understand how to evaluate the feelings of people presented with scenarios of a societal nature. The approach used by author HRM is called Mind Genomics [10]. Mind Genomics grew out of work beginning in 1980, trying to understand the patterns of preference of people towards foods, and the application of those patterns to the creation of commercial products [11]. The pioneering work, first with products eventually migrated into a variety of areas, some dealing with food, others dealing with social issues [12], and finally with the law [13], and with bigger issues in society [13]. The original efforts migrated to consulting projects in the legal and business areas, with work in different places around the world. It was clear from the projects that people from different countries often had markedly different styles of negotiating, an observation supported by published studies [14]. What was also interesting was the range of different responses to the same offers, suggesting the need to treat aspects of the negotiation process in a way which respects and understands these profound individual differences.

Demonstrating the Opportunity Through a Short Case History

During a meeting with lawyers in the Albany region of New York State, the opportunity emerged to demonstrate the approach. The topic was a merger of two companies. The opportunity was to identify how the owners of two companies could find an area of agreement. Separately from the private meeting with their lawyers negotiating the merger, the parties agreed to discuss the issues with author HRM, in an informal manner, and strictly for purposes of science. From the short, 10-minute background discussion, it become possible to ‘create’ a matrix of different issues, elaborating on the topics raised. At this point, the participants in the merger, here presented as Charles and Rebecca, respectively, returned to the meeting, after having given HRM permission to do a small demonstration ‘experiment’ using the material surfaced in the meeting. The relevant information was disguised where necessary.

Table 1 shows the set of four questions emerging from the discussion. The questions pertain to the topics of the merger. The 16 answers or elements present alternatives raised in the discussion, as well as several added by HRM afterward, based on the discussion, but not directly raised. The Mind Genomics process provides a template by which the researcher can quickly record the topic, the four questions, and the 16 answers, as shown in Table 1.

Table 1: The four questions and the four answers to each question, for the project pertaining to the merge of two companies.

table 1

Figure 1 shows three panels, each a screenshot from the actual project. The left panel shows the selection of the project name (business case Rebecca). The middle panel shows the four questions. The right panel shows the four answers to Question 1. The Mind Genomics program follows this right-hand panel with three additional panels (now shown), allowing for the remaining three sets of four answers each. It is important to note that the project can be set up ‘live,’ viz., in real time. The www.BimiLeap.com website is set up to guide and structure the thought processes, making the approach feasible in the middle of the meeting to gain quick feedback. The website can be freely accessed and easily used. Figure 1, as well as Figures 2 and 3, show the set-up of the experiment, requiring about 15-20 minutes at most.

fig 1

Figure 1: The set-up screens for the Mind Genomics project showing the selection of the name, the list of four questions, and the set of four answers to the first question.

fig 2

Figure 2: Screen shots showing communication to the respondent, including the third self-classification question (left panel), the rating scale and anchors (middle panel), and the short orientation which introduces the topic to the respondent.

fig 3

Figure 3: The final user screen (left), and the two respondent screens (middle, self-profiling classification; right, sample vignette to be rated).

The next set of screens shown in Figure 2 instruct the user first to add a question pertaining to the respondent (left panel), then the rating scale, and finally the orientation to the study that the respondent will read. The Mind Genomics project is entirely private, so that the respondent is only identifiable by age gender and the third question.

Have you negotiated in the last five years in business?

1=no 2=yes 3=no but occasionally give advice 4=Not applicable

The rating scale provides the opportunity for the respondent to voice her or his opinion about the merger (whether or not the offer for merger will be rejected (rating = 1) or accepted (rating = 9)). This scale is called the Likert Scale, showing the magnitude of feeling. More recent practice has been to use a shorter 5-point scale. The scale is anchored at both ends, serving as a tool to show the respondent’s opinion AFTER the respondent has read the vignette, the test stimulus, described below.

Low Anchor: Rating question                                                   1=reject offer

High Anchor: Rating question                                                 9=accept offer

The orientation provides the user with a way to tell the respondent about the project. Creating the orientation is easy, but the user should be sure to provide as little specific information as possible. It will be the vignettes, small combinations of 2-4 messages which will provide the necessary ‘real’ information about the communications pertaining to the proposed merger.

Rebecca and Charles are merging companies. Here are negotiation suggestions. Read each screen as a suggestion and rate whether it be accepted by both by both Rebecca and Charles

Figure 3 shows the final screen of the user’s set-up experience (left panel), and then the respondent’s experience (middle and right panels, respectively). The user is given a set of options, to declare the study a business study or an academic study, to define the number of respondents to participate, and then to define the sourcing of the respondents. The study here involved the selection of 25 respondents, a sufficient and affordable number of respondents to provide necessary information about the ‘case.’ The user specified recruiting from the preferred provider (Luc.id, Inc.), and did not choose any specifics about the respondent. The final step is either to review and edit, or to ‘launch’ the study, and pay with a credit card.

The respondents are selected by country, and by other criteria available through the Luc.id system of literally hundreds of user-specified criteria. The respondents are sent notifications, and within minutes, many of the respondents from the ‘blast email’ participate. The respondent goes through two major steps for this study. The first step is completion of a self-profiling questionnaire (middle panel), which asks for gender, age, and response to the classification question shown in Figure 2 (left panel. The second step is the evaluation of 24 vignettes, set up like the vignette shown in Figure 3 (right panel).

The right panel of Figure 3 shows all of the information that the respondent needs to decide, but using information presented in an unusual way. Every one of the 24 vignettes that the respondent will see is set up the same way:

a. Orientation about the topic

b. Reminder to consider the entire vignette (viz., all the elements) as one idea

c. The rating question/scale

d. Three elements put together seemingly ‘at random,’ left justified

e. The response scale and the anchors

The vignette itself comprises 2-4 elements, combined according to an experimental design. The combination may look random, but the combination(s) is set up according to a strict structure called an experimental design [15]. Each of the 24 screens has a defined number of elements, and a defined listing of the specific elements to be incorporated. As a consequence, each of the 16 elements appears exactly five times, and is absent from 19 vignettes. Each question or grouping of four elements is allowed to contribute either one or no elements, but never two or more elements. This design feature means that for bookkeeping purposes, one should put into the same question two, three or four elements which are mutually contradictory. Finally, the 16 elements are statistically independent of each other, allowing for regression analysis. The novel part of the design is that by the correct permutation each respondent can evaluate the same ‘structure’ of vignettes, but the combinations are different. One can liken this metaphorically to the MRI, magnetic resonance imaging, which takes many pictures of the same tissue, all from different angles, and during the processing phase recombines them to arrive at a single in-depth image with 25 respondents, each viewing 24 DIFFERENT combinations, we end with 600 pictures of the topic, and the associated rating of that vignette or ‘picture’. The study was launched approximately 20 minutes from the start, although the novice may require at first 30-40 minutes to set up, and then launch. The actual data collection and basis, automated analysis, required 30 minutes. The results were ready for discussion approximately 60 minutes from the start, and available in printed form (easy-to-read EXCEL booklet). The speed and cost of the process are worth emphasizing before we look at the data. If nothing else, the process actually helped the merger negotiation by surfacing issues and the responses to the issues.

The First Experience with the Data – Average Ratings by Total and by Key Subgroups

Mind Genomics experiments generate a great deal of information, much of it usable. Our first analysis looks at the averages. We will look at complementary groups, shown in Table 2. The averages are computed on four measures

a. Rating = average of the 1-9 rating (1=merger offer not accepted .. 9=merger offer accepted)

b. TOP3 = a new binary variable, showing either strong acceptance (ratings 7-9) or all else (1-6)

c. BOT3 = a new binary variable, showing either strong rejection (ratings 1-3) or all else (4-9)

d. Response time in seconds = The Mind Genomics program measured the time from the presentation of

Table 2: Average values for ratings, binary variables and response times for Total Panel and key subgroups.

table 2

The test vignette to the time when the respondent rated the vignette. The authors’ experiences in a variety of studies suggest most response times of approximately 1.5-4.5 seconds for a vignette. Typically, response times of 8 or more seconds suggest that the respondent was multi-tasking. These longer response times (about 1/5 of the data) were simply eliminated from all analyses, but the remainder of the data from the respondent was kept.

Based upon Table 2 we see a simple story emerging when we look data from the total panel.

a. An average rating of 4.9 on the anchored 9-point scale, suggesting neither MERGER-YES (higher averages) or MERGER-NO (lower averages).. This may be due to most of the ratings clustering in the middle, or the decisions about equally divided between TOP3 (YES to the merger), and BOT3 (NO to the merger). Table 1 shows that the responses are divided about equally among YES (27%), NO (32%) and the rest MAYBE (100% – 27% – 32% = 41%)

b. The response time is short, about 1.6 seconds. The information in this merger is not difficult to comprehend and does not require much thinking. The information appears to be more emotionally driven than fact driven.

The self-profiling questionnaire allows us to identify respondents by gender, by age group, and by involvement in negotiations. Further analysis to uncover mind-sets (groups of people who think alike) reveal two mind-sets. These two mind-sets will be further explicated below. For the current analyses, it suffices to measure the average ratings for each of these defined groups. Table 3 suggests some differences, such as the fact that the younger respondents (ages 14-29) are far more negative about the prospects for the merger (BOT3 = 48), almost beginning with a negative attitude), and read the vignettes on average twice as quickly than do the older respondents (1.0 vs 2.1 seconds). For those with experience in negotiating, the average is overwhelmingly positive, and the time to read the vignettes is shorter. The two mind-sets differ from each other and are explicated below in depth.

Table 3: How the elements drive a third-party group (respondents) to feel whether there will be a merger (TOP3) or there won’t be a merge (BOT3).

table 3

Beyond Averages to the Stability/Instability of the Averages across the 24 Vignettes

A continuing issue in attitude research concerns how stable the responses are over time, especially when the respondent is evaluating many test stimuli. Practitioners have discovered the so-called ‘tried first bias’ [16], which means that the stimulus evaluated first may score aberrantly higher or lower than it would score when tried in the middle of a set of similar stimuli. This bias, sufficient to affect the validity of the data, has led to different ‘best practices’ such as testing only stimulus per person (so-called pure monadic), evaluating many products and rotating the order of the products to minimize the ‘tried first bias.’ The Mind Genomics system ensures that the respondents each evaluate a different set of vignettes, so that there is no tried first bias. Yet, there is always the possibility that the vignette evaluated first is biased, even though we cannot measure the effect of that bias due to the different combinations. Figure 4 shows two panels. The left panel shows the average TOP3 (merger = YES), and average BOT3 (merger = NO). The right panel shows the average response time. The graph shows the change in the averages across the 24 positions. Figure 3 does not suggest a systematic bias in the ratings for TOP3 or BOT3, although one might make a case for the variation in averages being at the start of the evaluation. The effect of repeated evaluations is far clear when the dependent variable is average response time. Over time the response times become shorter, presumably because at some point the respondent both knows what to do and responds more quickly when recognizing those elements which are important. It might an interesting study to compare different sets of messages around the same topic of mergers, to see whether the pattern of decrease of response time with experience in rating time is affected by the type of message.

fig 4

Figure 4: The change in the average responses (TOP3 – merge; BOT3 – no merge; Response time) as a function of position in the 24 vignettes evaluated by the respondent.

Linking Elements to Response to Determine ‘What Messages’ Work

The most important aspect of the Mind Genomics effort is the ability to link together the elements and the responses, and by so doing discover what elements might be driving the response. The benefit of the Mind Genomics design is that cognitive richness of the test stimuli. Up to now we have simply looked at the pattern and surmised what might be happening. Up to now we had to be content with discovering that there are regularities in the data, such as the drop in the response time with increasing experience, or the difference in the average rating by key subgroup. For practical applications, such as study of the efficacy of messages, we must move beyond general patterns of responses, and into the specific elements themselves. The strategy of combining the messages by underlying experimental design ensures that that the combinations have some semblance of reality, and that the respondent cannot ‘game the system.’ The elements are combined in a way which precludes the respondent from changing the criterion of judgment. Such change of criterion may occur when the messages, the elements, are presented one at a time. The respondent might well adopt one criterion when the issue is division of ownership, and another criterion when the issue is which employees and assets to retain. By combining the elements into vignettes, Mind Genomics makes it virtually impossible for the respondent to adjust the judgment criterion. As explicated above, each respondent evaluated a unique 24 different vignettes, with the elements statistically independent of each other [17]. The underlying experimental design makes it feasible to use OLS (ordinary least-squares) regression to relate the presence/absence of the 16 elements to the newly created binary dependent variables, TOP3 and BOT3, respective, as well as Response Time. The equation deconstructs the newly created binary variables into the part-worth contribution of each element, as well as a baseline value the additive constant.

The equation is written as: Dependent Variable = k0 + k1(A1) + k2(A2).. k16(D4)

The additive constant, also called the intercept, shows the expected value of the dependent variable (e.g., TOP3) when all 16 elements are absent. Of course, the experimental design ensures that every vignette comprises a minimum of two and a maximum of four elements, at most one element from each question. Thus, the additive constant is strictly theoretical, but does provide a sense of the baseline. Table 3 shows that the additive constant for TOP3 is 40, and the additive constant for BOT3 is 38. We conclude from that the basic likelihood is equal for votes for (TOP3) versus against (BOT3) the merger. It is in the coefficients where matters become interesting, informative. A positive coefficient means that including the element in a vignette will increase the vote, either for the merger (TOP3) or against the merger (BOT3). A negative or a 0 coefficient men that including the element in a vignette will not increase the vote, either for the merger or against the merger. In the interest of making the study simple to report, and patterns easy to spot It has become customary in Mind Genomics studies to report only the positive coefficients, and to highlight the strong positive coefficients, viz., those around 8 or higher. The negative and 0 coefficients do not tell us much. For TOP3 they tell us the strength of failure to push for TOP3. When we are really interested in the elements which actively drive away agreement (Merger – NO), we are better served by looking at the coefficients for BOT3. Positive elements for BOT3 are those which actively drive away agreement. Table 3 presents the positive coefficients for TOP3 and for BOT3, respectively. When an element fails to have a positive coefficient for either TOP3 or BOT3 the element does not appear. In this way it becomes easier to see the patterns. The data suggest that the there is an equal proclivity for Merger and No Merger. The elements which push for a merger are those about the way the merger will combine the companies. The elements which push away from a merger are those about ownership. It becomes clear that control is a major issue, as perceived by an outside group of people evaluating the different propositions for merger. The data do not mean that these are the actual issues that will be discussed, but rather perceived to be potentially contentious.

Mind-Sets and Negotiations

If we were to stop at the results in Table 3, the effort to understand the ‘sticking points’ of the merger would have emerged, in a matter of 30 minutes, from a small group of 25 respondents acting as ‘consultants,’ albeit unknowingly since their job was to evaluate the likely outcome of a set of discussion points. We could stop here and have our job more or less compete. Yet, there is more to be learned. That ‘more’ is the discovery of different ways of looking at the same information and arriving at different decisions. These different way are called mind-sets. Mind-sets emerging from segmentation have been a hallmark of marketing for decade [18], and is now interesting, or even better carving out new areas of the practice of business and law. Even with as few as 25 respondents it is possible to discover meaningful mind-sets. The researcher creates individual-levels, two per respondent, one for TOP3 vs elements, and the other for BOT3 vs elements. The models do not have an additive constant. The database comprises 25 rows (one per respondent), with 32 columns (16 for TOP3; 16 for BOT3). The numbers in the body of the data matrix are coefficients. The researcher clusters the respondents into two groups, based upon pattern of the coefficients. Within each cluster or mind-set are respondents whose pattern of 32 coefficients are ‘similar to each other, and dissimilar to the patterns of the 32 coefficients generated by respondents in the other cluster or mind-set [19]. After all is done, Table 4 reveals two clear mind-sets. Both mind-sets are equal in their desire for a merger, with the additive constants of 37 and 40. It is the elements which are important. Mind-Set 1 wants equity in the division. Nothing really turns off Mind-Set 1, viz., there is nothing driving BOT3. In contrast, Mind-Set 2 wants a rational merger, and is turned off by either unequal division of stock, or loss of control. The important thing about Table 4 is a sense of the fine-grained needs of the different mind-sets, setting the agenda about what to discuss, and what to ‘take off the table.’

Table 4: Strong performing elements for the two emergent mind-sets, created the combination of the 16 TOP3 coefficients, and the 16 BOT3 coefficients.

table 4

A Shortened, Which is Both Inclusive (Participatory) and Objectively (Data Centric)

The analysis above suggests a rich database can be developed quickly, viz., in less than 60 minutes, from start to analysis. The nature of the Mind Genomics approach forces the use into a disciplined presentation of the ‘case.’ Some may consider the speed and the concomitant ‘structuralizing’ of the process as a negative, viz, that those involved may be forced to study the topic without having a chance to think deeply about the topic. This criticism is absolutely correct. The spirit of the Mind Genomics process is founded on the alluring combination of structure, speed, and depth. The very design, as a computer-based app, with almost automatic front-to-back effort, and an automated basic analysis, prevents deep thinking, at least at the time of the evaluation. The focus is on pulling out the salient ideas, putting them into a template, involving a third part as judges in a way which prevent judgment biases, and h nth return with structured data. What might be the way such a system could be used in the world of the everyday? The first use is a subtle one. The structure forces the people involved to think about alternatives or options facing them. The user must contribute the question and the four elements for each question. The thinking, therefore, is to support one’s position, but rather to focus on the different aspect of the topic. Ongoing work with Mind Genomics suggests that simply requiring the participants to offer ideas in a structured manner improves their thinking. There is a second benefit as well. That benefit is the ability to identify what specifics work, and whether there exist hitherto unknown or only suspected mind-sets of individuals having different points of view [20]. Such information is important to the people involved in the case because it demonstrates the very real possibility that there are different ways to approach the same topic. The disagreements between people become more explainable. Even more promising, however, is the possibility of finding ideas which are very acceptable to one mind-set and to another, or at least ideas which are acceptable to one mind-set, and do not turn off the other. There is a third benefit, perhaps the most important. That benefit is improved access to the law, something being regularly recognized as a major need. Howard [21-25]. With an opposing party threatening to sue, or at least to damage by driving up legal fees, there is a need for rapid, inexpensive DIY (do it yourself) methods. It is quite possible that Mind Genomics might be one of those methods, a simple DIY system, executed collaboratively by the different groups involved in the negotiation, leading to speedier, fruitful negotiations, filled with mutual understanding, less expensive, and ultimately being far more productive.

References

  1. Frandino J (2018) (Personal communication).
  2. Moskowitz H, Wren J, Papajorgji, P (2020) Mind Genomics and the Law. LAP Lambert Academic Publishing.
  3. Arunachalam, V, Dilla WN (1995) Judgment accuracy and outcomes in negotiation: A causal modeling analysis of decision-aiding effects. Organizational Behavior and Human Decision Processes 61: 289-304.
  4. Chetkow-Yanoov B (1996) Conflict-resolution skills can be taught. Peabody Journal of Education. 71: 12-28.
  5. Gettinger J, Koeszegi ST, Schoop M (2012) Shall we dance?—The effect of information presentations on negotiation processes and outcomes. Decision Support Systems 53: 161-174.
  6. Nadai E, Maeder C (2008) Negotiations at all points? Interaction and organization. In Forum Qualitative Research (online), 9: 1-19.
  7. Julian V, Sanchez-Anguix V, Heras S, Carrascosa C (2020) Agreement Technologies for Conflict Resolution. In Natural Language Processing: Concepts, Methodologies, Tools, and Applications pg: 464-484. IGI Global.
  8. Kersten GE, Lo G (2003) Aspire: an integrated negotiation support system and software agents for e-business negotiation. International Journal of Internet and Enterprise Management. 1: 293-315.
  9. Neijens P, Swaab R, Postmes T (2004) Negotiation support systems: communication and information as antecedents of negotiation settlement. International Negotiation 9: 59-78.
  10. Moskowitz HR, Gofman A, Beckley J, Ashman H (2006) Founding a new science: Mind genomics. Journal of Sensory Studies 21: 266-307.
  11. Gladwell M (2004) Choice, happiness and spaghetti sauce.
  12. Moskowitz HR, Gofman A (2007) Selling Blue Elephants: How to Make Great Products that People Want Before They Even Know They Want them. Pearson Education.
  13. Kover A, Moskowitz H, Papajorgji P (2020) Applying Mind Genomics to Social Sciences, Book submitted, In Review.
  14. Gabrielidis C, Stephan WG, Ybarra O, Dos Santos Pearson VM, Villareal L (1997) Preferred styles of conflict resolution: Mexico and the United States. Journal of Cross-Cultural Psychology 28: 661-677.
  15. Ryan TP, Morgan, JP, (2007) Modern experimental design. Journal of Statistical Theory and Practice 1 ; 501-506.
  16. Malhotra N (2008) Completion time and response order effects in web surveys. Public Opinion Quarterly 72: 914-934.
  17. .Gofman A, Moskowitz H (2010) Isomorphic permuted experimental designs and their application in conjoint analysis. Journal of Sensory Studies 25: 127-145.
  18. Wedel M, Kamakura WA (2012) Market segmentation: Conceptual and methodological foundations (Vol. 8). Springer Science & Business Media.
  19. Likas A, Vlassis N, Verbeek JJ (2003) The global k-means clustering algorithm. Pattern Recognition 36: 451-461.
  20. Sternberg RJ, Soriano LJ (1984). Styles of conflict resolution. Journal of Personality and Social Psychology 47: 115-126.
  21. Howard D (2001) The Law School Consortium Project: Law Schools Supporting Graduates to Increase Access to Justice for Low and Moderate-Income Individuals and Communities.” Fordham Urb. LJ 29 (2001): 1245.
  22. Nader L (1980) No Access to Law: Alternatives to the American Judicial System (pp. 64-67). New York: Academic Press.
  23. Trebilcock M, Duggan A, Sossin L (2018) Middle Income Access to Justice. University of Toronto Press.
  24. Ware SJ (2012) Is adjudication a public good: Overcrowded courts and the private sector alternative of arbitration. Cardozo Journal of Conflict Resolution 14.
  25. Wren J (2021) (Personal communication).

Convincing Prospects to Switch Mobile Phone Providers: A Mind Genomics Cartography of an Everyday Opportunity to Optimize Messaging

DOI: 10.31038/MGSPE.2021113

Abstract

In a rapid, affordable, and scalable experiment, 50 respondents each evaluated unique sets of 24 ‘messages’ dealing with ‘offers to switch mobile phone providers’. The focus of the study was to show what could be learned from a simple experiment dealing with an everyday topic. For each test vignette of 2-4 messages, the respondents rated both likely to switch, and selected an emotion. The analysis revealed the emotional signature of each element, showing the feeling(s) most associated with each element, as well as the degree to which the element or message was rated as driving the respondent to switch providers. In terms of convincing respondents to say that they would be likely to switch providers, no elements performed strongly for the total panel. Only after clustering the respondents into four mind-sets by the patterns of their responses to the elements did the opportunities emerge, corresponding to specific messages. The paper shows the power and contribution of Mind Genomics to understanding a person’s person’s decision criteria, as well as providing immediate guidance to solve a practical problem. The attractiveness of the approach comes from the combination of the power of the approach, combined with the practical benefits of simplicity, speed, and affordability.

Introduction

Today (2021) it would be no exaggeration to say that the smart phone is ubiquitous. The millennial generation has grown up with the smart phone. It is unimaginable to many that there could have been an era when the telephone was just that, a device into which people spoke to other people either on the next street, or more rarely in the next state, or even more remarkably (and with great expense) people living in a foreign country. Those who are old enough to marvel at the change in technology like to compare the technology of today’s smart phone with the available technology in 1969, when John Glenn went to the moon and back.

As a consequence of the accelerated acceptance of the smart phone, the phone itself has become a commodity. What attracted attention 30 years ago in the 1990’s is now a part of everyday life? And of course, with the ubiquity of the smartphone is the ubiquity of the provider. The smartphone is everyone’s entry point into today’s powerful technology. Virtually world-wide people can do things such as make video calls at low price, and with the abandon of something which is virtually free.

A search through today’s literature (Google Scholar®, done October 18, 20201) for the topic of ‘switching mobile phone providers’ showed an astonishing 57,800 hits, and changing the word from provider to carrier reduced the number of hits to 38,000. The numbers become even more remarkable when we break up to ‘hits’ for mobile phone providers, doing the analysis in by five-year periods, and then compute the approximate hits/month. Table 1 shows these statistics.

Table 1: Hits for ‘switching mobile phone providers’.

Period

Total Hits

Hits/Month

1990-1994

634 11
1995-1999 2450

41

2000-2004

6700 112
2005-2009 10,900

182

2010-2014

15,900 265
2015-2019 16,700

278

2020-2021

7,390

308

Clearly the academic literature reflects the interest in mobile telephony, and the services provided. What is just as interesting are the topics. What emerge from the literature search is what might be expected, namely studies of the topic in different countries, namely what are the important aspects to which people attend. Here are two representative titles of papers. The focus is on the general process of how people think about the issue of switching:

Switching behavior of mobile users: do users’ relational investments and demographics matter? [1]

Drivers of brand switching behavior in mobile telecommunications. [2]

The search through many of the Google Scholar® hits reveals two patterns. The first pattern is the academic effort to simplify the topic of switching into a set of actions, or need states, viz., the need to systematize understanding. The second pattern, far more frequent, is the analysis of switching behavior, along with motivations for doing so, in the many countries around the world. This second effort gives the reader an awed sense of the power, and the ubiquity of mobile telephony.

What is missing, however, is the practical understanding of the type of messaging which drives consumers to feel that they would switch mobile phone providers. The literature may contain some of these messages, but the focus is generally from the ‘outside in’, viz., looking at the patterns of behavior in the increasingly important world of mobile telephony. Like so many other areas, the focus ends up rarifying the specifics, the messages, which become ephemera, to be discarded in the search for lasting ‘truth’ or at least ‘general patterns.’

The focus on Mind Genomics is on these ephemera, specifically the messaging. The objective of Mind-Genomics, as emphasized below, is the understanding of the messaging, and by so doing, understanding the topic from the ‘inside-out’, from the mind of the customer faced with the array of messages, and the competing cacophonies of merchants hawking their wares, shouting their offers.

Faced with this topic, the experiment reported here, done 10 years ago, is still relevant. The technology may have changed, but as we will see, the minds of people then made sense. Nothing discovered a decade ago has not changed very much, nor surprises very much. In this paper we resurrect data a decade old to show how understanding the way the consumer mind works provides data which has a very long shelf-life. Underneath the technology is the benefit, the appreciation of that which does not change from year to year.

Ways to Solve the Problem

Better messaging to convince buyers is a hallmark topic of consumer research. The publications one sees in the scientific and business literature about the topic is dwarfed by the amount of information retained in the archives warehousing corporate research. It should come as no surprise that the proper messaging of a company’s offer is a key to attracting customers, at least new customers, who have almost no other opportunity to know what is available unless they are told.

The above being said, it is rare that a corporate executive will truly know the messages which appeal to customers. There may be some answers of an obvious nature, but the reality is that most of the corporate knowledge is based upon such things as ‘this is the way we have advertised before…. it works. …let’s not take a chance, let’s not change.’ Of course there are situations such as the recent Covid-19 pandemic which has changed the way people behave, but there is the seemingly eternal reticence to explore new ideas.

The typical approach to testing messages, so-called ‘promise testing’, evaluates the messages one at a time, looking for messages which either simply score well, or upon probing, appear to convey messages of the right tonality. It is often averred by the advertising agency and by marketing gurus that one requires a sensitive and developed ear and mind to ‘know’ what will succeed in the marketplace, and that simply testing many messages does not reveal the truly breakthrough idea. The result of such statements is the continuing fight between the artist who ‘knows’ what will work, and the researcher, who must test to know what will work. The artist feels that one or two of the ‘right talented’ individuals, like the copyrighter, can do the job. The researcher feels that it will require a representative group of target consumers to ensure that one is making the correct choice.

The Mind Genomics Process

The Mind Genomics process has evolved over the past thirty years, during which time is has evolved into the beginning of a science, with many published paper, and an increasing cadre of practitioners around the world [3-6].

The Mind Genomics process is a systematized, templated process, requiring the researcher to break up the problem into a series of small, easily managed steps. By so doing, Mind Genomics forces the researcher (really the user) to think in both a creative and a structure way, respectively. The steps below, moving from thinking to discovery, were done over a period of two days. Today, a decade later, the process would be reduced to about two hours.

Step 1 – Create Materials

Table 2 shows the set of four questions and six answers for each question. Mind Genomics forces the researcher to think a structured fashion, beginning with a topic, continuing with a set of questions, and then for each question a set of alternative answers. The Mind Genomics system comprises a variety of different experimental designs, layouts or sets of combinations comprising a specific number of ‘questions’ and for each question a set required number of ‘answers’. The array shown in Table 2 is called a 4×6 (four questions, each with six answers). Today’s practice has been reduced to the much easier and faster design, the 4×4 (four questions, each with four answers).

Table 2: The four questions and the six answers for each question. Brand names are disguised.

Question A: How do we allay your concerns about our support?

A1 Hundreds of technical support staff only a phone call away
A2 Check service problems online! Our online support staff can keep you updated on all service problems
A3 Connect with fellow network members via our online forums
A4 Stores everywhere to help you find the right phone
A5 Check your phone and voice your concerns at any of our retail stores
A6 Reasonably priced extended warranties for all of our phones

Question B: What are the ‘fun’ features of our phones?

B1 Most of our phones come with pre-installed cameras, games, and applications
B2 Buying applications for phones is simple, easy, and inexpensive
B3 Numerous applications ranging from calculators to puzzles and games
B4 All compatibility questions can be easily answered online on our website
B5 Applications can be purchased online and downloaded immediately to your phone
B6 Many different pricing options for applications -from monthly subscription to one-time fees

Question C: What prices do we feature?

C1 Individual plans start as low as $39.99 a month
C2 Family plans starting from $59.99
C3 Don’t want a plan… pre-paid service for only $2 a day
C4 A 2-gigabyte data plan for only $35 a month
C5 Inexpensive plan for international calls
C6 Mobile Broadband Plan enables you to use internet on your (Product 1) or any other  smartphone

Question 4: What are some other fun features?

D1 Various phones featuring slide out keyboards
D2 Don’t like too many buttons We also carry simple touch tone phones
D3 Buy one of our phones and immediately begin texting
D4 Star Wars lover… Our new (Product 2) has an awesome Star Wars theme
D5 Choose from our wide (Product 3) selection for web browsing and mobile apps
D6 Our amazing phone also features a slide out keyboard

The questions in Table 2 ‘tell a story’. There is no need for the researcher to deeply understand the topic in order to develop the questions and the answers to the questions. Rather than forcing the researcher to select the answers that will be best, thus delaying the process until everything is ‘just right,’ the Mind Genomics process has been designed to be simple, affordable, and iterative. The researcher is encouraged to ‘just do it,’ find the results, and ‘do it again, changing what didn’t work with new guesses. Thus, Table 1 presents a ‘first guess.’ With ‘n’ cycle time of 1-2 hours, the second iteration would see some new questions and answers replacing the ones which performed poorly, viz., simply ‘did not convince the respondents’.

As one might surmise, the hardest part of this first section is coming up with the four questions which ‘tell a story’. The questions require the researcher to think more deeply and critically about the topic. When presented with the notion about asking a question, most researchers begin with a question that can be answered yes or no, or with some specific one-word answer. It takes a while for the researcher to think in terms of questions which require a phrase as an answer, rather than a simple no/yes. In contrast, once the questions are asked, the answers in the form of a declarative phrase are easy to create. The questions provide the structure for the answer.

Step 2 – Creating an Experimental Design Which Mixes and Matches 2-4 Elements in Each Element

The hallmark of ‘field work’ in Mind Genomics is the evaluation of combinations of elements (so-called vignettes), with these vignettes systematically composed according to an underlying experimental design [7]. The design specifies the composition of each vignette. No effort is made to link together the elements of the vignette, an example of which appears in Figure 1.

fig 1

Figure 1: The orientation page to the Mind Genomics study on purchasing a mobile phone.

Each vignette comprises a specified number of 2-4 elements. Each respondent evaluates 48 vignettes. The mathematical structure of the 48 vignettes is the same from one respondent to another with the mathematical structure ensuring that the 24 elements are statistically independent of each other. The Mind Genomics system presents each respondent with a totally new set of combinations of the 24 elements but a set of combination following the SAME underlying structure. Although the structure remains the same, the actual combinations different. Rarely do respondents ever test the same combinations. That difference in combinations is a property of the underlying design [8].

Step 3 – Execute the Study, through a Third Part On-line Field Service

Since the early years of this century, on-line panel providers have made available respondents to participate in studies conducted on the internet. What was unusual in the late 1990’s is today the ‘norm.’ Most people have been invited to participate in a variety of ‘studies’, whether these studies deal with limited topics such as the satisfaction of their last transaction with a company, or the studies deal with longer, more involved topics conducted as polls. In contrast, the Mind-Genomics process can be thought of as an experiment conducted on the internet, but in the form of a simple set of answers to systematically varied stimuli.

The respondents received an invitation to participate in the study, which would last about 10-15 minutes. The respondents interested in the study pressed on the linked embedded in the email invitation, and were taken to the study. The study began with an orientation, which is shown in Figure 1. The orientation screen used at the time of the study in 2012 was substantially longer than the orientation screen used today. Of special interest is the effort to reassure respondents that they are evaluating different vignettes. This effort to communicate that all the vignettes are really different from each came from a few complaints from professional and students that the vignettes seemed all the same. The early efforts in Mind Genomics focused on establishing the usefulness of the approach, one way of doing so being an effort to anticipate problems and avoid them. Thus the effort to reassure the respondent that the vignettes all differ from each other. Another remnant of the early effort, still in force, is the reassurance that the evaluations will last 10-15 minutes. This effort comes from the complaint from some professionals (but not panel respondents) that the effort is ‘overly long’, and that ‘how much is left?’

The IdeaMap program presented the respondent with a set of 48 vignettes, each vignette to be rated on two scales. The first scale instructed the respondent to rate the vignette on likelihood to switch to the provider. The second scale instructed the respondent to select one of five emotions experienced after reading the vignette.

Figure 2 shows an example of the vignette, set up for Rating Scale #1 (how likely are you to switch to this mobile service provider?). The combinations of elements are dictated by the specific permuted design for the respondent. The program makes no effort to beautify the combination, viz., by providing connections between the elements. The elements are presented as centered phrases, in unadorned fashion. Despite the apparent starkness of the stimulus, few respondents complain. Rather, over the 40+ years that this format has been used (since 1980), many respondents have made the unsolicited comment that the format actually helped them to ‘scan’ the vignette, and make their decision.

fig 2

Figure 2: Example of a vignette set up for Rating Scale #1.

For each vignette, the respondent assigned two ratings, for the likelihood of switching, and then for the selection of emotion. The vignette remained the same. As soon as the respondent rated the vignette by selection the closest emotion to what was being experienced, the vignette closed, and the next vignette was immediately presented. At the end of the evaluation, the respondents provided answers to four classification questions, including gender, age, and two on patterns of usage.

From Vignette to Mind – The Templated Analyses of Mind Genomics

The focus of Mind Genomics moves to the elements. The vignettes are only a convenient way to ensure that the elements are presented in a more typical fashion, approximating the typical type of offer, rather than being presented one-at-a-time. Presenting vignettes, all differing from each other, makes it almost impossible for the respondent to be politically correct, to ‘game the system,’ and provide the answers that one might deem to be ‘the right answer.’

Given focus on individual elements, Mind Genomics moves from the combinations, the vignettes, to deconstructing the vignettes into the contributions of the individual elements. Recall that each respondent evaluated 48 different combinations, and that the elements appeared 2-4 times in the combinations. Furthermore, each element appeared an equal number of times, and the elements appeared in an uncorrelated fashion.

The analysis begins by creating a data matrix, each row corresponding to one vignette from one respondent. The matrix comprised a column to identify the respondent, 24 columns corresponding to the 24 element, and two final columns corresponding to the rating assigned on Rating Scale #1 and Rating Scale #2, respectively. The final four columns contained the answers to the self-profiling questions (age, gender, and two questions about phone use).

The data matrix comprising 1’s (element present in vignette) and 0’s (element absent from vignette) presents the 24 elements as so-called dummy variables, absent or present. There is no metric information about the dummy variables. The objective of the analysis is to determine the degree to which the element drives estimated switching (Rating Scale #1) or links with certain feelings/emotions (Rating Scale #2).

The actual data matrix comprises a set of 48 rows for each of the 50 respondents, or 2400 rows of data.

The 9-point rating for Rating Scale #1 (1=not likely to switch at all … 9=very likely) is converted to a binary scale, with ratings of 1-6 converted to 0, and ratings of 7-9 converted to 100. To each of the newly created binary numbers is added a very small random number (< 10-5).

The rationale for converting the 9-point scale to a binary scale is the proclivity of users of data to demand simple yes/no statements, viz., will the respondent switch or not switch, based upon the elements in the vignette? It is technically correct to say, ‘the data shows a rating of 7, closer to switch and further away from not likely to switch’. That answer is not useful in a business situation, where the answer should be all or none. The 9-point Likert scale could be replaced by a simple binary scale (no/yes) at the outset, but there is always interest in precision for other analyses that may be of interest.

The same type of transformation is done for the emotions, except that five new binary variables are created, one each for curious, interested, positive, hesitant, and uncomfortable, respectively. For each vignette, the emotion selected in Rating Scale #2 is given the value 100, and the four emotions not selected in Rating Scale #2 are each given the value 0. Again, and afterwards, each of the five newly created emotion variables has another vanishingly small random number added.

The rationale for adding a small random number to each newly created binary variable is ensure that the binary variables exhibits some small degree of variation each at the individual level. Were a single respondent to rate all the vignettes 1-6, for instance, or select the emotion ‘hesitant’, the conversion would transform all of the respondent’s ratings into the same value. The OLS (ordinary least-squares) regression would fail. Adding a the vanishingly small random number is a prophylactic step, not affecting the results, but protecting against a crash of the regression program used to relate the elements to the ratings.

Linking Emotions to Elements

Our first analysis focuses on the link, if any, between the element and the selection of an emotion. Recall that the respondent selected one feeling/emotion for each vignette. The analysis is straightforward, promoted by the foresight of creating the vignettes according to the permuted experimental design.

The analysis creates five OLS (ordinary least squares) regression equations, each expressed in the same way: Linkage (to an emotion) = k1 (A1) + k2 (A2) … k24 (D6)

The foregoing equation says that the linkage between the feeling/emotion and be expressed by a simple equation, which shows the linkage of each element to the emotion. Coefficients (k1 to k24) are estimated using OLS regression, without estimating the additive constant. Coefficients of about 10 or higher are statistically significant and relevant, based upon previous observations across many projects using Mind Genomics conjoined with ratings of emotion.

For our presentation here, and to allow the strong patterns to emerge, we show the data from the total panel, but show only those coefficients or linkages 10 or higher. Table 3 shows those strong linkages. The elements not appearing at all in the table are those which do not show a strong linkage to the feeling/emotion. nt.

Table 3: Linkage between elements and feelings/emotions. Only strong linkages of 10 or are shown.

Curious  
C4 A 2-gigabyte data plan for only $35 a month

10

Interested  
C4 A 2-gigabyte data plan for only $35 a month

13

C1 Individual plans start as low as $39.99 a month

10

Positive  
A2 Check service problems online! Our online support staff can keep you updated on all service problems

16

A4 Stores everywhere to help you find the right phone

14

D6 Our amazing phone also features a slide out keyboard

14

A1 Hundreds of technical support staff only a phone call away

12

A3 Connect with fellow network members via our online forums

12

A5 Check your phone and voice your concerns at any of our retail stores

12

B3 Numerous applications ranging from calculators to puzzles and games

12

C6 Mobile Broadband Plan enables you to use internet on your  (Product 1) or any other smartphone

11

D1 Various phones featuring slide out keyboards

11

C1 Individual plans start as low as $39.99 a month

11

B1 Most of our phones come with pre-installed cameras, games, and applications

11

A6 Reasonably priced extended warranties for all of our phones

10

  Hesitant  
A6 Reasonably priced extended warranties for all of our phones

18

B5 Applications can be purchased online and downloaded immediately to your phone

16

D3 Buy one of our phones and immediately begin texting

16

D4 Star Wars lover… Our new (Product 2) has an awesome Star Wars theme

15

C2 Family plans starting from $59.99

15

C3 Don’t want a plan… pre-paid service for only $2 a day

15

D6 Our amazing phone also features a slide out keyboard

15

D2 Don’t like too many buttons We also carry simple touch tone phones

14

C5 Inexpensive plan for international calls

14

B4 All compatibility questions can be easily answered online on our website

14

A4 Stores everywhere to help you find the right phone

13

A3 Connect with fellow network members via our online forums

12

D5 Choose from our wide (Product  3) selection for web browsing and mobile apps

11

B2 Buying applications for phones is simple, easy, and inexpensive

11

B6 Many different pricing options for applications -from monthly subscription to one-time fees

11

A2

Check service problems online! Our online support staff can keep you updated on all service problems

10

A1 Hundreds of technical support staff only a phone call away

10

B3 Numerous applications ranging from calculators to puzzles and games

10

C1 Individual plans start as low as $39.99 a month

10

Uncomfortable  
D4 Star Wars lover… Our new (Product 2) has an awesome Star Wars theme

 10

The important thing to note is that improvement in our understanding of the elements, simply by learning the linkage of emotions and elements. From the entire array of 50 x 48 or 2400 vignettes we see that despite the imagined difficulty of the task, the linkages exhibit face validity, making sense.

The elements which are interesting are pricing.

The elements which are strongly positive are first service, and then features.

Sometimes an element links to a positive element and to a slightly negative element (hesitant). For some people the element (Reasonably priced extended warranties for all of our phones) provokes the feeling of interested, for others the same element provokes the feeling of hesitant. There may be different mind-sets among the respondents, viz., and ways of thinking.

Finally, one message actually makes the respondent feel uncomfortable (Star Wars lover… Our new (Product 2) has an awesome Star Wars theme)

Linking the 24 Elements to the Likelihood of Switching

We now return to the original focus of the study, viz.., what messages, if any, are likely to get a person to consider switching mobile phone providers. Although the study focused on mobile phone providers, the question is universal in the world of business. The Mind Genomics process provides an approach to answer the question, doing so quantitatively and efficiently.

The analysis once again begins with a transformation, this time with ratings of 1-6 transformed to 0, rating 7-9 transformed to 100, and a vanishingly small random number added to each of the transformed ratings. There is not fixed about the criteria of transformation, but the bifurcation of 1-6 and 7-9 has been the standard one for decades. Sometimes the division is at 7 (1-7 transformed to 0; 8-9 transformed to 100). This is done for respondent populations which tend to up-rate vignettes, and corrects for the exceptionally large number of positive responses.

The analysis creates one OLS regression equation, of the form: Likely to switch = k0 + k1 (A1) + k2 (A2) … k24 (D6)

This time the equation has an additive constant. The additive constant, k0, is a measure of the likelihood to switch in the absence of elements. Of course, by design all the vignettes comprised 2-4 elements, so there are no vignettes without elements. Nonetheless, the additive constant gives a good sense of the likely reception of one’s offers, information valuable to have in a marketing campaign. Without a Mind Genomics experiment of this sort, one would have to ask a respondent directly, or mine the switching data of the respondent. With Mind Genomics the additive constant convenient provides this measure of proclivity to switch. The above-mentioned equation is calculated at the level of the group, with the group defined by total, by specific ages, and by gender, respectively.

When the topic is switching, the information emerging from the analysis suggests the following findings, information that would be useful both to the marketer facing the business problem, but also to the researcher trying to understand what motivates people. Table 4 shows the relevant elements of the model for five groups; total, two genders, two age groups, respectively. There are only 42 of the 50 respondents shown in the age groups. The remaining groups, younger and older, did not comprise a sufficient number of respondents to show.

We begin with the additive constant. As noted above, the additive constant is the estimates likelihood of switching providers in the absence of messages, and should be considered a baseline. Table 4 shows a basically low likelihood of switching in the absence of a compelling message, with the additive constant of 20 for the total panel. Females are more likely to switch than males are (constant 29 vs 21). The age groups are similar, although the older respondents are slightly less likely to switch.

At this point, the common criticism is the small base size. With larger base sizes the additive constant will remain the same, with the usual ‘variability’ encountered with subjective data. What is important is that a 3-4 hours excursion into an experiment suggests topics, messages, and even opporgtunities, perhaps even not hitherto expected or perhaps conjectured but not demonstrated.

The body of Table 4 shows only those elements which generate a coefficient of +6 or higher for any one of the five groups. Only four elements do so, with the male respondents being most positive. For the total panel and for females no elements generate strong performing coefficients.

The low additive constant and the lack of strong performing elements among the total panel and key demographic subgroups are not the results of a low base size. That is, increasing the number of respondents from 50 to 100 or even 200 or 500 is not likely to produce results too different from what we see in Table 4. We conclude, therefore, that there are simply no elements which really drive switching, and that the team must go back to create new messaging. It is better to find this information out in an hour or two than in a month or two.

Table 4: Additive constant and strong performing elements for total panel, gender, and age. Only elements showing a coefficient of +6 or higher are shown.

table 4

There is, however, another possibility, viz., that there are different ways of thinking about the offers, ways which do not emerge when we just know age and gender. This is known as mind-sets,

Clustering uncovers hitherto unexpected groups of people in the population, mind-sets in the language of Mind Genomics. Within a cluster the respondents see the world similarly, at least the world of offers regarding switching mobile phone providers. Clustering does not pretend that these mind-sets are actually fixed in stone. Rather, clustering is an analytic ‘heuristic’, trying to make sense out of variation which inevitable occurs in data concerning choices. The clustering provides insights which would otherwise not emerge

The mechanics of clustering is straightforward. There are different ways to cluster data, all of which are equally ‘correct,’ but simply a matter of decision. Clustering attempts to uncover groups in the data, not based on who the groups ARE but rather on how the groups perform.

The mechanics of clustering begins with the generation of the information on which the clustering will be done, such information obtained at the level of the individual respondent. The subsequent analysis creates the clusters or mind-sets. Recall that each respondent tested the same structure of 48 combination, prescribed according to by a single experimental design that was permuted to create new combinations evaluated by each respondent. . The design allows for the estimation of individual-level models or equations, just as we estimated the group model. Thus, the foregoing equation with the additive constant is created at a respondent-by-respondent level to provide a matrix of 50 rows, one per respondent, and 25 numbers in each row, the additive constant and the 24 coefficients. That data matrix is then analyzed by through clustering, using the 24 coefficients (but not the additive constant) to define first two clusters, then three clusters, then four clusters of respondents. A cluster comprises individuals whose patterns of coefficients are similar to each other, and quite dissimilar to the coefficients of the respondents in the other clusters [9].

Table 5 shows new opportunities for messaging when we break the respondents into mind-sets based upon the pattern of responses to the messages that a mobile provider would likely use With 50 people the objective is not to create the science of messaging for this topic, but rather at a tactical level to identify messages which seem to work. There are certainly no promising messages when we look at the Total Panel. When we move to two mind-sets we three elements emerging. When we move to three mind-sets we see seven elements emerging. When we move to four mind-sets, we also see the same seven elements emerging, and some very strong performances. The key group on which to focus is Mind-Set 4F, first because it is the largest mind-set (19 respondents), and second because it has the highest basic likelihood to switch, based on the additive constant of 29. Table 4 is sorted by Mind-Set 4F of the four mind-sets. These are the price-focused, and the serious users. The key messages are:

A2: Check service problems online! Our online support staff can keep you updated on all Service problems.

C1: Individual plans start as low as $39.99 a month

The offering can be improved by choosing a message which also appeals to Mind-Set 4G, those who like to explore, but are not technically adept (not ‘techy’)

A5: Check your phone and voice your concerns at any of our retail stores

Table 5: Additive constant and strong performing elements for total panel, two complementary mind-sets, three complementary mind-sets, and four complementary mind-sets, respectively. Only elements showing a coefficient of +6 or higher are shown.

table 5

Discussion and Conclusions

Everyday life is replete with opportunities to understand the way people make decisions. The common approach is to look at the problem from the ‘outside-in,’ searching for regularities, and patterns. This approach characterizes a great deal of what we know about consumers. The academic literature focuses on the pattern, the generalities, the so-called ‘nomothetic’, coined from the Greek word Nomos, pertaining to the general, the normative.

We can trace this focus of outside-in to the development of science, where the focus is on discovering patterns, and where there was no ‘mind’ to report the experience, other than the mind of the researcher. This attitude of searching for patterns is important in the world of science, where the focus is on discovering patterns in a nature which has no ‘communicating mind.’ The reality is that searching for patterns, running experiments and measuring results, are the only ways of making sense out of nature which is mute, but lawful.

The opportunity learns about patterns of thinking and patterns of behavior are much different when we work with people who can talk. Two different measures emerge. The first is what people say they will do, and second is what people actually do. Up to now the focus of ‘real science’ has been on measuring what people actually do. That measure is considered the ‘real’ information. What people say they do is cast off as attitudes, something to measure, but not necessarily something on which to establish a science. It is precisely the patterns of what people ‘say they will do’ with different stimuli and in varying situations which constitutes the basis of Mind Genomics.

At the practical level, the data just shown suggests a richness of understand to be had of the world of the everyday by doing the simple experiments prescribed by Mind Genomics. The data may well enhance business performance on the one hand, as it enhances our knowledge of people and motives on the other. Examples include studies on attendance at museum by teens [10], and the recognition that entire world of new knowledge awaits the Mind Genomics researcher [11,12].

Acknowledgment

The author wishes to thank Professor Martin Braun of Queens College, and Professor Sue Henderson of New Jersey City University, who were instrumental in the work at Queens College leading to these Mind Genomics studies. The studies were done by the Ms. Janna Kaminsky and the late Stephen Onufrey, in Math 110.

References

  1. Ranganathan C, Seo D, Babad Y (2006) Switching behavior of mobile users: Do users’ relational investments and demographics matter? European Journal of Information Systems 15: 269-276.
  2. Grigoriou N, Majumdar A, Lie L (2018) Drivers of brand switching behavior in mobile telecommunications. Athens Journal of Mass Media and Communications 4: 7-28.
  3. Moskowitz HR (2012) ‘Mind Genomics’: The experimental, inductive science of the ordinary, and its application to aspects of food and feeding. Physiology & behavior 107: 606-613. [crossref]
  4. Moskowitz HR, Gofman A, Beckley J, Ashman H (2006) Founding a new science: Mind genomics. Journal of Sensory Studies 21: 266-307.
  5. Porretta S (2021) The Changed Paradigm of Consumer Science: From Focus Group to Mind Genomics. In Consumer-based New Product Development for the Food Industry Royal Society of Chemistry 21-39.
  6. Porretta S, Gere A, Radványi D, Moskowitz H (2019) Mind Genomics (Conjoint Analysis): The new concept research in the analysis of consumer behaviour and choice. Trends in Food Science & Technology 84: 29-33.
  7. Lundstedt T, Seifert E, Abramo L, Thelin B, Nyström Å, et al. (1998) Experimental design and optimization. Chemometrics and Intelligent Laboratory Systems 42: 3-40.
  8. Gofman A, Moskowitz H (2010a) Isomorphic permuted experimental designs and their application in conjoint analysis. Journal of Sensory Studies 25: 127-145.
  9. Fraley C, Raferty AE (1998) How many clusters? Which clustering method? Answers via model-based cluster analysis. The Computer Journal 41: 578-588.
  10. Gofman A, Moskowitz HR (2010b) Improving customers targeting with short intervention testing. International Journal of Innovation Management 14: 435-448.
  11. Milutinovic V, Salom J (2016) Mind Genomics: A Guide to Data-Driven Marketing Strategy. Springer.
  12. Gofman A, Moskowitz HR, Mets T (2011) Marketing museums and exhibitions: What drives the interest of young people. Journal of Hospitality Marketing & Management 20: 601-618.