Author Archives: author

Biosecurity and Cyber Security Perceived Before COVID-19

DOI: 10.31038/PSYJ.2022432

Abstract

Civilian adaptation to a security regime supposes a calculation of costs and benefits that, being associated with adaptation to the health and economic crisis, reveal a common agenda between the rulers and the ruled. The review of the adaptation to security derived from the health and economic crises is the objective of this work. A documentary, cross-sectional and exploratory study was carried out with a selection of sources indexed to international repositories, considering the publication period from 2019 to 2021, as well as the search by keywords. The axes, dimensions, trajectories and relationships between the variables that reflect and determine the phenomenon were established. In relation to the state of the art, applications to the virtual classroom are mentioned.

Keywords

Adaptation to change, Public agenda, Health crisis, Citizen security, Biosafety and cyber security perceived by COVID-19

Introduction

Until April 2021, the pandemic has killed three and a half million in the world, although such a figure is questionable if deaths from atypical pneumonia are counted, inferred from excess mortality [1]. In Mexico, there are 600 thousand recognizable or deductible cases [2]. In this scenario, the perception of security is a central issue on the citizen agenda not only because of the health crisis, but also because of the economic crisis [3].

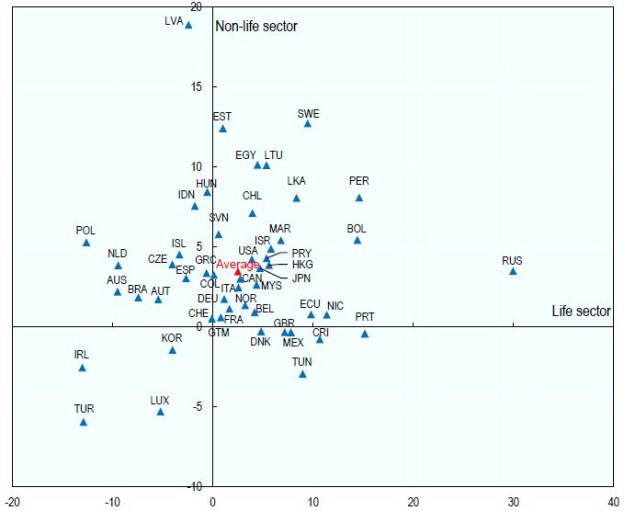
An indicator of the importance of biosecurity and cyber security is spending on insurance (Figure 1). From the year 2000 to date, an increase is seen until 2010 when a marginal decline is seen, but the date is sustainable. Mexico is located at a threshold of minimum spending on insurance against biosecurity and cyber security risks.

fig 1

Figure 1: Insurance spending by OECD countries. Note: Prepared with data from the OECD (2021)

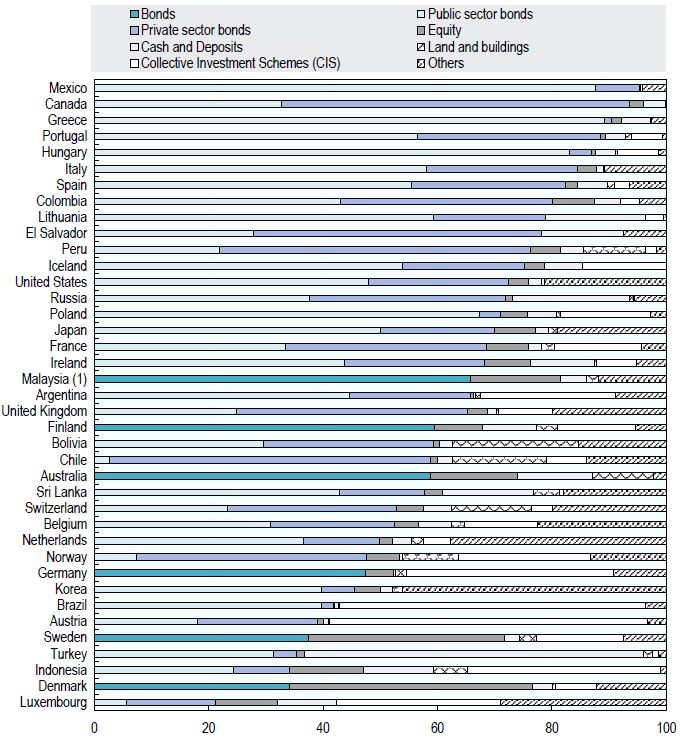
The United States of America is the largest insurance contractor, followed by the Japanese and the French (Figure 2). In other words, a greater propensity for risks is observed in the North American market with respect to the Asian or European one. Mexico is located in a spurious zone, very little spending on insurance relative to the OECD average.

fig 2

Figure 2: Figures in dollars for insurance

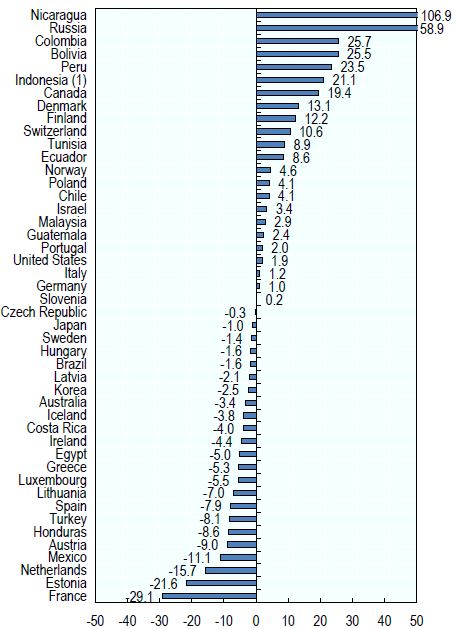
Other indicators associated with insurance show an increasing trend as the indicators are broken down (Figure 3). In other words, biosecurity and cyber security are transversal axes whose risk perception is observed in indicators that reflect them as central issues on the public agenda. Mexico is located in a deficit area of insurance spending compared to half of the countries that invest in insurance and belong to the OECD.

fig 3

Figure 3: Biosafety and cybersecurity indicators. Note: Prepared with OECD database (2021)

In this way, the escalation of violence against vulnerable groups such as children, women and the elderly has increased exponentially and adds to the risks posed by the pandemic. Derived from this situation, the perception of security emerges, develops and consolidates as a central issue on the citizen’s agenda [4]. It is a phenomenon in which potential victims see the pandemic as unpredictable in its effects, immeasurable in its consequences, and uncontrollable by the authorities.

Such phenomena, the pandemic and security, converge in violence against vulnerable groups as a result of the frustration of family heads in the face of unemployment, hunger and poor health [5]. In this way, the areas of greatest risk are the most densely populated, such as Mexico City, mainly in the Iztapalapa mayor’s office.

Precisely, the objective of this work is to review and discuss the biosecurity and cyber security perceived in the face of the pandemic, confinement and violence towards vulnerable groups such as the elderly, women and children with respect to the head of the family, civil and health authorities, exploring the perception of security by reviewing seven dimensions: territorial, national, public (government), human, public (self-protection), private and internet user.

The discussion on the relationship between the dimensions of security has been oriented from their integration as indicators of social representation [6]. It is a process in which citizens move from the objectification of kidnappings, homicides, robberies or extortions spread in the media towards their anchoring and naturalization as risk scenarios distinguishable by sectors, zones and spaces. In other words, the fragmentation of data, images or speeches in electronic networks generates levels of security that citizens perceive as far away from worrying about their situation. Or, it assumes the risks as very close to apply voting strategies of contact with people, services or activities in unsafe areas.

This social representation of security is a framework to interpret the effects of the pandemic on the personalization of security [7]. If the media broadcast institutions, hospitals, neighborhoods and sectors affected by the community transmission of the coronavirus, then the audiences will build a public agenda segmented into dimensions that reflect their fears and expectations regarding the pandemic and its collateral effects.

What are the axes, dimensions, trajectories and relationships between the variables that explain and reflect the adaptation to the SARS CoV-2 and COVID-19 pandemic?

The premise that supports this work suggests that adaptation to change and cost benefit are the axes of discussion around the SARS CoV-2 and COVID-19 pandemic [8]. This is so because a level of social despair has been reached that translates into the establishment of an agenda focused on the use of devices outside confinement as a central strategy in the face of the health crisis [9]. By virtue of the degree of overcrowding, ventilation and stay, adaptation to change acquires levels of exposure to risk and coping behaviors in the face of the situation [10]. In this sequence of costs and benefits, the perception of risk reveals a structure of decisions and actions based on the demands of the environment and the internal resources of the civil sectors.

The contributions of the study to the discipline are 1) systematic review of the state of the art, 2) systematization of findings, 3) discussion between the findings and the literature reviewed, and 4) modeling of the variables and 5) design of pedagogical sequences. Thus, in the first section, the theoretical and conceptual approaches that explain the phenomenon are reviewed. The second section presents the results of studies related to the topic. The axes, trajectories and relations between the variables are proposed. These findings are discussed to reflect on the contribution and application of the study in the classroom.

Theories of Biosecurity and Cyber Security

In this section, the theoretical and conceptual frameworks that explain the relationship between biosecurity and cyber security are reviewed, considering their representation in the governed with respect to the public administration of the matter [11]. There are at least three phases: objectification (security as a crime prevention instrument), anchoring (crime prevention as a tool of the rule of law) and naturalization (speech attributing responsibility to the government).

Based on the three phases: objectivation, anchoring and naturalization, the theory of social representations places security as an image with meaning and a precautionary sense as long as the public administration reflects a consistent policy. This is so because citizens generate a representation of their current and future authorities based on their experiences with past authorities. This is the case of elections when voters choose the outgoing public administration based on punishment.

However, the process of representing security warns of continuous and permanent learning by citizens, as well as feedback with new symbols issued in the media and electronic networks [12]. In this way, the rulers and the ruled build a public security agenda that includes permanent and ephemeral axes and topics of discussion. This relationship between the administration of past, current and future security materializes in decisive episodes for the evaluation of the authorities and crime.

Citizens build symbols that identify their government with criminality, guiding its performance as an indicator of corruption. Or, archetypes associated with civil protection, idolizing their State as omnipresent and all-powerful [13]. In this synchrony of corruption and prevention, those who make decisions on public policies contribute to the image, prestige and reputation of their institution. If these decisions obey a synchrony with the administration of justice, then an isomorphism is appreciated. It is a transfer of government values and norms towards crime prevention that citizens value as the image of their government. This is the case of the inter-institutional coupling in matters of cooperation for the extradition of cartel leaders.

However, the theory of social representation insists that the theory of governmental isomorphism is limited in that it does not consider civil participation in the incidence of the public agenda and municipal policies [14]. In turn, for the isomorphic perspective, the analysis of the administration of power is distinctive of advanced democracies with respect to transitional political systems. This distinction suggests that advanced governance, although it includes civil participation in the corporations of order, is guided by institutional mechanisms and protocols that regulate the balance of power rather than concentrating it on an individual, group or crowd.

Meanwhile, the theory of representations suggests that, in matters of security, crime prevention and rehabilitation, the State is the guarantor of said process and the citizenry should only cooperate with the election, scrutiny, questioning, debate and establishment of a public agenda.

For its part, institutional theory recognizes that the public security administration bases its operation on isomorphism or the transfer of public policy protocols to local agencies [15]. In order to be able to guarantee the continuity of the programs, regardless of the government’s ideology, both representational and institutional approaches suggest that the crime prevention strategy be carried out. Both perspectives assume that the differences between the rulers and the ruled dissolve in the face of an insecurity problem, but they forget that the asymmetries between political and social actors intensify with the increase in homicides, robberies, kidnappings or extortion.

Both the institutional and representational views believe that the State should be the guiding axis of security, but they avoid the conflict between the governors and the governed when executing the protocols for preventing and combating crime [16]. Although an authority that is distinguished by its attention to complaints, capture of delinquents or rehabilitation of criminals generates a favorable image, it is also true that the multiplication of criminal groups is concomitant with the deprivation of liberty of their leaders.

Such issues are raised by both institutional and representational perspectives, suggesting the dissection of security by dimensions that allow anticipating risk scenarios and collaboration between the parties involved. This security governance system supposes the emergence of biosecurity and cyber security as guiding axes of the agenda, discussion, agreements and co-responsibility between public and private sectors. The way in which the relationship between the categories has been addressed is through models.

Biosecurity and Cyber Security Models

Security has been of concern to the authorities and civil society in recent years. The substrata of different societies have different perceptions about security. This, in several countries, has suffered from a lack or absence, particularly when it comes to government participation. Public security can be understood as the work of the State to protect and safeguard its population from internal dangers or threats. In Latin American countries, public custody is perceived as absent, due to the large amount of press coverage that exposes the aforementioned lack [17].

In the case of Mexico, day after day a greater amount of red news coverage appears in the news, which shows a violent face of the country. It deals with the structure of the perception of security in: Territorial security; National security; Public Safety (State as Attorney General); human security; Public security (self-protection); Private security; and, internet user perception of security, scope [18].

The literature distinguishes each of the dimensions based on observing differences between groups and people with respect to events, areas, systems or risk scenarios [19]. The common denominator lies in the calculation that individuals make regarding costs and benefits around the risks, as well as the attribution of responsibility to their rulers. In the case of the pandemic, its effects are asymmetric between those who assume that the State must manage mitigation and those who assume co-responsibility between citizens and authorities.

Public safety events like pandemics occur all over the world, posing a threat to personal safety, property, and national defense. Mexico’s security problems are similar to the general context in Latin America in many ways. However, Mexico is influenced by organized crime due to the levels of consumption of illegal products in the US market [20]. The North American drug trade, when associated with the confinement of families, fosters an environment of health risks [21].

It is stated that the perception of our reality is subjective, just as our world depends on our living conditions, operating from a higher order, a mesosystem that would include both, and in which each one appears as elements and not as closed and closed units. independent [22]. The notion that what we see might not be what is really there has preoccupied and tormented the entire population in every sector, class or role of our society. A different sector of the population would have a different expectation of security.

The administration of public security is the implementation of public policies that justify the orientation of the State in the prevention of crime and the administration of justice, but only the distrust of citizens towards the action of the government is evidenced in a growing perception of insecurity reported in literature, in seven dimensions: territorial, national, public (government), human, public (self-protection), private and Internet user [23].

Mexico can be seen from various fields such as economic, historical or social. In this sense, there are other sub-scopes ( sub-scales in the social sphere) such as health, public safety, education, environmental awareness, among others. As mentioned above, different sectors of the population have a different perception of the social sub-scopes (or subscales) [24].

From the theoretical, conceptual and empirical review, the relationships between the variables were modeled. In this way, territorial and national security are concomitant given their level of generality in the protection of the country, as well as the multilateralism involved in international or regional pacification measures. In the cases of public and citizen security, both share the imperative of safeguarding common goods that, although public, can be established as socially and environmentally available for future generations. In this sense, private and digital security are also similar in terms of preventing crimes that threaten the dignity and integrity of the individual and not of society.

The relationships between security perceptions are consistent with the observed data. This is so because the measurement of the seven security dimensions is presumed, as well as their consistency when applied to other scenarios and samples [25]. In addition, security as a multidimensional phenomenon suggests levels of measurement that are concomitant with each other, reflexive and with errors attributed to the variance of the responses.

Concomitant hypotheses refer to the covariances between the dimensions of the phenomenon, as well as to the explanation of its trajectory structure if a new specification or model were to arise when testing the null hypothesis. The reflective hypotheses allude to the relationships between the factors with respect to the indicators, suggesting the structuring of the phenomenon, as well as the convergence of the responses to the reagents that measure each feature of the dimensions [26]. Measurement error hypotheses refer to unexplained variations in the estimation of the structure of concomitant and reflexive relationships. In addition, it suggests the probable incidence of other factors and indicators not included in the model.

The theory of the perception of security alludes to converging dimensions with respect to trust between the rulers and the ruled. In this way, the central premise of the theory is that citizens have unfavorable or positive expectations of their authorities in charge of law enforcement and crime prevention, as well as social rehabilitation [27]. In this sense, security is a sociopolitical phenomenon, but reduced to media expectations of government action, as well as mistrust or empathy for its strategies, programs or policies in terms of safeguarding the integrity and dignity of its governed, as well as private property and public interests.

The dimensions of this perception of security have been structured in socio-spatial terms such as the territory or in social issues such as the nation, but with emphasis on the situation of sectors, strata or groups such as the so-called citizens and citizen security, as well as particular interests such as private and Internet security [28]. In the case of cyber security, the discussion lies in the protection and safeguarding of identity and personal data.

However, the dimensions of security converge in cyber security. The unconfirmed information disseminated on electronic networks about the risk events associated with climate change and the pandemic have generated an area of study concerning the infodemic [29]. In this way, territorial and national security have traditionally been the perspectives most approached from the sociology of risk to account for the impact of climate change on sea level and coasts, as well as risk events derived from droughts, frosts, fires, floods or earthquakes in vulnerable areas, human trafficking , species or the appearance of epidemics due to the invasion of animal territories. The dissemination of the media on these problems, associated with the confinement of people, has generated an oversupply of content, resulting in two logics: Verisimilitude and verifiability.

In the first case, alluding to credibility, the impact of the media and networks on their audiences and users supposes the influence of their content based on the demonstration of risks through images. Consequently, responsibility is attributed to the State to the extent that public administrations with similar risk events are compared. Such a process has been exacerbated during the pandemic with the intensive dissemination of unconfirmed notes.

Precisely, the second case regarding the verifiability of the information supposes an expectation based on the demonstration of data, but limited to the description of risk scenarios and probabilities of affectation. This is the coverage of risk events from comparatives of public policies, although reduced to trends of expert opinions.

Within the framework of plausibility and verifiability, the so-called biosafety focuses on food as the main indicator of the level of health in the face of a health or environmental crisis [30]. In this sense, territorial or national security should have specialized in public matters because each sector or social stratum demanded different needs according to contingent situations. Citizen security gave way to the individualization of expectations and resources, giving rise to both personal and virtual self-protection, with the emergence of cyber security.

There are more differences between biosecurity and cyber security, but both are essential for the rule of law, the administration of justice, the prosecution of crime, social rehabilitation and collective pacification. From a traditional perspective, both dimensions are observable as complementary, but from a progressive approach they are assumed to be concomitant.

In other words, the effects of climate change are increasingly linked to identity theft, extortion or co-optation, since computer crimes originate from the niches of environmental and social deterioration. Cyber security observes in real time the data of robberies, kidnappings or homicides in situations of natural disaster or health contingencies.

Studies of Biosecurity and Cyber Security

Studies of adaptation to change have focused on the validity of the instruments by estimating their internal consistency with alpha and omega parameters, as well as the adequacy and sphericity for factor analysis and structure adjustment.

Seven investigations stand out on adaptation to change in scenarios of violence and insecurity derived from geopolitical conflicts or racial cleansing, as well as immigration and human trafficking:

Mendoza et al. [31] propose the perception of territorial security as the expectations about the governing State of public peace. The variable refers to the territory protected by the State in a context where invasions extended or disappeared empires. Adaptation to change was rooted in the preservation of the territory rather than in the preservation of lineage or the prevalence of race, uses and customs, all of which were mixed with the invading culture. Only in the case of Greece, which, when invaded by Rome, not only preserved its mythology but was also plagiarized by the medieval empire.

García et al. [32] raise the perception of national security as the expectations about the State as the attorney for crimes against democracy, national identity or the interests of the population. It is a scenario of adaptation of the modern state to industrial revolutions. The identity of the State as the repository of power was in crisis and the rulers allocated their resources to the propaganda of a national identity and union in the face of invading forces. The preservation of the territory was no longer enough, but the construction of a common good that will differentiate one culture from another.

Quintero et al. [33] conceptualize the perception of human security as expectations generated before crime prevention policies, the administration of justice and the promotion of social peace. It is a conglomerate of humanist approaches from which the center of the universe is no longer the nation state but rather the individual with values and idiosyncrasies that little by little will generate sufficient intellectual capital as a weapon for the accumulation of state power and resources.

Carreón et al. [34] suggest that the perception of public security refers to the expectations that citizens generate from distrust of the State and alienation with its security institutions, while interest is focuses on civil self-protection resources. The advent of civil rights and with it the new relationship between State and society directed the concern to an internal issue. The internal affairs of the nation state were now on a public agenda after the expression of sectors and no longer in the wishes of the ruler.

Mejía et al. [35] point out that the internal perception of security refers to the expectations that Internet users consider generated from the spy State and their search for information, selection of content and dissemination of topics. It is an agenda specialized in propaganda, anti-propaganda and against propaganda. Political and social actors debate around the surrounding information on government performance and electoral preferences. The impact of security policies on voters generates a media agenda and promotion of the party in power or the opposition.

Juárez et al., (2017, p. 23) define the perception of citizen security as the expectations regarding the State as attorney general. It is a conglomeration of social demands that the government in turn raises as central axes of its agenda, but based on the expectations of voters or the proximity of the elections. Unlike internal security, where the main thing is to obtain votes, propaganda aimed at civil security emphasizes national identity in the face of crime.

García et al. [36] warn that the perception of private security refers to the expectations of civil society generated from the State as incapable of preventing crime and fighting corruption. Even organized civil sectors state that the problem lies in the State as the rector of security, since it is pragmatically related to the citizenry based on the propaganda of fear of crime.

The studies confirm the factorial structure of the perception of safety, although the research design limits the findings to the research sample, suggesting the extension of the work towards the expansion of the factors. The adjustment values and residual parameters used led them not to reject the null hypothesis regarding the significant differences between the theoretical relationships established in the literature with respect to the empirical relationships found in the study.

Method

A documentary, exploratory and cross-sectional study was carried out with a selection of 100 references alluding to biosecurity and cyber security during the period of the pandemic from November 2019 to May 2021, considering the search by keywords in the Google repository (Table 1).

Table 1: Descriptives of the sample

Abstract

Repository Author   Shows Instrument Trajectory
e1 Academy Mueller 2021 71 references Biosecurity and cybersecurity inventory

Cyber biosecurity ← biosecurity

e2

Copernicus Pieralisi et al., 2021 20 references Biosafety Inventory Biosafety ← cyber security
e3 Dialnet Elgabry 2020 6 references Biocrime Inventory

Biocrime ← Biosafety

e4

Ebsco Salem & Jagadeesan 2020 13 references Biosafety Inventory Biosafety ← Institutional coordination
e5 Latindex Gomez et al., 2020 15 references biosecurity inventory

Biosafety ← Standards

Note: Prepared with study data

The Systematic Review Inventory was used, considering five extractions of findings qualified by expert judges in the axes, themes and discussion categories in three rounds. The first phase related to the qualification of the contents (1 for dominant biosecurity, 2 for hegemonic cyber security and 3 for prevailing cyber biosecurity). The second round refers to the feedback between the judges, after a comparison report of averages with their scores from the first round. The third instance related to the reconsideration based on the comparative data of the second phase.

The data was processed in the statistical analysis package for social sciences (SPSS version 20), considering the parameters of normal distribution, contingency and probability proportions in order to achieve a model of structural equations to observe their axes, trajectories and relationships in around biosecurity and cyber security with respect to the five selected extracts.

Results

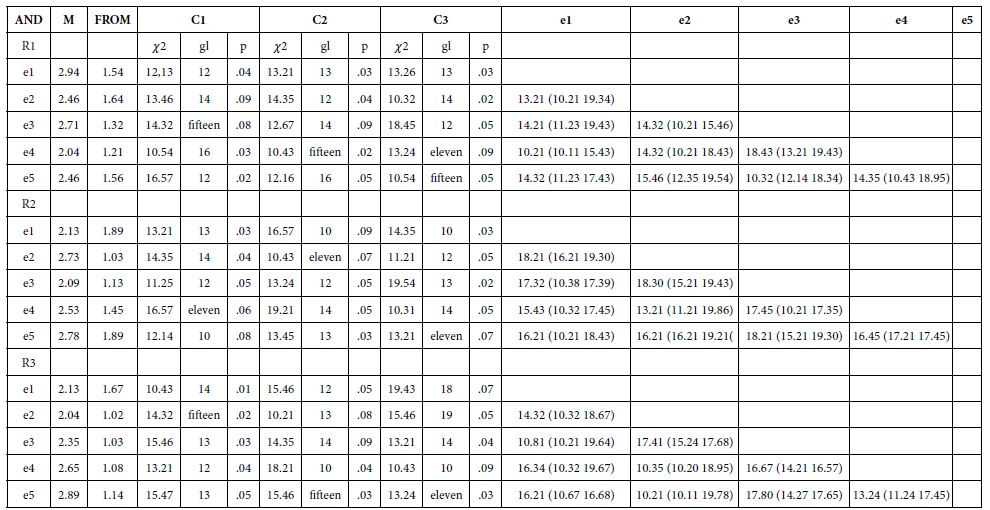
The values of the parameters of normal distribution, contingency and probability ratio suggest that relationships prevail between the categories of biosecurity, cyber security and cyber biosecurity with respect to the reviewed findings. The three categories prevail as axes and are related to each other with respect to a threshold of permissible risk. In other words, the findings reflect the random effects of COVID-19 in an ordinal way as it spreads from biosecurity to cyber biosecurity (Table 2).

Table 2: Instrument Descriptives

table 2

Note: Prepared with study data: E: Extract; e1: Mueller (2021), Pieralisi et al., (2021), e3: Elgabry (2020), e4: Salem & Jagadeesan (2020), e5: Gomez et al., (2020), R: Ronda, R1: Qualifying, R2: Feedback, R3: Reconsideration, C: Category, C1: Biosecurity, C2: Cybersecurity, C3: Cybersecurity, M: Mean, SD: Standard Deviation

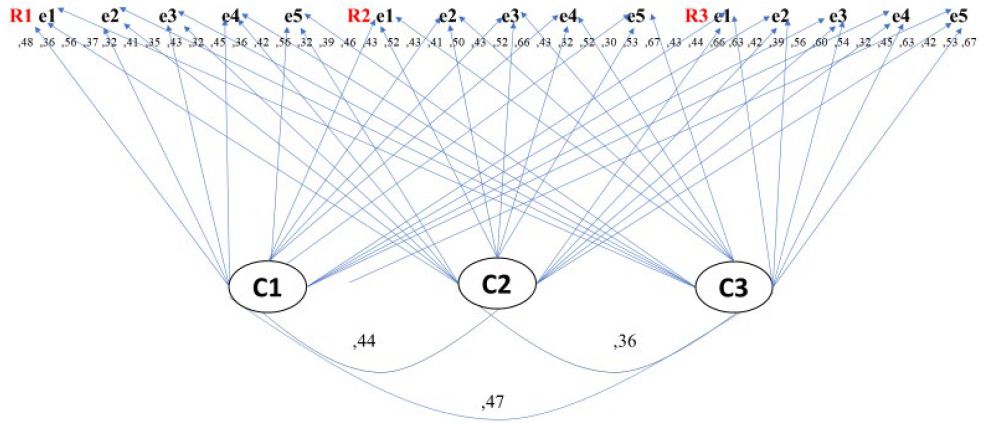
Once the relationships between the categories and extracts were established, the structural equation model was estimated, considering the pairing between the variables (Figure 4).

fig 4

Figure 4: Structural equation model. Note: Prepared with study data: E = Extract; e1 = Mueller (2021), Pieralisi et al., (2021), e3 = Elgabry (2020), e4 = Salem & Jagadeesan (2020), e5 = Gomez et al., (2020), R = Ronda, R1 = Qualifying, R2 = Feedback, R3 = Reconsideration, C = Category, C1 = Biosecurity, C2 = Cybersecurity, C3 = Cybersecurity

The fit and residual parameters ⌠ 𝜒2 = 13.24 (14 df ) p > .05; GFI = .990; IFC, 997; RMSEA = .008 ⌡suggest the non-rejection of the hypothesis regarding the differences between the revised structure and the model established in this study. It then means that the categories and extracts configure a structure that can be established with more extracts as long as they allude to the relationship between biosecurity and cyber security.

Discussion

The contribution of the present work was to establish the modeling of biosecurity and cyber security, considering a review of the literature, as well as a selection of five findings that were associated with the categories, being observable a structure where these five extracts are related to the prevailing categories. . In relation to three meta -analyses of the categories in the COVID-19 era where they recognize a scarcity of studies and risks of bias in the samples , the present work has observed a subtracted structure from the qualification of expert judges in the matter.

Tarakji et al. [37] conclude that studies on the effects of COVID-19 are neither specific nor conclusive. In the present work, it has been shown that biosecurity and cyber security have been merged into cyber biosecurity as an indicator of the impact of COVID-19. Such a process can be seen in the insurance expenditure of OECD countries, as well as in the qualification that judges make of the studies related to the association between the categories.

Yu & Chang [38] showed that the literature consulted revolves around industrial biosecurity together with the use of cyber security technology. In the present work it has been established that cyber security is linked to biosecurity and even generates a new order called cyber biosecurity to explain the impact of the pandemic on information systems and public health.

Bastos et al., [39] showed that the COVID-19 serological studies reviewed have a high risk of bias. In the present work, the risk of bias is tolerable, suggesting the extension of the study to other repositories and categories of analysis. Lines concerning the reduction of the risk of bias will make it possible to notice the relationship between biosecurity and cyber security once the pandemic is over.

Lines of research related to the effects of COVID-19 on biosecurity and cyber security will allow warning of bias risk scenarios in the literature published since 2019. Such a question will allow anticipating strategies based on permissible risk thresholds when making decisions by consulting the literature. specialized in cyber biosecurity.

Conclusion

In relation to the theory of the perception of security, which proposes nine dimensions related to territory, nation, citizenship, public, private, human and internet, this work found that human security is the factor that reflects the structure of perceptual security. The lines of study referring to the dimensions of human security will allow us to notice scenarios of conflict between the rulers and the ruled, as well as the emergence of citizen and private security.

Regarding security studies where a continuous coercive and persuasive State stands out in its relationship with citizens, this work has discussed human security as a dimension that explains the differences and similarities between the rulers and the ruled. The development of this dimension will allow us to notice the transition from a coercive system to a persuasive one. That is to say, the security attributed to the legitimate violence of a democratic government will be observed up to the security that demarcates the regime from all responsibility and burdens the citizen with the attribution of prevention by confining their expression and their property.

Regarding the seven dimensions of the perception of security, the present study has proposed that these explain the variance and warn of the appearance of a common factor that the literature identifies as second order. The lines of research on the emergence of this common factor will allow evaluating, accrediting and certifying the relations between rulers and rulers in matters of multidimensional security.

Perceived security is a multidimensional psychological phenomenon since it derives from the relationships between authorities and citizens with respect to crime prevention, the administration of justice and social rehabilitation, although other dimensions such as sectoral or media security to explain the impact of policies, strategies and programs on civil decisions and actions.

In Mexico, a common interpretation or idea of which country lacks security prevails. The absence of custody is influenced by the presence of organized crime, the illegal sale of drugs and weapons, and the corruption available in each branch of government, among the main aspects.

The correlations of reliability and validity when the unit shows so far that there are other dimensions linked to the construct. In this sense, the inclusion of self-control explains the effects of state propaganda in crime prevention, law enforcement, and peace education on the lifestyles of civilian sectors [40-45].

Studies on citizen security identify government expectations as the predominant factor that explains the phenomenon as an efficient, effective and effective institution, but in this paper the emergence of this phenomenon has been demonstrated from a structure of perceptions around the personal, citizen, public, human, national and territorial agenda.

References

  1. World Health Organization (2021). SARS CoV-2 and Covid-19 coronavirus statistics. Geneva: WHO
  2. Pan American Health Organization (2021). SARS CoV-2 and Covid19 coronavirus statistics. New York: PAHO
  3. Aguilar JA (2021) Social work towards a network of violence. Research Advances.10: 1-5
  4. Molina MR (2021) Compare a model of security perception in the Covid-19 era. Journal of Community Medicine and Public Health. 8: 1-6
  5. Carreón J, García C, Blanes AV (2018b) Networks of violence around the governance of public security. Social Sciences. 4 : 60-65
  6. Hernandez J (2020b) Specification of a model of sexual violence. british journal of Medical and Health Science. 2:1-4
  7. Sandoval FJ (2020) Labor expectations in the face of risk events and collateral social effects. International Journal of Humanities, Social Sciences and Education. 7:1-7
  8. Garcia C (2021) Perception of security in the face of the pandemic caused by the SARS CoV-2 coronavirus and the Covid-19 disease. Epidemiology International Journal. 5:1-8
  9. Hernandez J (2020a) Specification of a social intervention model against Covid-19. Biomedical Journal of Scientific and Technical Research. 26: 62-65
  10. Garcia C (2020a) Specification of a model to study risk perception. Reget. 24: 1-8
  11. Garza JA, Hernandez J, Carreon J, Espinoza F & Garcia C (2021) Contrast of a model of the determinants of tourist stay in the Covid-19 era: Implications for biosafety. Tourism and Heritage. 16 : 1-13.
  12. Carreón J, Bustos JM,Bermúdez G, Espinoza F & García C (2020) Attitudes towards the pandemic caused by the SARS CoV-2 coronavirus and the Covid-19 disease. Invurnus. 15: 12-16.
  13. Nájera M, Bustos JM, Carreón J & García C (2020) The perception of risk in university students in the face of the spread of the SARS CoV-2 coronavirus and the Covid-19 disease. Psychology. 8: 94-107.
  14. Bustos JM, Garcia C & Juarez M (2020) Perception of security against Covid-19. Academic Research Without Borders. 13: 1-26.
  15. Molina HD, Garcia ML, Garcia ME, Carreon J & Garcia C (2020) A statistical approach to the behavior of the Coovid-19 outbreak in mainland China. Tepexi. 7: 6-16.
  16. Molina MR, Coronado O, Garcia C & Quiroz CY (2021) Contrast a model security perception in the Covid-19 era. Journal of Community Medicine and Public Health Care. 8: 77-83.
  17. Rincon RM, Juarez M & Garcia C (2018) Interpretation of speeches around the mobility habitus to reveal the meaning of public transport. Margin. 90 : 1-13.
  18. Bustos JM,Ganga FA, Llamas B and Juárez M (2018) Contrast of a prospective decision model and implications for a university governance of sustainability. Margin. 89: 1-16.
  19. Garcia C (2020b) Specification of a model for the study of insecurity systems. Global Journal of Management & Business Research. 20 :7-10.
  20. Carreón J, Blanes AV and García C (2018a) Reliability and validity of a model of perceived governance of insecurity. Without Border. 11: 1-53.
  21. Aldana WI, Rosas FJ & Garcia C (2018) Specification of a model for the study of the public security agenda. Atlanteans. 9: 1-20.
  22. Juárez M, Carreón J, Quintero ML, Espinoza F, Bustos JM & García C (2017) Reliability and validity of an instrument that measures the dimension of the perception of safety and risk in students of a public university. International Journal of Advances in Social Sciences and Humanities. 11: 23-13.
  23. Martinez E, Anguiano F and Garcia C (2018) Governance of social works towards a network of violence. Science Learning Educational Journal. 6:1-3.
  24. García C, Carreón J and Hernández J (2017a) Governance of public safety. Literature review for a discussion of the state of knowledge of criminal sociopolitical identity. Margin. 84: 1-17.
  25. Amemiya M (2020) Retrospective meta -analysis of the random and homogeneous effect of the validity of the risk perception scale. American Journal of Applied Scientific Research. 10: 25-35.
  26. Rivera BL (2020) Exploratory structural algorithm of the perceived risk factor International Journal of Invention in the Humanities and Social Sciences. 10:26-30.
  27. Carreon J (2020) Neural networks of scenarios, phases and discourses of Internet violence. Journal of Neurology and Neuro Toxicology, 4:1-9.
  28. Garcia C (2019) Exploratory factorial structure of the security public. Journal of International System. 23:82-86.
  29. Quiroz CY (2019) Meta- analytic retrospective of transportation risk management policies in Mexico City. NetJournal of Social Science. 7: 92-100.
  30. Hernandez J (2019) Harassment on the Internet in the documentary and expert agenda. Asian Journal of Science and Technology. 10:1-3.
  31. Mendoza D, Carre ón J, Mejía S and García C (2017) Specification of a model of propaganda representations in older adults in the face of public safety. Tlatemoani . 25:21-31.
  32. Garcia C, Carreon J & Hernandez J (2017b) Co-management as a security device for local sustainable development. Eureka, 14:268-289.
  33. Quintero ML, Hernandez J, Sanchez A, Molina HD, Garcia C (2017) Model of expectations regarding public safety in microentrepreneurs in central Mexico. Borderless. 10 : 1-20.
  34. Carre ón J, Hernandez J, Garcia C (2017) A theoretical review for the study of the governance of public safety. Epsys , 4: 1-15.
  35. Mejía S, Carreón J, García C (2016) Psychological effects of violence and insecurity in older adults. Eureka. 13 : 39-55.
  36. Garcia C, Carreon J & Hernandez J (2016) Governance of terror to crime. Eureka. 13:168
  37. Tarakji B, Alali FM, Alenzi A, Nassani MZ (2020) Systematic review with no meta- analysis of coronavirus Covid-19. Macedonian Journal of Medical Science. 30 :108-111.
  38. Yu H & Chang H (2020) A meta-analysis of industrial security research for sustainable organizational growth. Sustainability. 12 : 9526-9546.[crossref]
  39. Bastos ML, Tavaziva G, Abidi SK, Campbell JR, Haraoui LP, etal (2020) Diagnostic accuracy serological test for Covid-19 systematic review and metaanalysis. BMJ.
  40. Elgabry M (2020) Biocrime and Covid-19. Security and Crime Science. 19 : 1-2.[crossref]
  41. Gómez M, Isaza MP, Ibañez C (2020) Let’s guarantee the quality of respiratory samples to diagnose Covid-19. Nova. 18 : 93-98.
  42. Mueller S (2021) Facing the 2020 pandemic: What does cyberbiosecurity want us to know to safeguard the future? Biosecurity & Health, 3 : 11-21.[crossref]
  43. Organization for Economic Cooperation and Development (2021). Statistics insurance . Giinevra : OECD
  44. Pieralisi N, Souza GN, Iwaki VLC, Chicarelli M, Tolentino SE (2021) Biosecurity perspectives in oral and maxillofacial radiology in time in coronavirus disease (Covid-19) a literature review. International Journal of Odontosomatic , 15 : 77-81.[crossref]
  45. Salem SB & Jagadeesan P (2020) Covid-19 from food safety and biosecurity perspective. Open Food Science Journal, 12: 1-12.[crossref]

The Cultural Psychology of Religion and Political Ideals: Political Liberalism as a Protoevangelium?

DOI: 10.31038/PSYJ.2022431


In his first letter to the church in Corinth, Paul remarks memorably that perception of divine truth is comparable to seeing “as through a glass darkly” (1 Corinthians 13:12 New International Version). For a number of contemporary Christians, the glass through which humans might perceive dimly the truths of the Christian faith is thought to have grown darker over the past two centuries due, in part, to the manner in which the culture of advanced political democracy has undermined revealed religion—has rendered more opaque the light of Christian faith. One villain in this view is the environment of meaning supported by political liberalism, an ecology formed by widely disseminated decrees of courts and legislative bodies as well as by a set of cultural expectations concerning the scope of justice realizable through state power, an expectation growing from, and reinforced by, the juridical and legislative pronouncements of the liberal state itself. Such an ecology of meaning is held by some Christians to have created an environment in which traditional Christian faith is perceived as marginal, or, worse, as harmful [1]. Hence, it is claimed that humanity’s capacity to know God, if only imperfectly, is made even more difficult by the rise of political liberalism and the symbolic universe it delimits: a world of governments always unmoored to churches or other religious institutions, a world, as a result, where the decisions of states can defensibly and intelligibly be grounded not on revelation but only on natural science, and where, partly in consequence of the state’s firm pursuit of justice, the morally serious pursue not transcendence, but the rectification of injustice in this life, unconcerned with a justice beyond the here and now—the justice dispensed to an immortal soul. These features of the culture of contemporary liberalism—separation of church and state and the resultant elevation of science as the basis of state decision making, and the overarching concern with overturning on earth injustice and the associated loss of the persuasive appeal of divine justice in a future life—have made much darker the knowledge of God’s truth, creating, it is claimed, a “culture of disbelief” [2].

In this work I develop, on the contrary, the hypothesis that the ideas created through the mediation of liberal courts and legislatures, and the cultural expectations that ensue, have forged a set of meanings that, although they may well have some of the consequences certain Christians decry, also, if seen in a proper light, have the power to incline the mind to conceive as plausible basic propositions of the Christian faith. Specifically, I hypothesize that the world in which church and state are separated and science brought to the forefront of culture, and the world in which the men and women whom all can agree to call heroes are those who seek to press as far as possible the redress of injustices in this life—in other words, the world of contemporary political liberalism—is an environment that might incline the mind to think in terms that are deeply consistent with, and thus open to, traditional Christian claims. The world of liberalism communicated through the instrumentalities of the state and through political culture, when viewed in a particular light, can help to prepare the mind for the acceptance of Christian faith: as a result of the cultural environment it creates, political liberalism can represent a kind of proto-evangelium, or presaging of the Christian message. The purpose of this work is not apologetic, however, but psychological: it is to deploy the insights of the cultural psychology of religion to suggest the internal complexity of the universe of meaning associated with liberalism and its potential to push thinking in directions not previously appreciated.

In the first section, I outline recent work in the cultural psychology of religion that demonstrates cogently the importance of this area of psychological research. Second, I provide an outline of basic tenets of traditional Christian thought and the cultural fora through which these understandings emerged. Third, I describe two concepts central to contemporary liberal political thought and the communicative technologies and cultural media that have facilitated their development. Fourth, I review briefly the claim made by certain Christians that political liberalism creates a system of reference and cultural ideals that militates against Christian truth-claims. In section five, I argue that the two principles of liberalism on which I focus can be hypothesized to support a system of cultural signs that point toward the plausibility of traditional Christian claims. In the sixth and final section, I lay forth a research agenda of qualitative inquiry designed to test the hypothesis that political liberalism can bear a fruitful connection to traditional Christian belief.

i) The Cultural Psychology of Religion

The cultural psychology of religion is a subfield in psychological research that, as J.H. Pak [3] notes, “focuses on understanding human behavior in the social context by taking into account environment, history and culture.” Using these insights, it studies the “generation of categories for understanding” the world individuals’ find themselves in, and their religious responses to it (p. 171). Cultural psychology is especially useful as one tool in the psychological study of religion since, as J.A. Belzen recounts [4], religiosity “is a culturally constituted phenomenon in which psychic life expresses itself.” (p. 25). Concretely, Pak, echoing D. Polkinghorne’s famous inventory of psychological research methodologies [5], notes that the cultural psychology of religion is an approach based on qualitative inquiry guided by a well-defined and plausibly-grounded hypothesis (Pak, p. 171). It is thus unmoored to large quantitative data collection research. However, it is not meant to replace quantitative analysis; it is meant, rather, as one tool to augment the study of the psychology of religion with theories derived from assessments of cultural-ecological effects on religious belief and practice. Lastly, the cultural psychology of religion is especially receptive to interdisciplinary analysis (Pak, 180), a point that will become important in the development in our last section of a future interdisciplinary research agenda.

ii) An Outline of Orthodoxy Christianity

Traditional, or orthodox, Christianity is certainly not univocal, but, for present purposes, it can be defined as a set of propositions and ideals derived from oral church tradition and ritual practice, scripture, and conciliar pronouncements, most centrally the creedal declarations of the Nicean and Constantinopolitan church councils. What many today call orthodox Christian thought, therefore, emerged through the communicative technologies of orality, collective practice, written exposition, and collaborative debate in the form of ecumenical councils comprised of leading church officials. These technologies forged the environment in which men and women came to define themselves as orthodox. Orthodoxy can thus be studied as the product of specific communicative strategies: the collection of oral tradition and ritual observances, the writing down and continual passage over time in written form of these traditions, and the collective debate and discussion of the true meaning of the claims found in oral and written material.

One abbreviated outline of the substance of orthodox thought can be adumbrated in the following way. All that exists in any space or any time is the result of an act of a creator god. This being created first a time and a place somehow anterior to the time and space we experience in our ordinary lives. In this place the creator made humanity from the substance of the earth. Here, the humans the creator made lived in harmony with their maker, the entire created world was peacefully and harmoniously directed toward god, and humans were, within their own psychological makeup deeply at peace. However, through a transgression by the first humans, the initial condition was radically altered. By force of this transgression, divine punishment came to be executed. The souls of the first humans became disordered and their orientation was turned away from their god. And the natural world itself also was wounded. Since the initial transgression and the resulting punishment, instead of being harmoniously directed toward god, the natural world became a captive of decay, etched with suffering, locked in ruthless competition, and travailed in pain—groaning for its ultimate redemption (Romans 8: 21-23). As the Book of Isaiah recounts: “the earth languishes…for a curse is on the earth” (Isaiah 24: 4-6). Indeed, “cursed is the ground because of you [Adam and Eve]” (Genesis 3:17). This altered state was a punishment visited not only on the perpetrators themselves but on all the humans who followed the initial pair. The creator gave to the later generations a punishment—a disordered soul, an orientation away from god, a natural world marked by decay, enmity and discord—for a transgression that they themselves did not commit, a penalty that makes it hard, or perhaps even impossible, for any human on his or her own to secure god’s favor. Through the redemptive act of Jesus Christ, however, atonement for the transgression is given. Humans who are in some way followers of the redeemer will then be resurrected in a new heaven and a new earth, in which there will be the restoration of internal balance for individuals; the reorientation of humankind to god; and the healing of the violence that marks the natural world, for, in that new place, “the wolf shall dwell with the lamb, and the leopard shall lie down with the kid; and the calf and the young lion” will live in harmony, with “the wolf and the lamb feeding together.” Indeed, “they shall not hurt nor destroy” in the abode of the new creation (Isaiah 11:6; 65:25).

iii) Contemporary Liberalism: Two Central Concepts

Contemporary liberalism is a complex and often amorphous set of ideas and aspirations. It has been shaped in the crucible of a distinctive set of institutions: standing courts issuing written decrees accessible through print media, and representative bodies assembled to address matters of public concern, informed in their deliberations frequently by the technology of representative polling, and issuing written laws accessible to the mass of society. The emergence and continued maintenance of liberalism depends on these (or very similar) institutional structures and communicative technologies. At least several constellations of ideas are central to the culture created by political liberalism. First, as Robert Audi and others have maintained, the concept of the separation of church and state is indispensable to contemporary liberal political thought [6]. Moreover, this separation is often viewed as deep and wide. The proper functions of the state should not include any meaningful promotion of religion at all.

Related to this strict separationist viewpoint is the idea of science as the privileged, even exclusive, means of state decision making. Since the state should not promote religion, policy making must not be based on claims derivable from scripture unless they can independently be verified by a non-religious source, most frequently the natural or social sciences (Audi, 2000). Science is privileged because its claims are held to be reproducible in empirical experiments, and are held to be subject to continual revision and testing through on-going debate and discussion in the forum of scientific conferences and publications.

With a strict separation of church and state has come the political and cultural elevation of science. As Oxford theologian Roger Trigg has argued, science has assumed the status of an alternative system of truth that takes the place of religion in the decision processes of government (2007, p.198). An example of this development can be seen in recent debates surrounding public school curricula. In the celebrated case of Kitzmiller v. Dover Area School [7], the United States District Court held that the decision as to which textbooks to assign in a public school had to be made in a way that was untinctured by the influence of any concepts even remotely religious; the decision as to which textbooks for a public school district to accept is a governmental decision that has to be made solely on that basis deemed the most purely scientific, a basis allowing no influence, however indirect, for religious concepts or ideas.

Another idea integral to contemporary liberalism is at least the aspiration that humans will treat injustice as a summum malum to be combated tirelessly as a highest duty. Liberalism has developed through the instruments of government power, specifically court rulings, legislative enactments, and executive orders. A central preoccupation of the liberal state has been to advance the cause of justice for individual citizens seen as free and equal members of the political community. Courts have perhaps most visibly advanced the cause of ensuring justice, understood as the fair and equal treatment of all citizens. Indeed, as Thomas Woods, Kevin Gutzman, and Thomas Sowell have argued, through the mediation of the court system and its printed decrees accessible to all in society, liberalism has grown into a set of cultural norms defined by an expansive and deeply ambitious claim that men must strive to rectify all human injustice [8,9]. From this overarching concern to redress injustice in this life has emerged dilated concepts of restorative justice. Several of such very ambitious attempts to right human wrongs can be found in the policy of affirmative action, in school desegregation, and calls for reparations for African slavery.

Affirmative action programs are born of a high idealism, the desire to take charge and make right past injustices. Injustice is so vilified, and the call to rectify wrongs in this life, without relying on divine justice in an afterlife, so powerful that affirmative action has emerged as a policy demanded by the political liberalism’s understanding of justice. Due to past wrongs, and the lingering consequences presently of the past injustices, all traces of the initial wrong must in this world be extirpated. To do so, all individuals now should not be treated strictly or fully equally, but rather, some advantage should be given today to the members of the class historically treated unfairly, even if this means that a member of a non-protected class unrelated in any direct way to the perpetration of the initial injustice is denied a strict conception of equal treatment. Perhaps the clearest articulation of this understanding of racial justice was expressed by Supreme Court Justice Harry Blackmun in the important affirmative action case of Regents of the University of California v. Bakke [10] when he notes that “in order to get beyond racism, we must first take account of race.” True justice, Blackman argues, demands that past injustices to African Americans be rectified to the point of treating whites who had no role in the imposition of earlier injustices in a way that can in effect prove to make their admission to college harder.

In respect to primary and secondary school desegregation, in Swann v. Mecklenberg Board of Education [11] the Supreme Court authorized the busing of white students to schools with a large percentage of African American students to remedy past state-sponsored school segregation on the basis of race. As a result of this ruling—one born of a deep desire that justice be done on earth—“among the losers,” Woods and Gutzman note, “were nonblack students bused to underperforming schools, even though none of the affected children was a wrongdoer,” i.e. the children had no role in the earlier state-sponsored acts of racial discrimination (2008, p. 58). Hence, the courts enshrined a conception of justice based on collective responsibility and accountability: it rejected, Woods and Gutzman remark, an “older idea of justice” which holds that only present malefactors are to be held responsible for criminal or immoral acts and that the state should only “target the guilty party and not inflict their punishments on a broad class of individuals” not themselves responsible for previous injustice (p. 61). Indeed, when justice is pursued with such passion as evidenced by many of the rulings of the United States Supreme Court—rulings that are core features of contemporary political liberalism–it often leads to an expansive definition of justice that includes and even necessitates collective responsibility.

Moreover, in regard to the question of material reparations for African slavery the same logic often holds. Calls by international legal bodies for reparations for slavery follow the logic of expanding justice to the point of implementing liabilities based on a de-personalized and collective sense of responsibility for previous egregious offences. The Legal Committee of the Organization of African Unity, for example, has called for monetary reparations for the past injustice of African slavery, a call echoed by legal scholars such as Mari Matsuda [12,13], who all call for the legal and political systems of the western world to make material amends for the past injustice of transcontinental African slavery. Against arguments that the injustice of past slavery is no longer justiciable since (presumably) no Western individual or state today is directly responsible for any current act of transcontinental African enslavement, these legal scholars and corporate bodies argue that the injustice of African slavery was so monstrously egregious—such an affront to justice itself—that any lingering aspect of the previous injustice, say, in the form of material advantages that the Western world may still enjoy as a result of its previous acts of unjust enrichment through slavery, must be extirpated: justice demands that collective responsibility for past wrongs be born by individuals and states not themselves responsible for the earlier injustice [14]. Through calls widely disseminated in print and electronic media, the demand for reparations for African slavery has begun to have a powerful influence in Western culture. As the noted scholar of global restorative justice Richard Falk argues, the decisions of the African Union and the writings in their defense by Western legal scholars have allowed the demands for reparations to assume a good deal of the same cultural force held by legal holdings of the United States Supreme Court (2008).

iv) The Claims that Political Liberalism Undermines Christian Faith

These influential ideas—the separation of church and state and the resulting political potency of natural science, and the rise of expansive claims on behalf of justice—are thought by some conservative Christians to have undermined the Christian faith. Separation of church and state is thought by such scholars as Roger Trigg (2007) and Stephen Carter (1994) to be religiously corrosive, in part due to the representational power of the state. That is, a functioning state is an entity that will always elicit awe. The technologies of state power will always be, to some degree, awesome: even the most constitutionally restrained government will have the reserve power to field an army and to send its young people to die in combat to defend the state; and even the most minimal state intent on survival will retain the reserve power to shape in some manner the upbringing of youth, through some control over schooling to ensure a minimum of social cohesiveness; and even the most minimal state will also have the power to take away the life of egregious wrongdoers, if not literally through the instrumentalities of the death penalty, then at least in the sense of taking away one’s life as a free person through the technology of perpetual imprisonment. A functioning state of any political stripe will, therefore, always be viewed with awe, having as it does power over life, youth, and death. Since the state concerns itself with these fundamentally important things and so is always to some extent awe-inspiring, for it not to be involved at all in religion is for religion to risk being seen as not awe-inspiring, as not fundamentally important: for if religion were, how could such an awesome force as government ever be indifferent to it? (Trigg, 2007, p. 128).

By this logic, when the state bases its activities on science (and not religion), science takes on the representational gravity of the state. Science, then, tends to become fundamentally important in the mind of the people. Moreover, many Christians have come to see science as increasingly and belligerently opposed to Christian faith. The burgeoning industry of natural scientists authoring god-rejecting books [15] has not assuaged this concern. For these reasons, some Christians see the culture of political liberalism as denigrating the faith, and even as setting up a parallel pseudo-religion using the same rhetorical technologies of the earlier religion: we see sacred books disseminated by writers claiming to have firsthand knowledge of the truth, but now not in the form of Christian oral tradition derived for eye witnesses to Christ but of empirical revelations of scientists in laboratories; ecumenical councils of learned experts convene to define creedal statements, but now not as a Christian creed but as a kind of scientific conciliarism to construe the precise meaning and formulations of disbelief; and the majesty of the state becomes moored to claims of ultimate reality, but now not through a union of church and state but through an establishment of science as the state’s official confession.

Additionally, the expansive concern for justice has also been viewed by some Christians as establishing ideals that erode orthodox faith. Combating injustice is of course not seen by any Christians as wrong. What is questioned is the commitment to a bold idea to make the world fully morally clean by human law and government. The proponents of reparations for slavery, for example, seek to purge the world of lingering vestiges of injustice, a desire they pursue with such passion that they see as fair the imposition of tariffs and impediments on individuals in no way directly implicated in the sin of human bondage. Here Christian thinkers often point to Eric Voegelin as having detected a dangerous siren song. Such a project communicates the idea that the mind must be focused on straightening the crooked timber of injustice on earth, remaking by human will the whole of social relations. Voegelin refers to this kind of a mission as the call to immimentize the eschaton, a call of a secularized heart for a world redeemed by human effort (1987).

v) Liberalism as a Cultural-Psychological Proto-Evangelium? A Hypothesis.

Such Christian thinkers, however, overlook a very real sense in which the culture of political liberalism might serve to underscore the viability of central Christian claims. The culture shaped by political liberalism can be hypothesized as forging a worldview that makes more accessible key Christian concepts—however mysterious these may be in a complete sense. The conjunction of the emergence of strict separation of church and state, and the resulting elevation of the power of science, and the rise of expansive claims on behalf of restorative justice can together create an ecology of meaning that can make plausible orthodox Christian views.

Separation as we have seen leads to the high cultural valuation of science. One of the central concepts of modern science is evolutionary biology. In fact, the Dover school case mentioned above was itself about evolutionary biology. Affirming evolutionary biology as the account of the origins on this earth of life and humanity is to affirm as true an account of the world in which the natural order itself is replete with suffering. As the poet Alfred Lord Tennyson wrote, in Darwin’s world nature is “Red in tooth and claw” (1850). Darwin’s natural world is marked by severe competition and frequent genetic mistakes that result in their animal bearers being butchered on, in paraphrase of Hegel’s famous words, natural history’s “blood-soaked slaughter-bench” [16,17]. Random mutations coupled with selection through ruthless competition are the engines of development on earth.

As this evolutionary account takes a greater cultural hold, it becomes natural to look for ways that the universe itself could be seen as the result of evolution. The drive is set in place to think about worlds before the big bang, which would allow our current universe to somehow be itself a product of a larger scheme of cosmic evolution. Indeed, a large number of scientists now speak frequently of evolution being applied to the universe as a whole. Many now speak of some earlier universe; and as a part of an evolutionary mindset—which sees incredible change over time in the natural order–an earlier universe is often seen as quite likely being radically different from our current universe, there being, as evolution demands, radical change over time. Hence, a number of physicists speak now of an earlier universe with entirely different physical laws, different “domain functions.” Scientists such as Lee Smolin in his work Life of the Cosmos have popularized this idea [18]. And major scientific conferences and publications have also widely disseminated this understanding. Indeed, as astrophysicist Bernard Carr argues, due to the rise of the “multi-verse” view of the cosmos, “although conservative cosmologists might prefer to maintain the [one universe model]…history is against them” [19,20]. Or as the noted physicist and author of the popular work The First Three Minutes, Stephen Weinberg argues, the many universe model is compelling and represents “a major shift in our understanding of the universe” (2007, p. 17), a view supported by such other luminaries of natural science, and promoters of science in popular culture, as Richard Dawkins, Daniel Dennett, [21,22]. As Dinesh D’Souza points out, these ideas are now widely disseminated and well known in the broader culture (2007, pp. 133-137; Trigg, 2007, p. 192). Given the cultural importance of science in a liberal political regime, which we have explored, the multiverse idea can indeed take a powerful hold.

So the culture of liberalism bends in the direction of seeing our world as one in which, hardwired in the natural world, is violence and discord, but at the same time as a world we can increasingly suppose was preceded by an earlier world with different physical laws—laws that might perhaps be other than the savage ones of mutation, competition, and selection repeated over immense periods of time which has fashioned in this universe the beings we are today. Moreover, by the logic of cosmic evolution–that is, of an evolutionary process at work in the cosmos in its broadest sense–it is increasingly plausible to assert that there will exist in the future a world after this, also possibly with entirely different natural laws.

Importantly, we must add to this concept of cosmic multiverses the cogency of claims of collective responsibility, such as inheres in the policies of affirmative action, school busing, and slavery reparations. Liberal political culture, by supporting policies that in effect punish some people today in order to rectify injustices perpetrated by earlier generations, makes increasingly plausible the idea that the savage laws of mutation and selection could actually be visited on this world due to some action in a previous one: that this world is a world suffering its own collective punishment.

From these ideas emerge a viewpoint consistent with orthodox Christianity, a kind of presaging of the Christian drama supplied by modern scientific and political liberal presuppositions. Humans are born into a natural order that is itself deeply disordered due to the operation of savage laws of competition, mutation, selection, and slaughter—the world of Charles Darwin. As beings made of the very stuff of nature, man is therefore also born disordered. Yet an earlier world existed in which different laws controlled, and the created being or beings in that world were not subject to Darwinian laws of mutation and selection. This current world with its Darwinian laws—laws the Christian writer Henry Morris [23] describes as “monstrous, inefficient, and cruel”—could be a punishment visited collectively on later humans for the transgressions of the beings in the earlier universe. Evolutionary biology could merely depict the physiology of the Pauline letters: man’s constitution in this world is inherently marked by inner turmoil, nature is scarred by incessant competition, the natural order is “red in tooth and claw”—and thus is in need of God’s deliverance—all because of an earlier offense. Such would, moreover, be no scandal to liberal justice, since the liberal language of justice inclines the mind to accept the validity of unearned punishment, of individuals—for the sake of justice—being punished for acts they themselves did not commit. The language of liberalism affirms in effect the right to punish sons for the sins of their fathers. For despite perhaps some superficial protests to the contrary, collective punishment is indeed an inexorable consequence of the policies of an expansive understanding of justice which has come to typify political liberalism. The liberal language of justice in the context of an evolutionary worldview, therefore, creates a system of cultural signposts pointing toward the Christian message of the fall. Yet the evolutionary framework points also to the possibility of a yet other world, with different physical laws, laws that could be free from the rule of mutation, selection, competition, and death: a new heaven and a new earth.

Of course, it can be argued that both policies like reparations and the Christian concept of the fall are unjust simpliciter. But this is not the logic of either position. Liberal political thought sees its policies as representing a deeper, fuller sense of justice; and Christianity holds that the fall does not impugn God’s justice, for “the judgments given by the LORD are trustworthy and absolutely just.” (Psalm 19:9 New English Translation).

Moreover, nothing I have sketched about evolutionary science and collective responsibility speaks clearly about the Christian drama of sin and salvation; yet the reference to one who would “crush” the head of the serpent (Genesis 3:15 Berean Study Bible)—what is called by Christians the proto-evangelium, or the pre-figurement of the Christian redeemer—is itself only suggestive of things to come; it only points in a particular direction. In the same way, might we be able to call political liberalism its own form of proto-evangelium?

My argument is not one of apologetics, it is one concerning the ecology of cultural meaning as an exercise in the cultural psychology of religion—a determination of how cultural symbols are available in the context of contemporary political liberalism that can point thought in a particular direction by broadening the imagination to think in terms consistent with fundamental Christian claims. It is about how forms of thought can be made viable by their presentation and elaboration in the culture of a particular time; it is about, in all, how liberalism might cast on what Paul calls the dark mirror a shimmer of new light.

vi) An Agenda for Future Research

Interdisciplinary work among political scientists deeply conversant in liberal political ideology and the leading figures in the liberal political movement, joined by religious studies scholars deeply conversant in Christian theology, and also qualitatively-focused psychologists of religion, can test this hypothesis in the following way. In line with suggestions developed by Pak [24,25], one especially fruitful method in the cultural psychology of religion to do this would be through in-depth examination of autobiographical narratives of leading liberal activists. As Pak argues, autobiographical narratives serve to create a sense of psychological “consistency and coherence across time” (p. 180; Belzen, 2008); and they do so, McAdams notes, by how “they serve to define self, define relationships with others, and regulate emotional experiences through drawing moral and life lessons” (Pak, p. 180; McAdams, 2001). These features of narrative writings, Pak maintains, are precisely the tools that should be seized on in the cultural psychology of religion (2017, pp. 180-82). In-depth analysis by an interdisciplinary team, therefore, should review the autobiographical accounts of leaders in movements that embody political liberal ideals to assay if self-descriptions are discoverable that fit the hypothesis developed above. A study of this nature would provide important advances in the cultural psychology of religion [26,27].

References

  1. Trigg R (2007) Religion in public life: Must religion be privatized? Oxford. Oxford University Press.
  2. Carter S (1994) The culture of disbelief: How American law and politics trivialize religious devotion. Anchor
  3. Pak JH (2017) Cultural psychology of religion and qualitative research. Research in the Social Scientific Study of Religion. 28: 163-187.
  4. Belzen JA (2010) Towards cultural psychology of religion: Principles, approaches, applications. Springer.
  5. Polkinghorne D (1983) Methodology for the human sciences: Systems of inquiry Albany. State University of New York Press.
  6. Audi R (2000) Religious commitments and secular reason. Cambridge University Press.[crossref]
  7. Kitzmiller v. Dover Area School District (2005).
  8. Woods TE, Gutzman KRC (2008) Who killed the Constitution? New York: Random
  9. Sowell T (2002) The quest for cosmic justice. New York: Free Press
  10. Regents of the University of California v. Bakke, 438 U.S. 265 (1978).
  11. Swann v Mecklenberg Board of Education (1971)
  12. Matsuda M (1987) Looking to the bottom: Critical legal studies and reparations. Harvard Civil Rights and Civil Review. 22: 340-376.
  13. Thompson J (2018) Should current generations make reparations for slavery? Cambridge: Polity Press
  14. Du Plessis M (2003) Historical injustice and international law: An exploratory discussion of reparation for Human Rights Quarterly. 624-659 [crossref]
  15. Dawkins R (2008) The god delusion. New York: Mariner Books.
  16. Tennyson AL (1850). In memoriam A.H.H. London: Edward Moxon
  17. Hegel G WF (1988) The philosophy of history. Indianapolis: Hackett
  18. Smolin L (1997) Life of the cosmos. New York: Oxford University Press.
  19. Carr B (2007) Universe or multiverse? Cambridge University Press. [crossref]
  20. Weinberg S (2007) Living in the multiverse. In B. Carr (Ed.), Universe or multiverse? Cambridge University Press. [crossref]
  21. D’Souza D (2007) What’s so great about Christianity. Washington, D.C.: Regnery Publishing.
  22. Hawkings S. Multiverses. (2008). In B. Carr (Ed.), Universe or multiverse? (pp. 57-75). Cambridge University Press
  23. Morris H (1973) The Day-age theory. In K.L. Segraves (ed.), And God created. San Diego .Creation Science Research Center
  24. Belzen JA (2008) Autobiography and the psychological study of religious lives . Brill Academic Publishers.
  25. McAdams DP (2001) The psychology of life stories. Review of General Psychology. 5 :100-122.
  26. Falk R (2008) Reparations, international law, and global justice. Handbook of reparations .Oxford University Press.
  27. Voegelin E (1987) The new science of politics. Chicago: University of Chicago Press.

Significance of Immunostimulants in Aquaculture

DOI: 10.31038/AFS.2022435

Abstract

The use of immunostimulants to enhance activities in the immune system has been given considerable attention in aquaculture in order to increase disease resistance in farmed fish. Use of Immunostimulants in aquaculture is gaining importance as the other therapeutic measures like antibiotics; vaccines and chemotherapy have their own limitations. This review stated the importance of immunostimulants, its application, objectives, types, advantages and disadvantages in aquaculture. Therefore, immunostimulants were found to be most promising for used in aquaculture to control diseases.

Keywords

Immunostimulants, Aquaculture, Fish, Significance

Introduction

Immunostimulant is a natural occurring compound that modulates the immune system by increasing the host’s resistance against diseases [1-7]. Immunostimulant comprise a group of biological and synthetic compounds that enhance the nonspecific cellular and humoral defense mechanism [4]. It may be chemical, drug or naturally occurring compound that elevates the nonspecific defense mechanisms or the specific immune response of the host and may be given alone to activate non-specific defense mechanisms as well as heightening a specific immune response.

An immunostimulant is a biological or synthetic compound administered either orally or through body fluids into the body of the fish or shrimp for enhancing the immune status of the host to overcome the adverse environmental conditions, stress, pathogens and opportunistic microbes. An immunostimulant, used in vaccines to amplify the specific immune response or administered as feed additives to modulate non-specific immunity, have been demonstrated to play a role in protection against diseases in fish [3]. Phagocytic cells play an important role in the defense mechanisms of the host by adhering to and engulfing the invading particles. Such cells include tissue macrophages, circulatory monocytes, and neutrophils. There are numerous reports of microbial products having immunostimulatory qualities that enhance phagocytic activity. Such immunostimulants include bacilli Calmette-Guérin and Corynebacterium parvum [4].

Various strategies are adopted for the management of fish health. Therapeutic approaches are amongst the most direct ones, while the more efficient and aquaculture- compatible and environmentally sound means of health management involve the use of immunostimulants to enhance the general well-being and health of fish. Immunostimulants and non-specific immune enhancers mostly in the form of natural products stimulate the immune system, reduce susceptibility to diseases and protect fish from stress and diseases in aquaculture. This reduces the dependence on chemicals or drugs and minimizes the negative environmental impact. It can also render aquaculture products more acceptable to consumers. Emerging trends show that eco-friendly approaches through the use of probiotics and immunostimulants can contribute significantly to health management in fish farming [5]. Aquaculture is likely to adopt the increased use of immunostimulants as feed additives since it can improve the efficiency of the system, enhance production, reduce the use of chemicals and render aquaculture products more acceptable and safe. There is a considerable emphasis on health management in aquaculture based on prevention rather than treatment [6]. Recently a number of studies have supported the rationale in incorporating the use of immunostimulants into the overall health management plan [7]. A more efficient and health management could lead to reduced cost and stability in the production system and improve the economics of aquaculture operations. Therefore, this review is of the significance of immunostimulant in aquaculture.

Application of Immunostimulants

  • [5] conducted an extensive review on the use of immunostimulants in aquaculture. Immunostimulants can increase resistance of fish to environmental stress and are therefore suitable for use in aquaculture. They can be used in complementing the activity of vaccines. However, overdosing can lead to immunosuppression [5].
  • Immunostimulants enhance disease resistance by improving non-specific defense mechanisms. Their use, in addition to other agents and vaccines is acceptable to farmers. There seems to be a wider efficacy and greater safety with immunostimulants in comparison to chemotherapeutics and vaccines. Immunostimulants have been used as feed additives for many years in aquaculture, and yeast β-glucan may be the one with the longest track record. In nature, β-glucans are widespread and have been characterized in microorganisms, algae, fungi and plants [8]. Boosting Fish Immune System: The immune system of fish has witnessed a surge in interest over the past two decades, occasioned by the demand of the fish farming industry for the control of infectious diseases. Although fish are poikilothermic, aquatic vertebrates, they possess a system of defense mechanism displaying many similarities with those of their mammalian counterparts. Moreover, it is now indisputable that fish are closer to mammals than to any invertebrate taxon [9]. The first line of defense mechanism present in fish is the innate or non-specific mechanism [5].

Objectives of Immunostimulation

The objectives of incorporating immunostimulant source in the diet of fish and other animals are as follows:

i. To promote a greater and more effective sustained immune response to those infectious agents producing subclinical disease without risks of toxicity, carcinogenicity or tissue residues.

ii. To enhance the level and duration of specific immune response, both cell mediated and humoral, following vaccination.

iii. To selectively stimulate the relevant components of the immune system or nonspecific immune mechanism that preferentially confers protection against microorganisms. For example via interferon release, especially for those infectious agents for which no vaccines currently exists and

iv. To maintain immune surveillance at heightened level to ensure early recognition and elimination of neoplastic changes in tissues.

Types of Immunostimulants Used in Aquaculture

  1. Levamisole is an anthelmintic used for treatment of nematodes in man and animals (Synthetic Chemicals): Levamisole is enhancing metabolic and phagocytic activation of neutrophils and increase the number of phagocytes and leucocytes and the level of Lysozyme. In Coho salmon, it increase resistance against Aeromonas salmonisida infection, In carp, it enhance phagocytic activity, myeloperoxidase activity in neutrophils, increase leukocytes number and serum lysozyme levels.
  2. FK-656 (Hepatonoyl-y-glutamyl-(L) mrsodiaminopimely–(D)–alanine is a peptide Related to lactoyl tetra peptide (Synthetic Chemicals). FK-656 has been shown activity against microbial infection. It increases the resistance of Rainbow trout against salmonicida. In Yellow tail, it elevate humoral antibody titers and splenic producing Antibody.
  3. MDP (Muramyl dipeptide) N-acetylmuramyl-L-alanyl-D-Isoglutamine) derived from Mycobacterium (Bacterial derivatives). It activate macrophages, B lymphocytes and alternative pathway of complement [6-19]. MDP increase the phagocytic activities, respiratory burst and migration activities of kidney leucocytes as well as resistance of the fish to salmonicida challenge.
  4. LPS (lipopolysaccharide) is a cell wall component of Gram-negative bacteria (Bacterial derivatives). LPS stimulate B cell
  5. Herbs as Immunostimulant: Natural plant products have been reported as anti-stress, growth promotion, appetite stimulation, tonic, immunostimulation, and to have aphrodisiac and antimicrobial properties in finfish and shrimp larviculture due to the presence of active principles such as alkaloids, flavanoids, pigments, phenolics, terpenoids, steroids and essential oils. The other merits that herbs as immunostimulants are local availability, broad spectrum effect, cost effective, no side effects and biodegradable. [12] fed catfish (Mystus montanus) with dietary Ocimum tenuiflorum, Zingiber officinale and Allium sepa (0.5 g/100 g each) for 45 days and analysed growth, haematological and serum biochemical parameters. Specific growth rate, total erythrocytes, haemoglobin, total leucocytes, total serum protein, glucose, cholesterol, magnesium levels, serum amylase, alkaline phosphatase, SGOT, SGPT and GGT have increased in all herbal supplemented fishes (especially in officinale) than control. Thus concluded that all the three herbs have immunostimulant potential and among the three herbs Zingiber officinale is more potent.

Mode of Action

The mode of action of immunostimulants is to activate the immune systems of organisms, to enhance the immunity level against invading pathogens. The approach is very diverse in nature or may be poorly understood and also depends on the type of immunostimulants, dose, and route of administration, time and period of exposure.

Advantages of Immunostimulants

  1. They are widely and successfully applied to improve fish welfare, health and production [18].
  2. It facilitates function of phagocytic cells, increase their bactericidal activities and stimulate natural killer cells, complement system, lysozyme activity and antibody response in fish and shellfish which confer enhanced protection from infectious diseases [13].
  3. It consider as enhancer to the non-specific immune responses along with the improvement of aquatic environmental quality [19].
  4. Controls fish diseases by enhancing both specific and non-specific defense mechanisms.
  5. Immunostimulants increase the immunocompetency and disease resistance of fish.
  6. Many IS have been developed to improve immunity of domestic animals.
  7. Some immunostimulant enhanced phagocytic activity and myeloperoxidase activity in neutrophils,

Disadvantages of Immunostimulants

  1. They are expensive.
  2. Limited efficiency upon parentally administration [6].
  3. They are not effective against all diseases.
  4. They induce immunosuppression when overdosed [1].

Conclusion

In conclusion, immunostimulants can reduce the losses caused by various diseases in aquaculture; but they may not be effective against all diseases. For the effective use of immunostimulants, the timing, dosages, method of administration and health status of animal need to be taken into consideration. Immunostimulants are substances that control diseases in aquaculture. They enhanced the function of phagocytic cells and increase their bactericidal activities. They also stimulate and complement lysozyme and antibody responses of fish. The effective method of administration of immunostimulants to fish is by injection. Oral and immersion methods have also been observed, but the efficacy of these methods decreases with longterm administration.

References

  1. Ian B, Roy AD (2005) The use of immunostimulants in fish larval Aquaculture. Fish and Shellfish Immunology 19: 457-472.
  2. Maqsood S, Prabjeet S, Munir HS, Khusheebee M (2011) Emerging role of immunostimulants in combating he disease outbreak in aquaculture. International Journal of Aquatic Research 3: 147-163.
  3. Raa J (2016) The use of immunostimulatory substances in fish and shellfish farming. Revision and Fisheries Science 4: 229-288.
  4. Sher J, Font-Llitjós M, Fort J, Zorzano A, Goldfarb DS, et al. (1975) Pathophysiology and treatment of cystinuria. Nature Revised Nephrology 6: 424-434. [crossref]
  5. Sakai M (1999) Current research status of fish immunostimulants. Aquaculture 1:30-80.
  6. Midtlyng PJ (2017) Vaccinated fish welfare: protection versus side effects. Developments and Biological Standards 90: 371-379. [crossref]
  7. Rodriguez A, Cuesta A, Ortuno J; Esteban MA, Meseguer J (2003) Immunostimulant properties of a cell wall-modified whole Saccharomyces cerevisiae strain administered by diet to seabream (Sparus aurata L.). Veterinary Immunology and Immunopathology 96: 183-192. [crossref]
  8. Volman R, Neilsen CU, Brodin B (2008) Basolateral glycylsarcosine (Gly-Sar) transport in Caco-2 cell monolayers is pH dependent. Journal of Pharmacy and Pharmacology 65: 970-979. [crossref]
  9. Manning L (1984) Effects of Chitosan on growth and Serum biochemical parameters of the white shrimp. Freshwater Fisheries 36: 6-8.
  10. Symoens I, Rosenthall M (1977) Levamisole in the modulation of the immune responses: The current experimental and clinical state. Journal of Reticuloendothelial Society 21: 175-221. [crossref]
  11. Oliver G, Evelyn TPT, Lallier T (1985) Immunity to Aeromona salmonicida in Coho salmon (Oncorhync husKisutch) induced by modified Freund,s complete adjuvant: Its non-specific nature and the probable role of macrophages in phenomenon. Developmental & Comparative Immunolgy 9: 419-432. [crossref]
  12. Kitao T, Yashida T, Anderson DP, Blanch A (1987) Immunostimulation of antibodyproducing cells and humoral antibody to fish bacterins by a biological response modifier. Journal of Fish Biology 31: 87-91.
  13. Kodama H Mukamoto N, Baba T, Mule DM (1994) Macrophage-Colony stimulating activity in Rainbow trout (Oncorhychus mykiss) serum. In: Stolen JS, Flecher TC, (EDs.), Modulators of fish immune responses. S0S publications, Fair Haven, NJ 1: 59-66.
  14. Bullock G, Blozer V, Tsukunda S, Summerfelt S (2000) Toxicity of acidification of chitosan for cultured rainbow trout (Oncorhynchus mykiss). Aquaculture 185: 273-280.
  15. Philip R, Sreekumar K, Anas A (2001) Bright Singh IS Immunostimulants–Source, diversity, commercial preparations and mode of application. Nat Workshop on Aquaculture Medicine 74.
  16. Robertsen B, Rorstad G, Engstad R, Raa J (1990) Enhancement of nonspecific disease resistance in Atlantic salmon, Salmo salar L., by a glucan from Saccharomyces cerevisiae cell walls. J Fish Dis 13: 391-400.
  17. Tewary A, Patra BC (2008) Use of Vitamin C as an immunostimulant-effect on growth, nutritional quality, and immune response of Labeo rohita (Ham.). Fish Physiol Biochem 34: 251-259. [crossref]
  18. Villegas JG, Fukada H, Masumoto T, Hosokawa H (2006) Effect of Dietary Immunostimulants on Some Innate Immune Responses and Disease Resistance against Edwardsiella tarda Infection in Japanese Flounder (Paralichthys olivaceus). Aquaculture Sci 54: 153-162.
  19. Wise DJ, Tomasso JR, Gatlin DM, Bai SC, Blazer VS (2011) Effects of dietary selenium and vitamin E on red blood cell peroxidation, glutathione peroxidase activity, and Macrophage Superoxide Anion Production in Channel Catfish. Journal of Aquatic Animal Health 5: 177-182.

Autotrophic and Mixotrophic Growth of an Ammonia Gas-tolerant Bacterium, Paenibacillus lentus NH33 in Ammonia Gas

DOI: 10.31038/GEMS.2022423

Abstract

The ammonia gas-tolerant bacterium Paenibacillus lentus NH33 (hereafter referred to as NH33) was isolated using minimal medium containing glucose in the presence of 1300 ppm of ammonia gas. NH33 showed no growth in the absence of gaseous ammonia (undissociated ammonia), indicating that it is an obligate requiring gaseous ammonia for growth. We investigated how NH33 uses gaseous ammonia. It also grew on minimal agar medium with or without glucose in the presence of 1350 ppm of ammonia gas, indicating that it was also capable of both mixotrophic and chemolithoautotrophic growth. Under the mixotrophic condition, NH33 used gaseous ammonia as a nitrogen source, but did not use dissociated ammonia, nitrite, or nitrate; thus, it appears to use gaseous ammonia as its sole nitrogen source. Under the autotrophic condition, NH33 was capable of using gaseous ammonia as its sole energy source, but not dissociated ammonia. The ammonia gas concentration that was optimal for the growth of NH33 was determined to be 1350 and 170 ppm for the mixotrophic and autotrophic growth conditions, respectively. These growth characteristics indicated that NH33 is a novel nitrifying bacterium that uses gaseous ammonia as its sole energy and nitrogen source.

Keywords

Gaseous ammonia, Ammonia-oxidizing bacteria, Chemolithoautotrophic growth, Mixotrophic growth, Paenibacillus lentus, Nitrite

Introduction

Odors are generally attributed to the production of various volatile compounds arising from the anaerobic decomposition of fecal matter. The number of complaints regarding odors from outdoor toilets, compost facilities, and livestock farms is increasing year-by-year [1]. Deodorization technologies can be classified into three categories, i.e., technologies employing chemical [2], physical, or biological treatment methods [3]. An important advantage of biological treatment methods over physical and chemical treatment methods is that biological processes can be conducted at moderate temperatures and atmospheric pressure. We have been developing biological deodorization techniques by applying the functions of microbes, but this approach is challenging as it requires the isolation of microorganisms capable of growing in the presence of gaseous ammonia. We have isolated promising microorganisms that decrease the odor of ammonia using a newly developed culture method called the closed gaseous ammonia-exposing culture method. The isolated microorganisms were all bacterial species that could be classified into two groups: 1) hypergaseous ammonia-tolerant bacteria and 2) gaseous ammonia-requiring bacteria, which are obligates requiring gaseous ammonia as the sole nitrogen source. These newly discovered bacteria had the ability to eliminate toxic ammonia, or conversely, to assimilate toxic ammonia, which has not been seen before in bacteria. An ammonia gas-tolerant bacterium, Paenibacillus lentus NH33 (hereafter referred to as NH33), was capable of growing in minimal agar medium containing glucose in the presence of gaseous ammonia (1350 ppm), but not in the absence of gaseous ammonia. This indicated that NH33 is a special organism that requires only gaseous ammonia as the nitrogen source. NH33 had a high gaseous ammonia-absorbing rate of 2.20 mmol/1010 cells. The ammonia-eliminating property of NH33 may be useful for biological deodorization technology [4]. The forms of ammonia include undissociated ammonia (NH3), which is the gaseous form, and dissociated ammonia (NH4+), which is the ionic form [5]. Ammonia is the preferred nitrogen source for most bacteria and fungi, and plants also require ammonia from the soil as a nitrogen source. Microorganisms also use nitrite and nitrate as nitrogen sources, and these nutrients are reduced to ammonia by reductase [6]. However, ammonia is a paradoxical nutrient: although ammonia is required for growth, undissociated ammonia has a strong cytotoxic effect. Undissociated ammonia dissolves easily through the lipid barrier and across the cytoplasmic membrane, and has a detrimental effect on the growth and metabolism of organisms [7]. Well-known organisms that use ammonia are chemolithoautotrophic ammonia-oxidizing bacteria, which are among a select group of microbes that have the ability to use ammonia as the sole source of energy and reductant for growth [8]. Ammonia-oxidizing bacteria extract energy from a single inorganic source (NH3), assimilate inorganic substrates (e.g., CO2 and NH3), and use them to synthesize all of the biochemicals needed for growth. The product of ammonia oxidation is nitrite. On the other hand, anaerobic ammonium oxidation (anammox) bacteria were discovered in wastewater sludge in the early 1990s; they have the unique metabolic ability to combine ammonium and nitrite or nitrate to form nitrogen gas [9]. Nitrification is catalyzed in two steps by ammonia-oxidizing bacteria and nitrite-oxidizing bacteria that are phylogenetically not closely related, and it was thought that no organism could oxidize both substrates. However, recently, complete ammonia oxidizers (comammox) that are capable of converting ammonia to nitrate within a single organism were unexpectedly discovered within the genus Nitrospira [10].

Ammonia has nutritional roles both as a nitrogen source and an energy source [11]. Ammonia-oxidizing bacteria use ammonium ions not only as an energy source, but also as a nitrogen source. NH33 is a previously unknown obligate that specifically requires gaseous ammonia for growth. In this study, to understand how NH33 utilizes gaseous ammonia, we investigated the autotrophic and mixotrophic growth properties of NH33 [12,13], including its growth in the presence of gaseous ammonia, and its energy and nitrogen sources.

Materials and Methods

Mixotrophic Culture

To prepare minimal medium containing glucose (MMG) agar plate, 15 mL of agar (Wako Pure Chemical Industries, LTD., Osaka, Japan) solution (1.5% final concentration) was sterilized by autoclaving, then (10x) minimal medium concentrate solution and (10x) glucose concentrate solution were added, and the agar was poured into Petri dish. This medium contained no nitrogen source. One liter of MMG (pH7.0) contained 2 μg of biotin, 400 μg of calcium pantothenate, 2 μg of folic acid, 2000 μg of inositol, 400 μg of niacin, 200 μg of p-aminobenzoic acid, 400 μg of pyridoxine hydrochloride, 200 μg of riboflavin, 400 μg of thiamin hydrochloride, 500 μg of boric acid, 40 μg of copper sulfate, 100 μg of potassium iodide, 200 μg of ferric chloride, 400 μg of manganese sulfate, 200 μg of sodium molybdate, 400 μg of zinc sulfate, 1.0 g of monopotassium phosphate, 0.5 g of magnesium sulfate, 0.1 g of sodium chloride, 0.1 g of calcium chloride, and 5.0 g of glucose. One mg of NH33 was added to 1 mL of sterilized water and suspended until homogenous (NH33 suspension). The NH33 suspension (50 μL/plate) was spread onto MMG agar plates without lids. The one plate was placed in an airtight plastic chamber (7.0 L) with ammonium hydrogen carbonate powder (0.178 g), and incubated at 40°C for 3 to 12 days (Figure 1). The ammonium hydrogen carbonate had completely sublimated after 2 to 3 h, and the ammonia gas concentration in the chamber reached 1350 ppm.

fig 1

Figure 1: Photograph of the closed gaseous ammonia exposure culture system. A MM agar plate for chemolithoautotrophic growth or a MMG agar plate for mixotrophic growth was placed in the 7-L chamber with ammonium hydrogen carbonate powder ((NH3)HCO3). The chamber was tightly closed, and incubated at 40oC. The ammonium hydrogen carbonate had completely sublimated during the 2.5- to 3-h incubation period to provide a gaseous mixture including gaseous ammonia. The amount of ammonium hydrogen carbonate powder in the chamber was adjusted to change the concentration of gaseous ammonia for the experiments.

Autotrophic Culture

To prepare minimal medium (MM) agar plate, 15 mL of agar solution (1.5% final concentration) was sterilized by autoclaving, then (100x) minimal medium concentrate solution was added, and the agar was poured into Petri dish. The MM contained no nitrogen and carbon source. One liter of MMG (pH7.0) contained 2 μg of biotin, 400 μg of calcium pantothenate, 2 μg of folic acid, 2000 μg of inositol, 400 μg of niacin, 200 μg of p-aminobenzoic acid, 400 μg of pyridoxine hydrochloride, 200 μg of riboflavin, 400 μg of thiamin hydrochloride, 500 μg of boric acid, 40 μg of copper sulfate, 100 μg of potassium iodide, 200 μg of ferric chloride, 400 μg of manganese sulfate, 200 μg of sodium molybdate, 400 μg of zinc sulfate, 1.0 g of monopotassium phosphate, 0.5 g of magnesium sulfate, 0.1 g of sodium chloride, and 0.1 g of calcium chloride.  The NH33 suspension (50 μL/plate) was spread onto MM agar plates without lids. The plates were placed in an airtight plastic chamber (7.0 L) with ammonium hydrogen carbonate powder (0.178 g), and incubated at 40°C for 3 to 12 days. The ammonium hydrogen carbonate had completely sublimated after 2 to 3 h, and the ammonia gas concentration in the chamber reached 1350 ppm.

Transmission Electron Microscopy (TEM) Observations

The cultured cells on a small patch of agar medium were fixed with 2.0% paraformaldehyde and 2.5% glutaraldehyde in 0.1 M phosphate buffer (pH 7.4) at 4°C for 120 min. The samples were subsequently washed three times with 0.1 M phosphate buffer (pH 7.4), then incubated in 1% OsO4 at 4°C for 120 min. The samples were dehydrated in a series of increasing ethanol concentrations as follows: 10 min in 50% ethanol at 4°C; 10 min in 70% ethanol at 4°C; 10 min in 80% ethanol at 4°C; 10 min in 90% ethanol at room temperature (RT), 10 min in 95% ethanol at RT, 10 min in 99.5% ethanol at RT twice, 10 min in 100% ethanol at RT twice, and 15 min in propylene oxide at RT twice. Then, the cells were incubated for 60 min in a 1:2 mixture of EPON:propylene oxide, 60 min in a 1:1 mixture of EPON:propylene oxide, 60 min in a 2:1 mixture of EPON:propylene oxide, and overnight in 100% EPON. Ultrathin sections (60 to 80 nm) were cut parallel to the bacterial layer, collected on single-slot Formvar-coated copper grids, and counterstained with 0.5% uranyl acetate at 20°C for 30 min, and 3% lead citrate at 20°C for 7 min [14,15]. Bacteria were imaged using a HT7700 transmission electron microscope (Hitachi, Tokyo, Japan) at an electron voltage of 80 kV.

Optimal Gaseous Ammonia Concentration for Mixotrophic and Autotrophic Growth

The NH33 suspension (50 μL/plate) was spread onto MM or MMG agar plates without lids, placed in an airtight plastic chamber (7.0 L) with ammonium hydrogen carbonate powder (0 to 0.337 g), and incubated at 40°C for 72 h. The ammonium hydrogen carbonate had completely sublimated after 2 to 3 h, and the ammonia gas concentration in the chamber reached 0 to 2560 ppm. The gaseous ammonia concentration was measured with an ammonia gas sensor (New Cosmos Electric Co. Ltd., Osake, Japan). The amount of gaseous ammonia was calculated using the ideal gas law [14].

Usable Nitrogen Sources in Mixotrophic Culture

The NH33 suspension was spread onto MMG agar plate containing different nitrogen sources (10 mM of (NH4)SO4, NaNO2, or KNO3), and cultured under air at 40°C for 72 h. To investigate the usefulness of gaseous ammonia as a nitrogen source, NH33 was inoculated onto MMG agar plate without lids, then the plate was placed in an airtight plastic chamber (7.0 L) with ammonium hydrogen carbonate powder (0.178 g; initial gaseous ammonia concentration of 1350 ppm), and incubated at 40°C for 72 h.

Usable Energy Sources in Autotrophic Culture

The NH33 suspension was spread onto MM agar plate containing ammonium (10 mM of (NH4)2SO4 or NH4Cl), and incubated at 40°C for 72 h under air. In addition, NH33 was inoculated onto MM agar plate, and incubated at 40°C for 72 h under 1350 ppm of gaseous ammonia.

Rate of Stable Nitrogen Isotope Uptake in NH33 Cells

A lidless MM agar plate inoculated with NH33 was placed in the 7-L chamber in the presence of 0.35 mL of 3.4% 15N-labeled ammonia solution (Kao Co. Ltd., Tokyo, Japan) or unlabeled ammonia solution (3.4%), and incubated at 40°C for 72 h. Initially, the concentration of the gaseous ammonia that had vaporized from the ammonia solution was 170 ppm. Cultured cells were recovered with distilled water and centrifuged. The recovered cells were dried at 100°C for 6 h. The rate of 15N stable isotope uptake (calculated as the ratio of 15N/total N) in the dried samples was measured by a combined system with a mass spectrometer (DELTAplus Advantage, Thermo Fisher Scientific, Bremen, Germany) and an elemental analyzer (FLASH 2000, Thermo Fisher Scientific, Bremen, Germany). The accuracy of this analysis system is ±0.3% of the measured value. As the standard samples, International Atomic Energy Agency (IAEA)-N-1 and IAEA-N-2 were used [16].

Detection of Nitrite in NH33 Cells

The NH33 suspension was spread onto MM agar plate and incubated at 40°C for 72 h in the presence of gaseous ammonia at 170 ppm. Cultured cells were recovered with distilled water, washed with a 0.8% NaCl solution, and centrifuged. The cells were then resuspended in 0.8% NaCl solution, and grounded by a bead grinder at 3200 rpm for 30 s. The nitrite concentration in the supernatant after centrifugation was measured by the naphthylethylenediamine hydrochloride spectrophotometric method [17]. The reaction time and temperature was 120 s and 30°C, respectively. The absorbance of the reaction solution was immediately measured by a spectrophotometer at 540 nm.

Biomass Estimation

Biomass production in wet weight was estimated for agar plate cultures by collecting 2.0 ml sterilized distilled water and streak bar. The collected cells were centrifuged (7,740 x g, 10 min) in micro tubes. The cell pellet was then gently washed with 1.5 mL of sterilized distilled water to remove culture medium salts. The sample was again pelleted (7,740 x g, 10 min), the supernatant was carefully removed and 1.5 mL of sterilized distilled water used to resuspend the pellet into pre-weighed 1.5 mL micro tubes. Cells were again pelleted at 9,000 x g for 5 min, and the supernatant discarded. Samples were semi-dried at 40˚C until visible water evaporated. Tubes were weighed on a precision balance (Sartorius CP324S) to estimate the weight of biomass. The wet weight of cells was quantified by subtraction the weight of tube from the total weight.

Results

Mixotrophic Growth

NH33 was inoculated onto MMG agar plate (mixotrophic medium), and incubated at 40°C for 6 days in the presence of 1350 ppm of gaseous ammonia (Figure 1). As shown in Figure 2A, opal colonies with a mucoid morphology were observed [18,19]. Compared to the growth on the MM agar plate, there was more growth on the MMG agar plate, and the colonies had larger diameters that reached over 10 mm. This suggested that active motility [20] or swarming behavior [21] occurred when NH33 was grown on mixotrophic medium. NH33 is an obligate that specifically requires gaseous ammonia for growth, as demonstrated by its inability to grow on MMG agar medium without gaseous ammonia.

Autotrophic Growth

NH33 was inoculated onto MM agar plate (autotrophic medium), and incubated at 40°C for 6 days in the presence of 1350 ppm of gaseous ammonia. As shown in Figure 2B, opal single colonies with diameters of 6 to 7 mm formed on the MM agar plate. NH33 was able to grow on MM agar plate, which did not contain carbon and nitrogen sources, indicating that it is a chemolithoautotrophic bacterium that could gain energy by the oxidation of gaseous ammonia [22].

TEM Observations

The TEM images of the mixotrophically and autotrophically grown NH33 cells are shown in the right panel of Figure 2. NH33 had a bacilliform morphology, and measured 5.0 to 6.5 µm in length and 0.5 to 0.7 µm in width. Under the two different culture conditions, the cells had a cell wall, and a previously unknown white substance which shows low electron dense was observed in the cytoplasm. In particular, the low electron dense area filled most of the cytoplasm in the autotrophically grown cells. Many of the cells grown on the autotrophic medium had an irregular shape, but this was not observed in the cells grown on the mixotrophic medium.

fig 2

Figure 2: The colony morphology (left) and a transmission electron microscopic image (right) of Paenibacillus lentus NH33. P. lentus NH33 was cultured for 6 days at 40oC on MMG agar plate in the presence of gaseous ammonia at 1350 ppm for mixotrophic growth (A), and MM agar plate in the presence of gaseous ammonia at 1350 ppm for autotrophic growth (B).

Optimal Gaseous Ammonia Concentration for Mixotrophic and Autotrophic Growth

We investigated the optimal gaseous ammonia concentration for the growth of NH33 on MMG agar plate. As shown in Figure 3A, the gaseous ammonia concentration at 1350 ppm (initial concentration) was optimal for cell growth (relative growth rate: 100). Gaseous ammonia at 2560 ppm repressed the growth of NH33 to a relative growth rate of 10, indicating that an excessively high concentration of gaseous ammonia had a toxic effect on NH33 growth. No growth of NH33 was observed on MMG agar plate without gaseous ammonia.

fig 3

Figure 3: Optimal gaseous ammonia concentration for mixotrophic and autotrophic growth. Paenibacillus lentus NH33 was cultured on MMG agar plate (A) and MM agar plate (B) in the presence of different concentrations of gaseous ammonia. The values indicate the relative wet weight of the cells.

With the initial gaseous ammonia concentration set to 1350 ppm, we measured the changes in the gaseous ammonia concentration and the growth of NH33 on MMG agar plate (Figure 4A). When no bacteria were inoculated, no change was seen in the gaseous ammonia concentration in the chamber during 170 h of incubation. On inoculated plates, NH33 continued to grow until the 80-h time point, when the gaseous ammonia concentration had decreased to 900 ppm, and the cells stopped growing. These results demonstrated that NH33 assimilated gaseous ammonia into the cells. A plot of the wet weight of cells versus the amount of assimilated gaseous ammonia (Figure 4a) indicated that mixotrophically grown NH33 required 0.62 mmol of gaseous ammonia to produce a biomass of 1.0 g (wet weight). The optimal gaseous ammonia concentration for the autotrophic growth of NH33 on MM agar plate (autotrophic medium) was investigated (Figure 3B). The optimal growth of NH33 on MM agar plate was observed (relative value: 100) when incubated in the presence of gaseous ammonia at 170 ppm. Gaseous ammonia at 2560 ppm decreased the growth rate to a relative value of 5. NH33 was more sensitive to gaseous ammonia when grown under the autotrophic growth condition than under the mixotrophic growth condition. No growth of NH33 was observed under the autotrophic condition without gaseous ammonia. These results indicated that NH33 used gaseous ammonia as an energy source. The increase in the biomass of NH33 grown on MM agar plate and the change in the gaseous ammonia concentration from the initial concentration of 150 ppm in the closed chamber were evaluated (Figure 4B). No change in the gaseous ammonia concentration was observed in the closed chamber during 100 h of incubation of MM agar plate without bacterial inoculation. The biomass continuously increased during 75 h of incubation. During this incubation period, the gaseous ammonia concentration decreased from 150 ppm to 90 ppm. This result demonstrated that NH33 assimilated gaseous ammonia to grow. Figure 4b shows a plot of the amount of assimilated gaseous ammonia versus the amount of biomass (wet weight). Autotrophically growing NH33 cells required 0.64 mmol of gaseous ammonia to gain 1.0 g of biomass (wet weight).

fig 4

Figure 4: Growth curves of Paenibacillus lentus NH33 on mixotrophic (A) and autotrophic (B) growth media and the changes in the gaseous ammonia concentration. The wet weight of P. lentus NH33 cells and the changes in the gaseous ammonia concentration are indicated by empty squares and circles, respectively. The changes in the gaseous ammonia concentration when using agar medium without P. lentus NH33 inoculation are indicated by black circles. The values indicate the means ± standard deviation of three independent experiments. The cell yield of P. lentus NH33 versus the amount of assimilated gaseous ammonia was plotted for the mixotrophic (a) and autotrophic (b) growth conditions.

Usable Nitrogen Sources in Mixotrophic Growth

NH33 could grow well on MMG agar plate in the presence of 1350 ppm of gaseous ammonia (specific growth rate: 2.21 ± 1.18), but not in the absence of gaseous ammonia (Table 1). Replacing gaseous ammonia with ammonium sulfate, sodium nitrite, or potassium nitrate did not enable the growth of NH33 (Table 1). These results indicated that NH33 could not use dissociated ammonia (i.e., ammonium ions), nitrite, or nitrate as a nitrogen source. NH33 required only undissociated ammonia (gaseous ammonia) as a nitrogen source.

Table 1: Usable nitrogen sources for Paenibacillus lentus NH33 growth on MMG agar plate (mixotrophic medium).

Medium

Nitrogen source

Cell yield (mg wet weight/h/plate)

MMG agar Gaseous ammonia

1350 ppm

2.21 ± 1.18

MMG agar None

MMG agar (NH4)2SO4

10 mM

MMG agar NaNO2

10 mM

MMG agar KNO3

10 mM

-, no growth

Usable Energy Sources in Autotrophic Culture

NH33 could grow on MM agar plate in the presence of 1350 ppm of gaseous ammonia (specific growth rate: 0.11 ± 0.01; Figure 2B, Table 2), but it could not grow on MM agar plate containing dissociated ammonia, i.e., 10 mM (NH4)2SO4 or NH4Cl, instead of gaseous ammonia (Table 2). These results suggested that NH33 could specifically use undissociated ammonia, i.e., gaseous ammonia, but not dissociated ammonia as an energy source. In addition, NH33 did not grow on MM agar medium without carbon and nitrogen sources (Table 2).

Table 2: Usable energy sources for Paenibacillus lentus NH33 growth on MM agar plate (autotrophic medium)

Medium

Energy source

Cell yield (mg wet weight/h/plate)

MM agar Gaseous ammonia

1350 ppm

0.11 ± 0.01

MM agar (NH4)2SO4

10 mM

MM agar NH4Cl

10 mM

MM agar None

-, no growth

Rate of Stable Nitrogen Isotope Uptake in NH33 Cells

NH33 was cultured in the presence of stable nitrogen isotope-labeled [15N] gaseous ammonia (170 ppm) or conventional gaseous ammonia (170 ppm) at 40°C for 72 h. No difference in the growth rate was observed between the two cultures. The rate of stable nitrogen isotope uptake (calculated as the ratio of 15N/total N) in the recovered cells was analyzed. As shown in Table 3, all of the nitrogen molecules in the cells grown in the presence of the stable nitrogen isotope-labeled [15N] gaseous ammonia were replaced by the stable nitrogen isotope. The rate of stable nitrogen isotope uptake (15N/total N) in the cells grown in the presence of the conventional gaseous ammonia was 0.0036, which is similar to the value of the natural content of 15N [23,24]. These results confirmed that NH33 took up and assimilated nitrogen derived from the gaseous ammonia. Thus, NH33 is a novel organism that uses gaseous ammonia as both an energy source and nitrogen source.

Table 3: Stable 15N isotope content in Paenibacillus lentus NH33 grown in 170 ppm of 15N ammonia gas

Growth type

15N atoms/total N atoms

Cells grown in 15NH3 gas

0.99999

Cells grown in NH3 gas

0.00367

Natural content of 15N

0.00366

Detection of Nitrite in NH33 Cells

NH33 cells that were cultured on MM agar plate in the presence of 170 ppm of gaseous ammonia at 40°C for 72 h (autotrophic growth cells) were collected and physically ground. The naphthylethylenediamine visual colorimetric method was used to detect nitrite. Figure 5 shows the absorbance spectrum of nitrite solution. The single peak at 540 nm indicates the presence of nitrite, and the maximum absorbance value of the peak reflects the amount of nitrite. As shown in Figure 5, line C, the absorbance peak at 540 nm was observed in the supernatant of the ground cells. The absorbance value at 540 nm indicated that 0.1 µg of nitrite was extracted from 100 mg (wet weight) of NH33 cells, which suggested that gaseous ammonia was oxidized to nitrite by NH33. No nitrite was detected in the agar medium, indicating that NH33 accumulates nitrite intracellularly, and does not eliminate it.

fig 5

Figure 5: Detection of nitrite in the cell-free extract from autotrophically grown Paenibacillus lentus NH33 cells. The absorbance spectra of 0.5 mg/L (line A), 0.2 mg/L (line B), and 0.05 mg/L (line D) nitrite standard solutions were determined by a spectrophotometer. The spectral peak indicates the nitrite content. The specific peak (line C) was also detected in the cell-free extract.

Discussion

NH33 was first isolated from soil using minimal medium (MM) agar plate containing 28 mM glucose in the presence of gaseous ammonia at 1350 ppm [4]. This bacterium could not grow on MM agar plate containing glucose without gaseous ammonia, indicating that it cannot carry out aerobic nitrogen fixation. Bacillus subtilis str. 168 [25,26] and Escherichia coli K-12 [27] could not grow on nutrient agar plate in the presence of gaseous ammonia at 1350 ppm. NH33 is not only a gaseous ammonia-requiring microbe, but also a gaseous ammonia-tolerant microbe. This report showed for the first time that NH33 is capable of growing on MM agar plate in the presence of gaseous ammonia. This growth property indicated chemolithoautotrophic growth, in which energy is gained through ammonia oxidization. NH33 could grow on MM with or without organic substrates in the presence of gaseous ammonia, indicating mixotrophic growth. Up until now, many researchers have thought that ammonia-oxidizing bacteria do not require an organic carbon source, and that autotrophic growth using ammonia is inhibited by the presence of organic carbons [28]. However, that notion was put into question when a pure culture of a mixotrophic ammonia-oxidizing bacterium (NH33) was established.  Ammonia usually has a dual nutritional role: it serves simultaneously as a source of nitrogen and energy [29] for some chemolithoautotrophic bacterial species. It was suggested that NH33 uses glucose as an energy and carbon source, and gaseous ammonia mainly as a nitrogen source, when grown on MMG agar plate. When NH33 is grown on MM agar plate, it uses gaseous ammonia as both an energy and nitrogen source, and carbon dioxide as a carbon source. Microorganisms take up extracellular ammonia, nitrate, urea, and amino acids as nitrogen substrates, and assimilate them [30]. The most reductive form of nitrogen (ammonia) is a favorable nitrogen source as it is energetically efficient. When NH33 was grown on MMG agar plate in the presence of gaseous ammonia, it used gaseous ammonia (undissociated ammonia) as the main nitrogen source. However, NH33 grown on MMG was unable to use ammonium (protonated ammonia), nitrite, and nitrate as a substitute for gaseous ammonia. To introduce ionic substrates intracellularly, organisms require the active transporter (channel protein) system [31,32]. NH33 may lack gene sets involved in the active transporter system for nitrogen species uptake or express them at extremely low levels. Undissociated substances, such as gaseous ammonia, permeate through the cell membrane to the cytoplasm by passive diffusion [33]. The cell surface of NH33 has a high affinity for gaseous ammonia, and can directly assimilate gaseous ammonia intracellularly. NH33 likely gains energy by the oxidation of gaseous ammonia during chemolithoautotrophic growth (growth on MM agar plate in the presence of gaseous ammonia). Ammonia is a stable compound consisting of a nitrogen atom and three hydrogen atoms. It is well-known that the unshared electron pair in the ammonia molecule readily undergoes protonation for the formation of an ammonium ion, as indicated by the following formula: NH3 + H+ ⇄ NH4+. Ammonia in solution is present as NH3 and NH4+, and the ratio of NH3/NH4+ depends on the pH, as defined by the Henderson-Hasselbalch equation [34]. For example, under physiological conditions with a blood pH of 7.4, more than 98% of ammonia is found in the NH4+ form. NH33 may use dissociated ammonia (ammonium ion) as an energy source by dissolving gaseous ammonia in the agar medium. However, NH33 was incapable of growth on MM agar plate (pH 7.0) containing ammonium ion (ammonium sulfate or ammonium chloride). NH33 could be defined as a nitrifying bacterium that uses only undissociated ammonia, but not dissociated ammonia as an energy source. Therefore, NH33 is an obligate that requires gaseous ammonia as both a nitrogen source and an energy source to support its chemolithoautotrophic metabolism.

NH33 is a chemolithoautotrophic bacterium that uses gaseous ammonia as the sole energy source. It extracts energy from a single inorganic source (NH3), assimilates inorganic substrates (e.g., CO2 and NH3), and uses them to synthesize all of the biochemicals necessary to support growth. Ammonia-oxidizing bacteria are incapable of growing mixotrophically [35]. In this study, rather than inhibiting growth, organic compounds, such as glucose, enhanced the growth of NH33. It was considered that NH33 preferentially uses glucose before gaseous ammonia when grown in the presence of gaseous ammonia and glucose simultaneously. Lactose and fructose promoted cell growth more than glucose (data not shown). This mixotrophic growth property suggested that NH33 likely expresses beta-galactosidase and glucose isomerase [36,37]. NH33 is the first reported ammonia-oxidizing bacterium to show mixotrophic growth properties. During mixotrophic growth on MMG agar plate, NH33 mainly used ammonia gas as a nitrogen source. The optimum gaseous ammonia concentration for mixotrophic growth was 1350 ppm. During autotrophic growth on MM agar plate, NH33 used gaseous ammonia as both an energy and nitrogen source. The optimum ammonia gas concentration for autotrophic growth was 170 ppm. Organic substances, such as glucose, were thought to promote the formation of mucoid-like colonies [38] and enhance ammonia gas resistance. The amount of gaseous ammonia required to obtain 1.0 g of cells (wet weight) was 0.62 to 0.64 mmol in both the mixotrophic and autotrophic growth conditions.

NH33 was cultured under autotrophic growth conditions in the presence of gaseous ammonia containing stable isotope nitrogen (15N), and the stable isotope nitrogen ratio in the cells was subsequently examined. All of the nitrogen in the cells was 15N, confirming that the gaseous ammonia in the air had been assimilated into NH33 cells. Autotrophic ammonia-oxidizing bacteria are among a specific group of microbes that are able to use ammonia as the sole energy source and reductant for growth. They extract energy from a single inorganic source (NH3), assimilate inorganic substrates (CO2 and NH3), and use them to synthesize all of the biochemicals necessary to support growth. In ammonia-oxidizing bacteria, ammonia is first oxidized to hydroxylamine by ammonia monooxygenase [39]. The hydroxylamine is then oxidized to nitrite by hydroxylamine oxidoreductase. The predominant nitrogen oxide produced in the process of ammonia oxidation is nitrite [40]. Nitrite was detected in the NH33 cells grown autotrophically in the presence of 170 ppm gaseous ammonia. The final substance of gaseous ammonia oxidation in NH33 was nitrite, suggesting that NH33 has an ammonia oxidation mechanism similar to that of conventional ammonia-oxidizing bacteria. However, it remains unclear whether nitrate can be detected in NH33. It is necessary in future studies to determine whether NH33 can completely oxidize ammonia. Chemolithoautotrophic ammonia-oxidizing bacteria are responsible for the rate-limiting step of nitrification in a wide variety of environments, and are thus very important in the global cycling of nitrogen. NH33 is an autotrophic bacterium capable of both mixotrophic and autotrophic growth. Under autotrophic conditions, it uses only gaseous ammonia as an energy source and a nitrogen source. These findings considerably challenge the currently accepted role of microbial communities in global nitrogen cycling. Due to the importance of this functional group of bacteria, understanding of their ecology and physiology has become a subject of intense research in recent years.

Conclusion

Previous studies of ammonia-oxidizing bacteria have reported ammonium ions in a dissociated state as an energy source. Many researchers are unaware of the existence of organisms that can grow in the presence of gaseous ammonia, such as the Paenibacillus lentus NH33 examined in this study. P. lentus NH33 is a previously unknown ammonia-oxidizing bacterium that uses gaseous ammonia as its sole nitrogen source for both assimilation and dissimilation. Understanding and systematizing gaseous ammonia-requiring bacteria in detail will contribute to the elucidation of yet-unknown roles of ammonia in the biosphere and details of the nitrogen cycle.

Acknowledgement

This research was supported by a Grant-in-Aid from the Japan Science and Technology Agency (Grant Number: MP28116808363).

References

  1. Senanu BM, Boakye P, Oduro-Kwarteng S, Sewu DD, et al. (2021) Inhibition of ammonia and hydrogen sulphide as faecal sludge odour control in dry sanitation toilet facilities using plant waste materials. Scientific Reports 11: 1-13. [crossref]
  2. Bertone E, Chang C, Thiel P, O’Halloran K (2018) Analysis and modelling of powdered activated carbon dosing for taste and odour removal. Water Res 139: 321-328.
  3. Kalemba K, Kasperczyk D, Urbaniec K, Kozik V (2017) Biological methods for odor treatment-A review. J Clean Prod 152: 223-241.
  4. Tada S, Itoh Y, Kiyoshi K, Yoshida N (2021) Isolation of ammonia gas-tolerant extremophilic bacteria and their application to the elimination of malodorous gas emitted from outdoor heat-treated toilets. J Biosci Bioeng 131: 509-517. [crossref]
  5. Myszograj S, Płuciennik-Koropczuk E (2020) COD and nitrogen compounds balance in mechanical-biological wastewater treatment plant with sludge treatment. Desalination Water Treat 186: 443-449.
  6. Reitzer L (2003) Nitrogen assimilation and global regulation in Escherichia coli. Annu Rev Microbiol 57: 155-176. [crossref]
  7. Dasarathy S, Mookerjee RP, Rackayov V, Thrane VR, Balasubramaniyan V, et al. (2017) Ammonia toxicity: from head to toe?. Metab Brain Dis 32: 529-538. [crossref]
  8. Arp DJ, Stein LY (2003) Metabolism of inorganic N compounds by ammonia-oxidizing bacteria. Crit Rev Biochem Mol Biol 38: 471-495. [crossref]
  9. Kuenen JG (2008) Anammox bacteria: from discovery to application. Nat Rev Microbiol 6: 320-326.
  10. Hu HW, He JZ (2017) Comammox-a newly discovered nitrification process in the terrestrial nitrogen cycle. J Soils Sediments 17: 2709-2717.
  11. Nicol GW, Schleper C (2006) Ammonia-oxidising Crenarchaeota: important players in the nitrogen cycle?. Trends Microbiol 14: 207-212.
  12. Steinmüller W, Bock E (1976) Growth of Nitrobacter in the presence of organic matter. I. Mixotrophic growth. Arch Microbiol 108: 299-304. [crossref]
  13. Pflug IJ, Smith GM, Christensen R (1981) Effect of soybean casein digest agar lot on number of Bacillus stearothermophilus spores recovered. Appl Environ Microbiol 42: 226-230. [crossref]
  14. Haar L, Gallagher JS (1978) Thermodynamic properties of ammonia. J Phys Che Ref Data 7: 635-792.
  15. Wenzel M, Dekker MP, Wang B, Burggraaf MJ, Wilbert B, et al. (2021) A flat embedding method for transmission electron microscopy reveals an unknown mechanism of tetracycline. Commun Biol 4: 1-13. [crossref]
  16. Tayasu I, Hirasawa R, Ogawa NO, Ohkouchi N, et al. (2011) New organic reference materials for carbon-and nitrogen-stable isotope ratio measurements provided by Center for Ecological Research, Kyoto University, and Institute of Biogeosciences, Japan Agency for Marine-Earth Science and Technology. Limnology (Tokyo) 12: 261-266.
  17. Ridnour LA, Sim JE, Hayward MA, Wink DA, et al. (2000) A spectrophotometric method for the direct detection and quantitation of nitric oxide, nitrite, and nitrate in cell culture media. Anal Biochem 281: 223-229. [crossref]
  18. Payment P, Coffin E, Paquette G (1994) Blood agar to detect virulence factors in tap water heterotrophic bacteria. Appl Environ Microbiol 60: 1179-1183. [crossref]
  19. Chiarelli A, Cabanel N, Rosinski-Chupin I, Zongo PD, Thierry N, et al. (2020) Diversity of mucoid to non-mucoid switch among carbapenemase-producing Klebsiella pneumoniae. BMC Microbiol 20: 1-14.
  20. Park SY, Kim R, Ryu CM, Choi SK, Choong HL et al. (2008) Citrinin, a mycotoxin from Penicillium citrinum, plays a role in inducing motility of Paenibacillus polymyxa. FEMS Microbiol Ecol 65: 229-237. [crossref]
  21. Fünfhaus A, Göbel J, Ebeling J, Knispel H, et al. (2018) Swarming motility and biofilm formation of Paenibacillus larvae, the etiological agent of American Foulbrood of honey bees (Apis mellifera). Sci Rep 8: 1-12.
  22. Chain P, Lamerdin J, Larimer F, Regala W, et al. (2003) Complete genome sequence of the ammonia-oxidizing bacterium and obligate chemolithoautotroph Nitrosomonas europaea. J Bacteriol 185: 2759-2773. [crossref]
  23. Naidu K, Maseko S, Kruger G, Lin J (2020) Purification and characterization of α-amylase from Paenibacillus D9 and Escherichia coli recombinants. Biocatal Biotransformation 38: 24-34.
  24. Pethybridge H, Choy CA, Logan JM, Allain V et al. (2018) A global meta-analysis of marine predator nitrogen stable isotopes: Relationships between trophic structure and environmental conditions. Glob Ecol Biogeogr 27: 1043-1055.
  25. Zolfaghari Emameh R, Kazokaitė J, Yakhchali B (2021) Bioinformatics analysis of extracellular subtilisin E from Bacillus subtilis. J Biomol Struct Dyn 4: 1-8. [crossref]
  26. Zeigler DR, Prágai Z, Rodriguez S, Chevreux B, et al. (2008) The origins of 168, W23, and other Bacillus subtilis legacy strains. J Bacteriol 190: 6983-6995. [crossref]
  27. Sandler SJ, Leroux M, Windgassen TA, Keck JL (2021) Escherichia coli K‐12 has two distinguishable PriA‐PriB replication restart pathways. Mol Microbiol 116: 1140-1150. [crossref]
  28. Krümmel A, Harms H (1982) Effect of organic matter on growth and cell yield of ammonia-oxidizing bacteria. Microbiol. 133: 50-54.
  29. Kowalchuk GA, Stephen J (2001) Ammonia-oxidizing bacteria: a model for molecular microbial ecology. Annu Rev Microbiol 55: 485-529. [crossref]
  30. Ouyang Y, Norton JM, Stark JM, Reeve JR, et al. (2016) Ammonia-oxidizing bacteria are more responsive than archaea to nitrogen source in an agricultural soil. Soil Biol Biochem 96: 4-15.
  31. Islam S, Islam R. Kandwal P, Khanam S, et al. (2020) Nitrate transport and assimilation in plants: a potential review. Arch Agron Soil Sci 68: 1-18.
  32. Li C, Ariga I, Mikami K (2019) Difference in nitrogen starvation-inducible expression patterns among phylogenetically diverse ammonium transporter genes in the red seaweed Pyropia yezoensis. Am J Plant Sci 10: 1325-1349.
  33. Keerio HA, Bae W, Park J, Kim M (2020) Substrate uptake, loss, and reserve in ammonia-oxidizing bacteria (AOB) under different substrate availabilities. Process Biochem 91: 303-310.
  34. Thurston RV, Russo RC, Vinogradov GA (1981) Ammonia toxicity to fishes. Effect of pH on the toxicity of the unionized ammonia species. Environ Sci Technol 15: 837-840.
  35. Liu X, Lin J, Tian K, Yan W (2008) Metabolism of organic compounds by extremely acidophilic, obligately chemolithoautotrophic Thiobacilli: a review. Chin J biotechnol 24: 1-7.
  36. Kim KH, Seo YL, Baek JH, Jin HM, et al. (2021) Paenibacillus agri nov., isolated from soil. Int J Syst Evol Microbiol 71.
  37. Soni R, Nanjani S, Keharia H (2021) Genome analysis reveals probiotic propensities of Paenibacillus polymyxa Genomics 113: 861-873.
  38. Daane LL, Harjono I, Barns SM, Launen L, et al. (2002) PAH-degradation by Paenibacillus and description of Paenibacillus naphthalenovorans sp. nov., a naphthalene-degrading bacterium from the rhizosphere of salt marsh plants. Int J Syst Evol Microbiol 52: 131-139. [crossref]
  39. Hommes NG, Sayavedra-Soto LA, Arp DJ (2001) Transcript analysis of multiple copies of amo (encoding ammonia monooxygenase) and hao (encoding hydroxylamine oxidoreductase) in Nitrosomonas europaea. J Bacteriol 183: 1096-1100. [crossref]
  40. Sepehri A, Sarrafzadeh MH (2019) Activity enhancement of ammonia-oxidizing bacteria and nitrite-oxidizing bacteria in activated sludge process: metabolite reduction and CO2 mitigation intensification process. Appl Water Sci 9: 1-12.

Autism Diagnostic Criteria, Symptoms, Child Diagnosis and Evaluation Scales

DOI: 10.31038/ASMHS.2022641

Abstract

Introduction: Autistic children have not withdrawn from reality due to some mental illness, rather they have failed to come out in reality due to a serious, and to a large extent, developmental disorder. As a result, autism is not currently considered psychosis, but is classified as a pervasive developmental disorder. This means that it is classified along with the other developmental difficulties rather than the mental illnesses themselves.

Aim: The aim of this study was to present an organized context of autism, its symptoms and clinical picture, its diagnostic criteria as well as child rating scales.

Method: The recent literature was reviewed with keywords: autism, symptoms, diagnostic criteria, evaluation, assessment of autism.

Conclusions: Autistic Disorder or autism is a severe form of Diffuse Developmental Disorder and has been described as a “spectrum disorder”, which means that the clinical picture of autism is not homogeneous, but ranges from milder forms (with minimal and mild form). autistic elements and normal intelligence) to more severe forms (with multiple autistic elements accompanied by severe mental retardation).

Keywords

Autism, Symptoms, Diagnostic criteria, Evaluation, Assessment of autism

Introduction

Autism is a disorder that is affecting more and more people and has been described as a “spectrum disorder” which means that the clinical picture of autism is not homogeneous, but ranges from milder forms (with minimal and mild autistic features and normal intelligence)up to more severe forms (with multiple autistic elements accompanied by severe mental retardation). Autism has a reduction in the following areas [1]:

  • Mutual social transactions
  • Communication
  • General behavior (stereotyped and divisive reactions occur)
  • Interests
  • Activities

In the areas mentioned above, people with Autism not only differ due to developmental delays, but also have divergent reactions, which are not usually found in children with normal development.

Diagnostic Criteria

The diagnosis of Autistic Disorder even today is based on the characteristics of the child’s behavior and not on medical examinations, although it is widely accepted that the causes of autism are due to organic rather than environmental factors [1].

It is true that Kanner himself fueled these orientations considerably by referring to “cold rational” parents and the upper social class, in conjunction with his claim that autistic children have potentially high intelligence. We need a brief reference to these issues because they are involved in the definition of autism in a variety of ways [2-7]:

a) Are the points that were mainly refuted in the course of Kanner’s initial presentation,

b) The data on them are also indirectly answered in the hypothesis for a psychogenic definition of autism, essentially excluding it and

c) From here the research went further, which It was already focusing on the specifics of autism, thus leading to modern perceptions of this disorder but also to highlighting its complexity. Kanner concluded that children should maintain normal intelligence, indirectly: from the islands of potential that he found to maintain among their difficulties, such as:

Their “excellent” memory. Many studies have shown that the majority of autistic children actually have some degree of mental retardation, which is usually not severe. In fact, it remains and is still seen later, even if their social performance improves as they grow older [8-11].

The other thing that is clear here and important for the definition of autism is that, although mental retardation and autism often coexist, they are not identical. A few points from reliable studies can show interesting differences:

  • Autism can coexist with illnesses and conditions that usually cause mental retardation but the association does not seem to be as strong: it seems to go particularly well with low sclerosis, which is a rare condition, but much less so with Down syndrome or cerebral palsy, which are much more common causes of mental retardation [1].
  • Epileptic seizures, common in children with mental retardation but usually beginning in early and middle childhood, typically first appear in autism (in ¼% of cases) around or near adolescence, or later [12,13].
  • Characteristic differences are presented by retarded children and in particular aspects of cognitive emotional and social function. As in the immediate recognition of the leaf, in the recognition of emotions as they appear in human faces and in the emotional understanding
  • Kanner’s first study of autism highlights a number of traits that he found to be characteristic of all the children he saw. These features are as follows [2]:

Excessive Autistic Loneliness

Children failed to interact smoothly with people, and seemed to be overjoyed when left alone. This lack of social response appeared, according to Kanner, very early in life, as shown by the autistic infant’s failure to reach out to the parent who would take him or hug him.

Anxious Depressive Desire to Maintain Similarity

Children were overly irritated by changes in routine or their surroundings. A different school routine, a rearrangement of furniture, could be the cause of an explosion, and the child may not be able to calm down until the familiar order is restored.

Excellent Memory

The children Kanner saw showed an ability to recall large and insignificant amounts of material (eg an encyclopedia content page) that did not keep pace with their clear learning difficulties or mental retardation in other cases.

Delayed Hoarseness

Children repeated the language they were hearing but failed to use words to communicate on topics beyond their immediate needs. The echo may explain the reversal of Kanner’s pronouns – that children use the “You” when referring to themselves and the “I” to the other person. This use would be an immediate repetition of another speaker’s observation. Similarly, autistic children commonly use an entire question to ask for something that follows (eg “Do you want a sweet?”, Meaning ” I want a sweet”).

Hypersensitivity to Stimuli

Kanner noted that many of the children he saw reacted strongly to certain noises and objects, such as vacuum cleaners, elevators, and even blowing air. Some even have problems or fantasies with food.

Limitation to Spontaneous Activity Diversity

This is evident in children’s repetitive movements in their verbal expressions and their interests. Kanner, however, realized that children often seemed to have a good relationship with objects revealing an amazing skill in spinning things or completing puzzles.

Good Cognitive Abilities

Kanner believed that the outstanding memory and skill shown in some of his cases reflected a superior intelligence, in addition to the fact that many children were considered to have severe learning disabilities.This strong impression on intelligence often observed in parents and teachers. A good memory is especially torturous – it leads everyone to form the impression that only if it turned to some practical use the child would learn well. An impression of intelligence is still given by the complete lack of obvious features in most cases of autism. Unlike children, who have many types of severe learning disabilities (eg Down syndrome), autistic children usually have a “normal” appearance. Kanner pointed out his “intelligent features”.

Highly Intelligent Families

Kanner pointed out that all of his cases had intelligent parents, which may have facilitated the referral of their children to a specialist – so Kanner’s sample is unlikely to be representative. Kanner also described parents as cold, although in his first article he was far from a psychogenic theory. On the contrary, he considers that “those in the world with an innate lack of ability to form a normal, biologically determined, emotional contact with people. The areas of speech that are particularly affected by autistic disorder, both comprehension and expression, are those that are related to the dialectical elements of speech, its prosody (tone of voice, volume, strength, intonation) [14], with its non-verbal elements (posture, distance, facial expressions etc.), the factual nature of speech and its use in everyday communication practice [10].

Kanner isolated only two of these key elements of autism: “excessive isolation and depressive obsession with maintaining similarity.” He considered that the other symptoms are either secondary or caused by these two elements (eg communication deficiencies), or that they do not correspond to autism (eg stereotypes) [12].

Symptoms

The symptoms of autism can generally be divided into “deficiencies” and “surpluses” of behavior. The shortcomings concern the main areas of development, such as [2]:

Attention

a) Avoid eye contact

b) Distraction

c) Minimal or excessive preoccupation with certain objects

d) Expression of concern

Speaking

a) Hoarseness

b) Incomprehensible joint

c) Inappropriate hoarseness of voice

d) Inappropriate volume of voice

e) Incoherent reason

f) Repetitive speech

Social and Emotional Events

a) Avoidance or refusal of physical contact

b) Avoidance or refusal of social contact / communication

c) Lack of interest in peers

d) General lack of interest in people

e) Lack of initiative and response to social transactions

f) Apathy to stimuli that cause fear

g) Excessive fear response to stimuli that usually do not elicit a phobic response

h) Apathy or excessive reaction to separation from the mother

i) Apathetic or inappropriately emotional expressions

j) Lack of empathy

Play

a) Peculiar use of toys abstaining from symbolic or representational play

b) Abstention from binary or group play with peers

c) Excessive attachment to certain games

d) Interest in a very limited number of games

Sensory Processing

a) Idiosyncratic processing of visual stimuli (eg plain gaze)

b) Indifference or excessive reaction to auditory stimuli (eg does not react to a loud click, while closing his ears to the sound of the vacuum cleaner)

c) Indifference or excessive reaction to tactile stimuli (eg apathetic pain remains, while caressing is not tolerated)

d) Hypersensitivity to certain flavors and odors

Selective Attention to Certain Characteristics of Environmental Stimuli or Overselectivity

It tends to focus on individual characteristics of environmental stimuli, such as color or shape, resulting in processing them piecemeal rather than spherically. This fragmentary or over-selective treatment exacerbates the difficulty for the person with autism to distinguish and recognize objects or symbols and to generalize their skills with new stimuli and in new conditions [5,6]. For example, if he has learned to name the person depicting a photograph, he recognizes it only from that photograph. He does not realize that the person he depicts in different photos is the same. This difficulty is due to the fragmentary observation of an element or elements of the photograph, such as the clothes of the person depicted or the landscape, instead of globally observing all the facial features that are the main stimulus for recognizing people [4].

Cognitive Functions

a) Mental retardation

b) Unstable learning

c) Developmental gaps in cognitive areas

d) Learning regression

“Surpluses” in the behavior of people with autism are mainly associated with maladaptive and stereotypical reactions and can be classified into the following categories:

Dissociative Behavior

a) Anger attacks

b) Disobedience

c) Aggression

d) Self-injuries

Stereotypical Reactions

a) In tactile stimuli (eg visual surveillance with half-closed eyes, monitoring of objects holding and twisting them like a whirlpool)

b) In speech (eg incoherent sounds or continuous phrases)

c) In the smell (eg smells persistently of objects or people)

d) In taste (eg holds food in the mouth for a long time) e) in touch (eg rubs fingers together)

e) In motion (eg shakes his fingers, hands or feet for a long time, tightens his muscles)

f) Rituals (eg placing objects in a straight line)

Special Abilities

a) Excellent memory and parrot ability

b) High arithmetic ability

c) Hyperlexia

d) Dexterity in puzzles and games with complex mechanisms

Diagnosis Scales and Evaluation of Children with Autism

The use of questionnaires and scales that assess only behavioral problems as well as the limited interests and repetitive and stereotypical behavior of children with ASD is useful not only for diagnostic purposes, but because it is a guide for prioritizing the goals of therapeutic intervention. That is, we decide to start the therapeutic intervention from the most serious problems of the child and the family (that is, the problems that most affect the life of the child and his family as well as those that greatly impede learning) and then we intervene in the least serious problems (those that least affect the child’s life and learning). According to the DCM-III-R we can classify the diagnostic criteria of autism into three categories: social behavior, communication and deviant behavior. In order to diagnose autism, it is necessary to add up a total of six or more “points” from the three categories mentioned above. In particular, the presence of at least two “points” from the first category and at least one point from the second and third category is necessary.

A. Diagnostic criteria for autism disorder by DCM-III-R

At least eight of the following traits are present and include two traits from group A, one from group B and one from group C [1].

Note: Consider a criterion only if the behavior is abnormal to the individual’s level of development.

A. Qualitative Deficiency in Mutual Social Interaction as Manifested by the Following

(The examples in parentheses are arranged so that what is mentioned first is more likely to suit smaller or more disadvantaged individuals and the latter to larger or less disadvantaged individuals with this disorder).

  1. Clear lack of vigilance regarding the existence or feelings of others (eg treats one person as if it were a piece of furniture, does not perceive another person’s anguish, obviously does not perceive the need for others’ privacy).
  2. Lack or abnormal pursuit of relief in times of distress (eg does not seek relief even when ill, wounded or tired, seeks relief in a stereotypical way, eg says “cheese, cheese, cheese »Whenever he is injured).
  3. Lack or inadequate imitation (eg does not shake his hand when saying “hello”, does not copy the mother’s activities at home, mechanical imitation of actions without content) Lack or abnormal play with others (does not actively participate in simple toys, prefers solitary play activities, engages in other children’s play only as “mechanical assistance”).
  4. Clear lack of ability to make friends with peers (no interest in making friends with peers, despite the interest in making friends shows a lack of understanding of the habits that govern social transaction (for example, reads a phone book to non-interested peers).

B. Quality Deficiency in Verbal and Non-verbal Communication and Creative Imagination Activities, as Manifested by the Following

(The numbered features are arranged so that those presented first are more likely to apply to smaller or more disadvantaged individuals and the latter to larger or less disadvantaged individuals with this disorder).

  1. No means of communication, such as the use of articulate communication screams, facial expressions, gestures, imitations or spoken language.
  2. Clear abnormal non-verbal communication on topics such as a research look, facial expression, posture or gestures to start or arrange a social transaction (eg does not anticipate being held in the arms, does not bend his body when held, does not look at the person or laugh when he takes a social approach, does not shake hands with his parents or visitors, has a steady plain look at social situations).
  3. Lack of creative imagination activity, such as playing the roles of an adult, fictional person or animal, lack of interest in fictional storytelling.
  4. Clear abnormalities in speech production, which includes characteristics such as volume, color, agony, proportion, rhythm and tone (eg monotonous speech, question-like melody, or high color).
  5. Clear anomalies in the form or content of speech, which includes stereotyped and repetitive use of speech (eg direct echo or mechanical repetition of TV commercials), use of “you” instead of “I” (eg uses: “Do you want a nut?” To mean:”I want a nut”), temperamental use of words or phrases (eg uses: “Go on the green aisle” to mean: “I want to go to the cot”), or frequent irrelevant remarks (eg begins to talks about train timetables during a sports discussion).
  6. Clearly inadequate ability to initiate or maintain a conversation with others beyond adequate speech (eg it results in long monologues that deal with a topic regardless of its connection to other topics).

C. Clearly Limited Repertoire of Activities and Interests

  1. Stereotypical body movements, e.g. hitting – twisting – knitting of the hands, strong banging of the head, complex movements of the whole body.
  2. Persistent bias towards parts of objects (eg smell of objects, repetitive sensual contact with materials, rotation of toy car wheels) or attachment to unusual objects (eg insists on rotating a piece of rope).
  3. Clear anxiety about changes in insignificant aspects of the environment, e.g. when a jar is moved from the usual position.
  4. Reckless obsession with routines with precise detail, e.g. obsession to always and exactly follow the same shopping habit.
  5. Clearly limited range of differences and a bias with a narrow interest, e.g. is interested in putting objects in order, collecting meteorological facts or pretending to be a fictional person.

D. Beginning during Infancy or Childhood

Identify the onset of childhood (after 36 months of age).

Categories with Indicative Examples of Grading Scale Classification of Autism (CARS, Childhood Autism Rating Scale, 1988)

Because people with Autism, in addition to psychoeducational needs, have additional problems due to deviant behavior, specially weighted scales and questionnaires are particularly useful to assess the behavioral problems, anxiety, and other disorders that these individuals experience. The most well-known and widespread of these questionnaires and scales are: the Autism Behavior Checklist (ABC) [3], which helps determine if a student should be referred for an autism test in the first place. , Autism Diagnostic Interview- Revised (ADI-R) [8] (also used to diagnose autism) and the Childhood Autism Rating Scale (CARS) [3], perhaps the most common scale for autism, used to determine the severity of symptoms. The score on this scale classifies autistic disorder as mild, moderate, and severe. CARS groups autism-related symptoms into 15 categories and each symptom is classified based on 7 scores (1, 1.5, 2, 2.5, 3, 3.5 and 4). The grade of the symptoms ranges from grade 1 (which means the manifestation of behavior at a normal level for his chronological age) to grade 4 (which means the manifestation of a symptom at a level that indicates a serious disorder). Below are the 15 categories of symptoms with examples [15-17].

1. Interpersonal Relationships

E.g. the grade 2.5-3 is given when the child sometimes does not perceive the presence of adults. It sometimes takes persistent effort to get his attention. Takes minimal communication initiatives.

2. Imitation

E.g. Grade 4 is given when the child rarely imitates sounds, words or movements, even at the urging of adults.

3. Emotional Manifestations

E.g. grade 1 is given when the child expresses his feelings with the quality and intensity dictated by social situations. Emotional expression is judged by the child’s facial expression, posture and manners.

4. Movement of the Body

E.g. Grade 2 is given when the child shows minor peculiarities in movement, such as awkwardness, repetitive or uncoordinated movements and when he is very short he makes particularly unusual movements.

5. Use of Objects

For example, grade 4 is given when the child has little interest in toys or other objects, or uses them in very peculiar ways. Absorbs dealing with elements or parts of the game that are not important and is impressed by the reflection of light on these objects. Repeatedly shakes a part of the object or plays exclusively with a single object. When a child becomes addicted to the above reactions, it is very difficult to distract him from them.

6. Adaptability to Change

E.g. Grade 2 is given when the child is still engaged in the same activity or the same material, despite the efforts of an adult to distract him.

7. Visual Reactions

E.g. grade 1 is given, if the child has normal for his age reactions to visual stimuli. It uses its sight, like its other senses, to process new stimuli.

8. Acoustic Reactions

E.g. grade 3 is given when the child’s reactions to auditory stimuli vary. The child sometimes systematically ignores some sounds and other times, scares and closes his ears if he hears normal sounds of the environment.

9. Reactions related to Taste, Smell and Touch

E.g. grade 2 is given when the child insists on putting in his mouth, smelling or trying to eat non-edible objects. The same degree is given when he is either completely ignorant or overly intolerant of mild pain, for which the average child would simply show little discomfort.

10. Stress Reactions

E.g. Grade 4 is given when the child repeatedly shows phobias about situations and objects that are harmless, while it is very difficult to alleviate his fear. The child may expose himself to dangers that children his age have learned to avoid.

11. Verbal Communication

For example, grade 4 is given when the child does not use communication language. It can make babies cry, strange sounds that sound like animal cries, complex noisy sounds that characterize articulated words or phrases in a repetitive and strange way.

12. Non-Verbal Communication

E.g. Grade 3 is given when the child cannot express his needs and desires using ways of non-verbal communication and does not understand the expressive communication expressions of others.

13. Mobility Level

E.g. Grade 1 is given when the child shows no deviation from children of his age in motor activities. The child does not show hyperactivity or hyperactivity in relation to children of his age.

14. Level of Stability in Cognitive Skills

E.g. Grade 3 is given when the child in general does not have the same cognitive skills as children of his age, but in one or two areas shows normal development.

15. General Impressions

The score ranges from 1 (the child does not show symptoms of autism) to 4 (the child has many symptoms or autism in severe form).

References

  1. Rutter M (1990) Infant Autism, Athens, Greek Letters.
  2. Frith U (1999) Autism, Athens: Greek Letters.
  3. Happe F (1008) Autism, Athens: Gutenderg.
  4. Stamatis S (1987) Fortified Silence, Athens: Gull.
  5. Kathleen Ann Quill. Scientific Supervision: A. Messini G Antoniadis (2000), Teaching autistic children, published by Ellin, Athens.
  6. Karantanos C (2001) Autism – Europe, Hellenic Society for the Protection of Autistic People.
  7. Grandin T, Scariano M (1995) Diagnosis: Autism, Athens: Greek Letters.
  8. Genna (2002) Autism and diffuse developmental disorders, Published by Ch. Zacharopoulos, Athens.
  9. Notas S, Brown W, Cohen I (2003) Conference Proceedings. Larissa: XE Seminar Athens, November 18 (2002) Therapeutic Approaches to Diffuse Developmental Disorders. Society for the Mental Health of Children and Adolescents.
  10. Upgrading and expansion of the institution of education of people with special needs (disabled) in Primary and Secondary Education, (2003) ACT OP. E.A. EC: 1.1.4.a ACTION B ‘: DEVELOPMENT OF CURRICULUM STUDIES, RESPONSIBLE:Markakis Emmanouil, Honorary Special Assistant Special Education Pedagogical Institute
  11. Kuder S Jay (2003) Teaching Students with Language and Communication Disabilities (2nd Edition). Boston: Allyn & Bacon.
  12. Raymond D Kent (2004) The MIT Encyclopaedia of Communication Disorders, MIT Press.
  13. Reed A Vicki (1993) An Introduction to Children with Language Disorders, Prentice Hall (a Pearson Education company).
  14. Faherty C (2003) What does it mean to me? Athena. Greek letters.
  15. Scariano M (1995) Diagnosis: Autism, Athens, Greek Letters.
  16. Andy Bondy, Kate Dickey, Diane Black, Sarah Buswell (2002) The Pyramid Approach to Education: Lesson Plans for Young Children, USA, Pyramid Educational Products Inc.
  17. Lennard-Brown (2004) Autism, Translation: Nikolakaki, Maria, Ed. Savallas.

Risk Factors for Postoperative Nausea and Vomiting, Some Helpful Hints

DOI: 10.31038/ASMHS.2022634

Introduction

Recovery following anesthesia is usually complicated by nausea, vomiting, and retching. PONV (postoperative nausea and vomiting) is a significant concern; people frequently regard PONV as terrible than postoperative pain [1]. PONV normally clears up or is treated without repercussions, although it may need an unexpected admittance to the hospital and cause a delay in discharge [2,3].

In this article, we’ll go over a few points concerning PONV risk factors that you should be aware of.

Pathophysiology

Nausea and vomiting are mediated by five neurotransmitter receptors: neurokinin 1 (NK1) – substance P, dopamine D2, muscarinic M1, 5-hydroxytryptamine (HT)-3 serotonin, and histamine H1. PONV might be prevented or treated by targeting any of these receptors [4].

  • Central mechanisms – Higher centers of cortex connecting with the central pattern generator (previously known as the center of vomiting) in the medulla can cause nausea and emesis. Anxiety, pain, conditioned nausea which is triggered by environmental cues, fear, and vestibular system stimulation are all major stimuli that can elicit nausea and vomiting during the perioperative period. During tympanoplasty, for example, surgical activation of the vestibular system via the H1 histamine and M1 cholinergic receptors may cause severe PONV [5].
  • Mechanisms in the periphery – Direct stimulation of the stomach from gastric injuries, bleeding, or toxins causes enterochromaffin cells to produce substance P and serotonin, activating the 5-HT3 receptors in the vagal and splanchnic nerves [6].
  • Toxins and Drugs – The chemical and neurological processes by which medications and toxins elicit nausea and vomiting, including anesthetics and opioids, are complicated and poorly understood [7]. Both opioids and inhalation anesthetics can cause nausea and vomiting by activating the area postrema directly beneath of the fourth ventricle in the medulla. The postrema then transmits dopamine and serotonin to the central pattern generator, which causes the vomiting reflex to be triggered [8,9].

Risk Factors

PONV develops in roughly 30% of infants and adults following anesthesia without prophylaxis [10]. The risk of PONV varies greatly from patient to patient; in high-risk individuals, the rate of PONV might be 80% [11]. The risk of PONV varies depending on the patient, the anesthesia used, and even the type of operation.

Patient Risk Factors

  • Nausea and vomiting before surgery – PONV might be the outcome of a pre-surgery ailment that caused nausea and vomiting.
  • Female gender – Female gender is the most accurate patient-specific predictor of PONV [12,13].
  • Prior to puberty, female children do not have an increased risk of PONV [14,15].
  • Patients who have already had PONV or motion sickness – Previous PONV and/or motion sickness increase the risk of PONV in adults [16].
  • A parent or sibling’s history of PONV or postoperative vomiting (POV), as well as a parent or sibling’s history of PONV or POV, increases the risk of POV/PONV in children [17].
  • Being a nonsmoker – Being a nonsmoker is a risk factor for PONV in and of itself [12,13,16].
  • Age – The majority of research have found a minor, gradual decline in PONV in people as they get older [10,12]. The age of 50 was found to be a risk factor for PONV in a prospective trial of over 2200 patients who received general anesthesia (PDNV) [18].
  • Young age seems to be protective in children. POV is uncommon in youngsters under the age of three, and it becomes more common as they become older, with puberty it reduces again [14].
  • Chemotherapy-induced nausea and vomiting – A background of chemotherapy-induced nausea and vomiting may aggravate PONV (CINV) [19].

Anesthetic Factors

  • Anesthetic technique – When compared to simply regional anesthesia, general anesthesia is linked to a greater rate of PONV [16].
  • Total intravenous anesthesia versus Volatile anesthetics – The use of volatile anesthetics is a major factor in the development of PONV [16,20].
  • Intravenous (IV) anesthetics – At dosages routinely used for induction of anesthesia, etomidate does not raise PONV on its own [21]. Low-dose ketamine in the perioperative period has been shown to minimize PONV, as well as postoperative pain and opioid needs [22,23].
  • Nitrous oxide (N2O) – When compared to anesthesia without N2O, N2O may slightly increase the incidence of PONV, particularly in children and high-risk individuals [24].
  • Duration of anesthesia – Anesthesia for longer periods of time using volatile anesthetics may raise the incidence of PONV [12,13,25].
  • Opioid administration and decrease – Several studies have found that perioperative opioid administration increases the risk of PONV in a dose-dependent way [11,16,26].
  • Neostigmine versus Sugammadex for reversal agent – As shown in a meta-analysis of 10 randomized studies including 933 individuals, combining neostigmine with either atropine or glycopyrrolate did not significantly enhance the incidence of overall nausea or vomiting [27].
  • It’s uncertain how common PONV occurs once sugammadex is used to reverse neuromuscular blocking medications.

Type of Surgery

When compared to other general surgical operations, the best data shows that cholecystectomy, laparoscopic, and gynecologic surgeries are linked with a moderately elevated risk of PONV [12].

In children, strabismus operation is a significant, and arguably the most critical, predictor of POV [14,17]. POV also happens in up to 70% of children who undergo adenotonsillectomy without prophylaxis [28], 60% of kids who have otoplasty [29], and 40% of children who have inguinal scrotal or penile surgeries [30].

In conclusion, PONV is a condition with distinct characteristics that can be avoided by recognizing preventive causes. In our review, we have covered several noteworthy elements.

References

  1. Macario A, Weinger M, Carney S, Kim A (1999) Which clinical anesthesia outcomes are important to avoid? The perspective of patients. Anesthesia and Analgesia 89: 652-658. [crossref]
  2. Fortier J, Chung F, Su J (1998) Unanticipated admission after ambulatory surgery–a prospective study. Canadian Journal of Anaesthesia 45: 612-619. [crossref]
  3. Hill RP, Lubarsky DA, Phillips-Bute B, Fortney JT, Creed MR, et al. (2000) Cost-effectiveness of prophylactic antiemetic therapy with ondansetron, droperidol, or placebo. Anesthesiology 92: 958-967. [crossref]
  4. Bashashati M, McCallum RW (2014) Neurochemical mechanisms and pharmacologic strategies in managing nausea and vomiting related to cyclic vomiting syndrome and other gastrointestinal disorders. European Journal of Pharmacology 722: 79-94. [crossref]
  5. Becker DE (2010) Nausea, vomiting, and hiccups: a review of mechanisms and treatment. Anesthesia Progress 57: 150-156. [crossref]
  6. Spiller R (2007) Recent advances in understanding the role of serotonin in gastrointestinal motility in functional bowel disorders: alterations in 5-HT signalling and metabolism in human disease. Neurogastroenterology and Motility 2: 25-31. [crossref]
  7. Horn CC, Wallisch WJ, Homanics GE, Williams JP (2014) Pathophysiological and neurochemical mechanisms of postoperative nausea and vomiting. European Journal of Pharmacology 722: 55-66. [crossref]
  8. Bountra C, Gale JD, Gardner CJ, Jordan CC, Kilpatrick GJ, et al. (1996) Towards understanding the aetiology and pathophysiology of the emetic reflex: novel approaches to antiemetic drugs. Oncology 1: 102-109.
  9. Mitchelson F (1992) Pharmacological agents affecting emesis. A review (Part I). Drugs 43: 295-315. [crossref]
  10. Cohen MM, Duncan PG, DeBoer DP, Tweed WA (1994) The postoperative interview: assessing risk factors for nausea and vomiting. Anesthesia and Analgesia 78: 7-16. [crossref]
  11. Apfel CC, Läärä E, Koivuranta M, Greim CA, Roewer N (1999) A simplified risk score for predicting postoperative nausea and vomiting: conclusions from cross-validations between two centers. Anesthesiology 91: 693-700. [crossref]
  12. Apfel CC, Heidrich FM, Jukar-Rao S, Jalota L, Hornuss C, et al. (2012) Evidence-based analysis of risk factors for postoperative nausea and vomiting. British Journal of Anaesthesia 109: 742-753. [crossref]
  13. Sinclair DR, Chung F, Mezei G (1999) Can postoperative nausea and vomiting be predicted? Anesthesiology 91: 109-118. [crossref]
  14. Eberhart LHJ, Geldner G, Kranke P, Morin AM, Schäuffelen A, et al. (2004) The development and validation of a risk score to predict the probability of postoperative vomiting in pediatric patients. Anesthesia and Analgesia 99: 1630-1637. [crossref]
  15. Eberhart LH, Morin AM, Guber D, Kretz FJ, Schäuffelen A, et al. (2004) Applicability of risk scores for postoperative nausea and vomiting in adults to paediatric patients. British Journal of Anaesthesia 93: 386-392. [crossref]
  16. Koivuranta M, Läärä E, Snåre L, Alahuhta S (1997) A survey of postoperative nausea and vomiting. Anaesthesia 52: 443-449. [crossref]
  17. Kranke P, Eberhart LH, Toker H, Roewer N, Wulf H, et al. (2007) A prospective evaluation of the POVOC score for the prediction of postoperative vomiting in children. Anesthesia and Analgesia 105:1592-1597. [crossref]
  18. Apfel CC, Philip BK, Cakmakkaya OS, Shilling A, Shi YY, et al. (2012) Who is at risk for postdischarge nausea and vomiting after ambulatory surgery? Anesthesiology 117: 475-486. [crossref]
  19. DA Silva HB, Sousa AM, Guimarães GM, Slullitel A, Ashmawi HA (2015) Does previous chemotherapy-induced nausea and vomiting predict postoperative nausea and vomiting? Acta Anaesthesiologica Scandinavica 59: 1145-1153. [crossref]
  20. Apfel CC, Kranke P, Katz MH, Goepfert C, Papenfuss T, et al. (2002) Volatile anaesthetics may be the main cause of early but not delayed postoperative vomiting: a randomized controlled trial of factorial design. British Journal of Anaesthesia 88: 659-668. [crossref]
  21. St Pierre M, Dunkel M, Rutherford A, Hering W (2000) Does etomidate increase postoperative nausea? A double-blind controlled comparison of etomidate in lipid emulsion with propofol for balanced anaesthesia. Eur J Anaesthesiol 17: 634-641. [crossref]
  22. Laskowski K, Stirling A, McKay WP, Lim HJ (2011) A systematic review of intravenous ketamine for postoperative analgesia. Canadian journal of anaesthesia. Journal Canadien d’anesthesie 58: 911-923. [crossref]
  23. Subramaniam K, Subramaniam B, Steinbrook RA (2004) Ketamine as adjuvant analgesic to opioids: a quantitative and qualitative systematic review. Anesthesia and Analgesia 99: 482-495. [crossref]
  24. Tramèr M, Moore A, McQuay H (1996) Omitting nitrous oxide in general anaesthesia: meta-analysis of intraoperative awareness and postoperative emesis in randomized controlled trials. British Journal of Anaesthesia 76: 186-193. [crossref]
  25. Apfel CC, Kranke P, Eberhart LH, Roos A, Roewer N (2002) Comparison of predictive models for postoperative nausea and vomiting. British Journal of Anaesthesia 88: 234-240. [crossref]
  26. Roberts GW, Bekker TB, Carlsen HH, Moffatt CH, Slattery PJ, et al. (2005) Postoperative nausea and vomiting are strongly influenced by postoperative opioid use in a dose-related manner. Anesthesia and Analgesia 101: 1343-1348. [crossref]
  27. Cheng CR, Sessler DI, Apfel CC (2005) Does neostigmine administration produce a clinically important increase in postoperative nausea and vomiting? Anesthesia and Analgesia 101: 1349-1355. [crossref]
  28. Ferrari LR, Donlon JV (1992) Metoclopramide reduces the incidence of vomiting after tonsillectomy in children. Anesthesia and Analgesia 75: 351-354. [crossref]
  29. Paxton D, Taylor RH, Gallagher TM, Crean PM (1995) Postoperative emesis following otoplasty in children. Anaesthesia 50: 1083-1085. [crossref]
  30. Villeret I, Laffon M, Duchalais A, Blond MH, Lecuyer AI, et al. (2002) Incidence of postoperative nausea and vomiting in paediatric ambulatory surgery. Paediatric Anaesthesia 12: 712-717. [crossref]

Effect of Nitrogen and Phosphorus Fertilizer Rates on Yield and Yield Components Sorghum (Sorghum bicolor L. Moench) at Kersa Woreda of Oromia Region

DOI: 10.31038/AFS.2022434

Abstract

Soil fertility is among the most important constraints that threaten sorghum production in Jimma Zone in Oromia Region. Therefore, a field experiment was carried out at Kersa woreda for four consecutive cropping seasons from 2013/14 to 2016/17 to evaluate the response of various levels of nitrogen (N) and phosphorus (P) fertilizer using sorghum. The treatments consisted of factorial combinations of four rates each of N (0, 23, 46 and 69 kg N ha−1) and P (0, 11.5, 23 and 34.5 kg P2O5 ha−1) laid down in a randomized complete block design (RCBD) with three replications. For data analysis, correlation coefficient and ANOVA were used. The result showed that the yield and yield components of the sorghum crop were highly significant response to impacts of inorganic N-P fertilizer nutrients. Parameters, such as, plant height, head weight, grain yield, biomass yield and stover yield, were statistically significantly different by nitrogen and phosphorus different fertilizer rates. Also, these parameters were significant and positive correlation to each other. This result revealed that the highest (4.14 t/ha) grain yield was obtained from 69 kgh-1 N and 23 kgha-1 P2O5 inorganic fertilizer, whereas the lowest (1.37 t/ha) grain yield was recorded from control treatment. Compared to the control treatment, the highest rate of N/P (69/23 kg ha-1) increased sorghum grain yield by about 202.2%. It is concluded that nitrogen and phosphorus at the rate of 69 kgh-1 N and 23 kgha-1 P2O5 has the best performance in obtaining maximum grain yield of sorghum crop. Therefore, N-P at the rate of 69 kgh-1 N and 23 kgha-1 P2O5 is highly recommended for optimum grain yield of sorghum crop in the study area.

Keywords

fertilize, Grain yield, Nitrogen, phosphorus, sorghum

Introduction

Globally, sorghum (Sorghum bicolor L. Moench) is the fifth most vital rice, wheat, barley and cereal crop after maize [1,2]. It is an important crop staple food crop in the semi-arid tropics of Africa, south Asia and Central America [3]. In Ethiopia, sorghum is a major staple food crop, ranking second after maize in total production. It ranks third after wheat and maize in productivity per hectare, and after Teff and maize in area cultivated. It is grown in almost all regions, covering a total land area of 1.8 million ha [4]. Sorghum grain is as nutritious as other cereal grains; contains about 11% water, 340 k/cal of energy, 11.6% protein, 73% carbohydrate and 3% fat by weight [5,6].

Despite the large-scale production and various merits, Sorghum production and productivity have been far below the potential. Currently the average regional productivity is 2.1 t ha-1 but, the study area productivity is below 1.3 t ha-1 which is very low as compared to other small grain cereals grown in Ethiopia [4]. Low productivity of crops has been attributed to abiotic stress for drought and low soil fertility and biotic stress for the disease, insect and weeds [7,8].

Soil fertility is one of the major production constraints in the Ethiopia. Deficiency of nitrogen and phosphorus is the main factor that severely reduces the yield of sorghum [9]. According to [10], although soil fertility status is dynamic and variable from locality to locality, and it is difficult to end up with a blanket recommendation invariably, some soil amendment studies were undertaken at different times and places. In addition to fertilizer rates, soil acidity also affects the productivity of the land by affecting availability of nutrients and hindering the activity of microorganisms. Also nitrogen is commonly the most limiting nutrient for crop production in the major world’s agricultural areas and therefore adoption of good N management strategies often result in large economic benefits to farmers. The various factors accounting for the poor soil fertility include topography, soil erosion, deforestation, population pressure, and continuous cultivation without proper soil fertility maintenance [11-13]. Among the major constraints on increased production of sorghum are poor soil fertility, limited supply of production inputs, low prices for the produce, and undeveloped markets [7]. The application of inorganic P fertilizer increased the efficient utilization of inorganic N fertilizer by the plants in grain yield and total biomass production; also, P nutrition of soils is critical for the efficient use of inorganic N fertilizer, thus deficiency in soil P limited the efficient use of applied N by the plant [14]. There was limited research conducted concerning fertilizers rates as a result of this fact, the farmers rely on traditional practices. Most of the farmers in experiment site do not use NP combination above the recommended rate. Therefore, there is a need to study the effect of different NP rates on the yield and yield components of sorghum.

Materials and Methods

Description of the Study Area

The experiment was conducted at Kersa woreda, Jimma zone of the Oromia national state for four consecutive cropping seasons from 2013/14 to 2016/17. The site is located at about 28 km east from Jimma town and 7° 40′ 0″ N latitude and 36° 50′ 0″ E longitude at an average elevation of 1740 to 2660 m amsl and average maximum and minimum temperature is 28.8°C and 11.8°C respectively and reliably receives good rains, ranging from 1,200 – 2,800 mm per annum cropping season. The middle and high altitude soils are less rich in nutrients due to the fact that they have been under human land use for long. The zone is one of the major coffee growing areas of Oromia region well-endowed with natural resources contributing significantly to the national economy of the country. The major crops grown, other than coffee, are maize, teff, sorghum, barley, pulses (beans and peas), root crops (enset-false banana and potato) and fruits.

Description of the Experimental Materials

Plant Materials

In the present study, Sorghum varieties Abamelko which adapted to the agro-ecology of the area were used. Varieties Abamelko is the most promising released by Jimma Agricultural Research Centre. It has wider adaptability and grows well at altitudes ranging from 1740 to 2660 meters above sea level with annual rain fall of 1,200 – 2,800 mm.

Experimental Design and Treatments

The experiment was conducted in Kersa district of Oromia Region in 2013/204 to 2016/2017 cropping seasons. The treatments consisted of four N levels (0, 23, 46 and 69 kg N ha-1) and four P levels (0, 11.5, 23 and 34.5 kg P2O5 ha-1). The experiment was arranged in randomized complete block design (RCBD) with three replications in a factorial arrangement. The plot size was 14.25 m2 (3.75 m × 4 m) and consisted of 5 rows. A distance of 0.5 m and 1 m were left between plots and blocks, respectively. The spacing of 75 × 15 cm was used between rows and plants, respectively and there were 26 plants planted per row with a total of 133 plants per plot. Urea and Triple supper phosphate (TSP) were used as a source nitrogen and phosphorus fertilizer, respectively. Nitrogen fertilizer was applied by split; application method in the form of urea half at planting and the remaining 45 days after planting. Phosphorus was applied once in the form of TSP at the time of planting. Agronomic practices such as weeding and cultivation were done uniformly for all treatments as per need.

Data Collection and Measurement

Plant height (cm) was measured at physiological maturity from the ground level to the tip of head from ten randomly taken plants and was averaged on per plant basis. Head weight (g): samples of ten heads were weighed after harvesting and sun drying to determine weight per head. Weight was adjusted to 12.5% moisture level. Grain and stover yields (t/ha) were determined by harvesting the entire net plot area and converted into tons per hectare. Grain yield was adjusted to 12.5% moisture level; whereas stover yield was weighed after leaving it in open air for 7 days. The biomass yield (t/ha) was calculated as the sum of the grain and stover yields.

Data Analysis

Collected data were subjected to analysis of variance (ANOVA) by using Statistical Analysis System Software Version 9.3 [15] and significant treatment means was separated using Least Significance Difference (LSD) test and correlation coefficient within and between yield and agronomic parameters was done.

Results and Discussion

Effect NP Fertilizer Combination on Plant Growth, Yield and Yield Components Sorghum

Plant Height

The mean of plant height and the analysis of variance are shown in Table 1. There were highly significant variations (p ≤ 0.001) among the fertilizers types on sorghum height. The Application of NP fertilizer linearly and significantly increased plant height as compared to the control (no application any fertilizer). Similarly, the highest mean value (197.42 cm) was obtained from the application of 69 kg ha-1 N and 34.5 kg ha-1 P2O, while the lowest mean value (157.57 cm) was recorded from the control treatment (Table 1). The treatment increased mean value of plant height by about 25.29% as compared with unfertilized plots. Plant height was significant and positive correlation with stover yield (Table 2). This result suggests that Plant height increased with increasing application of NP fertilizer rates.

Table 1: Effect nitrogen and phosphorus fertilizer rates on sorghum height

Treatment (NP)

Plant height (cm)
2013/2014 2014/2015 2015/2016 2016/2017

Over year

0/0

171f

1.32e 149h 177.93e

157.57i

0/11.5

178ef

135e 156h 179.33e

162.16i

0/23

184edf

140de 165g 197.80cab

171.72h

0/34.5

190cedb

153cdb 169gf 181.38de

173.51hg

23/0

186cedf

146cde 168g 188.80cde

172.12h

23/11.5

192cedb

159cba 169gf 195.07cb

178.57hfg

23/23

200cadb

155cdb 170gef 197.71cab

180.54defg

23/34.5

206ab

156cdba 178dec 200.53cab

185.02debfc

46/0

190cedb

160cba 176def 192.78cdb

179.56efg

46/11.5

202cab

154cdb 177def 194.89cb

181.78defc

46/23

202cab

167ab 185bc 190.67cdbe

186.08debc

46/34.5

206ab

163ab 181dbc 198.56cab

186.93dbc

69/0

203cab

164ab 184dbc 200.36cab

187.76bc

69/11.5

207ab

166ab 188ba 187.67cde

187.16dbc

69/23

209a

167ab 189ba 202.62ab

191.99ba

69/34.5

213a

171a 196a 209.78a

197.42a

LSD (0.05)

17.4

16.03 6.18 13.332

7.1082

CV (%)

5.32

6.18 2.81 4.13

2.36

Values followed by the same letter within a column are not significantly different at P<0.05

Table 2: Pearson correlation coefficients between selected sorghum plant parameters

Sorghum Plant Parameters

PH HW GY TBMY

STY

PH

1

HW

0.39*

1

GY

0.46**

0.91**

1

TBMY

0.37*

0.94** 0.90**

1

STY

0.35*

0.91** 0.85* 0.97**

1

**P ≤ 0.001; *P ≤ 0.05; PH: Plant Height; HW: Head Weight; GY: Grain Yield; TBMY: Total Biomass Yield

The possible reason for the increased plant height of sorghum over the control in response to the mixed application of the fertilizers might be attributed to the released major nutrients and improved soil physical property in enhancing plant growth owing to their contribution to enhanced cell division, stem elongation, promotes leaf expansion and vegetative growth of plant. This result is in agreement with [16] who reported that plant height of sorghum was increase with increasing rates of NP from 0/0 to 69/46 kg ha-1. This study is in agreement with [17] who reported that application of NP fertilizer at rate 49/46 kgha-1 significantly increases the plant height of sorghum, and height of sorghum was 18.21 cm greater than control treatment at rate 69 kg N and 46 P2O5 ha-1 fertilizer. It can be concluded the increased rates of N, and P increased the plant growth and biomass, and also the increased amounts of N-P increases the production of sorghum crop [18].

Head Weight

Head weight was highly significantly affected (p≤ 0.001) by different rates of NP application (Table 3). The results indicated that head weight was linearly increased with increasing levels of NP fertilization from 0/0 to 69/23 kg NP2O5 ha-1. The maximum head weight (93.17 gm) was recorded from application of 69/23 kg NP2O5 ha-1, whereas zero the minimum (29.13 gm) was obtained zero application, which was significantly lower than the effect of other rates. Thus, the combination of N and P at 69/23 kg ha−1 resulted in about 219.7% higher head weight compared with the application of no fertilizer (Table 3).

Table 3: Effect nitrogen and phosphorus rates on head weight of sorghum

Treatment (NP)

Head Weight (t/ha)
2013/2014 2014/2015 2015/2016 2016/2017

Over year

0/0

25.43j

21.1d 43.16g 26.85e

29.13e

0/11.5

33.13ij

21.7cd 46.01fg 34.76de

33.90e

0/23

35.19ihj

41.44cbd 47.74fg 48.26cde

43.16de

0/34.5

39.48ihfgj

51.91cabd 62.28efg 59.87cdbe

53.39dc

23/0

38.31hgj

55.18cabd 67.80ed 52.83cde

53.53dc

23/11.5

41.99iehfg

56.42cabd 64.64efd 57.76cdbe

55.20dc

23/23

48.07ehfgd

60.04ab 82.50cd 72.77cba

65.84bc

23/34.5

53.84ed

60.77ab 81.40ecd 63.65cdba

64.91bc

46/0

44.15iehfgd

55.79cabd 97.31cb 74.35cba

67.90bc

46/11.5

50.67ecfgd

60.21ab 88.84c 57.94cdbe

64.41bc

46/23

82.89a

79.79a 116.41ab 90.35ba

92.36a

46/34.5

57.29cd

60.93ab 115.88ab 75.57cba

77.42ba

69/0

56.79cd

58.79cab 82.57cd 67.9cdba

66.51bc

69/11.5

52.90ecfd

80.15a 116.59ab 79.23cba

82.22ba

69/23

75.79ab

83.27a 118.58a 95.06a

93.17a

69/34.5

62.40ab

83.41a 89.72c 73.95cba

77.37ba

LSD (0.05)

14.31

37.524 19.321 33.431

18.565

CV (%)

17.2

38.67 14.02 31.11

17.45

Values followed by the same letter within a column are not significantly different at P< 0.05

This might be attributed to large quantities of nitrogen and phosphorus is translocated from the other plant parts to the grain as it develops heads. This current result is in agreement with [19] who indicated that Sorghum with headings increased consistently with increasing rates of application of inorganic N-P fertilizers from 58 to 121.67. In the same way, head weight was significant and positive correlation with grain yield (Table 2). The present study is similar to the findings of [20] who reported that head weight had the highest direct effect on grain yield sorghum, and also there is significant and high positive correlation between grain yield and head weight (r=0.976).

Grain Yield

Application of nitrogen and phosphorus fertilizers highly significantly (p ≤ 0.001) influenced grain yield. Mean values of the data showed that maximum grain yield (4.14 t/ha) was produced by the treatments of 69/23 kg ha-1 NP inorganic fertilizers. However, the control plots resulted in minimum grain yield (1.37 t/ha) (Table 4). Compared to the control treatment, the highest rate of N/P (69/23 kg ha-1) increased sorghum grain yield by 202.2%. Hence, application of 69/23 N and P fertilizer rate gave the highest sorghum yield all years (Table 5). Also, grain yield was significant and positive correlation growth parameters, yield and yield components of sorghum (Table 2).

Table 4: Effect nitrogen and phosphorus rates on grain yield of sorghum

Treatment (NP)

Grain Yield (t/ha)
2013/2014 2014/2015 2015/2016 2016/2017

Over year

0/0

1.40j

1.42h 1.56i 1.30f

1.37h

0/11.5

1.88ij

1.50h 1.74i 1.41ef

1.47h

0/23

2.01ij

1.51h 2.33h 1.63def

1.90g

0/34.5

2.28hifjg

2.35g 2.58hg 2.50cadbef

2.55fe

23/0

2.21hijg

2.63gf 2.85fg 1.93cdef

2.46f

23/11.5

2.44heifg

2.63gf 2.98f 2.57cdbe

2.76fed

23/23

2.82hefdg

2.66gfe 3.01fe 2.68cadb

2.81fed

23/34.5

3.19ecd

3.03dfe 3.07fe 2.26cdbef

2.83ed

46/0

2.58heif

3.10cdfe 3.09fe 2.62cadbe

2.95d

46/11.5

2.99ecfdg

3.22cdbe 3.29de 2.33cdbef

2.98d

46/23

5.01a

3.68ba 4.31a 3.40ab

3.95ba

46/34.5

3.40cd

3.52cdba 3.46dc 3.04cab

3.53c

69/0

3.37cd

3.52cdba 3.59c 2.97cab

3.35c

69/11.5

3.13ecfd

3.43cdba 4.14ba 3.26cab

3.52c

69/23

4.57ab

3.80a 4.33a 3.56a

4.14a

69/34.5

3.72cb

3.66ba 4.01b 2.62cadb

3.61bc

LSD (0.05)

0.9013

0.5747 0.2877 1.2097

0.3636

CV (%)

18.39

12.07 5.48 28.96

7.55

Values followed by the same letter within a column are not significantly different at P<0.05

Similar result was observed in [17] that there is significant increase in grain yield of sorghum when supplied with higher rates of NP fertilizer. This result is in agreement with [19] who reported that application of 92/30 kg ha-1 NP fertilizer rate increased the grain yield of sorghum. Also, this study is in agreement with the finding of [14] who stated that increasing N rates significantly increased grain and total dry biomass production, whereas the application of inorganic P fertilizer increased the efficient utilization of inorganic N fertilizer by the plants in grain yield and total biomass production.

Total Biomass Yield

The total biomass yields of sorghum were highly significantly (p≤ 0.001) affected by inorganic N-P fertilizers rates (Table 5). Total biomass yield was increased with applying NP fertilizers. Accordingly, the maximum mean total biomass yield (10.27 t/ha) of sorghum was recorded from application of 69/23 NP fertilizer, while the lowest mean total biomass yield (3.52 t/ha) of sorghum was recorded from control without application of any fertilizer (Table 5). The current result indicated that NP fertilizer increased the biomass yield by 191.76% over control treatments.

Table 5: Effect nitrogen and phosphorus rates on total biomass yield of sorghum


Treatment (NP)

Total Biomass Yield (t/ha)
2013/2014 2014/2015 2015/2016 2016/2017

Over year

0/0

4.30i

3.45f 5.90i 3.17c

3.52g

0/11.5

5.07hi

4.06ef 6.18i 3.65c

4.07fg

0/23

5.89ghfi

4.27def 6.95h 6.42bc

5.07efg

0/34.5

6.61ghf

6.15dec 7.78g 7.68bc

6.13edf

23/0

6.38ghfi

6.42dc 7.87g 6.75bc

6.00edf

23/11.5

6.42ghfi

6.92bc 8.52f 8.80ba

6.69ed

23/23

7.79gdfe

7.26abc 9.73e 9.05ba

7.26edc

23/34.5

10.09cab

7.71abc 10.04de 7.70ba

7.64dbc

46/0

5.763ghi

7.83abc 10.14de 9.13ba

6.99edc

46/11.5

6.793ghe

7.90abc 10.56dc 7.47ba

6.91edc

46/23

12.20a

8.79ab 12.82a 10.60ba

9.70ab

46/34.5

8.85cdbe

8.92ab 10.88c 9.38ba

8.36adbc

69/0

7.94dfe

8.93ab 10.89c 9.08ba

8.17adbc

69/11.5

8.033dfe

8.92ab 12.06a 12.92a

9.23abc

69/23

10.323ab

9.40ab 13.10a 13.34a

10.27a

69/34.5

9.61db

9.16ab 13.07a 9.81ba

9.12abc

LSD (0.05)

2.154

2.335 0.4632 36.17

2.4202

CV (%)

16.93

19.30 2.84 5.0874

20.17

Values followed by the same letter within a column are not significantly different at P<0.05

The maximum mean total biomass yield recorded from 69/23 NP over the control might be due to more nutrients gained from both NP combined fertilizers. The result was in line with [17] who reported that application of NP fertilizer at rate 69/46 kg ha-1 increases the grain yield of sorghum significantly. In the same way, study conducted by [19] observed that NP fertilizer application at rate 92/30 kgha-1 increases the total biomass yield of sorghum by 68.21% advantage over control treatment. This current study is supported by [14] who reported that the application of inorganic P fertilizer increased the efficient utilization of inorganic N fertilizer by the plants in grain yield and total biomass production; also, P nutrition of soils is critical for the efficient use of inorganic N fertilizer, thus deficiency in soil P limited the efficient use of applied N by the plant.

Stover Yield

The stover yield of sorghum was showed highly significant (p≤ 0.001) difference due to treatments (Table 6). Accordingly, the maximum stover yield (8.05 t/ha) of sorghum was recorded from application of 69/23 kgha-1 NP inorganic fertilizer, while the lowest stover yield (3.58 t/ha) of sorghum was obtained from the unfertilized plot. This 69/23 kgha-1 NP treatment gave stover yield advantage of 4.47 t/ha (124.86%) compared to unfertilized plots (Table 6).

Table 6: Effect nitrogen and phosphorus rates on stover yield of sorghum

Treatment (NP)

Stover Yield (t/ha)
2013/2014 2014/2015 2015/2016 2016/2017

Over year

0/0

6.47d

2.03d 4.33i 1.87e

3.58g

0/11.5

6.55cd

2.56cd 4.44i 2.24de

3.85fg

0/23

6.71cd

2.75cbd 4.62i 4.78cde

4.61feg

0/34.5

6.80cd

3.80cabd 5.20hg 5.18cde

5.13fdeg

23/0

6.80cd

3.79cabd 5.02h 4.82cde

4.99fdeg

23/11.5

6.74cd

4.28cab 5.53g 6.23cdba

5.57cfde

23/23

6.78cd

4.60ab 6.73f 6.37cdba

5.97cdeb

23/34.5

6.94cd

4.68ab 6.97fe 5.44cdbe

5.85cdeb

46/0

6.76cd

4.72a 7.06fed 6.51cba

6.10cdeb

46/11.5

6.84cd

4.68ab 7.27ed 5.14cde

5.82cdeb

46/23

8.22cab

5.11a 8.51b 7.20cba

7.07cab

46/34.5

8.10cabd

5.40a 7.42d 6.34cdba

6.64cadb

69/0

7.06cd

5.42a 7.30ed 6.11cdba

6.31cadeb

69/11.5

7.14cbd

5.48a 7.92c 9.66ba

7.37ab

69/23

8.85ab

5.61a 8.76ba 9.78a

8.05a

69/34.5

9.05a

5.50a 9.06a 7.19ba

7.49ab

LSD (0.05)

1.7274

1.9371 0.3709 4.2371

1.7831

CV (%)

14.31

26.39 3.35 42.86

18.12640

Values followed by the same letter within a column are not significantly different at P<0.05

This indicates that presence of greater stover yield of sorghum might be due to the fact that crops supplied with adequate nutrients have more vegetative growth, longer linear growth rate and more dry matter accumulation which directly related to an increment in stover yield. This result is supported by [17] who reported that application of nitrogen with phosphorus increase on plant height, grain yield and biomass yield of sorghum. The increase in stover yield with higher N levels might be due to the increase in grain and total dry biomass of maize with higher N rates [14].

Correlation between Growth Parameters, Yield and Yield Components of Sorghum

A summary of the correlation coefficients of the relationships between selected growth parameters, yield and yield components of sorghum in kersa woreda farmers farm, are presented in Table 2. Accordingly, the result indicates all selected parameters of sorghum were significant and positive correlation with one another. Hence, this result suggests that, sorghum grain yield, plant height, head weight, total biomass yield and stover yield is highly influenced NP inorganic fertilizer. The current study is in agreement with [20] who revealed that there was significant and positive correlation between grain yields, head weight and 1000 grain mass, whereas significant but negative correlation exists between panicle count and panicle length.

Conclusion

Overall, the present study showed that the yield and yield components of the sorghum crop were significant response to impacts of inorganic N-P fertilizer nutrients. Parameters, such as, plant height, head weight, grain yield, biomass yield and stover yield, were statistically significantly different by nitrogen and phosphorus different fertilizer rates. Also, these parameters were significant and positive correlation to each other. Therefore, N and P fertilizers are very vital nutrients in limiting the growth, development and the production of the crops in the study area.

This result revealed the highest (4.14 t/ha) grain yield was obtained from 69 kgh-1 N and 23 kgha-1 P2O5 fertilizer, whereas the lowest (1.37 t/ha) grain yield was recorded from control treatment. Compared to the control treatment, the highest rate of N/P (69/23 kg ha-1) increased sorghum grain yield by about 202.2%. It is concluded that nitrogen and phosphorus at the rate of 69 kgh-1 N and 23 kgha-1 P2O5 has the best performance in obtaining maximum grain yield of sorghum crop. Therefore, N-P at the rate of 69 kgh-1 N and 23 kgha-1 P2O5 is highly recommended for optimum grain yield of sorghum crop in the study area.

References

  1. FAO (2014) Food and Agriculture Organization of the United Nations.
  2. El-Mageed TAA, Mohammed SA, El-Samnoudi IM, Ibrahirm AEM (2018) Interactive effects of soil salinity and water table depth on soil properties and sorghum (Sorghum Bicolor L. Moench) production. Archives of Agriculture and Environmental Science 3: 15-24.
  3. Kumar V, Chopra AK (2013) Response of sweet sorghum after fertigation with sugar mill effluent in two seasons. Sugar Tech 15: 285-299.
  4. CSA (2015) Area and production of major crops. Addis Ababa.
  5. Thimmaiah SK (2002) Effect of salinity on biochemical composition of sorghum (Sorghum bicolor L.) seeds. Indian Journal of Agricultural and Biochemistry 15: 13-15.
  6. Taylor J, Schober TJ, Bean SR (2006) Novel food and non-food uses for sorghum and millets. Journal Cereal Science 44: 252-271.
  7. Olanite JA, Anele UY, Arigbede OM, Jolaosho AO, Onifade OS (2010) Effect of plant spacing and nitrogen fertilizer levels on the growth, dry-matter yield and nutritive quality of columbus grass (Sorghum Almum Stapf) In Southwest Nigeria. Grass Forage Science 65: 369 375.
  8. Mbwika J, Odame H, EN (2011) Feasibility study on striga control in sorghum.
  9. Ashiono GB, Gatuiku S, Mwangi P, Akuja TE (2005) Effects of nitrogen and phosphorus application on growth and yield of dual purpose sorghum in the dry highlands of Kenya. Asian Journal of Plant Sciences 4: 379-382.
  10. Alemu Lelago, Tekalign Mamo, Wassie Haile and Hailu Shiferaw (2016) Assessment and Mapping of Status and Spatial Distribution of Soil Macronutrients in Kambata Tembaro Zone, Southern Ethiopia. Advances in Plants and Agriculture Research 4: 144.
  11. International Food Policy Research Institute (IFPRI) (2010) Fertilizer and Soil Fertility Potential in Ethiopia. IFPRI, Washington DC, USA.
  12. Kehali Jembere, Tekalign Mamo, Kibebew Kibret (2017) Characteristics of agricultural landscape features and local soil fertility management practices in Northwestern Amhara, Ethiopia. Journal of Agronomy 16: 180-195.
  13. Mohammed Kedir, Taye Kufa, Bayu Dume (2021) Assessment of Soil Chemical Properties and Coffee Leaf Analysis in Goma Woreda of Oromia Region. Agriculture, Forestry and Fisheries 10: 93-101.
  14. Benedicta Y, Fosu‑Mensah, Michael Mensah (2016) The effect of phosphorus and nitrogen fertilizers on grain yield, nutrient uptake and use efficiency of two maize (Zea mays L.) varieties under rain fed condition on Haplic Lixisol in the forest‑savannah transition zone of Ghana. Fosu‑Mensah and Mensah Environ Syst Res 5: 22.
  15. SAS Institute, Inc (2012) The SAS System for Window Release 9.3; SAS Institute, Inc. Cary, NC, USA.
  16. Legesse H, Gobeze L (2015) Growth and grain yield response of sorghum (Sorghum Bicolor L. Moench) varieties to moisture conservation practices and NP Fertilizer at moisture stress area of Amaro, Southern Ethiopia. Ashese Journal of Agricultural Science 1: 001-005.
  17. Sebnie W, Mengesha M (2018) Response of nitrogen and phosphorus fertilizer rate for sorghum (Sorghum bicolor L. Moench) production in Wag-Lasta area of Ethiopia. Archives of Agriculture and Environmental Science 3: 180-186.
  18. Bayu W, Rethman NFG, Hammes PS, Alemu G (2006) Effects of Farmyard Manure and Inorganic Fertiliz- ers on Sorghum Growth, Yield, and Nitrogen Use in a Semi-Arid Area of Ethiopia. Journal of Plant Nutrition 29: 391- 407.
  19. Masebo N, Menamo M (2016) The effect of application of different rate of N-P Fertilizers rate on yield and yield components of sorghum (Sorghum Bicolor): Case of Derashe Woreda, Snnpr, Ethiopia. Journal of Natural Sciences Research 6: 88-94.
  20. Ezeaku and Mohammed (2006) Character association and path analysis in grain sorghum. African Journal of Biotechnology 5: 1337-1340.

Detection of Wheat Stem Rust (Puccinia graminis f.sp. tritici) Physiological Races from Major Wheat Producing Regions of Ethiopia

DOI: 10.31038/AFS.2022433

Abstract

Wheat is important crop in globally both in production and productivity. It is sourced as food for global population. Due to un-matched wheat production and population growth it is not able to meet the feed. The low production and productivity it is due to fungal disease specially rust (stem rust) disease. The objective of the experiment was to identify and detect Pgt across surveyed areas. The experiment was conducted in 2019/20 main rainy season East Shewa zone, North Shewa zone and Hadiya Zones which has high wheat production potential with suitability environment for the disease development. A total of fifty five infected wheat stem rust samples were collected from the three regions. Only 35 isolates have given produced infectious pustules. Races: TKTTF, TTKTF, TTTTF, TKPTF, TKKTF and TTKTT have been identified. TTTTF, TKTTF and TKKTF are found at all assessed regions of Ethiopia. The collected samples were analyzed at Ambo Agricultural Research Center (AmARC) laboratory for race identification.

Keywords

Distribution, Cultivars, Diversity, Incidence, Races, Rust and severity

Introduction

Wheat is a cereal grains produced and consumed globally [1]. It is one of strategic crop for food security and a source of livelihood in emerging countries [2]. Wheat also remains a major source of dietary calories and proteins [2]. As a result, yield and its cultivation area of wheat have been increased to contribute to total production increase [3]. Ethiopia is experienced and largest wheat producer in sub-Saharan Africa with about 0.75 million hectare. Ethiopia can produce both bread and durum wheat cultivated in the highlands of the country largely in the areas like North West, East and Central parts [4]. However, the relations of yield and production in Ethiopia were not well understood in quantitative terms. At present, wheat is produced both in rain fed and irrigated conditions with an average yield of 2.764 t/ha in 2019 [5], but the yield is still lower the global wheat production about 3.56 t/ha. Wheat stem rust is the major constraints for wheat production in the world and in the Eastern part of Africa particularly Ethiopia and Kenya. Yield loss of stem rust reaches 100% in conducive environment and susceptible varieties during year of epidemics. Countries such as Kenya and Ethiopia experience recurrent epidemics of stem rust due to evolution of new stem rust races [6]. The alternate hosts of P. graminis include Berberis spp., Mahonia spp., P. recondita and Clematis [7]. The sexual cycle produces a great genetic diversity with a large number of virulence genes [8]. Evidence points to the recombination of wheat stem rust and the scabrum rust (P. graminis f. sp. secalis) [9, 10]. Puccinia graminis tritici, evolves and mutates, the popularly grown wheat varieties remain at constant stake of losing their resistance to break the strongest of resistant genes [11]. The first virulent stem rust race which was designated as Ug99 in Uganda in 1999 has threatened wheat production globally [12]. The emergence of new virulent races in East Africa are continue to pose a threat to global wheat production and food security [13]. Most highlands of Ethiopia are considered as a hot spot for the development of stem rust complex [14]. Stem rust race are dominant and widely distributed in different regions with high frequency [15]. Several historical events were happened in parts of Ethiopia in recent stem rust caused great losses: stem rust epidemics in 1975 on variety Laketch; in 1992/93, on variety Enkoy; in 1994, on variety Kubsa; and, in 2013, on variety Digelu. The epidemics are due to the appearance of new races as a result of mutation and sexual recombination. To minimize the threat of epidemics, it is important to characterize the race composition of the pathogens and the appearance of new races in the Ethiopia. So it is aimed to identify the Puccinia graminis f.sp. tritici physiological races distribution across different areas and identify seedling resistance test.

Materials and Methods

The field assessment was carried out during 2019/20 main cropping season in three major wheat growing areas such as East Shewa zone, North Shewa zone and Hadiya Zones which are selected based on wheat production potential and highly suitable environment for the disease development. During assessment farmer’s field, Farmer’s Training Center (FTC) and agricultural research wheat stations with different crop growth stages based on Zadoks growth stage (0-9) key (Table 1).

Table 1: Agro-ecological descriptions of areas

Zone

Districts Coordinates Altitude (m.a.s.l) Temperature (°C) RF (mm)
N E Min.

Max.

East shewa zone Ada’a

08°44′′

38°58′′ 1950 8°C 28°C

851

Gimbichu

08°58′′

39°06′′ 2450 9°C 29°C

1200

Lume

08°12′′

39°17′′ 1900 9.2°C 29.3°C

951

Hadya zone Lemo

07°30′′

37055′′ 2001 13°C 26°C

1150

Misha

07°56’′

38°52′′ 2143 10.5°C 22.5°C

869

Duna

07°20′′

37°39′′ 2453 12°C 24°C

932

North shewa zone Moret ena Jiru

09°36′′

39°38′′ 2828 6.1°C 24°C

890

Basona werana

10°41′′

39°47′′ 2828 13.5°C 21.5°C

1000

Minjar

08°45′′

39°15′′ 2120 13°C 29°C

854

Stem rust severity and incidence was made at five points along the two diagonals (in an “W” pattern) of the field using 1m x 1m (1m2) quadrant and used to calculate average values. The stem rust incidence was calculated using the number of infected plants and expressed as a percentage of the total number of plants assessed.

formula

The disease severity was measured as a percentage of stem area infected by rust disease according to Modified Cobb’s scale (Figure 1). The severity of the disease was examined on randomly selected five plants in quadrant.

fig 1

Figure 1: Rust severity estimation on leaves and stem of wheat. A. Percentage occupied by uredinia. B. Rust severities by Peterson et al. (1948). Source: Roelfs et al. (1992)

In addition to the disease parameters, agronomic and geographical data were recorded. Data on geographical information including latitude, longitude and elevation of each field were recorded using Garmin 600 model GPS. 

Sample Collection, Isolation and Multiplication of Single-pustules Pathogen

Infected wheat stem sheath and leaf were cut into pieces of 5-10 cm in length using scissors then placed in paper bags. The collected samples were labeled with the zone, district, variety and date of collection then transported to Ambo Agricultural Research Center (AmARC) laboratory for race identification. Sterilized soil composed of three growing Medias; sand, soil and farmyard manure mixed at the ratio of 2:1:1 by volume were used. “McNair” seeds were raised in 5cm diameter pots by spreading the seeds on filter paper in Petri dishes, moisten with water to allow the radicles sprout and sprouted seeds were planted in to growing pots.

Spores collected from rust infected sample after suspension then inoculated onto a week old McNair seedlings [16]. The inoculated seedlings were placed on a table for 30 minutes until the Soltrol evaporate then the seedling is moistened with fine droplets of distilled water and placed in the incubation chamber in a dark at 18-22°C followed by exposure to light for 3-4 hours to facilitate infection. The humidifier switched on for about 1:30 hours, so the seedlings have enough moisture for the whole dark period to condition facilitate the initial infection. Then after, the seedlings were transferred to glass compartments in the greenhouse a temperature of 18-25°C and relative humidity of 60-70%.

Inoculation of Wheat Stem Rust Differential Host Lines

Five seeds of the twenty wheat stem rust differentials with known resistance genes and susceptible variety McNair were grown in 5 cm diameter pots. The required amount 4 mg of spore was prepared in 1ml lightweight mineral oil suspension and inoculated onto a week old seedlings of the differentials. Inoculated plants were moistened with fine droplets of distilled water and placed in an incubation chamber 18-22°C and 98-100% RH. Inoculated seedlings were placed in separate glass compartments greenhouse temperature adjusted with 18°C and 25°C. Natural daylight was supplemented with an additional 4 hrs/day that emitted by cool white fluorescent tubes arranged directly above plants (Figure 2) [7].

fig 2

Figure 2: Picture captured during the sample collection on severely infected wheat varieties

Determination of Stem Rust Races

Seedling infection types (ITs) were scored 14 days after inoculation using 0 to 4 scoring scale described by [17]. The IT readings of 3 (medium-size uredia with/without chlorosis) and 4 (large uredia without chlorosis or necrosis) were regarded as susceptible. Other readings, i.e. 0 (immune or fleck), 1 (small uredia with necrosis) and 2 (small to medium uredia with chlorosis or necrosis) were resistant (Figure 3).

fig 3

Figure 3: Infection types of Pgt and host response. Source: Stackman et al. (1962)

Race identification and designation was done using the North American’s nomenclature system for Pgt and grouped the differential lines into five subsets (Table 2). Each isolate was assigned five letter of designation code of [7]. Based on low IT′s isolate that produces on 20 differential lines; the race was designated with a five letter race code BBBBB. Conversely, an isolate that produces a high IT on the 20 differential lines races coded as TTTTT. If an isolate produces a low IT on Sr31 and Sr24, but high infection type on the remaining 18 differential lines, the race was designated as TTTTF. 

Table 2: North American’s nomenclature system for Pgt differential wheat lines

Wheat Pgt gene differential sets and infection phenotype coding

Set

Differential lines identified by Pgt resistance gene

Set 1

5

21 9e

7b

Set 2

11

6 8a

9g

Set 3

36

9b 30

17

Set 4

9a

9d 10

Tmp

Set 5

24

31 38

McN

gt-code Infection phenotype: High: virulent (susceptible); low=avirulent (resistant).
B

Low

Low Low

Low

C

Low

Low Low

High

D

Low

Low High

Low

F

Low

Low High

High

G

Low

High Low

Low

H

Low

High Low

High

J

Low

High High

Low

K

Low

High High

High

L

High

Low Low

Low

M

High

Low Low

High

N

High

Low High

Low

P

High

Low High

High

Q

High

High Low

Low

R

High

High Low

High

S

High

High High

Low

T

High

High High

High

Source: [7]

Disease Data Collection

Seedling infection types (ITs) data obtained from the race analysis study was used for the identification of races using the North American′s nomenclature system for distribution of Pgt races percentage across the study area (zones), altitude ranges and cultivated varieties was analyzed using descriptive statistics by using Microsoft excel. Infection type data obtained from the seedling resistance analysis of the greenhouse experiment was used to group cultivars under different resistance categories according to [17]. Percentage of durum wheat cultivars having resistant vs. susceptible reaction to selected stem rust races was computed using descriptive statistics in by using Microsoft excel.

Result and Discussion

A total of fifty five infected wheat stem rust samples were collected from the three regions. Of those samples collected, 35 isolates have given produced infectious pustules, but 20 samples didn’t yield viable isolates. Of these isolates, 6 races namely TKTTF, TTKTF, TTTTF, TKPTF, TKKTF and TTKTT were identified (Figure 3). TTTTF, TKTTF and TKKTF are found at all selected regions of Ethiopia while; race TTKTF is only found at North shewa and Hadiya zone of wheat potential production area (Figure 4).

fig 4

Figure 4: Distribution of Puccinia graminis f.sp. tritici races in assessed areas. Prevalence of puccinia graminis f.sp. tritici races

The diversified distributions of races were prevalent at northern shewa. Out of the samples 35 viable stem rust samples collected; TKKTF race is identified from 17 isolates at about 48.57%; while TTTTF is isolated 8 times. This implies that that TKKTF and TTTTF are the dominantly diversified races in the areas. The race variation at different location wheat varieties grown and environmental conditions [16, 18, 19]. TKKTF was identified form Hidase variety which is wiped out by this race in 2017/18. From the study indicated that race TTTTF was the second most diversified races in the study locations. The second most everyday identified races were TTTTF and TKTTF at a rate of 14.81% each. Race TKKTF was found at all surveyed locations except Ada’a district (Table 3).

Table 3: Amount of races isolated from assessed fields related to cultivated varieties

Race

Field inspected Percentage of races

Variety

TKKTF

17

30.91%

Mangudo, Kubsa, Kakaba, Land races and Hidase
TTTTF

8

14.55%

Hidase, Kubsa, Mangudo and Tesfaye
TKTTF

4

7.27%

Mangudo and kubsa
TTKTF

3

5.46%

Kakaba and Kubsa
TTKTT

2

3.64%

Kubsa and Mangudo
TKPTF

1

1.82%

Uknown

Altitudinal Variation Influence on Pgt Races Distribution

Altitudinal ranges have influence on distribution of stem rust races diversity. The result revealed that there are variations in stem rust incidence, severity levels and races as well. Much more in number about 22 races with the percentage of 62.86% were identified from high altitudes ranging from 2300-2863 m.a.s.l, conversely; lower number of races was identified at low altitudes ranging from 1500-2300 m.a.s.l. Wide ranges of incidence 0-100% was recorded at higher altitude between 2300-2863 m.a.s.l while the narrow incidence 20-100% was recorded at low altitude between 1500-2300 m.a.s.l (Table 4).

Table 4: Altitudinal variation influence on Pgt races distribution in 2018/2019

Altitude (m.a.s.l)

No. of identified races Percentage % Incidence range Severity range

Host response

1500-2300

13

37.14% 20-100 5-70

MS-S

2300-2863

22

62.86% 0-100 0-70

MS-S

Mean

17.5

50 0-100 0-70

MS-S

Effect of Growth Stage on Pgt Races Distribution

Wheat stem rust distribution is affected by wheat growth and maturity stage depending on food accumulated and prepared in the host plant. Races about 21 in number were identified were detected at dough full growth stage in enough food accumulated (Table 5). Wider ranges of disease incidence 0-100% were recorded at dough stage, while narrow range disease incidence 15-80% was at milk stage. Higher rust severities were recorded at maturity stage 15-70%, but lower severity 5-40% was at milk stage. This implies that wheat growth and maturity stage have influences on rust epidemics.

Table 5: Effect of growth stage on Pgt races distribution in 2018/2019

Maturity stage

No. of identified races Percentage % Incidence range Severity range

Host response

Milk

9

25.71 15-80 5-40

MS-S

Dough

21

60.00 0-100 0-70

MS-S

Maturity stage

5

14.29 100 15-70

MS-S

Mean

11.67

33.33 0-100 0-70

MS-S

As shown in the graph below more races were detected on kubsa with high percentage record. Races about 14 times were identified sample collected kubsa bread wheat variety. Hidase is one of the popular varieties which is one of the severely infected currently about four races with a percentage of 11.43% (Figure 5) have been recorded on samples collected. One of detected variety is kakaba about 7 races has been identified with percentage of 20%. Among this lesser race about 1 and 2.86% was identified on Tesfaye variety. Mangudo is found to be the second variety infected by nine races with percentage 25.71% among others (Figure 5).

fig 5

Figure 5: Number of races identified and recorded percentage

Summary and Conclusion

Thirty five stem rust isolates were analyzed on twenty stem rust differentials and six stem rust races namely: TKTTF, TTKTF, TTTTF, TKPTF, TKKTF and TTKTT are identified. Race TKPTF was prevailed only at East Shewa zone Ada’a districts, while races TKKTF and TTTTF were dominant isolate from all assessed zones of regions and collected samples which receive the first and second ranks of samples. This implies that TKKTF and TTTTF are the dominantly diversified races at surveyed fields at a rate of 48.15 and 14.55% respectively. Race TKKTF was found at all surveyed locations except Ada’a district. Much more in number about 22 races with the percentage of 62.86% were identified from high altitudes ranging from 2300-2863 m.a.s.l, conversely; lower number of races was identified at low altitudes ranging from 1500-2300 m.a.s.l. Wide ranges of incidence 0-100% was recorded at higher altitude between 2300-2863 m.a.s.l while the narrow incidence 20-100% was recorded at low altitude between 1500-2300 m.a.s.l. In addition to this agro-ecological variation and types of wheat varieties cultivated has greater influence in the presence of races. Survey and surveillance is required to clearly indicate the available Pgt race available in Ethiopia. To develop management methods for each races the breeder is intended to upgrade research on resistance protocols.

Acknowledgment

I would like to thank Ethiopian Institute of Agricultural Research and Debre Zeit Agricultural Research Center for the release of Budget.

Conflict of interest

The author has no declared any conflict of interest

References

  1. Igrejas G, Branlard G (2020) The importance of wheat. In Wheat quality for improving processing and human health.(1-7). Springer, Cham.
  2. Shiferaw B, Smale M, Braun HJ, Duveiller E, Reynolds M, et al. (2013) Crops that feed the world 10. Past successes and future challenges to the role played by wheat in global food security. Food Security5: 291-317.
  3. Tesfaye B, Mesfin K, Tolera A, Gebresilasie H, Gebreyes G, et al. (2019) Some maize agronomic practices in Ethiopia: A review of research experiences and lessons from agronomic panel survey in Oromia and Amhara regions. African journal of agricultural research 14: 1749-1763.
  4. Addis Ababa Chamber of Commerce and Sectoral Associations (AACCSA) (2017) Value chain study on wheat industry in Ethiopia by afro-universal consultant and general trading P.L.C. final report Addis Ababa, January, 2017: 12-59.
  5. CSA (2019) Report on area and production of major crops (For private peasant holding, Meher Season Volume 1). Addis Ababa, Ethiopia: Central Statistical Agency.
  6. Eshete BB (2018) Status and challenges of wheat stem rust (Puccinia graminis F. sp. Tritici) and threats of new races in Ethiopia. Int J For Hortic 4: 22-31.
  7. Jin Y, Szabo LJ, Pretorius ZA, Singh RP, Ward R, et al. (2008) Detection of virulence to resistance gene Sr24 within race TTKS of Puccinia graminis f. sp. tritici. Plant Disease 92: 923-926. [crossref]
  8. Roelfs AP (1992) Rust diseases of wheat: concepts and methods of disease management. Cimmyt.
  9. Burdon JJ, Marshall DR, Luig NH (1981) Isozyme analysis indicates that a virulent cereal rust pathogen is a somatic hybrid. Nat 293: 565-566.
  10. Luig NH, Watson I (1972) The role of wild and cultivated grasses in the hybridization of formae speciales of Puccinia graminisAust J Biol Sci 25: 335-342.
  11. Ambika R, Meenakshi D (2018) Wheat Stem Rust Race Ug99: A Shifting Enemy. Int J Curr Microbiol App Sci 7: 1262-1266.
  12. Pretorius ZA, Singh RP, Wagoire WW, Payne TS (2000) Detection of virulence to wheat stem rust resistance gene Sr31 in Puccinia graminis f. sp. tritici in Uganda. Plant Dis 84: 203. [crossref]
  13. Olivera P, Newcomb M, Szabo LJ, Rouse M, Johnson J, et al. (2015) Phenotypic and genotypic characterization of race TKTTF of Puccinia graminis sp. triticithat caused a wheat stem rust epidemic in southern Ethiopia in 2013–14. Phytopathology 105: 917-928. [crossref]
  14. Abebe T, Woldeab G, Dawit W (2012) Distribution and Physiologic Races of Wheat Stem Rust in Tigray, Ethiopia. Journal of Plant Pathology and Microbiology 3: 142.
  15. Hailu A, Woldeab G, Dawit W, Hailu E (2015) Distribution of wheat stem rust (Puccinia Graminis F. Sp. Tritici) in West and Southwest Shewa Zones and identification of its physiological races. Advances in Crop Science and Technology 3: 189.
  16. Roelfs AP (1992) Rust diseases of wheat: concepts and methods of disease management. Cimmyt.
  17. Stakman EC, Stewart DM, Loegering WQ (1962) Identification of physiologic races of Puccinia graminis var. tritici. Washington: USDA 5-50.
  18. Tesfaye L (2016) Seedling resistance to stem rust (Puccinia graminissp. tritici) and molecular marker analysis of resistance genes in some wheat cultivars. plant 6: 16-23.
  19. Peterson RF, Campbell AB, Hannah AE (1948) A diagrammatic scale for estimating rust intensity of leaves and stem of cereals. Can J Res Sect C 26: 496-500.

Breeding and Culture of Macrobrachium rosenbergii; Giant Freshwater Prawn (Scampi), Practiced along the Coast of Kerala, India

DOI: 10.31038/AFS.2022432

Abstract

The Giant freshwater prawn, Macrobrachium rosenbergii (De Man, 1879), commonly known as Scampi, is one of the most important freshwater prawn species widely cultured in several tropical and sub-tropical countries around the world. It has several attractive attributes as a candidate species viz., fast growth rate, compatibility to grow under poly-/mixed-culture, hardy nature, high market price and demand in both domestic and export markets. Besides, it can also be cultured in low saline brackish water areas (salinity < 10 ppt). It is an indigenous species of India and is naturally occurring in most of the river systems along both coasts of India. It can be cultured alone or with compatible fish species such as Catla (Catla catla) and Rohu (Labeo rohita). It is also a suitable species for incorporating in paddy-cum-fish culture (rice-prawn farming) system. Culture of Scampi can be carried out in earthen ponds, cement tanks and pens.

Keywords

Macrobrachium rosenbergii, Broodstock culture, Seed production, Management

Introduction

The species is characterized by the overlapping of pleura of second abdominal segment over those of first and third segment [1]. It can easily be identified by its large second pair of thoracic legs in male. Rostrum is long and is bent in the middle and upturned distally. The rostral teeth formula is 12-13/11-13 (most common). There are distinct black bands on the dorsal side at the junction of all abdominal segments. In the juveniles, on the lateral sides of the carapace, several horizontal blue/black bands are characteristics of this species (Figure 1) [2-14].

fig 1

Figure 1: External appearance of Macrobrachium rosenbergii

Distribution

Macrobrachium rosenbergii, a tropical species, is widely distributed in the Indo-Pacific region, ranging from the Indus River Delta through India, Shri Lanka, Bangladesh, Myanmar, Malaysia, Thailand, Vietnam, Indonesia and the Philippines, to Australia and New Guinea. Natural distribution of the species is limited to estuarine and freshwater zones of river mouths and backwaters having temperature usually ranging from 25-34°C and salinity from 0-20 ppt. The species is distributed in the lower stretches of most of the river systems of both the coast of India. It has been introduced in many parts of the world for commercial farming [13].

Habit and Habitat

It is benthic in its habit, sluggish by nature and hides under shades and shelters in the shallow areas of rivers, canals, lakes and ponds during day time to avoid direct sunlight and is very active during night time. It moves slowly and continuously and with slight disturbance jerks backwards and retreats. It is omnivorous, becomes cannibalistic when hungry and has territorial instincts [1,10].

Life Cycle

The giant freshwater prawn has five distinct phases in its life cycle: egg, larva (zoea), post-larva, Juvenile and adult. In nature, juvenile to adult stages are spent in freshwater habitat. Attainment of maturity and mating takes place in freshwater/habitat [1,6]. The egg-bearing (berried) females migrates to brackishwater environment for incubation of fertilized eggs and embryonic development. Hatching and growth of larvae through eleven stages, till they metamorphose to post-larvae, takes place in brackishwater environment. The post-larvae/juveniles ascend to the freshwater zones of the rivers, backwaters, lakes, canals, etc., which are subjected to the tidal influence.

Materials and Methods

Hatchery Production of Seed

Good quality seed is the single most critical input in successful prawn farming as the survival, growth and overall production depends on it. Due to the obligatory requirement of brackish water for hatchery operations, most of the prawn hatcheries are located nearer to the coast. Inland hatcheries mostly use diluted brine (concentrated seawater transported from salt-pans) or synthetic salts to prepare artificial brackish water. After the breakthrough in closing the life cycle of the species in captivity by Dr. SW Ling in 1962, several researchers have developed different types of larval rearing techniques for hatchery production of post-larvae (PL). The most widely used method is clear water technique originally developed by AQUACOP [2-5,8].

ICAR-CIFA has developed and standardized a semi-closed two-phase clear water technology for larval rearing of Scampi. In this technique larval rearing is carried out in two phases (9). In the first phase high density (>200-300 larvae/l) rearing is carried out in smaller tanks (500-1000 L) for 10 to 12 days. In second phase low density (50-60 larvae/l) rearing is carried out in larger tanks (>2000 L) till the entire batch metamorphoses to post-larvae (in 20-25 days). During the first phase the larvae are fed exclusively on live feed Artemia nauplii, whereas during the second phase the dominant feed item is the inert feed such as egg custard, while live-feed is a minor component. Water is exchanged at 50% once every alternate day to maintain water quality. This technique is simple to operate and helps in optimum utilization of space and feed and gives good results with PL output of >35/l.

Steps Involved in Establishing a Hatchery

The following section gives a brief account of the steps involved in establishing a Scampi Hatchery.

Site Selection

A careful selection of site is essential for the successful operation of hatchery in a particular locality. It is also equally important to consider the following essential factors to ensure success in achieving the production target.

Climatic Conditions

Temperature is a key environmental factor for successful operation of hatchery as Scampi is a tropical species. Since the optimum temperature range required during seed production is 28-31°C, the hatchery should be located in tropical or sub-tropical zones. Area selected should have temperature near the optimum range over a minimum period of eight months for profitable operation of hatchery. Besides temperature, rainfall, sunlight, humidity and wind speed at the site are also considered before selecting it for hatchery. Areas vulnerable to natural calamities such as floods, cyclones and earthquakes are not suitable for hatchery construction.

Topography

Assessment of transects, evaluation of slope and determination of the most economic way of constructing hatchery are important. Flat or slightly sloping lands are good and slope close to 2% minimizes the construction cost for broodstock ponds associated with hatcheries. In addition, gravity water-filling and draining from the pond becomes cost-effective and easy.

Soil

Soils that sustain biological activities and have water retention capacity apart from structural stability are considered suitable.

Availability of Adequate Freshwater and Seawater

The hatchery site should preferably be near the coastal areas. Seawater used in the hatchery should be free from pollutants. Seawater can be pumped from surface of the sea or estuary during high tide phases through an in situ filter bed [5]. Saltwater also can be drawn from underground source by sinking deep tube-well fitted with suitable pumps. Freshwater can be drawn from a river/canal/shallow groundwater source. Un-contaminated freshwater is essential for hatchery operations, mainly for broodstock management, for diluting seawater (larval medium) and for general use.

Good Physical Access to the Site

Site should have good all-weather approach-road for facilitating easy and low-cost transportation of construction material, pond and hatchery inputs and for marketing seed.

Uninterrupted Power Supply

Adequate power supply is most important consideration during hatchery activity. Therefore the site should have good proximity to uninterrupted power source.

Hatchery Facilities

The following section give a brief account of the facilities required for a Scampi Hatchery:

Hatchery Building

A proper building or shed based on the scale of operation to house the larval rearing tanks, post-larval holding tanks and Artemia tanks is essential for the successful operation of the hatchery. Small hatcheries may be set up in a shed made up of palmyrah trunk and leaves, or a bamboo framework, but large hatcheries are to be constructed in permanent shed. A low-cost permanent shed should have side walls of brick and cement and flooring with proper drainage facility and should have a mix of asbestos- and translucent fibre-sheets fitted over the roof. The translucent sheets meant for good light penetration should cover around 15% of the total roof area. A common drain of around 24’’ to 30’’ wide and 15’’ to 20’’ deep may be constructed to drain water from all the tanks by gravity.

Water Storage Tanks

Separate cement tanks for storing seawater, freshwater and mixed water (larval rearing water) are required. The tanks for the first two types of water may be constructed outside the hatchery shed, whereas the tank(s) for larval rearing water (salinity 12 ppt) are better located either under a temporary shed or even inside the hatchery proper (in small hatchery) to get water of ambient temperature in the larval rearing tanks. The size and capacity of above three types of tanks will depend on the overall production capacity of the hatchery. Huge quantity of larval rearing water is normally required in a flow through hatchery. Larval rearing medium of about 12-times the total volume of rearing tanks are required for each seed production cycle. The hatchery should have water storage facility of at least 3-times the volume of its larval rearing tanks to allow for adequate water storage, treatment and mixing time for preparation of larval medium. To minimize the costs, tanks are better constructed at ground-level and provision for pumping the water at required place should be made.

Broodstock Holding Unit

Broodstok holding facility may comprise of FRP or cement tanks, the size depends on the capacity of hatchery. These tanks inside the hatchery are for keeping both mature male and female prawns for breeding and for final maturation of eggs, or keeping berried females collected from the wild/grow-out facilities for acclimatization to hatchery conditions. This facility should be separate and away from the larval rearing unit as prawns collected from outside may be infected and need to be given prophylactic treatments.

Larval Rearing Unit

Larval rearing unit should be established as a separate unit so that it is safe and free from any likely outside infection. In large hatcheries, several such small units may be established instead of making a single very large unit to prevent spreading of infection. Larval rearing unit may comprise of large number of tanks made up of FRP, ferro-cement, or cement. Tanks can be circular, rectangular or cylindrico-conical in shape. Usually rectangular tanks of 2 to 10 t capacity are preferred. All right-angled corners should be rounded off to facilitate cleaning and to prevent algal growth. The tank bottom should preferably be ‘U-shaped’ and have sufficient slope so as to drain completely. The interior of the tanks should be painted with several layers of dark coloured pure epoxy resin to prevent leaching of toxic chemicals and to provide smooth surface. The depth of the tanks should be approximately 1.0 m and the water column not more than 0.9 m. The number of larval rearing tanks (LRTs) depends on the hatchery capacity.Tanks should be provided with vigourous aeration from a grid of air-blowers and pipes. The air-stones of all the aeration points should be close to the tank bottom. The tanks should have provision for inlets to receive larval rearing water through pipeline from the larval water storage tanks [6,7,11].

Post-larval Holding Tanks

Rectangular cement or concrete tanks of 2 to 10 t capacity are suitable for holding post-larvae till disposal. The number of such tanks depends on the hatchery capacity. Post-larval Rearing Tanks (PLRTs) also can function as broodstock holding tank. These tanks are better placed outside the main hatchery building to reduce and offset the construction cost, but should be provided all around with green shade-netting (commonly used in green-houses) and covered over a pipe framework fitted at a height of approximately 8-10 feet. Such arrangement will keep tank water free from algal growth and also from dust. The tanks should be provided with separate inlets for freshwater supply and an aeration system.

Artemia Cysts Hatching Tanks

Artemia or Brine Shrimp cysts are a source of pathogens and hence there should be a separate unit for their hatching. The size of the tanks depend on the overall requirement of Artemia nauplii (AN) per day in the hatchery. Cylindro-conical shaped tanks are better from operational point of view. They should have transparent bottom where nauplii could be easily attracted by artificial light (lamp) and drained from bottom outlet. Cylindrico-conical fibreglass reinforced plastic tanks of 100 to 500 litre capacity with a central drain and water control structure can be used as Artemia cysts hatching tanks.

Aeration System

A reliable 24-hour oil-free aeration system is essential for hatchery in order to maintain dissolved oxygen levels in excess of 5 ppm in various units of the hatchery. The air supply is essential in all the tanks used for broodstock holding, hatching, larval rearing, post-larval rearing and Artemia hatching. Although majority of the units require mild aeration, it should be vigorous or rather bumping particularly in larval rearing and Artemia hatching tanks. Three-phase electrically operated air-blowers both roots-type and fan-type can be used but fantype provide better aeration and create relatively less noise. Diesel operated air-blowers could also be used where power supply is either not available or there is frequent failure. The capacity of air-blower should depend on the overall requirement of air in different units or the size of the hatchery. A 200 CFM (5.66 m3/minute) air-blower is sufficient to supply air for a hatchery capable of producing 20 million post-larvae/year. The air-blower or a set of air-blowers should be used at a stretch for a maximum period of 8 hours and switched off, followed by supply from a second set of similar blowers. This practice reduces losses from early wear and tear and avoids sudden aeration failure in the hatchery. The aeration pipeline grid should be installed in such a way and place that it cannot breakdown due to movement of people and other hatchery items. It is better to arrange pipelines overhead and each tank may be provided separate pipeline of smaller diameter pipe of 0.5 to 1.0 inch PVC pipe (dropping from the main pipeline). Each dropping pipeline in turn ought to be provided with small holes for fixing plastic joints and fixing aeration tubings of 1/8 inch diameter, which are provided with air-stones and dropped into the tanks for aeration.

Water Supply System

A separate pipeline both for freshwater and larval-rearing water is essential in the hatchery. Freshwater is required in almost all the hatchery sections, i.e. broodstock holding tanks, hatching tanks, larval-rearing tanks and post-larval tanks for use as media and also for washing the tanks, whereas, larval-rearing water of 12 ppt salinity is required only in the larval tanks (LRTs). Accordingly, separate pipeline for both types of waters would be required with provision for separate inlet near one side of the tank. The pipeline and all other fittings including ball valves should be made up of PVC rigid pipe as metal pipes and fittings are likely to be corroded by saline water and leaching of metal ions may take place in the tanks which may harm the prawn larvae.The diameter of water pipeline shall depend on the volume of water required every day in the hatchery. As a thumb rule, initially from pump side, it may start with 3-6 inch diameter pipe and subsequently reduced to 1-2 inches at the tank inlet. Complete pipe line is to be laid inside the hatchery building so that temperature fluctuations are minimized.The water system is simple and all the storage tanks should be sufficiently elevated above the larval rearing tanks (LRTs) so that brackish water can be introduced by gravity.

Power Back-up System

The hatchery needs round the clock power supply for the operation of aeration and water grids. Power breakdown even for a short duration may cause mortality of hatchery live-stock. Therefore, a back-up power system of sufficient capacity is essential for the hatchery. The diesel generators can support power back-up for sufficient duration. The generators are to be installed at a suitable place slightly away from the main hatchery building to minimize sound and air pollution.

Laboratory

A small laboratory, having working platform for keeping equipment/chemicals/glassware/plasticware, should be established possibly within the main hatchery building for easy approach. The laboratory should be provided with necessary equipment and facilities like refrigerator, salinity refractometer, pH meter, dissolved oxygen (DO) meter, weighing scales (chemical/digital/dial/spring balances), hand lens, different types of microscopes (field/dissection/low-power binocular/compound), pressure cooker, mixie, necessary glassware, plastic-ware and chemicals for estimation of DO, hardness, alkalinity, etc.

Broodstock Management

Scampi broodstock may be procured both from wild and grow-out ponds, in later case, care should be taken that the stock is not under severe inbreeding depression. Raising healthy brooders in the close vicinity or at the hatchery site is ideal. If reared at the hatchery site, the stocking density should be <10,000/ha. Half of the feed ration may be substituted with the equivalent amount of pieces of fresh feeds, such as mussels flesh, cut to the appropriate size, at least twice per week. 1 kg of wet feed is roughly equivalent to 200 g of pellet diet. The feed ration should be given in two equal portions, normally early in the morning and late evening. The pond water should maintain optimum water conditions with partial exchange (30-40%) every fortnightly in case of earthen ponds.

Only berried females in an advance stage of egg-incubation (those carrying grey egg-mass) should be brought to the hatchery for hatching eggs so as to minimize cost of maintenance at the brood holding tanks. The berried females having entire egg mass should be selected and stocked in these tanks .The size of the brood prawn should preferably be 60-100 g in weight. It should be apparently healthy and free from diseases particularly from epibiont fouling, lesions, spots, infected appendages, etc. Brooders should be procured and transported with utmost care so that it does not lead to injury and loss of egg mass. Transport of berried females over shorter duration can be undertaken in buckets or tubs containing water of the same pond. For two to three hours journeys, the broodstock can be transported in open containers having water of the same pond along with some aquatic weeds. The container(s) may be provided aeration from a battery operated portable aerator. For long distance transportation (>12 hours), brooders may be packed in 9 inches (23 cm) long 50 mm dia slotted PVC pipes, tide on both ends with meshed cloth. 3-5 such pipes may then be kept in one polythene bag having 5-6 litre of water and packed with oxygen and transported in a carton. It is recommended to transport the bags in insulated containers to avoid temperature fluctuations and movement. The temperature should be maintained at 25-27°C. The rostrum of each prawn should be blunted with scissors or a rubber cap should be placed on it so that the polythene bag does not get punctured. For transporting in PVC tanks with aeration, a maximum stocking rate of one prawn per 40 litre of water should be maintained.

The berried females should be handled with utmost care after their arrival in the hatchery and also while shifting from one tank to the other. The female should be caught under water using a bucket and keep them immersed in water while shifting to the other tanks. Catching with hands or scoop net result in shedding of egg mass and injury to the female and hence poor hatching performance. The female should be disinfected with formalin (@ 50 ppm) under vigorous aeration for 8-10 hours followed by complete change of tank water for the control of epizoan parasites before putting them in the hatching tank.

Hatchery Operation

Operation of hatchery involves different activities starting from preparation of water till post-larval disposal. The following section briefly describes the steps involved in hatchery operation.

Preparation of Larval Rearing Water

Seawater for larval rearing should preferably be collected from a sea coast having little pollution impact. For transportation of seawater, plastic barrels or FRP tanks are desirable. Transporting by truck-tankers having tank made up of iron may increase iron contents in the water and hence should be avoided. Seawater need to be disinfected for probable pathogens by active chlorine and potassium permanganate @ 5 ppm and 2 ppm respectively after shifting into the treatment tanks under vigorous aeration. Good quality freshwater is also required for preparing larval rearing water of 12-13 ppt salinity from seawater. The prepared mixed water should be disinfected with active chlorine @ 5 ppm under vigorous aeration for at least for 48 hours and the residual chlorine may be removed by adding sodium thiosulphate. The water should then be filtered with 5µ bolting silk cloth bag and used in the larval rearing tanks.

Larval Production and Rearing

The usual practice followed in most commercial hatcheries is stocking a large number of berried females of similar egg colour for hatching in a large tank. However, this is unsafe for many reasons particularly heterogenous size of larvae (zoea), disease spreading, mixing of healthy and unhealthy larvae that would cause problems at later stages. Hence only few berried females required to supply enough larvae for larval rearing tanks should be kept in each hatching tank for minimising chances of spreading pathogens and for production of healthy batch of larvae [11,12].

Hatching tanks should be provided aeration round the clock. Hatching generally takes place in the night and hence freshly hatched larvae (length about 2 mm) are to be harvested as soon as possible through siphoning as the female may consume them if kept for prolong period. Fresh or low salinity water (salinity 3-4 ppt) having pH below 8.3 and temperature 28-3°C should be used in these tanks. The larvae should be disinfected with 15 ppm formalin for 5-10 minutes before shifting to larval rearing tanks.

Larval rearing tanks (LRTs) should be thoroughly cleaned and disinfected with bleaching powder at least two days prior to larvae stocking. The tanks are filled with filtered larval water (salinity 1213 ppt) prepared at least 48 hours before use preferably in indoor conditions of the hatchery. The tanks should be provided with vigorous aeration throughout the tank area and care should be taken to minimize dead ends. This practice helps in uniform circulation of food particles in the tank for easy feeding by the larvae as well as to reduce larval cannibalism due to continuous movement. The stocking density of larvae in the tanks will depend on the rearing methodology adopted. In single stocking method in which zoea larvae are reared to post-larvae, they are stocked at 50-60/litre; in two-phase stocking method, initial larval stocking density is 100 larvae/litre, which is reduced to 50-60/litre, by thinning/shifting, when they reach Stage-V Zoea. Freshly hatched Artemia nauplii (AN) should be fed all the time to all the eleven Zoea Stages (I-XI); however, feeding exclusively nauplii may be cut down after Stage-V Zoea, when egg custard is incorporated in the diet. The quantity of Artemia nauplii and egg custard should be given according to the area of the tank and not by the number of larvae being reared. This is essential because the larvae prey on the food by touching and not by seeing.

The larval tanks should be cleaned daily to remove accumulated debris, left over feed and faecal matter through siphoning. Around 50% of the tank water should be replaced with fresh larval water after cleaning. The larval tanks may be provided with 5-10 g of EDTA (Ethylene diamine tetra acetic acid) per tonne of water for chelation of heavy metals after every 3-5 days. Antibiotics should not be used in the larval tanks and instead use of probiotics is considered ideal. Both live and formulated diets are used in the hatchery for feeding larvae and post-larvae. The live feed used in prawn hatchery are Artemia nauplii and Moina macrura. The later is used only in few hatcheries, where it is cultured in the pure form separately. The formulated diet comprises of egg custard.

Preparation of Live Feed (Artemia nauplii)

Artemia, commonly known as Brine Shrimp, is a small crustacean living in salt pans and high saline water bodies. During unfavourable conditions they produce hard shelled cysts (fertilized eggs). These cysts hatch when provided with favourable conditions. Newly hatched microscopic free-swimming larvae are called nauplii. They form a highly nutritious live diet containing more than 50% crude protein and 12% lipid. The size of nauplii is important for proper use in the larval tanks. Nauplii of Artemia salina of San Francisco Bay and Great Salt Lake (USA) are comparatively very small (~400 µm in length) and considered best for use in the prawn hatchery. Artemia cysts are sold in the market in tin packs of generally one pound weight (454 g). Based on the hatching rates, it is categorized generally into three qualities ranging from 70-95%. Better the hatching rates, less the chances of contamination. Artemia cyst tins are to be stored in deep freezer immediately after the procurement otherwise its nutritional and hatching quality get deteriorated.

Artemia cysts are usually contaminated with bacteria, fungal spores, other micro-organisms and organic impurities that may infect the water of larval rearing tanks if not treated properly. Hence, cysts need to be disinfected before stocking for hatching. The disinfection eliminates the chances of infection. The number of Artemia per unit weight depends on the type of artemia. On an average, Artemia of Great Salt Lake may yield 2.7 lakh and that of San Francisco Bay 3.2 lakh nauplii per gram weight. Find out the hatching rate of Artemia from instructions written on the tin for the first time and subsequently after observing the hatching percentage by manual counting. The Artemia cysts are stocked in the hatching tanks @ 2 g/l seawater, where they hatch out between 12-24 hours. After harvesting, nauplii need to be acclimatized to the salinity of larval rearing water by gradually mixing freshwater. The nauplii should also be treated with 15 ppm formalin for disinfection. Freshly hatched nauplii are to be fed to the prawn larvae as they are rich in nutritional contents in the beginning which gradually reduces with time.

Artemia Enrichment

The nutritional quality and physical size of nauplii vary enormously from source to source and even between individual batches from a single source. Of particular importance is the level of essential polyunsaturated fatty acids, eicosapentaenoic acid (EPA, 20:5n-3) and docosahexaenoic acid (DHA, 22:6n-3), which depends on the composition of primary food available to the brine shrimp in the locations where they originate and is generally found low. In order to provide sufficient quantity of these essential fatty acids, the nauplii are to be enriched with both EPA and DHA. There are various enrichment products available in the market, such as Super Selco, DHA Selco (INVE, Aquaculture), Super artemia (Catvis BV., 5222 AE, Netherland), Super HUFA (Salt Creek Inc, USA), Algamac-2000, Algamac-3050 (Biomarine Inc., USA). The methodology for enrichment is provided with these products.

Egg Custard

Egg custard is provided to advanced larvae (Zoea Stage-V and above). A good quality egg custard can be prepared by mixing whole egg, skimmed milk powder, corn flour/wheat flour, mussel/shrimp/prawn/squid meat, yeast, agar, cod liver oil and vitamin-mineral mixture. All the ingredients are blended in a mixer-grinder and cooked under steam in a pressure cooker for maximum of 15-20 minutes. It should not be over cooked as it will lose its flavour and nutritional quality. The egg custard should be used within 4-5 days of its preparation and the left over portion to be kept in a refrigerator. A measured quantity of egg custard is seived through strainers of different mesh sizes.

The mesh of sieve may be selected from fine to coarse depending on the mouth size of the larvae. Smaller larvae need smaller particles whereas larger larvae require bigger particles of egg custard and accordingly selection of sieve is done. The egg custard is then pressed through the sieve held in some water, just sufficient to accommodate the sieve mesh. Water is then drained leaving particles of egg custard in the container. The particulated custard is again washed with freshwater so that finer particles are drained off completely. Vitamin-mineral mixture is added to the egg custard mash and feed to prawn larvae. Egg custard should be fed 3-4 times during day time and left over particles should be drained out in the evening so that they do not foul the water during long stay in the tank.

Collection of Post-larvae from Larval Tanks

The first post-larva (PL) could be seen in the tank (LRT) after around 18 days of rearing; however, majority of them appear after 25 days depending on the water temperature. When sufficient numbers of Zoea Stage-XI larvae (say 40%) metamorphose to post-larvae they should be harvested and stocked in the post-larval tanks. Delay in harvesting results in cannibalism of the larvae by the post-larvae which are highly cannibalistic in nature. Post-larvae have to be harvested from the larval rearing tanks whenever sufficient numbers appear in LRTs. For collection of postlarvae from the larval tanks, aeration in the larval tanks is to be stopped. By doing this, all the larvae will come to the surface and post-larvae being photo-negative will settle at the bottom from where they could be siphoned out with the help of a flexible tubing. Post-larvae have to be checked for any probable infection at the time of harvesting and if stock is found free from any infection, they should be released in the post-larval tanks. After harvesting from the larval tanks, the postlarvae need to be acclimatized to freshwater conditions gradually.

Post larvae (PLs) should be reared in freshwater tanks (PLRTs) till they attain the desired size/age. They may be fed on commercial prawn starter diet specially prepared for them. Around 50% tank water is to be changed daily and all leftover feed, faecal matter and debris to be removed at the same time. The growth of post-larvae may be checked by observing their moulting on a regular basis. Harvesting of post-larvae should be done when they attain the desired size in terms of length. The post-larvae of size above 10 mm is considered ideal for harvesting and stocking in the nursery ponds. The seed of more or less same size should be supplied for stocking in the nursery pond. Post-larvae can be packed in polythene bags containing 4-5 litre water and oxygen and kept in cardboard cartons for transport. For long distance transportation of >12 hours, a sachet of cooling gel is placed in each seed pack container for maintaining temperature.

Hatchery Hygiene and Prophylactics

Prawn larvae are highly susceptible to pathogens and lot of mortalities are often observed in the hatcheries.

Therefore, strict surveillance is needed to avoid entry of pathogens that come both from outside and inside. As a first and foremost control measures, the entry of people in the hatchery should be restricted only to the workers of the hatchery. Soak pits to be constructed at all the entry points which are cleaned daily and filled with water containing disinfectants like bleaching powder. Similarly, wash basins containing sanitizers should also be available at the entry points. Everyone should wash their hands and feet before entering the hatchery. Lot of tools like hapa, hand nets, sieves, cloth pieces, etc, which are used in the hatchery tanks should be washed and disinfected before using in other tanks. The entry of such items should be limited to one unit of the hatchery only and should not be allowed to be used in the other unit. All the tanks of the hatchery should be washed before and after use with clean freshwater and disinfected with bleaching powder or iodophor substances. The components and equipment used in the hatchery should be washed and disinfected after every use.

V.Grow-out Culture

Scampi can be cultured either alone (mono culture) or in combination with compatible fishes like Carps, Tilapia, etc (polyculture). Culture can be carried out by direct stocking of post-lavae or stocking juveniles after a nursery phase of 45-60 days. Incorporating a nursery phase has shown improved survival and production during grow-out culture (Figure 2).

fig 2

Figure 2: Grow out culture ponds with paddle wheel aerators

Nursery Phase

Nursery is the intermediate phase between hatchery and grow-out of freshwater prawn. It involves rearing of the delicate 25-day or older post-larvae (10-20 mm), obtained from hatcheries, in well prepared earthen ponds (0.01 to 0.1 ha) or concrete tanks for a period ranging from 45-60 days till they grow to juveniles (1-2 g). Stocking density ranges from 20 to 50/m2. Higher stocking densities would require aeration or water exchange. Stocking nursery reared larger juvenile prawns in grow-out ponds gives better yield and predictable production than direct stocking of post-larvae. Hence nursery rearing phase is always recommended prior to grow-out culture. Pond preparation and management are similar to that of grow-out ponds except that hide-outs are not provided in nursery ponds. Floating aquatic plants such as Eichhornia sp. may be introduced in a floating bamboo or PVC frame to cover 5-10% of pond surface area. The dense root system of these plants provides shade, shelter and food to growing post-larvae. Good quality commercial pellet feed (Starter-I) is recommended for feeding the post- larvae twice daily. If it is not available, then powdered oilcake and ricebran mixture can also be fed to post-larvae at 100% biomass per day for the first 10 days and slowly reducing the quantity as the prawns grow. Survival rates of 75 to 80% can be achieved during nursery phase under good management practices.

Grow-out Phase

Grow-out phase follows nursery phase where the juveniles harvested from nursery ponds are stocked in well prepared earthen grow-out ponds at a stocking density of 3/m2. As stocking density shows a strong negative relationship with growth, lower stocking densities are preferred if the farmer wishes to harvest larger prawns. Higher stocking densities (>5/m2) will lead to smaller prawns at harvest. The prawns are fed daily with formulated pellet diet (2-3 mm) at 10% of the biomass initially and then reduced to 3% of the biomass at the end of culture period. Monitoring important water quality parameters such as dissolved oxygen, pH and temperature is recommended to prevent loss of stock due to poor water quality. Regular monthly sampling needs to be carried out to assess the growth and health of the prawns as well as to revise the feed ration. After four months, marketable size prawns (>40 g) may be harvested by using large mesh net and this selective harvesting should continue once every 3-4 weeks for another 3-4 months and finally the prawns can be harvested by completely dewatering the pond.

Site Selection

The selected site should have warm climate for nearly 6-8 months (temperature >20°C). It should have a supply of good quality, pollution free freshwater or brackish water (<7 ppt) for at least 6 months. It should have soil with good water retention capacity.

Pond Construction

  • Ponds should preferably be embankment-type that can be fully drained by gravity.
  • Ponds should have an inlet and outlet.
  • Pond bottom should have a gradient/slope (1:200) towards the outlet.
  • Pond bund should have a suitable slope (1:2, 1:3).
  • Water control structure should be installed at inlet and outlet to aid water exchange.
  • Pond size – 0.2 to 1.0 ha (preferably 0.2-0.5 ha).
  • Rectangular shaped ponds with the long axis oriented in the direction of prevailing wind are most suitable.
  • Soil – clayey loam, sandy loam. Depth – 2 m.

Eradication of Competitors and Predators

  • This step may not be necessary in newly constructed ponds but in old ponds, all unwanted species such as predatory fishes, weed fishes and aquatic weeds should be removed.
  • Drying and exposing the pond bottom until cracks developed is the best way of eradicating predators and competitors.
  • Drying and exposing the pond bottom also kill pathogenic microbes and helps in oxidizing the pond bottom.
  • Poisons of plant origin such as mahua oil cake, tea seed cake or derris root powder may be applied in un-drainable ponds to kill predators and unwanted fishes.

Liming

  • Liming is an important step in pond preparation and is done after drying the pond by spreading the lime uniformly on the pond bottom.
  • The rate of application varies with soil pH; to a pond having soil pH above 6 agricultural lime (Calcium carbonate) is applied @ 200250 kg/ha.
  • Application of lime helps to correct pH; increases the buffering capacity of water; disinfects the pond bottom as well as acts as a source of calcium which is important for exoskeleton formation in prawns.

Fertilization

  • After liming, the pond is filled with water up to 1-2 feet and manure or fertilizers are applied for development of plankton.
  • Surface waters from rivers, canals or reservoirs or groundwater from bore-well may be used for culturing freshwater prawns.
  • A fine-mesh net should be used to screen the inlet water to prevent entry of eggs and larvae of predatory and weed fishes that may colonize the pond and lead to poor growth and survival of the stocked prawn juveniles.
  • Cow dung @1000 kg/ha or poultry manure @500 kg/ha and super phosphate @100 kg/ha may be applied to initiate plankton development.
  • The pond can be filled up to the desired level (4-5 feet) after initial manuring.
  • Manures or fertilizers helps in development of phytoplankton which in turn prevents development of benthic algae and rooted vegetation.
  • It also helps in development of bottom living animals on which the prawn feeds.

Provision of Hideout and Bird Netting

  • Prawn needs shelter/hideout during moulting to avoid predation by other prawns. Hence cut branches of trees, nylon screen, earthen pipes etc can be provided as hideout. Hideout materials also provide more surface area for the prawns.
  • Birds are one of the major predators and can cause significant reduction in survival, so tying nylon ropes or large mesh gill net above the water surface provide some protection from bird predation.

Stocking the Pond

  • Ponds can be stocked with post-larvae or juveniles after preparing and laying hideouts.
  • Prawn seed from hatchery needs to be acclimatized at the farm site by floating the transport bag in the pond for 15 minutes. After opening the bag, pond water should be allowed to flow into the bag and post-larvae/juveniles should be slowly released into the pond.
  • Stocking should be done early morning or late evening which is the ideal period.
  • A stocking density of 3/m2 is desirable, which however may be reduced to 50% in polyculture pond with compatible fish species such as Catla, Rohu, Silver Carp and Grass Carp.

Water Quality Management

  • Visibility/transparency and colour of the pond is an important indicator of the health of pond ecosystem. In unproductive ponds the visibility can be up to the bottom which will lead to growth of bottom algae that adversely affect the growth and survival of prawns. Low visibility (<10 cm) indicate high blooming or turbidity that could cause problem of oxygen depletion and mortality of stocks. Ideally, the visibility should be maintained in the range of 30-40 cm to avoid water quality deterioration.
  • Daily monitoring of water quality parameters such as dissolved oxygen, pH and temperature is recommended to prevent loss of stock due to poor water quality. Loss of prawn is usually associated with low dissolved oxygen level in the pond. Therefore it is essential to maintain dissolved oxygen at optimum level of >4 ppm at all times. Provision of aerators (paddle wheel or any other such devices) is recommended especially during the final 2-3 months when the biomass in the pond is high. When the oxygen level in the pond is critically low, the prawns come to the surface along the periphery which indicates the need for taking immediate remedial measures such as water exchange or operation of aerators to avoid mortality of stock.
  • Water should be free of pollutants and toxic chemicals and the optimum ranges for a few most important water quality parameters for freshwater prawn culture are as follows (Table 1)

Table 1: Optimum Water Quality Parameters for Scampi Farming

Water Parameter

Optimum Range

Temperature (°C) 28-31
Salinity (ppt) Freshwater/low-saline (<7 ppt)
pH 7.0-8.5
Dissolved Oxygen (ppm) >4.0
Total Hardness (ppm) 40-100

Feed Management

  • Freshwater prawns are omnivorous and feed on both animal and plant materials, found on the pond bottom, such as algae, aquatic insects and their larvae, worms, crustaceans, small mollusks, etc.
  • Farmers may use commercial pellet feed having good water stability or farm made feed. Most commonly used ingredients for farm made feed includes ricebran, broken rice, groundnut oil cake, tapioca powder, fishmeal, apple-snail meat, etc.
  • Prawns are fed daily at 25% of the biomass during the first two months which is gradually reduced to 3% of the biomass at the end of culture period.
  • Although feed is usually broadcasted around the periphery of the pond in shallow area, providing of feed in checktrays kept in different areas of the pond will help in determining the quantum of feed required per day.
  • Feeding should be done during late evening or early morning since prawns are more active during night time.
  • Feed rate should be revised once every three weeks depending on the average body weight obtained during monthly sampling. Weight dependent feeding rates is given in table as follows (Table 2)
  • Regular sampling of prawns using cast net or small mesh seine net at 3-4 week interval is essential to assess the growth of prawns. Feed rate is revised after every sampling based on the body weight and estimated biomass in the pond.

Table 2: Optimum Feeding Rate for Scampi in Grow-out Pond

Body Weight of Prawns (g)

Feeding Rate (% Prawn Biomass)

< 2

> 25
2-5

10

5-10

8
10-15

6

15-20

4
20-25

2.5

25-30

2
> 30

1

Health Management

  • Diseases in freshwater prawn grow-out culture are usually found to be associated with poor rearing conditions (over-feeding, water shortage, silting etc).
  • Bacteria and fungus are the most common disease causing organisms. Loss of appendages, brown or black colouration of exoskeleton, fouling on the body are some of the symptoms seen in diseased prawns.
  • If disease symptoms are noted, water should be replaced, water quality should be tested and necessary steps should be taken. Immediate consultation of experts will help in avoiding loss of stock due to diseases.
  • Following good rearing practices mentioned below will help avoid diseases to a great extent:

– Use good quality seed and avoid high density stocking.

– Use good quality pellet feed, monitor the feeding using check-tray and avoid overfeeding.

– Dry out the ponds between production cycles so that the pond bed can be reoxidized.

– Water exchange (30-50%) helps in rinsing the pond and induces moulting.

– Regular monitoring of water quality especially dissolved oxygen is essential.

Yield and Production Cost

  • Good quality post-larvae stocked at moderate density 3/m2 and fed with good quality pellet diet will grow to an average size of 50-60 g in 6-8 months.
  • Periodic harvesting of prawn is always suggested due to heterogeneous growth among prawns. Large prawns (>40 g) may be harvested using seine net of suitable mesh size after four months of culture, which should continue once every 3-4 weeks thereafter for the next 3-4 months.
  • Final harvesting of the prawns may be done after 8 months of culture by complete dewatering and the pond should be freshly prepared for the next production cycle.
  • A survival rate of 65 to 70% is expected and prawn yield may range from 800 to 1000 kg/ha (320 to 400 kg/acre).
  • The cost of production per kg of prawn may range from Rs.150 to Rs.175/-. Major components of cost of production include cost of seed, pellet feed, energy and labour (Figure 3).

fig 3

Figure 3: Post-harvest quality Macrobrachium rosenbergii brooders

Post-harvest Handling

  • Processing yield (tail weight percentage) of freshwater prawns (<50%) is less than that of marine shrimps (>60%) and decreases with the increase in size of the prawn and is better for females than males.
  • Prawns are sold either head-on or head-less. Sometimes they are sold live also. Ice-chilled uncooked prawns have a short shelf life (3 days) before they become mushy. ‘Kill chilling’ by dipping prawns in iced water prior to blanching at 65°C for 15-20 sec before icing for transport to market, significantly improves quality.
  • Usually harvested prawns are washed and iced immediately to prevent quality deterioration. In the processing plants they are removed from ice and washed again. The washed and drained prawns are weighed and sent for de-heading.
  • The iced headless prawns are then size-graded by weight.
  • After size-grading the product then goes for further value addition according to the requirement of the buyer, such as ‘peeled and deveined’ (PD) and ‘peeled deveined tail-on’ (PDTO). Most of the Giant Freshwater Prawn farmed in India is exported in a headless tail-on style.
  • Prawns are either bulk frozen or individually quick frozen at -40°C. Packed material is finally stored at -20°C.
  • Removal of head and intensive washing decreases initial microbial load and improves the post-storage quality of prawns which can be stored frozen for up to six months without any deterioration of flavour.

Results and Discussion

Constraints – Pitfalls and Precautions

  • The major problem during freshwater prawn culture is size heterogeneity in harvested crop, which demands additional effort to market them.
  • Tail yield of freshwater prawns (40-50%) is less than that of marine shrimp (60%)and freshwater prawns require more care in processing than marine shrimp.
  • There are reports of reduced growth rate in grow-out phase from some parts of India which has been attributed to ‘inbreeding depression’.
  • Freshwater prawns are very sensitive to low dissolved oxygen levels and mortality of stock due to low levels of oxygen in the pond is one of the major reasons of low yield.
  • Body weight of this prawn shows a very strong negative relationship with stocking density. Therefore, this species cannot be stocked at higher densities and moreover the price is sizedependent.
  • Low seed quality from hatcheries has resulted in low production.

Polyculture

  • Freshwater prawns can be easily integrated with existing carp culture bringing additional income to farmers without much additional cost.
  • Macrobrachium rosenbergii (Scampi) can be cultured with compatible fish species such as Catla (Catla catla), Rohu (Labeo rohita), Silver Carp (Hypophthalmichthys molitrix) and Tilapia.
  • Polyculture of carp and prawn has the advantage that both prawn and carp can utilize different food niches in the pond efficiently.
  • Polyculture of prawn without bottom feeders like Common Carp and Mrigal allows the prawns to obtain their share of the pellet feed that will sink to the bottom. In addition, it allows the prawn to graze on bacterial films on the bottom substrate which results in better growth performance of prawn. Further, polyculture improves the ecological balance of the pond water, preventing the formation of massive algal blooms.
  • Polyculture of Scampi can be carried out in earthen ponds and pens of varying sizes.
  • Stocking size of prawn should preferably be 2-5 g for better yield and income.
  • Stocking density of prawn recommended in polyculture range from 10,000 to 15,000/ha or 1 -1.5/m2 and that of fish range from 6,000 to 8,000/ha.
  • Fish can be fed with traditional feed (mash feed of ricebran and oilcake) or floating pellet feed. The prawns need not be fed separately as they will consume the left over feed that finally sink to the pond bottom.
  • Monitoring of important water quality parameters such as dissolved oxygen, pH and temperature is recommended to prevent loss of stock due to poor water quality especially during last 3 to 4 months of culture.
  • After four months, marketable size prawns (>40 g) may be harvested by using large mesh cast net or bag net and this selective harvesting can be continued once every 3-4 weeks for another 3-4 months.
  • Fish can be harvested by netting after 8-10 months and finally the prawns can be harvested by complete dewatering.
  • At 8,000/ha stocking density the average final size of fish after 10 months of culture would range from 800 g, to 1 kg at a survival rate of 70-75%. The expected production of fish would be 5,000 kg/ha.
  • At 1/m2 stocking density the average final size of Scampi after 8 months of culture would be 50 to 80 g if good quality scampi seed are used. Final survival rate of 60 to 70% is expected and the production of Scampi may range from 480 to 600 kg/ha (200 to 250 kg/acre).

Acknowledgements

Author wish to thank the family members( Mr. Sali V A, Mrs. Girija K R, Mr. Ambady V S, Mr. Anandu VS) for giving the essential facilities, and their thoughtful support and direction throughout the investigation.

References

  1. FAO (2007) The next frontier in genetic research: under water FAO News Room.
  2. Jhingran VG (1956) The capture fishery of river Ganga at Buxar (Bihar, India) in the years 1952- 1954. Indian Journal of Fisheries 1: 197-215.
  3. Kanaujia DR, Mohanty AN (1992) Breeding and large scale seed production of the Indian river prawn Macrobrachium malcolmsonii (H. M. Edwards). J Aqua 2: 7-16.
  4. Kanaujia DR, Pani KC, Mohanty AN (1996) Seed production of Macrobrachium malcolms onii (H.M. Edwards) in synthetic sea-water. Aqua. Trop 11: 259-260.
  5. Kanaujia DR, Mohanty AN, Das KM (1998) Recycling of used water for the seed production of Macrobrachium malcolmsonii (H. M. Edwards). J Aqua Trop 13: 223-232.
  6. Kanaujia DR, Das BK, Mohanty AN (1998) Mass larval mortalities in Indian river prawn Macrobrachium malcolmsonii under hatchery conditions and their control by application of antibiotics. J Aqua Trop 13: 171-179.
  7. Kewalramani HG, Sankolli KN, Shenoy SS (1971) On the larval life history of Macrobrachium malcolmsonii (H. M. Edwards) in captivity. J Indian Fish. Assoc 1: 1-25.
  8. Maria Lourdes A, Cuvin-Aralar, Manuel Laron A, Emiliano V, Aralar, et al. (2011) Aquaculture Extension Manual, Breeding and seed production of the giant freshwater prawn (Macrobrachium r osenbergii) Southeast Asian Fisheries Development Center Aquaculture Department Tigbauan, Iloilo, Philippines 33.
  9. New MB, Singholka S (1985) Freshwater Prawn Farming. A Manual for the Culture of Macrobrachium ro senbergii. FAO Fisheries Technical Paper 1: 118.
  10. Rajyalakhsmi T (1980) Comparative study of the biology of the freshwater prawn Macrobrachium malcolmsonii of Godavari and Hooghly river system. Proc Indian Nat. Acad., B 46: 72-89.
  11. Saeed Ziaei-Nejad, Gholamreza Rafiee, Mehdi Shakouri (2009) Culture and breeding of fresh water prawn Macrobrachium ro senbergii as an exotic species in Iran, present status and future perspective, Department of Fisheries Natural Resources Faculty Behbahan high educational complex Behbahan, Iran, Asian Pacific Aquaculture.
  12. Tiwari KK (1949) On a new species of Palaemon from Banaras with a note on Palaemon lanchesteri (de Man). Records Indian Museum 45: 333-345.
  13. Tiwari KK (1955) Distribution of the Indo-Burmese freshwater prawns of the genus Palaemon (Fabr) and its bearing on the Satpura hypothesis. Bulletin National Institute Sciences India 7: 230-239.
  14. Tiwari KK, Holthuis LB (1996) The identity of Macrobrachium gangeticum Bate, 1868 (Decapoda, Caridea, Palaemonidae). Crustaceana 69: 922-925.

Reaching a Meaningful Agreement among Diverse Parties: The Potential Contribution of Mind Genomics to an Iterated, Optimal Policy

DOI: 10.31038/MGSPE.2022221

Abstract

Mind Genomics was used to assess the response of ordinary people to different prospective strategies involved with the nuclear deal with Iran, in 2016. Each respondent read a unique set of 25 small vignettes comprising systematically varied messages about the nuclear deal, rating each on likelihood for an agreement, and expected emotional response from Iran. From the set of 20 elements only seven elements performed strongly, but not among the total panel, only among emergent mind-sets. These were MS1 (Focus on military aspects, specifically prevention, n=29 respondents), MS2 (Focus on economic development, n=45), and MS 3 (Focus on effective negotiations and diplomacy, n=11). Most of the emotional reactions were negative. The paper suggests that Mind Genomics be used as an iterative, low cost, rapid fashion, to identify strong negotiating points, base upon the mind of the average citizen. The iterations each lasting 3-4 hours, with several iterations possible in a day at low cost, and with deep learning may radically change the process of negotiation. Mind Genomics identifies what specific messages ‘work’. The process can evolve to a joint effort by both parties to the disagreement, and by so doing craft an agreement attractive to both sides, an agreement emerging from the positive responses of the citizens of both sides.

Introduction

The world of US policy the domain of the three branches of the government, and in practice the domain of a host of consultants and others helping to formulate the policy. Often the policy seems well thought out, other times the policy seems to be either poorly thought out, or more of concern, the influence of various parties which dictate aspects of policy for their own interest.

The topic of this paper is the introduction of a tool, Mind Genomics, to help formulate policy by understanding the ‘mind’ of the average citizen, in a way that could tap into the ‘wisdom of the crowd’, and become an iterative, affordable, rapid tool to help policy formulation.

We illustrate the approach by a study run five years ago on responses to policy about Iran. The objective of the study was to demonstrate the potential of what one could learn in a matter of two days, a time that would be shortened to period of 2-4 hours as of this writing (Fall, 2021). The topic of what to do with the fractious government of Iran continues to rear its head. At the original time of the experiment, the last months of the Obama administration, the issue was raised as to what could be done to deal effectively with Iran. Donald Trump was in the midst of pre-election efforts. The research was done to identify key issues and what people wanted as support for the Republican party.

Formulation of Public Policy with the Aid of Polls

Public policy is often announced by a spokesperson for the committee putting forward that policy. It is obvious from the reports both before, and during the birth of the policy, that the policy was ‘crafted’ by a group, and that often the group is bipartisan. There is the phrase ‘horse-trading’ to discuss the back-and-forth negotiations.

At the same time, in the world of politics, whether for candidates or for political issues there are two worlds intertwined. One world is the world of experts, such as individuals from so-called think tanks, who come up with the recommendations. In the United States these individuals are disparaging called ‘Beltway Bandits’, because are housed near Washington. The experts are highly paid to work with the lawmakers and policy makers, to give advice. Occasionally, scientists enter the process as well because the issue is technical [1,2].

At the same time there are the pollsters, who measure public opinion, attitude. The emphasis here is on accurate measurement. Occasionally these pollsters might be asked to consult on policy, but their expertise is accurate measurement. The measurement may occur with well conducted local and national polls, focus groups, individual depth interviews, perhaps coupled with their own observations of what is happening at the time they are doing the research [3].

There are two languages in policy, the language of artisanship in the creation, and the language of statistics and measurement in people’s response to the creating. The language of policy creation is the language of the artisan shop, where the policy is ‘crafted,’ ‘hammered out’, etc., through the interactions and efforts of the individuals involved. The policy is ‘created’ by those tasked with the job. We can contrast this policy of ‘artisanship’ with the language used in measuring responses to the policy, the language of statistics, polls, degree of confidence, measurement of trends, and assignment of reasons for specific patterns of people’s response to the policy. Furthermore, he two languages do not overlaps. There is not much published in terms of scientifically guided iterations in the development of the artisan-crafted policy. The two worlds are different, creation and measurement.

In contrast to the above is the world of product design, especially the world of software design, but engineering in general. The product may be created by an artisan, but that product is special, one time. The true effort is to create products which work, products that have been created by iterations, with the creation coming first, then the testing, then the revision, and the testing again [4]. The key word is ‘testing as part of the iteration,’ something that is not heard publicly in the world of government policy.

A search through the literature reveals a moderate number of papers on policy, but almost none on measurement during the course of policy development in the way that one might iterate in the creation of software. We might we be in different worlds. Policy again and again seems to be crafted as a one-tine reaction, rather than being quickly evolved from iterations and testing propositions in the policy. It is that opportunity, creation and optimization through iteration, which constitutes the contribution of this paper.

Beyond Polls to Experimentation

The notion of experimentation in political science seems at first strange, simply because one thinks of the political order as an emergent, resulting from the confluences of forces and the ‘Zeitgeist,’ the spirit of the times. Philosophers have debated the nature of the political orders, the classes of political orders, and of course both the assumed ‘original political order of man’ (if there ever was one), and the most appropriate political order for a society. The important thing to note is that political order is so critical that it begs for study, whether for itself or knowledge of which allows one to achieve one’s goals.

At the same time, during the past decades there has emerge a notion of experimentation, and the idea of an experimental political science, perhaps of the same type as experimental psychology. The difference is where the material is published, and the nature of the published material. Experimental psychology began to emerge in Germany almost two centuries with the publication of Ebbinghaus’ book ‘On Memory’. The book was filled with the results of experiments, with data that could be studied, reanalyzed, challenged, and ultimately replicated or not.

We can contrast the early beginnings of experimental psychology with the beginnings of experimental political science, whose material appears in book after book, as points of view, substantiated with one or two experiments, or better rethinking of data [5,6]. There are no standard experiments in political science, experiments which constitute the basis of the science. Rather, there is talk, philosophical point of view, the need and from time-to-time re-presenting data, cast in this new light of experimentation. In other words, experimental political science is very much alive, but as hope for the future, not as a daily, simple, scalable system for producing data and knowledge. We are just not ready although the interest is certainly real, as shown by the intellectual vibrancy of the topic, a ‘must’ for breaking through into new territory [7-9].

The Mind Genomics Approach

Mind Genomics is an emerging science with roots in experimental psychology, marketing research and public polling. The fundamental nature of Mind Genomics is of a science of experimentation which discovers the mind of people with respect to a specific micro-topic. The key word is micro-topic, a focus on easy-to-understand ideas. The objective is to quantify decision making from the bottom up, and identify coherent groups, ‘mind-genomes’, based upon different, recurring patterns describing how individuals make judgments about the world of the everyday [10,11].

The part of Mind Genomics emerging from experimental psychology is the focus on the measurement of ideas, the inner psychophysics as it was called by modern day psychophysics pioneer, S.S. Stevens of Harvard University. Psychophysics itself is the search for lawful relations between physical stimuli and subjective responses, so-called outer psychophysics. It is the aspects of psychophysics to which most scientists familiar with psychology and referring to when they refer to psychophysics. Inner psychophysics, Stevens’ dream, was to apply metrics to ideas, to measure ideas.

The part of Mind Genomics emerging from consumer is the use of mixtures of test stimuli which simulate real world stimuli have cognitive meaning. One of the tools of consumer research, coincidentally developed by experimental psychologists Luce and Tukey is ‘conjoint measurement,’ the evaluation of mixtures of stimuli, and the estimation of the contribution of each element in the mixture to the overall response. In the world of commerce, mixtures are importance. They are the substance of which products and services are composed. We don’t buy single ideas, but rather combinations of features and benefits embedded in a product or a service.

The Seven Steps

Mind Genomics follows a templated process comprising seven steps. The steps begin with the creation of raw material, and finish with the identification of strong performing elements, among defined groups of respondents, including new-to-the-world groups of respondents who can be shown to think alike on this topic. The output of the Mind Genomics study may find use in driving a better program of communication of one’s product, or part of an academic effort to create the ‘wiki of the mud for a set of related issues’

Step 1: Define the Problem, Create the ‘Raw Material’, Defined as a Set of ‘Questions’, and a Specified Number of Answers to Each Question

The Mind Genomics effort is an experiment, rather than a questionnaire, although Mind Genomics has often been defined in public terms as a survey’.

The essence of Mind Genomics is to measure responses to defined stimuli, viz., combinations of messages, and these combinations called vignettes. The vignettes are combinations of statements about the topic, in our case policy towards Iran. As a consequence, the Mind Genomics process prescribes the raw material, namely the topic (Iran), a set of ‘questions’ or ‘categories’ which in sequence describe or tell a story, and for each question or category, an equal number of ‘answers.’

The approach for finding the raw material may range from sheer expertise and ‘off the cuff’ to serious research into what is in published. With the growing interest in Mind Genomics as a fast, iterative process, the movement is towards simple, superficial ideas, some based upon what has been seen or read in public sources, the others based upon one’s own ideas, or the ideas of a creative group, thinking about the topic.

Table 1 shows the list of elements. The structure of the table, four questions, five answers per question, is based on the one of the designs of the Mind Genomics system. The elements were created by author Bitran based upon his on strategic analysis work with his program, Enterprizer(r). It is important to keep in mind that Mind Genomics is a tool which puts the elements to a hard test, as we will see below. The iterative nature of Mind Genomics will allow strong elements to emerge. At the same time, however, the Mind Genomics system is not ‘creative’. And so, a good knowledge of the topic is helpful but not a requirement.

Table 1: The five questions (categories) and four answers (elements) for each question

table 1

Step 2: Create Short Vignettes Using Experimental Design

The world of science works by identifying a phenomenon of interest, defining aspects of the phenomenon to be studies, and when possible, isolating those aspects of interest, and measuring them. The aim is to determine the nature of the variable of interest. Doing so means reducing the haze around the variable, the random variation which hides that nature of the variable. The variability itself is unwanted and eliminated through research. The two strategies are to isolate the variable, eliminating extraneous forces which lead to variation, or measure the variable many times, under different situations, and average out the unwanted variation.

When we deal with issues of foreign policy and break out the issues into elements such as those shown in Table 1, the typical research strategy would be to polish each element so that each element is as clear as possible, and as simple to understand as possible. That corresponds to the first effort, measuring the variable which has been made as simple as possible, so other factors do not affect the results. The second is to test that single idea with hundreds of people, one idea at a time with each of the hundreds of people. Averaging the results from the large group should provide a stable measure of the response to the variable.

The one-at-a-time method dictates that the researcher presents the respondent with each of the elements, one element at a time as the phrase says. The respondent is instructed to maintain the same criterion, and with that one criterion rate the element. It does matter whether the element is positive, negative, deals with peace, deals with conflict; the respondent is to use the same rating scale all the time.

An ongoing problem in the on-at-time research is the unnaturalness of single elements. There is no context. The rating is easier when all of the test stimuli, the elements, are of the same type, such as military alliances, or economic alliances, educational strategies, and so forth. The respondent reads the elements, all of the same time, and has no problem evacuating the elements themselves. They are commensurate with each other. The problem arises when the elements are different. The differences may be vast, such as economic policy versus military policy. Although the researcher can instruct the respondent to use the same criterion, it is not clear that the respondent can actually do so.

A better approach, one which removes some of the artificiality of the one-at-a-time method, works by creating combinations of ideas. This is the approach used by Mind Genomics. Rather than forcing the respondent to maintain the same criterion with palpably different types of statements, Mind Genomics puts together the ideas or statements into small easy to read combinations, such as that shown in Figure 1. There is no effort to polish the combination, or to create connectives so that the combination is even more natural looking, appearing like the paragraphs that the respondent is comfortable evaluating. Although the critic might aver that the combination is not polished, that there are no connectives, that some of the laws of grammar are violated, the reality is that the combination forces the respondent to adopt one criterion and keep it because it is impossible in a Mind Genomics experiment to continue to shift judgment criteria to match what ends up seeming to be an ever-changing set of random combinations of ideas. The easiest way is to maintain one’s judgment criteria in the face of ever-changing combinations.

fig 1

Figure 1: Example of a four-element vignette. Each respondent evaluates 25 unique vignettes. The vignettes for each respondent differ from each other

The combinations themselves may appear to the respondent to be utterly random. Nothing can be further from the truth. The combinations are created according to an experimental design [12]. The experimental design comprises specific combinations, allowing the variables to interact, but making sure that the 20 elements in this particular case are presented so that they are statistically independent of each other. That statistical independence is accomplished by the specific combinations. The design comprises 25 combinations or vignettes. Each vignette has a specified number of elements, at most one element or answer from any question. The vignette structure is:

Two elements in the vignette – 2 of 25 vignettes

Three elements in the vignette – 4 of 25 vignettes

Four elements in the vignette – 11 of 25 vignettes

Five elements in the vignette – 8 of 25 vignettes.

Although some critics might aver that the vignette has to be complete, with one element from each of the five categories, the reality is that respondent has no problem dealing with the sparser vignettes. The problem is the attitude of the researcher who wants completeness.

The basic design of 20 element embedded in 25 vignettes is a very efficient design. The breakthrough is design came around 1998, when the notion emerged of a permutable design. That is, one could create the basic mathematical structure of the design, specifying the combinations, and so forth. Once this was done, I was simple and straightforward to create a basic design, and then permute it, changing the elements, but maintaining the design structure. That meant renumbering the elements but keeping the elements in the same category. Thus, A1 would become A2, A5 would become A4, and so forth. The renumber would be done for all elements. This strategy, described in detail by Gofman & Moskowitz (2010), maintained the structural integrity of the experimental design, but recrafted the design slightly to cover many more of the possible combinations.

Figure 1 shows an example of a four-element vignette. The physical layout is simple, one phrase atop the other. There is no indication of categories or questions, simply a combination of the elements. No effort is made to connect the combinations.

Step 3: Execute the Study (viz., Experiment) Online

The actual study was executed through an on-line panel provider, specializing in recruiting respondents and providing them for these studies. The company, Luc.id Inc., in Louisiana, USA, is an aggregator of respondents from various panels. Working with a panel provider such as Lucid. makes the process easy. Over the past two decades it has become increasingly difficult to recruit one’s own panelists, especially for interview or experiments lasting 10+ minutes. The refusal rate has skyrocketed. As a consequence, the panel providers can deliver a group of respondents, generally filling easy specifications, for a reasonable price.

The respondents were invited to participate. The respondents were shown the following orientation. Note that a link was given for further reading about the JCPOA

survey

By way of background Wikipedia as this this writing (Fall 2020) presents a background to the JCPOA, the Joint Comprehensive Plane of Action, which was signed in 2015.

Under the JCPOA, Iran agreed to eliminate its stockpile of medium-enriched uranium, cut its stockpile of low-enriched uranium by 98%, and reduce by about two-thirds the number of its gas centrifuges for 13 years. For the next 15 years, Iran will only enrich uranium up to 3.67%. Iran also agreed not to build any new heavy-water facilities for the same period of time. Uranium-enrichment activities will be limited to a single facility using first-generation centrifuges for 10 years. Other facilities will be converted to avoid proliferation risks. To monitor and verify Iran’s compliance with the agreement, the International Atomic Energy Agency (IAEA) will have regular access to all Iranian nuclear facilities. The agreement provides that in return for verifiably abiding by its commitments, Iran will receive relief from the U.S., European Union, and United Nations Security Council nuclear-related sanctions. https://en.wikipedia.org/wiki/Joint_Comprehensive_Plan_of_Action

The study was complete by 85 respondents, recruited by Luc.id. The base size of 85 suffices for a simple but often deep focus on the topic. The reason for the need for fewer than the hundreds of respondents in conventional survey work is that the research is searching for patterns, not for a precise measure of one point.

Step 4: Prepare the Data for Analysis by Creating New Binary Variables

The Mind Genomics exercise produces a great deal of data, since each of 85 respondents evaluated 25 different vignettes on two types of attributes, a degree of belief in the meaningful agreement (1=Definitely No … 9=Definitely yes) and a selection of the emotion that would be felt by Iran, if Iran were a person.

Our goal is to link the 20 elements to the ratings and the emotions. We do that in the next section. in this first section we transform the 9-point rating to a no/yes scale. Managers find it easier to work with binary scale, rather than to talk in percentages. Following the convention of previous efforts with Mind Genomics and the 9-point scale, we recode ratings of 1-6 to 0 (low probability), and ratings of 7-9 to 100 (high probability). The recoding could be made more stringent or less stringent. There is no ‘right answer,’ just appeal to previous processes. We do the same type of recoding for the emotions. We recode emotions as positive) negative). (Positive: Happy, Relieved, Victorious; Negative: Defeated, Fearful).

Thus, each vignette ends up with three numbers. One for the binary recode for probability of meaningful agreement, one for a positive emotion, and the complement for a negative emotion. The numbers are either 0 or 100. When it comes to the positive versus negative emotion, one of the two variables will take on the value 100, and the other by definition will take on the value 0.

Finally, vanishingly small random number is added to every newly created binary scale. this random number does not affect the results but does avoids a problematic statistical issue emerging from OLS (ordinary least0squares) regression occurring when the respondent selects all ratings for question 1 (meaningful agreement) either 1-6 or 7-9 (all 0’s or all 100’s across the 25 vignettes) or select all emotions as positive or all emotions as negative.

Step 5: Compute Means for to Better Understand the Patterns of Responses

By Step 5 we have already put the data into a form that makes it easy to compare average ratings (the focus of this step), and to link the elements to response (focus of Step 6).

We can explore the quality of the data by computing averages, considering both the number of elements in a vignette as a stratifying variable, and considering the order of testing as a stratifying variable. Even without knowing which elements are present in a vignette, we can ask whether there are any differences in the average ratings assigned to vignettes of 2,3,4 or 5 elements respectively, in terms of the binary transform of likelihood of agreement (TOP 3), and for the average Positive and average Negative emotions.

To answer the foregoing questions means simply to identify each vignette in two ways, first by the number of elements (2, 3, 4 or 5, respectively), and second by the position in the respondent’s sequence (first third, second third, final third).

Table 2 that there is no difference by position in terms of how it covaries with either likelihood to reach agreement (Q1) of emotion selected.

Table 2 also shows no effect of number of elements in terms of affecting the likelihood to reach agreement. There is, however, a quite strong and inverse covariation between the number of elements in the vignette and the selection of a positive emotion. Shorter vignettes are perceived as more likely to generate a positive emotional response by Iran, perhaps because the terms are defined, and the permission is direct. That is, shorter vignettes may leave less ‘wiggle room’, ‘and less ‘fine print’ in the agreement.

Table 2: Average values for TOP3 (likelihood of an agreement), and emotions selected (positive, negative) versus order of testing, and the number of elements in a vignette

table 2

The final topic of our surface is analysis is to get a sense of how the respondents feel about what they are reading. Question 1 allows us a sense of whether respondents feel optimistic about the process, viz., that it will happen, or feel pessimistic. Question 2 gives us a sense of their emotions. Let us average the ratings from their reactions to their own 25 vignettes, independent of what is in the vignettes. (Although, we know that each element appears equally often in the 25 vignettes; it’s just the combinations which vary).

Figure 2 shows a scatterplot of the average score for ‘reach agreement’ (% rating 7-9) vs. the average percent of selections of a positive emotion. Figure 2 shows a concentration of respondents on the left, with low average value of TOP3. We conclude from this that the individual respondents, on average, feel that the agreement will not be reached. There is no sense, however of a preponderance of emotions. Respondents simply do not seem to be able to figure out what the feelings of the Iranians will be a finding which should not surprise. Response can feel strongly about the outcome but not feel strongly about the expected feelings emerging from that outcome.

fig 2

Figure 2: Scatterplot showing the average ratings for reach agreement (abscissa, TOP3) versus the percent of times that a positive emotion will be experienced by the Iranians

Step 6: Relate the Elements to the Ratings

As of today’s state-of-the-art, the pinnacle of the analysis is the ability to relate the presence / absence of the 20 elements to the response, whether the response be the TOP3 (strong likelihood of that there will be an agreement), or the selection of a positive emotion, and finally the selection of a negative emotion. Mathematically, the selection of positive versus the selection of negative emotions is complements of each other. We will be dealing with both, because in our presentation of data will look only at strong performing elements driving positive emotions, and strong performing emotions driving negative emotions, and in turn NOT presenting data from elements which do not strongly engage of or the other.

The experimental design allows us to create both group models and individual-level models relating the presence/absence of the 20 elements to the response. The original design was set up to allow a simple regression equation to describe the data: Response=k0 + k1(A1) + k2(A2) … k20(E4). Recall that each respondent evaluated a unique set of 25 vignettes, comprising a permuted variation of the original design, a variation known to ‘work’, viz., to mathematically identically to the original design.

The first analysis created models relating the presence/absence of the elements to the actual rating of Question 1 on the 9-point scale. Although we will be looking at a transformed variable (TOP3 instead of the 9-point rating), it is instructive to see the degree to which our 85 respondents generate data which is consistent. We measure consistency by estimating the equation, and computing the goodness of fit, the multiple R, the multiple correlation. The multiple R goes from 0.00 (no fit of the variables to the ratings; totally inconsistent results) to +1.00 (perfect fit of the variables to the ratings, totally consistent results which trace the ratings precisely to the presence/absence of the elements).

Figure 3 shows the distribution of the 85 ratings. We can feel confident about the data. Even though most respondents feel that they are ‘guessing,’, that they cannot figure out the ‘correct answer,’ our estimation of consistency suggests that the results are reasonably consistent.

fig 3

Figure 3: Consistency of the results for the 85 respondents, shown by the Multiple R statistic estimated from the individual-level multiple linear regressions

Step 6: Divide the Respondents by the Pattern of the Coefficients to Create Mind-sets

Our last analysis divides the respondents by the pattern of their coefficients. For each respondent we create a model or equation whose dependent variable is TOP3, previously defined as taking on one of two values. The values depend upon the original rating of Q1, the probability of reaching an agreement. Recall that ratings of Q1 1-6 were coded 0, ratings of 7-9 were coded 100.

The database generated from the individual-level regressions comprises 85 rows, one row corresponding to each respondent. Each row comprises 21 columns, one column for the additive constant, and 20 columns for the 20 coefficients. The objective of clustering is to divide this group of 85 ‘objects,’ viz respondents into a limited number of non-overlapping groups, the clusters or mind-sets, based upon a mathematical criterion. The criterion does not require the researcher to know the ‘meaning’ of the measures, viz., in this case the coefficients, but simply to have each object quantified on each measure. Thus, we have 85 objects (people) on 20 measures (coefficients). We do not consider the additive constant in the process.

The clustering program is a heuristic. There are many different clustering programs. The program used here is k-means [13], with the objective of putting the 85 people into either two groups (analytic pass 1) or three groups (analytic pass 2). The criteria are that the profiles of the 20 averages (one per coefficient A1-E4) should be ‘far away from each other’, and the distance between the objects or people in a cluster should be as small as possible. The criterion for distance is (1-Pearson Correlation Coefficient, R). The Pearson R shows the strength of a linear relation between two variables, taking on the value +1 (viz., Distance=0) when they are perfectly linearly related, and taking on the value -1 (viz., distance=2) when they are perfectly inversely related.

Our criteria for choosing the ‘best’ number of clusters combines a desire for parsimony (fewer clusters are better than more clusters), and interpretability (the clusters must tell a coherent story, and the stories of the clusters must differ from one another).

The two-cluster solution, although parsimonious, seemed too jumbled. There was no clear story. The three-cluster solution seemed a bit better. A four-cluster solution was virtually no different in types of groups than the three-cluster solutions. That is, two of the clusters in the four-cluster solution seemed quite similar. The decision was to work with a three-cluster solution.

In the language of Mind Genomics, the cluster becomes a mind-set, a way of responding to a limited set of related stimuli. The min-sets are constructed from the patterns of the coefficients form the 85 respondents who participated in this study. Over the years, the mind-sets which emerge from these focused, quite small studies, continue to repeat. The repetition comes about because when we abstract the type of individual based upon the pattern of responses, we end up with just a few really quite different groups. The psychologists called the ‘archetypes’, but the archetypes emerging from Mind Genomics are based on small, single-focus studies. Yet, again and again, these mind-sets continue to appear in many different ways. The great anthropologist, Joseph Campbell [14], would call this the ‘hero with a thousand faces.’

Step 7: The Total Panel and the Mind-sets

The Mind Genomics effort naturally brings with it many numbers for the study 21 numbers for each group, or 84 numbers for the combination of total panel and the three mind-sets. The objective of these studies is to find patterns, and not to overwhelm ourselves with numbers which may end up disguising the patterns in the dense undergrowth of numbers. To counteract the death by wall of numbers were show only positive coefficients of 8or higher. These strong performer in a Mind Genomics study. We may be losing some information by this stringent cutoff, but a coefficient of +8 or higher is strongly significant from the regression modeling, with a t statistic approaching 2.0.

Table 3 shows the total panel and the three mind-sets, created for the results from Question 1, on the likelihood of an agreement. The cluster uses the coefficient emerging when TOP3 is the dependent variable. The table shows base size first, then the additive constant, and then the strong performing elements for each mind-set.

Table 3: Performance of the strong performing elements for total panel and three emergent mind-sets. Only the seven elements with coefficients of +8 or higher are shown

table 3

The additive constants are 32-38 meaning that without additional information, but just knowing that there are negotiations, about one in three responses to the vignettes are 7-9. We know this because the additive constant tells us the likelihood of a rating of 7-9 in the absence of elements, and is a purely theoretical, computed value. Nonetheless, the additive constant gives us a good sense of basic response. It is remarkable that all three mind-sets agree so well. This is unusual. The agreement means we are dealing with specifics.

When we look at the column for total panel, we find NO strong performing elements that disappointing finding does not mean that we failed in this attempt, although it might mean failure. Our success in the study comes after we deconstruct the total panel into the three groups, based upon patterns of coefficients, not upon magnitude of coefficients. That is, our three mind-sets would have emerged if all of the coefficients were equally reduced by 20 points. In such a case three mind-sets would emerge from the patterns, but NO elements would emerge as being strong.

Before we go into the three mind-sets, which is now quite simple, its worth remarking that we began with 20 elements, the best guesses from people involved. Yet, only seven of the 20 elements emerged as strong, no elements emerged as strong for total, and surprisingly, each strong performing element appeared strong only in one of the three mind-sets.

The min-sets are easy to describe. One simply looks at the strongest element.

Mind-Set 1=Focus on military aspects (prevention) – 29 of the 85 respondents

Mind-Set 2 Focus on economic development – 45 of the 85 respondents

Mind-Set 3 – Focus on effective negotiations and diplomacy – 11 of the 85 respondents.

We move now to the elements which drive strong positive and strong negative responses. The coefficients in Table 4 emerge from six regressions. The six regression comprised three regressions for the selection of a net positive emotion, and three regressions for the selection of a net negative, in both cases two regressions for each mind-set, respectively. The regression model was run without the additive constant, because of the previously conventions in Mind Genomics practice, that emotions and other selections emerging from the nominal scales are estimated without coefficients.

This time we look only the elements which drive a percent selection of 16% or more, for either a positive or a negative emotion. Table 4 shows us that only one mind-set, MS1 (focus on military aspects, prevention) feel that there will a strong positive response. All three mind-sets feel that there will be a strong negative emotion from Iran.

Table 4: Strong positive and negative emotions selected by the respondents from the three mind-sets as they think about the feeling emerging from Iran, as driven by the element. Only coefficients of +16 or higher are shown

table 4

Discussion and Implications

When this study was executed in 2016, Mind Genomics was just beginnings its broader application to international relations, having begun in 2012 with studies of the Israeli Palestinian conflict. The realization at that time, confirmed by many subsequent studies in a variety of areas, is the relative paucity of solid information about the mind of the citizen in the world of social issues, the mind of the customer in the world of commerce, the mind of the patient in medicine, the mind of the client in legal and business issues, and so forth. There were dozens of polls, dozens of learned volumes on key issues, the ongoing broadcasting, and increasing ‘natter’ of the media with ‘talking head’ proclaiming the same new, spun one or another way.

A cursory content analysis of the literature, of the media, and so forth brings out facts, histories, opinions, and the voice of the citizen. The voice of the citizen, however, appears to be limited to simple factoids, statements, voting on issues. Furthermore, there seemed to be a desire to compare changes, and by that comparison to get a sense of where things were going. In other words, the focus was on the macro, with little content, and the depth was assumed to emerge by observing the path of the macro trends over time, perhaps with an effort to see how the trend covaries with exogenous factors, like world order world economics, and so forth. And perhaps even the world’s ‘Zeitgeist’ although Zeitgeist might be more the bias of the analyst than the reality of the items. There are examples of iterated efforts, such as China’s policy [15], but these iterations are large-scale, in the manner of iterating products, rather than ideas.

Enter Mind Genomics, here presented as the first experiment on international relations, at a time when Mind Genomics was conceived of as a one-off process, requiring a lot of thinking, a great deal of expertise for choosing the ‘right material’, and the careful efforts which accompany a scientific project. There were 85 respondents, rather than the customary hundreds of respondents, but that is not a problem. the problem here is the fact that the Mind Genomics study at that time was considered as a final effort, a one time ‘deep dive’ into the mind of the citizen. And the results are what they were, pointing to different mind-sets, but with remarkably few elements performing strongly, either in terms of driving agreement or driving emotions.

The methods of Mind Genomics have been proven again and again, in the legal, medical and commercial realms [16-18]. In those realms, the efforts of Mind Genomics have evolved from one-off, large-scale studies with 36 elements down to the current size of 16 elements (four questions and four answers to each question). The notion of the ‘final experiment’ has given way to Mind Genomics as a fast, iterative, learning=based process. Within that world-view, this study would be updated by a series of short studies, each requiring about 60 minutes to set up on publicly available program (www.BimiLeap.com), and then executed with 50-100 respondents automatically with 60-90 minutes, and the entire data set totally analyzed 10 minutes, and returned to the researcher. One might imagine the use of the iteration as a way both to arrive at good ideas, acceptable to both sides, as well as a consensus-building method, wherein both sides cooperate, and thus build good will.

In the evolution of political science, and the evolution of knowledge of people, these early studies by Mind Genomics of political issues show the potential of a systematic exploration of a topic. When that exploration becomes inexpensive, quick, easy to execute on the internet, and most importantly, ITERATIVE, we have the potential a new political science, one based upon data, extending across many countries, many people, over time, and many topics [19-21]. What was one study in 2016 could well generate a wiki of the mind for the topic of dealing with Iran, that ‘wiki’ filled with data, topic-related, and searchable for specific results and for general patterns.

Acknowledgments

The author would like to acknowledge the help of four associates who helped to design the study.

Joseph Bitran of Enterprizer®

Alice Duggan

Tawfik Hamid

Richard Sciacca

References

  1. Garrison JA (2003. Foreign policy analysis in 20/20: a symposium. International Studies Review. 5: 155-202.
  2. Rametsteiner E, Pülzl H, Alkan-Olsson J, Frederiksen P (2011). Sustainability indicator development—Science or political negotiation? Ecological Indicators. 11: 61-70.
  3. Gadarian SK (2010) The politics of threat: How terrorism news shapes foreign policy attitudes. The Journal of Politics. 72: 469-483.
  4. Wynn DC and Eckert CM (2017) Perspectives on iteration in design and development. Research in Engineering Design 28: 153-184
  5. Druckman JN, Greene DP, Kuklinski JH, Lupia A (2011). Cambridge Handbook of Experimental Political Science. Cambridge University Press.
  6. Morton RB, Williams KC (2010) Experimental political science and the study of causality: From nature to the lab. Cambridge University Press.
  7. Kinder DR, Palfrey TR (1993) On behalf of an experimental political science. In: Experimental Foundations of Political Science 1-39.
  8. Kittel B, Luhan W, Morton R (2012). Experimental political science: Principles and practices. Springer.
  9. McDermott R (2002) Experimental methods in political science. Annual Review of Political Science. 5: 31-61.
  10. Gere A, Radvanyi D, Moskowitz H (2017). The Mind Genomics Metaphor-From Measuring the Every-Day to Sequencing the Mind. International Journal of Genomics Data Minin. IJGD
  11. Radványi D, Gere A, Moskowitz HR (2020) The Mind of Sustainability: A Mind Genomics Cartography. International Journal of R&D Innovation Strategy (IJRDIS). 2: 22-43.
  12. Moskowitz HR, Gofman A, Beckley J, Ashman H (2006) Founding a new science: Mind Genomics. Journal of Sensory Studies, 21: 266-307.
  13. Likas A, Vlassis N, Verbeek JJ (2003) The global k-means clustering algorithm. Pattern Recognition 36: 451-461.
  14. Campbell J (1949). The Hero with a Thousand Faces, New York, Pantheon
  15. Leutert W (2021) Innovation through iteration: Policy feedback loops in China’s economic reform. World Development. 138: 105-173.
  16. Wren JE and Williams TC (2009) Selling blue elephants to the jury: Potential application of rule developing experimentation in litigation. Baylor Law. 61: 1
  17. Gabay G, Moskowitz HR (2019) “Are we there yet?” Mind-Genomics and data-driven personalized health plans. In: The Cross-Disciplinary Perspectives of Management: Challenges and Opportunities. Emerald Publishing Limited.
  18. Milutinovic V, Salom J (2016) Mind Genomics: A Guide to Data-Driven Marketing Strategy. Springer.
  19. Kaarbo J (2003) Foreign policy analysis in the twenty-first century: back to comparison, forward to identity and ideas. International Studies Review. 5: 156-202.
  20. Horiuchi Y, Smith DM, Yamamoto T (2018) Measuring voters’ multidimensional policy preferences with conjoint analysis: Application to Japan’s 2014 election. Political Analysis. 26: 190-209.
  21. Rapport A (2017) Cognitive Approaches to Foreign Policy Analysis. In Oxford Research Encyclopedia of Politics.