Abstract
Respondents rated vignettes (combinations of elements, viz., statements) describing the different features of senior communal dining. Each of 108 senior respondents (age 65+) rated unique sets of 50 vignettes, combinations of 2-5 elements created according to a permuted experimental design, ensuring that the 50 combinations differed for each respondent. Each vignette was rated on both importance of, and emotional response to, the combination of the specific elements presented in the vignette. Deconstruction based on ratings of importance revealed different mind-sets, focusing on food, service, and ambiance, respectively In terms of emotions, few elements were delighters. Most elements did not strongly drive either positive or negative emotions. The one consistently important message was ‘warm food out of the oven’, but it was not a delighter. The one element consistently driving negative emotions was ‘high noise level’. Groups of mind-sets emerged, showing different patterns of importance (Mind-Sets 1-3) and emotion (Mind-Sets 4-6). The mind-sets distribute across the population, suggesting simple knowledge of WHO the respondent is in terms of age, marital status, and so forth does not clearly predict what will be important to any specific senior diner.
Introduction
As the nation ages, there are an increasing number of group or community living facilities, designed for healthy, aging seniors [1]. These communities have group dining facilities. The issue becomes one of finding what is important to a senior. The obvious answer is food, companionship, and service [2]. But what exactly is entailed by each of these? And furthermore, are there differences in the importance of these three general factors?.
The usual approach to answering these questions is for the respondent to rate or rank these factors, either in the abstract, or after having experienced a certain community, so that the specific community is rated on satisfaction with respect to these three or more general factors. The rating or ranking factors requires that the respondent evaluate the general factors in isolation, and in general terms. Sometimes the researcher recognizes that the general factor, e.g., service, might be better assessed by first specifying the question in terms of defined behaviors, or food specified in terms of defined dishes and/or method of preparation.
As popular as the ‘one-at-a-time’ evaluation has been, it suffers from at least two defects which limit its usefulness. One is that the respondent may unconsciously adjust the judgment criterion when dealing with the different factors, when evaluating one element at a time. For example, the same rating scale for food versus service may mean different things. The researcher does not know that. Second, the one-at-a-time strategy fails to recognize that people rate things more readily and easily when what they are rating is less abstract, more concrete. It is more natural to rate combinations of ideas which represent a situation, a vignette, than to rate each idea separately.
This paper presents the results of a Mind Genomics cartography, an investigation of different ideas, so-called elements, which might be relevant to older adults eating in communual dining situations, such as retirement homes. The objective is understand senior communal dining from the ‘inside-out.’ The strategy maps out what might be important to the senior diner, doing so by presenting the respondent with different ‘vignettes’, viz., combinations of features describing a senior dining situation. Through the response to these vignettes, rated both as describing something important, and as eliciting an emotion, the researcher uncovers both what is important, and what produces an emotional response, respectively. The approach differs dramatically from the one-at-a-time approach, used to in conventional research [3,4].
The background of Mind Genomics can be found in the confluence of statistics (experimental design; [5], patterns emerging from the study of consumer opinions [6], and the change in focus from a sociological viewpoint (outside-in) to a psychological viewpoint (inside-out). The underlying world-view of Mind Genomics is the vision of the science as a tool to ‘map the mind’, focusing on the ordinary aspects of life, rather than setting up experiments configured to test a hypothesis. The Mind Genomics science comes from a history of psychophysics, with the objective to discover patterns, regularities in nature, rather than from the hypothetico-deductive system, which assumes the world works a certain way, and seeks to confirm or to disconfirm that assumption through experiment. Thus, the study reported here was done in the spirit of an exploration of the mind of what senior feel about the various aspects of communal dining.
Dining behavior is a well-explored areas of foodservice. Most studies of dining among adults focus on the choice of restaurant, and the dimensions of food and service, topics which are relevant in a situation where the diner eats and pays, even in the world of senior dining [7]. In contrast, there has been less focus on institutional communal dining, and much less on communal dining among seniors.
Focus on Emotions and Feelings
This study focused on the response of older, relatively healthy adults (age 65+) to different messages about senior communal dining. The objective was to identify which elements were important to them (viz., homo intellectualis) and which elements generated positive or negative feelings (viz., homo emotionalis). The latinized terms intellectualis and emotionalis were coined for this paper.
Rather than instructing the respondent to rate the importance of, and the emotional response to, single elements, Mind Genomics proceeds in another direction, one that might seem less direct, but one that cannot be gamed, and thus provides robust information. The respondent reads a set of messages or elements, created according to a specific recipe plan (experimental design). For this study, comprising 35 elements in 50 vignettes, the combinations primarily comprise vignettes containing 3-4 elements, but a few containing 2 elements, or 5 elements. Each element appeared five times, always in combination with other elements. The experimental design is set up so that no two respondents evaluate the same set of vignettes, allowing the Mind Genomics experiment assess many of the possible combinations [8]. This property makes Mind Genomics unusual because it directly measures many of the possible stimuli, rather than forcing the researcher to ‘know’ what will work before the experiment is done. The goal is to avoid the folk wisdom which prescribes the cautionary ‘measure nine times, cut once,’ a way of thinking which subtly transforms research to confirmation, rather than allowing research to explore the ‘new’.
Method
The Mind Genomics approach to knowledge follows a structured, formatted pattern, in recent years put into the form of a computer-aided process (see www.BimiLeap.com). The study reported here was done a few years before the automated system was developed, but the actual creation, presentation, of the vignettes, and analysis were reasonably automated, although not from beginning to end as they are as of this writing (Fall, 2021).
Step 1 – Select the Topic, Ask the Questions, and Provide Answers in the Form of Simple Declarative Sentences
Table 1 shows the five questions and the seven answers for each question. The underlying mathematics of Mind Genomics prescribes certain combinations of questions (or categories) and answers (or elments). The rationale for the five questions and seven answers is that it is a specific array which fits into the prescribed experimental designs of Mind Genomics. Those prescribed designs are important because they allow each respondent to test the same elments, but each respondent testing a different set of actual combinations. This is a permuted design, and will be discussed below [8].
It is important to note in Table 1 that the focus is on word pictures, on specifics, ratherr than general ideas. The underlying reason is that the Mind Genomics effort attempts to paint ‘word pictures’ about the situation (here adult communal dining). To paint these word pictures requires that the researcher move beyond simple, general statement, and focus on the particular, even if the particular is something ‘new’ to the respondent.
Table 1: The raw material comprising five questions, and seven answers for each question.
|
Question A: Describe the ambiance |
|
| A1 | Adequate lighting at the table |
| A2 | The overall volume of noise in the dining room is high |
| A3 | Eating with a group of friends |
| A4 | Eating by yourself |
| A5 | Listening to music during a meal |
| A6 | Lots of stimulating conversation during a meal |
| A7 | Table settings (plates, silverware, tablecloth etc.) makes for an enjoyable meal |
|
Question B: Describe the service |
|
| B1 | Friendly waiters can really make for an enjoyable meal |
| B2 | Waiters who are knowledgeable about the food help you select items from the menu |
| B3 | Family style service with bowls of food to pass around the table |
| B4 | Speedy service is important for your enjoyment |
| B5 | Waiters let you substitute items such as sides and salads not included in the menu item description |
| B6 | You are given the choice to sit anywhere in the dining room |
| B7 | Waiters remember the type of food or drink you like |
|
Question C: Describe the information provided on the menu regarding the items |
|
| C1 | Nutritional information on the menu to help you make your selections |
| C2 | Total calories for each item listed on the menu to help you make your selections |
| C3 | The amount of sodium for each item listed on the menu will help you make a choice |
| C4 | Listing the amount of fat in menu items helps you decide what to order |
| C5 | Clear and simple wording on the menu makes it easy to decide what you will order |
| C6 | You select menu items with exotic or foreign sounding descriptions |
| C7 | Having the option for ordering smaller portions of the items on the menu |
| C8 | You love fresh uncooked vegetables (salads for example) at every meal |
|
Question D: Describe a specific food |
|
| D1 | You enjoy vegetables that are thoroughly cooked |
| D2 | Fresh fruit at every meal |
| D3 | If it contains chicken, you will like it |
| D4 | Red meat is your choice every time |
| D5 | You can’t go wrong with a simply prepared fish dish |
| D6 | You like large portions of food |
|
Question E: Describe the sensory aspect of the food |
|
| E1 | The aromas of herbs or spices you love |
| E2 | Foods with soft textures are your preference |
| E3 | You choose food with vibrant colors |
| E4 | You prefer food that is under-salted |
| E5 | Food is served hot out of the oven every time |
| E6 | You prefer food that is served warm |
| E7 | You enjoy hot and spicy flavors |
Step 2 – Combine the Elements into Small, Easy to Read Vignettes Using an Underlying Experimental Design
This experimental design for this study (5×7) generated an experimental design or set of combinations totally 50 different combinations or vignettes, all but three vignettes comprising either three or four elements. The remaning three vignettes encompassed two elements or five elements. Each element appears five times in the 50 different combinations.
The important thing about the underlying 5×7 design, like others of its class, is that the experimental design is complete at the level of each respondent. This means that the 50 cases or observations from one respondent can be used to estimate the contribution of each element to the rating. Such analysis at the level of the individual respondent becomes important when we create equations for each individual and then combine individuals on the basis of similar patterns of individual-level coefficients to discover mind-sets.
It is at Step 2 where Mind Genomics departs radically from the conventional approaches, which are founded on the principle of ‘isolate and study’. The objective of conventional research is to quantify the basic dimensions, such as ambiance, service, information, food, and so forth. Conventional research looks for the general principles. It is usually the evaluation of elements one-at-a-time which allow the researcher to rank order the different general aspects. There are situations when the topic requires the combination of different aspects, but in those situations the actual combination itself is important, and treated as a ‘single’ element by itelf, even though it comprises a composition. That composition is fixed, and analyzed as a single item. The fact that the stimulus is a composition is not relevant for the analysis.
The ingoing approach of Mind Genomics is the opposite of the conventional approach. The basic interest remains the performance of the individual element, and from that performance the understanding of how the respondent, the older adult, makes a decision. The strategy is different, however, working with combinations, and from the response to these combinations estimating the performance of the individual elements, the messages.
Figure 1 shows an example of the vignette. The vignette was shown twice, first instructing the respondent to assign a rating of importance, and second insructing the respondent to choose a feeling/emotion. To the respondent it appeared that the vignette did not change, only the insrtructioins did.
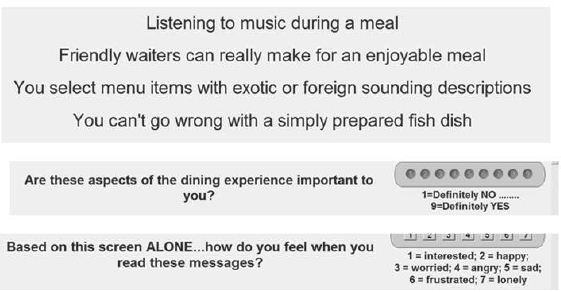
Figure 1: Hows an example of a 4-element vignette, with the two rating scales.
There are at least three clear advantages emerging from a Mind Genomics study.
Ecological Validity
The combination of elements is ecologically more valid because it describes something that could be real. People are accustomed to reading combinations of ideas in everyday life, whether in advertisements, or hearing the description in a story told to them, etc. We call this ‘ecological validity’ because it is that to which they people are accustomed.
Inability to ‘game the experiment’
The continually changing combinations of elements make it virtually impossible for the respondent to find a ‘right answer.’ The vignettes appear to comprise elements put together in a haphazard order. Most respondents feel that the combinations are, in fact, random. When asked about their experience, many respondents said that they could not figure out the ‘correct answer’ from the pattern of vignettes, and simply ‘guessed.’ This ‘guessing’ is actually not the case, because otherwise the responses would not correlate with the ratings, which they do. Figure 2 show the adjusted multiple R (Pearson Correlation), a meaure of the goodness of fit of the 108 models, one per respondent, with the models predicting the response from the elements. Were the respondents actually ‘guessing’, the adjusted multiple R across the 108 respondents would cluster around 0 – 0.3. There are a number of respondents with adjusted multiple R values of 0. These respondents were no doubt guessing. The data from the other respondents can be said to be consistent.
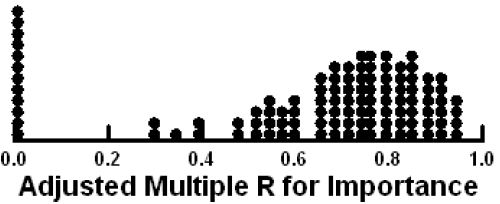
Figure 2: Distribution of adjusted multiple R statistic for 108 respondents. R values near 1.0 suggest a strong, consistent relation between the presence/absence of elements and the 9-point rating. R values near 0 suggest no relation between presence/absence of elements and the 9 point rating.
No need to ‘know’ the right test stimuli at the start of the session
Mind Genomics was created with the idea that one need not know the ‘correct combinations’ at the inception of the experiment. All- too-often the research preparation focuses on weaker than optimal efforts to narrow the range of possible combinations of ideas, such narrowing done by qualitative discussion. Only when the researcher feels that the correct combinations have been identified does the researcher then use the experment to ‘validate’ the guess about what elements are really important. This effort is self-defeating. Conventional research makes ‘the perfect the enemy of the good.’ It is better to have an inexpensive, rapid, iterative system which allows quick screening of messages, viz. in the form of vignettes, with the poor performers eliminated, and new performers inserted, for the next iteration.
Step 3 – Invite Respondents to Participate
Good practice dictates that the respondents be selected by a third party, based upon the research specifications. The increasingly popular use of the Internet as the reearch venue has spurred the growth of many providers who specialize in such online studies. The respondents in this study were recruited using a local US panel provider. The respondents were ‘double opt-in’, viz., agreed to participate in these types of studies. The identify of the respondents was never disclosed to the research team performing the study.
The panel provider sent a link to the respondents with the topic, doing so to adults 65 and older. The records kept by the provider ensured the age. The respondents who agreed to participate were introduced to the the study by the screen shown in Figure 3. The majority of the introduction is ‘bookkeeping’, informing the respondents about the topic, but spending more time about the nature of the vignettes, the approximate amount of time, and the rating questions. These instructions have been significantly shortened at the time of this writing (2021). The standard Mind Genomics study has been reduced in size from 35 messages in 50 combinations to 16 messages in 24 combinations.
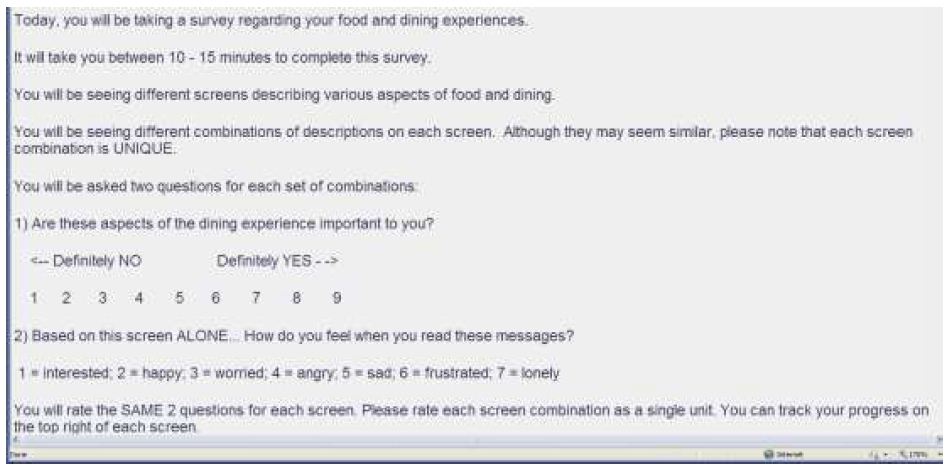
Figure 3: The orientation page to the communal dining study for seniors.
Analysis and Results
Converting the Data to Usable Formats
Each respondent evaluated 50 vignettes, rating every vignette on two scales, as noted above. The first scale was the Likert scale for importance, anchoared at 1 (Definitely NO) and 9 (Definitely YES). The second question is called a nominal scale. Each of the seven scale points corresponds to a feeling/emotion. The scale itself has no intrinsic numerical properties for analysis. The numbers are placeholders, corresponding to different words.
It is common in the world of consumer research and political polling to reduce the scales to a binary scale, yes/no. The binary scale makes it easy to communicate the findings. It is a matter of understanding what a number ‘means.’ ‘No’ versus ‘Yes’ is understandable. A rating of a 4 versus a 7 is less understandable, other than what was rated 7 had ‘more’ of the attribute than what was rated ‘4.’
The transformation was straightforward. TOP2 (Important) – Ratings of 1-7 were transformed to 0 to denote ‘not important.’ Ratings of 8-9 were transformed to 100 to denote ‘important.’ The usual transformation is 1-6 and 7-9, but the interest here was to identify the ‘really imporant’ messages. Thus, the range corresponding to ‘important’ was narrowed. This first transformation produced the necessary data for the subsequent analysis by OLS (ordinary least-squares) regression, which would relate the presence/absence of the 35 elements to the binary rating.
The second transformation creates two new binary variables, POS (positive emotion), and NEG (negative emotion), respectively. When the respondent selected either the feeling ‘interested’ or ‘happy,’ POS took on the value ‘100’, and NEG took on the vaue ‘0’. When the respondent selected any other feelings, POS took on the value ‘0’ and NEG took on the value ‘100.’ This second transformation also produced the necessary format of data for OLS regression.
One final transformation, or better prophylactic action was done to ensure that each dependent variable (TOP2, POS, NEG) was always different from 0, and that the different. A small random number (<10-5) was added to each transformed value, to create slight variation across the responses of a single respondent. This process ensured that the OLS regression would never encounter the situation that all observations for a dependent variable (viz., all TOP2, or POS or NEG) for a given respondent would be the same value. OLS (ordinary least squares) regression requires some vanishingly small variation in the dependent variable.
Mean Ratings
The simplest, most direct analysis involves computing the average rating assigned by the different groups of respondents. By different groups we refer to the total panel, to gender, age, married versus single, number of meals per day eaten by the respondent, order of testing the vignettes, and to three newly created groups of mind-sets, the criteria for which are presented below. For this first analysis the focus is on whether there are dramatic differences across the defined respondent subgroups in the averages of TOP2 (what is important), and the emotions selected (Positive, POS; Negative NEG).
Table 2 shows us the averages ratings across all respondents which fall into a particular group. Thus the Total Panel comprises the averages of all 108×50 or 5,400 vignettes. We get a sense of the proclivity of the groups to consider vignettes important, respectively, as well as generating a positive feeling or a negative feeling.
Table 2: Averages for the four key dependent variables, by different groups of respondents or different orders of testing.
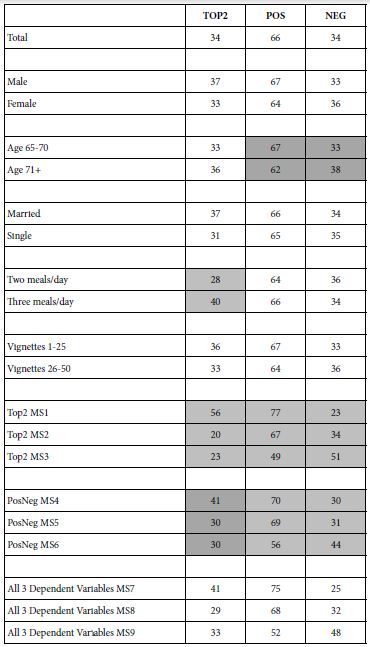
For the most part, the averages are similar across key subgroups. For groups of respondents defined by who they say they are, and by what they do, we see a few patterns which are interesting. There are more group to group differences when the respondent subgroups are created from the pattern of ratings (emergent mind-sets, discussed below).
The most notworthy differnence is the average rating of TOP2 (importance) for two groups defined by how frequently they eat. Those who eat two meals a day thought the vignettes to be far less important, on average, and those who eat three meals a day thought the vignettes to be more important (28 vs 40).
The second noteworthy difference is the emotional response by age. When rating the feeling after reading the vignette, the younger respondents chose the positive emotion slightly more frequently than did the the older respondents (67 versus 62).
Relating the Presence/Absence of the 35 Elements to the Three Newly-created Dependent Variables
Beyond simple averages and the discovery of some interesting differences lies the opportunity to link the elements and the ratings, and by so doing create a deeper undertanding because the elements themselves are ‘cognitively rich’. Table 2 showed us ‘averages,’ but Table 2 cannot tell us whether the patterns we see correspond to anything more deep. That deeper understanding will emerge from the linking exercise. We will more deeply understand the mind of the respondents because the strong performing elements, those with the deeper linkage, will have meaning in and of themselves.
The initial linking is done by regression modeling. The modeling creates an equation relating the presnece/absence of the 35 elements to the binary rating. The equation states simply that the binary dependent variable is the sum of an additive constant (baseline) and individual contribution of each element, respectively.
The equation is written as follows: Binary Dependent Variable = k0 + k1(A1) + k2(A2) … k35(E7)
The additive constant, k0, is the expected value of the binary dependent variable (e.g., TOP2 for important, POS for positive emotion, NEG for negative emotion), estimated in the absence of all 35 elements. The experimental design ensures that all vignettes comprise 2-5 elements, primarily 3-4 elements as noted above. Thus, the additive constant is a purely computed, theoretical parameter, an ‘adjustment factor.’ The additive constant is the baseline, the basic likelihood to choose a rating.
Table 3 shows the results from the first application of the modeling, result from the Total Panel. Table 3 is short, allowing us a sense of what really makes a difference. We present only those elements which have a TOP2 coefficient of +8 or more, or a POS or NEG coefficient of +10 or more. These cut-points are selected to focus our search for patterns on those elements which perform ‘strongly,’ viz., are statistically ‘significant’ (p<0.05), in the language of interential statistics.
Table 3: Strong performing elements for the Total Panel.
|
Total Panel |
||||
|
TOP2 |
||||
| Additive Constant |
39 |
|||
| E5 | Food is served hot out of the oven every time |
10 |
||
|
POS |
NEG |
|||
| Additive Constant |
74 |
26 |
||
| E2 | Foods with soft textures are your preference |
10 |
||
| E7 | You enjoy hot and spicy flavors |
12 |
||
| D5 | Red meat is your choice every time |
12 |
||
| A4 | Eating by yourself |
21 |
||
| A2 | The overall volume of noise in the dining room is high |
27 |
||
Total Panel – Importance: 39% likehood of being saying something is important. Warm food is important.
Total Panel – Feelings: Strong basic positivity (74%), but no ‘delighters’. There are are strong negatives, however; eating by oneself and eating with noise, respectively.
Does More Information in the Vignette Affect the Coefficients?
The respondent population in this study was 65 years or older. It is very likely that most of the respondents would never have participated in an experiment quite like the Mind Genomics experiment presented in the previous data. One of the issues which continues to arise is just ‘how’ do the respondents actually form their judgments, and are the judgments affected by the complexity of the test stimulus? That is, most people are accustomed to answering questions one question at a time, with one topic, even though in the introduction we suggested that this one-at-a-time approach might lead to biased data because the respondent would attempt to provide what is believed to be ‘the correct answr’
The data collected here can address one issue, namely are we likely to see the patterns of coefficients change when we base our analysis only on the vignettees comprising three elements, versus only on the vignettes comprising four elements. Recall that in the set-up, most of the vignettes comprised either three or four elements. Only three of the vignettes comprised 2 or 5 elements, respectively.
The robustness of the data from the total panel emerges from Figure 3. The data were divided into two strata, those vignettes comprising three elements, and those vignettes comprising four elements. These two data sets were analyzed in parallel, by computing a simple equation relating the presence;absence of the 35 elements to the response (Top2, Positive Emotion, Negative Emotion, respectively). To make the comparison easier, the euqations were estimated without an additive constant, so that one could directly compare the coefficients to each other.
The equation is written as: Dependent Variable = k1(A1) +k2(A2) … k35(E7)
Each anaysis generated 35 coefficients. Figure 4 shows three scatterplots. The abscissa shows the 35 coefficients estimated using only those vignettes comprising three elements. The ordinate shows the same 35 coefficients, this time estimated using only those vignettes comprising four coefficients. There are remarkably high correlations, even though at an element by element basis basis there might be some slight difference in the value of the oefficient for that element. The patterns and decisions would be the same, suggesting remarkable stability of judgment.
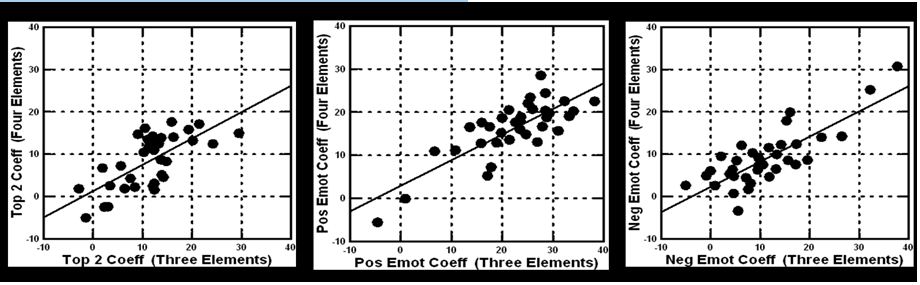
Figure 4: Values of the coefficients estimated using only vignettes comprising three elements (abscissa) versus using only vignettes comprising four elements (ordinate).
Gender
Table 4 shows the strong performing elements by gender. The gender differences are clear.
Table 4: Strong performing elements for Males vs Females.
|
TOP2 |
|||||
|
Males |
|||||
| Additive Constant |
41 |
||||
| E5 | Food is served hot out of the oven every time |
8 |
|||
|
Females |
|||||
| Additive Constant |
38 |
||||
| C7 | Having the option for ordering smaller portions of the items on the menu |
14 |
|||
| E5 | Food is served hot out of the oven every time |
12 |
|||
| C5 | Clear and simple wording on the menu makes it easy to decide what you will order |
11 |
|||
| B5 | Waiters let you substitute items such as sides and salads not included in the menu item description |
9 |
|||
| E1 | The aromas of herbs or spices you love |
9 |
|||
| B2 | Waiters who are knowledgeable about the food help you select items from the menu |
8 |
|||
|
POS |
NEG |
||||
|
Males |
|||||
| Additive Constant |
74 |
26 |
|||
| D4 | If it contains chicken you will like it |
10 |
|||
| D5 | Red meat is your choice every time |
12 |
|||
| A4 | Eating by yourself |
19 |
|||
| A2 | The overall volume of noise in the dining room is high |
27 |
|||
|
Females |
|||||
| Additive Constant |
75 |
25 |
|||
| C7 | Having the option for ordering smaller portions of the items on the menu |
11 |
|||
| B5 | Waiters let you substitute items such as sides and salads not included in the menu item description |
10 |
|||
| D7 | You like large portions of food |
10 |
|||
| D6 | You can’t go wrong with a simply prepared fish dish |
12 |
|||
| E2 | Foods with soft textures are your preference |
14 |
|||
| D5 | Red meat is your choice every time |
14 |
|||
| E7 | You enjoy hot and spicy flavors |
19 |
|||
| A4 | Eating by yourself |
23 |
|||
| A2 | The overall volume of noise in the dining room is high |
26 |
|||
In terms of what is important, for males it is only warm food, out of the oven. For females, there are five elements covering portion size, warmth, simplicity of ordering, flexibility, and sensory aspects (2).
In terms of positive emotions, delighters, no elements stand out for males. Two elements stand out as delighters for females:
Having the option for ordering smaller portions of the items on the menu
Waiters let you substitute items such as sides and salads not included in the menu item description
Age
Table 5 shows the strong performing elements by the two age groups.The two age groups are similar to each other. There are some differences, but in degree, and not very large.
Table 5: Strong performing elements for Males vs Females.
|
TOP2 |
|||
| Age 65-70 | |||
| Additive Constant |
38 |
||
| E5 | Food is served hot out of the oven every time |
10 |
|
|
Age71+ |
|||
| Additive Constant |
41 |
||
| E5 | Food is served hot out of the oven every time |
11 |
|
|
POS |
NEG |
||
|
Age 65-70 |
|||
| Additive Constant |
73 |
27 |
|
| E7 | You enjoy hot and spicy flavors |
10 |
|
| D4 | If it contains chicken you will like it |
10 |
|
| D5 | Red meat is your choice every time |
13 |
|
| A4 | Eating by yourself |
20 |
|
| A2 | The overall volume of noise in the dining room is high |
26 |
|
|
Age 71+ |
|||
| Additive Constant |
71 |
29 |
|
| C7 | Having the option for ordering smaller portions of the items on the menu |
10 |
|
| E4 | You prefer food that is under-salted |
10 |
|
| D5 | Red meat is your choice every time |
11 |
|
| E2 | Foods with soft textures are your preference |
12 |
|
| A4 | Eating by yourself |
15 |
|
| E7 | You enjoy hot and spicy flavors |
18 |
|
| A2 | The overall volume of noise in the dining room is high |
26 |
Both ages want ‘Food is served hot out of the oven every time’. In terms of emotion, there is only one delighter, that for the older respondent: Having the option for ordering smaller portions of the items on the menu
Mind-sets Based on the Patterns for Importance, and the Patterns for Emotions
The foregoing analysis of the models suggests that there are modest differences between complementary groups, when these groups are self-defined. A fundamental principle of Mind Genomics is that people differ from each other in terms of patterns of judgment about the events of the everyday. Mind Genomics looks at inter-individual variation from the ‘bottom-up’, viz., for the particular topic [9].
When applied to the topic of senior communal dining, we can divide the respondents by either the pattern of what is important, the pattern of what drives positive and negative emotions, or a combination of both. The computational approach is the same; create individual level models relating the presence/absence of the elements to the dependent variable and then cluster the respondents on the basis of the patterns of the coefficients.
There are a few modifications to the modeling done to make the results simpler to work with.
- Begin with the data from importance (TOP2). Estimate the individual-level models without an additive constant. The coefficients correlate highly when the models are estimated with an additive constant versus without an additive constant.
- Using the coefficients for TOP2 (importance), cluster the 108 respondents into two groups, and then three groups, based upon the k-means algorithm [10]. Clustering simply divides the respondents (or other objects) into a set of non-overlapping groups, based upon the pattern of their coefficients. The two-cluster solution was hard to interpret. The three cluster solution was easier. These become the three mind-sets, MS1, MS2, and MS3, respectively
- Move to the emotion data (POS, NEG). For each repondent estimate the coefficients for POS and for NEG separately. Again, do not estimate the additive constant. Combine the two sets of 35 coefficientsm to create a set of 70 coefficients. Extract three clusters, or mind-sets; MS4, MS5, and M6 respectively.
- Combine the coefficients for TOP2 (#1) with the coefficients for emotion (#3), to create a set of 105 coefficients. For this third analysis, reduce the 105 coefficients to a set of 14 statistically independent variables using principle components factor analysis [11]. The analysis creates 14 new variables, the factors, with each respondent located on these newly created variables, according to the 14 factor scores for each respondent. Then cluster the 108 respondents on these 14 new variables, to create a third group of mind-sets (MS7, MS8, MS9).
The results from the clusteriong the mind-sets appear in Tables 6-8.
Mind-Sets Created on the Basis of Importance
We focus only on groups emerging for importance, to see how they differ. The first mind-set feels that many things are important. The additive constant is 58, showing that they believe that the topic of senior communal dining to be important. Fve of the elements are important, based upon the requirement that the coefficient be +8 or higher. These respondents feel that it is service (Table 6).
Table 6: Strong performing elements based upon the coefficients for mind-sets defined by different patterns of importance (TOP2).
|
TOP2 |
||
|
Mind-Set 1 – Service is important |
||
| Additive Constant |
58 |
|
| B5 | Waiters let you substitute items such as sides and salads not included in the menu item description |
13 |
| E5 | Food is served hot out of the oven every time |
12 |
| B7 | Waiters remember the type of food or drink you like |
10 |
| B1 | Friendly waiters can really make for an enjoyable meal |
9 |
| B4 | Speedy service is important for your enjoyment |
8 |
|
Mind-Set 2 – Make the meal simple – just warm out of the oven, and that’s all |
||
| Additive Constant |
26 |
|
| E5 | Food is served hot out of the oven every time |
10 |
|
Mind-Set 3 – The experience is importance |
||
| Additive Constant |
27 |
|
| A3 | Eating with a group of friends |
10 |
| E5 | Food is served hot out of the oven every time |
9 |
| C5 | Clear and simple wording on the menu makes it easy to decide what you will order |
9 |
| A7 | Table settings (plates, silverware, tablecloth etc.) makes for an enjoyable meal |
9 |
| C3 | The amount of sodium for each item listed on the menu will help you make a choice |
8 |
The second mind-set shows a much lower additive coefficient, 26. They are not likely to think of anything as really important, except the food be warm out of the oven. The third mind-set also shows a low additive constant, 27. The elements which are important revolve around the experience itself.
The one common element which is important is E5: Food is served hot out of the oven every time.
Mind-Sets Created on the Basis of Emotional Response
Table 7 show the strong performing elements for both POS and NEG. The three mind-sets which emerge show similar additive constants. As in the case of segmenting on importance, the mind-sets differ on the elements, but the picture is less clear.
Table 7: Strong performing elements based upon the coefficients for mind-sets defined by different patterns emotions (POS, NEG).
|
|
POS | NEG | |
|
Mind-Set 4 – Picky eater, does not want to be alone |
|||
| Additive Constant |
75 |
25 |
|
| D4 | If it has chicken, you will like it |
11 |
|
| D5 | Red meat is your choice every time |
13 |
|
| A4 | Eating by yourself |
33 |
|
| A2 | The overall volume of noise in the dining room is high |
39 |
|
|
Mind-Set 5 – A good sensory experience engenders a warm feeling, but hold off on providing too much information |
|||
| Additive Constant |
73 |
27 |
|
| E1 | The aromas of herbs or spices you love |
12 |
|
| E5 | Food is served hot out of the oven every time |
12 |
|
| C3 | The amount of sodium for each item listed on the menu will help you make a choice |
10 |
|
| C4 | Listing the amount of fat in menu items helps you decide what to order |
10 |
|
| C6 | You select menu items with exotic or foreign sounding descriptions |
14 |
|
| D6 | You can’t go wrong with a simply prepared fish dish |
14 |
|
| A2 | The overall volume of noise in the dining room is high |
18 |
|
|
Mind-Set 6 – Good service, good food, good company all make for a great meal, but don’t go into specifics about the food |
|||
| Additive Constant |
68 |
32 |
|
| B5 | Waiters let you substitute items such as sides and salads not included in the menu item description |
11 |
|
| B7 | Waiters remember the type of food or drink you like |
10 |
|
| E4 | You prefer food that is under-salted |
10 |
|
| E3 | You choose food with vibrant colors |
10 |
|
| D5 | Red meat is your choice every time |
15 |
|
| A4 | Eating by yourself |
16 |
|
| A2 | The overall volume of noise in the dining room is high |
17 |
|
| E6 | You prefer food that is served warm |
18 |
|
| E2 | Foods with soft textures are your preference |
25 |
|
| E7 | You enjoy hot and spicy flavors |
33 |
The one common element is A2, The overall volume of noise in the dining room is high’. This element consistently drives a negative emotion.
The three mind-sets do not share the same elements as delighters, viz., drive a strong positive emotional response.
Mind-Set 4 shows no delighters
Mind-Set 5 suggests delight with sensory experience
Mind-Set 6 suggests delight with good service
Avoid specifics.
It is important to emphasize that the segmentation by pattern of emotional response fails to reveal many delighters, at least among this age group. There are, however, many elements which drive a negative emotion.
Is there any Benefit to Segmenting by Both Intellectual and Emotional Responses at the Same Time?
We need not limit cluster anaoysis to one type of variable, e.g., importance or emotion, respectively. What happens when we create a profile for each, and do the analysis simultaneously? Table 7 shows the third set of three mindsets, created from considering importance and emotion jointly. Rather than providing a richer set of results, combining two measures, importance and emotion, ends up generating a demostrably more sparse set of results, harder to understand. There is nothing new which emerges. The same delighters emerge (viz., choice in what one orders). These results suggest it is better to work separately with intellectual dimensions (viz., importance) and with emotional dimensions, respectively.
Composition of the Mind-sets
An onpoing issue in consumer research is the whether there is a strong relation between standard demographics and other information gathered for a respodent and membership in a specific mind-set. One might expect there to be, but the data from 30+ years of Mind Genomics and its predecessor research suggest that the simple co-variation is not the case. Who a person IS does not covary in a simple way with how a person THINKS. One might be able to create a predictive model using statistics, but the model is usually descriptive, works in a limited way, and does not necessarily have any value other than ability to predict.
Table 8 shows once again that although one can readily create apparently meaningful mind-sets from the coefficients (viz., the underlying response patterns), but there is little in the way of covariation of these mind-sets with the different ways of dividing the respondent as the respondent identifies herself or himself; gender, age, marital status, eating patterns, or health issues (Table 9).
Table 8: Strong performing elements based upon the coefficients for both importance (TOP2) and emotional response (POS, NEG).
| TOP2 | |||
|
Mind-Set 7 – Joint Mind-Set (Service and warm food) |
|||
| Additive Constant |
42 |
||
| B1 | Friendly waiters can really make for an enjoyable meal |
12 |
|
| E5 | Food is served hot out of the oven every time |
11 |
|
|
Mind-Set 8 – Joint Mind-Set (warm food) |
|||
| Additive Constant |
32 |
||
| E5 | Food is served hot out of the oven every time |
15 |
|
|
Mind-Set 9 – Joint Mind-Set (Easy to decide and to customize) |
|||
| Additive Constant |
40 |
||
| C5 | Clear and simple wording on the menu makes it easy to decide what you will order |
11 |
|
| B5 | Waiters let you substitute items such as sides and salads not included in the menu item description |
9 |
|
|
POS |
NEG | ||
| Mind-Set 7 – Joint Mind-Set (Service and warm food) |
|
||
| Additive Constant |
81 |
19 |
|
| B5 | Waiters let you substitute items such as sides and salads not included in the menu item description |
11 |
|
| A2 | The overall volume of noise in the dining room is high |
34 |
|
| A4 | Eating by yourself |
41 |
|
|
Mind-Set 8 – Joint Mind-Set (Warm food) |
|||
| Additive Constant |
72 |
28 |
|
| E5 | Food is served hot out of the oven every time |
14 |
|
| C7 | Having the option for ordering smaller portions of the items on the menu |
11 |
|
| C1 | Nutritional information on the menu to help you make your selections |
11 |
|
| A2 | The overall volume of noise in the dining room is high |
14 |
|
| C6 | You select menu items with exotic or foreign sounding descriptions |
15 |
|
| E7 | You enjoy hot and spicy flavors |
18 |
|
|
Mind-Set 9 – Joint Mind-Set (No delighters) |
|||
| Additive Constant |
61 |
39 |
|
| A4 | Eating by yourself |
10 |
|
| E7 | You enjoy hot and spicy flavors |
11 |
|
| D2 | You enjoy vegetables that are thoroughly cooked |
14 |
|
| D4 | If it contains chicken, you will like it |
15 |
|
| D6 | You can’t go wrong with a simply prepared fish dish |
15 |
|
| E2 | Foods with soft textures are your preference |
16 |
|
| D7 | You like large portions of food |
18 |
|
| D5 | Red meat is your choice every time |
27 |
|
| A2 | The overall volume of noise in the dining room is high |
31 |
Table 9: Composition of the mind-sets based on how the respondent self-defines herself or himself.
|
Mind-Sets based on Importance |
Mind-Sets based on POS NEG Emotions | ||||||
| Base Sizes | Total | MS1 | MS2 | MS3 | MS4 | MS5 |
MS6 |
| Total Panel |
108 |
41 | 36 | 31 | 44 | 32 |
32 |
| Gender | |||||||
| Male |
66 |
29 | 22 | 15 | 26 | 22 |
18 |
| Female |
42 |
12 | 14 | 16 | 18 | 10 |
14 |
| Age | |||||||
| Age 65-70 |
72 |
28 | 21 | 23 | 25 | 21 |
26 |
| Age 71+ |
25 |
7 | 11 | 7 | 13 | 8 |
4 |
| Marital Status | |||||||
| Married |
66 |
27 | 24 | 15 | 27 | 17 |
22 |
| Single |
42 |
14 | 12 | 16 | 17 | 15 |
10 |
| Frequency of Eating | |||||||
| Day/3 Meals |
59 |
27 | 18 | 14 | 24 | 14 |
21 |
| Day/2 Meals |
43 |
13 | 15 | 15 | 18 | 15 |
10 |
| Health Issues | |||||||
| Cholesterol |
108 |
41 | 36 | 31 | 21 | 15 |
16 |
| Blood Pressure |
56 |
18 | 19 | 19 | 21 | 14 |
21 |
| Heart Disease |
20 |
3 | 7 | 10 | 7 | 5 |
8 |
| Gastrointestinal discomfort |
19 |
10 | 7 | 2 | 8 | 8 |
3 |
Discussion and Conclusions
As the population ages, more of the population may be expected to move to community facilities, where the respondents will be eating food prepared by a central kitchen. Unlike community feeding in schools, the communal meals of adults may be expected to be more difficult. Adults will have had a lifetime of experience choosing their own foods. Subtle issues of satisfaction may not revolve around the food at all, but around the ambiance.
The data suggest a panoply of individual differences. For most of the world of food service, individual differences in preference end up being an annoying factor, something which reduces the ability of the food service ‘system’ to satisfy and thus to achieve a high satisfaction score [12]. When it comes to satisfaction, however, it may well turn out that the key to satisfaction is to understand the specifics of what to do, rather than the general categories of what is done. For example, Cluskey (2001) suggested that three meals rather than two meals might increase satisfaction, a suggestion which is specific, and which finds confirmation in these data [13]. Undoubtedly, there are many more such suggestions that have been made, which are lying around dormant, but potentially game-changing.
The data in this study once again suggest the need for exploratory research, with ‘cognitively rich’ material as the stimuli. Asking respondents to rate stimuli which are not specific runs the risk of missing what is really important. The research process embodied in Mind Genomics can provide a database about elements, and what is important. When the respondents evaluate the combinations, they do so in a repeatable fashion, and appear to do so validly. Yet, and suprisingly, few people appear to ‘know’ what is really important, despite experience in community foodservce. The elements selected here were chosen on the basis of what was thought to be important, but surprisingly, the results suggest only a few elements stand out, not many delighters, and some but not many which are important.
As a closing note, it is worth noting that the Mind Genomics platform, as constituted as of this writing (Fall, 2021) makes it feasible, straightforward, easy and affordable to do dozens, if not hundreds of similar studies in a short period of time, to create a wiki of the mind for ‘senior communal feeding.’ The opportunity for such an effort is being recognized as the natural outgrowth of qualitative research, and quantitative research [14-16].
Acknowledgment
The data for this paper were first presented at the Pangborn Conference, Toronto, Canada, September, 2011, and then reanalyzed for this paper. The authors wish to acknowledge the original contributions of Christopher Loss of Cornell University, for the original work presented in 2011.
References
- Brecht SB, Fein S, Hollinger-Smith L (2009) Preparing for the future: Trends in continuing care Retirement Communities. Seniors Housing & Car Journal 17: 1.
- Seo S, Shanklin CW (2006) Important food and service quality attributes of dining service in continuing care retirement communities. Journal of Foodservice Business Research 8: 69-86.
- Moskowitz HR (2012) ‘Mind genomics’: The experimental, inductive science of the ordinary, and its application to aspects of food and feeding. Physiology & Behavior 107: 606-613. [crossref]
- Moskowitz HR, Gofman A, Beckley J, Ashman H (2006) Founding a new science: Mind genomics. Journal of Sensory Studies 21: 266-307.
- Hinkelmann K, Kempthorne O (2007) Design and analysis of experiments, volume 1: Introduction to experimental design. John Wiley & Sons.
- Becker-Suttle Cheri B, Pamela A Weaver, Simon Crawford-Welch (1994) A pilot study utilizing conjoint analysis in the comparison of age-based segmentation strategies in the full service restaurant market.” Journal of Restaurant & Foodservice Marketing 1: 71-91.
- Sun YHC, Morrison AM (2007) Senior citizens and their dining-out traits: Implications for restaurants. International Journal of Hospitality Management 26: 376-394.
- Gofman A, Moskowitz H (2010) Isomorphic permuted experimental designs and their application in conjoint analysis. Journal of Sensory Studies 25: 127-145.
- Saulo AA, Moskowitz HR (2011) Uncovering the mind-sets of consumers towards food safety messages. Food quality and preference 22: 422-432.
- Likas A, Vlassis N, Verbeek JJ (2003) The global k-means clustering algorithm. Pattern Recognition 36: 451-461.
- Ringnér M (2008) What is principal component analysis?. Nature Biotechnology 26: 303-304.
- Seo SH (2006) Perception of foodservice quality attributes of older adults: compared by lifestyle and dining frequency in continuing care retirement communities. Korean Journal of Community Nutrition 11: 261-270.
- Cluskey M (2001) Offering three-meal options in continuing care retirement communities may improve food intake of residents. Journal of Nutrition for the Elderly 20: 57-62.
- Porretta S (2021) The changed paradigm of consumer science: From focus group to Mind Genomics. In: Consumer-based New Product Development for the Food Industry, 21-39. Royal Society of Chemistry.
- Bakar AZA (2013) Dining at continuing care retirement communities: A social interaction view. Kansas State University. PhD thesis.
- Christine Sun YH (2008) Dining-in or dining-out: Influences on choice among an elderly population. Journal of Foodservice Business Research 11: 220-236.