Abstract
Mind Genomics was used to assess the response of ordinary people to different prospective strategies involved with the nuclear deal with Iran, in 2016. Each respondent read a unique set of 25 small vignettes comprising systematically varied messages about the nuclear deal, rating each on likelihood for an agreement, and expected emotional response from Iran. From the set of 20 elements only seven elements performed strongly, but not among the total panel, only among emergent mind-sets. These were MS1 (Focus on military aspects, specifically prevention, n = 29 respondents), MS2 (Focus on economic development, n=45), and MS 3 (Focus on effective negotiations and diplomacy, n=11). Most of the emotional reactions were negative. The paper suggests that Mind Genomics be used as an iterative, low cost, rapid fashion, to identify strong negotiating points, base upon the mind of the average citizen. The iterations each lasting 3-4 hours, with several iterations possible in a day at low cost, and with deep learning may radically change the process of negotiation. Mind Genomics identifies what specific messages ‘work’. The process can evolve to a joint effort by both parties to the disagreement, and by so doing craft an agreement attractive to both sides, an agreement emerging from the positive responses of the citizens of both sides
Introduction
The world of US policy the domain of the three branches of the government, and in practice the domain of a host of consultants and others helping to formulate the policy. Often the policy seems well thought out, other times the policy seems to be either poorly thought out, or more of concern, the influence of various parties which dictate aspects of policy for their own interest.
The topic of this paper is the introduction of a tool, Mind Genomics, to help formulate policy by understanding the ‘mind’ of the average citizen, in a way that could tap into the ‘wisdom of the crowd’, and become an iterative, affordable, rapid tool to help policy formulation.
We illustrate the approach by a study run five years ago on responses to policy about Iran. The objective of the study was to demonstrate the potential of what one could learn in a matter of two days, a time that would be shortened to period of 2-4 hours as of this writing (Fall, 2021). The topic of what to do with the fractious government of Iran continues to rear its head. At the original time of the experiment, the last months of the Obama administration, the issue was raised as to what could be done to deal effectively with Iran. Donald Trump was in the midst of pre-election efforts. The research was done to identify key issues and what people wanted as support for the Republican party.
Formulation of Public Policy with the Aid of Polls
Public policy is often announced by a spokesperson for the committee putting forward that policy. It is obvious from the reports both before, and during the birth of the policy, that the policy was ‘crafted’ by a group, and that often the group is bipartisan. There is the phrase ‘horse-trading’ to discuss the back-and-forth negotiations.
At the same time, in the world of politics, whether for candidates or for political issues there are two worlds intertwined. One world is the world of experts, such as individuals from so-called think tanks, who come up with the recommendations. In the United States these individuals are disparaging called ‘Beltway Bandits’, because are housed near Washington. The experts are highly paid to work with the lawmakers and policy makers, to give advice (Alden & Aran, 2016; [1]. Occasionally, scientists enter the process as well because the issue is technical [2].
At the same time there are the pollsters, who measure public opinion, attitude. The emphasis here is on accurate measurement. Occasionally these pollsters might be asked to consult on policy, but their expertise is accurate measurement. The measurement may occur with well conducted local and national polls, focus groups, individual depth interviews, perhaps coupled with their own observations of what is happening at the time they are doing the research [3].
There are two languages in policy, the language of artisanship in the creation, and the language of statistics and measurement in people’s response to the creatin. The language of policy creation is the language of the artisan shop, where the policy is ‘crafted,’ ‘hammered out’, etc., through the interactions and efforts of the individuals involved. The policy is ‘created’ by those tasked with the job. We can contrast this policy of ‘artisanship’ with the language used in measuring responses to the policy, the language of statistics, polls, degree of confidence, measurement of trends, and assignment of reasons for specific patterns of people’s response to the policy. Furthermore, he two languages do not overlaps. There is not much published in terms of scientifically guided iterations in the development of the artisan-crafted policy. The two worlds are different, creation and measurement.
In contrast to the above is the world of product design, especially the world of software design, but engineering in general. The product may be created by an artisan, but that product is special, one time. The true effort is to create products which work, products that have been created by iterations, with the creation coming first, then the testing, then the revision, and the testing again [4]. The key word is ‘testing as part of the iteration,’ something that is not heard publicly in the world of government policy
A search through the literature reveals a moderate number of papers on policy, but almost none on measurement during the course of policy development in the way that one might iterate in the creation of software. We might we be in different worlds. Policy again and again seems to be crafted as a one-tine reaction, rather than being quickly evolved from iterations and testing propositions in the policy. It is that opportunity, creation and optimization through iteration, which constitutes the contribution of this paper.
Beyond Polls to Experimentation
The notion of experimentation in political science seems at first strange, simply because one thinks of the political order as an emergent, resulting from the confluences of forces and the ‘Zeitgeist,’ the spirit of the times. Philosophers have debated the nature of the political orders, the classes of political orders, and of course both the assumed ‘original political order of man’ (if there ever was one), and the most appropriate political order for a society. The important thing to note is that political order is so critical that it begs for study, whether for itself or knowledge of which allows one to achieve one’s goals.
At the same time, during the past decades there has emerge a notion of experimentation, and the idea of an experimental political science, perhaps of the same type as experimental psychology. The difference is where the material is published, and the nature of the published material. Experimental psychology began to emerge in Germany almost two centuries with the publication of Ebbinghaus’ book ‘On Memory’. The book was filled with the results of experiments, with data that could be studied, reanalyzed, challenged, and ultimately replicated or not.
We can contrast the early beginnings of experimental psychology with the beginnings of experimental political science, whose material appears in book after book, as points of view, substantiated with one or two experiments, or better rethinking of data [5,6]. There are no standard experiments in political science, experiments which constitute the basis of the science. Rather, there is talk, philosophical point of view, the need and from time-to-time re-presenting data, cast in this new light of experimentation. In other words, experimental political science is very much alive, but as hope for the future, not as a daily, simple, scalable system for producing data and knowledge. We are just not ready although the interest is certainly real, as shown by the intellectual vibrancy of the topic, a ‘must’ for breaking through into new territory [7-9].
The Mind Genomics Approach
Mind Genomics is an emerging science with roots in experimental psychology, marketing research and public polling. The fundamental nature of Mind Genomics is of a science of experimentation which discovers the mind of people with respect to a specific micro-topic. The key word is micro-topic, a focus on easy-to-understand ideas. The objective is to quantify decision making from the bottom up, and identify coherent groups, ‘mind-genomes’, based upon different, recurring patterns describing how individuals make judgments about the world of the everyday [10,11].
The part of Mind Genomics emerging from experimental psychology is the focus on the measurement of ideas, the inner psychophysics as it was called by modern day psychophysics pioneer, S.S. Stevens of Harvard University. Psychophysics itself is the search for lawful relations between physical stimuli and subjective responses, so-called outer psychophysics. It is the aspects of psychophysics to which most scientists familiar with psychology and referring to when they refer to psychophysics. Inner psychophysics, Stevens’ dream, was to apply metrics to ideas, to measure ideas.
The part of Mind Genomics emerging from consumer is the use of mixtures of test stimuli which simulate real world stimuli have cognitive meaning. One of the tools of consumer research, coincidentally developed by experimental psychologists Luce and Tukey is ‘conjoint measurement,’ the evaluation of mixtures of stimuli, and the estimation of the contribution of each element in the mixture to the overall response. In the world of commerce, mixtures are importance. They are the substance of which products and services are composed. We don’t buy single ideas, but rather combinations of features and benefits embedded in a product or a service.
The Seven Steps
Mind Genomics follows a templated process comprising seven steps. The steps begin with the creation of raw material, and finish with the identification of strong performing elements, among defined groups of respondents, including new-to-the-world groups of respondents who can be shown to think alike on this topic. The output of the Mind Genomics study may find use in driving a better program of communication of one’s product, or part of an academic effort to create the ‘wiki of the mud for a set of related issues’
Step 1: Define the Problem, Create the ‘Raw Material’, Defined as a Set of ‘Questions’, and a Specified Number of Answers to Each Question
The Mind Genomics effort is an experiment, rather than a questionnaire, although Mind Genomics has often been defined in public terms as a survey’.
The essence of Mind Genomics is to measure responses to defined stimuli, viz., combinations of messages, these combinations called vignettes. The vignettes are combinations of statements about the topic, in our case policy towards Iran. As a consequence, the Mind Genomics process prescribes the raw material, namely the topic (Iran), a set of ‘questions’ or ‘categories’ which in sequence describe or tell a story, and for each question or category, an equal number of ‘answers.’
The approach for finding the raw material may range from sheer expertise and ‘off the cuff’ to serious research into what is in published. With the growing interest in Mind Genomics as a fast, iterative process, the movement is towards simple, superficial ideas, some based upon what has been seen or read in public sources, the others based upon one’s own ideas, or the ideas of a creative group, thinking about the topic.
Table 1 shows the list of elements. The structure of the table, four questions, five answers per question, is based on the one of the designs of the Mind Genomics system. The elements were created by author Bitran based upon his on strategic analysis work with his program, Enterprizer(r). It is important to keep in mind that Mind Genomics is a tool which puts the elements to a hard test, as we will see below. The iterative nature of Mind Genomics will allow strong elements to emerge. At the same time, however, the Mind Genomics system is not ‘creative’. And so, a good knowledge of the topic is helpful but not a requirement.
Table 1: The five questions (categories) and four answers (elements) for each question.
| Question Non-Aggression Pact | |
| A1 | Non-aggression pact signed by ALL countries … those affiliated with Iran and as well those left out. Examples of affiliated – Syria, Lebanon, Palestine. Examples of those left out – Egypt, Israel, Saudi Arabia, Arab Emirates |
| A2 | Non-aggression pact signed by ALL countries NOT AFFILIATED with Iran and Egypt, Israel, Saudi Arabia, Arab Emirates |
| A3 | Bilateral non-aggression pact between all pairs of Arab countries involved |
| A4 | Bilateral non-aggression pact between all pairs of Arab countries involved, and with Israel as well |
| B – Middle East Security Agreement | |
| B1 | Innovative US Policy … advancing economic prosperity & security (for Egypt, Israel, Jordan, Saudi, Emirates) |
| B2 | Create strategic alliances among the group (Egypt, Israel, Jordan, Saudi, Emirates) |
| B3 | Cyber Protection Policy to protect the signing group from cyber disruptions of critical national ‘infrastructure’ |
| B4 | Regular meetings to understand current situations and threats, with feedback to improve policy |
| C – Middle East Free Trade Region (Egypt, Israel, Saudi, Emirates, with Iran option) | |
| C1 | Middle East Free Trade Area can include Iran if it signs new agreement |
| C2 | No BDS (Boycott, Divestment, Sanctions) among Egypt, Israel, Saudi, Emirates |
| C3 | Economic development initiatives… job creation through small / medium companies |
| C4 | International innovation zones in each country…attract corporations & startups |
| D – US Foreign Assistance to Promote American Values | |
| D1 | US Foreign assistance only when receiving governments commit to promote no racism & anti-Semitism in trade and education systems |
| D2 | You get foreign aid from the US – forbid BDS against Israel (Boycott, Divestment, Sanctions) |
| D3 | All conditions must be part of every US foreign and defense program |
| D4 | American Values …. Projects/policies have to contain them |
| E – Renegotiate Iran Deal | |
| According to a recent survey by United Against Nuclear Iran, a large majority of American registered voters view Iran as the greatest state threat facing the United States. | |
| E1 | Close consultations by US with Egypt, Israel, Jordan, Saudi, Arab Emirates, who will also publicly sign the new agreement |
| E2 | Deal with Iran…Strict, REAL, proactive enforcement by IAEA (International Atomic Energy Agency). No Iranian ‘self-inspection’ |
| E4 | Deal with Iran…. Forbid Iran to transfer ballistic missiles and related technology |
| E4 | Deal with Iran …Exclude Iranian Revolutionary Guard Corps (IRGC), so they have no official standing |
Step 2: Create Short Vignettes Using Experimental Design
The world of science works by identifying a phenomenon of interest, defining aspects of the phenomenon to be studies, and when possible, isolating those aspects of interest, and measuring them. The aim is to determine the nature of the variable of interest. Doing so means reducing the haze around the variable, the random variation which hides that nature of the variable. The variability itself is unwanted and eliminated through research. The two strategies are to isolate the variable, eliminating extraneous forces which lead to variation, or measure the variable many times, under different situations, and average out the unwanted variation.
When we deal with issues of foreign policy and break out the issues into elements such as those shown in Table 1, the typical research strategy would be to polish each element so that each element is as clear as possible, and as simple to understand as possible. That corresponds to the first effort, measuring the variable which has been made as simple as possible, so other factors do not affect the results. The second is to test that single idea with hundreds of people, one idea at a time with each of the hundreds of people. Averaging the results from the large group should provide a stable measure of the response to the variable.
The one-at-a-time method dictates that the researcher presents the respondent with each of the elements, one element at a time as the phrase says. The respondent is instructed to maintain the same criterion, and with that one criterion rate the element. It does matter whether the element is positive, negative, deals with peace, deals with conflict; the respondent is to use the same rating scale all the time.
An ongoing problem in the on-at-time research is the unnaturalness of single elements. There is no context. The rating is easier when all of the test stimuli, the elements, are of the same type, such as military alliances, or economic alliances, educational strategies, and so forth. The respondent reads the elements, all of the same time, and has no problem evacuating the elements themselves. They are commensurate with each other. The problem arises when the elements are different. The differences may be vast, such as economic policy versus military policy. Although the researcher can instruct the respondent to use the same criterion, it is not clear that the respondent can actually do so.
A better approach, one which removes some of the artificiality of the one-at-a-time method, works by creating combinations of ideas. This is the approach used by Mind Genomics. Rather than forcing the respondent to maintain the same criterion with palpably different types of statements, Mind Genomics puts together the ideas or statements into small easy to read combinations, such as that shown in Figure 1. There is no effort to polish the combination, or to create connectives so that the combination is even more natural looking, appearing like the paragraphs that the respondent is comfortable evaluating. Although the critic might aver that the combination is not polished, that there are no connectives, that some of the laws of grammar are violated, the reality is that the combination forces the respondent to adopt one criterion and keep it b3cuase it is impossible in a Mind Genomics experiment to continue to shift judgment criteria to match what ends up seeming to be an ever-changing set of random combinations of ideas. The easiest way is to maintain one’s judgment criteria in the face of ever-changing combinations.
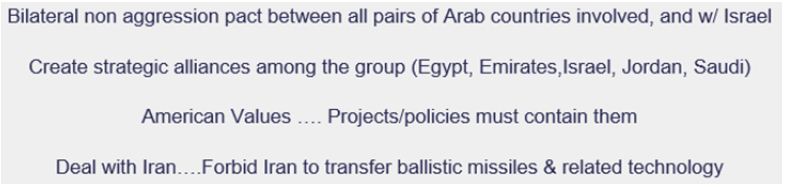
Figure 1: Example of a four-element vignette. Each respondent evaluates 25 unique vignettes. The vignettes for each respondent differ from each other.
The combinations themselves may appear to the respondent to be utterly random. Nothing can be further from the truth. The combinations are created according to an experimental design (Gofman & Moskowitz, 2010). The experimental design comprises specific combinations, allowing the variables to interact, but making sure that the 20 elements in this particular case are presented iso that they are statistically independent of each other. That statistical independence is accomplished by the specific combinations. The design comprises 25 combinations or vignettes. Each vignette has a specified number of elements, at most one element or answer from any question.
The vignette structure is:
Two elements in the vignette – 2 of 25 vignettes
Three elements in the vignette – 4 of 25 vignettes
Four elements in the vignette – 11 of 25 vignettes
Five elements in the vignette – 8 of 25 vignettes
Although some critics might aver that the vignette has to be complete, with one element from each of the five categories, the reality is that respondent have no problem dealing with the sparser vignettes. The problem is the attitude of the researcher who wants completeness.
The basic design of 20 element embedded in 25 vignettes is a very efficient design. The breakthrough is design came around 1998, when the notion emerged of a permutable design. That is, one could create the basic mathematical structure of the design, specifying the combinations, and so forth. Once this was done, i was simple and straightforward to create a basic design, and then permute it, changing the elements, but maintaining the design structure. That meant renumbering the elements but keeping the elements in the same category. Thus, A1 would become A2, A5 would become A4, and so forth. The renumber would be done for all elements. This strategy, described in detail by Gofman and Moskowitz (2010), maintained the structural integrity of the experimental design, but recrafted the design slightly to cover many more of the possible combinations.
Figure 1 shows an example of a four-element vignette. The physical layout is simple, one phrase atop the other. There is no indication of categories or questions, simply a combination of the elements. No effort is made to connect the combinations.
Step 3 -Execute the Study (viz., Experiment) Online
The actual study was executed through an on-line panel provider, specializing in recruiting respondents and providing them for these studies. The company, Luc.id Inc., in Louisiana, USA, is an aggregator of respondents from various panels. Working with a panel provider such as Lucid. makes the process easy. Over the past two decades it has become increasingly difficult to recruit one’s own panelists, especially for interview or experiments lasting 10+ minutes. The refusal rate has skyrocketed. As a consequence, the panel providers can deliver a group of respondents, generally filling easy specifications, for a reasonable price.
The respondents were invited to participate. The respondents were shown the following orientation. Note that a link was given for further reading about the JCPOA.
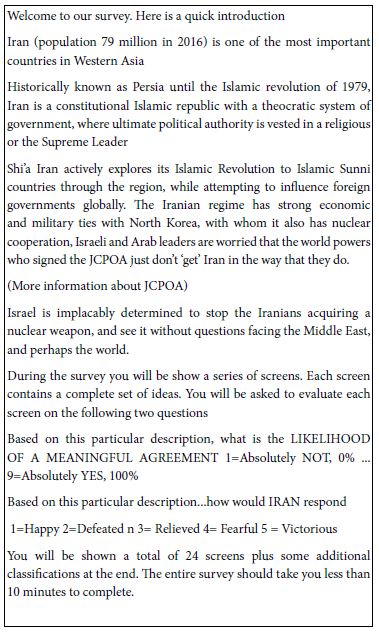
By way of background Wikipedia as this this writing (Fall 2020) presents a background to the JCPOA, the Joint Comprehensive Plane of Action, which was signed in 2015.
Under the JCPOA, Iran agreed to eliminate its stockpile of medium-enriched uranium, cut its stockpile of low-enriched uranium by 98%, and reduce by about two-thirds the number of its gas centrifuges for 13 years. For the next 15 years, Iran will only enrich uranium up to 3.67%. Iran also agreed not to build any new heavy-water facilities for the same period of time. Uranium-enrichment activities will be limited to a single facility using first-generation centrifuges for 10 years. Other facilities will be converted to avoid proliferation risks. To monitor and verify Iran’s compliance with the agreement, the International Atomic Energy Agency (IAEA) will have regular access to all Iranian nuclear facilities. The agreement provides that in return for verifiably abiding by its commitments, Iran will receive relief from the U.S., European Union, and United Nations Security Council nuclear-related sanctions.
https://en.wikipedia.org/wiki/Joint_Comprehensive_Plan_of_Action
The study was complete by 85 respondents, recruited by Luc.id. The base size of 85 suffices for a simple but often deep focus on the topic. The reason for the need for fewer than the hundreds of respondents in conventional survey work is that the research is searching for patterns, not for a precise measure of one point.
Step 4: Prepare the Data for Analysis by Creating New Binary Variables
The Mind Genomics exercise produces a great deal of data, since each of 85 respondents evaluated 25 different vignettes on two types of attributes, a degree of belief in the meaningful agreement (1=Definitely No … 9 = Definitely yes) and a selection of the emotion that would be felt by Iran, if Iran were a person.
Our goal is to link the 20 elements to the ratings and the emotions. We do that in the next section. In this first section we transform the 9-point rating to a no/yes scale. Managers find it easier to work with binary scale, rather than to talk in percentages. Following the convention of previous efforts with Mind Genomics and the 9-point scale, we recode ratings of 1-6 to 0 (low probability), and ratings of 7-9 to 100 (high probability). The recoding could be made more stringent or less stringent. There is no ‘right answer,’ just appeal to previous processes. We do the same type of recoding for the emotions. We recode emotions as positive) negative). (Positive: Happy, Relieved, Victorious; Negative: Defeated, Fearful)
Thus, each vignette ends up with three numbers. One for the binary recode for probability of meaningful agreement, one for a positive emotion, and the complement for a negative emotion. The numbers are either 0 or 100. When it comes to the positive versus negative emotion, one of the two variables will take on the value 100, and the other by definition will take on the value 0
Finally, vanishingly small random number is added to every newly created binary scale. This random number does not affect the results but does avoids a problematic statistical issue emerging from OLS (ordinary least0squares) regression occurring when the respondent selects all ratings for question 1 (meaningful agreement) either 1-6 or 7-9 (all 0’s or all 100’s across the 25 vignettes) or select all emotions as positive or all emotions as negative.
Step 5: Compute Means for to Better Understand the Patterns of Responses
By Step 5 we have already put the data into a form that makes it easy to compare average ratings (the focus of this step), and to link the elements to response (focus of Step 6).
We can explore the quality of the data by computing averages, considering both the number of elements in a vignette as a stratifying variable, and considering the order of testing as a stratifying variable. Even without knowing which elements are present in a vignette, we can ask whether there are any differences in the average ratings assigned to vignettes of 2,3,4 or 5 elements respectively, in terms of the binary transform of likelihood of agreement (TOP 3), and for the average Positive and average Negative emotions.
To answer the foregoing questions means simply to identify each vignette in two ways, first by the number of elements (2, 3, 4 or 5, respectively), and second by the position in the respondent’s sequence (first third, second third, final third).
Table 2 that there is no difference by position in terms of how it covaries with either likelihood to reach agreement (Q1) of emotion selected.
Table 2: Average values for TOP3 (likelihood of an agreement), and emotions selected (positive, negative) versus order of testing, and the number of elements in a vignette.
|
Q1 Top 3 |
Positive Emotion |
Negative Emotion |
|
| Order in the sequence of 25 | |||
| Vignettes 1-8 |
35 |
48 |
52 |
| Vignettes 9-16 |
30 |
47 |
53 |
| Vignettes 17-25 |
32 |
48 |
52 |
| Number of elements | |||
| 2 |
38 |
55 |
45 |
| 3 |
33 |
53 |
47 |
| 4 |
31 |
48 |
52 |
| 5 |
32 |
42 |
58 |
Table 2 also shows no effect of number of elements in terms of affecting the likelihood to reach agreement. There is, however, a quite strong and inverse covariation between the number of elements in the vignette and the selection of a positive emotion. Shorter vignettes are perceived as more likely to generate a positive emotional response by Iran, perhaps because the terms are defined, and the permission is direct. That is, shorter vignettes may leave less ‘wiggle room’, ‘and less ‘fine print’ in the agreement.
The final topic of our surface is analysis is to get a sense of how the respondents feel about what they are reading. Question 1 allows us a sense of whether respondents feel optimistic about the process, viz., that it will happen, or feel pessimistic. Question 2 give us a sense of their emotions. Let us average the ratings from their reactions to their own 25 vignettes, independent of what is in the vignettes. (Although, we know that each element appears equally often in the 25 vignettes; it’s just the combinations which vary).
Figure 2 shows a scatterplot of the average score for ‘reach agreement’ (% rating 7-9) vs. the average percent of selections of a positive emotion. Figure 2 shows a concentration of respondents on the left, with low average value of TOP3. We conclude from this that the individual respondents, on average, feel that the agreement will not be reached. There is no sense, however of a preponderance of emotions. Respondents simply do not seem to be able to figure out what the feelings of the Iranians will be a finding which should not surprise. Response can feel strongly about the outcome but not feel strongly about the expected feelings emerging from that outcome.
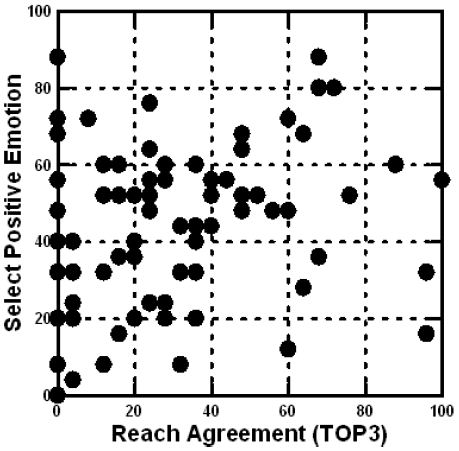
Figure 2: Scatterplot showing the average ratings for reach agreement (abscissa, TOP3) versus the percent of times that a positive emotion will be experienced by the Iranians.
Step 6 –Relate the Elements to the Ratings
As of today’s state-of-the-art, the pinnacle of the analysis is the ability to relate the presence / absence of the 20 elements to the response, whether the response be the TOP3 (strong likelihood of that there will be an agreement), or the selection of a positive emotion, and finally the selection of a negative emotion. Mathematically, the selection of positive versus the selection of negative emotions are complements of each other. We will be dealing with both, because in our presentation of data will look only at strong performing elements driving positive emotions, and strong performing emotions driving negative emotions, and in turn NOT presenting data from elements which do not strongly engage of or the other.
The experimental design allows us to create both group models and individual-level models relating the presence/absence of the 20 elements to the response. The original design was set up to allow a simple regression equation to describe the data: Response = k0 + k1(A1) + k2(A2) … k20(E4). Recall that each respondent evaluated a unique set of 25 vignettes, comprising a permuted variation of the original design, a variation known to ‘work’, viz., to mathematically identically to the original design.
The first analysis created models relating the presence/absence of the elements to the actual rating of Question 1 on the 9-point scale. Although we will be looking at a transformed variable (TOP3 instead of the 9-point rating), it is instructive to see the degree to which our 85 respondents generate data which is consistent. We measure consistency by estimating the equation, and computing the goodness of fit, the multiple R, the multiple correlation. The multiple R goes from 0.00 (no fit of the variables to the ratings; totally inconsistent results) to +1.00 (perfect fit of the variables to the ratings, totally consistent results which trace the ratings precisely to the presence/absence of the elements).
Figure 3 shows the distribution of the 85 ratings. We can feel confident about the data. Even though most respondents feel that they are ‘guessing’, that they cannot figure out the ‘correct answer,’ our estimation of consistency suggests that the results are reasonably consistent.
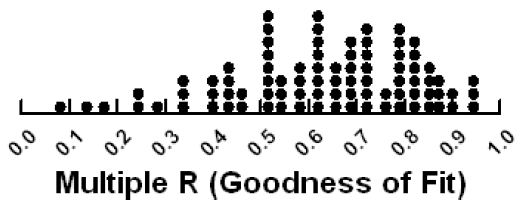
Figure 3: Consistency of the results for the 85 respondents, shown by the Multiple R statistic estimated from the individual-level multiple linear regressions.
Step 7: Divide the Respondents by the Pattern of the Coefficients to Create Mind-sets
Our last analysis divides the respondents by the pattern of their coefficients. For each respondent we create a model or equation whose dependent variable is TOP3, previously defined as taking on one of two values. The values depend upon the original rating of Q1, the probability of reaching an agreement. Recall that ratings of Q1 1-6 were coded 0, ratings of 7-9 were coded 100.
The database generated from the individual-level regressions comprises 85 rows, one row corresponding to each respondent. Each row comprises 21 columns, one column for the additive constant, and 20 columns for the 20 coefficients. The objective of clustering is to divide this group of 85 ‘objects,’ viz respondents into a limited number of non-overlapping groups, the clusters or mind-sets, based upon a mathematical criterion. The criterion does not require the researcher to know the ‘meaning’ of the measures, viz., in this case the coefficients, but simply to have each object quantified on each measure. Thus, we have 85 objects (people) on 20 measures (coefficients). We do not consider the additive constant in the process.
The clustering program is a heuristic. There are many different clustering programs. The program used here is k-means (Likas et. al., 2003), with the objective of putting the 85 people into either two groups (analytic pass 1) or three groups (analytic pass 2). The criteria are that the profiles of the 20 averages (one per coefficient A1-E4) should be ‘far away from each other’, and the distance between the objects or people in a cluster should be as small as possible. The criterion for distance is (1-Pearson Correlation Coefficient, R). The Pearson R shows the strength of a linear relation between two variables, taking on the value +1 (viz., Distance = 0) when they are perfectly linearly related, and taking on the value -1 (viz., distance = 2) when they are perfectly inversely related Our criteria for choosing the ‘best’ number of clusters combines a desire for parsimony (fewer clusters are better than more clusters), and interpretability (the clusters must tell a coherent story, and the stories of the clusters must differ from one another).
The two-cluster solution, although parsimonious, seemed too jumbled. There was no clear story. The three-cluster solution seemed a bit better. A four-cluster solution was virtually no different in types of groups than the three-cluster solutions. That is, two of the clusters in the four-cluster solution seemed quite similar. The decision was to work with a three-cluster solution.
In the language of Mind Genomics, the cluster becomes a mind-set, a way of responding to a limited set of related stimuli. The min-sets are constructed from the patterns of the coefficients form the 85 respondents who participated in this study. Over the years, the mind-sets which emerge from these focused, quite small studies, continue to repeat. The repetition comes about because when we abstract the type of individual based upon the pattern of responses, we end up with just a few really quite different groups. The psychologists called the ‘archetypes’, but the archetypes emerging from Mind Genomics are based on small, single-focus studies. Yet, again and again, these mind-sets continue to appear in many different ways. The great anthropologist, Joseph [12], would call this the ‘hero with a thousand faces.’
Step 8 – The Total Panel and the Mind-sets
The Mind Genomics effort naturally brings with it many numbers, for this study 21 numbers for each group, or 84 numbers for the combination of total panel and the three mind-sets. The objective of these studies is to find patterns, and not to overwhelm ourselves with numbers which may end up disguising the patterns in the dense undergrowth of numbers. To counteract the death by wall of numbers were show only positive coefficients of 8or higher. These strong performer in a Mind Genomics study. We may be losing some information by this stringent cutoff, but a coefficient of +8 or higher is strongly significant from the regression modeling, with a t statistic approaching 2.0.
Table 3 shows the total panel and the three mind-sets, created for the results from Question 1, on the likelihood of an agreement. The cluster uses the coefficient emerging when TOP3 is the dependent variable. The table shows base size first, then the additive constant, and then the strong performing elements for each mind-set.
Table 3: Performance of the strong performing elements for total panel and three emergent mind-sets. Only the seven elements with coefficients of +8 or higher are shown.
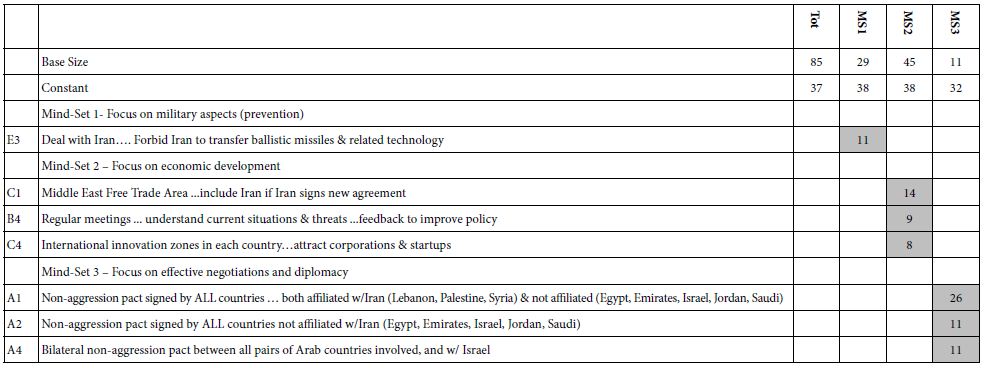
The additive constants are 32-38 meaning that without additional information, but just knowing that there are negotiations, about one in three responses to the vignettes are 7-9. We know this because the additive constant tells us the likelihood of a rating of 7-9 in the absence of elements, and is a purely theoretical, computed value. Nonetheless, the additive constant gives us a good sense of basic response. It is remarkable that all three mind-sets agree so well. This is unusual. The agreement means we are dealing with specifics.
When we look at the column for total panel, we find NO strong performing elements that disappointing finding does not mean that we failed in this attempt, although it might mean failure. Our success in the study comes after we deconstruct the total panel into the three groups, based upon patterns of coefficients, not upon magnitude of coefficients. That is, our three mind-sets would have emerged if all of the coefficients were equally reduced by 20 points. In such a case three mind-sets would emerge from the patterns, but NO elements would emerge as being strong.
Before we go into the three mind-sets, which is now quite simple, it’s worth remarking that we began with 20 elements, the best guesses from people involved. Yet, only seven of the 20 elements emerged as strong, no elements emerged as strong for total, and surprisingly, each strong performing element appeared strong only in one of the three mind-sets.
The min-sets are easy to describe. One simply looks at the strongest element.
Mind-Set 1 = Focus on military aspects (prevention) – 29 of the 85 respondents
Mind-Set 2 Focus on economic development – 45 of the 85 respondents
Mind-Set 3 – Focus on effective negotiations and diplomacy – 11 of the 85 respondents.
We move now to the elements which drive strong positive and strong negative responses. The coefficients in Table 4 emerge from six regressions. The six regression comprised three regressions for the selection of a net positive emotion, and three regressions for the selection of a net negative, in both cases two regressions for each mind-set, respectively. The regression model was run without the additive constant, because of the previously conventions in Mind Genomics practice, that emotions and other selections emerging from the nominal scales are estimated without coefficients.
Table 4: Strong positive and negative emotions selected by the respondents from the three mind-sets as they think about the feeling emerging from Iran, as driven by the element. Only coefficients of +16 or higher are shown.
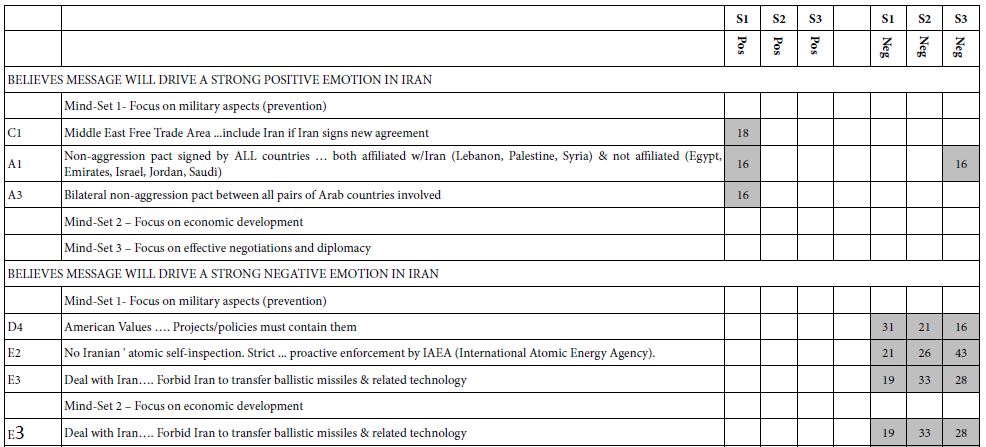
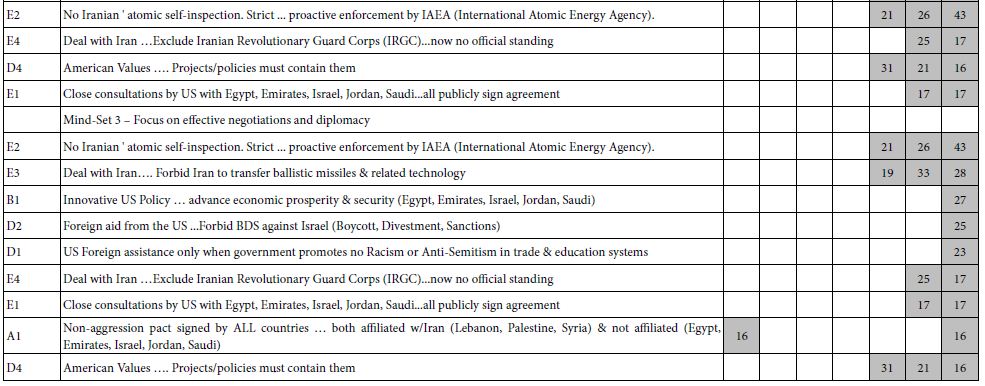
This time we look only the elements which drive a percent selection of 16% or more, for either a positive or a negative emotion. Table 4 shows us that only one mind-set, MS1 (focus on military aspects, prevention) feel that there will a strong positive response. All three mind-sets feel that there will be a strong negative emotion from Iran.
Discussion and Implications
When this study was executed in 2016, Mind Genomics was just beginnings its broader application to international relations, having begun in 2012 with studies of the Israeli Palestinian conflict. The realization at that time, confirmed by many subsequent studies in a variety of areas, is the relative paucity of solid information about the mind of the citizen in the world of social issues, the mind of the customer in the world of commerce, the mind of the patient in medicine, the mind of the client in legal and business issues, and so forth. There were dozens of polls, dozens of learned volumes on key issues, the ongoing broadcasting, and increasing ‘natter’ of the media with ‘talking head’ proclaiming the same new, spun one or another way.
A cursory content analysis of the literature, of the media, and so forth brings out facts, histories, opinions, and the voice of the citizen. The voice of the citizen, however, appears to be limited to simple factoids, statements, voting on issues. Furthermore, there seemed to be a desire to compare changes, and by that comparison to get a sense of where things were going. In other words, the focus was on the macro, with little content, and the depth was assumed to emerge by observing the path of the macro trends over time, perhaps with an effort to see how the trend covaries with exogenous factors, like world order world economics, and so forth. And perhaps even the world’s ‘Zeitgeist’ although Zeitgeist might be more the bias of the analyst than the reality of the items. There are examples of iterated efforts, such as China’s policy [13], but these iterations are large-scale, in the manner of iterating products, rather than ideas.
Enter Mind Genomics, here presented as the first experiment on international relations, at a time when Mind Genomics was conceived of as a one-off process, requiring a lot of thinking, a great deal of expertise for choosing the ‘right material’, and the careful efforts which accompany a scientific project. There were 85 respondents, rather than the customary hundreds of respondents, but that is not a problem. the problem here is the fact that the Mind Genomics study at that time was considered as a final effort, a one time ‘deep dive’ into the mind of the citizen. And the results are what they were, pointing to different mind-sets, but with remarkably few elements performing strongly, either in terms of driving agreement or driving emotions.
The methods of Mind Genomics have been proven again and again, in the legal, [14] medical [15] and commercial realms [16]. In those realms, the efforts of Mind Genomics have evolved from one-off, large-scale studies with 36 elements down to the current size of 16 elements (four questions and four answers to each question). The notion of the ‘final experiment’ has given way to Mind Genomics as a fast, iterative, learning=based process. Within that world-view, this study would be updated by a series of short studies, each requiring about 60 minutes to set up on publicly available program (www.BimiLeap.com), and then executed with 50-100 respondents automatically with 60-90 minutes, and the entire data set totally analyzed 10 minutes, and returned to the researcher. One might imagine the use of the iteration as a way both to arrive at good ideas, acceptable to both sides, as well as a consensus-building method, wherein both sides cooperate, and thus build good will.
In the evolution of political science, and the evolution of knowledge of people, these early studies by Mind Genomics of political issues show the potential of a systematic exploration of a topic. When that exploration becomes inexpensive, quick, easy to execute on the internet, and most importantly, ITERATIVE, we have the potential a new political science, one based upon data, extending across many countries, many people, over time, and many topics [17-19]. What was one study in 2016 could well generate a wiki of the mind for the topic of dealing with Iran, that ‘wiki’ filled with data, topic-related, and searchable for specific results and for general patterns [20-22].
Acknowledgments
The author would like to acknowledge the help of four associates who helped to design the study.
References
- Garrison JA (2003) Foreign policy analysis in 20/20: a symposium. International Studies Review 5: 155-202.
- Rametsteiner E, Pülzl H, Alkan-Olsson J, Frederiksen P (2011) Sustainability indicator development—Science or political negotiation? Ecological Indicators 11: 61-70.
- Gadarian SK (2010) The politics of threat: How terrorism news shapes foreign policy attitudes. The Journal of Politics 72: 469-483.
- Wynn DC, Eckert CM (2017) Perspectives on iteration in design and development. Research in Engineering Design 28:153-184
- Druckman JN, Greene DP, Kuklinski JH, Lupia A eds., (2011) Cambridge Handbook of Experimental Political Science. Cambridge University Press.
- Morton RB, Williams KC (2010) Experimental political science and the study of causality: From nature to the lab. Cambridge University Press.
- Kinder DR, Palfrey TR (1993) On behalf of an experimental political science. In: Experimental Foundations of Political Science (Kinder, D.R. and Palfrey, T.R. eds). 1-39,
- Kittel B, Luhan W, Morton R eds., (2012) Experimental political science: Principles and practices. Springer.
- McDermott R (2002) Experimental methods in political science. Annual Review of Political Science 5: 31-61.
- Gere A Radvanyi D, Moskowitz H (2017) The Mind Genomics Metaphor-From Measuring the Every-Day to Sequencing the Mind. International Journal of Genomics Data Mining IJGD-110. DOI, 10.
- Moskowitz HR, Gofman A, Beckley J, Ashman H (2006) Founding a new science: Mind Genomics. Journal of Sensory Studies 21: 266-307.
- Campbell J (1949) The Hero with a Thousand Faces, New York, Pantheon.
- Leutert W (2021) Innovation through iteration: Policy feedback loops in China’s economic reform. World Development 138: 105-173.
- Wren JE, Williams TC (2009) Selling blue elephants to the jury: Potential application of rule developing experimentation in litigation. Baylor Law Review 61: 1.
- Gabay G, Moskowitz HR (2019) “Are we there yet?” Mind-Genomics and data-driven personalized health plans. In: The Cross-Disciplinary Perspectives of Management: Challenges and Opportunities. Emerald Publishing Limited.
- Milutinovic V, Salom J (2016) Mind Genomics: A Guide to Data-Driven Marketing Strategy. Springer.
- Kaarbo, J., 2003. Foreign policy analysis in the twenty-first century: back to comparison, forward to identity and ideas. International Studies Review 5: 156-202.
- Horiuchi Y, Smith DM, Yamamoto T (2018) Measuring voters’ multidimensional policy preferences with conjoint analysis: Application to Japan’s 2014 election. Political Analysis 26: 190-209
- Rapport A (2017) Cognitive Approaches to Foreign Policy Analysis. In Oxford Research Encyclopedia of Politics.
- Garrison JA (2003) Foreign policy analysis in 20/20: a symposium. International Studies Review 5: 155-202.
- Likas A, Vlassis N, Verbeek JJ (2003) The global k-means clustering algorithm. Pattern Recognition 36: 451-461.
- Radványi D, Gere A, Moskowitz HR (2020) The Mind of Sustainability: A Mind Genomics Cartography. International Journal of R&D Innovation Strategy (IJRDIS) 2: 22-43.