Abstract
The purpose of this study was to evaluate the reproducibility of results yielded using a macELISA for detection of allergen specific IgE in dogs and cats when run by eleven different individuals in seven separate affiliated laboratories. Samples of 24 different sera samples were independently evaluated in each laboratory by differing operators in a single blinded fashion. For evaluations completed by multiple operators in a single laboratory, the average intra-operator variance was calculated to be 4.6% (range=0.8%-8.7%) while the average inter-operator variance was 5.7% (range=1.4%-7.8%). The average intra-assay variance among reactive assay calibrators in all laboratories was 5.3% (range=0.8%-12.6%). The overall inter-assay inter-laboratory variance evident with reactive calibrators was consistent among laboratories and averaged 10.1% (range=4.4%-12.8%). All laboratories yielded similar profiles and magnitudes of responses for replicate unknown samples; dose response profiles observed in each of the laboratories were indistinguishable. Correlation of EAU observed for individual allergens between and among all laboratories was strong (r>0.90, p<0.001). Collectively, the results demonstrated that ELISA for measuring allergen specific IgE is reproducible, and documents that consistency of results can be achieved not only in an individual laboratory, but among different operators and between laboratories using the same ELISA.
Keywords
IgE, ELISA, Proficiency, Atopy, Allergy, Immunotherapy, Cross-reactive carbohydrate
Introduction
Stallergenes Greer maintains a proficiency monitoring program for laboratories that routinely run macELISA [1] for evaluation of allergen specific IgE in serum samples. The foundation for this program is based on the desire for inter-laboratory standardization and quality control measures that ensure the uniformity, consistency, and reproducibility of results among laboratories that perform the assays. This program is designed to evaluate the proficiency of laboratories and ensures that individual operators yield consistent and reproducible results. The inaugural proficiency evaluations, initiated in 2009 and repeated in 2010, in six different laboratories documents that inter-laboratory standardization and quality control measures in the veterinary arena are on the immediate forefront and that uniformity, consistency, and reproducibility of results between laboratories is achievable [2]. Similarly, reproducibility of results among different laboratories was documented in the subsequent proficiency evaluations completed in 2013 [3], 2016 [4], 2018 [5], 2019 [6], and 2020 [7]. The results presented herein summarize the comparative results observed in the affiliate laboratories for the most recent proficiency evaluations that were completed in August 2021. The 2021 proficiency evaluation is the third documentation of the assay reproducibility since adopting a cross-reactive carbohydrate inhibitor in the sample diluent [7,8].
Materials and Methods
All serum samples, buffers, coated wells, calibrator solutions, and other assay components were aliquants of the respective lots of materials manufactured at Stallergenes Greer’s production facilities (located in Lenoir, NC, USA) and supplied as complete kits to the participating laboratories along with the exact instructions for completing the evaluations.
Participating Laboratories
Seven independent Veterinary Reference Laboratories (VRLs) participated in the 2021 proficiency evaluation of macELISA. Participating laboratories included three separate IDEXX laboratories located in Memphis, Tennessee, Kornwestheim, Germany, and Markham, Ontario Canada. Other affiliated European laboratories that participated in this evaluation included Agrolabo (Scarmagno, Italy), Laboratories LETI Pharma (Barcelona, Spain), and Ceva Biovac (Beaucouzé, France). Stallergenes Greer Laboratories (Lenoir, NC) served as the prototype for evaluation of the macELISA; the 2021 evaluations included results reported by three separate and independent operators. Because the performance characteristics of macELISA in Stallergenes Greer’s VRL have been well documented for use over an extended period [1-6], all results observed in the other participating laboratories were compared directly with the results observed in Stallergenes Greer’s reference laboratory.
Serum Samples
Separate pollen and mite reactive serum pools or non-reactive sera pools were prepared from cat and dog serum samples that previously had been evaluated using the macELISA for detection of allergen specific IgE. The reactivity of each sera pool ranged from nonreactive to reactive for multiple pollen or mite allergens. These sera pools and admixtures of the pools were used to construct a specific group of samples that exhibited varying reactivity to the allergens included in the evaluation panel. Twenty-four samples were included in the blinded evaluation conducted by each laboratory. Identical replicates of the high, low, and negative controls routinely used in the assay were also included as unknown samples. Also included in the array of samples was a five tube three-fold serial dilution of a highly pollen reactive pool, diluted into non-reactive sera, which served to document the dose response evident within the assay. All samples were stored at -20°C for the interim between testing.
Calibrators
Mite reactive calibrator solutions of predetermined reactivity in the macELISA were prepared as three-fold serial dilutions of a sera pool highly reactive to Dermatophagoides farinae, Acarus siro, and Tyrophagus putrescentiae. Replicates of each were evaluated in each assay run and served as a standard response curve for normalizing results observed with the various samples. All results were expressed as ELISA Absorbance Units (EAU) which are background-corrected observed responses expressed as milli absorbance.
Buffers
The buffers used throughout have been previously described,1-7 and included: a) well coating buffer: 0.05 M sodium carbonate bicarbonate buffer, pH 9.6; b) wash buffer: phosphate buffered saline (PBS), pH 7.4, containing 0.05% Tween 20, and 0.05% sodium azide; c) reagent diluent buffer: PBS, pH 7.4, containing 1% fish gelatin, 0.05% Tween 20 and 0.05% sodium azide. The buffer used for dilution of serum samples was identical to the reagent diluent buffer, but it has been supplemented (2.5 mG/mL) with a cross-reactive carbohydrate inhibitor derived from the carbohydrate components present in bromelain (BROM-CCD)7. BROM-CCD was prepared in house and remains a proprietary product of Stallergenes Greer (Lenoir, NC, USA).
Allergen Panel
The allergen panel was a 24 allergen composite derived from the array of allergens that are included in the specific panels routinely evaluated in the various laboratories; the composite allergen panel consisted of 4 grasses, 6 weeds, 6 trees, 5 mites, and 3 fungi. The protocol for coating and storage of wells has been previously described [1-7]. Immulon 4HBH flat bottom 12 well strip assemblies (Thermo Electron Corporation, Waltham, MA) were used throughout and served as the solid phase for all assays. The individual extracts were diluted in bicarbonate buffer (pH 9.6) and 100 µL was added to each assigned well. Following overnight incubation at 4-8°C, the wells were washed with PBS, blocked with 1% monoethanolamine (pH 7.5) then air dried and stored at 4-8°C in Ziploc bags until used.
Sample Evaluations – macELISA
The operational characteristics and procedures for the macELISAs have been previously described [1-6]. Following incubation of allergen coated wells with an appropriately diluted serum sample, allergen-specific IgE is detected using a secondary antibody mixture of biotinylated monoclonal anti-IgE antibodies, streptavidin alkaline phosphatase as the enzyme conjugate, and p-nitrophenylphosphate (pNPP) as substrate reagent. Specific IgE reactivity to the allergens is then estimated by determining the absorbance of each well measured at 405 nM using an automated plate reader. All results are expressed as ELISA Absorbance Units (EAU), which are background-corrected observed responses expressed as milli absorbance [8-13].
To evaluate the stability of stored wells, the reactivity of wells coated in April 2019 and in April 2021 was assessed by Stallergenes Greer technicians. The storage stability of the anti-IgE-biotin reagent was assessed by comparing the reactivity of a preparation of reagent that was prepared in January 2017 with that of one that was prepared in April 2020.
Statistics
A coefficient of variation was calculated as the ratio of standard deviation and means of the responses observed for the calibrator solutions within different runs in multiple laboratories. Pearson’s correlation statistic was used for inter-laboratory comparison among individual allergens. Statistical analyses were conducted using EXCEL (2016; Microsoft; Redmond, WA, USA).
Results
The assay variance (% CV) observed with the calibrator solutions in the different laboratories are presented in Table 1 and are representative of the assay reproducibility in the various laboratories. The average intra-assay % CV among positive calibrators (#1-5) was 5.3% (range=0.8%-12.6%); differences among laboratories or between assays and within assay runs were not detected. No substantial difference in results among various operators was revealed. The average intra-operator variance documented for Stallergenes Greer technicians was calculated to be 4.6% (range=0.8%-8.7%) while the average inter-operator variance was 5.7% (range=1.4%-7.8%). The average inter-assay variance (% CV) observed in Stallergenes Greer’s laboratory with the positive calibrators from multiple runs over a one year period has been documented at 8.9% (range 7.1% -9.7%), and the inter-laboratory % CV among reactive calibrators also remained relatively constant (average 12.1%; range=11.2%-13.4%). The results of the current evaluation (Table 1) are consistent with these unpublished findings; the inter-assay variance among positive calibrators for all laboratories included in this evaluation was calculated to be 10.1% (range=4.4%-12.8%). Similar to previously published studies [1-7], the intra-assay variability was higher with the calibrators containing lesser amounts of allergen specific IgE, and a similar increased intra-assay variability was evident with the background ODs (average 8.6%; range=2.0%-18.1%). A negative response is classified as anything with an EAU below 150 [1]. Any analysis of results below this threshold, especially when looking at %CV and relative differences should be done cautiously.
Table 1: Calculated variance of macELISA calibrator solutions observed with different laboratory runs by multiple operators during the 2021 Proficiency evaluation.
| Calibrator % CV | BG % CV | ||||||
|
Variance |
N |
#1 | #2 | #3 | #4 |
#5 |
|
| Inter-Laboratory |
352 |
4.4 | 10.0 | 12.8 | 12.2 | 10.8 |
19.8 |
| Inter-Assay (Stallergenes Greer) |
160 |
1.4 | 6.2 | 7.8 | 6.7 | 6.6 |
7.7 |
| Intra-Assay | |||||||
| Stallergenes Greer #1 |
32 |
1.3 | 6.1 | 5.9 | 4.5 | 3.7 |
3.8 |
| Stallergenes Greer #2 |
32 |
1.2 | 3.4 | 6.8 | 4.5 | 6.5 |
2.0 |
| Stallergenes Greer #3 |
32 |
1.3 | 6.7 | 7.9 | 4.8 | 6.1 |
9.9 |
| Stallergenes Greer #4 |
32 |
0.8 | 4.1 | 4.2 | 5.0 | 3.9 |
4.9 |
| Stallergenes Greer #5 |
32 |
1.1 | 4.7 | 4.6 | 8.7 | 7.0 |
7.9 |
| IDEXX Memphis |
32 |
3.3 | 6.9 | 12.2 | 7.0 | 10.9 |
14.6 |
| IDEXX Canada |
32 |
1.5 | 3.0 | 5.2 | 4.2 | 3.5 |
9.4 |
| IDEXX Germany |
32 |
2.0 | 6.6 | 11.1 | 7.5 | 4.0 |
9.9 |
| Agrolabo |
32 |
1.0 | 3.2 | 5.7 | 6.9 | 12.6 |
18.1 |
| Biovac |
32 |
2.6 | 7.2 | 6.6 | 6.3 | 6.8 |
6.0 |
| LETI |
32 |
2.2 | 4.5 | 8.9 | 6.7 | 7.3 |
7.6 |
* Calibrator #1 was prepared as a dilution of a sera pool which is highly reactive to mite allergens; Calibrators #2 – #5 are prepared as a serial 3-fold dilution of calibrator #1.
† Background responses observed with diluent in place of serum sample.
To evaluate the strength of association with the magnitude of EAU results observed for each allergen among the different laboratories a Pearson’s correlation coefficient was determined (Microsoft Excel 2016) for each laboratory pair. Because the macELISA is designed to yield comparable responses in dog and cat samples, comparison of results among affiliate laboratories included both cat and dog samples as a single population of sera samples [5-7]. These results (Table 2) demonstrate that very high inter-laboratory correlation (r>0.90; p<0.001) is evident between the results observed in Stallergenes Greer laboratory and those observed in six affiliate laboratories for all pollen, mite, and fungi allergens. The overall correlation of results observed in the various laboratories is summarized in Table 3; a very strong correlation (r>0.90, p<0.001) was demonstrated between and among the results of the participating laboratories.
Table 2: Inter-laboratory correlation of macELISA results observed with individual allergens in Stallergenes Greer Laboratory and the results observed in the individual affiliate laboratories.
|
Allergens |
Inter-Laboratory Coefficient of Correlation Stallergenes Greer vs | |||||
| IDEXX Memphis | IDEXX Germany | IDEXX Canada | Ceva Biovac | Agrolabo |
LETI |
|
| Mites | ||||||
| Acaris siro |
0.996 |
0.995 |
0.981 | 0.988 | 0.995 |
0.972 |
| Dematophagoides farinae |
0.992 |
0.993 | 0.998 | 0.984 | 0.994 |
0.972 |
| Dematophagoides pteronyssinus |
0.990 |
0.982 | 0.971 | 0.980 | 0.976 |
0.882 |
| Lepidoglyphus destructor |
0.971 |
0.967 | 0.893 | 0.953 | 0.974 |
0.838 |
| Tyrophagus putrescentiae |
0.993 |
0.986 | 0.975 | 0.992 | 0.991 |
0.956 |
| Grasses | ||||||
| June Grass (Poa pratensis) |
0.995 |
0.990 | 0.997 | 0.988 | 0.990 |
0.937 |
| Meadow fescue (Festuca pratensis |
0.989 |
0.987 | 0.983 | 0.983 | 0.987 |
0.908 |
| Orchard Grass (Dactylis glomerata) |
0.984 |
0.982 | 0.993 | 0.984 | 0.984 |
0.904 |
| Perennial Rye (Lolium perenne) |
0.985 |
0.984 | 0.988 | 0.983 | 0.986 |
0.899 |
| Trees | ||||||
| Birch (Betula pendula) |
0.977 |
0.978 | 0.965 | 0.908 | 0.964 |
0.900 |
| Cypress (Cupressus sempervirens) |
0.981 |
0.972 | 0.904 | 0.948 | 0.898 |
0.926 |
| Hazelnut (Corylus avellana) |
0.978 |
0.970 | 0.983 | 0.977 | 0.955 |
0.915 |
| Olive (Olea europaea) |
0.980 |
0.972 | 0.991 | 0.964 | 0.965 |
0.889 |
| Populus mix (P.nigra, P. tremula, P. alba) |
0.976 |
0.970 | 0.988 | 0.975 | 0.964 |
0.894 |
| Willow Black (Slix discolor) |
0.971 |
0.962 | 0.963 | 0.976 | 0.968 |
0.927 |
| Weeds | ||||||
| English Plantain (Plantago lanceolata) |
0.988 |
0.974 | 0.979 | 0.985 | 0.977 |
0.905 |
| Lambs Quarter (Chenopodium album) |
0.981 |
0.961 | 0.944 | 0.933 | 0.934 |
0.916 |
| Mugwort (Artemisia vulgaris) |
0.977 |
0.967 | 0.980 | 0.971 | 0.953 |
0.915 |
| Pellitory (Parietaria officinalis) |
0.985 |
0.974 | 0.986 | 0.981 | 0.977 |
0.914 |
| Ragweed (Ambrosia trifida, A. artemisifolia) |
0.999 |
0.992 | 0.996 | 0.997 | 0.989 |
0.994 |
| Sheep Sorrel (Rumex acetosella) |
0.990 |
0.982 | 0.986 | 0.988 | 0.980 |
0.931 |
| Fungi | ||||||
| Alternaria alternata |
0.953 |
0.991 | 0.977 | 0.977 | 0.945 |
0.931 |
| Aspergillus fumigatis |
0.993 |
0.995 | 0.994 | 0.958 | 0.998 |
0.950 |
| Cladosporium herbarum |
0.995 |
0.992 | 0.843 | 0.914 | 0.994 |
0.944 |
| Overall |
0.991 |
0.986 | 0.977 | 0.987 | 0.983 |
0.956 |
*Pearson Correlation Coefficient (r); Good Correlation (r > 0.8, p<0.001)
Table 3: Inter-laboratory correlation of macELISA results observed among individual affiliate laboratories.
| Interlaboratory Coefficient of Correlation | |||||||
| Laboratory | Stallergenes Greer | IDEXX Memphis | IDEXX Germany | IDEXX Canada | Ceva Biovac | Agrolabo |
LETI |
| Stallergenes Greer |
1 |
0.991 | 0.986 | 0.977 | 0.987 | 0.983 |
0.956 |
| IDEXX Memphis |
0.991 |
1 | 0.990 | 0.980 | 0.989 | 0.986 |
0.967 |
| IDEXX Germany |
0.986 |
0.990 | 1 | 0.967 | 0.981 | 0.994 |
0.956 |
| IDEXX Canada |
0.977 |
0.980 | 0.967 | 1 | 0.978 | 0.962 |
0.955 |
| Biovac |
0.987 |
0.989 | 0.981 | 0.978 | 1 | 0.974 |
0.969 |
| Agrolabo |
0.983 |
0.986 | 0.994 | 0.962 | 0.974 | 1 |
0.948 |
| LETI |
0.956 |
0.967 | 0.956 | 0.955 | 0.969 | 0.948 |
1 |
*Pearson Correlation Coefficient (r); Good Correlation (r > 0.8, p<0.001)
For an evaluation of the dose response in this ELISA, a five tube three-fold serial dilution of a reactive dog sera pool was prepared using a negative cat sera pool as diluent. Each of the dilutions was then evaluated by all of the participating laboratories as unknown independent samples. Similar responses were yielded by all of the laboratories and the results observed within the various laboratories are encompassed by the acceptable variance limits [1-3] (±20%) established for macELISA. Further, the magnitude of responses observed in each laboratory was reduced in direct proportion to dilution. Consequently, the dose responses for the individual allergens are presented as aggregate responses. The results presented in Figure 1 confirm the sera pool was highly reactive to mites as well as grass, weed, and tree pollen allergens, but it was not reactive to fungi. To be expected, the magnitude of responses observed in each laboratory was reduced in direct proportion to dilution. Results from the final tube in the dilution scheme yielded results that were indistinguishable from negative responses, indicating a dilution extinction of detectable response.
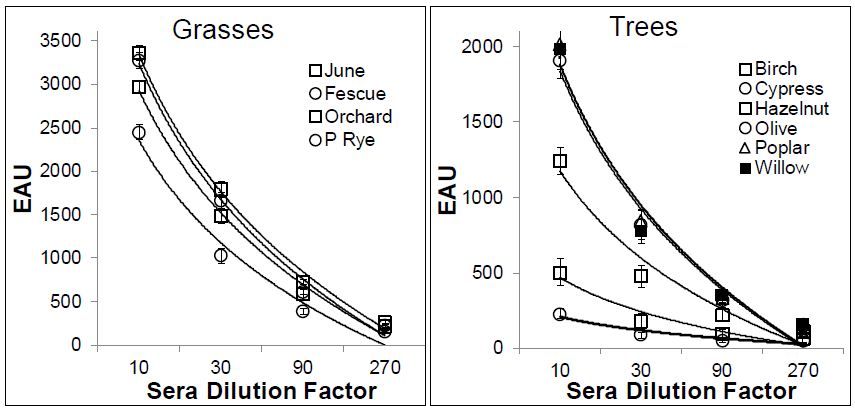
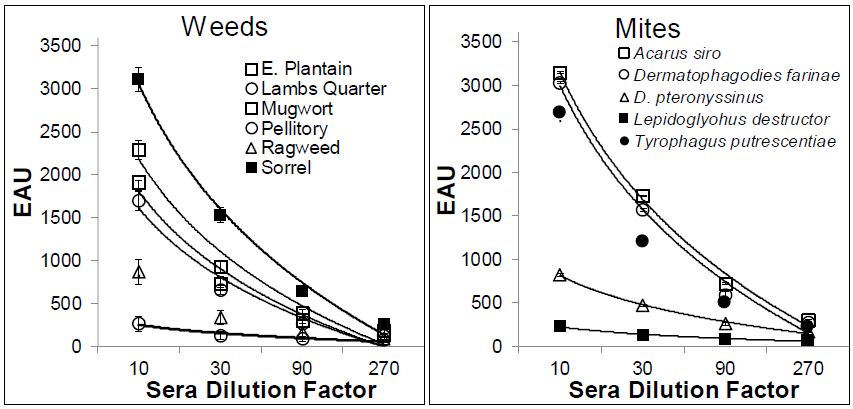
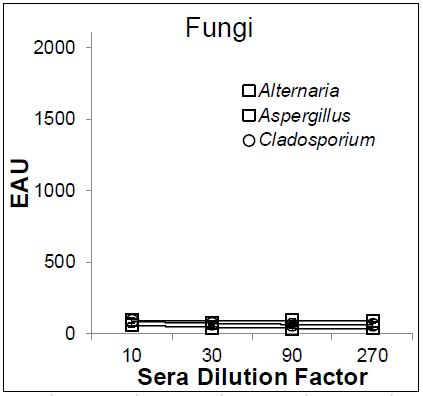
Figure 1: Dose response evident in macELISA with a pollen reactive serum pool.
The final objective for the current evaluation was to document the stability of the anti-IgE biotin reagent and the allergen coated wells. For these evaluations two separate lots of each assay component were reciprocally assessed. The two lots of allergen coated wells were manufactured in April 2019 and April 2021 and stored in zip closure plastic bags at 4-8°C until used. The separate anti-IgE reagent lots were manufactured in January 2017 and April 2021 and were store at -10°C in alkaline phosphatase stabilizing buffer containing 50% glycerin. All evaluations were completed in July 2021.
The results present in Table 4 demonstrate that similar responses are yielded with calibrators when evaluated with either lot of anti-IgE biotin. The average intra assay variance (% CV) observed with the two reagent lots were evaluated by two separate technicians and calculated to be 5.5% (range=0.9%-11.9%). The average inter-assay variance for the two reagent lots was calculated to be 7.1% (range=1.1%-12.0%); whereas the average inter-lot/inter-operator variance was 12.1% (range=2.2%-17.9%). To be expected, the greatest variance was noted for calibrator solutions that yielded signals of lesser magnitude.
Table 4: Correlation of responses observed with calibrator solutions when evaluated with separate lots of anti-IgE biotin that were stored for 3 or 55 months.
| Anti-IgE Biotin | Calibrator % CV* | ||||||||
| Variance | Lot # | Storage(Months) | N | #1 | #2 | #3 | #4 | #5 |
BG % CV |
| Inter-Lot/ Operator | |||||||||
|
1 & 2 |
3 & 55 | 160 | 2.2 | 9.8 | 15.7 | 17.9 | 15.0 |
9.5 |
|
| Inter-Assay | |||||||||
|
1 |
55 | 96 | 1.5 | 7.6 | 6.3 | 7.0 | 7.8 |
7.0 |
|
|
2 |
3 | 96 | 1.1 | 5.7 | 10.6 | 12.0 | 11.2 |
10.3 |
|
| Intra-Assay | |||||||||
| Operator #1 |
1 |
55 | 64 | 1.6 | 9.0 | 4.9 | 4.0 | 3.1 |
4.0 |
|
2 |
3 | 64 | 0.9 | 3.2 | 6.7 | 5.5 | 7.4 |
3.8 |
|
| Operator #2 |
1 |
55 | 32 | 1.2 | 3.4 | 6.8 | 4.5 | 6.5 |
6.8 |
|
2 |
3 | 32 | 1.2 | 6.3 | 10.1 | 11.9 | 11.5 |
11.4 |
|
* Calibrator #1 was prepared adilution of a sera pool which is highly reactive to mite allergens; Calibrators #2 – #5 are prepared as a serial 3-fold dilution of calibrator #1. Background responses observed with diluent in place of serum sample.
† Anti-IgE biotin was stored at -10 °C in alkaline phosphatase stabilizing buffer containing 50% glycerin
The final endeavor of the present study was to document the storage stability of the individual allergen coated wells along with the anti-IgE biotin conjugate stability. For these evaluations a single dilution of each of the sera included in the proficiency panel were evaluated separately by two technicians on both lots of wells using each of the anti-IgE biotin lots. Because the magnitude of signals evident with the individual allergens between the two technicians was indistinguishable all results were treated as a single population for each allergen. The results present in Table 5 demonstrate a very high correlation (Pearson’s) of results for each of the allergen coated wells and for each lot of anti-IgE biotin (r>0.900, p<0.001).
Table 5: Correlation of results observed with proficiency sera samples when evaluated with two separate lots of anti-IgE biotin stored for 3 or 55 months using allergen coated wells that were stored for 3 and 24 months.
|
Coefficient of Correlation |
||||
| Allergens | Wells* Apr 2019 vs Apr 2021 |
Biotin+ |
||
|
Mites |
Biotin Jan 2017 |
Biotin Apr 2020 |
Wells
Apr 2019 |
Wells |
| Ascaris siro |
0.993 |
0.992 | 0.995 |
0.994 |
| Dermatophagoides farinae |
0.999 |
0.999 | 0.996 |
0.993 |
| Dermatophagoides pteronyssinus |
0.987 |
0.985 | 0.995 |
0.988 |
| Lepidoglyphus destructor |
0.959 |
0.975 | 0.987 |
0.976 |
| Tyrophagus putrescentiae |
0.988 |
0.987 | 0.996 |
0.991 |
| Grasses | ||||
| June Grass (Poa pratensis) |
0.995 |
0.997 | 0.965 |
0.946 |
| Meadow fescue (Festuca pratensis |
0.998 |
0.998 | 0.956 |
0.937 |
| Orchard Grass (Dactylis glomerata) |
0.990 |
0.996 | 0.952 |
0.926 |
| Perennial Rye (Lolium perenne) |
0.993 |
0.997 | 0.956 |
0.929 |
| Trees | ||||
| Birch (Betula pendula) |
0.997 |
0.971 | 0.903 |
0.960 |
| Cypress (Cupressus sempervirens) |
0.874 |
0.918 | 0.956 |
0.962 |
| Hazelnut (Corylus avellana) |
0.998 |
0.998 | 0.944 |
0.947 |
| Olive (Olea europaea) |
0.999 |
0.995 | 0.935 |
0.950 |
| Populus mix (P.nigra, P. tremula, P. alba) |
0.995 |
0.992 | 0.942 |
0.949 |
| Willow Black (Slix discolor) |
0.983 |
0.973 | 0.931 |
0.953 |
| Weeds | ||||
| English Plantain (Plantago lanceolata) |
0.995 |
0.985 | 0.957 |
0.982 |
| Lambs Quarter (Chenopodium album) |
0.996 |
0.992 | 0.952 |
0.962 |
| Mugwort (Artemisia vulgaris) |
0.980 |
0.985 | 0.954 |
0.950 |
| Pellitory (Parietaria officinalis) |
0.997 |
0.996 | 0.940 |
0.953 |
| Ragweed (Ambrosia trifida, A. artemisifolia) |
0.999 |
0.990 | 0.997 |
0.992 |
| Sheep Sorrel (Rumex acetosella) |
0.999 |
0.991 | 0.942 |
0.963 |
| Fungi | ||||
| Alternaria alternata |
0.989 |
0.993 | 0.986 |
0.969 |
| Aspergillus fumigatis |
0.997 |
0.998 | 0.996 |
0.993 |
| Cladosporium herbarum |
0.932 |
0.923 | 0.974 |
0.966 |
| Overall |
0.972 |
0.975 | 0.974 |
0.975 |
*Allergen coated wells were air dried then stored at 4-8 °C in plastic bags
† Anti-IgE biotin was stored at -10 °C in alkaline phosphatase stabilizing buffer containing 50% glycerin
Discussion
Consistent with previous proficiency evaluations of laboratories that routinely run the monoclonal antibody cocktail based enzyme linked immunoassay (macELISA) manufactured by Stallergenes Greer [1-6], the results of the present study demonstrated that the intra-assay variance observed with the positive calibrators remains relatively low and indistinguishable among the various laboratories. Likewise, the inter-assay variance within each laboratory remained relatively constant and the results from all laboratories was demonstrably similar and the CV of the positive responses was relatively constant across the entire range of reactivity tested. The results demonstrated that the variability between and among the affiliate laboratories and technicians are indistinguishable from the results evident within and between runs completed in the laboratory of Stallergenes Greer. Thus, all laboratories and technicians included in the study were equally proficient in providing consistent results for all allergens tested and the results were well within the acceptable variance limits (±20%) established for this assay and reflects the robustness of the assay [1].
During the 2020 proficiency evaluations, we documented the stability of allergen specific IgE in serum samples stored frozen for at least one year. In the present study we have documented the stability of allergen coated wells that have been stored for at least 24 months. In addition, we have shown that our anti-IgE reagent maintain functional utility for at least 55 months when stored at -10°C in an alkaline phosphatase stabilized buffer containing 50% glycerin.
There was no compelling evidence that the level of allergen specific IgE correlates with severity of clinical disease [14-17]. However, an evaluation that purports to measure allergen specific IgE should have a reduction in signal that is directly proportional to the dilution factor of the test ligand [18]. Similar responses were yielded by all of the laboratories for the samples that comprised the dose response and the results observed within the various laboratories are encompassed by the acceptable variance limits (±20%) established for macELISA [1-3]. Further, the magnitude of responses observed in each laboratory was reduced in direct proportion to dilution. Consequently, the dose responses for the individual allergens are presented as aggregate responses (Figure 1). The responses of greatest magnitude were evident with the grass pollen allergens, and these responses were reduced in direct proportion to dilution; the magnitude of responses ranged from near maximum to those that were indistinguishable from background responses. The reaction profiles for grass allergens also appear to be parallel and quite similar in magnitude of response. Whether or not these like responses result because of a similar level of co-sensitization or allergen epitope similarity combined with cross-reaction remains to be determined. Although the responses evident to differing tree and weed allergens are more variable in magnitude of response, the observed response in each laboratory was reduced in direct proportion to dilution. The positive response profiles evident with these allergens also appear to be parallel and, it becomes evident that the detectability of allergen specific IgE within this assay spans at least a 150-fold dilution range. Substantial responses to A siro, D farinae, and T putrescentiae were noted in the original sample and these responses decreased in direct proportion to dilution. Reactivity to fungal allergens were lacking in the original sample. We have demonstrated a continued reliability and reproducibility of our macELISA with the open publication of our proficiency testing procedures and results [1-6]. We encourage other groups to determine and document similar findings; however, we emphasize the importance of identifying results below the cutoff of 150 EAU merely as non-reactive and consequently negative responses. The reproducibility of the assay for these responses should be defined only as negative and their numerical values become meaningless; comparison of EAU values are meaningful for reactive samples only (EAU>150). Because the magnitude of specific responses is dependent on the concentration of allergen-specific IgE that can span a wide range, a better means of comparison of repeat results for individual samples in an assay of this sort should be to evaluate the correlation (perhaps Pearson statistic) of results that might exist.
The lack of a regulatory mandated quality assurance program for serum allergen specific IgE testing in companion animals, that independently monitors performance of all laboratories and assay formats, prompts Stallergenes Greer to focus on its continued evaluation of laboratories that routinely use the company’s assays. Information presented herein documents the continued commitment of Stallergenes Greer and its affiliate laboratories to providing a stream of information relating these results to the veterinary community.
Funding
Funding for this study was provided by Stallergenes Greer.
References
- Lee KW, Blankenship KD, McCurry ZM, Esch RE, et al. (2009) Performance characteristics of a monoclonal antibody cocktail-based ELISA for detection of allergen-specific IgE in dogs and comparison with a high affinity IgE receptor-based ELISA. Vet Dermatol 20: 157-64. [crossref]
- Lee KW, Blankenship KD, McCurry ZM, Kern G, et al. (2012) Reproducibility of a Monoclonal Antibody Cocktail Based ELISA for Detection of Allergen Specific IgE in Dogs: Proficiency Monitoring of macELISA in Six US and European Laboratories. Vet Immunol Immunopathol 148: 267-275.
- Lee, K.W, Blankenship, K, McKinney, B, Kern, G, et al. (2015) Proficiency monitoring of monoclonal antibody cocktail–based enzyme-linked immunosorbent assay for detection of allergen-specific immunoglobulin E in dogs. Journal of Veterinary Diagnostic Investigation 27: 461-469. [crossref]
- Lee K, Blankenship K, McKinney B, Kern G, et al. (2017) Continued Proficiency Monitoring of Monoclonal Antibody Cocktail-Based Enzyme-Linked Immunosorbent Assay for Detection of Allergen Specific Immunoglobulin E in Dogs – 2016. Integr J Vet Biosci 1: 1-10.
- Lee K, Blankenship K, McKinney B, Kern G, et al. (2018) Proficiency Monitoring of Allergen Specific IgE macELISA ̶ 2018. Integr J Vet Biosci 2: 1-6.
- Enck K, Lee K, Blankenship K, McKinney B, et al. (2019) Proficiency Monitoring of Allergen-Specific IgE macELISA – 2019. Integr J Vet Biosci 3: 1-6.
- Enck K, Lee K, McKinney B, Lillard J, et al. (2020) Proficiency Monitoring of Allergen-Specific IgE macELISA – 2020. Integr J Vet Biosci 4: 1-7.
- Lee KW, Blankenship KD, McKinney BH, Morris, DO (2020) Detection and Inhibition of IgE for cross-reactive carbohydrate determinants evident in an enzyme linked immunosorbent assay for detection of allergen specific IgE in the serum of dogs and cats. Vet Dermatol. [crossref]
- Altmann F (2016) Coping with cross-reactive carbohydrate determinants in allergy diagnosis. Allergo J Int 25: 98-105. [crossref]
- Holzweber F, Svehla E, Fellner W. Dali T, et al. (2013) Inhibition of IgE binding to cross-reactive carbohydrate determinants enhances diagnostic selectivity. Allergy 68: 1269-1277. [crossref]
- Yokoi H, Yoshitake H, Matsumoto Y, Kawada M, et al. (2017) Involvement of cross-reactive carbohydrate determinants-specific IgE in pollen allergy testing. Asia P ac Allergy 7: 29-36.
- Kaulfürst-Soboll H, Mertens M, Brehler R, von Schaewen A, et al. (2011) Reduction of cross-reactive carbohydrate determinants in plant foodstuff: elucidation of clinical relevance and implications for allergy diagnosis. PLoS One 6: 17800.
- Ito K, Morishita M, Ohshima M, Sakamoto T, et al. (2005) Cross-reactive carbohydrate determinant contributes to the false positive IgE antibody to peanut. Allergol Int 54: 387-392.
- Mari A, Iacovacci P, Afferni C, Barletta B, et al. (1999) Specific IgE to cross-reactive carbohydrate determinants strongly affect the in vitro diagnosis of allergic diseases. J Allergy Clin Immunol 103: 1005-1011. [crossref]
- DeBoer DJ, Hillier A (2001) The ACVD task force on canine atopic dermatitis (XVI): laboratory evaluation of dogs with atopic dermatitis with serum-based “allergy” tests. Vet Immunol Immunopathol 81: 277-87. [crossref]
- Gorman NT, Halliwell, REW (1989) Atopic Diseases. In: Halliwell REW, Gorman NT. ed. Veterinary Clinical Immunology pp 232-52. WB Saunders, Philadelphia.
- Griffin CE, DeBoer DJ (2001) The ACVD task force on canine atopic dermatitis (XIV): clinical manifestation of canine atopic dermatitis. Vet Immunol Immunopathology 81: 255-269. [crossref]
- Griffin CE, Hillier A (2001) The ACVD task force on canine atopic dermatitis (XXIV): allergen-specific immunotherapy. Vet Immunol Immunopathol 81: 363-383. [crossref]