Author Archives: author

Rainbow Paratha – Establishment of Common People Diet in Post Pandemic Situation as Protective Measure and Immunity Enhancer

DOI: 10.31038/NRFSJ.2023613

Abstract

A remarkable increase is recorded regarding global burden of non-communicable lifestyle diseases. Prevalence of non-infectious diseases especially type 2 Diabetes, hypertension, depression, anxiety, arthritis etc. are directly related with the lifestyle patterns including the “Diet” that has been consumed during the course of lifetime. Food and health are correlated; improper food intake will produce detrimental effects on health leading to altered body physiology ultimately resulted in persistent illness. By incorporating functional foods in daily routine will strengthen the overall health and immune system, detoxify the organs, leading to delay age related degeneration of organs and symptoms. Purpose of this study was to design a unique functional food termed as “Rainbow Paratha” using whole wheat flour (Triticum aestivum) as main medium mixed with antioxidants herbs mainly Beeta vulgaris leaves and root and Moringa oleifera leaves. To add on taste and nutritional value some wet condiments (ginger, garlic, turmeric, and onion) and some dry condiments (black pepper, cumin, and fenugreek) were also added. Taste was developed using pink salt and mustard oil, while garnishing was done with coriander and peppermint leaves to make paratha presentable. Dough was made using mustard oil and distilled water. This paratha is safe to use as a functional food, boost immunity and improve health. Natural antioxidants in this paratha will detoxify the body with reactive oxygen species preventing from chronic diseases. It can be concluded that this product will not only satisfy the hunger and provide prompt responding nutrients to consumers but may prevent some lifestyle diseases and try to maintain perfect health without any untoward effects.

Keywords

Beeta vulgaris roots and leaves, Moringa oleifera, Functional food, Immunity, Chronic diseases

Introduction

Food provides the basic fuel necessary for the survival and maintenance of human life. On scientific ground relationship between diet and health has been established and studied by researchers all over the world. Unbalanced diet or processing of food in unscientific manner will result in compromised nutritional value; finally leading to the prevalence of different diseases. Japan introduced the term functional food for the first time in mid 80s, by then it has been adopted the shape of modern industry all over the world. The Concept of functional food is nothing but based on two main parameters of human life i.e. diet and health. Any food that may be utilized on daily basis for preventing diseases via improving overall health is considered as functional food. Functional foods may be conventional natural food, having fortified food components, and synthesized food ingredients. There are a lot of data available that support the practice of incorporating functional food on daily routine will result in improved health and delay of chronic diseases like hypertension, diabetes etc. [1-4].

Majority of chronic diseases are associated with high oxidative stress on the body. Increased level of Reactive Oxygen Species (ROS) or free radicals in the body will gradually result in prevalence of lifestyle diseases like hypertension, diabetes, neurodegenerative diseases like Alzheimer’s, and even malignant conditions of various organs [5-9].

Nature has blessed humankind with a range of edible and medicinal plants having antioxidant potential and these are available according to seasonal variations. Incorporation of edible plants having natural antioxidants in our daily diet plan can improve our health through maintaining body’s own metabolic processes ; strengthen immune system, boosting body’s own free radical scavenging activity. Hence the overall health condition will be improved and the natural process of aging and age related complications could be minimized.

Purpose of this research is to introduce a natural functional food after pandemic situation of COVID-19 that has antioxidant and immune boosting potential, known as “Rainbow Paratha”. We made this paratha using whole wheat flour, mixing with edible Beeta vulgaris roots and leaves and Moringa oleifera that are rich in antioxidant poly phenols and can be safely consumed as are non-toxic [10,11,16,17]. Other condiments having beneficial and safe phytochemicals are also added to add on flavor according to the taste buds of Asians population. Grated rhizome of ginger and garlic along with onion were used as wet condiments of the preparation. Dry condiments are also the primary part of the preparation like turmeric, cumin, black pepper, and fenugreek along with maintaining the taste with pink salt, with coriander and peppermint leaves not only as garnishing agent but also for significant taste and aroma. Mustard oil was used to process the dough into cooked paratha that itself have very advantageous effects. All of these wet and dry condiments are routinely utilized in Pakistani cuisines and not only enhance the taste but also beneficial for health as containing valuable phytochemical nutrients that can be used in moderate amounts.

Materials and Methods

Preparation of rainbow paratha is composed of some simple steps including collection of ingredients, dough preparation, processing the dough, and cooking.

Collection of Material/Ingredients

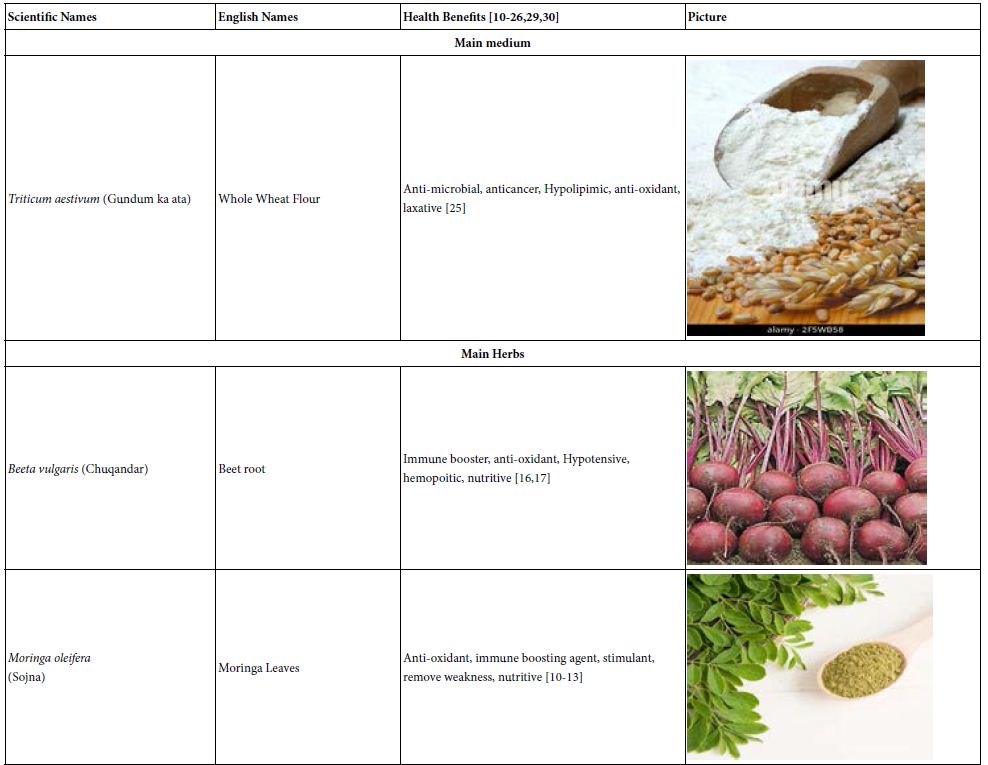
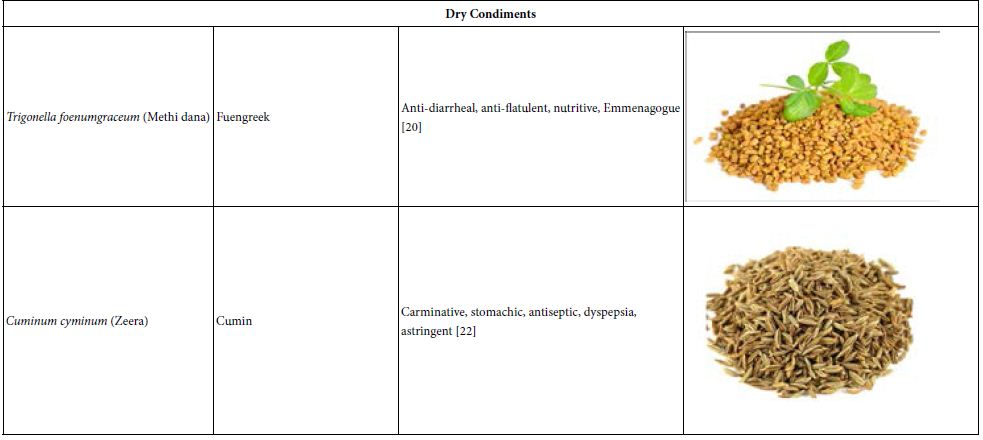
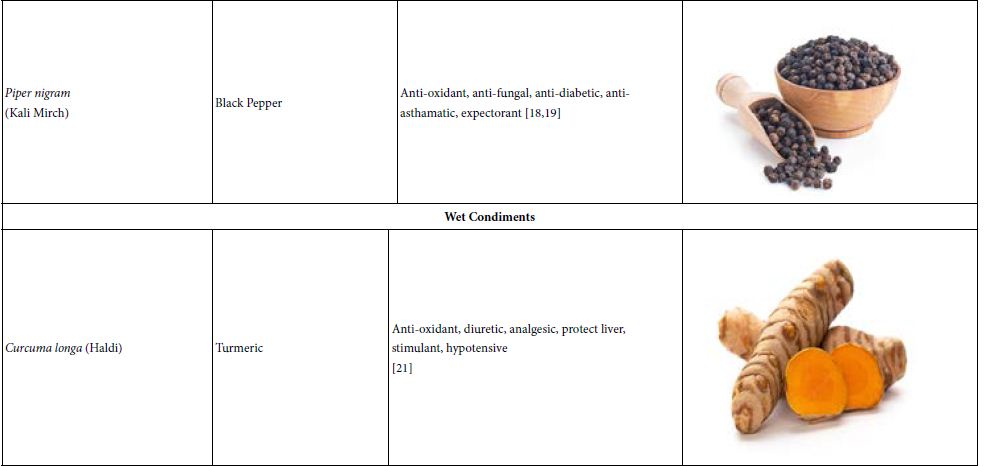
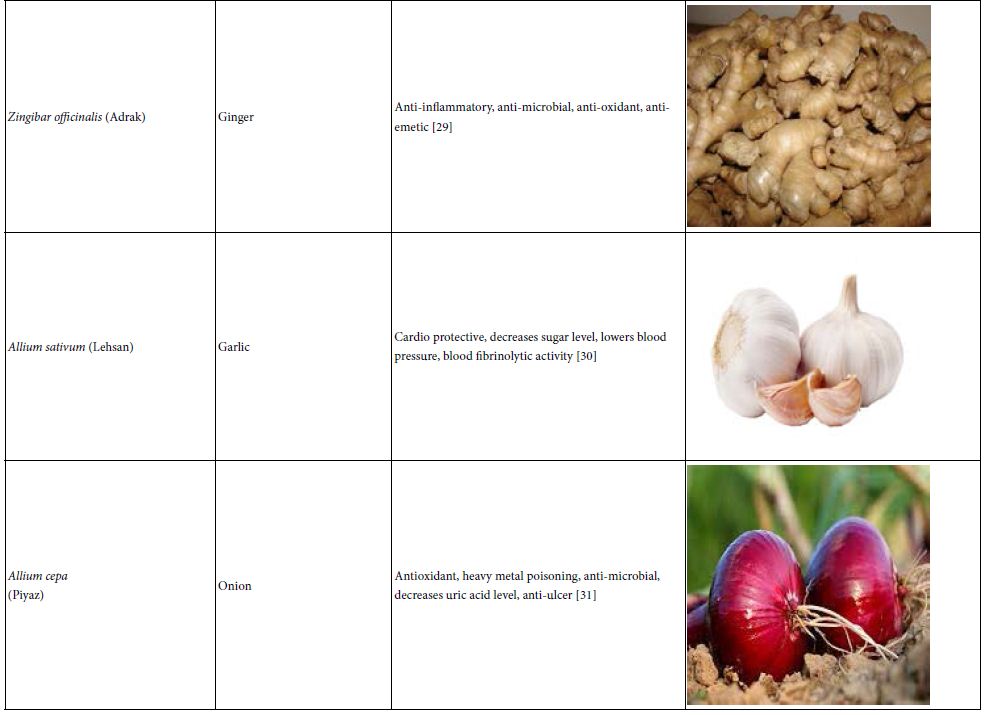
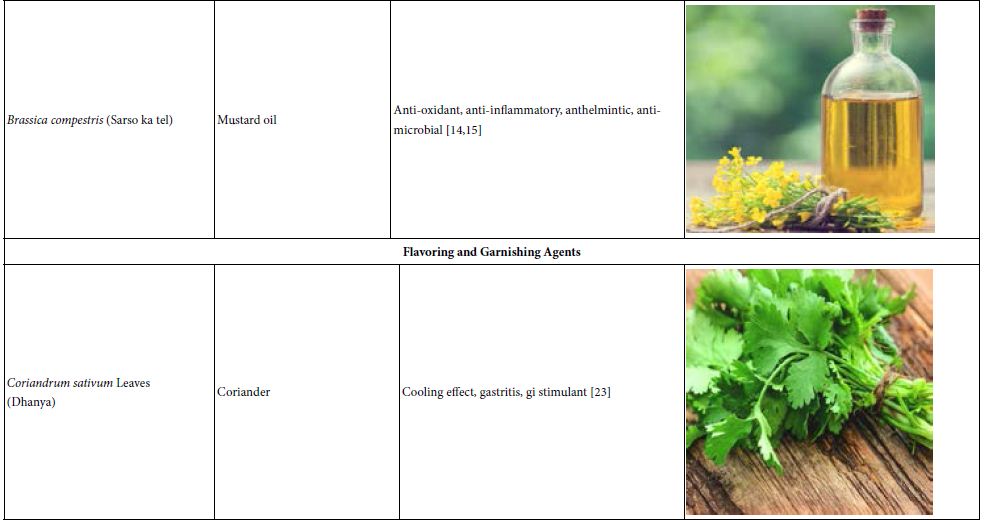
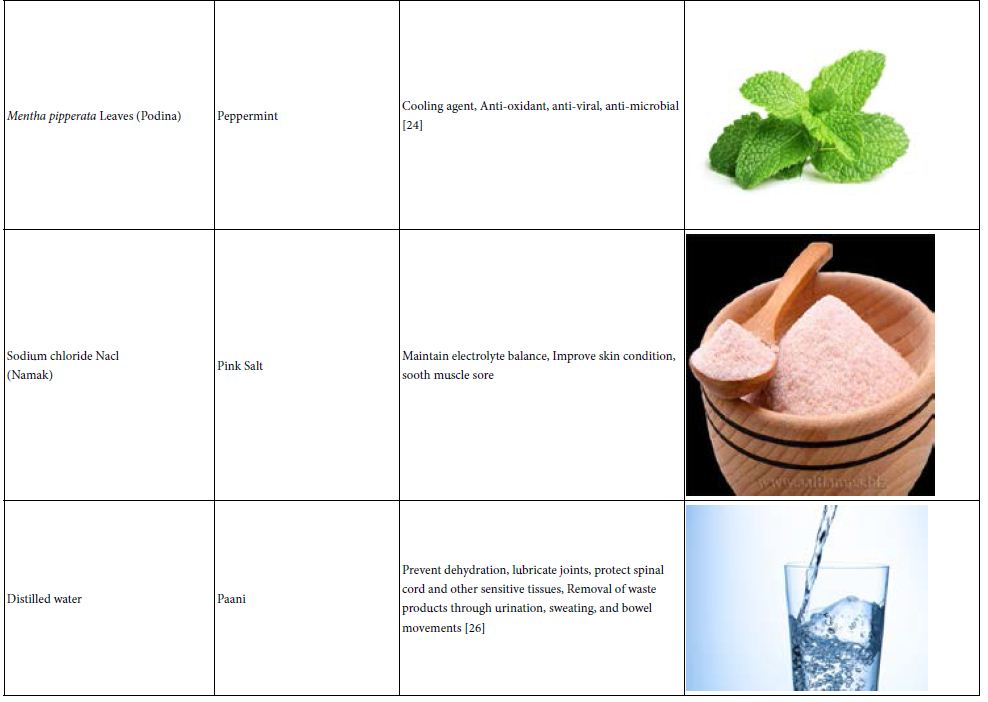
Ingredients used in the preparation of rainbow paratha were procured from local market of Karachi, Pakistan and identified by Prof. Dr. Ghazala H Rizwani. It includes some fresh materials as well as some regional spices (wet and dry condiments) according to the taste of local Pakistani population. All the materials required for making rainbow paratha are listed in Table 1.

Table 1: Description of Composition of Rainbow paratha

TAB 1(1)

TAB 1(2)

TAB 1(3)

TAB 1(4)

TAB 1(5)

TAB 1(6)

Experimental Design

Dough Preparation and Processing

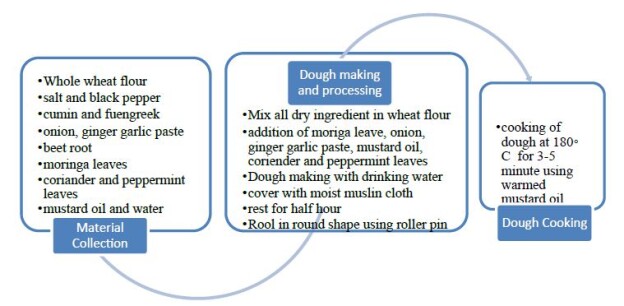
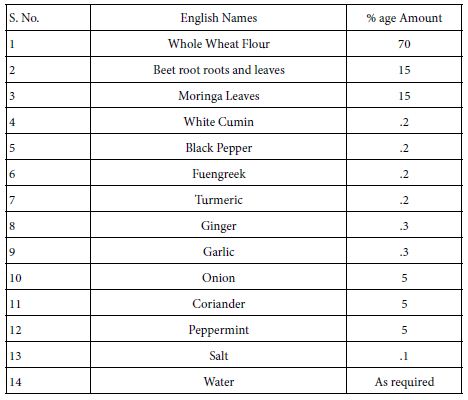
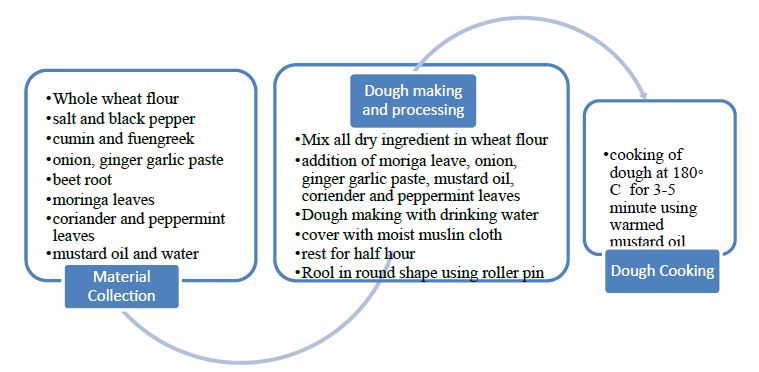
Table 2 represents the percentage amount of all ingredients used to make the dough; while all steps involved in the preparation of this product is summarized in Figure 1. Firstly all dry ingredients were mixed well in flour followed by gradual addition of cooking oil. Simple drinking water was used for Dough preparation. Dough was kneaded with the help of hands to obtain uniform consistency. It was covered with moist muslin cloth at room temperature for half an hour before further processing. The respective dough was divided into small pieces of approximately equal size. Each piece of dough was rolled out in the shape of round Paratha using roller pin.

Table 2: Percentage composition of Ingredients used in rainbow paratha

TAB 2


FIG 1

Figure 1: Steps involved in making Rainbow Paratha

Cooking of Paratha dough

The resulted prepared dough in addition with 2-3 table spoons of mustard oil warmed at 180 C for at least 5 minutes on a nonstick pan. Warming of mustard oil till smoke point is necessary to remove its toxic constituents allyl isothiocyanate responsible for its bitter taste and to convert bitter oil into edible sweet mustard oil.

Results and Discussion

COVID-19 pandemic has influenced the life of mankind in various aspects including from physical and mental health, economy, socialization and the overall immune system. Post pandemic scenario has opened new global challenges for medical professionals, pharmacists, dieticians, and researchers to address and solve health complications and strengthen the immune system so that our bodies will be able to defend itself in case of reoccurrence of the disease or other variant of corona virus. A strong immune system will safeguard the person with all kinds of illness and complications.

In 21st century attention is paid towards maintain the diet in such a way that food itself becomes medicine for individuals. Concepts of functional foods, neutraceutical reflecting the healthy eating habits are on the rise to boost up immunity. The concept of our research of designing rainbow paratha is based on this fact that by incorporating healthy food items having antioxidant potential in our cuisine will help naturally us to fight against diseases.

Rainbow paratha is prepared using wheat flour as main medium, with antioxidants herbs, and some dry and wet condiments and flavoring agents. The details of all components of rainbow paratha are given as;

Main Medium

Triticum aestivum (Whole Wheat Flour)

Whole wheat flour was taken as main medium to prepare the dough. It was selected because wheat flour is the most widely used type of grain in Pakistan. Although due to high amount of carbohydrate it is considered as a source of energy but it also perform some valuable functions like anti-diabetic, anti-microbial, and even anti-malignant effects also [25].

Main Herbs

Beta vulgaris (Beet Root and leaves)

Beet root is highly nutritive food full of vitamins, mineral, and nitrates. Fresh beet roots with its green leaves are used in this product that has miraculous effects on health. Most of the chronic diseases are slowly developing in the body, moreover gradual accumulation of toxins and metabolic wastes will weaken the immune system and damages organs. Use of beet root with its leaves detoxifies liver getting rid from disease progression. It is also beneficial to main high blood pressure so delays the onset of hypertension in border line patients. It is also helpful in making heart health in good condition; also decreases cholesterol levels. Due to hemopoitic action it is good for treating anemia [16,17].

Moringa oleifera (Moringa leaves)

Moringa oleifera is known as “Magical vegetable” because of its miraculous uses both as functional food and medicine. Its use has not only been proved scientifically effective but also safe for human consumption. In our Rainbow paratha recipe we used fresh leaves of moringa that are rich in natural antioxidants like vitamin C, poly phenols, and carotenoid. Moringa plant has long history of therapeutic utilization in traditional system of medicines for its anti-inflammatory, anti-microbial, diuretic, anti-hyperlipidemic, anti-hypertensive, anti-diabetic activities. Presence of these antioxidants will decrease the oxidative stress hence preventing from different chronic diseases [10-13].

Dry Condiments

Piper nigrum (Black pepper)

Black pepper having a characteristic spicy and pungent odor and taste is very popular food condiment in Asian cuisines. This plant has deep cited history of use as medicine as well as food spice. Piperine, piperidine are the main constituents responsible for medicinal actions. It is widely used for respiratory complaints [18,19].

Trigonella fonumgraceum (Fenugreek)

Fenugreek is another condiment used in making rainbow paratha. It is also one of the popular food condiments in Asia having nice aroma and bitter taste. Methi dana is rich in fat soluble vitamins A and D, Steroidal sapogenin, disogenin, hecogenin, mucilage, Wax, volatile oil and used as tonic, flatulence, antidiarrheal, emonenagouge and laxative [20]. Since it has a bitter taste so whole seeds are used instead of crushing it to maintain the taste.

Cuminum cyminum (White Cumin)

Whit cumin has characteristic aromatic odor and spicy taste. It contains Essential oil especially pinene, cuminic aldhehyde (25-35%) and used as diuretic, carminative, condiment, stomachic, astringent, anti-diarrheal, dyspepsia, antiseptic, flavoring agent [22].

Wet Condiments

Curcuma longa (Turmeric)

Curcuminoids (Curcumin, Demethoxycurcumin, Bisdemethoxycurcumin) are Nontoxic Polyphenolic derivatives of Curcumin that make it very beneficial. It is used as analgesic, diuretic, antioxidant, bactericidal, hypotensive, rubefacient, stimulant, reduce risk of serious health conditions like heart disease, diabetes, sores, bruises, osteoarthritis [21].

Allium sativum (Garlic)

Garlic is well known for its cardio protective action, it protects the heart, lowers blood pressure, shows fibrinolytic activities [30].

Allium cepa (Onion)

Onion is a widely used ingredient of Pakistani cuisine. Due to its detoxification action, it prevent tissue, organ and system damage from Heavy metal and other type of poisoning. Uric acid level is also controlled by incorporating onion in daily routine [31].

Brassica compestris (Mustard oil)

Mustard oil has a strong and pungent flavor with high smoke point. Isothiocyanate, Glucosynolate also known as mustard oil glycosides is responsible for the characteristic taste and aroma of mustard oil. Mustard oil is very beneficial for health due to its unique fatty acid composition. It reduces cholesterol level, well for heart, anti-inflammatory, treat pain associated with arthritis; stimulate sweat gland and lower body temperature [14,15]. Heating the oil will mask its pungent taste so in our recipe mustard oil was heated till its smoke point prior to use it.

Garnishing and Flavoring Agents

Coriandrum sativum (Coriander)

Fresh coriander leaves were used. It contains Camphor, geraniol, Coriandrol, Linalool, pinene, limonene, carvone and used for rheumatisem, dysentery, piles, flatulence, hernia Measles, nausea, and toothache [23].

Mentha pipperata (Peppermint)

Peppermint leaves contain essential oil like methol, menthone, limonine showing antioxidant, anti-microbial, anti-viral activities [24].

The paratha is a processed product of dough. All steps of dough making are physical i.e. mixing of ingredients, kneading the material with water to make dough, resting period. All these physical steps does not affect the nutritional value of paratha as a functional food; the only step that can change the nature of thermolabile phytochemicals especially polyphenol is the conversion of thin rolled sheets of dough into the processed form paratha i.e. “cooking the dough at 18°C for at least 5 minutes”.

As Rainbow paratha recipe contains multiple ingredients, but all ingredients are edible and safe to utilize in daily routine. Processing of paratha is also very easy and simple; moreover its taste is also very good. It is very tasty functional food that can easily be made at home having very low cost budget.

Conclusion

After COVID-19 pandemic health conditions of people all over the globe is facing challenges. In most of the individuals immune system has been weakened in post pandemic conditions altering both Physical and mental status of populace. It is recommended to make awareness among people to maintain their health in better condition by incorporating functional foods like rainbow paratha by just adding some condiments in the traditional simple paratha which is a must part of Pakistani traditional cuisine almost at every home. It can help in strengthen the immune system and overall improved health condition of community.

References

  1. Clare M Hasler (2002) Functional Foods: Benefits, Concerns and Challenges—A Position Paper from the American Council on Science and Health The Journal of Nutrition 132: 3772-3781. [crossref]
  2. Henry C (2010) Functional foods. Eur J Clin Nutr 64: 657-659.
  3. Monica Butnariu, Ioan Sarac (2019) Functional Food. International Journal of Nutrition 3: 7-16.
  4. Temple NJ (2022) A rational definition for functional foods: A perspective. Nutr 9. [crossref]
  5. Schieber M, Chandel NS (2014) ROS Function in Redox Signaling and Oxidative Stress Review Current Biology 24: R453-R462. [crossref]
  6. Pizzino G, Irrera N, Cucinotta M, Pallio G, Mannino F, et al. (2017) Oxidative stress: Harms and benefits for human health, Oxidative medicines and cellular longevity 2017: 13. [crossref]
  7. Rajendran P, N Nandakumar, T Rengarajan, R Palaniswami, EN Gnanadhas, et al. (2014) “Antioxidants and human diseases,” Clinica Chimica Acta 436: 332-347. [crossref]
  8. Kumar S, AK Pandey (2015) “Free radicals: health implications and their mitigation by herbals,” British Journal of Medicine and Medical Research 7: 438-457. [crossref]
  9. Valko M, D Leibfritz, J Moncola, MD Cronin, M Mazur, et al. (2007) “Free radicals and antioxidants in normal physiological functions and human disease,” The International Journal of Biochemistry & Cell Biology 39: 44-84. [crossref]
  10. Vergara-Jimenez M, Almatrafi MM, Fernandez ML (2017) Bioactive Components in Moringa Oleifera Leaves Protect against Chronic Disease. Antioxidants (Basel) 6: 91. [crossref]
  11. Stohs SJ, Hartman MJ (2015) Review of the Safety and Efficacy of Moringa oleifera Res 29: 796-804. [crossref]
  12. Vongsak B, Sithisarna P, Mangmool SB, Thongpraditchote S (2013) Maximizing total phenolics, total flavonoids contents and antioxidant activity of Moringa oleifera leaf extract by the appropriate extraction method Industrial Crops and Products 44: 566-571.
  13. Sreelatha S, Padma PR (2009) Antioxidant Activity and Total Phenolic Content of Moringa oleifera Leaves in Two Stages of Maturity. Plant Foods Hum Nutr 64: 303. [crossref]
  14. BKKK Jinadasa, F Van Bockstaele, JH Cvejic, Jesus Simal-Gandara (2022) Chapter 11 – Current trends and next generation of future edible oils, Editor(s): Rajeev Bhat, Future Foods, Academic Press 2022: 203-231.
  15. Chakraborty S, Gupta SS, Sengupta A, Ghosh M (2018) Quality ascertain of different mustard oil samples Obtained from the Local market of West Bengal, India. Asian Journal of Dairy and Food Research 37: 138-143.
  16. Neha P, Jain SK, Jain NK, Mittal HK (2018) Chemical and functional properties of Beetroot (Beta vulgaris L.) for product development: A review International Journal of Chemical Studies 6: 3190-3194.
  17. El Gamal AA, AlSaid MS, Raish M, et al. (2014) Beetroot (Beta vulgaris L) extract ameliorates gentamicin-induced nephrotoxicity associated oxidative stress, inflammation, and apoptosis in rodent model. Mediators Inflamm 2014: 983952. [crossref]
  18. Saleem A, Naureen I, Naeem M, Tasleem G, et al. (2022) Therapeutic Role of Piper Nigrum L (Black Pepper) and Pharmacological Activities. Sch Int J Biochem 5: 15-21.
  19. Meghwal M, Goswami TK (2013) Piper nigrum and piperine: an update. Phytother Res 27: 1121-1130. [crossref]
  20. Yadav UC, Baquer NZ (2014) Pharmacological effects of Trigonella foenum-graecum L. in health and disease. Pharm Biol 52: 243-254. [crossref]
  21. Kocaadam B, Şanlier N (2017) Curcumin, an active component of turmeric (Curcuma longa), and its effects on health. Crit Rev Food Sci Nutr 57: 2889-2895. [crossref]
  22. Singh RP, Gangadharappa HV, Mruthunjaya K (2017) Cuminum cyminum – A Popular Spice: An Updated Review, Pharmacognosy Journal 9: 292-301.
  23. Laribi B, Kouki K, M’Hamdi M, Bettaieb T (2015) Coriander (Coriandrum sativum L.) and its bioactive constituents. Fitoterapia 103: 9-26. [crossref]
  24. Schmidt E, Bail S, Buchbauer G, Stoilova I, Atanasova T, et al. (2009) Chemical composition, olfactory evaluation and antioxidant effects of essential oil from Mentha x piperita. Nat Prod Commun 4: 1107-1112. [crossref]
  25. Minocha N, Saini S, Pandey P (2022) Nutritional prospects of wheatgrass (Triticum aestivum) and its effects in treatment and chemoprevention. Explor Med 3: 432-442. [crossref]
  26. Centers of Disease Control and Prevention (CDC). Water and Healthier Drinks; Healthy Weight, Nutrition, and Physica Activity.
  27. World Health Organization (WHO). Post COVID-19 condition.
  28. World Health Organization (WHO). The impact of COVID-19 on mental health cannot be made light of.
  29. Mao QQ, Xu XY, Cao SY, et al. (2019) Bioactive Compounds and Bioactivities of Ginger (Zingiber officinale Roscoe). Foods 8: 185. [crossref]
  30. El-Saber Batiha G, Magdy Beshbishy A, G Wasef L, Elewa YHA, et al. (2020) Chemical Constituents and Pharmacological Activities of Garlic (Allium sativum L.): A Review. Nutrients 12: 872. [crossref]
  31. Dorrigiv M, Zareiyan A, Hosseinzadeh H (2021) Onion (Allium cepa) and its Main Constituents as Antidotes or Protective Agents against Natural or Chemical Toxicities: A Comprehensive Review. Iran J Pharm Res 20: 3-26. [crossref]

Empowering Young People to become Researchers: What Does It Take to become a Police Officer?

DOI: 10.31038/PSYJ.2023531

Abstract

The study reported here on ‘what does it take to become a police officer’ represents one of several explorations of the ‘world of the adult’ from the point of view of a middle school student. The objective of these studies is to explore the nature of how students see the world of adults, doing so by providing the student with a templated research tool (www.BimiLeap.com). With this tool, and with the embedded coaching provided by the access to artificial intelligence (Idea Coach), the student can explore a topic, select aspects of the topic, and perform a real-world experiment, in the same way as a professional researcher does. The outcome shows how the student thinks about a topic, and the response to the student’s thinking by actual respondents, an outcome which at once provides knowledge about the topic and knowledge about the mind of the researcher.

Introduction

A great deal of the research involving the way young people think comes from the world of developmental psychology, with its emphasis on the nature of how the young person approaches a problem, conceptualizes the problem, and then proceeds to solve the problem. The literature of developmental psychology is vast, much of it in the hands of professional psychologists who study the topic in the rarified atmosphere of observational science [1,2]. The science, the knowledge emerging, may be idiographic, viz., detailed knowledge of an individual, or nomothetic, viz., detailed knowledge of general patterns of groups. Of interest here is how children think about future careers, specifically a career in the police force [3-6].While scientists and clinicians build up their world of understanding, there are practical issues and applications as well, best expressed by issues encountered in school and in everyday life. How does a student learn? What are the types of questions that a student asks about a topic? One example is how do students formulate questions about a topic to learn about the topic. What can we learn from those questions? And can we create a system which allows us to explore the mind of the student towards the world of the everyday?

A continuing topic in science concerns what is appropriate for science to investigate, who should do the investigation, how should the investigation be done, what should be the appropriate report, and finally what is the ultimate value of the research? For the efforts involving student researchers, often young ones who have not even graduated high school or middle school, the question revolves around the nature of the contribution that they can make. The world of academic science is replete with degreed professionals, publishing papers on topics to, in colloquial terms, ‘answer a call from the literature’ or plug a hole in the gaps of our knowledge.’ There is a sense that science is evolving to a closed world, permission to join that world granted only by degree, and only by the receipt of money to do one’s scientific research. There is no room for others. Sadly, then, this attitude, if correct, may end up limiting our knowledge about the psychology of people, especially young people, as these people focus on real-world issues. The young people may end up as subjects for the study, the study involving an external researcher trying to figure out the ideas of the young person. Why not let the young person do the research, choosing the topic, and executing the study in a way which ensures the maximum opportunity of success.

The Worldview of Mind Genomics

Mind Genomics is an emerging science, focusing on the analysis of how we make decisions about the world of the everyday [7,8]. Of relevance to the understanding of the mind of young people are at least two studies dealing done with Mind Genomics, one on hospitals [9], the other on the marketing of museums to young people [10]. Mind Genomics has emerged slowly during the past forty years, with roots and history traceable to at least three worlds of inquiry:

The first of the worlds is experimental psychology, and specifically the world of psychophysics, the study of the relation between test stimuli and the perception of these test stimuli. Psychophysics is often thought to be the earliest field of experimental psychology, with a focus on measuring the perceived intensity of test stimuli, such as the sweetness of a cola sweetened beverage. The traditional objective of psychophysics is to measure the subjective intensity of external stimuli, such as the loudness of sounds, and so forth. Mind Genomics moves the measurement inwards, to measure the magnitude of private sensory or cognitive experience. The goal, however, remains measurement.

The second world is statistics, and more specifically the role of experimental design. Mind Genomics ‘works’ by presenting vignettes (combinations of elements, viz., messages) to the respondent with the instruction to read the vignette, and rate the entire vignette as a single entity. The rationale is that in the world of the everyday the person is confronted with mixtures of elements, from which the respondent must make a decision. The person is almost never presented with a series of single elements, one at a time, and instructed to make a decision. That ‘one at a time’ strategy simply does not represent the world in which people naturally make decisions. The issue is to create the appropriate set of combinations or vignettes, allowing the researcher to uncover how each element drives the response. In other words, the respondent evaluates systematically constructed mixtures, allowing the researcher to estimate the contribution of each component of the mixture. It is statistics, specifically experimental design, which prescribes the specific combinations to create and to test [11].

The third world is consumer research, more specifically the evaluation of real-world concepts, viz., meaningful combinations of elements. Consumer research deals with topics that are meaningful and real in the everyday world, in contrast to experimental psychology and psychophysics which deal with artificially contrived situations having little or no cognitive value. A consumer researcher works with test stimuli which have meaning in the outside world. Just the word ‘consumer’ in the name ‘consumer research’ is a clue that the topics must have relevance to the real world of people, not to artificially contrived situations set up to support or disprove a hypothesis.

Templating the Mind Genomics Studies to Democratize the ‘Project of Science’

During the forty-year history of Mind Genomics, as it evolved from business-oriented studies of what to say about products into a more general understanding of how people think about topics, it became increasingly obvious that the process of creating vignettes to test was a barrier. In today’s language, the need to think about topics, to create test stimuli, and to execute and analyze experiments became ‘friction points.’ Even students, accustomed to research projects, reported that they had difficulty developing combinations of ideas to test, although few students ever reported difficulties with the ensuing statistical analysis of the data once the study was designed and executed.

During that forty year period it was becoming increasingly obvious that the process of Mind Genomics had to be streamlined, both to help the researcher develop the test stimuli / run the experiment, but also, and more profoundly, help the researcher to think in a new way. It was at this point that the effort moved towards templates, and to automating the process, an effort evolving to the use of artificial intelligence as a coach to help create the questions and the answers [12].

This paper presents the templated approach, applying it to a specific study developed entirely by the senior author, Cledwin Mendoza, himself a middle school student. It is important to keep the nature of the lead researcher in mind because the paper will reveal a way by which the world can be studied from the ‘inside out’, viz., from the mind of young people who are just entering the world, rather than being studied from the ‘outside in’, by professionals who are trying to understand what the young person is thinking, but doing it through a blunt instrument and a blurry lens.

The steps presented below are implemented in an easy-to-use computer program, www.BimiLeap.com. The program is free to use, with the only charges being the minor cost of acquiring information from the artificial intelligence source (Open AI), and the relatively minor cost of actually running a study with real people.

The Steps in the Process

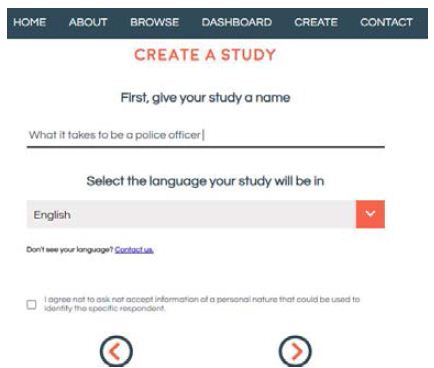
Step 1: Describe the Topic in a Word or Two (Figure 1)

This step may seem simple, but it forces the researcher to focus on the issue. This first step begins the development of critical thinking about the topic, as the research is forced to distinguish between the topic in general (to be written in the proper space in Figure 1), and the actual question about the topic (to be written in Figure 2, where the researcher is requested to expand on the topic.

FIG 1

Figure 1: The front page, requesting the researcher to name the study

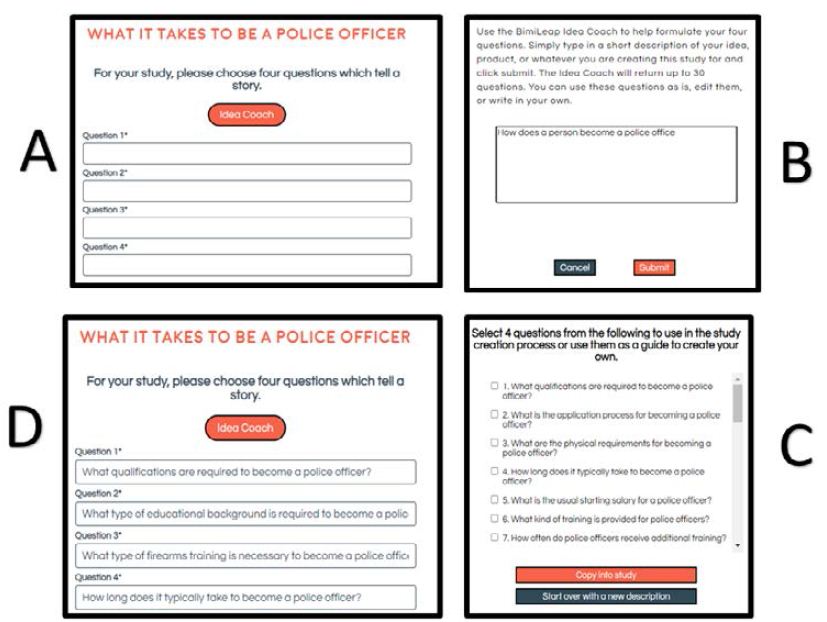
Step 2: Come Up with Four Questions Pertaining to the Topic (Figure 2)

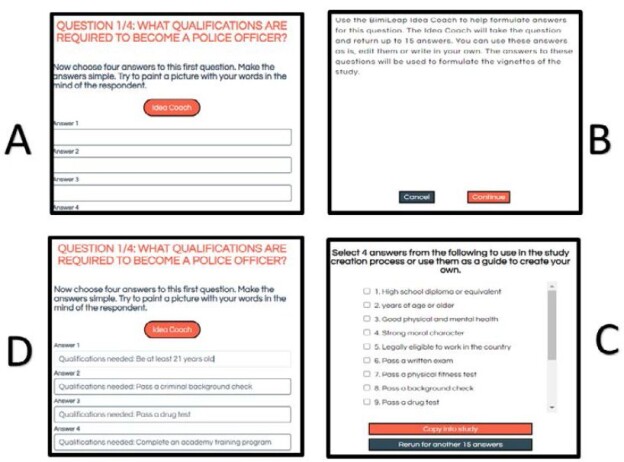
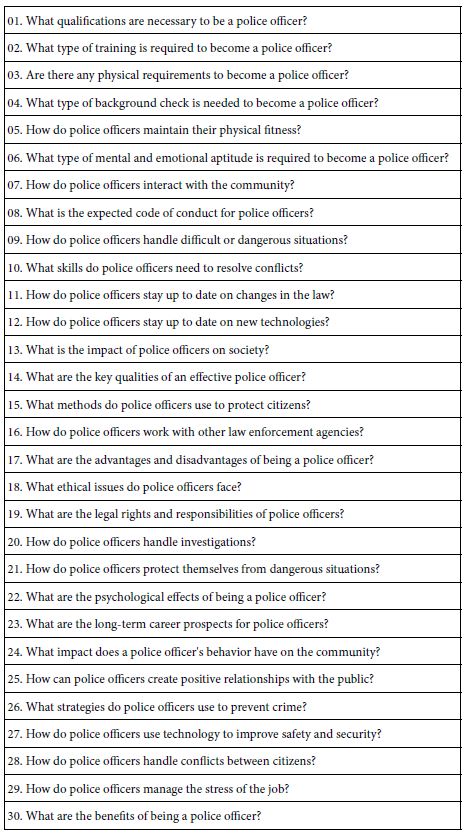
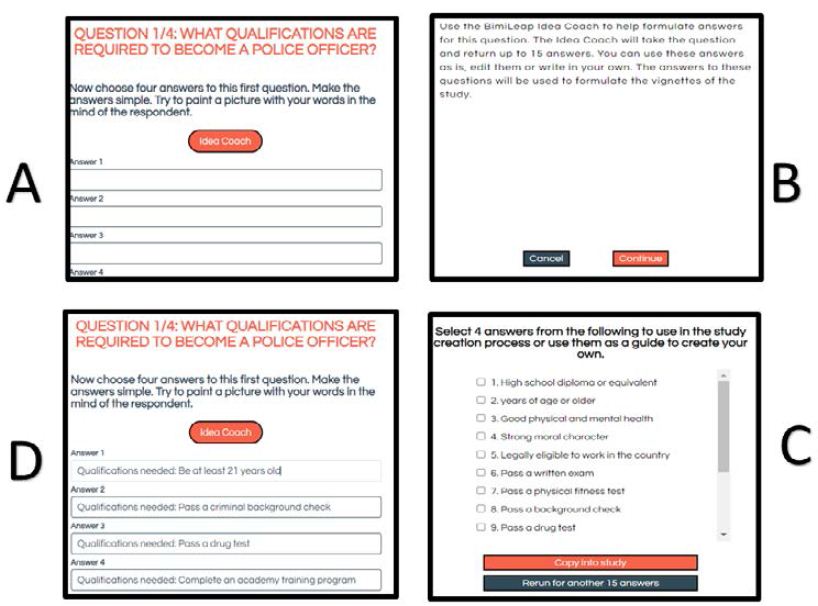
It is at this point that many researchers and students ‘freeze.’ It is one thing to name a topic, but quite another to think deeply about a topic, coming up with a set of four questions which are coherent, and which tell a story. The Mind Genomics process has been immeasurably aided by the emergence of artificial intelligence provided by Open AI, Inc., and embedded in Idea Coach. Panel B shows the screen shot with the ‘box’ in which the researcher can describe the topic, either in sketchy terms or in detail, as desired. Idea Coach then returns with a set of up to 30 recommended questions that can be used (Panel 2C). The researcher may select some of the questions, and repeat the request, using either the same description of the topic, or a revised description. Idea Coach will return with another set of 30 questions, some of which may be repeats from the first set of 30. Panel D lists the final set of four questions. The Idea Coach in Step 2 serves both as a tool to facilitate the research and to engage the researcher to think more deeply about the topic. Table 1 presents a set of 30 questions emerging from the request. The entire set-up process takes about 10 minutes or less once the researcher becomes familiar with the process of using Idea Coach. It is important to emphasize that Step 2 enables the researcher to learn about the topic in a way that ends up being deep and granular.

FIG 2

Figure 2: The request for the four questions (Panel A), the Idea Coach (Panel B), some of the questions returned (Panel C), and the four questions finally selected (Panel D).

Table 1: The 30 questions emerging from using Idea Coach

TAB 1

Step 3: Create Four Answers for Each of the Four Questions

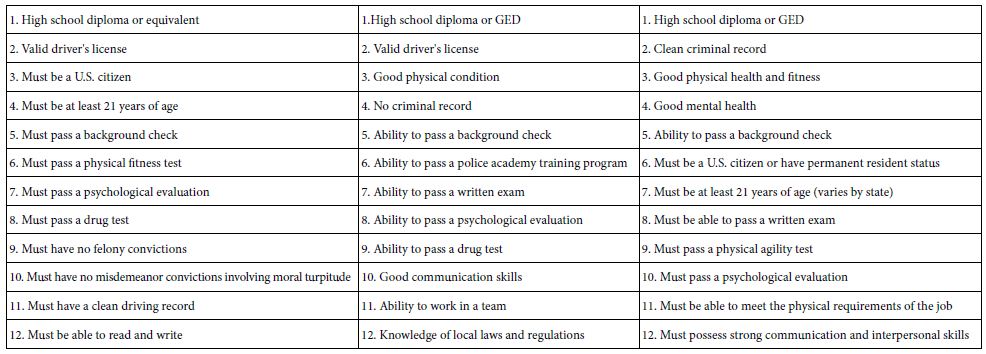
Answering questions ends up being easier than posing questions. Once the researcher has chosen the four questions, the researcher can either answer the questions directly, or once again use artificial intelligence embedded in Idea Coach to create the answers. Once again the researcher can use Idea Coach a number of times for each question to identify appropriate answers. Each ‘query’ to Idea Coach returns with 10-15 answers. Depending upon the nature of the topic the answers can be the same or different. There is no direct control. Figure 3 shows the process as the researcher would see it. Table 2 shows three different runs of the same question, creating 45 answers, many of which are the same from run to run.

FIG 3

Figure 3: The instruction to create four answers for Questions

Table 2: Three sets of 12 suggested answers to question 1 provided by Idea Coach. The question is ‘What qualifications are required to become a police officer?”

TAB 2

Step 4: Create Vignettes Comprising 2-4 Elements

Mind Genomics works by presenting vignettes to respondents, these vignettes comprising a limited number of elements. The vignettes attempt to describe a ‘scenario’ with sufficient information to allow the respondent to assign a rating. The vignettes are created according to an underlying experimental design. The design for the specific set of four questions and four answers to each question requires 24 combinations. These combinations can be modified by a permutation scheme, one which maintains the underlying mathematical structural, but ensures that each set of 24 combinations differs substantially from every other set of 24 combinations. Each of the 16 elements in the 24 combinations appears exactly five times, and is absent exactly 19 times. Each vignette comprises at most one element or answer from a question, never two answers from the same question, and in five of the 24 vignettes the element or answer from the question is entirely absent.

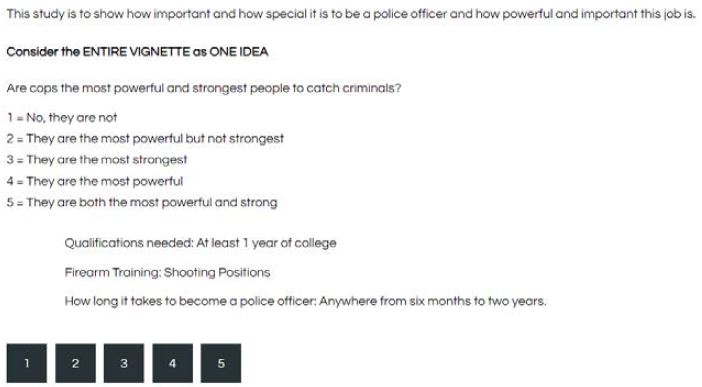
Figure 4 shows an example of the vignette (and the rating question and scale) as it would be presented to the respondent. The respondent does know that the vignettes are created by an underlying design, and indeed it would be impossible for the respondent to detect such a design in the short time that the respondent participants.

FIG 4

Figure 4: Example of the vignette as the respondent sees it. The figure shows the rating question, the vignette

Step 5: Complete the Study set-up

The set-up includes the creation of a set of self-profiling classification questions, two fixed (gender, age), and up to eight more left to the researcher. The rest of the study includes the rating question, the rating scale, an open end-question if desired, and a small paragraph to record the underlying objective of the study. Table 3 shows the relevant information for the study, including the number and gender of the respondents. This information is returned in the Excel report which summarizes the study and its data. Once the study is finalized, the researcher launches, choosing either paid respondents, or respondents that will be furnished by the researcher (Figure 5). Although it is always more attractive to work with one’s own associates/friends/students as respondents, experience suggests that study with 100 respondents may take an hour or two to complete with ‘paid respondents’, and a week or two or even longer, sometimes never, to complete with one’s ‘unpaid respondents.’

Table 3: Relevant study information for the study returned in the Excel report

TAB 3

FIG 5

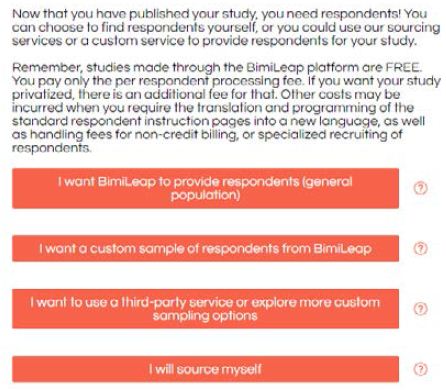
Figure 5: Options to source respondents from (www.BimiLeap.com, the Mind Genomics website

Step 6: Sourcing Respondents

During the past decade the volume of surveys has increased dramatically, as the desire for consumer feedback has exploded. Consequently, the so-called ‘response-rate’ has dropped down. Whereas decades ago the participation in a survey was deemed interesting, today the same participation is considered an intrusion. It is difficult, almost impossible at times, to secure respondents for free, unless one is dealing with a captive audience. The best way to get willing respondents is to pay them, or to work with an on-line panel provider who incentivizes the respondent to participate in these surveys, e.g., through points which can be redeemed for something, even occasionally for money. Whether these respondents are somehow biased or not representative of the ‘real world’ was once an issue for the purist researcher, but today’s oversampled, survey-weary individuals make that issue of ‘real world’ virtually irrelevant.

The BimiLeap program has within it a variety of options to source respondents, as Figure 5 shows. The efforts to source respondents do cost some money, but minimal amounts in the world of today. For those who want to source their own respondent there is that option. For those who want a professional group to provide a group of specified types of individuals there is that option as well.

Step 7: Acquiring the Data and Storing the Data in an Analysis-ready Database

The respondents were provided by Luc.id, Inc. BimiLeap contains a set of screens allowing the researcher to specify the respondents. For this study, the respondents were selected to be residents of the United States, and to be between the ages of 16 and 30. The BimiLeap program is set up to forward the request automatically to Luc.id, when the researcher selects BimiLeap as the provider.

The appropriate respondents who fit the criteria selected by the researcher are invited to participate. Those who participate are shown a series of screens, introducing the topic, requesting the respondent to complete the self-profiling questionnaire, and then read and rate each of the 24 vignettes. Recall that each respondent evaluated a unique set of 24 vignettes, as specified by the underlying experimental design [13].

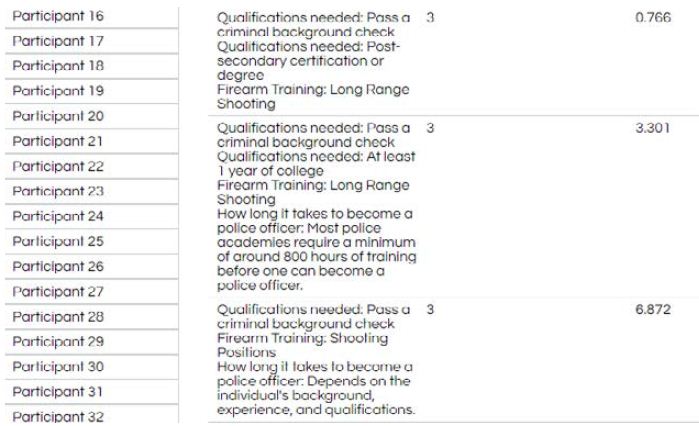
Figure 6 shows an example for three vignettes evaluated by one of the respondents. The left column shows the respondent (cut off for this respondent), the 2nd column shows the text of the vignette, the 3rd column shows the rating, and the 4th column shows the response time.

FIG 6

Figure 6: Example of data as captured by the Bimileap program

Step 8: Create Equations Relating the Presence/Absence of Elements to Ratings and to Response Time

The goal of Mind Genomics is to quantify the relation between the presence/absence of the elements and the response. The response in this case is the rating assigned by the respondent on the 5-point scale (or more correctly a transformed value, described below), and well as the response time.

The first action to create the equations is to put the rating into the proper form. The scale by itself has to be transformed so that the numbers are meaningful. The scale as presented is known as a nominal scale. The scale does not have metric meaning. Fortunately, the transformations that can be made are easy to do, as presented below.

For this study we focus on Rating 5. The rating question is: Are cops the most powerful and strongest people to catch criminals? Rating 5 is: They are both the most powerful and strong.

Our interest then is whether the respondent feels that that, based on the vignette, does the respondent rate the vignette ‘5’ or not. When the respondent rates the vignette ‘5’, then we create a new variable, called R5, and give R5 the value ‘100’. When the respondent rates the vignette ‘1, 2, 3 or 4’, then we give R5 the value ‘0’. In this way we end up with a new variable ‘5’ which has a defined, straightforward meaning. Furthermore, a manager presented with an average value of 45 for R5, for example, the manager immediately knows that 45% of the responses were ‘5’, and the remaining 55% of the responses were not ‘5’. Note that in this study only the rating of ‘5’ was transformed to 100, with the remaining four rating points transformed to ‘0’. In other studies, often the ratings of both ‘5’ and ‘4’ are transformed to 100. The reason for the focus on rating ‘5’ is the interest in perceiving the police officer as both powerful and strong. Finally, after the binary transformation has been made, a vanishingly small random number is added to the transformed number, moving it away from purely ‘0’. This action is prophylactic, preventing the respondent from ending up with all ‘0’s,’ or with all ‘1’s,’ respectively, a situation which would cause the regression program to ‘crash.’ The regression program requires some minimal level of variation in the dependent variable.

The second action is to bring in the response time and truncate it to the nearest 100th of a second. There is no transformation needed here.

Once the transformations are made, the database can be easily created. Each respondent generates 24 rows in this database. The columns are defined as follows:

Column 1              Study name

Column 2              Respondent unique identifier

Columns 3-5       Specific information from the self-profiling classification (here gender, age, and appropriate age…)

Column 6-21      Coding for the element. Each column corresponds to an element (A1-D4). For a specific respondent and a specific vignette, the cell has the value ‘1’ when the element appears in the vignette, or the value ‘0’ when the element is absent from the vignette.

Column 22            Order of testing (1-24)

Columns 23-24    Rating, Response Time,

Columns 25-29 Binary Transformed Ratings (R1, R2, R3, R4, R5)

Once the data are transformed, it is straightforward to create the equation relating the presence/absence of the 16 elements to the transformed (binary) variable for R5, and to response time. The approach is known as OLS, ordinary least-squares, with the variables being known as ‘dummy variables,’ because the variables are either ‘0’ (absent) or ‘1’ (present).

The regression equation for R5 (transformed binary rating) is: R5 = k0 + k1(A1) + k2(A2) … k16(D4)

The equation tells us that the binary value R5 is the sum of an additive constant (k0) and the weighted values for the 16 elements. The additive constant is a purely theoretical baseline, showing the expected value of the binary variable R5 when all the 16 elements are absent from the vignette. The reality is that the underlying experimental design ensures that each respondent evaluated vignettes comprising a minimum of two elements and a maximum of four elements, so in no case was a vignette ever shown without elements. Nonetheless, the regression equation estimates that value, as a ‘correction factor’. IN the language of statistics, k0 is known as the ‘intercept’, viz the value of Y when X is 0, or in our case the value of R5 when all the 16 X’s, the 16 elements, are 0. We use the value R5 as a measure of the basic predilection of a person or a group of respondents to select the rating of ‘5’.

The coefficient for an element (viz., k1 – k16) tells us the percentage of respondents who will change their rating to ‘5’ when they evaluate a vignette with the element in the vignette. Thus, for a coefficient of 3 for an element, an additional 3% of the respondent who read a vignette with that particular element changed their rating from ‘1, 2, 3 or 4’ to a rating of ‘5’. Our focus will be on the elements and the subgroups showing high coefficients, typically 6 or higher. Continuing with our train of thought, a coefficient of +6 for an element means that an additional 6% of the responses for a vignette containing this element will shift from a lower range of 1-4 to the higher value of 5.

The regression for RT (response time) is expressed by the same equation, but without an additive constant: RT = k1(A1) + k2(A2) … k16(D4). Response time does not need an additive constant. We assume that in the absence of all elements there is no response at all, so by definition the response time is already 0.

Step 9: Create Mind-sets Using Clustering

People are different. We often pay attention to the large differences among people, feeling that these are worthy of note. Marketers attempt to divide the world into these different basic groups, the groups being relevant to large-scale topics and issues such as political leaning (e.g., progressive vs. conservative), financial issues (e.g., growth seeking vs. capital protection), food preferences (adventurous eaters vs. conservative eaters), and the like. The contribution of Mind Genomics is to find these differences in the world of the everyday. An early discovery of Mind Genomics was that it is a straightforward approach to uncover these group differences within a single dataset using relatively straightforward statistics.

For our data on police, or for that matter, any data of this type, the process to uncover these mind-sets, these groups of different-thinking individuals, uses a combination of regression analysis and cluster analysis. The overall goal is to create an individual-level equation for each respondent, then using the coefficients of the model for each respondent to define a ‘distance’ between each pair of respondents, and finally put the individuals in a small number of groups or clusters (viz., mind-sets) so that the pattern of coefficients is similar within a group or mind-set, but the groups are different from each other. The outcome, however, ends up being a small number of groups which have radically different patterns of coefficients, patterns which presumably lend themselves to easy interpretation.

The clustering used in this study is called k-means cluster [14]. The clustering approach creates an equation for each respondent, relating the dependent variable, R5, to the 16 elements. The estimation of the individual-level model is possible because the 24 vignettes for each respondent are set up to allow OLS regression for that individual, even if there is no other respondent. The measure of distance between the respondents is (1-Pearson R), with the Pearson R (correlation) measuring the degree of linearity between two sets of 16 coefficients (the additive constant not considered). The distance between two perfectly correlated sets of 16 coefficients is 0 (1-1 = 0). The distance between two opposite patterns is (1)-(-1), viz., 2. Once the person-to-person distances are computed, as well as the centroid-to- centroid differences computed, the clustering program can identify the number of clusters, and the appropriate membership of each respondent in one of the non-overlapping, exhaustive clusters. For these data the cluster solution suggested two groups, called MS1 and MS2 (MS short for mind-set).

Results

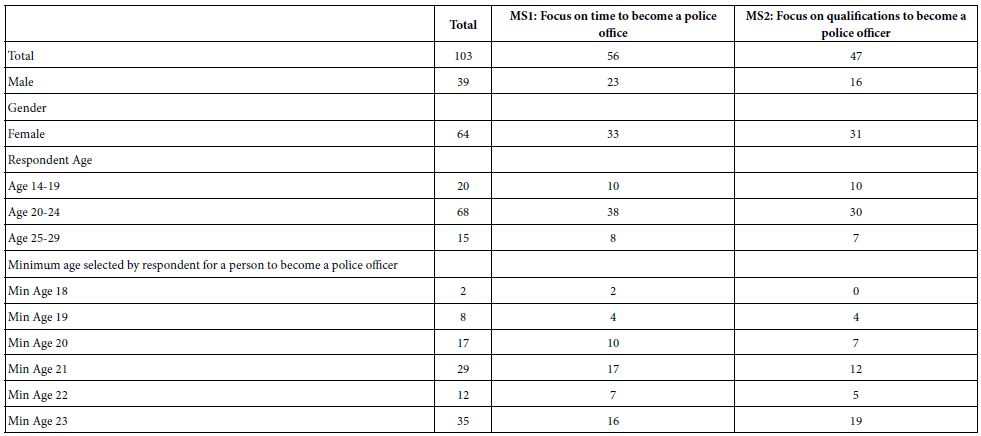
Table 4 shows the panel composition:

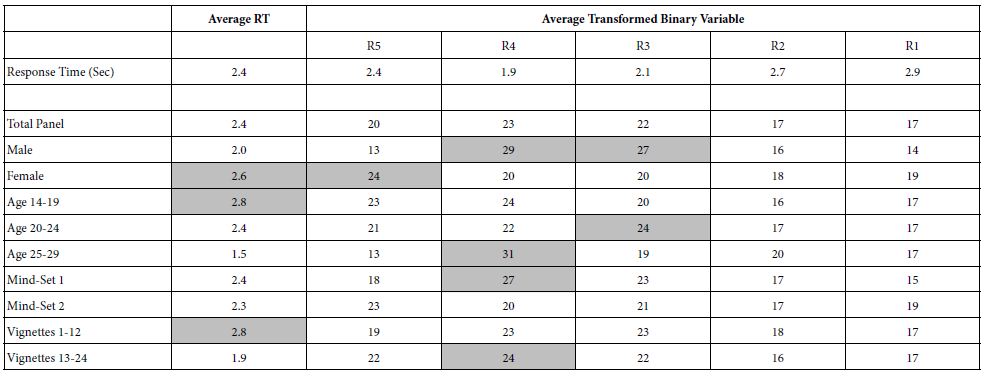
We begin the exploration of the data with the simplest analysis, namely the average response time, and the average transformed ratings, first for total panel, and then for key subgroups. Table 4 shows the averages. The columns correspond to the dependent variable, the first being the average response time across all vignettes evaluated by the key subgroup, and the remaining five being the average transformed ratings, R1-R5. The final analysis looks at the averages for the first 12 vignettes, and then the second 12 vignettes. To allow patterns to emerge, Table 4 presents strong performing elements in shaded cells. These strong performing elements are response times of 2.6 seconds or longer, and average transformed variable of 24 or higher. The pattern is clear for the order of testing, with vignettes 1-12 generating longer response times than vignettes 13-24. Yet, beyond that simple finding, it is hard to state anything about the results. By itself, Table 5 may allow one to generate hypotheses about ‘why’ certain ratings (R5, R2, R1) co-vary with long responses times, whereas other ratings (R4, R3) co-covary with short response times. Table 4, however, does not allow the researcher to exploit the most important feature of the stimuli, viz., that the test stimuli, the elements, are ‘cognitively rich,’ replete with meaning, and interpretable in and of themselves.

Table 4: Panel composition

TAB 4


We now move to the explication of the data after OLS (Ordinary Least Squares) regression. The dependent variable is R5, The rating question is: Are cops the most powerful and strongest people to catch criminals? Rating 5 is: They are both the most powerful and strong. R5 takes on the value ’100’ when the respondent selects ‘5’ as the rating. R5 takes on the value ‘0’ when the respondent selects any other number, ‘1, 2, 3, or 4’.’

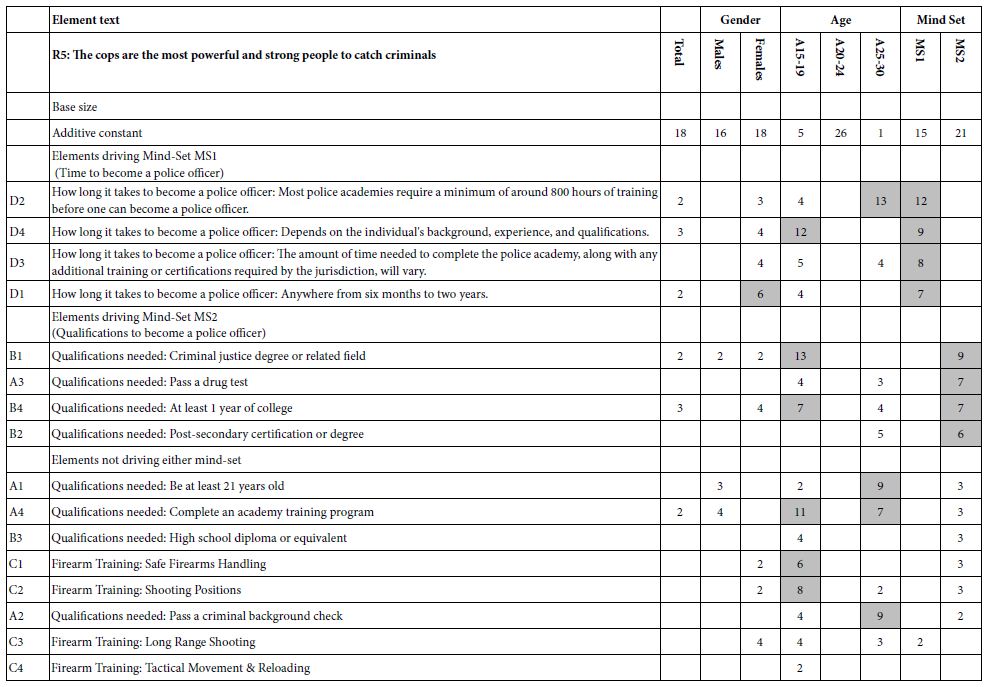
The coefficients for the equation (models) for the studies are shown in Table 5. The columns correspond to the defined groups of respondents or vignettes, the rows correspond to the additive constant, and then to the 16 elements. All coefficients of 1 or lower are removed, so that the cell is empty. Strong performing elements (operationally defined as a coefficient of +6) are shown by shaded cells. The table is sorted by the values for the coefficients emerging from the mind-sets.

Table 5: Average response time and transformed binary variable for total panel and key subgroups

TAB 5

The rationale for not showing very low, 0 or negative coefficients is that these negative coefficients show that the element does not drive R5. We are interested in the elements which drive R5. The rationale for shading the strong performing cells is to allow the patterns to emerge more clearly. Finally, the rationale for sorting the table by the coefficient of the two mind-sets that only then does a strong and meaningful pattern emerge.

Table 6 shows four sets of columns, corresponding to the key groups.

  1. The additive constant is 18, meaning that about one out of five or six responses is ‘5’. This is a low baseline. As we scan the table, looking at the column for Total, see remarkably few elements. It is as if there are no strong messages. It is important to stop to think about what this means. Is it the case that the researcher simply failed to find the ‘right words’ to drive the strong responses? Or is the reason deeper, that perhaps looking at the Total is not a productive approach, that perhaps there will never be the ‘magic messages’ which generate high coefficients among the total panel. It is important to note that this conundrum, about low coefficients among the total panel, is a lesson for the young researcher that there is no perfect message, and that it might be futile to continue in that path, looking for the ‘better message’. Finally, the disappointing results for the Total Panel do not surprise us. They emerge again and again in these studies and in the outside where the data are used to make product development and marketing decisions. There are no ‘perfect’ and when a high scoring element is achieved for the Total Panel, it is an unexpected anomaly.
  2. Once again, the additive constants are low, 16 for males, 18 for females. And once again most coefficients are absent. There are few positive coefficients and no operationally defined ‘strong performing elements’ with coefficient of +6 or higher.
  3. It is when we get to age that we begin to see patterns emerging, patterns which show us different ways of thinking. When we look at these patterns in detail, however, we will see that the patterns emerge from the general magnitudes of the response, and not from profoundly different ways of looking at the work. The key to the differences among the different elements which perform strongly can be traced to the size of the additive constant. The additive constant is very low for ages 15-19, and for ages 25-30. The basic tendency is low for a vignette to get the rating ending up as R5, viz., and original rating of ‘5’. Consequently, it is much easier for an element to generate a high positive coefficient when the additive constant is low. Think of an element with coefficient 14, but with additive constant 4 as not really that different from an element with coefficient 2 but additive constant 16. Both sum to 18. The former element is a strong performer. The very low base does nothing to help the elements score well. This element scores well without any help. Now let’s turn to the second, from a data set with a higher additive constant, 16. All elements benefit from this higher additive constant. A poor element with an intrinsic value of +2 will have the benefit of added to a high base.

Nonetheless, there are patterns.

Age 15-19 – very low additive constant (5), so three elements stand out

B1               Qualifications needed: Criminal justice degree or related field                       13

D4               How long it takes to become a police officer: Depends on the individual’s background, experience, and qualifications.                          12

B4               Qualifications needed: At least 1 year of college                                              7

Age 20-24 – modest additive constant (26), so no element stands out.

Age 25-30 – very low additive constant (1), so four elements stand out

D2            How long it takes to become a police officer: Most police academies require a minimum of around 800 hours of training before one can become a police officer.                             13

A1             Qualifications needed: Be at least 21 years old                                                   9

A2             Qualifications needed: Pass a criminal background check                                9

A4             Qualifications needed: Complete an academy training program                      7

It is with the creation of the two mind-sets that we see strong performing elements, and two clear patterns. Recall that the clustering was done without any interpretation of the results. Only after the clustering was complete was the data reanalyzed by OLS regression, with a separate equation for each mind-set. Table 6 shows that the two mind-sets each have modest additive constants (15 and 21, respectively), and more important, the strong performing elements for each mind-set tell a coherent story.

Mind-Set 1 focus on time to become a police officer.

D2 How long it takes to become a police officer: Most police academies require a minimum of around 800 hours of training before one can become a police officer.                                   12

D4 How long it takes to become a police officer: Depends on the individual’s background, experience, and qualifications.                                                                                                          9

D3 How long it takes to become a police officer: The amount of time needed to complete the police academy, along with any additional training or certifications required by the jurisdiction, will vary.   8

D1 How long it takes to become a police officer: Anywhere from six months to two years.        7

Mind-Set 2 focuses on the qualifications to become a police officer

B1        Qualifications needed: Criminal justice degree or related field                                      9

A3        Qualifications needed: Pass a drug test                                                                           7

B4        Qualifications needed: At least 1 year of college                                                             7

B2        Qualifications needed: Post-secondary certification or degree                                     6

Table 6: Additive constant and coefficients for equations relating R5 to the presence/absence of the 16 elements

TAB 6

We finish the presentation of results and the analysis by considering the data from the point of view of response time (RT). Response time occupies a special position in psychology and consumer / public opinion research [15]. It is presumed by some reearchers that a lot can be learned by measuring ‘responses’ that cannot be consciously controlled. Response time to the stimulus is one of these measures, albeit very closely related to the stimulus, and thus a reasonable choice for a non-conscious measure, one step beyond the direct rating which is assumed to be a conscious measure measure.

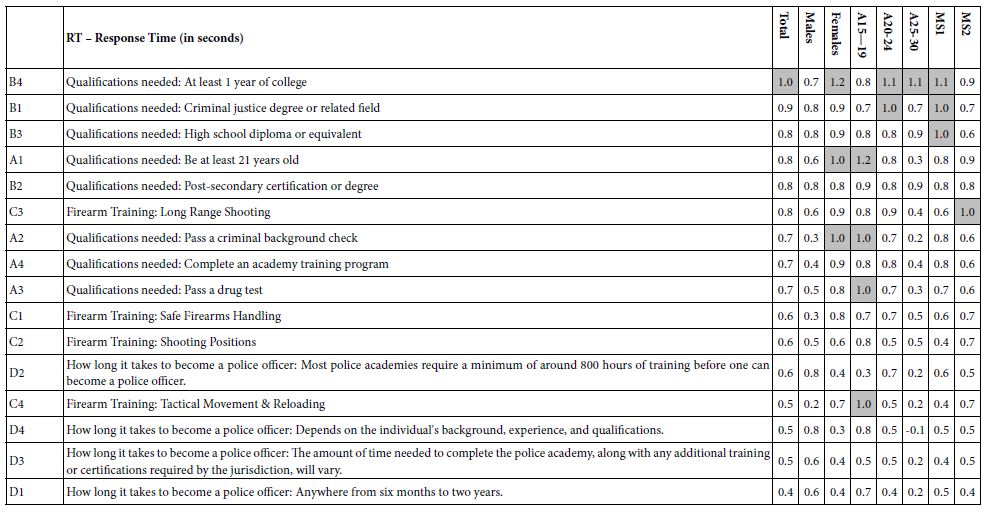
Table 7 shows the coefficients from the group-level equations relating response time (RT) to the presence/absence of the 16 elements. As noted above, the equation is estimated without an additive constant. In ‘regression speak’ this is known as ‘forcing the equation through the origin.’ All coefficients 1.0 seconds or longer are shown in shaded cells. Finally, the table shows the elements sorted by decreasing response time.

There are some clear patterns emerging from Table 6, patterns which make sense,

There is a clear hierarchy of response times

B4           Qualifications needed: At least 1 year of college                                              1.0

D1           How long it takes to become a police officer: Anywhere from six months to two years.       0.4

There is one element, B4, which is consistently among the longest in every group, suggesting that the respondents think about this element. This element reads: Qualifications needed: At least 1 year of college.

In contrast, the elements dealing with ‘how long it takes to become a police officer’ generate the shortest response times among all groups.

The practical aspects of the response time data emerge when we think about the implications. If the objective is to convey relevant information, long response times are important. They figuratively ‘stop the reader in her/his tracks,’ engaging the reader. The information is important to the reader, forcing the reader to think about what was read.

Table 7: Coefficients for equations relating response time (RT) to the presence/absence of the 16 elements

TAB 7

Discussion and Conclusions

A glance through the various references suggest that researchers are aware of the need to understand careers from the mind of students [16,17], but often approach the issue from the ‘top down.’ That is, the researcher is the adult, asking the younger person about ‘why did you want to become a police officer?’ The top-down approach is hallowed in research, with the topic-experts investigating the topic at a distance.

What is missing from the foregoing approach is a sense of what the young person is thinking. The young person can only respond to questions formulated by individuals who are ‘outside’ them, probing them to understand how the young person thinks. One need only look at the published research about young people and police to realize that virtually all information is top-down [18,19].

This paper has presented a novel way to understand how young people think about a career. The novelty comes from the use of young people as researchers, as well as using other young people as respondents. The scientific community is accustomed to researchers being topic-experts, focusing their inquiry into a problem, after having formulated hypotheses.

The ability to make students into researchers emerges from the combination of a research approach (experimental design), coupled with a templated approach guiding the user (www.BimiLeap.com, embodying Mind Genomics), and with artificial intelligence to suggest ideas (Idea Coach). The result of this happy combination is that virtually any young person who can read and understand instructions can become a researcher. The benefit is that the topic can be investigated by those who are also most heavily involved. The researcher needs not be mature, nor be a topic expert. As long as the researcher knows what to do, the approach is straightforward. The technology is set up so that no adult has to be involved, either in the design of the study, or in the completion of the study. That simplification, allowing anyone to become a researcher, opens the possibility of far deeper understanding of the way children think, not so much from better theory as from the ability to give the mind of the child a way to explore topics in the form of an experiment, with answers from other qualified respondents appropriate to the study.

References

  1. Barthe EP, Leone MC, Lateano TA (2013) Commercializing success: The impact of popular media on the career decisions and perceptual accuracy of criminal justice students. Teaching in Higher Education 18: 13-26.
  2. Fekjær SB (2014) Police students’ social background, attitudes and career plans. Policing: An International Journal of Police Strategies & Management 37: 467-483.
  3. Howard KA, Walsh ME (2010) Conceptions of career choice and attainment: Developmental levels in how children think about careers. Journal of Vocational Behavior 76: 143-152.
  4. Kupchik A, Curran FC, Fisher BW, Viano SL (2020) Police ambassadors: Student‐police interactions in school and legal socialization. Law & Society Review 54: 391-422.
  5. Powell MB, Skouteris H, Murfett R (2008) Children’s perceptions of the role of police: a qualitative study. International Journal of Police Science & Management 10: 464-473.
  6. Sindall K, McCarthy DJ, Brunton-Smith I (2017) Young people and the formation of attitudes towards the police. European Journal of Criminology 14: 344-364.
  7. Moskowitz HR, Gofman A, Beckley J, Ashman H (2006) Founding a new science: Mind genomics. Journal of Sensory Studies 21: 266-307.
  8. Moskowitz HR, Gofman A (2007) Selling Blue Elephants: How to Make Great Products that People Want Before Theu Even Know They Want Them. Pearson Education.
  9. Gabay G, Moskowitz HR (2015) Mind Genomics: What Professional Conduct Enhances the Emotional Wellbeing of Teens at the Hospital? Journal of Psychological Abnormalities in Children.
  10. Gofman A, Moskowitz HR, Mets T (2011) Marketing museums and exhibitions: What drives the interest of young people. Journal of Hospitality Marketing & Management 20: 601-618.
  11. Mukerjee R, Wu CF (2006) A Modern Theory of Factorial Design. New York: Springer.
  12. Mendoza C, Deitel J, Braun M, Rappaport S, Moskowitz H (2023) Empowering Young Researchers: Exploring and Understanding Responses to the Jobs of Home Aide for a Young Child. Pediatric Studies and Care 3: 1-9.
  13. Gofman A, Moskowitz H (2010) Isomorphic permuted experimental designs and their application in conjoint analysis. Journal of Sensory Studies 25: 127-145.
  14. Likas A, Vlassis N, Verbeek JJ (2003) The global k-means clustering algorithm. Pattern Rrecognition 36: 451-461.
  15. Bassili JN, Fletcher JF (1991) Response-time measurement in survey research a method for CATI and a new look at nonattitudes. Public Opinion Quarterly 55: 331-346.
  16. Clinkinbeard SS, Solomon SJ, Rief RM (2021) Why did you become a police officer? Entry-related motives and concerns of women and men in policing. Criminal Justice and Behavior 48: 715-733.
  17. Durkin K, Jeffery L (2000) The salience of the uniform in young children’s perception of police status. Legal and Criminological Psychology 5: 47-55.
  18. Ho T (1999) Assessment of police officer recruiting and testing instruments. Journal of Offender Rehabilitation 29: 1-23.
  19. Kanable R (2001) Strategies for recruiting the nation’s finest. Law Enforcement Technology 28: 64-68.

Τhe Relationship between Smoking and Emotional Intelligence in Patients with Coronary Artery Disease

DOI: 10.31038/PSYJ.2023524

Abstract

Background: Several studies have found an inverse relationship between emotional intelligence and smoking behavior.

Purpose: The purpose of the research is to examine this relationship.

Methods: The questionnaires used in this research were the following: a demographic questionnaire, the Smoking in psychiatric hospitals-a survey of patients’ views, and the TEIQue-SF in order to measure emotional intelligence. The research was conducted on a sample of 152 patients at the Cardiology Clinic of the National University of Athens “Sotiria”.

Results: The results indicated that there was a negative statistically significant relation between emotionality and well-being were inversely related to years of smoking and number of cigarettes per day, but a positive statistically significant relation between emotionality and well-being with the age the sample began to smoke. In addition, a statistically significant positive relationship was found between sociability and number of cigarettes/day.

Conclusions: Overall, therefore, it cannot be argued that higher levels of emotional intelligence are related to more positive smoking behaviors such as frequency and age of smoking initiation. Nevertheless, there are indications that emotional intelligence can be an important factor that can reduce the frequency of smoking and strengthen a positive behavior towards stopping this habit. For this reason, it is proposed to design and implement educational programs that aim to strengthen and utilize emotional intelligence, both at the level of prevention and treatment of smoking. However, further studies in a more representative sample of the population are necessary.

Introduction

Cardiovascular diseases are associated with significant morbidity and mortality and are associated with a significant financial burden on health care systems worldwide [1]. Cardiovascular diseases refer to a set of disorders of the heart and blood vessels and include, among others, coronary artery disease [2]. Due to the negative impact of these diseases on the individual and on society as a whole, the importance of early detection and prevention of risk in the appropriate age and risk groups is highlighted, with the aim of implementing interventions that can reduce the risk of developing these diseases. On the one hand, an inverse relationship has been demonstrated between emotional intelligence and cardiovascular disease [3,4], as well as specific health outcomes related to coronary heart disease [5], such as reduced blood pressure. On the other hand, an inverse relationship has also been indicated between emotional intelligence and smoking, which is an important risk factor for coronary heart disease [6-9].

Emotional intelligence is related to the individual’s ability to accurately perceive, evaluate, manage and express his/her emotions [10,11]. Overall, emotional intelligence is defined as the ability to accurately perceive, understand, evaluate, and express emotions, with this emotional knowledge influencing individuals’ thinking and behavior [12]. Emotional intelligence mainly includes a person’s achievement, adaptability, emotional self-awareness, empathy, mood regulation/self-control, self-evaluation, cognitive ability, conceptual thinking, problem solving, and stress management [13]. Therefore, emotional intelligence is characterized by a series of skills: a) perception, evaluation and expression of emotion, which includes recognition of both one’s own emotions and the emotions of others, as well as the ability to express them; b) understanding and analysis of emotions, which allows one to characterize them and understand the relationships between them, as well as the situation that created them; c) control of emotions, the ability to regulate and control the emotions of both one’s own person and others.

Consequently, the ability to monitor and use information about one’s emotions is important in the context of health behavior, as it can be used to guide thoughts, attitudes, and perceptions [14-16]. It is a psychological mechanism capable of enhancing positive behavioral changes, as it is based on the ability of a person to deal with negative emotions, the ability to appropriately manage peer pressure to engage in a behavior (e.g. smoking), but also the potential to discourage addiction various substances, such as nicotine. Furthermore, components such as self-control and self-awareness have been found to be effective in reducing individuals’ self-destructive behavior [17-19].

In the international literature, a relationship between emotional intelligence and smoking has been found. For example, high levels of emotional intelligence have been found to be a protective factor for smoking [20] and be associated with lower smoking frequency [21]. In addition, emotional intelligence is inversely related to age of smoking initiation. Moreover, it has been found that people with a higher level of emotional intelligence are governed by better perceptions of the negative social consequences of smoking, greater self-confidence to refuse an offer and peer pressure to smoke, and therefore less intention to smoke [22]. Overall, several studies have found an inverse relationship between emotional intelligence and smoking behavior [23,24].

Regarding the impact of demographics, the findings of previous studies lead to ambiguous results. More specifically, it has been found that gender plays a role in the relationship between emotional intelligence and smoking, while age has not been found to have an effect. Apart from demographic data, stress has been found to be an important factor related both to smoking behavior itself [25], and to the relapse of people who have stopped smoking, as it is considered as a coping mechanism for stressful situations. Additionally, it has been found that personality type, paranoid beliefs and anxiety in combination with coping methods, but also emotional intelligence are related to psychopathology in patients with coronary artery disease [26].

Aim and Research Hypotheses

The purpose of the research is to examine the relationship between smoking and emotional intelligence in patients with coronary artery disease. Based on the findings of the international literature stated above, the research hypotheses formulated are the following:

H1: There is an inverse relationship between emotional intelligence and age of smoking initiation.

H2: There is an inverse relationship between emotional intelligence and the number of cigarettes per day.

Material and Method

Sample

Convenience sampling was used as the sampling method. More specifically, the researcher addressed to the Cardiology Clinic of the public hospital ‘Sotiria’ in Athens, Greece. A total of 155 questionnaires were distributed to patients, of which 152 were completed. All questionnaires were valid. The questionnaire was accompanied by a participant information and consent form. Approval permission was received from the Board of Directors of the hospital, under application protocol no. 16773/24-6-21 and a hospital license no. 17810/6-7-21 was also obtained.

Smoking Questionnaire

The Smoking in psychiatric hospitals-a survey of patients’ views questionnaire was used [27]. This questionnaire includes the following sections:

  • Demographic and smoking information: Name, age, gender, place of birth, residence, marital status, number of children, educational level, occupational status, number of cigarettes per day, age of initiation, years of smoking, duration of smoking cessation, family history of psychiatric disorders.
  • Smoking history: Information about individuals’ smoking history and whether there have been periods when they had stopped smoking, reasons that encourage or discourage smoking cessation, as well as existing conditions related to smoking.
  • Smoking and health: The following factors were examined: Age of smoking initiation, reasons for initiation, number of cigarettes per day, type of cigarette, knowledge of the harmful effects of smoking, and comorbidity.

Emotional Intelligence Questionnaire

The TEIQue-SF questionnaire [28] was chosen in order to measure emotional intelligence. It consists of a total of 30 questions grouped into four categories (well-being, self-control, emotionality, sociability), as shown in Table 1. The answers are given on a seven-point Likert scale from 1 (strongly disagree) to 7 (strongly agree). The Cronbach’s a index demonstrated a high level of internal reliability overall for the scale (0.944).

Table 1: Calculation and reliability of TEIQue-SF scales

Subscale

Questions

Reliability

Well-being (5+9+12+20+24+27)/6

0.895

Self-control (4+7+15+19+22+30)/6

0.660

Emotionality (1+2+8+13+16+17+23+28)/8

0.883

Sociability (6+10+11+21+25+26)/6

0.858

Statistical Analysis

Statistical analysis was performed with the Statistical Package for Social Science (SPSS) version 21. Descriptive and inferential statistics (correlations) were used.

Results

Demographic Data

The majority of the participants are men (67.8%), with an average age of approximately 62 years (M=61.9), graduates of higher education (42.1%), married (70.4%), with two children (44.7%), who are currently working (61.8%) (Table 2).

Table 2: Respondents’ demographic data


N (Mean)

% (SD)

Gender Man

103

67.8

Woman

42

27.6

No response

7

4.6

Age

(61.9)

(7.7)

Education Basic education

48

31.6

High school

18

11.8

University degree

64

42.1

Master/PhD

20

13.2

No response

2

1.3

Marital status Single

20

13.2

Married

107

70.4

Divorced

12

7.9

Widow

7

4.6

No response

6

3.9

Number of children 0/No response

24

15.7

1

16

10.5

2

68

44.7

3

39

25.7

4

5

3.3

Occupation Unemployed

3

2.0

Household

9

5.9

Retired

46

30.3

Currently employed

94

61.8

Family history of psychiatric disorders Yes

18

11.8

No

95

62.5

No response

39

25.7

Smoking Habits and Smoking History

Most of the participants, 98.7% (N=150), stated that they have smoked in their lifetime, while 97.4% (N=148) were smoking during the survey period. Moreover, 72.4% (N=110) stated that they have never tried to quit smoking, while of those who answered positively, they stopped smoking for an average of 4.6 years (M=55.4 months). Of those who answered positively that they smoke during this period, the average age of starting smoking was 18 years (M=17.7) and therefore the average number of years of smoking is 43 (M=43), while the average number of cigarettes per day is 20 (M=20.1). Regarding the reasons for starting smoking, social influence (43.4%), curiosity (24.3%), “fashion” (19.7%), as well as stress and personal problems (10. 5%). Finally, the cigarettes that are preferred are filtered (88.2%) versus unfiltered (1.3%) and twisters (7.2%) (Table 3).

Table 3: Smoking habits and smoking history


N

Minimum

Maximum

M

SD

Number of cigarettes per day

152

10

40

20.1

6.2

Age of smoking initiation

152

15

24

17.7

1.5

Years of smoking

151

26

60

43

8.2

Duration of smoking cessation (in months)

17

5

192

55.4

43.9

Opinions/Attitudes about Smoking Cessation

Based on the results, 94.7% of respondents stated that their doctor advised them to stop smoking immediately. Also, 75% believe that smoking harms their health a lot, compared to 21.1% who said that smoking harms their health to a small extent. Moreover, 53.3% of respondents stated that it is very difficult to quit smoking. Regarding the reasons, smoky atmosphere (65.2%), seeing other patients (52%) and staff (52.6%) smoking were mentioned to a very, very large extent. It should be noted that 9.2% stated as additional reasons stress and/or habit. In addition, 62.8% (N=94) of the respondents stated that they would need help to stop smoking and mainly nicotine substitutes – mastics and stickers (47.4%). It is noteworthy that 34.2% (N=52) admitted that they do not want help, but that quitting smoking depends only on their own will.

Hospital Smoking Policy

According to the statistical analysis, 81.6% see staff smoking at work and specifically outside (78.3). 43.4% of respondents believe that staff should not be allowed to smoke at work. It was also mentioned that staff (86.8%) and visitors (87.5%) should not smoke together with patients. Moreover, 50.7% consider that the rules for smoking in the department are very/very high. Furthermore, 99.3% believe that staff should encourage smokers to stop/cut down and 63.8% that it is important for staff members to lead by example.

Moreover, 89.5% know who the reference person is and 85.6% state that the reference person smokes. 73.7% disagree that they would trust a non-smoking referent more than a smoker, while 75.7% disagree that they can work better with a smoking referent than a non-smoker.

Emotional Intelligence

All subscales of emotional intelligence range at above average levels. A higher mean was found in the subscale of sociability (M=4.9, SD=1), then well-being (M=4.9, SD=.8), then emotionality (M=4.7, SD=1) and finally self-control (M=4, SD=.9) (Table 4).

Table 4: Descriptive statistics of emotional intelligence subscales


Minimum

Maximum

M

SD

Well-being

2.8

6.7

4.9

0.8

Self-control

2

6.3

4

0.9

Emotionality

2.5

6.9

4.7

1

Sociability

2.3

7

4.9

1

Smoking and Emotional Intelligence Relation

Using the Spearman coefficient, the existence of a correlation between emotional intelligence and age of onset, number of cigarettes/day and years of smoking was examined (Table 5). At a significance level of α=.01, a statistically significant negative correlation was found between emotionality and the number of cigarettes/day (p<.01) and a statistically significant positive correlation between emotionality and age of smoking initiation (p<.05=1). At a significance level of α=.05, a statistically significant negative correlation was found between well-being and years of smoking (p<.05), as well as a statistically significant positive correlation between well-being and the age at which smoking began (p<.05), but also between sociability and the number of cigarettes/day (p<.05).

Table 5: Correlations between smoking and emotional intelligence (N=150)

Cigarettes/day

Age of onset

Years of smoking

Well-being

-0.14

0.18*

-0.19*

Self-control

-0.25**

0.15

-0.01

Emotionality

-0.33**

0.23**

-0.12

Sociability

0.17*

-0.11

0.02

*Correlation is significant at .05 level (2-tailed)
**Correlation is significant at .01 level (2-tailed)

Discussion

From the statistical analysis it was found that while the doctor has advised almost all patients to stop smoking and that while almost everyone knows that smoking greatly damages their health, the vast majority continue to smoke, as it is too much for them/very difficult to stop this habit. All study participants started smoking during adolescence/early adulthood, which has been reported by other studies. Stress was found to be a factor associated with the smoking habit.

The results regarding the relationship between emotional intelligence and the history and habits of smokers are interesting. More specifically, a statistically significant negative correlation was found between emotionality and number of cigarettes/day, as well as between well-being and years of smoking. Therefore, dimensions of emotional intelligence are inversely related to years of smoking and number of cigarettes per day, which is consistent with what has been reported by other scholars [29]. However, a positive correlation was also found between emotionality and age of smoking initiation, between well-being and age of smoking initiation, and between sociability and number of cigarettes/day. Therefore, dimensions of emotional intelligence are associated with a positive relationship with age of smoking initiation and number of cigarettes per day, which is contrary to what has been found in previous research. Also, self-control, emotionality and sociability were not found to be correlated to a statistically significant degree with years of smoking, while no correlation was found to a statistically significant degree between self-control-age of smoking initiation and sociability-age of smoking initiation.

Overall, therefore, it cannot be argued that higher levels of emotional intelligence are related to more positive smoking behaviors such as frequency and age of initiation, as has been supported by various studies in the past [30,31]. Possibly these results can be interpreted considering the moderate level of emotional intelligence found in the participants of the present research. The characteristics of the specific patient sample (e.g., older age and therefore more years of smoking) may be another reason why the findings of this study partially contradict the findings of earlier studies, considering that smoking it is also a habit that is difficult to break, especially after several years of smoking.

Conclusions and Suggestions

Even though the findings of this research are not entirely consistent with the findings of previous studies regarding the inverse relationship between emotional intelligence and smoking, there are indications that this relationship is partially valid. This means that emotional intelligence can be an important factor that can reduce the frequency of smoking and strengthen a positive behavior towards stopping this habit.

Consequently, emotional intelligence training can effectively facilitate individuals’ adequate adaptation to health conditions [32], while individuals with higher levels of emotional intelligence can better benefit from prevention programs. In a previous study, an educational intervention based on emotional intelligence was used to reduce smoking, the results of which showed that it was effective in smoking cessation [33,34]. Overall, it has been reported by various scholars that educational programs based on emotional intelligence can be beneficial for reducing smoking dependence and overall adopting behaviors that reduce smoking intention. In addition, stress management training and training aimed at enhancing emotional intelligence have been suggested to lead to a reduction in psychopathology in patients with coronary artery disease. Therefore, it is proposed to design and implement educational programs that aim to strengthen and exploit emotional intelligence, both at the level of prevention and treatment of smoking.

However, further research is needed in the Greek population, especially considering that the sample of this paper consists mostly of old-aged men. The composition of the sample and its origin from a specific department of a specific nursing unit limit its representativeness and therefore the generalizability of the results does not exist and therefore, a more representative sample of the population is necessary.

Conflicts of Interest

The authors declare no conflicts of interest regarding the publication of this paper.

References

  1. Gautam N, Saluja P, Malkawi A, Rabbat MG, Zhang Y, Lee BC, Al’Aref SJ (2002) Current and Future Applications of Artificial Intelligence in Coronary Artery Disease. Healthcare 10. [crossref]
  2. Appleton AA, Kubzansky LD (2014) Emotion regulation and cardiovascular disease risk. In: J. J. Gross (Ed.), Handbook of Emotion Regulation. The Guilford Press.
  3. Vlachakis D, Vlachakis C (2014) Understanding of emotions and cardiovascular related diseases. PeerJ PrePrints.
  4. Vlachaki C, Maridaki Kassotaki K (2013) Coronary Heart Disease and Emotional Intelligence. Global Journal of Health Science 5: 6: 156: 165.
  5. Kravvariti E, Maridaki-Kassotaki K (2010) Emotional Intelligence and Coronary Heart Disease: How Close Is the Link? Global Journal of Health Science 2: 1, 127: 137. [crossref]
  6. Banks E, Joshy G, Korda RJ, Stavreski B, Soga K, Egger S, et al. (2019) Tobacco smoking and risk of 36 cardiovascular disease subtypes: fatal and non-fatal outcomes in a large prospective Australian study. BMC medicine 17: 1. [crossref]
  7. Salehi N, Janjani P, Tadbiri H, Rozbahani M, Jalilian M (2021) Effect of cigarette smoking on coronary arteries and pattern and severity of coronary artery disease: a review. The Journal of International Medical Research 49: 12,
  8. Stallones, RA (2015) The association between tobacco smoking and coronary heart disease. International Journal of Epidemiology 44: 3, 735:743
  9. Yadegar Tirandaz S, Sahebihagh MH, Namdar Areshtanab H, Jafarizadeh H, Asghari Jafarabadi M (2020) Nicotine Dependency and Its Relationship With Emotional Intelligence Among Male Smoker Employees. Journal of Research & Health 10: 3, 159: 166.
  10. Salovey P, Mayer J (1990) Emotional intelligence. Imagination, Cognition and Personality 9: 3, 185-211.
  11. Trinidad DR, Johnson CA (2002) The association between emotional intelligence and early adolescent tobacco and alcohol use. Personality and Individual Differences 32: 1: 95:
  12. Mayer JD, Salovey P (1997) What is emotional intelligence? In: P Salovey D Sluyter (Eds.), Emotional development and emotional intelligence: implications for educators. New York: Basic Books.
  13. Bar-On R (2001) Emotional intelligence and self-actualization. In: Ciarrochi JP, Forgas Mayer (Eds.), Emotional intelligence in everyday life: A scientific inquiry. New York: Psychology Press.
  14. Bhochhibhoya A, Branscum P (2015) Emotional intelligence: a place in public health promotion and education. Paediatric 3: 2.
  15. González-Yubero S, Lázaro-Visa S, Palomera Martín R (2020) The Protective Association of Trait and Ability Emotional Intelligence with Adolescent Tobacco Use. International Journal of Environmental Research and Public Health 17. [crossref]
  16. Schutte NS, MalouffJ M, Thorsteinsson EB, Bhullar N, Rooke SE (2007) A meta-analytic investigation of the relationship between emotional intelligence and health. Personality and Individual Differences 42, 921: 933.
  17. Li GS F, Lu FJ, Wang H (2009) Exploring the relationships of physical activity, emotional intelligence and health in Taiwan college students. Journal of Exercise Science & Fitness 7: 1, 55: 63.
  18. Hill EM, Maggi S (2011) Emotional intelligence and smoking: Protective and risk factors among Canadian young adults. 2011. Personality and Individual Differences 51: 1, 45: 50.
  19. Louie AK, Coverdale J, Roberts LW (2006) Emotional Intelligence and Psychiatric Training. Academic Psychiatry 30: 1: 3. [crossref]
  20. Limonero JT, Tomás-Sábado J, Fernández-Castro J (2006) Perceived emotional intelligence and its relation to tobacco and cannabis use among university students. Psicothema 18, 95: 100. [crossref]
  21. Trinidad DR, Unger JB, Chou CP, Johnson CA (2004) The protective association of emotional intelligence with psychosocial smoking risk factors for adolescents. Personality and Individual Differences 36: 4: 945: 954.
  22. Perea-Baena, JM, Fernández-Berrocal P, Oña-Compan S (2011) Depressive mood and tobacco use: moderating effects of gender and emotional attention. Drug and Alcohol Dependence 119: 3.
  23. del Mar Molero Jurado M, del Carmen Pérez-Fuentes M, Barragán Martín AB, del Pino Salvador RM, Gázquez Linares JJ (2019) Analysis of the Relationship between Emotional Intelligence, Resilience, and Family Functioning in Adolescents’ Sustainable Use of Alcohol and Tobacco. Sustainability, vol 11.
  24. Tsaousis I, Nikolaou I (2005) Exploring the relationship of emotional intelligence with physical and psychological health functioning. Stress & Health 2: 2 77: 86.
  25. Megías-Robles A, Perea-Baena JM, Fernández-Berrocal P (2020) The protective role of emotional intelligence in smoking relapse during a 12-month follow-up smoking cessation intervention. PLoS One 15: 6.
  26. Shal, RS, Sharbaf HA (2013) Survey the prevalence of psychopathology in Coronary heart disease patients: A casual model based on analysis of the role of psychological factors. Jundishapur Journal of Chronic Disease Care 2: 4 56: 71.
  27. Kourakos M, Kalokairinou A, Zyga S, Koukia E (2016) Views and Attitudes of Patients in Mental Facilities Regarding Smoking. Global Journal Health of Sciences 8: 8. [crossref]
  28. Petrides KV (2009) Psychometric properties of the Trait Emotional Intelligence Questionnaire. In: CStough DH. Saklofske Parker (Eds.), Advances in the assessment of emotional intelligence. New York
  29. Kun B, Demetrovics Z (2010) Emotional intelligence and addictions: a systematic review. Substance Use & Misuse 45: 7-8, 1131-1160. [crossref]
  30. Champeris Tsaniras S, Megalooikonomou V, Vlachakis D (2018) Human Emotions on the Onset of Cardiovascular and Small Vessel Related Diseases. In vivo (Athens, Greece) 32: 4, 859-870. [crossref]
  31. Sharma D, Gulati R, Misra I (2017) Emotional Intelligence: Influencing Smoking Behavior in Young Adults. Jindal Journal of Business Research 6: 1, 14: 24.
  32. Karimzadeh M, Goodarzi A, S (2012) The effect of social emotional skills training to enhance general health & Emotional Intelligence in the primary teachers. Procedia-Social and Behavioral Sciences 46: 57: 64.
  33. Lawrence KC, Egbule EO (2021) Can emotional intelligence training cause a cease in tobacco smoking among school-going adolescents? International Journal of Adolescence and Youth 26: 1, 356-366.
  34. Goleman E (2002) Emotional intelligence, social intelligence, ecological intelligence. New York: Bantam books.

Multiple Double-State Degrees of Degeneracy Spectrum of Gold Clusters, Au56, 57 (C1)

DOI: 10.31038/NAMS.2023613

Abstract

In this article, an interesting phenomenon has described the geometries and vibrational frequency of the stable AuN clusters with N=56 and 57. We have found all 2 clusters are having the very same C1 point symmetry group. For the re-optimization process, the finite-differentiation method has been implemented within the density-functional tight-binding (DFTB) approach. The effects of the range of interatomic forces were calculated and the desired set of system eigenfrequencies (3N-6) are obtained by diagonalization of the symmetric positive semidefinite Hessian matrix. More than anything else, we have observed the vibrational spectra, which occur between 1.57 cm−1 and 336.04 cm−1 at ∆E=0. Most significantly, all the clusters had come across the double and the triple-state degeneracies, which are due to the stretching and the bending mode of the vibrations through the atoms. Nevertheless, the vibrational spectrum is strongly dependent upon size, shape, and structure.

Keywords

Gold atomic clusters, Density-functional tight-binding (DFTB) approach, Finite-difference Method, Force constants (FCs) and vibrational spectrum

Introduction

Gold nanoclusters are promising optically functional materials because of their attractive optical properties, such as luminescence, two-photon absorption, photothermal conversion, and photodynamics. Regulating the optical functions of gold nanoclusters and improving their performance have attracted wide interest in biological applications. Noble metal like rhodium (Rh), palladium (Pd), silver (Ag), platinum (Pt), and gold (Au) is one kind of modish and desired material, according to their inherent resistance to oxidation and corrosion even in the moist environment. Its physical and chemical properties appear to be entirely change as the size of metal continuously decreases into nanoscale because of the quantum size effect, surface effect, small size effect, and macroscopic quantum tunnelling (MQT) effect [1-5]. Nanoclusters have potential uses in chemical reactors, telecommunications, microelectronics, optical data storage, catalysts magnetic storage, spintronic devices, electroluminescent displays, sensors, biological markers, switches, nano-electronics, nano-optics, transducers and many other fields. In general, Noble-metal (Cu, Ag, and Au) clusters have attracted much attention in scientific and technological fields because of their thermodynamic, electronic, optical and catalytic properties in nano-materials. Especially, gold is a soft metal and is usually alloyed to give it more strength as well as a good conductor of heat and electricity, and is unaffected by air and most reagents, those are the main reasons to choose among the other metal clusters [6-10].

In this study, mainly we focus on the vibrational properties of gold atomic clusters with sizes Au51-54 atoms, because, the vibrational properties play a major role in structural stability [11-18]. For further assistance for the readers, specifically for the general information about global minima gold structures which have been calculated by the work of Dong and Springborg [19,20] can be found in those articles. In very short, the structures were found through a so-called genetic algorithm (GA) in combination with Density Functional Tight-Binding (DFTB) energy calculations and the steepest descent algorithm permitting a local total energy minimization. Nevertheless, in our case, we use the numerical finite-difference method [21] along with the density-functional tight-binding (DFTB) approach and finally extract the vibrational spectrum from the optimized structures. Overall, for a better understanding and to visualize, the detailed information is discussed in the results and discussion section.

Theoretical and Computational Procedure

At first step, the DFTB [22-24] is based on the density functional theory of Hohenberg and Kohn in the formulation of Kohn and Sham. In addition, the Kohn-Sham orbitals ψi(r) of the system of interest are expanded in terms of atom-centered basis functions {φm(r)},

for 1

While so far the variational parameters have been the real-space grid representations of the pseudo wave functions, it will now be the set of coefficients cim. Index m describes the atom, where Φm is centered and it is angular as well as radially dependent. The Φm is determined by self-consistent DFT calculations on isolated atoms using large Slater-type basis sets.

In calculating the orbital energies, we need the Hamilton matrix elements and the overlap matrix elements. The above formula gives the secular equations

for 2

Here, cim’s are expansion coefficients, i is for the single-particle energies (or where i are the Kohn-Sham eigenvalues of the neutral), and the matrix elements of Hamiltonian Hmn and the overlap matrix elements Smn are defined as

for 3

They depend on the atomic positions and on a well-guessed density ρ(r). By solving the Kohn-Sham equations in an effective one particle potential, the Hamiltonian h is defined as

for 4

To calculate the Hamiltonian matrix, the effective potential Veff has to be approximated. Here, t being the kinetic-energy operator sigma  and Veff(r) being the effective Kohn-Sham potential, which is approximated as a simple superposition of the potentials of the neutral atoms,



for 5

Vj 0 is the Kohn-Sham potential of a neutral atom, rj=rRj is an atomic position, and Rj being the coordinates of the j -th atom.

Finally, the short-range interactions can be approximated by simple pair potentials, and the total energy of the compound of interest relative to that of the isolated atoms is then written as:

for 6

Here, the majority of the binding energy (i) is contained in the difference between the single-particle energies i of the system of interest and the single-particle energies jmj  of the isolated atoms (atom index j, orbital index mj), Ujj,(|RjRj,|) is determined as the difference between B and BSCF for diatomic molecules (with ESCF being the total energy from parameter-free density-functional calculations). In the present study, only the 5d and 6s electrons of the gold atoms are explicitly included, whereas the rest are treated within a frozen-core approximation [25].

Structural Re-optimization Process

In our case, we have calculated the numerical first-order derivatives of the forces (Fiα, Fjβ) instead of the numerical-second-order derivatives of the total energy (Etot). In principle, there is no difference, but numerically the approach of using the forces is more accurate.

for 7

Here, F is a restoring forces which is acting upon the atoms, ds is a differentiation step-size and M represents the atomic mass, for homonuclear case. The complete list of these force constants (FCs) is called the Hessian H, which is a (3N x 3N) matrix. Here, i is the component of (x, y or z) of the force on the j’th atom, so we get 3N [26].

Results and Discussion

The Optimized Structure of the Clusters Au56, 57

We present the vibrational spectrum analysis of the re-optimized Au56, 57 clusters, interestingly, all of them are having the very same point group symmetry C1 at ground state, ∆E=0. Initially, the structures were found through a so-called genetic algorithm (GA) in combination with Density Functional Tight-Binding (DFTB) energy calculations and the steepest descent algorithm permitting a local total energy minimization. To sum up, we have accurately predicted the vibrational frequency of the clusters, and they are very strongly dependent on the size, structure, and shape of the clusters, mainly influenced by the stretching and the bending mode vibrations of the atoms that are due to changes on the bond length fluctuations for a small step-size ds=± 0.01 a.u. on the equilibrium coordinates [27]. By the way, for the perspective view of the structures, we have plotted with two different styles (Space-filling, Polyhedral).

The Vibrational Frequency (ωi) Range of the Cluster Au56 at ∆E=0

Table 1 shows the low (at the least) and the high (at the most) frequency range of the cluster Au56, which occurs between 1.57 and 318.01 cm−1, and the lowest energy geometrical structural view can be seen in Figure 1.

Table 1: The Normal modes (NVM) and the vibrational frequencies (ωi) of Au56 at ∆E=0

NVM (3N-6)

ωi [cm1]

NVM (3N-6)

ωi [cm1]

NVM (3N-6)

ωi [cm1]

1

1.57

56

46.69

111

133.77

2

4.07

57

47.07

112

139.43

3

5.11

58

48.15

113

141.09

4

5.59

59

48.56

114

141.77

5

6.40

60

50.84

115

146.29

6

6.66

61

51.19

116

148.06

7

7.55

62

52.05

117

150.08

8

8.25

63

53.05

118

151.61

9

8.51

64

53.38

119

154.61

10

8.84

65

54.43

120

155.68

11

9.26

66

56.90

121

161.95

12

10.46

67

58.54

122

163.12

13

10.94

68

59.15

123

165.09

14

11.18

69

60.35

124

167.01

15

12.19

70

61.98

125

169.96

16

13.45

71

63.18

126

172.26

17

13.88

72

64.48

127

173.82

18

14.04

73

65.20

128

175.76

19

14.99

74

67.41

129

180.95

20

15.77

75

68.83

130

182.55

21

16.57

76

68.99

131

184.90

22

16.80

77

70.81

132

187.54

23

18.40

78

71.84

133

188.53

24

18.70

79

74.30

134

189.55

25

18.91

80

76.21

135

195.11

26

19.91

81

77.43

136

196.68

27

20.26

82

78.78

137

198.57

28

20.66

83

79.98

138

201.34

29

21.48

84

81.12

139

205.43

30

22.50

85

84.32

140

207.38

31

23.34

86

84.85

141

207.68

32

23.60

87

87.95

142

213.72

33

24.26

88

90.62

143

216.71

34

25.21

89

90.98

144

222.20

35

26.32

90

91.79

145

223.46

36

26.70

91

94.03

146

228.91

37

27.81

92

97.06

147

229.69

38

28.95

93

98.99

148

234.72

39

29.84

94

100.76

149

237.25

40

31.43

95

102.18

150

239.80

41

31.86

96

103.86

151

243.65

42

32.25

97

106.26

152

249.53

43

33.62

98

108.60

153

250.14

44

35.04

99

110.05

154

251.74

45

36.19

100

110.69

155

253.00

46

36.87

101

113.66

156

254.43

47

37.58

102

114.75

157

260.70

48

37.88

103

116.95

158

263.48

49

38.45

104

121.10

159

274.92

50

39.88

105

121.61

160

275.45

51

41.81

106

123.40

161

304.84

52

42.37

107

126.49

162

318.01

53

43.04

108

127.67

163

54

44.44

109

131.87

164

55

45.72

110

132.70

165

fig 1

Figure 1: Au56 (C1); Style (Space-filling [left], Polyhedral [right]): The lowest energy geometrical structure of the Au56 cluster. Standard orientation of crystal shape at ∆E = 0.

Firstly, the cluster has some low frequencies (ωmin) in between 1.57-9.26 cm−1, which is only for the very first 11 NVM that comes even below the scale of Far Infrared FIR, IR-C 200-10 cm−1. Secondly, for the 12-137 NVM, the frequency ranges occurred between 10.46-198.57 cm1, which comes within the range of Far Infrared FIR, IR-C 200- 10 cm1. Thirdly, the rest of the 138-162 NVM, is having the maximum high frequencies, which are ((ωi) – 201.34-318.01 cm1) falling within the range of Mid Infrared MIR, IR-C 3330-200 cm1.

The Double and the Triple State Degeneracyi)

[{5.11, 5.59} {6.40, 6.66} {8.25, 8.51, 8.84} {10.46, 10.94} {13.45, 13.88} {14.04, 14.99} {16.57, 16.80} {18.40, 18.70, 18.91} {20.26, 20.66} {23.34, 23.60} {26.32, 26.70} {31.43, 31.86} {36.19, 36.87} {37.58, 37.88} {48.15, 48.56} {53.05, 53.38} {68.83, 68.99} {84.32, 84.85} {90.62, 90.98} {110.05, 110.69} {121.10, 121.61} {141.09, 141.77} and {207.38, 207.68}] in cm1.

The Vibrational Frequency (ωi) Range of the Cluster Au57 at ∆E=0

Table 2 shows the low (at the least) and the high (at the most) frequency range of the cluster Au57, which occurs between 2.59 and 336.04 cm−1, and the lowest energy geometrical structural view can be seen in Figure 2.

Table 2: The Normal modes (NVM) and the vibrational frequencies (ωi) of Au57 at ∆E=0

NVM (3N-6)

ωi [cm1]

NVM (3N-6)

ωi [cm1]

NVM (3N-6)

ωi [cm1]

1

2.59

56

50.09

111

131.98

2

3.90

57

50.76

112

134.76

3

5.69

58

51.17

113

137.88

4

6.03

59

51.99

114

141.31

5

6.51

60

53.73

115

142.46

6

7.44

61

54.53

116

143.49

7

7.91

62

55.92

117

144.62

8

9.58

63

57.10

118

148.21

9

10.10

64

57.55

119

152.57

10

10.83

65

58.41

120

154.79

11

11.59

66

58.58

121

156.54

12

12.22

67

59.94

122

158.23

13

12.51

68

61.18

123

160.74

14

13.12

69

62.43

124

163.87

15

13.45

70

63.48

125

165.20

16

14.47

71

63.78

126

168.35

17

14.72

72

65.35

127

171.29

18

15.66

73

67.23

128

173.69

19

17.24

74

68.31

129

175.53

20

17.47

75

69.97

130

178.67

21

18.23

76

71.74

131

181.40

22

20.28

77

73.09

132

181.74

23

21.02

78

73.48

133

185.41

24

21.75

79

73.54

134

186.96

25

22.61

80

74.43

135

189.75

26

23.11

81

77.77

136

193.58

27

24.08

82

79.01

137

198.70

28

24.89

83

80.06

138

199.87

29

25.40

84

80.64

139

201.61

30

25.97

85

81.86

140

203.43

31

26.66

86

83.96

141

204.74

32

27.64

87

85.31

142

209.70

33

28.48

88

88.12

143

212.31

34

29.36

89

90.19

144

215.27

35

30.02

90

93.79

145

218.89

36

30.67

91

93.99

146

219.13

37

32.91

92

96.01

147

227.32

38

33.34

93

98.95

148

229.48

39

33.86

94

99.17

149

237.44

40

35.36

95

101.53

150

239.56

41

35.73

96

103.34

151

243.69

42

36.41

97

103.88

152

246.65

43

37.67

98

107.90

153

249.68

44

38.15

99

109.27

154

251.20

45

39.10

100

110.30

155

257.30

46

40.65

101

111.69

156

261.52

47

41.97

102

115.40

157

263.64

48

42.76

103

116.45

158

266.55

49

43.24

104

117.87

159

269.54

50

43.63

105

120.11

160

273.32

51

44.45

106

121.17

161

274.25

52

45.15

107

122.44

162

282.04

53

45.62

108

126.24

163

287.47

54

47.84

109

129.91

164

288.58

55

49.21

110

131.47

165

336.04

fig 2

Figure 2: Au57 (C1); Style (Space-filling [left], Polyhedral [right]): The lowest energy geometrical structure of the Au57 cluster. Standard orientation of crystal shape at ∆E = 0.

Firstly, the cluster has some low frequencies (ωmin) in between 2.59-9.58 cm−1, which is only for the very first 8 NVM that comes even below the scale of Far Infrared FIR, IR-C 200-10 cm−1. Secondly, for the 9-138 NVM, the frequency ranges occurred between 10.10-199.87 cm1, which comes within the range of Far Infrared FIR, IR-C 200- 10 cm1. Thirdly, the rest of the 139-165 NVM, is having the maximum high frequencies, which are ((ωi) – 201.61 – 336.04 cm−1) falling within the range of Mid Infrared MIR, IR-C 3330-200 cm−1.

The Double and the Triple State Degeneracy (ωi)

[{6.03 6.51} {7.44 7.91} {10.10 10.83} {12.22 12.51} {13.12 13.45} {14.47 14.72} {17.24 17.47} {21.02 21.75} {24.08 24.89} {25.40 25.97} {30.02 30.67} {33.34 33.86} {35.36 35.73} {43.24 43.63} {45.15 45.62} {50.09 50.76} {51.17 51.99} {57.10 57.55} {58.41 58.58} {63.48 63.78} {73.09 73.48 73.54} {80.06 80.64} {93.79 93.99} {103.34 103.88} {131.47 131.98} and {181.40 181.74}] in cm−1.

It has occurred within the range of Far Infrared FIR, IR-C 200-10 cm1. Certainly, such kind of spectrum could be highly possible to observe in the experimental calculations, upon availability in the near future. In addition to that due to the degree of degeneracy [which is being composed by] that gives a deep interpretation about the elliptical motion () but could be multiple single motions.

Size and the Shape Effects

In Table 3, the third column shows the spectral ranges that have been influenced with respect to the size of the clusters, the shape of the structures, and the arrangement of the atoms (inner core, and the overall outer surface of the edges), as well as the short and the long-range interactions due to the inter-nuclear attraction and the repulsive energies.

Table 3: The double and the triple state degeneracy of the clusters, Au56, 57 at ∆E=0

Gold Nanoclusters (AuNCs)

Point Groups s(PG) Symmetry

Spectral Range (Min-to-Max) ωi [cm-1]

Double (D) & Triple (T) State Degeneracy [DT]{pairs}

Total Number of Pairs

Total Random Number (RN)  of Different States of Equal Energy RN=(D*pairs+T*pairs)

Predicted Spectral Range Only for D, T-Degeneracies. A: Far Infrared FIR, IR – C 20010 cm-1

B: Mid Infrared MIR, IR – C 3330 – 200 cm1

X: Lesser than both, A and B

Au56

C1

1.57-318.01

D21 T2

23

48

A, B, X

Au57

C1

2.59-336.04

D25 T1

26

53

A, X

Once again, we are first to present, the vibrational frequencies of bigger-sized clusters (Au56, 57) and the shell-like structure (of course, they are part of the family of so-called full-shell clusters) at ∆E=0 by using the numerical finite-differentiation method with the DFTB approach. We have observed the vibrational spectrum, the minimum starting, and the maximal end ranges that vary between 1.57 cm−1 and 336.04 cm−1 at ∆E=0. Moreover, amazingly the occupancy of the multiple double and the triple state degeneracy is revealed on the gold atomic clusters, Au56, 57 (refer to Table 3). Interestingly, more number of the double-state degeneracy may depend on the nearest neighboring atoms, and their interactions, as well as the zig-zag circumstances of the outermost surface surrounded by them. We are able to see, a maximum, of 26 total double pairs have occurred on the Au57 cluster.

Conclusions

We have observed the vibrational properties of the gold clusters in order to explore the stability and the structures. We have designed a mini formula for the occupancy of the double and the triple state degeneracy. Above all, we have pinpointed the correct location of the spectrum, through Far Infrared FIR, IR-C 200-10 cm-1, and Mid Infrared MIR, IR-C 3330-200 cm-1. In addition to that, our prediction will help the researchers to develop a range of potential applications such as catalysis, biomedicine, imaging, optics, and energy conversion.

Acknowledgements for Funding

Initially, the main part of this work was supported by the German Research Council (DFG) through project Sp 439/23-1. We gratefully acknowledge their very generous support.

References

  1. Griffith WP (1967) The Chemistry of the Rarer Platinum Metals (Os, Ru, Ir, and Rh) Interscience Publishers.
  2. Hartley FR (1973) The Chemistry of Platinum and Palladium: With Particular Reference to Complexes of the Elements. Applied Science Publishers Ltd.
  3. Huang X (2016) Polymer Ligand Stabilized Fluorescent Platinum Nanoclusters: Synthesis, Characterization, and Their Applications.
  4. Siegel RW (1994) Nanostructured materials -mind over matter. Nanostructured Materials 4: 121-138.
  5. Huang X, Li Z, Yu Z, Deng X, Xin Y (2019) Recent Advances in the Synthesis, Properties, and Biological Applications of Platinum Nanoclusters. Journal of Nanomaterials.
  6. Liangliang W, Weihai F, Xuebo C. (2016) The photoluminescence mechanism of ultra-small gold clusters. Chem. Chem. Phys. 18: 17320-17325.
  7. Andres RP, Bein T, Dorogi M, Feng S, Henderson JI, et al. (1996) Coulomb Staircase at Room Temperature in a Self-Assembled Molecular Nanostructure. Science 272: 1323-1325. [crossref]
  8. Young CC, Han ML, Woo YK, Kwon SK, Tashi N, et al. (2007) How Can We Make Stable Linear Monoatomic Chains? Gold-Cesium Binary Subnanowires as an Example of a Charge-Transfer-Driven Approach to Alloying, Rev.Lett. [crossref]
  9. Li J, Liu Y, Zhang J, Liang X, Duan H (2016) Density functional theory study of the adsorption of hydrogen atoms on Cu2X (X=3d) clusters. Chem Phys Lett 651: 137-143.
  10. Chuanchuan Z, Haiming D, Xin Lv, Biaobing C, Ablat A, et al. (2019) Static and dynamical isomerization of Cu38 cluster. Scientific Reports 9: 7564. [crossref]
  11. Ignacio L, Garzon, Alvaro Posada-Amarillas (1996) Structural and vibrational analysis of amorphous Au55 clusters. Phys Rev B 54: 11796.
  12. Bravo-Perez G, Garzon IL, Novaro O (1999) Ab initio study of small gold clusters. THEOCHEM 493: 225-231.
  13. Bravo-Perez G, Garzon IL, Novaro O (1999) Non-additive effects in small gold clusters. Chem Phys Lett 313: 655-664.
  14. Sauceda HE, Mongin D, Maioli P, Crut A, Vallee F, et al. (2012) Vibrational properties of metal nanoparticles: Atomistic simulation and comparison with time-resolved investigation. J Phys Chem C 116: 25147-25156.
  15. Sauceda HE, Pelayo JJ, Salazar F, Perez LA, Garzon IL (2013) Vibrational spectrum, caloric curve, low-temperature heat capacity, and Debye temperature of sodium clusters: The Na139+case. J Phys Chem C 117: 11393-11398.
  16. Sauceda HE, Salazar F, Perez LA, Garzon IL (2013) Size and shape dependence of the vibrational spectrum and low-temperature specific heat of Au nanoparticles. J Phys Chem C 117: 25160-25168.
  17. Sauceda HE, Garzon IL (2015) Structural determination of metal nanoparticles from their vibrational (phonon) density of states. J Phys Chem C 119: 10876.
  18. Dugan N, Erkoc S (2008) Phys Stat Sol B 245, 695.
  19. Dong Y, Springborg M (2007) Global structure optimization study on Au2-20. Eur Phys J D 43: 15-18.
  20. Warnke I (2007) Heat Capacities of Metal Clusters. Diploma Thesis (Research Assistant and Diploma Research), Saarland University.
  21. Dvornikov M (2004) Formulae of numerical differentiation.
  22. Porezag D, Frauenheim Th, Kohler Th, Seifert G, Kaschner R (1995) Construction of tight-binding-like potentials on the basis of density-functional theory: Application to carbon. Phys Rev B 51: 12947. [crossref]
  23. Seifert G, Schmidt R (1992) Molecular dynamics and trajectory calculations: The application of an LCAO-LDA scheme for simulations of cluster-cluster collisions. New J Chem 16: 1145.
  24. Seifert G, Porezag D, Th. Frauenheim (1996) Calculations of molecules, clusters, and solids with a simplified LCAO-DFT-LDA scheme. Int J Quantum Chem 58: 185-189.
  25. Seifert G (2007) Tight-Binding Density Functional Theory: An Approximate Kohn-Sham DFT Scheme. J Phys Chem A 111: 5609-5613.
  26. Press WH, Teukolsky SA, Vetterling WT, Flannery BP (2007) Numerical Recipes in Fortran. Cambridge University Press.
  27. Vishwanathan K (2018) Bonding Forces and Energies on the Potential Energy Surface (PES) of the Optimized Gold Atomic Clusters by a Differentiation Step-Size (ds=±0.01 a.u.) via DFTB Method. Nanosci Technol 5: 1-4.

COVID-19 Vaccine Hesitancy among Syrian Refugees

DOI: 10.31038/JCRM.2023611

Abstract

Background: The COVID-19 pandemic has disproportionately affected refugee populations, with refugees suffering higher rates of exposure and infection and a higher risk of severe disease and death due to socioeconomic disparities, reduced access to healthcare, and underlying medical conditions. Widespread vaccination is critical to reduce the individual morbidity and mortality as well as the public health burden of COVID-19. However, the uptake of COVID-19 vaccination among refugee populations is unknown.

Methods: We used validated surveys to quantitatively assess COVID-19-related fear and vaccine hesitancy in a population of Syrian refugees living in Turkey.

Results: COVID-19 vaccine hesitancy is critically high among Syrian refugees, with 85% of participants refusing vaccination. However, COVID-19 fear is also high, with over 90% of participants expressing fear of contracting or dying from COVID-19. Misinformation and false beliefs regarding vaccine efficacy and side effects contribute to the discrepancy between high fear of an infectious disease and low rates of acceptance of a life-saving preventive measure.

Conclusion: COVID-19 vaccine hesitancy is alarmingly high in Syrian refugee populations. Targeted interventions to improve vaccine acceptance in refugee populations are urgently needed.

Keywords

COVID-19, Vaccine hesitancy, Refugees, Syria, Turkey

Background

The COVID-19 pandemic has caused over 650 million recorded cases and over six million deaths worldwide as of December 2022 per World Health Organization statistics. Refugees and asylum-seekers have been disproportionately affected by all aspects of the pandemic. Refugees are at higher risk of initial exposure to SARS-CoV-2, are more likely to be hospitalized with COVID-19, and have a higher mortality rate compared to non-refugee populations [1]. A multitude of factors contribute to increased risk of in this population. Refugees are more likely to reside in crowded living conditions, to work low-wage public-facing jobs, to have less access to public health messaging in their native language, and to have lower health literacy compared to non-refugee individuals [2-8]. Once infected, refugees have a higher risk of severe COVID-19 symptoms, of requiring hospitalization due to COVID-19, and of death due to COVID-19. This is likely due to a higher incidence of chronic comorbidities, delays in seeking medical attention, and exclusion from the healthcare system, among other causes. Special attention to the effect of the COVID-19 pandemic on refugees is urgently needed.

Turkey harbors the world’s largest population of refugees and the world’s largest Syrian refugee population, with 3.65 million Syrian refugees and an additional 330,000 refugees from other countries [9]. Turkey has been profoundly affected by the COVID-19 pandemic, with over 12 million infections, nearly 92,000 deaths, massive inflation, and an unemployment rate of up to 40% [10]. Even prior to the pandemic, the refugee population in Turkey placed humanitarian and economic strain on the country. In 2020, the United Nations High Commissioner for Refugees (UNHCR)’s budget for refugees and asylum-seekers in Turkey was 365 million US dollars (USD); however, the sum of all available funds was only 131 million USD, a gap of 234 million USD [11].

Vaccination, combined with non-pharmaceutical methods such as social distancing and use of masks, offers the world’s best chance at curtailing the COVID-19 pandemic. Multiple effective and safe vaccinations to prevent COVID-19 have been developed and widely implemented with infection reduction rates of over 90% and excellent safety profiles. Unfortunately, vaccine hesitancy, defined by the World Health Organization (WHO) as “the reluctance or refusal to vaccinate despite the availability of vaccines,” is common in many populations. Given that refugees are at increased risk of COVID-19 exposure, infection, severe disease, and death, vaccination of this population is critically important, and vaccine hesitancy in this group is life-threatening. However, refugee and migrant populations have dismally low vaccination rates compared to non-refugee populations. Prior to the COVID-19 pandemic, vaccination rates for other preventable infectious diseases, such as measles-mumps-rubella (MMR), polio, and diphtheria-pertussis-tetanus (DPT), had been persistently low for decades in refugee populations compared to non-refugee populations [12]. With regard to the COVID-19 vaccine, as of June 2021, 85% of COVID-19 vaccine doses administered had been given in high- and middle-income countries, but 85% of refugees reside in developing countries [13]. Even within vaccine administration programs in developing countries, refugees are neglected: for example, in Lebanon in April 2021, refugees and migrants comprised 30% of the country’s population, but only 2.9% of vaccinated individuals [14].

Low COVID-19 vaccination rates among refugees are multifactorial. Some contributors are systemic, including lack of healthcare coverage or access to care for refugees, lack of vaccine information in refugees’ language, lack of transportation or financial means to obtain vaccination, and perceived fear of detention when presenting for medical care [15]. However, COVID-19 vaccine hesitancy is prevalent in refugee populations as identified by qualitative interviews [16]. These investigations identified misinformation and false beliefs as major drivers of vaccine hesitancy: for example, that COVID-19 is a hoax, that COVID-19 is a “Western disease,” that the government cannot be trusted, and that the COVID-19 vaccine contains microchips [17]. Facebook, TikTok, Whatsapp, and YouTube were cited as primary sources of COVID-19-related information [17].

Objectives

A rigorous understanding of the motivations, attitudes, and fears regarding vaccination is critically needed in order to decrease vaccine hesitancy and improve vaccination rates in refugee populations. In this study, we present the first quantitative investigation of refugee COVID-19 vaccine hesitancy using a validated questionnaire.

Methods

A cross-sectional survey was conducted in January 2022 among Syrian refugee patients in Turkey. Data were collected from patients aged 18 and older who presented for outpatient care at a public medical facility in Istanbul, Turkey. Patients who had already received any COVID-19 vaccine were excluded. Informed consent was obtained from each participant. This study was approved by the Institutional Review Board of the university hospital.

COVID-19-related fear was assessed via the Fear of COVID-19 Scale (FCV-19S). FCV-19S was developed in 2020 by a multinational group from Hong Kong, Iran, the United Kingdom, and Sweden [18]. FCV-19S assesses multiple aspects of fear related to COVID-19, including vulnerability to infection, fear of dying, and psychological and physical symptoms of anxiety. FCV-19S has robust psychometric properties and provides a reliable quantification of the severity of fear of COVID-19. Response patterns are not affected by respondent age or gender. The scale has since been implemented and validated in numerous other European, Middle Eastern, and Asian countries, including Turkey.

General vaccine hesitancy sentiment was assessed using the World Health Organization (WHO) Strategic Advisory Group of Experts on Immunization (SAGE) definition. Assessment of vaccine hesitancy by the SAGE definition can be done via as few as three questions regarding vaccine behaviors; this definition and question set have been widely employed worldwide [19].

COVID-19 vaccine hesitancy was assessed using a version of the Vaccination Attitudes Examination (VAX) scale. VAX is a measure of anti-vaccination sentiment that was initially developed in 2017 by a cooperative group from the United States and New Zealand [20]. Initially developed to measure general anti-vaccination attitudes, the VAX scale can be adapted to assess attitudes toward specific vaccines. The original VAX scale has high internal consistency and validity, and responses are significantly associated with both past vaccine behavior and future vaccine intentions. The VAX scale has been adapted to create the Attitudes toward COVID-19 Vaccine Scale to assess COVID-19 vaccine hesitancy, and has been implemented in several countries, including the United States, France, and India.

For the present study, assessments were translated from English into Arabic, and participant responses were translated back into English. A pilot with 20 participants was initially performed. The questionnaire and the logistical arrangements were found feasible by the participants.

Statistical analysis: Statistical analyses were performed using SPSS statistical software version 24 (IBM Corporation, Armonk, New York, USA). Results are presented as frequencies and percentages for categorical variables and as the mean and standard deviation for continuous variables.

Results

A total of 321 participants were recruited to the study and completed the survey. The median participant age was 43 (range: 18-75). Forty-three percent of participants identified as female. The majority of participants were illiterate (60%), were not working (62%), and lived in large households (household size of five to six, 41%; household size of seven to nine, 42%). Thirty percent of participants reported a personal history of COVID-19 infection. Twenty-seven percent of participants reported a personal history of diabetes mellitus, hypertension, and/or hyperlipidemia. Demographic characteristics of the cohort are displayed in Table 1.

Table 1: Demographic characteristics of study participants

Median (range)

Age 43 (18-75)
N (%)
Gender identity
 Female 139 (43.3)
 Male 182 (56.7)
Education
 Illiterate 193 (60.1)
 Primary school graduate 71 (22.1)
 Secondary school graduate 57 (17.8)
Work status
 Not working 200 (62.3)
 Working irregularly 41 (12.8)
 Working regularly 80 (24.9)
Size of household
 3-4 57 (17.8)
 5-6 130 (40.5)
 7-9 134 (41.7)
Personal history of COVID-19 infection
 Yes 94 (29.3)
 No 227 (70.7)
Personal history of chronic disease (DM, HTN, and/or HLD)
 Yes 86 (26.8)
 No 235 (73.2)

Fear of COVID-19 was common among participants, as assessed by FCV-19S. Ninety-three percent of participants reported feeling uncomfortable when thinking about COVID-19, and 75% of participants reported fear of dying of COVID-19. Forty to 65% of participants also reported physical symptoms of anxiety (palpitations or insomnia) related to fear of COVID-19. Results of the FCV-19S assessment are displayed in Table 2.

Table 2: Fear of COVID-19

Yes [N (%)]

No [N (%)]

I am most afraid of Coronavirus-19. 300 (93.5) 21 (6.5)
It makes me uncomfortable to think about Coronavirus-19. 300 (93.5) 21 (6.5)
My hands become clammy when I think about Coronavirus-19. 180 (56.1) 141 (43.9)
I am afraid of losing my life because of Coronavirus-19. 239 (74.5) 82 (25.5)
When watching news and stories about Coronavirus-19 on social media, I become nervous or anxious. 218 (67.9) 103 (32.1)
I cannot sleep because I’m worrying about getting Coronavirus-19. 127 (39.6) 194 (60.4)
My heart races or palpitates when I think about getting Coronavirus-19. 207 (64.5) 114 (35.5)

General vaccine hesitancy was common among participants. Seventy-one percent of participants reported refusing a vaccine for themselves or their child in the past, and 46% reported postponing a vaccine recommended by a physician. Vaccine hesitancy data are displayed in Table 3.

Table 3: Vaccine hesitancy

Yes [N (%)]

No [N (%)]

Have you ever refused a vaccine for yourself or a child because you considered it as useless or dangerous? 229 (71.3) 92 (28.7)
Have you ever postponed a vaccine recommended by a physician? 147 (45.8) 174 (54.2)
Have you ever had a vaccine for a child or yourself despite doubts about its efficacy? 0 (0) 321 (100.0)

COVID-19 vaccine hesitancy was high among participants. Only 14% of participants stated that they would receive the COVID-19 vaccine. The remaining 86% of participants stated that they would refuse the COVID-19 vaccine. Of those respondents who refused vaccination, reasons for refusal were fear of side effects (78.5%), doubt about effectiveness (19%), and suspicion of short production timeline (2.5%). Attitudes toward COVID-19 Vaccine Scale response data are displayed in Table 4.

Table 4: Intentions regarding COVID-19 vaccination

If a vaccine against the Coronavirus was available, would you get vaccinated?

N (%)

 Yes 46 (14.3)
 No 275 (85.7)
If no, why?
 Fear of side effects 216 (78.5)
 Doubt about effectiveness 52 (19.0)
 Suspicion of short production timeline 7 (2.5)

Discussion

In this study, we present the first quantitative assessment of COVID-19 vaccine hesitancy and fear of COVID-19 in a refugee population using validated questionnaires. COVID-19 vaccine hesitancy is alarmingly high in this population: 86% of participants stated that they would refuse a COVID-19 vaccine. General vaccine hesitancy is also prevalent in this population, with more than 40% of participants reporting a history of refusing or postponing a recommended vaccine.

The prevalence of vaccine hesitancy in this large cohort of refugee patients is concerning given this population is at extremely high risk in every phase of an infectious pandemic, from initial infection to death. Firstly, migrants and refugees are at higher risk of infection with the Coronavirus compared to non-refugee populations. For example, in Denmark in May 2020, the incidence of COVID-19 in the migrant population was 240 per 100,000, compared to 128 per 100,000 among native Danish individuals [21]. Similarly, in Spain in April 2020, the incidence of COVID-19 in the migrant population was 8.81 per 1,000, compared to only 6.51 per 1,000 for native Spanish individuals [22]. The living conditions of refugees, which commonly involve camp-type settings with crowding and extensive use of shared spaces, likely contribute to the increased incidence in refugee populations: outbreaks have been observed in migrant shelters in many countries. Even in non-camp settings, refugees are more likely to reside in shared or overcrowded housing. For example, in a survey of Organization for Economic Cooperation and Development (OECD) countries, migrants were twice as likely to live in an overcrowded housing setting (17%, versus 8% of native-born individuals) [1]. Occupational risks also contribute to increased risk of contracting COVID-19 among refugee populations: refugees are more likely to be employed in public-facing jobs, such as retail, delivery, hospitality, and transport, thereby increasing the risk of COVID-19 exposure compared to other, non-public-facing jobs [23]. Furthermore, refugees generally have more tenuous financial means compared to non-refugee populations and are more likely to be employed in “no work, no pay” jobs such as those mentioned above, necessitating the continuation of work even in high-risk conditions [4,5,23].

Refugees are also at higher risk of hospitalization and mortality from COVID-19. In Denmark in September 2020, migrants made up 15% of COVID-19-related inpatient admissions, despite comprising only 9% of the population [21]. In Sweden, the relative risk of ICU admission for COVID-19 was five times higher for migrants from Africa and the Middle East than for native Swedish individuals [24]. Similarly, in Norway, the incidence of hospitalization due to COVID-19 was 147 per 100,000 in migrant populations, compared to 37 per 100,000 for native Norwegian individuals [2,25]. Certain ethnic groups are at even higher risk of poor outcomes, and studies specific to Syrian refugees have found dismal COVID-related mortality rates. In Sweden, Syrian migrants had a relative risk of death from COVID-19 of 6.14 compared to native Swedish individuals [26]. Excess mortality in Syrian migrants in Sweden was 220% in 2020, due overwhelmingly to COVID-19 deaths [26].

Thus, given the high risk of initial exposure, severe disease, and death in this population, the magnitude of benefit from vaccination in this population is enormous, and the consequences of vaccine hesitancy are catastrophic. For example, the resurgence of measles in the United States, Norway, and other countries in the early 2000s as a result of increased parental refusal of MMR vaccination was notable for outbreaks heavily concentrated in migrant and refugee populations. In two outbreaks in Minnesota, USA in the 2010s, 72% of cases occurred in members of the Somali community [27,28]. During this time period, MMR vaccination rates among two-year-old Somalis in Minnesota fell to 54%, from over 90% ten years prior [29]. Similarly, in a 2011 measles outbreak in Oslo, Norway, 80% of cases occurred in members of the Somali community, in which MMR vaccine rates were also noted to be low [29,30]. Unfortunately, the present study confirms that vaccine hesitancy continues to be a major barrier to vaccination among refugee communities with regard to COVID-19 vaccination. Interventions to increase vaccine uptake in refugee populations are critically needed.

Vaccine uptake can be improved by addressing each contributing factor to low vaccination rates. Systemic factors must be addressed on the institutional level. For example, although the national COVID-19 vaccine program in Turkey, the setting of the present study, includes all individuals living in the country regardless of immigration, refugee, or asylum-seeking status, public health and vaccine programs in some countries exclude refugees, either explicitly, or indirectly due to requirements for identification or documentation to be presented at the time of vaccination. Removing systemic barriers by making COVID-19 vaccines available to all individuals regardless of legal status, improving outreach in refugees’ native language, increasing vaccine convenience, and guaranteeing protection from detention when seeking healthcare will all increase vaccination rates in individuals who desire to be vaccinated.

However, the present study identified that unvaccinated individuals who desire to be vaccinated (but may be impeded from doing so by systemic factors such as those detailed above) are a small minority among the Syrian refugee population in Turkey; the vast majority of participants are refusing COVID-19 vaccination, with concern for side effects the most commonly cited reason for refusal. Therefore, removing systemic barriers to vaccination is not sufficient to improve vaccination rates. Education on vaccine effects must be provided and misinformation and false beliefs must be addressed to improve vaccine hesitancy.

Although the present study is the first to quantitatively assess COVID-19 vaccine hesitancy in refugee populations using validated questionnaires, vaccine hesitancy in general has been well-studied. The most effective strategies for reducing vaccine hesitancy and improving vaccination rates overwhelmingly involve accessible, understandable health education from trusted sources. These strategies have been well-described by previous groups [31,32]; we briefly summarize the most common and salient points here. First, and perhaps most importantly, public health messaging must be available in refugees’ native language. In Turkey, a robust COVID-19 public health program is available via internet and a COVID-19 hotline is available via telephone, but these sources are only available in Turkish and English; 80% of Syrian refugees speak only rudimentary Turkish. An Arabic translation of the website or an Arabic language option for the telephone hotline would make this information more accessible for Syrian refugees. This model has been extremely successful in Sweden, where healthcare workers use telemedicine platforms nicknamed “Corona lines” to distribute COVID-19 educational information, triage respiratory symptoms, and instruct patients on appropriate quarantine and hygiene in Arabic, Somali, Tigrinya/Amharic, and Persian/Dari as well as the Swedish national languages. Second, vaccine development, testing, and approval information should be transparent and accessible to the public. As prior qualitative interviews cited above noted social media as the main source of COVID-19-related information for refugees, this information should be publicized via not only traditional media, but verified sources on social media as well. For example, national health ministries can use their official Facebook and other social media feeds to publicize vaccine information; this information should be in refugees’ native language, as discussed below. Specific provocative or culturally relevant false beliefs, such as concern that the vaccine contains pork products or causes infertility, should be targeted and addressed emphatically. The participants in the present study overwhelmingly indicated fear of side effects as the reason for vaccine refusal; public health information should emphasize the favorable side effect profile of COVID-19 vaccines. Third, personal storytelling from persons with whom refugee populations identify are effective means of appealing to individuals’ empathy and emotion. For example, for a target population of Syrian refugees, a public health announcement featuring a multigenerational Syrian family who accepted the vaccine can be filmed and widely publicized as described above. Fourth, community leaders, particularly religious leaders, such as imams at Syrian-majority Arabic-speaking mosques, should be partnered with for the dissemination of vaccine information. Fifth, refugee populations should be actively included in the process of public health education and information dissemination; for example, local public health committees should include at least one refugee member who participates in vaccination campaigns.

We found that fear of COVID-19 is also common in this population, with over 90% of participants reporting COVID-19-related fear. Notably, 75% of participants stated that they fear dying of COVID-19. The coexistence of high COVID-19 fear with high vaccine hesitancy seems contradictory. This contradiction emphasizes the role of misinformation, portraying the preventive measure as more harmful than the disease itself, in promoting vaccine hesitancy in this population. However, COVID-19 fear may become a motivation for participants to agree to vaccination if misinformation is replaced with accurate information about the efficacy and safety of COVID-19 vaccines.

The limitations of our study include its design as a cross-sectional survey, which represents the attitudes of the survey participants at one time point, and does not assess changes in attitudes over time. The demographic and clinical variables assessed, such as comorbidities and history of COVID-19 infection, were self-reported by participants, and were not verified by the investigators. The study was restricted to Syrian refugees in an urban metropolis. It may not be generalizable to other ethnic refugee populations, or to refugees in rural areas.

Conclusion

Refugee populations are at high risk of COVID-19 exposure, infection, severe morbidity, and mortality. Fear of COVID-19 infection is high in this population, with over 90% of participants reporting COVID-19-related fear. However, despite high levels of fear the disease, COVID-19 vaccine hesitancy is contradictorily and critically high among Syrian refugees in Turkey, with over 80% of individuals refusing vaccination. Fear of side effects is the most common reason for refusal of vaccination. Targeted public health outreach interventions are critical to improve vaccination rates in this vulnerable population.

Funding

This research received no specific grant from any funding agency in the public, commercial, or not-for-profit sectors.

References

  1. OECD (2020) What is the impact of the COVID-19 pandemic on immigrants and their children? Paris: OECD.
  2. Indseth T, Grosland M, Arnesen T, Skyrud K, Klovstad H, et al. (2021) COVID-19 among immigrants in Norway, notified infections, related hospitalizations and associated mortality: A register-based study. Scand J Public Health 49: 48-56. [crossref]
  3. Intervention GMoHNPHODoESa. Epidemiological surveillance in points of care for refugees/migrants weekly report week 14/2020. Greek Ministry of Health National Public Health Organization Department of Epidemiological Surveillance and Intervention; 2020.
  4. Giordano C (2020) Freedom or money? The dilemma of migrant live-in elderly carers in times of COVID-19. Gend Work Organ.
  5. Wang FTC, Qin Weidi (2020) The impact of epidemic infectious diseases on the wellbeing of migrant workers: A systematic review. International Journal of Wellbeing 10.
  6. Chiarenza A, Dauvrin M, Chiesa V, Baatout S, Verrept H (2019) Supporting access to healthcare for refugees and migrants in European countries under particular migratory pressure. BMC Health Serv Res 19: 513.
  7. Kizilkaya MC, Kilic SS, Bozkurt MA, Sibic O, Ohri N, et al. (2022) Breast cancer awareness among Afghan refugee women in Turkey. EClinicalMedicine 49: 101459. [crossref]
  8. Sayan M, Eren MF, Kilic SS, Kotek A, Kaplan SO, et al. (2022) Utilization of radiation therapy and predictors of noncompliance among Syrian refugees in Turkey. BMC Cancer 22: 532. [crossref]
  9. United Nations High Commissioner for Refugees Fact Sheet: Turkey. 2021.
  10. G S. The impact of COVID-19 on poverty in Turkey. The Borgen Project; 2021 13 July 2021.
  11. United Nations High Commissioner for Refugees [Internet]. 2021.
  12. Roberton T, Weiss W, Jordan Health Access Study T, Lebanon Health Access Study T, Doocy S (2017) Challenges in Estimating Vaccine Coverage in Refugee and Displaced Populations: Results From Household Surveys in Jordan and Lebanon. Vaccines (Basel) 5. [crossref]
  13. ER (2021) On COVID vaccinations for refugees, will the world live up to its promises? The New Humanitarian.
  14. Waddell B (2021) States That Have Welcomed the Most Refugees from Afghanistan. US News and World Report.
  15. Observatory Report: Left Behind: The State of Universal Healthcare Coverage in Europe. Brussels: Médecins du Monde; 2019.
  16. Salibi N, Abdulrahim S, El Haddad M, Bassil S, El Khoury Z, et al. (2021) COVID-19 vaccine acceptance in older Syrian refugees: Preliminary findings from an ongoing study. Prev Med Rep 24: 101606. [crossref]
  17. Crawshaw AF, Deal A, Rustage K, Forster AS, Campos-Matos I, et al. (2021) What must be done to tackle vaccine hesitancy and barriers to COVID-19 vaccination in migrants? J Travel Med 28. [crossref]
  18. Ahorsu DK, Lin CY, Imani V, Saffari M, Griffiths MD, et al. (2020) The Fear of COVID-19 Scale: Development and Initial Validation. Int J Ment Health Addict 1-9. [crossref]
  19. Rey D, Fressard L, Cortaredona S, Bocquier A, Gautier A, et al. (2018) Vaccine hesitancy in the French population in 2016, and its association with vaccine uptake and perceived vaccine risk-benefit balance. Euro Surveill 23. [crossref]
  20. Martin LR, Petrie KJ (2017) Understanding the Dimensions of Anti-Vaccination Attitudes: the Vaccination Attitudes Examination (VAX) Scale. Ann Behav Med 51: 652-660. [crossref]
  21. Institut SS (2020) COVID-19 I Danmark. Epidemiologisk trend og fokus: Herkomst (etnicitet). Copenhagen. Statens Serum Institut.
  22. Guijarro C, Perez-Fernandez E, Gonzalez-Pineiro B, Melendez V, Goyanes MJ, et al. (2021) Differential risk for COVID-19 in the first wave of the disease among Spaniards and migrants from different areas of the world living in Spain. Rev Clin Esp (Barc) 221: 264-273. [crossref]
  23. Reducing COVID-19 transmission and strengthening vaccine uptake among migrant populations in the EU/EEA. Stockholm; 2021 3 June 2021.
  24. Utrikesfödda och covid-19: Konstaterade fall, IVAvård och avlidna bland utrikesfödda i Sverige 13 mars 2020 – 15 februari 2021. Stockholm: Swedish Public Health Agency (Folkhalsomyndigheten); 2021.
  25. Covid-19 blant personer født utenfor Norge, justert for yrke, trangboddhet, medisinsk risikogruppe, utdanning og inntekt2021. Folkehelseinstituttet; 2021.
  26. Hansson E, Albin M, Rasmussen M, Jakobsson K (2020) [Large differences in excess mortality in March-May 2020 by country of birth in Sweden]. Lakartidningen 117. [crossref]
  27. Gahr P, DeVries AS, Wallace G, Miller C, Kenyon C, et al. (2014) An outbreak of measles in an under vaccinated community. Pediatrics 134: e220-228. [crossref]
  28. Leslie TF, Delamater PL, Yang YT (2018) It could have been much worse: The Minnesota measles outbreak of 2017. Vaccine 36: 1808-1810. [crossref]
  29. Tankwanchi AS, Jaca A, Larson HJ, Wiysonge CS, Vermund SH (2020) Taking stock of vaccine hesitancy among migrants: a scoping review protocol. BMJ Open 10: e035225.
  30. Vainio K, Ronning K, Steen TW, Arnesen TM, Anestad G, et al. (2011) Ongoing outbreak of measles in Oslo, Norway, January-February 2011. Euro Surveill 16. [crossref]
  31. Thomas CM, Osterholm MT, Stauffer WM (2021) Critical Considerations for COVID-19 Vaccination of Refugees, Immigrants, and Migrants. Am J Trop Med Hyg 104: 433-435. [crossref]
  32. Aborode AT, Fajemisin EA, Ekwebelem OC, Tsagkaris C, Taiwo EA, et al. (2021) Vaccine hesitancy in Africa: causes and strategies to the rescue. Ther Adv Vaccines Immunother 9: 25151355211047514. [crossref]

Voice Analysis for Decisions in Clinical Practice

DOI: 10.31038/IJNM.2022334


Verbal and nonverbal communication generates various debates and feelings between individuals, finally improving knowledge and experiences and, last but not least, influencing people’s health. Mental activity is mainly influenced by visual, sound, and smells perception. A person’s appearance, colour use, scent, and movement in a specific environment create diverse motion pictures going along with excitement, indifference, or discomfort, according to data processing. The music expresses various themes; miscellaneous musical compositions decoded by matching corresponding musical instruments or human voices determine emotions, relaxation, and even attentiveness. Verbal communication skills are necessary to improve an individual’s professional, cultural and social life; the words’ meaning and energy influence people’s well-being. The effects of the usage of the words in the written format are different from the spoken words since the speech energy, controlled by the nervous system, adds value to the words’ significance. Communication skills by terms make a difference between individuals and initiate numerous actions according to their relevance, physical characteristics of words’ transmission, intended recipient’s sensitivity, and context.

In this digital era, an individual can put an idea in a writing format or convert it into a say that instantly goes up to the intended recipients using IT devices.

Speech or the words’ ordering analysis offers information about the individual:

  • Level of Expertise
  • Skills for knowledge translation in practice
  • Emotions
  • Possible medical conditions
  • Well-being

Speech depicts its coordination in appearance; deficiencies at various levels for command and execution pathways indicate the voice’s signs of interest in clinical practice. Voice characteristics combined with the breathing data reflect blood flowing in the human body. Heart activity, the respiratory system’s function, and gravitational waves influence human body fluids movement; the digestive, endocrine, skeletal, respiratory system, kidney, and liver functions influence blood composition. The mind activity affects all these variables interplay, conveying the words and voice expression. Even so, the heart function and respiratory system, both under nervous system coordination, are seen as significant contributors to the voice function. Heart failure modifies the body’s fluid distribution and, subsequently, voice characteristics that change from one stage to another in its evolution.

Each person’s voice is distinctive and adaptable to various internal and external stimuli. AI supply leads to fast voice analysis and prediction of disorders in appearance or evolution. In this digital era, a video visit or only a phone call visit can offer sufficient details about individuals, including data health. For the medical team, an e-visit may be considered appropriate when necessary. For the patient, an in-person or e-visit represents a convenient option to get care in need. The patient experience can be appreciated /measured by his words’ composition to express gratitude, voice attributes, and sentiment analysis, preferably using AI supply. Subjective voice analysis and artificial intelligence utilization offer another perspective in clinical practice. Recent medical literature highlights ambitious AI projects for using the voice function in diagnosis. Therefore, according to individual financial status, there will be a wide range of options for the disease’s management in clinical practice. But only by using a mobile phone can the patient and the physician be connected to successfully control the patient’s disorders. The art of using the voice for analysis and decisions in clinical practice defines us as professionals in the community we serve.

Formative Evaluation of Trauma-informed Content Provided to Undergraduate Nursing Students in NURS 466 – Community Health

DOI: 10.31038/IJNM.2022333

Abstract

Purpose: The purpose of this Quality Improvement (QI) project was to complete a formative evaluation of Trauma Informed Care (TIC) content delivered in a population-focused health nursing course for senior-level undergraduate nursing students.

Methods: This was a descriptive study that gathered feedback from students about the Trauma Informed Care content. A survey was disseminated via Qualtrics after the module/lecture to gather information about the effectiveness of the lecture with respect to TIC content; timing of the lecture in the semester relative to clinical; attitudes/perceptions about the importance of the content and practical application.

Results: The content provided to the students in Nursing 466 Community Health improved students’ knowledge and skills related to providing Trauma Informed Care. Twenty-five participants from the Bachelor of Science in Nursing program at Gonzaga University participated

Keywords

Bachelor of nursing students, Trauma-informed care, COVID-19, Population health

Introduction

Current times require us to reexamine the content we are teaching community/public health nursing courses. The American Association of Public Health suggests that undergraduate public health nursing education should include information on trauma-informed care. Trauma-informed pedagogy in public health is not new, but the trauma related to the COVID-19 pandemic argues for making it a priority for all educators [1]. As a result of the pandemic many in the public have experienced trauma related to stress, financial impact, mental health, and physical well-being. We are faced with increasing rates of the COVID-19 pandemic, chronic conditions, infections, violence, and extreme weather events. All these circumstances point to a growing need for including content about Trauma Informed Care. The concept of trauma can be described as the following “Individual trauma results from an event, series of events, or set of circumstances that is experienced by an individual as physically or emotionally harmful or life-threatening and that has lasting adverse effects on the individual functioning and mental, physical, social, emotional, or spiritual well-being [1]. This article reports the formative evaluation of adding content about Trauma Informed Care (TIC) to a population-focused health course in a Bachelor of Science (BSN) program at a private university in the inland northwest. Trauma-informed care is grounded in a set of four assumptions and six key principles as a framework. The four Rs of this Trauma-Informed Approach framework are: realize, recognize, respond, and resist re-traumatization [1]. “A program, organization, or system that is trauma-informed realizes the widespread impact of trauma and understands potential paths for recovery; recognizes the signs and symptoms of trauma in clients, families, staff, and others involved with the system; and responds by fully integrating knowledge about trauma into policies, procedures, and practices, and seeks to actively resist re-traumatization (wording bolded in original text). These concepts are needed when working in population health. The content that was presented to this BSN group of students was organized into three sections. Section 1 was an overview of trauma-informed care, including the definitions of trauma and passive trauma. The trauma that those who experience homelessness or living in poverty were used as exemplars. This section included an overview of neurobiology, biopsychosocial needs of those experiencing homelessness, addiction, and/or poverty, and how the brain reacts to trauma. Section two described different types of traumas as a public health issue of our time and included an overview of Adverse Childhood Effects (ACEs). Exemplars of trauma related to ACES, as well as the pandemic, and natural disasters were presented. Section two also included an overview of current statistics related to trauma and how stress affects those that experience trauma. Section three addressed addiction, stress, and homelessness, how to return to a state of hope, how to implement and “do” trauma-informed care, transformation, and post-traumatic growth, and how not to re-traumatize individuals. Today we are not only faced with increasing diseases but also other traumatic events [2]. These events can be additional sources of trauma and Post Traumatic Stress Disorder (PTSD) in public health. Although the need for nurses who can manage care along a continuum, implement evidence-based practice, work in multi-disciplinary teams, and integrate clinical expertise with knowledge of community resources is recognized, there is a lack of pedagogy that includes Trauma Informed Care [3]. This article describes the need for gathering formative information to add trauma-informed pedagogy to the current community health course. Using that formative information students provide could lead to changes made to the content before presenting it to the next group of students. The TIC content and knowledge could be implemented with the partnership between the school of nursing (SON) and local agencies where students complete public health clinicals.

Background

As a result of the COVID-19 pandemic, there is an essential need to prepare BSN students to not only care for individuals, but also for populations. According to SAMSHA “PHN practice is population-focused and requires unique competencies, skills, and knowledge. The important skills of analytic assessment, program planning, cultural competence, communication, leadership, and systems thinking, and policy are critical to the PHN role” [4]. Considering the pandemic, students’ interest may be piqued, and more students now see public health as a viable career option. It is important as faculty to recognize how Public Health will be taught in the aftermath of the COVID-19 pandemic and have awareness of the trauma students could experience as new nurses taking care of COVID patients. The pandemic will have likely affected students as well as those prone to experience trauma among the population on a personal level either because they have become ill themselves or know someone that was affected by the virus. Furthermore, we need to consider the trauma of providing nursing care as a student to COVID patients. With this comes the need for trauma-informed care. Those from marginalized communities, the homeless population, and middle-class families have all been prone to traumatic experiences. Trauma Informed Care will ensure that the students gain knowledge and learning tools to serve their community with the knowledge of what Trauma Informed care is and how to reduce the risk of re-traumatization of clients [3]. The added pedagogy included Trauma Informed Care, to an already packed course that includes Disaster Preparedness, prioritizing social determinants of health, and the use of politics and policy. As faculty teaching, this group of “post-pandemic” students requires our pedagogy to include trauma-informed care so as to not exacerbate the client’s trauma in their public health clinicals’. The students at this school of nursing work in partnership with community sites such as shelters, homeless centers, the department of health, and many other agencies that provide services to populations that experience extreme poverty. The content took on a hybrid format of teaching online and in the classroom. Study findings provide information to inform revisions to the lecture to better meet the needs of students regarding this content.

Problem

Undergraduate Nursing students in this BSN program need Trauma Informed Care content. There is a gap in practice in the literature regarding Trauma Informed Care (TIC) taught in the BSN program. As a result of the COVID-19 Pandemic, many in the public may have experienced some form of trauma. There is a recurring recommendation from the American Public Health Association to start integrating TIC into the undergraduate curricula to educate BSN students on what Trauma Informed Care is and how to apply it to practice. This Quality Improvement Project aimed to examine the formative feedback and perceived value of the TIC content integrated into the BSN Community Health content.

Methods

This was a descriptive study within one BSN program. Students were enrolled in the senior-level community health class. Participation was voluntary and consent, as well as understanding the purpose and process of this project, was presumed by completion of the survey. Approval from the university’s IRB was obtained. The survey included both scaled and open-ended questions and students could voluntarily participate post-lecture. This article describes the preliminary findings of the perceived value of the TIC content and how students responded to the content delivered. The overall goal was to gather feedback about the effectiveness of the lecture and what changes need to be made for the future integration of TIC into the community health course. Participants were invited to participate in a Qualtrics survey sent out securely to their student email addresses during class by a staff member from the Dean’s Office. The investigator did not utilize email addresses herself but had the staff member send the surveys via email during class time from a remote location. The class roster was available to the staff member in the university system. Email addresses were not stored in any other system except for Qualtrics, the survey software. Once the survey and project were completed using Qualtrics, any email addresses used by the system were deleted. The investigator/course instructor informed the class (potential subjects) about the survey and study goals immediately before the lecture was given and informed the students of their ability to opt-in/out of the survey portion of the class, which occurred after the lecture was given. The survey consisted of 9 questions Likert-type scaled responses and 5 open-ended questions that were designed to gather feedback about the effectiveness of the lecture with respect to content; timing of the lecture in the semester relative to clinicals’; perceived importance of the content and practical application; information necessary to inform revisions to the lecture to make it tailored to the population-level needs of the students A Likert scale was used to gather quantitative data. Five of the questions were open-ended so that the students could provide written feedback exploring contextual factors [5,6]. Students’ narrative responses provided essential information about how to format the content and presentation for the next group.

Results

The Trauma Informed Care content is particularly valuable. This information also provides resources and tools for clinical practice use. The formative evaluation process used in the project provided valuable feedback to increase the quality of this content and delivery in the future to the next group of participants (students). The content provided to the students in Nursing 466 Community Health improved students’ knowledge and skills related to providing Trauma Informed Care. Twenty-five participants from the Bachelor of Science in Nursing program at Gonzaga University participated. Participating evaluators indicated that the education program was effective with respect to TIC content, the timing of the lecture in the semester relative to clinical, attitudes/perceptions about the importance of the content and practical application. Overall, 52% of participants felt the content was very understandable and 64% felt the content was very important to clinical practice. 56% of participants felt that the lecture was very understandable and 64% of the participants felt that the content was important to clinical practice. Participants (54%) felt that the content was usable in their practice and 44% of participants felt that it would impact their values and beliefs.

Demographics

Thirty-six students were enrolled in the course; 25 (69%) of participants completed the survey. This section outlines descriptive statistics performed for the Likert-type items that were a part of the questionnaire. To capture the students’ perceptions about the lecture, we included in the questionnaire questions such as “How informative was the lecture content” and “How relevant is this lecture to public health.” These questions were measured utilizing a Likert-type scale ranging. 0=Unimportant, 1=Somewhat important, 2=Moderately important, 3=Important, 4=Very important, 5=I don’t know.

Qualitative feedback identified strengths in the use of the open-ended questions related to how the lecture impacted the students’ values and beliefs about people who live with homelessness and substances; the length of the presentation; timeliness of the presentation; understandability of the lecture and lastly, what changes the participants suggested to improve the lecture for future students

14 (56%) of respondents indicated that they found the lecture content to be informative, while 8 (32%) found it very informative. 21 (84%) of respondents found the lecture to be very relevant to the landscape of public health (Graph 1).

graph 1

Graph 1: How informative was the lecture content

The students were asked to assess the length of the presentation. There were 25(60%) respondents that found the length of the presentation appropriate, while 5(20%) found it very appropriate (Graph 2).

graph 2

Graph 2: Length of lecture

From this question, four different themes came to light. These themes are “different parts of the lecture “extending the lecture” “reduction in the lecture” and “additions to lecture.

The lecture was split up into three different sections and the students responded favorably to this and stated that “the presentation blended well together, and each section built off one another in a coherent manner”. There were some comments to extend the lecture by including more breaks and breaking apart what trauma-informed care is based on evidence-based practice and how that can be implemented in different communities. Related to the reduction in lecture the lecture was very consolidated, and students felt that there were a few slides that could be omitted. Some students suggested that perhaps it could be a multiday lecture. Additions to the lecture included suggestions to add some more videos and to include the ACE’s resources and some CDC resources.

The timeliness of the lecture relative to the student’s clinical experiences was also assessed. There were 13 (52%) respondents that indicated that the lecture was somewhat timely;7 (28%) of respondents rated it as timely with respect to how early it was offered in the course (Graph 3).

graph 3

Graph 3: Timeliness of the lecture

Timeliness was very important to the students, and they noted that it would be good for students to benefit from the content much earlier in their BSN curriculum. Students suggested receiving this content earlier in the semester of their program. It was stated that if they had this before their senior practicum it would be very beneficial. Others stated that they could see this content being threaded throughout their 4-year program. It was mentioned that trauma-informed care is something they are thankful they learned in their BSN track and wished to learn about it earlier.

To assess the impact of the lecture, the following questions were asked: “How understandable was the presentation?” 14 (56%) Respondents felt the presentation was very understandable (Graph 4).

graph 4

Graph 4: How understandable was the lecture

In response to this question Students mentioned that the topic was very relevant and helped them to see the “bigger picture”. Furthermore, they stated it would help them to identify paying attention to the information relating to ACEs among children, and being able to be an advocate for their patients was very important and helpful. Regarding the enjoyability of the lecture, students felt the PowerPoint was easy to follow and enjoyable to view.

“How important will this lecture be to your clinical practice,” 7 (28%) respondents felt that this was very important content for their clinical practice. 16 (64%) of respondents felt that this was very important content for their clinical practice (Graph 5).

graph 5

Graph 5: Importance of lecture to clinical practice

“To what extent do you feel the content can be used by you in practice immediately?” 9 (36%) of respondents felt that the content could be used in practice immediately. 13 (52%) respondents felt that the content was usable for practice immediately (Graph 6).

graph 6

Graph 6: Usability of lecture in practice

“To what extent did the lecture content impact your values and beliefs about people who live with homelessness and use substances?” 9(35%) of respondents felt that the content was very impactful and related to the above question. 11 (44%) of respondents felt it was impactful content (Graph 7).

graph 7

Graph 7: Impact on values and beliefs

The first question analyzed reflects the impact that the content on the student’s values and beliefs about how people live with homelessness and substances. Students stated that the content was “extremely relevant” and is a significant component in promoting healing. Furthermore, students stated that “being educated on this topic allows us to be more aware and educate the community we work with during our community health clinical’ as future nurses, and it provides details about the struggles the homeless face since many of those experience some form of trauma that have been homeless before.” There were two sub-questions to this overall question.

  • The next question addressed what students’ reaction was to the details about physiological and psychological content. Students responded that neurological and biological changes are important to consider and that it was “cool” to learn more about the actual physiology and physical and chemical changes that occur during trauma. Furthermore, it was stated that “the lecture did a really good job at explaining the reasoning behind homelessness and addiction”.
  • Understanding what Adverse Childhood Effects (ACEs) are, was another area of this question that could influence the values and beliefs. Students state that understanding ACES “impacts the way you interact with patients in the clinical setting and broadened their perspective and strengthened their patience while working with this population and/or people who may have experienced ACEs or trauma in the past.

What changes would you make to the TIC lecture to improve it for future NURS 466 students? This question addressed any suggestions or changes to the lecture. Three themes emerged including resources, timing, and methods. Students suggested that they could offer specific resources or reference for patients or clients. They also asked how they can be sure to not re-traumatize patients. One of the students suggested asking someone who experienced trauma and overcame it to write a letter and share how they overcame their trauma. Timing again addressed the fact students wanted this content earlier in the semester, and program. Regarding methods, students mentioned more class discussions and asked for some real-life clinical examples. They also suggested part of the lecture be more interactive and include discussion.

Outcomes

Participating evaluators indicated that the education program was effective with respect to TIC content, the timing of the lecture in the semester relative to clinical, attitudes/perceptions about the importance of the content and practical application. Receiving formative evaluation to improve the development of a trauma-informed public health education program that provided evidence-based strategies and resources was the primary goal of this project. The results of the program demonstrated the effectiveness of using formative evaluation to develop a trauma-informed educational lecture for senior undergraduate Bachelor of Nursing students. The educational lecture overall demonstrated positive responses as to how the lecture impacted the students’ values and beliefs about people who live with homelessness and substances; the length of the presentation; timeliness of the presentation; understandability of the lecture and lastly, what changes the participants suggested to improve the lecture for future students. The findings of this educational lecture resonate with findings from other publications in relation to the importance of educational content on trauma-informed care for undergraduate nursing students to equip students with knowledge and understanding of trauma-informed care as it relates to public health. Emphasis on how timely this lecture was given is noted and will help change the timeliness of future lectures provided at the beginning of the student’s semester rather than toward the end.

Limitations

While the development of this Trauma-Informed care lecture reasonably provides strong evidence of the effectiveness of using formative evaluation to aid the development of the lecture within the sample population, it has some limitations. The first limitation is that it did not provide pre- and post-feedback as to what knowledge base the students had related to the content. It was limited only to one class in the undergraduate nursing program and the feedback is provided at the end of class when students are overloaded with the information they just received.

Future Directions

To overcome some of the limitations the respondents in the next part of this project will have a pre-and post-survey. The formative information provided in this project will better the lecture offered to the next student group in the Spring 2021 semester.

Funding

There was no funding involved for this project.

Conclusions

The trauma-informed care for public health lecture developed for senior undergraduate nursing students is powerfully applied by using evidence-based content and resources poised to provide an excellent delivery system for educating students. The lecture provided students with evidence-based content related to how trauma-informed care impacts public health. The student participants’ responses to the formative evaluations in developing this content were positive. In addition, the responses provided positive feedback and suggestions to improve the development of this lecture for future students.

References

  1. SAMHSA’s Concept of Trauma and Guidance for a Trauma-Informed Approach (2014) Retrieved from Substance Abuse and Mental Health Services Administration.
  2. Auerbach, J, Miller F (2020) COVID 19 Exposes the cracks in our already fragile mental health system. AJPH. [crossref]
  3. Abuelezam N (2020) Teaching public health will never be the same. AJPH 110. [crossref]
  4. National League for Nursing. NLN. 2022.
  5. Center for Disease Control. CDC. 2021.
  6. S Department of health and human services (HHS) (2014) Office of women’s (OWH) health trauma informed care (TIC) training and technical assistance initiative. Participant scales. Cross-site evaluation of the national training initiative on trauma informed care (TIC) for community-based providers from diverse service systems. Abt. Associates.

Peer-to-Peer Evaluation: Kritik Pilot at Two Post- secondary Canadian Institutions

DOI: 10.31038/IJNM.2022332

Abstract

In 2021/2022, educators at two Canadian universities chose to use a novel pedagogical approach to undergraduate program learning and instruction. Kritik, an on-line platform was selected because of its reputation for encouraging peer-to-peer learning and evaluation through use of Bloom’s Taxonomy of Learning to promote critical thinking skill development in learners. In this article, we outline our experiences while piloting use of Kritik, provide a critical assessment of its use and share our pedagogical lessons learned.

Keywords

Peer evaluation, Peer feedback, Undergraduate learning and instruction, Kritik

Introduction

The inspiration for this article originated  in  2021/2022  after our pilot of Kritik, an on-line, peer-to-peer learning and evaluation platform used for the  purpose  of  promoting  student  engagement in learning. Kritik allowed us to step away from being the primary source of all knowledge, and to instead use a collaborative educational approach to facilitate the learning process. In this article, we share our experiences, provide a critical assessment of Kritik use, and outline our pedagogical lessons learned.

Explication of Concepts

A peer has been defined to be one who is of equal standing with another, especially based on age, grade, or status [1]. In this article, a peer is understood to be an undergraduate student. Despite their similarities and often being used interchangeably, the terms review, assessment and evaluation have distinct meanings. A review is identified to be the act of giving one’s opinion about the quality of a product, and assessment is a systematic basis for making inferences about student learning and development, while evaluation is the determination of the value, nature, character, or quality of something [1]. Feedback is the transmission of evaluative or corrective information about an action, event, or process to the original or controlling source [1].

The terms peer feedback and peer evaluation are used for the purposes of this article. Peer feedback is the “rich detailed comments” [2 p. 280] given by peer student evaluators and communicated to students with the aim of providing “guidance on the quality of the student’s work and understanding of the subject manner”  [3  p.  753]. Peer feedback is given during the process of peer evaluation; an organized, systematic process wherein students use a rubric, a standardized measurement tool to evaluate peer assignment compositions completed on the Kritik platform.

Background

We teach undergraduate courses at two Canadian universities located in the province of Manitoba. Kristen teaches DIS-2200/ WGS- 2264, Disabilities, Sexualities and Rights, cross-listed between the Disability Studies Program and Women’s and Gender Studies Department, as well as REL-2570, Sexuality in the Religious Context, in the Religion and Culture Department at the University of Winnipeg. I teach both 69:161, an introductory interpersonal communication course and 69:473, a fourth-year philosophical perspectives in psychiatric nursing course at Brandon University.

Over the past two decades, I have incorporated the use of peer evaluation into my courses. One of my previously taught fourth-year courses involved students completing peer evaluation of their seminar presentations. The assignment mark was derived from an average of peer evaluation scores and my own. In a third-year course, students conducted peer evaluation of a case study analysis, completed, and posted on an on-line platform by each student. In this case, too, the assignment mark was based on an average between peer review scores and mine. In yet another course, this time an introductory course, after viewing an assigned video, students posted their responses to questions about the video to an on-line platform for peer evaluation by fellow classmates. The assignment mark was again based on an average of student peer review scores and mine.

It is noteworthy to share that over the years, I have repeatedly encountered significant resistance to peer evaluation assignments from several students. Course end student evaluation included have comments suggesting that the majority of opposition was aligned with assumptions and beliefs that use of peer evaluation is a mechanism for offloading the course instructor’s work onto students.

Kristen had previously experimented with incorporating peer evaluation into an online REL-2507 course, using the ‘Discussions’ feature of the D2L/Brightspace platform. Having sorted students into groups, they were asked to post their near-final drafts of a visual-art analysis assignment on-line. Each group member was instructed to carefully read the other members’ submissions, and to offer actionable feedback. Completing all (four or five) of one’s peer assessments with evidence of a good degree of care and effort earned each student   5% of their final mark, though students’ drafts themselves were not graded. Students then made any changes they wished to their drafts and submitted the final papers to the instructor for assessment. The finished paper was worth 15% of students’ final grade, and assessed in a conventional, holistic way by the instructor and teaching assistant (TA). One of the limitations of this  peer-evaluation  activity  was that the process could not be made anonymous, limiting the critical feedback some students were comfortable providing. Overall, this activity resulted in respectful and supportive engagement with peers’ work, and a reasonably high caliber of finished work, and encouraged Kristen’s interest in using peer evaluation in future courses.

Kritik

Kritik, a novel on-line platform developed with the aim of encouraging peer-to-peer learning and evaluation,  integrates  the  use of Bloom’s Taxonomy of Learning to promote critical thinking skill development in learners [4]. A rubric developed by the course instructor, in consultation with a Kritik design specialist, accompanies each peer-to-peer learning & evaluation activity. This rubric, comprised of evaluative criteria and specific criterion measures, serves as a frame of reference for students while conducting peer review and evaluation.

Each peer-to-peer learning and evaluation activity consists of create, evaluate, and feedback stages [4]. In the create stage, students follow the activity instructions, adhere to the criteria outlined in    the corresponding rubric, and create an activity composition that is uploaded to the Kritik platform. During the evaluate phase, students provide both formative and summative feedback by evaluating assigned peers’ activity compositions using the corresponding rubric and substantiate their assigned peer evaluation scores with written comments intended to be helpful when students complete their next Kritik composition. The feedback stage involves students providing each peer evaluator with feedback about how helpful their comments were [4]. Weighting is assigned to each of the three stages through use of an algorithm calibrated by a Kritik design specialist in consultation with the course instructor. A score is assigned for each of the three stages using the established algorithm with the overall Kritik activity mark being the combined score of all three stages

Motivations for Using Kritik

We do not believe that the course instructor should be the central figure in any given course; achievement of sustained, quality learning is a cooperative task. Moreover, we opine that learning is less likely to occur if students are passive recipients and not actively engaged within learning and instruction. As such, we strive to create student-centered learning environments with students actively engaged with one another while we provide guidance in the accomplishment of course learning objectives. One of the most significant advantages of Kritik, from this perspective, is that it keeps the learning process student centered. Although instructors are available to ‘step in’ to provide guidance with peer evaluations, or to override marks assigned by peer evaluators in any/all three stages, students interact primarily with each other. Further, if Kritik is used for a sequence of assignments in a course, students are teaching and learning from one another and so doing are engaged in an iterative process. Kritik levels the playing field wherein students are on somewhat more-even footing with the course instructor. Rather than being fundamental to the learning process, we consider ourselves to be facilitators of learning, readily available to assist and/or intervene if needed.

One of the more ‘pragmatic’ benefits of Kritik is the flexibility  it offers to instructors in managing their grading work. While the platform does not completely take assessment duties away from the instructor, it does allow the instructor to choose how intensively  they wish to be involved in the process, ranging from engaging   only when students disclose a concern with a peer evaluation by submitting a ‘grade dispute’, to evaluating all Kritik compositions as well as commenting on and/or adjusting the score for students’ work themselves. For those educators dealing with large grading loads and minimal teaching assistance, this is a decidedly attractive feature.

Kritik Implementation

During the 2021/2022 academic year, Kristen piloted Kritik for DIS-2200/WGS-2264 and REL-2507 during Fall 2021 term, for DIS- 2200/WGS-2264 again in the Winter 2022 term, and once more for the latter course in the condensed Spring 2022 term; and I piloted Kritik in 69:161 and 69:473 during Fall 2021 term as well as 69:161 again in the Winter 2022 term.

Both Kristen and I had some lead time to familiarize ourselves with the platform. We each worked closely with Kritik’s instructional designers and technical-support people to navigate Kritik’s range of features and to become familiar with the processes involved in using Kritik from both the faculty and student perspectives. Despite this support, and although we had prior experience with peer evaluation as well as a significant degree of confidence with design/development of grading matrices, we both encountered steep learning curves. In saying this, it is important to acknowledge that Kritik’s support team were indispensable supports in our onboarding including platform set-up and initial use.

Kristen opted to use Kritik in REL-2507 for ‘two and a half ’ of the written assignments. Specially, the initial draft (but not final paper) of a visual-art analysis activity, the final version of the course’s media analysis and film analysis assignments. Each assignment component required students to apply their course-derived knowledge to analyze, respectively, a visual image, a media story, and a documentary film. In her first term of using Kritik in DIS-2200/WGS-2264, Kristen chose to use Kritik for most of the written assignments (weekly response papers, plus two film analyses). After receiving mixed student reviews, adjustments (described below) were made to Kritik use in subsequent terms.

In both 69:161 sections of my course, students completed five Kritik based learning activities designed to increase writing proficiency. Two weeks completion time was allocated to each of the five activities, with six days to create the composition, five days for the peer evaluation and three days for the feedback stages. A different rubric accompanied each of the five Kritik based activities. 69.474 involved short essay compositions to address a different philosophical question for each of five Kritik based activities. The same time parameters used for 69:161, outlined above, were used for this course but all Kritik based activities had the same corresponding rubric.

Kristen and I made a point of soliciting frequent feedback from students about their experiences with Kritik. We both expressed an interest in receiving feedback in several asynchronous lecture videos and distributed reminders in our weekly email updates to students. Ultimately, it was the time spent during synchronous online class inviting students to discuss and share concerns about Kritik that we found to be most productive.

Pedagogical Issues/Concerns

One of my reasons for deciding to use Kritik was its assurance of student anonymity throughout the peer evaluation process. Following completion of the first Kritik activity in 69.474, I received notification from several students that viewing the document ‘properties’ of uploaded Microsoft Word files permitted identification of the students for whom they were completing peer evaluations. After notifying Kritik technical support of this issue, I was advised that use of third party, Microsoft Word was the issue; that anonymity could only be assured by a copy and paste of student compositions directly into the Kritik application text box. I was also advised that disabling the file type submission option would prevent Word file uploads and ensure that students could only submit a composition via the copy/paste feature.

However, this copy/paste option was not without issue. None of the original formatting was retained after composition copy/paste. Those compositions that were not edited following copy/paste were difficult for peers to evaluate. Specifically, students shared difficulties with determining where paragraph breaks should be. Ultimately students disclosed their frustration with the additional time and focus required to complete an accurate peer review, when formatting was askew. Therefore, prior to third 69:474 assignment commencement, I advised all students of the necessity to pay particular attention to their composition formatting, and the need to edit submissions, after copy/ paste completion within the Kritik application textbox.

In both my 69:161 Fall and Winter term offerings, following completion of the initial assignment, several students shared their lack of understanding that assignment completion involved participation in the three Kritik stages, others indicated they did not realize that they needed to evaluate all peer compositions assigned to them and many disclosed their duress with the requirement of learning a new platform in a very short time while being concurrently required to complete an assignment for marks.

In both 69:161 sections, 10 of 35 and five of 26 students respectively did not complete the first two Kritik activity compositions by the due date/time. Acceptance of late submissions affects the assignment of completed compositions for peer review, and I believed it unfair for those students who completed their peer evaluation in a timely manner to be assigned late composition(s) to evaluate. Therefore, I made the decision not to permit late composition submissions. Students were notified of this decision from the outset of course commencement. However, in circumstances where students notified me early of their failure to complete the assignment by due date/time, I did allow these students to proceed with completing the peer review and evaluation stages. In these instances, I assigned partial marks that reflected the effort each student had invested during completion of these last two Kritik stages.

All students in both 69:161 sections and 69:474 were assigned five peer compositions to evaluate. While reviewing the first activity compositions and corresponding peer evaluations, I noted significant variation in peer evaluation scores assigned by the 69:474 students. Specifically, 10 of 36 peers had assigned full marks for many if not all rubric criteria, while other peers who had been assigned the same student compositions to evaluate, had allocated less than half mark for the same rubric criteria. Upon further examination, I noted the peer evaluations with less than full marks assigned were closely aligned with my evaluations. To ensure that use of Kritik was accurate and therefore credible, I adjusted the composition scores for students who had received inaccurate peer evaluation  scores  and  reduced the evaluation scores of the students who completed inaccurate evaluations. All students involved were  apprised  of  my  reasons  for over-riding the previously assigned scores and in particular the students who had completed inaccurate evaluations were informed of the action required by them to ensure that I did not have to over-ride scores again.

One of Kristen’s concerns, as a Disability Studies instructor and self-identified disabled person, was whether the inflexible deadlines within Kritik would create an accessibility issue for some students, including those with formal accommodations around time allowances for completing assignments, and those who encountered unexpected illnesses or personal/family circumstances. Outside of Kritik, Kristen has maintained a flexible policy of granting extensions on most assignments, especially if requested in advance. Somewhat surprisingly, despite having more than 100 students in the three courses combined, accessibility rarely became an issue. While not obvious to students, work could still be submitted late (with the instructor’s approval) via Kritik’s on-line help/support chat feature. If the work was uploaded before the deadline for the ‘evaluation’ stage, there was a good chance of its distribution for peer-assessment to those students who have left their ‘evaluate’ tasks until closer to that phase’s due date/time. Even papers uploaded too late to be peer evaluated can be assessed within Kritik by the instructor.

For the most recent offering of DIS-2200/WGS-2264, Kristen experimented with allowing late submissions automatically. In this case, Kritik requires students to provide an explanation for the delay in their submissions, and then allows the instructor to accept or reject the paper. In a class of approximately 40 students, this typically resulted in only one or two late submissions for a given activity, with improved odds of ‘slightly’ late papers being distributed to peers for evaluation because of the lack of a need to obtain pre-approval and Kritik’s assistance to upload late work.

Partway through each section of DIS-2200/WGS-2264, during discussions with students about Kritik, some of Kristen’s strongest students expressed misgivings about  having  their  work  assessed by peers, and their inability to score ‘perfect’ marks, given the way Kritik’s algorithm calculates overall activity marks. A few students showed interest in receiving  more  ungraded,  early  term  training in assessing peers’ work accurately in Kritik. Some students also expressed concerns that their peers were marking too harshly. During one conversation, some students disclosed the belief that because one of the metrics during the evaluation stage asked them to rate how ‘critical’ aspects of the peer evaluation were, some believed they needed to “find faults” in the peer evaluations. Kritik’s use of the term “critical” refers to how helpful and actionable the peer evaluation was for students [4]. This misinterpretation of the term “critical” was addressed during asynchronous online class and by email.

Kritik’s ‘grade dispute’ function permits students to notify the course instructor of any peer evaluation concerns. Such ‘disputing’ promotes more focused checking by the course instructor of student work with dispute resolution accomplished by the instructor prior   to finalizing activity grades. Repeatedly encouraging all students to use Kritik’s ‘grade dispute’ function to flag any concerns about peer evaluations or make comments for the instructor on a specific paper also reduced in-class complaints about inaccurate grading. Both Kristen and I think that the presence of this function builds students’ trust. For example, if students think their peers’ evaluations are too low, upon notification of a grade dispute, the instructor or TA can focus in on the issue to reassess, and perhaps regrade, the work. In response to concerns over lower-than-expected marks by midterm during her first term using Kritik, Kristen emailed her students and requested that they “err on the side of generosity” in their evaluations. This tipped the subsequent marks noticeably upwards, even somewhat beyond what Kristen would have assigned had she evaluated students’ work herself. Revision of rubrics in subsequent terms was helpful in preventing inappropriately low averages.

Also worrisome were the views, expressed by several students in the Fall DIS-2200/WGS-2264-section course evaluations that use of Kritik reflected “laziness” on the part of the instructor; that because the instructor’s spot-checking papers was not visible to students unless marks were changed, or additional comments left, students perceived they were doing this work with no oversight. These concerns were addressed through changes made in implementing Kritik in the following winter and spring-term sections of the same course, with both a reduction in the number of course assignments for which Kritik was used, and instructor comments left on all spot-checked papers; a process that involved approximately a third of submitted papers each week, while recording which papers had been checked in any given week.

Pedagogical Lessons Learned

My lessons learned include the necessity to include both a Kritik orientation for students and a strategy to promote student anonymity, as well as provision of clear expectations about the scoring and commentary required of peers during the  evaluation  stage.  I  did not anticipate the need for providing an orientation to Kritik at the beginning of my courses. Based on student concerns and my acquired insight into the difficulties associated with lack of familiarity with the Kritik platform, I believe that during the first week of coursework all students should participate in a mandatory orientation to Kritik that includes completion of a mock Kritik peer review assignment with no marks assigned.

Anonymity cannot be assured if students upload a composition, completed in a format such as MS Word, to Kritik. To ensure that anonymity is maintained throughout the  course,  all  compositions must be uploaded to the Kritik application text box and the file type submission option disabled by course instructor. Students need to be advised of the requirement to edit composition(s) after upload to ensure assignments are formatted appropriately in advance of peer evaluation.

Some peers failed to exercise due diligence when evaluating composition(s) and instead assigned inaccurate score(s). To ensure accurate assignment of scores, it is crucial that a timely and thorough review be conducted of all peer evaluation commentary and score(s) assigned, particularly when significant variation exists among the assigned peer evaluation scores. In circumstances of inaccurate score(s) allocation, fairness in grading is assured by adjustment of Kritik assigned scores for both student who completed the composition and the peer who conducted the inaccurate evaluation.

Kristen’s experiences also led to several conclusions about how to better implement Kritik. Having every written assignment for a course submitted and assessed via Kritik was not a popular option with students; maintaining at least one major activity as instructor-graded seems to have satisfied students who were concerned over the degree of instructor involvement in the process. Regular spot-checking with at least brief comments acknowledging an instructor’s or TA’s reading of the work has also made a significant difference with students’ expressions of dissatisfaction. Instructor visibility and responsiveness to disputes, combined with reassurance and proactive training and support of students in the use of the platform, are perhaps the leading factors noted by Kristen in improving students’ receptiveness to the use of Kritik.

Kristen is of the opinion that there are also some learning activities for which Kritik simply does not work very well. Specifically, for activities such as the REL-2507 film analysis that involves a set of common questions for each student on the same media, peer evaluation resulted in additional frustration. Students experienced less variety and more repetition in the materials they were required to assess, while offering less ‘reward’ in terms of exposure to different perspectives and ideas. It is also very challenging to design an effective rubric for assessing multiple questions effectively within the context of an individual activity, since only one rubric per activity may be used, and any marks assigned apply to the entire submission.

Although instructors have the option to adapt one of Kritik’s rubric templates, for those instructors who decide to design their own, a significant degree of effort is required to design an effective rubric. Students, most of whom will be new to doing rubric-based assessment themselves, require a rubric that is clear, minimally complex, explains the specifics that students should use to determine assignment of scores for each criterion and an explanation of how peer evaluation scores align with the course grading scale. Since the rubric also needs to guide students on how to evaluate solid-but-not-exceptional papers, determining whether a composition that addresses all required criteria quite well should be assigned full marks, or not, is also important. Investing additional effort into this stage translates into more-accurate marks, less frustration, and complaints among peer evaluators, as well as less revisions to peer scoring by the instructor.

One area that remains a concern when using Kritik is identifying plagiarism. Despite being encouraged to contact us in situations where peer evaluators suspected plagiarism or other forms of academic dishonesty, no students did so. In contrast, spot-checking by both of us did reveal some instances of plagiarism.

Kritik representatives have shared plans for integration with the plagiarism-detection software such as Turnitin which may be of use for some courses. However, as is the case for traditional assessment methods, the easy availability of new automatic ‘paraphrasing’ applications to circumvent automated detection systems, is still a concern. Ultimately, diligent spot-checking by the instructor seems  to be the most-effective way to monitor, detect, and correct academic integrity issues.

Use of Kritik in the Future

Based on our experiences thus far and with consideration of our lessons learned, both Kristen and I have decided to incorporate the use of Kritik into our upcoming courses. It is noteworthy to share that our decision to use the platform will cost students a fee ranging from $18.00 to $24.00 Canadian per term. The lower fee is associated with adoption of Kritik by multiple faculty members at the same learning institution. Given we both concur that peer evaluation is a beneficial pedagogical approach to learning and instruction and that our experiences with Kritik have for the most part been positive, we believe adoption of Kritik for use in our courses will be money well spent.

References

  1. Merriam G, Merriam C, Webster N (2005) Merriam-Webster’s Collegiate Dictionary (11th ) Springfield, MA: Merriam-Webster.
  2. Liu NF, Carless D (2006) Peer feedback: the learning element of peer Teaching in Higher education 11: 279-290.
  3. Parboteeah S, Anwar M (2009) Thematic analysis of written assignment feedback: Implications for nurse Nurse Education Today 29: 753-757. [crossref]
  4. Marette C (2022) V1_Kritk Product Breakdown.

Monthly Fluctuation of Spike Protein-specific IgG Antibody Level against COVID-19 after COVID-19 Vaccination and Booster Shot

DOI: 10.31038/IJNM.2022331

Abstract

We investigated the spike protein-specific IgG antibody levels against COVID-19 in a 64-year-old male medical staff periodically after two doses of COVID-19 vaccination and a third booster shot during a one-year period. The antibody levels increased after the two doses vaccination; however, it rapidly decreased in the first 3 months. The antibody levels increased again after the third booster vaccination. The antibody levels were remarkably higher than that after the two doses of vaccination and remained high for several months. We demonstrated that the third booster shot was significant in maintaining a high level of immunity against COVID-19.

Keywords

COVID-19, Vaccine, Antibody, Spike protein, Booster

Introduction

The COVID-19 pandemic [1], which began in early 2020, affected the examination and treatment of patients in hospitals, healthcare, and nursing care facilities in various ways. Vaccination for COVID-19 [2-4] initially started in the United Kingdom in December 2020 and subsequently started in Japan in February 2021, which has been effective in preventing the onset and reducing the severity of the disease [5-7] owing to its high immune induction potency [8]. However, some cases of breakthrough infections have been reported [9-11], and it has been pointed out that one of the causes is a decrease in the levels of antibodies against the disease over time [12]. However, booster vaccination has been shown to be effective in preventing the onset of the disease and reducing the risk of severe disease [13-15]. Therefore, we consider it meaningful to assess COVID-19 antibody levels periodically after vaccination and booster shots to prevent such infections. We measured the antibody levels of our medical staff against COVID-19 monthly after COVID-19 vaccination and examined changes in antibody levels after administration of additional vaccination during a one-year period.

Materials and Methods

Subjects

The subject was a 64-year-old male medical staff of our corporation who received the COVID-19 vaccine by Pfizer-BioNTech twice and received an additional vaccine dose by Moderna eight months after the second vaccine dose and was administered COVID-19 antibody testing monthly for a year.

Ethical Principles

The present study was conducted in accordance with the Declaration of Helsinki, and the Seikokai Group Ethics Committee approved the study protocol. Informed consent was obtained from the staff.

Methods

The staff member received two doses of the COVID-19 vaccine by Pfizer-BioNTech between 10 June and 1 July 2021 and was subsequently administered COVID-19 antibody testing over time. Following that, he received an additional booster COVID-19 vaccine by Moderna on 21 February 2022 and was subsequently administered COVID-19 antibody testing over time. Antibody levels were measured monthly: one month after the completion of the second vaccination [16], two months after the second vaccination, and three months after the second vaccination. Subsequently, the fourth, fifth, and sixth measurements were performed every one month. An additional vaccine dose was administered eight months after the second vaccination. The seventh antibody level was measured one month after the additional vaccine dose, and the eighth, ninth, and tenth measurements were performed every one month, respectively. In total, the fluctuation of antibody levels was monitored for a year. Antibody levels were measured by quantification of spike protein-specific IgG antibodies, which have neutralizing activity against the receptor-binding domain of the virus. Abbott SARS-CoV-2 IgG (Abbott Japan, Minato-ku, Tokyo, Japan; cutoff value: 50 AU/mL) was used to perform this measurement.

Results

The time course of the antibody levels after two doses of the vaccine for the first 6 months is shown in Figure 1. The antibody level at one month after the second vaccine dose was 3,337 AU/mL, but that at the next month was 1,510 AU/mL, which is a decrease of 55%. The antibody level at three months after the vaccination was 749 AU/mL, a 78% decrease from that at the first measurement. Antibody levels at 4, 5, and 6 months after treatment were 455, 287, and 245 AU/mL, respectively. The decline in antibody levels was relatively slow compared with that in the first three months (Figure 1: arrows). The time course of the antibody levels from six months to 12 months after two doses of the vaccine is shown in Figure 2. After the administration of booster vaccine dose, the antibody level was remarkably increased to 22,900 AU/mL (at 9 months) and declined to 17,100 AU/mL (at 10 months), 12,900 AU/mL (at 11 months), and 7,990 AU/ml (at 12 months). However, the antibody level after the additional vaccine dose was relatively higher than that after the second dose. The total course of vaccination and antibody levels for a year period are shown in Figure 3.

fig 1

Figure 1: Time course of the antibody levels for six months after administration of a second vaccine dose

fig 2

Figure 2: Changes in the antibody levels after administered an additional vaccine dose

fig 3

Figure 3: Total time course of vaccine doses and antibody tests for a-year period

Discussion

How antibody levels change after COVID-19 vaccine dose is now a matter of concern not only for healthcare professionals but also for the general population. In this study, we evaluated the antibody levels of our medical staff following vaccination and booster shot for COVID-19 every month during a one-year period. After two doses of the vaccine, the antibody level at three months decreased by 78% from baseline and at six months, decreased by 93% from baseline. This result indicates that the degree of decrease in antibody levels in the first three months was higher than that in the second three months, and the current results support our previous study [17]. We also demonstrated that after the administration of the booster shot, the antibody levels were remarkably increased and significantly higher than that after the second vaccine dose (Figure 3). Notably, the antibody levels remained high even after several months of the booster shot. Our current data also showed similar results to those of the previous studies [18-21]. It has been thought that the vaccinations increased at the same time as the outbreak of the delta strain that began in May last year from India [22-24], contributing to the convergence [25] of COVID-19 worldwide; however, the subsequent decrease in antibody levels may have contributed to the new omicron strain outbreak. However, the administration of additional doses of the vaccine is considered a significant countermeasure against COVID-19 because it was shown that the antibody levels against the disease increased again after the additional doses and that the severity and mortality rate from COVID-19 were reduced by the additional vaccine doses [26,27]. This remarkable increase in antibody levels after the additional vaccine dose may also contribute to the convergence of the omicron strain. We believe that the current data may help infection measures against COVID-19 for doctor, nurse, and other medical staff.

Study Limitations

The serum sample was obtained from one medical staff, and a large-sample investigation is needed to confirm our current study.

Conclusion

We measured the antibody levels of our medical staff over time after COVID-19 vaccination and examined changes in antibody levels after the administration of the booster vaccination for a year. Although the antibody levels declined with time after vaccination, we showed that the antibody levels significantly increased again after booster vaccination and remained high for several months.

Acknowledgment

The authors deeply indebted Saeki Ishiwata for providing serum samples and technical assistance for this research. The authors also thank to Bio Medical Laboratories Incorporated (BML, Inc.) for valuable support.

The preliminary data of this study was presented at a 4th European Congress on Infectious Diseases via live on 11 November 2022 at Paris, France, and on demand web streaming.

Funding

The authors declare that they have nothing to disclose regarding funding.

Conflict of Interest

The authors state that they have no conflict of interest to declare.

Author Contributions

Ikuma Kasuga conceived the work and designed the study protocol. Yuko Ishii contributed to the data curation and laboratory analysis. Yoshimi Yokoe and Osamu Ohtsubo supervised the project. Ikuma Kasuga contributed to the writing of the original draft, and all authors contributed to the revision of the manuscript and approved the final manuscript version.

References

  1. Gao Z, Xu Y, Sun C, Wang X, Guo Y, et al. (2021) A systematic review of asymptomatic infections with COVID-19. J Microbiol Immunol Infect 54: 12-16. [crossref]
  2. Mulligan MJ, Lyke KE, Kitchin N, Absalon J, Gurtman A, et al. (2020) Phase I/II study of COVID-19 RNA vaccine BNT162b1 in adults. Nature 586: 589-593. [crossref]
  3. Kim JH, Marks F, Clemens JD. Looking beyond COVID-19 vaccine phase 3 trials. (2021) Nat Med 27: 205-211.
  4. Lazarus JV, Ratzan SC, Palayew A, Gostin LO, Larson HJ, et al. (2021) A global survey of potential acceptance of a COVID-19 vaccine. Nat Med 27: 225-228. [crossref]
  5. Keech C, Albert G, Cho I, Robertson A, Reed P, et al. (2020) Phase 1-2 trial of a SARS-CoV-2 recombinant spike protein nanoparticle vaccine. N Engl J Med 383: 2320-2332.
  6. Polack FP, Thomas SJ, Kitchin N, Absalon J, Gurtman A, et al. (2020) Safety and efficacy of the BNT162b2 mRNA Covid-19 vaccine. N Engl J Med 383: 2603-2615. [crossref]
  7. Baden LR, El Sahly HM, Essink B, Kotloff K, Frey S, et al. (2021) Efficacy and safety of the mRNA-1273 SARS-CoV-2 vaccine. N Engl J Med 384: 403-416.
  8. Wang Z, Schmidt F, Weisblum Y, Muecksch F, Barnes CO, et al. (2021) mRNA vaccine-elicited antibodies to SARS-CoV-2 and circulating variants. Nature 592: 616-622.
  9. Callaway E (2021) Could new COVID variants undermine vaccines? Labs scramble to find out. Nature 589: 177-178.
  10. Gupta RK, Topol EJ (2021) COVID-19 vaccine breakthrough infections. Science 374: 1561-1562.
  11. Hacisuleyman E, Hale C, Saito Y, Blachere NE, Bergh M, et al. (2021) Vaccine breakthrough infections with SARS-CoV-2 variants. N Engl J Med 384: 2212-2218. [crossref]
  12. Khoury J, Najjar-Debbiny R, Hanna A, Jabbour A, Ahmad YA, et al. (2021) COVID-19 vaccine – Long term immune decline and breakthrough infections. Vaccine 39: 6984-6989. [crossref]
  13. Bar-On YM, Goldberg Y, Mandel M, Bodenheimer O, Freedman L, et al. (2021) Protection of BNT162b2 vaccine booster against Covid-19 in Israel. N Engl J Med 385: 1393-1400.
  14. Accorsi EK, Britton A, Fleming-Dutra KE, Smith ZR, Shang N, et al. (2022) Association between 3 doses of mRNA COVID-19 vaccine and symptomatic infection caused by the SARS-CoV-2 Omicron and Delta variants. JAMA 327: 639-651. [crossref]
  15. Garcia-Beltran WF, St Denis KJ, Hoelzemer A, Lam EC, Nitido AD, et al. (2022) mRNA-based COVID-19 vaccine boosters induce neutralizing immunity against SARS-CoV-2 Omicron variant. Cell 185: 457-466. [crossref]
  16. Zhou W, Xu X, Chang Z, Wang H, Zhong X, et al. (2021) The dynamic changes of serum IgM and IgG against SARS-CoV-2 in patients with COVID-19. J Med Virol 93: 924-933. [crossref]
  17. Kasuga I, Gamo S, Yokoe Y, Sugiyama T, Tokura M, et al. (2022) Antibody levels over time against novel coronavirus and incidence of adverse reaction after vaccination. Health Evaluation and Promotion 49: 462-469.
  18. Belik M, Jalkanen P, Lundberg R, Reinholm A, Laine L, et al. (2022) Comparative analysis of COVID-19 vaccine responses and third booster dose-induced neutralizing antibodies against Delta and Omicron variants. Nat Commun 13.
  19. Zeng G, Wu Q, Pan H, Li M, Yang J, et al. (2022) Immunogenicity and safety of a third dose of CoronaVac, and immune persistence of a two-dose schedule, in healthy adults: interim results from two single-centre, double-blind, randomized, placebo-controlled phase 2 clinical trials. Lancet Infect Dis 22: 483-495. [crossref]
  20. Petrelli F, Luciani A, Borgonovo K, Ghilardi M, Parati MC, et al. (2022) Third dose of SARS-CoV-2 vaccine: A systemic review of 30 published studies. J Med Virol 94: 2837-2844. [crossref]
  21. Muik A, Lui BG, Wallisch A-K, Bacher M, Mühl J, et al. (2022) Neutralization of SARS-CoV-2 Omicron by BNT162b2 mRNA vaccine-elicited human sera. Science 375: 678-680. [crossref]
  22. Vaidyanathan G (2021) Coronavirus variants are spreading in India – what scientists know so far. Nature 593: 321-322. [crossref]
  23. Callaway E (2021) Delta coronavirus variant: scientists brace for impact. Nature 595: 17-18. [crossref]
  24. Planas D, Veyer D, Baidaliuk A, Staropoli I, Guivel-Benhassine F, et al. (2021) Reduced sensitivity of SARS-CoV-2 variant Delta to antibody neutralization. Nature 596: 276-280.
  25. Bernal JL, Andrews N, Gower C, Gallagher E, Simmons R, et al. (2021) Effectiveness of Covid-19 vaccines against the B.1.617.2 (Delta) variant. N Engl J Med 385: 585-594. [crossref]
  26. Barda N, Dagan N, Cohen C, Hernán MA, Lipsitch M, et al. (2021) Effectiveness of a third dose of the BNT162b2 mRNA COVID-19 vaccine for preventing severe outcomes in Israel: an observational study. Lancet 398: 2093-2100.
  27. Arbel R, Hammerman A, Sergienko R, Friger M, Peretz A, et al. (2021) BNT162b2 vaccine booster and mortality due to Covid-19. N Engl J Med 385: 2413-2420. [crossref]

Demographic and Clinicopathological Evaluation of Colorectal Adenocarcinoma in Bangladesh at a Tertiary Level Hospital

DOI: 10.31038/CST.2023811

Abstract

Background and aim: Colorectal Cancer (CRC) is the third leading cause of global cancer death in humans and its incidence is gradually rising in developing nations including Bangladesh. The study was carried out to unveil the demographic and clinicopathological profile of CRC cases in Bangladeshi patients.

Methods: A cross-sectional study was conducted among purposively selected 50 patients irrespective of age and sex with histologically proven colorectal cancer at a tertiary level hospital for a period of 2 years. Large bowel resection specimens of CRC made the samples. Demographic and clinical information were recorded in a pre-tested, structured case record. Relevant macroscopic and microscopic features of tumors were recorded during gross and microscopic examinations of the specimen.

Results: Mean age of the CRC patients was 48.60±14.6 years. Adult active males (35-54 years old) were significantly affected by CRCs (p=0.0001). Per rectal bleeding (38.7%) and generalized weakness and pallor (38.98%) were the most frequent findings in distal and proximal CRCs, respectively. Adenocarcinoma NOS was the most commonly observed histologic type. Occurrence of CRC and tumour grades were significantly (p=0.0001) related where Grade-II and Grade-III tumour occurred in 72% and 24% of cases, respectively. Majority of the cases were presented at stage pT3 (68%) and pN0 (48%). Tumors in adult active age showed a higher tendency to be presented at advanced stages.

Conclusions: Bangladeshi adult active males of 35-54 years old were predominantly affected by a locally advanced stage of CRC. Routine screening programs are proposed for early detection and treatment of the cases.

Keywords

Colon cancer; Bangladeshi patients; Clinical features; Demographic characteristics; Intestinal tumor

Introduction

Colorectal cancer is one of the most common cancers globally. It is the second most common malignancy among women and the third most common malignancy in men [1]. The global burden of colorectal cancer is expected to increase by 60% by 2030. Its incidence shows a 10-fold variation across the world [2]. The prevalence of colorectal cancer is lower in Asia than in Western countries. But the incidence has been alarmingly increasing in countries of the Asia-Pacific region during the last two decades due to the westernization of lifestyles [3]. In Bangladesh, 5-year prevalence of colon and rectal cancer are 3.28 and 3.1 per 100,000 population, respectively [4]. There are variations in risk factors, mode of disease presentation, sub-site distribution, tumor morphology, grade and stage at presentation. These tumors grow insidiously and remain undetected for long periods remaining potentially curable, premalignant lesions over several years. Therefore, screening procedures provide a unique opportunity for cancer prevention [5]. However, in the long run, the tumor cells metastasize to lymph nodes and in the other organs. The treatment, prognosis and survival rate largely depend on the stage of disease at diagnosis.

The development of both familial and sporadic colorectal cancers can be influenced by genetic factors [6]. Age is another major risk factor for sporadic CRC. The diagnosis is rare before the age of 40 years. The incidence starts to increase significantly between 40 to 50 years and the age-specific incidence rates raise in each succeeding decade thereafter [7]. Although patients over 50 years of age represent 90% of newly diagnosed cases [8], the trend is changing with the increasing incidence among the younger population who present in a more advanced stage [9]. In recent years, tumor location has also been suggested to be a valuable predictor, which has added to the difficulty of discussing its clinicopathological features and outcomes [10]. The majority of colorectal cancers belong to classical adenocarcinomas, with several histological variants associated with specific molecular characteristics  [11,12].  Understanding  these   features   could  guide the proper management and prognosis of the patient. But unfortunately, there is a scarcity of data regarding the demographic and clinicopathological patterns of colorectal cancers in Bangladeshi patients. Therefore, the present study was undertaken to understand the demographic and clinicopathological profiles of patients with colorectal carcinoma in Bangladesh.

Methods

Ethical Approval

This study was approved by the local Ethics Committee (Institutional Review Board) at Bangabandhu Sheikh Mujib Medical University (BSMMU) and informed consent was obtained from all participants.

Study Design, Period and Sample

This cross-sectional, descriptive, hospital based, study was conducted in the Department of Pathology, Bangabandhu Sheikh Mujib Medical University (BSMMU), Dhaka, Bangladesh during  the period of March 2019 to February 2021. Large bowel resection specimen histologically diagnosed as adenocarcinoma at the department of Pathology, BSMMU were included in this study. A total of 50 primary colorectal carcinoma cases irrespective of ages and sexes were included in the study. Clinically suspected colorectal carcinoma subsequently proved to be non-epithelial tumors of the colon were excluded from this study. Patients’ attendants were interviewed for demographic and clinical information, which were recorded in a performed questionnaire.

Gross and Microscopic Evaluation of Samples

During gross examination tumor site and macroscopic features of tumors were noted. Splenic flexure was taken as demarcating point of proximal and distal lesions. After that representative tissue blocks were submitted for routine processing and paraffin embedding. Standard protocol was maintained during tissue processing and staining. Microscopic examination of tissue sections stained with hematoxylin and eosin was carried out and relevant points were recorded. The tumors were classified following World Health Organization classification of tumor and grading of tumor was done by using AJCC specified four-tiered grading system. Staging was performed following TNM Classification of Colorectal Carcinoma American Joint Committee on Cancer (AJCC).

Statistical Analysis

Data was entered in MS Excel and analyzed by using SPSS software version 21. Categorical variables were expressed as percentages and analyzed using the Chi-square test or Fisher’s exact test. Continuous variables were expressed as mean or median and analyzed using the Mann-Whitney test. Demographic factors and clinical characteristics were summarized with percentages for categorical variables and median for continuous variables.

Results

A total of 50 patients with CRC were enrolled in this study. Age of the study population varied from 19-85 years with a mean of 48.60±14.6 (SD) years. All the 50 cases were categorized into four age groups where samples from patients belonging to 15-34 years, 35-54 years, 55-74 years and 75-94 years were considered as young, adult, elderly and old age groups, respectively. Figure 1 illustrates the distribution of CRC cases in different age groups.

fig 1

Figure 1: Distribution of CRC cases in different age groups of Bangladeshi patients

As shown in Figure 1; half (50%) of the CRC cases belonged to adult active age group (35-54 years), followed by 28% cases in elderly (55-74 years), 18% cases in young (15-34 years) and 4% cases in  old age group (75-94 years). A chi-square test of independence was performed to examine the relationship  between  age  groups  and  the frequency of occurrence of CRCs. The relation between these variables was significant, X2 (3, N=50)=22.48, p=.0001 at α=0.05. The adult active age group (35-54 years) was more likely to be affected by colorectal carcinoma than the other groups.

Sex-wise distribution of CRC cases of this study revealed that almost two-thirds (64%) of the study cases were male while around one-third (36%) cases were female. The occurrence of male cases was numerically high in all age groups except the old age where the percentage of both cases was equal (Figure 2). The relation between the occurrence of CRS and sexes was weakly significant, [X2 (1, N=50)=3.92, p=.048 at α=0.05]. Males were more likely to be affected by colorectal carcinoma than females (Figure 2).

fig 2

Figure 2: Sex-wise distribution of CRC cases in different age groups of Bangladeshi patients

Per rectal bleeding was the most frequent clinical presentation  of CRC among the study population that was documented in 30% of cases followed by generalized weakness and pallor (26%), abdominal pain with or without features of obstruction (16%), altered bowel habit (12%), weight loss (12%) and abdominal mass (4%). Only one study case had a positive family history of colon cancer. None of the cases was presented with a history of extra-colonic malignancy. When the site of occurrence was considered, the tumor was located in the distal colon and proximal colon in 62% and 36% of cases, respectively. Only one (2%) of cases were recorded to have synchronous tumors involving both colons. However, no signification relation was observed between the tumor sites and the occurrence of CRC [X2 (1, N=50)=2.880, p=.090 at α=0.05]. The distribution of study cases based on tumor location along with presenting complaints is shown in Table 1.

Table 1: Distribution of study cases based on tumor location along with presenting complaints

ta 1

P/R Bld: Per rectal bleeding; Ab Pain: Abdominal pain; Alt bowl: Altered bowel habit; Wt loss: Weight loss; Ab mass: Abdominal mass; Gw & pal: Generalized weakness and pallor; Cc: Cecum; Asd. col: Ascending colon; Trns col: Transverse colon; Dsd col: Descending colon; Sg col: Sigmoid colon; Rec junc: Rectosigmoid junction; Rec: Rectum: Asd. col. & rec.: Ascending colon & rectum (synchronous)

The exophytic pattern was the most common gross morphology which was observed in more than half (60%) of the cases, followed by ulcerating and infiltrative patterns, seen in 30% and 10% of the cases, respectively. In our study, the frequency of the Exophytic pattern was significantly higher than the other two patterns based on the chi- square test of independence, [X2 (2, N=50)=19.00, p=.0001 at α=0.05] indicating that Exophytic pattern was more likely to occur in CRC cases (Table 2).

Table 2: Distribution of study cases based on tumor morphologies

ta 2


In this study, only two variants of adenocarcinoma were observed; the commonest one being adenocarcinoma (NOS) (76%) followed by  mucinous  adenocarcinomas  (24%).  The  frequency  of adenocarcinoma (NOS) in relation to CRC cases was highly significant [X2 (1, N=50)=13.52, p=.0001 at α=0.05] compared to mucinous adenocarcinoma. It seemed that adenocarcinoma (NOS) was the more frequent variant of CRC in Bangladeshi patients  (Table 2). Among the 50 selected cases, majority (72%) of the tumours belonged to grade II (moderately differentiated) tumors. Remaining 24% and 4% cases were categorized as grade III (poorly differentiated) and grade I (well differentiated) tumors, respectively. There was a highly significant relation between the occurrence of CRC the and grade of tumours [X2 (2, N=50)=36.640, p=0.000 at α=0.05]. However, no significant relationship was seen between the tumour grades and age groups [X2 (6, N=50)=2.702, p=0.845 at α=0.05] or sex [X2 (2, N=50)=1.292, p=0.524 at α=0.05]. It seemed that Grade-II CRCs were more likely to occur in case of colorectal carcinoma in Bangladeshi patients irrespective of age and sex. Figure 3 illustrates the graphical presentation of grades of tumours according to age groups and sexes whereas Table 3 summarizes the frequency of tumours according to grades, age groups and sexes with their relationship.

fig 3

Figure 3: Graphical presentation of grades of CRC cases according to age groups and sexes. Grade-I: well differentiated tumors; Grade-II: moderately differentiated tumours; Grade-III: poorly differentiated tumours.

Table 3: Frequency of tumours according to grades, age groups and sexes with their relationship

ta 3

No.: Number of occurrence; %: Percentage of occurrence;
a: X2 (2, N = 50) = 36.640, p = 0.000 at α = 0.05; b: X2 (6, N = 50) = 2.702, p = 0.845 at α = 0.05; c: X2 (2, N = 50) = 1.292, p = 0.524 at α = 0.05

According to the pathological depth of invasion, studied CRC cases were ranked into 4 stages namely PT-I, PT-II, PT-III and PT- IV starting from lowest to highest invasion. Stage-3 (PT-III) was the most commonly recorded stage of tumour which was seen in 68% of the cases followed by PT-II, PT-IV and PT-I which were recorded in 22%, 8% and 2% cases, respectively. A highly significant relation was observed between the occurrence of CRC and the stage of tumours based on pathological invasion [X2 (2, N=50)=36.640, p=0.000 at α=0.05]. It seemed that PT-III is more likely to occur in Bangladeshi CRC cases. A highly significant relation was also observed between the pathological invasion of tumours and age groups [X2 (6, N=50)=2.702, p=0.845 at α=0.05] where adults are more likely to be affected by Stage-3 (PT-III) CRCs. However, no significant relationship was seen between the tumour stages and sex [X2 (2, N=50)=1.292, p=0.524 at α=0.05]. A graphical presentation of stage of tumours according to age groups and sexes has been depicted in Figure 4 and the summary of the frequency of tumours according to stages, age groups and sexes with their relationship is shown in Table 4.

fig 4

Figure 4: Graphical presentation of stages of tumours according to age groups and sexes. PT-I: low pathological invasion; PT-II: moderate pathological invasion, PT-III: fair pathological invasion; PT-IV: high pathological invasion.

Table 4: Frequency of tumours according to stage of tumor based on the pathological depth of invasion. age groups and sexes with their relationship.

ta 4

PT-I; PT-II; PT-III; PT-IV; No.: Number of occurrence; %: Percentage of occurrence;
a: X2 (2, N = 50) = 36.640, p = 0.000 at α = 0.05; b: X2 (6, N = 50) = 2.702, p = 0.845 at α = 0.05; c: X2 (2, N = 50) = 1.292, p = 0.524 at α = 0.05

Studied CRC cases were further classified based on the involvement of regional lymph nodes by the tumor (PN) where cases with no lymph node involvement was grouped in PN0, metastasis in one to three regional lymph nodes in PN1, metastasis in four or more regional lymph nodes in PN2 and the cases where Lymph nodes could not be assessed was grouped in PNx. Almost half (48%) of the study cases was categorized in PN0 followed by PN2, PN1 and PNx in 26%, 22% and 4% cases, respectively. The involvement of regional lymph nodes was highly related to the occurrence of CRCs [X2 (3, N=50)=19.600, p=0.000 at α=0.05]. It is more likely that regional lymph nodes were not involved in CRC cases. However, no significant relationship was seen between the lymph node invasion and age groups [X2 (9, N=50)=6.915, p=0.646 at α=0.05] or sex [X2 (3, N=50)=2.620, p=0.454 at α=0.05]. Figure 5 illustrates the graphical presentation of different classes of CRC cases based on the involvement of regional lymph nodes according to age groups and sexes whereas Table 5 summarizes the frequency of different classes of CRC cases based on the involvement of regional lymph nodes according to stages, age groups and sexes with their relationship.

fig 5

Figure 5: Graphical presentation of different classes of tumours based on involvement of regional lymph nodes according to age groups and sexes. PNO: no lymph node involvement; PN1: metastasis in one to three regional lymph nodes; PN2: metastasis in four or more regional lymph nodes; PNx: lymph nodes could not be assessed.

Table 5: Frequency of tumours according to involvement of regional lymph nodes by the tumor, age groups and sexes with their relationship

ta 5

N1: ; N2: ; N3: ; N0: ; No.: Number of occurrence; %: Percentage of occurrence;
a: X2 (3, N = 50) = 19.600, p = 0.0001 at α = 0.05; b: X2 (9, N = 50) = 6.915, p = 0.646 at α = 0.05; c: X2 (3, N = 50) = 2.620, p = 0.454 at α = 0.05

Discussion

Although CRC is more likely to occur at old age, nowadays, younger patients are increasingly affected by different types of CRCs [13]. In this study, half (50%) of the cases belonged to the 35-54-years age group, with a mean of 48.60 ± 14.6 years which is lower than that reported age from the Western world [13-15]. Salminen, et al., 2005 recorded 59 years as the mean age of CRC in their study in the Finnish population and Turner, 2014 observed only 20% cases to occur below the age of 50 years [14,15]. However, Saha et al., 2016 and Raza et al., 2016 recorded the mean age as 50.77 years and 47 ± 14.8 years, respectively in Bangladeshi colorectal cancer patients [16,17], which are in good agreement with this study. The occurrence of CRCs specially in relatively young age group may be attributed  to the recent change in food habits of Bangladeshi active-aged people (35-54 years) who have shifted to western diets that ae well documented as a contributor to colon cancer. It has been reported that consumption of red or processed meats is associated with an increased risk of colon cancer [18]. Consumption of high fat containing foods like red or processed meats induces increased bile acids secretion that in turn results in altered microbial composition in gut [19, 20]. Such alternation in microbial community contributes to the production of different metabolites that might influence the development of colon cancer [20]. Moreover, geographical and environmental factors of the study population may have influenced the findings as well. However, the higher incidence of CRCs in the younger age group of Bangladeshi patients in comparison to western studies is alarming. This interesting finding necessitates the importance of cancer screening program and this report may be considered in future studies to evaluate predisposing and genetic factors for CRCs in this region.

In the current study, there was male preponderance (64%) with a male to female ratio 1.8:1. Studies conducted elsewhere also showed higher incidence of CRC among male patients [14,16,17]. Urbanization and changes in lifestyles might have contributed to the transformation in food habit from native to western diets rich in high fat which are known to trigger colon cancer. In association with altered food habit, higher incidence of smoking, alcohol consumption or genetic factors might be responsible for this male predominance.

Clinical presentations are different for proximal and distal CRC. In our study, per rectal bleeding was the most frequent finding (38.7%) in distal CRCs whereas, generalized weakness and pallor were the chief complaints of the patients with CRCs in proximal colon (38.98%). These features are consistent with the findings of reported elsewhere [5].

The most commonly observed location of CRC in this study is distal colon (62%). Rectum was most frequently observed site (28%). Other Bangladeshi studies conducted also found similar findings [17,21,22]. Occurrence of CRC in Bangladeshi population is higher in distal colon due to some unknown etiology which may be related to some genetic factors.

The exophytic pattern was the most common gross morphology observed in 60% cases followed by ulcerating (30%) and infiltrative pattern (10%). In this study, only two histological  types  of colorectal adenocarcinoma: adenocarcinoma (NOS) and mucinous adenocarcinoma were observed. Adenocarcinoma (NOS) comprises the majority (76%) of the total cases. These findings were consistent with the findings of other studies indicating common gross and histopathological feature of CRCs [17,21-23].

Among the 50 cases, 72% cases were Grade II tumours, 24% were Grade III and 4% were Grade I tumours. All of the mucinous adenocarcinoma was considered poorly differentiated (grade III). Several studies suggest that CRCs occuring in younger patients (less than 50 years of age) are less differentiated [24]. In the present study, 34% of Grade-II and 14% of Grade III tumours were observed in 35- 54 years of age whereas 22% Grade-II and 4% Grade III tumours were recorded in 55-74 years of age. Present study findings are in close agreement with previous findings that documented less differentiated CRCs are likely to occur within 50 years of age [23]. However, a statistically significant association between age group and tumor grade was not observed possibly due to a smaller sample size.

We also categorized study cases according to the PT and PN stage of the tumor. Our study revealed that PT3 (68%) and PN0 (48%) were the most commonly reported stages of tumor in CRC cases based on the depth of invasion and lymph node metastasis, respectively. Studies conducted elsewhere reported that colorectal cancers in young patients (<50 years of age) are biologically aggressive and present at advanced stage [9,25]. In our study, PT3 and PT4 stages were recorded in 34% and 6% cases, respectively in 35-54 years age group in comparison to 20% PT3 and 2% PT4 stages in 55-74 years age group. In the case of nodal staging, metastasis in one to three regional lymph nodes (PN1) was observed in 12% of cases in 35-54 years age group which was double of the observed cases (6%) in the 55-74 years age group. Our study findings for pathological invasion and metastasis in lymph nodes in CRC cases clearly support previous study reports that documented biological aggressiveness and advanced stage in colorectal cancers in patients under 50 years of age.  All  these  studies  suggest  that  patients  with colorectal adenocarcinomas usually present with advanced morphology in histopathology.

Conclusion

Present study findings on colon cancer were different from that described in the western countries. Active aged people (35-54 years old) were found to be significantly affected by CRC in our study. In majority of the cases, the tumour presented at a locally advanced stage. Quick urbanization, fast shifting to western food, lack of proper knowledge on CRC might account for some of these differences. Routine screening program is proposed for early detection and treatment of the cases to reduce the burden of morbidity and mortality. Genetic tests should also be carried out to unveil the cause of young age presentation of CRCs. However, this study had its own limitations. The study reflects to the findings of a specific geographical area with a small sample size. Therefore, further studies should be conducted all over the country with a larger sample size for a more comprehensive understanding on demographic and clinicopathological profiles of CRCs in Bangladesh.

Acknowledgements

The authors gratefully acknowledge the logistics and grant support to conduct the research activities from Bangabandhu Sheikh Mujib Medical University (BSMMU), Dhaka, Bangladesh.

Availability of Data and Materials

Raw data, supplemental data and materials are available on request.

Conflict of Interests

The authors declare that they have no conflict of interests in publishing the article.

Ethical Consideration

Written consent from individual patient/representative of patients was obtained for using the samples for research purposes. No personal data/information of patients was shared in public.

Author’s Contributions

SSUM planned, designed and performed the study. She also wrote the manuscript (MS). FB, MMR & AZ helped in planning & designing of the study and developing the research question. PR, TI, USS, UTN, SA and NA helped in data collection and processing. KBMS helped in study design, data screening and performed data analyses, interpretation and MS writing. All authors read and approved the final manuscript.

References

  1. GLOBOCAN 2020: New Global Cancer Data. [Online]; 2020. [crossref]
  2. Arnold M, Sierra MS, Laversanne M, Soerjomataram I, Jemal A, Bray 2017 Global patterns and trends in colorectal cancer incidence and mortality. Gut. 66(4): 683-691. [crossref]
  3. Wong MC, Ding H, Wang J, Chan PS, Huang J (2019) Prevalence and risk factors of colorectal cancer in Intestinal Research 17: 317-329. [crossref]
  4. Global Cancer Observatory. [Online].; 2020.
  5. Turner JR (2014) The Gastrointestinal In: Robbins and Cotran Pathologic Basis of Disease. 9th ed. Elsevier 749-819. [crossref]
  6. Valle L (2014) Valle Genetic predisposition to colorectal  cancer:  where  we  stand and future World Journal of Gastroenterology 20: 9828-9849. [crossref]
  7. Eddy DM. 1990 Screening for colorectal cancer. Annals of Internal Medicine 113: 373-84. [crossref]
  8. Paymaster JC (1964) Cancer and its distribution in India. Cancer 17: 1026-1034. [crossref]
  9. Mohandas M, Desai DC (1999) Epidemiology of digestive tract cancers in India large and small bowel. Indian Journal of Gastroenterology 18: 118-121. [crossref]
  10. Salem ME, Weinberg BA, Xiu J, El-Deiry WS, Hwang JJ, et (2017) Comparative molecular analyses of left-sided colon, right-sided colon, and rectal cancers. Oncotarget 8: 86356-86368. [crossref]
  11. Reynolds IS, Furney SJ, Kay EW, McNamara DA, Prehn JH, et al. (2019) Meta- analysis of the molecular associations of mucinous colorectal British Journal of Surgery. 106: 682-691. [crossref]
  12. Nguyen LH, Goel A, Chung DC (2020) Pathways of colorectal Gastroenterology 158: 291-302. [crossref]
  13. Nelson RL, Dollear T, Freels S, Persky 1997 The relation of age, race, and gender to the subsite location of colorectal carcinoma. Cancer 80: 193-197. [crossref]
  14. Salminen E, Palmu S, Vahlberg T, Roberts PJ, Söderström KO (2005) Increased proliferation activity measured by immunoreactive Ki67 is associated with survival improvement in rectal/recto sigmoid cancer. World Journal Gastroenterology 11: 3245-3249. [crossref]
  15. Turner The Gastrointestinal Tract. In: Kumar V, Abbas AK, Aster JC (2014) Robbins and Cotran Pathologic Basis of Disease. 9th ed. New Delhi: Reed Elsevier India Private Limited 810-814. [crossref]
  16. Saha M, Shil BC, Saha SK, Banik RK, Perveen I, et al. (2016) Study of Clinicopathological Profile of Sporadic Cases of Colorectal Euroasian Journal of Hepato-Gastroenterology 6: 134-136. [crossref]
  17. Raza AM, Kamal M, Begum F, Yusuf MA, Mohammad D, Begum M, et al. 2016 Clinico-demographic Characteristics of Colorectal Carcinoma in Bangladeshi Patients. Journal of Current and Advance Medical Research 3: 22-25. [crossref]
  18. Magalhaes B, Peleteiro B, Lunet N (2012) Dietary patterns and colorectal cancer: systematic review and meta-analysis. European Journal of Cancer Prevention 21: 15-23. [crossref]
  19. Islam B, Fukiya S, Hagio M, Fujii N, Ishizuka S, Ooka T, et (2011) Bile acid is a host factor that regulates the composition of the cecal microbiota in rats. Gastroenterology. 141: 1773-81. [crossref]
  20. Yokota A, Fukiya S, Islam KB, Ooka T, Ogura Y (2012) Is bile acid a determinant of the gut microbiota on a high-fat diet?. Gut Microbes 3: 455-459. [crossref]
  21. Rahman MM. Expression pattern of the proliferative marker Ki-67 and status of microsatellite instability in different histomorphological patterns of colorectal carcinoma. MD Thesis, Bangabandhu Sheikh Mujib Medical University (BSMMU), Dhaka, Bangladesh 2014.
  22. Hossain Clinicopathologic study of colorectal adenocarcinoma, MD Thesis, Bangabandhu Sheikh Mujib Medical University (BSMMU), Dhaka, Bangladesh 2014.
  23. Hashmi AA, Ali R, Hussain ZF, FN, Khan EY, Bakar SMA, et al. (2017) Mismatch repair deficiency screening in colorectal carcinoma by a four-antibody immunohistochemical panel in Pakistani population and its correlation with histopathological World Journal of Surgical Oncology 15: 116. [crossref]
  24. Chou CL, Chang SC, Lin TC, Chen WS, Jiang JK, et al. (2011) Differences in clinicopathological characteristics of colorectal cancer between younger and elderly patients: an analysis of 322 patients from a single institution. American Journal of Surgical Pathology 202: 574-582. [crossref]
  25. Mueller M, Schneider MA, Deplazes B, Cabalzar-Wond D, Rickenbacher A, et al. (2021) Colorectal cancer of the young displays distinct features of aggressive tumor biology: A single-center cohort World Journal of Gastrointestinal Surgery 13: 164-175. [crossref]