Author Archives: author

Estimating the Feelings of Prisoners Regarding Hope vs Despair: A Mind Genomics Exploration

DOI: 10.31038/ASMHS.2019322

Abstract

Prisoners are often thought to harbor thoughts about suicide, with sensationalized stories about the despair in prisons touching the hearts of listeners and readers. We explore the degree to which ordinary people, non-prisoners, feel that there is despair versus hope among prisoners. Through experimentally designed vignettes, we describe who the prisoner IS, what the prisoner FACES, what the OTHER PRISONERS are like, and what preparatory efforts are in place regarding RELEASE. Each respondent read a unique set of 24 vignettes, comprising different elements, and for each vignette rated the degree to which the prisoner would be likely to think of committing suicide versus be hopeful. The analysis reveals the specific contribution of each element in the vignette as a driver of projected suicide versus hopes, and the numbers of tenths of second required to ‘process’ the element before making the decision. The study suggests two mind-sets, one focusing on the prisoner, the other focusing on the surrounding, each as a driver of despair, as represented by the phrase ‘contemplates suicide.’

Introduction

The increasing cost of imprisonment, the increasing number of those imprisoned, and the alternative ways of imprisoning people, have created an entire industry of concern about what to do with the prisoner, how to rehabilitate the prisoner, and how to avoid post-release recidivism, or despair-driven suicide. Certainly, the prisoner, upon release, can be considered as a person with one or many ‘black marks, ’ responses by others to his or his misdeeds and punishments. The prospect of a life after prison or a life in prison, one marked with rejection and condemnation by society often leads to severe psychological and social problems. One of these is the possibility of contemplating suicide and then successfully suiciding. The recent literature, both popular and academic, deals with the emotions involved in prison.

The experience of imprisonment is difficult, with detrimental effects on prisoners and their families [1]. The nature of life in prison is particularly noticeable among women whose socialization left them with a lack of voice in the public domain. Female prisoners often referred to their feeling of helpless during their prison experience [2]

Accounts of prison life for males consistently describe a culture of mutual mistrust, fear, aggression and barely submerged violence [3]. Often too, prisoners adapt to this environment by putting on emotional ‘masks’ of masculine bravado hiding their vulnerabilities and deterring the aggression of their peers. Johnson [4] claimed that prisoners’ self-presentations of cool, hard manliness’ often reflect a ‘chronically defensive’ attitude rooted in feelings of moral self-doubt, social rejection and psychic vulnerability. This is a posture against the hurt that imprisonment threatens to expose [5]. Prisoners have a psychological need to re-establish their sense of masculine self-esteem and the need to develop personas to save them from exploitation [3]. De Viggiani [7] emphasized the ‘survival’ functions of prisoners whereas Jewkes [8] emphasized their jostling for positions of power in their depriving environments.

 Interviews with prisoners pointed to the protective functions of emotional self-control to hide fear or hurt which may be interpreted as signs of weakness exposing prisoners to ridicule and exploitation [3]. Prisoners expressed anger, fear, sadness and disgust through facial expressions [9] Emotional control is an internal defense as means of coping. Many prisoners stressed the need to control their emotions in order not avoid ‘cracking’ especially due to events outside the prison over which they had almost no control [3].

Occasional displays of emotion were deemed acceptable if they were the outcome of bereavements or if they related to children (e.g. serious illnesses, custody issues). Yet to unload one’s emotions on a continuing basis was reported to be unwelcome. In the visiting room, prisoners showed warmth and tenderness that were taboo on the landings, closed to visitors. Visits offered the only opportunity to display authentic feelings and to show warmth. Some were visibly upset as their visitors left, or sat in silent contemplation, their stolidity contrasting with the animated tone of a few minutes earlier.

Although there are many studies about the statistics of prisoners and imprisonment, along with interview accounts with prisoners, there is relatively little in the literature about metric studies on the ‘mind’ of the prisoner from the point of view of those who are not prisoners, i.e., studies of one’s empathic feeling toward prisoners. This study examines the perception of the public regarding emotions of prisoners and the extent of empathy understanding, with empathy being the ability to ‘sense the feeling of the other. This paper introduces a new approach to thinking about a topic, namely the study of empathy of normal people towards people who find themselves in a particularly stressful situation. The worlds of literature and song, stories, novels, poems, ballads, are is filled with descriptions of how one person feels about another or a group of others. Science is not, however, at least with descriptions having depth and tonality. This study begins that new course of research effort.

Method

Mind Genomics is an emerging science of the ‘everyday, ’ studying how people make decisions when confront by descriptions of ordinary experience, or at least experiences which could happen to people, experiences with which people are familiar [10, 11] Mind Genomics moves away from the traditional scientific approach of isolating one variable at a time and studying that variables. Rather, the premise of Mind Genomics is that we are continually confronted by compound situations, comprising many aspects. We, ordinary people, seem to have no trouble coping with these compound situations, making a series of decisions, and moving forward. Often, we are not able to articulate the reason WHY we do what we do. Yet, our behavior is rapid, automatic, appearing considered rather than random.

In its world-view and execution, Mind Genomics differs from most conventional research, which pay a great attention to the test stimuli, and may test a very few stimuli, but offer a variety of conclusions and implications from one study. With Mind Genomics, we look at simple, broad brush strokes of different aspects of prison, and do fast, simple research. Our metaphor is to cover ground, to explore, much like a cartographer explores and maps out an area, without paying very close attention to the minutiae of the area being mapped. The goal is to understand the key points of the topic, what ideas drive strong responses, what ideas drive strong engagements. The responses are measured using rating scales, converted later to a binary scale. The engagements are measured by response time, deconstructed into the number of tenths of second a statement ‘holds the respondent’s attention’ while being processed.

The test stimuli comprise four questions dealing with the person who is in prison, what the person does basis, the nature of other people in the prison, and the preparations, if any, for re-entry. The four questions are used as prompts to drive the researcher to provide four answers to each question. Table 1 show the four questions and the four answers to each question.

Table 1. The four questions, and the four answers to each question.

Question A: What kind of person is this?

A1

Young inner-city black woman

A2

White middle-age for theft

A3

21-year-old second conviction for drugs

A4

54-year old woman convicted for drugs

Question B: What does the person do on a daily basis?

B1

Boring stay, little to do

B2

Machine shop license plates

B3

4-hours of forced library

B4

Rehabilitation and reeducation

Question C: What other kind of people are in the prison?

C1

Lower and upper middle class (in the prison)

C2

Comradely (in the prison)

C3

Drug addicts (in the prison)

C4

Invisible status (in the prison)

Question D: What kind of links are there for a future after prison?

D1

Optional courses to prepare for jobs

D2

Out you go

D3

No support

D4

Re-enter prison

Test stimuli created by experimental design

The typical way to understand what people feel about a topic is to ask them questions about the topic, either in discussion (interviews), or through a survey on pencil and paper. An emerging way to understand people is the belief that observing their recorded behavior, e.g., what the person buys or does, gives a sense of who the person is, and what the person believes. This latter approach, is called ‘Big Data.’ The reality is that each of the approaches provides some information about the person, but does not provide the specific information for the topic. Our topic is the empathy of normal people towards their ideas of prisoners, and specifically prisoner despair. There is no way that Big Data can provide this information. Rarely can we find a survey which focuses on this topic because the topic is so specific, and so different from the more mainstream, conventional topics in the world of sociological or psychological research,

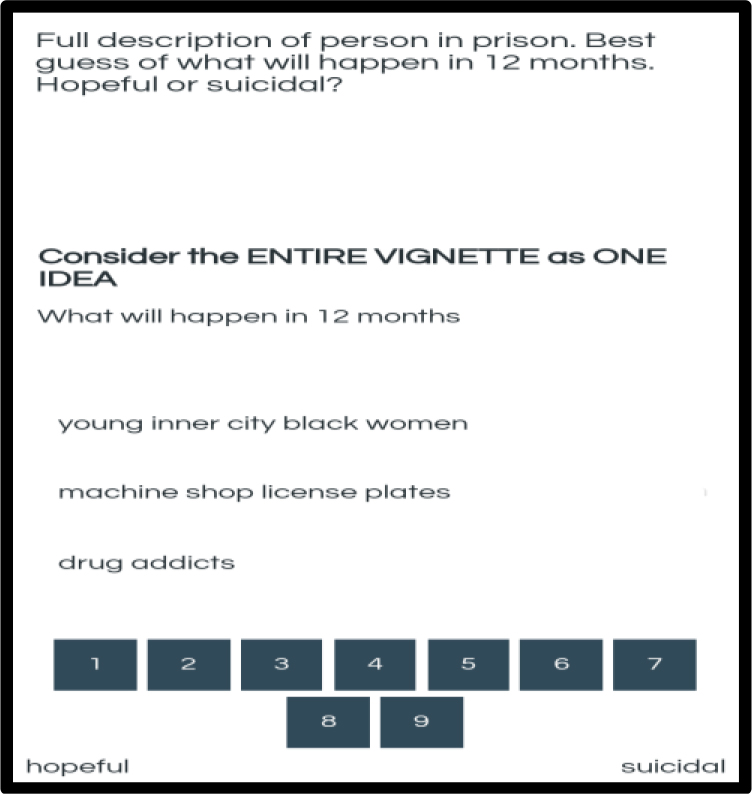
Mind Genomics approaches the issue of empathy about prisoner despair by running a simple experiment. The respondent or subject is provided with test combination of the 16 answers, and instructed to rate the combination, the vignette, on an anchored 9-point scale, with the scale focusing on an assessment of estimated feelings. Figure 1 shows the test stimulus.

Mind Genomics-015 - ASMHS Journal_F1

Figure 1. Example of a 3-element vignette about a prisoner, and the instruction to the respondent to rate.

The underlying experimental design comprises a ‘recipe’ or systematic layout of 24 combinations, vignettes, each vignette comprising 2–4 elements or answers, selected from Table 1. Each respondent evaluated 24 different vignettes, comprising 2–4 elements per vignette, at most one element or answer from one question. The experimental design presents the combinations without concern as to whether the combination ‘makes sense’ [12] The objective is to present the respondent with a set of test stimuli and force a judgment, that judgment being a rating of the entire vignette. The respondent cannot assign a ‘politically correct rating’ because there is no underlying pattern that the respondent can discern. The respondent may begin by trying to be politically correct and do the task ‘properly’ by paying attention, but soon gets frustrated, and reacts at an almost automatic, intuitive, ‘gut level.’ This is the desired state for the respondent. The intuitive response means that the response will be relatively uncontaminated by what the respondent feels to be that which the research ‘wants.’

The experiment with 42 respondents generated a data set, comprising 1208 vignettes. Most of the vignettes differed from one another. This structure of testing different combinations by each respondent is known as a permutable experimental design [13] The structure allows the researcher to ‘cover the space’ of possible test combinations, an approach analogous to the MRI (taking different pictures of the tissue), rather than the way typical scientific research works (repeating the pictures many times to reduce the error of measurement.)

Analysis

The ratings from the respondents were transformed to a binary scale, following the approach used by author HRM for 35 years, since the mid 1980’s, and based upon a combination of experience and common industry practice. Experience suggests that most users of scales do not know what the scales mean. Often the user of the data, the ultimate ‘client’ of the results, asks for an interpretation, such as ‘is a 6 a lot or a little better than a 5, or a little or a lot worse than a 7?’ These questions continue to reaffirm the fact that the user of the data does not really understand what to do with the data, other than to make conclusions about ‘better or worse.’ A more productive approach, used for decades by market researchers bifurcates the scale, so that there is a top of the scale (e.g., 7–9), and a bottom of the scale (e.g., 1–6). In our case, we would interpret the top of the scale, the ratings of 7–9, as indicating that the prisoner is believed to be thinking of suicide. A rating of 1–6 indicates that the prison is not likely to commit suicide, or to think about committing suicide. We can also look at the scale from the opposite end, hopefulness with a rating of 1–3 indicating that the prisoner is believed to be hopeful,

The underlying experimental design enables us to combine the data from our 42 respondents into a database comprising the 1008 observation. Each observation comes from one respondent, one vignette. The experimental design ensures that the 16 predictor variables, the elements, are statistically independent of each other. The dependent is augmented by the addition of a very small random number, approximately 10–5

Table 2 shows the results from the first OLS (ordinary least-squares) regression, focusing on the data from the transformation to the binary scale (1–6 = not thinking about suicide; 7–9 = thinking about suicide.) The regression procedure, colloquially known as curve fitting, deconstructs the 0/100 binary rating into the basic contribution of the 16 elements, the 16 coefficients, and an estimated basic level, the additive constant.

Table 2. Coefficients for ‘thinking about suicide’ (ratings 7–9 converted to binary). Data from the total panel.

Thinking about suicide (Scale points 7–9)

Coefficient

T Statistic

P Value

Additive constant

24.46

3.48

0.00

D3

No support

11.16

2.62

0.01

C3

Drug addicts

10.98

2.54

0.01

A3

21-year-old second conviction for drugs

7.08

1.65

0.10

B1

Boring stay, little to do

4.10

0.94

0.35

D2

Out you go

1.10

0.26

0.80

A2

White middle age for theft

-0.02

-0.01

1.00

A4

54-year-old woman convicted for drugs

-0.68

-0.16

0.88

C4

Invisible status (in the prison)

-1.17

-0.27

0.79

B4

Rehabilitation and reeducation

-2.34

-0.54

0.59

C2

Camaraderie (in the prison)

-3.40

-0.80

0.43

B3

4-hours of forced library

-3.81

-0.88

0.38

C1

Lower and upper middle class (in the prison)

-4.13

-0.96

0.34

D4

Re-enter prison

-4.22

-0.99

0.32

B2

Machine shop license plates

-5.25

-1.23

0.22

D1

Optional courses to prepare for jobs

-8.31

-1.94

0.05

A1

Young inner-city black woman

-8.52

-1.98

0.05

The interpretation of the results is straightforward:

  1. The additive constant is the estimated probability of a respondent saying that the person described in the vignette will attempt suicide (rating 7–9 on the scale.) The additive constant is 24.46, which we interpret to mean that in the absence of elements, the expected proportion of responses 7–9 (thinking of suicide) is 24.46, about 25%.
  2. Table 2 shows the 16 elements sorted from highest (believed most likely to think of suicide), to lowest (believed least likely think of suicide.)
  3. The coefficients have ratio-scale values, so that a value of 10 means believed twice as likely to thinking of suicide than a value of 5.
  4. The coefficients can be added to the additive constant to create a sum which provides the estimated probability of a prisoner thinking about suicide. Thus, one needs only the additive constant, and the elements, as well as their coefficients, to estimate the likelihood that one believes that thoughts of suicide will plague prisoner described by the vignette.
  5. The coefficients in Table 2 suggest that the two elements co-varying most strongly with likelihood of suicide are C3 (drug addicts, as fellow prisoners), and D3 (the recognition of no support.) These two elements talk about two aspects, one who the fellow prisoners happen to be, and second the emotional support in the prison.
  6. The coefficients suggest that two descriptions are least likely to covary with the thought of suicide. One is the young inner-city black woman, the other is optional courses to prepare for jobs. These are radically different. The first suggests the appreciation who the prisoner happens to be. The second is the fact that someone is taking care of the prisoner, or at least thinking of the prison to prepare for a job.
  7. The T statistics tells us the ratio of the coefficient to the standard error of the coefficient. The higher the T statistic, the more likely it is that the coefficient or the additive constant comes from a distribution whose true value is not 0. The P value, in turn, is the probability that the T statistic comes from a distribution whose true value is 0.

Reversing the perspective – what drives the rating of ‘hopeful’ (1–3 on the 9-point scale)

Our respondents could assign rights on either side of the scale, 1 representing hopeful, 9 representing contemplating suicide at some point. What happens when we focus on the positive aspects, looking at the elements driving the ratings of 1–3. We now convert the ratings on the low end of the scale, 1–3, corresponding to hopeful, so that they become. In turn, the value 100. The remaining six scale points, 4–9, become 0, to denote not hopeful. We perform the same analysis on the data from the total panel, looking at the additive constant, and the coefficient for each element.

  1. The additive constant is 43.79, almost 44, meaning that in the absence of elements, almost half of the responses will be between 1 and 3, hopeful. We interpret this to mean that it is basic information (a person is in prison) which conveys some hope. Being in prison does not automatically drive one’s feeling that the imprisoned person will contemplate suicide. Being is prison does, however, drive a sense that the prisoner will be modestly hopeful.
  2. Estimated hopefulness is driven by reading about preparations for release, such as ‘optional courses to prepare for job’, and ‘4-hours of forced library.’.
  3. Lack of hopefulness is driven by who a person is, and the situation in the prison. These are the elements with the lowest coefficients for hopefulness.

    21-year-old second conviction for drugs

    54-year-old woman convicted for drugs

    drug addicts (in prison)

    white middle age for theft

    no support

Individuals – are they optimistic or pessimistic, based upon their coefficients

Can we classify an individual as optimistic (perceiving the situations in the vignette as ‘hopeful’) or pessimistic (contemplating suicide), both or neither? One way to answer this question computes the average coefficient across 16 elements for each individual, when we look at the equation for ratings of 7–9. Recall that the coefficient shows the believed likelihood that the prisoner being described is likely to commit suicide. Each respondent generates 16 coefficients. The average coefficient for a respondent tells us the proclivity of the respondent to see the described prisoner’s feelings as leading to thoughts of suicide. The second part of the answer is to compute the average for the same respondents for the 16 coefficients dealing with hopeful. The average coefficient for a respondent tells us the proclivity of the respondent to see the described prisoner vignette as leading to hopefulness.

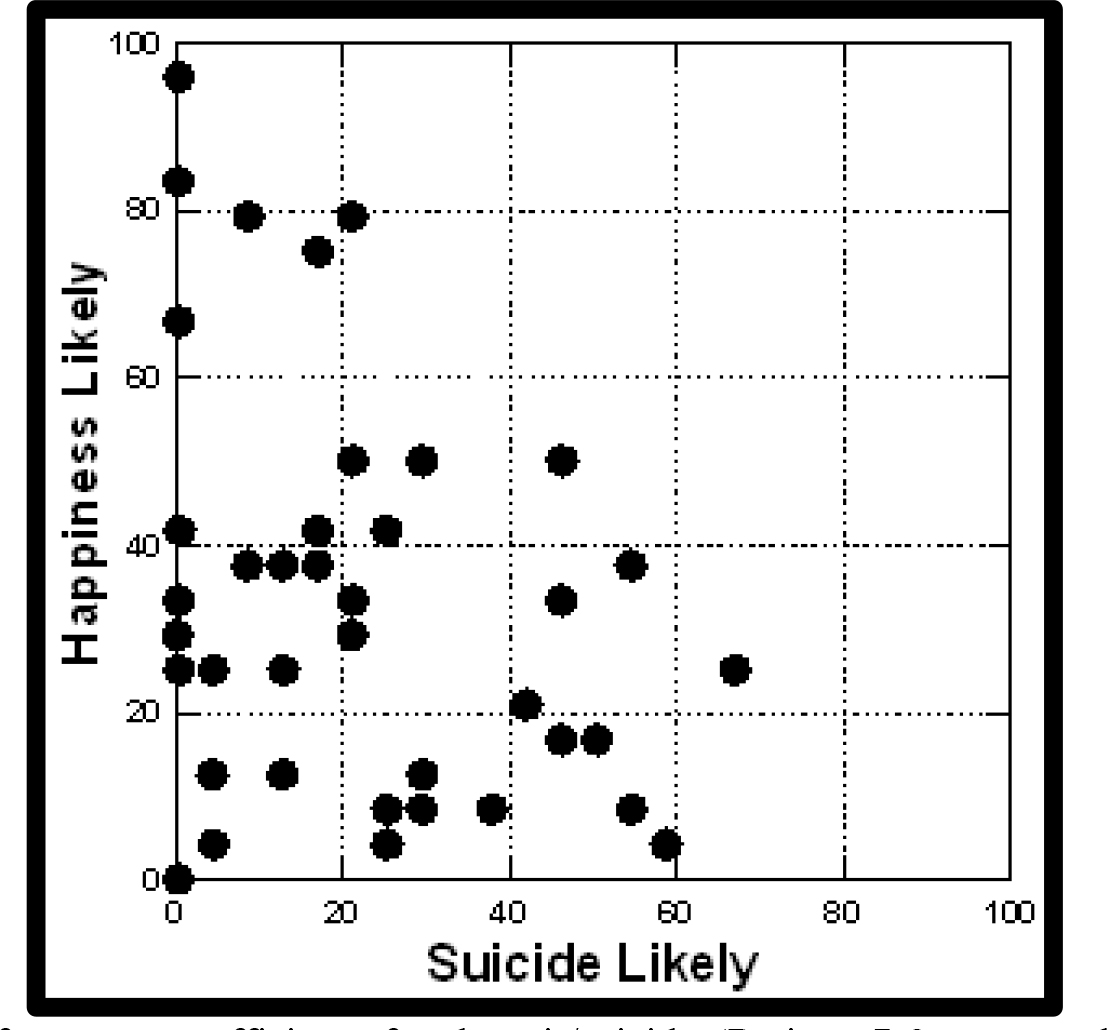
We begin with the scattergram for the total panel, in Figure 2. Each filled point represents one respondent. The abscissa corresponds to the average of the respondent’s 16 coefficients on the top part of the scale, tendency to suicide, i.e., the coefficients of the individual-level regression model run for the respondents when the ratings of 1–6 were converted to 0, and the ratings of 7–9 were converted to 100. The ordinate corresponds to the average of the respondent’s 16 coefficients on the bottom of the scale, hopeful, when the ratings of 1–3 were converted to 100, and the ratings of 4–9 were converted to 0.

Mind Genomics-015 - ASMHS Journal_F2

Figure 2. Distribution of average coefficients for despair/suicide (Ratings 7–9 converted to binary) and average coefficients for happiness/hopefulness (Ratings 1–3 converted to binary). Each filled circle corresponds to a respondent.

When the respondent cluster at 0, 0, we conclude that the respondent does not sense either prisoner despair or prisoner hopefulness in the vignettes. The averages for the latter two scales are both near 0, and thus the respondent falls at the bottom left. The further out to the right on the abscissa lies the respondent’s average, the more the respondent feels that the prisoner will contemplate suicide. The further up the ordinate lies respondent’s average more the respondent feels that the prisoner will feel hopeful. Figure 2 suggests more respondents feel that the prisoner will be hopeful, and fewer respondents will feel that the prisoner will contemplate suicide. Looking more closely at the distribution, we see about five respondents who feel primarily despair in the vignettes, and about five respondents who feel primarily hopefulness in the vignettes.

As a side note, this format of presenting data suggests a new way to understand the basic mind-set of a person on two opposing dimensions of a feeling. The location of the points gives a sense of how different people think and empathize. Most of the respondents in the large area between 0, 0 and 0.3, 0.3. The location 0, 0 corresponds to a person who is neither pessimistic nor optimistic in the estimation of how the prisoner would feel. The location 0.5, 0.5 corresponds to the location where the person is absolutely decisive, rating the vignettes as either hopeful or despairing (contemplate suicide.) For the person located at 0.5, 0.5, there is no middle ground. For the person located at 0, 0 there is virtually only middle ground.

Subgroups – Gender, Age, Mind-Set – What is expected to drive the prisoner’s though to suicide?

One of the key benefits of the Mind Genomics approach is the use of different combinations of vignettes for each respondent, but at the same time ensure that each respondent evaluates the appropriate set of vignettes in order to create an experimental design. One can do the analysis on key subgroups, both self-defined (gender, age), and defined through analysis (mind-set.) The small group of 42 respondents provides sufficient depth into the mind of the respondent to reveal the responses of subgroups, perhaps a bit noisily, but nonetheless powerfully.

Table 4 shows the set of key subgroups. For this study we divided the respondents by gender and by age, respectively, and then created mind-set segments as described in the following section.

Table 3. Coefficients for ‘hopeful’ (ratings 1–3 converted to binary). Data from the total panel.

Coeff

T Statistic

P Value

Additive constant

43.79

5.55

0.00

D1

Optional courses to prepare for job

13.24

2.76

0.01

B3

4-hours of forced library

8.52

1.76

0.08

C1

Lower and upper middle class (in the prison)

6.38

1.32

0.19

B4

Rehabilitation and reeducation

5.04

1.04

0.30

B1

Boring stay, little to do

1.38

0.28

0.78

B2

Machine shop license plates

1.15

0.24

0.81

A1

Young inner-city black woman

-1.44

-0.30

0.77

D2

Out you go

-2.10

-0.44

0.66

C4

Invisible status (in the prison)

-4.53

-0.94

0.35

C2

Camaraderie (in the prison)

-5.45

-1.14

0.26

D4

Re-enter prison

-8.72

-1.82

0.07

A3

21-year-old of second conviction for drugs

-11.23

-2.33

0.02

A4

54-year-old woman convicted for drugs

-11.86

-2.46

0.01

C3

Drug addicts

-11.89

-2.45

0.01

A2

White middle age for theft

-12.48

-2.59

0.01

D3

No support

-16.69

-3.49

0.00

Table 4. Strongest performing elements by key subgroup of the models relating the presence/absence of elements to the estimate of the prisoner’s contemplation of suicide.

Contemplate Suicide (Top 3 scale points, 7–9)

Total

Males

Females

Age <30

Age 31+

Mind-Set 1
(want preparation)

Mind-Set 2
(sensitive to surroundings)

Base size

42

19

23

14

26

19

23

Additive constant

24

25

22

22

27

26

24

D3

No support

11

5

18

10

12

32

-6

C3

Drug addicts

11

11

12

16

10

5

13

A3

21-year-old of second conviction for drugs

7

3

11

7

8

5

9

B1

Boring stay, little to do

4

14

-4

5

4

-5

12

D2

Out you go

1

5

0

-2

2

20

-15

  1. Additive constant – all subgroups are approximately the same, showing an additive constant of 22 – 27.
  2. Males feel that simply ‘being bored, having nothing to do’ is a cause for contemplating suicide. Females do not.
  3. There is no difference in projected potential of contemplating suicide by younger versus older respondent.
  4. We created two mind-sets by clustering the array of 16 coefficients, and extracting two different groups, which are maximally different from each other (De Hoon et. al., 2004.) Clustering is a purely statistical technique. We extract the fewest number of clusters (parsimony) which tell coherent stories (interpretability.)
  5. Mind-Set 1 feels that the prisoner will think of suicide if there is no emotional support in the prison, and if the prisoner is simply discharged, released, without any preparation. To Mind-Set 1, it is the sense of aloneness in the prisoner which is distressing. Mind-Set 1 can be called ‘want preparation.’
  6. Mind-Set 2 feels that the prisoner will contemplate suicide if there is a sense of nothing to do, and if the prisoner is either a serious drug addict (second conviction) or surround by drug addicts. Mind-Set 2 can be called sensitive to surroundings.

Subgroups – Gender, Age, Mind-Set – What is expected to drive the prisoner’s thoughts to happy

We can follow the same logic, this time looking at gender, age, and newly constructed mind-sets for the low part of the scale, ‘hopeful.’

  1. Males show a much higher imputed basic hopefulness for prisoners than do females (54 versus 36.) Without any additional information, males believe that that the prisoner will be neither hopeful or not hopeful (additive constant 54), whereas females believe that it’s more likely that the prisoner will not be hopeful (additive constant 36).
  2. For males, hopeful is perceived as a matter of preparing for a job and being surrounded by prisoners who are middle class.
  3. For females, hopefulness is perceived when the message is about preparing for a job, library, rehabilitation, and surprisingly, with the prisoner has little to do. Males, in contrast feel when the prisoner in bored, and has little to do, the despair is higher, with a greater thought of suicide.
  4. Younger respondents (under 30) feel that hopefulness will come from job preparation and from the hours in the library.
  5. Older people feel the same way, and also feel that hopefulness will come from being surrounded by middle class prisoners.
  6. The previously created Mind Set 1 feels that hopefulness is a matter of the requirement of four forced hours in library, as well as being surround by middle-class prisoners.
  7. The previously created Mind-Set 2 feels that hopefulness will come with the preparatory course for jobs, and the requirement of library.

Subgroups – are they optimistic or pessimistic, based upon their coefficients

The previous analysis for the total panel presented a novel way to gauge whether the respondents are optimistic or pessimistic, by plotting the average coefficient from the two models, doing so for each respondent. The coefficient shows the average conditional probability that the respondent would assign the element a rating of 7–9 (top 3, contemplating suicide), versus that the same respondent would assign the element of 1–3 (bottom 3, happy). The two averages come from the coefficients of 16 elements.

When we plot each respondent on a two-dimensional graph, we can sense the respondent’s mind. To review:

  1. Each filled circle corresponds to one respondent
  2. The location 0, 0 corresponds to a person who is ‘all middle ground, ’ sensing neither despair leading to contemplation of suicide, nor sensing hopefulness. All the ratings for the vignettes lie between 4 and 6.
  3. The location 0.5, 0.5 corresponds to a person for whom there is ‘no middle ground’ but not basically optimistic nor basically pessimistic in the estimation of how a prisoner would feel.
  4. Plots to the right on the abscissa suggest a person who is more pessimistic, and sees despair leading to the contemplation of suicide.
  5. Plots upwards on the ordinate suggest a person who is more optimistic, and sees ‘hopefulness’

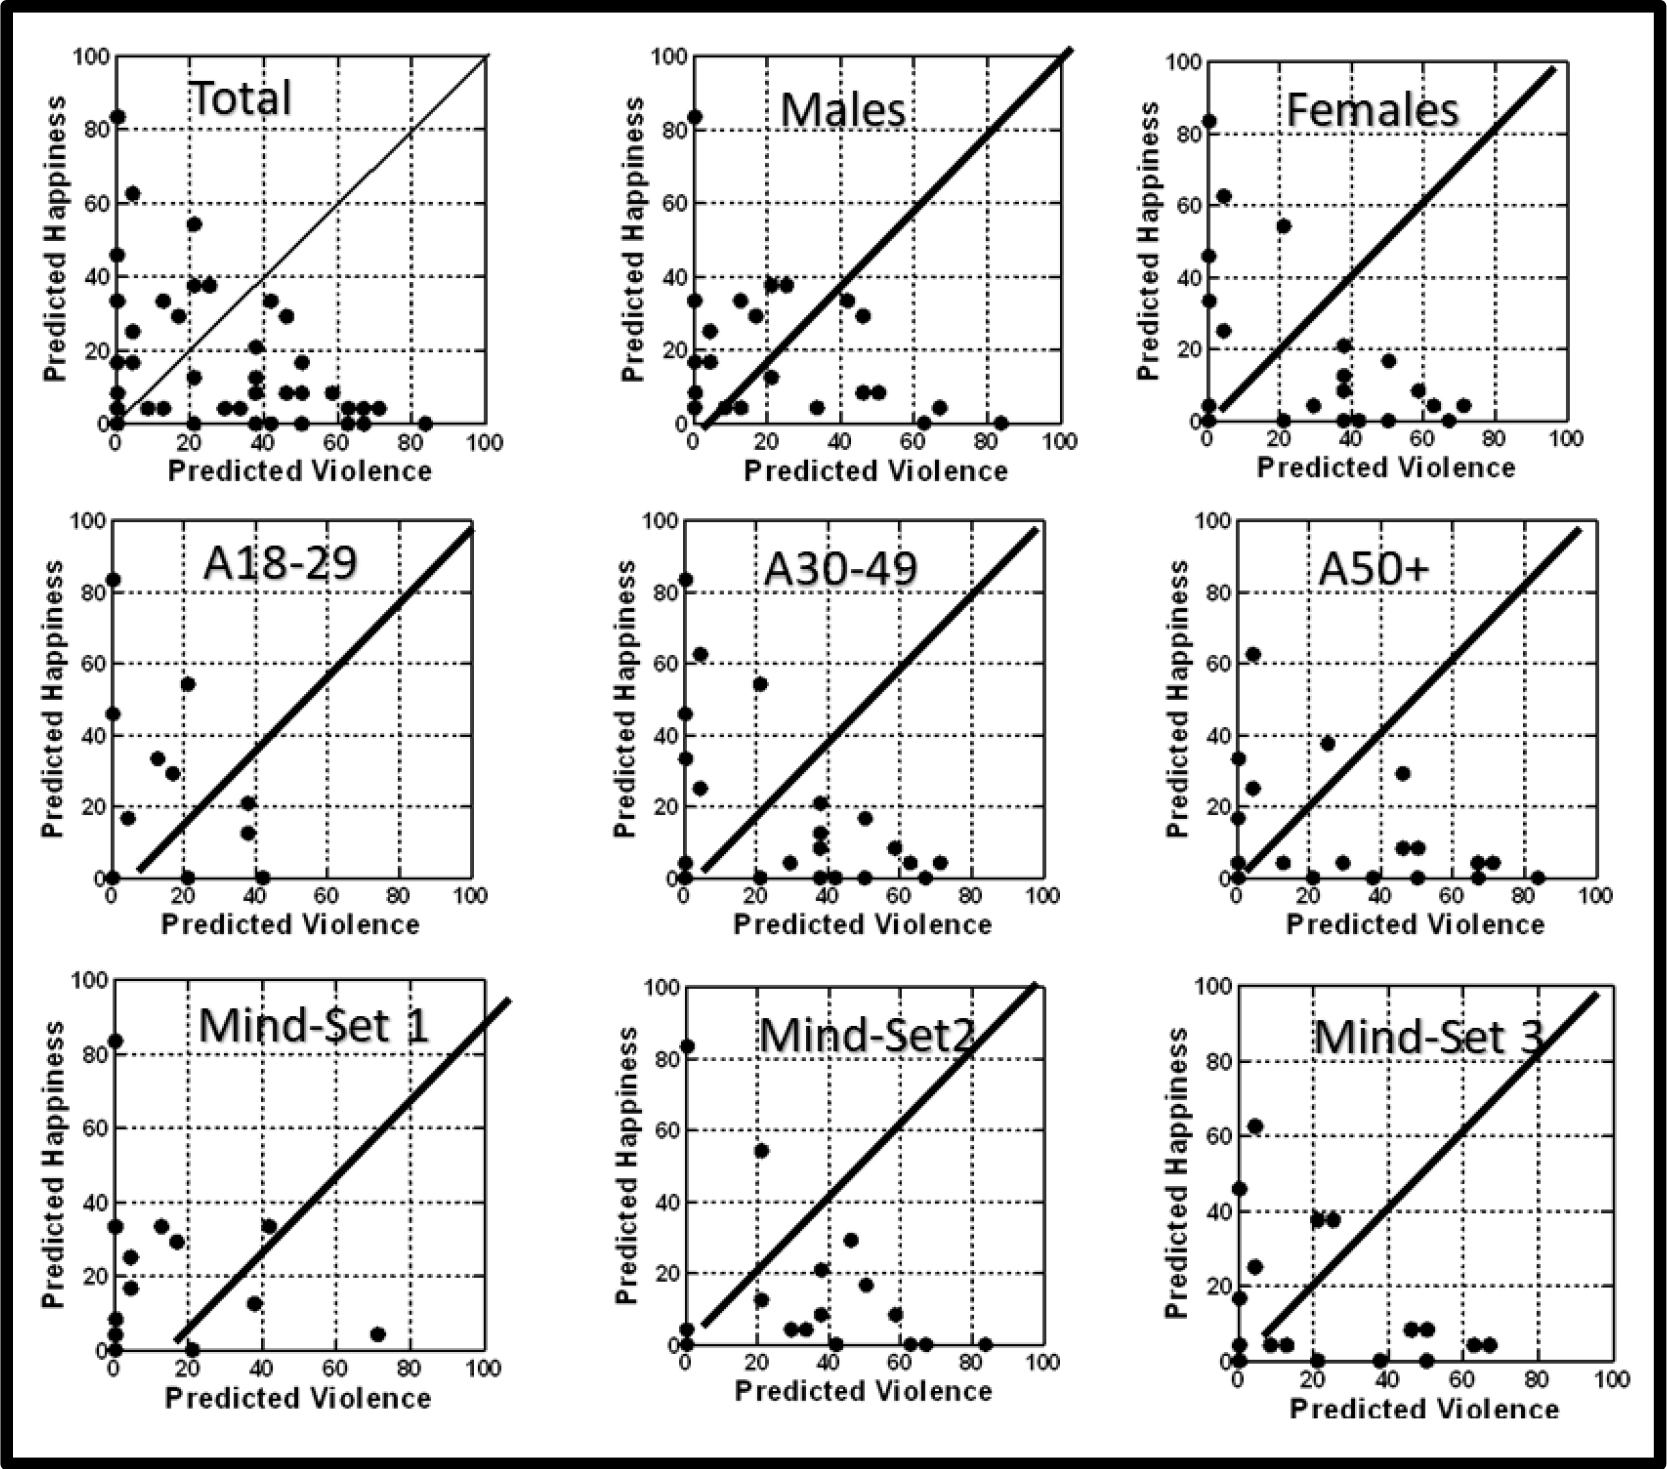
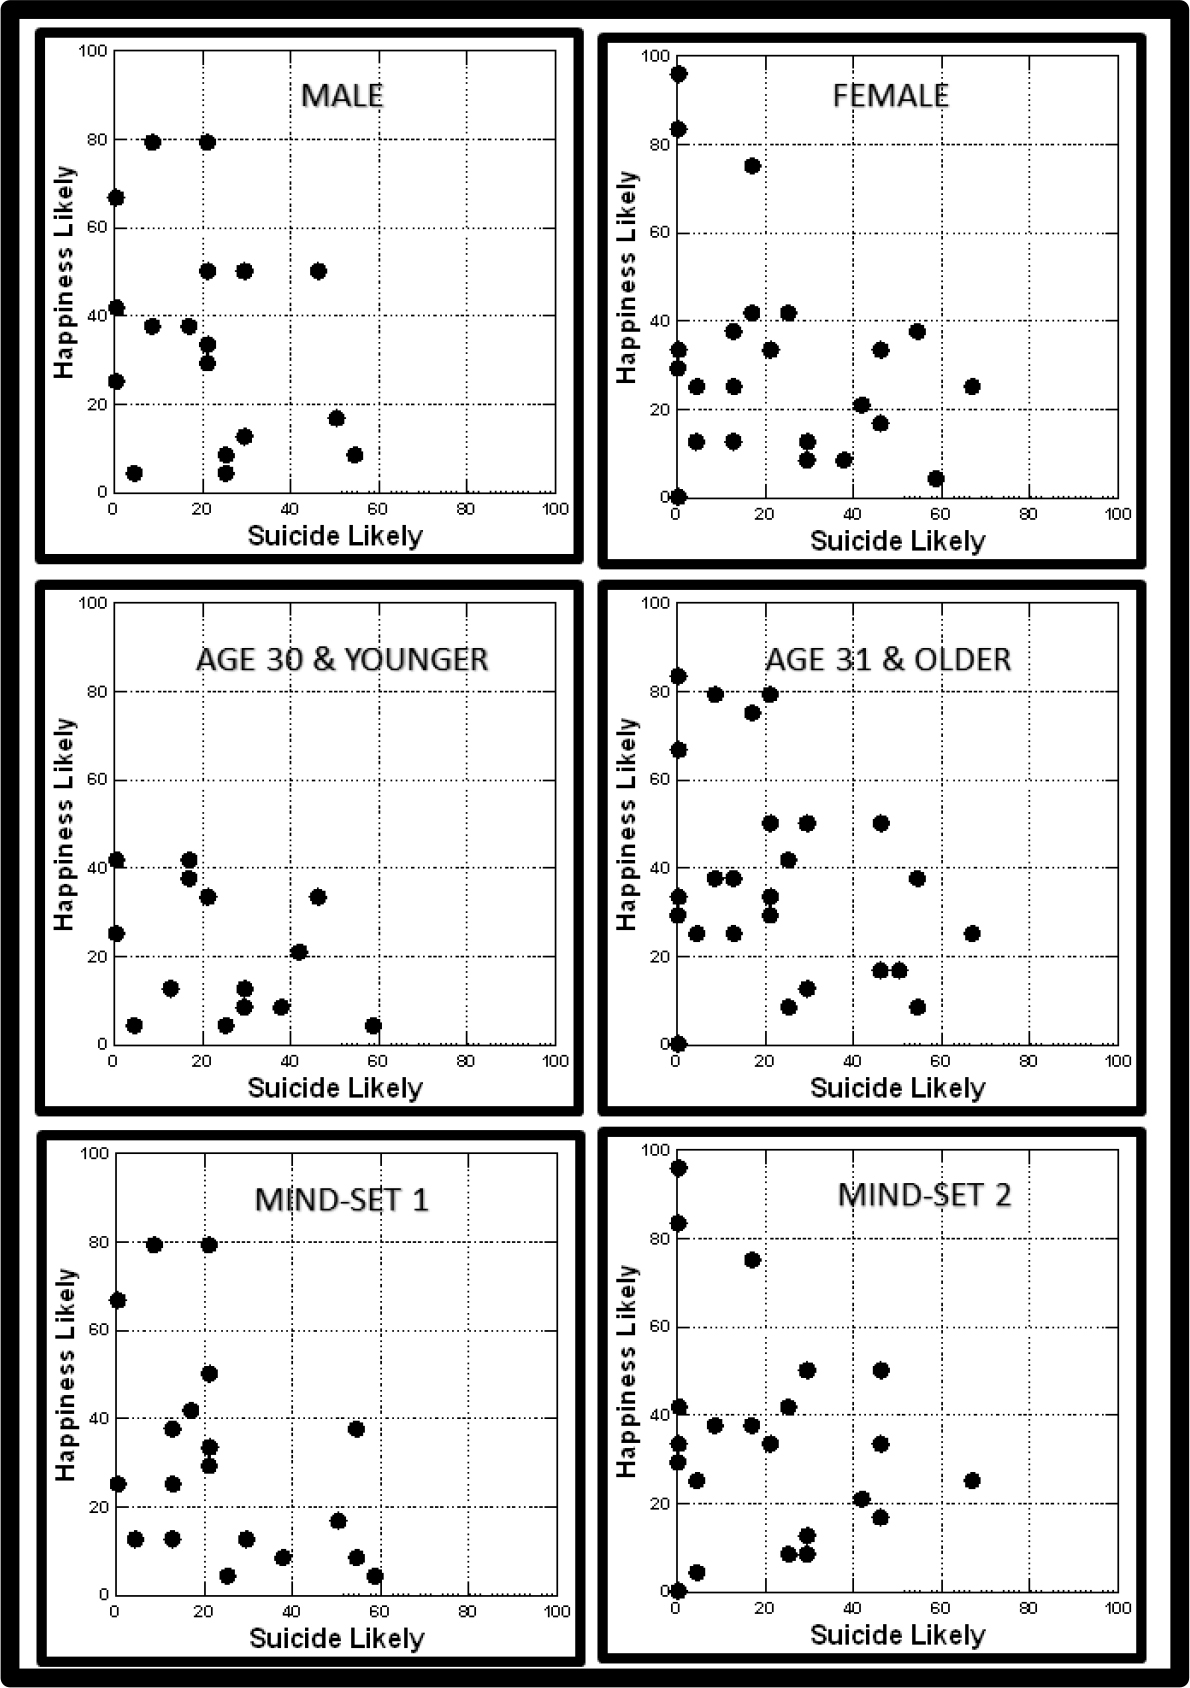
Figure 3 shows the plots for key subgroups. Each panel (top,
middle, bottom) compares two complementary subgroups. The
statements below are purely from visual observation and impression,
not from a statistical analysis.

Mind Genomics-015 - ASMHS Journal_F3

Figure 3. Distribution of average coefficients for despair/suicide (Ratings 7–9 converted to binary) and average coefficients for happiness/hopefulness (Ratings 1–3 converted to binary). Each filled circle corresponds to a respondent. The three panels show the results for complementary subgroups.

  1. Females show more respondents closer to the 45-degree line, and further out than men on that line. Qualitatively, females seem to be more judgmental than men, but neither overly optimistic nor pessimistic.
  2. Younger respondents aged 30 and younger show more respondents lying close to the non-judgmental region of 0, 0. Older respondents age 31 and older show more respondents as lying further out towards 0.5, 0.5, with a tendency to be more optimistic, and feeling that the prisoner is more hopeful.
  3. Mind-Set 1 (want preparation) appears to be less judgmental, and if judgmental then optimistic in terms of rating what the prisoner would feel. Mind-Set 2 (sensitive to surroundings) is more judgmental, with fewer ratings in the 4–6 region of the scale. Mind-Set 2 appears to be slightly more pessimistic.

Response Time

The previous sections dealt with the analysis of the ratings, specifically what elements are perceived, in one’s opinion to correlate with thinking that would contemplate suicide, at least in the opinion of a non-prisoner respondent reading a vignette about the prisoner. The analysis deals with the conscious assignment of ratings to the test stimuli, even if the decisions tend to be automatic.

Researchers have been interested in the past few years in possibly deeper mechanisms of decision-making, many of which they put in the grab-bag called neuromarketing, or more correctly non-conscious, physiological correlates of decision-making. Fugate [15], Lee et. al. [16] and Stipp [17] summarize this new area of neuromarketing, or really physiological correlates of messaging. Genco et. al. [18] have popularized in a book ‘Neuromarketing for Dummies.’ We now proceed to the analysis of one of one of these measures, response time. The ingoing assumption is that longer response times signal that the respondent is somehow ‘engaged’ in reading and thinking about the particular element in the vignette.

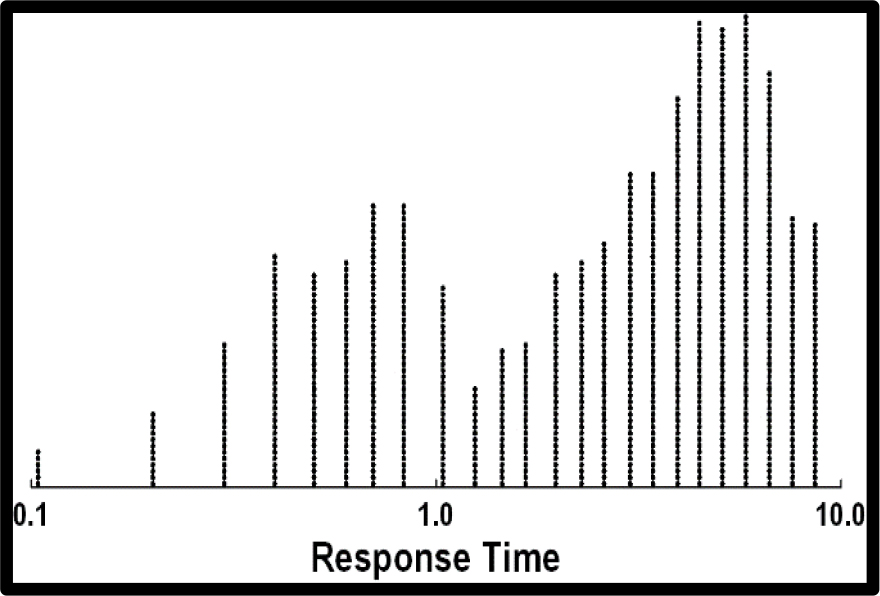
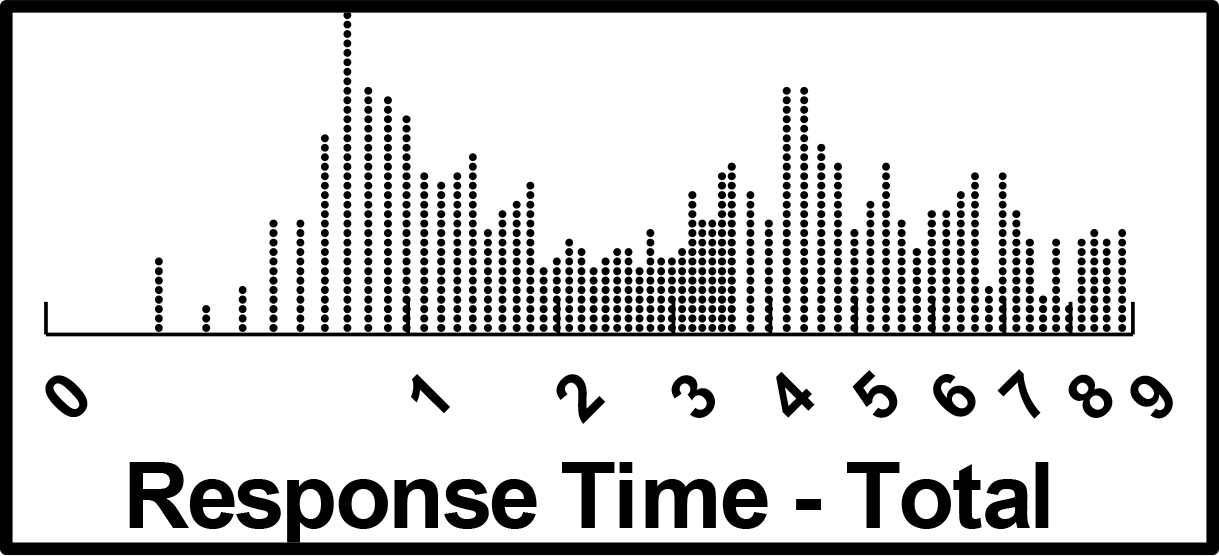
Some of the vignettes constructed were responded to slowly, others were responded to quickly. After removing the first vignette evaluated by each respondent because the respondent was just ‘learning what to do in the experiment, ’ and after removing all vignettes responded to after 9 seconds because it was likely the respondent was doing something else, we emerge with a distribution of response times as shown in Figure 4. The time scale, abscissa, is logarithmically spaced, emphasizing the many vignettes responded to faster than 2 seconds. The computer program picked up the response times in tenths of seconds.

Mind Genomics-015 - ASMHS Journal_F4

Figure 4. Distribution of the response times for the vignettes, after removal of the first vignette and after removal of all response times of 9 seconds or longer.

As stated above, we assume response time to be a correlate of engagement. We operationally define the term as ‘time spent attributed to the element when the vignette is being evaluated.’ We cannot, of course, ask the respondent to tell us how engaging each element seems to be, although occasionally the novice researcher might ask that question. The reading and response occur so rapidly, so automatically, that the respondents are not aware of what holds their attention unless there is something so powerfully strong that it ‘stops’ the respondent.

The experimental design enables us to estimate the likely number of seconds in the response time that can be attributed to each element. It is important to note that this assignment is an estimate, only, based upon the application of OLS regression to the response times. Some interesting patterns emerge from Table 5.

The elements are presented in descending order of response time based upon the results from the total panel. These ratings are from 40 respondents, each evaluating at most 23 vignettes, but a number of vignettes have been removed because they were recorded as being unusually long.

We have highlighted and bolded those response times of 1.4 seconds or longer, which can be assumed to be ‘engaging.’ The choice of 1.4 seconds is simply to represent a time that can be thought of as possibly conscious attention.

The longest response time for any group is 1.7 seconds (female respondents with the element ‘lower and upper middle class’).

The shortest response time for any group is virtually 0 time, ‘optional courses to prepare for jobs’ (0.2 seconds, for Mind-Set 2, who are sensitive to their surroundings, and would be expected not to care about courses for the future.)

Total panel: The longest response times, i.e., the most engaging, are descriptions of the person, requiring multiple words. The shortest times, i.e., the least engaging, are descriptions of occupation training in prison. It’s all about the people, who they are.

Assigning new individuals to one of the two mind-sets

Conventional research is grounded on the belief that there is an indivisible link between who the person IS and what the person THINKS. This belief motivates the use of large, representative samples of respondents, believing that it is important to measure the correct group of people in order to understand the way the mind works. Thus, good practice in business and political polling is often accompanied by large base sizes and a measure of ‘error, ’ or underlying variability.

Table 5. Strongest performing elements by key subgroup of the models relating the presence/absence of elements to the estimate of the prisoner’s hopefulness.

Total

Male

Female

LT30

GT31

Mind-Set 1
(want preparation)

Mind-Set 2
(sensitive to surroundings)

Base size

42

19

23

14

26

19

23

Additive constant

44

54

36

35

48

46

42

D1

Optional courses to prepare for jobs

13

8

17

14

13

7

18

B3

4-hours of forced library

9

6

11

9

8

9

8

C1

Lower and upper middle class

6

8

5

6

8

8

5

B4

Rehabilitation and reeducation

5

-1

10

-1

7

4

6

B1

Boring stay, little to do

1

-12

11

3

-1

5

-1

Table 6. Coefficients for response times, by total panel and key subgroups. Coefficients of 1.4 or higher are shown in shaded cells, with bold numbers.

Total

Male

Female

Age 30 or less

Age 31+

Mind-Set 1 (want preparation)

Mind Set 2 (sensitive to surroundings)

C1

Lower and upper middle class (in the prison)

1.4

1.2

1.7

1.2

1.4

1.2

1.5

A1

Young inner-city black woman

1.4

1.4

1.3

1.2

1.6

1.6

1.3

A3

21-year-old-old, second conviction for drugs

1.4

1.6

1.1

1.0

1.6

1.6

1.3

A4

54-year-old woman convicted for drugs

1.4

1.5

1.1

1.0

1.5

1.3

1.5

C4

Invisible status (in the prison)

1.3

1.6

1.2

1.4

1.4

1.5

1.1

C3

Drug addicts (in the prison)

1.3

1.3

1.4

1.2

1.5

1.7

0.9

A2

White middle age for theft

1.2

1.8

0.7

0.4

1.7

1.4

1.2

B1

Boring stay, little to do

1.0

0.8

1.2

0.6

1.2

1.1

1.0

B2

Machine shop license plates

1.0

1.3

0.8

0.6

1.3

0.9

1.1

D4

Re-enter

1.0

0.5

1.4

0.6

1.2

1.1

0.7

C2

Camaraderie (in the prison)

0.9

1.0

0.9

0.4

1.3

0.7

1.2

B3

4-hours of forced library

0.8

0.6

1.1

0.8

0.8

0.8

0.9

B4

Rehabilitation and reeducation

0.7

0.4

1.0

0.3

1.0

0.7

0.8

D1

Optional courses to prepare for jobs

0.6

0.3

0.8

0.7

0.6

1.0

0.2

D3

No support

0.5

0.1

0.7

0.4

0.7

0.7

0.3

D2

Out you go

0.3

0.0

0.5

0.5

0.2

0.6

-0.1

One of the premises of Mind Genomics is that in virtually any topic area where human judgment comes into play one can discover different points of view, different criteria for judgment. These are called Mind-Sets. Their reality emerges from the analysis of how individuals respond to the different elements or ‘answers’ in the particular study. That is, these mind-sets exist, but are really groups of individuals who behave similarly in a specific situation, as revealed by their patterns of responses, or perhaps as the next paragraph suggests, mind-sets are really combinations of ideas.

Underlying the research in Mind Genomics is the belief that some ideas ‘flow together.’ It is the combination of such ideas which flow together that comprises the focus of interest of Mind Genomics. Individuals, the respondents who participate, are ‘protoplasm’ which in some way embody these basic mind-sets, but the individuals are NOT the mind-sets. The mind-sets are primaries, like the colors red, yellow and blue. Each person comprises a set of mind-sets, with the methods of Mind Genomics both identifying the nature of the mind-sets from clustering, and establishing who in a study embodies each mind-set. Whether these mind-sets represent true primaries like color primaries, red, blue and yellow, is not important. What is important is that they show remarkably different, and interpretable patterns of responses, patterns which make sense, can be interpreted and labelled. These primaries may co-vary with external behaviors, and perhaps even with physiological patterns of responses. What is important is that they represent a new way of looking at individual differences.

With the foregoing accepted, the question is whether there is a natural affinity for the mind-sets established in an experiment to distribute in the way to which we have been accustomed. That is, for our study we have established two mind-sets, those who want preparation, and those who are sensitive to their surroundings, etc.

Table 7 shows that there is no clear relation between mind-set membership and either gender or age. This is typically the case. Mind-sets emerge quite clearly in Mind Genomics studies, but these mind-sets do not distribute in ways that are easy to discern, despite the radical differences in content between or among the mind-sets.

Table 7. Distribution of the two mind-sets by gender and age, respectively.

Want preparation

Sensitive to surroundings

Total

Male

9

10

19

Female

10

13

23

Total

19

23

42

Mind-Set

Mind-Set 2

Total

30 and under

8

6

14

31 and Older

10

16

26

No age given

NA

NA

2

Total

18

22

42

Given the clear similarity in the patterns of WHO are in the two mind-sets, at least in terms of gender and age, how then do we assign a new person to a mind-set? This is an important question, both for science, and for commerce. For science, we can begin to study the relation between membership in a mind-set for one topic, and both membership in other mind-sets for other topics, and/or external behaviors, and even biological/genetic covariates of membership in different mind-sets.

Our approach uses the average coefficients from each mind-set. We create 1, 000 different variations of the average profile by adding ‘noise’ to the coefficients. We then identify the six questions which, in the presence of “noise” can be used to correctly assign the respondents to the correct mind-set. Figure 5 shows an example of the PVI (personal viewpoint identifier), presenting the six strongest questions which, in concert, help us assign a person to the correct mind-set. We also show the feedback page, which can go to the person being typed, or be used to drive the respondent to the right e-commerce website, or perhaps incorporated into the person’s profile for future use. As of this writing (March, 2019), the PVI is located at this location: http://162.243.165.37:3838/TT19/

Mind Genomics-015 - ASMHS Journal_F5

Figure 5. The PVI (personal viewpoint identifier) and the two feedback pages, one for each mind-set segment uncovered in the original study.

Discussion and Conclusion

The sociology and psychology literatures are replete with studies presenting statistics about the backgrounds of prisoners, their environment, and clinical analyses of personalities. There is no end to the fascination with other people, especially those who commit crime. What is lacking, however, is a sense of how the ‘other’ reacts to prisoners. We are aware of the prisoner, but what do we think of prisoners in terms of specifics? The answer may be found in novels, in news clippings, in common discussion, but not particularly in the scientific literature.

Mind Genomics provides a way of understanding how people perceive the ‘other, ’ not so much in a clinical sense, but the ‘other’ when represented in a story, that story provided by the vignette. Mind Genomics opens new vistas, probing into the mind, and how the mind reacts to others, the ‘others’ presented in meaningful but manageable descriptions. Simple experiments, of the type presented here, generate the foundations of new knowledge that that hitherto could only be obtained in unstructured form by talking with people, or by reading personal accounts, news commentary, or literature.

Acknowledgement

Attila Gere thanks the support of Premium Postdoctoral Research Program of the Hungarian Academy of Sciences.

The authors wish to thank Dr. Gillie Gabay for her help in formulating the problem and placing it into its academic perspective.

References

  1. Liebling, A, Maruna, S (2005) The Effects of Imprisonment, Devon: Willan.
  2. Chamberlen, A (2016) Embodying prison pain: Women’s experiences of self-injury in prison and the emotions of punishment. Theoretical Criminology 20: 205–219.
  3. Crewe B, Warr J, Bennett P, Smith A (2014) The emotional geography of prison life. Theoretical Criminology 18: 56–74.
  4. Cole Johnson R (1987) Hard Time: Understanding and Reforming the Prison. Pacific Grove, CA, Brooks
  5. Newton C (1994) Gender theory and prison sociology: Using theories of masculinities to interpret the sociology of prisons for men. The Howard Journal of Criminal Justice 33: 193–202.
  6. De Viggiani N (2012) Trying to be something you are not: Masculine Performances within a prison setting.    Men and Masculinities 15: 271–291
  7. Jewkes Y (2012) Autoethnography and emotion as intellectual resources: doing prison research differently, Qualitative Inquiry, 18: 63–75.
  8. Robinson L, Spencer MD, Thomson LD, Sprengelmeyer R, Owens DG, et al (2012) Facial emotion recognition in Scottish prisoners. International journal of law and psychiatry 35: 57–61.
  9. Moskowitz HR (2012) ‘Mind genomics’: The experimental, inductive science of the ordinary, and its application to aspects of food and feeding. Physiology & behavior 107: 606–613.
  10. Moskowitz HR, Gofman A, Beckley J and Ashman H (2006) Founding a new science: Mind genomics. Journal of sensory studies 21: 266–307.
  11. Box GEP, Hunter WP, and Hunter JS (1978)  Statistics for experimenters, New York, John Wiley.
  12. Gofman A, Moskowitz H (2010) Isomorphic permuted experimental designs and their application in conjoint analysis. Journal of Sensory Studies 25: 127–145.
  13. De Hoon MJ, Imoto S, Nolan J, Miyano S (2004) Open source clustering software. Bioinformatics 20: 1453–1454.
  14. Fugate  DL (2007)  Neuromarketing: a layman’s look at neuroscience and its potential application to marketing practice. Journal of Consumer Marketing 24: 385–394.
  15. Lee N, Broderick AJ, Chamberlain L (2007) What is ‘neuromarketing’? A discussion and agenda for future research. International journal of psychophysiology 63: 199–204.
  16. Stipp H (2015) The Evolution of Neuromarketing Research: From Novelty to Mainstream: How Neuro Research Tools Improve Our Knowledge about Advertising. Journal of Advertising Research 55: 120–122.
  17. Genco SJ, Pohlmann AP, Steidl P (2013) Neuromarketing for dummies. John Wiley & Sons.

Enterobacteria Producing Extended Spectrum Beta- Lactamases : 74 Cases in a General Hospital in France

DOI: 10.31038/IMROJ.2019413

Abstract

Antibiotics used to treat zoonoses, such as campylobacteriosis and salmonellosis become less effective, new data from the European center for Disease Prevention and Control (ECDC) confirm this observation. Enterobacteria are the most common causes of community or nosocomial infections. Some of them produce beta-lactamases extended spectrum (ESBL) frequently associated with resistance to antibiotics. We conduct a retrospective study from positive levies of enterobacteria ESBL identified in adult patients hospitalized at the Quimper hospital, during the year 2016. 74 patients (48women) median age 80 years were included. 30% lifed in an institution, 21% had an history of infection of EBLSE, 62% had urinary tract infection, 12% intraabdominal infection, 9% respiratory infections. Distribution of Enterobacteriaceae was: E. coli (73%), E.cloacae complex (16%), K.pneumoniae (5.4%), Citrobacter freundii (2.7%), Citrobacter koseri(1.4%), Salmonella enterica (1.4%). Sensitivity profiles of antibiotics strains are presented. The strategies of antibiotic therapy are detailed and discussed. The most used molecule was ceftriaxone for probalistic treatment then fluoroquinolone, carbapenems and amoxicillin- clavulanate for second line. The evolution was favorable for 64 patients, 8 deaths, 6 serious complications were notified.

Keywords

Enterobacteria beta-lactamases extended spectrum, ESBL, nosocomial infection, antibiotic resistance

Introduction

Enterobacteria are the most common causes of community or nosocomial infections. They are usually treated with beta – lactams, such as penicillins, broad-spectrum cephalosporins and carbapenems, or fluoroquinolones. For several decades, there has been a significant increase in the resistance of Enterobacteriaceae to these antibiotics, in particular Escherichia coli (E. Coli) and Klebsiella pneumoniae (K. pneumoniae), It is related to their large-scale use appropriately or excessively in humans but also in animals [1, 2].

The β- lactamases extended spectrum (ESBL) are a large heterogeneous family of bacterial enzymes, mainly found in the Enterobacteriaceae family (secretory Enterobacteriaceae ESBL (EBLSE)). They are induced either by the acquisition of genetic material in the form of a plasmid most frequently, or by a chromosomal mutation. Both mechanisms give the affected bacteria the ability to hydrolyze a wide variety of beta – lactams. These enzymes do not hydrolyse cephamycins nor carbapenems, and are inhibited, to varying degrees, by β- lactamase inhibitors (Annex 1). The presence of ESBL is frequently associated with resistance to fluoroquinolones and carbapenems often remain the first choice molecules to treat these infections with the risk of emerging resistances to this class and the spread of carbapenemase- producing enterobacteria (CPL) [ 3].

EBLSE can cause hospital and community infections [4] with the consequent high risk of clinical failure in probabilistic treatments with cephalosporins or quinolones. The eur broadcast is now a major concern of health institutions in the fight against multi-resistant bacteria (BMR).

Epidemiological data

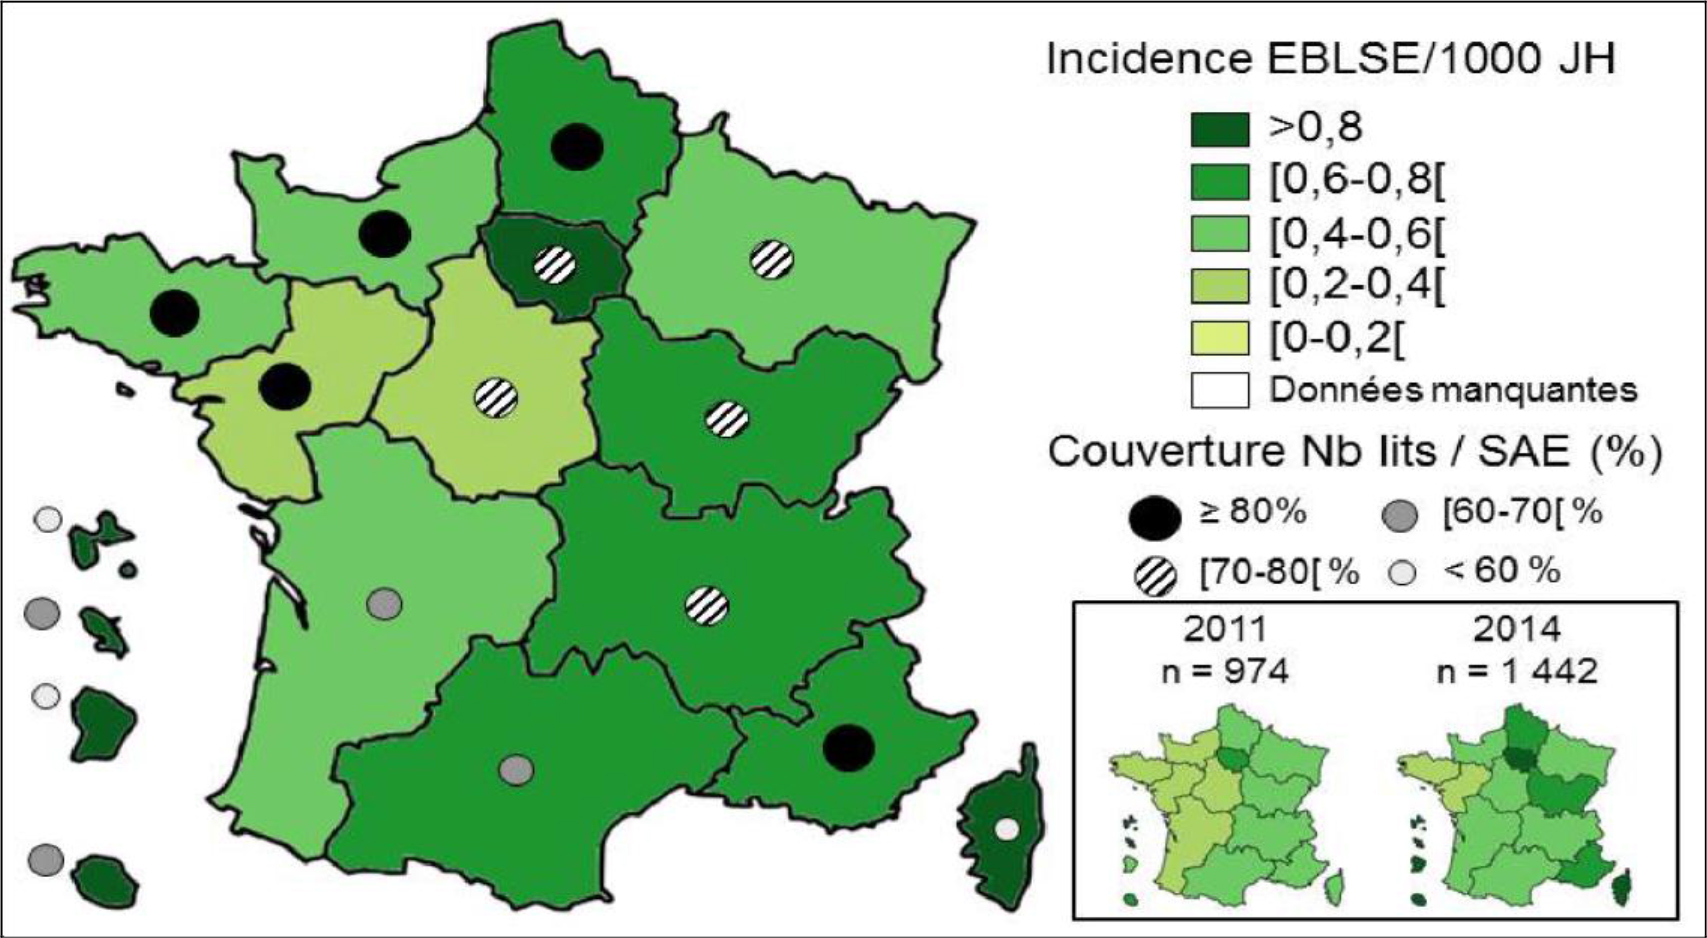
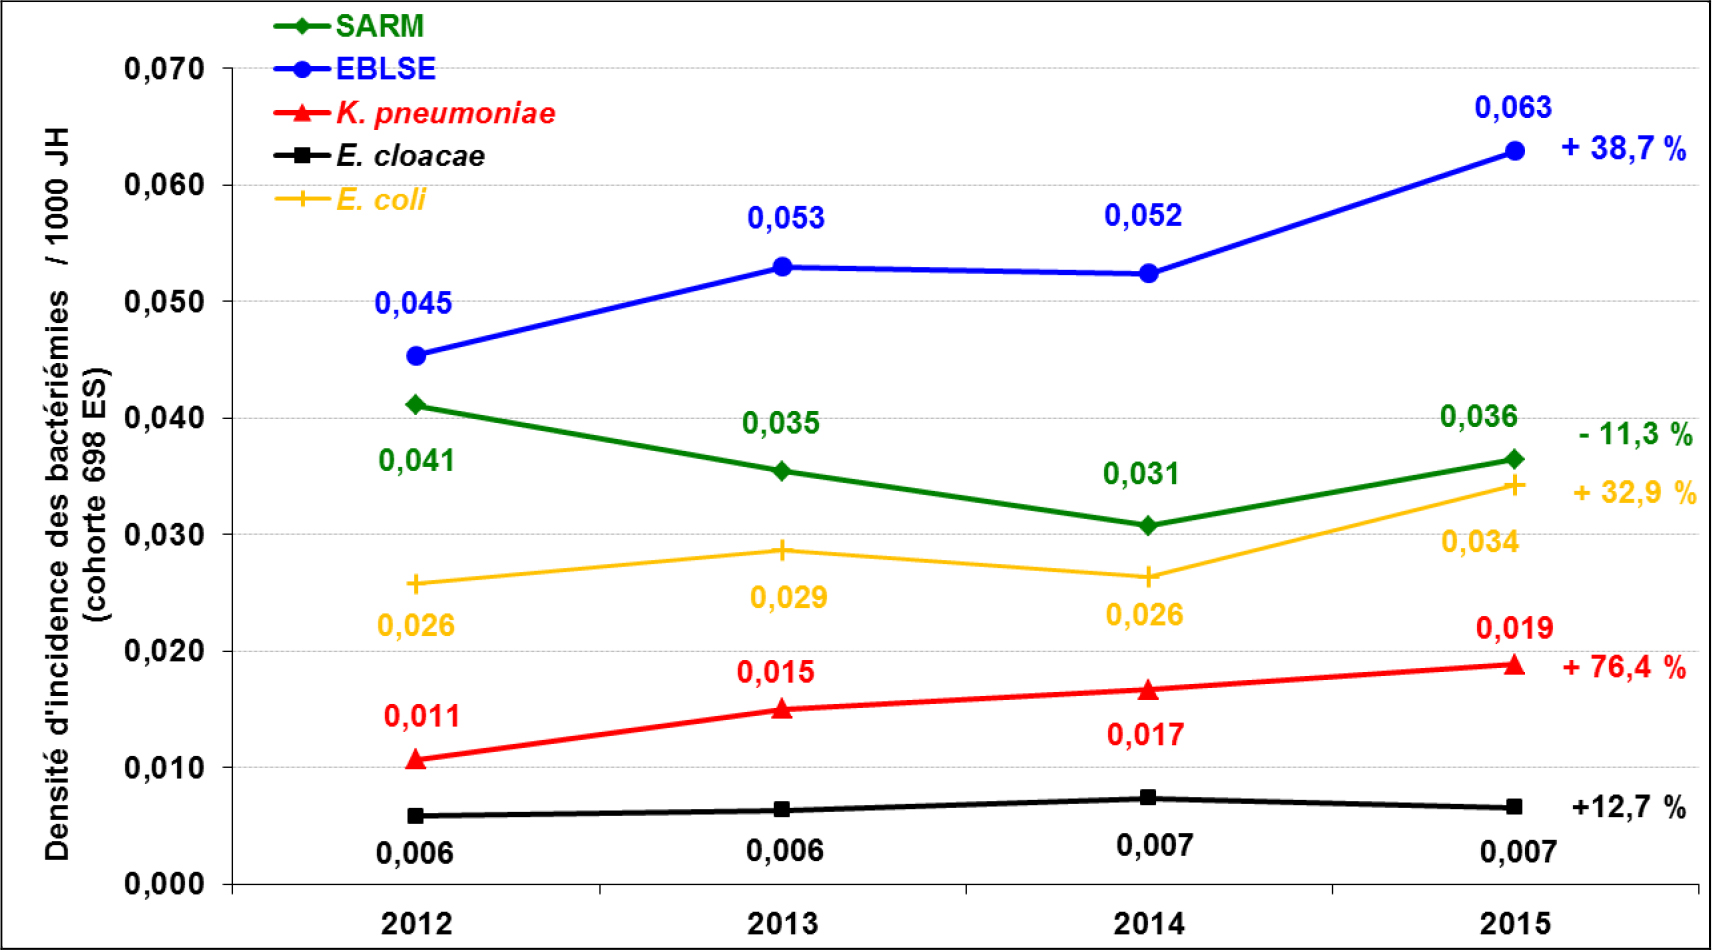
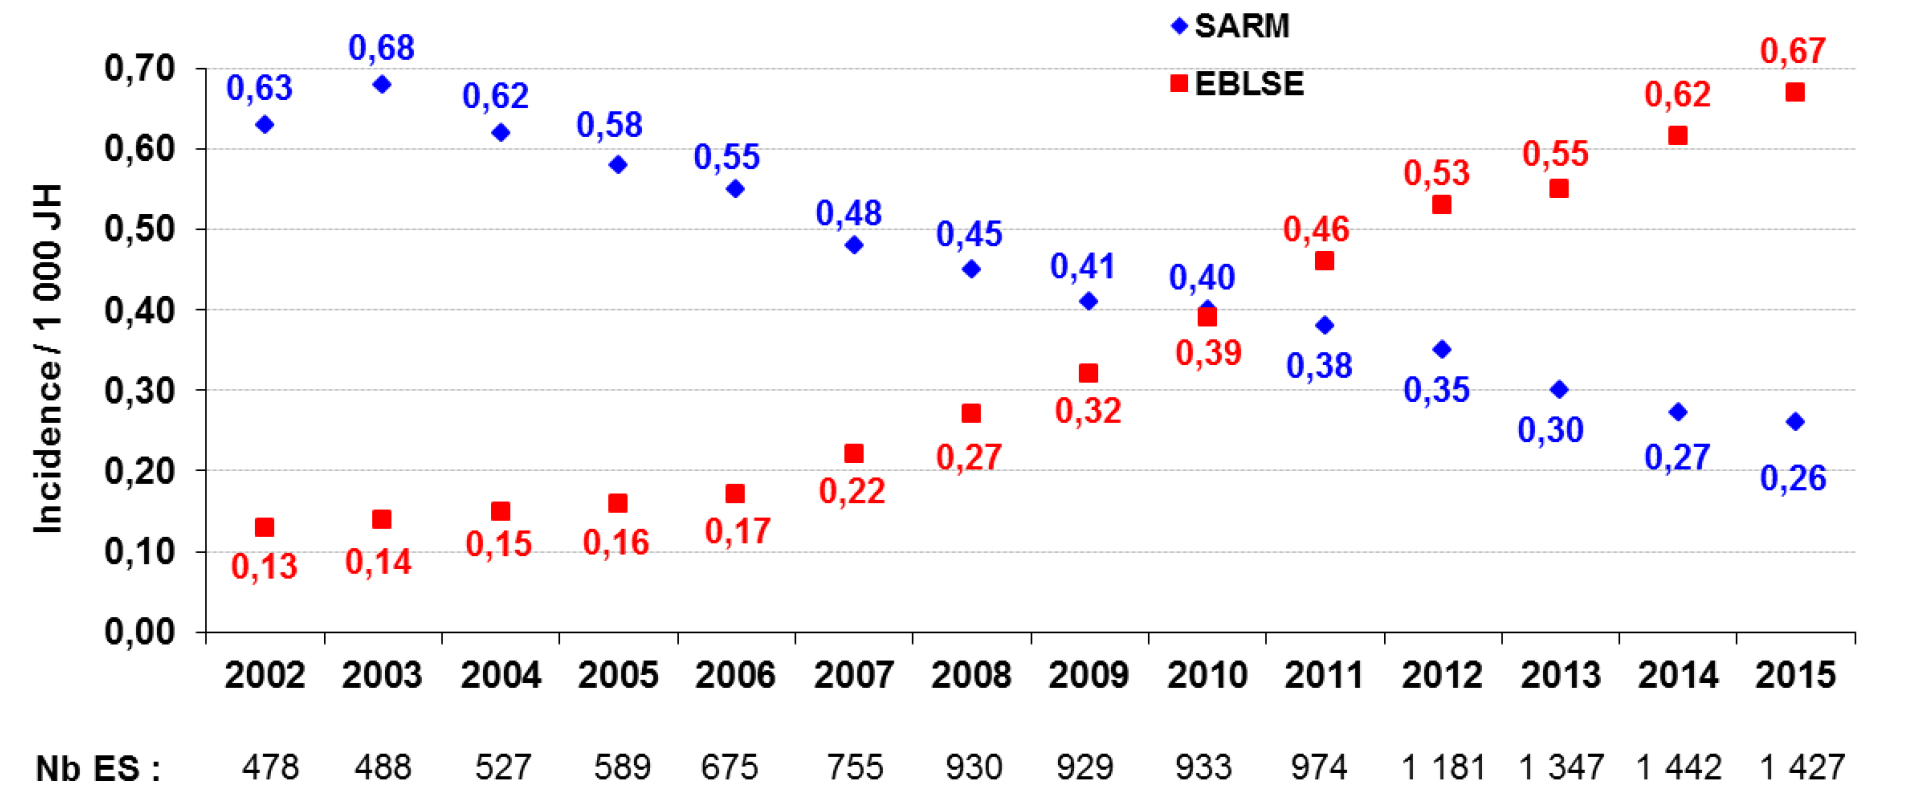
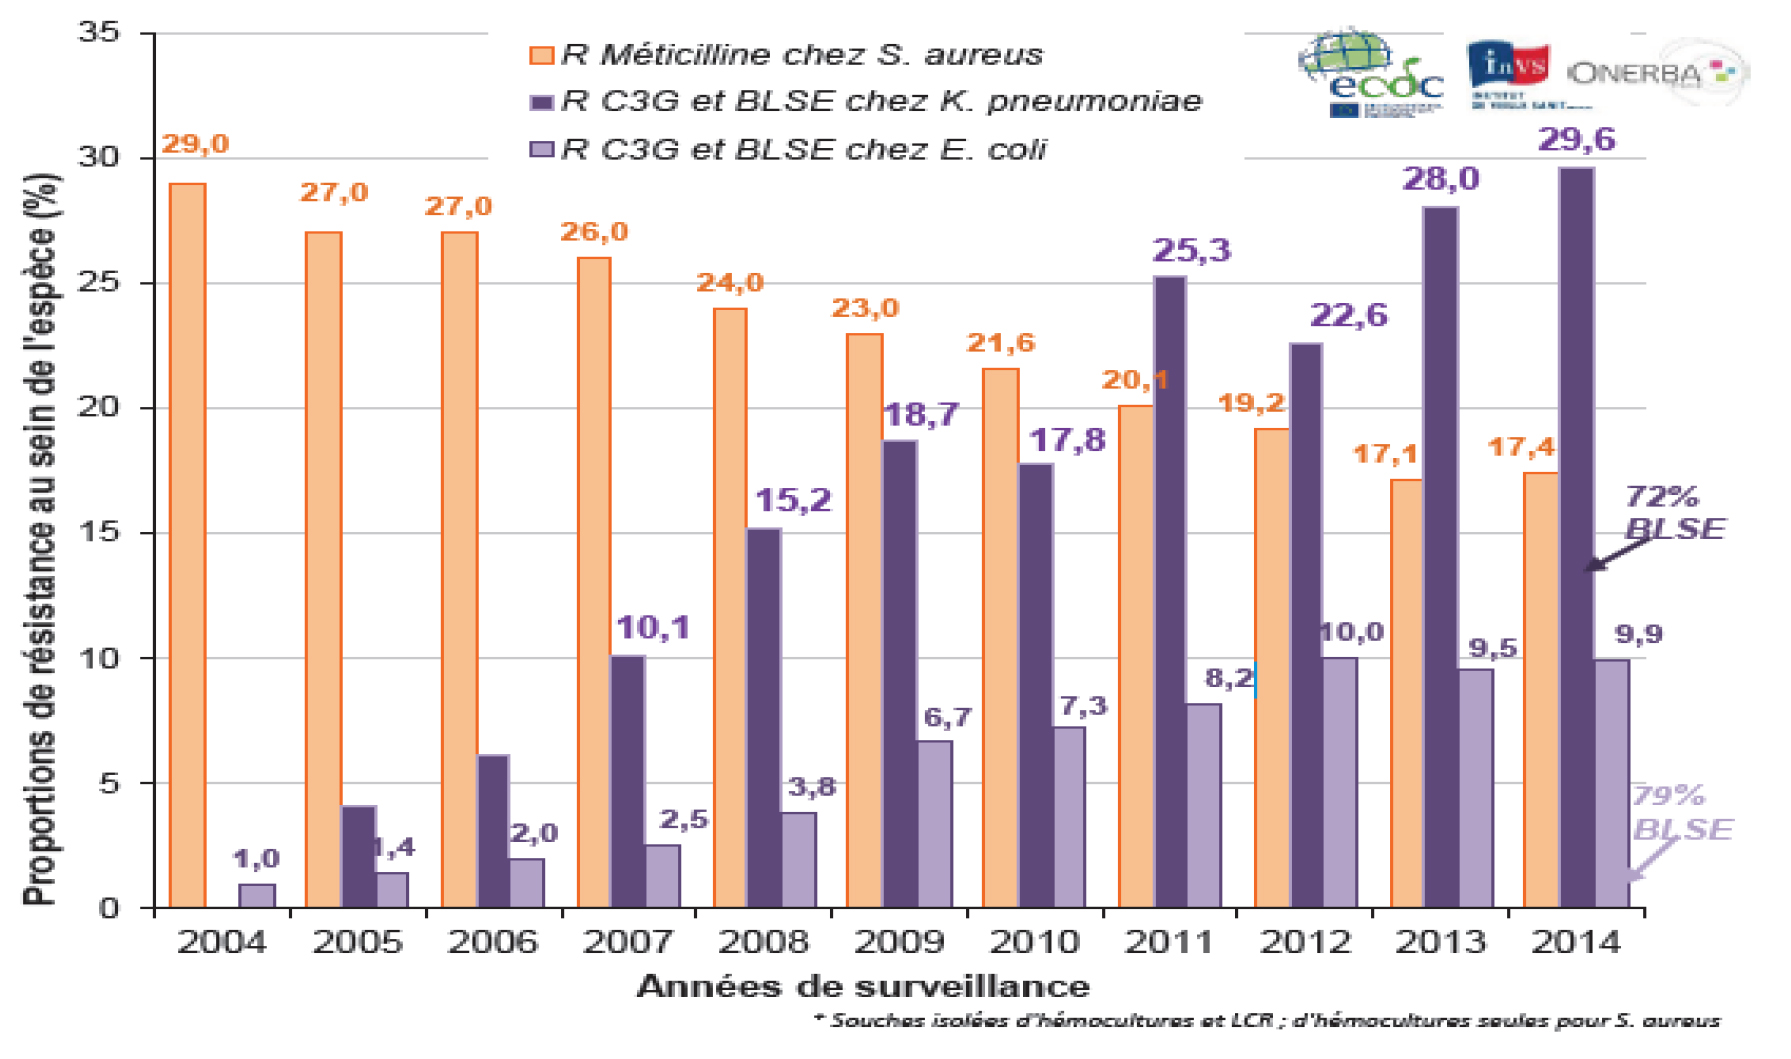
Discovered in the 80s in Europe, the first ESBL were of TEM (TEMoneira) and SHV (SulHydryl Variable) [5, 6] (see Ambler Classification, Annex 2). The majority were K. pneumoniae and were mainly responsible for nosocomial infections. Since now for several years, there is a worldwide spread of ESBL, in particular CT XM subtype (CefoTaXimase – Munich) on the pandemic mode with a predominance of E. coli as a host bacterium, which is largely implicated in urinary tract infections [7, 8]. In France, the incidence of EBLSE is increasing and has overtaken that of girls Staphylococcus aureus resistant to methicillin (MRSA) in hospitals ( Figures 1 and 2;
Annex 3 and 4).

IMROJ 2019-103 - Geier France_F1

Figure 1. BMR-Raisin 2015 – Overall EBLSE Impacts per 1, 000 Hospital Days (JH) (all Health Facilities, n = 1, 427) by region.

IMROJ 2019-103 - Geier France_F2

Figure 2. BMR-Raisin 2015 – Densities of MRSA and different EBLSE bacteremia incidence per 1, 000 JH (annual overall incidence density born) between 2012 and 2015 (n = 698)

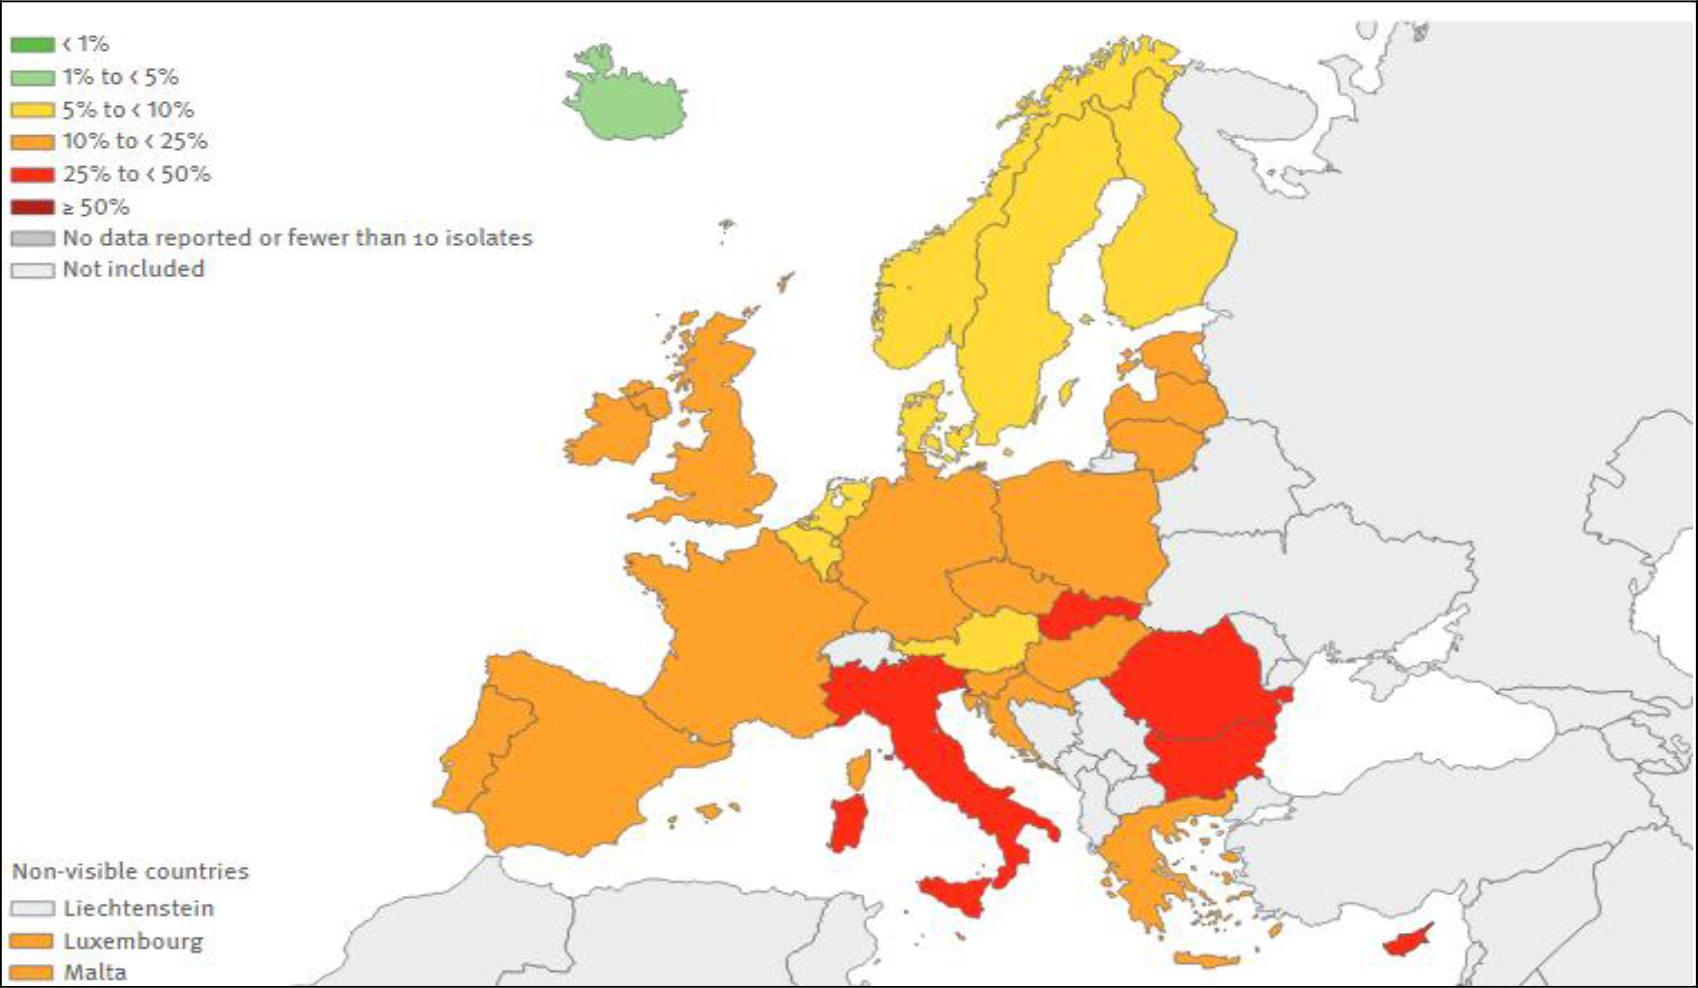
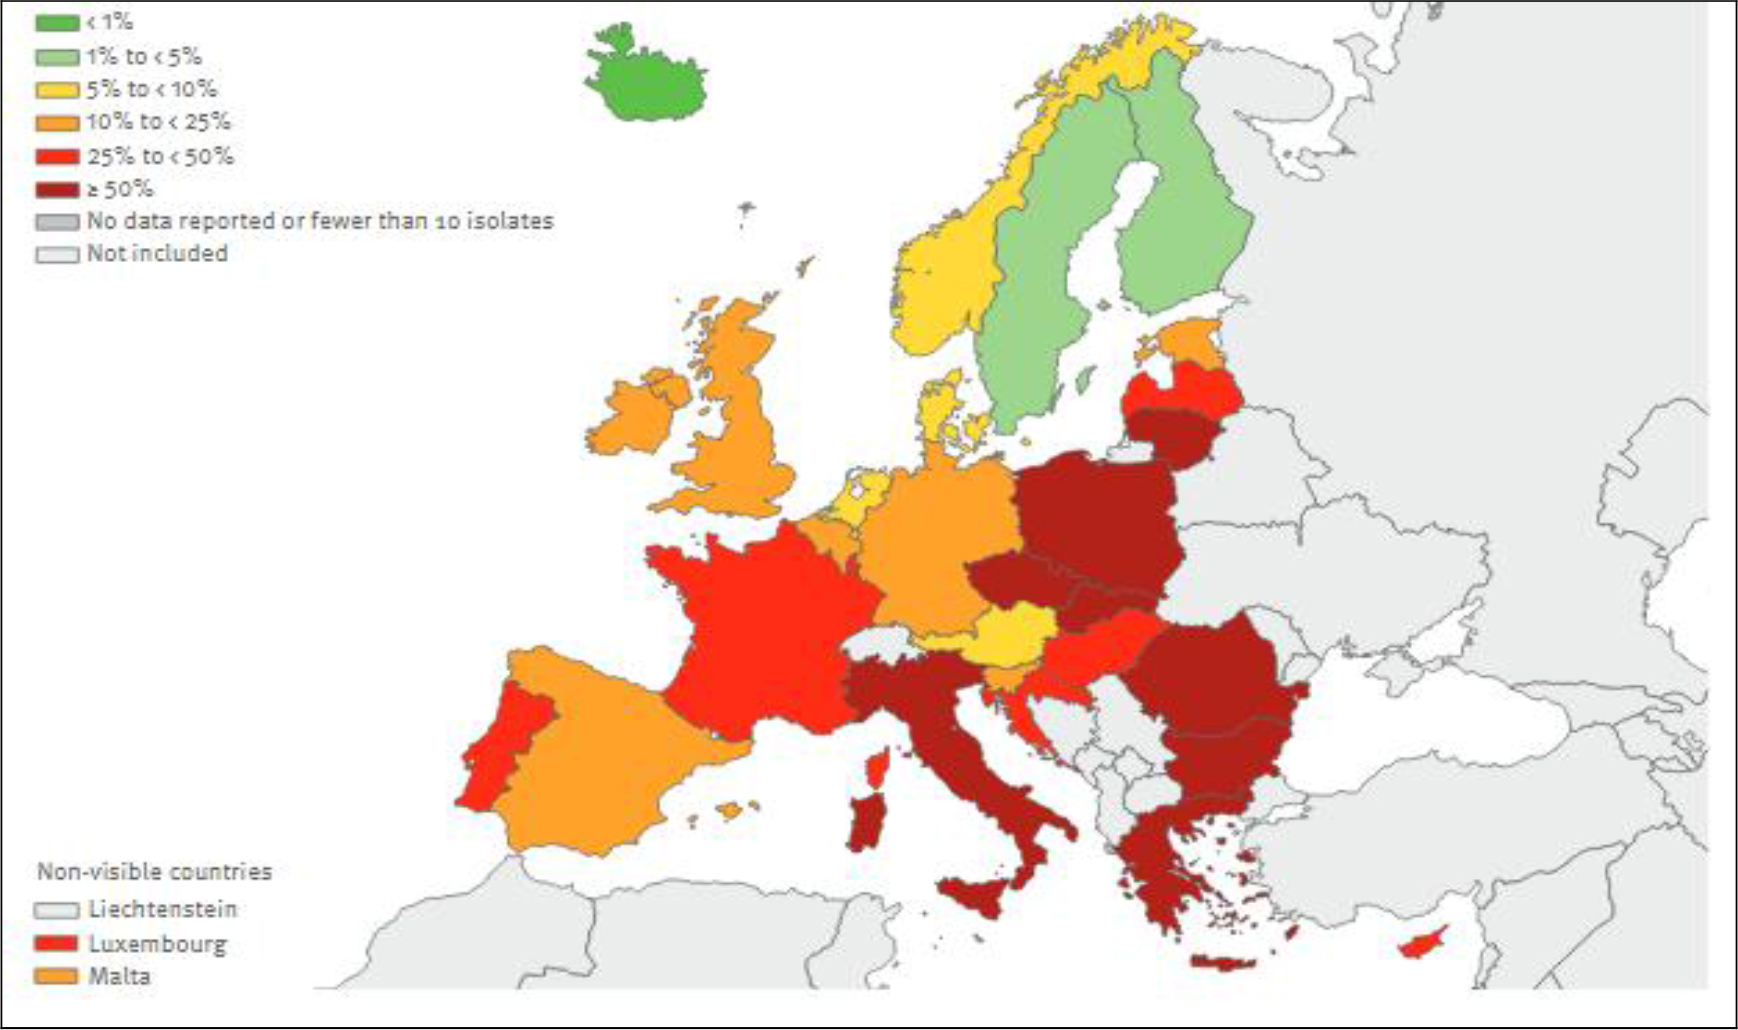
Europe is characterized by a north-south and west-east distribution gradient [10, 11] (Figures 3 and 4).

IMROJ 2019-103 - Geier France_F3

Figure 3. E. Coli. Percentage (%) of invasive isolates with resistance to third- generation cephalosporins, by country, EU/EEA countries, European Centre for Disease Prevention and Control, Antimicrobial resistance surveillance in Europe, 2015

IMROJ 2019-103 - Geier France_F4

Figure 4. K. pneumoniae. Percentage (%) of invasive isolates with resistance to third-generation cephalosporins, by country, EU/EEA countries, European Centre for Disease Prevention and Control, Antimicrobial resistance surveillance in Europe, 2015

Objectives of the study

We conducted a retrospective study from positive levies of enterobacteriaceae producer extended-spectrum β-lactamase, identified in adult patients hospitalized at the Quimper hospital, during the year 2016. The main objective of this study was to evaluate in current practice the therapies administered and their efficacy in case of infection documented at EBLSE, and in particular to study alternative molecules to carbapenems. The secondary objectives were to identify the risk factors presented by these patients and to study the management of the infectious episode.

Method

This is a retrospective observational monocentric study, conducted at the Hospital Center of Quimper, France (population 100000 inhabitants)

  1. Study population and definitions

    The study population is for adults over 15 years old hospitalized during 2016.

    •  Inclusion criteria:

    Included are EBLSE strains isolated from diagnostic specimens made during the survey period in hospitalized patients complete “(Short or long stay), but also outpatients consulting at the hospital or hospitalized for a total period of less than 24 hours. For the definition of EBLSE, the reference is the annual bulletin of the Committee of the antibiogram of the French Society of Microbiology (CA-SFM).

    •  Exclusion criteria:

    Have been excluded (a) strains of EBLSE isolated from ecological samples (eg nose, stool…), that is to say in which we exclusively look for multiresistant bacteria (for example by using selective media containing antibiotics), (b) duplicates defined as strains isolated in a patient for which a strain of the same species and the same antibiotype (same antibiotype = no major difference in terms of clinical categories [S> R or R> S] for antibiotics on the standard list defined by the CA-SFM) has already been taken into account during the survey period, regardless of the diagnostic sampling from which it was isolated.

    Infection was associated with care if it occurred during or after management (diagnostic, therapeutic, palliative, preventive or educational) and was not present or incubated at the beginning of the medical care [12]. This definition was extended to patients residing in long-term care facilities, such as nursing homes for the elderly (EHPAD).

  2. ESBL risk factors

    Certain risk factors recognized as promoting the risk of developing EBLSE infection were sought in all patients. Among these factors, were retained :

    •  Older age

    •  Institutionalization

    •  A history of infection and / or colonization at EBLSE

    •  Long-term hospitalization

    •  Hospitalization in the year preceding admission

    •  A trip abroad during the past year

    •  Medical device in place

  3. The infectious episode

    Were notified: the type of infection and the presence of bacteremia;
    the different types of samples and EBLSE strains isolated for diagnostic purposes, characterized by family, genus, species and subspecies by the microbiologist; the context of care or community; complicated forms (septic shock, abscess…)

  4. Therapeutic

    The first antibiotic treatment administered was retained, with for each patient the type of drug or combination of drugs used and the duration of treatment. Antibiotic therapy was then said to be probabilistic when it was initiated before the nature and / or sensitivity of the microorganism (s) responsible for the infection were known. In case of modification of the therapeutics after reception of the antibiogram, this one was notified. Antibiotic therapy was then said to be documented when it was initiated after knowledge of the nature and / or sensitivity of the microorganism (s) responsible for the infection.

    The use of carbapenems in probabilistic and a possible association with an aminoglycoside and the notion of an opinion taken with an infectious diseases specialist of the hospital center (HC) were also noted.

  5. Become patients

    The evolution was noted as favorable if the patient was considered cured at one month of the end of the treatment. An infectious complication was sought before, during or after antibiotic therapy. In the event of death, it was notified.

  6. Data collection

    The data was collected by the principal investigator from a computer database. They were then retranscribed on a standardized Microsoft Excel ® file

RESULTS

  1. Population

    In total, 74 patients were included. 84 positive samples were identified, with the presence of 10 duplicates that were removed.

    •  Among these patients, the female sex was predominant with 48 women for 26 men

    •  The median age was 80 years [ 18–100].

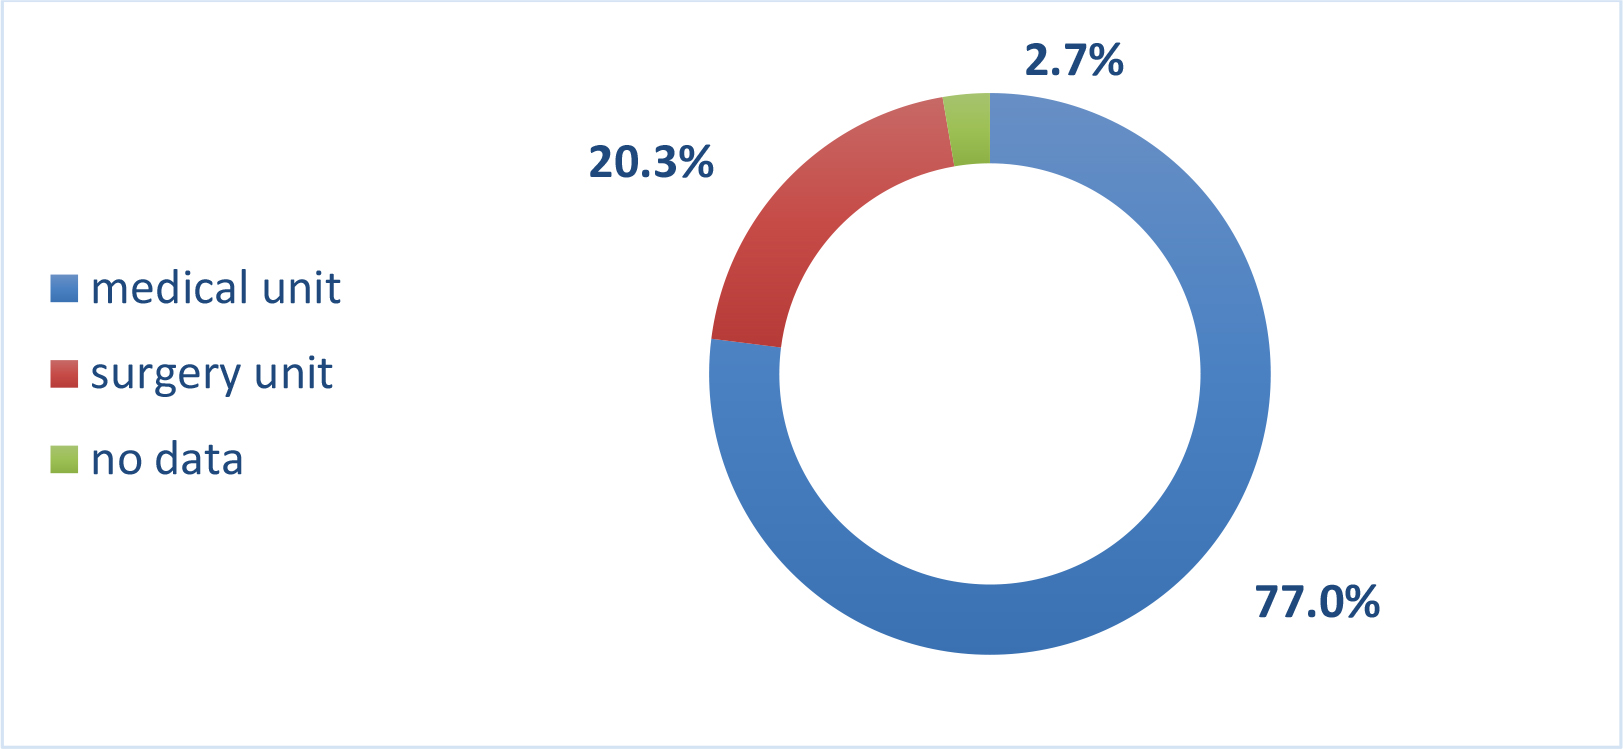
    •  The distribution of patients between a service under a medical care and a surgical service is shown in Figure 5

    •  The median duration of hospitalization was 10 days, with a minimum duration of less than 24 hours during outpatient care, and a maximum duration of 100 days. The average duration of hospitalization was 18 days.

    •  The average time between admission to hospital and the occurrence of infection was 5.5 days. The median was 1 day [0–33].

    It should be noted that the residence data of patients residing in the EHPAD who were not hospitalized at the HC of Quimper were not selected.

    IMROJ 2019-103 - Geier France_F5

    Figure 5. Patients sectorization

  2. ESBL risk factors

    Risk factors for EBLSE infection are shown in Table 1.

    Table 1. Risk Factors for EBLSE Infection of Patients.

    Risk factors

    patients : n; %

    Advanced age ≥ 80 years

    38; 51.4%

    EHPAD (life in an institution)

    22; 29.7%

    History of infection and / or carriage of EBLSE

    16; 21.6%

    Long-term hospitalization ≥ 14 days

    30; 40.5%

    Hospitalization in the year preceding admission

    38; 51.4%

    Travel abroad during the year

    4; 5.4% *

    Medical device in place

    7; 9.5%

    * 30 missing data

    Urinary colonization prior to EBLSE was known in 6 patients (5 patients had colonization with E. Coli, 1 with Citrobacter freundii); 2 patients had an E. coli digestive portage.

    Eight patients had a known history of infection with ESBL E (4 urinary infection and one bile liquid infection with E. coli, one urinary infection with Citrobacter freundii, one urinary tract infection with Enterobacter cloacae complex (E. cloacae complex), one peritonitis Citrobacter freundii).

    Regarding the presence of foreign material, 2 patients had a Percutaneous Implantable Chamber (PIC), a patient with an orthopedic prosthesis, 2 patients with endovascular material such as aortic stents and a dialysis catheter, 2 patients with invasive urological material. cysto- catheter type and JJ probe. It should be noted that the presence of an indwelling urinary catheter has not been noted. In total, 7 patients (9.5%) had a medical device in place.

  3. The infectious episode

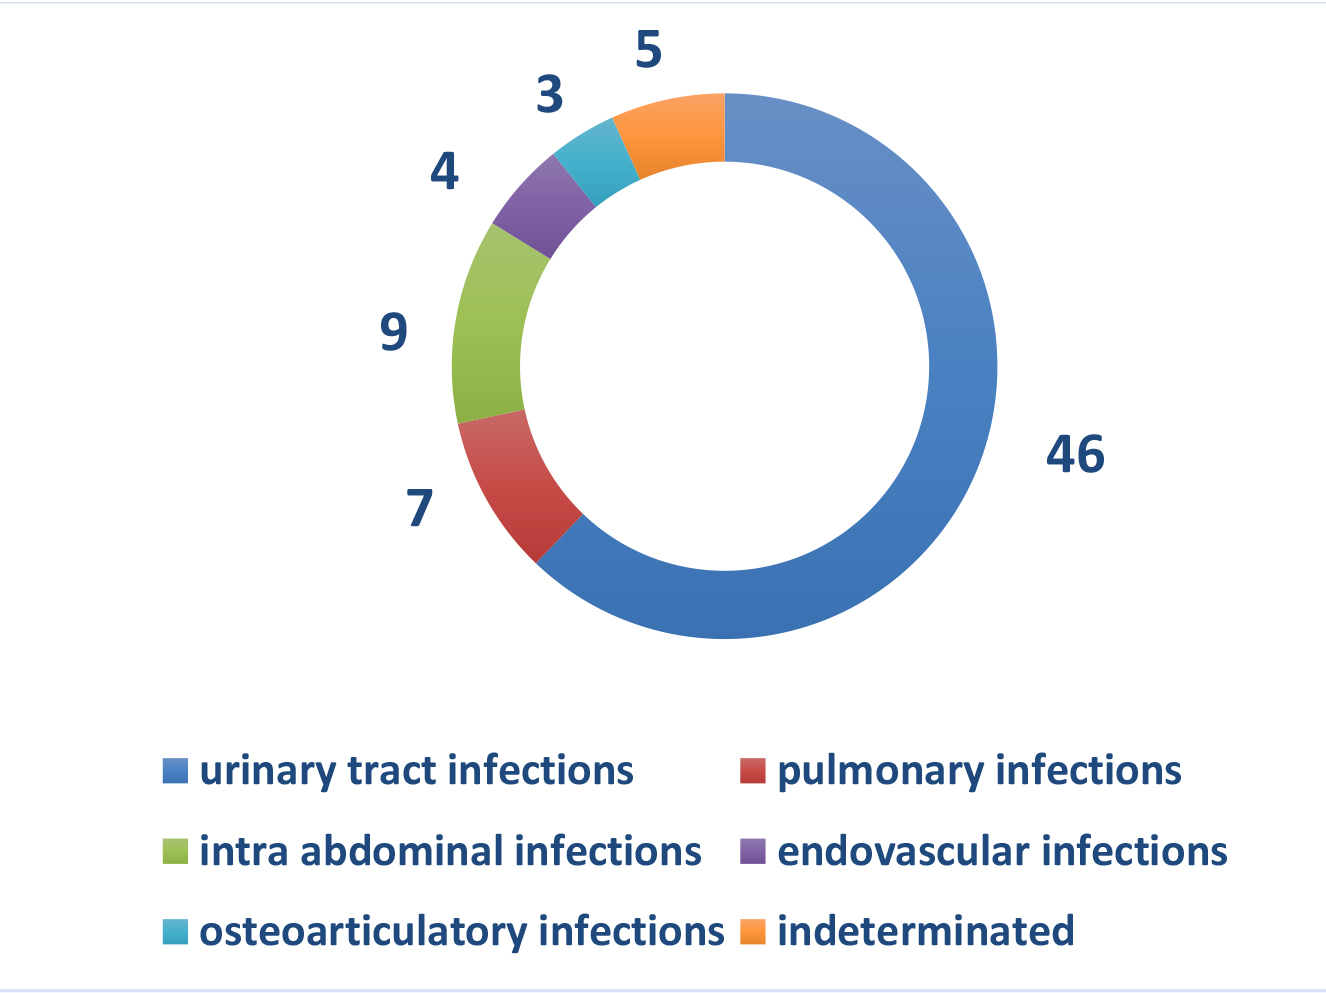
    The different types of infections that have occurred are shown in Figure 6.

    IMROJ 2019-103 - Geier France_F6

    Figure 6. Nature of infectious episodes

    46 patients (62.2%) had clinical signs of urinary tract infection. 9 patients (12.3%) had an intra-abdominal infection, 7 patients (9.4%) had signs of low respiratory infections

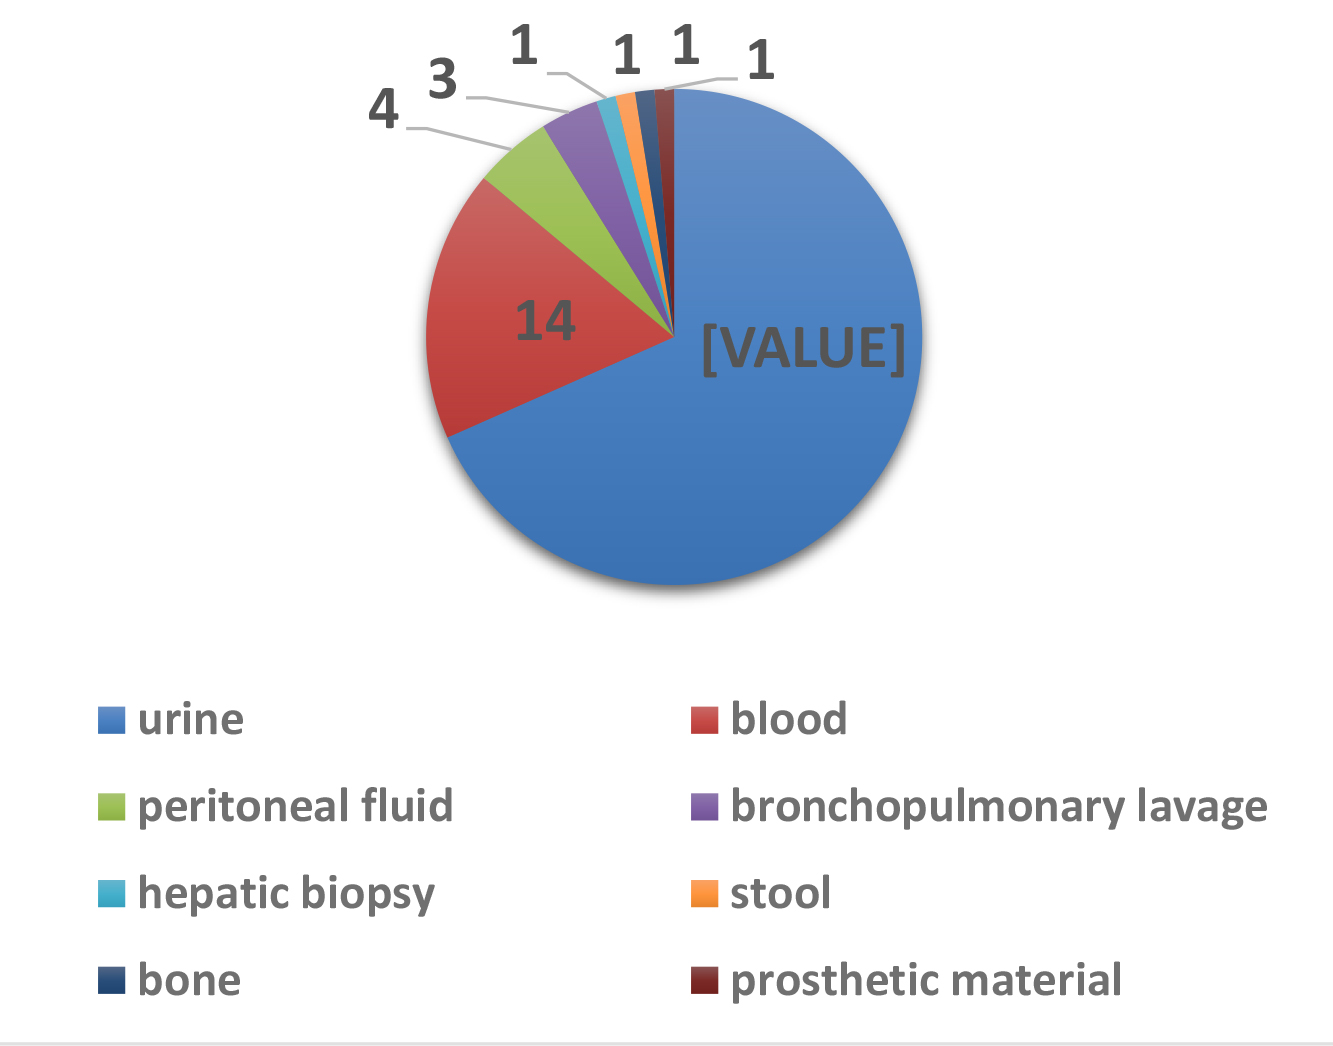
    The different types of sampling that showed an EBLSE are shown in Figure 7.

    IMROJ 2019-103 - Geier France_F7

    Figure 7. Collection types

    The allocation of enterobacteriaceae species is shown in Table 2.

    Table 2. Distribution of Enterobacteriaceae

    species

    n; %

    urine

    Blood cultures

    E. coli

    54 (72.9%)

    41

    9

    E. cloacae complex

    12 (16.2%)

    8

    4

    K. pneumoniae

    4 (5.4%)

    2

    1

    Citrobacter freundii

    2 (2.7%)

    2

    Citrobacter koseri

    1 (1.4%)

    1

    Salmonella enterica

    1 (1.4%)

    E. coli was the most common uropathogen. It was present in 54 cases (41 ECBU, 9 blood cultures, other samples not detailed). The second specie most frequently isolated was E. cloacae complex present in 12 cases (8 ECBU, 4 blood cultures, other samples not detailed). There were 4 cases of K. pneumoniae infection.

    Bacteremia was present in 14 cases (19.0%).

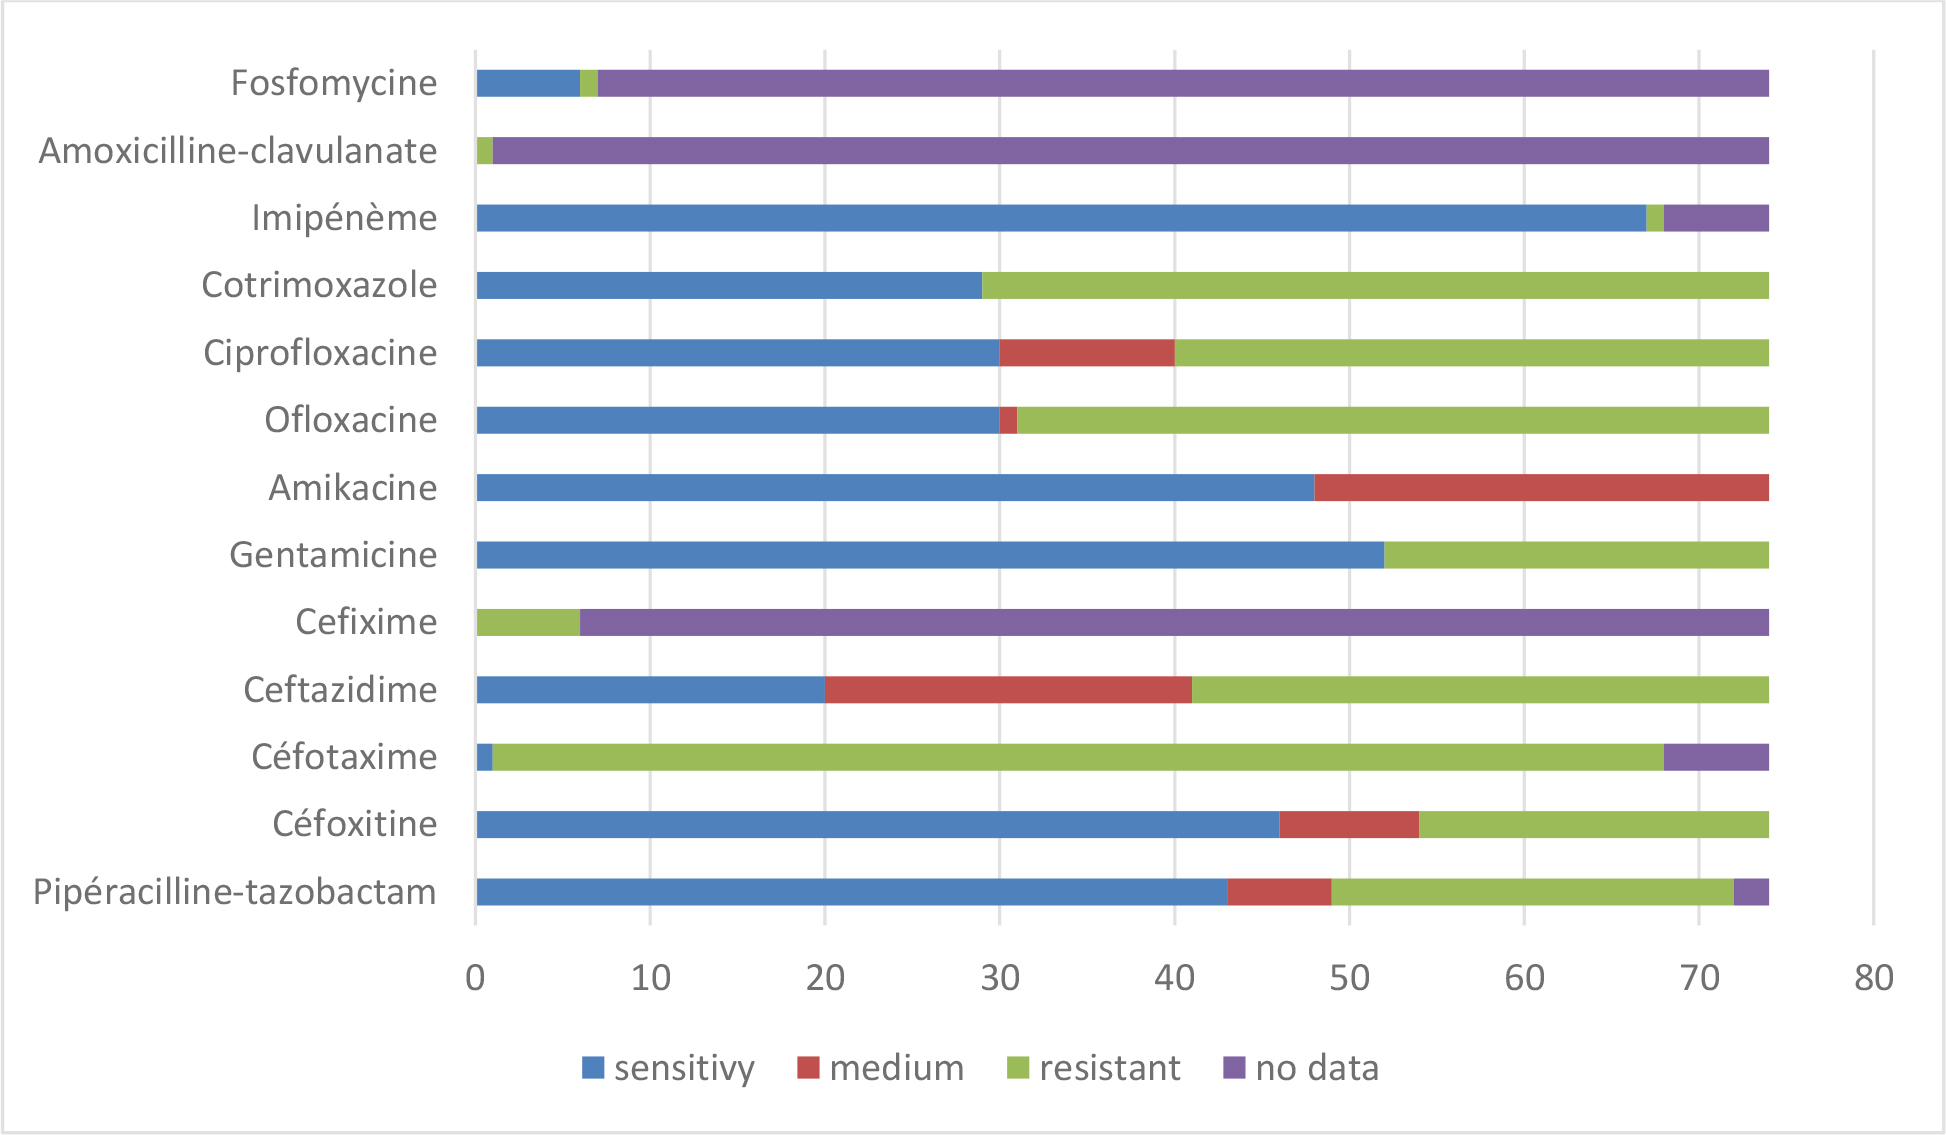
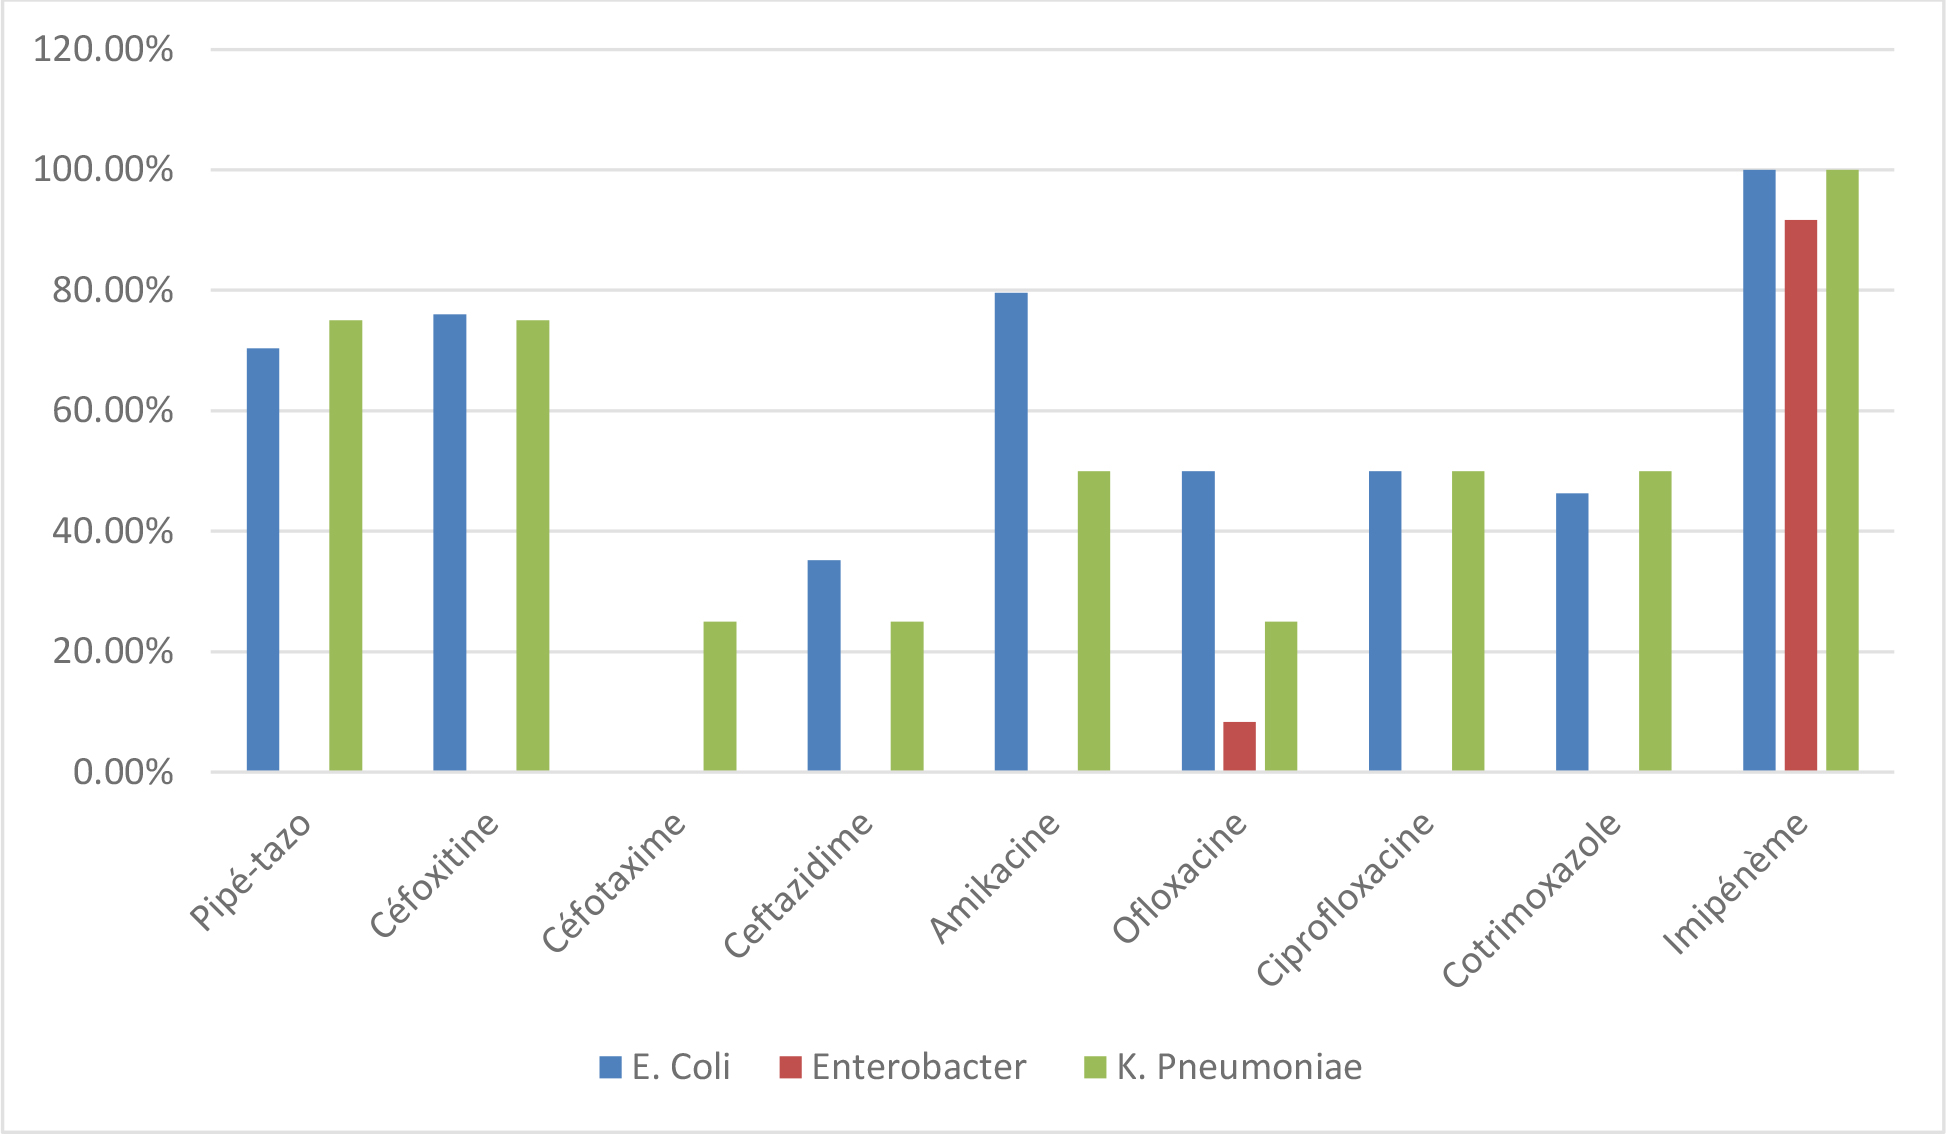
    The susceptibility profiles of the different molecules tested are represented Figure 8. Only one strain had a carbapenem resistance profile (E. cloacae complex). The sensitivity profile of the 3 most common bacteria is described in Figure 9.

    IMROJ 2019-103 - Geier France_F8

    Figure 8. Sensitivity profile of antibiotic strains

    IMROJ 2019-103 - Geier France_F9

    Figure 9. Sensitivity profile of the 3 most frequently isolated bacteria

    It is estimated that the infection was associated with care in at least 29 cases:

    Patients infected with EBLSE n = 74

    •  ESBL possibly acquired (delay> 48 hours) n = 29

    •  Carriage of Imported ESBL (time ≤ 48 hours) n = 36

    Missing data n = 9

  4. Treatment

    A total of 47 patients (63.5%) received antibiotic therapy. 15 patients did not receive anti-infectious treatment. Data was missing for 12 patients.

    •  Probabilistic antibiotic therapy

    The strategies for choosing initial antibiotic therapy are detailed in Table 3.

    Table 3. Probabilistic antibiotic therapy.

    antibiotics

    All infections, n; %

    amoxicillin

    2; 3.2%

    Amoxicillin-clavulanate

    3; 4.8%

    ceftriaxone

    12; 19.5%

    Ceftriaxone + metronidazole

    5; 8.1%

    Piperacillin-tazobactam

    3; 4.8%

    Piperacillin Tazo + aminoglycoside

    1; 1.6%

    Piperacillin Tazo + glycopeptide

    1; 1.6%

    Aztreonam-linezolid

    1; 1.6%

    cefepime

    1; 1.6%

    carbapenems

    7; 11.3%

    Carbapenem + aminoglycoside

    2; 3.2%

    fluoroquinolones

    3; 4.8%

    pristinamycin

    1; 1.6%

    Fosfomycine trometamol

    2; 3.2%

    cotrimoxazole

    2; 3.2%

    furans

    1; 1.6%

    No treatment

    15; 24.3%

    Total

    62

    The most used molecule was ceftriaxone. Of the patients who received the piperacillin-tazobactam combination, none had a known history of EBLSE carriage but their period of hospitalization was> 48 hours. Among patients who received imipenem, one patient had a history of urinary infection with E. coli ESBL and another with Citrobacter freundii ESBL, a patient had a history of peritonis with Citrobacter freundii; the other patients had been hospitalized for more than 48 hours.

    Probabilistic antibiotic therapy was considered active in 21 cases out of 47 treated patients, ie 44.7% of cases.

    •  Documented antibiotic therapy

    After reassessment, antibiotic therapy was modified in 19 cases. The choice of antibiotherapy after microbiological documentation and knowledge of the antibiogram are detailed Table 4.

    Table 4. Antibiotic for second line

    antibiotics

    n = 19; %

    Amoxicillin- clavulanate

    4; 21.1%

    Ceftazidime-ofloxacin

    1; 5.3%

    Piperacillin Tazo + aminoglycoside

    1; 5.3%

    Fluoroquinolone alone

    5; 26.2%

    cotrimoxazole

    1; 5.3%

    carbapenems

    5; 26.2%

    furans

    1; 5.3%

    temocillin

    1; 5.3%

    Of the 19 patients who received a therapeutic modification, only one died.

    A third generation cephalosporin (C3G), ceftriaxone, was used in probabilistic for 17 patients. Among them, a therapeutic modification took place for 12 patients. It should be noted that of the 17 patients treated with C3G, 2 died (one left on unsuitable probabilistic antibiotic therapy), 2 had deep abscesses, one patient had severe sepsis. Inadequate initial treatment seemed effective for 4 patients.

    •  Provision of the opinion of an infectious disease specialist

    In 28 cases only, treatments were advised by an infectious diseases specialist, leading to the prescription of a carbapenem in 9 cases, a β- lactamin – β- lactamases inhibitors (BL-IBL) in 8 cases (3 times amoxicillin-clavulanic acid and 5 times piperacillin-tazobactam), one fluoroquinolone in 3 cases, cotrimoxazole in 1 case.

    De-escalation strategies were more frequent when infectious advice was given.

    It should be noted that 5 of 28 patients carried a medical device. Of these 28 patients, 3 died as a result of EBLSE infection.

    •  Processing times

    It was difficult to evaluate treatment times because of their heterogeneity due to the various pathologies and the many missing data because they were not found in patients’ files. However, the median duration of treatment at 10 days can be evaluated with a minimum duration of one day and a maximum duration of approximately 90 days (especially in the osteoarticulatory infections), for an average duration of 12.9 days, all infections combined.

  5. Evolution

    The evolution was favorable for 64 patients (2 patients lost to follow-up). Among the complications found : 8 deaths, 2 septic shock favorable, unspecified epilepsy with imipenem, two patients presented deep abscesses, a patient presented with clostridium difficile colitis.

    4 patients died while initial antibiotic therapy was considered active.

Discussion

In general, the choice of antimicrobial therapy taking into account microbiological data is essential : mortality is higher if effective treatment initiation is delayed or inactive on EBLSE. Carbapenem treatments are associated with the lowest mortality. But the use of this class of antibiotics in the presence of ESBL also promotes the emergence of other enzymes, the metallo- beta-lactamases that hydrolyze carbapenems (CPE) and render them ineffective. In order to limit this risk, the use of antibiotic molecules that are alternative to carbapenems and frequently active in vitro on EBLSE has been encouraged. Some β- lactams (such as cephamycins, temocillin, aztreonam (AZT), the mecillinam, the BL-IBL associations or C3G) retain in vitro activity on certain ESBLE [13]. Since 2009, CA-SFM has modified the critical levels of C3G and AZT for Enterobacteriaceae based on proposals made by the European Committee on Antimicrobial susceptibility Testing (EUCAST) [14]. Thus, a strain is, since 2009, categorized Sensitive (S) when the MIC of C3G and AZT is ≤ 1 mg / L whereas it was previously when CMI was ≤ 4 mg / L. To encourage these carbapenem saving practices, the CASFM issued a press release in 2011 recommending no longer interpretative reading for the codification of Enterobacteriaceae strains having acquired mechanisms of resistance to C3G and AZT, but while continuing to detect the ESBL to monitor their evolution. But the clinical efficacy of these molecules compared to carbapenems is debated [15].

The main objective of this study was to evaluate in current practice the therapies administered and their efficacy in the case of EBLSE – documented infection, and in particular to study alternative molecule to carbapenem. The secondary objectives were to identify the risk factors presented by these patients and to study the management of the infectious episode.

This work is original insofar as it is concerned with the current practice of a resistant germ infection in a secondary HC. It is heterogeneous because it covers several sites of infection and several bacterial species.

In this study, the risk factors for EBLSE infection are generally those described in the literature, but with several limitations.

Patient comorbidities and history of immunosuppression have not been identified, nor the concept of recurrent urinary tract infections. Regarding the medical device in place, the presence of a current bladder catheter or in the previous 3 months was not sought. Hospitalization in the year preceding admission was sought but was not mentioned prior treatment with the β- ctamines and / or fluoroquinolones. [16] There were few patients who traveled to areas known to be at risk of colonization and / or EBLSE infection. In addition, the search for an earlier colonization resistant germ was made only on the Quimper hospital and therefore remains very limited. The children have not been included. More than half of the patients had an advanced age ≥ 80 years and almost a third lived in EHPAD. The predominance of women and urinary tract infections at EBLSE are consistent with the literature. Regarding the community or nosocomial origin, the data are also in agreement with the literature, confirming that the EBLSE are far from being present only in the hospital [17].

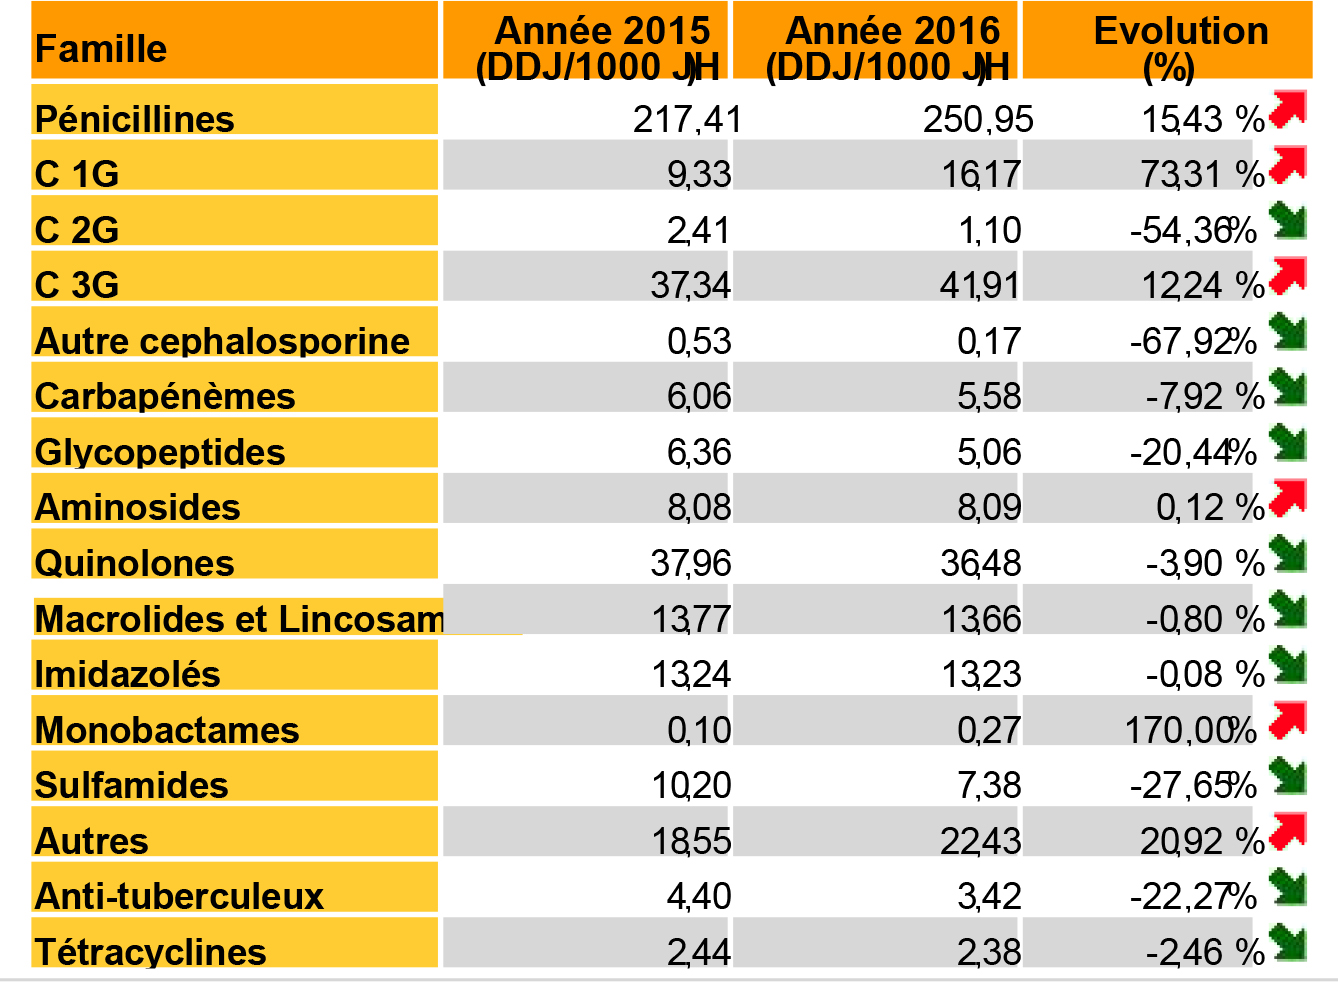
During the year 2016, 108 adult patients had a positive diagnostic specimen at EBLSE. Only 74 patients were included in this study. In 2015, we find a number of patients equivalent with a positive diagnostic sample at EBLSE. Between 2015 and 2016, hospital of Quimper has seen its consumption of antibiotics increase, especially that of C3G and monobactams (cf. report ConsoRes 2016, evaluating antibiotic consumption and resistance monitoring s in Quimper HC, compared to institutions same size, Annex 5). Amoxicillin- clavulanate remains the most widely used antibiotic. On the other hand, there is less consumption of fluoroquinolones and carbapenems.

If we look at the 3 main enterobacteria found in this study, we note that the percentage of resistance of E. coli and K. pneumoniae to cefotaxime is decreasing between 2015 and 2016. On the other hand, it is increasing for Enterobacter cloacae. Resistance to fluoroquinolones also appears to be increasing for E. coli and E. cloacae. Carbapenem resistance is dissociated with a decrease in overall resistance to imipenem but an increase in resistance to ertapenem.

The question of antibiotic therapy of choice in EBLSE infections remains debated. In this work, the most used probabilistic antibiotic therapy was a C3G, often prescribed as soon as the patient was admitted to the hospital and most of the time via the Emergency Reception Service, followed by a carbapenem. AZT has hardly been used. C3G such as ceftriaxone and cefotaxime remain molecules often used in probabilistic. Here, ceftriaxone appeared to be effective in only 4 cases. Each time, it was an urinary tract infection with E. coli, no infectious advice was taken, and the antibiogram showed “ not rendered “ in 2 cases and “ R “ in the other 2 cases. AZT was used once, in the case of an osteoarticulatory infection with E. cloacae complex with favorable evolution. After microbiological documentation, only one patient received C3G (ceftazidime), in combination with a fluoroquinolone, as part of an E. coli PIC infection and after consultation with an infectious disease specialist. Successful treatment of EBLSE with C3G has been reported in clinical cases or retrospective studies [18, 19]. It is nevertheless a small number of patients and mixed success. Their use seems possible in the case of mild and low inoculum EBLSE infections due to strains with low minimum inhibitory concentration (MIC). Some literature data suggest that when probabilistic C3G therapy is compared to probabilistic carbapenem or BL-IBL treatment, the mortality rate is higher with C3G therapy [20].

In this study, BL-IBLs such as amoxicillin- clavulanate and piperacillin-tazobactam were frequently used and mostly effective in urinary tract infections, in two cases of low respiratory tract infections, one with E. Coli and the other with K. pneumoniae, and in one case of intra-abdominal E. coli infection, whether in probabilistic or microbiological documentation. In re-evaluating the crude results of antibiograms for BL-IBL, EUCAST has also facilitated their potential therapeutic use for susceptible categorized strains, but only in cases of urinary tract infection and / or bacteremia with a urinary origin [14].

The carbapenems were prescribed as empiric antibiotic therapy in patients when ESBL colonization was known, in appropriate antibiotic therapy in case of failure or resistance to initial treatment. These attitudes are consistent with the recommendations for the proper use of carbapenems. In the litterature, some studies found a carbapenem superiority compared to BL-IBL [21] while others conclude noninferiority of BL-IBL on carbapenems [22, 23]. These results are encouraging to limit the emergence of carbapenemases. Nevertheless, one should be wary of the inoculum effect observed with piperacillin-tazobactam and which could lead to clinical failures whereas the MIC in vitro was low with a labeled antibiotic [24]. Current evidence suggests that the use of BL-IBL for the treatment of EBLSE infections would be effective, if certain conditions are met such as a low MIC, a low inoculum and a sufficient antibiotic dose with extended infusion.

No molecule of the cephamycin class was used. Cefoxitin has in vitro efficacy against ESBL but its use still seems limited because its clinical and microbiological efficacy has not been evaluated. A study is in progress (COLIFOX Trial) evaluating the non-inferiority of cefoxitin versus imipenem in the treatment of urinary tract infections and ESBL-sensitive E. coli bacteremia in vitro.

Other antibiotics do not belong to the family of the β- lactamine were also used : cotrimoxazole, fluoroquinolones, furans and fosfomycin. These last two molecules can be the treatment of choice for urinary infections such as cystitis [25]. However, antibiograms were poorly reported for fosfomycin and furans in our study. Cotrimoxazole has low sensitivity rate for Enterobacteriaceae in general and especially for ESBLE. Its sensitivity rate here is less than 30% for all strains. However, they may be of great interest in the future, given the emergence of resistance. Fluoroquinolones have rarely been used as first, but turn out as frequent as carbapenems in second line. However, the use of carbapenems is sometimes necessary and the only recourse, when one focuses on resistance profiles to the class of fluoroquinolones.

The opinion of an infectious disease specialist is very often necessary because of the complexity of the clinical and microbiological care. Strategies for climbing or de-escalating must be argued all the more in the presence of resistant germs. In order to limit the emergence of resistance, it seems essential to justify broad-spectrum antibiotic prescriptions in complex and serious cases as well as in simple cases.

The analysis of the treatment durations finds very heterogeneous results in connection with various pathologies ranging from urinary infection to osteoarticular infection. Whenever a carbapenem was prescribed, an infectious advice had been taken beforehand, limiting the inappropriate duration of treatment.

Eight patients died during the course of EBLSE infection, ie 10.8%. This figure appears to be lower than the death rate described in the literature (between 20% and 60%) [26, 27], probably due to the fact that this cohort is only part of the population that has had EBLSE infection during the year 2016 in a hospital center. In addition, the literature often reports serious infections; here, community infections have also been reported.

Although this study is limited by the fact of its retrospective, monocentric character, with sometimes inaccurate data and without a control group, it does however highlight quite different therapeutic possibilities in case of EBLSE infection. The carbapenems are far from the only effective molecules and their need is not evident in the literature. Prospective studies are expected to try to close the debate. Progress can still be made, particularly on the management of infectious episodes, by improving the communication between emergency-specialists-infectiologists-organ specialists and microbiologists, by being vigilant with fragile patients who have undergone several prior antibiotics and potentially carriers of germs (s) resistant, so that hygiene measures are put in place upon admission to hospital, which is rarely the case.

Conclusion

ESBL enterobacterial infections represent a major therapeutic challenge. Some molecules seem to position themselves as therapeutic alternatives to carbapenems, including BL-IBL, or even other classes after microbiological documentation, if we follow the recommendations of EUCAST and CA-SFM.

In view of the evolution of bacterial resistance and the lack of innovation in antibiotic therapy, the safeguarding of antibiotics requires a reasoned use of the molecules conventionally used, a new exploitation of previously neglected molecules, an innovation in terms of association and improvement in preventing the transmission of multidrug-resistant bacteria (28).

ABREVIATIONS LIST

AZT : aztreonam

BL-IBL: β- lactam – β- lactamases inhibitors

ESBL : extended spectrum β- lactamase

BMR: multi-resistant bacterium

C3G : C éphalosporines 3rd generation

CA-SFM : Committee of the antibiogram of the French Society of Microbiology

CCLIN: Coordination Center for the Fight against Nosocomial Infections

CIP : Percutaneous Implantable Chamber

CPE : carbapenemase-producing Enterobacteriaceae

CTX-M: cefotaxime

EBLSE: Enterobacteria producing ESBL

ECBU: Cyto-bacteriological examination of urine

E. cloacae : Enterobacter cloacae

E. Coli : Escherichia coli

EHPAD: Accommodation facility for dependent elderly people

EPC : Enterobacteria producing carbapenemases

EUCAST : European Committee on Antimicrobial Susceptibility Testing

HC : hospital center

“I : Intermediate

JH : Day of Hospitalization

K. pneumoniae : Klebsiella pneumoniae

MIC : minimum inhibitory concentration

MRSA : Staphylococcus Aureus Meticillin Resistant

RAISIN: Network of Alert, Investigation and Surveillance of Nosocomial Infections

“R” : Resistant

“S” : Sensible

MRSA: Staphylococcus Aureus Meticillin Resistant

References

  1. Pitout JD, Laupland KB (2008) Extended-spectrum betalactamase -producing Enterobacteriaceae : An emerging public-health concern. Lancet Infect Dis 8: 159–66.
  2. Arias CA, Murray BE (2009) Antibiotic-resistant bugs in the 21st century- A clinical super-challenge. N Engl J Med 360: 439–43.
  3. European Center for Disease Prevention and Control. Carbapenemase -producing bacteria in Europe: Interim results from the European Survey on carbapenemase producing Enterobacteriaceae (EuSCAPE) project. Stockholm: ECDC; 2013.
  4. Vora, R. Auckenthaler (2009) What does mean “ broad spectrum beta- lactamases “ in practice ? Rev Med Switzerland 5 : 1991–4.
  5. Knothe H, Shah P, Krcmery V, Antal M, Mitsuhashi S (1983) Transferable resistance to cefotaxime, cefoxitin, cefamandole and cefuroxime in clinical isolates of Klebsiella pneumoniae and Serratia marcescens . Infection 11: 315–317.
  6. Sirot D, Sirot J, Labia R, Morand A, Courvalin P, Darfeuille- Michaud A, et al. (1987) Transferable resistance to third-generation cephalosporins in clinical isolates of Klebsiella pneumoniae: identification of CTX-1, a novel beta-lactamase. J Antimicrob Chemother 20: 323–334.
  7. Hull TM, Baquero F, Canton R (2008) Increasing prevalence of ESBL-producing Enterobacteriaceae in Europe. Euro Surveill Bull Eur On Mal Transm Eur Commun Dis Bull 2008 : 13.
  8. Zahar JR, Ball E, Schnell D, Lantern F, Mechai F, Mass V, et al. (2009) [Extension of beta-lactamases producing bacteria is a worldwide concern]. MS Sci Medicine 25: 939–944.
  9. Network of alert, investigation and surveillance of nosocomial infections, RAISIN 2015.
  10. Paterson DL, Bonomo RA (2005) Extended-spectrum beta-lactamases: a clinical update. Clin Microbiol Rev 18: 657–686.
  11. Proportion of invasive E. coli strains resistant to 3rd generation cephalosporins, Europe, 2015 . European Antimicrobial Resistance Surveillance Network (EARS-Net) .
  12. Definition of Care Associated Infections – Technical Committee for Nosocomial Infections and Care-Related Infections. Ministry of Health, Youth and Sports (2007).
  13. Fournier D, Chirouze C, Leroy J, Cholley P, Talon D, Plesiat P, et al. (2013) Alternatives to carbapenems in ESBL- producing Escherichia coli infections. Medicine and infectious diseases 43: 62–6.
  14. Leclercq R, Canton R, Brown DF, Giske CG, Heisig P, MacGowan AP, et al. (2013) EUCAST expert rules in antimicrobial susceptibility testing. Clinical Microbiology and Infection: The official publication of the European Society of Clinical Microbiology and Infectious Diseases 19: 141–60.
  15. Harris PN, Tambyah PA, Paterson DL (2015) beta-lactam and beta-lactamase inhibitor compounds in the treatment of extended-spectrum beta-lactamase producing Enterobacteriaceae : time for a reappraisal in the era of few antibiotic options? Tea Lancet Infectious diseases 15: 475–85.
  16. Rodríguez-Baño J, Alcalá JC, Cisneros JM, Grill F, Oliver A, Horcajada JP, et al. (2008) Community infections caused by extended-spectrum beta-lactamase-producing Escherichia coli. Arch Intern Med 168: 1897–1902 .
  17. Saltoglu N, Karali R, Yemisen M, Ozaras R, Balkan, II, Mete B, et al. (2015) [Escherichia coli and antimicrobial activities]. International journal of clinical practice. 2015.
  18. Paterson DL, Ko WC, Von Gottberg A, Casellas JM, Mulazimoglu L, Klugman KP, et al. (2001) Outcome of cephalosporin treatment for serious infections due to apparently susceptible producing extended-spectrum beta-lactamases: implications for 69 the clinical microbiology laboratory. Journal of clinical microbiology 39: 2206–12.
  19. Rodriguez- Bano J, Picon E, Navarro MD, Lopez- Cerero L, Pascual A (2012) Impact of changes in CLSI and EUCAST breakpoints for susceptibility in bloodstream infections due to extended-spectrum beta-lactamase-producing Escherichia coli. Clinical Microbiology and Infection: The official publication of the European Society of Clinical Microbiology and Infectious Diseases. 18: 894–900.
  20. Rodriguez- Bano J, Picon E, Gijon P, Hernandez J, Ruiz M, Pena C, et al. (2010) Community onset bacteremia due to extended-spectrum beta- lactamase-producing Escherichia coli: risk factors and prognosis. Clinical Infectious Diseases: an official publication of the Infectious Diseases Society of America. 2010; 50: 40–8.
  21. Ofer- Friedman H, Shefler C, Sharma S, Tirosh A, Tal-Jasper R, Kandipalli D, et al (2015) Carbapenems Versus Piperacillin- Tazobactam for Bloodstream Infections of Nonurinary Source Caused by Extended-Spectrum Beta-Lactamase-Producing Enterobacteriaceae . Infect Control Hosp Epidemiol 2015: 1–5.
  22. Harris PN, Yin M, Jureen R, Chew J, Ali J, Paynter S, et al. (2015) Comparable outcomes for beta-lactam / beta-lactamase inhibitor combinations and carbapenems in definitive treatment of bloodstream infections caused by cefotaxime-resistant Escherichia coli or Klebsiella pneumoniae. Antimicrobial resistance and infection control 4: 14.
  23. Vardakas KZ, Tansarli GS, Rafailidis PI, Falagas ME (2012) Carbapenems versus alternative antibiotics for the treatment of bacteraemia due to Enterobacteriaceae producing extended-spectrum beta-lactamases: a systematic review and meta-analysis. J Antimicrob Chemother 67: 2793–803.
  24. Thomson K, Moland E (2001) Cefepime, piperacillin- tazobactam, and the inoculum effect in tests with extended-spectrum beta-lactamase-producing Enterobacteriaceae . Antimicrobial agents and chemotherapy 45: 3548–54.
  25. Sultan A, Rizvi M, F Khan, Sami H, Shukla I, Khan HM (2015) Increasing antimicrobial resistance among uropathogens : Is fosfomycin the answer? Urology annals 7 (1): 26–30.
  26. Lew KY, Ng TM, Tan M, SH Tan, Lew EL, Ling LM, et al. (2015) Safety and clinical outcomes of carbapenem de-escalation as part of an antimicrobial stewardship program in an ESBL-endemic setting. J Antimicrob Chemother 70: 1219–1225.
  27. Peralta G, Lamelo M, Alvarez-Garcia P, Velasco M, Delgado A, Horcajada J, et al. (2012) Impact of empirical treatment in extended-spectrum beta-lactamase-producing Escherichia coli and Klebsiella spp. bacteremia. A multicentric cohort study . BMC infectious diseases 12: 245.
  28. European Food Safety Authority and European Center for Disease Prevention and Control (2019) The European Union summary report on microbial resistance in zoonotic and indicator bacteria for humans, animals and food in 2017. EFSA Journal 17: 5598

Annexure

Annex 1: Phenotypes of resistance of enterobacteria to β- lactams

  • Natural resistances of enterobacteria to β- lactams:

Enterobacteria are naturally resistant to penicillins G and M, depending on additional resistance to other β lactam antibiotics, they are classified into four groups:

 Group of β- lactamines

 Group 1

 Group 2

 Group 3

 Group 4

Main types of enterobacteria encountered in hospitals

E. coli
Proteus mirabilis Salmonella Shigella

Klebsiella Citrobacter koseri

 Enterobacter
Serratia
Morganella
Providencia Citrobacter freundii

Yersinia

 aminopenicillins

S

R

R

R

 Carboxypénicillines

S

R

S

R

 ureidopenicillins

S

I / R

S

I / R

 C1G

S

S

R

R

 C3G

S

S

S

S

 carbapenems

S

S

S

S

 Mechanisms of resistance

Absence of β lactamase

Penicillinase at low level

Cephalosporinase at low level

Penicillinase + cephalosporinase

  • Resistances acquired from β- lactam enterobacteria :

Presentation of resistance phenotypes of enterobacteria to β – lactams :

Antibiotic markers

Low level penicillinase

Penicillinase high level

Penicillinase resistant to I β L

Cephalosporinase low level

Cephalosporinase high level

ESBL ¹

amoxicillin
AMX aminopenicillin

R

R

R

R

R

R

amoxicillin +
Ac.clavulanique

AMC aminopenicillin + I β L

S

I / R

R

ticarcillin
TIC carboxypenicillin

R

R

R

S

R

R

mecillinam
MEC aminidopenicillin

S

R

R

S

S

R

cephalothin
CF (C1G)

S

R

S

R

R

R

ceftazidime
CTX (C3G)

S

S

S

S

R

 R or synergist – gy4

1 : ESBL: β – lactamase with extended spectrum. | 2 : I β L: β – lactamase inhibitors do not inhibit cephalosporinase s (cephalosporinases are nevertheless β – lactamases) | 3 : Resistant strain sometimes intermediate, in all cases the inhibition diameter for the AMC is greater than that of the AMX. | 4 : some ESBLs can give an intermediate or sensitive profile with a C3G. The demonstration of synergy between clavulanic acid (AMC disk) and C3G not allow to conclude that the presence of an ESBL.

Annex 2: Classification of s β – lactamases according to amble:

  •  Serines transferases :

 – Class A : (TEM, SHV, MEN, PES, PER, VEB, CTX-M …)

 Penicillinases, ESBL ; p lasmidic or chromosomal

 – Class C : (CMY, DHA, FOX, MOX …)

 cephalosporinases ; c hromosomiques or plasmid

 – Class D : (OXA, PSE)

 Oxacillinases p lasmidiques

  •  Metallo-enzymes: Class B (IMP, VIM, NDM-1)

 carbapenemases

IMROJ 2019-103 - Geier France_F10

Annex 3. BMR-Raisin 2015- MRSA and EBLSE Incidence Densities per 1, 000 JH (overall incidence density per year) between 2002 and 2015 in France

IMROJ 2019-103 - Geier France_F11

Annex 4. Evolution of the methicillin resistance in S. aureus, and 3rd generation cephalosporins in K. pneumoniae and E. Coli, France, 2004-2014, EARS-Net France-InVS data

IMROJ 2019-103 - Geier France_F12

Annex 5. ConsoRes report 2016, Quimper HQ

Effect of Propolis Nanoparticles on Early-Stage Wound Healing in a Diabetic Noncontractile Wound Model

DOI: 10.31038/NAMS.2019212

Abstract

Propolis is commonly used to treat dermal inflammatory disorders and has shown great potential in experimental wound healing. However, propolis usually requires organic solvents for solubilization, which hampers its use in dermal wound healing. In this regard, nanotechnology arises as an important tool towards the development of aqueous systems with application in wound healing. In this context, the present study aimed to develop propolis nanoparticles and to evaluate, in vitro and in vivo, their potential in early-stage wound healing. Propolis Nanoparticles (PN) were characterized regarding their physical-chemical properties and chemical profile. In vitro, their effect on murine fibroblast cells was evaluated. In vivo, PN was administered in diabetic mice with impaired wound healing, using a noncontractile wound healing model. PN presented good encapsulation, stability, and phenolic content. They also stimulated growth of NIH/3T3 fibroblast cells, leading to an increase in 50% of cell viability. Mice treated with PN showed superior wound closure percentage (54.5%) when compared to untreated animals (20.7%). Taken together, our results showed that PN is promising for application in cutaneous tissue regeneration.

Graphical Abstract

NAMS 2019-101 - Thaís Alberti Brazil_F8

Keywords

Brazilian Propolis, Nanoparticles, Wound healing, Tissue Regeneration, Diabetes mellitus.

Introduction

Over the last few decades, we have seen a worldwide increase in the use of natural products. Plants produce a great number of different metabolites which can target different molecular mechanisms simultaneously, generating synergistic therapeutic effects, even in low concentration. Phytotherapeutics also represent lower risks of toxicity and undesirable side effects compared to many synthetic molecules [1].

Propolis, also known as bee glue, is a featured natural product owing to its various biological activities and well-documented traditional use [2]. Its main pharmacological activities are antimicrobial, antitumor, antioxidant, anti-inflammatory, immunomodulatory, hypocholesterolemic, hypotensive, anesthetic, and wound healing. These activities can be linked to its chemical composition, and since the resinous mixture produced by Apis mellifera bees varies according to their surrounding botanical variety, the biological activity of propolis also varies [3]. Brazilian green propolis has worldwide prominence based on its abundant chemical compounds, such as prenylated phenylpropanoids, especially cinnamic acid derivatives. Among them, Artepillin C ((E)-3-[4-hydroxy-3, 5-bis(3-methylbut-2-enyl)phenyl]prop-2-enoic acid) has the most added value based on its antimicrobial and antitumor activities [4]. Furthermore, phenolic acids, flavonoids, mono- and sesquiterpenes have often been detected in Brazilian propolis, contributing to its chemical profile and biological activities [5]. Studies have shown that these compounds have greater antioxidant effect than commonly used antioxidants, such as vitamin C and E. By diminishing intracellular peroxides, antioxidants can also have antitumor, anti-inflammatory, and immunomodulatory activity [6]. The anti-inflammatory effect of propolis is widely documented and several studies have shown its potential in experimental wound healing.

Propolis chemical composition varies between polar and nonpolar compounds; hence, hydroalcoholic solutions have been described as the best extraction method [7]. As a result of the lipophilic characteristic of its compounds, propolis has low solubility in water, and commercial propolis formulations are often ethanol-based, which may cause adverse topical reactions. In this context, nanotechnology arises as an interesting tool that both allows the transport of lipophilic compounds in aqueous solutions and improves their stability. Nanostructured biomaterials of variable composition and with different roles in the wound healing process have been developed. These biomaterials have been extensively described as a promising alternative for the treatment of skin diseases, especially since modern wound dressing aims to create an ideal environment to provide good oxygenation, diminish bacterial colonization, and improve tissue repair [8]. In particular, nanoparticles provide properties of interest such as being nontoxic or dermal-irritating, having good physical stability, greater contact surface area, and better drug absorption [9]. Furthermore, the encapsulation of propolis into a nanoparticle system avoids the use of organic solvents which are often toxic and can harm the chemical structure of bioactive compounds. Moreover, nanoparticles may also boost the release of bioactive compounds, especially in topical use, owing to the morphology and size of the particles and their interaction with the epidermal surface.

Diabetic ulcer is one of the most worrisome conditions in the context of wound healing impairment. It is a common and serious complication of Diabetes Mellitus (DM), being one of the major causes of organ amputation which affects 15% of all diabetics. Currently, about 194 million patients living with diabetes, and WHO estimates that this number will double by 2025. The severity of wounds leads to amputation in 25% of subjects with diabetic ulcers [10]. Many studies have demonstrated that the elevation of blood glucose levels hampers resolution of the inflammatory phase and reduces angiogenesis and fibroblast proliferation, impairing the wound healing process. DM can also hinder the wound healing process by interfering with cell signaling and decreasing cell response, leading, in turn, to a reduction in peripheral blood flow and local tissue regeneration [11].

In this scenario, the present study aimed to develop Propolis Nanoparticles (PN) specific to wound healing and investigate their wound healing properties, both in vitro an in vivo. To accomplish this, a non-contractile diabetic wound healing model was previously adopted to evaluate the potential of the new formulation in individuals with compromised wound healing [12]. Aware of the limitation of using rodents, which have contractile wound healing, as opposed to human noncontractile wound healing, we adopted a model that limits wound contraction by applying silicon discs around it. This method prevents wound healing by epithelial contraction; therefore, the effect observed is by re-epithelialization and granulation, processes similar to those that occur in human tissue regeneration.

Materials and Methods

Preparation of propolis extract

A propolis sample was collected in the fall of 2015 in southern Brazil (Santa Catarina State, Sao Joaquim County, 28° 17′ 38″ S, 49° 55′ 54″ W, altitude 1353 m). Its chemical traits and low toxicity were previously determined by our research group [13]. The extraction was made using ethanol 70% (v/v) at the ratio of 0.2 mg of dried propolis per mL of solvent. The mixture was left to extract overnight at room temperature, followed by vacuum filtration to recover the hydroalcoholic extract that was further dried (1h) using a Savant™ SpeedVac™ microcentrifuge to obtain dried propolis extract.

Preparation and characterization of propolis nanoparticles

Propolis Nanoparticles (PN) were prepared using a spontaneous emulsification method with 0.4% of poloxamer (Kolliphor P188) in the aqueous phase and 2.5 mg/mL of soy lecithin in the organic phase composed of acetone and ethanol at a ratio of 60:40 (v/v). The hydroalcoholic extract was solubilized in the organic phase, reaching a final concentration in nanoparticles of 17 mg/mL after removing the organic phase in a rotary evaporator. Particle size and zeta potential were measured at 25°C by photon correlation spectroscopy, and laser Doppler anemometry, respectively, using a Zetasizer® Nano-ZS 90 (Malvern Instruments, Worcestershire, UK).

Morphology – TEM

Morphology was determined by Transmission Electronic Microscopy – TEM (CM200 Philips; FEI Company, Hillsboro, OR, USA). Droplets of nanoparticles suspension were deposited on carbon grids and fixated with uranyl acetate 2% (w/v) following visualization.

Analysis of phenolic composition by HPLC-UV-vis

The propolis dried extract (1mg) was dissolved in ethanol and centrifuged (10 min, 4000rpm). The supernatant (0.5 mL) was collected, filtered (0.22 μm), and used for chromatographic analysis. An aliquot (60 μL, n = 3) was injected into a liquid chromatograph (Shimadzu LC-10A) equipped with a C18 reverse phase column (Shim-Pack CLC-ODS, 250 mm × 4.6 mm, ∅ 5μm, 40°C), fitted with a C18 reversed phase guard column (Shim-Pack CLC-ODS, 4.6 mm, ∅ 5μm) and a UV-vis detector. Elution consisted of H2O: AcOH: η-BuOH (350: 1: 10, v/v/v) with a flow rate at 0.8 mL/min. Identification of phenolic acids was performed using the retention times and co-chromatography of standard compounds (gallic acid, syringic acid, p-coumaric acid, sinapic acid, quercetin, and artepillin C – Sigma-Aldrich, MO – USA). For purposes of concentration calculations, an external standard curve was built for artepillin C under the same experimental conditions, using the integral values of the peaks’ area of interest.

Encapsulation efficiency and phenolic content

Total phenolic content (μg/mL) of propolis nanoparticles was determined by the Folin-Ciocalteau spectrophotometric method [14], using a UV-vis spectrophotometer (BEL LGS 53, Monza, Italy). Analysis was carried out in triplicate, and total phenolic content was quantified using a standard curve of gallic acid (y = 0.3344x, r2 = 0.937) in the same solvents (7.8 – 125 µg.mL). Results were expressed as mg gallic acid equivalents per g of oil (mean values ± SD).

Encapsulation efficiency (%) was calculated using the formula described below, considering the difference between the values of total phenolic content in the PN and the nonencapsulated phenoliccontent, using an ultrafiltration filter device (Amicon, Ultracel-100 filter membrane, 100 kDa, Millipore Corp., USA).

Encapsulation efficiency (%) = (phenolic content of PN suspension – phenolic content of non-encapsulated fraction) × 100/phenolic content of PN suspension.

Stability studies

To evaluate the stability of PN, samples were stored at room temperature (25 ± 2°C). Particle size, Polydispersity Index (PDI), zeta potential, and pH were measured after 24h and at 7, 15, 30, 60, and 90 days after preparation.

Cell Culture Studies

Murine NIH/3T3 fibroblast cells were cultivated in DMEM medium (Dulbecco’s Modified Eagle’s Medium) supplemented with fetal bovine serum 10% (FBS), 10 mM HEPES, 2mM L-glutamine, 100 units/mL penicillin, and 100 g/mL streptomycin. Medium was changed every 48h, and cells were maintained in culture at 37°C, humid atmosphere at 5% CO2. When cells were confluent, they were treated with a 0.25% (w/v) trypsin in 1mM EDTA solution and counted using a Neubauer chamber.

Cell viability essay

Toxicity of nanoparticles was determined by the neutral red uptake (NRU) assay as previously described [15]. To perform this assay, 104 cells/well were inoculated, and after 24h incubation at 37°C, they were treated with different concentrations of PN, blank nanoparticles, i.e., the same concentrations of nanoparticles, but without propolis, and sodium dodecyl sulfate (positive control).

After 48h incubation, the plate was washed with 100μl PBS, stained with 100 μL of NR dye (25 μg/mL) in DMEM and incubated for another 3h. The medium containing NR was removed and washed with 100μL PBS and 100μL desorption solution (H2O: EtOH: glacial acetic acid, 49: 50: 1, v/v/v). Absorbance was read in a Gold Spectrumlab 53 UV-vis Spectrophotometer (BEL Photonics, Brazil) at a wavelength of 540nm.

Wound Healing In Vivo Assay

Male Swiss mice (8 to 12 weeks of age) were obtained from the Central Biotery of the Federal University of Santa Catarina (Florianópolis, SC, Brazil) and housed in communal cages at 21 ± 2°C under a 12-h light/dark cycle (lights on at 07:00 h) with free access to food and tap water. All experimental procedures were previously approved by the Committee on the Ethical Use of Animals and performed in accordance with Brazilian regulations on animal welfare (CEUA/UFSC 23080.030926/2010-62).

Induction of experimental diabetes

Induction of experimental diabetes was performed with minor modifications of [16]. Mice were intraperitoneally injected with a single dose of streptozotocin (150mg/kg) dissolved in citrate buffer (1mM, pH 4.5). After 7 days, their blood glucose was measured with a glucometer, and mice with plasma glucose higher than 250mg/dL were considered diabetic.

Surgical procedure

Mice were anaesthetized with isoflurane and shaved; then a full-thickness round wound was made in the dorsum of the animal (∅ = 0.8 cm) using sterile scissors. In order to diminish contraction, a noncontractile wound healing model was applied as previously described by Wang et al. [26]. A strip of Tegaderm™, a transparent polyurethane dressing, was used to cover the wound.

Then, a 2mm-thick, round-auto adhesive Tegaderm™ was fixed with 4 counter lateral stitches with 5.0 nylon thread such that the wound remained at the center of the disc. The animals were randomly separated and equally distributed into four groups (n = 6). Mice were treated each 48h with a 100 μL treatment solution, i.e., PN, blank nanoparticles or allantoin (2.5mg/mL, positive control). The olution was injected under the Tegaderm™ and over the wound. For the negative control group, no treatment was applied. On day 7 post-surgery, animals were euthanized with an isoflurane overdose, the wounds were measured, and the wound tissues were collected for histological examination.

Histopathological analyses

Tissues were fixed in buffered formaldehyde solution (10%, v/v – pH 7.2), embedded in paraffin sections (6 μm thickness), and stained with Mallory›s trichrome stain (Leica autostainer XL). Samples were scanned (Axio scan) and analyzed morphologically using the Zen software (Carl Zeiss AG, GE).

Statistical Analysis

In order to evaluate the effect of the treatments, statistical analysis was applied to the dataset, using one-way analysis of variance (ANOVA). Statistical analyses were performed using the GraphPad Prism 6 Software (GraphPad Software Inc., San Diego, CA, USA), and p-values less than 0.05 were considered significant. Data are presented as mean ± SEM of independent experiments.

Results

Characterization of PN

TEM micrographs of PN produced using 0.4% poloxamer displayed a spherical shape (Figure 1). The uranyl acetate of the negative staining deposited more intensively around the nanoparticles, its higher affinity for the lecithin hydrophilic shell. The formulations showed a mean particle size similar to that obtained through photon correlation spectroscopy analysis.

NAMS 2019-101 - Thaís Alberti Brazil_F1

Figure 1. Transmission electron micrograph of propolis nanoparticles with 0.4% poloxamer and 2.5mg/mL of soy lecithin coating, stained with uranyl acetate at 2% (w/v). Scale bar corresponds to 0.5 μm.

Stability

Different parameters may be used for evaluating the stability of a nanoparticles-based system. Macroscopically, stability can be examined by the absence of phase separation and maintenance of the original visual characteristics. Also, the stability of physicochemical characteristics, such as size, PDI, and pH, should be evaluated [9]. Figure 2 shows the results of the average nanoparticle size at 122.1 nm. The formulation showed a unimodal distribution with a PDI of 0.126. As PDI decreases, the homogeneity of particle size increases. This value is determined by the proportion between the standard deviation and average particle size. Another important parameter is zeta potential, which measures the particle’s surface electrical charge.

NAMS 2019-101 - Thaís Alberti Brazil_F2

Figure 2. Correlation between mean particle size (a) and zeta potential (b) according to decay time distribution (0, 1, 2, 3, and 4 weeks).

As this value increases, either positive or negative, generally above 30mV, electrochemical repulsion increases and, hence, stability. The negative charge of PN results from the presence of soy lecithin in the formulation, which is preferably located at the nanoparticle surface and confers a negative charge. Zeta potential remained the same throughout the evaluated time. However, after the first 7 days, a wider distribution in particle size was noted, and it remained constant until the end of the experiment, increasing PDI to a maximum of 0.253, which is within unimodal distribution. Thus, the nanoparticles presented good stability, as demonstrated by particle size and surface charge throughout the evaluated time.

Characterization of phenolic composition and encapsulation efficiency of PN

The Folin–Ciocalteau Reagent (FCR) method was used to determine the total phenolic compounds of PN (total and nonencapsulated fractions). The nonencapsulated fraction includes all compounds that were not encapsulated in the nanoparticle and that remained solubilized in aqueous phase. This fraction was separated from the intact PN, using an ultrafiltration device that retains the PN, but not the free compounds, i.e., those solubilized in aqueous phase. Encapsulation efficiency (%) represents the percentage of compounds successfully encapsulated inside the nanoparticles. The total phenolic content and encapsulation efficiency of PN are displayed in Table 1.

Table 1. Total phenolic content (μg/mL) and encapsulation efficiency (%) of PN

Total phenolic content (pg/mL)

Encapsulation efficiency (%)

Propolis NPs (total fraction)

Propolls NPs
(non-encapsulated fraction)

Day 0

75.31 ±1.05

44.77 ±0.75

40.55 ±1.34

Day 30

67.72 ± 0.68

40.63 ±0.1

40.01 ±0.46

The average total phenolic content of PN was 75.31 μg/mL. Since the concentration of propolis extract in the nanoparticle suspension was 17 mg/mL, the average proportional concentration of phenolic compounds was 4.43 μg/mg propolis. In turn, the concentration of nonencapsulated phenolic compounds at 44.77 μg/mL represents about 60% of total phenolic compounds, or encapsulation efficiency of 40.55%. The encapsulation efficiency remained constant throughout the experiment.

To assess how multiple compounds from the complex matrix of propolis were distributed in the PN suspension, HPLC-UV-vis analyses of propolis extract, total fraction, and nonencapsulated fraction were performed. Representative chromatograms of propolis extract, total propolis of nanoparticles, and nonencapsulated propolis are shown in Figure 3.

NAMS 2019-101 - Thaís Alberti Brazil_F3

Figure 3. HPLC-UV-vis chromatograms of propolis extract (A), total content of PN (B), and free content of PN (C).  Peak number 1 (gallic acid), (2) syringic acid, (3) p-coumaric acid, (4) sinapic acid, (5) quercetin, and (6) artepillin C. 1  propolis concentration at 1 mg/mL.

The chromatographic profile of PN is similar to that of propolis extract, evidencing the presence of the six phenolic compounds identified and quantified in the extract (Table 1). Among the non-encapsulated fraction, the major compound found was gallic acid with a similar amount relative to the total PN suspension (13.7 μg/mL). On the other hand, artepillin C was detected in high concentrations in the total PN suspension (41.9 μg/mL), but in low amounts in the nonencapsulated fraction (2.5 μg/mL). In general, a decrease in encapsulation efficiency was observed for compounds with lower retention times, i.e., more polar, such as gallic acid. This result evidences the selective encapsulation of compounds from the propolis matrix, in which polar compounds showed a lower efficiency of encapsulation, owing to their higher affinity to the water phase, so that as compound polarity decreased, the encapsulation efficiency increased.

Overall encapsulation efficiency, as shown by HPLC analysis, was 42.9%, similar to the value found by the total phenolic content assay, i.e., 40%. Moreover, total phenolic contents in PN were estimated to be 71.9 μg/mL and 75.31 μg/mL by chromatographic and spectrophotometric analysis, respectively. When encapsulating a single compound, the highest possible encapsulation efficiency is desired. The nanoencapsulation of a complex mixture requires a deeper analysis accordingly to its chemical profile. HPLC analysis demonstrated that gallic acid remained in the aqueous phase. This is consistent with its chemical structure, in which 4 out of its 5 radicals are hydroxyl groups and, therefore, highly hydrophilic with high affinity for the aqueous phase. The carboxyl group of syringic acid is also highly polar; however, the ether groups make it slightly less soluble as a result of the increasing hydrophobic nature of the alkyl chain. That explains why we could observe increasing encapsulation efficiency, but decreasing affinity, with the aqueous phase. In its turn, p-coumaric acid has a carboxyl group, but also an aromatic ring, making it more nonpolar than syringic acid. Sinapic acid has a chemical structure similar to that of p-coumaric acid, but with two more methyl ether radicals, favoring its nonpolar character. Quercetin has 3 aromatic rings, but equally as many hydroxyls, giving it almost the same affinity to aqueous partition as that of the nonpolar fraction, explaining its 54% encapsulation efficiency. Artepillin C is a phenol constructed of single ring with two prenyl groups. Since the molecule becomes more nonpolar and therefore less soluble in water as the carbon chain becomes longer, its low molecular weight and chemical structure increase its affinity for incorporation into the phospholipidic bilayer membrane of the nanoparticle, substantiating its encapsulation efficiency by 93.9%.

Cell Viability Essay

The effect of PN on 3T3 fibroblasts was assessed through in vitro acute oral toxicity assay by measuring the neutral red uptake (NRU – Figure 4). Cells were treated with logarithmic concentrations of PN, and from the lowest concentration, i.e., 0.001 mg/mL, an increase of 50% in cell viability was observed, compared to negative control. The increase in cell viability was statistically relevant up to 0.1mg/mL, which was also the highest dosage before inhibitory concentration (IC50) has been detected, showing a values of 1.30 mg/mL. The lethal dose (DL50) was 1523.9 mg/kg, which corroborates previous findings described on the propolis toxicity [17].

NAMS 2019-101 - Thaís Alberti Brazil_F4

Figure 4. Cell viability (%) obtained through NRU cytotoxicity assay using 3T3 cells with logarithmic concentrations of PN (mg/mL). Each column represents the mean + SD of 6 wells/group. *p<0.001 vs. control group (one-way ANOVA with Dunnett’s post-hoc test).

Wound Healing Assay in vivo

Since rodents have a contractile wound healing pattern, the discs used in our noncontractile model prevented wound healing by epithelial contraction. Thus, the cicatrization effect is through re-epithelialization and granulation, processes similar to those that occur in human tissue regeneration [12]. Additionally, DM type 2 was induced to further evaluate the wound healing potential in subjects with impaired cicatrization. Mice were administered a 100 μL treatment solution every 48h after surgical lesion. Thus, 1.7mg PN were delivered to the lesion site each treatment. Likewise, positive control (allantoin 2.5mg/mL) received 0.25mg per treatment. Figure 5 compares the percentage of wound closure area after 7 days of lesion.

NAMS 2019-101 - Thaís Alberti Brazil_F5

Figure 5. Wound closure area (%) after 7 days according to the treatments: NC – negative control, NV – blank nanoparticle (vehicle), PN – propolis nanoparticles, and PC – positive control. Each column represents the mean ± SD. *p<0.0001 vs. control group (one-way ANOVA with the Dunnett’s post-hoc test).

All treated groups showed statistically significant wound closure percentage compared to untreated animals, which presented only 20.7% of wound closure after 7 days. PN treatment resulted in the highest percentage of wound closure (54.5%), a result quite similar to positive control (54.3%). Because of the chemical nature of PN formulation without propolis, it could be theorized that the moisture and physicochemical properties of the emulsifier present in blank nanoparticles were sufficient to positively influence the wound healing process (38.5%). Soy lecithin used as emulsifier is a phospholipid that forms phospholipid bilayers in the process of homogeneous emulsification, similar to those present in cell membranes. Nonetheless, the presence of propolis in the nanoparticles accelerated the wound healing process by 16.0% and 33.8% in comparison to blank nanoparticles and the nontreated group, respectively.

Macroscopically, it was possible to observe changes in the aspect of the wound, as shown in Figure 6. Untreated control exhibited wound aspect of raw exposed skin, whereas blank nanoparticles (NV) seemed to have a thin layer of protective mucus. The allantoin group (PC) and PN displayed the formation of a crust typical of later stages of the wound healing process. Even though it was not the aim of our study, the results revealed an unexpected effect of PN in that some component of PN, present in both blank NV and PN, stimulated hair follicle growth. In order to perform the surgical lesion, all the animals were shaved, and all photos were taken on the same day after lesion. We were not able to observe any hair growth in untreated animals or in positive control (allantoin), only a few with random patches of fur. Interestingly, a previous study reported that propolis stimulates hair growth by inducing keratinocyte proliferation [18].

NAMS 2019-101 - Thaís Alberti Brazil_F6

Figure 6. Photographs on day 7 post-wounding of macroscopic appearance of wounds treated with a – negative control (untreated), b – nanoparticles vehicle, c – allantoin (positive control), and d – PN. Scale bar corresponds to 1 cm and applies throughout.

NAMS 2019-101 - Thaís Alberti Brazil_F7

Figure 7. Representative microscopic images of the lesion region at day 7th post-wounding obtained through Mallory’s staining of histological cuts. A – untreated (negative control), B – allantoin (positive control) C – nanoparticles vehicle,  D – E – G propolis nanoparticles. (A-F) 10x; (G) 40x. Scale bar corresponds to 50μm and applies throughout. Abbreviations: (gt) granulation tissue; (epi) epidermis; (sc) stratum corneum; (coll) collagen; (hf) hair follicle; and capillary vases (cv and arrows).

Histological evaluation of the wound sites was performed at day 7th post-wounding, and some preliminary findings were found. On day 7 post-wounding all groups displayed formation of new epidermis, granulation tissue (high density of fibroblasts), and immature regenerated tissue (with newly synthesized unarranged collagen fibers, as detected by blue light). These data corroborate the results obtained in the macroscopic analysis of the lesions in which a similar closure was observed in the same groups. Moreover, PN showed two distinctive characteristics not found in the other groups: remodeling and angiogenesis. With the reestablishment of the functional structure of the tissue, it was possible to observe skin appendages (hair follicles), arrangement of collagen fibers resembling normal skin tissue (stained in darker blue), and numerous mature blood vessels. In the other groups, numerous red blood cells were found, but they were dispersed randomly with inflammatory infiltrates and not organized into well-defined blood vessels.

Discussion

In order to allow solubilization of nonpolar compounds in aqueous medium, propolis extract was encapsulated into a nanoparticle-based system. This system presents many advantages, such as increase in stability and compound permeation through the skin, owing to size, morphology, and physicochemical properties of the nanoparticles and their association with the skin surface constituents. The lipophilicity of nanoparticles and the use of surfactants also increase the process of compound permeation. Nevertheless, as shown by the chemical composition analysis, propolis is a mixture of polar and nonpolar compounds with different affinities for the aqueous phase and the phospholipid bilayer of the nanoparticle. The compounds that presented medium encapsulation efficiency and, therefore, affinity with both phases may be responsible for the change in the particle size distribution noted in the first week of storage. As mentioned before, stability depends on the amount of repulsion forces between the particles, guaranteeing that they will not be attracted to each other and, thus, forming a bigger particle through coalescence. This phenomenon is known as Ostwald ripening. The zeta potential remained constant during the analyzed time. Thus, particle charge and repulsion forces were not responsible for the coalescence effect observed, which, instead, could be attributed to the polarity grade of the phenolic compounds encapsulated, such as syringic acid, p-coumaric acid, and sinapic acid.

The detection of a typical chemical profile associated with propolis from a specific production region or season may be used to obtain a specific pharmacological activity. The chemical fingerprint of the propolis in the present work is consistent with the same specific harvest season and region of production as other studies determined through NMR-based metabolomics, chemometrics, machine learning algorithms [13], and UV-Vis profiles [19]. Furthermore, chromatographic profiles of the propolis herein investigated and the source of Artepillin C, the plant species Baccharis dracunculifolia, were similar [20]. The chromatogram highlights phenolic acids derived from benzoic acid (gallic and syringic acids) and derived from the cinamic acid (p-coumaric acid, sinapic acid, and ArtC), in addition to the major flavonol, quercetin. Quercetin is a flavonoid commonly found in European propolis [3] that has potent antioxidant activity and also boosts wound healing in collagen matrices [21]. Gallic acid is a potential antioxidant that directly upregulates the expression of antioxidant genes. In addition, that secondary metabolite accelerates cell migration of keratinocytes and fibroblasts in both normal and hyperglucidic conditions [23]. Syringic acid possesses both antioxidant and anti-inflammatory properties shown to protect against chemically induced inflammation [23]. Sinapic acid and its derivatives possess high radical scavenging potential which can be applied to multiple pharmacological uses [24]. In addition to antioxidant and chemoprotective properties, p-coumaric acid also acts as a precursor for phenylpropanoids, among them ArtC [25], the major nanoencapsulated component detected in the present study. Previous reports have shown that ArtC prevents oxidative damage in a dose-dependent manner and that it suppresses lipid peroxidation [26]. Furthermore, both Art-C and Brazilian propolis significantly inhibited alloreactive CD4 T cell proliferation and activation, as well as suppressed the expressions of IL-2, IFN-gamma, and IL-17 [27]. ArtC has also been associated with propolis treatment with local and systemic anti-inflammatory activity in acute and chronic inflammation models [28].

In the present study, PN (from 0.001 mg/mL to 0.1mg/mL) presented a proliferative effect on fibroblasts, in vitro, increasing by 50% the cell viability. This could be associated with the accelerated wound healing effect found in vivo, since the proliferative phase (7 days) seems to be in a more advanced stage in comparison to the other groups such as allantoin, which macroscopically showed a similar percentage of wound closure, but did not display microscopically collagen deposition (more associated with remodeling phase), formation of skin appendages, or angiogenesis, as noted for PN. It has been shown that propolis can stimulate angiogenesis by increasing the expression of fibroblast growth factor-2 (FGF-2), a transcription factor involved in revascularization and hematopoiesis. This result was observed concomitant with fibroblast stimulation with topical application of propolis extract in the healing process of traumatic ulcer in diabetic rats [29]. FGF-2 has been found to be mediated through protein kinase (MEK/ERK) and phosphoinositide-3 kinase (PI3K/Akt) signaling pathways [30], eventually indicating a possible mechanism through which PN mediates wound healing in diabetic mice by proliferating fibroblasts, increasing collagen deposition, and forming blood capillaries and skin appendages.

Conclusion

To the best of our knowledge, this is the first report on the use of PN for wound healing. The chemical fingerprint of PN is rich in Art C and, hence, comparable to that of green propolis, usually produced in southeastern Brazil and with claimed antitumor activity. PN stimulated fibroblast proliferation in vitro and induced a higher rate of wound closure in vivo. Likewise, our data suggest that PN induces acceleration of the proliferative phase, collagen deposition, angiogenesis, and skin appendage formation. Collectively, therefore, these results suggest that polyphenolic-rich PN has the potential to serve as a novel topical wound healing therapy in chronic wounds, including settings of impaired wound healing caused by DM.

List of Abreviation

Art C, artepillin C; PN, propolis nanoparticles; DM,diabetes mellitus; TEM, transmission electron microscopy; DMEM, dulbecco’s modified eagle’s medium; NRU, neutral red uptake; PDI, polydispersion index; HPLC, high performance liquid cromatography; NV, nanovehicle/blank nanoparticles; PC, positive control/allantoin group; NMR, nuclear magnetic ressonace, CD4 T, T helper cells; IL-2, interleukin-2; IFN-gamma, interferon gamma; IL-17, interleukin-17; FGF-2, fibroblast growth factor-2; MEK/ERK, protein kinase; PI3K/Akt, phosphoinositide-3 kinase.

Funding Information

This work was supported by CNPq, CAPES, FAPESC and PRONEX, Brazil [grant numbers 17420/2011/3, 454572/2014-0 and 401517/2012-8].

Authorship

Authors Thaís Alberti, Daniela Coelho, Ana Voytena, Roniele Iacovski, Leticia Mazzarino, Marcelo Maraschin and Beatriz Veleirinho all approved the final version of the article. The first two and last three authors contributed to the conception and design of the study. The first four authors contributed in data collection, interpretation, or analysis. The first and last two authors contributed in writing of the article and revision.

References

  1. Yunes RA, Pedrosa RC, Cechinel Filho V (2001) Fármacos e fitoterápicos: a necessidade do desenvolvimento da indústria de fitoterápicos e fitofármacos no Brasil. Química nova 24: 147–152.
  2. Ghisalberti E, Jefferies P, Lanteri R, Matisons J (1978) Constituents of propolis. Cellular and Molecular Life Sciences. 34:157–158.
  3. Marcucci MC (1995) Propolis: chemical composition, biological properties and therapeutic activity. Apidologie. 26: 83–99.
  4. Aga H, Shibuya T, Sugimoto T, Kurimoto M, Nakajima S (1994) Isolation and identification of antimicrobial compounds in Brazilian propolis. Bioscience, biotechnology, and biochemistry 58: 945–946.
  5. Salatino A, Teixeira, Weinstein r, Negri G, Message D (2005) Origin and Chemical Variation of Brazilian Propolis. Evidence-Based Complementary and Alternative Medicine 2: 33–38.
  6. Banskota AH, Tezuka Y, Kadota S (2001) Recent progress in pharmacological research of propolis. Phytotherapy Research 15: 561–571.
  7. Park YK, Ikegaki M, Abreu JdS, Alcici NMF (1998) Estudo da preparação dos extratos de própolis e suas aplicações. Ciência e Tecnologia de Alimentos 18: 313–318.
  8. Alberti T, S Coelho D, Voytena A, Pitz H, de Pra M, et al. (2017) Nanotechnology: A Promising Tool Towards Wound Healing. Current pharmaceutical design. 23: 3515–3528.
  9. Tadros T, Izquierdo P, Esquena J, Solans C (2004) Formation and stability of nano-emulsions. Adv Colloid Interface Sci 108–109: 303–318. [crossref]
  10. Gordois A, Scuffham P, Shearer A, Oglesby A, Tobian JA (2003) The health care costs of diabetic peripheral neuropathy in the US. Diabetes Care 26: 1790–1795. [crossref]
  11. Hehenberger K, Hansson A (1997) High glucose-induced growth factor resistance in human fibroblasts can be reversed by antioxidants and protein kinase C-inhibitors. Cell Biochem Funct 15: 197–201. [crossref]
  12. Wang X, Ge J, Tredget EE, Wu Y (2013) The mouse excisional wound splinting model, including applications for stem cell transplantation. Nat Protocols 8: 302–309.
  13. Maraschin M, Somensi-Zeggio Al, Oliveira SK, Kuhnen S, Tomazzoli MM, et al. (2015) Metabolic profiling and classification of propolis samples from southern brazil: an NMR-based platform coupled with machine learning. Journal of natural products 79: 13–23.
  14. Popova M, Bankova V, Butovska D, Petkov V, Nikolova-Damyanova B, et al. (2004) Validated methods for the quanti?cation of biologically active constituents of poplar-type propolis. Phytochemical analysis 15: 235–240.
  15. OECD E (2010) Guidance document on using cytotoxicity tests to estimate starting doses for acute oral systemic toxicity tests. OECD Ser Test Assess 20: 1–54.
  16. Jain SK, Rains JL, Croad JL (2007) Effect of chromium niacinate and chromium picolinate supplementation on lipid peroxidation, TNF-a, IL-6, CRP, glycated hemoglobin, triglycerides, and cholesterol levels in blood of streptozotocin-treated diabetic rats. Free Radical Biology and Medicine 43: 1124–1131.
  17. Park E-H, Kim S-H, Park S-S (1996) Anti-inflammatory activity of propolis. Archives of pharmacal research 19: 337–341.
  18. Miyata S, Oda Y, Matsuo C, Kumura H, Kobayashi K (2014) Stimulatory Effect of Brazilian Propolis on Hair Growth through Proliferation of Keratinocytes in Mice. Journal of Agricultural and Food Chemistry 62: 11854–11861.
  19. Tomazzoli MM, Neto RDP, Moresco R, Westphal L, Zeggio ARS, et al. (2015) Discrimination of Brazilian propolis according to the seasoning using chemometrics and machine learning based on UV-Vis scanning data. Journal of integrative bioinformatics 12:15–26.
  20. Park YK, Paredes-Guzman JF, Aguiar CL, Alencar SM, Fujiwara FY (2004) Chemical constituents in Baccharis dracunculifolia as the main botanical origin of southeastern Brazilian propolis. J Agric Food Chem 52: 1100–1103. [crossref]
  21. Gomathi K, Gopinath D, Rafiuddin Ahmed M, Jayakumar R (2003) Quercetin incorporated collagen matrices for dermal wound healing processes in rat. Biomaterials 24: 2767–2772.
  22. Yang DJ, Moh SH, Son DH, You S, Kinyua AW, et al. (2016) Gallic acid promotes wound healing in normal and hyperglucidic conditions. Molecules 21: 899.
  23. Wei X, Chen D, Yi Y, Qi H, Gao X, et al. (2012) Syringic Acid Extracted from Herba dendrobii Prevents Diabetic Cataract Pathogenesis by Inhibiting Aldose Reductase Activity. Evidence-based Complementary and Alternative Medicine : eCAM 2012: 426537.
  24. Chen C (2016) Sinapic Acid and Its Derivatives as Medicine in Oxidative Stress-Induced Diseases and Aging. Oxidative Medicine and Cellular Longevity 2016: 10.
  25. Marcucci MC, Ferreres F, García-Viguera C, Bankova VS, De Castro SL, et al. (2001) Phenolic compounds from Brazilian propolis with pharmacological activities. J Ethnopharmacol 74: 105–112. [crossref]
  26. Shimizu K, Ashida H, Matsuura Y, Kanazawa K (2004) Antioxidative bioavailability of artepillin C in Brazilian propolis. Arch Biochem Biophys 424: 181–188. [crossref]
  27. Cheung K-W, Sze DM-Y, Chan WK, Deng R-X, Tu W, et al. (2011) Brazilian green propolis and its constituent, Artepillin C inhibits allogeneic activated human CD4 T cells expansion and activation. Journal of ethnopharmacology 138: 463–471.
  28. Machado JL, Assunçao AKM, da Silva MCP, Reis ASd, Costa GC, et al. (2012) Brazilian green propolis: anti-inflammatory property by an immunomodulatory activity. Evidence-Based Complementary and Alternative Medicine 2012.
  29. Puspasari A, Harijanti K, Soebadi B, Hendarti HT, Radithia D, et al. (2018) Effects of topical application of propolis extract on fibroblast growth factor-2 and fibroblast expression in the traumatic ulcers of diabetic Rattus norvegicus. Journal of Oral and Maxillofacial Pathology 22: 54.
  30. Ornitz DM, Itoh N (2015) The fibroblast growth factor signaling pathway. Wiley Interdisciplinary Reviews: Developmental Biology 4: 215–266.

Printing Clear Annular Patterns by Mass Separated Ion Using Rotating Electric Fields

DOI: 10.31038/NAMS.2019211

Abstract

We have printed clear annular patterns by mass separated ion using rotating electric fields. We have been developing the new type mass analyzer using two rotating electric fields (REFs). The REF-MS are capable of simultaneous mass separation with limited elements. In our previous studies, the origins of the ions and the annular ring patterns were identified by theoretical calculations and time of flight type secondary ion mass spectrometry (TOF-SIMS) imaging. In this paper, we have printed clear annular patterns on the Si wafer within short time and discuss the origin of finger prints.

Keywords

FIB, Imaging mass spectrogram, REF-MS

Introduction

We have been developing the new type mass analyzer using two rotating electric fields (REFs). The origin of REF type mass analyzer can be traced back to a simple TOF principle within a single REF geometry [1, 2]. Table 1 indicates the comparison with conventional mass analyzers and REF-MS. The REF-MS is highly developed to separate different ions continuously in a two-dimensional plane. In principle, dimension of detection on sector-MS, TOF-MS and Q-MS are almost restricted to spots. The sector-MS and the REF-MS are capable of simultaneous detection with limited elements. Each REF consists of eight small electrodes and AC voltage with a phase contrast of 45 degrees is applied to the each electrode. This REF-MS locates double REFs aligned on the same axis. Then, we optimized the phase contrast between the upstream REF and downstream REF to make the phases opposite for the selected ion. First, ions travel into the upstream REF. The flight time of the selected ion is controlled to be just one cycle of the REF. Between the two REFs, ions travel mirror trajectories on their mass. The selected ion draws a cycloid trajectory. The downstream REF is drawn opposite phase with the upstream REF. In the downstream REF, typical ions are converged to center axis and other ions travel different trajectory [3, 4]. The relationship with the mass electric charge ratio of the selected ion and the frequency of REFs can be described by following equation (1), where f is the frequency of the REF, L is the length of the REF, Vacc is the accelerating voltage of the selected ion, m/Z is the mass weight of the single charged ion for measurement, and e is the quantum of electricity [5].

NAMS 2019-102 - Masashi Japan_F3

Table 1. Comparison with conventional mass analyzers and REF-MS.

Sector-MS

TOF-MS

Q-MS

REF-MS

Ion beam

Continuous

Pulse

Continuous

Continuous

Dimension of Detection

Spot (line)

Spot

Spot

2D plane

Simultaneous

Detection

(Dependence)

Multi elements (Magnetic field)

One elements (Time)

One elements (Frequency)

Multi elements (Rotating electric field)

Experiments

Our original instruments are precisely described in our previous papers [3–5]. In this study, we selected AuGe alloy as a FIB source. It is reported that many kinds of Au, Ge isotopes or compounds are emitted from AuGe alloy liquid metal ion source [6, 7]. The accelerating voltage of the AuGe-FIB was 10 kV. The alternative potential of each sinusoidal wave was ±210 V maximum (peak to peak). First, we optimized the phase contrast between each channel and optimized the alternative potential for the specific mass from AuGe alloy. Then, we set the movable aperture unit and kept the ion-beam current to about 5.2 nA. Second, we obtained the annular patterns of AuGe alloy by sweeping the frequencies of REFs. In our previous studies, the origins of the ions and the annular ring patterns were identified by theoretical calculations (SIMIONTM). The certainty of these results was confirmed by time of flight type secondary ion mass spectrometry (TOF-SIMS) imaging of printed AuGe annular ring patterns on Si wafer [8]. In this paper, we have printed clear annular patterns on the Si wafer within short time and discuss the origin of finger prints.

Results & Discussion

Using the equation (1), we calculated the proper frequencies when 197Au2+, 197Au+ and 197Au2+ ions are converged to the center. Figure 1 indicates the projection patterns of AuGe alloy obtained by using REF-MS on the fluorescent screen. On fig.1-(A), 197Au2+ mass was converged to the center and other masses formed concentric annular rings with different diameters from the center. There are also the annular rings outside of center, however the origins of annular rings cannot be identified. On the other hand of fig.1-(B), 197Au+ ion was converged to the center and 197Au2+ ion was disappeared from the screen. There are non-annular patterns were also confirmed near the edge of the screen. It is thought that the ions were reflected within the wall of electrode and formed fringed patterns. Because, the fringed patterns draw the opposite movement from the annular patterns when the optical axis is shifted. On fig.1-(C), 197Au2+ ion was converged to the center and 197Au+ ion have moved from the center to the outside. There are also Ge isotopes ions forming annular rings in concentric order around 197Au2+ ion.

We converted target from the fluorescent screen to the Si wafer and printed clear annular patterns on the wafer. Figure 2 indicates the results of the prints of annular rings patterns. Samples were prepared by irradiating AuGe-FIB mass-separating by REFs at an acceleration voltage of 12.9 kV for 3 hours. At each frequency, we succeeded in printing the clear annular patterns. In fig.2-(A), we can see two central points. It is thought that the axis of the beam shifted during the irradiation of AuGe-FIB. In fig.2-(B), the fringed patterns of ions could not be printed. From these results, it is considered that the patterns printed to the Si wafer were formed by ions colliding directly to the Si wafer. All of the clear printed Si wafers were elementally analyzed by TOF-SIMS and the surface was measured by surface roughness meter. The results indicate AuGe-FIB has left no fingerprints on Si wafers. It can be concluded that the clear patterns can be originated to amorphous phase generated within the first 3 hours. Ion implantations were majorly processed, after the amorphous phase has formed completely.

NAMS 2019-102 - Masashi Japan_F1

Figure 1. Annular patterns of AuGe alloy by mass separation of REF-MS on the fluorescent screen (A) f = 479 kHz, (B) f = 680 kHz (c) f = 956 kHz (Each frequency was assigned by
equation(1))

NAMS 2019-102 - Masashi Japan_F2

Figure 2. The results of the prints of annular ring patterns on Si wafers (A) f = 479 kHz, (B) f = 678 kHz, (C) f =956 kHz.

Authorship

This work was spatially supported by Mr. Tokio Norikawa and Naoya Kishimoto of Tokyo University of Science.

Contributors

The authors are particularly indebted to Mr. Takashi Kusanagi of Ampere Inc., Dr. Satoshi Kurumi and Prof. Kaoru Suzuki of Nihon University, Prof. Kosuke Moritani of University of Hyogo This unique technique was originally invented by Mr. Masanao Hotta and Dr. Tatsuya Adachi. I wish to express great respects for them.

Funding information

This work was partially supported by academic incentive system of the Toshiba Electric Devices & Storage Corporation and SHIMADZU SCIENCE FOUNDATION.

References

  1. Clemmons JH, Herrero FA (1998) Mass spectroscopy using a rotating electric field. Rev Sci Instrum 69: 2285–2291.
  2. Katayama A, Kameo Y, Nakashima M (2008) Time-of-Flight Mass Spectrometer Using an Imaging Detector and a Rotating Electric Field. J Mass Spectrom Soc Jpn 56: 229–234.
  3. Nojima M, Anai Y, Hotta M, Suzuki K, Kurumi S, et al. (2016)  Development of a mass spectrometer using two rotating electric fields. J Vac Sci Technol B 34: 03H132-1-03H132-4.
  4. Nojima M  (2017) Imaging Mass Spectrogram using Rotating Electric Fields Mass Spectrometer. Global Journal of Nanomedicine 2: GJO.MS.ID555596.
  5. Anai Y, Nojima M, Hotta M, Suzuki K, Kurumi S, et al. (2016) Development of Mass Spectrometer Using Two Rotating Electric Fields for Separation of High-Mass Ions. J Surf Sci Nanotech 14: 161–164.
  6. Machalett F, Muhle R, Stiebritz I, Gotz G (1989) Mass Spectra of Au-Ge Alloy Liquid Metal Ion Sources. Nuclear Instruments and Methods in Physics Research B37/38: 180–183.
  7. Davies N, Weibel DE, Blenkinsopp P, Lockyer N, Hill R, et al. (2003) Development and experimental application of a gold liquid metal ion source. Applied Surface Science 203–204, 223–227.
  8. Nojima M, Norikawa T, Kishimoto N (2018) Mass Separation of AuGe-LMIS Using a New Principle: Rotating Electric Fields. Mass Spectrom Purif Tech 4: 128.

Surgical History’s missing figures – a brief discussion on the under-representation of female neurosurgeons in the archives of history

DOI: 10.31038/JCRM.2019213

Original Article

Neurosurgery is a bridge between many worlds – the ancient origins of its procedures tie into the cutting edge technological advances that drive the field forward today. It is a balance between the intricate skills required in microscopic surgery to the more robust spinal surgical procedures. Women comprise over half of the annual medical student population yet in surgical fields and especially in Neurosurgery, this filters down to between 10–12% [1, 2] with progression to leadership roles in this area even more so rare – this is a gap which still needs to be bridged. In the current age wave of political correctness and openly acknowledging the generational gender inequality that has seeped into the very fabric of our economic and social conduct, one can’t help but wonder if the same could be said for the current health care system. As we slowly see a shift of women opting for once male dominated surgical departments, we should also endeavour to reflect this in our history of surgery and medicine that is often a source of inspiration for young minds. According to the Health and Social Care Information Centre 2013/14, female surgeons comprise of almost a third of all surgical trainees, however of all of the current surgical consultants in England, only 11% are women [3]. We must shed a light on the surgical specialties that may often be under-populated in the medical census such as neurosurgery and appreciate that while there is a progressive increase of women in surgery, it may be unbalanced and often skewed towards certain principles than others.

Perusing through the pages of any medical book for students or residents of examples not unlike those of Harvey Cushing and Walter Dandy who were no doubt, pioneers in their field. However, there is a deafening silence when it comes to discussing leading female neurosurgeons. Although to ate there are 12 women who have won the Nobel prize in physiology or medicine and 8 in chemistry and physics, we have been only taught about Marie Curie, a figure who comes to the minds of most students when asked. In Neurosurgery, we have heard of Dr Diana Beck and Dr.Sofia Ionescu, the first reported female neurosurgeons in the world in 1947 and 1945 respectively but this remains a niche area of interest which is slowly but surely gaining momentum.

A 2014 paper by Hariz et al discusses the contributions by female neurosurgeons and neurophysiologists in advancing stereotactic basal ganglia surgery including Dr.Gunvor Kullberg who contributed in early CT imaging and functional imaging of stereotactic lesions in Parkinson’s Disease and psychiatric patients and Dr.Hilda Molina, paving the way for MER guided transplant surgery in Parkinson’s patients. Furthermore, Dr. Veerle Vandewalle is a pioneer for deep brain stimulation for patients with Tourette’s Syndrome [4]. It is worth recognising that it was not until 2007 that the first woman to be voted into the AANS was in 2007 and first female President of the AANS, Dr Shelly Timmons, was not elected till April 2018 [5–7].

This historical underrepresentation can be attributed to a myriad of factors. Female neurosurgeons reported being influenced by factors such as lack of mentorship and leadership training as well as negotiating skills which seem to be recurring themes [2, 8]. This is reflected by the disparity between residency completion with 76% of women versus 87.2% of men completing residency and only 63% of women becoming board certified in contrast to 81.3% of male neurosurgery residents [9]. Is it then perhaps this skewed representation at the higher levels that influences what we know and learn from the history books and archives?

Dr Somma, an Italian neurosurgeon discussed this in depth, citing that female residents experiencing the impostor syndrome, a persistent fear of impropriety, by tending to point out their own fears and express their flaws, underrating themselves. Is it this reflection that often does not encourage female neurosurgeons to seek equal historical representation as well?[5]. Conversely, in India, there is an increasing number of highly-educated women entering the medical workplace annually yet multiple cultural factors discourage women from opting for highly competitive and male-dominated fields such as neurosurgery. Women are still very much “stereotyped in Indian society [who have] better acceptance of female doctors as gynecologists” [11]. This ostracized approach of not accepting that women can treat others beyond their own is very much an out dated approach in modern cultures yet seems to persist in a large percentage of the population. In contrast, we have seen a shift in Japanese Neurosurgical departments who maintain almost 29% of their residents as being female many of whom “were satisfied with their job status” when discussed [11].

In the last few number of years, we have seen an increasing number of articles and reports of pioneer female neurosurgeons in their respective countries – this is a refreshing and welcome change noted and lauded by many. It has also provided a reason to discuss this more openly and encourage diversity among all surgical specialties. It is safe to say that we are on the right track. Whilst there is still much for us to achieve before we reach an equilibrium, it may be time to change some of our old adages. Ultimately, the onus falls on us to represent history in the diverse and equal manner to future generations who will inevitably seek inspiration in their journey through this diverse, interesting and ever evolving field.

Abbreviations

AANS: American Association of Neurological Surgeons

WIN: Women in Neurosurgery (society)

References

  1. Bean J. (2008) Women in neurosurgery. J Neurosurg. 109(3): 377.oi: 10.3171/JNS/2008/109/9/0377.
  2. Steklacova A, Bradac O, de Lacy P, Benes V. (2017) E-WIN Project 2016: Evaluating the Current Gender Situation in Neurosurgery Across Europe-An Interactive, Multiple-Level Survey. World Neurosurg. 104: 48–60. doi: 10.1016/j.wneu.2017.04.094.[Crossref]
  3. The Royal College of Surgeons England. Surgery and The NHS in Numbers; https: //www.rcseng.ac.uk/news-and-events/media-centre/mediabackground-briefings-and-statistics/surgery-and-the-nhs-in-numbers/
  4. Hariz GM et al; Women pioneers in basal ganglia surgery; Parkinsonism & Related Disorders, Volume 20 , Issue 2 , 137 – 141. [Crossref]
  5. Somma T, Cappabianca P; (2019) Women in Neurosurgery: A Young Italian Neurosurgeon’s Perspective. World Neurosurgery, 15–18. [Crossref]
  6. Gilkes CE. (2008) An account of the life and achievements of Miss Diana Beck, neurosurgeon (1902–1956). Neurosurgery. 62(3): 738–42. [Crossref]
  7. Ciurea AV, Moisa HA, Mohan D. (2013) Sofia Ionescu, the first woman neurosurgeon in the world. World Neurosurg. 80(5): 650–3. [Crossref]
  8. Abosch A, Rutka JT. (2018) Women in neurosurgery: inequality redux. J Neurosurg. 129(2): 277–81. [Crossref]
  9. Lynch G, Nieto K, Puthenveettil S, Reyes M, Jureller M, Huang JH, et al. (2015) Attrition rates in neurosurgery residency: analysis of 1361 consecutive residents matched from 1990 to 1999. J Neurosurg. 122(2): 240–9. [Crossref]
  10. Spetzler RF. (2011) Progress of women in neurosurgery. Asian J Neurosurg. 6(1): 6–12. [Crossref]
  11. Yagnick NS, Tripathi M; (2018) From Conversation to Transformation: Mens’ Perspective on Strange Nuances of Neurosurgical Practice for Women in India. World Neurosurgery 117(11). [Crossref]
  12. Fujimaki T, Shibui S, Kato Y, Matsumura A, Yamasaki M, Date I et al. (2016) Working Conditions and Lifestyle of Female Surgeons Affiliated to the Japan Neurosurgical Society: Findings of Individual and Institutional Surveys.. Neurol Med Chir (Tokyo). 56(11): 15–18. [Crossref]

Ventriculo-Peritoneal Shunt Infection Secondary to Translocation of Gut Bacteria without Evidence of Peritonitis

DOI: 10.31038/JCRM.2019212

Abstract

Translocation of gut flora is a well-known and documented phenomenon which usually presents in immunocompromised patients or obstructive jaundice. Presented here is a patient with translocation of intestinal bacteria and subsequent infection of ventriculo-peritoneal (VP) shunt without clinical picture of acute peritonitis or sepsis.

Keywords

Ventriculo-peritoneal shunt, Bacterial translocation

Introduction

Translocation of gut flora resulting in sepsis in patients is well documented. However, translocation without a clear clinical picture of offending factors (i.e. immunosuppression, bowel obstruction, obstructive jaundice) are not well published. We present a patient who had a VP shunt with subsequent shunt infection by intestinal flora following enteritis secondary to Clostridium difficile bacteria.

Case History

Our patient is a 53-year-old female with medical history of cerebral aneurysm that was operatively clipped then subsequently developed hydrocephalus. The patient underwent placement of a VP shunt for the treatment of her symptomatic hydrocephalus. Patient presented to the emergency department 3 months later with a headache lasting 48 hours with photophobia, nausea, vomiting, and neck stiffness. Patient also reported two weeks of diarrhea. The patient denied any other significant findings on review of systems.

On physical exam the patient’s vital signs were stable, afebrile, in no acute distress, lungs clear to auscultation bilaterally, and abdomen soft nontender nondistended. Laboratory findings upon arrival were a white blood cell count to 7.4 (4.5–11.0 103/µL), hemoglobin 15.2 (11.0–17.3g/dL), hematocrit 45.9 (36–53%), platelet count 144 (140–440 103/µL), sodium 141 (136–144 mmol/L), potassium 4.2 (3.6–5.1 mmol/L), chloride 103 (101–111mmol/L), blood urea nitrogen 6 (8–26 mg/dL), creatinine 0.64 (0.61–1.24 mg/dL), glucose 108 (79–99 mg/dL), and anion gap of 16 (3–13 mmol/L). Throughout the entirety of the patient’s hospital stay, she did not have an elevated white blood cell count, fever, tachycardia or tachypnea. She did however have asymptomatic bradycardia which was improved after discontinuing her beta-blocker medication.

CT of the brain showed proper position of ventriculostomy catheter placement and unchanged compared to previous CTs. There is no evidence of hemorrhage, midline shift, or hydrocephalus. CT of the abdomen was unremarkable with no acute abdominal or pelvic process visualized. Cerebrospinal fluid cultures were taken which were positive for enterococcus faecalis and E. coli. Clostridium difficile screen was positive for both antigen and active toxin in stool but blood cultures were negative. Patient was started on IV gentamicin, IV ampicillin, and oral vancomycin. Patient underwent successful removal of VP two-piece shunt and diagnostic laparoscopy with peritoneal washout. There was no evidence of free fluid or intraperitoneal infection. A moderate amount of adhesions were present within the abdominal cavity from previous surgeries but no abscess or phlegmon were found and no bowel perforation. Copious irrigation was performed with saline and sent for cultures which were negative for organisms and white blood cells. The patient tolerated the procedure well. She was ultimately discharged with IV gentamicin & ampicillin, and oral vancomycin. Patient followed up 6 months later with improvement in her hydrocephalus without evidence of residual infection.

Discussion

VP shunt is the most common neurosurgical procedure done in the US [1]. This procedure often is complicated by infection resulting in the shunt being extracted, repositioned or replaced. While gut bacterial translocation is a common phenomenon [2,3], the pathophysiological outcome of such phenomena precipitating in VP shunt infection was not observed before.

The blood flow translocation presented by low immune response and intestinal infection has been observed in patients with acute abdominal pain, fever, nausea, and vomiting with signs and symptoms of peritonitis [4]. The management specifically directed toward the infection may be successful at time to salvage the shunt. Occasionally, temporary externalization of the distal portion of the shunt may be performed until the infection is controlled.

Bacterial translocation presented by the brief incidence of colitis is not well recorded. This brings the attention of the physician to the fact that disturbance of the gut flora and loss of intestinal mucosal barrier can occur with little or no symptoms of peritonitis and can potentially result in translocation of the gut bacteria and shunt infection. The plan for patient is immediate and aggressive treatment of the source of and removal of the shunt. Our patient had a brief history of diarrhea with few abdominal complaints and no signs or symptoms of peritonitis to explain the subsequent shunt infection. Furthermore, culture of peritoneal fluid was negative for bacteria. Therefore, the translocation of gut flora during the episode of colitis resulted in a loss of intestinal barrier integrity with subsequent positive CSF culture and VP shunt infection.

The conservative treatment with IV antibiotics at this stage was unsuccessful and ultimately to control the infection the shunt had to be removed. The long-term therapy in such patients is to continue IV antibiotics, followed by replacement of the shunt when needed.

We did not perform bacterial DNA-strain of the cultured organism due to the lack of resources, which would be helpful when available in similar future cases.

Conclusion

Intestinal bacterial translocation and its impact on the integrity of the VP shunt come with serious consequences. We presented a patient with very minimal evidence of intestinal infection and VP shunt infection, with failure of conservative management and ultimately removal of the shunt to achieve recovery.

Acknowledgements

The authors acknowledge Natalia Cwalina MD, for her invaluable assistance.

Declaration of Conflicting Interests: The Authors declare that there is no conflict of interest.

References

  1. C Vaishnavi. (2013)  Translocation of gut flora and its role in sepsis.  Indian Journal of Medical Microbiology  31: 334–342. [Crossref]
  2. S Balzan, C de Almeida Quadros, R de Cleva, et al. (2007) Bacterial translocation: overview of mechanisms and clinical impact.  Journal of Gastroenterology and Hepatology 22: 464–471. [Crossref]
  3. JC Dalfino, MA Adamo, RH Gandhi, et al. (2012) Conservative management of ventriculoperitoneal shunts in the setting of abdominal and pelvic infections.  Journal of Neurosurgery Pediatrics  9: 69–72. [Crossref]
  4. Y Gutierrez-Murgas, JN Snowden. (2014) Ventricular shunt infections: immunopathogenesis and clinical management.  276: 1–8. [Crossref]

Chikungunya Infection and The Gynecological and Obstretic Effects on Girls and Women: A Short Note

DOI: 10.31038/IGOJ.2019224

Short Commentary

Chikungunya virus is the causal agent of chikungunya fever, which is a vector-borne disease that was first identified in Tanzania in 1952 [1]. The term is from the Kimakonde language and means “to become contorted” [1]. Here, our objective is to alert people to chikungunya virus and its gynecological and obstetric effects on pregnancy and children. So, after general considerations on chikungunya virus we present the effects that have been considered more relevant, of chikungunya infection on girls and woman in the gynecological and obstetric context.

General Considerations

The vectors of chikungunya virus are the mosquitoes Aedes albopictus and Aedes aegypti. However, it is also possible that vertical transmission, a transmission occurs from mother- to- child during pregnancy or at birth. Accordingly [2] the chikungunya epidemic that occurred on La Reunion Island, 2005–2006, revealed for the first time the possibility of mother- to- child transmission in the perinatal period with a high rate of morbidity.

In a general context,  we can show the world importance of chikungunya infection by  the occurrence of outbreaks in the world [3]: (1) Sudan, 15 October 2018; (2) Mombasa – Kenya,  27 February 2018; (3) Italy, 29 September 2017; (4) Italy, 15 September 2017; (5) France, 25 August 2017; (6) Kenya, 9 August 2016; (7) United States of America, 14 June 2016; (8) Argentina, 14 March 2016; (9) Spain (update), 17 September 2015; (10) Senegal, 14 September 2015;(11) Spain, 10 August 2015; (12) France, 23 October 2014; (13) in the French part of the Caribbean isle of Saint Martin, 10 December 2013; (14) India, 17 October 2006; (15) South West Indian Ocean , 17 March 2006;(16)  La Reunion Island (France), 17 February 2006.

Effects of Chikungunya Infection on Girls and Woman

The authors [4] have indicated that “in addition to virus transmission at birth, potential complications include transplacental transmission before birth, congenital malformations, stillbirths, growth restriction, and preterm delivery. The high fever that characterizes chikungunya infection could cause uterine contractions or fetal heart rate abnormalities, which might promote spontaneous or induced preterm delivery (cesarean for fetal salvage). The hemorrhagic syndrome described at the onset of infection might be manifested by vaginal bleeding during pregnancy or third-stage hemorrhaging, reported for dengue virus [5, 6]”. In [7], we have a good article on “congenital and perinatal complications of chikungunya fever”, which we recommend.  The authors cite in their conclusion:” Chikungunya represented a substantial risk for neonates born to symptomatic parturients during the chikungunya outbreak in the Americas Region, with important clinical and public health implication.”

Finally, with knowledge of the negative effects of chikungunya virus on reproductive health in girls and women the World Health Organization (WHO) [8], encourages countries to develop and maintain the capacity to detect and confirm cases, manage patients and implement social communication strategies to reduce the presence of the mosquito vectors.

Keywords

Aedes, Chikungunya, Gynecology, Obstetric, Pregnancy, Vector-Borne Diseases

References

  1. WHO (April 2016) Chikungunya Fact Sheet. https://www.who.int/emergencies/diseases/chikungunya/en/
  2. Lenglet Y, Barau G, Robillard PY, Randrianaivo H, Michault A, Bouveret A, et al. Chikungunya infection in pregnancy: Evidence for intrauterine infection in pregnant women and vertical transmission in the parturient. Survey of the Reunion Island outbreak. J Gynecol Obstet Biol Reprod (Paris) 2006; 35:578–83.
  3. https://www.who.int/csr/don/archive/disease/chikungunya/en/
  4. Fritel X, Rollot O, Gerardin P, Gauzere BA, Bideault J, et al. (2010) Chikungunya virus infection during pregnancy, Reunion, France, 2006. Emerg Infect Dis 16: 418–425.
  5. Carles G, Talarmin A, Peneau C, Bertsch M (2000) Dengue fever and pregnancy. A study of 38 cases in French Guiana. J Gynecol Obstet Biol Reprod (Paris) 29: 758–762.
  6. Waduge R, Malavige GN, Pradeepan M, Wijeyaratne CN, Fernando S, et al. (2006) Dengue infections during pregnancy: a case series from Sri Lanka and review of the literature. J Clin Virol 37: 27–33. [crossref]
  7. Torres JR, Falleiros-Arlant LH, Dueñas L, Pleitez-Navarrete J, Salgado DM, et al. (2016) Congenital and perinatal complications of chikungunia fever: a Latin American experience. Int J of Infectious Dis 51: 85–88.
  8. WHO, News 12 April 2017. For more information: WHO Media Centre, email mediainquiries@who.int

Cardiovascular Changes in Normo and Hypogonadal Rats Treated with a High-Fructose Diet and Induced Hyperuricemia Condition

DOI: 10.31038/EDMJ.2019332

Abstract

Objective: to evaluate the presence and type of cardiovascular damage in normogonadic and hypogonadic male rats with a induced condition of mild hyperuricemia and exposed to a high-fructose diet.

Methods: Fifty six (56) male adult Wistar rats were used in the present work. Animals were divided into two groups; normogonadic (NGN) and hypogonadic (HGN), and each group was divided into four subgroups according to their treatment: control with only water (C), Fructose (F), Oxonic acid (OA) and Fructose plus Oxonic acid (FOA). Cardiovascular changes were evaluated by measuring systolic blood pressure , myocyte volume, fibrosis and intima media of aorta.

Results: The FOA group significantly increased blood pressure, myocyte volume (p<0.0001), the percentage of fibrosis was significant in the group receiving OA (p<0.001). When comparing NGN vs HGN, hypogonadic animals showed a less favorable lipid profile.

Conclusion: Hypogonadic, hyperuricemic conditions and a high-fructose diet favor blood pressure increase, along with changes in the cardiac hypertrophy, fibrosis and thickness increase of the intima media.

Key words

Hyperuricemia, Hypogonadism, Normogonadism, Cardiovascular Damage, Hypertension.

1. Introduction

Cardiovascular disease (CVD) is the main cause of mortality in the world 1] and is the first cause of morbi-mortality in the elderly adult man. The increase of CVD may be related to the concomitant decrease in testosterone levels, which can be associated with cardiovascular risk factors such as Body Mass Index (BMI) increase, abdominal obesity, inflammatory markers, insulin resistance, dyslipidemia, diabetes, hypertension and arteriosclerosis [2]. It is still controversial whether or not a testosterone decrease is an independent factor of CVD. The Rancho Bernardo study monitoring 1000 men aged from 40 to 79 during 12 years did not find any relation between testosterone levels and CVD [3]. Similar findings were observed in the Baltimore Longitudinal Study of Aging [4] and in the Honolulu Heart Program [5]. Conversely, in a 5-year monitoring study, Ohlsson and coll. [6] found that men with higher testosterone levels showed less CVD incidence. Likewise, other authors found that low levels of testosterone showed a greater CVD incidence [7–9].

Uric acid is the end product of purine catabolism. Although many mammals such as rats have uricase, an enzyme that degrades uric acid into allantoin, humans lost uricase during the course of evolution. Hyperuricemia may be the result of a purine-rich diet, an overproduction due to the increment in the action of the xanthine oxidase enzyme, as well as a decrease excretion of urates; although more often it is due to a high-fructose diet, being fructose a characteristic of fast food [10]. There is controversy regarding the oxidant and antioxidant actions of uric acid [11], including its effect on the CVD. Some studies have revealed a relationship between hyperuricemia and CVD such as NHANES I, LIFE study [12–14] whereas in others this relationship was not found [15–18]. Ranjith [19] and Tomiyana [20] observed a positive relationship between CVD, hyperuricemia and metabolic syndrome.

All studies were performed in adults and being them mostly men. But none of the studies expresses the gonadal state of men or testosterone levels. Unlike what happens in the studies of women, where the menopause marks a difference of the gonadal stage.

For this reason, the object of this paper is to evaluate the presence and type of cardiovascular damage in normogonadic and hypogonadic male rats with a induced condition of mild hyperuricemia and exposed to a high-fructose diet.

2. Experimental

2.1 Animals

Fifty six male adult Wistar rats from the Department of Physiology, School of Medicine, University of Buenos Aires were used for this experiment. Animals were housed in a light, temperature and humidity controlled environment (lights on from 07.00 am to 07.00 pm, T 22–24° C), and were fed ad libitum, having access to chow and water during the experiment. When the experiment began animals were 70 days old. Animal handling and experiments were performed in line with the “Ethical principles and guidelines for experimental animals” of the Swiss Academy of Medical Sciences (3rd Edition 2005).The study was granted by the Animal Care and Ethics Committee of the School of Medicine-UBA (CICUAL).

2.2 Experimental Design

Eight groups of adult male Wistar rats (n= 7/group) four normogonadic (NGN) and four hypogonadic (HGN), were studied over a period of 5 weeks;

The NGN groups were divided into four subgroups (n= 7/group; weight 200 grams ± 5 grams): a) Control group (C): fed with a standard commercial diet and water. b) Fructose group (F): fed with the same diet plus 10% (w/v) fructose (100% fructose, Tate&Lyle, USA) in the drinking water during 5 weeks. c) Oxonic Acid group (OA) (97% oxonic acid potassium salt, Sigma Aldrich n°:156124, St.Louis, MO, USA): fed with a standard commercial diet and water, and receiving the uricase inhibitor OA by intragastric gavage (750 mg/kg BW, daily) (21). d) Fructose and Oxonic Acid group (FOA): fed with the control diet plus 10% (w/v) fructose in the drinking water during 5 weeks and receiving also the oxonic acid by intragastric gavage (750 mg/kg BW, daily), during the same period. All animals were fed with balanced food for laboratory rodents (Cooperation, ACA-16014007, Argentine Cooperative Association, Animal Nutrition Division, Argentina Industry).Animals in all groups were provided from same diet lots at the same time during the course of the study, to control across groups for possible variation in the content of the diet.

In the second group (HNG), young adult male rats (70 days old) were orchiectomized bilaterally through an anterior median incision in the scrotum and each duct deferens was isolated, ligated and cut, and so the testicle could be removed. One month after that, HNG animals (100 days old) began the experimental period and were divided into the same four subgroups (n= 7/group; weight 280 grams ± 5 grams) that received the same treatment as the four NGN groups: a) Control group (C), b) Fructose group (F), c) Oxonic acid group (OA), d) Fructose and Oxonic acid group (FOA).

In all control and fructose groups without OA, animals received water vehicle administered by intragastric gavage. In such way all animals had the same level of stress by gavage.

2.3 Body Weight and Systolic Blood Pressure Measurements

Animals body weight was measured daily (g) were carried out using an analytical balance (Scaltec model SAC-62), with an accuracy of (10–4 grams), following the recommendations of Cossio-Bolaños et al [22]. Amount of beverage consumed by each group of rats was calculated and measured daily according to the volume of liquid consumed.

Systolic blood pressure (SBP) was measured in conscious rats by a validated volume-based tail-cuff method connected to an amplifier and a data acquisition system (Rat Tail System; Innovators in Instrumentation, Landing NJ, USA). All animals were preconditioned for blood pressure measurements 1 week before each experiment. SBP was measured at baseline, at the end of week 2, and at the end of week 4. Prior to measurements, rats were placed in a holder preheated to 35°C. An average value from three SBP readings (that differed by no more than 2 mm Hg) was determined for each animal after they had become acclimatized to the experimental environment.

2.4 Blood Measurements

At the end of the 5-week-treatment period all animals were sacrificed between 9:00 – 10:00 am by decapitation and trunk blood samples were collected to measure plasma glucose, creatinine, uric acid, and lipid profile total-cholesterol, triglycerides (TG), and HDL-cholesterol. The TG/HDL-cholesterol index was calculated as a surrogate marker of insulin resistance (IR) [23]. All these values were assayed with commercial kits (Bayer Diagnostics, Argentine) implemented in an automated clinical analyzer. Testosterone was measured by Electrochemiluminescence immunoassay (ECLIA) (Roche Diagnostics Ltd., Switzerland).

2.5 Cardiovascular Outcomes

The whole heart from seven animals from each experimental group was carefully dissected and removed and its wet weight was recorded; thereafter, a piece of each heart was obtained, fixed in 10% formaldehyde and embedded in paraffin. The sections were stained with hematoxylin & eosin and Periodic Acid Schiff (PAS).

2.5.1 Morphometric determination of myocyte size

We measured cardiomyocyte sizes previously stained with hematoxylin, eosin and PAS. To be consistent, myocytes positioned perpendicularly to the plane of the section with a visible nucleus and cell membrane clearly outlined and unbroken were then selected for the cross sectional area measurements. Myocyte volume (myocyte hypertrophy) was calculated from individual myocyte area (formula: length (μm) × width (μm) × 7.59 × 10⁻³) based on the previously demonstrated correlation between these parameters [24]. A total of 50 myocytes per animal were selected from the left ventricle of each heart and analyzed by an observer blinded to the experimental treatment.

2.5.2 Fibrosis

Sections were stained with Masson’s trichrome. Positive blue color was analyzed in Image Pro Plus (Media Cybernetics).

2.5.3 Intima Media Aorta

At the end of the experiment, only in hypogonadic rats, the thoracic aorta (from the arch to the diaphragm) was harvested, cut in half, and either fixed in buffered formalin or snap frozen. Aorta rings were embedded in paraffin and sections were cut at 4 μm and prepared for hematoxylin and eosin (HE) staining. Quantification of injured area in HE-stained aorta sections was analyzed using Image-Pro Plus software and analyzed by an observer blinded to the experimental treatment.

2.6 Statistical Analysis

Values are expressed as means ± SEM. Significant differences between treatment groups were determined by two-way ANOVA. When p<0.05, ANOVA post test comparisons were made using a Bonferroni multiple-comparison test. The relationship between variables was assessed by correlation analysis (Pearson correlation). Statistical analysis was performed with Prism version 5.04 (Graph Pad Software, San Diego, CA).

3. Results

3.1 Body weight

Although there was an increase in weight between the start and the end of the experiment in all the groups (p < 0.001), no significant difference was found at the end of the experiment between groups, both in NGN and HGN animals (not shown).

3.2 Water intake

All animals receiving fructose (F) drank more liquid volume than the control group or animals receiving other treatments, NGN group: (C: 122.5 ± 17.5, F: 258 ± 65, OA: 107.5 ± 22.5, FOA: 250 ± 50 ml/day (p<0.01), HGN: (C: 125 ± 15, F: 235 ± 65, OA: 105 ± 5, FOA: 250 ± 50 ml/day (p<0.01) (not shown).

3.3 Blood Pressure

In normogonadic animals: Control group did not show SBP changes during the experiment. Nevertheless, there was a significant increment in the F group (p<0.01), in the OA group (p<0.0001) and in the FOA group (p<0.0001) compared to basal state. At the end of the experimental period, SBP was significantly higher in all treatment vs control group (p<0.0001). In addition, a significant difference was found between F vs OA and FOA groups (p<0.01), reaching maximal SBP levels in FOA, which was significantly higher than in the OA group (p<0.01) (Figure 1).

EDMJ 2019-111 - Soutelo J Argentina_F1

Figure 1. Blood Pressure in NGN groups, at basal and 4th weeks after beginning treatment.

Data are expressed as mean ± SEM. NGN (Normogonadic), OA (Oxonic acid); FOA (Fructose and oxonic acid)
* p<0.05 Fructose at 4th week vs Fructose basal.
** p<0.001 OA and FOA groups at 4th weeks vs respective basal groups.

In hypogonadic animals: Contrary to normogonadic rats, the control group showed a significant (p<0.01) increment in SBP during the time of experiment. Also there was a significant (p<0.001) increment in the F, OA (p<0.0001) and FOA groups (p<0.0001). At the end of the experiment, SBP was significantly higher in all treatments vs. control group (p<0.001). In addition, a significant difference was found between F vs. OA and FOA groups (p<0.01), reaching maximal SBP levels in FOA, that were significantly higher than in the OA group (p<0.01). (Figure 2).

EDMJ 2019-111 - Soutelo J Argentina_F2

Figure 2. Blood Pressure in HGN groups, at basal and 4th weeks after beginning treatment.

Data are expressed as mean ± SEM. HGN (Hypogonadic), OA (Oxonic acid); FOA (Fructose and oxonic acid)
*p<0.001 Control at 4th week vs Control basal.
**p<0.0001 Fructose, OA and FOA groups at 4th week vs respective basal groups.

When comparing gonadal condition, HGN rats presented -in all groups and during the whole experimental time- higher SBP levels than NGN rats (p <0.0001), except at the end of experimental time in OA and FOA groups.

3.4 Biochemical Variables

As expected, testosterone levels decreased to a very low level in all hypogonadic animals compared to all non castrated rats (p<0.0001). Nevertheless, in both normogonadic and hypogonadic groups there were no plasmatic testosterone levels differences between different treatments. There was no difference in plasmatic creatinine levels when comparing treatment groups. Also no significant differences were observed in fasting glucose levels between normo and hypogonadic groups with different treatments.

Uric acid levels were significantly higher in normogonadic animals treated with OA (UA: 1.27 ± 0.13 mg/dl) and FOA (UA: 1.49 ± 0.1 mg/dl) when comparing them to the respective control group (UA: 0.97 ± 0.04 mg/dl) (p< 0.01). Also, uric acid levels were significantly higher in hypogonadic animals treated with FOA (UA: 1.29 ± 0.06 mg/dl) when comparing them to the respective control group (0.96 ± 0.67 mg/dl) (p< 0.01). Likewise, there were no significant differences when comparing NGN and HGN animals undergoing same beverage treatment.

Regarding the lipid profile, NGN animals showed no significant difference in Total Cholesterol (TC), triglycerides (TG), HDL-c levels, in no-HDL-c, in the TG/HDL index in the different experimental groups.

HGN animals in the fructose (F) group showed a significant increase (p<0.01) in TG and TC levels, accompanied by an increase of no HDL-c (p<0.05) with no changes in the HDL fraction. These changes translated into a significant increase (p<0.05) of the TG/HDL index. Conversely, the lipid profile showed no changes in OA and FOA groups when comparing them to the control group.

Hypogonadic animals showed -when faced to fructose administration- a significant increase in CT plasmatic levels (p<0.0001), TG (p<0.01), no HDL-c (p<0.0001) and a decrease of HDL (p<0.0001) accompanied by an increase of the TG/HDL index (p<0.004) as compared to the normogonadic animals. Likewise, hyperuricemia induction (OA) in HGN animals produced an HDL decrease (p<0, 001) with a rise of no HDL-c (p< 0, 001) accompanied by an increase of the TG/HDL index (p<0.02); and the combined treatment (FOA) in the same group showed a decrease of HDL (p<0.02) with an increase of no HDL (p<0.04) (Table 1)

Table 1. Lipid Profile. Comparative effect of the gonadal condition at different stages of treatments.

Cholesterol (mg/dl)

NGN

HGN

p (NGN vs HGN)

Control

53.71 ± 10.12

59.83 ± 2.56

NS

Fructose

56.00 ± 5.68

74.79 ± 3.21*

0.0001

OA

55.28 ± 5.85

60.22 ± 2.84

NS

FOA

63.00 ± 2.20

60.38 ± 4.11

NS

Triglycerides (mg/dl)

Control

64.14 ± 16.65

67.5 ± 6.85

NS

Fructose

69.28 ± 14.28

103.15 ± 9.58**

0.01

OA

48.00 ± 7.69

59.25 ± 5.66

NS

FOA

67.14 ± 15.84

68.03 ± 7.23

NS

HDL-c (mg/dl)

 Control

41.71 ± 4.39

27.75 ± 1.85

0.001

Fructose

44.71 ± 6.01

30.89 ± 2.06

0.0001

OA

44.28 ± 5.54

31.95 ± 1.57

0.001

FOA

44.00 ± 6.72

34.58 ± 2.21

0.02

TG/HDL

Control

1.05 ± 0.58

1.47 ± 0.31

NS

Fructose

1.52 ± 0.45

3.49 ± 0.54***

0.004

OA

1.10 ± 0.24

1.86 ± 0.16

0.02

FOA

1.58 ± 0.48

2.06 ± 0.31

NS

No HDL-c (mg/dl)

Control

22.00 ± 6.30

32.08 ± 0.95

0.01

Fructose

19.28 ± 4.59

43.9 ± 2.80

0.0001

OA

19.00 ± 2.45

28.26 ± 2.27

0.01

FOA

19.00 ± 4

25.20 ± 2.35

0.04

Data are expressed as mean ± SEM . NGN: normogonadic HNG: hypogonadic, OA: oxonic acid; FOA: Fructose and oxonic acid. NS: non significant.
*p< 0.01 HGN Control vs HGN Fructose group.
**p< 0.01 HGN Control vs HGN Fructose group
*** p< 0.05 HGN Control vs HGN Fructose group.
p< 0.05 HGN Control vs HGN Fructose group.

A weak positive correlation was found between the testosterone and HDL levels (r: 0.313, p<0.02) and a weak reverse relationship between the testosterone and no HDL levels (r -0.345, p<0.01) (Figure 3).

EDMJ 2019-111 - Soutelo J Argentina_F3

Figure 3. Testosterone and lipids correlation. A: Testosterone and HDL (r: 0.313 p< 0.02). B:  testosterone and no HDL levels (r -0.345, p<0.01).

3.5 Cardiovascular Histology

3.5.1 Morphometric determination of myocyte size

In the NGN group of animals there was significant difference between groups, the ones treated with FOA showed a greater volume (p<0.001), followed by the ones treated with OA (p<0.001); then animals treated with F (<0.05), while control animals had the lowest volume (Figure 4 A)

Same pattern with significant difference was observed in the HGN group. The FOA group showed a greater volume (p<0.001), followed by the ones treated with OA (p< 0.001); then animals treated with F (NS), while control animals had the lowest volume. (Figure 4B)

EDMJ 2019-111 - Soutelo J Argentina_F4

Figure 4. Myocyte volume of normogonadic (A) and hypogonadic rats (B).

Data are expressed as mean ± SEM. OA: oxonic acid, FOA: Fructose and oxonic acid.
*p < 0.05 Fructose vs Control NGN group
** p < 0.001 OA and FOA vs Control NGN group
*** p < 0.001 OA and FOA vs Control HGN group

No significant differences were found when analyzing different groups (NGN vs HGN) with same treatment.

3.5.2 Fibrosis

Animals in NGN groups treated with FOA showed a greater fibrosis percentage vs control (p<0, 009) also in F group (p<0.03 vs control). Animals in HGN groups treated with FOA and OA showed more fibrosis than control group (p<0.01) When comparing the different experimental groups (NGN vs HGN) under same treatment, we found a greater fibrosis in HGN animals treated with OA than in NGN animals under same treatment (p<0.04). Even though it was not significant, same pattern was observed in animals treated with FOA (Table 2).

Table 2. Percentage of miocardic fibrosis.

NGN

HGN

p

Control

2.69 ± 0.19*‡

2.56 ± 0.06**†

NS

Fructose

3.25 ± 0.14‡

3.26 ± 0.34

NS

OA

2.97 ± 0.17

4.33 ± 0.62†

0.04

FOA

3.43 ± 0.14*

5.96 ± 1.23**

0.06

Data are expressed as mean ± SEM. NGN: normogonadic,  HNG: hypogonadic, OA: oxonic acid; FOA: Fructose and oxonic acid.  NS: non significant
*p <0.009 control group NGN vs FOA group NGN
‡p <0.03 control group NGN vs F group NGN
**p< 0.01 control group HGN vs FOA group HGN. † p< 0.01 control group HGN vs OA group HGN

3.5.3 Intima media of aorta

The intima media was significantly thicker in FOA (p<0.001), OA (p<0.001) and F (p<0.001) groups when compared to control animals, with no evidence of differences between the treated groups (Figure 5)

EDMJ 2019-111 - Soutelo J Argentina_F5

Figure 5. Intima media thickness in hypogonadic rats.

Data are expressed as mean ± SEM. OA: oxonic acid, FOA: Fructose and oxonic acid.
* p<0.001 Fructose, OA and FOA vs Control group.

4. Discussion

During our work we found that animals in both groups (NGN and HGN) treated with FOA showed a greater volume of myocyte, followed by OA groups while only normogonadic animals treated with F showed a greater volume when compared to control animals; this effect was not influenced by gonadal condition. Similar results were observed when systolic blood pressure was examined; probably the increase of same is -in part- the cause of the myocyte hypertrophy found.

Hyperuricemia leads -in its initial phase- to an endothelial dysfunction [25, 26], increase in the oxidative stress and activation of the rennin-angiotensin- aldosterone system [27] and in a second phase favors inflammatory changes [28]. Likewise, Saygin et al. showed recently that a high-fructose diet also produces endothelial damage [29]. Hypogonadic animals treated with F, OA and FOA showed an increase in the intima media when compared to the control group. So, we could observe that a high-fructose diet and hyperuricemia share mechanisms to favor the increase of intima media thickness, endothelial damage and arterial hypertension and in this way favoring arteriosclerosis [25, 26, 30] and cardiac hypertrophy. This is consistent with the observations made in our experiment where the FOA group showed the highest values of systolic blood pressure, greater thickness of the intima media and cardiac hypertrophy.

We also noticed that hypogonadic animals showed higher levels of blood pressure than the normogonadic ones. The blood pressure increase could be partly due to the weight increase observed in these animals, as well as insulin resistance and cytokine increase which favor vasoconstriction. Testosterone is a vasodilating agent; some experiments have theorized about an inhibition of the Voltage Gated Calcium Channels (VGCC) and/or activation of potassium channels in the vascular smooth muscle, and it could also be a result of an up regulation of endothelial nitric oxide synthase enzyme expression (eNOS) [31, 32].

Animals treated with FOA in both groups showed greater cardiac fibrosis when comparing with their respective controls: Likewise animals in the hypogonadic OA group showed a greater fibrosis compared with normogonadic OA, and the same tendency was observed in FOA groups. Chen et al. [33] showed that hyperuricemia increases cardiac fibrosis and Mellory et al. [34] found that the high-fructose diet also increases cardiac fibrosis. Unfortunately, there is a strong controversy regarding the role of testosterone over the cardiovascular effects [35] as to assert that the testosterone deficit causes cardiovascular damage and fibrosis.

Regarding the lipid profile, it is clear that hypogonadic animals showed a less favorable profile, where the fructose group is the one with higher levels of cholesterol, triglycerides, no-HDL and the TG / HDL ratio, a marker of insulin resistance [23].

High fructose diets lead to a hepatic insulin resistance with an increased influx of free fatty acids, synthesis and triglyceride storage, and VLDL synthesis excess. This overproduction of VLDL alters the lipoprotein lipase (LPL) function. Hypertriglyceridemia is normally associated with low HDL levels [36].

This occurs, and is partly due to an increment of the Cholesteryl ester transfer protein (CETP) activity which favors HDL decrease (36). In the resistance to insulin an alteration of hepatic and endothelial lipase activity has been observed; which increases the HDL catabolism [36].

So we can assert that high levels of triglycerides and a decrease in HDL levels are independents predictors of insulin resistance and cardiovascular disease [23].

Likewise, low testosterone levels are linked to a pro-atherogenic lipid profile. A positive correlation between HDL and testosterone levels was found in several works [37, 38]. Rancho Bernardo study also showed a reverse relation between testosterone and VLDL levels [39]. On the other hand, in all treatments we found a uric acid level increase in normogonadic animals compared to the hypogonadic ones. This could be the result of testosterone stimulant action on the urate transporter -1 (URAT-1) expression responsible for the reabsorption of urates at tubular level. Also the monocarboxylate transporter expression coupled with sodium type 1 and 2 which facilitates the presence of essential lactate for the urate/lactate transport by URAT-1 [40].

On the other hand we observed an inversely significant correlation between testosterone and body weight. Studies in humans [41–43] have shown that hypogonadic men have an increase in body weight (BMI) and in waist circumference. Although the mechanism has not been completely clarified, it was stated that adipocytes express androgen receptor [44] and that testosterone inhibits Lipoprotein Lipase (LPL) activity, responsible for the uptake of triglycerides by the fat cell, and so producing an inhibition of the triglyceride uptake and a decrease of visceral adipose tissue [45]. On the contrary, the lack of testosterone produces a higher triglyceride uptake with the subsequent increase of visceral fat. This increment favors a rise in the aromatase, increasing the estrogen synthesis. Likewise, it produces the resistance to insulin, which leads to an SHBG decrease, thus increasing the testosterone metabolism [46].

Undoubtedly animals treated with FOA, OA and F showed some morphologic and functional cardiovascular changes, shown by the increment in systolic arterial pressure and therefore a higher hypertrophy and fibrosis. These changes were affected by gonadal conditions. Likewise, hypogonadic animals showed greater weight, worse lipid profile (less HDL and more HDL) and a higher TG/HDL index as insulin resistance marker, which carries a greater atherosclerotic risk.

 Fructose is a simple sugar that is present in fruits and honey and is responsible for their sweet taste. Excessive fructose intake (>50 g/d) may be one of the underlying etiologies of metabolic syndrome and type 2 diabetes. [47] One of the more striking aspects of fructose is its ability to stimulate uric acid production. As ATP is consumed, AMP accumulates and stimulates AMP deaminase, resulting in uric acid production. Researchers have reported a dose dependent relationship between fructose ingestion and serum uric acid levels in both men and women, although in another study this relationship was confirmed only in men [45] It has been proved that fructose administration to normal rats for different time periods sequentially induces impaired glucose tolerance and type 2 diabetes [48–50]. Also rats have an active uricase, and these findings explain why higher concentrations of fructose are required to induce greater metabolic changes in rats, whereas humans, who lack uricase, appear to be much more sensitive to the effects of fructose. For this reason, we induce mild hyperuricemia with an inhibitor of uricase, oxonic acid. That in humans would be given by a serum value between 6 to 7.0mg/dl [51]. Likewise, we believe that the age of the rats used in this present experiment, did not influence the results, since the male Wistar rats acquire their reproductive capacity at 60 days. We wanted to simulate a state of hypogonadism similar to a man around the age of forty, when testosterone begins to decline [52], without becoming an elderly adult.

A high fructose diet as well as hyperuricemia conditions, favor the increment of blood pressure and cardiovascular damage, and these effects are more relevant in animals with both conditions simultaneously. Likewise, it was also shown that the lipid profile is linked to testosterone levels. The combination of these conditions might explain why western fast food diets associated with a testosterone decrease favor the presence of cardiovascular disease in older men. In any case, it is necessary to carry out more studies to understand the mechanisms involved in such changes.

In short, cardiovascular damage was worse in rats with hypogonadism with a condition induced by mild hyperuricemia exposed to a high fructose diet than the normal gonadal state with a similar condition.

Authors’ Contributions

Study design was conducted by Jimena Soutelo, who also performed experiments, analyzed data, and wrote the paper. Yanina Alejandra Samaniego and María Cecilia Fornari were responsible for sample collection. Carlos Reyes Toso was responsible for performed experiments and data analysis. Osvaldo Ponzo analyzed data and wrote the paper.

Acknowledgement

This work was supported by Grants from University of Buenos Aires (UBACYT) Project number 20020130100439BA. We thank Angela Ciocca Ortúzar for the manuscript translation and revision.

References

  1. World Health Organization (WHO) Global status report on noncommunicable diseases 2014. 2014: 1–302. Available at: http://www.who.int/nmh/publications/ncd-status-report-2014/en/
  2. Shores MN, Biggs ML, Arnold AM, Smith NL, Longstreth WT, et al. (2014) Testosterone, dihidrotestosterone, and incident cardiovascular disease and mortality in the cardiovascular health study. J Clin Endocrinol Metab 99: 2061–2068.
  3. Barrett-Connor E, Khaw KT (1988) Endogenous sex hormones and cardiovascular disease in men. A prospective population-based study. Circulation 78: 539–545.
  4. Contoreggi CS, Blackman MR, Andres R, Muller DC, Lakatta EG, et al. (1990) Plasma levels of estradiol, testosterone, and DHEAS do not predict risk of coronary artery disease in men. J Androl 11: 460–470. [crossref]
  5. Phillips GB, Yano K, Stemmermann GN (1988) Serum sex hormone levels and myocardial infarction in the Honolulu Heart Program. Pitfalls in prospective studies on sex hormones. J Clin Epidemiol 41: 1151–1156.
  6. Ohlsson C, Barrett-Connor E, Bhasin S (2011) High serum testosterone is associated with reduced risk of cardiovascular events in elderly men. The MrOS (Osteoporotic Fractures in Men) study in Sweden. J Am Coll Cardiol 58: 1674–1681.
  7. Malkin CJ, Pugh PJ, Morris PD, Asif S, Jones TH, et al. (2010) Low serum testosterone and increased mortality in men with coronary heart disease. Heart 96: 1821–1825.
  8. Wehr E, Pilz S, Boehm BO, März W, Grammer T, Obermayer-Pietsch B (2011) Low free testosterone is associated with heart failure mortality in older men referred for coronary angiography. Eur J Heart Fail 13: 482–488.
  9. Hyde Z, Norman PE, Flicker L, Hankey GJ, Almeida OP, et al. (2012) Low free testosterone predicts mortality from cardiovascular disease but not other causes: the Health in Men Study. J Clin Endocrinol Metab 97: 179–189. [crossref]
  10. Johnson RJ, Segal MS, Sautin Y, Nakagawa T, Feig DI, et al. (2007) Potential role of sugar (fructose) in the epidemic of hypertension, obesity and the metabolic syndrome, diabetes, kidney disease, and cardiovascular disease. Am J Clin Nutr 86: 899–906. [crossref]
  11. Oda M, Satta Y, Takenaka O (2002) Loss of urate oxidase activity in hominoids and its evolutionary implications. Mol Biol Evol 19, 640–653.
  12. Alderman MH, Cohen H, Madhavan S (1999) Serum uric acid and cardiovascular events in successfully treated hypertensive patients. Hypertension 34: 144–150.
  13. Fang J, Alderman MH (2000) Serum uric acid and cardiovascular mortality the NHANES I epidemiologic follow-up study, 1971–1992. National Health and Nutrition Examination Survey. JAMA 283: 2404–2410.
  14. Høieggen A, Alderman MH, Kjeldsen SE, Julius S, Devereux RB, et al. (2004) The impact of serum uric acid on cardiovascular outcomes in the LIFE study. Kidney Int 65: 1041–1049. [crossref]
  15. Wannamethee SG, Shaper AG, Whincup PH (1997) Serum urate and the risk of major coronary heart disease events. Heart 78: 147–153. [crossref]
  16. Culleton BF, Larson MG, Kannel WB, Levy D (1999) Serum uric acid and risk for cardiovascular disease and death: the Framingham Heart Study. Ann Intern Med 131: 7–13. [crossref]
  17. Wheeler JG, Juzwishin KD, Eiriksdottir G (2005) Serum uric acid and coronary heart disease in 9,458 incident cases and 155,084 controls: prospective study and meta-analysis. PLoS Med 2:76.
  18. Kim SY, Guevara JP, Kim KM, Choi HK, Heitjan DF, et al. (2010) Hyperuricemia and coronary heart disease: a systematic review and meta-analysis. Arthritis Care Res (Hoboken) 62: 170–180. [crossref]
  19. Ranjith N, Myeni NN, Sartorius B, Mayise C (2016) Association Between Hyperuricemia and Major Adverse Cardiac Events in Patients with Acute Myocardial Infarction. Metabolic syndrome and related disorders 15: 1–8.
  20. Tomiyama H, Higashi Y, Takase B, Node K, Sata M, Inoue T, et al. (2011) Relationships Among Hyperuricemia, Metabolic Syndrome, and Endothelial Function. American Journal of Hypertension 24: 770–774.
  21. Tapia E, Cristóbal M, García-Arroyo FE, Soto V, Monroy-Sánchez F, et al. (2013) Synergistic effect of uricase blockade plus physiological amounts of fructose-glucose on glomerular hypertension and oxidative stress in rats. Am J Physiol Renal Physiol 304: 727–736. [crossref]
  22. Cossio MA, Gómez R, Arruda M, Hochmuller R ( 2010) Valores de confiabilidad de indicadores somáticos en ratas machos wistar. Actualizacion en Nutricion 11: 296–302.
  23. McLaughlin T, Abbasi F, Cheal K, Chu J, Lamendola C, et al. (2003) Use of Metabolic Markers To Identify Overweight Individuals Who Are Insulin Resistant. Ann Intern Med 139: 802–809.
  24. Satoh H, Delbridge LM, Blatter LA, Bers DM (1996) Surface volume relationship in cardiac myocytes studied with confocal microscopy and membrane capacitance measurements: species-dependence and developmental effects. Biophys J 70: 1494–1504.
  25. Tian TT, Li H, Chen SJ, Wang Q, Tian QW, Zhang BB, et al. (2018) Serum uric acid as an independent risk factor for the presence and severity of early onset coronay artery disease: A case control study. Disease Markers Volume, Article ID 1236837, 8 pages.
  26. Lan M, Liu B, He Q (2018) Evaluation of the association between hiperuricemia and coronary artery disease. A strobe- compliant articule. Medicine 97: 44–50.
  27. Yang X, Gu J, Lv H, Li H, Cheng Y, et al. (2019) Uric acid induced inflammatory responses in endothelial cells via up-regulating (pro) rennin receptor. Biomedicine & Pharmacotherapy 109: 1163–1170.
  28. Kanbay M, Segal M, Afsar B, Kang DH, Rodriguez-Iturbe B, et al. (2013)The role of uric acid in the pathogenesis of human cardiovascular disease. Heart 99: 759–766.
  29. Saygin M, Asci H, Cankara FN, Bayram D, Yesilot S, et al. (2016) The impact of high fructose on cardiovascular system: Role of α-lipoic acid. Hum Exp Toxicol 35: 194–204. [crossref]
  30. Liu Z, Chen T, Niu H, Ren W, Li X, et al. (2016) The Establishment and characteristics of rat model of aterosclerosis induced by hiperuricemia. Stem Cells International  Article ID 1365257, 7 pages.
  31. Kelly DM, Jones TH (2013) Testosterone: a vascular hormone in health and disease. J Endocrinol 217: 47–71. [crossref]
  32. Chistiakov DA, Myasoedova VA, Melnichenko AA, Grechko AV, Orekhov AN, et al. (2018) Role of androgens in cardiovascular pathology. Vasc Health Risk Manag 14: 283–290. [crossref]
  33. Chen Ch,  Hsu YJ, Lee TM (2011) Impact of elevated uric acid on ventricular remodeling in infacted rats with experimental hiperuricemia. Am J Physiol Heart Circ Physiol 301: 107–117.
  34. Mellor KM, Bel JR, Young MJ, Ritchie RH, Delbrigde L (2011) Myocardial autophagy activation and suppressed survival signaling is associated with insulin resistance in fructose fed mice. Journal of Molecular and Cellular Cardiology 50: 1035–1043.
  35. Testes RC, Carneiros FS, Carvalho MHC, Reckelhoff JF (2016) Reactive oxygen species: Players in the cardiovascular effects of testosterone. Am J Physiol Regul Integr Comp Physiol 310: 1–14.
  36. Cornier MA, Dabelea D, Hernandez TL, Lindstrom RC, Steig AJ, et al. (2008) The metabolic syndrome. Endocr Rev 29: 777–822. [crossref]
  37. Haffner SM, Mykkänen L, Valdez RA, Katz MS (1993) Relationship of sex hormones to lipids and lipoproteins in nondiabetic men. J Clin Endocrinol Metab 77: 1610–1615. [crossref]
  38. Mäkinen JI, Perheentupa A, Irjala K, Pöllänen P, Mäkinen J, et al. (2008) Endogenous testosterone and serum lipids in middle-aged men. Atherosclerosis 197: 688–693. [crossref]
  39. Khaw KT, Barrett-Connor E  (1991) Endogenous sex hormones, high density lipoprotein cholesterol, and other lipoprotein fractions in men. Arterioscler. Thromb 11: 489–494.
  40. Hosoyamada M, Takiue Y, Shibasaki T, Saito H ( 2010) The effect of testosterone upon the uratere absorptive transport system in mouse kidney. Nuclesides, Nucletides and Nucleic Acids 29: 574–579.
  41. Vermeulen A, Goemaere S, Kaufman JM (1999) Testosterone, body composition and aging. J Endocrinol Invest 22: 110–116. [crossref]
  42. Tsai  EC, Boyko EJ, Leonetti DL, Fujimoto WY(2000) Low serum testosterone level as a predictor of increased visceral fat in Japanese-American men. International Journal of Obesity and Related Metabolic Disorders 24: 485–491.
  43. Corona G, Giagulli VA, Maseroli E, Vignozzi L, Aversa A, et al. (2016) Testosterone supplementation and body composition: results from a meta-analysis of observational studies. J Endocrinol Invest 39: 967–981.
  44. Bjorntorp P (1996) The regulation of adipose tissue distribution in humans. International Journal of Obesity and Related Metabolic Disorders 20, 291–302.
  45. Mårin P, Odén B, Björntorp P (1995) Assimilation and mobilization of triglycerides in subcutaneous abdominal and femoral adipose tissue in vivo in men: effects of androgens. J Clin Endocrinol Metab 80: 239–243. [crossref]
  46. Cohen PG (1999) The hypogonadal-obesity cycle: role of aromatase in modulating the testosterone-estradiol shunt–a major factor in the genesis of morbid obesity. Med Hypotheses 52: 49–51. [crossref]
  47. Johnson RJ, Perez-Pozo SE, Sautin YY (2009) “Hypothesis: could excessive fructose intake and uric acid cause type 2 diabetes?” Endocrine Reviews 30: 96–116.
  48. Thorburn AW, Storlien LH, Jenkins AB, Khouri S, Kraegen EW (1989) Fructose-induced in vivo insulin resistance and elevated plasma triglyceride levels in rats. Am J Clin Nutr 49: 1155–1163.
  49. Catena C, Giacchetti G, Novello M, Colussi G, Cavarape A et al. (2003) Cellular mechanisms of insulin resistance in rats with fructose-induced hypertension. Am J Hypertens 16: 973–978.
  50. Panchal SK, Brown L (2011) RodentModels forMetabolic Syndrome Research. Journal of Biomedicine and Biotechnology Volume 2011, Article ID 351982, 14 pages.
  51. Kuwabara M (2015) Hyperuricemia, Cardiovascular Disease, and Hypertension. Pulse 3: 242–252.
  52. Feldman HA, Longcope C, Derby CA, Johannes CB, Araujo AB, et al. (2002) Age Trends in the Level of Serum Testosterone and Other Hormones in Middle-Aged Men: Longitudinal Results from the Massachusetts Male Aging Study. J Clin Endocrinol Metab 87: 589–598.

Awareness of HPV Infection and Vaccination among Teens in Urban High School

DOI: 10.31038/AWHC.2019225

Abstract

To assess the level of awareness and knowledge of HPV infection and vaccination among 648 Teens from secondary schools and colleges in four metro cities of Port Harcourt Nigeria.

Materials and methods: This cross-sectional study was conducted by from 1st March to 31st August, 2018. Girls of 13–19 years, with an average of 16 years are targeted. A written questionnaire with two parts has been applied. A preliminary written questionnaire included questions of HPV infection and vaccination awareness.

Results: The study participants are poorly aware about HPV infection and vaccination but are intensely willing to know about it. 98% (n-632) are not aware of HPV infection, while, 98% (n–636) is not aware of the vaccination.

Conclusion: This study brings out the unawareness about HPV infection and vaccination in urban adolescent in four metro cities in Port Harcourt Nigeria. Adolescent understanding and being aware of the HPV virus is needed to have successful vaccination programs in Nigeria.

Keywords

Adolescents and HPV, Cancer cervix, HPV Awareness, HPV Vaccination

Background

Human Papillomavirus (HPV) is a common virus reported to be responsible to some type of cancers. HPV infection is the major risk factor for cervical cancer [1]. The prevalence rate of more than 85% global cervical cancer occurs in developing countries. This health burden is a public health issue that could be prevented by early vaccination of adolescents against HPV. A prophylactic vaccination against the HPV has the ability to reduce HPV infection and cervical cancer occurrence, thereby saving HPV many lives [2]. HPV vaccine approved by FDA has been in circulation since the year 2006 [3]. Notwithstanding, HPV vaccine implementation is still facing challenges in acceptance and lack of awareness despite its futuristic benefits. Awareness has been found to be low in some population and high in another [4, 5], but studies are yet to investigate the awareness of teens in Nigeria, If one exist, it does not measure the awareness of both the HPV infection and HPV vaccination of teenagers in high school. To enable practical programmed of HPV vaccination in the future, it will be required to assess the awareness and knowledge regarding HPV and vaccination among the teens population. If awareness could influence the acceptability of the uptake of the vaccination, it may then be wise to target public awareness as commonly done [6]. More research focus should be targeted on adolescent population as they constitute the interest group. This study therefor, explores the teens urban dwellers’ awareness and knowledge about HPV infection and it vaccination.

Methods

Design

A longitudinal cohort study design with a cross sectional quantitative analysis. The study assessed baseline awareness and knowledge of HPV infection and HPV vaccination among teens in a four selected High School in Port Harcourt, Nigeria. The study was conducted from 1st March to 31st August, 2018.

Study population and Recruitment

For the teens studied, the eligibility criteria included ages 13 – 19 years in High School. The method of selection and sampling units (high school) was through random. Four urban High Schools were purposively selected. Six hundred and forty eight (648) Teens were then randomly selected from the four high schools.

Data Collection

Each respondent completed a consent form and a questionnaire. Participation was voluntary and anonymous. Selected Teens were assembled in a room on the day of the survey. Each respondent filled the questionnaire under close supervision and the purpose and procedure of the survey explained. Data was collected, starting from the first school to the 4th school. The research questionnaire consisted of two parts; social demographic profile, and awareness questions form the second part. The demographic data included information regarding sexual activity. This was done in other to predict the sexual behavior risk factor to HPV infection.

Result and Statistical Analysis

In this study, simple descriptive statistics were used. The study question items were organized into categories: demographic 5 items, awareness based 8 items which include awareness of HPV infection and awareness of HPV vaccination. Questions were answered in “Yes” or ‘NO’ items. Those with answers “Yes” = 1 point and “No” = 0 point. All scores were summed up to calculate the overall awareness scores for HPV infection and HPV vaccination.

The study considered 648 Teens between the ages of 13 to 19 years, with 16 years as mean age. The rationale for the sample size and sampling is to see if there are any significant gaps between the level of awareness on HPV infection and HPV vaccination and between the girls and boys participants (Table 1). Of the study population (n-648) Teens, 41% (n- 264) were boys and 59% (n- 384) were girls. The preliminary questionnaire assessed the awareness. Awareness was low. Only 2% (n – 16) were aware of HPV infection, and 98% (n = 632) were not. Also 2% (n – 12) knew about HPV vaccination and 98% (n – 636) did not know. Out of 12 and 16 participants that had heard about HPV infection and HPV vaccination respectively, 1% (n-3) were boys and 3% (n –13) were girls. Majority of both boys and girls were not aware. Few of the participants that were aware heard about HPV from their parents and friends (Table 2).

Table 1. The demographic data of the study population.

Variable

Classification

Frequency

Percentage

Age

9 – 14

15 – 19

432

216

67%

33%

Sex

Boys

Girls

264

384

41%

59%

Have had sex

Yes

No

182

466

28%

72%

Age at first sex

13 years

14 years

15 years

16 years and above

7

22

48

105

4%

12%

26%

58%

Table 2. Awareness on HPV Infection and HPV Vaccination and between boys and girl.

Awareness

Classification

Frequency

Percentage

HPV Infection

No Awareness

Yes Awareness

632

16

98%

2%

HPV   Vaccination

No   Awareness

Yes  Awareness

636

12

98%

2%

 Boys

Yes  Awareness

No   Awareness

3

261

1%

99%

Girls

Yes  Awareness

No   Awareness

13

381

3%

97%

Discussion

The study found result not consistent with some previous studies on high school students’ knowledge and awareness of HPV infection and vaccination [7, 8]. It was anticipated that there would be unawareness across participants as there is no knowledge programmes in schools and colleges regarding HPV and its vaccination. Nigeria adolescences seem to be disadvantaged group both economically and by their lack of knowledge and health awareness like many other African countries. However the findings of this study may have limited generalizability to Nigerians with cultural diversity, different religions, and socioeconomic status that are distinctively different from western societies. Adequate knowledge and awareness of the clinical health importance of HPV infection and vaccination usually provide positive influence.

In addition, when comparing the social and demographic characteristics among the respondents from four schools based on their gender, the differences were rather small, majority of participants had little knowledge and awareness on HPV infection or HPV vaccination across the four schools in the study. Researchers from west found out that adolescents who have high knowledge levels about HPV and cervical cancer, their acceptance of vaccine is also high [9]. Ninety nine percent girls and 97% boys have not heard of HPV virus and but were willing to know more about the infection. The new option of HPV vaccine as a primary prevention in adolescents is a unique opportunity of this era which promises a significant reduction of cervical cancer in the coming decades [10]. More efforts are needed to provide adolescence with information which will help them to be excluded from among those thousands of women who die from this preventable condition.

Conclusion

 This study brings out the unawareness about HPV infection and vaccination in urban Teens in 4 High schools in Port Harcourt city, Nigeria. The study participants are poorly aware about HPV infection and vaccination but are intensely willing to know about them. In conclusion, findings of this study suggest that HPV infection and vaccination are not likely to encourage adolescent sexual activity. In addition, efforts should be made to increase knowledge-based programs in schools and colleges.

Acknowledgement

The authors gratefully acknowledged Dr. C. TobI-West, and Dr. EO. Oranu for their contributions. I also acknowledge all the high school students who participated.

Authors Contributions

FCD had primary responsibility for protocol development, data collection, analysis and writing of the paper. KND performed final data analysis, participated in the development of the protocol and analytical framework for the study and contributed to the writing of the study.

What this study Add

It raised alarm on the poor awareness on HPV infection and Vaccination. It also highlight that the relevant group for HPV vaccination are willing to receive the vaccine.

References

  1. Cohen J (2005) Public health. High hopes and dilemmas for a cervical cancer vaccine. Science 308: 618–621. [crossref]
  2. Smith JS, Lindsay L, Hoots B (2007) Human papillomavirus type distribution in invasive cervical cancer and high-grade cervical lesions: a meta-analysis update. Int J Cancer 121: 621–632
  3. Walsh CD, Gera A, Shah M (2008) Public knowledge and attitudes towards human papilloma virus (HPV) vaccination. BMC Public Health 8: 368.
  4. Fu LY, Bonhomme LA, Cooper SC, Joseph JG, Zimet GD (2014) Educational interventions to increase HPV vaccination acceptance: a systematic review. Vaccine 32: 1901–1920
  5. Small SL, Sampselle CM, Martyn KK (2013) Dempsey AF. Modifiable influences on female HPV vaccine uptake at the clinic encounter level: a literature review. J Am Assoc Nurs Pract [published online ahead of print August 22, 2013].
  6. Blasi PR, King D, Henrikson NB (2015) HPV Vaccine Public Awareness Campaigns: An Environmental Scan. Health Promot Pract 16: 897–905. [crossref]
  7. Jill B, Melissa KF, Michael JW Jr (2012) Adolescent understanding and acceptance of the HPV vaccination in an underserved population in New York City. J Oncol 2012, Article ID 904034.
  8. Ericka C (2001) Lambert-college students’ knowledge of human papillomavirus and effectiveness of a brief educational intervention. J Am Board Fam Pract 14: 178–183.
  9. Marlow LA, Waller J, Wardle J (2007) Public awareness that HPV is a risk factor for cervical cancer. Br J Cancer 97: 691–694. [crossref]
  10. Brabin L, Roberts SA, Henry CK (2007) A semi-qualitative study of attitudes to vaccinating adolescents against HPV without parental consent-BMC Public health 2007. http://www.biomedcentral.com/1471–2458/7/20.

Psychopedagogic intervention according to Piagetian Theory in three girls with Turner Syndrome: performance improvement revealed by Bender Test

DOI: 10.31038/AWHC.2019224

Abstract

Turner syndrome (TS) carriers seem to present cognitive compensation of profile of reduction in visuospatial skills during development. Thus, a psychopedagogical intervention was performed in order to optimize this mechanism.

Three pairs of age matched 45, X girls were evaluated at two moments (pre and posttest) for the Bender test (BT) and specific Piaget’s tasks or scales (PS). The experimental intervention through the environmental solicitation process was applied for one year to each pair girl with learning disabilities.

Experimental subjects (ES) revealed more ability to planning and organizing their graphic expression in the posttest, as well as presented a decrease in number of brain lesion indicators on their BT performance. ES also showed performance improvement in half of PS (e.g. conservation and measurement of volumes task).

Data suggest that the present intervention instruments may have contributed to the performance increment of the experimental TS girls.

Keywords

Turner syndrome cognition; cognitive compensation; psychopedagogic intervention; Piaget’s tasks or scales; Bender-Gestalt test.

Introduction

Turner syndrome is consequent to total or partial absence of one X-chromosome. Specific profile of reduction in visuospatial skills besides other cognitive or neuropsychological (arithmetic and executive function) and neurophysiological characteristics among subjects with Turner syndrome (TS) has been widely described [1–8]. TS girls seem to have cognitive compensation of that visual deficit throughout their growing-up [7, 9]. With the hypothesis of a gradual increasing to this mechanism, a Piagetian psychopedagogic intervention was planned in order to optimize the heteromodal connections of brain areas, associated to the development of neuropsychological compensation.

Piagetian scales and experimental intervention through the environmental solicitation process [10] “make use of the clinical method [11], which guarantees an affective-emotional optimization in order to promote the best child intellectual performance and to more accurately evaluate their individual cognitive potential”[7].

In addition, clinical method seems to be particularly appropriate for a evaluation or/and intervention with Turner syndrome carriers as far as their verbal performance is within (or above) most population average [12–15], since this method facilitates the establishment of relations and the argumentation in favor of the subject’s own ideas [11, 16]. ZAIA, [17] still expounds that “the critical clinical method is to follow the unfolding of the child’s thinking, adapting questions to the actions and speeches of the child, enabling the free and personal expression of the child’s ideas. This process is still characterized by the adult’s effort to use the child’s language, not to suggest anything, not to give clues to the answers and to understand the child’s point of view without deforming it.”

Materials and Methods

This investigation was approved by the Ethics Committee of Federal University of São Paulo- Paulista School of Medicine (UNIFESP-EPM), protocol number 1040/08. Only patients whose legal guardians signed an informed consent were included in this study.

Three pairs of age matched 45, X girls were evaluated at two moments (evaluation and revaluation; or pretest and posttest) for the Bender test (BT) and specific Piaget’s tasks or Piagetian scales (the latter apparently have been applied to TS carriers only twice before [4, 7]).

In between, the experimental intervention through the environmental solicitation process (developed by Mantovani de Assis [10], according to Piaget’s theory; and adapted to psychopedagogic intervention by Zaia [18]) was applied to experimental subjects in order to propitiate thinking development. The experimental intervention, lasting one year, was performed to each pair girl that presented learning disabilities.

The BT was administered according to Clawson [19] (Figure 1). The examiner registered each subject’s visual motor performance, which was further analyzed with Koppitz method [20] by psychologists specialized in BT.

AWHC 2019-110 - Fatima Ricardi Brazil_F1

Figure 1. Stimulus-models from Bender visual motor gestalt test used on the present investigation according to Clawson (1980).

Piagetian scales (PS) consisted of the construction of reflective abstraction (Correlate Formation (FC); and Relationships between Surfaces and Perimeters of Rectangles (SP) [21]); representation space (projective straight line construction (PSL); and viewpoints or perspectives coordination (“three mountains”; 3M) [22, 23]; and conservation of physical quantities (Conservation and Measurement of Volumes; CMV [24]) tasks. In addition, the Discover the Animal Game (DA) [25] was employed to evaluate logical structures and concept construction.

Intervention process comprised a series of appropriate psychopedagogic instruments, selected in order to develop those aspects which presented development delay during evaluation through Piagetian tasks: Discover the Animal Game (classification) [25], Memory Game (memory) [26], activity of making rolls into several formats using the same amount of modeling clay, for the construction of conservation of continuous quantities [27] and wooden building blocks (Playing Engineer [28]) for the conservation of discrete quantities. For the construction of spatial relations, Headsnake [29] and Magic Bag [29] games were picked out as well as activities like puzzles [30], figures assembly [31], free drawing and geometrical figures fitting. Causal relationships establishment was stimulated by the Semblance [29], Total Balance [29] and Pick-up-Sticks [32] games besides the fluctuation of body’s activity [27]. Furthermore, narrative construction [33] and activities with numbers (Semblance game [29], e.g.) were applied to facilitate the construction of school skills. Finally, in order to provide own body knowledge and mastery, the following activities were proposed: body scheme, making the child’s body outline with wax pencil followed by requesting her to represent different body parts of her own; songs with gestures (e.g.: “Hokey- Pokey”); clay doll followed by its drawing. Table 1 presents the games and activities used in the intervention for each experimental subject beyond the total number of intervention sessions per subject.

Table 1. Games and activities employed during psychopedagogical intervention (environmental solicitation) applied to each experimental subject (ES) and their respective purposes; and total number of sessions per subjects.

Games and activities to propitiate

Subjects

Logical relationships development

ES1

ES2

ES3

Classification: Discover the animal Game

X

X

X

Continuous quantities conservation: making rolls

X

X

X

Memory: Memory Game

X

X

X

Real construction

Space:

Headsnake Game

X

Puzzles

X

X

X

Magic Bag Game

X

X

X

Free drawing

X

X

X

Playing Engineer (wooden building blocks)

X

X

X

Figures assembly

X

X

X

Geometrical figures fitting

X

Causality:

Sambalance Game

X

X

X

Activities with objects that float or sink

X

X

Total Balance Game

X

X

X

Pick-up sticks Game

X

X

Oral and written language construction

Narrative construction

X

X

X

Dictation

X

Number recognition (and arithmetic operations)

Sambalance game

X

X

X

Calculation (regarding the pick up sticks game play)

X

Psychomotor activities: body image construction, rhythm and movement control

Body outline made with wax pencil complemented with different body parts representation

X

X

“Hokey Pokey” (music with gestures)

X

Modeling-clay (e.g.: clay doll)

X

X

X

Doll drawing

X

Songs

X

X

X

TOTAL NUMBER OF INTERVENTION SESSIONS

36

36

27

It is noteworthy that both the application of Piagetian tasks and the process of psychopedagogic intervention used the critical Piagetian clinical method [11, 16–17], which fundamental aspects were previously reported in this paper.

Results

Bender test

Data referring to performance by experimental and control subjects on Bender test (Table 2; Figures 2 to 7) exhibit that from seven years old on impulsivity diminished. On the other hand, time required to perform BT increased with age (Table 2). Furthermore, both experimental TS girls younger than ten during posttest (ES1 and ES2) improved the use and planning of spaces of gestalts.

AWHC 2019-110 - Fatima Ricardi Brazil_F2

Figure 2. Evaluation of ES2, at five yr and 2nd examination at six yr.

AWHC 2019-110 - Fatima Ricardi Brazil_F3

Figure 3. Evaluation of CS2, at five yr and 2nd examination at six yr.

AWHC 2019-110 - Fatima Ricardi Brazil_F4

Figure 4. Evaluation of ES1, at six yr, and 2nd evaluation at eight yr.

AWHC 2019-110 - Fatima Ricardi Brazil_F5

Figure 5. Evaluation of CS2, at seven yr, and 2nd evaluation at eight yr.

AWHC 2019-110 - Fatima Ricardi Brazil_F6

Figure 6. Evaluation of ES3, at nine yr. and 2nd evaluation at 10 yr.

AWHC 2019-110 - Fatima Ricardi Brazil_F7

Figure 7. Evaluation of CS3, at nine yr, and new assessment at 10 yr.

Legend
1- Age; 2-Time; 3-Form distortion; 4-Rotation: 5-Integration; 6-Perseveration: 7-Score

Table 2. Performances of experimental (ES) and control (CS) subjects on Bender test and respective ages (A) and significative (+) or not significative (-) number of brain lesion (BL) indicators.

Subjects

A (y;m)

Step

Time

F

R

I

Pe

Score

Visual motor perception level

BL

BL#

BL##

BL (meaning)

BL (difference) (R-E)

ES1

(06;10)

Evaluation

11’

7

7

5

0

19

Below 5 years

21

+

+

anxiety and space disorganization

-6

(07;11)

Revaluation

18’

4

5

5

2

16

Below 5 years

15

+

+

improved in space planning and decreased in impulsivity

CS1

(07;01)

Evaluation

12’

4

6

4

3

17

Below 5 years

17

+

+

CS1 erased during performance and exhibited disorganization and lack of space planning

-4

(08;02)

Revaluation

11’

5

5

3

0

13

5 years and 5 years and 5 months

13

+

+

disorganization and lack of space planning

ES2

(05;00)

Evaluation

05’

6

8

6

1

21

Below 5 years

13

+

+

impulsivity and space disorganization

-5

(06;02)- (06;03)

Revaluation

06’

5

4

6

0

15

Below 5 years

08

+

ES2 retouches copies during performance and shows impulsivity and disorganization

CS2

(05;03)

Evaluation

05’

7

8

7

3

25

Below 5 years

25

+

+

CS2 retouches a lot during performance besides exhibiting space disorganization

-5

(06;02)

Revaluation

05’

6

5

5

2

18

Below 5 years

20

+

+

CS2 showed improvement in perception although space kept disorganized

ES3

(09;00)

Evaluation

03’

6

8

5

0

19

Below 5 years

20

+

+

impulsivity and lack of space planning

-16

(10;04)

Revaluation

06’

5

4

2

0

11

5½ and 5 years and 11 months

04

Anxiety. Nevertheless, ES3 exhibited an outstanding improvement in space planning

CS3

(09;02)

Evaluation

07’

2

4

2

0

08

6 and 6 years and 5 months

05

CS3 retouches during performance

2

(10;05)

Revaluation

13’

3

2

2

0

07

6½ and 6 years e 11 months

07

CS3 erased a lot and retouched copies. Also still showed good usage of space. However, exhibited anxiety to improve gestalt

Age = (years; months); F = form distortion; R = rotation; I = integration; Pe = perseveration; #UnG (Guarulhos University) standard: n = 8; ##APEP (Psychology and Psychotherapy Studies Association) standard: n = 10; E = evaluation; R = revaluation.

Table 2 also shows that most (5/6) of all subjects presented decrease in number of brain lesion indicators from evaluation to revaluation. It is noteworthy that such difference was greater for two experimental subjects (ES1 and ES3).

On the contrary, ES2 did not present a BL decrease greater than her respective control (CS2). Although ES2 and CS2 showed the same BL decrease, the former diminishment was from a significative to a non significative value, according to one of the two considered standards (Table 2).

Moreover, nearly all propositii (5/6) showed improvement on all scores of their performances on Bender test (evaluation and revaluation compared; table 2), either experimental (3/3) or control (2/3) ones.

Piagetian tasks or Piagetian Scales

Data referring to performance by experimental and control subjects on conservation and measurement of volumes and other Piagetian tasks during evaluation and revaluation are given in Table 3.

Table 3. Performances of experimental (ES) and control (CS) subjects classified by Piagetian Scales (PS) and respective ages (A) and final diagnoses (FD)

AWHC 2019-110 - Fatima Ricardi Brazil_F9

PS tasks: CMV = conservation and measurement of volumes; 3M = viewpoints or perspectives coordination (“three mountains”); CF = correlate formation; SP = relationships between surfaces and perimeters of rectangles; PSL = projective straight line construction. Game: DA = discover the animal. For abbreviations of diagnosis, see legend to Table 4.

Table 4 exhibits the reference values for the final operatory diagnosis corresponding to the sum of points of individual performance on each Piagetian task.

Table 4. Reference values for the final operatory diagnosis corresponding to the sum of points of individual performance on each Piagetian task.

Total points

Final diagnosis

6,0

PO1

6,5 – 11,5

tPO1/2

12

PO2

12,5 – 17,5

tPO/CO

18,0

CO1

18,5 – 22,5

tCO1/2

23

CO2

23,5 – 24,5

tCO/FO

25 – 30

FO1

PO = pre-operatory period; PO1 = the beginning stage of the pre-operatory period; tPO1/2 = transition between Pre-Operatory Stage 1 and the Pre-Operatory Equilibrium Level; PO2 = Pre-Operatory Equilibrium Level; tPO/CO = transition between pre-operatory and concrete operatory periods; CO = concrete operatory period; CO1 = the beginning stage of the concrete operatory period; tCO1/2 = transition between the beginning stage and the stage in equilibrium of the concrete operatory period; CO2 = concrete operatory equilibrium level; tCO/FO = transition between the concrete operatory and the formal operatory periods; FO1 = the beginning stage of the formal period; FO = formal operatory period.

In addition, Figure 8 presents the comparison between experimental (ES) and control (CS) subjects performances classified by Piagetian scales (PS) during evaluation and revaluation. Table 3 and Figure 8 analyses enable to compare the progress achieved by the experimental and control subjects in the different Piagetian tasks.

AWHC 2019-110 - Fatima Ricardi Brazil_F8

Figure 8. Comparison between experimental (ES) and control (CS) subjects performances classified by Piagetian scales (PS) during evaluation and revaluation. PS tasks: CMV = conservation and measurement of volumes; 3M = viewpoints or perspectives coordination (“three mountains”); CF = correlate formation; SP = relationships between surfaces and perimeters of rectangles; PSL = projective straight line construction. Game: DA = discover the animal.

The great majority (5/6) achieved progress in Conservation and Measurement of Volumes task (CMV). In groups comparison, all experimental (three) and most (2/3) control subjects presented better performance in CMV during posttest than in the pretest (Table 3)

Thus, in CMV task and among controls, one subject (CS3) did not achieve progress, whereas the other two presented one (CS1) and two (CS2) levels of progress. In addition, among experimental subjects, two (ES2 and ES3) achieved one level while ES1 achieved two levels of progress (Figure 8). However, in Discover the Animal game 4/6 of the subjects presented progress on their performances, that means every control and one experimental subject (ES2; Figure 8).

Data referring to performance by control and experimental subjects in representation space tasks revealed that two of each group (4/6) achieved progress in the “Three Mountains” (CS2 and CS3; ES2 and ES3) and in the Projective Straight Line (CS2 and CS3; ES1 and ES3; Figure 8) tasks. Also considering the progress amplitude, only ES2 presented two levels whereas the other experimental and both control subjects showed one level of progress in 3M, in pretest and posttest comparison.

Concerning reflective abstraction, half of the subjects (3/6) achieved progress on their performance in Correlate Formation task that means two controls (CS1 and CS2) and one from the experimental group (ES3). The progress amplitude corroborates this observation, as far as one of the controls (CS2) presented three levels while CS1 and the experimental subject showed only one level of progress (Figure 8).

Nevertheless, still considering abstraction, despite only one subject of each group (CS1 and ES3) have achieved progress on their performances in the Relationships between Surfaces and Perimeters of Rectangles task, the control showed one level whereas the experimental subject, two levels of progress.

Discussion

It is noteworthy that Turner syndrome has a cognitive impact besides a physical one [8, 34–36]. Thus TS girls and teenagers should be provided a demanding formal assessment, orientation and/or intervention [7, 8, 34, 37].

In the present investigation, there was a difference on BT performance in favor of the experimental subjects (ES), who presented more ability to planning and organizing their graphic expression.

Increase in time required to perform BT with age was probably due to older subjects effort in order to more carefully accomplish gestalts.

Furthermore, improvement in use and planning of spaces of gestalts of both experimental TS girls younger than ten during posttest (ES1 and ES2) suggests those subjects took more advantage of intervention procedures than the eldest one (ES3). Also, it is likely that neurological functions in development have been benefited by intervention process stimuli. This assumption is based on number of brain lesion indicators (BL) decrease revealed by BT.

Unlike both other experimental subjects, ES2 did not present a BL decrease greater than her respective control (CS2) inasmuch as the observed hindrance to cooperate in the beginning of the intervention process, specifically refusing several times to accomplish or to repeat the suggested activity. The latter behavior could be due to pre-operativeness characteristics ES2 presented at that time.

Improvement of nearly all propositii on all scores of their performances on Bender test may be assumed mostly to their natural development, in controls case. On the other hand, it is reasonable to consider the benefit of intervention that favours the subject in order to explain the considerable decrease ES3 presented for brain lesion indicators on her BT performance.

However, a new investigation with a greater number of subjects and its replication by other researchers would be necessary to corroborate such supposition.

The present data may reinforce how important psychopedagogic intervention process can be to Turner syndrome carriers. In addition, the earlier such intervention occurs the more convenient it will be, as well as should the family be advised with this purpose.

Besides, on three Piagetian tasks (CMV, 3M and SP) a greater progress was observed in most experimental subjects.

This mentioned difference, if explained by the influence of psychopedagogic intervention, shows how the instruments employed along the latter might influence conservation construction on TS girls.

This may be confirmed by the amplitude (namely the relationship between the beginning performance level at the pretest and that achieved at the posttest) of progresses achieved by experimental and control subjects performances analysis.

This relationship suggests the intervention process might have influenced on the conservation construction.

Moreover, on projective straight line task subjects performances were similar in both groups.

On the other hand, controls achieved higher progress in CF and in Discover the Animal game as in number of subjects as in the amplitude of progresses.

Therefore, this led us to consider that concept construction and classification were not influenced by psychopedagogic intervention instruments. This finding may be confirmed by the progresses amplitude as far as the only experimental subjects and all the controls achieved one level of progress each.

So, considering the number of subjects which achieved progresses in the space construction, we do not find there was influence from the intervention process, as far as it was the same in both experimental and control groups. However, if we also consider the progress amplitude, only ES2 presented two levels whereas the other experimental and both control subjects showed one level of progress in 3M, in pretest and posttest comparison. In conclusion, we suppose there was a slight influence of psychpedagogic intervention, in this case. Finally, it is noteworthy that a more detailed analysis of intervention through the environmental solicitation process and its influence on experimental subjects performances will be addressed in an upcoming publication.

Conclusion

According to Bender [38], the gestalt visual-motor functions basically may be associated with language aptitude, time and space organization, and to manual motor abilities. One concluded there was an improvement on the quality of gestalt functions, observed in the paper organization and drawings planning, and that psychopedagogical activities have probably influenced on the Bender test organization and planning, so presumably contributing to ameliorate cognitive performance of three girls with Turner syndrome. In conclusion, greater performances progresses observed among experimental subjects on Bender test, when compared to those presented by controls, suggest the psychopedagogic intervention accomplished during the present study may have contributed to optimize the cognitive compensation of the experimental subjects visual motor deficit.

Nevertheless, the environmental solicitation process should be applied to a greater number of TS girls and preferably for a longer period of time in order to confirm the conclusion above.

References

  1. Shaffer JW (1962) A specific cognitive deficit observed in gonadal aplasia (Turner’s syndrome). J Clin Psychol 18: 403–406. [crossref]
  2. Garron DC (1977) Intellegence among persons with Turner’s syndrome. Behav Genet 7: 105–127. [crossref]
  3. Money J (1968) Cognitive deficits in Turner’s syndrome. In: Vandenberg SG. (Ed.) Progress in human behavior genetics. J. Hopkins, Baltimore, USA.
  4. Ricardi FCF (1996) Cognição na síndrome de Turner: investigação de 28 sujeitos com o Teste de Bender e as Escalas de Piaget. Masters of Science thesis, São Paulo: USP.
  5. Ross J, Stefanatos GA, Kushner H, Zinn A, Bondy C, Roeltgen D (2002) Persistent cognitive deficits in adult women with Turner syndrome. Neurology 58: 218–225. [crossref]
  6. Ross J, Roeltgen D, Zinn A (2006) Cognition and the sex chromosomes: studies in Turner syndrome. Horm Res 65: 47–56. [crossref]
  7. Ricardi FCF, Zaia LL, Pellegrino-Rosa I, Rosa JT, Mantovani de Assis OZ, et al. (2010) Psychogenetics of Turner syndrome: an investigation of 28 subjects and respective controls using the Bender test and Piagetian scales. Genet Mol Res 9: 1701–1725. [crossref]
  8. Hong DS, Reiss AL (2012) Cognition and behavior in Turner syndrome: a brief review. Pediatr Endocrinol Rev 9: 710–712. [crossref]
  9. Ricardi FCF, Pellegrino-Rosa I, Rosa JT, Saldanha PH (2002) Síndrome de Ullrich-Turner: investigação de 21 sujeitos com o teste de Bender. Águas de Lindóia: Sociedade Brasileira de Genética (Ed.), Resumos do 48. Congresso Nacional de Genética, CD-ROM.
  10. Mantovani de Assis OZ (1976) A solicitação do meio e a construção das estruturas lógicas elementares na criança. Ph.D. thesis. Campinas: Unicamp.
  11. Vinh-Bang (1970) El método clinico y la investigación en psicologia del niño. In: Ajuriaguerra J et al. (Eds). Psicologia y epistemologia genéticas: temas piagetianos. Buenos Aires: Proteo.
  12. Shankar RK, Backeljauw PF2 (2018) Current best practice in the management of Turner syndrome. Ther Adv Endocrinol Metab 9: 33–40. [crossref]
  13. Temple CM, Shepard EE (2012) Exceptional lexical skills but executive language deficits in school starters and young adults with Turner syndrome: implications for X chromosome effects on brain function. Brain Lang 120: 345–359. [crossref]
  14. Hong D, Scaletta Kent J, Kesler S (2009) Cognitive profile of Turner syndrome. Dev Disabil Res Rev 15: 270–278. [crossref]
  15. Ross JL, Stefanatos GA, Kushner H, Zinn A, Bondy C, Roeltgen D (2002) Persistent cognitive deficits in adult women with Turner syndrome. Neurology 58: 218–225. [crossref]
  16. Piaget J (1975) Os problemas e os métodos. In: A Representação do Mundo na Criança. Rio de Janeiro: Brazil.
  17. Zaia LL (2015) O atendimento psicopedagógico pelo processo de solicitação do meio. Revista Educação 9: 117–127.
  18. Zaia LL (1996) A solicitação do meio e a construção das estruturas operatórias em crianças com dificuldades de aprendizagem. Ph.D. thesis, Campinas: Unicamp, Brazil.
  19. Clawson A (1980) Bender infantil: manual de diagnóstico clínico. Porto Alegre: ArtMed, Brazil.
  20. Koppitz EM (1966) The Bender gestalt test for young children. New York: Grune & Stratton, USA.
  21. Piaget J (1995) Abstração reflexionante: relações lógico-aritméticas e ordem das relações espaciais. Porto Alegre: ArtMed, Brazil.
  22. Piaget J, Inhelder B (1993) A representação do espaço na criança. Porto Alegre: Artmed, Brazil.
  23. Kobayashi MCM (1998) A construção das relações espaço-geométricas em crianças de educação infantil: um estudo de epistemologia genética. Masters of Science thesis. Marília: Unesp, Brazil.
  24. Piaget J, Aebli MH, Pitsou MF (1948) La conservation et la mesure des volumes. In: Piaget J, Inhelder B, Szeminska A. La géométrie spontanée de lénfant. Paris: Presses Universitaires de France, France: 448–483.
  25. Piaget J, Sakellaropoulo M, Henriques-Christophides A (1996) Em direção à circularidade dialética mais geral das conexões lógicas: a determinação de alguns animais ou objetos. In: Piaget J. As formas elementares da dialética. São Paulo: Casa do Psicólogo, Brazil.
  26. Jogo da Memória- Brinquedos (Memory Game- Toys) (24 peças em madeira). Xalingo brinquedos. Fabricado por: Xalingo S/A Indústria e Comércio. CNPJ: 95.425.534/0001-76. Santa Cruz do Sul, Brazil.
  27. Mantovani de Assis OZ, Assis MC (Orgs.) (2004) PROEPRE: prática pedagógica. Campinas: Graf. FE; LPG, 3.
  28. Brincando de Engenheiro (Playing Engineer) (42 peças). Xalingo brinquedos. Fabricado por: Xalingo S/A Indústria e Comércio. Santa Cruz do Sul, Brazil.
  29. Zaia LL (2008) A construção do Real na criança: a função dos jogos e das brincadeiras. Schème 1: 74–94.
  30. Quebra-cabeça: The Flintstones (30 peças em madeira- 22X18 cm). Start. Fabricado por: L. Moller. São Paulo, Brazil.
  31. Monta-figuras (Mounting Pictures): Turma da Mônica (24 peças em madeira). Xalingo brinquedos. Fabricado por: Xalingo S/A Indústria e Comércio, Santa Cruz do Sul, Brazil.
  32. Pega-Varetas (28 varetas). Fabricado por: Algazarra Ind. e Com. de Brinquedos Ltda. São Paulo, Brazil.
  33. Sauer MIM (2000) A construção da narrativa infantil e suas relações com a construção do espaço. Masters of Science thesis, Campinas: UNICAMP, Brazil: 73–107.
  34. Erhan H, Belotserkovsky J (2014) Neuropsychological impact of Turner syndrome: importance of parent education, early detection and intervention: a case study. Arch Clin Neuropsychol 29: 544–545.
  35. Saad K, Abdelrahman AA, Abdel-Raheem YF, Othman ER, Badry R, Othman HA, Sobhy KM (2014) Turner syndrome: review of clinical, neuropsychiatric and EEG status: an experience of tertiary center. Acta Neurol Belg 114: 1–9. [crossref]
  36. Kesler SR, Sheau K, Koovakkattu D, Reiss AL (2011) Changes in frontal-parietal activation and math skills performance following adaptive number sense training: preliminary results from a pilot study. Neuropsychol Rehabil 21: 433–454. [crossref]
  37. Mueller SC (2013) Magnetic resonance imaging in paediatric psychoneuro-endocrinology: a new frontier for understanding the impact of hormones on emotion and cognition. J Neuroendocrinol 25: 762–770. [crossref]
  38. Bender L (1938) A visual motor Gestalt test and its clinical use. New York: American Orthopsychiatric Association, Res. Monograph, USA: 103.