Abstract
Recently, the American Psychiatric Association (APA) published a position paper stating that neuroimaging provided no benefit to the diagnosis and treatment of psychiatric disorders. In the position statement and the accompanying 46-page review of the subject literature, the APA makes a strong case for the failure of functional magnetic resonance imaging to elaborate useful diagnostic biomarkers for psychiatric disorders. However, the APA fails to consider and do not include in the analysis, extensive research on the clinical value of Positron Emission Tomography (PET) and Single Photon Emission Computed Tomography (SPECT) neuroimaging. Herein, the International Society of Applied Neuroimaging (ISAN) will elaborate on the incongruity between the categorical system of psychiatric diagnoses and neuroimaging findings. We further explore the manner in which neuroimaging can and should contribute to psychiatric diagnosis and to guiding psychiatric treatment. Lastly, we describe several examples of neuroimaging applications which meet or exceed the criteria set forth by the APA to define a neuroimaging biomarker, including the diagnosis of Alzheimer’s disease and other dementias, the differential diagnosis of ADHD, and the diagnosis of traumatic brain injury. The position of ISAN is that neuroimaging is not to be feared. Neuroimaging does not replace the diagnostician; rather, it aids the diagnostician in complex cases.
Keywords
ADHD, Depression, Neuroimaging, PET, SPECT, TBI, Traumatic brain injury, fMRI, functional MRI
Introduction
Recently, the American Psychiatric Association (APA) published a position paper stating “neuroimaging has yet to have a significant impact on the diagnosis or treatment of individual patients in clinical settings” 1]. Surely, the APA guiding its profession must be a good thing. Unfortunately, there is one far-reaching problem. This sweeping statement made by the APA might be correct for Functional Magnetic Resonance Imaging (fMRI), but it is certainly not true for Positron Emission Tomography (PET) and Single Photon Emission Computed Tomography (SPECT) neuroimaging. Both these functional scanning techniques have clearly proven benefits in diagnosis and in guiding treatment of psychiatric patients [2]. The APA position paper focused almost exclusively on fMRI data and did not review these other widely used functional neuroimaging techniques. More troubling, was that the APA then generalized its conclusions about fMRI to all neuroimaging techniques without supportive evidence.
The tendency to take unsupportable positions is not new to the APA. Psychiatry has attempted to neatly package mental illness into diagnostic categories which unfortunately have little to do with the underlying neurobiology [3]. While neuroimaging studies have demonstrated that these diagnostic entities are, in fact, made up of multiple endophenotypes of neurophysiological disruption, the APA has done nothing to alter the categorical system elaborated in the Diagnostic and Statistical Manual (DSM) in its fifth iteration [3].
When the APA officially declared that using neuroimaging to look at the brain has no clinical value in psychiatry, it took a step backwards scientifically. The APA ignored data which did not fit with this rigid position. By deciding to be august, rather than accurate, the APA robbed themselves, psychiatrists, and the general public of effective and promising neuroimaging opportunities that could improve clinical care. The resistance to actually looking at brain function by psychiatrists is startling.
As President of the International Society of Applied Neuroimaging (ISAN), I encouraged the Society to respond rapidly with a letter-to-the-editor. Much to our dismay, the letter was rejected by the Journal, but not because of poor writing quality. Rather, it was rejected because the Journal claimed there could be no rebuttal to such APA position papers.
Herein, we will elaborate on the incongruity between DSM categories and neurobiological data, compare and contrast the APA’s position [1] with some of the available data which they did NOT examine in their analysis of neuroimaging, and demonstrate how imaging can and should augment the diagnostic and treatment process. We will demonstrate that neuroimaging has already proven itself valuable in the psychiatric treatment of individual patients, as well as how neuroimaging can advance the field going forward.
The Incongruity between DSM Diagnostic Categories and Neuroimaging Findings
Depression
Using the DSM diagnostic criteria for Major Depressive Disorder,[3] it is possible to have over 20 different phenotypes of this single diagnosis. Patients can have increased motor activity or decreased motor activity. They can have insomnia or hypersomnia. They can have weight gain or weight loss. It is difficult to see how such a multi-faceted presentation can represent a single diagnostic entity which would benefit in the same way from the same medications and/or treatments. Indeed, experts agree that depression is not just one thing, despite the efforts of mainstream psychiatry to classify it into a single illness category. Nassir Ghaemi, MD, noted expert on psychopharmacology recently wrote:[4]
“Psychiatry…practice(s) non-scientifically; we use hundreds of made-up labels for professional purposes, without really getting at the reality of what is wrong with the patient…We have a huge amount of neurobiology research now to conclude that the 20th century neurotransmitter theories of psychopharmacology basically are false. The dopamine and monoamine (serotonin) hypotheses of schizophrenia and depression are wrong…we now know that drugs have major second messenger effects which (cause) neuroplastic changes in the brain, including connections between neurons. The brain is literally re-sculpted.”[4]
Neuroimaging studies have shown there are several neurophysiological substrates for depression. Functional brain scans, such as SPECT (single photon emission computed tomography) or PET (positron emission tomography) have shown that while patients may present with the same symptoms of depression, they can have very different processes occurring in their brains. Indeed, some of the anatomic circuits of depression and mood regulation have been revealed by converging evidence from SPECT, PET and fMRI studies of depression, as well as the analysis of both lesions resulting in depressive symptoms and surgical lesions used to treat severe cases of depression [5,6]. These convergent findings have revealed a network of brain regions, including the dorsal prefrontal cortex, ventral prefrontal cortex, anterior cingulate gyrus, amygdala, hippocampus, striatum, and thalamus in the pathophysiology of depression.[7–9] Drevets and others have emphasized that depression is the result of multiple pathophysiological processes and the dysfunction of multiple pathways [5,10]. It is not one disorder.
Distinct subtypes of depression now can be detected. Depression is often associated with decreased activity (and therefore metabolism and perfusion) of the frontal lobes, the insular cortex, and the anterior cingulate gyrus [5–10]. However, some patients with depression have increased perfusion in the precuneus, which correlates with rumination and self-criticism [11]. Some patients with depression also have decreased temporal lobe function. Many patients with depression show increased thalamic activity (metabolism or perfusion) [12]. Portions of the thalamus have direct connections to the amygdala, the seat of fear and anxiety [13]. SPECT and PET neuroimaging can also predict who will respond to certain antidepressants. For example, those who are likely to respond to SSRI antidepressants show increased perfusion in the ventral frontal cortex and anterior cingulate 14,15]. The response to SSRI antidepressants is often decreased perfusion in these areas, as well as in the thalamus. In contrast, some patients with depression have markedly decreased dorsal frontal cortex and medial frontal cortex perfusion. These patients are less likely to respond to SSRI medications, but may respond better to noradrenergic antidepressants [9,16]. Treatment-resistant depression may show markedly increased perfusion in the subgenual cingulate [10].
Neuroimaging also helps to diagnose neurological disorders which may masquerade as psychiatric conditions. For example, over 40% of patients who experience a concussion (also known as mild traumatic brain injury [TBI]) will develop depression over the subsequent year [17,18]. There is no reason to expect patients with TBI to respond the same way as those who have endogenous depression. Similarly, toxic brain injury [19,20], Parkinsonian syndromes [21], and dementia in the elderly [22] can all present as depression.
Attention-Deficit Hyperactivity Disorder (ADHD)
There is overwhelming neurobiological evidence for the existence of multiple forms of ADHD based on neuroimaging. A multitude of functional imaging studies utilizing a diversity of modalities; including SPECT, fMRI, PET, and quantitative electroencephalogram (qEEG) repeatedly demonstrated similar results in children and in adults. Some of these studies, reviewed by Dr. Cherkasova and Dr. Hechtman,[23] show reduced activity during a concentration task in the prefrontal cortex, orbital frontal cortex, and caudate nuclei in some patients with ADHD. In addition, abnormal function and anatomy have been reported in the cerebellum of some patients with ADHD. Others diagnosed with ADHD have poorly functioning temporal lobes.[23] Significant clinical experience has shown that patients with symptoms of ADHD can also present with diffuse over-activity of the cerebral cortices, involving not only the frontal lobes, but also the temporal and parietal lobes. This clinical observation is supported by recent research looking at subclasses of ADHD endophenotypes [24,25], rather than bearing the underlying presumption that all ADHD looks the same on neuroimaging.
Fully recognizing that the plural of anecdote is not data, we offer two examples of these alternate endophenotypes of ADHD and how they responded differently to medications. The first patient was a 7 year old female who was diagnosed with ADHD by her pediatrician, but became wildly out of control on stimulant medications. A trial of the non-stimulant medication atomoxetine, which is FDA-approved for the treatment of ADHD, led to aggression. This phenomenon has been previously described by Henderson and Hartman [26] who found that fully one-third of all new starts on atomoxetine experienced aggression, hypomania, or mania. Off all medication, the patient was still struggling in school academically and was often hyperactive and impulsive at home and at school. However, the patient was not grandiose, hypersexual, excessively giddy, or showing reduced need for sleep as would be expected in mania. Thus, this seemed less likely to be a burgeoning case of Bipolar Disorder. Her Connor’s Continuous Performance test for ADHD was positive.
A SPECT scan (Figure 2) revealed diffusely increased activity throughout the cerebral cortices. The overactive frontal lobes became even more active during a concentration task, in contrast to the usual situation in ADHD as illustrated in Figure 1 above. Based on the SPECT findings, the patient was treated with an anticonvulsant, oxcarbazepine, to calm the overactive areas. Within a few weeks of starting treatment, the patient was less hyperactive and more focused. She demonstrated marked improvement in her academic performance. She remained stable and free of symptoms for the subsequent 43 months until lost to follow-up.
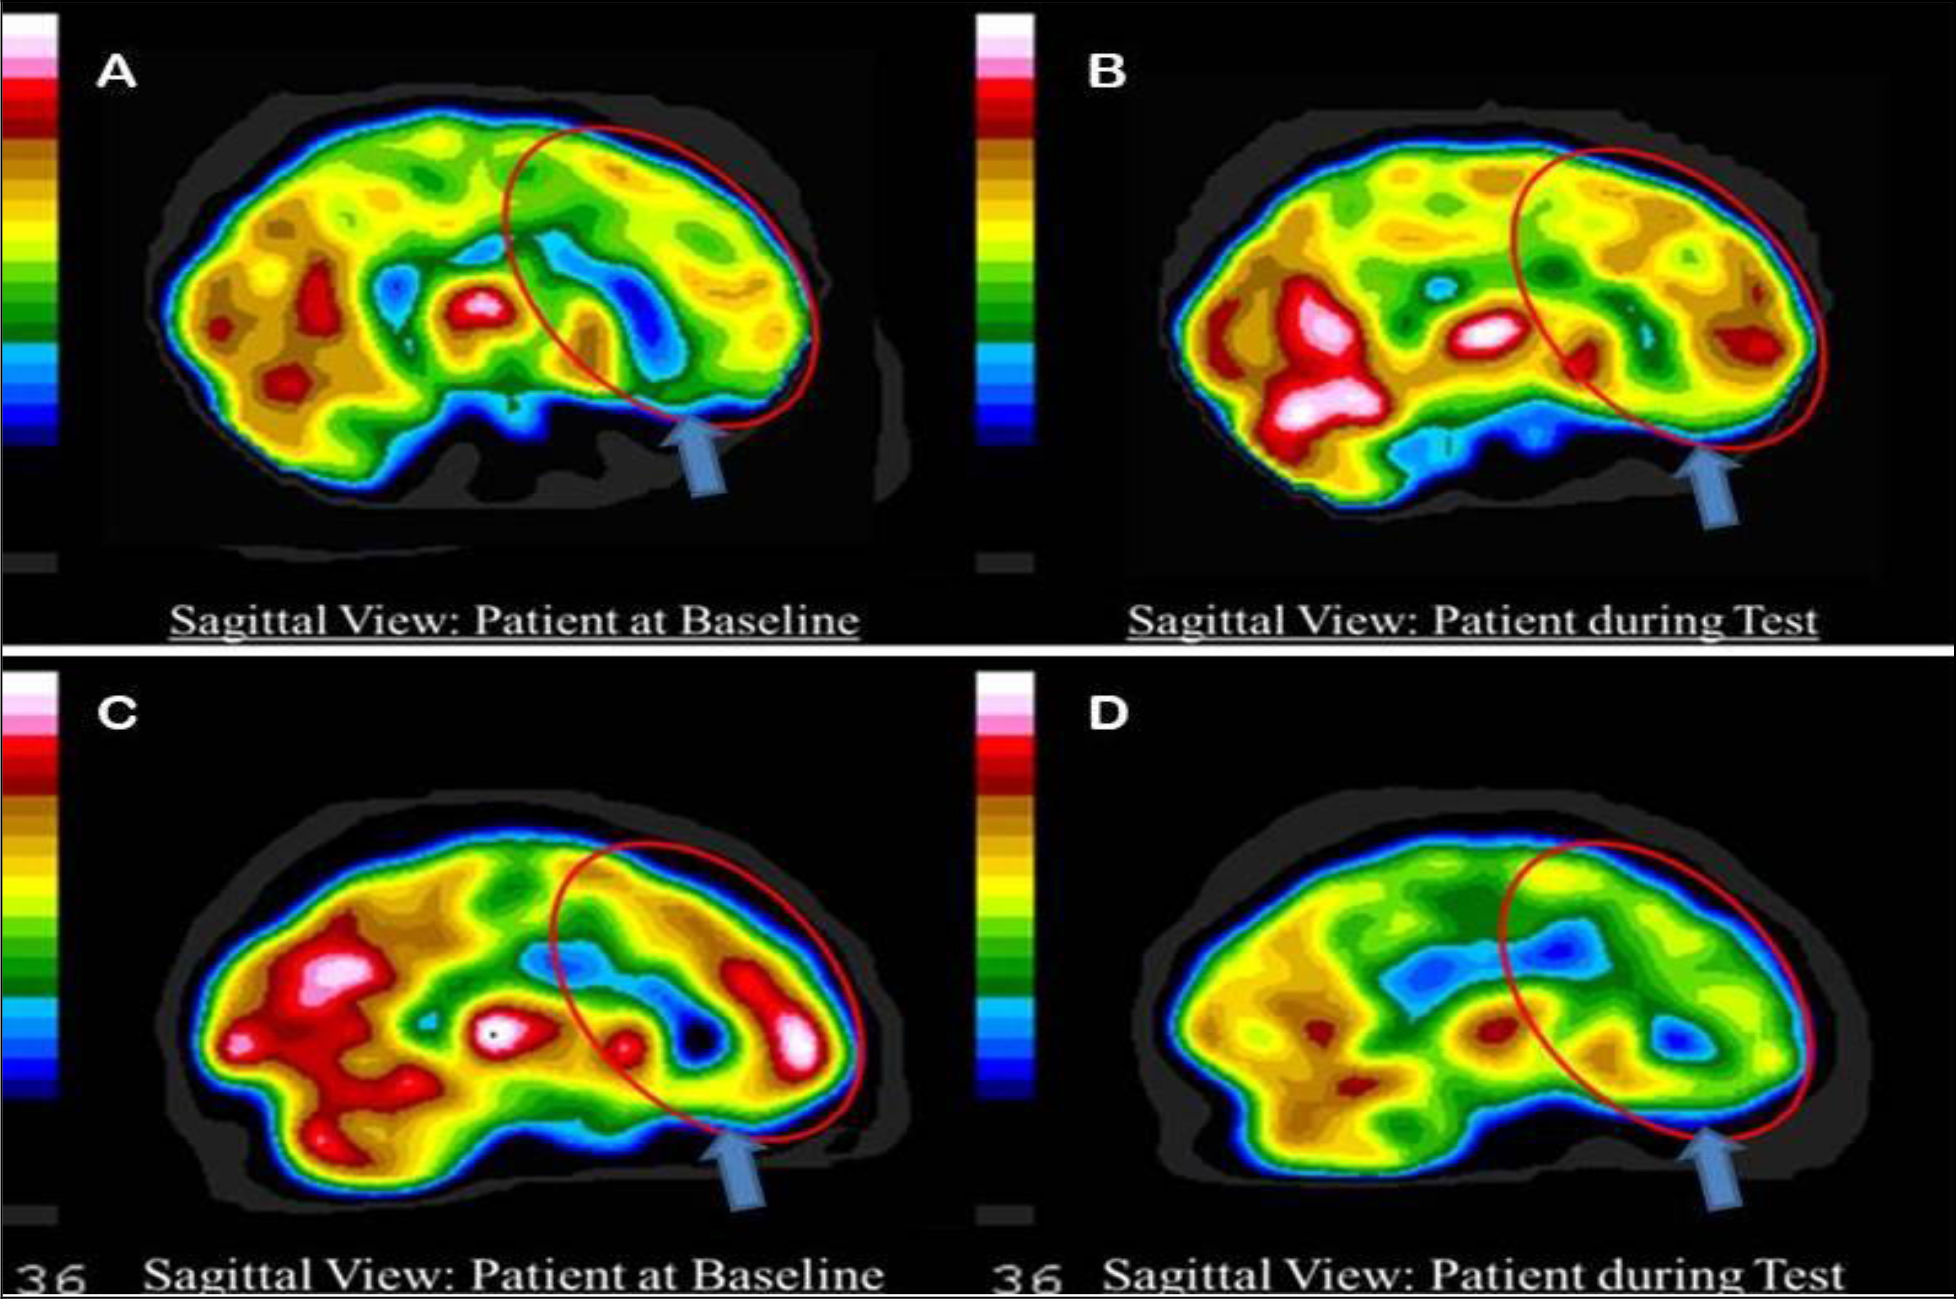
Figure 1. Tc-99m-HMPAO perfusion SPECT scan data presented in sagittal tomogram. The color scale is scaled relative to the patient’s mean cerebral perfusion. Mean blood flow (72%) is in yellow. Color shifts occur at approximately every 0.5 SD (3 %) relative to the patient’s mean. Baseline (A) and concentration (B) scan of a neurotypical patient demonstrating increased frontal lobe (red elipse) and orbitofrontal cortex (arrow) perfusion during concentration. Baseline (C) and concentration (D) scan of a patient with ADHD demonstrating decreased frontal lobe (red elipse) and orbitofrontal cortex (arrow) perfusion during concentration.
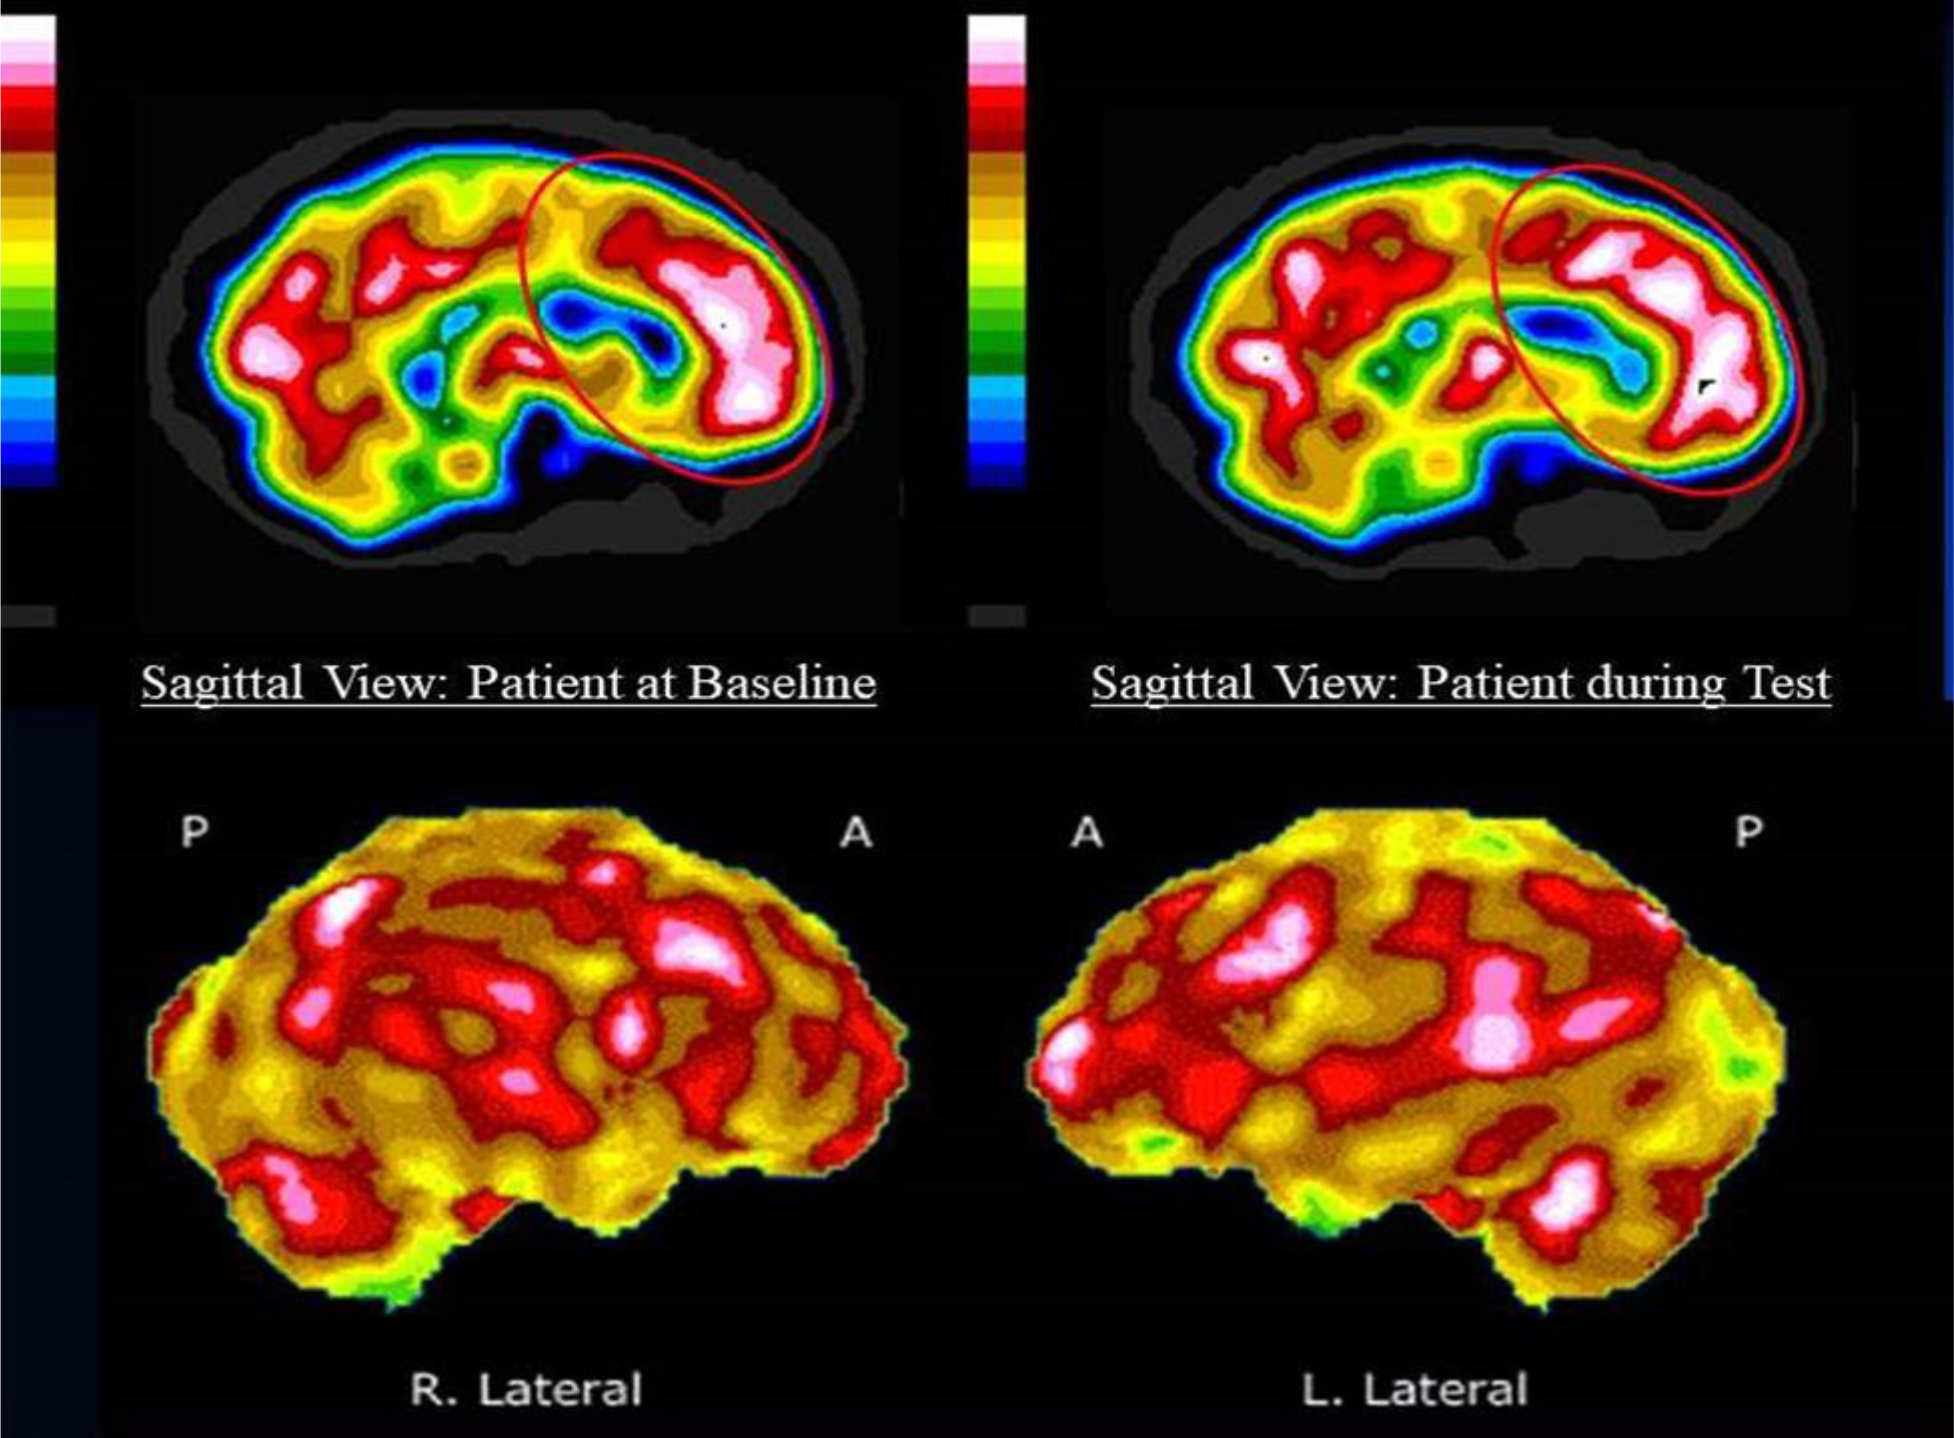
Figure 2. Tc-99m-HMPAO perfusion SPECT scan data presented in sagittal tomogram (upper row) and in surface rendering (lower row). The color scale is as in Figure 1. Baseline (upper left) and concentration (upper right) scan of the patient demonstrating increased frontal lobe (red elipse) and orbitofrontal cortex perfusion at baseline, which become even more active during concentration. Surface rendering shows the diffuse hyperperfusion throughout the cerebral cortices.
The second case is a 10 year old female who struggled with poor attention and poor academic performance, but did not demonstrate hyperactivity. She had a trial of stimulant medications, but became anxious and agitated. She underwent a qEEG evaluation and was diagnosed with severe auditory and visual attention deficits. She then underwent over $10,000 worth of neurofeedback, but showed only slight transient benefit. Her Connor’s Continuous Performance test for ADHD was negative.
A SPECT scan (Figure 3) revealed temporal lobe hypoperfusion and no evidence of frontal lobe deactivation during a concentration task. Based on clinical experience and the appearance of temporal lobe dysfunction, she was started on donepezil (Aricept), an acetylcholinesterase inhibitor. Within one month, her reading speed had increased and her math skills were improving. By three months, she had gained approximately two years in math skills and 1.5 years in reading comprehension skills. Donepezil was shown in a small study to improve ADHD symptoms [27]. Doyle and colleagues [28] also reported on an open-label case series of patients with autism spectrum disorder who showed reduced ADHD-like symptoms in response to donepezil. However, an 18-week open-label trial in children with ADHD and tics failed to show improvement in ADHD-like symptoms [29].
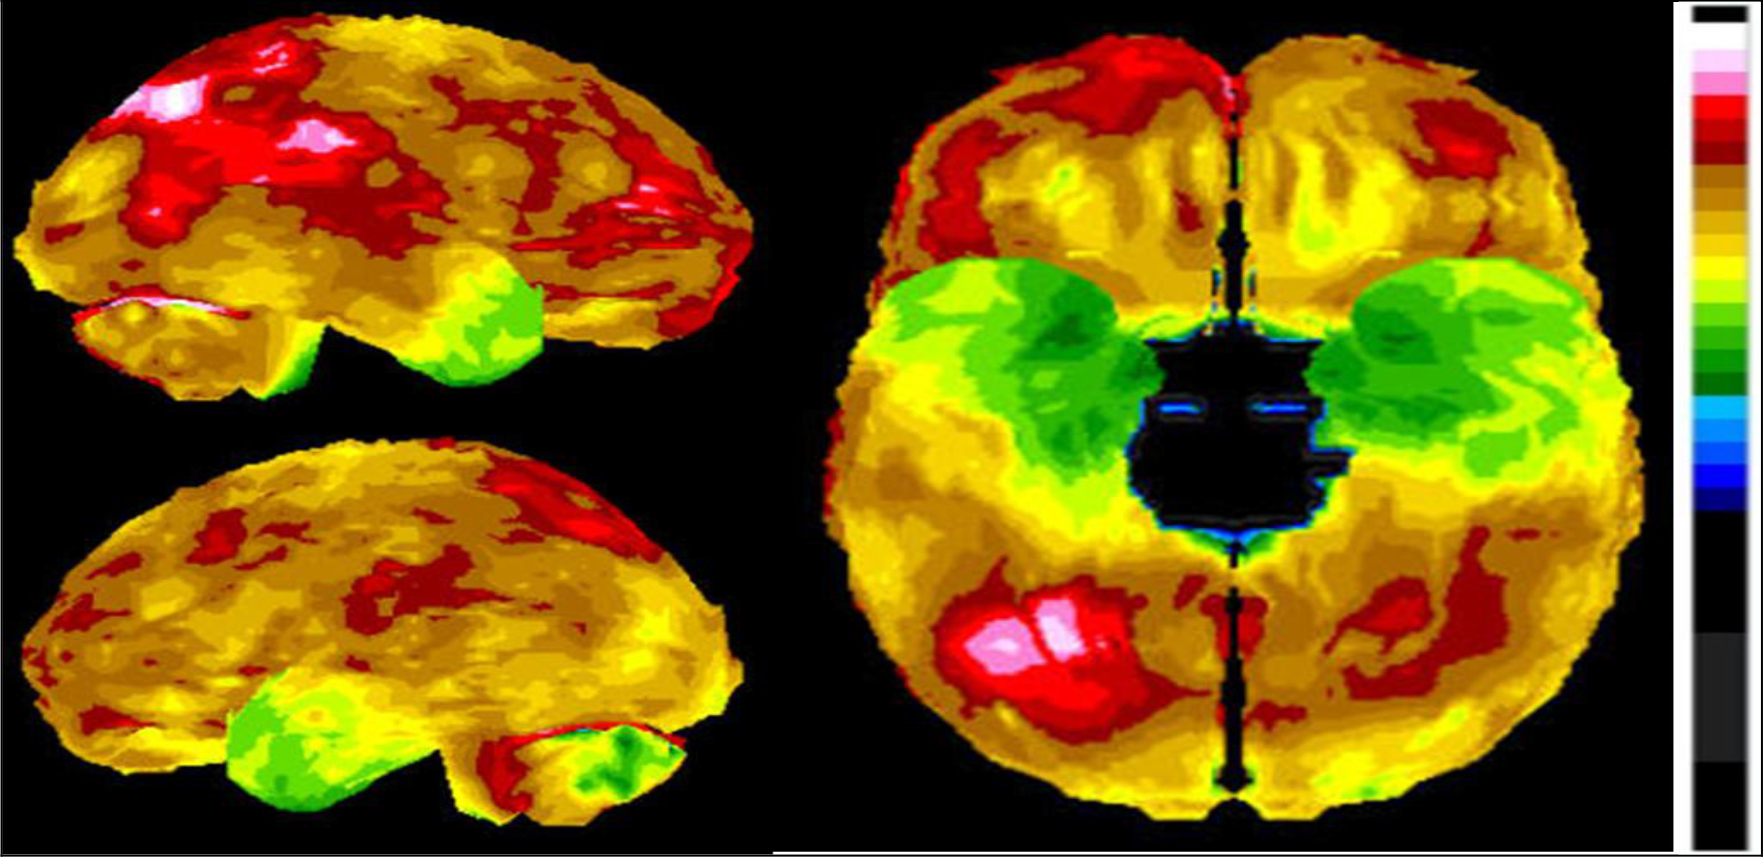
Figure 3. Tc-99m-HMPAO perfusion SPECT scan data presented in surface rendering. The color scale is as in Figure 1. The decreased perfusion (green) is clearly visible in the temporal lobes.
A separate important point is that inattention is a non-specific symptom. Inattention, is found not only in ADHD, mania, anxiety, and depression, but it is also found in TBI, carbon monoxide poisoning, cadmium toxicity, lead toxicity, schizophrenia, post-traumatic stress disorder (PTSD), post-coronary bypass syndrome, multiple sclerosis, substance abuse, space-occupying lesions, CNS infections, dementia, and a litany of other conditions which alter frontal lobe functioning. While, an interview will not help distinguish among these possibilities, neuroimaging can differentiate many of these categories. Can neuroimaging provide a pathognomonic imaging result (a fingerprint, if you will) for each of these conditions? No, but it can eliminate several possibilities and lead you closer to a definitive diagnosis. For example, if a perfusion SPECT scan shows a diffuse pattern of decreased function, ADHD become much less likely and systemic effects such as metal [30], mold [31], or other [32] toxicity, carbon monoxide poisoning,[33] or infection [34] become more likely. Rather than treating the patient with a stimulant, a clinician would be directed by the scan results to seek a cause for the brain dysfunction.
The APA takes a position
The APA has now taken the position that there is no reason to look at the brain. In a two-page position paper [1] in the September 2018 issue of the American Journal of Psychiatry, the APA concluded, “According to this standard, the psychiatric imaging literature currently does not support the application of a diagnostic biomarker to positively establish the presence of any primary psychiatric disorder”. This bold statement was backed up by a separate 44-page review article prepared by a workgroup of APA neuroimaging researchers issued in electronic form [35]. Notably the review focused almost entirely on Functional Magnetic Resonance Imaging (fMRI) and neglected the extensive literature on SPECT and PET neuroimaging in psychiatric disorders.
The International Society of Applied Neuroimaging (ISAN) rapidly responded with a letter-to-the-editor. Much to our dismay, the letter was rejected. Curiously, the letter was rejected because the Journal claimed there could be no rebuttal to such APA position papers. The APA has delivered this condemnation of neuroimaging in a manner that prevented any objection, rebuttal, or discussion. It is, simply put, an indefinite moratorium.
The APA’s position had essentially three elements [1] which we will address in turn:
- A neuroimaging finding to have diagnostic value must have sensitivity and specificity of no less than 80% verified by at least two independent studies,
- The psychiatric imaging literature does not support the application of neuroimaging in psychiatric diagnostics or treatment,
- Neuroimaging has not had a significant impact on the diagnosis and treatment of psychiatric disorders.
Element 1: First, the APA workgroup set unrealistic standards for diagnostic biomarkers in psychiatry. A “biomarker” is a measurable or detectable indicator of the presence or severity of a disease. The APA workgroup leaned heavily on the example of amyloid imaging in Alzheimer’s disease;[35] however, they seem to miss the point that Alzheimer’s disease is a degenerative disease characterized by the accumulation of abnormal proteins – tau and amyloid, which can be quantified and visualized at autopsy. In contrast, psychiatric disorders are not so simply distinguished based on pathological markers. Rather, psychiatric disorders as defined in the DSMV are constructs conceived by a committee. Not surprisingly then, fully 60% of the DSMV diagnoses failed to stand up to diagnostic testing when subjected to field trials.[36] As an example, Major Depressive Disorder constitutes a single psychiatric diagnosis, but a patient can meet the criteria for this disorder with more than two dozen combinations of divergent symptoms as described above; yet, it is considered a single diagnosis.
Moreover, comorbidity (the presence of two or more diagnoses) is the rule, rather than the exception in psychiatry. Patients with ADHD frequently have comorbid anxiety, oppositional disorders, or learning disorders [2,37–39]. Patients with depression have a very high rate of comorbid anxiety [2,40]. Patients with PTSD, particularly veterans, often have comorbid TBI [41,42]. These comorbid diagnoses cloud the diagnostic process. The DSMV was not designed with the brain in mind and has done little to adopt the lessons learned about the neurobiology of psychiatric disorders. Furthermore, functional aspects of the brain do not neatly fit into DSMV categories [2].
In addition, it is almost laughable that the criteria for sensitivity and specificity were set at 80% by the APA workgroup. It was as if the APA was setting an insurmountable barrier for neuroimaging biomarkers. Many of the tests which are used daily in medicine and in psychiatry, in particular, lack this level of accuracy. For example, the PTSD checklist, a widely accepted scale for assessing the presence or absence of PTSD, has 70% sensitivity and 90% specificity [43]. The Draw-A-Clock test used in neurology to diagnose dementia has a sensitivity of 66% and a specificity of 65% [44]. The Hamilton depression scale and the Zung depression scale, both widely accepted self-rating scales for depression, lack sensitivity or specificity which measure up to the APA workgroup’s standard [45,46]. Looking outside psychiatry, the prostate specific antigen test remains a standard of care in screening for prostate cancer, despite low sensitivity and specificity. Similarly, multiparametric MRI has a sensitivity of 50% and a specificity of 69% [47] to detect prostate cancer, but is widely utilized. While these tests fail to meet the stringent standard proposed by the APA, they remain central to clinical care and disease detection and management.
Element 2: The review offered by the APA Workgroup [35] is heavily weighted to functional MRI and neglected extensive literature using other forms of neuroimaging. Curiously in fact, a large number of replicated studies using perfusion SPECT and fluoro-deoxyglucose-PET (FDG-PET) to identify disorders and differentiate among overlapping diagnoses were not included in the APA workgroup report. We will offer just three examples. First, numerous published, peer-reviewed studies by independent investigators show that both FDG-PET and SPECT meet the criteria set by the workgroup committee in diagnosing Alzheimer’s disease as described above [48]. FDG-PET and SPECT both have sensitivity and specificity in the diagnosis of Alzheimer’s disease between 82–89%.[48] Moreover, FDG-PET and SPECT are superior to amyloid imaging in the differential diagnosis of the various forms of dementia.[48] To be specific, a positive amyloid scan can reliably be considered evidence of Alzheimer’s disease or its precursor (sensitivity = 89%; specificity = 87%) [49]. However, the non-specific binding in amyloid scans increases dramatically with age to over 40% in patients over 80 years [48,50] Thus, the specificity of amyloid imaging declines dramatically with age. Furthermore, if an amyloid scan is negative, then the patient presumably does not have Alzheimer’s disease, but it is impossible to differentiate among the alternative forms of dementia with an amyloid scan. FDG-PET and SPECT are superior in this regard [48], and can provide clear evidence aiding in the differential diagnosis.
Second, perfusion SPECT [51,52] can readily distinguish ADHD from controls. Indeed, SPECT differentiated children who were highly likely to respond favorably to stimulants from non-responders [51]. As illustrated above, SPECT neuroimaging can provide important clues which aid in the clinical management of presumptive ADHD cases, which do not respond in a typical fashion to stimulant medications. Nonetheless, Lee and colleagues [51] characterized a reasonably sized sample of 40 medication-naïve children with ADHD compared to 17 controls using SPECT plus statistical parametric analysis before and after treatment with methylphenidate. Statistical analysis confirmed that subjects with ADHD showed decreased perfusion (activity) of the prefrontal cortex and middle temporal gyrus, but showed increased perfusion (activity) in the somatosensory cortex and anterior cingulate gyri, compared to controls. After treatment with methylphenidate, ADHD subjects showed increased perfusion of the prefrontal cortex relative to their own pre-medication scans. Perfusion in the somatosensory cortex and striatum was reduced [51]. These SPECT studies have been confirmed by numerous fMRI studies which have found similar impairment of the fronto-striatal networks. For example, Pliska and colleagues [53] found that adolescents with ADHD (N = 17) failed to show increased perfusion (activation) in the anterior cingulate bilaterally and the left ventrolateral prefrontal cortex during an inhibitory task (Stop Signal Task) compared to 15 age-matched controls. Smith and colleagues [54] similarly described decreased perfusion in the left rostral mesial frontal cortex during one interference-type concentration task and decreased perfusion in the bilateral inferior prefrontal (right more significant than left) and temporal lobes during a switch task.[54]
Third, perfusion SPECT is extremely accurate in differentiating TBI from controls and TBI from PTSD[55–57]. Notably, there is tremendous overlap (33% to 42%) between the clinical presentation of TBI and PTSD in veterans [58,59]. Diagnostic instruments routinely used by the Veterans Administration (VA) are neither sensitive, nor specific [60]. For instance, several of the symptoms assessed by questions in the Clinician-Administered PTSD scale [61] could be a result of TBI, such as sleep difficulties, irritability, poor concentration, and memory difficulties. Using perfusion SPECT neuroimaging, TBI and PTSD can be differentiated with a sensitivity of 92% and a specificity of 85% based on a study of 196 veterans [55]. Furthermore, these results were replicated in a separate civilian population of over 24,000 individuals [56]. These findings certainly meet the APA workgroup criteria for a psychiatric biomarker – greater than 80% sensitivity and specificity and replicated with independent data.
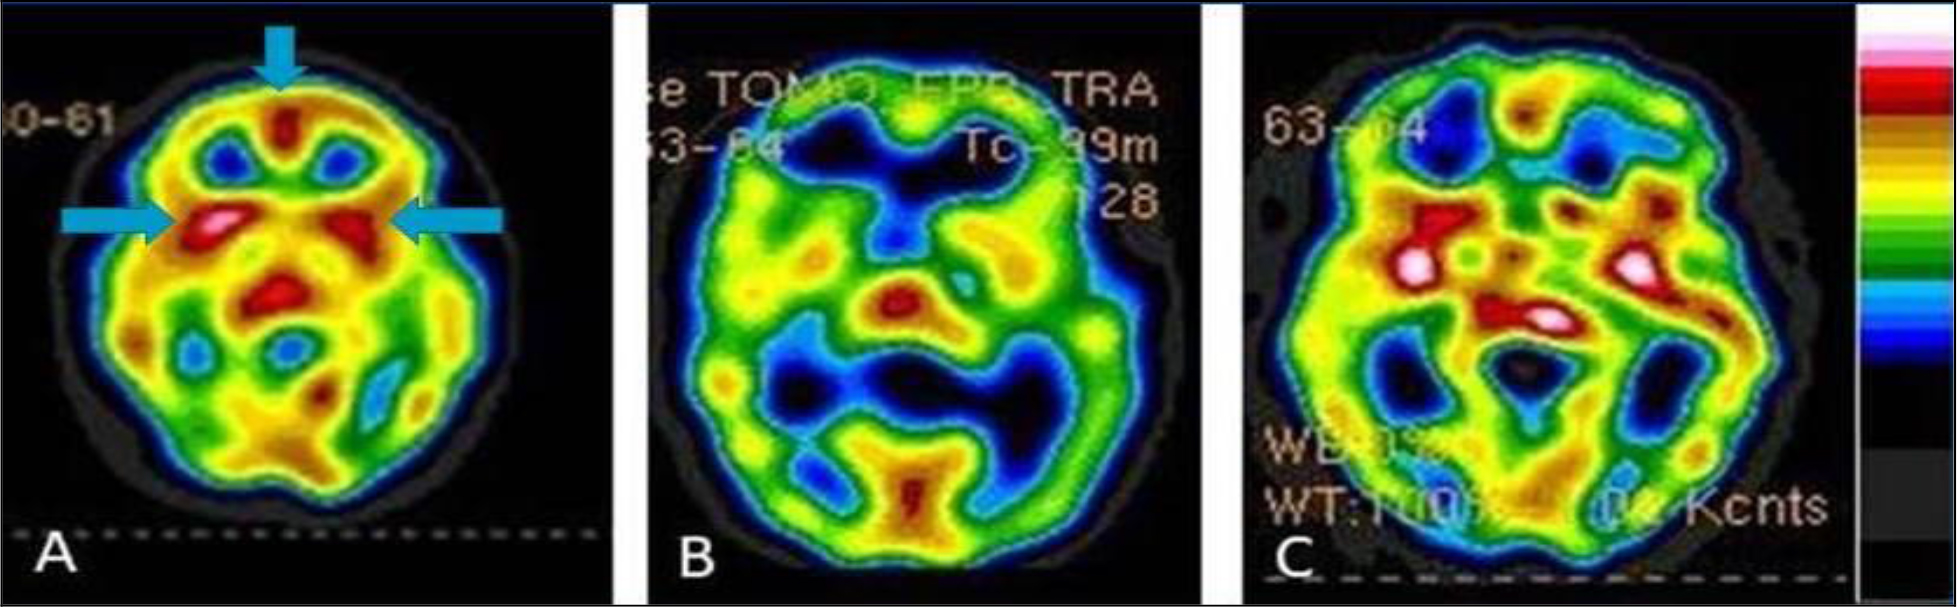
Figure 4. Tc-99m-HMPAO perfusion SPECT scan data presented in transverse tomogram at the level of the basal ganglia. The color scale is as in Figure 1. SPECT scans showing PTSD (A), TBI (B), and the combination of PTSD and TBI (C). Over-activity of the basal ganglia (horizontal arrows) and anterior cingulate (vertical arrow) can be seen in the PTSD case, while decreased activity in these areas is seen in TBI. Each has a very distinct appearance visually and when the default-mode network is analyzed, these conditions can be differentiated with 94% accuracy.
Element 3: The APA workgroup’s claim that neuroimaging has not had a significant impact on the diagnosis and treatment of psychiatric illnesses assumes that neuroimaging can only be helpful if it provides a pathognomonic “fingerprint” for a DSM diagnosis. Notwithstanding the absurdity of expecting imaging of the human brain to yield a hallmark of a disorder invented by a committee, issues of comorbidity and the shared final neurophysiological outcome of multiple “diagnoses” make it highly unlikely that we will have neuroimaging “fingerprints” for disorders.
Neuroimaging, like all forms of diagnostic imaging, allows a clinician to eliminate possibilities and narrow the differential diagnosis. This progression is central to any medical diagnostic process. For example, we routinely use chest X-rays in the diagnostic workup of various disorders. There is an intrinsic assumption that chest X-rays give the diagnosis. Let’s look at the example of a large solitary pulmonary mass of size greater than 4 cm. According to Reeder and Felson’s definitive text Gamuts in Radiology [62] this could be an abscess, bronchogenic carcinoma, alveolar cell carcinoma, metastasis, arteriovenous malformation, bronchial adenoma, fluid filled cyst, hamartoma, hematoma, inflammatory pseudotumor, organized nodular pneumonia, lipoid pneumonia, loculated pleural fluid, lymphoma, pneumoconiosis, pulmonary sequestration, sarcoma, or Wegener’s granuloma. How does one distinguish the likely correct diagnosis from this long list of diagnostic possibilities? It is done by clinical correlation and additional testing. The diagnosis is made ultimately by the physician as a result of synthesizing the imaging data, the testing data, and the clinical information. Psychiatry should be no different. Psychiatric diagnoses should be made based on the synthesis of data – laboratory data, clinical data, and neuroimaging data. But ultimately, the physician makes the diagnosis, not the lab test. Neuroimaging is a tool which only assists in the diagnostic process.
Neuroimaging can be diagnostic
The APA workgroup ignored several neuroimaging modalities which have demonstrated value in the differential diagnosis of TBI, dementia and other psychiatric disorders and focused almost exclusively on fMRI. One interpretation of the APA workgroup report is that fMRI has failed to live up to the expectations set forth by academia over two decades ago. Despite hundreds of millions of dollars in research funding and hundreds of years of collective research time, the over one hundred MRI research centers in the United States has failed to provide a psychiatric biomarker.
On the other hand, functional neuroimaging can offer clues and information about psychiatric disorders and their comorbid conditions. Functional neuroimaging helps clinicians to unravel complex cases. For example, ruling out toxic exposure or TBI can be highly valuable in the differential diagnosis of complex case. The highly sensitive and specific ability of SPECT neuroimaging to differentiate TBI from PTSD not only meets the APA criteria, but offers hope to tens of thousands of veterans who suffer from one or both disorders [63].
The introductory sentence of the APA position paper clearly signals the fear that drives the APA’s position, “In response to claims being made that brain imaging technology had already reached the point at which it could be useful for making a clinical diagnosis and for helping in treatment selection in individual patients, the APA Assembly passed an action paper…”[1]
Conclusion
The members of ISAN call upon the APA to re-examine neuroimaging in psychiatry with inclusion of SPECT and FDG-PET research. Rather than set unrealistic expectations for a neuroimaging biomarker, understand the value of incremental steps in a differential diagnosis. Furthermore, ISAN encouraged the APA to explore the use of SPECT and FDG-PET in psychiatry with those who are actually knowledgeable about their practical applications. We acknowledge that interpreting SPECT requires thorough training, just as with interpreting amyloid scans. SPECT scans are technically demanding and poor quality scans can be misleading and dissuasive. On the other hand, high quality SPECT scans with quantitative analysis can provide striking insights into the function of the brain across a diversity of psychiatric conditions. Lastly, neuroimaging is not something to be feared. Neuroimaging does not replace the diagnostician; rather, it can aid the diagnostician in complex cases.
References
- First MB, Drevets WC, Carter C, Dickstein DP, Kasoff L, et al. (2018) Clinical Applications of Neuroimaging in Psychiatric Disorders. Am J Psychiatry 175: 915–916. [crossref]
- Henderson TA (2018) Brain SPECT imaging in neuropsychiatric diagnosis and monitoring. EPatient 2018 1: 40–47.
- American Psychiatric Association (2013) Diagnostic and statistical manual of mental disorders (5th ed.). Arlington VA. American Psychiatric Association, 2013.
- http://boards.medscape.com/forums?128@363.ovpaa3yod6L@.2a37df02!comment=1&cat=All
- Price JL, Drevets WC (2012) Neural circuits underlying the pathophysiology of mood disorders. Trends Cogn Sci 16: 61–71. [crossref]
- Masdeu JC1 (2011) Neuroimaging in psychiatric disorders. Neurotherapeutics 8: 93–102. [crossref]
- Nagafusa Y, Okamoto N, Sakamoto K, Yamashita F, Kawaguchi A, et al. (2012) Assessment of cerebral blood flow findings using 99mTc-ECD single-photon emission computed tomography in patients diagnosed with major depressive disorder. J Affect Disord 140: 296–299. [crossref]
- Willeumier K, Taylor DV, Amen DG (2019) Decreased cerebral blood flow in the limbic and prefrontal cortex using SPECT imaging in a cohort of completed suicides. Transl Psychiatry 1:28.
- Kito S, Hasegawa T, Koga Y (2012) Cerebral blood flow ratio of the dorsolateral prefrontal cortex to the ventromedial prefrontal cortex as a potential predictor of treatment response to transcranial magnetic stimulation in depression. Brain Stimul 5: 547–53.
- Drevets WC, Savitz J, Trimble M (2008) The subgenual anterior cingulate cortex in mood disorders. CNS Spectr 13: 663–681. [crossref]
- Dumas R, Richieri R, Guedj E, Auquier P, et al (2012) Improvement of health-related quality of life in depression after transcranial magnetic stimulation in a naturalistic trial is associated with decreased perfusion in precuneus. Health Qual Life Outcomes 10: 87.
- Conway CR, Sheline YI, Chibnall JT, Bucholz RD, et al. (2012) Brain blood-flow change with acute vagus nerve stimulation in treatment-refractory major depressive disorder. Brain Stimul 5: 163–71.
- Dougherty DD1, Weiss AP, Cosgrove GR, Alpert NM, Cassem EH, et al. (2003) Cerebral metabolic correlates as potential predictors of response to anterior cingulotomy for treatment of major depression. J Neurosurg 99: 1010–1017. [crossref]
- Brockmann H, Zobel A, Joe A, Biermann K, Scheef L, et al. (2009) The value of HMPAO SPECT in predicting treatment response to citalopram in patients with major depression. Psychiatry Res 173: 107–112. [crossref]
- Brody AL, Saxena S, Silverman DH, Alborzian S, Fairbanks LA, et al. (1999) Brain metabolic changes in major depressive disorder from pre- to post-treatment with paroxetine. Psychiatry Res 91: 127–139. [crossref]
- Thornton JF, Schneider H, McLean MK, van Lierop MJ, Tarzwell R (2014) Improved outcomes using brain SPECT-guided treatment versus treatment-as-usual in community psychiatric outpatients: a retrospective case-control study. J Neuropsychiatry Clin Neurosci 26: 51–56. [crossref]
- Jorge RE1, Robinson RG, Moser D, Tateno A, Crespo-Facorro B, et al. (2004) Major depression following traumatic brain injury. Arch Gen Psychiatry 61: 42–50. [crossref]
- Fann JR, Burington B, Leonetti A, Jaffe K, et al. Psychiatric illness following traumatic brain injury in an adult health maintenance organization population. Arch Gen Psychiatry, 2004.61(1):53–61.
- Condray R, Morrow LA, Steinhauer SR, Hodgson M, Kelley M (2000) Mood and behavioral symptoms in individuals with chronic solvent exposure. Psychiatry Res 97: 191–206. [crossref]
- Bowler RM, Mergler D, Rauch SS, Bowler RP (1992) Stability of psychological impairment: two year follow-up of former microelectronics workers’ affective and personality disturbance. Women Health 18: 27–48. [crossref]
- Postuma RB, Aarsland D, Barone P, Burn DJ, Hawkes CH, et al. (2012) Identifying prodromal Parkinson’s disease: pre-motor disorders in Parkinson’s disease. Mov Disord 27: 617–626. [crossref]
- Stella F, Radanovic M, Balthazar ML, Canineu PR, de Souza LC, et al. (2014) Neuropsychiatric symptoms in the prodromal stages of dementia. Curr Opin Psychiatry 27: 230–235. [crossref]
- Cherkasova MV, Hechtman L (2009) Neuroimaging in attention-deficit hyperactivity disorder: beyond the frontostriatal circuitry. Can J Psychiatry 54: 651–664. [crossref]
- Stevens MC, Pearlson GD, Calhoun VD, Bessette KL. (2018) Functional Neuroimaging Evidence for Distinct Neurobiological Pathways in Attention-Deficit/Hyperactivity Disorder. Biol Psychiatry Cogn Neurosci Neuroimaging 3: 675–685.
- Lecei A, van Hulst BM, de Zeeuw P, van der Pluijm M, et al. (2019) Can we use neuroimaging data to differentiate between subgroups of children with ADHD symptoms: A proof of concept study using latent class analysis of brain activity. Neuroimage Clin 21: 101601.
- Henderson, TA, Hartman K (2004) Aggression, Mania, and Hypomania Induction Associated with Atomoxetine. Pediatrics 114: 895–896.
- Wilens TE, Waxmonsky J, Scott M, Swezey A, et al. (2005) An open trial of adjunctive donepezil in attention-deficit/hyperactivity disorder. J Child Adolesc Psychopharmacol 15: 947–955.
- Doyle RL, Frazier J, Spencer TJ, Geller D, et al. (2006) Donepezil in the treatment of ADHD-like symptoms in youths with pervasive developmental disorder: a case series. J Atten Disord 9: 543–549.
- Cubo E, Fernández Jaén A, Moreno C, Anaya B, et al. (2008) Donepezil use in children and adolescents with tics and attention-deficit/hyperactivity disorder: an 18-week, single-center, dose-escalating, prospective, open-label study. Clin Ther 30: 182–189.
- Geier DA, Pretorius HT, Richards NM, Geier MR (2012) A quantitative evaluation of brain dysfunction and body-burden of toxic metals. Med Sci Monit 18: CR425–431. [crossref]
- Rea WJ, Didriksen N, Simon TR, Pan Y, Fenyves EJ, et al. (2003) Effects of toxic exposure to molds and mycotoxins in building-related illnesses. Arch Environ Health 58: 399–405. [crossref]
- Véra P, Rohrlich P, Stiévenart JL, Elmaleh M, Duval M, et al. (1999) Contribution of single-photon emission computed tomography in the diagnosis and follow-up of CNS toxicity of a cytarabine-containing regimen in pediatric leukemia. J Clin Oncol 17: 2804–2810. [crossref]
- Tsai CF, Yip PK, Chen SY, Lin JC, et al. (2014) The impacts of acute carbon monoxide poisoning on the brain: Longitudinal clinical and 99mTc ethyl cysteinate brain SPECT characterization of patients with persistent and delayed neurological sequelae. Clin Neurol Neurosurg 119: 21–27.
- Shroff G (2018) Single-photon emission tomography imaging in patients with Lyme disease treated with human embryonic stem cells. Neuroradiol J 31: 157–167.
- First MB, Drevets WC, Carter C, Dickstein DP, Kasoff L, et al (2018) Clinical Applications of Neuroimaging in Psychiatric Disorders. Am J Psychiatry 175: 915–916.
- Regier DA, Narrow WE, Clarke DE, Kraemer HC, Kuramoto SJ, et al. (2013) DSM-5 field trials in the United States and Canada, Part II: test-retest reliability of selected categorical diagnoses. Am J Psychiatry 170: 59–70. [crossref]
- Spencer T, Biederman J, Wilens T (1999) Attention-deficit/hyperactivity disorder and comorbidity. Pediatr Clin North Am 46: 915–27.
- Newcorn JH, Halperin JM, Jensen PS, Abikoff HB, Arnold LE, et al. (2001) Symptom profiles in children with ADHD: effects of comorbidity and gender. J Am Acad Child Adolesc Psychiatry 40: 137–146. [crossref]
- Pliszka SR (2003) Psychiatric comorbidities in children with attention deficit hyperactivity disorder: implications for management. Paediatr Drugs 5: 741–50.
- McElroy E, Fearon P, Belsky J, Fonagy P, et al. (2018) Depression/anxiety Networks of Depression and Anxiety Symptoms Across Development. J Am Acad Child Adolesc Psychiatry 57: 964–973.
- Henderson TA (2016) TBI and PTSD symptoms appear similar, but clinical treatments must differ: Some treatment can do more harm than good when proper diagnosis is not made. Behav Healthc 36: 34, 36–7.
- Hoge CW, Castro CA, Messer SC, McGurk D, et al. (2008) Combat duty in Iraq and Afghanistan, mental health problems and barriers to care. US Army Med Dep J :7–17.
- Spoont MR, Williams JW Jr, Kehle-Forbes S, Nieuwsma JA, Mann-Wrobel MC, et al. (2015) Does This Patient Have Posttraumatic Stress Disorder?: Rational Clinical Examination Systematic Review. JAMA 314: 501–510. [crossref]
- Seigerschmidt E, Mösch E, Siemen M, Förstl H, Bickel H (2002) The clock drawing test and questionable dementia: reliability and validity. Int J Geriatr Psychiatry 17: 1048–1054. [crossref]
- Bagby RM1, Ryder AG, Schuller DR, Marshall MB (2004) The Hamilton Depression Rating Scale: has the gold standard become a lead weight? Am J Psychiatry 161: 2163–2177. [crossref]
- Biggs JT, Wylie LT, Ziegler VE (1978) Validity of the Zung Self-rating Depression Scale. Br J Psychiatry 132: 381–385. [crossref]
- Hicks RM1, Simko JP, Westphalen AC, Nguyen HG, Greene KL, et al. (2018) Diagnostic Accuracy of 68Ga-PSMA-11 PET/MRI Compared with Multiparametric MRI in the Detection of Prostate Cancer. Radiology 289: 730–737. [crossref]
- Henderson TA (2012) The diagnosis and evaluation of dementia and mild cognitive impairment with emphasis on SPECT perfusion neuroimaging. CNS Spectrums 17: 176–206.
- Yeo JM, Waddell B, Khan Z, Pal S (2015) A systematic review and meta-analysis of (18)F-labeled amyloid imaging in Alzheimer’s disease. Alzheimers Dement (Amst) 1: 5–13.
- Rowe CC, Ng S, Ackermann U, Gong SJ, Pike K, et al. (2007) Imaging beta-amyloid burden in aging and dementia. Neurology 68: 1718–1725. [crossref]
- Lee JS, Kim BN, Kang E, Lee DS, et al. (2005) Regional cerebral blood flow in children with attention deficit hyperactivity disorder: comparison before and after methylphenidate treatment. Hum Brain Mapp 24: 157–64.
- Cho SC, Hwang JW, Kim BN, Lee HY, et al. (2007) The relationship between regional cerebral blood flow and response to methylphenidate in children with attention-deficit hyperactivity disorder: comparison between non-responders to methylphenidate and responders. J Psychiatr Res 41: 459–65.
- Pliszka SR, Glahn DC, Semrud-Clikeman M, Franklin C, Perez R 3rd, et al. (2006) Neuroimaging of inhibitory control areas in children with attention deficit hyperactivity disorder who were treatment naive or in long-term treatment. Am J Psychiatry 163: 1052–1060. [crossref]
- Smith AB1, Taylor E, Brammer M, Toone B, Rubia K (2006) Task-specific hypoactivation in prefrontal and temporoparietal brain regions during motor inhibition and task switching in medication-naive children and adolescents with attention deficit hyperactivity disorder. Am J Psychiatry 163: 1044–1051. [crossref]
- Raji CA, Willeumier K, Taylor D, Tarzwell R, et al. (2015) Functional neuroimaging with default mode network regions distinguishes PTSD from TBI in a military veteran population. Brain Imaging Behav 9: 527–34.
- Amen DG, Raji CA, Willeumier K, Taylor D, et al (2015) Functional Neuroimaging Distinguishes Posttraumatic Stress Disorder from Traumatic Brain Injury in Focused and Large Community Datasets. PLoS One 10: 0129659.
- https://www.neurologyadvisor.com/traumatic-brain-injury/advanced-neuroimaging-can-guide-interventions-in-traumatic-brain-injury/article/578028/
- Lew HL (2005) Rehabilitation needs of an increasing population of patients: Traumatic brain injury, polytrauma, and blast-related injuries. J Rehabil Res Dev 42: xiii-xvi. [crossref]
- Taylor BC, Hagel EM, Carlson KF, Cifu DX, et al. (2012) Prevalence and costs of co-occurring traumatic brain injury with and without psychiatric disturbance and pain among Afghanistan and Iraq War Veteran V.A. users. Medical Care 50: 342–346.
- http://www.cbs46.com/story/36965673/untested-vets-thousands-ofthe-potentially-misdiagnosed-fail-to-get-re-tested-for-tbi
- http://www.clintools.com/victims/resources/assessment/ptsd/protected/CAPSIV.pdf
- Reeder, MM, Felson B (1975) Gamuts in Radiology. Cincinnati, OH. Audiovisual Radiology of Cincinnati, Inc. 1975.
- https://www.psychiatryadvisor.com/home/topics/suicide-and-self-harm/veteran-suicides-fuel-widespread-demands-for-answers/