Author Archives: author

Ablative Treatment of Hepatic Recurrence of Lung Cancer Using Electrochemotherapy : A Case Report

DOI: 10.31038/IMCI.2019214

Abstract

Introduction: Electrochemotherapy (ECT) is a locally enhanced chemotherapy that combines the administration of chemotherapeutic drugs with well-dosed electric pulses for cell membrane Electroporation (EP). As opposed to thermal ablation, cell death with ECT is primarily induced using electrical energy: electrical pulses disrupt the cellular membrane integrity, resulting in cell death while sparing the extracellular matrix of sensitive structures such as the bile ducts, blood vessels, and bowel wall. This article reports the successful non-thermal ablation treatment of a hepatic recurrence of lung cancer as an individual treatment in order to achieve loco-regional tumor control.

Case Presentation: 50-year-old Caucasian woman was referred for interventional treatment of the largest of the hepatic metastases of lung cancer (6.0 × 4.8 cm), located in the left hepatic lobe and close to the left suprahepatic vein. Due to the size and the immediate proximity to the left suprahepatic vein the patient could neither undergo ablation treatments (RFA or MWA) neither TACE because of tumor size and the high risk of thermal sinks (“heat-sink effect”) potentially resulting in reduction of complete treatment of the target lesion. Due to its ablation mechanism, electrochemotherapy with use of bleomicin was deemed to be the best therapy option for the patient as loco-regional disease control.

Conclusions: Due to its more selective and non-thermal ablation effect , percutaneous ECT is a novel, potentially very effective treatment option in minimally invasive oncologic treatments, especially for hepatic metastases. We showed in this case report that a large hepatic metastatic lesion adjacent to the left suprahepatic vein can be widely ablated by ECT with ablation of a large infiltrating tissue volume.

Keywords

Electrochemotherapy, Reversible Electroporation, Hepatic Metastases.

Introduction

Electrochemotherapy (ECT) is a locally enhanced chemotherapy that combines the administration of chemotherapeutic drugs with well-dosed electric pulses for cell membrane electroporation (EP) [1].

Tissue electroporation is a novel approach to introduce molecules and genes into the cells of specific areas of the body. It employs the ability of certain electrical fields to reversibly permeabilize the cell membrane in a process known as reversible electroporation [2].

The exposure of biological membranes to a sufficiently high external electric field can lead to a rapid and large increase in electric conductivity and permeability, called membrane EP. While applying an electric field on cell membranes, their surface tension will be destabilized and nonpermanent molecules can diffuse into the cytosol. According to the theory of aqueous pore formation, pores are able to form spontaneously, when the bilayer is exposed to an electrical field (>50 V) [2,3].

Mass transfer can now occur through these channels (pores), which in reversible electroporation persist for a period of a few seconds. Typically, in reversible electroporation, the permeabilization pulses are delivered on a time scale of microseconds, and the pores reseal on a time scale of seconds. Macromolecules in the extracellular space can enter the cells by diffusion during the time the pores are open [4].

When electric pulses are applied to cells, 2 different phenomena are observed: reversible EP and irreversible electroporation (IRE), both used in clinical practice. Reversible EP will increase cell membrane permeability and open an access route for molecules that are too big to cross the cell membrane (DNA, RNA) or facilitates cell enter by hydrophilic molecules (bleomycin [BLM], cisplatin) [5–7]. These molecules once crossed the cell membrane exert their effect in the resealing and intact cells. In contrast, IRE (>600 V/cm) is used as non-thermal form of soft tissue ablation in clinical routine [8]. The IRE of cell membranes leads to a disturbance of the cell homeostasis and thus ultimately to apoptosis in the treated tissue [9–11].

Electrochemotherapy is a promising method to locally treat tumors regardless of its histological type with minimal adverse side effects and a high response rate [12,13].

The efficacy of ECT treatment is well demonstrated for cutaneous and subcutaneous melanomas, and the technique can be applied in a variety of malignant lesions [14,15]. The range of applications can be divided into 3 groups: (1) treatment of cutaneous and subcutaneous metastases located in head or neck, melanoma, non-melanoma skin cancer, or breast cancer metastases to the skin [14, 16–19]; (2) treatment of non-cutaneous metastases located in bone, liver, or Soft Tissue Sarcoma (STS) [20–22]; and (3) clinical trials for the treatment of primary tumors, such as ovary or colon cancer [23,24].

Its applications were described by Neumann et al nearly 3 decades ago when electrical fields were used to temporarily create pores in cell membrane to facilitate gene transfer into mouse lyoma cells [25]. The use of electroporation to increase the permeability of the cell membrane in tissue was introduced by Okino and Mohri in 1987 [26] and by Mir et al in 1991 [27], who described that combining an impermeant anticancer drug with reversibly permeabilizing electrical pulses greatly enhanced the effectiveness of the treatment compared with either therapy alone.

The liver is an organ of particular current research interests in ECT. Besides established ablation modalities like microwave ablation [28] or RFA [29] and IRE [30] there is need for a controlled non-thermal ablation modality that enhances the efficacy of chemotherapeutic agents. The benefit of non-thermal ablation, like IRE, is the ability to treat lesions without thermonecrosis. This enables the ability to ablate near-sensitive structures like vessels and nerves, as no heat will be produced which spread around the treated area. An already established loco-regional method is TACE. During TACE, embolizing agents and chemotherapeutics will be administrated via catheter to obtain tissue-specific necrosis. As both therapy concepts are based on loco-regional application of cytostatic in hepatocellular parenchyma, a similar response rate of ECT by liver lesions can be possible. Similar to TACE, ECT allows for a controlled loco-regional additional chemotherapy without marked systemic side effects. As the chemotherapeutics applied during ECT are membrane impermeant, even better results might be possible [1].

First trials of ECT by hepatic tumors were conducted in animal models. Electrochemotherapy was shown to be effective to reduce the volume of hepatic metastases of colorectal cancer in the rats [31].

Electrochemotherapy of solid organs has been evaluated in phase I and II trials in humans [21, 32]. A significant reduction of viable tumor tissue in ECT-treated metastases was observed. Infarct-like necrosis occurred presumably caused by the cytotoxic and vascular-disrupting effect on tumor cells and small tumor blood vessels [32,33].

Histopathological analysis of colorectal liver metastases after ECT treatment revealed necrotic and fibrotic changes of tumor and normal tissue in the treated area, whereas 3 months later, regeneration was observable. The analysis also revealed that after ECT treatment, most vessels (>5 mm) and biliary structures were preserved [34].

In a small clinical trial, patients received an open approach of ECT for the treatment of unresectable colorectal liver metastases. The obtained response rates 4 weeks after ECT were 55% as complete response and 45% stable disease [35].

A recent study by Gasljevic et al. [34] Demonstrated regressive changes in the whole ECT-treated area of the liver. It confirmed that ECT could be proposed for the therapy of metastases near major blood vessels in the liver to provide a safe approach with good antitumor efficacy.

The successful establishment of ECT as hepatic lesion treatment can offer an additional minimally invasive treatment in the case of malignant lesions with decreased systemic side effects.

This article reports the successful non-thermal ablation treatment of a hepatic recurrence of lung cancer as an individual treatment in order to achieve loco-regional tumor control.

Case Presentation

 A 50-year-old Caucasian woman was referred for treatment of one of the liver metastases of lung cancer. After initial diagnosis of lung cancer with multiple bone metastases and a single hepatic lesion in 2013, a systemic chemiotherapy was performed with subsequent radiotherapy with the initial result of partial tumor remission. The hepatic lesion was treated with microwave ablation and was obtained a great loco-regional tumor control.

Under systemic chemotherapy (denosumab and navelbine), after a partial remission and subsequent disease stability, in 2018 a systemic progression was observed with appearance of peritoneal carcinomatosis, multiple lymphadenopathy, brain metastases and numerical and dimensional increase of bone and hepatic metastases.

The largest of the hepatic lesions was located in the left hepatic lobe and close to the left suprahepatic vein. The tumor size was 6.0 × 4.8 cm in axial section at the abdominal CT scan (Figure 1).

IMCI 19 - 109_Grasso RF_F1

Figure 1. Contrast-enhanced axial CT scan demonstrating the large hepatic metastases (6.0 × 4.8 cm ) located in the left hepatic lobe and close to the left suprahepatic vein prior to ECT procedure. CT indicates computed tomography; ECT indicates electrochemotherapy.

The patient’s case was discussed at the multidisciplinary tumor board for therapy options: due to the size and the immediate proximity to the left suprahepatic vein the patient could neither second ablation treatments (RFA or MWA) nor TACE because of tumor size and the high risk of thermal sinks (“heat-sink effect”) potentially resulting in reduction of complete treatment of the target lesion. Electrochemotherapy with use of bleomicin was deemed to be the best therapy option for the patient as loco-regional disease control.

The concept of ECT is based on the aforementioned properties of reversible EP combined with therapeutic efficacy of chemotherapeutic agents. Due to the increased permeability of the cell membrane, chemotherapeutic agents can pass into cells and induce cell death mitosis in the targeted tissue. Electrodes located around or inside the tumor will deliver defined electric pulses which enables diffusion of otherwise membrane nonpermeant anticancer drug into the target cells [1]. This – in contrast to thermal ablation techniques like Radiofrequency Ablation (RFA) or Microwave Ablation (MWA) – potentially allows tumor cell ablation without concomitant destruction of connective tissue, blood vessels and nerves.

Due to this potentially selective cell ablation technique, ECT was offered as a therapy option because it provided the opportunity of tumor mass reduction and decrease of tumor burden with reduced risk of impairment of surrounding blood vessels. The procedure with risks and benefits was discussed with the patient and informed consent was obtained.

 The patient was put under general anesthesia and neuromuscular blocking to prevent arrhythmia. The procedure was performed using a commercially available RE system. Due to the large tumor volume a total of five needles were placed into the target area (Figure 2). The percutaneous placement of the electrodes was guided by ultrasound using a multifrequency probe (1 to 5MHz). As recommended by the manufacturer and recorded by the RE generator the following parameters were used: number of electrodes: five; type of electrodes: monopolar; distance of electrodes: 0.5m (minimum), 1.5cm (maximum); impulses per electrode: 80; voltage: 500V (minimum), 3000V (maximum); maximum deliverable current: 50A. An intravenous administration of an anticancer drug (BLM) was done so it could evenly distribute over the vascular system and extracellular space of the tissue. After that, electrodes located around or inside generated the electric pulses for a time of 8 minutes with consequent diffusion of otherwise membrane nonpermeant anticancer drug into the target cells. After a short time, a few seconds to several minutes after exposure to the electric field, the membrane permeability would return to its initial state and the specific chemotherapeutics would cause multiple DNA breaks (BLM) in the abnormal tumor cells. A stepwise ablation procedure with replacement of two electrodes at the level of the caudal portion of the lesion was performed.

IMCI 19 - 109_Grasso RF_F2

Figure 2. Percutaneous placement of five electrode needles for hepatic lesion treatment.

During the electrochemotherapy the patient did not have any cardiovascular events, in particular no supraventricular tachycardia and no atrial fibrillation. Complications, especially post-interventional bleeding, were not observed.

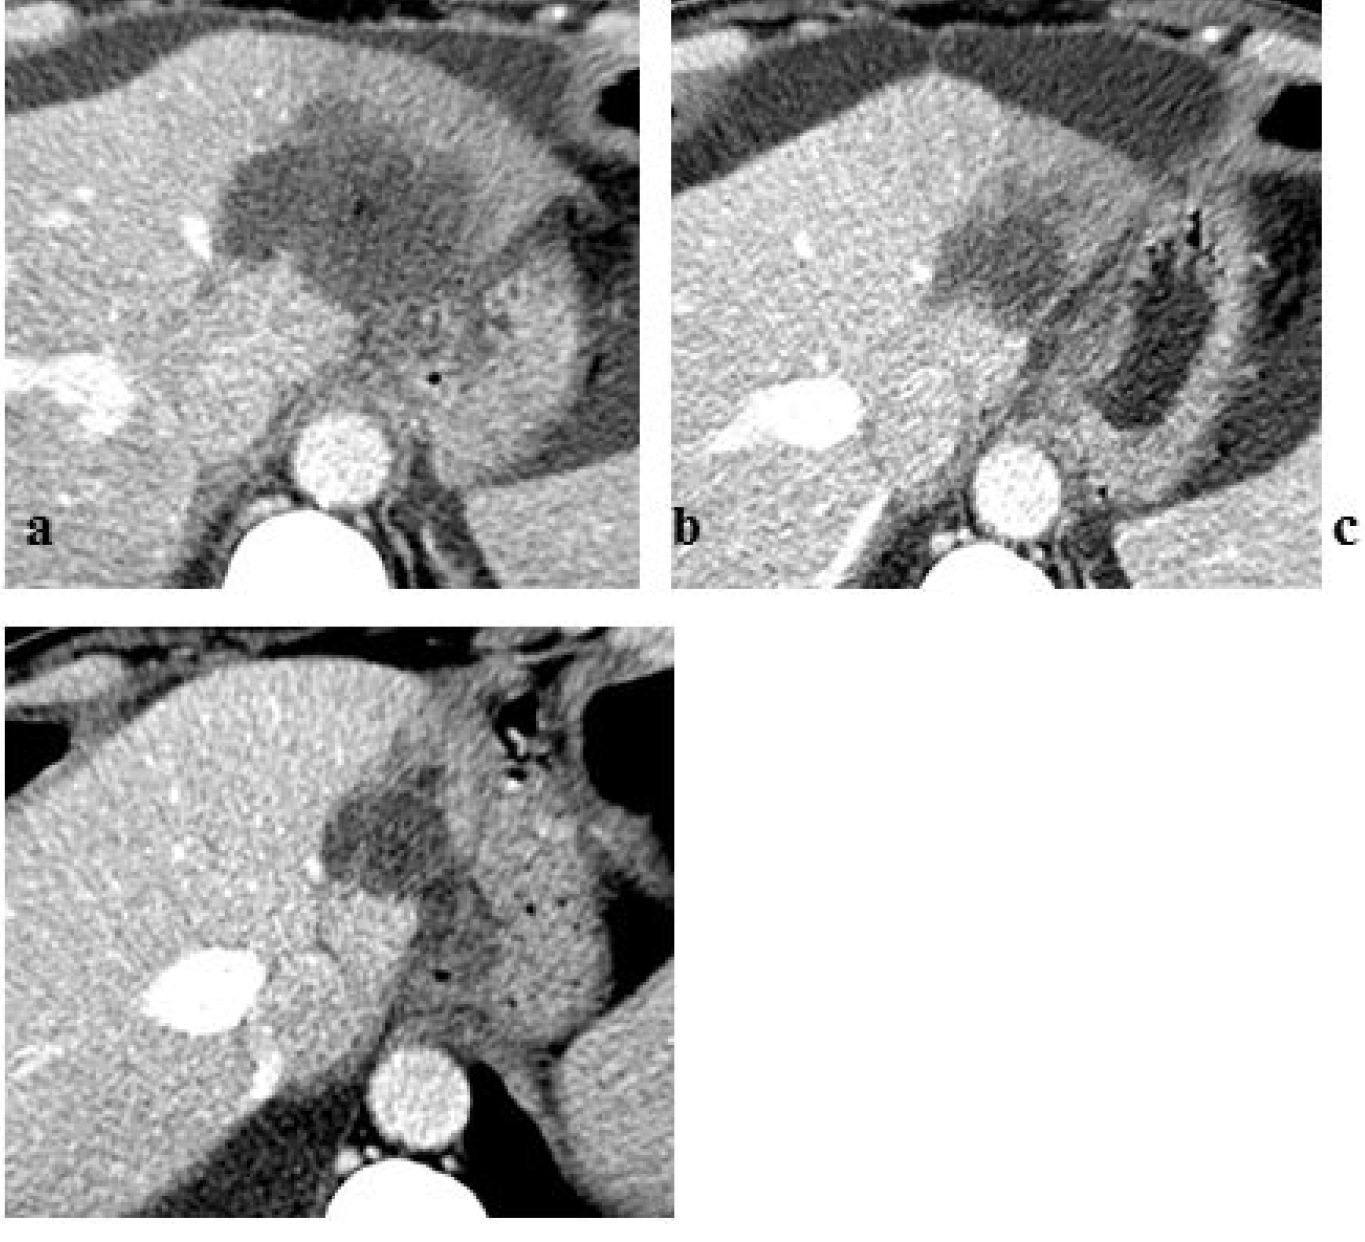
Follow-up imaging, after one week, showed good response to the treatment of the hepatic lesion in absence of remaining viable tumor tissue. Contrast-enhanced CT scan at 3 and 6 months after electrochemotherapy procedure showed a complete necrosis of the tumor and reduction of tumor volume (Figure 3).

IMCI 19 - 109_Grasso RF_F3

Figure 3. Follow-up imaging post-ECT procedure: contrast-enhanced axial CT scan (a) at one week demonstrating no residual or recurrent tumor; (b) at 3 and (c) 6 months showing a complete necrosis of the tumor and reduction of tumor volume. CT indicates computed tomography; ECT indicates electro chemotherapy.

Discussion

The majority of patients who are diagnosed with liver malignancies are not eligible for resection or transplantation due to inadequate functional liver function, multifocal or advanced disease, prohibitive tumor location or the presence of medical co-morbidities. In some highly selective scenarios resection appears to remain superior in terms of disease recurrence rates and overall and disease-free survival. For curative intentions in term of local tumor control there are reports of equivalent results following local-regional ablation treatments when compared to resection in selected patients [36–38].

Image-guided tumor ablation techniques have significantly broadened the treatment possibilities for primary and secondary hepatic malignancies. A tumor resection leads to immediate absence of tumor tissue, in contrast (thermo)ablative procedures will induce necrotic damages whereas chemoablative procedures induce cell apoptosis [1].

 Monopolar RFA is an established technique for the treatment of tumors that are limited in number (3 or less) and size (3 cm or less) and are located 1 cm or more from critical structures and vessels. MWA appears to have the potential to improve the rate of complete ablation achieved with RFA in tumors that are larger than 3 cm or when multiple and seems to have the potential to overcome the limitations of RFA in the treatment of tumors in perivascular locations [39].

 A new ablation technique, Reversible Electroporation (RE) with use of chemiotherapy (as BLM), is recently added to the treatment armamentarium. As opposed to thermal ablation, cell death with ECT is primarily induced using electrical energy: electrical pulses disrupt the cellular membrane integrity, resulting in cell death while sparing the extracellular matrix of sensitive structures such as the bile ducts, blood vessels, and bowel wall. The preservation of these structures makes electrochemotherapy attractive for liver metastases that are unsuitable for resection and thermal ablation owing to their anatomical location. In contrast to chemoembolization techniques, ECT relies on membrane non-permeant chemotherapeutics, which need EP for cell uptake. Improvements need to be done to achieve homogeneous EP in the treated area, as well as steady concentrations of cytostatic drug in big lesions [1].

The establishment and expansion of ECT in deep-seated tumors (eg, liver, bone metastases) will open up new opportunities for minimally invasive treatment of metastases and carcinomas. Even if only few experiences have been published for colorectal liver metastases treated by ECT, considering the proven safety and the promising results, this treatment option deserves further attention. ECT can induce tumor volume shrinkage, suggesting an implementation in clinical routine as neoadjuvant treatment to enhance future tumor resection. In most cases, it is used in treatment of advanced neoplastic lesions in which radical surgical treatment is not possible (eg, due to lesion location, size, and/or number) [1].

Even though percutaneous ablation techniques are used as possibly curative therapies, palliative tumor ablation can be useful to achieve loco-regional control of tumor growth, pain relief or pain control, especially in patients with unresectable tumor manifestations [40]. Indeed, electrochemotherapy is usually applied in palliative settings for patients with unresectable tumors, resulting in amelioration of quality of life.

Electrochemotherapy allows treating tumor nodules in the proximity of important structures like vessels and nerves and the safety profile of ECT is favorable. Due to heat dissipation to adjacent structures there is an inherent risk of thermal damage of adjacent organs, blood vessels and nerves. Thus, lesions close to adjacent structures with high risk of unintended heat destruction still pose a challenge for percutaneous thermal ablation techniques [41]. In particular, ECT – in contrast to thermal ablation – would allow tumor cell ablation without concomitant destruction of connective tissue, blood vessels and nerves, which means ablation of tumor cells in those areas where thermal ablation was not possible before. In the proximity of larger blood vessels thermal ablation techniques are also hindered by the heat-sink effect. Due to its cooling effect blood flow is an important determinant as much as a limiting factor of thermal ablation techniques [42,43]. ECT seems to be unaffected by the blood flow and conversely does not potentially affect the macro vascularization of the ablation zone.

Most of the observed adverse events are local and transient, including moderate local pain, erythema, edema, and muscle contractions during ECT. No serious adverse events or deaths related to ECT have been reported. Limitations of ECT are the need for interventional individual electric pulse generating systems, individual electrode needles, and complex preinterventional planning. As the success of difficult interventions in deep-seated tumors will rely on accurate needle placement, robotic navigated systems as well as image guidance improve successful ECT treatment and minimize reintervention [1].

Conclusion

Percutaneous ECT of solid organs is a novel, potentially very effective treatment option in minimally invasive oncologic treatments, especially for hepatic metastases.

Due to its more selective and non-thermal ablation effect ECT widens the field of minimally invasive treatable lesions. We showed in this case report that a large hepatic metastatic lesion adjacent to the left suprahepatic vein can be widely ablated by ECT with ablation of a large infiltrating tissue volume.

References

  1. Probst U, Fuhrmann I, Beyer L et al (2018) Electrochemotherapy as a New Modality in Interventional Oncology: A Review. Technol Cancer Res Treat 17:1533033818785329.
  2. Weaver J, Chizmadzhev Y (1996) Theory of electroporation: a review. Bioelectrochem Bioenerg 41: 135–160.
  3. Pliquett U, Langer R, Weaver J (1995) Changes in the passive electrical properties of human stratum corneum due to electroporation. Biochim Biophys Acta 1239: 111–121.
  4. Yair Granot and Boris Rubinsky (2008) Mass Transfer Model for Drug Delivery in Tissue Cells with Reversible Electroporation. Int J Heat Mass Transf 51: 5610–5616.
  5. Belehradek M, Domenge C, Luboinski B, et al. (1993) Electrochemotherapy, a new antitumor treatment. First clinical phase I–II trial. Cancer 72: 3694–3700.
  6. Calvet C, Andre F, Mir L. (2014) Dual therapeutic benefit of electroporation-mediated DNA vaccination in vivo. Oncoimmunology 3: 28540.
  7. Ivanov MA, Lamrihi B, Szyf M, et al. (2003) Enhanced antitumor activity of a combination of MBD2-antisense electrotransfer gene therapy and bleomycin electrochemotherapy. J Gene Med 5: 893–899.
  8. Onik G, Mikus P, Rubinsky B (2007) Irreversible electroporation: implications for prostate ablation. Technol Cancer Res Treat 6: 295–300.
  9. Miller L, Leor J, Rubinsky B (2005) Cancer cells ablation with irreversible electroporation. Technol Cancer Res Treat 4: 699–705.
  10. Wiggermann P, Bruenn K, Baeumler W (2017) Irreversible electroporation (IRE): a minimally invasive therapeutic option in prostate cancer [in German]. Radiologe 57: 637–640.
  11. Niessen C, Thumann S, Beyer L, et al. (2017) Percutaneous irreversible electroporation: long-term survival analysis of 71 patients with inoperable malignant hepatic tumors. Sci Rep 7: 43687.
  12. Jaroszeski MJ, Gilbert R, Nicolau C, et al. (1999) In vivo gene delivery by electroporation. Advanced Drug Delivery Reviews 35: 131–137.
  13. Dev SB, Rabussay DP, Widera G, et al. (2000) Medical Applications of Electroporation. IEEE Transactions on Plasma Science 28: 206–223.
  14. Marty M, Sersa G, Garbay J, et al. (2006) Electrochemotherapy—an easy, highly effective and safe treatment of cutaneous and subcutaneous metastases: results of ESOPE (European Standard Operating Procedures of Electrochemotherapy) study. EJC Suppl 4: 3–13.
  15. Mali B, Jarm T, Snoj M, et al. (2013) Antitumor effectiveness of electrochemotherapy: a systematic review and metaanalysis. Eur J Surg Oncol 39: 4–16.
  16. Quaglino P, Mortera C, Osella-Abate S, et al. (2008) Electrochemotherapy with intravenous bleomycin in the local treatment of skin melanoma metastases. Ann Surg Oncol 15: 2215–2222.
  17. Eggermont A (1996) Treatment of melanoma in-transit metastases confined to the limb. Cancer Surv 26: 335–349.
  18. Sersa G, Cufer T, Cemazar M, et al. (2000) Electrochemotherapy with bleomycin in the treatment of hypernephroma metastasis: case report and literature review. Tumori 86: 163–165.
  19. Campana L, Mocellin S, Basso M, et al ( 2009) Bleomycin-based electrochemotherapy: clinical outcome from a single institution’s experience with 52 patients. Ann Surg Oncol 16: 191–199.
  20. Fini M, Salamanna F, Parrilli A, et al. (2013) Electrochemotherapy is effective in the treatment of rat bone metastases. Clin Exp Metas 30: 1033–1045.
  21. Edhemovic I, Gadzijev E, Brecelj E, et al. (2011) Electrochemotherapy: a new technological approach in treatment of metastases in the liver. Technol Cancer Res Treat 10: 475–485.
  22. Linnert M, Iversen H, Gehl J (2012) Multiple brain metastases—current management and perspectives for treatment with electrochemotherapy. Radiol Oncol 46: 271–278.
  23. Perrone A, Cima S, Pozzati F, et al. (2015) Palliative electrochemotherapy in elderly patients with vulvar cancer: a phase II trial. J Surg Oncol 112: 529–532.
  24. Pellegrino A, Damiani G, Mangioni C, et al. (2016) Outcomes of bleomycin-based electrochemotherapy in patients with repeated loco-regional recurrences of vulvar cancer. Acta Oncol 55: 619–624.
  25. Neumann E, Schaefer-Ridder M, Wang Y, et al. (1982) Gene transfer into mouse lyoma cells by electroporation in high electric fields. EMBO J 1:841–845
  26. Okino M, Mohri H (1987) Effects of a high-voltage electrical impulse and an anticancer drug on in vivo growing tumors. Jpn J Cancer Res 78: 1319–1321
  27. Mir LM, Orlowski S, Belehradek J Jr, et al. (1991) Electrochemotherapy potentiation of antitumour effect of bleomycin by local electric pulses. Eur J Cancer 27: 68–72.
  28. Simon C, Dupuy D, Mayo-Smith W (2005) Microwave ablation: principles and applications. Radiographics 25: 69–83.
  29. Gazelle G, Goldberg S, Solbiati L, et al. (2000) Tumor ablation with radio-frequency energy. Radiology 217: 633–646.
  30. Rubinsky B, Onik G, Mikus P (2007) Irreversible electroporation: a new ablation modality—clinical implications. Technol Cancer Res Treat 6: 37–48.
  31. Chazal M, Benchimol D, Baque P, et al. (1998) Treatment of hepatic metastases of colorectal cancer by electrochemotherapy: an experimental study in the rat. Surgery 124: 536–540.
  32. Edhemovic I, Brecelj E, Gasljevic G, et al. (2014) Intraoperative electrochemotherapy of colorectal liver metastases. J Surg Oncol 110: 320–327
  33. Sersa G, Jarm T, Kotnik T, et al. (2008) Vascular disrupting action of electroporation and electrochemotherapy with bleomycin in murine sarcoma. Br J Cancer 98: 388–398.
  34. Gasljevic G, Edhemovic I, Cemazar M, et al. (2017) Histopathological findings in colorectal liver metastases after electrochemotherapy. PLos One 12: 0180709.
  35. Coletti L, Battaglia V, De Simone P, et al. (2017) Safety and feasibility of electrochemotherapy in patients with unresectable colorectal liver metastases: a pilot study. Int J Surg 44: 26–32.
  36. American Association for the Study of Liver Diseases – Practice Guidelines.
  37. Diaz-Nieto R, Fenwick S, Malik H, et al. (2017) Defining the Optimal Use of Ablation for Metastatic Colorectal Cancer to the Liver Without High-Level Evidence. Curr Treat Options Oncol 18: 8.
  38. Alice Gillams, Nahum Goldberg, Muneeb Ahmed, et al. (2015) Thermal ablation of colorectal liver metastases: a position paper by an international panel of ablation experts, the interventional oncology sans frontières meeting 2013. Eur Radiol 25: 3438–3454.
  39. Riccardo Lencioni, Thierry de Baere, Robert C. Martin, et al. (2015) Image-Guided Ablation of Malignant Liver Tumors: Recommendations for Clinical Validation of Novel Thermal and Non-Thermal Technologies – A Western Perspective Liver Cancer. 4: 208–214.
  40. Mylona S, Karagiannis G, Patsoura S, et al. (2012) Palliative treatment of rectal carcinoma recurrence using radiofrequency ablation. Cardiovasc Intervent Radiol 35: 875–882.
  41. Christoph Niessen, Ernst-Michael Jung, Andreas G Schreyer, et al. (2013) Palliative treatment of presacral recurrence of endometrial cancer using irreversible electroporation: a case report. Journal of Medical Case Reports 7:128
  42. Patterson EJ, Scudamore CH, Owen DA, et al. (1998) Radiofrequency ablation of porcine liver in vivo: effects of blood flow and treatment time on lesion size. Ann Surg 227: 559–565.
  43. Charpentier KP (2012) Irreversible electroporation for the ablation of liver tumors: are we there yet? Arch Surg – Chicago 147: 1053–1061.

Sequential Changes in Activity of Hip Abductor Muscles after Side-lying Hip Abduction Exercise with Different Directions using Muscle Functional Magnetic Resonance Imaging

DOI: 10.31038/IJOT.2019231

Abstract

Study Design: Controlled laboratory cross-sectional study.

Background: Hip abductor muscle weakness is associated with various lower extremity injuries. Side-lying hip abduction exercises to strengthen the hip abductor muscles is frequently used in rehabilitation and injury prevention programs without scientific evidence regarding their ability to activate the targeted muscles. In addition, previous studies have not quantified the activity of hip abductor muscles during side-lying hip abduction exercises in different directions.

Objectives: To measure the T2 values of hip abductor muscles during side-lying hip abduction exercises in different directions using magnetic resonance imaging and to clarify variations in the activity of each segment of the gluteus medius, upper fiber of the gluteus maximus, gluteus minimus, and tensor fasciae latae.

Methods: The T2 values measured using magnetic resonance imaging were used to quantify the activity level of the hip abductor muscles in 10 healthy young males during side-lying hip abduction with different directions (neutral hip, internal rotation and flexion, external rotation, and extension). The two-way repeated measures analysis of variance analysis was used to determine differences between the groups over time.

Results: The T2 values of all muscles, excluding the upper fiber of the gluteus maximus, significantly increased after exercise with all motor tasks over time. The anterior segment of the gluteus medius was significantly increased with side-lying abduction with internal rotation and flexion compared to that with side-lying abduction with external rotation and extension. In contrast, the posterior segments of the gluteus medius and upper fiber of the gluteus maximus were significantly increased with side-lying abduction with external rotation and extension compared to that during other tasks.

Conclusions: The results suggest that side-lying hip abduction exercise with different directions influences the difference in muscle activity between hip abductor muscles and reflects differences in the function of the hip abductor muscles.

Keywords

Hip Abductor Muscles, Transverse Relaxation Times, Muscle Activity, Side-Lying Hip Abduction, Magnetic Resonance Imaging

Introduction

The hip abductor muscles play an important role in maintaining normal movement patterns of the pelvis and lower extremities. They are considered one of the primary stabilizers in the pelvic region [1]. These muscles build a powerful triangular ensemble spanning between the anterior superior iliac spine, the posterior superior iliac spine, and the greater trochanter region of the femur [2]. Hip abductor muscle weakness has been associated with several lower extremity injuries, including patellofemoral pain syndrome [3–6], iliotibial band friction syndrome [7], anterior cruciate ligament sprains [8–10], and chronic ankle instability [11]. Weakness of the gluteus medius and maximus may contribute to lower extremity injury by influencing joint-loading patterns and lower extremity control [4,12,13]. As the hip abductor muscles resist possible injurious motions, such as dynamic knee valgus resulting from excessive hip adduction and internal rotation, improvement of hip abductor muscle strength and activation may be a critical aspect of rehabilitation and injury prevention programs [14].

Although hip abductor muscles at the anatomic site have not been defined completely, several studies have reported that the varying anatomic structures of the hip abductor muscle fibers translate to differences in function [7,15–20]. Many reports about rehabilitation programs for the hip abductor muscles based on the presence of the functional subdivisions are available.

Electromyography (EMG) is one of the most reliable ways to evaluate skeletal muscle activity. Recent studies have sought to determine which exercises are the best to activate the hip abductor muscles, consisting of the Gluteus Medius (GMED), Gluteus Minimus (GMIN), Tensor Fasciae Latae (TFL), and Gluteus Maximus [21–28]. Distefano et al. reported that gluteus medius activity is significantly greater during side-lying hip abduction compared with that during other exercises such as clam exercises, lunges, and hop exercises [29]. Side-lying abduction exercise is frequently used clinically in rehabilitation sessions because it can be performed early in a rehabilitation program to generate proper neuromuscular control and strength since it is less demanding than an open kinematic chain exercise [29]. While EMG is a valuable instrument, significant limitations also exist in its use as an indicator of muscle function. EMG recorded from surface electrodes may be contaminated by crosstalk from the surrounding muscles [30, 31]. EMG signal detected using fine-wire electrodes is specific to the target/sampled muscle, and the normalized intramuscular signal is representative of the entire muscles [32]. However, this method for measuring muscle activation is invasive.

Muscle Functional Magnetic Resonance Imaging (mfMRI) can quantify all muscle activities within the imaging range by exploiting the process by which exercise induces signal changes that result primarily from increases in the transverse relaxation time (T2) of water in the tissues. T2 changes measured with mfMRI have high validity[33, 34] and reliability.[35, 36] Therefore, because the prolongation in T2 relaxation time could easily be used as a noninvasive, quantitative measurement for muscle activity of the deep muscles, this technique is an excellent tool for assessing the extent of muscle activation following the performance of a task [37].

Kumagai et al [38] investigated the activity of the GMIN and that of the deep and superficial layers of the GMED. They demonstrated using the T2 values that the activity levels of these differing portions of the abductor muscles are influenced by the degree of hip abduction angle during isometric hip abduction exercise. Recently, Mitomo et al. reported that side-lying hip abduction exercise immediately increases the rate change in the T2 value of the TFL, GMIN, and the anterior and middle segments of the GMED but delays the activation of the upper fiber of the Gluteus Maximus (UGM) and posterior segment of the GMED [39]. These reports demonstrated that the activity levels of the muscles with hip abduction action were not homogeneous, and a functional difference existed between the hip abductor muscles. However, the exact role of functional subdivisions of hip abductor muscle remains poorly understood. Isotonic exercise strengthens the muscle involved in joint movement and can be effective in strengthening muscles at various angles, which are often used in clinical practice. Although many studies on changes in hip abductor activity during isometric side-lying hip abduction exercise have been reported, there has been no study on the muscle activity of the hip abductor during isotonic side-lying hip abduction exercise in different directions using the T2 values. Therefore, this study aimed to measure the T2 values of the hip abductor muscles after side-lying hip abduction exercise with different directions over time and to clarify variations in the activity of the hip abductor muscles.

Methods & Materials

Subjects

Ten young healthy males with a mean age of 26.1 (range 24−32) years, a mean (SD) height of 1.72 (0.04) m, and a mean weight of 63.3 (8.1) kg participated in the study. Subjects were excluded if they reported any musculoskeletal disorders of the trunk or lower extremities or any neurological conditions. Written informed consent was obtained from all subjects after the aims of the study and its protocol had been explained to them in detail. The study protocol was reviewed and approved by the Ethics Committee of Tokyo Metropolitan University.

Acquisition of Magnetic Resonance Images

A 3.0-T MRI system (Achieva 3.0T; Philips, Tokyo, Japan) was used for all patients. T2 mapping was performed in addition to routine T2-weighted imaging. T2 measurement with single-slice acquisition was performed on the upper part of the acetabulum using a turbo spin echo sequence. The turbo spin echo scanning parameters were as follows: 6 echo times of 13–78 ms; repetition time, 4200 ms; field of view, 350 × 350 mm; matrix size, 269 × 269; slice thickness, 5.0 mm; and number of slices, 7.

T2 Measurement

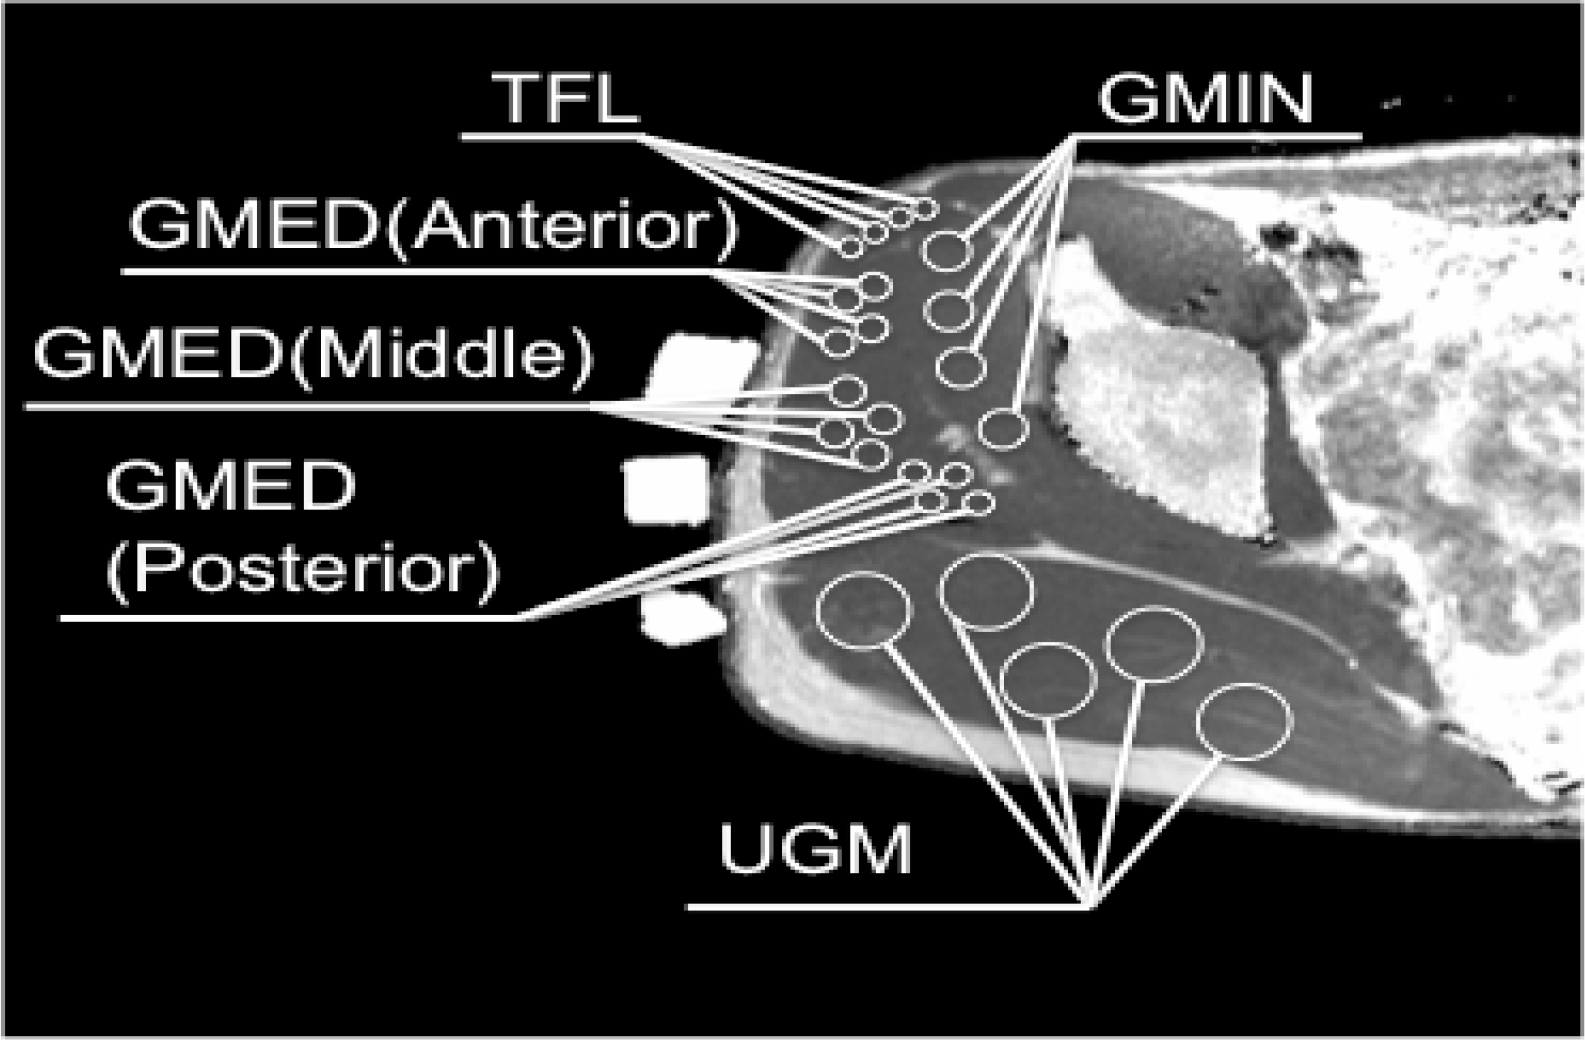
The images were processed using a DICOM viewer (OsiriX Lite, Pixmeo Sàrl, Geneva, Switzerland) to determine the relaxation times. A water capsule was placed along each segment of the GMED to distinguish each type of fiber. The T2 values were measured for the TFL; GMIN; anterior, middle, and posterior segments of the GMED; and UGM. Four regions of interest (ROIs), each located in the TFL and GMIN and anterior, middle, and posterior segments of the GMED, were determined to investigate the changes in signal intensity. For the UGM, five ROIs were identified to assess the changes in signal intensity. The ROIs were manually selected using a computer mouse, after which the mean of the T2 values between the pixels of the ROI was automatically calculated using the OsiriX Lite software
(Figure 1). Care was taken to exclude subcutaneous and intramuscular fat, aponeuroses, and vessels from the selected regions. The T2 values for each muscle were taken as the mean value of T2 for the selected ROIs, and the workload for each muscle was expressed as a T2 value in milliseconds.

IJOT 19 - 107_Mitomo S_F1

Figure 1. T2 measurement of hip abductor muscles on T2 calculated map. GMED, gluteus medius; GMIN, gluteus minimus; TFL, tensor fascia latae; UGM, upper fiber of the gluteus maximus.

Exercise Protocol

The subjects performed 5 sets of 40 repetitions of a hip abduction exercise at 30% maximum voluntary contraction with the right leg during each task. Isometric maximum voluntary contraction of each task was measured, from which we calculated the 30% maximum voluntary contraction of each task. The pelvis was fixed with a belt to avoid compensatory movements as much as possible. MRI scans were performed before exercise, at intervals during exercise, and at the end of the exercise. The exercise was performed inside the magnet bore of the MRI scanner, and the subjects were then immediately moved into the magnet for imaging.

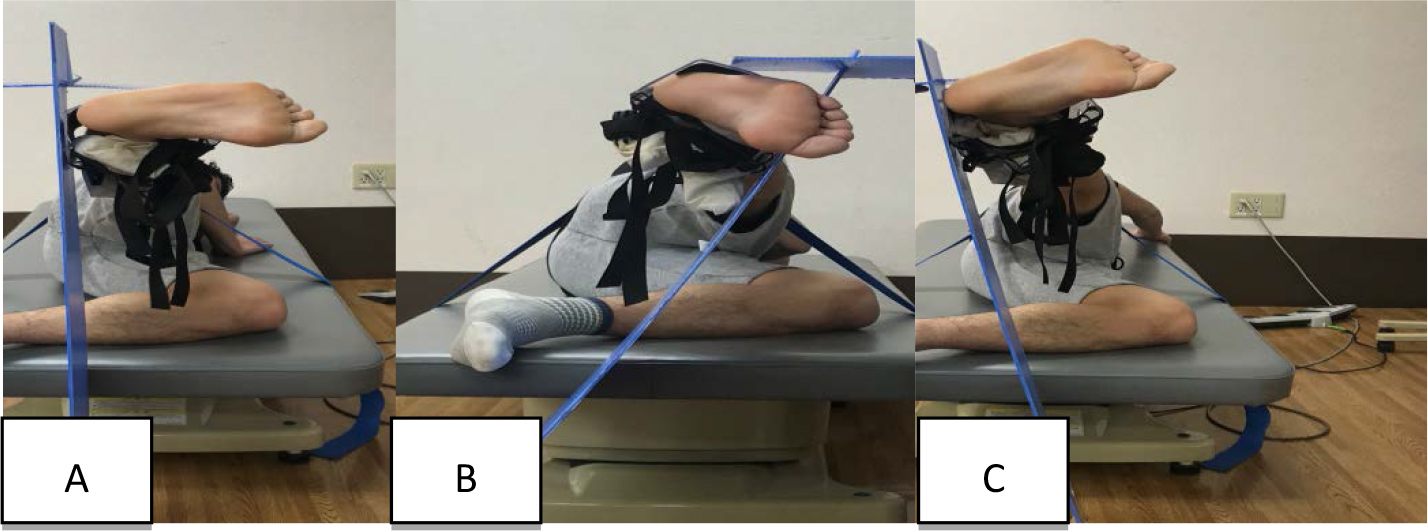
Task 1: Side-lying hip abduction with neutral hip (Figure 2A)

IJOT 19 - 107_Mitomo S_F2

Figure 2. Subject performing the exercise task.

A: Side-lying hip abduction with neutral hip.

B: Side-lying hip abduction with internal rotation and flexion.

C: Side-lying hip abduction with external rotation and extension.

Subjects lay on their sides with the upper trunk and pelvis aligned in a straight line on the treatment table. The bottom side of the hip joint was flexed at 45°, and the knee joints were flexed at 90° for stabilization. A plastic target bar was placed at 20° of the hip abduction range of motion. The movement direction was indicated using a plastic plate, which was placed vertical to the floor. The subjects abducted the hip joint along the plate. In each subject, the hip was abducted 20° over 1 s and then returned to its initial position over 1 s. No rest periods were allowed during exercise. The subjects were cued to point their toes forward by abduction from the hip as much as they could without rotating their pelvis forward or backward.

Task 2: Side-lying hip abduction with internal rotation and flexion (Figure 2B)

Subjects performed this task in the same manner as in side-lying abduction with neutral hip, excluding the hip internal rotation and flexion. The movement direction was indicated using a plastic plate. The plastic plate was placed to tilt 30° forward from the vertical plane on the floor. Subjects performed side-lying hip abduction exercise up to abduction 20° in a forward direction of 30° with internal rotation along the plate to avoid pressing the plate as much as possible. The subjects were cued to point their toes toward the floor by rotating from the hip as much as they could, without rotating their pelvis forward or backward.

Task 3: Side-lying hip abduction with external rotation and extension (Figure 2C)

Subjects performed this task in the same manner as in side-lying abduction with neutral hip, excluding the hip external rotation and flexion. The movement direction was indicated using a plastic plate. The plastic plate was placed to tilt 10° backward from the vertical plane on the floor. The subjects performed side-lying hip abduction exercise up to 20° abduction in a backward direction of 10° with external rotation along the plate to avoid pressing the plate as much as possible. The subjects were cued to point their toes toward the ceiling by rotating from the hip as much as they could, without rotating their pelvis forward or backward.

Statistical Analysis

For each muscle, we used the two-way repeated measures analysis of variance (ANOVA) with the main effect being task (task 1, task 2, and task 3) and exercise set (pre-exercise, 1, 2, 3, 4, and 5 sets). All data were analyzed at an alpha level of .05. Significant differences from the ANOVA were further examined using Bonferroni post hoc analysis, with the alpha level corrected for multiple comparisons of less than .05. All statistical analyses were performed using SPSS version 22 (IBM Corporation, Armonk, NY), and outcome data were presented as mean (range) or mean (SD).

Results

No significant exercise task-by-exercise set interactions were found for the T2 values of the TFL, GMIN, and middle segment of the GMED (Table 1). However, there were main effects in these muscles for the exercise set (Table 1). Bonferroni post hoc analysis comparing the exercise set revealed that the T2 values of these muscles had a significant increase after exercise (Table 2, 3, 5).

Table 1. Two-way repeated measures analysis of variance for comparisons between the exercise task and exercise set.

TFL

GMIN

GMED (anterior)

GMED (middle)

GMED (posterior)

UGM

F values

P values

F values

P values

F values

P values

F values

P values

F values

P values

F values

P values

Task

0.731

0.495

1.127

0.346

3.624

0.048

2.386

0.120

15.074

0.000

7.650

0.000

Exercise set

27.678

0.000

118.849

0.000

92.689

0.000

44.310

0.000

38.312

0.000

9.465

.0.002

Task×exercise set

0.671

0.749

0.606

0.805

2.031

0.039

0.735

0.690

4.228

0.000

2.972

0.003

TFL, tensor fasciae latae; GMIN, gluteus minimus; GMED, gluteus medius; UGM, upper fiber of the gluteus maximus

Table 2. Comparison of the T2 values of the TFL (mean (SD), ms) according to exercise task and exercise set

Pre-exercise

1 set

2 sets

3 sets

4 sets

5 sets

Multiple comparisons

(exercise set)

Task 1

31.8 (0.8)

35.3 (2.4)

36.7 (3.0)

38.8 (3.1)

38.9 (3.0)

39.1 (2.9)

Pre-exercise<1, 2, 3, 4, 5 sets*

1 set<3, 4, 5 sets

2 sets<3, 4, 5 sets

Task 2

32.1 (0.9)

36.2 (3.8)

37.5 (4.7)

39.0 (5.5)

38.9 (5.1)

38.6 (4.7)

Task 3

32.0 (1.3)

36.8 (3.5)

38.3 (4.4)

39.2 (5.1)

39.6 (4.6)

39.6 (4.0)

Multiple comparisons (exercise set): the result of comparing the T2 values of each exercise set during all exercise tasks using Bonferroni post hoc analysis.
*p=0.017, 0.019, 0.008, 0.004, 0.003, respectively; p=0.013, 0.006, 0.001, respectively; p=0.001, 0.006, 0.002, respectively

Table 3. Comparison of the T2 values of the GMIN (mean (SD), ms) according to exercise task and exercise set

Pre-exercise

1 set

2 sets

3 sets

4 sets

5 sets

Multiple comparisons (exercise set)

Task 1

35.2 (1.6)

40.2 (1.6)

41.4 (1.5)

42.7 (2.2)

41.7 (1.6)

40.6 (1.3)

Pre-exercise<1, 2, 3, 4, 5 sets*
1 set<2, 3 sets

4 sets>5 sets

Task 2

35.5 (1.6)

41.0 (2.0)

42.4 (2.1)

42.7 (2.0)

42.5 (2.4)

41.1 (2.4)

Task 3

35.3 (1.3)

41.1 (1.7)

41.5 (2.6)

41.9 (1.7)

41.8 (1.2)

41.1 (1.4)

Multiple comparisons (exercise set): the result of comparing the T2 values of each exercise set during all exercise tasks using Bonferroni post hoc analysis
*p=0.000, for all sets; p=0.009, 0.001, respectively; p=0.001

Table 4. Comparison of the T2 values of the anterior segment of the GMED (mean (SD), ms) according to exercise task and exercise set

Pre-exercise

1 set

2 sets

3 sets

4 sets

5 sets

Multiple comparison

(exercise set)

Task 1

34.7 (1.1)

39.8 (2.1)

40.4 (2.3)

40.7 (2.0)

40.2 (1.8)

40.1 (1.9)

Pre-exercise<1, 2, 3, 4, 5 sets*

Task 2

35.0 (1.5)

39.8 (2.2)

41.6 (2.8)

42.2 (3.3)

41.7 (2.7)

40.9 (3.0)

Pre-exercise<1, 2, 3, 4, 5 sets

1 set < 2 set

Task 3

34.6 (1.1)

39.5 (2.6)

39.9 (3.2)

40.0 (2.6)

39.8(2.0)

39.1 (2.0)

Pre-exercise<1, 2, 3, 4, 5 sets§

Multiple comparisons

(exercise task)

n.s.

n.s.

n.s.

n.s.

Task 2> Task 3**

Tasks 2 > Task 3††

Multiple comparisons (exercise set): the result of comparing the T2 values of each exercise set at each exercise task using Bonferroni post hoc analysis.
Multiple comparisons (exercise task): the result of comparing the T2 values of each exercise task at each exercise set using Bonferroni post hoc analysis
*p=0.000, for all sets; p=0.000, for all sets; p=0.000; §p=0.001, 0.003, 0.000, 0.000, 0.000, respectively; **p=0.046; ††p=0.041

Table 5. Comparison of the T2 values of the middle segment of the GMED (mean (SD), ms) according to exercise task and exercise set.

Pre-exercise

1 set

2 sets

3 sets

4 sets

5 sets

Multiple comparisons (exercise set)

Task 1

35.0 (1.4)

38.6(2.7)

39.0 (2.0)

40.0 (2.1)

39.6 (2.0)

39.7 (2.0)

Pre-exercise<1, 2, 3, 4, 5 sets*

Task 2

35.8 (1.7)

39.0 (1.7)

40.1 (3.1)

40.7 (4.0)

40.8 (3.3)

40.3 (3.5)

Task 3

34.8 (1.7)

38.7 (3.3)

38.6 (2.9)

39.0 (2.7)

38.9 (2.2)

39.2 (2.1)

Multiple comparisons (exercise set): the result of comparing the T2 values of each exercise set during all exercise tasks using Bonferroni post hoc analysis
* p=0.000, for all sets

In contrast, a significant exercise task-by-exercise set interaction was found for the T2 values of the anterior and posterior segments of the GMED and UGM (Table 1).

For the anterior segment of the GMED, Bonferroni post hoc analysis comparing each exercise task revealed that the T2 values at task 2 was significantly increased compared with task 3 at 4 and 5 sets (Table 4). In addition, the T2 values of all tasks were significantly increased after exercise.

For the posterior segment of the GMED, Bonferroni post hoc analysis comparing each task revealed that task 3 was significantly higher than task 1 after all exercise sets, and was significantly higher than task 2 after 2, 3, 4, and 5 sets (Table 6). In addition, the T2 values of all tasks were significantly increased after exercise (Table 6).

Table 6. Comparison of the T2 values of the posterior segment of the GMED (mean (SD), ms) according to exercise task and exercise set.

Pre-exercise

1 set

2 sets

3 sets

4 sets

5 sets

Multiple comparisons (exercise set)

Task 1

34.8 (1.4)

36.6 (2.1)

37.1 (1.8)

37.1 (1.8)

37.2 (2.1)

37.1 (1.6)

Pre-exercise<3, 4, 5 sets*

Task 2

35.5 (2.1)

36.7 (1.5)

37.1 (1.5)

37.1 (1.5)

37.5 (1.0)

37.6 (1.9)

Pre-exercise<4 set

Task 3

35.1 (1.4)

38.1 (1.5)

38.9 (1.1)

39.3 (1.3)

39.7 (1.7)

40.2 (1.3)

Pre-exercise<1, 2, 3, 4, 5sets

2 sets<5 sets§

Multiple comparisons (exercise task)

n.s.

Task 3>Task 1**

Task 3>Tasks 1, 2††

Task 3>Tasks 1, 2‡‡

Task 3>Tasks 1, 2§§

Task 3>Tasks 1, 2***

Multiple comparisons (exercise set): the result of comparing the T2 values of each exercise set at each exercise task using Bonferroni post hoc analysis
Multiple comparisons (exercise task): the result of comparing the T2 values of each exercise task at each exercise set using Bonferroni post hoc analysis.
*p=0.043, 0.023, 0.020, respectively; p=0.045 p=0.009, 0.000, 0.001, 0.001, 0.000, respectively; §p=0.006; **p=0.020; ††p=0.009, 0.004, respectively; ‡‡ p=0.017, 0.000, respectively; §§p=0.009, 0.001, respectively; ***p=0.002, 0.002, respectively

For the UGM, Bonferroni post hoc analysis comparing each task revealed that task 3 was significantly higher than task 1 after 5 sets and was significantly higher than task 2 after 4 sets and 5 sets (Table 7). In addition, only the T2 values of task 3 were significantly increased after exercise (Table 7).

Table 7. Comparison of the T2 values of the UGM (mean (SD), ms) according to exercise task and exercise set.

Pre-exercise

1 set

2 sets

3 sets

4 sets

5 sets

Multiple comparisons (exercise set)

Task 1

37.4 (1.4)

38.1 (1.2)

38.4 (1.4)

38.5 (1.2)

38.6 (1.2)

38.1 (1.1)

n.s.

Task 2

38.0 (2.0)

38.4 (1.4)

38.6 (1.9)

38.6 (1.7)

38.8 (1.5)

38.5 (2.0)

n.s.

Task 3

37.2 (1.6)

38.8 (1.4)

39.3 (1.4)

40.1 (1.4)

40.6 (1.5)

40.3 (1.0)

Pre-exercise<2, 3, 4, 5 sets*

1 set<3, 4, 5 sets

2 sets<5 sets

Multiple comparisons (exercise task)

n.s.

n.s.

n.s.

n.s.

Task 3>Task 2§

Task 3>Tasks 1, 2**

Multiple comparisons (exercise set): the result of comparing the T2 values of each exercise set at each exercise task using Bonferroni post hoc analysis
Multiple comparisons (exercise task): the result of comparing the T2 values of each exercise task at each exercise set using Bonferroni post hoc analysis.
*p=0.000, 0.001, 0.001, 0.000, respectively; p=0.040, 0.016, 0.000, respectively; p=0.045; §p=0.043; **p=0.013, 0.025, respectively.

Discussion

In this study, the T2 values of the hip abductors increased with an increasing load of exercise. The results of this study demonstrated that the T2 values could be used to assess muscle activity. Many factors could contribute to the changes in T2, including increases in intracellular and extracellular water content, accumulation of diamagnetic ions (e.g., lactate, phosphate, and sodium), and a decrease in pH [40, 41]. T2 shift measures provide a powerful technique to assess muscle function during specific exercise/rehabilitation protocols [37]. The muscle activation data evaluated using the T2 values associated with exercise in the present study were consistent with those in a previous study caused by the factors described above. Our results demonstrated that the hip abductor muscles were activated differently between the side-lying hip abduction exercise variations examined.

The T2 values of the TFL in all tasks were increased over time, and no significant difference was found between each task. The TFL is located in the superficial layer [15], and its primary role is abduction of the hip joint as well as flexion and internal rotation [17, 42]. Gottschalk et al.[17] proposed in their muscle modeling studies that the main function of the TFL is hip abduction. Sidorkewicz et al.[43] found that the activity of the TFL does not vary significantly during hip abduction exercise with neutral hip and internal and external rotations, which was in agreement with our findings.

The T2 values of the GMIN in all tasks were increased over time, and no significant difference was found between each task. The GMIN is located in the deepest layer, and its muscle belly adheres directly to the superior joint capsule [44], which enables this muscle to augment and protect joint stability [44, 45]. Based on anatomic and EMG studies, the primary function of the entire GMIN is to stabilize the head of the femur in the acetabulum [17]. Therefore, the GMIN was activated in all tasks to stabilize the head of the femur in the acetabulum during exercise because of its anatomical structure and function.

No significant difference was found between the tasks in the T2 of the middle segments of the GMED; this result is probably attributable to its anatomical structure. Middle fascicles have been reported to be more vertically oriented, which appears to be a better position to abduct the hip [1]. Therefore, it is suggested that the middle segment of the GMED contracts due to the element of hip abduction of the exercise task performed in this study.

The activity of the anterior segments of the GMED was increased in all tasks over time. Additionally, the T2 values of the anterior segment of the GMED were increased in task 2 compared to those in task 3. On the other hand, the activity of the posterior segment of the GMED in task 3 was increased immediately, and the T2 values in task 3 were increased compared to those in other tasks. Our results appear to reflect the concept in which task-dependent activation differences of various segments of the GMED indicate a functional subdivision within the muscle. Cadaveric and anatomical studies suggest that the GMED comprises three structurally unique regions (anterior, middle, and posterior) [18,46–48], the activity of which may be independent of the central nervous system control [18,19]. The patterns of orientation and insertion of the anterior and posterior portions of the gluteus medius appear to reflect their probable role in internal and external rotations, respectively, and are in line with the findings of EMG studies [1,16]. Semciw et al. [49] studied the activity of each segment of the GMED during hip exercise and demonstrated using fine-wire EMG that muscle activation in the posterior GMED during the clam maneuver is higher than that in other segments of GMED. Hip movement of the clam maneuver is abduction with extension and external rotation, and side-lying hip abduction with extension and external rotation in the current study is similar to the clam maneuver. Therefore, the current study showed that the activity of the anterior and posterior segments of the GMED was in agreement with a previous research. O’Sullivan et al.[50] noted that the presence of these subdivisions may require exposure of the degree of muscle activity for each subdivision during a variety of clinically used strengthening exercises. Therefore, given these results, we suggest performing side-lying hip abduction with extension and external rotations as an effective method to activate the posterior segment of the GMED.

The T2 values of the UGM were increased in task 3 compared to those in other tasks, similar to the posterior segment of the GMED. The UGM is located in the superficial layer [15], and because of its anatomical structure, its primary role is abduction of the hip joint as well as extension and external rotation [42]. Our findings are in agreement with those of Selkowitz et al.[51] who reported that the superior gluteus maximus EMG activity is greater than the incorporated hip abduction and/or external rotation movements. Thus, the results of the T2 values in the UGM showed that side-lying hip abduction with external rotation and extension activated compared with the side-lying hip abduction with neutral hip or internal rotation and flexion.

This study has several limitations. First, real-time muscle activity during exercise could not be evaluated using the T2 values. However, in this study, the T2 values were measured immediately after exercise. Thus, interpretation of the change in the T2 values is related to all the work performed by the muscle and not just to a single activity. An exercise-induced shift in T2 is detectable after a few as two contractions and increases to a work-rate-dependent plateau within a few minutes [40]. Recovery after exercise takes at least 20 min [52], which should have enabled us to measure exercise-induced shifts in T2 after exercise. Second, this study did not evaluate muscle activity using EMG. Even if there was no significant change in the intensity of the MRI signal, the work of the muscle may possibly be observed on EMG. Third, as the exercise load increases, a synergistic contraction of other hip joint muscles exists during hip abduction exercise, but the T2 values of other hip joint muscles were not measured. In addition, the exercise task had only 3 conditions, and the variation of other hip abduction motion was not considered. However, this study confirmed the movement of free water inside and outside of muscle cells when the activity level increased in the hip abductor muscles. The results of our study suggest that the variation in changes in activity observed between the hip abductor muscles was attributable to the differences in their anatomic structure and was indicative of intramuscular variation of activity within the hip abductor muscles.

Hip-focused neuromuscular exercise interventions have gained considerable attention for addressing a myriad of lower extremity injuries [53]. Deficits in proximal hip strength or neuromuscular control may lead to lower extremity valgus [9]. Dynamic lower extremity valgus is operationally defined as a combination of motions and rotations in the lower extremity, including hip adduction and internal rotation, knee abduction, and tibial external rotation [8]. Therefore, the posterolateral hip musculature has hip abduction and external rotation, play a central role in controlling the dynamic alignment of the lower extremity. The current study demonstrated that posterolateral hip musculature, such as the posterior segment of the GMED and UGM, was activated during side-lying hip abduction with extension and external rotation. Thus, this knowledge will allow physical therapists to develop specific and targeted rehabilitation programs for these muscles and clinical condition. However, this suggestion needs validation through further research involving people with lower extremity conditions. Whether activation of the posterior segment of the GMED and UGM could improve lower limb kinematics and athletic performance should also be validated.

Acknowledgment

We thank the subjects and the other members of the study group for their participation. This study would not have been possible without them.

References

  1. Conneely M, O’Sullivan K (2008) Gluteus maximus and gluteus medius in pelvic and hip stability: isolation or synergistic activation? Physio Ireland 29: 6–10.
  2. Anders C, Patenge C, Sander K, Layher F, et al. (2017) Detailed spatial characterization of superficial hip muscle activation during walking: a multi-electrode surface EMG investigation of the gluteal region in healthy older adults. PLoS One 1: 1–24.
  3. Cichanowski HR, Schmitt JS, Johnson RJ, Niemuth PE (2007) Hip strength in collegiate female athletes with patellofemoral pain. Med Sci Sports Exerc 39: 1227–1232. [crossref]
  4. Ireland ML, Willson JD, Ballantyne BT, Davis IM (2003) Hip strength in females with and without patellofemoral pain. J Orthop Sports Phys Ther 33: 671–676. [crossref]
  5. Robinson RL, Nee RJ (2007) Analysis of hip strength in females seeking physical therapy treatment for unilateral patellofemoral pain syndrome. J Orthop Sports Phys Ther. 37: 232–238.
  6. Rowe J, Shafer L, Kelley K, West N, Dunning T, et al. (2007) Hip strength and knee pain in females. N Am J Sports Phys Ther 2: 164–169. [crossref]
  7. Fredericson M, Cookingham CL, Chaudhari AM, Dowdell BC, Oestreicher N, et al. (2000) Hip abductor weakness in distance runners with iliotibial band syndrome. Clin J Sport Med 10: 169–175. [crossref]
  8. Hewett TE, Myer GD, Ford KR (2006) Anterior cruciate ligament injuries in female athletes: Part 1, mechanisms and risk factors. Am J Sports Med 34: 299–311.
  9. Hewett TE, Myer GD, Ford KR, Heidt RS Jr, et al. (2005) Biomechanical measures of neuromuscular control and valgus loading of the knee predict anterior cruciate ligament injury risk in female athletes: a prospective study. Am J Sports Med 33: 492–501.
  10. Ireland ML (2002) The female ACL: why is it more prone to injury? Orthop Clin North Am 33: 637–651. [crossref]
  11. Friel K, McLean N, Myers C, Caceres M (2006) Ipsilateral hip abductor weakness after inversion ankle sprain. J Athl Train 41: 74–78.
  12. Fulkerson JP (2002) Diagnosis and treatment of patients with patellofemoral pain. Am J Sports Med 30: 447–456. [crossref]
  13. Powers CM (2003) The influence of altered lower-extremity kinematics on patellofemoral joint dysfunction: a theoretical perspective. J Orthop Sports Phys Ther 33: 639–646.
  14. Distefano LJ, Blackburn JT, Marshall SW, Padua DA (2009) Gluteal muscle activation during common therapeutic exercises. J Orthop Sports Phys Ther 39: 532–540.
  15. Grimaldi A, Richardson C, Hides J, Donnelly W, et al. (2009) The association between degenerative hip joint pathology and size of the gluteus maximus and tensor fascia lata muscles. Man Ther 14: 611–617.
  16. Earl JE (2005) Gluteus medius activity during three variations of isometric single-leg stance. J Sport Rehabil 14: 1–11.
  17. Gottschalk F, Kourosh S, Leveau B (1989) The functional anatomy of tensor fasciae latae and gluteus medius and minimus. J Anat 166: 179–189. [crossref]
  18. Schmitz RJ, Riemann BL, Thompson T (2002) Gluteus medius activity during isometric closed-chain hip rotation. J Sport Rehabil 11(3): 179–188.
  19. Soderberg G, Dostal W (1978) Electromyographic study of three parts of the gluteus medius muscle during functional activities. Phys Ther 58: 691–696.
  20. Wilson G, Capen E, Stubbs N (1976) A fine-wire electromyographic investigation of the gluteus medius and minimus muscles. Res Q 47: 824–828.
  21. Arokoski JP, Kankaanpää M, Valta T, Juvonen I, et al. (1999) Back and hip extensor muscle function during therapeutic exercises. Arch Phys Med Rehabil 80: 842–850.
  22. Ayotte NW, Stetts DM, Keenan G, Greenway EH (2007) Electromyographical analysis of selected lower extremity muscles during 5 unilateral weight-bearing exercises. J Orthop Sports Phys Ther. 37: 48–55.
  23. Bolgla LA, Uhl TL (2005) Electromyographic analysis of hip rehabilitation exercises in a group of healthy subjects. J Orthop Sports Phys Ther 35: 487–494.
  24. Bolgla LA, Uhl TL (2007) Reliability of electromyographic normalization methods for evaluating the hip musculature. J Electromyogr Kinesiol 17: 102–111.
  25. Boudreau SN, Dwyer MK, Mattacola CG, Lattermann C, Uhl TL, et al. (2009) Hip-muscle activation during the lunge, single-leg squat, and step-up-and-over exercises. J Sport Rehabil 18: 91–103. [crossref]
  26. Ekstrom RA, Donatelli RA, Carp KC (2007) Electromyographic analysis of core trunk, hip, and thigh muscles during 9 rehabilitation exercises. J Orthop Sports Phys Ther 37: 754–762.
  27. McBeth JM, Earl-Boehm JE, Cobb SC, Huddleston WE (2012) Hip muscle activity during 3 side-lying hip-strengthening exercises in distance runners. J Athl Train 47: 15–23.
  28. Lee JH, Cynn HS, Kwon OY, Yi CH, et al. (2014) Different hip rotation influence hip abductor muscles activity during isometric side-lying hip abduction in subjects with gluteus medius weakness. J Electromyogr Kinesiol 24: 318–324.
  29. Distefano LJ, Blackburn JT, Marshall SW, Padua DA (2009) Gluteal muscle activation during common therapeutic exercises. J Orthop Sports Phys 39: 532–540.
  30. Johnson VL, Halaki M, Ginn KA (2011) The use of surface electrodes to record infraspinatus activity is not valid at low infraspinatus activation levels. J Electromyogr Kinesiol 21: 112–118.
  31. Perry J, Easterday CS, Antonelli DJ (1981) Surface versus intramuscular electrodes for electromyography of superficial and deep muscles. Phys Ther 61: 7–15.
  32. Bogey RA, Perry J, Bontrager EL, Gronley JK (2000) Comparison of across-subject EMG profiles using surface and multiple indwelling wire electrodes during gait. J Elecromyogr Kinesiol. 10: 255–259.
  33. Adams GR, Duvoisin MR, Dudley GA (1992) Magnetic resonance imaging and electromyography as indexes of muscle function. J Appl Physiol (1985) 73: 1578–1583. [crossref]
  34. Dickx N, D’Hooge R, Cagnie B, Deschepper E, et al. (2010) Magnetic resonance imaging and electromyography to measure lumbar back muscle activity. Spine (Phila Pa 1976) 35: 836–842.
  35. Elliott JM, O’Leary SP, Cagnie B, Durbridge G, et al. (2010) Craniocervical orientation affects muscle activation when exercising the cervical extensors in healthy subjects. Arch Phys Med Rehabil 91: 1418–1422.
  36. Cagnie B, Dickx N, Peeters I, Tuytens J, et al. (2008) The use of functional MRI to evaluate cervical flexor activity during different cervical flexion exercises. J Appl Physiol 104: 230–235.
  37. Cagnie B, Elliott JM, O’Leary S, D’hooge R, Dickx N, et al. (2011) Muscle functional MRI as an imaging tool to evaluate muscle activity. J Orthop Sports Phys Ther 41: 896–903. [crossref]
  38. Kumagai M, Shiba N, Higuchi F, Nishimura H, et al. (1997) Functional evaluation of hip abductor muscles with use of magnetic resonance imaging. J Orthopaedic Res. 15: 888–893.
  39. Mitomo S, Usa H, Hata M, Ogawa D, et al. (2018) Sequential changes in activity of hip abductors seen on muscle functional magnetic resonance imaging after hip abduction exercises. Bone Muscle 1: 1–4.
  40. Jenner G, Foley JM, Cooper TG, Potchen EJ, et al. (1994) Changes in magnetic resonance images of muscle depend on exercise intensity and duration, not work. J Appl Physiol 76: 2119–2124.
  41. Meyer RA, Prior BM (2000) Functional magnetic resonance imaging of muscle. Exerc Sport Sci Rev 28: 89–92. [crossref]
  42. Neumann DA (2010) Kinesiology of the hip: a focus on muscular actions. J Orthop Sports Phys Ther 40: 82–94. [crossref]
  43. Sidorkewicz N, Edward DJ, Cambridge, McGill SM (2014) Examining the effects of altering hip orientation on gluteus medius and tensor fascae latae interplay during common non-weight-bearing hip rehabilitation exercises. Clin Biomech 29: 971–976.
  44. Beck M, Sledge JB, Gautier E, Dora CF, Ganz R (2000) The anatomy and function of the gluteus minimus muscle. J Bone Joint Surg Br 82: 358–363. [crossref]
  45. Al-Hayani A (2009) The functional anatomy of hip abductors. Folia Morphol (Warsz) 68: 98–103. [crossref]
  46. Semciw AI, Green RA, Pizzari T, Briggs C (2013) Verification of a standardized method for inserting intramuscular EMG electrodes into uniquely oriented segments of gluteus minimus and gluteus medius. Clin Anat 26: 244–252.
  47. Pfirrmann CW, Chung CB, Theumann NH, Trudell DJ, et al. (2001) Greater trochanter of the hip: attachment of the abductor mechanism and a complex of three bursae – MR imaging and MR bursography in cadavers and MR imaging in asymptomatic volunteers. Radiology 221: 469–477.
  48. O’Dwyer C, Sainsbury D, O’Sullivan K (2011) Gluteus medius muscle activation during isometric muscle contractions. J Sport Rehabil 20: 174–186.
  49. Semciw AI, Pizzari T, Murley GS, Green RA (2013) Gluteus medius: an intramuscular EMG investigation of anterior, middle and posterior segments during gait. J Electromyogr Kinesiol 23: 858–864.
  50. O’Sullivan K, Smith SM, Sainsbury D (2010) Electromyographic analysis of the three subdivisions of gluteus medius during weight-bearing exercises. Sports Med Arthros Rehabil Ther Technol 2: 1–9.
  51. Selkowitz DM, Beneck GJ, Powers CM (2016) Comparison of Electromyographic Activity of the Superior and Inferior Portions of the Gluteus Maximus Muscle During Common Therapeutic Exercises. J Orthop Sports Phys Ther 46: 794–799. [crossref]
  52. Fisher MJ, Meyer RA, Adams GR, Foley JM, et al. (1990) Direct relationship between proton T2 and exercise intensity in skeletal muscle MR images. Invest Radiol 25: 480–485.
  53. Ford KR, Nguyen AD, Dischiavi SL, Hegedus EJ, et al. (2015) An evidence-based review of hip-focused neuromuscular exercise interventions to address dynamic lower extremity valgus. Open Access J Sports Med 6: 291–303.

The Impact of SPY Angiography on Intraoperative Decision Making and Outcomes for Post-Mastectomy Reconstruction

DOI: 10.31038/IMCI.2019213

Abstract

Objective: While the use of intraoperative laser angiography (SPY) is increasing in mastectomy patients, its impact in the operating room to change the type of reconstruction performed has not been well described. The purpose of this study is to investigate whether SPY angiography influences post-mastectomy reconstruction decisions and outcomes.

Materials and Methods: A retrospective analysis of mastectomy patients with reconstruction at a single institution was performed from 2015–2017. All patients underwent intraoperative SPY after mastectomy but prior to reconstruction. SPY results were defined as ‘good’, ‘questionable’, ‘bad’, or ‘had skin excised’. Complications within 60 days of surgery were compared between those whose SPY results did not change the type of reconstruction done versus those who did. Preoperative and intraoperative variables were entered into multivariable logistic regression models if significant at the univariate level. A p-value <0.05 was considered significant.

Results: 267 mastectomies were identified, 42 underwent a change in the type of planned reconstruction due to intraoperative SPY results. Of the 42 breasts that underwent a change in reconstruction, 6 had a ‘good’ SPY result, 10 ‘questionable’, 25 ‘bad’, and 2 ‘had areas excised’ (p<0.01). After multivariable analysis, predictors of skin necrosis included patients with ‘questionable’ SPY results (p<0.01,OR:8.1,95%CI:2.06 – 32.2) and smokers (p<0.01,OR:5.7,95%CI:1.5 – 21.2). Predictors of any complication included a change in reconstruction (p<0.05,OR:4.5,95%CI:1.4–14.9) and ‘questionable’ SPY result (p<0.01,OR:4.4,95%CI:1.6–14.9).

Conclusion: SPY angiography results strongly influence intraoperative surgical decisions regarding the type of reconstruction performed. Patients most at risk for flap necrosis and complication post-mastectomy are those with questionable SPY results.

Background

In recent years, intraoperative laser (SPY) angiography has been shown to be effective in identifying areas of ischemic tissue and predicting skin or nipple areolar necrosis during mastectomies [1–5]. One of the most significant complications following a skin or nipple sparing mastectomy with reconstruction is flap necrosis [6,7]. Consequently, SPY angiography has been found to be a useful adjunct to clinical assessment in identifying and potentially preventing complications such as skin necrosis [2].

While studies have demonstrated the ability of SPY angiography to predict mastectomy flap necrosis, none have investigated the impact of SPY angiography on intraoperative decision making, such as changing the type of reconstruction performed. In order to identify the independent predictive value of SPY angiography for postoperative complications, prior studies have not allowed SPY results to impact intraoperative reconstruction decisions [1]. Other studies have described the usefulness of SPY in identifying areas of flap ischemia intraoperatively so that compromised skin could be excised, resulting in decreased complication rates compared to those who did not use SPY [4]. To date, there are no studies describing whether SPY angiography affects surgical decision making regarding the type of breast reconstruction performed. Nor are there studies evaluating whether SPY angiography results can predict other complications, such as seroma or infection. These complications can result from skin necrosis, but independent predictive values have not been evaluated.

Our study aims to describe the impact of SPY angiography on intraoperative decision making regarding type of breast reconstruction. Additionally, we aim to investigate the utility of SPY in predicting other postoperative complications.

Materials and Methods

Patients

After receiving institutional review board approval, a retrospective analysis was performed of a single institution breast care center from 2015–2017. Adult female patients age 18 or older who underwent Nipple Sparing Mastectomy (NSM) or Skin Sparing Mastectomy (SSM), with or without sentinel lymph node biopsy (SLNB) and/or Axillary Lymph Node Dissection (ALND) were identified. The study included patients with a diagnosis of breast cancer and patients undergoing prophylactic surgery. All mastectomies were performed by one of three breast surgical oncologists at our institution. All patients underwent immediate reconstruction with Tissue Expander (TE) or fixed volume implant during the same procedure by one of three plastic surgeons, and all had intraoperative indocyanine green (ICG, standard dose of 2.5mg/ml with 4ml) SPY angiography using the SPY Elite System to evaluate skin perfusion prior to reconstruction.

Variables

Preoperative patient variables including age, smoking status (defined as current smoker at the time of surgery), diabetes, obesity (BMI >/= 30kg/m2), breast weight, and exposures (history of chest wall radiation or chemotherapy) along with intraoperative variables including type of surgery (NSM vs SSM) and ALND were compared. SPY results were defined as described by the plastic surgeon in their operative report as ‘good,’ ‘questionable,’ ‘bad ’or‘ areas excised.’ Documentation of planned reconstruction was noted in the preoperative clinic note and the performed reconstruction was identified in the final operative report. A change in intraoperative reconstruction was either placement of an expander rather than implant, minimal expansion of an expander, or no reconstruction at all. Complications assessed included necrosis (full or partial flap or Nipple-Aerola Complex (NAC) necrosis, dehiscence, or those requiring reoperation), infection (abscess, cellulitis or sepsis), seroma (requiring aspiration or surgical intervention), or explantation of implant within 60 days of surgery. These outcomes were compared between those who had SPY results that changed the type of reconstruction performed and those who did not.

Statistics

Univariate analyses were performed using chi-square tests, Fisher’s exact test, independent sample t-tests, and F-tests in ANOVA for categorical and quantitative variable analysis, respectively. A change in reconstruction was used as the predictor variable with each outcome of interest being the dependent variable tested for significant univariate association. Patient demographics and intraoperative variables were tested for univariate association with our predictor variable to identify possible confounders. These variables were adjusted for in multivariable logistic regression models when the respective univariate p-value was less than 0.1. Covariates in the final multivariable logistic model were considered statistically significant if the p-value was less than 0.05. All statistical analysis was done using SAS version 9.3 (Cary, NC).

Results

Of the 267 mastectomies identified, 42 breasts from 25 patients (15.7%) underwent a change in the type of reconstruction intraoperatively due to SPY results. Of the 42 changes in reconstruction type, 6 breasts had ‘good’ SPY results, 10 had ‘questionable’ SPY results, 25 had ‘bad’ SPY results, and 2 breasts ‘had areas excised’ (p<0.0001) (Table 1). Of the patients who underwent a change in reconstruction, 39 of 42 breasts (92.8%) had a TE placed instead of implant or a TE placed with lower volume, while 3 breasts (7.1%) did not undergo any reconstruction based on intraoperative assessment.

Table 1. SPY results and frequency of intraoperative decision change.

All Subjects
N=267

Good
N=165 (61.8)

Questionable
N=25
(9.4)

Bad
N=25
(9.4)

Areas excised
N=52
(19.5)

p-value

N (%)

Change in Reconstruction

42
(15.7)

6
(3.6)

10
(40)

25
(100)

1
(1.9)

<.0001*

The patient demographics that were statistically significant on univariate analysis in relation to those who had no change versus those who had a change in reconstruction included smoking (p<0.001), obesity (p<0.01), and breast weight (p<0.0001). Age, diabetes, and history of chemotherapy or chest wall radiation were not statistically significant (Table 2). Patients who did not have a change in reconstruction were more likely to have undergone a SSM versus a NSM (p<0.01) and have a ‘good’ SPY result (p<0.0001) compared to those who underwent a change in reconstruction (Table 2). There was a statistically significant increase in complications including necrosis (p<0.01), infection (p<0.01), and seroma (p<0.0001) for patients who had a change in reconstruction based on SPY results compared to those who did not (Table 3).

Table 2. Demographic and intraoperative variables for patients with no change in reconstruction compared to change in reconstruction.

No Change in Reconstruction
(N=225)

Change in Reconstruction
(N=42)

p-value

Demographics

N (%) or mean +/- SD

Age

45.6 ± 10.7

47.3 ± 12.20

0.36

Smoker

10 (4.4)

9 (21.4)

<0.001*

Obesity (kg/m2)

44 (19.6)

0 (0)

<0.01*

Diabetes

11 (4.9)

0 (0)

0.15

Breast weight (gm)

607.0 ± 377.8

403.4 ± 190.8

<.0001*

History of Chemo

56 (24.9)

9 (21.4)

0.63

History of Radiation

13 (5.8)

2 (4.8)

0.79

Intraoperative variables

SSM

69 (30.7)

4 (9.5)

<0.01*

ALND

19 (8.4)

6 (14.3)

0.25

SPY Result

<.0001*

Good

159 (70.7)

6 (14.3)

Questionable

15 (6.67)

10 (23.8)

Bad

0 (0)

25 (59.5)

Areas Excised

51 (22.7)

1 (2.4)

Table 3. 60-day outcomes for no change in reconstruction compared to change in reconstruction.

Outcome

No Change in Reconstruction
(N=225)

Change in Reconstruction
(N=42)

p-value

Demographics

N (%)

Necrosis

15 (6.7)

9 (21.4)

<0.01*

Infection

6 (2.7)

5 (11.9)

<0.01*

Seroma

29 (12.9)

17 (40.5)

<.0001*

Explantation

3 (1.3)

3 (7.1)

0.052

A multivariable analysis was performed adjusting for significant co-variates including preoperative factors and intraoperative factors if a variable produced a p<0.1. Predictors of necrosis within 60 days of surgery included those who had a ‘questionable’ SPY result (p<0.01 OR: 8.1 95% CI 2.1–32.2) and current smoker (p<0.01 OR: 5.7 95% CI 1.5 – 21.2) (Table 4). Predictors of infection included those who underwent a change in reconstruction (p<0.01 OR: 34.6 95% CI 2.7 – 448) and obesity (p<0.001 OR: 79 95% CI 6.1 – 1000) (Table 5). Predictors of seroma included those who underwent a change in reconstruction (p < 0.05 OR: 4.3 95% CI 1.2–14.7) (Table 6). There were no significant predictors of explantation after multivariable analysis (Table 7). Predictors of one or more complications were significant for patients who had a change in type of reconstruction (p<0.05 OR: 4.5 95% CI 1.4–14.9) and those who had a “questionable” SPY result (p<0.01, OR: 4.4 95% CI 1.6 – 12.1) (Table 8). There were no mortalities within 60 days.

Table 4. Multivariable logistic regression model predicting necrosis within 60 days of surgery.

Variable

OR (95% CI)

p-value

Change in Reconstruction

3.1 (0.67 – 14.4)

0.15

Questionable SPY

8.1 (2.1 – 32.2)

<0.01*

Bad SPY

1.2 (0.15 – 9.5)

0.86

Areas Excised SPY

3.4 (0.97 – 11.8)

0.06

Smoker

5.7 (1.5 – 21.2)

<0.01*

Obesity

2.04 (0.54 – 7.7)

0.30

SSM

0.44 (0.11 – 1.7)

0.24

Breast weight (grams)

1.001 (1.000 – 1.002)**

0.19

Table 5. Multivariable logistic regression model predicting infection within 60 days of surgery.

Variable

OR (95% CI)

p-value

Change in reconstruction

34.6 (2.7 – 448)

<0.01*

Questionable SPY

1.6 (0.19 – 13.5)

0.66

Bad SPY

0.21 (0.01 – 3.3)

0.26

Areas Excised SPY

0.82 (0.12 – 5.7)

0.84

Smoker

0.80 (0.08 – 8.2)

0.84

Obesity

79 (6.1 – 1000)

<0.0001*

SSM

1.3 (0.20 – 8.9)

5

Breast weight (gm)

0.99 (0.99 – 1.0)

0.09

Table 6. Multivariable logistic regression model predicting seroma within 60 days of surgery.

Variable

OR (95% CI)

p-value

Change in reconstruction

4.3 (1.2 – 14.7)

<0.05*

Questionable SPY

1.5 (0.45 – 4.7)

0.53

Bad SPY

1.2 (0.28 – 5.4)

0.79

Areas Excised SPY

0.92 (0.36 – 2.4)

0.87

Smoker

1.1 (0.35 – 3.4)

0.85

Obesity

0.91 (0.30 – 2.7)

0.86

SSM

2.3 (0.89 – 5.7)

0.09

Breast weight (grams)

1.001 (0.99 – 1.001)**

0.70

Table 7. Multivariable logistic regression model predicting explantation within 60 days of surgery

Variable

OR (95% CI)

p-value

Questionable SPY

7.4 (0.37 – 146.2)

0.19

Areas Excised SPY

0.94 (0.06 – 15.7)

0.97

SSM

1.5 (0.09 – 24.5)

0.79

Breast weight (gm)

1.0 (0.991 – 1.003)**

0.83

Table 8. Multivariable logistic regression model predicting any complication within 60 days of surgery.

Variable

OR (95% CI)

p-value

Change in reconstruction

4.5 (1.4 – 14.9)

<0.05*

Questionable SPY

4.4 (1.6 – 12.1)

<0.01*

Bad SPY

0.82 (0.19 – 3.5)

0.79

Areas Excised SPY

1.2 (0.56 – 2.7)

0.61

Smoker

1.3 (0.44 – 3.7)

0.66

Obesity

2.1 (0.87 – 4.9)

0.10

SSM

1.7 (0.74 – 3.7)

0.22

Breast weight (gm)

1.000 (0.999 – 1.001)**

0.87

* = significant, p < 0.05
** = 3 decimal places needed to accurately show OR and CI
OR = odds ratio
CI = confidence interval
SSM – skin sparing mastectomy, ALND – axillary lymph node dissection

Discussion

To date, this has been the first study describing how SPY angiography impacts intraoperative decision making with respect to reconstruction after mastectomy. In this study, nearly 20% of patients underwent excision of compromised tissue and 16% had a change in reconstruction due to findings on SPY angiography (Table 1). Our study also found that SPY results strongly affected the plastic surgeon’s intraoperative decision making, where 100% of ‘bad’ SPY results resulted in a change in type of reconstruction and 40% in the ‘questionable’ SPY group (Table 1). Furthermore, a change in reconstruction type was predictive of infection, seroma, and any complication, while established risk factors such as smoking and obesity increased risk of necrosis and infection. Interestingly, ‘questionable’ SPY results were an independent risk factor for postoperative necrosis and other complications while ‘bad’ results were not.

Studies have shown that Immediate Breast Reconstruction (IBR) has increased complication rates compared to delayed reconstruction with flap necrosis being reported as the most common complication [8–10]. Flap necrosis rates after IBR have been noted to range anywhere from 3.8% up to 42% [8,9,11]. However, morbidity rates for IBR have decreased over time even with nipple sparing technique [12]. This improvement is likely multifactorial and has been largely attributed to increased surgeon experience and technique modification. Our study found a necrosis complication rate of 8.9% for all patients undergoing mastectomy with reconstruction, which is consistent with prior studies [8,9,11]. While preoperative risk factors for complications have been well studied, the intraoperative evaluation for necrosis with SPY angiography is the next potential area of intervention to reduce morbidity [13].

Our study found that 15.7% of breasts with planned IBR ultimately underwent a change in reconstruction intraoperatively based on SPY results either by undergoing TE placement rather than implant, TE with less volume, or no reconstruction at all. While patients who had a change in reconstruction were at increased risk of a complication on univariate analysis, our study also shows that patients who are smokers or had a ‘questionable’ SPY result are at greater risk for necrosis on multivariate analysis (Table 4). Smoking has been established as a known independent risk factor for skin and flap necrosis [7,10,13]. This was seen within our patient population as well and stresses the importance of SPY for these smokers who undergo IBR. Those patients with a ‘questionable’ SPY were more likely to have necrosis compared to those with a ‘good’ result, while those with a ‘bad’ or ‘had areas excised’ result were not. This is likely because excision of skin for a ‘questionable’ spy was not performed. This confirms the utility of SPY intraoperatively in identifying ischemic areas that can be excised in order to reduce postoperative complications and suggests that a more aggressive approach for ‘questionable’ areas should be taken. After multivariable analysis, patients with SPY results that were not clearly identified as “under-perfused/bad” or “well-perfused/good” were at the greatest risk for necrosis complications.

The objective methods by which SPY can be reported have varied in the literature, with studies investigating anatomic blood flow patterns and the quantitative measurements of perfusion including intensity of fluorescence (also known as absolute perfusion or relative perfusion.) [3,5,14] These studies were limited by small sample size, and because SPY angiography is an “instantaneous index of perfusion” it can be impacted by variations in blood pressure or possibly during the operation [1,3,4,5,14]. In addition, because images are black and white with shades of gray defining areas of perfusion, SPY angiography may be subject to user interpretation and operator experience.6 Overall, most studies have made a consensus that SPY should be used in conjunction with clinical assessment to assess perfusion [3–6,14]. Our study confirms SPY is helpful in assessing flap perfusion but there continues to be a need for standardization of perfusion measurements. While 100% of patients with a ‘bad’ SPY result underwent a downgrade in reconstruction, only 40% of those with a ‘questionable’ SPY result had a change, suggesting that surgeons should be more vigilant in downgrading reconstruction options, delaying reconstruction for patients, or excising areas of skin that are compromised with a questionable SPY result. This is further supported by the finding that intraoperative change in reconstruction was not an independent risk factor for necrosis (Table 4).

Obesity is another known risk factor for postoperative complications [10]. In this study, obesity and a change in reconstruction were independent risk factors for infection. Those who underwent a change in reconstruction were at higher risk for infection as well as seroma formation (Table 4, Table 5). The increased risk of infection in those who underwent a change in reconstruction may have been related to ischemia or necrosis while the increased risk for seroma formation may have been due to placement of a TE with minimal expansion instead of placement of an implant.

SPY angiography continues to be an important adjunct in assessing tissue perfusion and can guide intraoperative decision making including excision of ischemic tissue and change in reconstruction options. While changing reconstruction may result in increased seroma formation, it may reduce other complications when there is indeterminate or ‘questionable’ SPY imaging result. There are multiple limitations to our study. The single institution and retrospective nature of our study are limitations as well as the small sample size. As with many other studies, the subjective nature of a SPY result interpretation by the surgeon continues to be present. Since SPY was introduced at our institution in 2014, operator experience may have affected our study as other studies have demonstrated that there is a learning curve for surgeons [6]. In addition, long term and oncologic outcomes were not assessed. Further prospective studies using a standardized measurement to assess tissue perfusion with SPY angiography are needed.

Conclusions

SPY angiography can influence intraoperative decision making for reconstruction, and whether direct to implant reconstruction is possible or expanders are necessary. The patients who were at greatest risk for flap necrosis or other complications in this study were those with ‘questionable’ SPY results as interpreted by the surgeon. Further studies are needed using a SPY angiography standardized perfusion measurement to identify patients who are at risk for post-mastectomy complications.

References

  1. Venturi ML, Mesbahi AN, Copeland-Halperin LR, Suh VY, and Yemc L (2017) SPY Elite’s Ability to Predict Nipple Necrosis in Nipple-Sparing Mastectomy and Immediate Tissue Expander Reconstruction. Plastic and Reconstructive Surgery. Global Open 5: 1334.
  2. Diep GK, Hui JYC, Marmor S, et al (2016) Postmastectomy Reconstruction Outcomes After Intraoperative Evaluation with Indocyanine Green Angiography Versus Clinical Assessment. Annals of Surgical Oncology 23: 4080.
  3. Newman MI, Jack MC, and Samson MC (2013) SPY-Q analysis toolkit values potentially predict mastectomy flap necrosis. Annals of Plastic Surgery 70: 595–598.
  4. Komorowska-Timek E, Gurtner GC (2019) Intraoperative perfusion mapping with laser-assisted indocyanine green imaging can predict and prevent complications in immediate breast reconstruction. Plastic and Reconstructive Surgery 125:1065–1073.
  5. Duggal CS, Madni T, Losken A (2014) An outcome analysis of intraoperative angiography for postmastectomy breast reconstruction. Aesthetic Surgery Journal 34: 61–65.
  6. Sood M and Glat P (2013) Potential of the SPY intraoperative perfusion assessment system to reduce ischemic complications in immediate postmastectomy breast reconstruction. Annals of Surgical Innovation and Research 7: 9.
  7. Munabi NCO, Olorunnipa OB, Goltsman D, et al. (2014) The ability of intra-operative perfusion mapping with laser-assisted indocyanine green angiography to predict mastectomy flap necrosis in breast reconstruction: a prospective trial. Journal of Plastic, Reconstructive & Aesthetic Surgery : JPRAS 67: 449–455.
  8. Alderman AK, Wilkins EG, Kim HM, and Lowery JC (2002) Complications in postmastectomy breast reconstruction: two-year results of the Michigan Breast Reconstruction Outcome Study. Plastic and Reconstructive Surgery 109: 2265–2274.
  9. Sullivan SR, Fletcher DRD, Isom CD, and Isik FF (2002) True incidence of all complications following immediate and delayed breast reconstruction. Plastic and Reconstructive Surgery 122: 19–28.
  10. McCarthy CM, Mehrara BJ, Riedel E, et al (2008) Predicting complications following expander/implant breast reconstruction: an outcomes analysis based on preoperative clinical risk. Plastic and Reconstructive Surgery 121: 1886–1892.
  11. Phillips BT, Lanier ST, Conkling N, et al. (2012) Intraoperative perfusion techniques can accurately predict mastectomy skin flap necrosis in breast reconstruction: results of a prospective trial. Plastic and Reconstructive Surgery 129:778–88.
  12. Wang F, Peled AW, Garwood E, et al. (2014) Total skin-sparing mastectomy and immediate breast reconstruction: an evolution of technique and assessment of outcomes. Annals of Surgical Oncology. 21: 3223–3230.
  13. Mlodinow AS, Fine NA, Khavanin N, and Kim JYS (2014) Risk factors for mastectomy flap necrosis following immediate tissue expander breast reconstruction. Journal of Plastic Surgery and Hand Surgery. 48: 322–326.
  14. Moyer HR and Losken A (2012) Predicting mastectomy skin flap necrosis with indocyanine green angiography: the gray area defined. Plastic and Reconstructive Surgery 129: 1043–1048.

Immediate Function of 3.25 mm Diameter Implants in Aesthetic Regions. An 18-month Clinical, Radiographic and Resonance Frequency Analysis (RFA) Study

DOI: 10.31038/JDMR.2019223

Abstract

The aim of the study was to evaluate the use of narrow implants (3.25 mm) to replace upper lateral and lower incisors according to an established immediate function protocol. A total of 49 narrow implants (Neoss Proactive 3.25 mm implants, Neoss Ltd, Harrogate, UK) in 35 patients were evaluated. Thirty-one implants were placed in the mandible and 18 in the maxilla. The mean insertion torque was measured in Ncm. Thirty-six implants were placed in fresh extraction sockets. Implant stability measurements were performed at baseline, after 2, 4, 6 weeks and 3, 6 months using resonance frequency analysis (RFA) measurements (Osstell ISQ™, Osstell AB, Gothenburg, Sweden) expressed in ISQ units (Implant Stability Quotient). The patients were followed with clinical and radiographic examinations for 18 months. One implant failed after 4 weeks giving a cumulative survival rate of 98.0 % and the marginal bone loss amounted to 0.7 + 1.0 mm after 18 months. The mean insertion torque was 36 + 9.1 Ncm. The mean ISQ values indicated firm stability at baseline in both mesial-distal and buccal-lingual directions (i.e. above 65 ISQ). The ISQ curve presented a significant drop after 2–4 weeks where after the stability recovered progressively up to 6 months.

It is concluded that upper lateral and lower incisors can be replaced with 3.25 mm implants according to an immediate loading protocol with high survival rate and minimal marginal bone loss. Moreover, the immediately loaded implants showed an initial dip of stability during the first 4 weeks followed by an an increase with time.

Keyword

Immediate Loading, Implant Stability, Narrow Implants, Resonance Frequency Analysis

Introduction

Immediate function was originally used to treat edentulous mandibles by placing conventional diameter (>3.75 mm) dental implants in the mandibular symphysis region, which is an area of dense bone offering high implant stability [1, 2]. Later, the concept of immediate function has successfully been applied to areas with lower bone density, in part depending on the development of new implant designs and surfaces aiming at high primary stability and rapid integration [3–5]. However, there are areas of the jaws in which it is difficult to place implants with a conventional diameter because of the small size of the teeth to be replaced. These areas are located the lower incisors and upper lateral incisors. In these cases, an Implant with standard diameter may result in an excessive proximity with neighbouring teeth, with possible damage to the teeth themselves or with lack of space for the osseointegration process [6]. Even the emergence profile from the soft tissues and the morphology of the papilla may be adversely affected by a diameter of the implant too large compared to the size of the origin tooth. Hence, the use of Implants with reduced diameter and reduced platform is a viable solution for the treatment of the lower incisors and upper lateral incisors, where the available space does not allow for the use of conventional diameter implants. An implant is considered of small diameter when this it is less than 3.5mm. The installations of small diameter (SDI) should not be confused with the mini-implants, characterized by a diameter of less than 3mm and a structure in one piece, and are generally used in orthodontics as anchorage [7]. The reliability of small diameter implants has been demonstrated in numerous clinical studies [8]. However, fractures of the implant body due to long-term fatigue following the load have been described for some implant types [9, 10]. Narrow 3.3 mm implants have been reported to be successful when loaded 6–10 weeks after surgery [11] as well as when loaded within 48 hours [12].

The purpose of the present work was to evaluate the implant survival rate of 3.25mm diameter implants with reduced platform, positioned in areas of the lower incisors and upper lateral incisors, and subject to a previously evaluated immediate function protocol [13–16]. Further aims were to analyse the marginal bone resorption and the behaviour of the implant stability during loading and healing as assessed by Resonance Frequency Analysis (RFA) measurements.

Material and Methods

Patient selection

A total of 35 patients (12 females and 23 males; mean age 57 years, range 16 – 87) treated with a previously established immediate implant function protocol were included in the study [13–16]. The inclusion criteria were: (i) need of implant-supported crown or bridge in the mandible incisor area or single restoration at the lateral incisor in maxilla, (ii) need, for aesthetic reasons, of the immediate restoration of the lacking teeth, (iii) available bone for at least 11 mm long and 3.25 mm wide implants. The exclusion criteria were: (i) non-compensated general diseases, (ii) poor oral hygiene, (iii) presence of acute inflammation at the teeth expected to extract. Smoking, bruxism and periodontal disease were considered as risk factors and recorded. Patients with active periodontitis were treated before implant surgery according to conventional periodontal therapy. Immediate placement of implants in extraction sockets was allowed. The study was conducted in full accordance with ethical principles, including the World Medical Association Declaration of Helsinki. All patients were carefully informed about the procedure and gave their written consent to participate and to follow a maintenance and observation program for 18 months. They could at any time point refuse further participation.

Implants

A total of 49 narrow diameter (3.25 mm) implants (Proactive Straight™, Neoss Ltd, Harrogate, UK) had been inserted in the 35 patients; 31 in mandible and 18 in maxilla (Table 1). Apart from small diameter (3.25mm) this implant has a small prosthetic platform. The implant is characterized by a positive tolerance, signified by a slightly tapered geometry. The surface (Proactive™) is prepared by blasting with titanium particles followed by acid etching and chemically modified to reduce surface tensions and to exhibit electro-wetting in contact with fluids. The Sa value at the implant body is some 0.8–1 μm for the Proactive surface. According to the manufacturer, the roughness is higher on the body and less at the neck of the implant.

Table 1. Position and length of implants.

Position and length of implants

Maxilla (n = 18)

Position

12

22

11mm

1

13mm

5

7

15mm

2

3

Mandible (n = 31)

Position

42

41

31

32

13mm

5

1

1

6

15mm

9

1

1

7

Surgical and prosthetic procedures

The patients were given one gram of amoxicillin prior to implant surgery. After local anaesthesia, a mid-crestal incision was performed in edentulous sites or, in case of presence of residual teeth, a para-marginal incision was carried out in order to eliminate the internal portion of the gingival sulcus. A full thickness flap, without any releasing incisions, was elevated, and the positions of the implants were marked with a round bur. Then, the receiving sites were prepared with cylindrical burs of increasing diameter, according to the recommendations of the manufacturer (2.2 mm and 2.85 mm as the last burr). In the presence of soft bone, an under-preparation technique was used with 2.2mm as final diameter. In order to preserve as much cortical bone as possible, the use of countersink was avoided. In selected cases a flapless procedure was adopted. The implants were placed with the implant collar “below the crest” (BC), “flush to the crest” (FC) or “above the crest” (AC), depending on width and high of the gingival tissues. In immediate post extractive sites, careful curettage of the socket was performed just after the extraction of the tooth in order to remove any residual inflammatory tissue or periodontal ligament. For this purpose round burr or piezosurgery (Piezosurgery, Mectron, Genova, Italy) device were used. The residual gaps adjacent to the implants were classified as “closed defect”, if all socket bone walls were conserved, or “open defect”, if one or more bone walls were lacking. Closed defects, as they are containing defects, were treated only with auologous bone graft, whereas open defects, when they were “non spacemaking”, with a combination of grafts and resorbable membranes.

After the complete seating of the implants, healing caps were screwed on and the flaps sutured using interrupted sutures. Then, the healing cap were unscrewed and the titanium components for the temporary prosthesis screwed. A temporary resin prosthesis, arranged previously from the laboratory, was then adapted to the components and relined by self-curing resin. After final finishing the prosthesis was screwed on the implants. No occlusal contacts, centrally, laterally and in protrusion, were allowed on the temporary prostheses. The patients received postsurgical antibiotic therapy (amoxicillin, Zimox®, Pfizer Italia Srl, Latina, Italy ), 1g, twice a day for 6 days, starting just before surgery, an anti inflammatory therapy, (nimesulide, Aulin®,Helsinn Birex Pharmaceuticals Ltd, Dublin, Ireland)), twice a day, for 4 days and they were instructed to rinse with a solution of chlorexidine at 2%, twice a day for 10 days.

Radiographic examination

Intraoral radiographs were taken after insertion of the implant (baseline), and then after 1 month, 6 months and 18 months from the installation of the implant using a paralleling technique (Dentsply RINN, Elgin, Il. USA). The technique to make correct radiographies was the following: a pin (the transfer’s one) was screwed to the implant, the Rinn collimator was positioned and supported by cotton rolls to avoid any incorrect inclination, then the x-ray was taken. The radiographs were examined by an independent radiologist. The upper corner of the coronal shoulder of the implant was used as reference point. Measurements from the reference point to the first bone contact at the mesial and distal aspects of the implant were performed. A mean value was calculated for each implant and time point.

Resonance frequency analysis (RFA)

 Implant stability measurements were performed at baseline, after 2, 4, 6 weeks and 3, 6 months using resonance frequency analysis (RFA) measurements (Osstell ISQ™, Osstell AB, Gothenburg, Sweden) expressed in ISQ units (Implant Stability Quotient). For each implant, two measurements, one in mesio-distal and one in bucco-lingual direction were made.

Implant survival criteria

An implant was considered a survival if clinically stable and complying with the function of supporting the prosthesis and causing no discomfort to the patient. Failure was defined as removal of an implant due to any reason.

Results

Clinical findings

All 49 implants, installed in 35 patients, were followed for 18 months with no drop-outs (Figures 1a to e). Thirty-six implants were positioned in immediate post-extraction sites. Seven of these filled almost completely the sockets and did not require any regenerative procedure. The remaining 29 implants presented with an adjacent bone defect after placement. All “closed defects” (n=17) were filled with autologous bone particles collected in the neighbouring areas. Part of the “open defects” (n=5), since they were containing, were treated only with autologous graft, whereas the remaining (n=6) with a combination of autologous graft and resorbable membrane or with (n=1) a mix of autologous bone, bovine bone and resorbable membrane. One of the 49 implants failed after 4 weeks giving a cumulative survival rate of 98.0 % after 18 months. The failed implant was placed in an immediate extraction socket at lower lateral incisor. The baseline ISQ value was 79, but after 2 weeks had already fallen to 66 and at 4 weeks the implant was symptomatic, with swelling and pain. At that point the implant was removed and the bone reconstructed by autologous bone and resorbable membrane. During the following healing period the contralateral implant supported a four elements temporary bridge, ensuring an adequate aesthetics. Three months later another implant was placed in the same position of the failed one, it was successful and could be used for the final restoration.

JDMR-19-119_ Lars_F1

Figure 1. a/Lower incisors suffering from severe periodontal disease with extensive loss of bone support. b/Teeth were extracted and 3.25 diameter implants placed into extraction sockets. c/The remaining gap adjacent to the implants were filled with autologous bone particles. d/Temporary bridge were immediately connected to the implants. e/The final restoration. f/ Radiographs after 18 months.

Radiographic findings

The radiographic measurements showed the bone level at baseline to be 0.7 + 0.6 mm apical to the implant platform and 1.2 + 0.9 mm and 1.4 mm + 0.8 after 6 and 18 months, respectively (Table 2 and 3). The marginal bone loss after 18 months amounted to 0.7 mm + 1.0 and 88% of the total number of implants presented a marginal bone loss not exceeding 1.9mm after 18 months. Only six implants showed a bone resorption more than 2mm. (Table 4). Most of the marginal bone resorption occurred during the first 6 months (0.5mm), with only 0.2 mm for the remaining 12 months (Figure 2).

Table 2. Marginal bone level measurements.

Bone level (mm)

Baseline

(mm + SD)

0.7 + 0.6

6 months

(mm + SD)

1.2 + 0.9

18 months

(mm + SD)

1.4 + 0.8

Table 3. Frequency distribution of marginal bone levels.

Baseline

18 months

Bone level (mm + SD)

0.7 + 0.6 (n=49)

1.4 + 0.8 (n=49)

Frequency distribution (mm)

No (%)

No (%)

0

9 (18.0)

0

0.1–0.9

25 (50.0)

20 (40.0)

1.0–1.9

14 (28.0)

18 (36.0)

2.0–2.9

1 (2.0)

10 (20.0)

>3.0

0

2 (4.0)

Table 4. Frequency distribution of marginal bone loss measurements.

Bone loss baseline to 18 m

 (mm + SD)

0.7 + 1.0 (n=49)

Frequency distribution (mm)

No (%)

<0

10 (20.0)

0–0.9

22 (44.0)

1.0–1.9

12 (24.0)

>2.0

6 (12.0)

JDMR-19-119_ Lars_F2

Figure 2. Distribution of insertion torque at implants placement.

Implant stability

The mean insertion torque was 36 (SD 9.1) Ncm (range 25–60 Ncm) (Figure 3). The mean ISQ values indicated firm stability at baseline in both mesial-distal and buccal-lingual directions (i.e. above 65 ISQ. The ISQ curve presented a significant drop after 2–4 weeks, then the stability recovered progressively up to 6 months (Figure 4).

JDMR-19-119_ Lars_F3

Figure 3. Time-stability curve based on ISQ measurements taken in mesio-distal and bucco-lingual directions.

Discussion

The present study demonstrated the possibility of immediate function in aesthetic areas with limited interproximal space and narrow alveolar crests (lower incisors and upper lateral incisors) using 3.25 mm implants. Only one of 49 implants were lost (2%) and minimal bone marginal bone resorption was seen during the 18 months of follow up. This is in line with Lambert and co-workers, who reported a 97.4% one-year survival rate for 39 narrow implants (3.3 mm) in 20 patients in both anterior and posterior areas with reduced thickness (< 6 mm) of the alveolar crest [12]. In a multicentre study, 97 narrow implants (3 mm) were placed in 69 patients and loaded after 6–10 weeks with a permanent fixed prosthesis [11]. The survival rate was 95.5 % after 3 years with stable marginal bone levels, which is in line with the findings from the present study. A systematic review of the literature showed an overall survival rate of 97.2 % for 672 narrow implants with a diameter of 3.0 to 3.25 mm, which further supports the idea that the use of narrow implants is an effective treatment option [8].

Firm primary implant stability is considered to be the most important factor for successful osseointegration [17]. Insertion torque (IT) is commonly used as a parameter of stability but gives only one measurement at placement surgery. The RFA technique on the other hand is a non-invasive method to assess implant stability at any time of implant treatment and follow-up as supported by numerous publications [18, 19]. In the present study, a series of RFA measurements were obtained at different time points following surgery (baseline, 2,4,6 weeks, 3,6 months). Hence, a stability curve could be plotted, which represents the stability conditions for each implant over the whole healing period. The mean baseline value in mesial-distal direction was 67.5 ISQ in the present study, which is similar to the 68 ISQ achieved in a previous study where standard diameter Neoss implants (4mm) were used [16]. During the weeks following implant installation the ISQ curve showed a drop followed by a recovery after 6-7 weeks up to the initial values, which is in line with previous studies [15, 16, 20, 21]. In the further period the stability continued to raise over the observation period (18 months). Also the shape of the stability curve was similar to that recorded in the mentioned above study with standard Neoss implants. The fall of stability after implant installation can be attributable to the surgery-induced inflammatory process and initial bone resorption, which is part of the repair process. When the inflammation decreases and the new bone formation takes place and stabilizes the interface, the ISQ values augment progressively. A previous study demonstrated the implant surface to be important for the development of stability during immediate loading [20]. The failed implant in the present study showed a significant reduction of stability after 2 weeks but the values were still in the security range. Unfortunately, the measurements after 4 weeks, along with an evident symptomatology, showed a rapid a dramatic loss of stability that led to implant failure. Thus, in this case the stability curve could not be used to save the implant by unloading it due to the rapid progress of stability loss, which was the case in a previous study [15], probably due infection.

The possibility to apply a temporary prosthesis to an implant placed in a fresh extraction socket to immediately or early after surgery has been previously demonstrated in many studies. For instance, Vanden Bogaerde (2005) placed 50 oxidized surface implants directly into fresh extraction sockets and applied a function the same day (immediate function) or within 7 days (early function) [15]. None of the 50 installed implants had failed at the end of the 18-month observation period, giving an implant survival rate of 100%. At the end of the observation period the mean marginal bone resorption in the total group was 0.9 mm. Of the 38 implants regularly examined by RFA, 19 showed no significant variations in stability from baseline to the 6-month follow-up, whereas 15 showed an increasing stability over time. Early loaded implants inserted into fresh extraction sockets were retrospectively analysed in a study by Nordin et al. [22]. The authors placed 116 implants, 77 of which into fresh, extraction sockets and 39 in healed bone. One hundred and ten implants were loaded by permanent fixed complete dentures within 10 days after placements and six after 14 days. Two implants were lost, giving a 98% of implant survival rate. The radiographic measurements after 2–3 years did not reveal any difference in marginal bone height at the implants placed in extraction sockets vs. in healed bone.

It is concluded that upper lateral and lower incisors can be replaced with 3.25 mm implants according to an immediate loading protocol with high survival rate and minimal marginal bone loss. Moreover, the immediately loaded implants showed an initial dip of stability during the first 4 weeks followed by an an increase with time.

References

  1. Henry P, Rosenberg J (1994) Single-stage surgery for rehabilitation of the edentulous mandible: preliminary results. Pract Periodontics Aesthet Dent 6: 1–8. [crossref]
  2. Ericsson I, Randow K, Nilner K, Petersson A (2000) Immediate functional loading of Brånemark dental implants. A 5-year clinical follow-up study. Clin Implant Dent Relat Res 2: 70–77. [crossref]
  3. Glauser R, Rèe A, Lundgren AK, Gottlow J, Hämmerle C, Schärer P (2001) Immediate occlusal loading of Brånemark implants applied in various jawbone regions: a prospective, 1-year clinical study. Clin Implant Dent Relat Res 4: 204–213. [crossref]
  4. Grunder U (2001) Immediate functional loading of immediate implants in edentulous arches: two-year results. Int J Periodontics Restorative Dent 21:545–551. [crossref]
  5. De Bruyn, H, Raes S, Östman PO, Cosyn J (2014) Immediate loading in partially and completely edentulous jaws: a review of the literature with clinical guidelines. Periodontol 2000 66: 153–87. [crossref]
  6. Froum SJ, Cho SC, Cho YS, Elian N, Tarnow D (2007) Narrow-diameter implants: a restorative option for limited interdental space. Int J Periodontics Restorative Dent 27: 449–455. [crossref]
  7. Motoyoshi M, Hirabayashi M, Uemura M, Shimizu N (2006) Recommended placement torque when tightening an orthodontic mini-implant. Clinical Oral Implants Research 17:109–114. [crossref]
  8. Klein MO, Schiegnitz E, Al-Nawas B (2014) Systematic review on success of narrow-diameter dental implants. Int J Oral Maxillofac Implants 29 Suppl: 43–54. [crossref]
  9. Zinsli B, Sagesser T, Mericske E, Mericske-Sterne R (2004) Clinical evaluation of small diameter ITI implants: a prospective study. Int J Oral Maxillofac Implants 19: 92–99. [crossref]
  10. Quek CE, Tan KB, Nicholls JI (2006) Load fatigue performance of a single-tooth implant abutment system: effect of diameter. Int J Oral Maxillofac Implants 21: 929–936. [crossref]
  11. Maiorana C, King P, Quaas S, Sondell K, Worsaae N, Galindo-Moreno P (2015) Clinical and radiographic evaluation of early loaded narrow-diameter implants: 3 years follow-up. Clin Oral Implants Res 26:77–82. [crossref]
  12. Lambert FE, Lecloux G, Grenade C, Bouhy A, Lamy M, et al. (2015) Less Invasive Surgical Procedures Using Narrow-Diameter Implants: A Prospective Study in 20 Consecutive Patients. J Oral Implantol 41: 693–699. [crossref]
  13. Vanden Bogaerde L, Pedretti G, Dellacasa P, Mozzati M, Rangert B (2003) Early function of splinted implants in maxillas and posterior mandibles using Brånemark System® machined-surface implants: an 18-month prospective clinical multicenter study. Clin Implant Dent Relat Res 5: 21–28. [crossref]
  14. Vanden Bogaerde L, Pedretti G, Dellacasa P, Mozzati M, Rangert B, et al. (2004) Early function of splinted implants in maxillas and posterior mandibles, using Brånemark System® TiUnite™ implants: an 18-month prospective clinical multicenter study. Clin Implant Dent Relat Res 6: 121- 129.
  15. Vanden Bogaerde L., Rangert B, Wendelhag I (2005) Immediate early function of Brånemark System® TiUnite™ implants in fresh extraction sockets in maxillae and posterior mandibles: an 18-month prospective clinical study. Clin Implant Dent Relat Res 7: 121–130. [crossref]
  16. Vanden Bogaerde L, Pedretti G, Sennerby L, Meredith N (2010) Immediate/Early Function of Neoss Implants Placed in Maxillas and Posterior Mandibles: An 18-Month Prospective Case Series Study Clin Implant Dent Relat Res 12: 83–94. [crossref]
  17. Gapski R, Wang HM, Mascarenhas P, Lang NP (2003) Critical review of immediate implant loading. Clin Oral Implants Res 14: 515–527. [crossref]
  18. Meredith N, Alleyne D, Cawley P (1996) Quantitative determination of the stability of the implant-tissue interface using resonance frequency analysis. Clin Oral Implants Res 7: 261–267. [crossref]
  19. Sennerby L, Meredith N (2008) Implant stability measurements using resonance frequency analysis: biological and biomechanical aspects and clinical implications. Periodontol 2000 47: 51–66. [crossref]
  20. Vanden Bogaerde L, Sennerby L (2016) A Randomized Case-Series Study Comparing the Stability of Implant with Two Different Surfaces Placed in Fresh Extraction Sockets and Immediately Loaded. Int J Dent2016: 8424931. [crossref]
  21. Glauser R, Lundgren AK, Gottlow J, Sennerby L, Portmann M, et al. (2003) Immediate occlusal loading of Brånemark TiUnite implants placed predominantly in soft bone: 1-year results of a prospective clinical study. Clin Implant Dent Relat Res 5 Suppl 1: 47–56. [crossref]
  22. Nordin T, Graf J, Frykholm A, Helldén L (2007) Early functional loading of sand-blasted and acid-etched (SLA) Straumann implants following immediate placement in maxillary extraction sockets. Clinical and radiographic result. Clin Oral Implants Res 18: 441–451. [crossref]

L-Ornithine L-Aspartate: Multimodal Therapeutic Agent for Hyperammonemia and Hepatic Encephalopathy in Cirrhosis

DOI: 10.31038/JPPR.2019234

Abstract

L-Ornithine L-aspartate (LOLA) is a 1:1 stable salt of naturally-occurring amino acids L-ornithine and L-aspartic acid. Following oral administration, LOLA is rapidly absorbed dependent on the Na + ion gradient. The elimination half-life is estimated to be in the 30–45 min range with bioavailability of 82.2%. LOLA has the proven capacity to cause lowering of blood ammonia and it does so as a result of multiple established mechanisms. Being a urea cycle intermediate and, more specifically, an activator of carbomyl phosphate synthetase, L-ornithine stimulates ammonia removal as urea by periportal hepatocytes. Both L-ornithine and L-aspartate are substrates for transamination reactions resulting in formation of glutamate, the obligate substrate for glutamine synthetase located in perivenous hepatocytes, skeletal muscle and brain. Increases of brain glutamine correlate with severity of Hepatic Encephalopathy (HE) in patients with cirrhosis. In cirrhosis, the normal pattern of inter-organ trafficking is modified and skeletal muscle replaces the liver as the major ammonia-removing organ. Muscle wasting (sarcopenia) occurs in cirrhosis as a result of exposure to ammonia and this seriously limits its ammonia-lowering capacity lead into a vicious cycle and worsening of hyperammonemia. Trials demonstrate that treatment with LOLA improves muscle function in patients with cirrhosis. There is also evidence to suggest that LOLA also has direct hepato-protective actions in these patients via mechanisms related to the production of antioxidants and the synthesis of nitric oxide leading to improved hepatic microcirculation. Over 20 randomized controlled trials together with systematic analyses with meta-analyses have demonstrated that LOLA is effective for the prevention and treatment of HE in cirrhosis where improvements in mental state occurred as a consequence of the lowering of circulating ammonia.

Keywords

L-Ornithine L-Aspartate, LOLA, Ammonia, Hyperammonemia, Cirrhosis, Hepatic Encephalopathy, Muscle, Sarcopenia, Meta-analysis

Introduction

The ammonia molecule exists in biological systems as an equilibrium between ammonia gas (NH3) and the ammonium ion (NH4)+ dependent upon pH so that, at normal physiological pH, 96% of ammonia is in the ionic form and blood ammonia concentrations are in the 30–50uM range.

A key function of the liver is the removal of excess blood-borne ammonia generated primarily from protein digestion in the intestines and carried to the liver via the portal vein. Hepatic ammonia detoxification occurs by two mechanisms as a function of the identity of the liver cell. In humans, the sites for the synthesis of urea and glutamine are differentially located in the liver acinus. Incorporation ammonia into the molecule of urea takes place in periportal hepatocytes that are known to express genes associated with constituent enzymes of the urea cycle. Scavenging of remaining ammonia then occurs by incorporation into the molecule of glutamine by perivenous hepatocytes expressing the gene coding for Glutamine Synthetase (GS) [1]. Location of these important enzymatic steps in relation to inter-organ trafficking of ammonia between the intestines, liver, skeletal muscle and brain is depicted in a simplified schematic form in Figure 1A.

In chronic liver disease, loss of hepatic parenchyma results in increases in vascular resistance and portal hypertension leading to portal-systemic shunting of ammonia-rich venous blood. Concomitantly, a significant loss of up to 85% of functional periportal and perivenous hepatocytes occurs resulting in severe impairments of hepatic ammonia detoxification (Figure 1B).

JPPR 19 - 118_Roger F Butterworth_F1

Figure 1. Simplified schematic representation of the steps involved in inter-organ trafficking of ammonia between the gut, liver, skeletal muscle, brain and kidney in A: normal individuals compared to B: patients with chronic liver disease and HE.

Recent studies using neuroimaging and spectroscopic techniques confirm the long-held view that ammonia plays a key role in the pathogenesis of Hepatic Encephalopathy (HE) in cirrhosis and, consequently, ammonia-lowering strategies remain the mainstay for the prevention and treatment of HE. Such treatments fall into one of two general types namely those aimed at the reduction of ammonia absorption from the gastrointestinal tract (non-absorbable disaccharides, probiotics and antibiotics) and those aimed at ammonia removal. L-Ornithine L-Aspartate (LOLA) belongs to the latter category.

Pharmacokinetics/Pharmacodynamics of LOLA

LOLA is a 1:1 stable salt of the naturally-occurring amino acids L-ornithine and L-aspartic acid. Orally-administered LOLA is rapidly absorbed by active transport across the brush border of the intestinal epithelium largely dependent on the Na+ ion gradient [2]. L-aspartate is transported by the dicarboxylic amino acid transporter. In the upper gut, LOLA is readily cleaved into its constituent amino acids. The elimination half-life of the constituent amino acids of LOLA has been estimated to be relatively short, in the 30–45 min range with a bioavailability of 82.2% following either oral or intravenous administration.

Mechanisms Responsible for the Ammonia-Lowering Actions of LOLA

Optimization of Ammonia-Removing Metabolic Pathways in Residual Periportal and Perivenous Hepatocytes

Results of studies in isolated hepatocytes have established that urea synthesis from ammonia is limited by the supply of L-ornithine and that L-ornithine requirements for the synthesis of urea are increased as a function of the supply of ammonia [3].

LOLA removes ammonia by supplying L-ornithine , a urea cycle intermediate and activator of the enzyme carbamoyl phosphate synthetase (Figure 2A) leading to increased synthesis of urea and this occurs in cirrhosis in the residual 15–20% of functional periportal hepatocytes.

Both L-ornithine and L-aspartate are substrates for transamination reactions (Figures 2B, 2C) both of which result in increased synthesis of L-glutamate, the obligate substrate for GS (Figure 2D) that is located in perivenious hepatocytes as well as in skeletal muscle and in brain and increased flux through GS in these organs leads to increased glutamine production in patients with cirrhosis and HE where increased brain glutamine signals from Magnetic Resonance Spectroscopic studies are predictors of HE grade in these patients [4].

JPPR 19 - 118_Roger F Butterworth_F2

Figure 2. Metabolic conversions of L-ornithine and L-aspartate via A: elements of the urea cycle, B: ornithine aminotransferase (OAT), C: aspartate aminotransferase (AAT), D: glutamine synthesis (GS).

In a randomized double-blind, placebo-controlled trial, 10 patients with cirrhosis and hyperammonemia were treated with infusions of LOLA (5–40g over 8h). Venous blood ammonia concentrations were lowered in a dose-dependent manner compared to placebo [3].

Prevention of Sarcopenia and Stimulation of Ammonia Removal by Skeletal Muscle

Under normal physiological conditions, skeletal muscle plays a minor role in the process of ammonia removal. However, studies of Arterio-Venous (A-V) differences across the forearm of patients with cirrhosis reveal significant increases of the fractional extraction of ammonia with concomitantly increased release of glutamine [5]. These findings were subsequently confirmed in a study of the dynamics of ammonia metabolism in patients with cirrhosis using 13NH3 Positron Emission Tomography in which increased trapping of ammonia was observed [6].

Studies in experimental animal models of chronic liver disease suggest that the mechanism responsible for the activation of the skeletal muscle pathway for ammonia removal in cirrhosis is underpinned by a post-translational induction of the GS gene [7] but increases in expression of ammonia transporters could also be implicated [8].

Clearly, the physiological and functional integrity of skeletal muscle represents a potential limitation on its capacity to remove blood-borne ammonia and in cirrhosis severe muscle wasting (sarcopenia) is a common complication that is associated with increased mortality and poor post-transplant outcomes [9]. Notably, the fractional extraction of ammonia is significantly decreased in sarcopenic (compared to non-sarcopenic) patients with cirrhosis [5] resulting in the aggravation of hyperammonemia.

To make matters worse, there is emerging evidence to suggest that sarcopenia in cirrhosis is the consequence of exposure of the muscle to ammonia itself [10]. Evidence for this includes the results of in vitro studies and in studies in an experimental animal model of chronic liver disease. For example, exposure of differentiated myotube preparations to ammonia leads to decreases of myotube diameters and protein synthesis as well as increased expression of autophagy markers [11]. Portacaval anastomosis (PCA) in the rat resulted in reduced muscle mass, muscle fibre diameter and grip strength as a function of increases in muscle and blood ammonia.

Based upon the above reports it was suggested that a “vicious cycle” occurs in chronic liver disease whereby hyperammonemia attributed to its decreased hepatic removal leads to muscle dysmetabolism and autophagy typical of sarcopenia which, in turn limits the capacity of skeletal muscle to fulfil its task as alternative pathway for ammonia removal in the form of glutamine resulting in worsening of hyperammonemia and the cycle goes around [12]. A simplified schematic representation of the steps involved in the cycle is provided in Figure 3.

JPPR 19 - 118_Roger F Butterworth_F3

Figure 3. a. Schematic representation of the vicious cycle whereby hyperammonemia resulting from decreased ammonia removal by the liver leads to muscle damage/autophagy and sarcopenia. Sarcopenia results in a serious diminution of the capacity of muscle to remove blood-borne ammonia leading to worsening of hyperammonemia and the vicious cycle continues. b. Schematic representation of the vicious cycle whereby treatment with LOLA results in the lowering of hyperammonemia by multiple mechanisms described in the text which, in turn, relieves the damage to skeletal muscle/sarcopenia, the muscle’s capacity to remove blood-borne ammonia is restored.

LOLA is commonly employed for the treatment of HE in cirrhosis by virtue of its efficacy for lowering of blood ammonia as summarized in a systematic review and meta-analysis [13]. Making use of the PCA rat model of chronic liver failure described above with LOLA and rifaximin results in significant improvements in skeletal muscle mass and muscle fibre diameters as well as grip strength and muscle protein synthesis rates as a function of reduced concentrations of both blood and skeletal muscle concentrations of ammonia [12].

These results add to a growing body of evidence suggesting a role for LOLA in the prevention and treatment of sarcopenia in cirrhosis. More direct evidence is provided by the results of a trial in 16 patients with cirrhosis-related sarcopenia who were randomized to receive LOLA or placebo. Muscle protein synthesis rates in biopsies of anterior tibalis muscle improved markedly in the LOLA treatment group who also manifested such improvements in response to feeding [14].

Direct Hepatoprotective Properties of LOLA

This area of research was founded following the publication of reports of improvements in liver enzymes, total bilirubin and improved mental state following treatment with a large range of doses of the oral formulation of LOLA in large cohorts of patients with fatty liver or cirrhosis [15, 16]. Although uncontrolled and observational in nature, these reports were the first to suggest beneficial effects of LOLA on both liver function and severity of HE in chronic liver diseases. Hepatoprotective properties of LOLA in cirrhosis were subsequently confirmed in Randomized Controlled Trials (RCTs) in patients with cirrhosis and a range of subtypes and degrees of severity of HE where either intravenous or oral formulations of LOLA were found to be effective. Some examples of these trials are:

In an RCT of 120 patients with cirrhosis of predominantly non-alcoholic etiology and mild-to-severe overt HE, treatment with intravenous LOLA (20g/d, 3days) resulted in lowering of blood ammonia, improvements in HE severity and decreases of serum bilirubin together with improvements in Prothrombin Time (PT) [17] suggesting that improved liver function played a significant role. In fact, multivariate analysis showed that Improvement in PT was an independent factor associated with improvement of mental state in grades II-IV HE.

In an RCT of 64 patients with cirrhosis and minimal HE treated with oral LOLA (5g/d tid, 60 days), all showed improvements in psychometric test scores and a slowing of progression to overt HE six months post-treatment [18]. In this trial, significant improvements in Child-Pugh and MELD scores in patients receiving LOLA led the authors to conclude that the lowering of blood ammonia and delayed progression of MHE to OHE was the consequence of improvements in hepatic function. It has been suggested that improvements in MELD scores following treatment with LOLA could have a potential positive impact on liver transplant priority and outcomes [9]. A recent systematic review with meta-analysis demonstrated that LOLA was effective in patients with cirrhosis for OHE prevention and prophylaxis over a range of clinical presentations [19].

In an RCT of 40 patients with cirrhosis having received successful TIPSS placements treated with intravenous LOLA (30g/d, 7 days), lowering of blood ammonia along with improvements in mental state were observed on days 1, 4 and 7 post-TIPSS as well as a slower progression of MHE to OHE. [20] These beneficial effects were accompanied by lowering of blood transaminases and bilirubin together with stabilization of MELD scores. It was suggested that a 7-day prophylactic use of intravenous LOLA would be sufficient to alleviate hepatocellular damage due to TIPSS.

Role of anti-oxidants

Studies of the potential mechanisms responsible for the hepatoprotective properties of LOLA are few in number and are currently focused on the synthesis of agents derived from the conversion of the constituent amino acids of LOLA to agents with established anti-oxidant properties such as glutathione (GSH) and glutamine [21].

Conversion of L-ornithine or L-aspartate to glutamate occurs by way of metabolic conversions depicted in Figures 2A, B above and the synthesis of glutamine from glutamate occurs readily in liver and skeletal muscle via the enzyme GS. There has been a recent upsurge of interest in the role of glutamine in anti-oxidant pathways in general and as a hepato-protective agent in chronic liver disease. In an experimental animal model of non-Alcoholic Fatty Liver Disease (NAFLD), oral glutamine supplementation was found to be hepato-protective via inhibition of NF-kB p65 expression and improvement of hepatic steatosis [22, 23]. The hepatoprotective effect of glutamine did not appear to be mediated via increased conversion of glutamine to GSH [22].

Synthesis of GSH from glutamate (Figure 4), cysteine and glycine is catalyzed by two enzymes g-glutamylcysteine synthetase and GSH synthetase acting in sequence [24]. In studies of HE in animals with toxic liver injury characterized by increased liver transaminases and bilirubin, levels of GSH were found to be significantly reduced [25]. Treatment with LOLA resulted in attenuation of the increased transaminases and bilirubin concomitant with normalization of GSH levels.

JPPR 19 - 118_Roger F Butterworth_F4

Figure 4. Possible mechanisms whereby L-ornithine L-aspartate (LOLA) exerts hepatoprotection properties mediated by the conversion of L-ornithine to L-glutamate followed by the synthesis of established antioxidants L-glutamine and glutathione (GSH). In parallel, the conversion of L-ornithine to L-arginine via the urea cycle provides the substrate for production of nitric oxide (NO) via the enzyme nitric oxide synthase (NOS) with the potential to improve hepatic microcirculation.

Role of nitric oxide

An alternative (or additional) mechanism implicated in the hepato-protective properties of LOLA involves the increased production of Nitric Oxide (NO). Studies in experimental animals and in patients with cirrhosis have consistently shown that LOLA treatment results in increased synthesis of L-arginine [3, 26] and L-arginine is the obligate substrate for Nitric Oxide Synthase (NOS) the enzyme responsible for the synthesis of NO (Figure 4). Moreover, the administration of L-arginine to animals with experimental steatosis has been shown to result in improvements in hepato-vascular perfusion [27]. Improved hepatic micro-perfusion has the potential to provide a second possible mechanism whereby LOLA treatment results in hepato-protection.

Clinical Efficacy of LOLA for The Prevention and Treatment of HE in Cirrhosis: The Evidence Based Upon the Results of Randomized Controlled Trials, Systematic Reviews and Meta-Analyses

Beneficial effects of LOLA on blood ammonia and mental state have been reported in over 20 randomized controlled clinical trials (RCTs), the findings from the majority of which have been published in peer-reviewed biomedical journals. In the 2000–2017 period results of systematic reviews with meta-analysis started to appear. [28–31] However, most of these analyses gave were performed using data from limited numbers of trials and/or were published in abstract form only resulting in limited information with respect to trial quality and risk of bias assessments that are essential for the interpretation of their findings. Moreover, the findings themselves were inconsistent with reports of efficacy of LOLA for the treatment of a range of HE presentations including MHE and OHE [30] but no such efficacy of LOLA on MHE by other investigators [29, 31]. Assessment of the effects of LOLA on blood ammonia was made in only 2 of the 4 studies, one in fasting blood samples [30], the other following post-prandial sampling [28]. No efforts were made in these studies to separately assess the efficacy of intravenous and oral formulations of LOLA on either the lowering of blood ammonia or on mental state.

In view of these inconsistent findings and generally poor quality of the studies noted above, it was not surprising that the AASLD/EASL committee responsible for the preparation of guidelines for the use of various agents for use in the treatment of HE in cirrhosis (published in 2014) expressed rather limited enthusiasm for LOLA compared to alternative agents [32]. In fact, the Guidelines Committee had managed to identify only a single RCT upon which to base their recommendations.

Consequently, a new systematic review with meta-analysis was undertaken with the objectives of assessment of the evidence base with respect to the efficacy of LOLA for the prevention and treatment of HE in cirrhosis based upon the results of RCTs [13, 33]. Efficacy was defined by two parameters; firstly, the ability of LOLA to cause significant reductions of blood ammonia and secondly, LOLA‘s effects on improvement in mental status. Subgroup analysis was used to assess efficacy in patients with MHE or OHE and for prevention of deterioration of MHE to OHE in suitably-designed trials. Efficacy of intravenous and oral formulations of LOLA was independently assessed by subgroup analysis.

Ammonia-lowering action of LOLA in Patients with Cirrhosis-Related HE

Figure 5 represents Forest plots showing the pooled effect of LOLA compared to placebo/no intervention on blood ammonia in 709 patients with cirrhosis-related HE (either MHE or OHE) [17, 18, 34–39]. LOLA was found to be consistently effective with MD of -17.50, [95% CI: -27.73 to -7.26], test for overall effect: Z = 3.35, p = 0.0008.

JPPR 19 - 118_Roger F Butterworth_F5

Figure 5. Forest plot indicating the pooled effect of LOLA (either oral or intravenous formulation) versus placebo/no intervention for the efficacy of lowering of hyperammonemia in patients with cirrhosis and HE. RR: Risk Ratio, CI: Confidence interval, SD: standard deviation.

Moreover, as shown by the analysis of the data in Table 1, both intravenous and oral formulations were found to be effective for lowering of blood ammonia in these trials.

Table 1. Pooled effects of intravenous (iv) or oral formulations of LOLA compared to placebo/no intervention (control) on blood ammonia concentrations in patients with cirrhosis and HE

Trial endpoint

Number of patients

MD

95% CI

Z score

p-value

LOLA

Control

NH3 lowering (total)

355

354

–17.5

[–27.73, –7.25]

3.35

0.0008

NH3 lowering (iv LOLA)

262

258

–27.16

[–44.77, –9.56]

3.02

0.002

NH3 lowering (oral LOLA)

93

95

–8.44

[–12.42, –4.46]

4.16

<0.0001

Effect of LOLA on Improvement of Mental State in Patients with Cirrhosis-Related HE

Figure 6 represents Forest plots indicating the pooled effect of LOLA compared to placebo/no intervention on improvement of mental state in 843 patients diagnosed with MHE or OHE according to psychometric test procedures or Westhaven criteria respectively [17, 18, 34–41]. In 8/9 trials, treatment effect favored LOLA with RR of 1.36 [95% CI: 1.10, 1.69], test for overall effect, Z = 2.82, p<0.005.

JPPR 19 - 118_Roger F Butterworth_F6

Figure 6. Forest plot indicating the pooled effect of LOLA (either oral or intravenous formulation) versus placebo/no intervention for the efficacy of improvement of mental state in patients with cirrhosis and MHE or OHE. RR: Risk Ratio, CI: Confidence Interval.

Subgroup analysis revealed that LOLA was effective for improvement of mental state in trials of patients with MHE or OHE [13] and, in the case of MHE trials, the oral formulation of LOLA (4 trials) appeared to be superior to that of the intravenous formulation (2 trials) for improvement of mental state (Table 2).

Table 2. Pooled effects of intravenous (iv) or oral formulations of LOLA compared to placebo/no intervention (control) on mental state improvement in patients with cirrhosis and HE

Trial endpoint

number of patients

RR

95% CI

Z score

p-value

LOLA

Control

Mental state (all HE)

424

419

1.36

[1.10, 1.69]

2.82

0.005

Mental state (OHE)

282

269

1.19

[1.01, 1.39]

2.14

0.03

Mental state (MHE)

142

150

2.15

[1.48, 3.14]

3.98

<0.0001

Mental state (MHE, iv)

32

33

1.67

[0.90, 3.08]

1.64

0.10/ns

Mental state (MHE, oral)

110

117

2.54

[1.54, 4.18]

2.54

0.0002

Efficacy of LOLA Compared to other Therapeutic Agents

In a head-to-head RCT comparing LOLA with the non-metabolizeable dissaccharide lactulose, decreases in blood ammonia that were comparable in magnitude were reported [42] but only patients in the LOLA treatment arm of the trial showed significant improvements in psychometric test scores, Westhaven criteria scores, asterixis grades and EEG activity. Subsequent RCTs confirmed the comparable efficacies of LOLA with other agents including lactulose, riraximin and probiotics for improvements in psychometric test and Critical Flicker Frequency (CFF) test scores as well as for the prevention of deterioration from MHE to OHE [38, 41].

A particular type of meta-analysis known as network meta-analysis has been employed on two occasions in which the efficacy of LOLA was compared with other commonly-prescribed agents used for the treatment of HE in cirrhosis [43, 44]. In the first such analysis, only treatment with LOLA or Branched-Chain Amino Acids (BCAAs) were effective in improving OHE with trends towards improvement reported for lactulose, neomycin and rifaximin. Only LOLA treatment resulted in significant lowering of blood ammonia [43]. In a second network analysis, rifaximin, LOLA and BCAAs were found to be superior to lactulose or probiotics and LOLA was found to reduce the risk of deterioration of MHE to OHE [44].

LOLA for OHE prophylaxis and future indications

OHE occurs in up to 50% of patients with cirrhosis following the Transjugular Intrahepatic Portosystemic Stent Shunt (TIPSS) procedure for the management of complications of portal hypertension and refractory ascites. An RCT of 40 TIPSS patients demonstrated that intravenous LOLA (30g/d, 7 days) was effective for the lowering of blood ammonia leading to improvements in psychometric test scores and a slowing of progression to OHE. Moreover, in this study, improvements in liver enzymes, bilirubin and MELD scores were also reported consistent with improvements in liver function [45].

The effectiveness of LOLA for secondary OHE prophylaxis in patients with cirrhosis has been demonstrated in a double-blind RCT of 150 patients [46] in which the probability of developing OHE was reduced and the time to breakthrough of HE was significantly slowed in LOLA-treated patients compared to placebo. These benefits were accompanied by significant reductions of blood ammonia and improvements in CFF scores.

More recently, in a placebo-controlled RCT in patients with cirrhosis and variceal bleeding, treatment with LOLA or rifaximin was found to be effective in preventing the primary development of HE in these patients [46]. If confirmed, these interesting findings may herald the start of the more widespread use of LOLA for primary HE prophylaxis in patients with cirrhosis.

Funding: Financial support for research conducted in the author’s Research Unit and related publications were provided by The Canadian Institutes of Health Research.

References

  1. Kaiser S, Gerok W, Häussinger D (1988) Ammonia and glutamine metabolism in human liver slices: new aspects on the pathogenesis of hyperammonaemia in chronic liver disease. Eur J Clin Invest 18: 535–542.
  2. Kircheis, G and Lüth, S (2019) Pharmacokinetic and Pharmacodynamic Properties of L-Ornithine L-Aspartate (LOLA) in Hepatic Encephalopathy. Drugs 79: 23–29.
  3. Staedt U, Leweling H, Gladisch R, Kortsik C (1993) Effects of ornithine aspartate on plasma ammonia and plasma amino acids in patients with cirrhosis. A double-blind, randomized study using a four-fold crossover design. J Hepatol 19: 424–430.
  4. Laubenberger J, Haussinger D, Boyer S, Gufler H (1997) Protein magnetic resonance spectroscopy of brain in symptomatic and asymptomatic patients with liver cirrhosis. Gastroenterology 112: 1610–1616.
  5. Ganda OP, Ruderman NB (1976) Muscle nitrogen metabolism in chronic hepatic insufficiency. Metabolism  25: 427–435.
  6. Lockwood AH, Weissenborn K, Butterworth RF (1997) An image of the brain in patients with liver disease. Curr Opin Neurol 10: 525–533. [crossref]
  7. Desjardins P, Rao KV, Michalak A, Rose C (1999)  Effect of portacaval anastomosis on glutamine synthetase protein and gene expression in brain, liver and skeletal muscle. Metab Brain Dis 14: 273–280.
  8. Takeda K, Takemasa T (2015) Expression of ammonia transporters Rhbgand RHcg inmouse skeletalmuscle and the effects of 6-week training on these proteins. Physiol Rep 3: 12596.
  9. Butterworth, RF (2019) L-ornithine L-aspartate for the Treatment of Sarcopenia in Cirrhosis: Potential Impact on the Outcome of Liver Transplantation. Ann Gastroenterol Dig Dis 2: 006–009.
  10. Qiu J, Tsien C, Thapalaya S, Narayanan A (2012) Hyperammonemia mediated autophagy in skeletal muscle contributes to sarcopenia of cirrhosis. Am J Physiol Endocrinol Metabol  303: 983–993.
  11. Kumar A, Davuluri G, Silva RNE, Engelen MPKJ (2017) Ammonia lowering reverses sarcopenia of cirrhosis by restoring skeletal muscle proteostasis. Hepatology 65: 2045–2058.
  12. Butterworth RF (2019) L-Ornithine L-Aspartate for the Treatment of Sarcopenia in Chronic Liver Disease: The Taming of a Vicious Cycle. Can J Gastroenterol Hepatol Article ID 8182195.
  13. Butterworth RF, Kircheis G, Hilger N, McPhail MJW (2018) Efficacy of l-ornithine l-aspartate for the treatment of hepatic encephalopathy and hyperammonemia in cirrhosis: systematic review and meta-analysis of randomized controlled trials. J Clin Exp Hepatol 8: 301–313.
  14. Reynolds N, Downie S, Smith K, Kircheis G (1999) Treatment with L-ornithine-L-aspartate infusion restores muscle protein synthesis responsiveness to feeding in patients with cirrhosis. J Hepatol 30: 65.
  15. Gruengreiff, K, Lambert-Baumann J (2001) Efficacy of L-ornithine L-aspartate granules in chronic liver diseases. MedWelt 52: 219–226.
  16. Butterworth RF, Gruengreiff K (2018) L-ornithine L-aspartate (LOLA) for the treatment of hepatic encephalopathy in cirrhosis: evidence for novel hepatoprotective mechanisms. J Liver Clin Res 5: 1044.
  17. Abid S, Jafri W, Mumtaz K, Islam M (2011) Efficacy of l-ornithine-l-aspartate as an adjuvant therapy in cirrhotic patients with hepatic encephalopathy. J Coll Phys Surg Pak 21: 666–671.
  18. Alvares-da-Silva MR, de Araujo A, Vicenzi JR, da Silva GV (2014) Oral L-ornithine L-aspartate in minimal hepatic encephalopathy: randomized double-blind placebo-controlled trial. Hepatol Res 44: 956–963.
  19. Butterworth RF (2019) Beneficial effects of L-Ornithine L-Aspartate for prevention of overt hepatic encephalopathy in patients with cirrhosis: a systematic review with meta-analysis. Metab Brain Dis under review.
  20. Bai M, He C, Yin Z, Niu J (2014) Randomised clinical trial: L-ornithine-L-aspartate reduces significantly the increase of venous ammonia concentration after TIPSS. Aliment Pharmacol Ther 40: 63–71.
  21. Butterworth RF, Canbay A (2019) Hepatoprotection by L-Ornithine L-Aspartate in Non-Alcoholic Fatty Liver Disease. Dig Dis 37: 63–68. [crossref]
  22. Lin Z, Cai F, Lin N, Ye J (2014) Effects of glutamine on oxidative stress and nuclear factor-?B expression in the livers of rats with non-alcoholic fatty liver disease. Exp Ther Med 7: 365–370.
  23. Sellmann C, Jin CJ, Degen C, De Bandt JP et al. (2015) Oral glutamine supplementation protects female mice from non-alcoholic steatohepatitis. J Nutr 145: 2280–2286.
  24. Wu G, Fang YZ, Yang S, Lupton JR, Turner ND (2004) Glutathione metabolism and its implications for health. J Nutr 134: 489–492. [crossref]
  25. Najmi AK, Pillai KK, Pal SN, Akhtar M (2010) Effect of L-ornithine L-aspartate against thioacetamide-induced hepatic damage in rats. Ind J Pharmacol 42: 384–387.
  26. Rose C, Michalak A, Pannunzio P, Therrien G (1998) L-Ornithine L-aspartate in experimental portal-systemic encephalopathy: therapeutic efficacy and mechanism of action. Metab Brain Dis 13: 147–157.
  27. Ijaz S, Yang W, Winslet MC, Seifalian AM (2005) The role of nitric oxide in the modulation of hepatic microcirculation and tissue oxygenation in an experimental animal model of hepatic steatosis. Microvasc Res 70: 129–136.
  28. Delcker AM, Jalan R, Schumacher M, Comes G (2000) L-ornithine-L-aspartate versus placebo in the treatment of hepatic encephalopathy: a meta-analysis of randomised placebo-controlled trials using individual data. Hepatology  4: 604.
  29. Jiang Q, Jiang XH, Zheng MH, Chen YP (2009) L-Ornithine-l-aspartate in the management of hepatic encephalopathy: a meta-analysis. J Gastroenterol Hepatol 24: 9–14. [crossref]
  30. Bai M, Yang Z, Qi X, Fan D (2013) L-Ornithine L-aspartate for hepatic encephalopathy in patients with cirrhosis: a meta-analysis of randomized controlled trials. J Gastroenterol Hepatol 28: 783–792.
  31. Goh ET, Stokes CS, Vilstrup H, Gluud LL (2017) L-Ornithine L-aspartate for hepatic encephalopathy: a systematic review with meta-analysis of randomised controlled trials. J Hepatol 66: 131.
  32. Vilstrup H, Amodio P, Bajaj J, Cordoba J (2014) Hepatic encephalopathy in chronic liver disease: 2014 practice guidelines by the American Association for the study of Liver Disease and the European Association for the Study of the Liver. Hepatology 60: 715–735.
  33. Butterworth RF, McPhail MJW (2019) L-Ornithine L-aspartate for hepatic encephalopathy in cirrhosis: results of randomized controlled trials and meta-analysis. Drugs 79: 31–37.
  34. Kircheis G, Nilius R, Held C, Berndt H (1997) Therapeutic efficacy of L-ornithine L-aspartate infusions in patients with cirrhosis and hepatic encephalopathy: results of a placebo-controlled, double-blind study. Hepatology 25: 1351–1360.
  35. Stauch S, Kircheis G, Adler G, Beckh K (1998) Oral L-ornithine L-aspartate therapy of chronic hepatic encephalopathy: results of a placebo-controlled, double-blind study. J Hepatol 28: 856–864.
  36. Chen M, Li R, Chen C, Gao X (2005) Observation of clinical effect of L-ornithine L-aspartate therapy on liver cirrhosis complicated by hepatic encephalopathy. Chin Libr Class 2588: 06-718-02.
  37. Schmid M, Peck-Radosavljevic M, König F, Mittermaier C (2010) A double-blind randomized, placebo-controlled trial of intravenous L-ornithine L-aspartate on postural control in patients with cirrhosis. Liver Int 30: 574–582.
  38. Mittal VV, Sharma BC, Sharma P, Sarin SK (2011) A randomized controlled trial comparing lactulose, probiotics, L-ornithine L-aspartate in treatment of minimal hepatic encephalopathy. Eur J Gastroenterol Hepatol  23: 725–732.
  39. Sidhu SS, Sharma BC, Goyal O, Kishore H (2018) L-Ornithine L-aspartate in bouts of hepatic encephalopathy. Hepatology 67: 700–710.
  40. Ahmad I, Khan AA, Alam A, Dilshad A, Butt AK, et al. (2008) L-ornithine-L-aspartate infusion efficacy in hepatic encephalopathy. J Coll Physicians Surg Pak 18: 684–687. [crossref]
  41. Sharma K, Pant S, Misra S, Dwivedi M (2014) Effect of rifaximin, probiotics and L-ornithine L-aspartate on minimal hepatic encephalopathy: a randomized controlled trial. Saudi J Gastroenterol 20: 225–232.
  42. Poo JL, Gongora J, Sanchez-Avila F, Aguilar-Castillo S (2006) Efficacy of oral L-ornithine L-aspartate in cirrhotic patients with hyperammonemic hepatic encephalopathy. Results of a randomized, lactulose-controlled study. Ann Hepatol 5: 281–288.
  43. Zhu GQ, Shi KQ, Huang S, Wang LR (2015) Systematic review with network meta-analysis: the comparative effectiveness and safety of interventions in patients with overt hepatic encephalopathy. Aliment Pharacol Ther 41: 624–635.
  44. Thumburu KK, Dhiman RK, Chopra M, Dutta U (2017) Comparative effectiveness of different pharmacological interventions for the treatment of minimal hepatic encephalopathy: a systematic review with network meta-analysis. J Clin Exp Hepatol 7: 6–7.
  45. Varakanahalli S, Sharma BC, Srivastava S, Sachdeva S (2018) Secondary prophylaxis of hepatic encephalopathy in cirrhosis of liver: a double-blind randomised controlled trial of L-ornithine L-aspartate versus placebo. Eur J Gastroenterol Hepatol.
  46. Higuera-de-la-Tijera F, Servin-Caamano AI, Salas-Gordillo F, Perez-Hernandez JL (2018) Primary prophylaxis to prevent the development of hepatic encephalopathy in cirrhotic patients with acute variceal bleeding. Can J Gastroenterol Hepatol 3015891.

Severe acute respiratory infection and viral infections in adult patients: active surveillance results

DOI: 10.31038/JCRM.2019231

Abstract

Severe acute respiratory syndrome (SARI) is a compulsory notification disease. The new molecular biology-based diagnostic methodologies have increased sensitivity for respiratory viruses (RVs) identification, evidencing their representativeness in SARI. Usually, they account for 22% of community-acquired pneumonias in adults. However, the epidemiology and burden of these infections in adults with SARI remain unclear. This study aimed to determine the clinical, epidemiological, risk factors and mortality rate of hospitalized adults with SARI, based on virus positivity. This descriptive, cross-sectional study included patients with SARI aged over than 14 years who were hospitalized from 2010 to 2016. A total of 592 cases were identified, of which 295 (49.8%) had samples collected. A total of 113 (38.4%) patients tested positive for RVs, and most of them were infected with influenza viruses (30.1%). Death occurred in 27.5% vs. 17.7% (p=0.09) of patients in the negative and positive virus group, respectively. SARI is an important condition in hospitalized adults, and is caused predominantly by influenza. It is associated with high mortality, independent of its etiology, without significant difference among those infected by positive or negative viruses.

Keywords

respiratory infections, respiratory viruses, influenza, and epidemiologic surveillance

1. Introduction

Lower respiratory tract infections are the leading cause of global morbidity and mortality, accounting for 292 million cases and 2.7 million deaths in 2015 [1]. The incidence reaches to 24.8 cases/100, 000 adults and 164.3 cases/100, 000 elderly people over 80 years old [2]. In Brazil, respiratory diseases are the fourth cause of death, concentrating on the extremes of age and in population with low socioeconomic status [3]. Community-acquired pneumonia (CAP) are caused by respiratory viruses (RVs) in 22.4% of cases according to a meta-analysis [4], which is the main etiologic agent in adults hospitalized, as reported in a US population study [2]. Influenza viruses (IFV) are among the major etiologies of CAP in adults, and influenza A H1N1pdm has been associated with more severe cases [5].

RVs can occur through monoinfection or coinfection with other viruses or bacteria [6] and may lead to severe forms [7, 8]. Some clinical factors in CAP are mostly associated with viral infections such as rhinorrhea and ground-glass opacity on computed tomography [9], but clinical and radiological signs should not be used alone to determine the etiology, due to the overlap of findings with other etiological agents [10].

Multiplex PCR-based diagnostic methods have been used to investigate cases of severe acute respiratory infection (SARI) identified by influenza virus surveillance [11, 12]. This methodology allowed the identification of multiple viral pathogens. In addition, to the benefit of epidemiological knowledge, the identification of virus in a clinical sample makes it possible to diagnose the etiology, support control measures to prevent transmission, and, together with clinical and laboratory data, guide antibiotics stewardship [13].

The high potential for pathogenicity of FLUs, human parainfluenza viruses (HPIVs), human adenovirus (HAdV), human respiratory syncytial viruses (HRSVs), and human metapneumovirus (HMPV) is well recognized [14]. Although there are difficulties in interpreting the detection of other RVs such as human rhinovirus (HRV), human bocavirus (HBoV), human enterovirus (HEV), and human coronaviruses (HCoVs), although evidence showed that they are associated with the development of lower respiratory tract infections [15–17].

In this study, we evaluated the clinical and epidemiological aspects of SARI in hospitalized adults identified during influenza active surveillance, and compared the clinical findings and outcomes based on virus positivity.

2. Materials and Methods

A cross-sectional study was performed to provide information on the active surveillance of influenza in hospitalized patients. In Brazil, notification of SARI is mandatory, and in the Hospital de Clínicas Complex, a tertiary academic hospital in southern Brazil, an active surveillance is conducted to detect cases, notify and collect samples to investigate RVs. Clinical, laboratory, Charlson comorbidity index, and outcome data are updated in a specific form after discharge or death. The Ethics Committee for Institutional Research approved this study (#18714013.4.0000.0096).

To be included, eligible patients were identified in the influenza active surveillance and older than 14 years. The following data were evaluated: age, sex, race, comorbidities, Charlson comorbidity index score, number of intensive care unit admissions, use of mechanical ventilations, death, collection or non-collection of specimen to detect the presence of a RV, antiviral use, time of symptom onset, period of hospitalization, and initiation of antiviral therapy (when performed), number of virus isolated, and identification of the virus isolated in case of positivity. The distribution of positive cases was evaluated monthly, as well severe cases and deaths. Severe disease was considered in case of ICU hospitalization, mechanical ventilation, or death.

Viral laboratory investigation was carried out using a multiplex PCR technology (Seeplex® RV15 ACE Detection Kit, Seegene Inc., Korea), which enables the simultaneous detection of 15 RVs: HAdVs; HMPV; HPIVs types 1, 2, 3, and 4 (HPIV-1, HPIV-2, HPIV-3, and HPIV-4); IFVA subtypes H1N1pdm and H3N2; IFV type B; HRSVs types A and B (HRSVA and HRSVB); HRV types A, B, and C; HEV; HBoV; and HCoV types 229E/NL63 (alpha coronaviruses) and OC43/HKU1 (beta coronaviruses). Clinical findings and outcome between groups with positive and negative viruses were evaluated.

2.1 Statistical analysis

A statistical analysis was carried out using the program XLSTAT version 2018.2.50494. Baseline demographic and clinical characteristics with normal and non-normal distributions were presented as means ± standard deviation and medians with interquartile ranges, respectively. Fisher’s exact test, independent t-test, Wilcoxon-Mann‐Whitney test, and U tests were used where appropriate. Odds ratios (ORs) and 95% confidence intervals (CIs) were calculated for the variables included. For the results in which the observed frequencies were less than 5, no statistical analysis was performed.. The level of significance was set at p<0.05. Time-to-event analyses (discharge or death) were performed using the Kaplan-Meier method.

3. Results

In the study period, a total of 1, 840 SARI cases were notified, of which 592 (32%) were from patients over 14 years old. Of these, only 295 (49.8%) patients were evaluated to detect RVs, and 113 (38.3%) of these cases were positive (Figure 1).

JCRM 2019-111 - Sonia Raboni Brazil_F1

Figure 1. Flow chart of study design

Of the positive cases, influenza viruses were the most frequent pathogen (34 cases, 30.1%), and IFVA H1N1pdm represented more than half of IFVs samples (Fig 2B). HRV were present in 23.3%, HRSV in 13.8%, HPIV in 13%, HCoV in 7.2%, HAdV in 7.2%, HEV in 6.5% and HMPV in 4.3% of positive cases (Fig 2A). Monoinfection was detected in 89 cases (78.8%), and viral coinfection with 2 and 3 viruses were observed in 23 (20.4%) cases and 1 (0.9%) case, respectively.

JCRM 2019-111 - Sonia Raboni Brazil_F2

Figure 2. Respiratory viruses detected and influenza virus distribution

Patients whose samples were positive or negative for RVs had their demographic, clinical, and laboratory findings compared. No statistical difference was observed between both groups, except for the duration of symptoms until hospital admission that was higher in patients with negative results (p = 0.019). Mortality was also higher in patients with negative test results (27.5% vs. 17.7%, p = 0.09), but with no significant difference (Table 1).

Table 1. Demographic, clinical, and laboratory findings among positive and negative cases for respiratory viruses

 Characteristics

Total

N = 295 (%)

Positive virus

N = 113 (%)

Negative virus
N = 182 (%)

p-value

Age – median (IQR)

45.1 (30.8/60.3)

43.7 (29.2/61.3)

45.7 (33.1/59.6)

0.521

>14–<=18

19 (6.5)

7 (6.2)

12 (6.6)

NS

> 18–<=50

152 (51.6)

60 (53.1)

92 (50.6)

>50

124 (42.1)

46 (40.8)

78 (42.9)

Gender

female

135 (45.8)

57 (50.5)

78 (42.9)

0.229

IFV vaccine last season

60 (20.4)

27 (23.9)

33 (18.2)

0.237

Signs/symptoms

Dyspnea

287 (97.3)

109 (96.5)

178 (97.9)

0.487

Desaturation (O2Sat <95%)

192 (80.7)

72 (78.3)

120 (82.2)

0.709

respiratory discomfort

192 (85.4)

75 (86.3)

117 (84.8)

0.801

Comorbidities (yes)

228 (77.3)

93 (82.4)

135 (74.2)

0.117

Pneumopathy

93 (31.6)

40 (35.4)

53 (29.2)

NS

Cardiopathy

53 (18.1)

19 (16.9)

34 (18.8)

Immunodeficiency

106 (36.1)

47 (41.6)

59 (32.6)

Other comorbidities

130 (44, 1)

47 (41.6)

83 (45.6)

Pregnant/puerperium

15 (5.1)

9 (8)

6 (3.3)

NS

Charlson comorbidity index score

0

89 (30.6)

27 (24.4)

62 (34.5)

NS

1–2

105 (36.1)

49 (44.2)

56 (31.2)

3–4

68 (23.4)

21 (19)

47 (26.2)

>=5

29 (10)

14 (12.7)

15 (8.4)

Duration of symptoms until hospital admission – days (IQR)

4 (1.5/7)

3 (3/6)

4 (2/7)

0.019

Pulmonary X-ray

Normal

30 (11.6)

14 (15.3)

16 (9.6)

NS

Interstitial pattern

119 (46)

42 (45.7)

77 (46.2)

Consolidation

80 (30.9)

27 (29.4)

53 (31.8)

Mixed pattern

24 (9.3)

12 (13.1)

12 (7.2)

Other

22 (8.5)

7 (7.7)

15 (9)

Severe disease

196 (75, 7)

69 (75)

127 (76.1)

0, 129

Mechanical ventilation

130 (44.3)

42 (37.5)

88 (48.4)

NS

ICU

189 (64.3)

64 (57.2)

125 (68.7)

Death

70 (23.8)

20 (17.7)

50 (27.5)

IQR = interquartile range. NS = not significant. In bold = significant value

No significant difference was observed between patients infected with IFVs and those infected with other RVs (ORVs). Severe disease was found in 70.9% and 77% (p = 0.93) of cases and the mortality rate was 22.3% and 21% (p = 0.91), respectively. A Kaplan-Meier curve comparing monoinfection by IFV and ORV cases did not show a statistical difference (p = 0.91) (Fig 3).

JCRM 2019-111 - Sonia Raboni Brazil_F3

Figure 3. Kaplan-Meier curve comparing influenza vs. other respiratory virus infection

Comparing the clinical and laboratory findings of fatal and non-fatal cases, no significant differences were observed regarding presence of comorbidities, Charlson score and X-ray findings, only the identification of more than 1 virus were more common in non-fatal cases (10.3 vs. 1.5%, p = 0.02), although no signification association to a specific virus was observed (Table 2).

Table 2. Demographic, clinical, and laboratory findings of fatal and non-fatal cases

 Characteristics

Total cases with collected samples (N = 295)

Fatal cases (N = 70)

Non-fatal cases (N = 225)

p-value

Age – median (IQR)

45.1 (30.8/60.3)

47.9 (32.8/57.9)

44.5 (29.9/60.9)

0.477

Gender – Female

135 (45.8)

25 (35.8)

110 (48.9)

0.056

Influenza vaccine last season

60 (20.4)

8 (11.5)

52 (23.2)

0.046

Signs/symptoms

Dyspnea

287 (97.3)

68 (97.2)

219 (97.4)

1.000

Desaturation

192 (80.7)

47 (87.1)

145 (78.9)

0.774

Comorbidities (yes)

228 (77.3)

58 (82.9)

170 (75.6)

0.253

Virus result

Positive

113 (38.4)

20 (28.6)

93 (41.4)

0.067

IFV

34 (11.6)

6 (8.6)

28 (12.5)

0.520

IFV A H1N1pdm

19 (6.5)

3 (4.3)

16 (7.2)

NA*

IFV A H3N2

9 (3.1)

1 (1.5)

8 (3.6)

IFV not subtyped

2 (0.7)

0 (0)

2 (0.9)

IFV B

4 (1.4)

2 (2.9)

2 (0.9)

HRV

32 (10.9)

5 (7.2)

27 (12)

NA*

HRSV

19 (6.5)

2 (2.9)

17 (7.6)

HPIV

18 (6.2)

3 (4.3)

15 (6.7)

HAdV

10 (3.4)

1 (1.5)

9 (4)

HCoV

10 (3.4)

2 (2.9)

8 (3.6)

HEV

9 (3.1)

1 (1.5)

8 (3.6)

HMPV

6 (2.1)

1 (1.5)

5 (2.3)

Number of virus identified

1

89 (30.2)

19 (27.2)

70 (31.2)

0.555

>1

24 (8.2)

1 (1.5)

23 (10.3)

NA*

In bold: significant values; IQR = interquartile range; NS = Not significant; NA = Not applicable; *Frequency < 5

4. Discussion

Due to the importance of RVs in SARI, high morbidity and mortality, and the capacity to cause outbreaks and pandemics, clinical and epidemiological studies must be conducted to improve RVs knowledge, mainly in developing countries [18]. As a result of the high representativeness of RVs in pediatrics, few data are specific for the adult population, especially in Brazil and Latin American countries. In this study we showed a high prevalence of respiratory viral infection among adult SARI patients.

In recent years, there has been an important improvement in the knowledge on the epidemiological aspects of the etiology of CAP. This probably occurred after the introduction of vaccines for Streptococcus pneumoniae and Haemophilus influenzae and, especially, access to new molecular diagnostic methods (PCR) [19, 20], which considerably increased the sensitivity for the identification of RVs. The notification of SARI in adults accounted for practically one-third of the cases. The active surveillance guarantees the identification of almost all cases, but only half of them had virus sampling performed due to the low adherence to epidemiological surveillance procedures. In this study, among the samples collected, 38.3% were positive for some RVs, similar to the incidence previously reported [21], and confirming the importance of viruses as the main cause of SARI in this population.

Comparing virus positive and negative cases, no clinical and demographic difference was found, nor in the proportion of severe cases and deaths, despite the increasing mortality among negative cases. Unfortunately, no systematic investigation has been performed for other etiologic agents. Bacterial infections are present in 14%–23% of patients with community-acquired pneumonia, but no etiologic agent was identified in 46%–62% of the cases [2, 22]. Therefore, in our study, some of the negative cases are probably bacterial infections, or even viral infections, which were not identified by the method used to evaluate the case. Furthermore, patients with negative results had a significant higher duration of symptoms until hospital admission, which could contribute for viral negative results.

Regarding the viruses identified, the importance of the influenza virus in the adult population studied was confirmed, being present in 11.6% of the SARI cases with virus investigation and in 30.1% of the positive cases for RVs. Similar this finding, the IFVs were the major pathogen associated with the development of community-acquired pneumonia in adults, according to a previous meta-analysis (4). However, the differences between the results of epidemiological studies on RVs may be related to geographic location and seasonal factors. In the present study, we decided to collect the data from 2010, following the 2009 pandemic, which was considered as an atypical year in relation to the clinical and epidemiological aspects of RVs infections.

Regardless of RVs detection (positive or negative), high lethality was found among cases of SARI (23.8%), reaching 34.9% between cases requiring ICU and 45.4% among those who required mechanical ventilation. Therefore, all hospitalized patients who met the SARI criteria, notwithstanding of etiology and presence or absence of comorbidities, should be considered as high risk for poor outcome.

Also, viral coinfected patients had higher mortality rates than monoinfected individuals (p<0.02), but the low frequency of viral monoinfection in the studied group hinders any conclusion. We have previously reported a similar finding after comparing patients with viral monoinfection and coinfection with bacteria, in which the detection of mixed respiratory pathogens is frequent in hospitalized patients with acute respiratory infections, but its impact on the clinical outcome does not appear substantial [23].

This study presents some limitations: (i) the low rate of RVs sampling performed among adult patients with SARI, (ii) and the failure to investigate other etiological agents that are possibly associated with SARI such as bacteria, fungi, and mycobacteria. (iii) In addition, the high proportion of patients with immunosuppression limits the extrapolation of these data to other populations. However, the frequency of respiratory viruses found in adults with SARI with percentage values above those previously reported should serve as an alert to the need for viral investigation in all cases of SARI in adults, seeking to know the impact of these infections on this age group

5. Conclusion

As a conclusion, for the population evaluated in the present study, respiratory viruses accounted for more than a third of cases of SARI in adults, being IFVs the main etiological agent. SARI is associated with high lethality, regardless of virus positivity, and presence of comorbidities. Surveillance measures should therefore be maintained and strengthened in adults, seeking to establish risk factors possibly associated with fatality rates and the etiologies of negative cases for RVs to identify emerging pathogens.

Conflict of Interests: Nothing to declare.

Acknowledgements: We would like to thank all epidemiological division staff who supported the routine collection and registration of data: Adeli Ribeiro P. Medeiros, Celia Targa, Cristina Garcia Beckert Batista, Fabiana Costa de Senna Ávila Farias, Juçara Maleoni de Oliveira, Lili Gonçalves, Monica Klimczuk Fernandes, Rosa Helena Silva Souza, and Suzana Dal-Ri Moreira.

We would also like to thank the following virology laboratory staff: Meri B. Nogueira, Luine R. Vidal, and Luciane A. Pereira

Authors Contributions: SMR participated to the conception/design of the study, supervised the analysis, interpreted the data, and wrote the manuscript. BMA participated to the conception of the study, analyzed the data and performed the statistical analysis. NS and MLP collected and analyzed the data. All authors provided contributions to the manuscript, and approved the final version.

Fundings: None

References

  1. Troeger C, Forouzanfar M, Rao PC, Khalil I, Brown A, Swartz S, et al. (2017) Estimates of the global, regional, and national morbidity, mortality, and aetiologies of lower respiratory tract infections in 195 countries: a systematic analysis for the global burden of disease study 2015. Lancet Infect Dis 17; 909–48.
  2. Jain S, Self WH, Wunderink RG, Fakhran S, Balk R, Bramley AM, et al. (2015) Community-acquired pneumonia requiring hospitalization among U.S. adults. N Engl J Med 373, 415–27.
  3. Brasil, Ministério da Saúde. Protocolo de tratamento de influenza 2017. Available from http://bvsms.saude.gov.br/bvs/publicacoes/protocolo_tratamento_influenza_2017.pdf (accessed 02 June, 2018).
  4. Wu X, Wang Q, Wang M, Su X, Xing Z, Zhang W, Shi Y. (2015) Incidence of respiratory viral infections detected by PCR and real-time PCR in adult patients with community-acquired pneumonia: A meta-analysis. Respiration 2015; 89; 343–52. [Crossref]
  5. Qu JX, Gu L, Pu ZH, Yu XM, Liu YM, Li R, et al. (2015) Viral etiology of community-acquired pneumonia among adolescents and adults with mild or moderate severity and its relation to age and severity. BMC Infect Dis 15; 89. [Crossref]
  6. Musher DM, Thorner AR. (2014) Community-acquired pneumonia. N Engl J Med 371; 1619–28.
  7. Wu RG. (2013) Viral pneumonia in adults. J Int Med Taiwan 24; 317–27.
  8. Nguyen C, Kaku S, Tutera D, Kuschner WG, Barr J. (2016) Viral respiratory infections of adults in the intensive care unit. J Intensive Care Med 31; 427–41. [Crossref]
  9. Kim JE, Kim UJ, Kim HK, Cho SK, An JH, Kang SJ, et al. (2014) Predictors of viral pneumonia in patients with community-acquired pneumonia. PLoS One 9; 2014; 1–13. [Crossref]
  10. Jartti A, Rauvala E, Kauma H, Renko M, Kunnari M, Syrjälä H. (2011) Chest imaging findings in hospitalized patients with H1N1 influenza. Acta radiol; 52, 297–04. [Crossref]
  11. World Health Organization. Global epidemiological surveillance standards for Influenza 2014. Available from http://www.who.int/influenza/resources/documents/WHO_Epidemiological_Influenza_Surveillance_Standards_2014.pdf (accessed 02 June, 2018).
  12. World Health Organization. Operational guidelines for sentinel severe acute respiratory infection (SARI) surveillance 2015. Available from https://www.paho.org/revelac-i/wp-content/uploads/2015/10/2015-cha-operational-guidelines-sentinel-sari.pdf (accessed 02 June, 2018).
  13. Gadsby NJ, Russel CD, McHugh MP, Mark H, Conway Morris A, Laurenson IF et al. (2016) Comprehensive molecular testing for respiratory pathogens in community-acquired pneumonia. Clin Infect Dis 201; 62, 817–23. [Crossref]
  14. Ruuskanen O, Lahti E, Jennings LC, Murdoch DR. (2011) Viral pneumonia. Lancet 377; 1264–75.
  15. Tan D, Zhu H, Fu Y, Tong F, Yao D, Walline J, et al. (2016) Severe community-acquired pneumonia caused by human adenovirus in immunocompetent adults: a multicenter case series. PLoS One 11; 1–12. [Crossref]
  16. Branche AR, Falsey AR. (2015) Respiratory syncytial virus infection in older adults: an under-recognized problem. Drugs & Aging 32, 261–69. [Crossref]
  17. Panda S, Mohakud NK, Pena L, Kumar S. (2014) Human metapneumovirus: review of an important respiratory pathogen. Int J Infect Dis 25; 45–52. [Crossref]
  18. Al-Tawfiq JA, Zumia A, Gautret P, Gray GC, Hui DS, Al-Rabeeah AA et al. (2014) Surveillance for emerging respiratory viruses. Lancet Infect Dis 2014; 14, 992–1000. [Crossref]
  19. Fang GD, Fine M, Orloff J, Arisumi D, Yu VL, Kapoor W, et al.(1990) New and emerging etiologies for community-acquired pneumonia with implications for therapy. A prospective multicenter study of 359 cases. Medicine (Baltimore) 69, 307–16. [Crossref]
  20. Pavia AT. (2011) Viral infections of the lower respiratory tract: old viruses, new viruses, and the role of diagnosis. Clin Infect Dis 52, 0–5. [Crossref]
  21. Pavia AT. (2013) What is the role of respiratory viruses in community-acquired pneumonia? what is the best therapy for influenza and other viral causes of community-acquired pneumonia? Infect Dis Clin North Am 27, 157–75. [Crossref]
  22. Musher DM, Roig IL, Cazares G, Stager CE, Logan N, Safar H. (2013) Can an etiologic agent be identified in adults who are hospitalized for community-acquired pneumonia: Results of a one-year study. J Infect 2013; 67, 11–18. [Crossref]
  23. Damasio GAC, Pereira LA, Moreira SD, Duarte dos Santos CN, Dalla-Costa LM, Raboni SM. (2015) Does virus–bacteria coinfection increase the clinical severity of acute respiratory infection? J Med Virol 2015; 87; 1456–61. [Crossref]


Immune Cytokines for Cancer Therapy

DOI: 10.31038/CST.2019424

Summary

Cytokines are molecular messengers that mediate cell-to-cell communication in an autocrine and paracrine fashion. Development of cytokine-based drugs requires a deep understanding of cytokine biology and continuous engineering effort to fine-tune pharmacological properties to elicit potent anti-tumor response while keeping toxicity to a minimum. To date, high dose bolus IL-2 for metastatic melanoma and INF-α for renal carcinoma have been approved as single agents for cancer therapy. In additions, immune cytokines, especially IL-2 and more recently IL-7, IL-15, and IL-21, have been used in Adoptive T-Cell Therapy (ACT) to expand anti-tumor T cells. Nonetheless, systemic monotherapy using cytokines has not fulfilled the promise of clinical efficacy due to several limitations, including failure to achieve effective concentrations in the tumor tissue, severe systemic toxicities that often associated with the high dose administration, and unwanted induction of immune suppression. To address these impediments, innovative approaches have been adopted to improve cytokine-based immunotherapy. These include PEGylation, structure-based cytokine engineering and antibody-cytokine fusion molecules. In this review, we summarize the clinical activity of immune cytokines in the treatment of cancers and recent progress in the engineering of new cytokine therapeutics.

1. Introduction

The role of cytokines in cancer immunology

Immune cells are well recognized to play critical functions in the surveillance of tumor cells and the eradication of established disease foci. A weakened or exhausted immune system usually leads to the growth of tumor cells and metastases. Current immune oncological therapies, such as the immune checkpoint blockade agents PD-1/PD-L1 antibodies, and CAR T therapy, are examples of either boosting cytotoxic T cell functions or directly providing tumor specific T cells to combat tumors.

Immune cytokines are small soluble proteins that function to maintain the activity of the immune system by playing roles in many aspects, such as the proliferation and differentiation of cytotoxic T cells and enhance effector cell antitumor cytotoxic activities. Ever since the identification of the pro-inflammation activity of Interleukin-2 (IL-2), immune cytokines have been tested as cancer therapeutic. However, due to their broad and systemic effect, few cytokines could clinically demonstrate convincing anti-tumor activity with limited adverse effects. Nevertheless, clinical trials with native or engineered cytokines provide valuable insights on how immune networking is established and will shed light on future tumor immune therapy.

2. Current Clinical Experience with Immune Cytokines in Cancer Therapy

2.1 IL-2

2.1.1 Native or Recombinant IL-2

Interleukin-2 (IL-2) is a cytokine produced mainly by activated CD4 T cells and CD8 T cells, and occasionally by certain B cells and dendritic cells [1]. IL-2 can stimulate the proliferation of T cells and other cells that express IL-2 receptors. Since cytotoxic T cells play roles in tumor immunity by attacking cancerous cells directly, IL-2 was used as an agent to boost cytotoxic T cell function to treat cancer patients.

In fact, IL-2 was one of the first immune cytokines tested in clinical trials as early as the 1980s. Initially, only purified native IL-2 was available, and due to the limitation of the purification process, only small doses of IL-2 were used. Unfortunately, only toxicity but no clinical anti-tumor activity was observed when tested in advanced cancer patients [2].

Later, when recombinant IL-2 (rIL-2) was produced, higher doses of IL-2 were tested together with autologous LAK cells in 25 patients with metastatic cancer, who had failed standard therapy. In this trial, very promising anti-tumor activity was observed [3]. One 33-year old female with metastatic melanoma was among the first cohort of patients who received the high dose rIL-2 treatment. This patient responded very well to this treatment, with complete response observed in a few months. In addition, she was cancer-free for at least 29 years.

Additional clinical trials revealed that high dose rIL-2 alone was sufficient to obtain therapeutic activity that leads to tumor regression. In one clinical trial, high dose bolus IL-2 treatment led to a 15% objective response rate (ORR) in 182 metastatic melanoma patients and a 19% ORR in 277 metastatic renal cancer patients. After several multi-institutional studies demonstrated the clinical efficacy of rIL-2 treatment, FDA approved rIL-2 to treat metastatic renal cancer and melanoma in 1992 and 1998, respectively.

Due to the short half life of IL-2, which is about 7 minutes in humans, IL-2 has to be administered at a large dose and several times a day. This limits the use of IL-2 as an effective therapeutic agent. Side effects include hypotension, heart toxicities, and vascular leak syndrome. These side effects prevent many patients from taking rIL-2 at the optimal high dosage. Initially, treatment related death happened in 2~4% of IL-2 treated patients, but the mortality rate was reduced to less than 1% later with appropriate clinical management [4].

In addition to serving as a direct therapeutic drug to cancer patients, IL-2 is also used in cancer immune therapies. Both CAR-T and ACT therapies are dependent on the availability of a large amount of T cells, either engineered T cells or endogenous antitumor lymphocytes. Thus, IL-2 has been used as the growth factor to expand these types of cells in vitro to obtain enough cells to treat patients.

2.1.2 Engineered IL-2

NKTR-214:

The IL2 receptor complex has three distinct subunits, the α-chain (IL-2Rα or CD25), β-chain (IL-2Rβ or CD122), and γ-chain (γc or CD132). Not all 3 receptors exist on all types of IL-2 target cells. IL-2Rα and L-2Rβ are commonly found as heteroreceptors in many target cells, but the presence of the α-chain in the receptor complex increases the affinity for IL-2 by 2 orders of magnitude [5]. Treg cells, the immune suppressive T cells, express CD25 and thus have the highest affinity for IL-2 as compared to other T cells. This explains why at a lower dose, IL-2 failed to show any anti-tumor activity in clinical trials. To limit IL-2Rα binding, a PEGylated form of rIL-2, which is named NKTR-214, has been developed.

PEGylation is a common practice to extend the in vivo half-life of peptides or small proteins by covalent or non-covalent attachment of polyethylene glycol (PEG) to peptides/proteins. For NKTR-214, IL-2 was conjugated with releasable PEG chains at lysine residues in the IL-2Rα-binding interface. Since the bulky PEG chains block the interaction of IL-2 with its receptor, NKTR-214 serves as a prodrug, and after several PEG chains are released, the one-chain pegylated IL-2 (1-PEG-IL-2) becomes the active form. Compared with IL-2, 1-PEG-IL-2 has comparable binding affinity to IL-2Rβ but much less affinity to IL-2Rα, and thus has a drastically lowered affinity to IL-2Rαβγ, the receptor complex that is abundant on Treg [6].

As expected, NKTR-214 increases the half-life of IL-2 to 15.5 hours in mice. Since the active form is slowly released, the Cmax is reached 24 hrs after a single treatment. More importantly, compared to IL-2, the active forms of NKTR-214 have a 10-fold lower Cmax, but 27-fold higher AUC, meaning a controlled release and more drug exposure as the benefit of PEGylation [6].

In the mouse B16F10 melanoma model, NKTR-214 demonstrated better activity and safety than rIL-2. While rIL-2 had to be administered twice daily, NKTR-214 was given to mice every 9 days. Single agent NKTR-214 treatment had much better anti-tumor activity than that of IL-2 [7].

Analysis of T cell populations in mice treated with NKTR-214 also indicated that total and memory CD8 T-cell population in tumor infiltrating lymphocytes were significantly increased. This is more sustainable and stable than the effect of natural IL-2.

When combined with the immune checkpoint inhibitor CTLA-4 antibody, NKTR-214 demonstrated synergistic activity to control tumor growth in the EMT6 breast cancer model, with 70% of mice showing complete response and becoming tumor free. In comparison, the tumor free rate in mice treated with IL2 and anti-CTLA4 is 40%. Tumor free mice were resistant to tumor- rechallenges, indicating a durable and specific immunity had been established with the combination of NKTR-214 and checkpoint blockade [7].

Due to the slow release of the active cytokines, longer half life and reduced peak concentration, NKTR-214 also demonstrated less severe side effects in animal studies. rIL-2 treated mice became hypothermic and exhibited shivering behavior, while NKTR-214 treated mice only showed mild weakness [7] .

Although NKTR-214 was designed to spare Treg, in vivo studies revealed that at the high dosage used in tumor treatment, activation of Treg may not even be an issue for rIL-2. To the opposite, the Treg population was reduced by both IL-2 and NKTR-214 as compared with control treatment.

Using a humanized model of IL-2 therapy, Li and colleagues reported that Treg in fact controls the toxicity during IL-2 therapy [8]. Down-regulation of Treg by high dose rIL-2 or NKTR-214 thus could be directly linked to the toxicity related to IL-2 therapies. To ameliorate IL-2 toxicity, a strategy is to use the PIM-1 kinase inhibitor, Kaempferol [8]. As discovered previously, Kaempferol enhances the suppressive function of Treg cells by inhibiting FOXP3 phosphorylation by PIM1[9, 10].

With the promising activity in animal models, NKTR-214 has been tested in clinical trials. However, when NKTR-214 was tested as monotherapy in the early EXCEL trial, no objective response was observed, compared with the 15~29% ORR for rIL-2 seen in other trials. The lack of clinical efficacy for NKTR-214 monotherapy was accounted for by a lower maximum-administered dose (0.012 mg/kg q3w), the much lower Cmax and weaker activation of lymphocytes. Analysis of clinical trial data also revealed that NKTR-214 has a mixed effect on Tregs. While tumor-infiltrating Treg cells are reduced, peripheral Treg populations are increased after NKTR-214 treatment.

When tested in combination as first line treatment in early stage clinical trials, NKTR-214 and PD-1 antibody Nivolumab produced 64% ORR in stage IV melanoma and 71% ORR in Stage IV RCC. The same combination also produced 60% ORR as first or second line treatment in Stage IV NSCLC [11]. Again, additional trials are needed to verify the clinical efficacy for the combination strategy and to show its benefit over Nivolumab monotherapy.

In terms of side effects, NKTR-214 has not solved all of the adverse effects that IL-2 displays. Still, many patients report having fatigue, rashes, and flu-like symptoms.

Neo-2/15

Instead of using pegylation to block binding to IL-2Rα receptor, a creative de novo approach was taken to develop IL-2 mimics with better selectivity for IL-2Rβγ and higher in vivo stability [12]. Although called “de novo” design, this strategy started with IL-2 as the template, extracting α helices that interacting with IL-2Rβγ, but modified the loops connecting the helices and the backbones to obtain structures with lower energy. Site mutations were then introduced into the lead structure for a better affinity to IL-2Rβγ.

The final structure, Neo-2/15, shows only 14% and 24% structure-based sequence identity to human and mouse IL-2 respectively, but binds to IL-2Rβγ receptor of both species with very high affinity. As designed, Neo-2/15 has no detectable binding to IL-2Rα and demonstrates thermal stability at 80°C[12].

As demonstrated by in vivo studies, Neo-2/15 causes less expansion of the immunosuppressive Treg cells than IL-2. When mice were treated with Neo-2/15, the ratio of CD8 T cells over Treg cells was greatly increased. Most importantly, Neo-2/15 has been found to have a superior immunotherapeutic activity to IL-2 in mouse models of melanoma and colon cancer. When Neo-2/15 was used in combination with TA99, which is an antibody against TRP-1, 4 out of 10 mice were tumor-free after treatment. Neo-2/15 caused less weight loss and general health problems in treated mice as compared with native IL-2 [12].

In addition to NKTR-214 and Neo2/15, there are several other engineered IL-2 cytokines under clinical testing. An IL-2 variant (IL2v), which has abolished binding to IL2Rα, was recombinantly linked to anti-FAP or anti-CEA antibodies [13]. The antibody- cytokine fusions (FAP-IL2v and CEA-IL2v) are designed to enrich cytotoxic T cells- specific IL-2 to tumor microenvironment and thus limiting its effect on peripheral Treg. Furthermore, CEA-IL2v and FAP-IL2v enhanced the cytotoxic activity of Natural Killer (NK) cells when combined with ADCC-competent antibodies against HER2 or EGFR [13].

2.2 IL-10

T cell exhaustion is frequently observed in cancer patients. It could lead to the escape of tumor cells from immune surveillance and create hurdles for successful cancer immunotherapy.

As one of the immune cytokines having dual roles, IL-10 is anti-inflammatory at low concentrations, but pro-inflammatory at high concentrations to induce immune activation and invigorate CD8+ T cells. It is produced by activated T cells, monocytes and lymphocytes, which is further induced by PD-1 blockade in animal studies [14]. It is proposed that PD-1 induces IL-10 secretion and renders tumor microenvironment immunosuppressive, as evidenced by the synergistic anti-tumor effect by anti-PD-1 and anti-IL-10 antibodies on ovarian cancer xenografts.

Nevertheless, when PEGylated IL-10 (also known as Pegilodecakin, or AM0010) was administered to mice to obtain sustained elevated serum concentration, activation of tumor-resident CD8+ T cells was observed and tumor rejection occurred [15, 16].

A phase I clinical trial was conducted in patients with intermediate to poor-risk renal cell cancer. In patients treated with the optimal dose of AM0100, which was 20 μg/kg, partial responses were observed in four out of 15 patients, resulting in an overall response rate of 27%. Furthermore, a prolonged stable disease of at least 4 months was observed in 4 patients, with one having disease stabilization for 20 months. [17]

In this trial, patients self-administered PEGylated IL-10 subcutaneously at doses of 1 to 40 μg/kg once daily [18]. At 29 days after treatment initiated, sustained serum levels of IFNγ, IL-18, IL-4, and IL-7 were detected. Patients with better clinical response tended to have increased LAG+PD1+CD8+ T cells after the treatment, suggesting an invigoration of exhausted T cells after PEGylated IL-10 treatment. Patients with PR also have more T cell clones amplified. The combination of PEGylated IL-10 and the anti-PD1 antibody pembrolizumab was also tested in heavily pre-treated cancer patients, including melanoma, non-squamous cell lung cancer or RCC. 42% ORR was observed in 19 evaluable patients [18].

Observed adverse events (AEs) included anemia, fatigue, thrombocytopenia, fever, and injection site reactions. Grade 3 to 4 nonhematopoietic treatment-related AEs was observed in 5 out of 33 patients, Grade 3 to 4 anemia or thrombocytopenia was also observed in five patients. However, most treatment-related AEs were transient or reversible, and AM0100 was considered to have an acceptable toxicity profile. Prolonged exposure to AM0100 did not lead to acute toxicities at the therapeutic dose [17].

2.3 IL-12

The IL-12 family cytokines comprise heterodimeric IL-12, IL-23, IL-27, and IL-35. Although similar in structures, these cytokines have various biological and immunological functions. IL-12 is a pro-inflammatory cytokine produced by DCs, macrophages and B cells. Secretion of IL-12 can be potentiated by IFN-γ from T cells. IL-12 can further act on NK cells to induce IFN-γ [19].

Like other members of the IL-12 family, IL-12 is composed of 2 subunits: α and β. IL-12 shares the α subunit (p35) with IL-35, and the β subunit (p40) with IL-23. The IL-12 receptor also includes two subunits: IL-12Rβ1 and IL-12Rβ2. Like the ligands, the IL-12 family receptors also share subunits. IL-12Rβ1 exists in the receptors for IL-12 and IL-23, and IL-12Rβ2 exists in the receptors for IL-12 and IL-35.

In preclinical studies, IL-12 is able to enhance anti-tumor activity and totally eradicate large established tumors [20], which is dependent on CD8 T cells and IFN-γ [21]. IL-12 is also critical to anti-tumor T cell immunity induced by the anti-PD-1 antibody, as eliminating IL-12 with anti-IL-12 antibody entirely wiped out the anti-tumor effect of anti-PD-1 antibody in an MC38 tumor model [22]. It is reported that the PD-1 antibody acts on CD8+ T cells to produce IFN-γ, which subsequently induces DC to release IL-12.

In clinical trials, as recombinant IL-12 has to be used at high doses due to its short half-life, significant and unacceptable toxicity sometimes occurs.

2.3.1 Early Clinical Trials with IL-12

Cutaneous T Cell Lymphoma (CTCLs): CTCLs are a family of non-Hodgkin lymphomas. It has 2 common forms: mycosis fungoides (MF) and Sezary syndrome (SS). Patients with CTCLs usually have defects in IL-12 and are associated with deficient IFN-γ production and depressed Th1 cells functions. In a phase I clinical trial with 10 CTCL patients, subcutaneous treatment with IL-12 resulted in 2 complete responses in 5 MF patients with extensive plaque. Only mild and short-lived adverse effects were noticed. In these patients, an increased proportion of cytotoxic CD8+ T cell was observed. In total, IL-12 treatment achieved an ORR of 56% (5 out of 9 patients) [23].

Hodgkin’s and non-Hodgkin’s Lymphoma: Younes et al reported a phase II study on the effect of IL-12 on HL (Hodgkin’s lymphoma) and NHL (non-Hodgkin’s B cell lymphoma) [24]. Objective responses were only observed in NHL patients. It was concluded that i.v. treatment was more effective than s.c. injections (40% v.s. 7%), and responses were better in follicular grade I/II lymphoma v.s. diffuse large B-Cell lymphoma. Patients with less severe diseases tended to have a better response. In a phase I clinical trial [25], recurrent NHL patients showed 69% ORR when treated with both rituximab and IL-12. However, a follow-up phase II study showed that the efficacy in the combination treatment was entirely due to rituximab.

Kaposi Sarcoma (KS): KS is a tumor localized in the skin, caused by HHV-8 (human herpesvirus 8). It is often associated with iatrogenic immunosuppression or HIV-related immunodeficiency. In a dose-escalating clinical trial with 24 patients [26], high dose IL-12 showed 71% ORR, and one patient showed complete tumor regression after continued IL-12 therapy for almost 5 years. Again, some patients experienced psychoneurological problems. IL-12 was also studied in the phase II study in combination with pegylated liposomal doxorubicin [27]. Impressively, ORR of this trial was 83%, with 25% treated patients showing complete response.

In general, as we extrapolated from clinical trials, high doses of IL-12 commonly leads to severe hematologic toxicity such as neutropenia, thrombocytopenia, hyperbilirubinemia, and hypoalbuminemia. While pre-treatment with a priming dose of IL-12 allowing administration of higher doses, this strategy shows no improvement regarding the therapeutic outcomes. In addition, consecutive injections of IL-12 will lead to adaptive responses and the significant decline of IFN-γ induction. It is unlikely that IL-12 will become an effective single agent treatment for cancer patients.

2.3.2 IL-12-based immunocytokines (Antibody-cytokine fusion proteins)

In an effort to improve therapeutic efficacy and safety, IL-12 has been explored as fusion proteins with tumor targeting antibodies. By accumulating in the tumor tissue or even directly killing cancer cells, the antibody-cytokine fusion proteins are expected to induce a strong inflammatory signal to enhance antitumor response.

One of these fusion proteins is AS1409, which contains a humanized antibody BC1 that binds to the ED-B variant of fibronectin and directs IL-12 to tumor-associated vasculature. In a phase I trial with 11 melanoma and 2 renal cell carcinoma patients, AS1409 treatment induced elevated serum levels of IFN-γ and interferon-inducible protein-10 (IP-10) in all patients, indicating activation of cell-mediated immune response. One melanoma patient had a partial response, while stable disease was seen in 5 other patients [28]. At the maximum tolerated dose of 15 μg/kg, most drug-related adverse events were grade 2 or less, including pyrexia, fatigue, chills, headache, vomiting, and transient liver function abnormalities. Unfortunately, plasma half-life of this fusion antibody was only 22 hours, and antidrug antibody responses were seen in all patients [28]. The shorter than expected half-life and immunogenicity issue will somehow limit the clinical development of AS1409.

Another example is NHS-IL12, which is IL-12 fused with a tumor necrosis-targeting human IgG1 (an anti-histone antibody) [29]. NHS-IL12 has demonstrated anti-tumor activity in pre-clinical studies with murine and dog tumor models [29, 30]. Irradiation that induces the necrosis of tumor cells is shown to potentiate NHS-IL12 anti-tumor activity [31]. Combination of NHS-IL12 with anti-PD-L1 antibody achieves complete tumor regression in the EMT-6 mammary tumor model [32].

2.3.3 Delivery of IL-12 cDNA

Therapeutic IL-12 is usually delivered as recombinant or engineered IL-12 proteins. Alternatively, IL-12 was also explored as gene therapy by delivering viral or plasmid vectors to express IL-12 in the host. In clinical trials, RTS-hIL-12 plus veledimex were studied in recurrent or progressive glioblastoma multiforme adult patients.

IL-12 expressing vector can also be delivered to therapeutic cells directly. To help CAR T therapy, T cells were engineered to express IL-12 to enhance the durability and help change the tumor microenvironment to allow better tumor penetration. A MUC-16 targeting CAR T therapy has been developed for recurrent ovarian cancer and is currently tested in a phase I clinical trial [33].

2.4 IL-15

IL-15, a cytokine mainly produced by activated myeloid cells, shares structure similarity with IL-2 and binds to two of IL-2’s receptors: IL-2Rβ and γc. IL-15 has its own high affinity receptor, IL-15Rα. Due to receptor specificity, IL-15 acts on NK cells and activated T cells, but not on immunosuppressive Treg. For this reason, IL-15 is considered as an ideal cytokine to effectively augment CD8+ T cell and NK cell function in solid tumors.

Recombinant IL-15 produced in Escherichia coli was initially tested via intravenous bolus injection in advanced melanoma and RCC patients. Expansion of peripheral NK and CD8+ T cells was reported in patients treated with IL-15, but there was no objective clinical response [34]. rIL-15 was also tested subcutaneously in patients with a variety of solid tumors, and the best clinical outcome was stable disease [35]. In general, subcutaneously administration of rIL-15 tended to have a little higher dose-limiting toxicity at 3.0 μg/kg per day. The severe adverse events after patients were treated with rIL-15 included high fever, hypotension and thrombocytopenia [34].

To engineer a potent IL-15 ligand, IL-15 was recombinantly connected to the sushi domain of IL-15R alpha. The sushi domain functions as an IL-15 agonist by enhancing its binding and biological effects through the IL-2Rβ and γc heterodimer [36]. This super IL-15 ligand can be produced as an IgG- fusion protein to obtain longer half-life. ALT-803 is such an IgG fusion protein but contains a mutated IL-15 with superior activity [37]. In a mouse model of multiple myeloma, a single intravenous dose of ALT-803, but not IL15, eliminated well-established tumors and prolonged survival of mice. In B16F10 melanoma tumors and CT26 colon cancer models, ALT-803 also demonstrated better anti-tumor activity than IL-15, and increased peripheral blood lymphocyte, neutrophil, and monocyte counts by >8-fold [37].

In a phase one clinical trial in patients with hematologic malignancies who relapse after allogeneic hematopoietic cell transplantation (allo-HCT), ALT-803 was administered to 33 patients via the IV or subcutaneous (SQ) routes once weekly for 4 doses. In general, ALT-803 was well tolerated. While IV administration led to constitutional symptoms temporally related to increased serum IL-6 and IFN-γ, SQ delivery only resulted in prolonged (>96 hour) serum concentrations and only self-limited injection site rashes without acute constitutional symptoms. Activation of NK cells and CD8+ T cells, but not Treg, were observed after ALT-803 treatment. More importantly, clinical responses were observed in 19% of evaluable patients, including 1 complete remission lasting 7 months [38].

Nanoparticles and protein nanogels are potential efficient delivery methods for ALT-803. Nanogels contains an antibody molecule that can direct the delivery to a specific cell type, such as T cells. To receive the ALT-803 payload, T cells need to have a cell surface receptor as the “loading dock” that is not down-regulated after binding to the antibody. Tang et al identified CD45 acting as the stable, non-internalizing “loading dock” for nanogels [39]. After binding to the anti-CD45 antibody, CD45 remains to have close to 100% surface expression level for more than 60 hours. Once nanogels reach the surface of activated CD8+ T cells, the cytokine is released due to higher cell surface reduction potential.

Compared with free cytokines, nanogels delivery is able to selectively expanded T cells 16-fold in tumors. This also allows much higher doses of cytokine. In animal studies, ALT-803 nanogels are used to substantially enhance tumor eradication by mouse T cells or human CAR-T cells [39].

2.5 IFNα

Interferons (IFNs) play important roles in immune defense against cancer cells and intracellular pathogens. Based on their corresponding receptors, IFNs are categorized into 3 types: types I, II, and III. IFN-α belongs to type I IFN, which are generally expressed by all kinds of cells in response to viral infection. By promoting apoptosis in the infected cell, IFN-α interferes with viral replication. IFN-α also activates macrophages and NK cells.

IFN-α has been clinically used to treat a variety of malignancies, including indolent B cell lymphoma and hairy-cell leukemia, chronic myelogenous leukemia (CML), renal cell carcinoma (RCC), and melanoma.

In advanced RCC, IFN-α is approved for combination treatment with bevacizumab based on the results of the CALGB and AVOREN trials. In the CALGB trial, compared with IFN-α monotherapy, the addition of bevacizumab to IFN-α led to an improved ORR (25.5% vs. 13.1%, P < 0.0001) and a significant 3 month benefit in PFS (8.5 months vs. 5.2 months, P < 0.0001). However, overall survival (OS) did not significantly differ between the 2 groups (18.3 months vs. 17.4 months, unstratified log-rank, P = 0.097). In the AVOREN trial, median PFS was also significantly improved in the bevacizumab plus IFN-α arm at 10.2 months compared with 5.4 months in the IFN-α monotherapy group. Again, the final median OS was only marginally improved in combination arm (23.3 months vs. 21.3 months, HR = 0.91; 95% CI, 0.76–1.10, P = 0.34) [40].

The practical use of IFN-α in RCC management is limited, partially due to the frequency of IFN-α administration and the side effects of the treatment. IFN-α is administrated subcutaneously 3 times a week for 52 weeks. In the combination treatment group of the CALGB trial, 64% of patients need to reduce the dose due to intolerability, and 80% had severe toxicity (grade ≥3), including hypertension, anorexia, fatigue, and proteinuria. The majority of the patients (56%) discontinued for disease progression.

IFN-α is much less used now after anti-angiogenic tyrosine kinase inhibitors are approved for RCC. As a first line treatment of metastatic clear cell RCC, IFN-α is less effective than sunitinib, with much lower ORR (12% vs. 47%), mPSF (5.0 months vs. 11.0 months), and mOS (21.8 months vs. 26.4 months [41]. However, Naito et al reported that analysis of real world data suggested that IFN-α might have a better outcome in Japanese metastatic clear cell RCC patients than in the western patients [42].

In melanoma, IFN-α was used for more than a decade in the adjuvant setting, until the arrival of immune checkpoint inhibitors for adjuvant treatment of high-risk resected melanoma.

2.6 Interferon γ (IFN- γ)

IFN-γ, which is the only member in the type-II interferon family, is a dimerized soluble cytokine that is dominantly produced by natural killer (NK) cells, natural killer T (NKT) cells, CD4 helper T cells, and CD8 cytotoxic T cells. As an immune cytokine, IFN-γ’s function is not limited to promoting T cells / NK cells to migrate into the tumor tissue. It can also directly binds to its receptor on tumor cells and upregulates MHC class I antigen presentation. This enhances tumor recognition by cytotoxic lymphocytes, favoring tumor rejection.

In addition, IFN-γ also inhibits tumor angiogenesis by inducing the production of chemokines, such as MIG (CXCL9, a small cytokine belonging to the CXC chemokine family) and IP10 (CXCL10), through both direct mechanisms by reducing endothelial cell adhesion and indirect mechanisms by inducing the production of antiangiogenic molecules.

After dimerized IFN-γ binds to its receptor, which is composed of IFN-γ receptor 1 (IFNGR1) and IFN-γ receptor 2 (IFNGR2), it induces trans-phosphorylation and activation of JAK1 and JAK2. Activated JAK1/2 leads to the phosphorylation of IFN-γ receptor, providing STAT docking sites through the SH2 domain and to recruit STATs to the JAK- IFN-γ receptor complex. After recruited to the receptor complex, STATs become activated and form dimers, followed by translocation to the nucleus to promote the expression of target genes involved in cell proliferation, differentiation, and inflammation.

Because IFN-γ plays an important role in innate and adaptive immunity, loss of tumor sensitivity to IFN-γ will offer a mechanism for tumor cells to escape immune surveillance and to metastasize. This occurs when there is a defect in IFN-γ receptor or other molecules of the downstream signaling pathways, such as Jak1 and Jak2. A complete loss of tumor sensitivity to IFN-γR has been reported for human melanomas and lung adenocarcinomas, including the loss of IFN-γRα expression, loss of Jak1, and expression of an abnormally phosphorylated Jak2 enzyme [43]. Defects in IFN-γ signaling pathways also contribute to the resistance to immune checkpoint inhibitors in melanoma patients [44]. High expression of IFN-γ in melanoma patients is associated with longer overall survival after treatment with immune checkpoint inhibitor pembrolizumab [45].

Nevertheless, IFN-γ signaling can also pose a negative effect on cancer therapy. There are reports that IFN-γ down-regulates tumor antigen expression and promotes the emergence of tumor antigen-loss variants that leads to disease progression. A melanoma patient vaccinated with a gp100- derived class I peptide together with IFN-γ developed a metastatic lesion that was associated with a selective loss of gp100 expression after an initial response. This suggests that selective pressure facilitated the emergence of antigen-negative tumors.

IFN-γ is clinically used as an antiviral agent to treat infections. However, some patients under IFN-γ treatment are also cancer patients and thus provide insights on IFN-γ effects on cancers. Buddingh et al. reported a case of IFN-γ treatment of a 3-year old Acute Lymphoblastic Leukemia (ALL) patient [46]. In this case, IFN-γ was intended to restore immune function to treat severe systemic Candida dubliniensis infection due to chemotherapy-induced immunoparalysis. After the patient’s clinical condition was improved, imaging and abdominal ultrasound examination revealed that the patient was in remission, with complete resolution of brain lesions and greatly diminished kidney, liver and spleen lesions.

During the course of IFN-γ treatment, the percentage of HLA-DR-positive monocytes increased from almost 2% to 50%. The HLA-DR ratio is a good indication for innate immunity. Since this ALL patient had been treated with both chemotherapy and antifungal agents, IFN-γ was not the only reason for the complete control of fungal infection and long lasting remission. However, the contribution of IFN-γ to the normalization of immunity needs to be noted and worth further investigation.

AbZed

We have reported that IFN-γ is effective to enhance HER2-targeted antibody therapy. The anti-oncogenic HER2 (also know as p185erbB2/neu) antibody 7.16.4, when given at a sub-optimal dose of 1.5 mg/kg (1/3 of the normal dose), was unable to significantly inhibit the growth of the H2N113 tumor in syngeneic MMTV-neu transgenic mice. IFN-γ treatment alone also failed to cause significant inhibition of the growth of the tumor. However, the combination of low dose 7.16.4 and IFN-γ completely arrested the growth of H2N113 tumors [47].

A further step was taken to establish a fusion protein HER2 AbZed, which contains a scFv to bind to HER2, an Engineered Effector Domain (EED) to bind to the Fc region of IgG, and IFN-γ in a single fusion protein. Treatment with this engineered fusion protein is even more potent than the anti-HER2 antibody alone or simply combining scFv-ZZ and IFN-γ in terms of inhibiting tumor growth [48]. The new fusion protein demonstrates superior activity over the anti-HER2 antibody on tumors that are resistant to trastuzumab. Examination of tumor infiltrating macrophages and lymphocytes reveals that the fusion protein induces change in tumor microenvironments [48]. The EED domain is originally derived from the bacterial protein A but can be further humanized for therapeutic use.

3. Conclusion

Although some immune cytokines have been approved for the treatment of certain types of cancers, the clinical use is limited. PEGylation is able to extend the in vivo half-life of cytokines, but it remains unclear if such a modification can dramatically enhance the clinical utilities. While combination use of cytokines with other immunotherapeutic regimens appears to be the future, the systemic toxicity is one major limitation. This may be circumvented by recombinantly connecting a cytokine to target therapeutic agents, thus the cytokines can be selectively accumulated around tumor. It is hoped that by innovative engineering, immune cytokines may play a major role in immunotherapy against cancer.

Acknowledgement

We acknowledge grant supports from the Breast Cancer Research Foundation and the National Institutes of Health to M.I.G. (R01 CA219034). We thank Isabel Liang for her comments on the manuscript.
CST 2019-112 - Zhang USA_F1

Figure 1. Interactions of cytokines and immune cells. Immunostimulatory cytokines produced by immune cells (solid arrows) are investigated as immunotherapies against tumors, by acting on different types of immune cells (dashed arrows).

References

  1. Gaffen SL, KD Liu, et al. (2004) Overview of interleukin-2 function, production and clinical applications. Cytokine 28: 109–23.
  2. Lotze MT, et al. (1985) In vivo administration of purified human interleukin 2. I. Half-life and immunologic effects of the Jurkat cell line-derived interleukin 2. J Immunol 134: 157–166.
  3. Rosenberg SA, et al. (1985) Observations on the systemic administration of autologous lymphokine-activated killer cells and recombinant interleukin-2 to patients with metastatic cancer. N Engl J Med 313: 1485–1492.
  4. Rosenberg SA, et al. (2014) IL-2: the first effective immunotherapy for human cancer. J Immunol 192: 5451–5458. [crossref]
  5. Burchill MA, Yang J, Vang KB, Farrar MA (2007) Interleukin-2 receptor signaling in regulatory T cell development and homeostasis. Immunol Lett 114: 1–8. [crossref]
  6. Charych, D, et al. (2017) Modeling the receptor pharmacology, pharmacokinetics, and pharmacodynamics of NKTR-214, a kinetically-controlled interleukin-2 (IL2) receptor agonist for cancer immunotherapy. PloS one 12: 0179431–0179431.
  7. Charych DH, et al. (2016) NKTR-214, an Engineered Cytokine with Biased IL2 Receptor Binding, Increased Tumor Exposure, and Marked Efficacy in Mouse Tumor Models. Clin Cancer Res 22: 680–690.
  8. Li Y, Strick-Marchand H, Lim AI, et al. (2017) Regulatory T cells control toxicity in a humanized model of IL-2 therapy. Nat Commun 8: 1762. [crossref]
  9. Lin F, Luo X, Tsun A, Li Z, Li D, et al. (2015) Kaempferol enhances the suppressive function of Treg cells by inhibiting FOXP3 phosphorylation. Int Immunopharmacol 28: 859–865. [crossref]
  10. Li Z, et al. (2014) PIM1 kinase phosphorylates the human transcription factor FOXP3 at serine 422 to negatively regulate its activity under inflammation. J Biol Chem 289: 26872–26881.
  11. Diab A, et al. (2018) NKTR-214 (CD122-biased agonist) plus nivolumab in patients with advanced solid tumors: Preliminary phase 1/2 results of PIVOT. J Clin Oncol 36(suppl; abstr 3006).
  12. Silva DA, Yu S, Ulge UY, et al. (2019) De novo design of potent and selective mimics of IL-2 and IL-15. Nature 565: 186–191. [crossref]
  13. Waldhauer I, et al. (2013) Novel Tumor-Targeted, Engineered IL-2 Variant (IL2v)-Based Immunocytokines For Immunotherapy Of Cancer. Blood 122: 2278.
  14. Lamichhane P, et al. (2017) IL10 Release upon PD-1 Blockade Sustains Immunosuppression in Ovarian Cancer. Cancer Res 77: 6667–6678.
  15. Emmerich J, et al. (2012) IL-10 directly activates and expands tumor-resident CD8(+) T cells without de novo infiltration from secondary lymphoid organs. Cancer Res 72: 3570–3581.
  16. Mumm JB, et al. (2011) IL-10 elicits IFNgamma-dependent tumor immune surveillance. Cancer Cell 20: 781–796.
  17. Naing A, Papadopoulos KP, Autio KA, Ott PA, Patel MR, et al. (2016) Safety, Antitumor Activity, and Immune Activation of Pegylated Recombinant Human Interleukin-10 (AM0010) in Patients With Advanced Solid Tumors. J Clin Oncol 34: 3562–3569. [crossref]
  18. Naing A, et al. (2018) PEGylated IL-10 (Pegilodecakin) Induces Systemic Immune Activation, CD8(+) T Cell Invigoration and Polyclonal T Cell Expansion in Cancer Patients. Cancer Cell 34: 775–791.
  19. Vignali DA, Kuchroo VK (2012) IL-12 family cytokines: immunological playmakers. Nat Immunol 13: 722–728. [crossref]
  20. Brunda MJ, Luistro L, Warrier RR, Wright RB, Hubbard BR, et al. (1993) Antitumor and antimetastatic activity of interleukin 12 against murine tumors. J Exp Med 178: 1223–1230. [crossref]
  21. Brunda MJ, et al. (1995) Role of interferon-gamma in mediating the antitumor efficacy of interleukin-12. J Immunother Emphasis Tumor Immunol 17: 71–77.
  22. Garris CS, et al. (2018) Successful Anti-PD-1 Cancer Immunotherapy Requires T Cell-Dendritic Cell Crosstalk Involving the Cytokines IFN-gamma and IL-12. Immunity 49: 1148–1161.
  23. Rook AH, et al. (1999) Interleukin-12 therapy of cutaneous T-cell lymphoma induces lesion regression and cytotoxic T-cell responses. Blood 94: 902–908.
  24. Younes A, Pro B, Robertson MJ, Flinn IW, Romaguera JE, et al. (2004) Phase II clinical trial of interleukin-12 in patients with relapsed and refractory non-Hodgkin’s lymphoma and Hodgkin’s disease. Clin Cancer Res 10: 5432–5438. [crossref]
  25. Ansell SM, Witzig TE, Kurtin PJ, Sloan JA, Jelinek DF, et al. (2002) Phase 1 study of interleukin-12 in combination with rituximab in patients with B-cell non-Hodgkin lymphoma. Blood 99: 67–74. [crossref]
  26. Little RF, et al. (2006) Activity of subcutaneous interleukin-12 in AIDS-related Kaposi sarcoma. Blood 107: 4650–4657.
  27. Little RF, et al. (2007) Phase 2 study of pegylated liposomal doxorubicin in combination with interleukin-12 for AIDS-related Kaposi sarcoma. Blood 110: 4165–4171.
  28. Rudman SM, et al. (2011) A phase 1 study of AS1409, a novel antibody-cytokine fusion protein, in patients with malignant melanoma or renal cell carcinoma. Clin Cancer Res 17: 1998–2005.
  29. Fallon J, Tighe R, Kradjian G, Guzman W, Bernhardt A, et al. (2014) The immunocytokine NHS-IL12 as a potential cancer therapeutic. Oncotarget 5: 1869–1884. [crossref]
  30. Paoloni M (2015) Defining the Pharmacodynamic Profile and Therapeutic Index of NHS-IL12 Immunocytokine in Dogs with Malignant Melanoma. PLoS One 10: 0129954.
  31. Eckert F (2016) Enhanced binding of necrosis-targeting immunocytokine NHS-IL12 after local tumour irradiation in murine xenograft models. Cancer Immunol Immunother 65: 1003–1013.
  32. Xu C, et al. (2017) Combination Therapy with NHS-muIL12 and Avelumab (anti-PD-L1) Enhances Antitumor Efficacy in Preclinical Cancer Models. Clin Cancer Res 23: 5869–5880.
  33. Koneru M, et al. (2015) A phase I clinical trial of adoptive T cell therapy using IL-12 secreting MUC-16(ecto) directed chimeric antigen receptors for recurrent ovarian cancer. J Transl Med 13: 102.
  34. Conlon KC, et al. (2015) Redistribution, hyperproliferation, activation of natural killer cells and CD8 T cells, and cytokine production during first-in-human clinical trial of recombinant human interleukin-15 in patients with cancer. J Clin Oncol 33: 74–82.
  35. Miller JS, et al. (2018) A First-in-Human Phase I Study of Subcutaneous Outpatient Recombinant Human IL15 (rhIL15) in Adults with Advanced Solid Tumors. Clin Cancer Res 24: 1525–1535.
  36. Mortier E, et al. (2006) Soluble interleukin-15 receptor alpha (IL-15R alpha)-sushi as a selective and potent agonist of IL-15 action through IL-15R beta/gamma. Hyperagonist IL-15 x IL-15R alpha fusion proteins. J Biol Chem 281: 1612–1619.
  37. Rhode PR, et al. (2016) Comparison of the Superagonist Complex, ALT-803, to IL15 as Cancer Immunotherapeutics in Animal Models. Cancer Immunol Res 4: 49–60.
  38. Romee R, et al. (2018) First-in-human phase 1 clinical study of the IL-15 superagonist complex ALT-803 to treat relapse after transplantation. Blood 131: 2515–2527.
  39. Tang L, Zheng Y, et al. (2018) Enhancing T cell therapy through TCR-signaling-responsive nanoparticle drug delivery. Nat Biotechnol 36: 707–716. [crossref]
  40. Harshman, LC, S Srinivas (2010) The bevacizumab experience in advanced renal cell carcinoma. OncoTargets and therapy 3: 179–189.
  41. Motzer RJ, et al. (2009) Overall survival and updated results for sunitinib compared with interferon alfa in patients with metastatic renal cell carcinoma. J Clin Oncol 27: 3584–3590.
  42. Naito S, et al. (2010) Prognosis of Japanese metastatic renal cell carcinoma patients in the cytokine era: a cooperative group report of 1463 patients. Eur Urol 57: 317–325.
  43. Kaplan DH, et al. (1998) Demonstration of an interferon gamma-dependent tumor surveillance system in immunocompetent mice. Proceedings of the National Academy of Sciences of the United States of America 95: 7556–7561.
  44. Hugo W, Zaretsky JM, Sun L, Song C, Moreno BH, et al. (2017) Genomic and Transcriptomic Features of Response to Anti-PD-1 Therapy in Metastatic Melanoma. Cell 168: 542. [crossref]
  45. Karachaliou N, et al. (2018) Interferon gamma, an important marker of response to immune checkpoint blockade in non-small cell lung cancer and melanoma patients. Ther Adv Med Oncol 10: 1758834017749748.
  46. Buddingh EP, et al. (2015) Interferon-gamma Immunotherapy in a Patient With Refractory Disseminated Candidiasis. Pediatr Infect Dis J 34: 1391–1394.
  47. Nagai Y, et al. (2015) Disabling of the erbB Pathway Followed by IFN-gamma Modifies Phenotype and Enhances Genotoxic Eradication of Breast Tumors. Cell Rep 12: 2049–2059.
  48. Zhang H, et al. (2017) A targeted immunotherapy approach for HER2/neu transformed tumors by coupling an engineered effector domain with interferon-?. OncoImmunology, (just-accepted): p. 00–00.
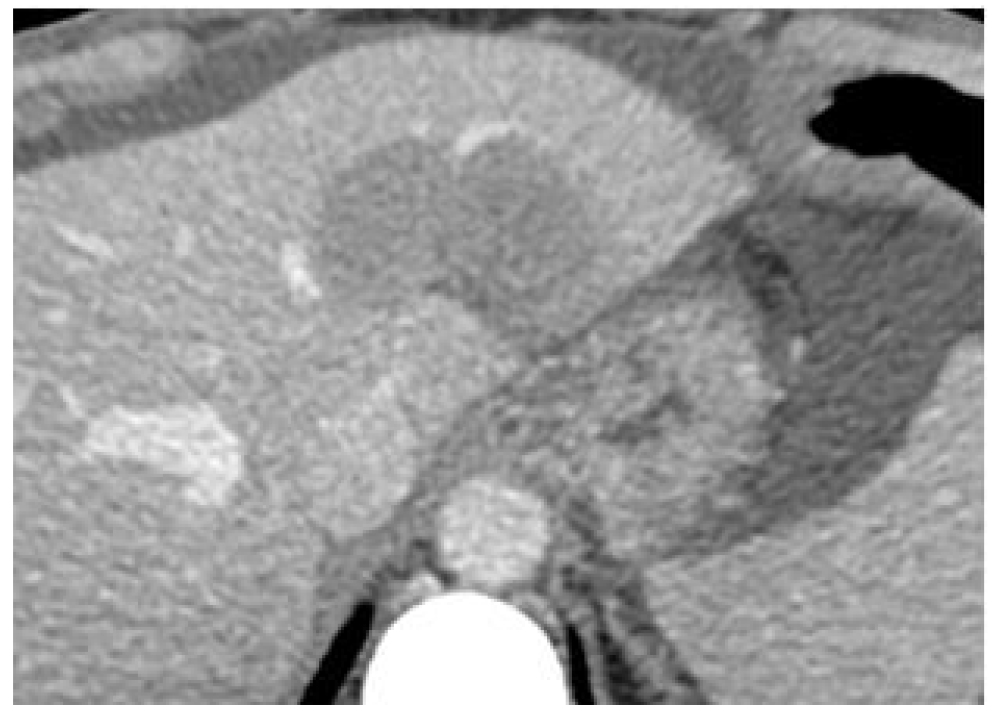
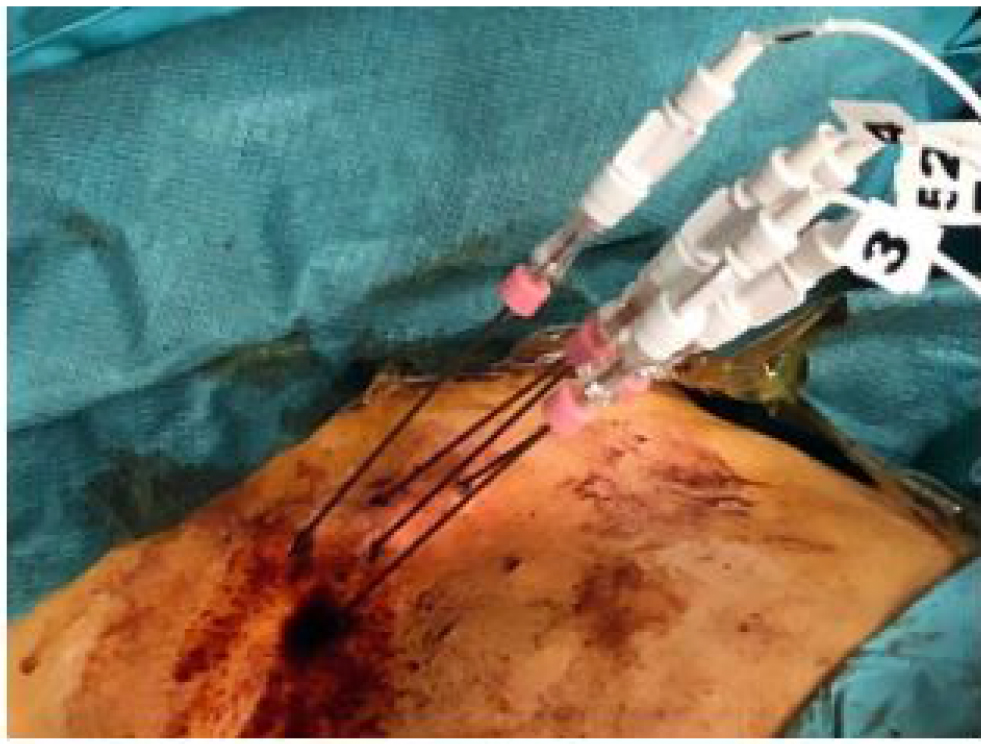
Comparison of Some Conventional and Photocatalytic Treatment Process Cost: Toxicity Analysis to Some Nanoparticles

DOI: 10.31038/ESCC.2019111

Abstract

Nano-metal oxides (NMOs) offer significant improvement in the treatment of hazardous, toxic and non-biodegradable contaminants to enhance their biodegradability. Some of these metal oxides was separated with recovery process. Metal oxide nanoparticles are among the most used engineered nanoparticles (NPs) in various treatment plants in recent years since nanoparticles offer significant improvement with their extremely high specific surface area and associated sorption sites, short intraparticle diffusion distance, and tunable pore size and surface chemistry. Although some acute toxicities was detected in the performed ecotoxicological for NMOs studied below the NMOs should be used to treat the recalcitrant, non-biodegradable pollutants since their cost are lower. The acute toxicity tests should be monitored regularly to prevent the ecosystem since the cost spent for toxicity analysis is very low and their harmful effects remain largely unknown. The first aim of this study is to determine the cost of the removals of some pollutants in the petrochemical wastewater by using advanced treatment processes containing some nano composites. The treatment efficiencies of the processes namely membrane diatilation (MD), reverse osmosis (RO), membrane filtration (MF), ultrafiltration (UF), nanofiltration (NF) were calculated and compared. On the other hand, the toxicity of NMOs of ZnO, Co3O4, ZrO2, Bi2O3 and ATO (Antimony oxide) to Vibrio fischeri, crustaceans (Daphnia magna) and fish (Poecillia reticula – lepistes) were investigated. In the ecotoxicological tests; the EC50 values was calculated from the inhibitions of NMOs used at increasing concentrations (0.1 – 14 mg/l) for 24 and 48 hours. The bioaccumulation the NMOs given above were performed. It was found that the most sensitive organism was Vibrio fischeri – bacteria while the most resistant organism was fish – Poecillia reticula – lepistes. The most toxic NMO were Co3O4 with low EC5O values (1.5 mg/L, while the less toxic NMO was ATO with high EC30 values (12.5 mg/l). Furthermore, the cost of the toxicity test analysis were compared. Although some acute toxicities was detected in the performed ecotoxicological tests advanced treatment plants containing the NMOs below the toxicity values did not cause acute toxicity

Keywords

Acute Toxicity, Bioaccumulation, Cost, Daphnia Magna, Nanometal Oxides, Vibrio Fischeri, Wastewater Treatment

1. Introduction

Among the various emerging technologies, the advancement in nanotechnology has proved an incredible potential for the remediation of wastewater and various other environmental problems [1]. NMOs have extremely high specific surface area and associated sorption sites, and surface chemistry. They can be recovered and they can be reused, and relatively have low energy demand. Therefore, they are used in the pretreatment or treatment of refractory substances via photocatalysts. The low cost increased the extensively usage of NMOs. This means that an increasing number of NMOs will be released to the aquatic environment through production processes. Although some authors have published in the literature on the fate, and toxicological information of NMOs and proposed research strategies for evaluation of safety of NMOs, their release into the aquatic environment is continuous and their harmful effects on organisms is expected. Ecotoxicology is the studies to determine the effects of toxic chemicals on biological organisms. In both developing and industrialized countries, a growing number of contaminants like micropollutants, pharmaceuticals, PCB, and PAHs are entering to the water bodies. The biological wastewater treatment is widely applied but these are usually slow, limited due to the presence of non-biodegradable contaminant, and sometimes causes toxicity to microorganisms due to some toxic contaminants [2]. With conventional treatment processes (sequential anaerobic and aerobic treatments and SBR) are not enough to treat the chemicals aforementioned and reach to the discharge standard by regulations and by the authorities. Therefore, there is a real requirement for more efficient, cheaper and powerful technologies for treatment of industrial wastewaters [3]. Nanotechnology-enabled water and wastewater treatment promises to not only overcome major challenges faced by existing treatment technologies, but also to provide new treatment capabilities that could allow economic utilization of unconventional water sources to expand the water supply. Efficiency of conventional adsorbents is usually limited by the surface area or active sites, the lack of selectivity, and the adsorption kinetics. Nano-adsorbents offer significant improvement with their extremely high specific surface area and associated sorption sites, short intraparticle diffusion distance, and tunable pore size and surface chemistry. It is a useful pretreatment for hazardous and non-biodegradable contaminants to enhance their biodegradability. Photocatalysis can also be used as a polishing step to treat recalcitrant organic compounds. Although there are already some studies on potential hazard of manufactured NPs, their release into the aquatic environment and their harmful effects remain largely unknown.

In this study it was aimed to determine the removal efficiencies and the cost of the some advanced treatment plants (membrane diatilation (MD), reverse osmosis (RO), membrane filtration (MF), ultrafiltration (UF),nanofiltration (NF)) for treating the pollutants from a petrochemical industry wastewater by the utilization of some nano-metal oxides. Therefore, the ecotoxicity of NMOs (nano-ZnO, nano-Co2O3, nano-Bi2O3, nano- ZrO2 and nano-ATO) to bioluminescence bacteria – Vibrio fischeri, anaerobic methane Archaea bacteria and water flea – Daphnia magna were studied. Among the inhibitions plots the EC50 values (NMOs concentration inhibiting 50 % of the organisms) of NMOs were calculated. Their bioaccumulation tests were determined in an aquatic environment during 28 days based on the soluble COD concentrations.

1.1 Theoretical Background

The properties of advanced processes used in this study were summarized below:

Membrane distillation (MD) is a thermally driven separational program in which separation is enabled due to phase change. A hydrophobic membrane displays a barrier for the liquid phase, allowing the vapour phase (e.g. water vapour) to pass through the membrane’s pores. Capillary polypropylene membranes (Accurel PP S6/2, Membrane GmbH, Germany), with the outside/inside diameter dout/din = 2.6 mm/1.8 mm containing 0, 2 mg/l nano ZnO. The capillary membranes have the pore size with the maximum and nominal diameter of 0.55 and 0.22 μm, respectively, and the porosity of 72%. The membranes were arranged as a parallel bundle of braided capillaries (three membranes in the braid). The total active surface area of membranes (A) for the mass transfer was calculated for the internal capillary diameter and amounted to 0.0889 m2. The values of the permeate flux were calculated from the equation J = 3,5 L/m2 .h :A hollow fiber PVC with UF membrane module with a nominal pore size of 0.01 μm and a total membrane area of 0.4 m2 was employed in the sMBR. Reverse osmosis (RO) is a water purification technology that uses a partially permeable membrane to remove ions, molecules and larger particles from drinking water. In reverse osmosis, an applied pressure is used to overcome osmotic pressure, a colligative property, that is driven by chemical potential differences of the solvent, a thermodynamic parameter. Reverse osmosis can remove many types of dissolved and suspended chemical species as well as biological ones (principally bacteria) from water, and is used in both industrial processes and the production of potable water. The result is that the solute is retained on the pressurized side of the membrane and the pure solvent is allowed to pass to the other side. To be “selective”, this membrane should not allow large molecules or ions through the pores (holes), but should allow smaller components of the solution (such as solvent molecules, i.e., water, H2O) to pass freely. Nanofiltration (NF) is a relatively recent membrane filtration process used most often with low total dissolved solids water such as surface water and fresh groundwater, with the purpose of softening (polyvalent cation removal) and removal of disinfection by-product precursors such as natural organic matter and synthetic organic matter. Forward osmosis (FO) is an osmotic process that, like reverse osmosis (RO), uses a semi-permeable membrane to effect separation of water from dissolved solutes. The driving force for this separation is an osmotic pressure gradient, such that a “draw” solution of high concentration (relative to that of the feed solution), is used to induce a net flow of water through the membrane into the draw solution, thus effectively separating the feed water from its solutes. In contrast, the reverse osmosis process uses hydraulic pressure as the driving force for separation, which serves to counteract the osmotic pressure gradient that would otherwise favor water flux from the permeate to the feed. Hence significantly more energy is required for reverse osmosis compared to forward osmosis.

1.2 Cost Analysis for the Novel Treatment Processes

In every treatment process the total treatment cost was defined based on the total expenses spent to treat 1 m3 wastewater. The total cost is the sum of the all normalized investment cost, the energy cost(natural gas, methane gas, electricity, thermal and steam costs) used during treatment processes, membrane charges during filer changing , personal and chemical costs, pumps and mechanic stirring device costs , bakıve onarımcosts (Tables 1, 2). For MD membran process flowrate: 30,000 m3/day, the ratio of permeat velocity to the food velocity 95%; yearly productiob capacity=: 30.000 m3/day x 365 day/year x 0.95 = 104.045.000 m3/year; First investment-capital cost: It can be calculated by the assumption of the capacity factor. The cost of a new MD process can be calculated with a similar known MD process cost and capacity. In order to calculate the normalized first investment cost.

The first normalized capital cost to treat the 1 m3 wastewater Equation (1) was used

The known capital of the old MD Process / the first capital cost of the second MD

= (MD-1 capacity/MD-2 capacity)m (Equation 1);

m is the capacity factor, and indicated the slope of the log curve in MD process for mall or big membrane process. The capacityfactor in MD system was accepted as 0.6 olarak alınır (Bick et al, 2012). The first investment cost (Euro/(m3/day ) for a flowrate of 30.000 m3/day was calculated as 850 Euro/m3.day (Bicket al, , 2012).

[(850 Euro/m3.day) × (30.000 m3/day)] × [(30.000 m3/day /29.000 m3/DAY)]0.6 = 27,270.596 Euro,

Capital recovery factor (CRF); cost reduction rate (r), and the sum of the cost payment numbers in the years in the future was (n)’ dir. r and n was taken as 7% and 10, respectively.

CRF is equal to r(1 + r)n/(1 + r n)–1 = [0.07 [ (1 + 0.07) 10/(1 + 0.07 10) –1]= 0,02 ( Equation 2) (Kesime et al., 2012)

normalized first investment cost is equal to : CRF × [ first investment cost (euro/year)/membran capacity (m3/yEAR) ]

The normalized first investment cost= 0,02 × [27,270,596 Euro/(104,045,000 m3/yıl)]= 0.005 Euro/m3 Electrical cost: Energy cost (Euro/m3) = Energy cost (Euro/kWh) x specific energy consumption (kWh/m3).

This specific energy comcumption for electricity was taken as 0,5 kWh/m3 (Kesime ve diğerl, 2012).

The specific energy consumption for natural – methane gas utilization was taken as 0.4 kWh/m3 (2, 33). 1 kWh electricity cost is =23 krş = 0,23 TL = 0.07 Euro, 1 Euro=3.1 TL alınmıştır.

Electricity requirement is equal to 0,07 Euro/kWh × 0,5 kWh/m3 = 0,035 Euro/m3

The cost of 1 kwh of natural gas is 0,08 TL = 0,02 Euro.

Natural gas requirement for methane gas is equal to 0.02 Euro/kwh x 0,4 kwh/m3 = 0.008 Euro/m3, Steam and thermal energy requirement for MD; 0,001 m3 STEAM energy is equal to 0,072 m3 methane gas

Steam energy cost = 0.0024 Euro/kwh (9). Specific energy consumption for steam energy = 100 kwh/m3,

Steam enegy expense (Euro/m3) = Energy cost (Euro/kWh) × specific energy consumption (kWh/m3);

Steam expense is accepted as 10% of the thermal energy; the steam energy expenses is = 0,0024 Euro/kwh × 100 kwh/m3 × 10/100 = 0,024 Euro/m3; Membrane changing cost: Membrane upflow rate = 6 kg/m2/h, membran cost 1,5 Euro/m2, membrane alteration cost is 20% , membran replacement rate = one in a year.

Membrane cost (Euro/m3) = [membrane price(euro/m2) × membrane changing rate (1/y)] × [ (1000 (l/m3) ]/[(membran akısı (6 kg/m2 × h) × 8760 h/yıl)] = 1,5 Euro/m2 × 0,20 × [(1000 l/m3)/(6 × 8760)], = Membran replacement expense= 0,005 Euro/m3,

Membran maintenance cost is calculated as 2% of the normalized investment cost of the mambran:. Membrane maintenance expense = 0,005 Euro/m3 × 0,02 = 1 × 10⁻⁴ Euro/m3

Personal cost (Euro/m3) = personal expense (TL-/day)/wastewater flow rate (m3/day), Personel cost: 30 days 2000 TL ( with assurance) person/month= 66 TL person/day = 21,3 Euro/day, Personal cost= 0.0007 Euro/m3; emission cost= Carbon cost= (Euro/m3) = Energy requirement (kwh/m3) x Emission factor (kg CO2-e/kwh) x carbon tax (Euro/ton CO2-e)X 1/1000 (ton/kg); for 1 ton carbon the tax is accepted as 17 Euro/ton. Emission factor for electricity= 1.22 kg CO2-e/kwh; Emission factor for methane gas is 18,4 kg CO2-e/kwh; Energy for electricity requirement is 0,5 kWh/m3 (2, 33).

Energy requirement for natural gas is accepted as 0,4 kWh/m3 (2, 33);

Carbon emission cost for electricity = 0,5 × 1,22 × 17/1000= 1,25 × 10⁻³ Euro/m3; Carbon emission cost for natural gas= 0,4 × 0,184 × 17/1000 = 7,36 × 10⁻⁵ Euro/m3; Cost for chemicals ( = H2SO4 1 L = = 10 Euro/L, NaOH 1 L= 9,67 Euro, For 30.000 m3/day flowrate 0,5 N’ lik 20 ml H2SO4 consumption= 2 × 10⁻⁴ Euro/m3; For 30.000 m3/gün flowrate 0.5 N 20 ml naoh consumption = 1,67 × 10⁻⁴ Euro/m3, cost for chemicals = 3,67 × 10⁻⁴ Euro/m3; Cost for pressured and vakuum pumps (4) = 225 Euro; Dört Investment cost of four pumps: Euro/(m3/day) is taken as 225 Euro/year. In recovery factor (KGF); Price reduction rate ® in recovery factor (KGF-RF), and the sum of the expensess will be paid ın the nex years is (n). (r = %3, n = 3 ). In the determination of Pump cost; recycling factor for pump ( RF = 0,02) normalized investment cost was calculated according to equation 3

RF × ( investment cost (Euro/year)/ pump capacity(m3/year) ( Eq… 3)

Pump capacity 30.000 m3/day × 365 day/year = 10,950,000 m3/year;

Normalized investment cost of pump is = 0,02 × [225 Euro/(10,950,000 m3/year)]= 4 × 10⁻⁴ Euro/m3

The cost for all membran processes are güven based on unit m2. With the same way the total cost for all treatment processes were calculated. The cost were 1,5 , 0,90 , 1,4, 1,40, 1,42 , 1,49 and 0,0045 Euro per m2 membran area for the processes MD, UF, RO, NF,DCMD, PRO and for FO forward osmosis. MD için 1,5 Euro/m2; batık fiber delikli UF = 0,90 Euro/m2, RO = 1,4 Euro/m2; UF için 1,40 Euro/m2; NF için 1,42 Euro/m2, DCMD için 1,49 Euro/m2, PRO için 0,045 Euro/m2, and for forwarded osmosis is 0,28 Euro/m2.

Table 1. The results of toxicity tests performed by NMOs

Daphnia magna

ATA

Vibrio fischeri

Bioaccumulation

24 h (mg/l)

48 h (mg/l)

24 h (mg/l)

48 h (mg/l)

30 min (mg/l)

10 mg/l COD

100 mg/l COD

1000 mg/l COD

ZnO

EC30=7,2

EC50=6,2

EC50=5,1

EC50=2,9

EC50=7,1

BCF 2

BCF 15

BCF 250

Co3O4

EC50=8,7

EC50=5,2

EC50=6,8

EC50=1,5

EC50=8,1

BCF 5

BCF 20

BCF 400

ZrO2

EC50=7,1

EC50=5,1

EC50=8

EC50=7,9

EC50=6,1

BCF 8

BCF 38

BCF 450

Bi2O3

EC50=5,1

EC50=4,2

EC50=4,9

EC50=2,9

EC50=9,9

BCF 9

BCF 45

BCF 460

ATO

EC50=7,9

EC50=6,2

EC50=6,9

EC50=4,9

EC30=12,5

BCF 4

BCF 23

BCF 300

Table 2. Cost analysis for Ecotoxicity Tests

Cost for ecotoxicity test : Daphnia magna : 20 tests in year: 1,2 euro

Cost for ecotoxicity test : Vibrio fischeri 20 test in year : 2.8 Euro

Cost for ecotoxicity test : Anaerobic bacteria 20 test in year  : 0.9 euro

Cost for Bioaccumulation : 2.9 euro

Total : 9.7 euro per year for 20 test

2. Material and Methods

2.1 Analytical Procedures

2.1.1 Vibrio fischeri Acute Toxicity Test:

Bioluminescent tests were performed under a NaCl concentration of 2% at 18⁰C (with incubation block) according to ISO/EN/DIN 11348 with Vibrio fischeri. The effective concentration, EC50, is defined as the NMO concentration decreasing the 50% of the light emitted by the Vibrio fischeri.

2.1.2 Anaerobic Toxicity Test – ATA

Anaerobic Toxicity Assay (ATA) measures the adverse effect of NMOs on the rate of the methane gas production (Owen et al, 1979). ATA were performed at 35ºC at volume of 150 ml amber bottle reactors. Anaerobic sludge used for this test providing 3000 mg/l anaerobic VSS (volatile suspended solids).

2.1.3 Daphnia magna Acute Toxicity Test

Acute toxicity assays with D. magna were conducted following OECD 202 (2004). Different nano material concentrations and 10 neonates (24 h old) D. magna were exposed to each NMOs. Median (50%) effective concentration levels (EC50) was calculated from percentage of inhibition graphics for each NMOs.

2.1.4 Bioaccumulation (BCF) Test

The bioaccumulation of NMOs was evaluated according to OECD 305 (1996).

For bioaccumulating substances, it can be expected that a time-weighted average (TWA) is the most relevant exposure concentration in water (Cw) within the allowed range of fluctuation . It is recommended to calculate a TWA water concentration, it should be noted that the transformation of the water concentration is suitable when exponential decay between renewal periods is expected, e.g. in a semi-static test design. In a flow through system,transformation of exposure concentrations may not be needed. If TWA water concentrations are derived, they should be reported and used in subsequent calculations.

In a standard fish BCF test uptake and depuration can be described in terms of two first order kinetic processes.

Rate of uptake = k1 × Cw (Eq.1)

Overall loss rate = (k2 +kg +km +ke) × Cf (Eq.2)

k1= First order rate constant for uptake into fish (L·kg-1·day-1).

k2 = First order rate constant for depuration from fish (day-1).

kg = First order rate constant for fish growth (‘growth dilution’) (day-1)

km = First order rate constant for metabolic transformation (day-1)

ke = First order rate constant for faecal egestion (day-1)

Cw = Concentration in water (mg·L-1).

The test consists of two phases: the exposure (uptake) and post-exposure (depuration) phases. k1 is the uptake rate constant (day-1) (Eq. 1). Cw is the NMOs concentration in the water (mg/l), k2 is the depuration constant (day-1) (Eq. 2) and Cf is the NMOs concentration in the fish.

At steady-state, assuming growth and metabolism are negligible (i.e. the values for kg and km cannot be distinguished from zero), the rate of uptake equals the rate of depuration. BCF is the bioaccumulation Factor and it was calculated by k1/k2 in Equation 3 (Eq. 3).

The ratio of k1/k2 is known as the kinetic BCF (BCFK) and should be equal to the steady-state BCF (BCFSS) obtained from the ratio of the steady-state concentration in fish to that in water, but deviation may occur if steady-state was uncertain or if corrections for growth have been applied to the kinetic BCF. However, as k1 and k2 are constants, steady-state does not need to be reached to derive a BCFK.

BCF =  k1 / k2 (Eq. 3)

ESCC 2019-101 - Delia Teresa SPONZA Turkey_F1 (Eq. 4)

ESCC 2019-101 - Delia Teresa SPONZA Turkey_F2 (Eq. 5)

2.1.5 Operational Conditions for the Membrane Processes

RO

A Hidrotek RO membrane consisting of ESPA2 LD and 0,4 mg/m2 nano ZnO with a surface area of 24 m2 at 21 bar Maximum pressure with a1,2 ml / min feed flow rate at 26°C at a pH =8 in continous mode(continuous operation) at a recovery of 85% was used.

MD

Js, the transmembrane flux is 0,7 kg m−2s−1), the lowest membrane pore is 0.0082, the porosity was 80–87%,feed flow rate 0,056 L/sec, the membrane material consist from PVDF with a paralel modül and contained 0,03mg/m2 Co2O3.

Hollow membrane                    

The membrane material consist from PVDF at a prseure of 3,5 bar, tensil module 06 0,0066 m2 at a flow rate of 0,23 L/sec, permeate flow rate 0f 0,6 L/sec, effective fiber lenttgh 0,6 m WİT A 0,02 mg/m2 ZrO2.

Pro Pressure Retarded Osmosis

The PRO process consisting from commercial cellulose triacetate provided by USA membrane production Center. An FO membrane supported by a USA (CTA-W) and an FO membrane (CTA-NW) was used. The RO experiments were conducted at 90 psi at 25 ± 0.2 °C. The PRO consisted from stainless steel with active membrane area of 110 cm2. The effluent was recirculated by a high pressure pump. The pressure in the draw solution was set by a back pressure regulator located downstream to the PRO. The temperature was 25 ± 0.2 °C with a Cross-flow velocity OF 8.5 cm/sEC WİTH 0,03 mg/m2 ATO.

MBR

The experimental MBR system comprised a bioreactor WİTH 20 L aerated tank AND with submerged flat sheet MF module consisting from a hydrophilic polypropylene membrane having a pore size of , 0.2μm. The channels between the membrane modules had a gap of 5 mm. The organic loading rate is 0,5 g COD/m3/day. The permeate suction pressure WA is 0.20 kPa with optimum SRT and HRT of 30 days and 6 days the aeration intensity and the permeate flux were 0,65 m3/m2 h and 14 L/m2 h at pH =8,0 with 0,09 mg/m2 ZnO

UF

UF membrane consinting from MWCO cntaining hollow fiber with a lentgh of 1,1 m, iner diameter is 0,65 μm with a 0,5 mg/m2 Co2O3 at a inlet flow rate of 4,86 ml/sec and a flux rate of 3,6 L/h.m2@20”C with a recovery of 90%.The molecular weigth cut-off is 30.000 D in YM30.

DCMD

Inlet flow rate is 1,5 L/sec, porosity 70%, length of Cross sectional area of flow channel is 0,0003 m2 with a 0,06 mg/m2 ZrO2 while the flow rate (Perimeter length of flow channel) is 0,115 m with a velocity of 0,135 m/h.

FO

The initial flux is 7.0µm/sec(25.2 L/m2 h while the hydraulic pressure is 3102.6 kPa (450 psi) containing 0,07 mg/m2 ATO. The flux is 7.04 m/s (25.2 L/m2 h), cross-flow velocity is 8.5 cm/sec, and the temperature was 21.0±1.0 ºC.

3. Results and Discussion

3.1 Comparison of Costs for Conventional and Advanced Treatment Plants

With conventional treatment processes (sequential anaerobic and aerobic treatments, Membrane processes and SBR) are not enough to threat the chemicals aforementioned and to reach to the discharge standards given by regulations. Furthermore, oxidation with chlorination, ozonation, chemical precipitation, UV/phenton processes consume high amount of chemical agents and, can produce toxic by-products and excess sludge. Furthermore, the cost of the conventional biological treatment plant are high compared to the advanced treatment plants utilizing the nanoparticles (data not shown). In advanced treatment processes in which the NPs was utilized, the total cost in RO, NF, UF and reduce to 0,0515 Euro, 0,0576 and 0,0576Euro to treat 20.000 m3 wastewater(data not shown). As result, the advanced treatment plants containing NMOs are significantly cheaper than conventional biological treatment plant. The cost in conventional treatment plants is 10 fold higher than that advance treatment plants containing NMOs (data not shown). Therefore, there is a real requirement for more efficient, cheaper and powerful technologies for treatment of industrial wastewaters. Among the various emerging technologies, the advancement in nanotechnology has proved an incredible potential for the remediation of wastewater and various other environmental problems [3].

3.2 Daphnia magna Acute Toxicity Test

The most toxic NMO is Bi2O3 with a low EC50 of 5.1 mg/l to D. magna after 24 h (Table 2). The least toxic NMO is Co3O4 with high EC50 value of 8.7 mg/l after 24 h incubation period (Table 2). After 48 h incubation the most toxic NMO was found to be Bi2O3 with the lowest EC50 value of 4.2 mg/l (Table 2). The least toxic NMOs were nano-ATO and nano-ZnO with the highest EC50 values of 6.2 mg/l (Table 2). The trophic transfer of ZnO NMO and ZnO-octyl NP from daphnids (Daphnia magna) to zebra fish (Danio rerio) was studied by [4]. For ZnO NMO and ZnO-octyl NP fast uptakes in D. magna were observed, whereas no measurable uptake took place for ZnO-OH NMO.

It was reported that the zinc recovered in the animals was not solely due to soluble zinc, but agglomerates/aggregates of ZnO NMO or ZnO-octyl NP contributed to the body burdens. [5] recently found that ZnO NP significantly accumulated and distributed in various tissues of juvenile carp (Cyprinus carpio). Only very few studies have reported on trophic transfer of engineered NMO. [6] demonstrated transfer of TiO2 NMO from D. magna to Danio rerio and studies using QD found evidence of potential trophic transfer [7]. The size distribution data showed a trend of ZnO NMO having the smallest hydrodynamic diameter, followed by Bi2O3, Co3O4, ZrO2 and ATO. In this study it was found that the NMO containing nanoparticles affected their EC50 values to D. magna. Though a combination of soluble, complexed Zn-species, and ZnO NMO as particles may contribute to the acute toxicity behavior observed in this study, the uptake of particles and aggregates contribute significantly to the overall acute toxicity observed. While dissolution may play a role in the uptake pattern observed for ZnO particles it is more likely that agglomerates contribute more inexplainable the higher uptake of bulk ZnO.

3.3 Anaerobic Toxicity Test – ATA

The least toxic NMO to anaerobic methane Archaea bacteria is Nano ZrO2 with the highest EC50 value of 8 mg/l after 24 h incubation while the most toxic NMO is Bi2O3 with the lowest EC50 value of 4.9 mg/l (Table 2). After 48 h incubation the EC50 values decreased at all NMO. The most toxic NMOs were nano-Co3O4 with the lowest EC50 values of 1,5 mg/l (Table 1). The least toxic NMO is nano ZrO2 with the highest EC50 value of 7.9 mg/l (Table 2). The biocidal potential of zinc oxide NPs against bacterial strain Pseudomonas aeruginosa was studied by Dwivedi et al. (2014). The NPs at a concentration of 100 µg/mL significantly inhibited the growth of bacteria and biofilm formation. The biofilm inhibition by ZnO-NPs was also confirmed via bio-transmission electron microscopy. ZnO-NPs treated bacteria confirmed the deformation and damage of cells. The bacterial growth in presence of NPs concluded the bactericidal ability of NPs in a concentration dependent manner. It has been speculated that the antibacterial activity of NPs as a surface coating material, could be a feasible approach for controlling the pathogens. No reports have described the toxicity of Bi2O3 nanoparticles, which indicates the necessity of investigating this area of nanotoxicology. Co3O4 nanoparticles, exert oxidative stress on human lymphocytes, damage DNA, and cause inflammatory responses [8]. Oxidative stress is an important factor for toxicity and causes the induction of apoptosis. Co3O4 nanoparticles induced cytotoxicity, morphological transformation, and genotoxicity in Balb3T3 cells [9]. All of these effects were most likely because of cobalt ion dissolution from the nanoparticles. Although cobalt metal oxide nanoparticles led to time- and concentration-dependent cytotoxicity, free Co2+ ions were more toxic.

3.4 Vibrio fischeri Acute Toxicity Test

The least toxic NMO was nano ATO with the highest EC30 value of 12.50 mg/l after 30 min for V. fischeri while the most toxic NMO was ZrO2 with the lowest EC50 value of 6.1 mg/l (Table 2). EC50 values obtained for ZnO from two models are comparable with effective concentrations of ZnO suspensions obtained by [10] (1.9 ppm) and [11] (4.8 ppm). The test results and calculation of effective concentration (EC) values showed that MCM-41 and nano-ZnO have the lowest and highest toxicity after 5 min exposure time to V. fischeri respectively. MCM-41 after 30 min contact time to Vibrio fischeri, was more toxic than nano SiO2. MCM-41s are listed to the latticed silica nano particles which are quite porous and have meso pore structure, while silica (SiO2) is nonporous-spherical nanoparticle. Bi2O3 although has attracted a great deal of attention as a semiconductor that is sensitive to visible light and has superior photocatalytic activity for environmental purposes, such as water treatment it was found to be toxic to Vibrio fischeri [12].

3.5 Bioaccumulation test of NMOs

The most accumulative NMO is Bi2O3 with high BCF values of 9, 45 and 460 mg/l at COD concentrations of 10, 100 and 1000 mg/l (Table 2). The least accumulative NMO İS ZnO with low BCF values of 2,15 and 250 mg/l, respectively (Table 2). According to REACH (Registration, Evaluation and Authorization of Chemicals) (REACH-EU, 2007) criteria if BCF values are less than 1000, the chemical is not bioaccumulative. Therefore all BCF values of NMOs used in this study were not higher than 1000 so these NMOs are not bioaccumulative according to REACH criteria.

3.6 Cost analysis for Ecotoxicity Test

Although some acute toxicities in bacteria, daphnids and methane Archaea bacteria the used NMOs were not bioaccumulative. Since the cost spent to conventional treatment plants are high in order to remove the pollutants from the wastewaters. Therefore, due to low investment costs of NMOs, in recent years the NMOs will be extensively used in the treatment of non-biodegradable pollutants at low concentrations. The acute toxicities of the NMOs should be monitored and the cost for these test was not so expensive (Table 2). For all acute toxicity tests and bioaccumulation the total cost is only 9.7 euro per year for 20 tests.

3.7 Treatment efficiencies in the novel processes containing the nano metal oxides

High removal efficiencies was obtained for all pollutants present in petrochemical industry wastewater (Table 3).

Table 3. Removal efficiencies in the novel processes containing NMOs

Parameter

Removal efficiencies (%)

MD

PRO

Submerged porous UF

RO

MF

UF

NF

DCMD

FO

COD

96

98

98

99,9

97

97

96

97

99

TOC

95

98

98

99,9

97

98

97

99

Polyphenols

95

98

97

99

97

98

96

98

TDS

95

98

97

99

97

98

95

99

DOC

96

98

98

99

96

97

96

98

Color

95

98

98

99

98

98

95

98

Aromatic amines

96

98

99

99

98

99

97

97

TN

95

98

98

100

97

97

96

97

TP

95

98

98

100

97

98

96

97

PAH

94

98

99

99

98

98

96

97

The total cost for all studied advanced treatment processes are low to treat 1 m3 petrochemical wastewater (Table 4).

Table 4. Calculated costs for some advanced processes containing NMOs

Parameter

MD

Submerged porous UF

RO

MF

UF

NF

Investment cost

0,005

0,0077

0,0034

0,004

0,008

0,009

Energy cost for natural gas

0,008

0,008

0,008

0,008

0,008

0,008

Energy cost for electricity

0,035

0,035

0,035

0,035

0,035

Steam energy cost

0,024

0,0011

0,0011

0,0012

0,005

0,003

Membrane exchange cost

0,005

0,001

0,005

0,003

0,005

0,0055

Membran

maintance cost

0,0001

0,00002

0,0001

0,0001

0,0001

0,0001

Total cost

0,0771

0,05172

0,0515

0,0151

0,3711

0,0576

Conclusion

The advanced treatment processes containing the NMOs were effectively used in the treatment of pollutants from the petrochemical industry wastewater. The cost of these treatment plants are low therefore should be preferred in the treatment of wastewaters containing refractory pollutants. With the utilization of nano metals below the inhibitions and toxicity levels high treatment efficiencies will be obtained in the industrial wastewater. The toxicity analysis results showed that the most toxic NMO is nano-Co3O4 to methane Archaea because of lowest EC50 value (1,5 mg/l) after 48 h. The least toxic NMO is ATO due to high EC50 value for organism (Vibrio fischeri ; 12,5 mg/l after 30 min). The results showed that nano-Co3O4 and Nano Bi2O3 are the most toxic NMOs with high acute toxicity compared to other NMOs. The most bioaccumulative NMO is nano-Bi2O3 due to the highest BCF value [13]. The least bioaccumulative NMO is nano-ZnO due to the lowest BCF value [13]. The concentrations of NMOs should be taken into consideration in the utilization of the novel treatment plant processes.

Acknowledgement

This study was prepared in the scope of Master of Sciences in Environmental Earth Sciences, and at the same time it was supported by the Department of Scientific Resource Project (2014.KB.FEN.019), in Dokuz Eylül University Graduate School of Natural and Applied Sciences. Also, the author acknowledged The Scientific and Technological Research council of Turkey (TÜBİTAK) for financial support (2210-C).

References

  1. Hull MS, Bowmann (2014) Nanotechnology Environmental Health and Safety: Risks, Regulation, and Management.
  2. Aruoja V, Dubourguier HC, Kasemets K, Kahru A (2009) Toxicity of nanoparticles of CuO, ZnO and TiO2 to microalgae Pseudokirchneriella subcapitata. Science of Total Environment 407: 1461–1468.
  3. Zare N (2007) Renewable and Alternative Energy: Concepts, Methodologies, Tools, and Applications, USA.
  4. Skjoldinga LM, Winther N, Baun A (2014) Trophic transfer of differently functionalized zinc oxide nanoparticles from crustaceans (Daphnia magna) to zebrafish (Danio rerio). Aquatic Toxicology 157: 101–108.
  5. Hao L, Chen L, Hao J, Zhong N (2013) Bioaccumulation and sub-acute toxicity of zinc oxide nanoparticles in juvenile carp (Cyprinus carpio): a comparative study with its bulk counterparts. Ecotoxicol Environ Saf 91: 52–60. [crossref]
  6. Zhua H, Wang J, Zhang X, Chang Y, Chen Y (2010) Trophic transfer of Ti O2 nanoparticles from daphnia to zebrafish in a simplified freshwater food chain. Chemosphere 79: 928–933.
  7. Woo ML (2015) Evidence of three-level trophic transfer of quantum dots in an aquatic food chain by using bioimaging. Nanotoxicology 9: 407–412.
  8. Zhang H, Ji S, Xia T, Meng H, Loe C (2012) Use of Metal Oxide Nanoparticle Band Gap To Develop a Predictive Paradigm for Oxidative Stress and Acute Pulmonary Inflammation. ACS Nano 6: 4349–4368.
  9. Cavallo D, Ciervo A, Fresegna AM, Maiello R, Tassone P, et al. (2015) Investigation on cobalt-oxide nanoparticles cyto-genotoxicity and inflammatory response in two types of respiratory cells. Journal of Applied Toxicology 35: 102–113.
  10. Heinlaan M, Ivask A, Blinova I, Dbourguier HC, Kahru (2008) Toxicity of nanosized and bulk ZnO, CuO and TiO2 to bacteria Vibrio fischeri and crustaceans Daphnia magna and Thamnocephalus platyurus. Chemosphere 71: 1308–1316.
  11. Mortimer M, Kasemets K, Heinlaan M, Kurvet I, Kahru A (2008) High throughput kinetic Vibrio fischeri bioluminescence inhibition assay for study of toxic effects of nanoparticles. Toxicology in Vitro 22: 1412–1417.
  12. Ana J, Jeong S, Moon HS, Jho EH, Nam K (2012) Prediction of Cd and Pb toxicity to Vibrio fischeri using biotic ligand-based models in soil. Journal of Hazardous Materials 203–204: 69–76.
  13. Hanna S, Miller RJ, Zhou D, Keller AA, Lenihan HS (2013) Accumulation and toxicity of metal oxide nanoparticles in a soft-sediment estuarine amphipod. Aquatic Toxicology 142–143, 441–446.

Premature vaginal delivery with breech presentation

DOI: 10.31038/IGOJ.2019231

Short Note

Only a few cases of extreme premature deliveries with breech presentation are described in the literature.  An unavoidable delivery with a premature child before gestationweek 26–28 whether there is a caput or a breech presentation, there are reasons to prefer a vaginal delivery.  You can`t change in worst case a very   poor prognosis for the child in relation to psyko and somatic development.  If you choose a cesarean section there are higher risks for the mother compared with vaginal delivery in mortality, aspiration, thromboembolic diseases, amnion emboli, higher risks for bleeding under the operation and infections subsequent.  In the future you may see complications with adherences and infertility, following births often end with placenta accrete, placenta previa and ablatio placenta, rupture of uterus and higher frequencies of caesarean section.

Whether the mode of delivery is vaginal or cesarean section, there will be risk of traumatic complication in the delivery of the foetus. Higher risks after cesarean section are neonatal meconium aspiration, respiratoric distress, hypoxi, and in the childhood allergic and bowl diseases.

In the choose of delivery – vaginal or cesarean section-you are giving the mother a much better prognosis  in a vaginal delivery and in any way you can’t chance a poor prognosis to the child.

References

  1. Ismail MA, Nagib N, Ismail T et al. Comparation of vaginal and cesarean section   delivery of  foetues  in breech presentation. Perinat Med 1999; 27: 339–51.
  2. Herbst A, Kællen K. Influence of mode of delivery on neonatal mortality and morbidity in spontaneous premature delivery. Eur J Obstet Gynecol Reprod Biol 2007; 133: 25–9.
  3. Markestad T, Kaaresen T, Rønnestad P et al. Early death, morbidity and need of treatment among extremely premature infants. Paediatrics 2005; 115: 1289–98.

Quantitative Point of Care testing of HCG in early pregnancy units: A Review

DOI: 10.31038/IGOJ.2019225

Current Practice

Vaginal bleeding and or abdominal pain occurs in 25% – 30% of viable pregnancies and are very common presentations to Primary Care; Emergency Departments and to specialist Early Pregnancy Assessment Units. In up to 42% of cases, no intrauterine pregnancy is seen on scan (and no ectopic pregnancy is identified) and this is known as a ‘pregnancy of unknown location’ (PUL) [1]. The current line of investigation for bleeding and pain in early pregnancy is a pelvic ultrasound scan to determine the location and viability of the pregnancy [2]. The pelvic ultrasound scan could be inconclusive in a fair number of patients. In up to 40% of cases there is no intrauterine pregnancy picked up on the scan, a diagnosis of pregnancy of unknown location (PUL) is considered [3]. Human chorionic gonadotrophin (hCG) is a glycoprotein hormone secreted from the placenta and is the most widely used biomarker as an indication of pregnancy in women.  As a single value it is not diagnostic nor beneficial, but when measured serially it is helpful. Serial hCG monitoring and a pelvic ultrasound are the mainstay of management of PUL [4-7]. The expected change in hCG over 48 hours is at least 53% and gives an indication that the pregnancy (intrauterine or ectopic) is progressing [8]. Serial hCG measurements are therefore used, not to determine the location of the pregnancy, but to predict viability of the pregnancy. The use of serial quantitative human chorionic gonadotropin (hCG) measurements is a mainstay of practice in Early Pregnancy Assessment Units (EPAUs) to aid in the management of these patients.

Quantitative POCT hCG Devices

The measurement of serial hCG using a recognised laboratory method has been recommended by both the NICE and the Royal College of Obstetrics and Gynaecology guidelines for managing a suspected ectopic pregnancy [9,10]. There have been quite a number of qualitative Point of Care (POC) hCG devices available on the market for some time but very few quantitative POC hCG devices. The quantitative POC devices that are currently on the market include the Abbott Point of Care i-STAT, the Radiometer AQT90 FLEX, and the Boditech i-CHROMA™.

For these devices to become common place in the serial quantification of hCG, there are several questions that need to be answered:

  1. What is the accuracy of quantitative POC methods compared to laboratory methods?
  2. Are the quantitative POC methods faster when compared to laboratory methods and thereby impact on patient experience (waiting time, decision making, diagnosis and hospital admissions)?
  3. What is the cost effectiveness of introducing quantitative POC methods to the treatment pathway?

What is the accuracy of quantitative POC methods compared to laboratory methods?

The i-STAT is a handheld cartridge-based system, CE certified using whole blood samples, using a sample volume of 17μl, with a total assay time of 10 minutes and a working range of 5 – 2,000 IU/L. Comparative studies between the quantitative POC method i-STAT and existing laboratory methods such as  the Abbott Architect Total β-hCG ; Beckman Dxl Total β-hCG ; and Roche Cobas e601 hCG+β showed that the  i-STAT results agreed most closely with the Abbott Architect Total β-hCG assay, while greater differences were observed with Beckman Dxl Total β-hCG and Roche Cobas e601 hCG+β assays [11,12]. (see table 1)

Table 1. Showing correlations (r2) between hCG concentrations of i-STAT method and other laboratory methods.

Method

Correlation (r2)

Beckman Coulter UniCel DX 1800

0.99411

Abbott Architect Total β-hCG

0.84312

Beckman Dxl Total β-hCG

0.99212

Roche Cobas e601 hCG+β

0.99312

Abbott Architect Total β-hCG

0.99312

The Boditech i-CHROMA™ hCG method is a portable device using fluorescence immunoassay (FIA), CE certified using whole blood samples, using a sample volume of 50μl, with a total assay time of 15 minutes and a working range of 5–50,000 IU/L. Comparative data between the quantitative POC method Boditech i-CHROMA™ hCG method and existing laboratory methods such as the Beckman Coulter Access2 hCG method described in the product leaflet [13] and in another study [14], with the following methods: Abbott Architect, BioMerieiux VIDAS/mini VIDAS, Roche hCG + Beta, Siemens Centaur XP/XPT/Classic, Siemens Dimension, Siemens DPC Immulite 1000 and 2000, Beckman DxI 600/800, Roche hCG STAT, Beckman Access, SNIBE Maglumi and Ortho Vitros [14] shown in table 2, showed very good correlation. In another study, the Boditech i-CHROMA™ hCG showed very good correlation with the following methods: Abbott Architect, BioMerieiux VIDAS/mini VIDAS, Roche hCG + Beta, Siemens Centaur XP/XPT/Classic, Siemens Dimension, Siemens DPC Immulite 1000 and 2000, Beckman DxI 600/800, Roche hCG STAT, Beckman Access, SNIBE Maglumi and Ortho Vitros [14] (see table 2).

Table 2. Showing correlations (r2) between hCG concentrations of i-CHROMA™ method and other laboratory methods

Method

Correlation (r2)

Beckman Coulter Access2

0.98913

Abbott Architect

0.99514

Monobind Inc. ELISA/CLIA

0.84214

Siemens Centaur CP

0.99214

Siemens Centaur XP/XPT/Classic

0.99214

Roche Cobas Core EIA

0.99314

Beckman DxI 600 /800

0.99314

DiaSorin, Liaison

0.99414

Beckman DXI Total βhCG (5th IS)

0.99414

bioMerieux, VIDAS / mini VIDAS

0.99414

Siemens/DPC Immulite 1000

0.99514

SNIBE Maglumi analysers

0.99614

Beckman, Access/LXi725

0.99714

Roche hCG+β

0.99714

Siemens Dimension

0.99714

Roche hCG STAT (Intact)

0.99814

Siemens/DPC Immulite 2000

0.99814

Beckman Access Total βhCG (5th IS)

0.99814

Ortho Vitros 3600/5600/ECi

0.99814

The Radiometer AQT90 method is based on an all in one dry chemistry concept, CE certified using whole blood samples, with a volume 0.3 – 2ml, with a total assay time of 18 minutes and a working range of 1 – 5,000 IU/L.  The agreement or concordance of the Radiometer AQT90 was 69% with the Abbott i-STAT, 81% with the Beckman Coulter and 75% with the Roche methods [15].

Are the quantitative POC methods faster when compared to laboratory methods and thereby impact on patient experience (waiting time, decision making, diagnosis and hospital admissions)?

The hCG sample, when taken in the emergency unit, is transported to the conventional laboratory and could take approximately 2-3 hours to return.  This could affect the patient experience (waiting time, decision making, diagnosis and hospital admissions). A study showed that a quantitative hCG method was simpler and faster than the traditional laboratory method [16].  This is not surprising as the hCG analysis can be done on whole blood samples and the analytical times of these quantitative POC devices range between 10 – 18 minutes, as described in this review. In most cases, in practice, patients are asked to wait until the following day for the result of the hCG test. This not only causes a delay in determining the management plan, it may also result in unnecessary hospital admission and almost certainly increases patient anxiety.

A case scenario and a brief review of the relevant literature was conducted, taking into consideration clinical and analytical elements of the clarity on the use of qualitative and quantitative hCG for the assessment of pregnancy. The conclusion was that use of hCG assays were reliable for pregnancy assessment [17]. A further case was presented from the emergency gynaecology unit at Barts and the London NHS Trust, where a point of care hCG analyser, the Radiometer AQT90 FLEX, was introduced as a strategy to deal with inconclusive sonography results. The unit had previously been sending hCG tests to the laboratory and getting the results back within 2-3 hours. With this POC hCG test, the staff, not being laboratory personnel, found the system reliable; user friendly and very simple to perform the test. In addition, in the past, patients with an inconclusive scan would have been sent away but now they are able to get results with the patients still in the clinic, facilitating the chance to initiate the appropriate treatment for the patient [18,19]. More recently, monitoring of serial hCG levels alone, permitted an early viability diagnosis to be made within 48 hours for 41.1% of patients with PUL, instead of 7 to 14 days with a transvaginal ultrasound scan [20].

The cost effectiveness of introducing quantitative POC devices to the treatment pathway

There are no studies looking at the cost effectiveness of point of care quantitative hCG testing. However, one study looked at the introduction of a point of care qualitative serum assay for hCG into an outpatient department for a 1 month period and showed a significant decrease in culdocenteses (p<0.001), ultrasound examinations (p<0.025) and hospital admissions (p<0.01), with a net projected institutional reduction in health care costs of $123,000 annually [21].

Conclusion

The possible advantages of a point-of-care quantitative serial hCG test in early pregnancy units would provide a rapid result, helping to aid prompt and effective clinical decision making.  It is likely to improve patient satisfaction by reducing waiting time for results and clinical decisions and enabling immediate feedback of the results to the patient. It may help diagnoses to be made in primary care, especially in the context of increasing availability of ultrasound scanning in the community setting. In addition, it may allow follow-up in primary care, rather than in secondary care, and it may be more cost effective than current laboratory methods.

In conclusion, there are currently a few POC quantitative hCG testing devices such as the Abbott Point of Care i-STAT, the Radiometer AQT90 FLEX and the Boditech i-CHROMA™. These devices have demonstrated very good correlation with many laboratory methods.  They are all CE approved devices able to measure hCG throughout the acceptable range, using small amounts of whole blood samples assayed all within 18 minutes. The devices should be able to make the patient experience more pleasant by allowing accurate diagnosis to be made, reduce waiting times and hospital admissions and be cost effective.

References

  1. Kirk E, Bottomley C, Bourne T. Diagnosing ectopic pregnancy and current concepts in the management of pregnancy of unknown location. Hum Reprod 2014; 20 (2): 250–261
  2. Kirk E, Papageorghiou AT, Condous G, Tan L, Boara S, Bourne T. The diagnostic effectiveness of an initial transvaginal scan in detecting ectopic pregnancy. Hum Reprod 2007; 22 (11): 2824–2828
  3. Royal College of Obstetrics and Gynaecologists: The management of tubal ectopic pregnancy. RCOG Guideline No 21. 2010 https://www.rcog.org.uk/en/guidelines-research-services/guidelines/gtg21/
  4. Banhart KT. Clinical practice. Ectopic pregnancy. N Engl J Med 2009; 361: 379 –387
  5. Barnhart K, Mennuti MT, Benjamin I, Jacobson S, Goodman D, Coutifaris C Prompt diagnosis of ectopic pregnancy in an emergency department setting. Obstet Gynecol 1994; 84: 1010–1015
  6. Nyberg DA, Filly RA, Mahony BS, Monroe S, Laing FC, Jeffrey RB Jr. Early gestation: correlation of HCG levels and sonographic identification. Am J Roentgenol 1985; 144: 951–954
  7. Peisner DB, Timor-Tritsch IE. The discriminatory zone of beta-hCG for vaginal probes. J Clin Ultrasound 1990; 18: 280–285
  8. Chung K, Allen R.: The use of serial human chorionic gonadotropin levels to establish a viable or a nonviable pregnancy. Semin Reprod Med 2008; 26 (5): 383-90.
  9. Royal College of Obstetrics and Gynaecologists. The management of tubal ectopic pregnancy. RCOG Guideline No 21. 210 https://www.rcog.org.uk/en/guidelines-research-services/guidelines/gtg21/
  10. NICE clinical guideline (CG154). Ectopic pregnancy and miscarriage: Diagnosis and initial management in early pregnancy of ectopic pregnancy and miscarriage. 2012. https://www.nice.org.uk/guidance/cg154
  11. Sowder AM, Yarbrough ML, Nerenz RD, Mitsios JV, Mortenson R, Gronowski AM et al. Analytical performance evaluation of the i-STAT total beta-human chorionic gonadotrophin immunoassay. Clin Chim Acta 2015; 446 : 165 – 170 Epub 2015/04/29
  12. Wikstrom A-K, Hagmar M, Ronquist G, Larsson A. Evaluation of plasma hCG method for point of care testing with the aim of shortening test turnaround times. Open Journal of Obstetrics and Gynecology 2015; 5 : 341–343. http://dx.doi.org/10.4236/ojog.2015.56049
  13. β-hCG Product Leaflet. Boditech Med Inc
  14. Bolodeoku J, Bains S, Pinkney S, Coker O, Fakokunde A. Comparison of the Point of Care Test (POCT), i-CHROMA™ Human Chorionic Gonadotrophin (HCG), Leutinizing Hormone (LH) and Follicle Stimulating Hormone (FSH) methods in serum with the other methods in the Randox International Quality Assessment Scheme (RIQAS). Clin Obstet Gynecol Reprod Med 2017 3 (4): 1–7
  15. Brun MM, Holloway L, Oleksy A, Dayton J, Estey MP, Goudreau B-L, Fuzery AK. Analytical evaluation of the Radiometer AQT90 FLEX βhCG assay. Prac Lab Med 2019; 13 :e00116 http://doi.org/10.1016/j.plabm.2019.e00116
  16. Von Lode P, Rainaho J, Pettersson K. Quantitative, wide range, 5 minute point of care immunoassay for total human chorionic gonadotrophin in whole blood. Clin Chem 2004; 50 (6): 1026–1035 Epub 2004/04/10
  17. Greene DN, Grenache DG. Pathology consultation on human chorionic gonadotropin testing for pregnancy assessment. Am J Clin Pathol 2015; 144 : 830–836. DOI: 10.1309/AJCP707VAREDUYIJ
  18. Case Story – Faster point of care hCG testing, transforming patient management in emergency gynaecology unit, reducing patient anxiety. Obs Gynae & Midwifery News 2012 May 25 http://www.ogpnews.com/2012/05/case-story-faster-point-of-care-hcg-testing-transforming-patient-management-in-emergency-gynaecology-unit-reducing-patient-anxiety/9581
  19. Product News – Point of care hCG invaluable for emergency gynaecology Obs Gynae & Midwifery News 2011 June 1 http://www.ogpnews.com/2011/06/point-of-care-hcg-testing-invaluable-for-emergency-gynaecology/291
  20. Joueidi Y, Bauville E, Laviolle B, Bendavid C, Lavoue V, Le Louis M. Serial hCG and progesterone levels to predict early pregnancy outcomes in pregnancies of uncertain viability: A prospective study. European Journal of Obstetrics and Gynecology and Reproductive Biology 2018; 220: 100–105 https://doi.org/10.1016/j.ejogrb.2017.11.020
  21. Gennis P. Gallagher EJ, Andersen F, Hain L. Cost effectiveness of an accurate and rapid assay for serum human chorionic gonadotropin in suspected ectopic pregnancy. Am J of Emerg Med 1988; 6 (1) 4–6