Author Archives: author

Ginger Ameliorated the Exocrine Pancreatic Structure of Fetuses of Diabetic Mother Wistar Albino Rats

DOI: 10.31038/EDMJ.2019335

Abstract

Objective: Hyperglycaemia and diabetic complication during pregnancy interfered with birth defect and traditional usage of phytotherapy take a great attention. The present study searched for illustrate the interference of maternal diabetes on the development of exocrine pancreas during in utero growth and role of ginger extract in improving the disease.

Research design and methods: Sixteen pregnant rats were used and arranged into four groups (n = 4); control, ginger extract group, diabetes, diabetes and ginger supplementation. Diabetes was induced by single i.p. injection of streptozotocin (60 mg/kg in citrate buffer pH 4.5 plus 100mg/kg nicotinamide). Ginger watery extract (200mg/kg body weight) was orally daily supplemented from 5th day of gestation until 14th day of gestation. Pregnant were sacrificed at 14th day of gestation, fetuses were separated and exocrine pancreas were separated and fixed in either 10% phosphate buffered formalin or 2.5 cacodylate buffered glutaraldhyde for transmission electron microscopy. Immunohistochemistry of caspase 3 was carried out. During the gestation period, blood glucose level was measured in the studied groups.

Results: The present results revealed that diabetes developed atrophy and degeneration of the acinar epithelium of the pancreas. At ultrastructural level, there was a considerable missing of the secretory granules and arranged of rough endoplasmic reticulum taking the characteristic feature of fibrosis. Immunohistochemical analysis illustrated over expression of caspase 3 in acina epithelium. However, ginger water extract supplementation to diabetic mother improved the blood glucose level and histo-cytlogical and immunohistochemical picture manifesting marked alleviation of the drastic alterations compared to the control.

Conclusion: The author concluded that ginger extract showed a potent antioxidant activity, decreasing the diabetes associated oxidative stress and improved the fetal exocrine pancreas histo-cytological structure.

Introduction

The pancreas is composed of exocrine and endocrine portion. It is developed from the dorsal and ventral endodermal as a result of the epithelio-mesenchymal interactions. Exocrine acinar cells, are responsible for secretion of zymogens and digestive enzymes through a ductal network leading to the duodenum and facilitated digestion [1, 2]. Acinar cells builds up the exocrine pancreas and secrete up to more than 20 kinds of enzymes, such as proteinase, DNAses and lipases, which are important elements for digestion [3].

The knowledge of type T3c diabetes mellitus (T3cDM, MODY) is still unclear and involved in the impairing of exocrine pancreas, the reservoir of digestive enzymes. Little knowledge about the mark differences between T2DM and T3cDM. T3cDM is developed in early childhood growth [4] and characterized by chronic pancreatitis, pancreatic cancer. Inflammation, fibrosis leading to damage of both endocrine and exocrine function impairing insulin/glucagon secretion and dysfunction of pancreatic enzyme [5]. The prevalence of exocrine dysfunction in type-1 and type-2 diabetic patients reached approximately to 37.7% and 26.2% respectively [6]. Also, the exocrine pancreas dysfunction related to diabetes affects 1.8% of adults with new-onset diabetes. Cell death of the islet of Langerhans alters the secretion of insulin, glucagon, and pancreatic polypeptide resulting fluctuations in glucose levels. Diabetes induced acute or chronic pancreatitis, associated with co-existing cystic fibrosis or hemochromatosis [7,8].

At the same time, there is a great attention to the consumption of traditional medicine. Ginger (Zingiber officinale) is a rhizome popular food spice and showed varieties of bioactive components such as vallinoids, viz. gingerol[9] and paradol, shogaols, zingerone, and galanals A and B [10]. Its administration resulted in improvements of diabetic patients [11–13] and experimental animals [14,15] through managing of hyperglycemia glycemia, oxidative stress, and inflammation.

There was no available work concerned the influence of maternal diabetes on the developing of exocrine pancreas during intrauterine life. The present work searched for illustrated the light and transmission electron microscopically study of fetal exocrine pancreas of diabetic mother and the potential medical phytotherapy of watery ginger extract.

Materials and Methods

1. Applied dose of ginger watery extract

A known weight of dried ginger (Zingiber officinale) was mixed thoroughly with hot water weekly, filtrate and allows standing at room temperature. Each pregnant received 0.5 cc containing 200mg of the extract / kg body weight. Each dose was orally administered daily from 6th day of gestation till 16th day of gestation.

2. Induction of diabetes

Experimental type 2 diabetes mellitus was induced in all the rats by a single interperitoneal injection of streptozotocin (60 mg/kg) in citrate buffer (0.05 M) (pH 4.5) and 100mg/kg nicotinamide [16]. Hyperglycemia was verified by measuring the blood glucose within 240- 280 mg/dl were selected for the study.

3. Experimental animal work

Twenty fertile male and virgin female of albino rats (Rattus norvegicus) (at a ratio of 1 male to 3 females) weighing approximately 200g body weight, obtained from Hellwan Breeding Farm, Ministry of Health, Egypt and used for experimentation. They were housed in good ventilation on a 12-h light and dark cycle. Females were mated (1 male/3 females) overnight and zero dates of gestation were determined the next morning by observing the sperm in vaginal smear. The pregnant were arranged into four groups (n = 4 per each); control, ginger watery extract, diabetes, diabetes and ginger extract. Experimental work was carried out from zero date of gestation till 16th day intra-uterine growth. Water was allowed ad Libitum. At the end of treatment, they were sacrificed by light diethyl ether anesthesia and dissected at 14th days prenatal. Maternal blood was collected and serum was separated and kept in refrigerator. Also, the pregnant were dissected and their fetuses were separated and processed for the following investigations:

4. Biochemical investigations:

Serum levels of total cholesterol (TC) [17], Triglycerides (TG) [18] and high density lipoproteins (HDL) [19] were determined. In case of low density lipoproteins (LDL), it was calculated from the total concentrations of cholesterol (TC), HDL-cholesterol and triglycerides according to Friedewald et al [20]. The glucose regularly measured by blood glucometers one touch ultra (Life Scan Milipitas, CA, USA).

5. Histological investigation:

Pancreas of 14th day-old fetuses of the studied groups were separated and immediately fixed in 10% phosphate buffered formalin (pH 7.4), dehydrated in ascending grades of ethyl alcohol, cleared in xylene and mounted in molten paraplast at 58–62ºC. Five μm histological sections were stained with hematoxylin & eosin and investigated under a bright field light microscope.

6. Transmission electron microscopy

Specimen of pancreas of 16th day old fetuses of the studied groups were immediately fixed in 2.5 % glutaraldehyde in 0.1M cacodylate buffer (pH 7.4) and post-fixed in 1% osmium tetraoxide, dehydrated in ascending grades of ethyl alcohol, and embedded in epoxy–resin. Ultrathin sections were cut with a diamond knife on a LKB Ultratome IV (LKB Instruments, Bromma, Sweden) and mounted on grids, stained with uranyl acetate and lead citrate, and examined under a Joel 100CX transmission electron microscope (Musashino 3-chome, Akishima, Tokyo 196–8558, Japan).

7. Immunohistochemistry for caspase 3

Deparaffinized histological 5μm thick sections of pancreas of 16 day old fetuses were cut and mounted onto super frost plus glass slides (Fisher Thermo Scientific, Nepean, Ontario, Canada). At a normal room temperature, the tissue sections were processed for antigen retrieval by digestion in 0.05 % trypsin (pH 7.8) for 15 min at 37°C and incubated with the antibodies against caspase 3 (dilution 1:100 Thermo Fisher Scientific, Fremont, CA, USA; Cat. No. A1–70007) for overnight at 4°C, followed by treatment with a horseradish peroxidase streptavidin detection system (Dako), and DAB plus Chromagen for developing the immunoactivity. The immunohistochemical stained slides were counterstained with hematoxylin. Negative control was carried out by incubating slides with 1% non-immune serum phosphate buffer solution (PBS) solution. Specimens were investigated under a Leica BM5000 microscope (Leica Microsystems, Wetzlar, Germany) and photographed.

For assessments of image analysis, slides were photographed using Olympus® digital camera installed on Olympus® microscope with 1/2 X photo adaptor, using 40 X objective. The result images were analyzed on Intel® Core I5® based computer using Video Test morphology® software (Russia) with a specific built-in routine for area, % area measurement and object counting.

Results

Biochemical observations

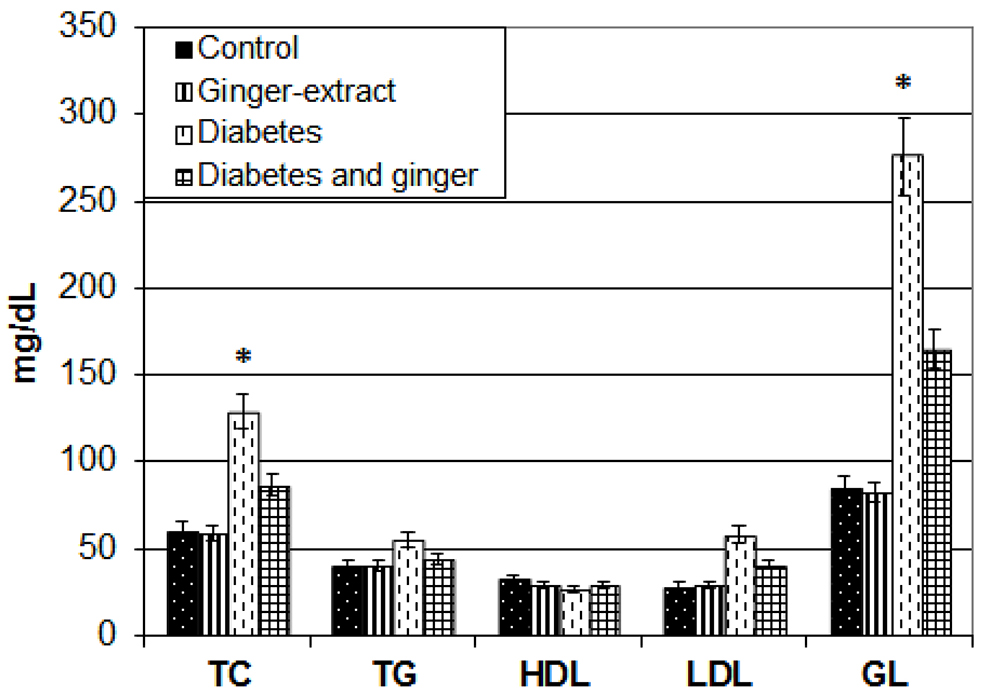
Ginger-extract supplementation improved the diabetic associated increase of serum glucose level, LDL, triglycerides and total cholesterol levels (Fig.1).

EDMJ 2019-116 - El-Sayyad Egypt_F1

Figure 1. Chart illustrating serum glucose, LDL, TG, HDL and total cholesterol levels. Each result represent the mean ± SD of n = 5. * Significant at P < 0.05. Abbreviations; GL, glucose, HDL, high density lipoprotein; LDL, low density lipoprotein; TC, Total cholesterol.

Exocrine pancreas of 14th day fetuses

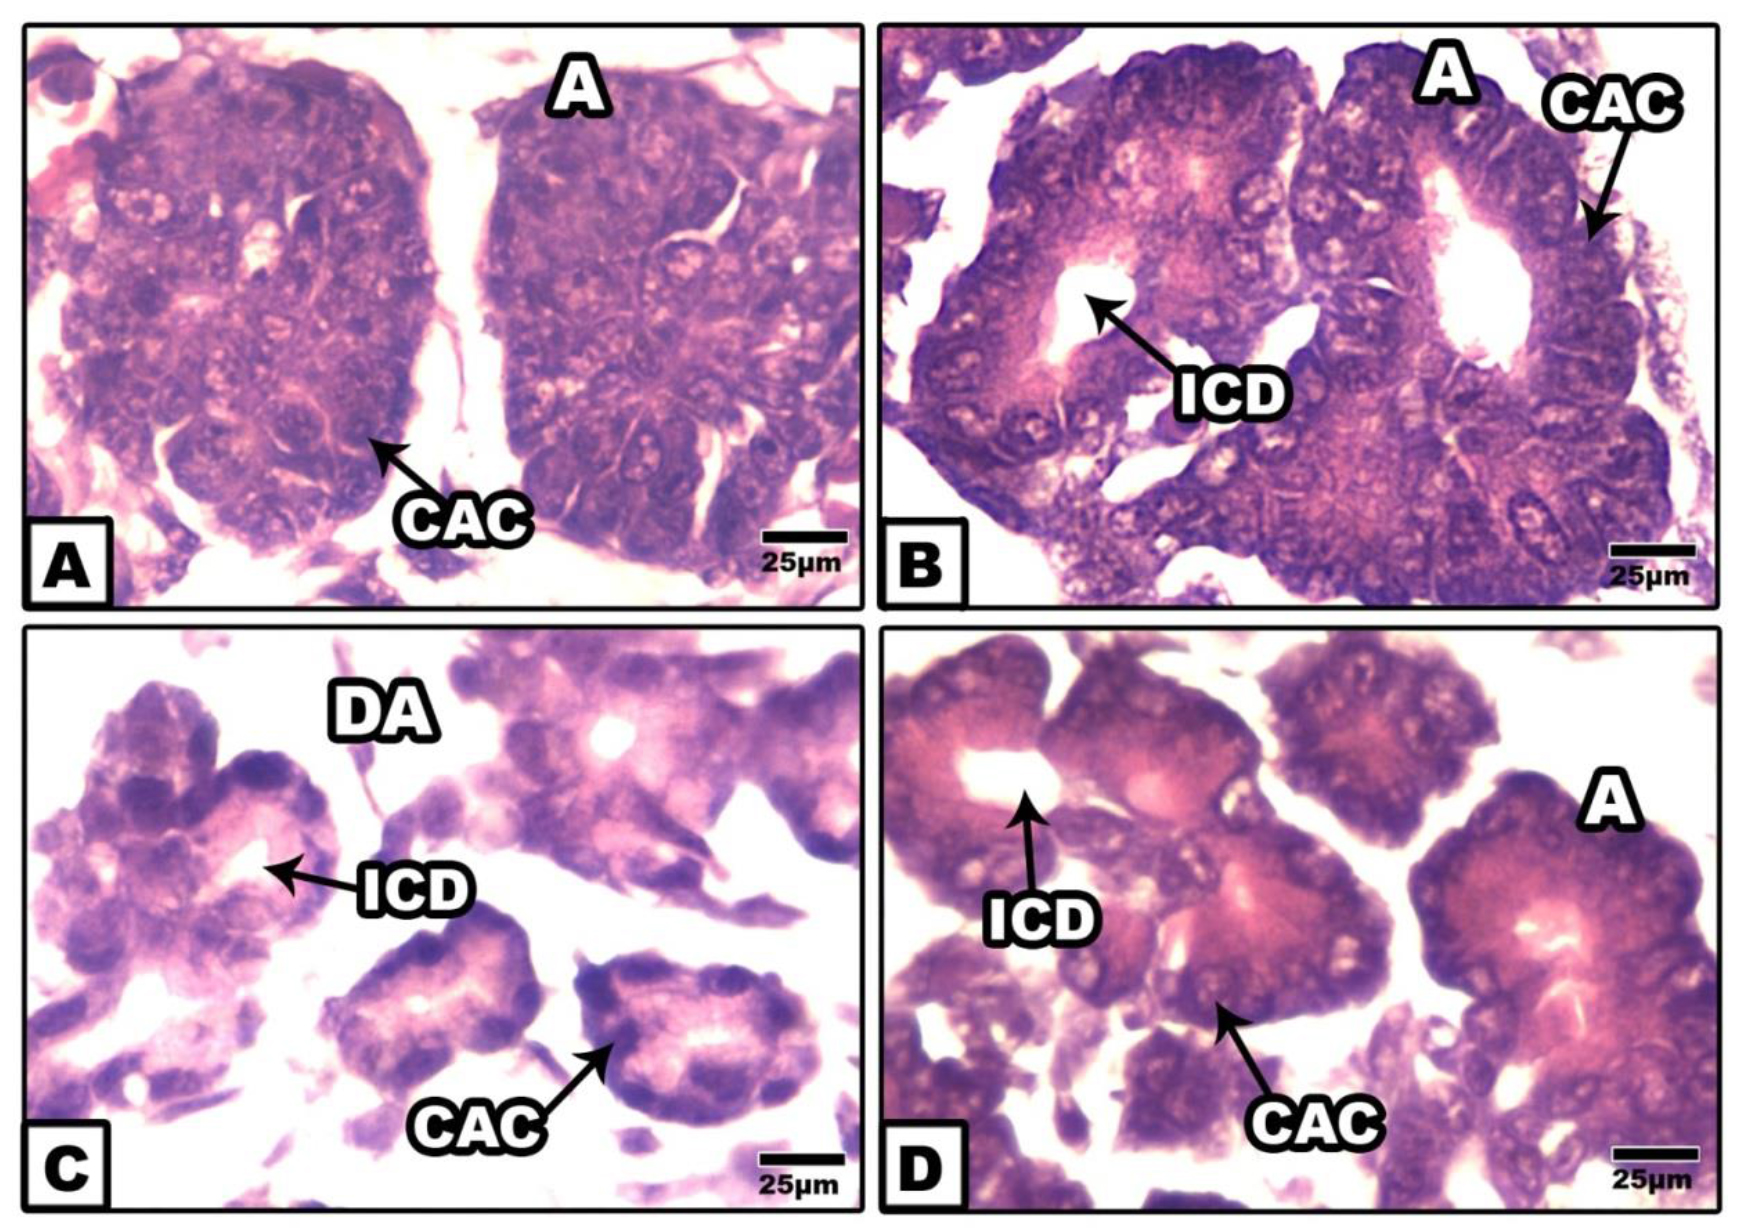
Fetuses of control and ginger-extract-supplemented mother exhibited normal structural pattern of exocrine pancreas. It is composed of tubuloacinar glands containing numerous acinar units. Each composed of pyramidal acinar cells with centrally located nuclei and basophilic cytoplasm surrounding their lumen (Fig. 2 A&B)

EDMJ 2019-116 - El-Sayyad Egypt_F2

Figure 2. Photomicrographs of histological sections of exocrine pancreas of 14th day rat fetuses. A. Control. B. Cinnamon-ginger extract. Note the normal structural pattern of centro-acinar cells and intercalated duct. C. Foetuses of diabetic mother showing disorganized acinus with collapsed duct and damaged acinar lining cells. D. Foetuses of diabetic mother supplemented ginger extract supplementation showing improved cento-acinar cells and intercalated duct. HE. Abbreviations; A, acini, CAC, centro-acinar cell; ICD, intercalated duct ; DA,deformed acinar.

However, those of diabetic mother exhibited massive damaging of the acinar units and atrophied lumina. The acinar lining cells appeared swollen with pyknotic nuclei and eosinophilic cytoplasm. Interlobular ducts were lined with flattened epithelium (Fig.2C).

On the other hand, fetuses of diabetic mother supplemented ginger-extract revealed improvement of the pancreatic structure but of less developed in comparison with the control (Fig.2D).

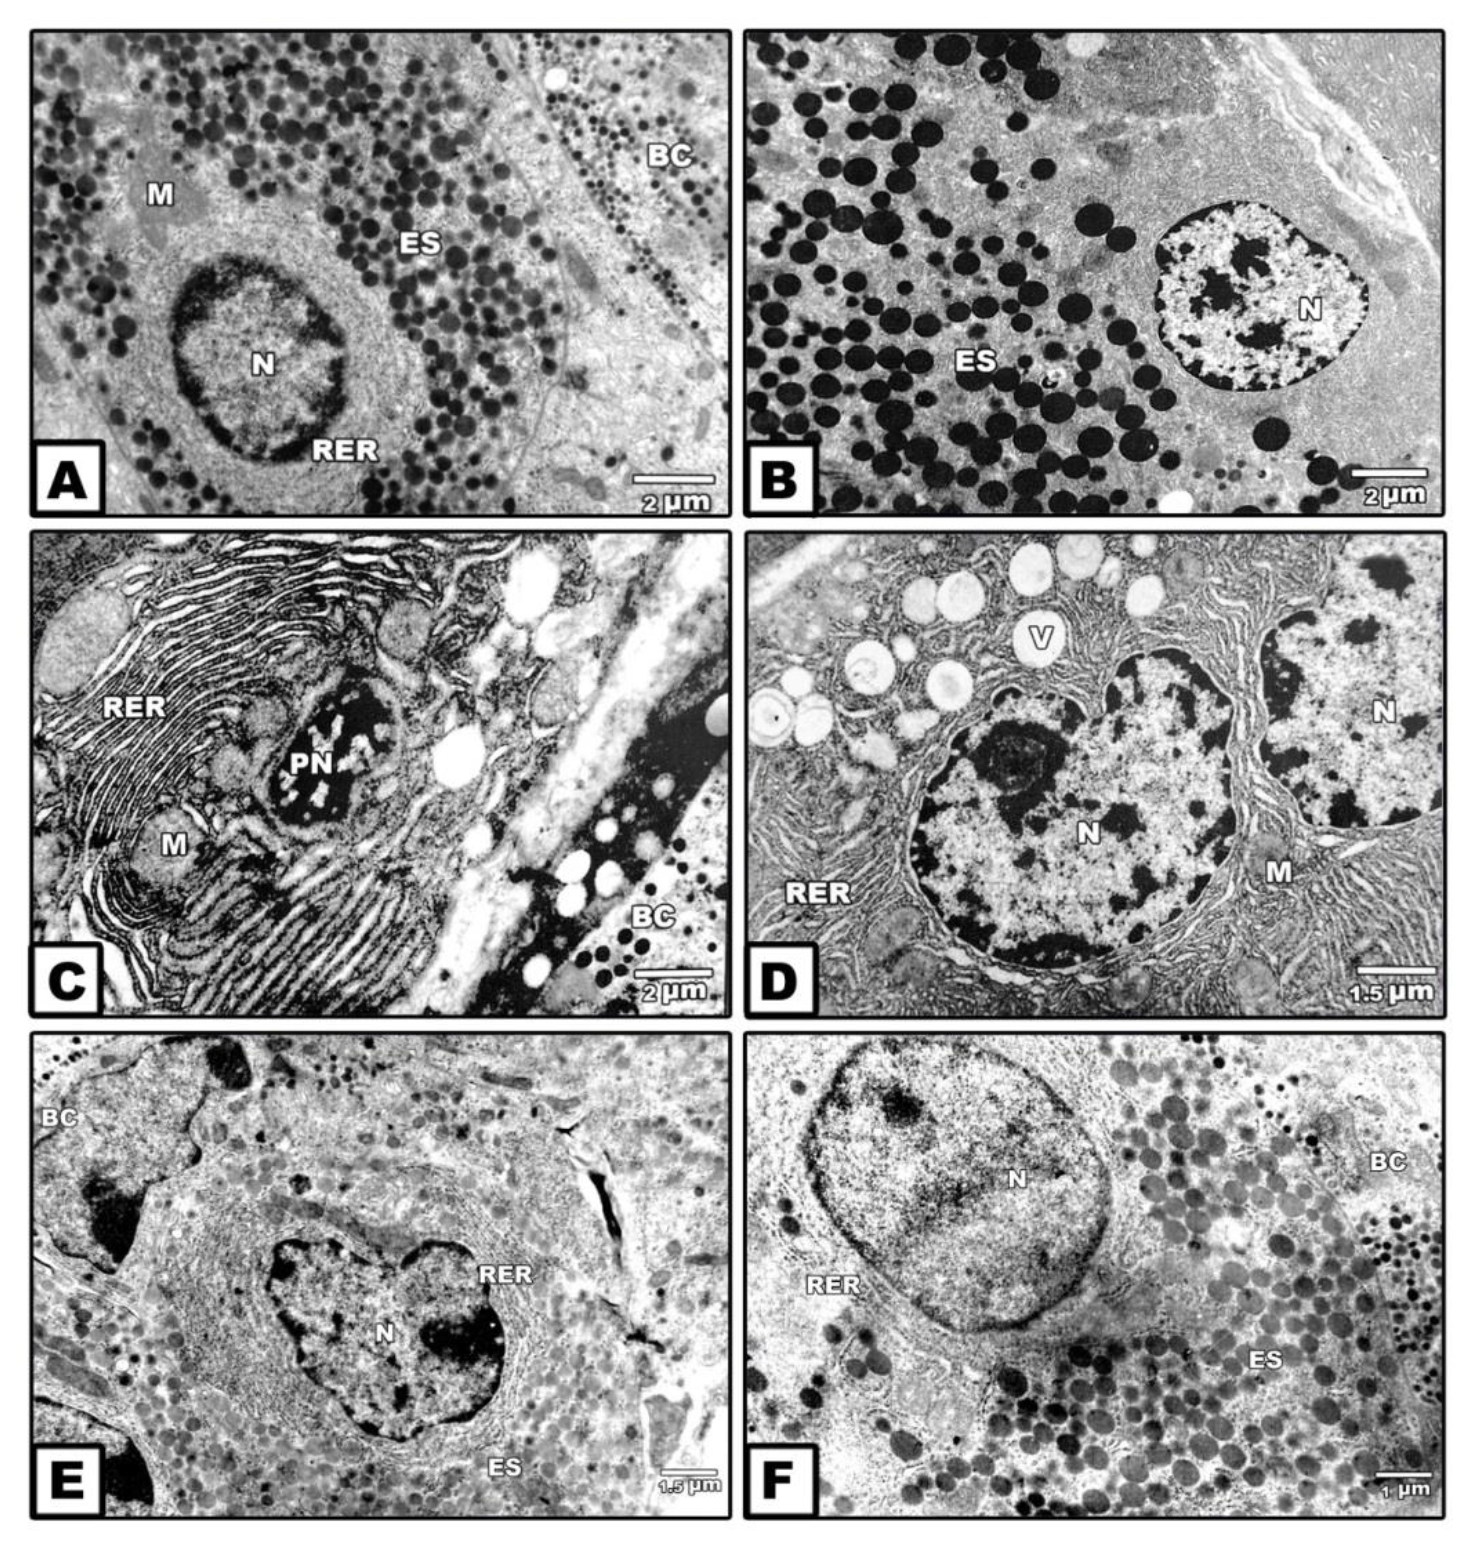
At ultrastructural level, the exocrine acinar cells possessed normal cytological structure in control and ginger –treatment. Each exocrine cell possessed centrally located nuclei with peripheral heterochromatin and abundant euchromatin. The cytoplasm contained abundant electron-dense and faint spherical zymogen granules of varying sizes and shape. The granules were membrane-bound. Numerous mitochondria and rough endoplasmic reticulum were detected in-between the secretory granules. Glycogen granules were observed in the cytoplasm of the acinar cells. Blood vessels are detected around the acini and ducts (Figs. 3 A&B).

EDMJ 2019-116 - El-Sayyad Egypt_F3

Figure 3. Transmission electron micrographs of exocrine pancreas of 14th day-old fetuses. A. Control. B. Maternally supplemented ginger extract. Note the presence of normal oval-shaped nuclei with peripheral marginal heterochromatin and central euchromatin. The is rich of electron –dense zymogen granules of different sizes containing in between mitochondria. C&D. Maternally diabetic showing apoptic atrophied nuclei composed electron-dense heterochromatin and surrounded by a network of clumped rough endoplasmic reticulum containing in between atrophied mitochondria (C). Another specimens illustrates nuclei with irregular nuclear envelope, lipid vacuoles and missing of secretory granules (D). E&F. Foetuses of diabetic mother supplemented ginger extract revealing increase secretion of light and electron-dense zymogen granules. Abbreviations; BC, blood capillary; ES, electron-dense-secretory granule; M, mitochondria, N, nuclei; PN, pyknotic nuclei; RER, rough endoplasmic reticulum; V, lipid vacuoles.

In those maternally diabetic, the acinar cells exhibited apoptic nuclei composed of electron-dense heterochromatin and surrounded by a network of clumped rough endoplasmic reticulum enclosed in between atrophied mitochondria manifesting fibrotic structure. In some other cells, the nuclei outlined by irregular nuclear envelope and their cytoplasm contained abundant lipidvacuoles of varying sizes and missing of their inclusion of secretory granules (Figs. 3 C&D).

On the other hand, fetuses of diabetic mother supplemented ginger extract restored the presence of faint secretory granules was comparatively decreased in some cells and increased in other ones. The criteria structure of the acinar cells is improved but less developed compared to the control (Figs. 3 E&F).

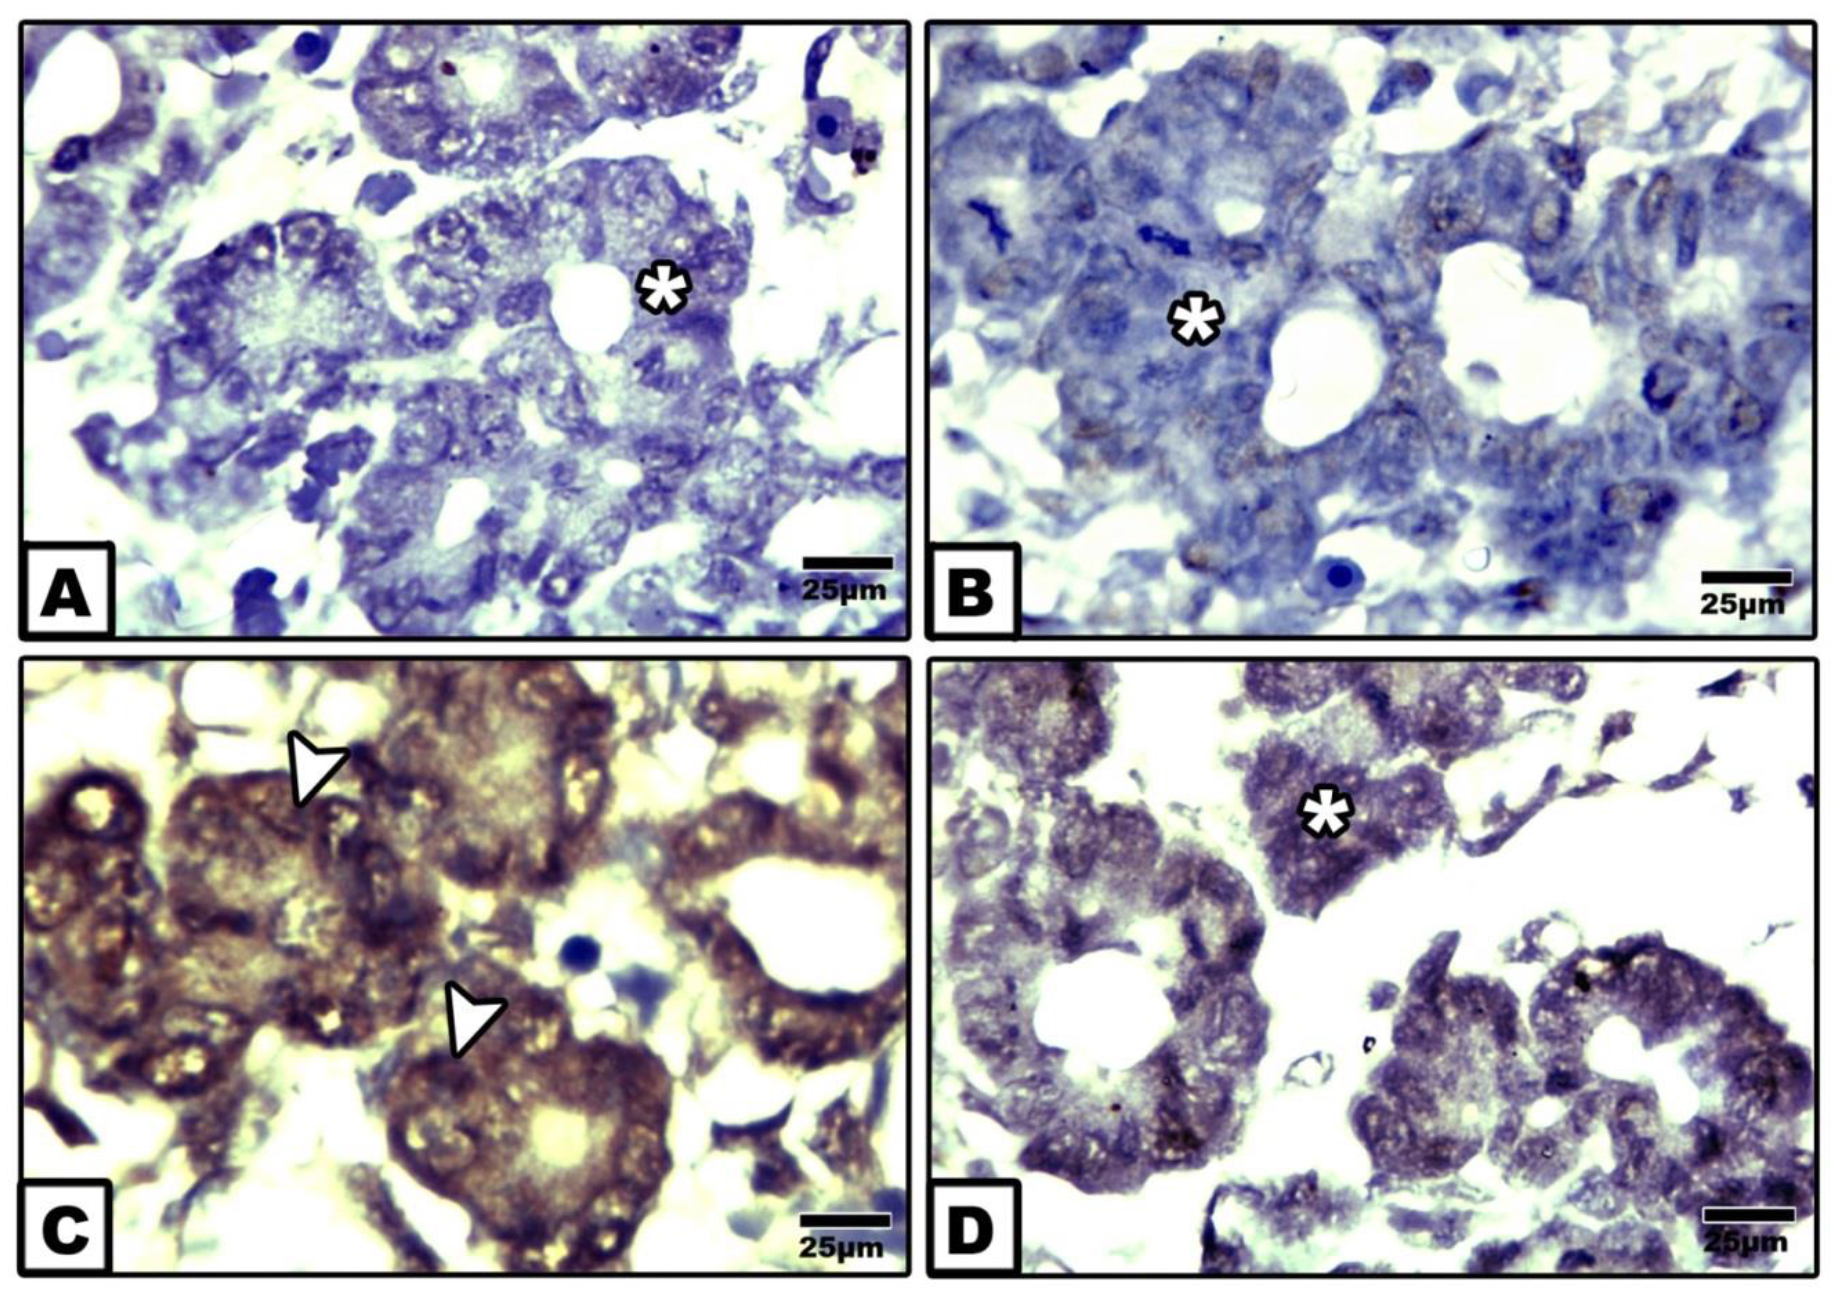
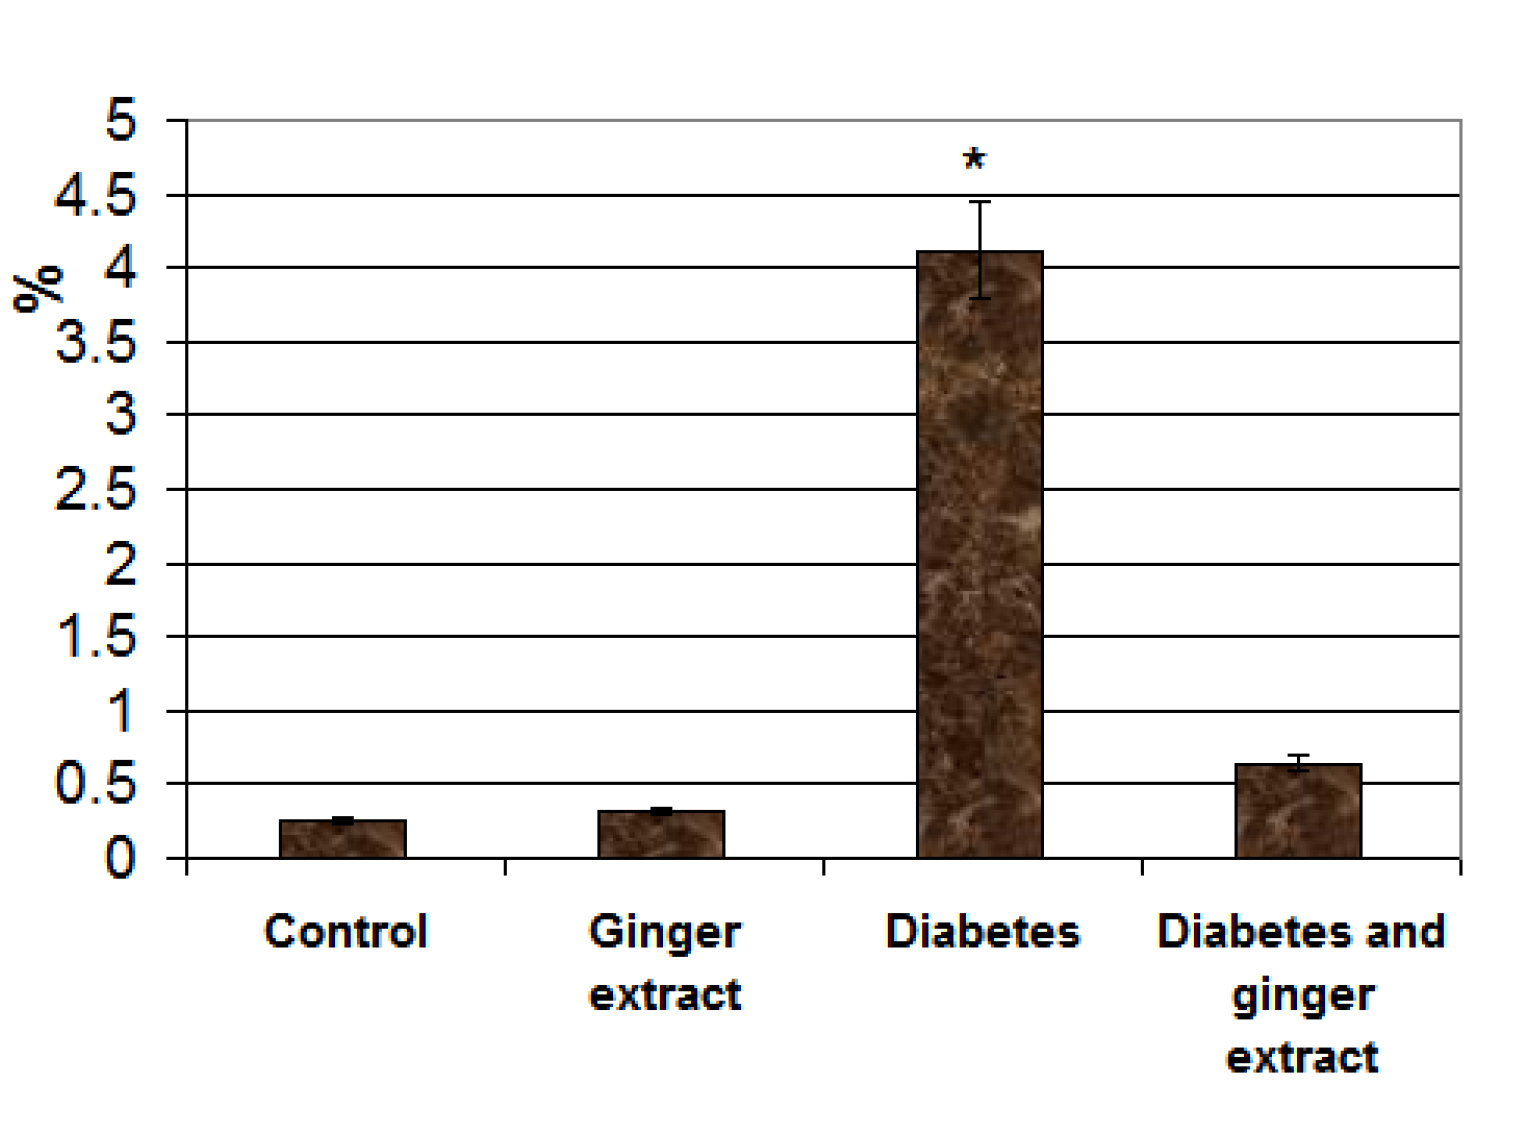
Following immunohistochemical staining with caspase 3, the fetuses of diabetic mother exhibited overexpression of dark brown reaction in acinar cells (Fig. 4C) in comparison with the negative staining affinity in control and ginger supplementation (Figs. 4 A&B). Fetuses of diabetic mother supplemented ginger extract revealed marked reduction of the immunohistochemical reaction (Fig. 4D). Image analysis revealed increased regional area of immunohistochemical reaction in acinar cells of diabetic mother compared to the other studied groups (Fig. 5).

EDMJ 2019-116 - El-Sayyad Egypt_F4

Figure 4. Photomicrographs of formalin fixed histological section of exocrine pancreas of 14th day-old fetuses maternally immunohistochemically stained with caspase 3. A. Control. B. Ginger extract-treatment. Note negative immuphistochemically stained with caspase 3. C. Maternally diabetic showing increased immunohistochemical affinity in acinar cells. D. Ginger extract showing marked reduction of the expression of caspase 3.

EDMJ 2019-116 - El-Sayyad Egypt_F5

Figure 5. Chart illustrating image analysis of surface immunohistochemical reactive areas with caspase 3 of acinar cells of fetuses of diabetic mother compared to the other studied groups. Each result represent the mean ± SD of n = 5. Star means significant at P < 0.05.

Discussion

The present findings revealed that 14th day-old fetuses of diabetic mother exhibited abnormal histological structure of exocrine pancreatic cells including eosinophilia cytoplasm and pyknotic nuclei of acinar cells and almost missing of their lumina. Although there is no detected the presence of inflammatory cells, other authors revealed that inflammation may be occurred during organogenesis of the lymphopoietic-hematopoietic system, based on hematopoietic cell-mesenchymal cell interactions [21].

The presence of zymogen granules in the acinar cells has been reported by Conklin [22] and Laitio et al. [23] in human fetal pancreas. Tadokoro et al. [24] reported the presence of increased number and density of zymogen granules before birth in rats. Inagaki et al. [25] mentioned that the secretory granules are responsible for stored zymogen granucles and secretion of lipase, trypsin, and amylase in fetal acinar cells. Rough endoplasmic reticulum and the Golgi apparatus are involved in synthesis of zymogen granule in the adult [26].

At ultrastructure level, the observed findings reported a detected missing of the secretory granules and increased network of endoplasmic reticulum surrounding the apoptic nuclei forming the fibrotic structure. Lipid vacuoles of varying sizes were distributed in the cytoplasm. Also, atrophied mitochondria with damaging internal structure were observed in comparison with the control.

Similar findings of reduced secretory granules were reported in E2F1/E2F2 compound-mutant mice develop non-autoimmune insulin-deficient diabetes [27].

Diabetes may involvein gene defects leads to pancreatic lipomatosis and exocrine pancreatic insufficiency in childhood, and progressed till 34 years [28]. The observed damage of both mitochondria and rough endoplasmic reticulum facilitated accumulation misfolding protein with intracellular and extracellular aggregation exerting a cytotoxic effect and caused progression of disease of the islets of Langerhans [29].

The apparent reduction and number of mitochondria and deposition of fat vacuoles reflected the depletion of energy level of acinar cells and consequently loss of pancreatic function.

Similar findings were reported by Kaido et al. [30] in a murine model of primary carnitine deficiency.

Also, the present study reported the development of congenital malformation of acute pancreatitis in fetuses of diabetic mother. Damaging of the acinar cells led to depletion of the majority of enzymes needed for digestion.

Pin et al. [31] reported that the acinar cells of the exocrine pancreas is responsible for the development of up >90% of the cells within the pancreas especially β cells. The conversion of acinar cells to either β cells involves alterations in the expression and activity of the transcription factor, and changes in their epigenetic program.

For my opinion in utero poor control of diabetes associated damage of the exocrine pancreas may be increased cell programming and increased the risk susceptibility for the developmental origin of diabetes during adult hood.

At the same time supplementation of ginger to diabetic mother ameliorated the structural pattern of the acinar cells, partially restoring the secretory granules and cell cytoskeletal structure.

Ginger was found to contain several bio components such as gingerol [9] and shogaols and zingerone [10] which improve hyperglycaemia and resoluted oxidative stress and inflammation. This led to decrease the programming of cell death and managing cell growth and differentiation [11,14, 15] .

The authors finally concluded that ginger supplementation during pregnancy may help to improve the antioxidant activity of the pancreatic cells and sustained growth and differentiation against the cytotoxicity of diabetes.

References

  1. Edlund H (2001) Developmental biology of the pancreas. Diabetes 50: 5–9.
  2. Zhou Q, Melton DA (2018) Pancreas regeneration. Nature 557: 351–358.
  3. Zhou Q, Law AC, Rajagopal J, Anderson WJ and Gray PA et al (2007) A multipotent progenitor domain guides pancreatic organogenesis. Dev Cell 13:103–14.
  4. Fajans SS, Bell GI, Polonsky KS (2001) Molecular mechanisms and clinical pathophysiology of maturity-onset diabetes of the young. N Engl J Med 345:971–980.
  5. Bhattamisra SK, Siang TC, Rong CY, Annan NC, Sean EHY et al (2019) Type-3c Diabetes Mellitus, Diabetes of Exocrine Pancreas – An Update. Curr Diabetes Rev.
  6. Talukdar R, Reddy DN (2017) Pancreatic Exocrine Insufficiency in Type 1 and 2 Diabetes: Therapeutic Implications. J Assoc Physicians India 65: 64–70.
  7. Bonnet-Serrano F, Diedisheim M, Mallone R, Larger E (2018) Decreased α-cell mass and early structural alterations of the exocrine pancreas in patients with type 1 diabetes: An analysis based on the nPOD repository. PLoS One 13: 0191528.
  8. Wynne K, Devereaux B, Dornhorst A (2019) Diabetes of the exocrine pancreas. J GastroenterolHepatol 34: 346–354.
  9. Kaul PN, Joshi BS (2001) Alternative medicine: Herbal drugs and their critical appraisal-part II. Prog Drug Res 57:1–75.
  10. Shukla Y, Singh M (2007) Cancer preventive properties of ginger: a brief review. Food ChemToxicol 45:683–690.
  11. Suk S, Kwon GT, Lee E, Jang WJ, Yang H et al (2017) Gingerenone A, a polyphenol present in ginger, suppresses obesity and adipose tissue inflammation in high-fat diet-fed mice. MolNutr Food Res 61.
  12. Wang J, Ke W, Bao R, Hu X, Chen F (2017) Beneficial effects of ginger Zingiberofficinale Roscoe on obesity and metabolic syndrome: a review. Ann N Y Acad Sci 1398: 83–98.
  13. Wang Y, Yu H, Zhang X, Feng Q, Guo X et al (2017) Evaluation of daily ginger consumption for the prevention of chronic diseases in adults: A cross-sectional study. Nutrition 36: 79–84.
  14. Ilkhanizadeh B, Shirpoor A, Khadem Ansari MH, Nemati S, Rasmi Y (2016) Protective effects of ginger (Zingiberofficinale) extract against diabetes-induced heart abnormality in rats. DiabetesMetab J 40: 46–53.
  15. de Las Heras N, Valero-Muñoz M, Martín-Fernández B, Ballesteros S, López-Farré A (2017) Molecular factors involved in the hypolipidemic- and insulin-sensitizing effects of a ginger (Zingiberofficinale Roscoe) extract in rats fed a high-fat diet. ApplPhysiolNutrMetab 42: 209–215.
  16. Ghasemi A, Khalifi S, Jedi S (2014) Streptozotocin-nicotinamide-induced rat model of type 2 diabetes. ActaPhysiol Hung 10: 408–20.
  17. Deeg R, Ziegenhorn J (1983) Kinetic enzymic method for automated determination of total cholesterol in serum. ClinChem 29: 1798–1802.
  18. Fossati P, Prencipe L (1982) Serum triglycerides determined colorimetrically with an enzyme that proceduces hydrogen peroxide. ClinChem 28: 2077–2080.
  19. Grove TH (1979) Effect of reagent PH on determination of the high-density lipoprotein cholesterol by precipitation with sodium phototungestate-magnesium. ClinChem 25: 560–564.
  20. Friedewald WT, Levy RI, Fredrickson DS (1972) Estimation of low density lipoprotein cholesterol in plasma without use preparative ultracentri-fuge. ClinChem 18: 499–502.
  21. Nishikawa SI, Hashi H, Honda K, Fraser S, Yoshida H (2000). Inflammation, a prototype for organogenesis of the lymphopoietic/hematopoietic system. CurrOpinImmunol 12: 342–345.
  22. Conklin JL (1962). Cytogenesis of the human fetal pancreas, Am J Anat 111: 181–193.
  23. Laitio M, Lev R, Orlic D (1974) The developing human fetal pancreas: An ultrastructural and histochemical study with special reference to exocrine cells. J Anat 117: 619–634.
  24. Tadokoro H, Takase M, Nobukawa B (2011) Development and congenital anomalies of the pancreas. Anat Res Int Article ID 351217: 7.
  25. Inagaki T, Tajiri T, Tate G, Kunimura T, Morohoshi T (2012). Dynamic morphologic change and differentiation from fetal to mature pancreaticacinar cells in rats. J Nippon Med Sch 79: 335–42.
  26. Caro LG, Palade GE (1964) Protein synthesis, storage, and discharge in the pancreatic exocrine cell: an autoradiographic study. J Cell Biol 20: 473–495.
  27. Iglesias A, Murga M, Laresgoiti U, Skoudy A, Bernales I et al (2004) Diabetes and exocrine pancreatic insufficiency in E2F1/E2F2 double-mutant mice. J Clin Invest 113: 1398–1407.
  28. Raeder H, Johansson S, Holm PI et al (2005) Mutations in the CEL VNTR cause a syndrome of diabetes and pancreatic exocrine dysfunction. Nat Genet 38: 54–62.
  29. Johansson BB, Torsvik J, Bjørkhaug L et al (2011) Diabetes and pancreatic exocrine dysfunction due to mutations in the carboxyl ester lipase gene-maturity onset diabetes of the young (CEL-MODY): a protein misfolding disease. J BiolChem 286: 34593–34605.
  30. Kaido M, Fujimura H, Ono A, Toyooka K, Yoshikawa H (1997) Mitochondrial abnormalities in a murine model of primary carnitine deficiency. Systemic pathology and trial of replacement therapy. EurNeurol 38: 302–9.
  31. Pin CL, Ryan JF, Mehmood R. (2015) Acinar cell reprogramming: a clinically important target in pancreatic disease. Epigenomics 7: 267–81.

Diabetes related cataract and histopathological abnormalities of the ocular regions of Wister albino rats

DOI: 10.31038/EDMJ.2019334

Abstract

Objective: Diabetes is an important public health disease affected different body organs especially eye. The present study aimed to illustrate the cataractous lenses associated complication on ocular organs.

Research design and methods: Following induction of type 2 diabetes for 6 months (streptozotocin 60mg/kg single dose in combination with nicotinamide100 mg./kg body weight), 6 rats of a colony of 47 individuals developed cataract. Control individuals were used of the similar age. The animals groups were anaesthetized and sacrificed. Ocular regions were incised and subjected for histopathology and comet assay. Transmission electron microscopy was carried out for the optic nerve. In case of meibomian gland, beside histopathological investigations, immunohistochemistry of bcl2, caspase 3 and p53 were carried out.

Results: The present findings revealed the development of cataractous lenses, diabetic retinopathy, thickened cornea and damaged stroma and optic neuropathy explained by demyelinated axons. Single gel electrophoresis explained DNA damage of cells of the retina, ciliary organ and optic nerve. Also, there is a marked reduction of the immunohistochemistry of bcl2, caspase 3 and p53 of diabetic meibomian gland, reflecting cell death.

Conclusion: Finally the authors concluded that the cataractous lenses originated through different pathways of diabetic complication.

Introduction

The Diabetes Mellitus (DM) is characterized by hyperglycemia associated with either decreased insulin production in the body or insulin resistance. It is increased among population reached up to 382 million in 2014 [1] and by 2035 more than 592 million may develop with the disease in a ratio of 1 per 10 individual become diabetic [2]. The disease resulted from impairing of β-cell function, hyperglycaemia and impairment of insulin secretion [3].

Poor diabetic-treatment resulted in impairment of visual acuity [4] and the development of cataract in child hood [5, 6]. Cataractous lenses were also reported in diabetic experimental animal [7]. Diabetic related cataract was associated with damaging corneal endothelial cells and increase foveal thickness [8]. Also, diabetic was found to induce retinopathy [9, 10] and represent the main cause of impaired visual acuity and blindness associated with elevated serum homocysteine level Hcy [11]. Also, it is involved in reduction of both retinal thickness and retinal blood flow, and increased thickening of the retinal choriocapillaries [12]. The disease increased retinal apoptosis, overexpression of VEGF and increased oxidative stress [13, 14] and altered osmoregulation leading to acidic retina [15]. Middle-aged, obese rhesus monkeys, developed diabetes mellitus characterized by hypertension, high levels of triglycerides and serum cholesterol. The disease associated with intraretinal hemorrhages, damage choriocapillaries, increased basal laminar deposits and hard drusen of Bruch’s membrane and numerical reduction of photoreceptor inner and outer segments [16]. Diabetic retinopathy characterized by up-regulation of pro-inflammatory interleukin-6 and down-regulation of superoxide dismutase and glutathione (GSH)/oxidized glutathione associated with numerical reduction of retinal ganglion cells and increased glial fibrillary acidic protein expression level [17–18].

Concerning cornea which is the transparent organ important for vision. Diabetes caused marked degeneration of corneal secondary nerve fiber branches [19, 20] and enhanced the development of anterior segment disorders such as corneal erosion and ulcer and persistent epithelial defects [21]. There is discrepancy between authors concerning diabetic interference on corneal thickness. Meanwhile Olsen and Busted (1981) [22] reported increased corneal thickness in diabetic patients, Hashemi et al. (2019) [23] reported no variations of corneal thickness between diabetic and non diabetic individuals. Diabetic keratopathy resulted in reduction of corneal sensitivity [24].

The ocular region guards by eye lid containing glands such as the meibomian glands (MGs) which are arranged in parallel strands within the tarsal plates of the eyelids. It secrete oily meibum by meibocytes and transported through the ductal system by ductule and the central duct towards the free lid margin. The gland possesses a characteristic innervations from sympathetic and parasympathetic fibers [25, 26]. The meibum lubricating the ocular surface during blinking and protecting against tear evaporation [27].

Diabetes was found to induced meibomian gland dysfunction [28, 29] leading to depletion of the lipid secretion associated the instability of tear and development of dry eye disease [27, 30].

Little is known about the diabetes related changes on the histopathological structure of the meibomian glands. Recently, a study from Ding et al. demonstrated that insulin stimulated the proliferation of immortalized human meibomian gland epithelial cells (HMGECs), whereas high glucose was found to be toxic for HMGECs [31]. Diabetes was found to reduce the number of glandular structure impairing its functional activity [32]. Also, diabetes was found to be involved in increase of ciliary body thickness [33] and reduction of both retinal nerve fiber layer and vessel density in the optic disc [34].

The present studies searched for illustrating if the opacity associated with other complication of the eye regions or not and the characteristic features of the histopathological alterations.

Materials and Methods

1. Induction of diabetes

Experimental type 2 diabetes mellitus was induced in all the rats by a single interperitoneal injection of streptozotocin (60 mg/kg) in citrate buffer (0.05 M) (pH 4.5) and 100mg/kg ncotinamide [35]. Hyperglycemia was verified by measuring the blood glucose within 240- 280 mg/dl were selected for the study.

2. Experimental animals

Following investigating a colony of 47 individual diabetic rats (Rattusnorvegicus) after 8 months of streptozotocin-induction and weighing approximately 200–250g body weight, 6 rats exhibiting cataractous lenses either unilateral (4/6) or bilateral (2/6). Control healthy individuals (n = 6) were selected. They were housed in good ventilation on a 12-h light and dark cycle. The studied cataractous rats were observed in about 47 individual diabetic rats after 6 months of induction the disease reaching incidence of about 13%. The cataractous group was separated and a similar control non-diabetic group was also selected. Free excess water and food were allowed ad Libitum. The studied groups were sacrificed by light diethyl ether anesthesia and dissected and ocular region, upper eye lid and optic nerves were separated and processed for the following investigations.

3. Histological investigation

Retina, cornea, proximal optic nerve, ciliary organ and upper eye lid of the studied groups were separated and immediately fixed in 10% phosphate buffered formalin (pH 7.4), dehydrated in ascending grades of ethyl alcohol, cleared in xylene and mounted in molten paraplast at 58–62ºC. Five μm histological sections were stained with hematoxylin & eosin and investigated under a bright field light microscope.

4. Immunohistochemistry for caspase 3

Histological 5 μm thick sections of upper eye lid were cut and mounted onto super frost plus glass slides (Fisher Thermo Scientific, Nepean, Ontario, Canada). The tissue sections were retained at normal room temperature and processed for antigen retrieval by digestion in 0.05 % trypsin (pH 7.8) for 15 min at 37°C and incubated with antibodies against bcl2, caspase 3 and P53 (dilution 1:100 Thermo Fisher Scientific, Fremont, CA, USA; Cat. No. A1–70007) for overnight at 4°C. Then treated with a horseradish peroxidase streptavidin detection system (Dako), followed with DAB plus Chromagen to detect the immunoactivity by counterstaining with hematoxylin (Sigma). Sections incubated with 1% non-immune serum phosphate buffer solution (PBS) solution served as negative controls. Specimens were observed with a Leica BM5000 microscope (Leica Microsystems, Wetzlar, Germany) and photographed. For assessments of the percentages of positive immunoreactive areas were determined by investigating slides using Olympus® digital camera installed on Olympus® microscope with 1/2 X photo adaptor, using 40 X objective. The result images were analyzed on Intel® Core I5® based computer using Video Test Morphology® software (Russia) with a specific built-in routine for area, % area measurement and object counting.

5. Transmission electron microscopy

Specimen of proximal optic nerve close to the retina of the studied groups were immediately fixed in 0.1M cacodylate buffer (pH 7.4) containing 2.5 % glutaraldehyde) and post-fixed in 1 % osmium tetraoxide, dehydrated in ascending grades of ethyl alcohol, and embedded in epoxy–resin. Ultrathin sections were cut with a diamond knife on a LKB Ultratome IV (LKB Instruments, Bromma, Sweden) and mounted on grids, stained with uranyl acetate and lead citrate, and examined under a Joel 100CX transmission electron microscope (Musashino 3-chome, Akishima, Tokyo 196–8558, Japan).

6. Comet assay

Retina, cornea, optic nerve, ciliary organ specimens of the studied groups were homogenized in chilled homogenizer buffer, pH 7.5, containing 75 mMNaCl and 24 mM Na2 ethylenediaminetetraacetic acid (EDTA), pH 13. Six µL of the homogenate were suspended on 0.5% low melting agarose and sandwiched between a layer of 0.6% normal-melting agarose and another of 0.5% low melting agarose on fully frosted slides and kept on ice for the polymerization. The slides were the immersed in a lysis solution (1% sodium surcosinate, 2.5 M NaCl, 100 mM Na2EDTA, 10 mm Tris-HCl, 1% Triton X-100, and 10% DMSO) at 4°C. After 1 h, they were placed in electrophoresis buffer (0.3 M NaOH, 1 mM Na2EDTA, pH 13) for 10 min at 37 oC to allow DNA to unwind. Electrophoresis was carried out for 10 min at 300 mA and 1 V/cm, followed by staining with 20 mg/mL ethidium bromide. Each slide was analyzed using a Leitz Orthoplan (Wetzlar, Germany) epifluorescence microscope. One hundred cells were analyzed on each slide using the Comet assay II automatic digital analysis system. Perspective tail length (mm) is the distance of DNA migration from the center of the body of the nuclear core and is used to evaluate the extent of DNA damage. Tail length was measured automatically by image analysis software [36].

7. Statistical analysis

Data are presented as means ± standard deviation (SD). The statistical analysis was performed with multi-variant analysis of variance (MANOVA) using the SPSS (version 13) software package for Windows, comparing the multivariations between diabetes and control groups. Significance was determined at p < 0.05.

Results

1. Cornea & Retina

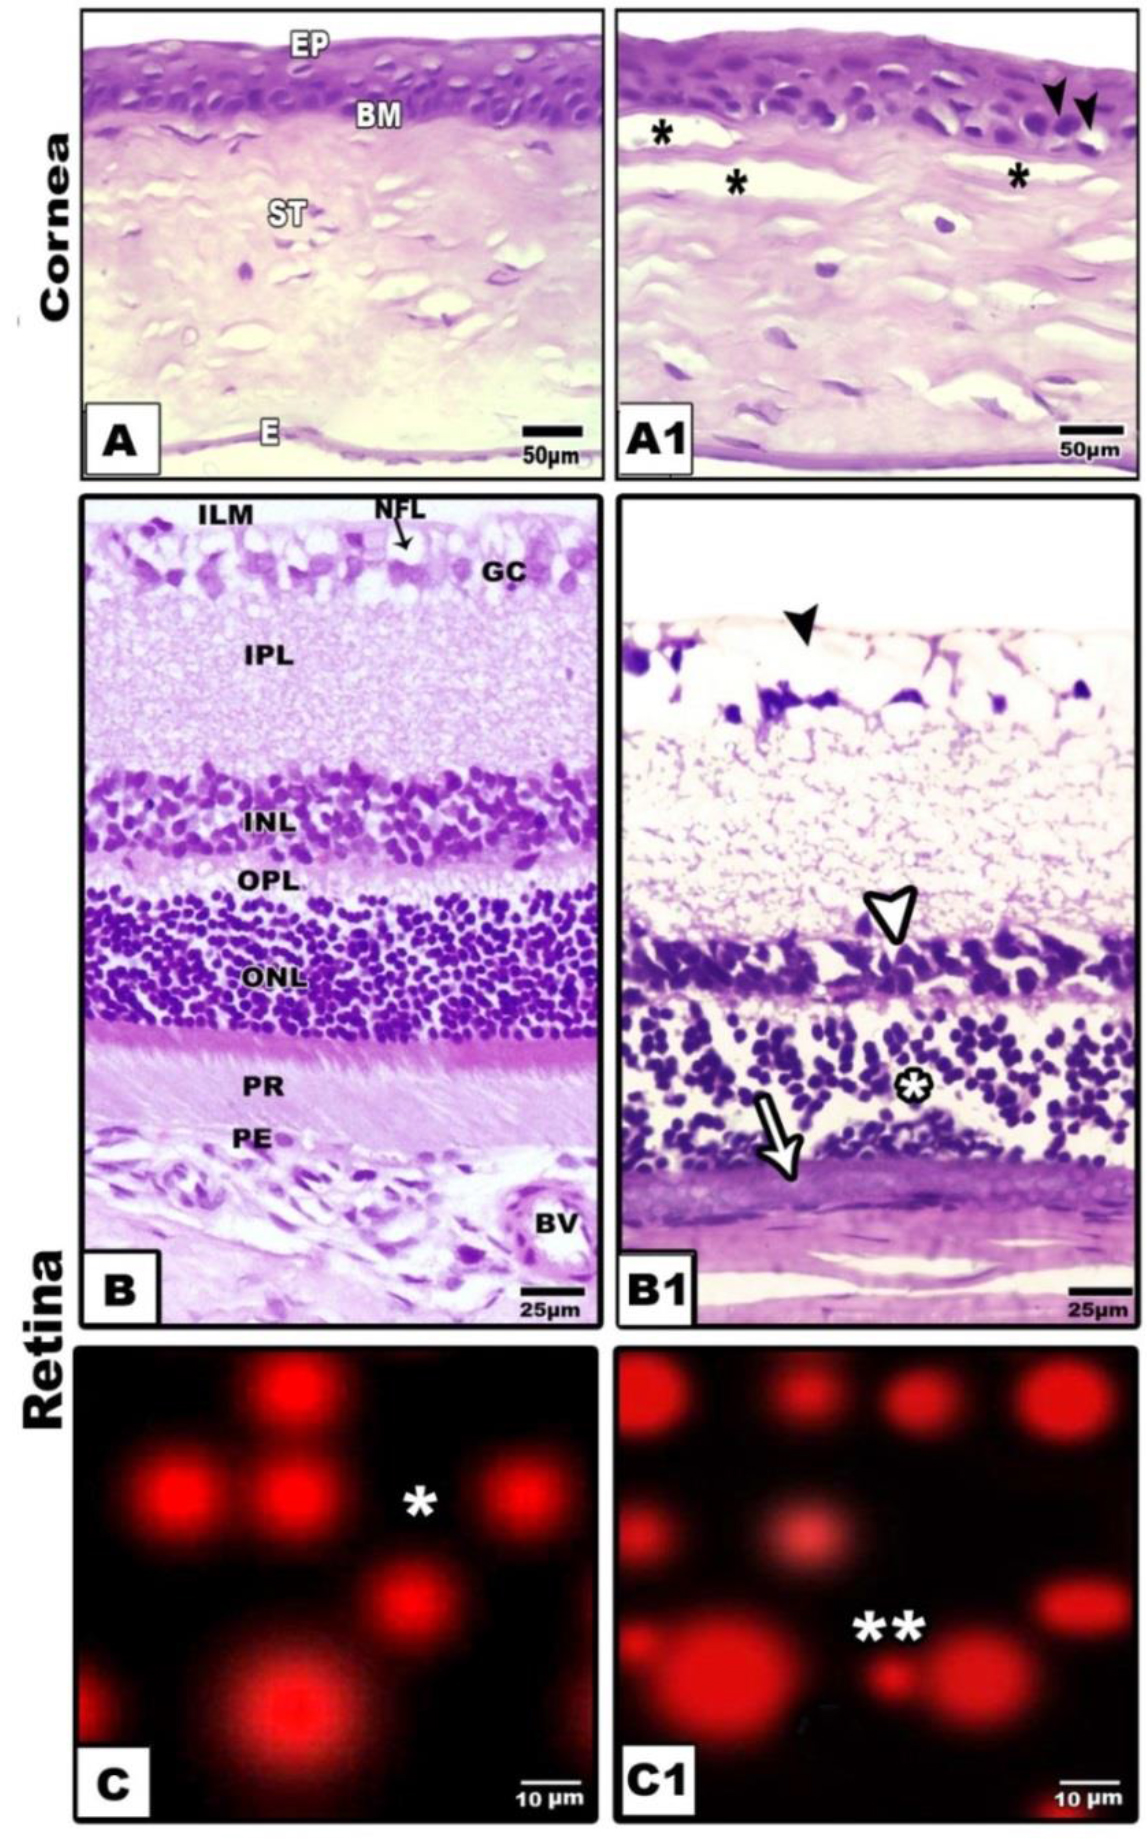
The cornea is composed of outer lining epithelium, followed by Bowman’s membrane, stroma, descemet’s membrane and corneal endothelium. Regard to the control (Fig. 1A), the diabetic group revealed that the corneal epithelium was comparatively thickened with vesicular vacuolar degenerated nuclei. The stroma showed patches of hyaline degenerated collagenous fibrils and infiltrated by necrotic regions. Vacuolated keratocytes were detected in between the collagen fibrils of the stroma. The corneal endothelium lining the descemet’s membrane attained considerable thickening (Fig. 1A1).
EDMJ 2019-115 - El-Sayyad Egypt_F1

Figure 1. Photomicrographs of cross histological sections of cornea (A&A1) and retina (B&B1). A. Control showing normal epithelium, basement membrane, stroma and endothelium. B. Diabetic showing thickened epithelium, damaged stroma and thickened endothelium. B. Control retina showing arranged ganglion, inner plexiform, inner nuclear, outer plexiform, outer nuclear and photoreceptor layers. B1. Diabetic retina showing damaged ganglion, thinning inner nuclear (arrow head), damaged outer nuclear (star) and atrophied photoreceptor(arrow) C & A1. Comet assay of control (single star)(C) and cataractous (double star) (C1) retina showing detached retinal cells of diabetic group. Abbreviations; E, endothelium;BM, basement membrane; IPL, inner plexiform layer; ILM, inner limiting membrane; INL, inner nuclear layer; NFL, nerve fiber layer; OPL, outer plexiform layer; ONL, outer nuclear layer; PR, photoreceptor; Pg, pigmented cell; St, stroma.

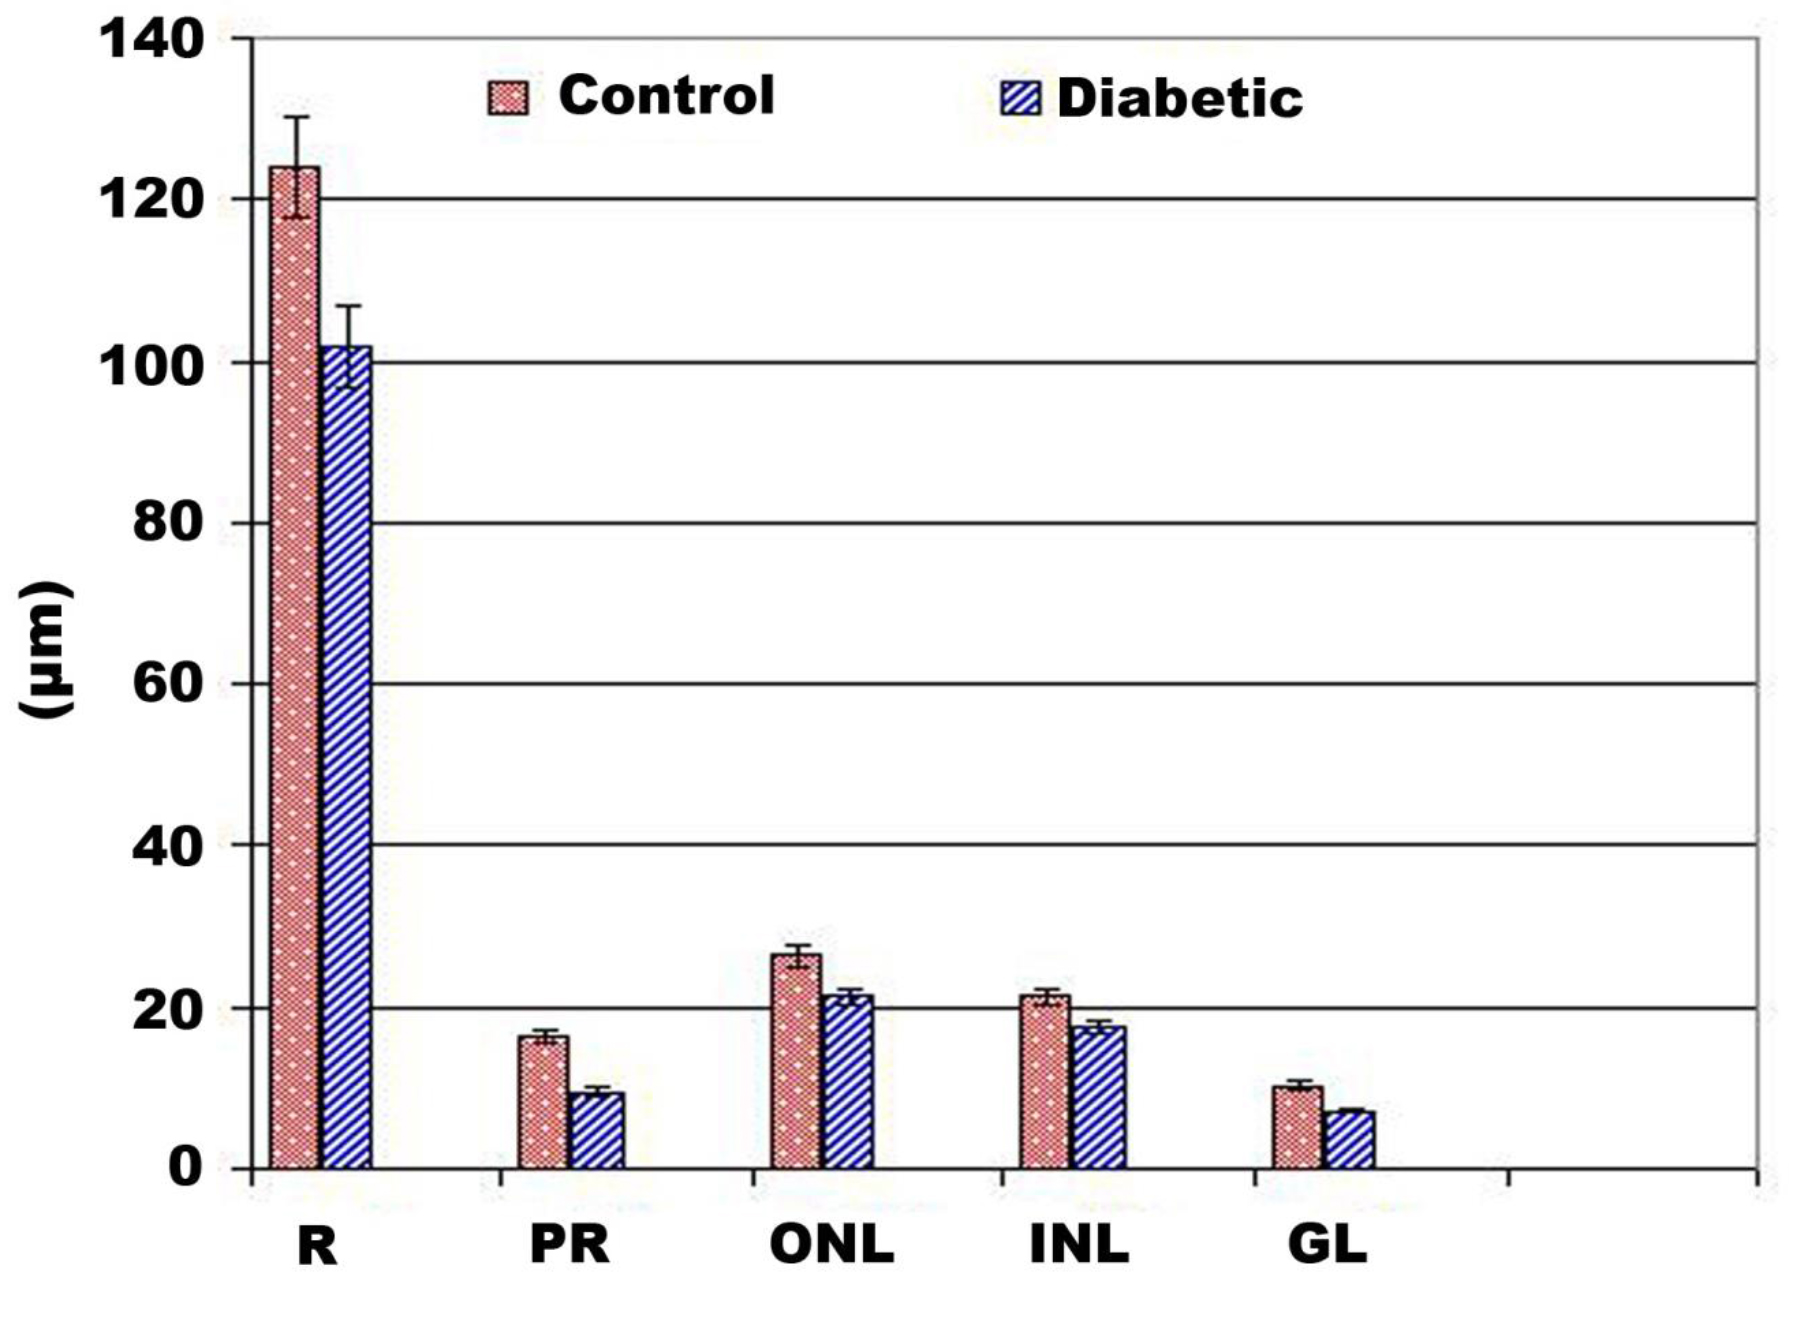
Regarding to the normal structure of the retina (Fig, 1B ), the diabetic group showed comparative reduction of the retinal thickness. There was comparative numerical reduction of the inner and outer nuclear cells. The nuclei of these cell layer were electron-dese manifesting clumping of the nuclear chromatin. The photoreceptor layer was comparatively atrophied. The ganglion cells were markedly missing and the nerve fiber become thin, fragile and vacuolated (Fig.1B1). Diabetic retina showed detached retinal cells manifesting damaged DNa (Fig. 1C1) compared to non-changed in control (Fig.1C). The whole retina, inner and outer nuclear layer and photoreceptors attained considerable reduction in diabetic group in comparison with the control (Fig. 2).
EDMJ 2019-115 - El-Sayyad Egypt_F2

Figure 2. Chart illustrated retinal layer thickness of diabetic group. Abbreviations; GL, gamglion layer; INL, inner nuclear layer; ONL, outer nuclear layer; PR, photoreceptor; R, retina. each result represent mean ±SD (n-5). Diabetic retina and photoreceptor thickness are significant in diabetic group at P < 0.05.

2. Ciliary organ and optic nerve

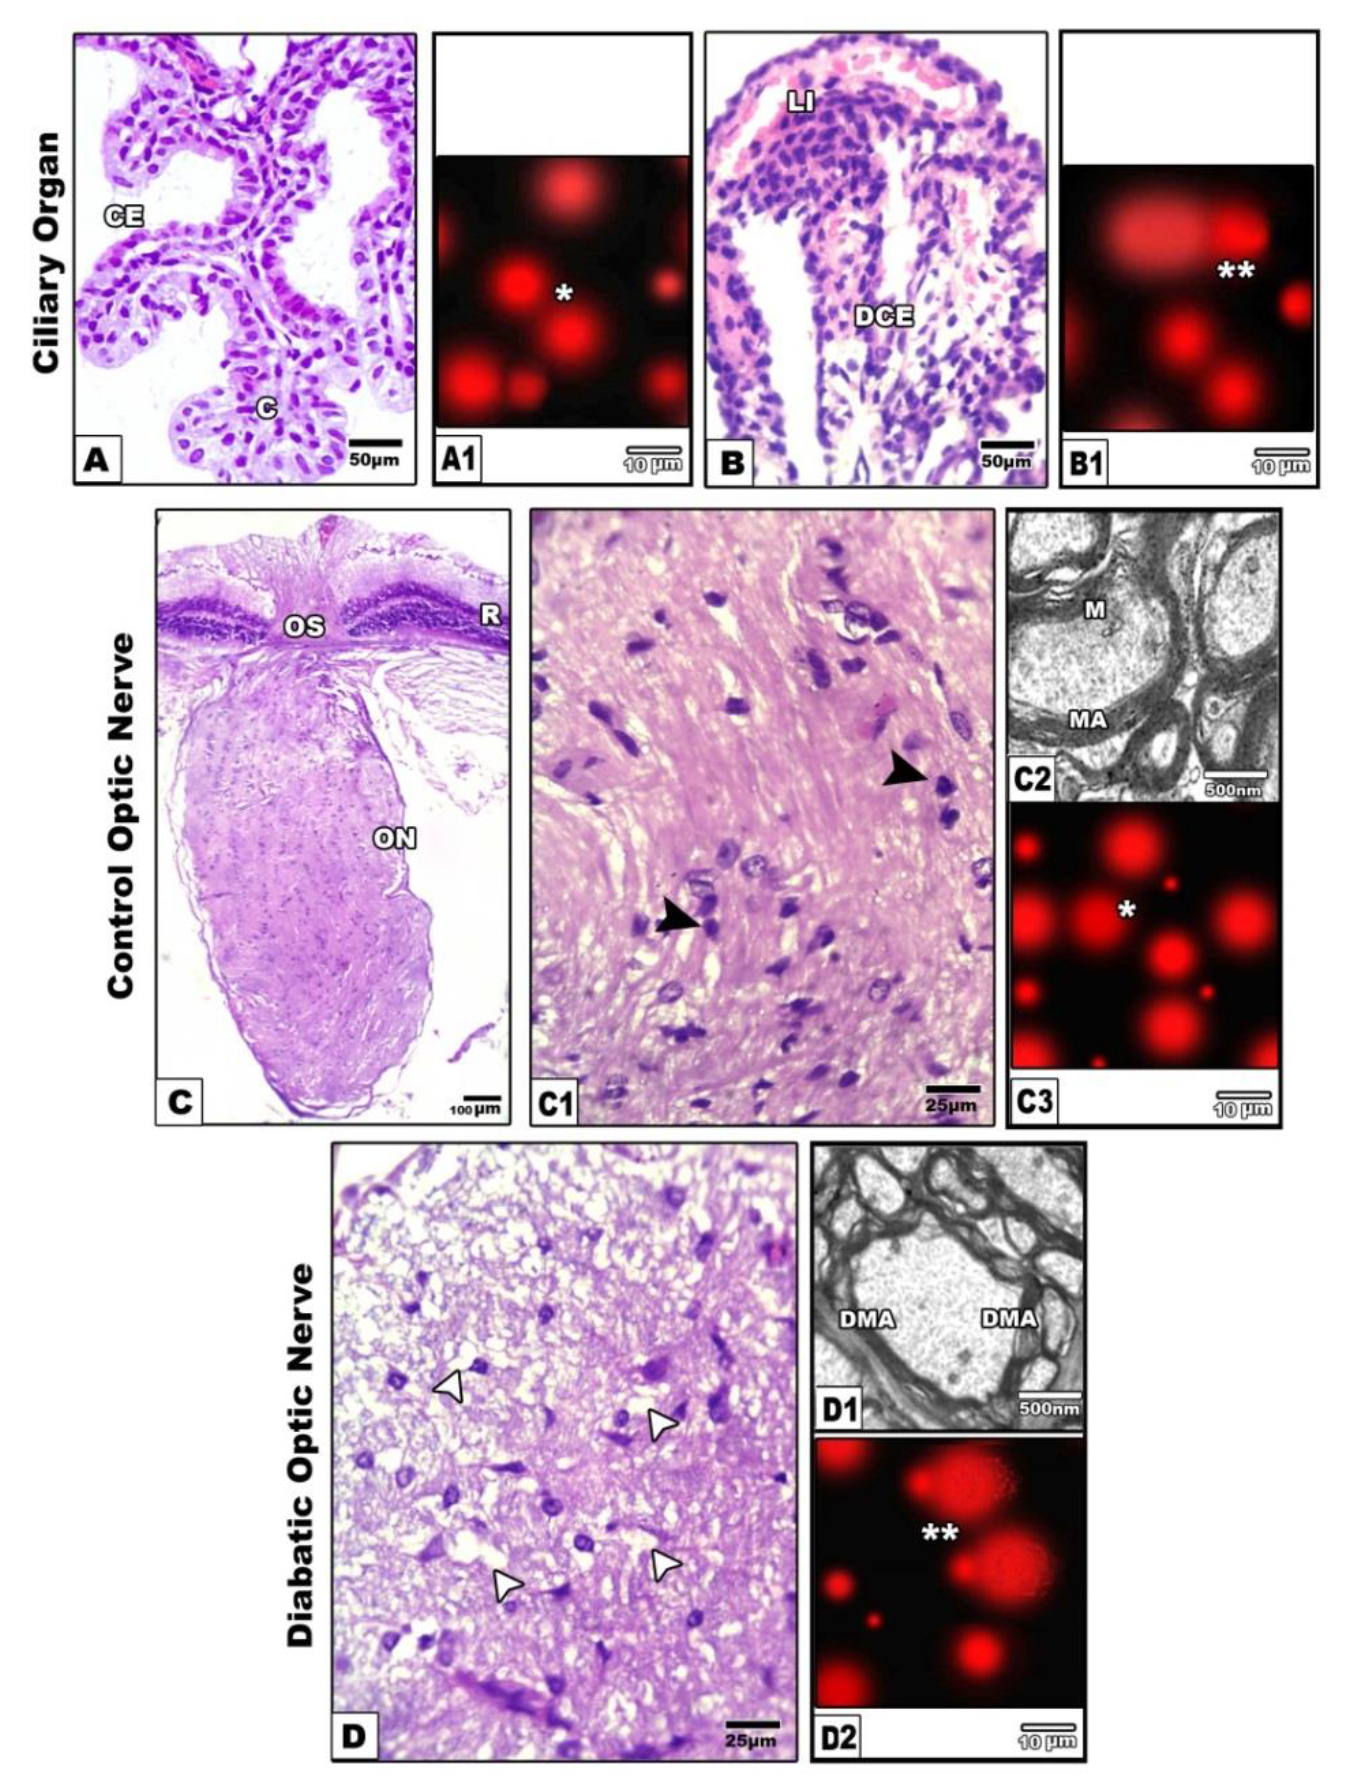
The ciliary body occupied the interface between the iris and the choroids. It is made up of two ring-shaped components: the pars plicata and the pars plana. The parsplicata detected in the anterior region of the ciliary body, at the scleral spur. The ciliary body composed of branched ciliary processes. It is lined by two layers of columnar cells. The outer one is pigmented, mean while the inner lining cells lack pigmentation. The lumen is enclosed with fine collagenous network (Fig. 3 A). Following application of comet assay the control ciliary cells are round (Fig.3A1).
EDMJ 2019-115 - El-Sayyad Egypt_F3

Figure 3A-B1. Photomicrographs of histological sections of ciliary organ. A. Control showing branched ciliary organ. A1. Comet assay of control showing normal round cells (single star). B&B1. Diabetic rat showing atrophied ciliary organ (B) with detached damaged cells post comet assay (double star) (B1).

Figure 2C-C1. Photomicrographs of histological sections of control optic nerve showing attachement with retina in optic disc and compacted axons and contents of neuronal cells(dark arrow head).C2. Transmission electron micrographs of control showing compacted myelinated axons. C3. Comet assay of control showing round cells (Single star). D-D2 Diabetic group showing fragile histological section and vacuolated neurons (white arrow head) (D) and demyelinated electron micrograph (D1) and detached neuronal cells of optic nerve after comet assay (D2). Abbreviations; C, connective tissue; CE, ciliary epithelium; DCE, damaged ciliary epithelium; DMA, degenerated mitochondrial axons.LI, lymphocytic infiltration; M, mitochondria; MA, mitochondrial axons;

Experimental diabetic group revealed missing of the ciliary processes and comparative thinning of their lining epithelium. Congestion of their blood capillaries, widened lumen and distortion of their collagenous network were observed (Fig. 3B). Following single gel electrophoresis (comet assay), revealed DNA segregation assessed by formation of detached tail region manifested DNA damage (Fig. 3B1).

Optic nerve

Concerning the optic nerve, light microscopically, these are formed of densely aggregated and enclosed in-between cells with basophilic nuclei suspected the oligodendrocytes and astrocytes (Figs. 3 C&C1). Ultrastructurally, the nerve axons are densely packed and composed of myelinated and non-myelinated axons of varying small size. The axon enclosed by several layers of myelin sheath. Abundant mitochondria are distributed the cytoplasm of the inner compartment of the axons (Fig.3 C2).

Diabetic–treatment revealed widespread of vacuoles and fragility of the nerve fibers, and comparative reduction of the oligodendrocytes. Many of them possessed vacuolated axoplasm (Fig. 3D). Ultrastructurally, vacuolation and demyelination of the theaxonal sheath were detected (Fig. 3 D1). Following application comet assay, there was apparent increase of apoptic cells with detached tail region (Fig.3D2) compared to non-changed in control (Fig.3C3).

3. Meibomian gland

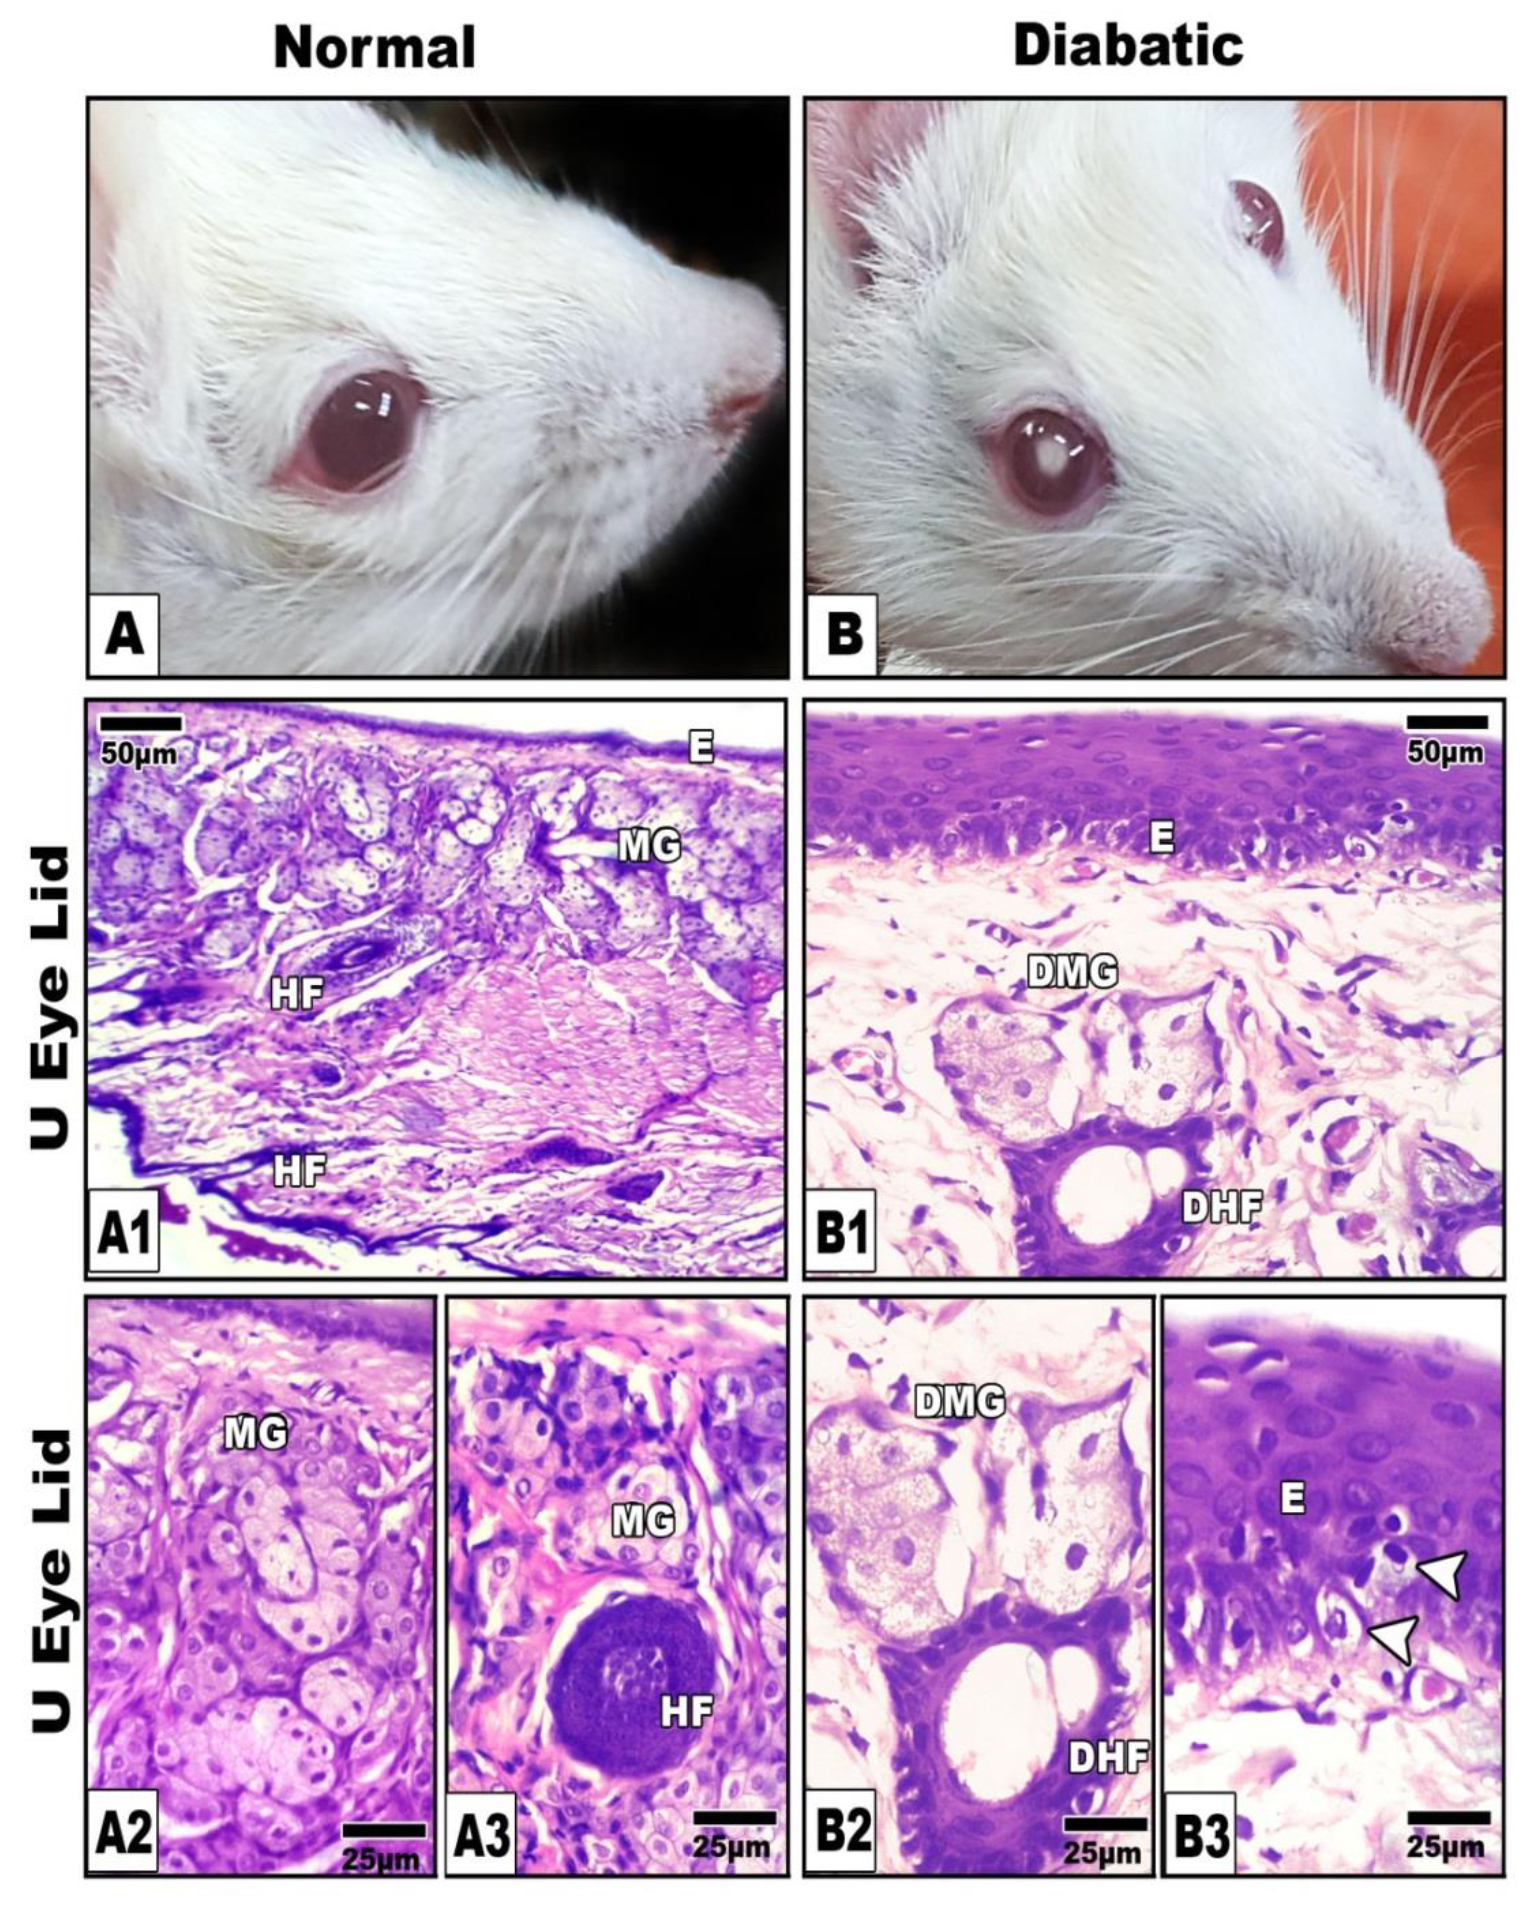
In control, the meibomian gland consisted of numerous branched acini that opened into a central duct through short ductules. Each acinus consisted of a basal layer of flattened cells. The central duct was lined by stratified squamous epithelium (Figs.4A1-A3).
EDMJ 2019-115 - El-Sayyad Egypt_F4

Figure 4. A, Photomacrograph of normal (A) and diabetic cataract (B).A1-A3. Photomicroph of histological sections of control meibomian gland showing normal branched acinar gland. B1-B3. Diabetic rat showing atrophied and degenerated meibomian gland (B1&B2) and degenerated germinativum of epidermis (B3) illustrated by arrow head. Abbreviations; DHf, degenerated hair follicle ; DMG, damaged meibomian gland; E, epidermis; HF, hair follicle ; MG, meibomian gland.HE

In diabetic group, the gland exhibiteda considerable atrophy and degeneration of the acinar cells (Figs. 4B1-B3).

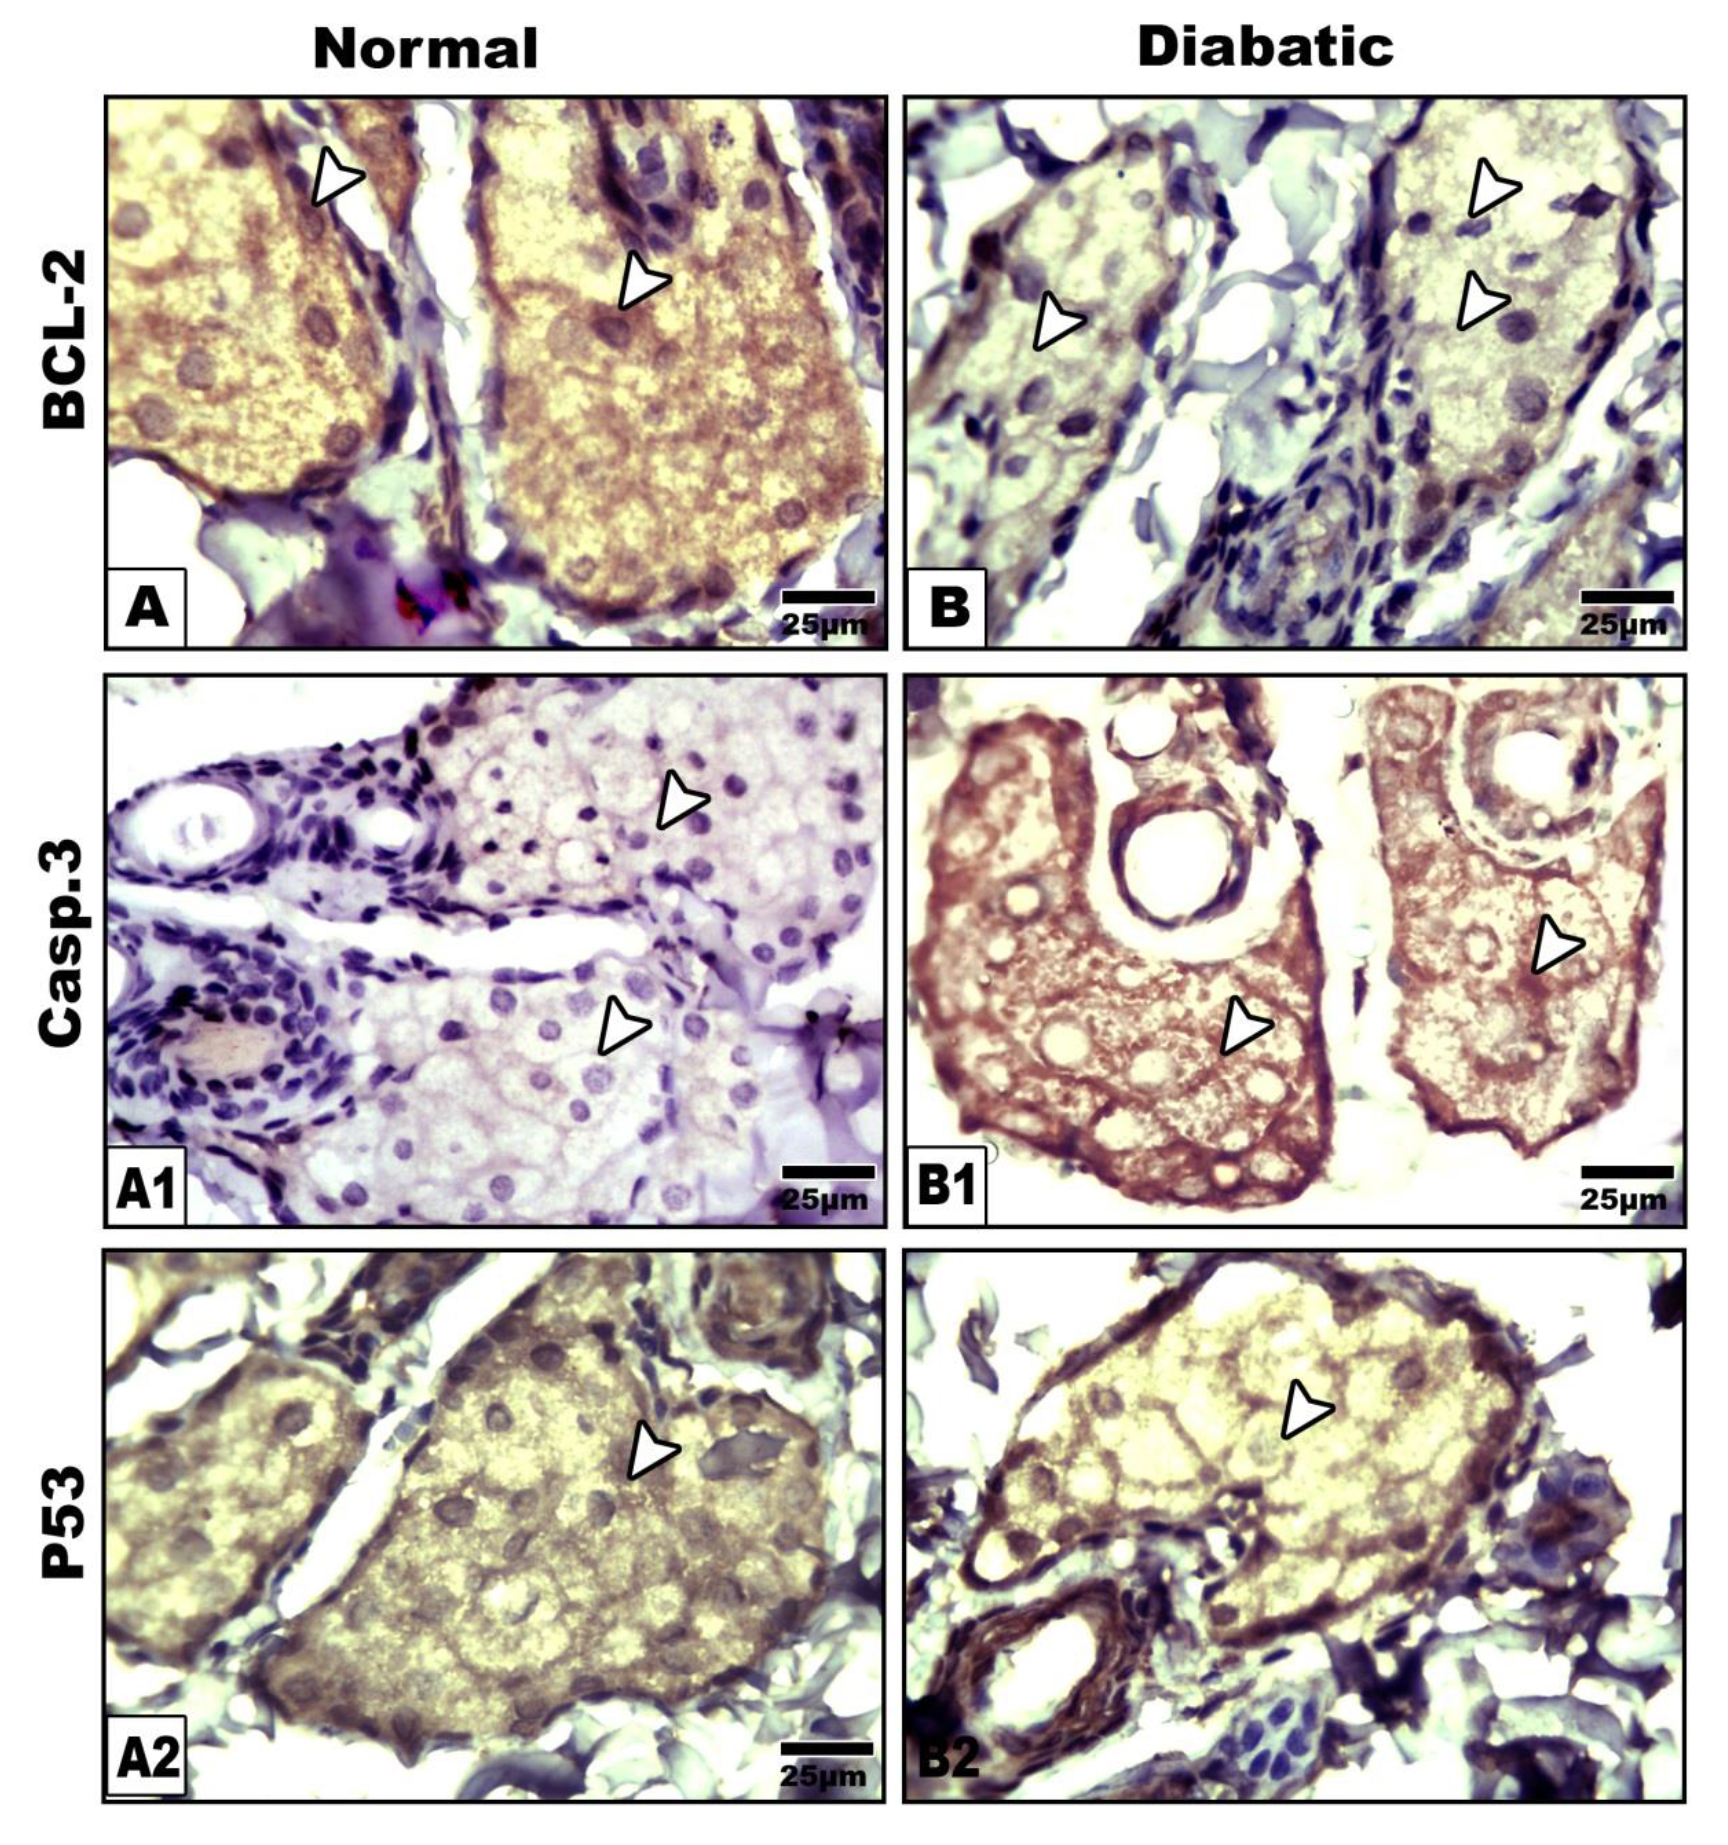
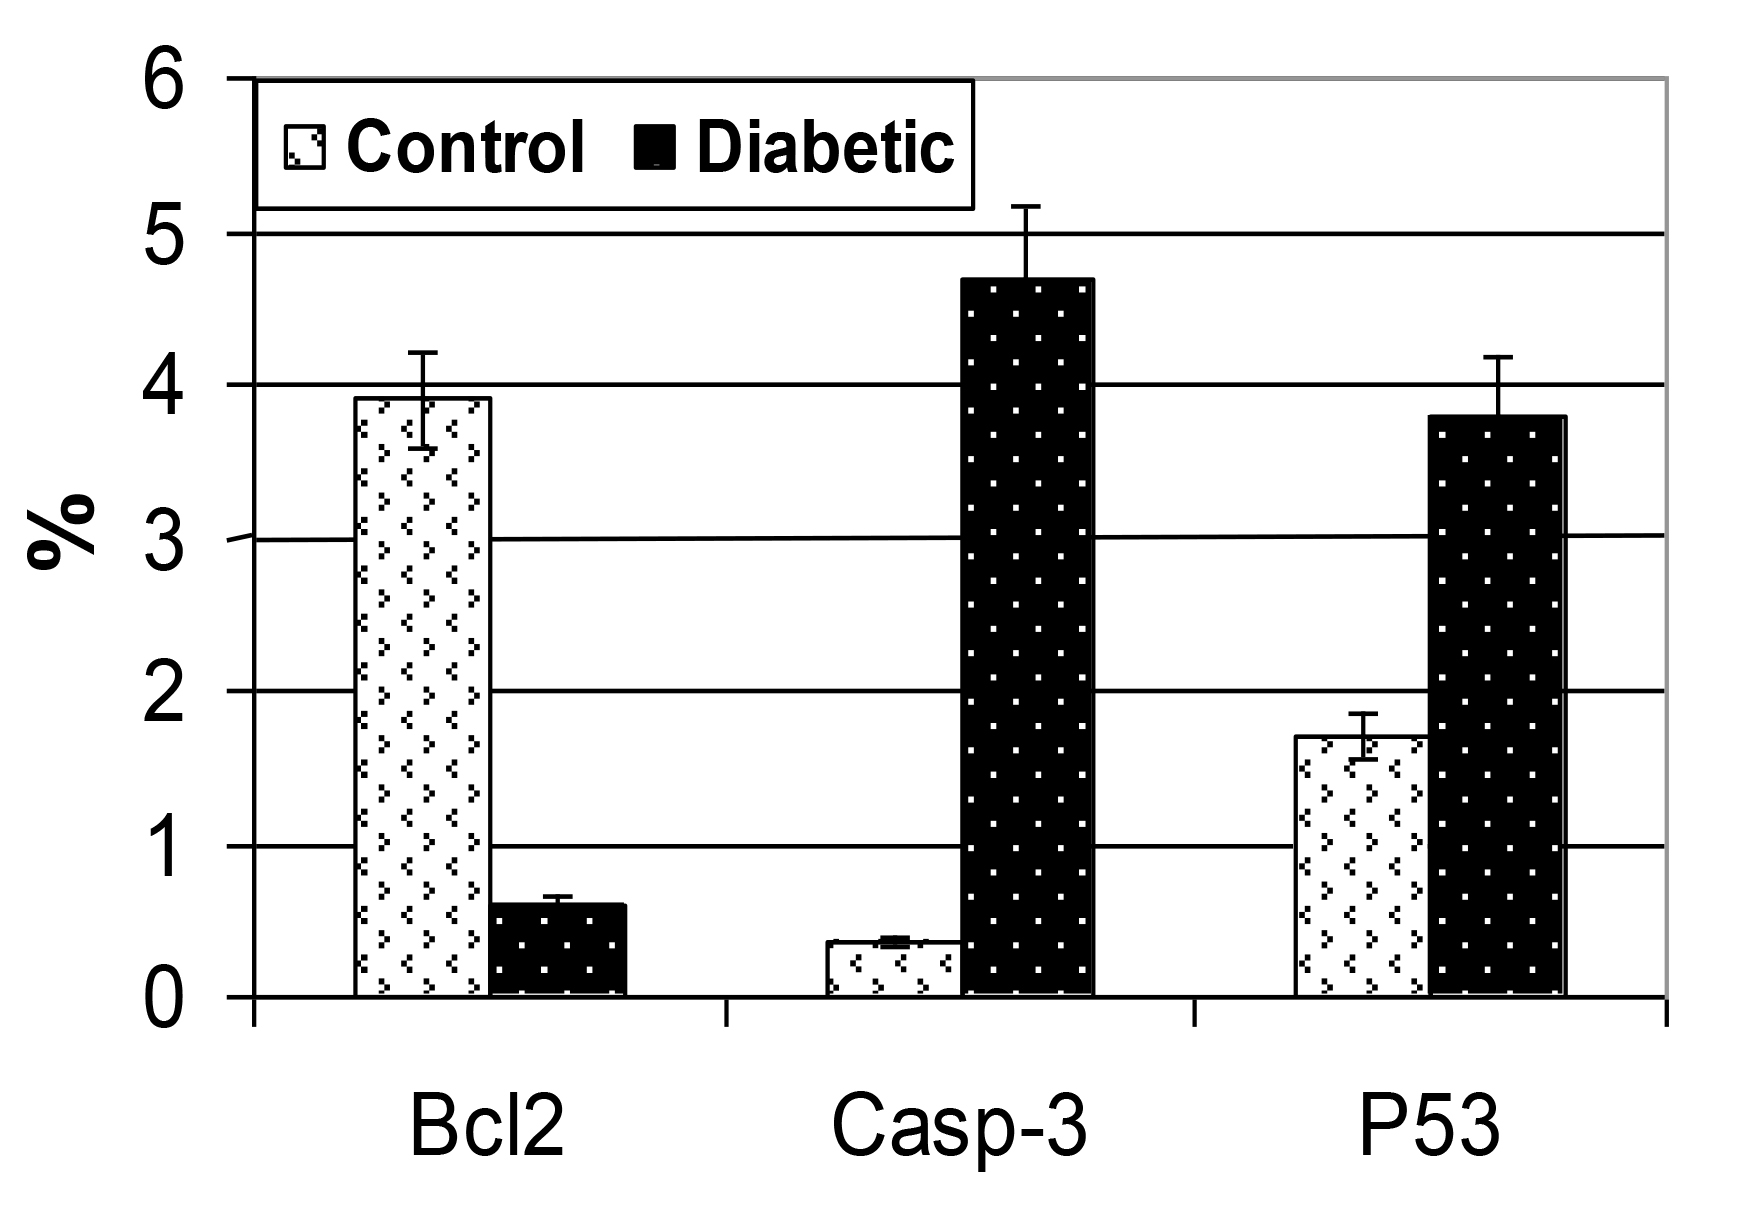
Following immunohistochemical investigations, bcl2 revealed marked depletion of the immunostaining reaction in the gland of diabetic rats compared to the increased expression in the control (Fig.5A&B). On the other hand both caspase 3 and P53 were over expressed in those of diabetic mother manifesting cell death (Figs. 5) in comparison with the control (Figs. 5A1, A2, B1 &B2). Image analysis revealed decreased bcl2 and increased both caspase 3 and p53 active area of immunohistochemical reaction those of diabetic mothers in comparison with the control (Fig.6).
EDMJ 2019-115 - El-Sayyad Egypt_F5

Figure 5. Photomicrographs of formalin fixed histological sections of meibomian glands immunohistochemical stained with Bcl2(A&B), Caspase 3 (A1 &B1) and P53 (A2 &B2). Note decreased expression of Bcl2 (B), increased expression of caspase 3( B1) and overexpression of p53 (B2) in diabetic group compared to control (A-A2). Arrow head pointed to the immunostaining activity.
EDMJ 2019-115 - El-Sayyad Egypt_F6

Figure 6. Chart illustrating of the image analysis of percentages immunoreactive area of diabetic group in comparison with the control. Each result represent the mean SD (n = 5). Diabetic is significant at P < 0.05.

Discussion

The diabetes mellitus (DM) is a public health problem widely increased among population. The present findings revealed induction of cataractous lenses of 6/47 individuals with about 13%.

The present findings agree with the work of El-Sayyad et al. [37–39], Becker et al. [5] and Wu et al. [6] in human and El-Sayyad et al. [37] and Miller and Brines [7] in experimental animals.

Development of cataractous lenses in diabetic patients was found to result from damaging of lens epithelium [37, 40] associated with releasing of free radicals and reduction of the capacity of both antioxidant enzymes and aldose reductase [39, 41] altering glucose metabolism and accumulation of sorbitol enhanced cell damage and development of cataract [39, 42, 43].

Also, diabetic cataract was found to be associated with corneal damage assessed by thickened epithelial lining layer, necrotic stromal patches and thickened endothelium.

The present findings supported the work of Olsen and Busted [22] and Hashemi et al. [23] that reported increased corneal thickness in diabetic patients. Diabetic keratopathy was also, mentioned by Bikbova et al. [24] which impaired the corneal sensitivity. Alterations of diabetic cornea may contribute to damage of the corneal nerve fibers [20, 44] and progress the development of anterior segment disorders [21] resulting in impairing the vision.

Also, the diabetic retina attained a comparatively reduced thickness; numerical reduction of inner and outer nuclear cells and atrophied photoreceptors coincides with increased detached retinal cells manifested DNA damage.

The observed diabetic retinopathy supported the work of El-Sayyad et al. [37], Kim and Yu [33], Yao et al. [12] and Li et al [10]. The authors mentioned that the retinopathy impaired the visual acuity and the development of blindness. Diabetic retinopathy related to blindness affected about 800 cases each year [45].

At the same time, the detected atrophy and damaged photoreceptors supported the work of Johnson et al. [16] and El-Sayyad et al. [37].

Diabetic retinopathy was found to exhibit over expression of inflammatory markers, down-regulation of antioxidant enzymes associated with increased retinal cell death [13, 14, 17].

The present data revealed that diabetes caused abnormal non-branched biliary processes and reduced thickness of their lining epithelium parallel with single strand DNA damage. The present findings agree with [33] following investigating diabetic patients.

Ciliary organ is important for contraction and relaxation of lens allowing it for accommodation. Damage of ciliary epithelium and defect of collagenous fibrils of the ciliary lumina interfered with retinal dystrophies [46].

The present findings revealed neuropathy of optic nerve of diabetic rat assessed by fragility and degeneration of nerve fibers, demyelinated axons and decrease of neuronal cells coincides with single strand DNA damage of astrocytes. Similar findings of optic neuropathy were detected in aging rats which exhibited similar diabetic deterioration of the neuronal cells [47].

Diabetes associated microvascular abnormalities may facilitate the progress of ischemia of the anterior optic nerve [48].

On the other hand the meibomian glands are important for ocular function through secretion of oily meibum which lubricate the ocular surfaces and protecting against tear evaporation [49].

The present findings revealed that diabetes induced atrophy and degeneration of meibomian glands. Following immunohistochemical staining, decreased expression of bcl2 and overexpression of caspase3 and p53, the markers of cell death were detected.

Similar findings of diabetes associated meibomian gland dysfunction were reported [28, 31, 32]. Decreased lipid secretion was found to be associated with the instability of tear and progress of dry eye disease [27, 30].

Finally the authors concluded that the cataractous lenses originated through different pathways of diabetic complication.

References

  1. Wild S, Roglic G, Green A, Sicree R, King H (2004) Global prevalence of diabetes: estimates for the year 2000 and projections for 2030. Diabetes Care 27: 1047–53.
  2. Aguiree F, Brown A, Cho NH, Dahlquist G, Dodd S et al. C (2013) IDF Diabetes Atlas.
  3. Al-Goblan AS, Al-Alfi MA, Khan MZ (2014) Mechanism linking diabetes mellitus and obesity. Diabetes MetabSyndrObes 7: 587–91.
  4. Kalra S,  Singh RR (2018) Visual acuity assessment in diabetes. J Pak Med Assoc 68: 1407–1409.
  5. Becker C,  Schneider C,  Aballéa S,  Bailey C,  Bourne R et al. (2018) Cataract in patients with diabetes mellitus-incidence rates in the UK and risk factors. Eye (Lond) 32: 1028–1035.
  6. Wu J,  Zeng H,  Xuan R,  Lei S,  Li J et al (2018) Bilateral cataracts as the first manifestation of type 1 diabetes mellitus: A case report. Medicine (Baltimore) 97: 12874.
  7. Miller EJ,  Brines CM (2018) Canine Diabetes Mellitus Associated Ocular Disease. Top Companion Anim Med 33: 29–34.
  8. Chen Z,  Song F,  Sun L,  Zhao C,  Gao N et al (2018) Corneal integrity and thickness of central fovea after phacoemulsification surgery in diabetic and nondiabetic cataract patients. Arch Med Sci 14: 818–825.
  9. Kim C,  Yu HG (2012) Changes in ciliary body thickness in patients with diabetic macular edema after vitrectomy. Retina 32: 1316–23.
  10. Li Z,  Alzogool M,  Xiao J,  Zhang S,  Zeng P et al. (2018) Optical coherence tomography angiography findings of neurovascular changes in type 2 diabetes mellitus patients without clinical diabetic retinopathy. ActaDiabetol 55: 1075–1082.
  11. Tawfik A,  Mohamed R,  Elsherbiny NM,  DeAngelis MM,  Bartoli M et al (2019) Homocysteine: A potential biomarker for diabetic retinopathy. J Clin Med 8: 121.
  12. Li Q, Yang Y, Lu X, Zhang Q, Luo M et al (2018) Lycium Barbarum Polysaccharides improve retinopathy in diabetic Sprague-Dawley rats. Evid Based Complement Alternat Med 2018: 7943212.
  13. Amato R, Rossino MG, Cammalleri M, Locri F, Pucci L et al (2018) Protects the retina from neurovascular damage in experimental diabetic retinopathy. Nutrients 10: 1932.
  14. Ola MS, Alhomida AS, LaNoue KF (2019) Gabapentin attenuates oxidative stress and apoptosis in the diabetic rat retina. Neurotox Res.
  15. Dmitriev AV,  Henderson D,  Linsenmeier RA (2019) Diabetes  alters pH control in rat retina. Invest Ophthalmol Vis Sci 60: 723–730.
  16. Johnson MA,  Lutty GA,  McLeod DS,  Otsuji T,  Flower RW et al (2005) Ocular structure and function in an aged monkey with spontaneous diabetes mellitus. Exp Eye Res 80: 37–42.
  17. Ren C,  Wu H, Li D,  Yang Y,  Gao Y et al. (2018) Remote Ischemic Conditioning Protects Diabetic Retinopathy in Streptozotocin-induced Diabetic Rats via Anti-Inflammation and Antioxidation. Aging Dis 9: 1122–1133.
  18. Yang F, Yu J, Ke F,  Lan M,  Li D et al (2018) Curcumin alleviates diabetic retinopathy in experimental diabetic rats. Ophthalmic Res 60: 43–54.
  19. Lagali NS, Allgeier S, Guimarães P, Badian RA, Ruggeri A et al (2017) Reduced corneal nerve fiber density in type 2 diabetes by wide-area Mosaic analysis. Invest Ophthalmol Vis Sci 58: 6318–6327.
  20. Bikbov MM,  Surkova VK (2019) Prognostic value of changes in the cornea and conjunctiva in diabetes mellitus. VestnOftalmol 135: 90–97.
  21. Han SB,  Yang HK,  Hyon JY (2018) Influence of diabetes mellitus on anterior segment of the eye. ClinInterv Aging 14: 53–63.
  22. Olsen T, Busted N (1981) Corneal thickness in eyes with diabetic and non diabetic neovascularisation. Br J Ophthalmol 65: 691–3.
  23. Hashemi H,  Asgari S,  Mehravaran S,  Emamian MH,  Fotouhi A (2019) Five-Year Changes of Anterior Corneal Indices in Diabetics versus Non-Diabetics: The Shahroud Eye Cohort Study. Curr Eye Res 44: 30–33.
  24. Bikbova G,  Oshitari T,  Baba T,  Bikbov M,  Yamamoto S (2018) Diabetic corneal neuropathy: clinical perspectives. ClinOphthalmol 12: 981–987.
  25. Knop N, Knop E (2009) Meibomian glands. Part I: anatomy, embryology and histology of the Meibomian glands. Ophthalmologe 106: 872–83.
  26. Bolekova A, Kluchova D, Tomasova L, Hvizdosova N (2012) Effect of retinoic acidon the nitrergic innervations of Meibomian glands in rats. Eur J Histochem 56: 50.
  27. Knop E, Knop N, Millar T, Obata H, Sullivan DA (2011) The international workshop on meibomian gland dysfunction: report of the subcommittee on anatomy, physiology, and pathophysiology of the meibomian gland. Invest Ophthalmol Vis Sci 52: 1938–1978.
  28. Seirafi H, Farsinejad K, Firooz A,  Davoudi SM, Robati RM et al (2009) Biophysical characteristics of skin in diabetes: a controlled study. J EurAcadDermatolVenereol 23:146–149.
  29. Shamsheer RP, Arunachalam C (2015) A Clinical Study of Meibomian Gland Dysfunction in Patients with Diabetes. Middle East Afr J Ophthalmol 22: 462–6.
  30. Baudouin C, Aragona P, Messmer EM,  Tomlinson A, Calonge M et al. (2013)  Role of hyperosmolarity in the pathogenesis and management of dry eye disease: proceedings of the OCEAN group meeting. Ocul Surf 11: 246–58.
  31. Ding J, Liu Y, Sullivan D (2015) Effects of insulin and high glucose on human meibomian gland epithelial cells. Invest Ophthalmol Vis Sci 56: 7814–7820.
  32. Lin X, Xu B, Zheng Y, Coursey TG, Zhao Y et al (2017) Meibomian Gland Dysfunction in Type 2 Diabetic Patients. J Ophthalmol 2017: 3047867.
  33. Kim C, Yu HG (2012) Changes in ciliary body thickness in patients with diabetic macular edema after vitrectomy. Retina 32: 1316–23.
  34. Cao D, Yang D, Yu H, Xie J, Zeng Y et al (2019) Optic nerve head perfusion changes preceding peripapillary retinal nerve fibre layer thinning in preclinical diabetic retinopathy. ClinExpOphthalmol 47: 219–225.
  35. Ghasemi A,  Khalifi S,  Jedi S (2014) Streptozotocin-nicotinamide-induced rat model of type 2 diabetes. ActaPhysiol Hung 101:408–20.
  36. Sasaki YF, Saga A, Akasaka M, Yoshida K, Nishidate E et al (1997) In vivo genotoxicity of ortho-phenylphenol, biphenyl, and thiabendazole detected in multiple mouse organs by the alkaline single cell gel electrophoresis assay. Mutat Res 395:189–98.
  37. El-Sayyad HIH, El-Sherbiny M, Sobh MA, Abou-El-Naga AM, Ibrahim MAN et al. (2011) Protective effects of Morus alba leaves extract on ocular functions of pups from diabetic and hypercholesterolemic mother rats. Int.JBiolSci 7: 715–728.
  38. El-Sayyad HIH, Bakr EHM, El-Ghawet HA, El-Desoky TMG (2015) Overview of congenital, senile and metabolic cataract J Ocular Biol 3: 12.
  39. El-Sayyad HI, Tag-Eldin YM, Khalifa SA, Abd- El-Wahab AA, El-Desoky TMG (2017) Biochemical and molecular markers of congenital and senile cataractous lenses. J MolBiomarkDiagn 8: 318.
  40. Tkachov SI, Lautenschlager C, Ehrich D, Struck HG (2006) Changes in the lens epithelium with respect to cataractogenesis: light microscopic and Scheimpflug densitometric analysis of the cataractous and the clear lens of diabetics and non- diabetics. Graefes Arch ClinExpOphthalmol 244: 596–602.
  41. Hashim Z, Zarina S (2012) Osmotic stress induced oxidative damage: possible mechanism of cataract formation in diabetes. J Diabetes Complications 26: 275–279.
  42. Kador PF, Lee JW, Fujisawa S, Blessing K, Lou MF (2000) Relative importance of aldose reductase versus nonenzymatic glycosylation on sugar cataract formation in diabetic rats. J OculPharmacolTher 16: 149–160.
  43. Gupta SK, Selvan VK, Agrarwal SS, Saxena R (2009) Advances in pharmacological strategies for the prevention of cataract development. Indian J Ophthalmol 57: 175–183.
  44. Lagali N, Wowra B, Dobrowolski D, Utheim TP and Fagerholm P et al (2018) Stage-related central corneal epithelial transformation in congenital aniridia-associated keratopathy. Ocul Surf 16: 163–172
  45. NegiA , Vernon SA (2003) An overview of the eye in diabetes. J Royal Soc Med 96: 266–272.
  46. May-Simera H, Nagel-Wolfrum K, Wolfrum U (2017) Cilia – The sensory antennae in the eye. ProgRetin Eye Res 60: 144–180.
  47. El-Sayyad HIH, Khalifa SA, El-Sayyad FI, Al-Gebaly AS, El-Mansy AA et al ( 2014) Aging-related changes of optic nerve of Wistar albino rats. Age (Dordr) 36: 519–32.
  48. Flammer J, Orgül S, Costa VP, Orzalesi N, Krieglstein GK et al (2002) The impact of ocular blood flow in glaucoma. Prog Ret Eye Res 21: 359–393.
  49. Knop E,  Knop N, Millar T, Obata H, Sullivan DA (2011) The international workshop on meibomian gland dysfunction: report of the subcommittee on anatomy, physiology, and pathophysiology of the meibomiangland. Invest Ophthalmol Vis Sci  52: 1938–78.
Building resilience, health, and wellness for undergraduate nursing students beyond Title IX and early alert programs

DOI: 10.31038/AWHC.2019232


Policy Brief: Building resilience, health, and wellness for undergraduate nursing students beyond Title IX and early alert programs.

Issue

Manifestations of stress have serious consequences for nursing professionals beginning with nursing students. [1, 2] One source of stress for baccalaureate nursing students is inappropriate patient sexual behavior (IPSB). [3, 4] Baccalaureate nursing programs have limited response frameworks to provide support to affected students. High levels of stress, regardless of duration or frequency, can affect learning, performance, and retention in nursing programs. [1, 3] Many stressful incidents experienced by nursing students do not meet parameters of existing student support policies, including Title IX or early alert programs since they occur in clinical sites off campus. Repetitive high-stake stressors encountered by nursing students increase risks for deleterious health outcomes. [1–4] Therefore, policy changes at university, state, and federal levels to build resilience, health, and wellness for undergraduate nursing students must be developed and implemented.

Background

Nurses face higher levels of stress with adverse health outcomes compared to other health professions. [2] Stress in nursing has been linked to reduced job satisfaction, increased illness, and poor job performance. [1–4] Furthermore, nursing students who were exposed to more adverse childhood experiences (ACE) showed higher rates of burnout and depression. [5] Developing strong foundations to manage stress early in nursing education may prepare nurses to develop better coping mechanisms, which could subsequently help them to develop healthy habits, decrease attrition rates, and reduce chances of developing stress-related illness later in life [6].

It is well documented that that nursing school can be a stressful experience and that nursing students have more intense stress levels than students studying in other health fields. [4] While there are many sources of stress, one of the more prevalent identified sources in healthcare is inappropriate patient sexual behavior. [3, 4] Johnson and colleagues define IPSB as any “verbal or physical act of an explicit, or perceived sexual nature which is unacceptable within the social context in which it is carried out.” [7]. IPSB encompasses a spectrum of behaviors including: gesturing, giving romantic gifts, making suggestive remarks, propositioning, exposing genitalia, unnecessary touching, with some of the more extreme cases resulting in sexual assault and rape. [8] It is imperative to note that when a patient’s behavior creates a hostile or intimidating work environment for any health care worker, as in its extreme manifestations, IPSB falls under the legal classification of sexual harassment, a form of sex discrimination that violates Title VII of the Civil Rights Act of 1964 [9].

The prevalence of IPSB among the nursing profession is difficult to ascertain due to a paucity of research and a presumption of underreporting. Ranges of reported IPSB in nursing range from 30–90% [10] and the majority of these reported incidents are from female nurses. [11] As nursing is a predominantly female profession, it is logical that female nursing students are a high risk for experiencing IPSB.

When IPSB is recognized as sexual harassment, it can imply patients as adversaries creating a difficult and potentially less effective care environment. Sexual harassment by patients is a significant problem for general healthcare professionals; however, nurses consistently report sexual harassment by their patients more than any other healthcare sector. [8] This is particularly poignant given that we are in the midst of several international campaigns increasing the awareness of sexual assault and harassment. Additionally, the Joint Commission has issued a Sentinel Event Alert on physical and verbal violence against healthcare workers, including sexual harassment, which calls to enforce workplace policies that keep nurses and other healthcare workers safe [12].

The emotional repercussions of sexual harassment include but are not limited to frustration, embarrassment, fear, anxiety, shame, depression, diminished self-esteem, and isolation by the victim. [13] The confusion and self-blame that often accompanies these emotions can then lead to psychological distress. For healthcare providers, inappropriate sexual behavior has been shown to impact ability to function, which can ultimately result in patient avoidance or neglect. [14] This is especially concerning in nursing given the amount of intimate care that we provide. While experienced nurses may have learned over time how to cope with toxic work environments, nursing students may lack the skills to navigate through such patient situations while simultaneously learning how to be a nurse. High levels of stress can affect learning, performance, and retention in nursing programs [1].

Nursing students must attain a unique skill set in their education to establish a foundation of resilience. They must mitigate the negative impact of stressors while managing physical and mental stressors of challenging nursing curricula. Concepts such as resilience, psychological strengthening mental wellness and academic success have been shown to have a pivotal role in the ability to cope with the challenges of nursing education. [15] Cognitive restructuring programs, problem-based learning support from family/friends/faculty, and education programs improving communication have been shown to increase resilience among nursing students [4].

Current Policies

Title IX of the Education Amendments Act of 1972 is a landmark federal law prohibiting sex discrimination in education. This law addresses sexual harassment, gender-based discrimination, and sexual violence. Title IX applies to all programs and related aspects of educational systems. In the 1990s, the U.S. Supreme Court issued three decisions interpreting Title IX to require schools to respond appropriately to reports of sexual harassment and sexual violence against students [9]. Early alert programing supports students and improves student retention in higher education. Some institutions solicit early alerts for social and emotional indicators beyond academic performance, such as drug and alcohol use, personal/family difficulties, and medical/mental health concerns. Early alert systems include any arrangement that provides feedback on a student’s situation – academic, social, or otherwise – allowing early intervention by divisions of academic or student affairs [16].

Closing The Policy Gap

Title IX and early alert systems offer organizational frameworks for identifying and managing specific types of stressors experienced by higher education students. Undergraduate nursing students are exposed to many potentially stressful situations in off-campus clinical settings, including IPSB. This type of incident does not fall within the parameters of Title IX or early alert systems, placing undergraduate nursing students in a vulnerable position that does not encourage a strong foundation of resilience, health and wellness. To address this crucial gap, a support system for undergraduate nursing students must be developed at the institutional level, the accrediting body level, both state and national levels, as well as the curriculum level. The Code Lavender model provides an established and effective framework for delivering emotional support in the clinical setting. Initially intended for patients and families, Code Lavender has evolved into an intervention when challenging situations threaten personal emotional equilibrium of healthcare staff as well. Affected individuals are assisted to meet their immediate responsibilities and process stressful situations through evidence-based relaxation and restoration interventions such as relaxation or breathing exercises, massage therapy, music, Reiki, or other kinds of soothing. [17, 18] Regardless of the specific intervention used, the message conveyed is comfort, caring, support, and restoration. [19] While this framework has been shown to be successful in clinical settings, there is no research demonstrating its effect in educational institutions and more specifically, for undergraduate nursing students. The Code Lavender framework would have the potential to lead to state boards of nursing initiatives to promote psychological first-aid support systems into the accreditation processes for baccalaureate nursing curricula.

References

  1. Puildo-Martos M, Augusto-Landa J, Lopez-Zafara E (2011) Sources of stress in nursing students: a systemic review of quantitative studies. Int Nurs Rev. 59: 15–25.
  2. Roberts RK, Grubb PL (2014) The consequences of nursing stress and need for integrated solutions. Rehabil Nurs 39: 62–69. [crossref]
  3. Wyss H, Vermeesch A (2019) Inappropriate patient sexual behavior in nursing education. ARCH Women Health Care. 2(1): 1. 2019. [crossref]
  4. Onan N, Karaca S, Barlas GU (2019) Evaluation of a stress coping course for psychological resilience among a group of university nursing students. Perspect Psychiatr Care 55: 233–238. [crossref]
  5. Thew J (2018) Bad childhood experiences increase burnout among student nurses. Health Leaders. Available: https://www.healthleadersmedia.com/nursing/bad-childhood-experiences-increase-burnout-among-student-nurses.
  6. Vermeesch A, Barber H, Howard L, Payne K, Sackash C (2016) Road less traveled: stressors and coping strategies of nursing students. Nurse Educ 41: 117. [crossref]
  7. Johnson C, Knight C, Alderman N (2006) Challenges associated with the definition and assessment of inappropriate sexual behavior amongst individuals with an acquired neurological impairment. Brain Inj 20: 687–693. [crossref]
  8. Cambier Z (2013) Preparing new clinicians to identify, understand, and address inappropriate sexual behavior in the clinical environment. Journal of physical Therapy Education 27: 7–14.
  9. The U.S. Equal Employment Opportunity Commission (2019) Sexual harassment. Available: https://www.eeoc.gov/laws/types/sexual_harassment.cfm.
  10. Bronner G, Peretz C, Ehrenfeld M (2003) Sexual harassment of nurses and nursing students. J Adv Nurs 42: 637–644. [crossref]
  11. Frellick M (2018) Harassment from patients prevalent, poll shows. Medscape Medical News Available: https://www.medscape.com/viewarticle/892006.
  12. The Joint Commission (2018) Physical and verbal violence against health care worker. Sentinel Event Alert. Pg No: 1–9.
  13. De Mayo RA (1997) Patient sexual behaviors and sexual harassment: a national survey of physical therapists. Physical Therapy 77: 739–744. [crossref]
  14. O’Sullivan V, Weerakoon P (1999) Inappropriate sexual behaviours of patients towards practicing physiotherapists: a study using qualitative methods. Physiotherapy Research International 4: 28–42. [crossref]
  15. Beauvais AM, Stewart JD, Denisco S, Beauvais JE (2013) Factors related to academic success among nursing students: a descriptive correlational research study. Nurse Educ Today 34: 918–923. [crossref]
  16. Tampke, DR (2013) Developing, implementing, and assessing an early alert system. J College Student Retention 14: 523–532.
  17. Stone RSB (2018) Code Lavender: A tool for staff support. Nursing 48: 15–17. [crossref]
  18. Manton A (2018) Emergency Nurses and Code Lavender. J Emerg Nurs 44: 321. [crossref]
  19. Davidson JE, Graham P, Montross-Thomas L, Norcross W, Zerbi G (2017) Code Lavender: Cultivating Intentional Acts of Kindness in Response to Stressful Work Situations. Explore (NY) 13: 181–185. [crossref]

Universal Design for Learning: A Framework for Education in Nursing

DOI: 10.31038/AWHC.2019231


Universal design for learning (UDL) is a framework that arose from a desire to provide greater educational opportunities for all learners. In the 1980’s, educators working with children with disabilities began utilizing new computer technologies to foster learning. Their approaches were successful in decreasing limitations created by print-based materials. The educators quickly realized that it was the curriculum, rather than the learners, that created barriers to learning. This new approach became known as universal design for learning-a way of thinking about the teaching / learning process that gives all individuals an equal opportunity to succeed [1].

Today, educators are exploring new ways to meet the needs of diverse learners, using new technologies and activities. The UDL approach offers flexibility in the ways students access material, engage with it and show what they know. Societal values and expectations are changing as well.  Our expectations for learning are rising as we find new ways to provide a relevant education for all learners.  Educators are becoming more savvy at presenting information directed to a variety of senses (auditory, visual, kinesthetic), assessing and meeting the motivational needs of learners, and utilizing social interaction and teamwork to maximize learning.  New approaches for designing learning environments are supporting high expectations for a wide variety of individuals. These innovations are directed at change in the curriculum and not the learner.

Using new approaches, educators recognize the need to make education more responsive to learner differences [1].  The education community realizes that many individuals, and not just those with disabilities, face barriers and impediments that interfere with learning. Likewise, the learning environment and the learner’s self-awareness play a huge role in whether a given condition is disabling or not. UDL principles are being applied in K-12 and higher education, and are equally relevant to patient and staff education within healthcare organizations. Following principles of UDL, educators begin with high standards for all learners and use a variety of activities to help each learner find appropriate challenges and supports for learning.

The three core principles of the UDL framework outlined by Meyer et al. [1] are as follows:

  • Multiple means of engagement
  • Multiple means of representation
  • Multiple means of action and expression

Engagement

Providing multiple means of engagement composes the “why” of learning.  Engagement means helping learners develop interest and motivation. The ability to self-regulate their own learning (maintaining control) is key.  Successful learners set their own objectives and work toward meeting those goals. Learners maintain a balance between personal motivation and the demands of others. This balance is monitored by learners, so that they can adjust their behaviors and strategies as needed.  The teacher’s role in this phase of the learning process is to stimulate interest and motivation for learning [1].

Representation

Providing multiple means of representation refers to the “what” of learning.  According to Meyer et al. [1] the teacher’s role is to present content and information in different ways to accommodate a variety of learning styles and preferences. Learners show variability in how they perceive information in the environment, understand and integrate new information, and develop skills to assimilate and remember information. The medium itself may be a barrier; for example a blind person requires audio information. When content is represented through two or more mediums, such as text, images, video, or audio, more learners can benefit.

Action and Expression

Providing multiple means of action and expression focuses on the “how” of learning.  Methods by which learners express what they have learned varies in different levels of learners.  Novice learners model demonstration by the teacher, with support to implement new skills.  As learners gain experience, they become more independent in setting goals and monitoring their performance.  The more difficult the task, the more learners must interact with others, to learn standards and receive feedback.  Ultimately, the teacher’s role is to create learning activities and define appropriate ways that students can demonstrate new skills and knowledge [1].

Most references that focus on UDL as a learning framework come from academic or formal education settings [1]. Examples are more easily transferred to these educational settings, e.g. teaching students in a school of nursing or providing staff education in a healthcare agency. More exploration is needed regarding how UDL principles can be applied to individual patient/family education provided by nursing staff. Nurses as patient educators have too long relied on print media to share information with patients and families. While many hospital and outpatient systems have developed video libraries for patient education, these resources are developed for groups, or “the average patient.” Nurse educators need to explore how to individualize the teaching plan for each individual patient, drawing upon group resources. Nurses can better engage patients by making use of “teachable moments” when patients or family members are more open to health promotion information, improving skills, or learning about a physiological process.

While academic and staff educators deal with curriculum and teach groups of students, individual nurses often teach patients one-on-one. In all these educator roles, nurses can learn more about how and when to engage learners in a targeted exchange of information. By using multiple means of representation, i.e. a variety of teaching resources that address different learning styles, their message is more likely to reach diverse learners. Likewise, they need to be open to multiple means of expression, encouraging each learner to become more self-directed and more proficient at self-care. By encouraging learners to act in ways that fit their lifestyle, expressions of learning will be more effective and empowering. For additional information on UDL, go to www.CAST.org.

Reference

  1. Meyer A, Rose D, Gordon D (2014) Universal design for learning: Theory and practice. Wakefield, MA: CAST Professional Publishing.

5-year Results of Neoss Dental Implants Restored at Implant-Level. A Retrospective Follow-Up Study

DOI: 10.31038/JDMR.2019222

Abstract

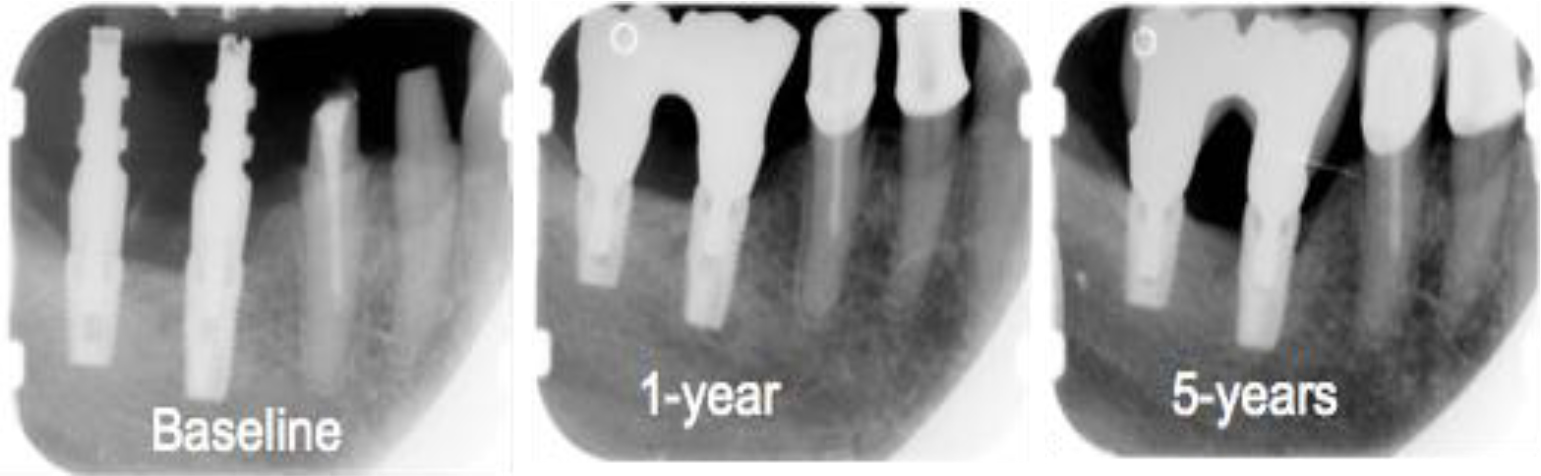
One way of reducing the cost for screw-retained implant-supported dental prosthesis is to avoid the use of prosthetic abutments. However, concerns have been raised that this might lead to complications such as extensive marginal bone loss resorption and implant loss. The aim of the study was to retrospectively evaluate a cohort of consecutive patients treated with implant-level prosthetic constructions after 5 years in function. A total of 49 consecutive patients previously treated with 102 hydrophilic dental implants (Neoss Proactive, Neoss Ltd, Harrogate, UK) in two private dental clinics were included in the study. Fifty-four implants were installed in maxillae and 48 in mandibles to replace single teeth (n = 21), to support partial bridges (n = 26), total maxillary bridges (n = 2), or mandibular overdentures (n = 2). The majority of patients (n = 37) had implants placed in healed sites without any adjunctive procedures. In 12 patients, implants were immediately placed in extraction sockets or in conjunction with maxillary sinus floor augmentation. A submerged healing period of 3 to 4 months was used before healing abutments were connected to the implants. Impressions were taken after 7 to 10 days. Baseline (abutment connection surgery), 1- and 5-year intraoral radiographs were used to measure marginal bone levels and calculate bone loss. Two mandibular implants were lost (2%) during the 5 years in function. The average marginal bone loss amounted to 0.7 ± 0.7 mm after 1 year and 0.9 ± 1.1 mm after 5 years. There was no correlation between insertion depth and bone loss. It is concluded that the use of screw-retained implant-level prosthetic constructions resulted in high implant survival rate and minimal marginal bone loss after 5 years in function.

Keywords

Dental Implants, Follow-Up Study, Implant-Level, Marginal Bone Resorption, Screw-Retained Prosthesis

Introduction

Dental implants is a first choice treatment modality for replacement of missing teeth and an integrated part of treatment planning and also executed in many modern dental clinics. The patients expect a rapid and affordable treatment with a long-lasting result with few complications during clinical function. One way of reducing costs for the patient is to avoid the use of costly prosthetic abutments and hence attaching the screw-retained prosthetic construction directly to the implant [1]. However, authors have argued that more complications may be seen without the use of prosthetic abutments. For instance, experimental studies have demonstrated that the presence of a micro-gap near the marginal bone may result in bone resorption due to violation of the “biological width” [2]. Moreover, repeated detachment of healing abutments, i.e. repeated insults to the “biological width”, resulted in marginal bone resorption in another animal study [3]. Some authors have suggested that implant-level prosthetic constructions are predisposed to inaccuracy and misfit, which could result in unfavourable stresses and strains leading to screw fracture, framework fracture, implant fracture, marginal bone loss, and even implant loss [4]. Indeed, clinical studies have shown less marginal bone resorption at implants with than without prosthetic abutments [4, 5]. For instance, Toia et al demonstrated significantly less marginal bone loss at implants with (0.005 mm) than without (0.086 mm) abutments after one year of function. However, as the difference was less than one tenth of a millimetre. It can be argued that the difference in that study was not clinically relevant. Other studies have shown good clinical outcomes and few complications with implant-level restored implants [6].

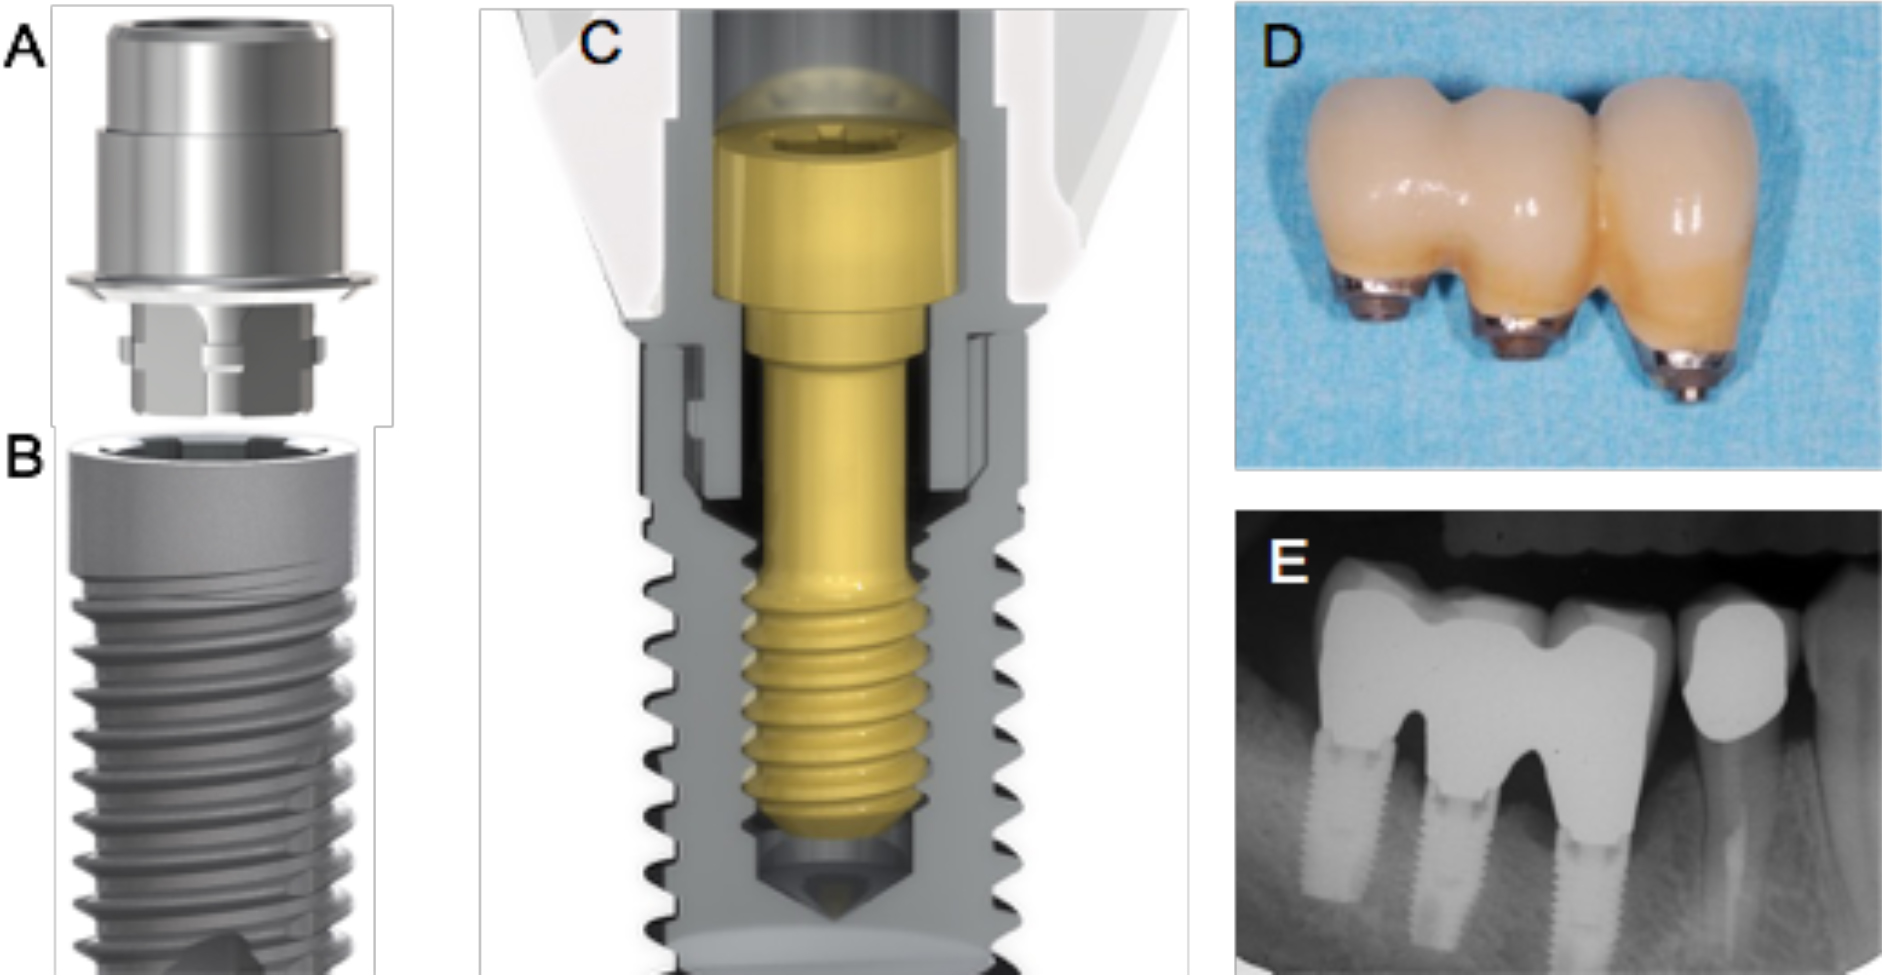
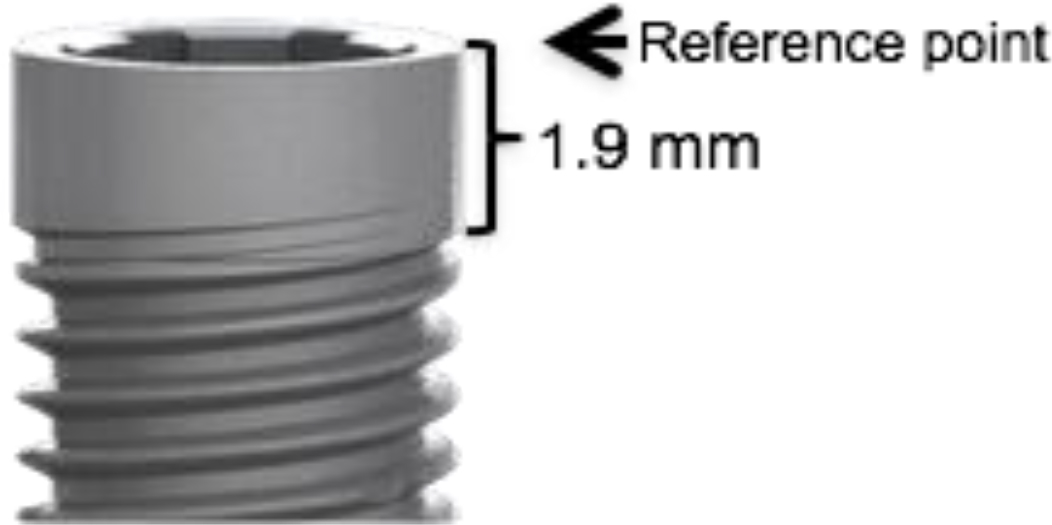
The Neoss implant system was introduced without the use of prosthetic abutments. The implant has a 1.9 mm high collar, which can be fully submerged or left above the bone level. Impressions are taken at implant level and healing abutments used between appointments. The final construction is screw-retained directly to the implant(s) through a flat-to-flat connection using a torque of 30 Ncm with no other attempts to seal the micro-gap. Thus, depending on the level of submerging the prosthesis/implant gap is theoretically violating the biological width, which according to the theories described above may result in marginal bone loss. Previous studies on this implant design with a smooth surface topography (Bimodal) have shown minimal bone resorption after 1 to 5 years of follow-up [7, 8]. Since 2009 the Neoss implant has a hydrophilic surface produced by blasting and acid-etching. Short-term studies have demonstrated small changes of the marginal bone levels during the first year in function [9, 10]. However, no long-term studies have yet been performed.

The aim of the investigation was to study the 5-year implant survival and changes of marginal bone levels in a group of consecutive patients treated with hydrophilic implants and implant level screw-retained fixed constructions.

Materials and Methods

A total of 49 consecutive patients previously treated with 102 hydrophilic dental implants (Neoss Proactive, Neoss Ltd, Harrogate, UK) in two private dental clinics were retrospectively evaluated with regard to survival rate and marginal bone loss after five years of loading (Table 1). The surgical and prosthetic procedures and one-year outcomes of the same patient group have been presented in detail in a previous publication [9]. All patients had been thoroughly informed and gave their written consent to the proposed therapy and follow-up routines including annual check-ups. No extra measures were taken for the purpose of the study. For quality assurance purposes, all implant treatments in the clinics are routinely documented using a computerized system (MS Excel, MicroSoft, Redmond, USA) from which the data used in the study could be extracted. The study followed the directives given by the Ethical Committee at the Feltre Hospital, Feltre, Italy and in accordance with the World Medical Association Declaration of Helsinki.

Table 1. Type and number of implants used in the study. Failed implants within parentheses.

Implant diameter

Implant length

Total

7 mm

9 mm

11 mm

13 mm

15 mm

3.5 mm

1

1(1)

1

3

4.0 mm

14

29

23

7

73

4.5 mm

1

4

6

2

13

5.0 mm

7(1)

6

13

Total

1

21

42

25

7

102

Fifty-four of the 102 implants were installed in maxillae and 48 in mandibles to replace single teeth (n = 21), to support partial bridges (n = 26), total maxillary bridges (n = 2), or mandibular overdentures (n = 2) (Table 2).

Table 2. Type of prosthetic constructions.

Mandible

Maxilla

Single tooth replacement

12

9

Fixed partial prosthesis

12

14

Fixed total prosthesis

2

Overdenture

2

The majority of patients (n = 37) had implants placed in healed sites without any adjunctive procedures. In 12 patients, implants were immediately placed in extraction sockets or in conjunction with maxillary sinus floor augmentation. A submerged healing period of 3 to 4 months was used before healing abutments were connected to the implants. Impressions were taken after 7 to 10 days. All prosthetic constructions were screw-retained on implant level without the use of abutments (Figure 1).

JDMR-19-118- Lars Sennerby_ Sweden_F1

Figure 1. Showing the prosthetic connection of the Neoss implant system. A. The NeoLink component. B. Implant C. Crossection through a single crown, NeoLink with prosthetic goldscrew and implant. D. Clinical and E. radiographic view of an implant-level three-unit bridge.

Baseline (abutment connection surgery), 1- and 5-year intraoral radiographs were used to measure marginal bone levels and calculate bone loss. Only implants with measurements from all three time points were used for calculations. The upper corner of the coronal shoulder of the implant was used as reference point, and measurements from the reference point to the first bone contact at the mesial and distal aspects of the implant were performed using a PC and specially designed software (Image-J, National Institutes of Health, Bethesda, MD, USA) (Figure 2). A mean value was calculated for each implant and time point.

JDMR-19-118- Lars Sennerby_ Sweden_F2

Figure 2. Radiographs of the same case at baseline and after 1 and 5 years of follow-up. The mesial implant shows some bone loss, while the distal implant show no bone loss.

The Spearman correlation test was used to evaluate a possible correlation between depth of implant placement and marginal bone loss after 5 years. A significance level p<0.05 was used for the test.

Results

Two implants were lost, giving a cumulative survival rate (CSR) of 98.0% after 5 years. Both failures occurred in the posterior mandible and all maxillary implants were successful (Table 1). One implant (3.5/11 mm), which had been accidentally placed close to a neighbouring root, was removed after 3 months of loading. The patient could maintain the partial bridge on two implants and a new implant was inserted after healing and eventually connected to a new bridge. The second failed implant (5/9 mm) was removed during the fifth year due to marginal bone loss, suppuration and discomfort.

The radiographs from a total of 79 implants (77.5% of all implants) could be measured at baseline, after one and five years (Figure 3). The marginal bone levels were situated 0.3 ± 0.4 mm, 1.0 ± 0.6 mm and 1.2 ± 1.0 mm below the implant shoulder at baseline and after 1 and 5 years, respectively (Table 3). The average marginal bone loss amounted to 0.7 ± 0.7 mm with 3.8% of the implants showing more than 2 mm and no implant more than 3 mm bone loss after 1 year (Table 3). After 5 years, the average bone loss was 0.9 ± 1.1 mm with 3.8 % of implants showing more than 2 mm bone loss and 3.8% more than 3 mm bone loss (Table 3). The majority of implants showed bone level gain (34.2%) or no and up to 1 mm of bone loss (55.7) from the 1st to the 5th year (Table 3). There was no correlation between insertion depth and bone loss.

JDMR-19-118- Lars Sennerby_ Sweden_F3

Figure 3. Schematic showing the reference point for bone level measurements. The collar of the implant is 1.9 mm.

Table 3. Marginal bone level and bone resorption based on 79 implants with readable radiographs from all three time points.

Baseline
mm±SD

1 year
mm±SD

5 years
mm±SD

Bone level

0.3 ± 0.4

1.0 ± 0.6

1.2 ± 1.0

Bone loss

0.7 ± 0.7

0.9 ± 1.1

Frequency of bone loss

n (%)

n (%)

< 0 mm

8 (10.1)

11(13.9)

0–1 mm

49 (62.0)

41 (51.9)

1.1–2 mm

19 (24.1)

21 (26.6)

2.1–3 mm

3 (3.8)

3 (3.8)

> 3 mm

0

3 (3.8)

Discussion

The present study group was evaluated after one year and the results presented in a previous publication, where one implant failure was reported9. The present follow-up showed one additional implant failure giving a total implant survival rate of 98.0 % after five years of function. This is in line with the outcomes from 5-year follow-up studies of the same and other modern dental implant systems [8, 11–13].

Only one of the failures was related to the performance of the implant as the first failure was due to a surgical mistake. The second implant was removed due to extensive marginal bone loss, suppuration and discomfort. The infection occurred during the 5th year of function after a continuous slow and asymptomatic bone loss from implant placement. This implies that the reason for bone loss was other than infection, which likely was a secondary phenomenon. This is in accordance with another publication in where causes for marginal bone resorption were discussed [14]. Other authors have argued that bone loss at implants is biofilm-mediated and advocate the use of periodontal indices to diagnose mucositis and peri-implantitis in analogy with gingivitis and periodontitis at teeth [15]. However, a recent review could not find any evidences that probing is an effective means of diagnosing peri-implant disease or predicting implant failure [16]. In contrast, the authors expressed concerns that the use of probing could lead to over-diagnosis of disease and unnecessary treatment of healthy implants. Nevertheless, also when applying liberal definitions of peri-implant infection [17] the condition requiring removal of the implant in the study can be judged as “peri-implantitis”. Hence, peri-implantitis was seen in 1% of the implants of the present study. Based on a previous literature search, the frequency of implants with reported peri-implant infection and significant bone loss leading to implant removal or other surgical intervention was on average 2.7% after 7 to 16 years [18].

Only implants with radiographs available from all observation time points were evaluated with regard to marginal bone levels in the present study. The present authors believe this results in more accurate data than using mean values from all available radiographs from the different time points. Some marginal bone remodelling was observed during the first year of function followed by a minor further change up to the fifth year check-up, which is in line with many other studies [12, 19]. The average marginal bone loss amounted to 0.7 ± 0.7 mm after 1 year and 0.9 ± 1.1 mm after 5 years. The majority of implants showed bone level gain (34.2%) or no and up to 1 mm of bone loss (55.7) from the 1st to the 5th year.

Our study showed less bone loss than in a previous study, where Brånemark implants with and without prosthetic abutments were evaluated after 5 years [20]. In their comparative investigation, the least amount of bone loss was found at implants with a machined-surfaced abutment after 5 years. The bone loss amounted to 1.6 mm compared to 0.9 mm in our study in spite of using implant-level prosthetic constructions. However, it should be pointed out that our baseline radiographs where taken at abutment or prosthesis connection and that implant surgery was used as baseline in the Göthberg et al study [20]. Therefore, any bone loss occurring from surgery to our baseline was not accounted for. However, the mean marginal bone level was still located more coronal in our study after 5 years, i.e. 1.2 mm vs 1.6 mm. An average of 0.2 mm of marginal bone was lost from the 1st to the 5th year in the present study, while about 0.6 mm was lost when pooling all implants in the Göthberg et al study [20]. Interestingly, the least bone loss from the one to the five-year follow-up was seen for implants restored at implant level in that study, indicating that most of the changes occurred during the first year in function [20]. In a comparative study using AstraTech implants, the bone loss at implants with or without prosthetic abutments was less than 0.1 mm after one year [4]. However, since there was a statistically significant difference in favour of the use of abutments together with less bleeding on probing, the authors argued that it is safer to use abutments rather than restoring the implants at implant level. However, in light of the discussion above neither initial bone loss nor the presence of bleeding on probing seems to reflect or predict clinically relevant problems and, according to the present authors, the use of prosthetic abutments cannot be justified. Moreover, a 5-year clinical follow-up study reported few complications of implant-level restorations [6], which corroborates with our findings.

Continuous marginal bone loss and related long-term complications is an obvious threat to the longevity of an implant and is the main reason why many historical implant designs are not used any longer [21, 22]. It is well known that also different modern implant designs show different amounts of marginal bone remodelling during the first year in function but that small differences are observed from the 1st year and onwards [19]. In a meta-analysis where Straumann, Brånemark and AstraTech implants were analysed based on published 5-year follow-up studies, all three designs seemed to result in excellent long-term outcomes in spite of measureable differences of initial marginal bone loss [12]. Hence, steady marginal bone levels after the first year seems more important than the amount of bone that is lost during the first year. So if the goal is to minimize initial marginal bone resorption, the choice of implant seems more effective than if using prosthetic abutments or not. This is also exemplified by the studies by Toia et al [4] and Göthberg et al [20], which showed greater differences between implant systems than between prosthetic protocols.

Implant placement depth did not have any effect on marginal bone resorption in the present study. This is in contrast to a 5-year study on Nobel Replace implants, where less bone loss was reported if the 2 mm smooth surfaced collar was placed above below the bone level compared to implants placed at or below the bone level [23]. The bone level shifted to the first thread for all implants over time, which indicated that the smooth surfaced collar could not retain the bone. It is likely that the surface topography played a role for the maintenance of the bone level at the collar in the present study. However, studies on other implant designs with moderately rough surfaces on the collar have shown both minimal [12] and extensive bone loss [24, 25], which indicates that other factors such as collar geometry and drilling protocols are of equal importance. Since it is difficult to draw general conclusions from one implant type, each individual design needs to be evaluated in clinical follow-up studies. Within the limitations of the present study, it is concluded that the evaluated implant system performs well when restored at implant level.

References

  1. Hellden LB, Derand T (1998) Description and evaluation of a simplified method to achieve passive fit between cast titanium frameworks and implants. Int J Oral Maxillofac Implants 13: 190–196. [crossref]
  2. Cochran DL, Hermann JS, Schenk RK, Higginbottom FL, Buser D (1997) Biologic width around titanium implants. A histometric analysis of the implanto-gingival junction around unloaded and loaded nonsubmerged implants in the canine mandible. J Periodontol 68: 186–198. [crossref]
  3. Abrahamsson I, Berglundh T, Sekino S, Lindhe J (2003) Tissue reactions to abutment shift: an experimental study in dogs. Clin Implant Dent Relat Res 5: 82–88. [crossref]
  4. Toia M, Stocchero M, Becktor JP, Chrcanovic B, Wennerberg A (2019) Implant vs abutment level connection in implant supported screw-retained fixed partial dentures with cobalt-chrome framework: 1-year interim results of a randomized clinical study. Clin Implant Dent Relat Res 21: 238–246. [crossref]
  5. Göthberg C, Gröndahl K, Omar O Thomsen P, Slotte C (2018) Bone and soft tissue outcomes, risk factors, and complications of implant-supported prostheses: 5-Years RCT with different abutment types and loading protocols. Clin Implant Dent Relat Res 20: 313–321. [crossref]
  6. Hellden L, Ericson G, Elliot A, Fornell J, Holmgren K, et al. (2003) A prospective 5-year multicenter study of the Cresco implantol-ogy concept. Int J Prosthodont  16: 554–562. [crossref]
  7. Sennerby L, Andersson P, Verrocchi D, Viinamäki R (2012) One-year outcomes of Neoss bimodal implants. A prospective clinical, radiographic, and RFA study. Clin Implant Dent Relat Res 14: 313–320. [crossref]
  8. Zumstein T, Billström C, Sennerby L (2012) A 4- to 5-year retrospective clinical and radiographic study of Neoss implants placed with or without GBR procedures. Clin Implant Dent Relat Res 14: 480–490. [crossref]
  9. Degasperi W, Andersson P, Verrocchi D, Sennerby L (2014) One-year clinical and radiographic results with a novel hydrophilic titanium dental implant. Clin Implant Dent Relat Res 16: 511–519. [crossref]
  10. Zumstein T, Sennerby L (2016) A 1-Year Clinical and Radiographic Study on Hydrophilic Dental Implants Placed with and without Bone Augmentation Procedures. Clin Implant Dent Relat Res 18: 498–506. [crossref]
  11. Andersson P, Pagliani L, Verrocchi D, Volpe S, Sahlin H et al (2019) Factors Influencing Resonance Frequency Analysis (RFA) Measurements and 5-Year Survival of Neoss Dental Implants. International Journal of Dentistry 2019: Article ID 3209872, 9 pages.
  12. Laurell L, Lundgren D (2011) Marginal bone level changes at dental implants after 5 years in function: a meta-analysis. Clin Implant Dent Relat Res 13: 19–28. [[crossref]
  13. Derks J, Håkansson J, Wennström JL, Tomasi C, Larsson M, et al. (2015) Effectiveness of implant therapy analyzed in a Swedish population: early and late implant loss. J Dent Res 94: 44–51. crossref]
  14. Albrektsson T, Dahlin C, Jemt T, Sennerby L, Turri A, et al. (2014) Is marginal bone loss around oral implants the result of a provoked foreign body reaction? Clin Implant Dent Relat Res 16: 155–165. [crossref]
  15. Lindhe J, Meyle J, Group D of European workshop on periodontology (2008) Peri-implant diseases: Consensus Report of the Sixth European Workshop on Periodontology. J Clin Periodontol 35: 282–285. [crossref]
  16. Coli P, Christiaens V, Sennerby L, Bruyn H (2017) Reliability of periodontal diagnostic tools for monitoring peri-implant health and disease. Periodontol 2000 73: 203–217. [crossref]
  17. Albrektsson T, Buser D, Chen ST, Cochran D, DeBruyn H, et al (2012) Statements from the Estepona consensus meeting on peri-implantitis, February 2–4, 2012. Clin Implant Dent Relat Res 14: 781–782.
  18. Albrektsson T, Buser D, Sennerby L (2012) Crestal bone loss and oral implants. Clin Implant Dent Relat Res 14: 783–791. [crossref]
  19. Oh TJ, Yoon J, Misch CE, Wang HL (2002) The causes of early implant bone loss: myth or science? J Periodontol 73: 322–333. [crossref]
  20. Göthberg C, Gröndahl K, Omar O Thomsen P, Slotte C (2018) Bone and soft tissue outcomes, risk factors, and complications of implant-supported prostheses: 5-Years RCT with different abutment types and loading protocols. Clin Implant Dent Relat Res 20: 313–321. [crossref]
  21. d’Hoedt B, Schulte W (1989) A comparative study of results with various endosseous implant systems. Int J Oral Maxillofac Implants 4: 95–105. [crossref]
  22. Albrektsson T, Sennerby L (1991) State of the art in oral implants. J Clin Periodontol 18: 474–481. [crossref]
  23. Pettersson P, Sennerby L (2015) A 5-year retrospective study on Replace Select Tapered dental implants. Clin Implant Dent Relat Res 17: 286–295. [crossref]
  24. Ostman PO, Hellman M, Albrektsson T, Sennerby L (2007) Direct loading of Nobel Direct and Nobel Perfect one-piece implants: a 1-year prospective clinical and radiographic study. Clin Oral Implants Res 18: 409–418. [crossref]
  25. Nowzari H, Chee W, Yi K, Pak M, Chung W, et al. (2006) Scalloped dental implants: a retrospective analysis of radiographic and clinical outcomes of 17 Nobel Perfect implants in 6 patients. Clin Implant Dent Relat Res 8: 1–10. [crossref]

Thought on the Present Molecular Genetics

DOI: 10.31038/JMG.2019213

Mini Review

The working of molecular genetics is involved in finding out the genetic components, their structures, mechanism, dynamics and pathologic alterations in the disease. The final aim is to rectify to normal for the health of human being.

The components are the genetic flows that start from the DNA, which manifests the storage site of all the genes, replication, transcription and translation. Extensive work on DNA sequencing reached the milestone of completing 3 × 10⁹ nucleotide sequences in human and complete genomic sequences from many species. General mechanisms of replication by DNA polymerases and involved factors have been elegantly defined. The structure of four RNA polymerases (pol I, II, III and mitochondrial RNA polymerases) are well characterized. Hundreds offactors are known for co-transcriptional and post transcriptional processing, modifications and splicing.

To understand the progresses made so far, the present is a good time to define some specificity of factors involved in specific gene expression. For example, in replication, how the replication origins are recognized and what may be disturbed in cancer and other diseases. The RNA involvement in replication origin is different from the Okazaki RNA fragment and has not been well characterized. It is interesting to note that the changes in nucleolar transcription system during carcinogenesis is fascinating. But we still don’t know enough what specific aberrations may occur. Replication origins are interdigitated in rRNA genes. In human the rRNA genes are in 5 acrocentric chromosomes (chromosomes 13–15, 21 and 22) which place the rRNA genes in close proximity to centromeres and telomeres. The nucleolus is the site where rRNA is synthesized by RNA polymerase I but have been demonstrated that some of RNA polymerase II activity has effect on nucleolar RNA polymerase I activity such as aluRNA [2].

In the tumor cells, pre-rRNA is accumulating in the nucleolus which may be due to transcriptional hyperactivity but may be also involved in some mutations in the processing factors.

In the system of mRNA transcription, many diseases have been reported caused by altered transcription factors which include general transcription factors as well as specific transcription factors. The promoter mutations also causes the diseases.

The modifications of mRNA are also involved in processing as well as its translational activity.

More importantly, the splicing mechanisms of pre-mRNA are extensively worked out and found that > 300 different proteins may be involved.

Are the splicing mechanisms are universally same throughout the different pre-mRNAs or are there specific factors involved in for specific pre-mRNA splicing? The spliceosomes, EJC complex and other protein involved in mRNA maturation have been well characterized structurally.

It is interesting to note that the order of splicing is not always from 5’ to 3’ direction and one of well characterized splicing order is in the ovomucoid pre-mRNA maturation. The order of splicing sites are from first to last to be in order of 5/6→7/4→2/1→3 (or 5/6→7/4→2→3/1) [5, 7]. Efficient splicing is involved splicing code (GU, branch site, AG), enhancers, suppressors, RNA sequences, secondary structure and tertiary structures. It was interesting to find that SF2/ASF are more abundant in early spliced site at the splice sites 5/6 and SC35 is enriched in late splice site 3 in ovomucoid pre-mRNA.

SF2/ASF

SC35

SRp40

SRp55

hnRNP A1

1

8.3

6.7

3.3

6.7

3.3

2

6.0

6.0

2.0

4.0

5.3

3

0.4

10.0

4.0

8.0

3.3

4

6.7

3.3

5.0

5.0

4.2

5

13.3

8.3

5.0

5.0

6.7

6

6.7

5.0

8.3

6.7

6.7

7

10.0

3.3

10.0

5.0

3.3

Motifs are analyzes 60 nucleotide at the splice sites (total 120 nucleotide by adding 5’ splice site and 3’ splice site). Due to short exon 2 (20 nucleotides) the 3’ splice site 1 and 5’ splice site 2 are 50 nucleotides each). The above values are expressed in number of motifs per 100 nucleotides.

(ESE are screened by ESE finder 3 CSHL and hnRNP A1 is screened by HSF3; Human Splicing Factor finder 3)

Balance between enhancers and suppressors show impact on splicing but how these regulators are distributed in the genes are not well characterized. For example, although, hnRNP A1 has been reported to be suppressor of splicing, it may also confer some RNA structural stability in the complexes.

Although some people stress that RNA transcription is taking place near the nuclear membrane and exit to the cytoplasm, it is well known that chromosomal domains in the nuclear geography are not all at the nuclear membrane. Transcription sites in different chromosomes are located throughout within dynamic nucleoplasm [3, 6, 1]. The location of pre-mRNP maturation stays not as the static site but it is mobile in dynamic movement. The co-transcriptional splicing progresses when pre-mRNP is still attached to the transcription complex, and post transcriptional splicing is taking place after detachment from the transcription complex on the way out to the cytoplasm. The splicing regulators are also dynamic, moving from the storage site to the transcription site [8]. On the other hand, the dynamic pre-mRNP movement after detachment from the transcription site may encounter the splicing factor storage sites where additional splicing and maturation may take place. In the course of dynamic movement of mRNP from the transcription site, it is interesting that SF2/ASF sites are more abundant in early transcription region, and next followed by SC35 and other factors such as SRp40 and SRp55.

SF2/ASF and SC35 are binding not only to RNA but also to DNA and are there intronic active TSS are present?

Research on the stem-cell therapy, gene therapy, gene editing, antisense oligonucleotide therapy are very active with FDA approved nusinersen (Spinraza) for SMA and Exondys 51 for DMD and more to come.

Recent development on targeted protein degradation by small molecules may have future for the specific degradation of proteins with dominant negative mutations [4].

References

  1. Bolzer A, Kreth G, Solovei I, Koehler  D and Saracoglu K (2005) Three-Dimensional Maps of All Chromosomes in Human Male Fibroblast Nuclei and Prometaphase Rosettes. PLos Biology. 3: 0826–0842, e157.
  2. Caudron-Herger M, Pankert T, Seiler J, Németh A and Voit R et al (2015) Alu element-containing RNAs maintain nucleolar structure and function. EMBO J. 34: 2758–2774.
  3. Cmarko D, Verchure PJ, Martin TE, Dahmus ME and Krause S et al (1999) Ultrastructural Analysis of Transcription and Splicing in the Cell Nucleus after Bromo-UTP Microinjection. Mol. Biol Cell. 10: 211–223.
  4. Cromm PM and Crews CM (2017) Targeted Protein Degradation: From Chemical Biology to Drug Discovery. Cell Chem Biol. 24(9), 1181–1190.
  5. Lewin B (1994, 2008) RNA Splicing and Processing. Gene IX, Chapter 26, Pearson Prentice Hall, Peason Education, Inc. pp667–705.
  6. Pombo et al (1998) EMBO J. 17(6) 1768–1778
  7. Ro-Choi TS and Choi YC (2009) Thermodynamic Analyses of the Constitutive Splicing Pathway for Ovomucoid Pre-mRNA. Mol. Cells. 27, 1–10.
  8. Spector DL and Lamond AI (2011) Nuclear Speckles in the book The Nucleus.

PD-1 Inhibitors: To Go or To Stop? ; Review Articles

DOI: 10.31038/CST.2019423

Abstract

PD-1 receptor as one of the programmed cell death protein 1 receptor was firstly designated in the early 1990s assumed its manifestation through out initiation of programmed cell death in a T-cell hybridoma. Subsequently its early detection, numerous groups have recognized that arrangement of PD-1 through its ligand, programmed death ligand 1 (PD-L1), negatively regulates T-cell-mediated immune responses. Early preclinical indication proposed that stimulation of PD-1/PD-L1 signaling might work as a mechanism for tumors to escape “an antigen-specific T-cell immunologic response”. Accordingly, the Atezolizumab is one of a novel immunotherapy medication called “checkpoint inhibitors”. It functioning through interfering with the tumor’s ability to deactivate cancer combat immune cells called (T-cells). It objects a “protein hypothesis was developed that PD-1/PD-L1 blockade may be an effective cancer immunotherapy.

For instance, several PD-1/PD-L1 inhibitors stays to develop, predictive biomarkers, mechanisms of resistance, management interval and therapy up on disease progression and immune-related side effects, are main ideasessential of additional attention to enhance the anticancer effects of this group of immunotherapy.

Keywords

PD-1/ PD-L1 inhibitor, Immune checkpoint, Treatment beyond progression, Immune-related toxicity

Introduction

The main role of T cells is to differentiate healthy cells from diseased or malignant cells by the activation or deactivation of numerous receptors on the T-cell surface. As stated before, the malignant cells can escape recognition through “cell surface molecules” that interact with the receptors on T cells to, in essence, mimic the signals released by healthy cells. So, the immune system that rests inactive against malignant cells, allowing their un-regulated development and proliferation.

As these molecules and their associated receptors on T cells keep the immune system ‘‘in check,” by “inhibiting immune functioning”, they are mutually called “checkpoint proteins”. The Checkpoint inhibitors inhibit the effects of these checkpoint proteins.

Types of checkpoint Inhibitors

Three different groups that targets different checkpoint proteins (1) PD-L1: Programmed Death Ligand-1, (2) PD-1: Programmed Cell Death Protein-1 and (3) CTLA-4; Cytotoxic T-Lymphocyte Associated Protein 4, have been the chief target of investigation for the management of cancer patients with immunotherapy as new era.CTLA-4 and PD-1 are found on T cells. PD-L1 are on cancer cells (Figure- 1).

CST 2019-111 - Ayman Egypt_F1

Figure 1. PD-1 and PD-L1 sites of action

Immune checkpoint inhibitor. Checkpoint proteins, such as PD-L1 on tumor cells and PD-1 on T cells, help keep immune responses in check. The binding of PD-L1 to PD-1 keeps T cells from killing tumor cells in the body (left panel). Blocking the binding of PD-L1 to PD-1 with an immune checkpoint inhibitor (anti-PD-L1 or anti-PD-1) allows the T cells to kill tumor cells (right panel).

https: //www.cancer.gov/publications/dictionaries/cancer-terms/def/immune-checkpoint-inhibitor.

PD-1 and its Immune-inhibitory Mechanism

The programmed cell death 1 (PD-1) receptor is expressed on activated T cells, B cells, macrophages, regulatory T cells (Tregs), and natural killer (NK) cells. Binding of PD-1 to its B7 family of ligands, programmed death ligand 1 (PDL1 or B7-H1) or PD-L2 (B7-DC) results in suppression of proliferation and immune response of T cells. Activation of PD-1/PD-L1 signaling serves as a principal mechanism by which tumors evade antigen-specific T-cell immunologic responses. Antibody blockade of PD-1 or PD-L1 reverses this process and enhances antitumor immune activity. TCR, T-cell receptor; MHC, major histocompatibility complex; APC, antigen-presenting cell.

PD-1 functions through regulation of late-phase immune responses. The management is as suggested by the activation-induced expression of PD-1. The control of immune reactions also takes place in the peripheral tissues. PD-1 contains single IgV-like domains as in its extracellular region. The region also includes ITIM and ITSM. PD-1 requires ligation with the physiological ligand to suppress T-cell activation (Figure- 1).

PD-1 Function

PD-1 and CTLA-4 can be applied at a diverse phase of immune reaction. They are also induced on the activated T-cells. PD-1 is shown on activated T-cells at a late effectors stage. In the condition of the chronic viral condition, there is a high persistence of PD-1 expression on CD8+ T-cells. Despite their distinct features, the CTLA-4 and PD-1 are both immune checkpoints.

They also regulate the immune responses at different stages. CTLA-4 can effectively block the activation of T-cells in the lymphoid organs. PD-1 functions effectively by inhibiting the effectors T-cells at a later stage of immune responses (Figure-2).

CST 2019-111 - Ayman Egypt_F2

Figure 2. PD-1 and CTLA-4 sites of action

jim-Allison-who-first-used-CTLA4-blockade-for-cancer-treatment-and-Honjo-who-originally-discovered-PD-1-new-Nobel-Laureates-of-Medicine-this-year-Custom-Graphic

Control of Cancerous Immunity by PD-1

PD-1 is essential for dampening the immune-surveillance for tumours. Tumors can express the PD-L1 and thus escaping the immune surveillance. PD-L1 interacts with PD-1 on T-cells and therefore and thus negatively regulates the immune responses [5].

There is also a correlation between poor prognosis and high expression of PD-1 ligands on tumors. PD-1 blockade has previously successfully been used on metastatic tumors. Additionally, PD-1 has been identified to contain a higher therapeutic capacity than CTLA-4 blockade (Figure-3).

CST 2019-111 - Ayman Egypt_F3

Figure 3. PD-1 Function and Action

jim-Allison-who-first-used-CTLA4-blockade-for-cancer-treatment-and-Honjo-who-originally-discovered-PD-1-new-Nobel-Laureates-of-Medicine-this-year-Custom-Graphic

CST 2019-111 - Ayman Egypt_F4

Figure 4. PD-1 Inhibitors Side Effect

https: //www.esmo.org/content/download/124130/2352601/file/ESMO-Patient-Guide-on-Immunotherapy-Side-Effects.pdf

Role of PD-1 inhibitors in the treatment of cancer patients

1-Pembrolizumab (Keytruda) was developed by Merck and first approved by the Food and Drug Administration in 2014 for the treatment of melanoma. It was later approved for metastatic non-small cell lung cancer and head and neck squamous cell carcinoma. In 2017, it became the first immunotherapy drug approved for use based on the genetic mutations of the tumor rather than the site of the tumour.

Indications

  • Indicated for the treatment of patients with unresectable or metastatic melanoma.
  • Indicated for the adjuvant treatment of patients with melanoma with involvement of lymph node(s) following complete resection.
  • In combination with pemetrexed and platinum chemotherapy, is indicated for the first-line treatment of patients with metastatic non-squamous non‒small cell lung cancer (NSCLC), with no EGFR or ALK genomic tumor aberrations.
  • In combination with carboplatin and either paclitaxel or nabpaclitaxel, is indicated for the firstline treatment of patients with metastatic squamous NSCLC.
  • As a single agent, is indicated for the first-line treatment of patients with metastatic NSCLC whose tumors have high PD-L1 expression [tumor proportion score (TPS) ≥ 50%] as determined by an FDA-approved test, with no EGFR or ALK genomic tumor aberrations.
  • As a single agent, is indicated for the treatment of patients with metastatic NSCLC whose tumors express PD-L1 (TPS ≥1%) as determined by an FDA-approved test, with disease progression on or after platinum-containing chemotherapy. Patients with EGFR or ALK genomic tumor aberrations should have disease progression on FDA-approved therapy for these aberrations prior to receiving KEYTRUDA.
  • Indicated for the treatment of patients with recurrent or metastatic head and neck squamous cell carcinoma (HNSCC) with disease progression on or after platinum-containing chemotherapy. This indication is approved under accelerated approval based on tumor response rate and durability of response. Continued approval for this indication may be contingent upon verification and description of clinical benefit in the confirmatory trials.
  • Indicated for the treatment of adult and pediatric patients with refractory classical Hodgkin lymphoma (cHL), or who have relapsed after 3 or more prior lines of therapy. This indication is approved under accelerated approval based on tumor response rate and durability of response.
  • Indicated for the treatment of adult and pediatric patients with refractory primary mediastinal large B-cell lymphoma (PMBCL), or who have relapsed after 2 or more prior lines of therapy. This indication is approved under accelerated approval based on tumor response rate and durability of response. Continued approval for this indication may be contingent upon verification and description of clinical benefit in confirmatory trials.
  • Indicated for the treatment of patients with locally advanced or metastatic urothelial carcinoma (mUC) who are not eligible for cisplatin-containing chemotherapy and whose tumors express PD-L1 [combined positive score (CPS) ≥10], as determined by an FDA-approved test, or in patients who are not eligible for any platinum-containing chemotherapy regardless of PD-L1 status. This indication is approved under accelerated approval based on tumor response rate and duration of response. Continued approval for this indication may be contingent upon verification and description of clinical benefit in confirmatory trials.
  • Indicated for the treatment of patients with locally advanced or metastatic urothelial carcinoma (mUC) who have disease progression during or following platinum-containing chemotherapy or within 12 months of neoadjuvant or adjuvant treatment with platinum-containing chemotherapy.
  • Indicated for the treatment of adult and pediatric patients with unresectable or metastatic microsatellite instability-high (MSI-H) or mismatch repair deficient (dMMR)solid tumours that have progressed following prior treatment and who have no satisfactory alternative treatment options, or colorectal cancer that has progressed following treatment with fluoropyrimidine, oxaliplatin, and irinotecan.

2-Nivolumab (Opdivo) was developed by Bristol-Myers Squibb and first approved by the FDA in 2014 for the treatment of melanoma.

Indications

  • As a single agent is indicated for the treatment of patients with BRAF V600 mutation-positive un-resectable or metastatic melanoma. This indication is approved under accelerated approval based on progression-free survival. Continued approval for this indication may be contingent upon verification and description of clinical benefit in the confirmatory trials.
  • As a single agent is indicated for the treatment of patients with BRAF V600 wild-type un-resectable or metastatic melanoma.
  • In combination with YERVOY® (ipilimumab), is indicated for the treatment of patients with un-resectable or metastatic melanoma. This indication is approved under accelerated approval based on progression-free survival. Continued approval for this indication may be contingent upon verification and description of clinical benefit in the confirmatory trials.
  • Is indicated for the treatment of patients with metastatic non-small cell lung cancer (NSCLC) with progression on or after platinum-based chemotherapy. Patients with EGFR or ALK genomic tumor aberrations should have disease progression on FDA-approved therapy for these aberrations prior to receiving OPDIVO.
  • Indicated for the treatment of patients with advanced renal cell carcinoma (RCC) who have received prior anti-angiogenic therapy.
  • Indicated for the treatment of adult patients with classical Hodgkin lymphoma (cHL) that has relapsed or progressed after autologous hematopoietic stem cell transplantation (HSCT) and brentuximabvedotin or after 3 or more lines of systemic therapy that includes autologous HSCT. This indication is approved under accelerated approval based on overall response rate. Continued approval for this indication may be contingent upon verification and description of clinical benefit in confirmatory trials.
  • Indicated for the treatment of patients with recurrent or metastatic squamous cell carcinoma of the head and neck (SCCHN) with disease progression on or after platinum-based therapy.
  • Indicated for the treatment of patients with locally advanced or metastatic urothelial carcinoma who have disease progression during or following platinum-containing chemotherapy or have disease progression within 12 months of neoadjuvant or adjuvant treatment with platinum-containing chemotherapy. This indication is approved under accelerated approval based on tumor response rate and duration of response. Continued approval for this indication may be contingent upon verification and description of clinical benefit in confirmatory trials.
  • Indicated for the treatment of adult and pediatric (12 years and older) patients with microsatellite instability high (MSI-H) or mismatch repair deficient (dMMR) metastatic colorectal cancer (CRC) that has progressed following treatment with a fluoropyrimidine, oxaliplatin, and irinotecan. This indication is approved under accelerated approval based on overall response rate and duration of response. Continued approval for this indication may be contingent upon verification and description of clinical benefit in confirmatory trials.
  • Indicated for the treatment of patients with hepatocellular carcinoma (HCC) who have been previously treated with sorafenib. This indication is approved under accelerated approval based on tumor response rate and durability of response. Continued approval for this indication may be contingent upon verification and description of clinical benefit in the confirmatory trials.
  • Indicated for the adjuvant treatment of patients with melanoma with involvement of lymph nodes or metastatic disease who have undergone complete resection.

3-Cemiplimab (Libtayo) is a human programmed death receptor-1 (PD-1) monoclonal antibody that binds to PD-1 and blocks its interaction with programmed death ligands 1 (PD-L1) and 2 (PD-L2). The drug is being investigated as a treatment for various cancers and in September 2018 received approval in the USA for the treatment of patients with metastatic cutaneous squamous cell carcinoma or locally advanced cutaneous squamous cell carcinoma who are not candidates for curative surgery or curative radiation. This article summarizes the milestones in the development of cemiplimab leading to this first global approval for the treatment of advanced cutaneous squamous cell carcinoma.

Side Effects of PD-1 Inhibitors

Side effects from treatment with checkpoint inhibitors typically appear within weeks or a few months of starting treatment but can persist or first appear after treatment has finished. Immune-related side effects (sometimes referred to as immune-related adverse effects or irAEs) arising from treatment with checkpoint inhibitors can affect any organ or tissue, but most commonly affect the skin, colon, lungs, liver and endocrine organs (such as the pituitary gland or thyroid gland) [7]. Most immune-related side effects are mild to moderate and reversible if detected early and addressed appropriately.

Management of side effects

There are other side effects to checkpoint inhibitors which occur infrequently, but of which you should be aware, as follows [7]:

  • Neurological symptoms – according to an analysis of data from many clinical trials, these occur in approximately 4%–6% of people treated with CTLA-4 inhibitors or PD-1 inhibitors, or in up to 12% if treated with both types in combination, and manifests in a wide range of different ways (including muscle weakness, numbness and breathing difficulties); treatment for symptoms of Grade 2 or higher is based mainly on increasing strength oral or intravenous corticosteroids.
  • Rheumatological symptoms – mild or moderate muscle or joint pain occurs in 2%–12% of people treated with checkpoint inhibitors, more commonly with PD-1 inhibitors; treatment is mainly with oral analgesics (mild-to-moderate symptoms), low-dose oral corticosteroids (moderate symptoms), or for severe symptoms, consultation with a specialist and high-dose corticosteroids or intravenous immunosuppressive drugs may be necessary. Treatment with checkpoint inhibitors may need to be interrupted or stopped, depending on symptom severity.
  • Kidney symptoms – fewer than 1% of people treated with CTLA-4 inhibitors or PD-1 inhibitors experience kidney problems (although approximately 5% do so if treated with the two types of checkpoint inhibitors in combination); significant impairment of kidney function is treated with intravenous corticosteroids and specialist intervention, and may require checkpoint inhibitor treatment to be interrupted or stopped.
  • Cardiac symptoms – seen in less than 1% of people treated with CTLA-4 inhibitors or PD-1 inhibitors and includes a wide range of different types; these require early referral to a cardiologist and treatment with high-dose corticosteroids or other immunosuppressive drugs.

Conclusion

In the immunotherapy era, PD-1 inhibitors achieved strong response for many cancer patients either as an adjuvant or palliative treatment. The side effects appear as mild to moderate and can be managed as discovered early.

References

  1. Khanna P, Blais N, Gaudreau P, Corrales-Rodriguez L (2017) Immunotherapy Comes of Age in Lung Cancer. Clinical Lung Cancer. 2017; 18(1): 13–22.
  2. Iwai Y, Hamanishi J, Chamoto K, HonjoT (2017) Cancer immunotherapies targeting the PD-1 signaling pathway. Journal of Biomedical Science. 2017; 24(1).
  3. Zhang R, Li P, Li Q, Qiao Y and Xu T et al (2018) Radiotherapy improves the survival of patients with stage IV NSCLC: A propensity score matched analysis of the SEER database. Cancer Medicine. 2018; 7(10): 5015–5026.
  4. Almutairi A, Alsaid N, Martin J, Babiker H and McBride A et al (2018) Comparative efficacy and safety of immunotherapies targeting PD-1/PD-L1 pathway for previously treated advanced non-small cell lung cancer: Bayesian network meta-analysis. Journal of Clinical Oncology. 2018; 36(15_suppl): e21012-e21012.
  5. Ferris R. PD-1 targeting in cancer immunotherapy (2012) Cancer.; 119(23): E1-E3.
  6. TogashiY (2017). ISY9-2Translational research for predictive biomarkers and novel cancer immunotherapies beyond PD-1/PD-L1 blockade therapies. Annals of Oncology. 2017; 28 (suppl_9).
  7. Haanen JBAG, Carbonnel F, Robert C, et al (2017) Management of toxicities from immunotherapy: ESMO Clinical Practice Guidelines for diagnosis, treatment and follow-up. Ann Oncol 2017; 28(suppl_4): iv119-iv142.

Feeding Broccoli Floret Residues on Layers: II. Effects on Fatty Acid Deposition

DOI: 10.31038/IJVB.2019312

Abstract

A study was conducted to determine the effects of feeding Dried Broccoli Florets (DBF) to layers on egg yolk fatty acid deposition. Seventy-two layers were randomly allotted to four dietary treatments (six cage replicates with three hens each) and fed diets containing 0, 4, 8, and 12% DBF for 56 days. Results showed that inclusion of DBF decreased (linear effect, P< 0.001) concentrations of Saturated Fatty Acids (SFA) and increased (linear effect, P< 0.001) concentrations of poly-unsaturated fatty acids (PUFA). Egg yolk concentration of palmitic acid decreased (linear effect, P< 0.001) while linoleic (quadratic effect, P = 0.003) and linolenic (linear effect, P < 0.001) acid concentrations increased as the level of DBF in the diet increased. It was concluded that feeding DBF at 12% of the diet increased PUFA concentrations and decreased those of SFA.

Introduction

Broccoli (Brassica oleracea L. var. italica) is an important vegetable crop in Canada with an annual production of 32,000 tons. As with other vegetables, large amounts of broccoli wastes are generated during harvest, packaging and marketing. It has been estimated that about 40 to 50% of total broccoli produced is discarded during processing as a result of the high standards imposed by consumers and retailers, and due to consumer refusal at the retail level. Additional losses occur in the field, generating large quantities of florets, stems and leaves as crop residues. As broccoli production increases, there is a concomitant increase in the quantity of residues produced. These residues are often discarded into the environment where they pose major environmental concerns. There is growing interest in developing new feeds from waste vegetable such as broccoli by-products to replace conventional feeds. Recent research showed that broccoli residues such as broccoli leaves and stems and broccoli florets can be incorporated in layer diets to substitute conventional feeds such as soybean meal. Incorporation of dried broccoli leaves and stems up to 9% of the diets had no effect on egg production, but significantly improved egg quality with higher yolk xanthophyll and lower yolk cholesterol concentrations [1], In more recent study, [2] reported that feeding Dried Broccoli Florets (DBF) up to 12% of the diet had no negative effects on feed intake, egg production and feed efficiency and improve egg yolk color and α-tocopherol. Chemical analysis of different broccoli parts showed that florets contained higher CP (22.4%) but lower crude fiber (11.7%) concentrations than broccoli leaves and stems [3]. Broccoli florets are also a rich source of poly-unsaturated fatty acids which constitute 62% of the total fatty acids [3]. Inclusion of feeds rich in PUFA has been shown to increase n-3 PUFA deposition in egg yolks without compromising egg production [4–6]. To the best of our knowledge, no studies have investigated the effects of dried broccoli floret (DBF) residues on egg yolk fatty acid profile.

Materials and Methods

Birds and housing

All animal procedures were approved by the Animal Care Committee of the Faculty of Agricultural and Environmental Sciences of McGill University. This study was part of larger study in evaluating the effects of feeding DBF on layer performance and total tract nutrient retention [2]. Preparation, processing and chemical composition were reported [2]. A Total of 72 (64-week-old) White Leghorn laying hens were weighed and placed in 24 cages (3 birds/cage) with six cage replicates. Each cage representing one replicate, was assigned to one of four experimental diets containing 0, 4, 8 and 12% DBF for 56 days. Dried broccoli florets partially replaced corn and soy bean meal (Table 2). All diets were formulated to be iso-caloric and iso-nitrogenous according to [7] and were offered in a mash form. Feed and water were provided ad libitum. Birds. Birds received equal daily lighting time (16L: 8D) at constant room temperature.

Sample collection

Feed intake was measured by-weekly. Two eggs from each cage replicates were collected at random, cracked, and yolks were separated from the whites. Samples of pooled egg yolks (2 eggs/cage replicates/treatment) for each treatment were collected at week 2, 4, 6, and 8 of the experiment (n = 48). The yolk samples were frozen at −20 °C, freeze dried, and finely ground before fatty acid analysis. Methyl esters of fatty acids were prepared from yolk, feed, and DBF samples according to [8]. Acid composition of methyl esters was determined by gas chromatography as described by [6]

Statistical Analysis

Data were analyzed using the PROC MIXED procedure [9] with the following model:

Yijk = μ + Ti + Cij + eijk

Where: Yijk= observation, μ = overall mean,

Ti= fixed effect of ith treatment (i= 1, 2, 3 or 4),

Cij= random effect of jth cage within ith treatment (j = 1, 2, 3, 4, 5 or 6),

eijk= residual error (k = 1 or 2),

eijk ~ N (0, σ 2e).

The least significant difference method was used to identify statistically different means (P <0.05). Orthogonal contrasts were used to test for linear and quadratic effects of adding DBF to the diet. The least square mean method was used to identify differences among treatment means and statistical differences were declared at p < 0.05.

Data were analyzed by one-way ANOVA using the GLM procedure [9] with cages as experimental units. Least significant difference method was used to identify statistically different means (P < 0.05). Orthogonal contrasts were used to test for linear and quadratic effects of adding DBF to the diet.

Results

Linolenic acid (C18: 3n3) was the most abundant fatty acid followed by palmitic and oleic acid, respectively (Table 2). Dietary C18: 3n3 increased by 8.2, 24.5, and 61.2% as BDF increased by 4, 8, and 12%, respectively (Table 1).

Table 1. Ingredients and chemical composition of dietary treatments

Broccoli floret residue inclusion (%)

0.0

4.0

8.0

12.0

Ingredients (%)

Corn

53.68

51.64

49.61

47.57

Soybean

31.47

29.10

26.73

24.37

Dried broccoli floret residues

0.0

4.00

8.00

12.00

Limestone

10.31

10.29

10.27

10.25

Soybean oil

2.18

2.61

3.04

3.47

Mono-calcium phosphate

1.25

1.22

1.20

1.17

Mineral-vitamin mix1

0.50

0.50

0.50

0.50

Salt

0.27

0.28

0.29

0.30

Choline chloride

0.10

0.10

0.10

0.10

Sodium carbonate

0.08

0.08

0.08

0.08

Methionine

0.01

0.02

0.03

0.04

Calculated analysis

Metabolizable energy (kcal/kg)

2775.00

2775.00

2775.00

2775.00

Crude protein (%)

19.00

19.00

19.00

19.00

Total lysine, (%)

1.10

1.10

1.10

1.10

Total methionine (%)

0.30

0.30

0.30

0.30

Total Ca (%)

4.30

4.30

4.30

3.00

Total P (%)

0.60

0.60

0.60

0.60

Analyzed fatty acids (% of fatty acids)

C16: 0

13.4

12.4

12.5

12.5

C16: 1

0.1

0.1

0.1

0.1

C18: 0

2.5

2.5

2.6

3.0

C18: 1

21.2

21.6

20.9

18.8

C18: 2

54.9

54.9

54.1

53.6

C18: 3

4.9

5.3

6.1

7.9

C20: 4

0.2

0.7

0.7

0.9

C22: 6

0.1

0.3

0.3

0.3

1Composition of premix: Vitamin A 11,530 IU/kg; Vitamin D 2,400 IU/kg; Vitamin E 74.168 IU/kg; Cu 24mg/kg; Fe 200mg/kg; Mg 122mg/kg; Se 0.38mg/kg; Zn 131mg/kg; Co 0.46mg/kg; F 19mg/kg; I 0.80mg/kg.

Table 2. Chemical composition of broccoli floret residues

Parameters

%

Fatty acids (% of fatty acids)

C12: 0

0.2

C14: 0

5.4

C15: 0

0.3

C16: 0

22.8

C16: 1

3.6

C18: 0

2.1

C18: 1

17.6

C18: 2

15.1

C18: 3

35.4

C20: 0

0.5

C22: 0

10.3

C24: 0

0.5

Fatty acids (%)

1.8

Saturated (SFA) and mono-unsaturated (MUFA) fatty acids of egg yolk decreased (linear effect, P < 0.0001) with increasing dietary DBF (Table 5). The reductions in SFA and MUFA were mainly due to the declines in palmitic (quadratic effect, P = 0.0838) and oleic (linear effect, P < 0.0001) acids, respectively. In contrast, poly-unsaturated fatty acid (PUFA) concentrations in egg yolk increased (linear effect, P< 0.0001) as the level of dietary DBF increased.

Consequently, SFA: PUFA ratio decreased (linear effect, P< 0.0001) in yolks produced by layers fed DBF. As the level of dietary DBF increased, yolk linolenic acid content (quadratic effect, P = 0.011) with highest concentrations being achieved for layers fed 8 and 12% DBF diets. A similar increase in yolk linoleic (linear effect, P< 0.0001) content was also observed as the level of dietary DBF increased.

Discussion

Linolenic acid concentration of DBF constitutes 35.4% of the total fatty acids, which is consistent with the values reported for broccoli florets [9,10], The Fatty acid profile of egg yolk reflected the dietary fatty acid composition. The increase in PUFA and linolenic acid concentrations is likely due to the high levels of linolenic acid concentration in DBF-based diets (Table 1) and DBF (Table 2). Inclusion of DBF at 4, 8, and 12% of the diet were accompanied with significant increases (i.e. 23.3, 66.3, and 68.6%, respectively) in egg yolk deposition of linolenic acid when compared with the control diet. Feeding layers diets rich in linolenic acid such as cabbage residues [11], pasture [12], and flaxseed [4, 6] has been successfully used to increase the concentration of linolenic acid as well as other health promoting fatty acids in egg yolk. The lower egg yolk SFA and MUFA concentrations produced by layers fed DBF diets can be attributed to their lower concentrations in DBF diets and \ or the inhibitory effects of PUFA. It is well documented that PUFA inhibit the activity of 9∆ desaturase which is involved in MUFA synthesis [13, 14].

Table 3. Effects of broccoli floret residue inclusion on egg yolk fatty acid composition (% of fatty acids)1

Broccoli floret residue inclusion (%)

Inclusion effect

0.0

4.0

8.0

12.0

SEM

L2

Q3

Saturated fatty acids

C14: 0

0.26a

0.26a

0.24b

0.24b

0.005

0.005

< 0.001

C16: 0

27.21a

26.65b

26.06c

26.01c

0.143

<0.001

0.084

C18: 0

8.41

8.48

8.12

8.36

0.134

0.507

0.779

Mono-unsaturated fatty acids

C16: 1

2.55

2.35

2.11

2.14

0.12

0.423

0.633

C18: 1

38.76a

38.65a

36.13b

35.59b

0.282

<0.001

0.412

Poly-unsaturated fatty acids

C18: 2n-6

17.50b

18.74b

22.27a

22.03a

0.48

<0.001

0.138

C18: 3n-3

0.86c

1.06b

1.43a

1.45a

0.033

<0.001

0.011

C20: 2n-6

0.18

0.16

0.20

0.19

0.03

0.004

0.199

C20: 3n-6

0.18

0.17

0.19

0.19

0.004

0.154

0.536

C22: 1

1.89ab

1.87ab

1.80b

2.00a

0.046

0.216

0.020

C22: 6n3

1.07c

1.19b

1.20ab

1.28a

0.024

< 0.001

0.411

C24: 1

0.11

0.10

0.11

0.11

0.002

0.247

0.046

SFA4

35.87a

35.40a

34.50b

34.61b

0.175

<0.001

0.190

MUFA5

43.20

42.86

40.04

39.73

0.294

<0.001

0.985

PUFA6

20.61b

21.41b

25.39a

25.26a

0.314

<0.001

0.165

SFA: PUFA

1.75a

1.66a

1.36b

1.38b

0.025

<0.0001

0.0675

a-cMeans in the same row with different superscripts are different.
1The values are means of 6 replicate cages
2L: Linear effect
3Q: Quadratic effect
4SFA3: Saturated fatty acids
5MUFA: Mono-unsaturated fatty acids
6PUFA: Poly-unsaturated fatty acids

Conclusions

It was concluded that incorporation of DBF in layer diets reduced egg yolk concentrations of SFA and increased those of PUFA. Greater deposition of omega-3 fatty acids (e.g. C18: 3n3) can be achieved by 6 or 9% DBF.

References

  1. Hu C, Zou A, Wang D, Pan H, Zheng B, et al (2011) Effects of broccoli stems and leaves meal on production performance and egg quality of laying hens. Animal Feed Science and Technology 170: 117–121.
  2. Mustafa A, Baurhoo B (2018) Effect of feeding broccoli floret residues on leghorn layer performance and egg quality and nutrient digestibility. British Poultry Science 59: 430–434
  3. Campas-Baypoli ON, Nchez-Machado DS, Solano CB, Gaste´Lum JE, Reyes-Moreno C, et al (2009) Biochemical composition and physicochemical properties of broccoli flours. Int J Food SciNutr 60: 163–173.
  4. Jia W, Slominki BA, Guenter W, Humphreys A, Jones O (2008) The effect of enzyme supplementation on egg production parameters and omega-3 fatty acid deposition in laying hens fed flaxseed and canola seed. Poultry Science 87: 2005–2014.
  5. Nain S, Renema RA, Korver DR, Zuidhof MJ (2012) Characterisation of the n-3 polyunsaturated fatty acid Enrichment in laying hens fed an extruded flax enrichment source. Poultry Science 91: 1720–1732
  6. Huang S, Baurhoo B, Mustafa A (2018). Effects of extruded flaxseed on layer performance, nutrient digestibility, and yolk fatty acid composition. British Poultry Science 59: 463–469.
  7. NRC (1994) Nutrient Requirements of Poultry, 9th rev. ed. Nat. Acad. Press. Washington
  8. O’Fallon JV, Busboom JR, Nelson ML, Gaskins CT (2007) A direct method of fatty acid methyl ester synthesis: Application of wet meat tissues, oils and feedstuffs. J AnimSci 85: 1511–1521.
  9. Zhuang H, Hildebrand DF, Barth MM (1995) Senescence of broccoli buds is related to changes in lipid peroxidation. J Agric Food Chem 4310: 2585–2591.
  10. Murcia MA, Lo´pez-Ayerra B, Garc´ıa-Carmona F (1999). Effect of processing methods and different blanching times on broccoli: proximate composition and fatty acids. LWT J Food SciTechnol 32: 238–243
  11. Mustafa, A. and Baurhoo, B. (2017) Evaluation of dried vegetable residues for poultry: III Effects of feeding cabbage leaf residues on laying performance, egg quality, and apparent total tract digestibility. Journal of Applied Poultry Research, 27: 145–151
  12. Lopez-Bote CJ, Sanz Arias R, Rey AI, Castano A, Isabel B, et al (1998) Effect of free-range feeding on n-3 fatty acid and α-tocopherol content and oxidative stability of eggs. Anim Feed SciTechnol 72: 33–40
  13. Mahfouz MM, Smith TL, Kummerow FA (1984) Effect of dietary fats on desaturase activities and the bio-synthesis of fatty acids in rat-liver microsomes. Lipids 19: 214–222.
  14. Garg ML, Sebokova E, Wierzbicki A,Thomson AB, Clandinin MT (1988) Differential effects of dietary linoleic andα-linolenic acid on lipid metabolism in rat tissues. Lipids 23: 847–852.

How safe is your DNA extract?

DOI: 10.31038/IJVB.2019311

Abstract

Three of four extraction methods yielding high quality DNA from blood failed to remove all live Bacillus anthracis from the extraction arm of a molecular assay that provided a partial molecular fingerprint of endemic B. anthracis in Israel and distinguished B. anthracis from closely related gram-positive bacteria.

Key words

Bacillus anthracis; DNA extraction; biosafety, sequence analysis

Introduction

Anthrax is an infectious disease caused by the non-motile, gram-positive, spore forming bacterium, Bacillus anthracis. Three forms of infection occur depending on the route of infection; cutaneous (skin), inhalation (lungs) and gastrointestinal. Edema toxin, lethal toxin, protective antigen, and capsular antigen are the virulence factors associated with B. anthracis pathogenesis. These factors are encoded on two plasmids, pX01 [1] and pX02 [2, 3]. The pX01 plasmid (185 kb) encodes the protective antigen, pag [4], the lethal factor, lef [5], and the edema factor, cyc [6], while the pX02 plasmid (95 kb) encodes three genes required for capsule formation, Cap A, Cap B, and Cap C [7]. Both plasmids must be present for B. anthracis to be pathogenic. Non-pathogenic, live B. anthracis agricultural vaccines have been produced from B. anthracis strains that lack either the plasmid pX01 (Pasteur vaccine strains) or pX02 (Sterne vaccine strains).

B. anthracis produces very stable spores when growth conditions become less than optimal. These spores remain viable in the soil for years and can infect domestic and wild animal. Humans can become infected with anthrax accidentally after coming in contact with the spores, by handling products from infected animals, by inhaling anthrax spores from contaminated animal products, and by eating undercooked meat from infected animals. Exposure can also be deliberate by acts of war or bioterrorism.

In any suspected anthrax outbreak (infection of one or more organism in an anthrax free region) it is important to know within a clinically relevant time whether pathogenic B. anthracis is actually present and in which organisms. A rapid molecular identification technique involves extracting DNA and characterizing it after PCR amplification using published B. anthracis specific primers validated for natural and weaponized anthrax and using commercially available extraction systems. The first requirement when establishing such an identification protocol is to determine whether the extracted DNA needs to be treated as a potential biological hazard (e.g., still contained infectious bacteria or spores) or just as a biochemical hazard (e.g., non-infectious DNA that might produce a false positive if reaction mixtures became contaminated).

Methods

Extraction of DNA from clinical samples spiked with B. anthracis

Bacteremia was mimicked by spiking fresh human blood from blood count Vacutainer® (Becton, Dickinson and Company, USA) tubes with bacteria from overnight liquid broth cultures of seven Israeli veterinary bovine isolates of B. anthracis isolated between 1980 and1990, obtained from the Clinical Bacteriology Laboratory, The Kimron Veterinary Institute, Israel, from seven non-B. anthracis, gram-positive clinical bacterial isolates obtained from the Bacteriology Laboratory, Sheba Medical Center, Tel Hashomer, Israel, and from Pasteur and Stern B. anthracis vaccine strains. PCR-quality DNA was prepared using four different procedures: DNA extraction using GeneReleaser (Bio Ventures, Incorporated, Murfreesboro, TN, USA), High Pure DNA Extraction Kits (Roche Diagnostics, Mannheim, Germany), and DNA Easy Tissue Kits (QIAGEN GMBH, Hilden, Germany), or by pre-heating aliquots of spiked blood at 95°C for 15 minutes before adding the PCR reaction mix.

Biosefety of DNA extracts

Aliquots of DNA from each procedure were shaken overnight in broth at 37C to determine whether they still contained any viable B. anthracis.

Molecular identification of B. anthracis genomic and plasmid DNA

The genomic and plasmid primers used in this study for PCR amplification, listed in Table 1, were chosen for the reasons outlined below.

Table 1. PCR primers used to amplify Bacillis anthracis genomic and plasmid DNAs.

Primer name

 Primer sequence

Genomic: vrrA [Ref (8, 9)]

GPR1

5’-CGT AGT TCA CGA ACT GCA TCT-3’

GPR2

5’-ATG ATG TAT CTA ATG CGG CGT-3’

EWA1

5’-TAT ggT Tgg TAT TgC Tg-3’

EWA2

5’-Atg gTT CCg CCT TAT Cg-3’

GPR4

5’-ACA ACT ACC ACC gAT ggC-3’

GPR5

5’-TTA TTT ATC ATA TTA gTT ggA TTC g-3’

Genomic: BA813 [Ref (11, 15, 14)]

Ba813 R1

5’-TTA ATT CAC TTG CAA CTg ATg gg-3’

Ba813 R2

5’-AAC gAT AgC TCC TAC ATT Tgg Ag-3’

Plasmid X01: pag [Ref (11, 15, 14)]

pag67

5’-CAg AAT CAA gTT CCC Agg gg-3’

pag68

5-’TCg gAT AAg CTg CCA CAA gg-3’

Pag23

5’-CTA Cag ggg ATT TAT CTA TTC C-3’

Pag24

5’-ATT gTT ACA TgA TTA TCA gCg g-3’

Plasmid X02: Cap A [Ref (8)]

CapA-F

5’-CAG AAg CAg TAg CAC CAg TAA-3’

CapA-R

5’-ATT TTC ACC AgC ACC CAC-3’

CapA-Fnes

5’-TgA CgA Tgg TTg gTg ACA-3’

CapA-Rnes

5’-CCT TAT TgT ATC TTT AgT TCC C-3’

B. anthracis Genomic DNA

The 1110 nt vrrA template defined by primer pair GPR1 / GPR2 was chosen for the genomic template since it was reported to contain two to six copies of a variable number tandem repeat (VNTR) of 5’caatatcaacaa-3’ and primers recognizing this template had been shown to distinguished B. anthracis from closely related gram positive bacteria such as Bacillus cereus, B. thuringiensis and B. mycoides [8, 9]. A further advantage is that since the copy number is conserved in progeny [9], the VNTR vrrA copy number would provide a partial B. anthracis fingerprint. A full molecular fingerprint of any B. anthracis isolate would require a series of PCR reactions targeting this vrrA template and 5 additional genomic and 2 plasmid VNTR sites [10]. While these additional reactions might help distinguish endemic strains from introduced strains, they are not necessary for rapid primary identification of B. anthracis infections. Two internal primer pairs were chosen. Depending on VNTR copy number, the GPR4 / GPR5 primer pair amplifies a 378 to 426 nt sub-fragment of vrrA, while the EWA1 / EWA2 pair amplifies a 142 to 190 nt sub-fragment within the GPR4 / GPR5 template. The advantage of using the GPR4/GPR5 primer pair stems from the fact that it had been validated for weaponized anthrax in an outbreak in the USSR [8], whereas it is easier to distinguish VNTR copy number by gel electrophoresis with the shorter EWA1 / EWA2 pair. Results were compared with the BA813R1 BA3R2 primer pair that amplified another genomic template BA813.

B. anthracis Plasmid DNA

One genomic template from each plasmid was chosen since pathogenicity required the presence of both plasmids. Specifically, pag and Cap A were chosen to represent the pX01 and pX02 plasmids, respectively, from among published PCR and nested PCR procedures for identifying pag, lef, cyc, and Cap A genes [11–14] since the primers for pag had been validated for many diverse strains including suspected weapon-modified organisms and a large database of sequence information existed for comparative molecular epidemiology of both [13, 7].

Preparation of positive control DNA for PCR

PCR amplification products from genomic DNA, Cap A, and pag from a field isolate of B. anthracis amplified using GPR-F / GPR-R , CAP-R / CAP F, and PAG67 / PAG 68 primer pairs, respectively, were cloned in pGEM-T-easy plasmids (Promega, Madison WI, USA) and transfected into JM109 competent bacteria (Promega, Madison WI, USA) according to manufacturers instructions. Plasmid DNA purified using Wizard Plus SV Minipreps DNA Purification System. (Promega, Madison, WI) and overnight cultures of transfected bacteria served as positive controls for all PCR reactions. The expected sizes were 377–425 nt, 397 nt, and 747 nt, respectively.

PCR Amplification

Two different PCR reactions were chosen, one based on a single tube Ready-to-go PCR bead assay (GE Healthcare Amersham Biosciences, Piscataway, NJ, USA) where all reagents except primers are stored at room temperature and the other using a commercial combination of Taq polymerases, in this study AmpliTaq Gold (Applied Biosystems by Life Technologies, Foster City, CA, USA), and optimized five-fold concentrated Taq reaction buffer chosen from among buffers A to H from a PCR Optimizer Kit (Invitrogen Ltd, Paisley, UK). The optimal buffers for PCR for genomic DNA were buffers E and to a lesser extent B for primer pair EWA1 / EWA2, buffer B for pag primers, and buffers A and B for Cap A primers (12 – 25 pmol of each primer per reaction mix). To simplify and unify procedures, all further amplifications with AmpliTaq Gold were with 5x B buffer (300 mM Tris-HCl, 75 mM ammonium sulfate, and 10 mM magnesium chloride at pH 8.5). The following amplification conditions were used for PCR: Activation at 93°C for 10 min; 60° for 2 min; 72° for 2 min; 35 cycles of 93°C for 45 seconds, 55°C for 45 seconds, and 72°C for 90 seconds; and a final elongation at 72°C for 10 minutes. PCR products were visualized by ethidium bromide staining after gel electrophoresis on 2% agarose gels.

DNA sequencing

The consensus sequences for pag and Cap A amplification products of 701 and 359 nt, respectively, were determined for templates amplified with external primer pairs. PCR products were purified after gel electrophoresis using QIAgen MiniElute PCR product kits (QIAgen GMBH, Hilden, Germany), and sequenced on an automatic ABI sequencer (Applied Biosystems Inc., Foster City, CA) by the Biological Services Department of the Weizmann Institute of Science, Rehovot, Israel. The Cap A, pag and vrrA sequences from two isolates have been deposited in the GenBank (accession numbers HQ536626 to HQ53631.

Results

Biosafety of DNA preparations

Aliquots of DNA were incubated to determine whether the biohazardous mixture of blood and B. anthracis had been converted into a non-viable biochemical by each of four DNA extraction procedures. Aliquots of DNA were incubated overnight in broth. No viable bacteria were recovered from DNA solutions extracted with the QIAgen DNA Easy Tissue Kit when manufacturers’ instructions were followed. In contrast, viable B. anthracis was recovered in overnight cultures of DNA prepared from B. anthracis-spiked blood cultures using GeneReleaser (Bio Ventures, Incorporated , Murfreesboro, TN, USA) and High Pure DNA Extraction Kit (Roche Diagnostics, Mannheim, Germany) according to manufacturers’ recommendations or after incubation at 95°C for 15 minutes. To further reduce the chance for viable bacteria remaining in extracted DNA and to increase DNA yield from gram-positive bacteria, we used the QAIgen DNA Easy Tissue Kit for all further preparations and added a manufacturer-suggested option of a 30-minute pre-digestion with 20 mg/ml lysozyme (Sigma) as a mandatory part of the DNA preparation protocol.

All four DNA preparation procedures yielded PCR quality DNA that was amplifiable by all of the primer sets described in Table 1 in both PCR assays. BA813 genomic primer pairs were able to detect as few as 15 to 40 colony-forming units, whereas vrrA, pag (PAG67/PAG68) and Cap A (EWA1/EWA2) primer pairs required ten-fold more bacteria in both PCR systems. In non-nested single reaction AmpliTaq Gold PCR, internal primer pairs were much better than external pairs when intensities of amplification products were compared. There was a lower threshold of detection when nested PCR was used for both assays, however in the Ready-to-go assay, a single PCR using internal primers gave bands only slightly less intense than those for nested PCR.

PCR of DNA from all blood samples spiked with Israeli field isolates of B. anthracis yielded bands of the expected sizes for vrrA, pag and Cap A for each pair of template specific primers. Those spiked with vaccine strains yielded vrrA and only the appropriate plasmid-encoded genes. Specifically pag template was absent for Pasteur vaccine and Cap A template was absent for Stern vaccine. The consensus sequences for pag, Cap A, and genomic DNA amplification products of 701nt, 348 nt, and 127 nt respectively, from seven Israeli veterinary B. anthracis strains isolated between 1980 and 1990 were determined for templates amplified with external primer pairs for pag and Cap A, and internal primers WA1 and WA2 for genomic DNA. All seven Israeli isolates had identical pag sequences, except for nucleotide 50 that was either a C or a T. All seven isolates had identical Cap A sequences. Finally, there were four perfect repeats of a 5’-CAATATCAACAA-3’ VNTR in the vrrA genomic sequence as determined by electrophoresis of GPR4 / GPR5 PCR products on 2% agarose gels and by sequencing. The four perfect repeats were flanked by imperfect repeat elements 5’- CAATATCAACAg-3’ and 5’-CAATAcCcgCAA-3’ upstream and downstream of the 4 perfect repeats, i.e. the sequence was 5’- CAATATCAACAg CAATATCAACAA CAATATCAACAA CAATATCAACAA CAATATCAACAA CAATAcCcgCAA-3’. Sequences for all three regions from isolates representing the two variants of pag are available from the GenBank nucleotide sequence database HQ536626 to HQ536630.

Discussion

We have described conditions for extraction of DNA for Bacillus anthracis diagnosis that can be performed in level 2 national clinical and veterinary laboratories using easily acquired commercial kits and components that can be easily transported to level 1 hospital or field hospitals in an emergency. All four DNA preparation procedures produced PCR quality DNA from spiked blood samples designed to mimic B. anthracis bacteremia. Both sets of B. anthracis genomic primers amplified the correct template in DNA from all Israeli B. anthracis isolates.

Diagnostic results should be provided in a clinical relevant time within the framework of practical biosafety procedures. Biosafety is always an issue when using a procedure to convert a biohazardous biological into a non-biohazardous biochemical. Preparation of PCR–quality B. anthracis DNA is no exception. Three of the four DNA preparation procedures evaluated left viable B. anthracis in the DNA solution. The addition of a pre-extraction lysozyme digestion step to further insure destruction of viable bacteria adds only 45 to 60 minutes to a PCR diagnostic procedure that can be completed within five and a half hours.

All of the four DNA extraction procedures may be used, provided that appropriate levels of personal protective equipment and environmental protective measures suitable for potential biohazards from viable B. anthracis are used at all times. Equipment must be decontaminated immediately after use and all biological and biochemical material must be disposed under strict isolation and decontamination procedures in less than 24 hours to prevent spore formation by any bacteria that remained viable. DNA solutions may be stored frozen, but unless specifically tested must be considered as biohazardous even when a given procedure has been repeatedly proven safe in the past. This is best illustrated by a recent PubMed notification (X-Promed-Id: 20090331.1226) from March 31, 2009 7: 22: 47 AM IDT, entitled ANTHRAX, LABORATORY EXPOSURE – FRANCE (02) that described exposure from an inadequately heat inactivated sample where “As before, a check loopfull was plated out on sheep agar for each supernatant, but because of the many hundreds of times this had been done before without anything growing [the culture had always been killed], the technician took the 6 vials of heated supernatant out of the Level 3+ lab and went to the Level 2 DNA laboratory before she had read the check plates the next day…” which in this instance were positive. Testing aliquots for viable B. anthracis delays results by a day and precludes moving the assay to level 1 laboratory. When overnight broth cultures are positive, the amplified stock of B. anthracis must be safely disposed.

In conclusion, don’t assume that your DNA extract is free from infectious pathogens; test it routinely to be sure.

Acknowledgement

The Israel Ministries of Health and Agriculture supported this work. Special thanks for the support of the late Dr. Avraham Mates who headed the Israeli Public Health Services Laboratories.

Conflicts of Interest: The authors affirm that there are no conflicts of interest.

References

  1. Mikesell P, BE Ivins, J D Ristroph, and T M Dreier (1983) Evidence for plasmid-mediated toxin production in Bacillus anthracis. Infect Immun 39: 371–6.
  2. Green BD, L Battisti, TM Koehler, CB Thorne and BE Ivins (1985) Demonstration of a capsule plasmid in Bacillus anthracis. Infect Immun 49: 291–7.
  3. Uchida I, T Sekizaki, K Hashimoto, and N Terakado (1985) Association of the encapsulation of Bacillus anthracis with a 60 megadalton plasmid. J Gen Microbiol 131: 363–7.
  4. Vodkin M H and SH Leppla (1983) Cloning of the protective antigen gene of Bacillus anthracis. Cell 34: 693–7.
  5. Robertson DL and SH Leppla (1986) Molecular cloning and expression in Escherichia coli of the lethal factor gene of Bacillus anthracis. Gene 44: 71–8.
  6. Mock M, E Labruyere, P Glaser, A Danchin, and A Ullmann (1988) Cloning and expression of the calmodulin-sensitive Bacillus anthracis adenylate cyclase in Escherichia coli.Gene 64: 277–84.
  7. Makino S, C Sasakawa, I Uchida, N Terakado, and M Yoshikawa (1988) Cloning and CO2-dependent expression of the genetic region for encapsulation from Bacillus anthracis. Mol Microbiol 2: 371–6.
  8. Jackson PJ, ME Hugh-Jones, DM Adair, G Green, KK Hill et al (1998) PCR analysis of tissue samples from the 1979 Sverdlovsk anthrax victims: the presence of multiple Bacillus anthracis strains in different victims. Proc Natl Acad Sci USA 95: 1224–9.
  9. Jackson PJ, EA Walthers, AS Kalif, KL Richmond, DM Adair et al (1997) Characterization of the variable-number tandem repeats in vrrA from different Bacillus anthracis isolates. Appl Environ Microbiol 63: 1400–5.
  10. Keim P, L B Price, AM Klevytska, K L Smith, J M Schupp et al (2000) Multiple-locus variable-number tandem repeat analysis reveals genetic relationships within Bacillus anthracis. J Bacteriol 182: 2928–36.
  11. Fasanella A, S Losito, T Trotta, R. Adone, S Massa et al (2001) Detection of anthrax vaccine virulence factors by polymerase chain reaction. Vaccine 19: 4214–8.
  12. Keim P, A M Klevytska, L B Price, J M Schupp, G Zinser, et al (1999) Molecular diversity in Bacillus anthracis. J Appl Microbiol 87: 215–7.
  13. Price LB, M Hugh-Jones, PJ Jackson, and P Keim (1999) Genetic diversity in the protective antigen gene of Bacillus anthracis. J Bacteriol 181: 2358–62.
  14. Ramisse V, G Patra, H Garrigue, J L Guesdon, and M Mock (1996) Identification and characterization of Bacillus anthracis by multiplex PCR analysis of sequences on plasmids pXO1 and pXO2 and chromosomal DNA. FEMS Microbiol Lett 145: 9–16.
  15. Patra G, P Sylvestre, V Ramisse, J Therasse, and J L Guesdon (1996) Isolation of a specific chromosomic DNA sequence of Bacillus anthracis and its possible use in diagnosis. FEMS Immunol Med Microbiol 15: 223–31.

Usability Testing of the Online Stress Management Intervention (STREAM) for Cancer Patients: Results and Implementations

DOI: 10.31038/CST.2019422

Abstract

Background: Online health interventions are becoming increasingly frequent. However, to prove effective and satisfy the specific needs of cancer patients, the standardized steps of development are crucial. This includes structured usability testing to identify potential usability issues in the patient-specific context early during the development process of a new program.

Methods: Usability of a newly developed online stress management program was prospectively assessed in patients with solid tumors undergoing systemic treatment. In an academic computer-lab facility, each patient was asked to fulfill 16 tasks, which covered key components of the program including website navigation, login-in to secure area, filling-in forms, accessing audio files, and contacting the trial team. Usability problems during these tasks were identified via the think-aloud method and video recording and categorized. General usability was tested with the System Usability Scale (SUS).

Results: A total of 165 tasks from 11 patients were analyzed. Overall usability was high (mean System Usability Scale score 83.6) exceeding the pre-defined cut-off of 70. Participants solved 97% (160/165) of all tasks, the majority (76%) independently. A total of 122 specific usability problems were identified, predominantly concerning website functionality (50.8%) and navigation (29.5%).

Conclusions: Structured usability testing of a novel online intervention in the target population of cancer patients allowed for identification and subsequent correction of a significant number of usability problems. This crucial step allowed for a patient-friendly, self-explanatory online program with enhanced user-specific functionality, navigation and terminology before embarking on the subsequent randomized trial.

Keywords

Cancer, internet-based, online, healthcare, usability, technical implications

Introduction

The use of internet-based health care interventions is growing rapidly enabling certain aspects of mental health care to be delivered to the patient without the need for face-to-face interactions. Internet-based cognitive behavioral therapy for common mental health problems such as anxiety disorders and depression can provide effective, acceptable and practical health care for those who otherwise might remain untreated [1]. Internet interventions can also fill an important gap in cancer care. Cancer patients and their caregivers frequently use the Internet as a source of information [2, 3] and appropriately designed online tools can augment and increase the availability of psychosocial care by making participation convenient, confidential and less stigmatizing [2, 4]. Nevertheless, problems with high dropout rates [5, 6] and low level of engagement have been reported with some internet interventions [7]. The usability of an internet intervention is a key aspect that determines whether it will be used by the patient or not [7]. The few existing guidelines stress the importance of conducting formalized usability testing of internet-based health care interventions in the target population, hereby assessing whether the end user can work with the webpage during specific tasks [2]. Usability is defined as ‘‘the extent to which a product can be used by specified users to achieve specified goals with effectiveness, efficiency, and satisfaction in a specified context of use’ (ISO 9241-11) [8]. In formalized usability testing the observed usability problems are grouped to identify flaws within the system, ultimately leading to design improvements that remove these barriers [9].

Aim of our study

Usability testing was conducted as part of the development process of the web-based stress management program for newly diagnosed cancer patients undergoing treatment “STREAM” (STRess Aktiv Mindern; Active Stress Reduction). The aim was to improve the final website (www.stress-aktiv-mindern.ch) specifically for use by cancer patients in a subsequent randomized trial. Here we describe the usability testing process, and identify key aspects of online intervention tools that are relevant for the development process of other online interventions for cancer patients.

Patients and Methods

Cancer patients (Table 1) who were undergoing systemic anti-cancer treatment at the Medical Oncology outpatient department of the University Hospital Basel were invited to participate in this study. The usability trial was conducted at the computer laboratory of the Center of Human-Computer Interaction of the Department of Psychology at the University of Basel. The Ethics Committee northwest/central Switzerland (EKNZ) approved the study and informed consent was obtained from all participant.

Table 1. Information on socio-demographics, medical history, internet skills and usage

Demographics

Age group <65 years
(N = 5)

Age group ≥ 65 years
(N = 6)

Total (N = 11)

Age

Mean (SD), range

51 (10.4), 37–63

70.5 (3.4), 68–77

61.64 (12.35), 37–77

Gender

Female

2

3

5

Male

3

3

6

Highest educational level

Apprenticeship

2

2

Business Academy

2

3

5

College

3

3

University

1

1

Medical information

Cancer type

Breast Cancer

2

2

4

Prostate Cancer

1

1

Lung Cancer

2

2

Ovarian Cancer

1

1

Colon Cancer

1

1

Glioblastoma

1

1

Hodgkin Lymphoma

1

1

Current treatmenta

Surgery

1

3

4

Radiotherapy

1

1

Chemotherapy

3

4

7

Hormonal treatment

2

2

4

Other

1

2

3

Ongoing side effects

5

5

10

Internet skills

Internet Usage (Years)

Mean (SD), range

15.8 (9.0), 5–35

16.17 (7.37), 8–25

16 (7.71), 5–30

Internet Usage (Frequency)b

Mean (SD), range

3 (0), 3–3

2.67 (.52), 2–3

2.82 (.41), 2–3

a) Patients might undergo more than one treatment
b) 0 = several times per month, 1 = once a week, 2 = several times per week, 3 = daily

Patients first completed a pre-test questionnaire that assessed socio-demographic data, medical history, and computer skills. Patients then executed 16 tasks (for an overview see Table 2) on the website using the ‘think-aloud’ method. This method encourages patients to think aloud while solving a problem, thereby giving observers an insight into the participant’s cognitive processes. A task designed to familiarize patients with the think-aloud method was also included. The 16 tasks covered the most important steps within the public area of the website (including the website overview, registration, and login function) and included a sample module of the secured area of the website that covered website navigation, filling-in forms, use of audio files, and contacting the trial team. Literature suggests that the majority of usability problems and flaws can be identified with as few as eight to ten subjects [9]. Overall usability was assessed with the validated System Usability Scale (SUS) questionnaire [10]. All usability tasks were videotaped and the recordings were used to assess usability. A coding manual for the analyses of behavior and performance was created by consensual expert judgment and later applied by these experts to each participant and task.

Table 2. Overview of usability problems and implications

Overall Usability Problems

Number of problems (N = 122)

100%

Category

Terminology (T)

Navigation (N)

Content (C)

Functionality (F)

Other (O)

11

36

5

62

8

9.0

29.5

4.1

50.8

6.6

Problem description

Number of users affected

Category

Severitya

Implications

Overall

  • Required form fields were not filled out

10 /11

F

I

Mark mandatory form fields using color or asterisks

  • Unclear error messages

6 / 11

T

I

Define terms clearly and use them consequently

  • Text was not read

3 / 11

C/T

II

Reduce text to a minimum and use simple-to-understand language

  • Cursor orientation (e.g. participants started typing while mouse cursor was not yet in a form field)

5 / 11

F/ N

II

Automatically place the cursor in the first form field

Specific for public area

  • Substantial information was overlooked

4 / 11

C

I

Display important information within user’s view, without the need to scroll

  • Label confusion (e.g. “sign up” versus “register”)

7 / 11

T

I

Define terms clearly and use them consistently

Specific for private area

  • Unintentional logouts

6 / 11

F

I

Prevent unintentional logouts

  • No feedback was given upon successful saving processes

4 / 11

F

I

Give feedback to inform the user about the system’s current status

  • System feedback was not noticed

5 / 11

F

I

Place system feedback within users focus of attention

  • Sequentially navigation within module was not intuitive

11 / 11

N

I

Use color to differentiate between visited subsites and not yet visited subsites

  • New interaction possibility (e.g. lightbox) caused disorientation

6 / 11

F

II

Use known and established interaction patterns

  • Mapping between labels and form field unclear

6 / 11

N

II

Place labels visually close to the form field

  • Scale labeling unclear

2 / 11

T

II

Define terms clearly and use them consistently

a Classification of problem severity: (I) Major problems that have a large impact on the user’s interaction and are experienced by many users = Immediate changes needed; (II) Medium problems experienced by only a few users but with a large impact on the user interaction or experienced by many users but with a small impact on the user interaction = Should be changed

Effectiveness was measured by task success and characterized by the degree of help needed (“some help” and “a lot of help”). Problems were categorized in terms of terminology, navigation, content, functionality, and ‘others’. The severity of each specific usability problem was rated by a usability expert based on the impact each problem had on the user [9]. Major problems were defined as those that had a large impact on the user’s interaction such as creating significant delay and frustration or had an impact on a persons’ workflow and were experienced by many users. Medium problems were those experienced by only a few users that had a large impact on the user interaction, or those experienced by many users but with a small impact on the user interaction. Efficacy was assessed by measuring the time-on-task and the time for navigating to the right place for task completion. Self-reported data concerning satisfaction with the STREAM tool were collected using a Likert Scale (1–6) and after every task.

Results

Data from 11 participants (Table 1) who solved 165 tasks (Table 2) were analyzed. Data analyses according to pre-specified age groups (<65/ ≥65 years) did not reveal any significant differences (data not shown).

Overall usability

The mean SUS score was 83.6 indicating that the overall usability of the STREAM web-based stress management program clearly exceeded the pre-defined cut-off for good overall usability of 70 [11].

Effectiveness and efficacy

Participants solved 97% (160/165) of all tasks (Table 2). Thereof, 76% (121) tasks were solved independently, 16% (26) with some help, and 8% (13) with a lot of help. The mean time spent on tasks was 39 minutes 47 seconds (SD: 78: 03; range 26: 13–64: 47 minutes).

Specific usability problems

A total of 122 specific usability problems were identified (Table 2). These predominantly concerned website functionality (50.8%) and navigation (29.5%).

Satisfaction

Participants indicated they were satisfied with the platform with an overall rating of 4.91 (on a scale 1–6). They described the intervention as clear, structured, and professional. Moreover, 73% (8/11) of the participants indicated that they would continue to use the program themselves and all participants stated they would recommend the platform to other cancer patient.

Discussion and implications

Our results show that structured usability testing with the target population is an important step during the standardized development of online health interventions. Our online stress management program STREAM is aimed at cancer patients who are undergoing active treatment. The overall usability of the STREAM website was rated as good and well above the pre-defined cut-off for usability; however, our analysis identified 122 specific usability problems.

A multidisciplinary team consisting of an oncologist, psychologists, human-computer interaction researchers, and software engineering specialists analyzed and subsequently solved these problems. The solutions to these problems were all relatively straightforward. Therefore, the crucial step is to first identify the problems, and this is greatly facilitated by evaluating the usability of the tool by the target patient population. Interestingly, usability in terms of solving tasks independently (effectiveness), the time spent on tasks (efficacy), and user satisfaction did not differ between young (<65 years) and older (≥65 years) patients. The likely explanation for this is that participants in both age groups had a similar frequency and duration of Internet use (Table 1). The specific usability problems identified in this analysis allow some general recommendations: First, it is essential to introduce simple but specific wording and use it consistently throughout the program. Second, users should be able to view the entire page without using the scroll function. To enable this, text should be concise and written in simple to understand language. Third, the intuitive use of a webpage is essential and this will solve the majority of minor usability problems (Table 2). Finally, a close collaboration with the software engineering specialist is extremely important to find good and affordable implementation solutions. A limitation of this study is that the testing was done in the laboratory and may not reflect the use of the program at home. If problems occurred during the use of the online program, participants were able to ask for assistance. Second, the small sample size may also limit the generalizability of our results. However, it is important to note that usability tests are qualitative methods that aim to reveal the most important issues that may arise during a patient’s interaction with a webpage.

In conclusion, our study highlights the importance of conducting a professional usability test with the target population during the development of an online intervention, as recommended by current guidelines [2]. This preparative step allowed for identifying several important but easy to resolve usability problems by integrating the end user (cancer patients) with the development of the STREAM online program. It influenced the development process and enabled us to implement a revised version of this tool prior to launching the randomized controlled trial (clinicaltrials.gov NCT02289014) assessing the efficacy and feasibility [12, 13] of the STREAM tool for newly diagnosed cancer patients.

Authorship

Grossert A: Conceptualization, Data Curation, Formal Analysis, Investigation, Methodology, Validation, Visualization, Writing –Original Draft Preparation, Writing – Review & Editing

Heinz S: Conceptualization, Data Curation, Formal Analysis, Investigation, Methodology, Validation, Visualization, Writing –Original Draft Preparation, Writing – Review & Editing

Müller L: Data Curation, Formal Analysis, Investigation, Writing – Review & Editing

Gaab J: Writing – Review & Editing

Urech C: Writing – Review & Editing, Financial support

Berger Th: Writing – Original Draft Preparation, Writing – Review & Editing

Hess V: Conceptualization, Formal Analysis, Methodology, Validation, Writing – Original Draft Preparation, Writing – Review & Editing, Financial support

Acknowledgements

This study was supported by the Swiss National Science Foundation (PP00P3_139155/1 to VH; PP00P1_144824 to TB) and Swiss Cancer Research (KFS-3260-08-2013). We thank Sebastian Westhues and Laurin Stoll of YooApplications AG Basel for their innovative software solutions. We thank Jamie Ashman of Prism Ideas for language editing of the manuscript. We also thank the patients and their families for participating in this study.

Abbreviations

STREAM   STRess Aktiv Mindern; Active Stress Reduction

EKNZ   Ethics Committee northwest/central Switzerland

SUS   System Usability Scale

Competing interests

The authors declare that they have no conflicts of interest.

Funding Information

The Swiss National Science Foundation (PP00P3_139155/1 to VH; PP00P1_144824 to TB) and Swiss Cancer Research (KFS-3260-08-2013) supported this study.

References

  1. Andrews G, Cuijpers P, Craske MG, McEvoy P et al. (2010) Computer therapy for the anxiety and depressive disorders is effective, acceptable and practical health care: a meta-analysis. PloS one. 5(10): e1319610.1371/journal.pone.0013196. [Crossref]
  2. Leykin Y, Thekdi SM, Shumay DM, Munoz RF et al. (2012) Internet interventions for improving psychological well-being in psycho-oncology: review and recommendations. Psycho-oncology. 21(9): 1016-102510.1002/pon.1993. [Crossref]
  3. van de Poll-Franse LV, van Eenbergen MC. (2008) Internet use by cancer survivors: current use and future wishes. Supportive care in cancer: official journal of the Multinational Association of Supportive Care in Cancer. 16(10): 1189–119510.1007/s00520-008-0419-z. [Crossref]
  4. Owen JE, Klapow JC, Roth DL, Nabell L et al. (2004) Improving the effectiveness of adjuvant psychological treatment for women with breast cancer: the feasibility of providing online support. Psycho-oncology. 13(4): 281–29210.1002/pon.733. [Crossref]
  5. David N, Schlenker P, Prudlo U, Larbig W (2013) Internet-based program for coping with cancer: a randomized controlled trial with hematologic cancer patients. Psycho-oncology. 22(5): 1064-107210.1002/pon.3104. [Crossref]
  6. Carpenter KM, Stoner SA, Schmitz K, McGregor BA et al (2012) An online stress management workbook for breast cancer. Journal of behavioral medicine. 10.1007/s10865-012-9481-6. [Crossref]
  7. Gorlick A, Bantum EO, Owen JE. (2014) Internet-based interventions for cancer-related distress: exploring the experiences of those whose needs are not met. Psycho-oncology. 23(4): 452-45810.1002/pon.3443. [Crossref]
  8. ISO 9241-11, Ergonomic requirements for office work with visual display terminals (VDTs), Part 11: Guidance on usability, vol. 2017. Geneva, Switzerland: International Standardization Organization (ISO); 1998.
  9. Tullis T, Albert B (2013) Measuring the User Experience. Collecting, Analyzing, and Presenting Usability Metrics. Waltham, USA: Morgan Kaufmann;
  10. Kortum PT, Bangor A (2013) Usability Ratings for Everyday Products Measured With the System Usability Scale. International Journal of Human–Computer Interaction. 29(2): 67-7610.1080/10447318.2012.681221.
  11. Measuring Usability with the System Usability Scale (SUS) http: //www.measuringu.com/sus.php. 2017/1/11.
  12. Urech C, Grossert A, Alder J, Scherer S et al. (2018) Web-Based Stress Management for Newly Diagnosed Patients With Cancer (STREAM): A Randomized, Wait-List Controlled Intervention Study. Journal of clinical oncology: official journal of the American Society of Clinical Oncology. 36(8): 780-78810.1200/JCO.2017.74.8491. [Crossref]
  13. Grossert A, Urech C, Alder J, Gaab J et al. (2016) Web-based stress management for newly diagnosed cancer patients (STREAM-1): a randomized, wait-list controlled intervention study. BMC cancer. 16(1): 83810.1186/s12885-016-2866-0. [Crossref]