Author Archives: author

MN Virus

DOI: 10.31038/CST.2019421

My Hypothesis: is the

CST 2019-102 - Raja Tunisia_F1

“The agent na + acts constantly on the circulatory rotation of the neurons, which accentuates the operational deficiency of the cellular rhythm in normal state, the agent ca acts on the bone system and indirectly on the cardiac rhythm. Body Gravity is based on the magnetic field of each neuron. Neurons provide the transmission of a bioelectric signal called nerve impulse. Neurons have two physiological properties: excitability or the ability to respond to stimulations and convert them into nerve impulses, and conductivity, which is the ability to transmit impulses. The source of the body’s energies is the mitochondria, the power plant of the cells. This relativity provokes the law of body weight with respect to the atmospheric deficiency.”

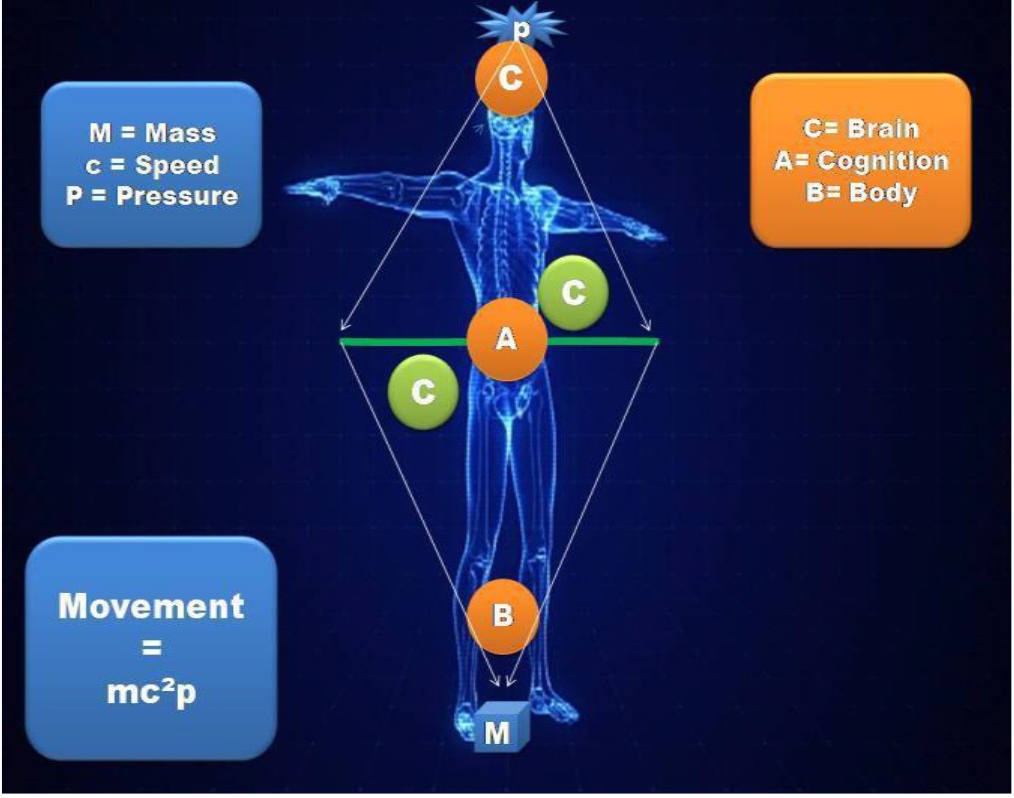
The human body encompasses three functional energies:

1- Energy A CST 2019-102 - Raja Tunisia_F2 Cognition

It is a substantial energy; it acts on the level of the blood circulation by allowing it to renew itself. The component cells circulate at a steady rate at the heart rate and react according to the intensity of the body’s magnetic energy. It is the level crossing of the blood system, it deteriorates the infectious level of blood while proceeding to the multiplication of red and white blood cells, the functional ion of this energy are located at the level of the central axis of the liver. The substantial energy acts at the level of the blood circulation allowing it to renew itself. The component cells circulate at a steady rate at the heart rate and react according to the intensity of the magnetic energy and that in the parallel direction of the sun. This explains that the rejection of toxins at the level of the lymph acts on the protection of the body of any destructive energy.

2- Energy B CST 2019-102 - Raja Tunisia_F2 Body

It is functional and self-defense energy of the body, the rejection of toxins at the level of the lymph acts on the protection of the body from all destructive energy at the moment when the radioactive rays act directly on the vision of the producing cells.

3- Energy C CST 2019-102 - Raja Tunisia_F2 Brain

It is an impulsive energy that allows the elimination of any toxic body accessing the envelopment of neurons that are made of a very thin but very strong connective and protective tissue acting on the lymph. Its texture is formed from chromosomes very rich in proteins and iron, it mainly participates in the constitution of embryonic cells, this element projects rays that act directly on the gray matter fighting in this way any radioactive body or viral foreign For this reason, in the event of failure, a malfunction occurs which in turn causes the elimination of the agent, so a substantial imbalance in the bones appears. This imbalance subsequently affects the spinal cord and causes lesions via atmospheric radioactive waves.

The Relativity

Substantial energy has some cellular fragments of the lymph and it is at this level that the nerve of the senses is located which is the motor of the brain. The root is located at the spine L5 / S1 which is the most important region because it is the center of gravity and is the source of any organic failure. The gray matter is the only essence of the bone mechanism. This liquid contains 1 billion 175,000 active cells, each cell contains a neuron, each neuron comprises the set of: an atom of oxygen + an atom of iron + a volume of magnesium ,each atom is enveloped by a thin wall containing an electric charge this charge represents the life of the body. Impulsive energy propagates very powerful and undetectable rays that act on the gray matter and cause heat that is distributed at the body level and expands as a function of the body’s magnetic field; these rays are propagated by solar energy. It acts on the circulatory rotation of the neurons, which accentuates the operational deficiency of the cellular rhythm in a normal state; the calcium reacts on the bone circuit and indirectly on the cardiac rhythm thing which controls the law of the gravity of the organism compared to atmospheric deficiency. The electrical intensity expands the circuits feeding the gray matter; this pressure causes a force of gravity on the cells composing the tissues and proceeds to the electric charge of the chromosomes that makes a movement: The functional energy.

CST 2019-102 - Raja Tunisia_F3

Pain Syndrome

In case the Body energies’ Relativity fails as soon as the toxins roll up carbon, which weakens the activity of the oxygen agent and leads to an imbalance in the iron rate in the body the pain takes place. It is caused by an atmospheric virus: MN originating from an atmospheric failure and affecting in depth the body metabolism. The cure must be fixed on a Remedy that is placed under an external application that reacts on the lymph and spreads to the Gray matter. Its active effect at the level of the organism will not allow any shaking of the defensive cells at the level of the organism and reacts directly on the gray matter and act on the heart and cell rhythm and goes up to the neurons.

A – The Definition of Pain:

Pain is a feeling of strong pressure that unites discomfort and choking from the outside to the inside with a higher than normal vibration of the energy of the body which causes a cooling or warming of the affected tip.

B – Different types of pain:

  1. Pain is localized or spread = Inflammatory pain.
  2. Pain is transverse = Viral pain.

In Practice

The medical therapy must be based on natural agents. The destruction of the cell itself must be fixed on a remedy that is placed under an external application that reacts on the lymph and spreads to the gray matter. Its active effect at the level of the organism will not allow any shaking of the defensive cells at the level of the organism and reacts directly on the gray matter and its detection will only be positive if the body is really impoverished in iron, the agent act on the heart and cell rhythm and goes up to the radiation of neurons. As a result to my Hypothesis I innovated a product as a gel for external application, its composition is natural, gives tenacity and rebalances the body energies and leaves room for remarkable body immunity.

The proposed treatment is based on natural therapy. Gravity G- is an Energetic treatment product is presented as a cream or gel, for external application; its composition is natural, gives tenacity and rebalances the body energies that leaves place for remarkable body immunity. Gravity G- Gel will be the cure therapy rebalancing. It fights the body energy affects. It acts on several levels.

Example: Used As a Pain treatment: When applied to the affected area of the body to eliminate pain in extreme intensity. And annihilates the perception of the pain or its translation in terms of intensity.

Conclusion

Pain is an infection caused by an external atmospheric virus originating from an atmospheric failure and affecting in depth the body metabolism. Summarizing, relativity leads us to study in an innovative way the human body movement and its coordination with the cognition and brain.

The excess of carbon attributes to an immune weakness at the level of the antibodies and subsequently at the level of the nervous system which becomes compressed by the continuous influx of the arterial pressure, The Main cause of the failure in the Body energies’ relativity Is the MN Atmospheric virus , the components of this viral cell are spheric virus derivative from APOPHIS. Previously known by Asteroid 2004 MN4.

The Impact of Accountable Care Units on Patient Outcomes

DOI: 10.31038/IMROJ.2019414

Abstract

Background: Effective hospital teams can improve outcomes, yet, traditional hospital staffing, leadership, and rounding practices discourage effective teamwork and communication. Under the Accountable Care Unit model, physicians are assigned to units, team members conduct daily structured interdisciplinary bedside rounds, and physicians and nurses are jointly responsible for unit outcomes.

Objectives: To evaluate the impact of ACUs on patient outcomes.

Design: Retrospective, pre-post design with concurrent controls.

Patients: 23,406 patients admitted to ACU and non-ACU medical wards at a large academic medical center between January 1, 2008 and December 31, 2012.

Measures: In-hospital mortality and discharge to hospice, length of stay, 30-day readmission.

Results: Patients admitted to ACUs were less likely to be discharged dead or to hospice (-1.8 percentage point decline [95% CI: -3.3, -0.3; p = .015]) ACUs did not reduce 30 day readmission rates or have a significant effect on length-of-stay.

Conclusions: Results suggest ACUs improved patient outcomes. However, it is difficult to identify the impact of ACUs against a backdrop of low inpatient mortality and the development of a hospice unit during the study period.

Keywords

quality improvement, teamwork, hospital medicine, care standardization

Introduction

Under the traditional model of inpatient staffing, hospitals nurses and allied health professionals are assigned to a unit, while hospital medicine physicians treat patients on multiple units. Care is delivered asynchronously. Physicians see patients when their schedules permit, usually early in the morning or in the late afternoon and update orders at those times. Nurses and other professionals care for patients separately. They may not see the physician during rounds, and their priorities for patient care may be different from those of the physician. In our experience, they often obtain information from second-hand sources or the often difficult-to-decipher notes in patients’ charts.

The traditional, physician-centric model of inpatient care poses significant coordination and incentive problems. Beginning in October 2010, Emory University Hospital re-organized two medical units into Accountable Care Units (ACU® units). In the ACU care model, hospital-based physicians are assigned to a home unit where they can focus on the patients in the unit and work with the same nurse team. By assigning physicians to home units with other unit-based personnel such as nurses and having teams engage in structured interdisciplinary bedside rounds, ACUs enable clinicians to recognize preventable hospital complications and signs of deterioration or diagnostic error that might otherwise have been missed and implement a coordinated response.

Previous publications on the ACU model have been mostly descriptive in nature [1–4]. Using electronic medical records and a pre-post study design with concurrent controls, we retrospectively evaluated the effect of ACUs on patient mortality, length of stay, and readmissions at Emory University Hospital.

Methods

Intervention

Emory University Hospital is a 500 bed teaching hospital in Atlanta, Georgia. Prior to the implementation of ACUs, hospital medicine physicians at Emory University Hospital treated patients in as many as eight units. In the first unit to be organized into an ACU, patients were divided between five physician care teams prior the re-organization. Beginning in October 2010, Emory University Hospital assigned two physician care teams to each of two newly-constituted ACU units. ACUs combine a number of interventions, some of which have been implemented at other hospitals [5–8] , into a single, cohesive bundle.

ACU physician teams were assigned to units and included one hospital medicine attending physician, one internal medicine resident, and three interns. Within an ACU, two teams rotated call schedules over a 24 hour period. The team on-call admitted every patient who arrived at the unit. The same nurse teams continued to staff each unit as before the reorganization.

ACUs standardize communication through a series of brief but highly scripted intra- and inter-professional exchanges to review patients’ conditions and care plans. Each shift change begins with a five minute huddle where the departing staff hands over the unit to the incoming staff. During the huddle, the departing staff alerts the incoming staff to patient- and quality-related issues. After the huddle, nurses hand over individual patients at the bedside using a structured format, highlighting patient-level factors that might indicate patient instability or are outside the expected range. Once a day, each patient’s care team meets for structured interdisciplinary bedside rounds. Structured interdisciplinary bedside rounds bring the bedside nurse, attending physician, and unit-based allied health professionals to the bedside every day with the patient and family members to review the patient’s current condition, response to treatment, care plan, and discharge plan collaboratively [5–8]. Evidence-based actions, such as “bundles” to prevent hospital acquired conditions, are embedded in structured interdisciplinary bedside rounds, and reported on by the patient’s nurse. A scripted, standard communication protocol reduces extraneous communication and focuses the structured interdisciplinary bedside round team’s attention on aspects of patients’ conditions that are responsive to staff attention and effort.

A unit leadership dyad, consisting of a nurse manager and senior physician, set explicit expectations for staff and manage unit process and performance. Physicians operating in the traditional model may be unaware of unit-level quality protocols and outcome measures. As part of the re-organization, a data analyst prepared quarterly unit-level performance reports describing rates of in-hospital mortality, blood stream infections, 30-day readmissions and patient satisfaction scores and length of stay. These reports are used by hospital administrators to set goals for the ACU leadership team and may figure into the performance evaluations of ACU administrators. Readers interested in additional details about the ACU model are urged to consult previous publications [1–4].

Following implementation of ACUs, physician teams assigned to ACUs saw patients on only 1.5 units, with 90% of their patients located in the ACUs, compared to non-ACU physician teams, which cared for patients spread across 6 to 8 units every day.1 The number of patient encounters per day for the ACU physician teams increased from 11.8 in the year before the ACUs (when the teams were not unit based) to 12.9 in the four years following implementation [1]. No changes were made to nurse staffing levels (1 to 4 or 5 nurses per patient).

During the study period, Emory University Hospital created two ACUs, but medical patients were also admitted to seven other units in the hospital. The units that became ACUs were selected because nearly all the patients were under the care of hospital medicine attending physicians so we could designate them as hospital medicine units. In other units, hospital medicine patients were mixed in with patients from other specialties (for example, cardiology). The assignment of patients to ACUs or other medical units was determined by bed control officers based on a mix of criteria that can include bed availability, relative patient wait times, and individual judgement. Bed managers know patients’ names, medical record number, and admitting diagnosis when they assign patients to units. They do not know have access to other prognostic indicators.

Study Sample

The study sample includes patients ages 18 and older admitted to the medical units of Emory University Hospital between January 1, 2008 and December 31, 2013. Following an intent-to-treat framework, we grouped patients who were transferred into ACUs during their hospital stay with non-ACU patients. Patients admitted to surgical, orthopedic, observation, or other specialty units (e.g. medical oncology) were excluded from the analysis, as were patients with cystic fibrosis who are treated only within one of the two ACUs. Patients in the control group were spread across 38 units, though 70% were in just 8 of these units.

Data and Outcome Variables

All study variables are captured in Emory’s internal electronic medical record and administrative data systems. We evaluated the impact of ACUs on in-hospital mortality, discharge to hospice, length of stay, readmission or emergency department visit to Emory University hospital within 30 days, and hospital-acquired urinary tract infection and deep vein thrombosis and pulmonary embolism. We counted a patient as having hospital-acquired urinary tract infection and deep vein thrombosis and pulmonary embolism if their records listed ICD-9 codes for these condition but not if they were among the present-on-admission ICD-9 codes.

Emory University Hospital opened an on-site hospice during the study period in November 2010, potentially reducing the barriers to transferring patients from the hospital to hospice care. While discharge to hospice is in many cases an indication of appropriate care, the opening of the inpatient hospice complicates efforts to measure trends in in-patient mortality. The opening of the unit may be responsible for changes in the site of death for patients admitted to the hospital over time. For this reason, we highlight the impact of ACUs on the combined outcome of in-hospital death or discharge to hospice.

Statistical Analysis

We compared patient characteristics between ACUs and control units using chi-squared tests. We estimated the impact of ACUs on these outcomes using a difference-in-difference study design (equivalently, a pre/post study with a concurrent control group). The pre period was January 1, 2008 to October 31, 2010. The post period was November 1, 2010 to December 31, 2012. We calculated the change in outcomes between the pre and post periods among patients admitted to the units that became ACUs and the change among patients in the control group. The difference of these changes is the difference-in-difference estimator. It assesses changes in outcomes in the units that became ACUs relative to changes in the control group. It assumes that absent any change in policy (i.e., the implementation of ACUs), trends in outcomes among patients admitted to the ACUs would have mirrored trends among patients in the control group. We calculated 95% confidence intervals for unadjusted estimates using z-tests. We used logistic regression with robust standard errors to estimate adjusted effects for in-hospital mortality and hospice discharges and readmissions. We used Poisson regression with robust standard errors to estimate adjusted effects for length of stay. We calculated standard errors and 95% confidence intervals for the difference-in-difference estimator using the Delta method [9].

In multivariable analysis, we adjusted estimates for patient age group, sex, race, primary payer, admission source (hospital or skilled nursing facility versus other), and Elixhauser comorbidities (based on all diagnosis codes) [10] that were present in at least 2.5% of patients in the sample. About one-third of the sample had missing values for admission source. We included each Elixhauser comorbidities as a separate variable in the model rather than collapsing the conditions into a count to avoid imposing unnecessary restrictions on the relationship between conditions and outcomes. Conditions are not mutually exclusive.

Estimates from difference-in-difference models may be biased if there are pre-existing trends in outcomes that differ between ACU and non-ACU units. We tested for pre-existing trends by estimating a model that included, in addition to the variables described above, indicators for the years in the pre-period (2008 to 2010) and these year indicators interacted with treatment group (ACU versus non ACU). We assessed the significance of the year-group interactions and used a likelihood ratio test to compare the model fit with a model that omitted the year-group interactions [11].

Estimates of the impact of ACUs on in-hospital mortality and hospice discharge rates may be biased by differences in length of stay. An intervention that reduces length of stay but does not affect mortality rates will reduce in-hospital mortality rates by shifting the place of death from the hospital to the community. In a sensitivity analysis we assessed the robustness of logistic regression estimates by estimating a Weibull survival model with robust standard errors of the time to hospice discharge or in-hospital death. Records for patients who were not discharged to hospice or dead are censored.

Results

There were 23,403 patients included in the study sample, of whom 10,639 were admitted to the ACU units (including patients admitted to the units before they became ACUs) and 12,764 patients in the control group. There are significant differences in some of the characteristics of ACU and control group patients in the pre and post periods (Table 1), but most differences are qualitatively small. There are some clinically meaningful differences in patients’ diagnoses. For example, in the pre-ACU period, 8.2% of patients in the control group had a solid tumor compared to 6.7% in the ACU group.

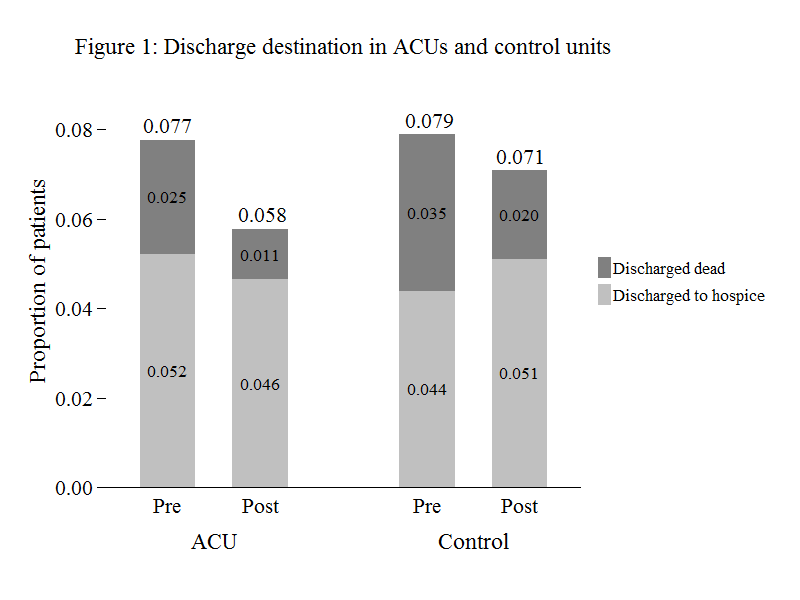
The unadjusted proportion of ACU patients discharged to hospice or dead declined from 7.7% to 5.8% (Figure 1) or -2.0 (95% CI: -2.9, -1.0) percentage points. The unadjusted proportion of patients discharged to hospice and dead both declined. A reduction in in-hospital mortality rates accounted for 70% of the decline (= [2.5–1.1] ÷ 2).

IMROJ 2019-105 - Jason Stein USA_figure1

Figure 1. Discharge destination in ACUs and control units

Table 1. Sample characteristics

  Pre

 Post


All


Control patients

ACU patients

P-value

Control patients

ACU patients

P-value

N (%)

N (%)

N (%)

N

23,403

6,219

5,499

6,545

5,140

Age

<0.001

.043

18–49

6,580

(28.1)

1,721

(27.7)

1,577

(28.7)

1,827

(27.9)

1,455

(28.3)

50–64

5,760

(24.6)

1,459

(23.5)

1,477

(26.9)

1,582

(24.2)

1,242

(24.2)

65–74

3,900

(16.7)

1,000

(16.1)

904

(16.4)

1,089

(16.6)

907

(17.6)

75–84

3,850

(16.5)

1,063

(17.1)

883

(16.1)

1,051

(16.1)

853

(16.6)

85+

3,313

(14.2)

976

(15.7)

658

(12.0)

996

(15.2)

683

(13.3)

White

11,719

(50.1)

3,314

(53.3)

2,796

(50.8)

.008

3,195

(48.8)

2,414

(47.0)

.047

Male

9,939

(42.5)

2,542

(40.9)

2,393

(43.5)

.004

2,746

(42.0)

2,258

(43.9)

.032

Insurance status

.024

.965

Medicare

12,079

(51.6)

3,144

(50.5)

2,728

(49.6)

3,470

(53.0)

2,737

(53.2)

Medicaid

2801

(12.0)

632

(10.2)

642

(11.7)

849

(13.0)

677

(13.2)

Self-pay

1598

(6.8)

416

(6.7)

400

(7.3)

439

(6.7)

343

(6.7)

Private/Other

2504

(10.7)

5,171

(83.1)

4,457

(81.1)

5,257

(80.3)

4,120

(80.2)

Admitted from facility

2504

(10.7)

798

(12.8)

503

(9.1)

<0.001

730

(11.2)

473

(9.2)

0.001

Diagnoses

Congestive heart failure

1,998

(8.5)

438

(7.0)

389

(7.1)

.948

653

(10.0)

518

(10.1)

.857

Pulmonary circulation disorders

1,211

(5.2)

331

(5.3)

252

(4.6)

.066

399

(6.1)

229

(4.5)

<0.001

Hypertension

719

(3.1)

148

(2.4)

179

(3.3)

.004

217

(3.3)

175

(3.4)

.790

Other neurological disorders

2,869

(12.3)

530

(8.5)

631

(11.5)

<0.001

867

(13.2)

841

(16.4)

<0.001

Chronic pulmonary disease

1,205

(5.1)

287

(4.6)

268

(4.9)

.511

352

(5.4)

298

(5.8)

.326

Diabetes

895

(3.8)

188

(3.0)

201

(3.7)

.057

258

(3.9)

248

(4.8)

.020

Renal failure

1,531

(6.5)

234

(3.8)

315

(5.7)

<0.001

473

(7.2)

509

(9.9)

<0.001

Liver disease

796

(3.4)

142

(2.3)

215

(3.9)

<0.001

211

(3.2)

228

(4.4)

.001

Metastatic cancer

694

(3.0)

248

(4.0)

170

(3.1)

.009

152

(2.3)

124

(2.4)

.750

Solid tumor

1,548

(6.6)

512

(8.2)

371

(6.7)

.002

365

(5.6)

300

(5.8)

.547

Fluid and electrolyte disorders

1,814

(7.8)

410

(6.6)

379

(6.9)

.519

506

(7.7)

519

(10.1)

<0.001

Deficiency anemias

672

(2.9)

150

(2.4)

176

(3.2)

.010

179

(2.7)

167

(3.2)

.104

The unadjusted proportion of patients in the control group discharged to hospice or dead declined from 7.9% to 7.1%, or -0.8 (95% CI: -1.7, 0.1) percentage points. A decline in the proportion of patients discharged dead was offset by an increase in the proportion discharged to hospice.

Adjusted estimates of the impact of ACUs are displayed in the last columns of Table 2. (Full regression results are available in the Appendix Table.) The adjusted estimate of the impact of ACUs on the composite outcome of discharged dead or to hospice is -1.8 (95% CI: -3.3, -0.3; p = .015) percentage points. The adjusted difference-in-difference estimate of the impact of ACUs on length of stay is negative but not statistically significant (-0.5 days [95% CI: -1.2, -0.3; p =.21]). The estimates for 30 day readmissions and hospital-acquired urinary tract infections are close to 0. The estimate of the impact of ACUs on the occurrence of pulmonary embolism/deep vein thrombosis was positive and borderline significant (0.6 percentage points [95% CI: -0.05, 1.3] p = .07).

Table 2. Changes in outcomes among ACU and non-ACU patients


Time period


Pre-ACU


Post-ACU


Unadjusted difference

P-value

Adjusted difference

P-value

In-hospital mortality (%)

ACU

2.5

(2.1,

2.9)

1.1

(0.8,

1.4)

-1.4

(-1.9,

-0.9)

Control

3.5

(3.0,

4.0)

2.0

(1.6,

2.3)

-1.5

(-2.1,

-1.0)

Difference

-1.0

(-1.6,

-0.4)

-0.9

(-1.3,

-0.4)

0.1

(-0.6,

0.9)

.765

-0.1

(-0.7,

0.8)

0.88

Hospice discharge (%)

ACU

5.2

(4.6,

5.8)

4.6

(4.1,

5.2)

-0.6

(-1.4,

0.3)

Control

4.4

(3.9,

4.9)

5.1

(4.6,

5.6)

0.7

(0.0,

1.5)

Difference

0.8

(0.1,

1.6)

-0.5

(-1.2,

0.3)

-1.3

(-2.4,

-0.2)

.023

-1.8

(-3.2,

-0.4)

0.013

In-hospital mortality and hospice discharge (%)

ACU

7.7

(7.0,

8.5)

5.8

(5.1,

6.4)

-2.0

(-2.9,

-1.0)

Control

7.9

(7.2,

8.6)

7.1

(6.5,

7.7)

-0.8

(-1.7,

0.1)

Difference

-0.1

(-1.1,

0.8)

-1.3

(-2.2,

-0.4)

-1.2

(-2.5,

0.2)

.083

-1.8

(-3.3,

-0.3)

0.015

Length of stay (days)

ACU

6.5

(6.3,

6.7)

6.4

(6.2,

6.6)

-0.1

(-0.4,

0.2)

Control

5.1

(4.6,

5.7)

5.4

(5.2,

5.5)

0.2

(-0.3,

0.8)

Difference

1.4

(0.8,

2.0)

1.0

(0.8,

1.3)

-0.4

(-1.0,

0.3)

.281

-0.5

(-1.2,

0.3)

0.21

30 day readmissions (%)

ACU

22.2

(21.1,

23.3)

21.0

(19.8,

22.1)

-1.2

(-2.8,

0.3)

Control

22.3

(21.3,

23.4)

20.9

(19.9,

21.9)

-1.4

(-2.9,

0.0)

Difference

-0.1

(-1.7,

1.4)

0.1

(-1.4,

1.5)

0.2

(-1.9,

2.3)

.852

0.3

(-1.8,

2.4)

0.80

Urinary tract infection (%)

ACU

5.2

(4.6,

5.8)

6.6

(6.0,

7.3)

1.4

(0.5,

2.3)

Control

5.5

(4.9,

6.0)

6.7

(6.1,

7.3)

1.3

(0.4,

2.1)

Difference

-0.2

(-1.1,

0.6)

-0.1

(-1.0,

0.8)

0.1

(-1.1,

1.4)

.819

0.01

(-1.2,

1.2)

0.99

Pulmonary embolism/Deep vein thrombosis (%)

ACU

1.8

(1.4,

2.2)

2.0

(1.7,

2.4)

0.2

(-0.3,

0.8)

Control

1.8

(1.5,

2.2)

1.6

(1.3,

1.9)

-0.2

(-0.7,

0.2)

Difference

0.0

(-0.5,

0.4)

0.4

(-0.1,

0.9)

0.5

(-0.2,

1.2)

.167

0.6

(-0.05,

1.3)

0.07

Models that included year-group interactions rejected the hypothesis of pre-existing trends for discharge status and readmissions (see Appendix for details). In the survival model estimating time to in-hospital death or discharge to hospice, the hazard ratio for the interaction of the ACU group indicator and the post period indicator was less than one but did not achieve significance at α = 0.05 threshold (0.80 [95% CI: .63 to 1.00]; p = .052).

Discussion

Results indicate that ACUs reduced the proportion of patients discharged dead or to hospice. Length of stay declined in ACUs relative to control units, but the effect was mostly driven by an increase in length of stay in control units rather than a decrease in ACUs. ACUs did not appear to affect readmission rates. The opening of an inpatient hospice unit coincided with the introduction of ACUs, making it more difficult to identify the discrete impact of ACUs. However, physicians in all units of the hospital could transfer patients to the inpatient hospice unit, and so it should not have differentially affected outcomes in ACU versus non-ACU patients. The proportion of patients discharged to hospice actually declined slightly in the units that implemented ACUs. This pattern may reflect mean-reversion (the hospice discharge rate was higher in ACU units in the pre-period).

Given the low rates of in-hospital mortality in this patient population and hospital-wide efforts to reduce in-hospital mortality, patient discharge status may not be particularly sensitive to the quality of care. The regular rotation of residents and movement of other unit staff through the hospital may have spread some of the features of ACUs and their processes, resulting in hospital-wide improvements in outcomes.

Consistent with our predetermined analysis plan, we evaluated trends in ACU units relative to trends in control units. However, there were baseline differences in mortality rates and length of stay.

ACUs did not reduce the occurrence of hospital-acquired urinary tract infections and pulmonary embolism/deep vein thrombosis, at least as measured from billing records. It is unclear whether these results reflect a failure of ACUs to improve care or whether they reflect “surveillance bias” [12] : ACU teams may be more likely to recognize and diagnose patients with these conditions. The hospital implemented an initiative to more accurately document patients’ conditions during the study period, which may account for the increase in urinary tract infection rates.

Lacking access to information about patient health after discharge, we were unable to determine the impact of being admitted to an ACU on long-term outcomes. Patients discharged too early may experience adverse outcomes. We found that readmission rates were similar between the ACU and control groups, suggesting that patients were not being discharged from ACUs prematurely.

Although we evaluated the impact of ACUs in a single, large academic medical center, there are no elements or features of the ACU model that would prevent it from being expanded to other care settings. ACUs have already been implemented in community hospitals in the US, Canada (see http: //www.rqhealth.ca/department/patient-flow/accountable-care-unit accessed April 19th 2019) and Australia (see http: //www.cec.health.nsw.gov.au/quality-improvement/team-effectiveness/insafehands accessed April 19th 2019).

Most prior studies on teams in inpatient and outpatient settings focus on single specialty teams (e.g. psychiatric care) and teams designed to address a specific quality issue (e.g., hospital acquired infections) [13,14].A recent report on the implementation of an Accountable Care Teams model, which shares many of the features of ACUs, at Indiana University Health Methodist Hospital found that implementation was associated with reductions in length of stay and costs but did not affect readmission rates or patient satisfaction [15].The assignment of hospitalists to units at Northwestern Memorial Hospital improved communication but did not increase physician-nurse agreement on patients’ care plans [16].

High risk industries with excellent safety records have recognized the value of teams to improving outcomes. ACUs, with their emphasis on patient-centered, interprofessional collaboration, were designed to address shortcomings of the traditional model of hospital organization. Our findings suggest that these and other features of the model were associated with reductions in the proportion of patients discharged dead or to hospice but did not affect other outcomes. Unfortunately, we were unable to assess the degree of fidelity of the study units to all features of the ACU model. Futures studies should include estimates of the extent to which units are implementing all four essential components of the model in estimating the effects of the model on distal outcomes.

Funding: Agency for Healthcare Research and Quality, R03 HS 022595-01

Conflicts of Interest: Dr Stein and Dr Chadwick are officers of 1Unit, a company that helps hospitals set up and run Accountable Care Units. Drs Howard, Shapiro, Murphy, and Ms Overton do not have any conflicts of interest.

References

  1. Stein J, Murphy DJ, Payne C et al. (2015) A Remedy for fragmented hospital care. Harvard Business Review-New England Journal of Medicine Online Forum: Leading Healthcare Innovation.
  2. Stein J, Payne C, Methvin A, et al. (2015) Reorganizing a Hospital Ward as an Accountable Care Unit. J Hosp Med 10: 36–40.
  3. Castle B, Shapiro S (2016) Accountable Care Units: A Disruptive Innovation in Acute Care delivery. Nurs Adm Q 40: 14–23.
  4. Shapiro S (2015) Accountable care at Emory Healthcare: Nurse-led interprofessional collaborative practice. VOICE of Nursing Leadership 13: 6–9
  5. Pronovost P, Berenholtz S, Dorman T, et al. (2003) Improving communication in the ICU using daily goals. J Crit Care 18: 71–75.
  6. O’Mahony S, Mazur E, Charney P, et al. (2007) Use of multidisciplinary rounds to simultaneously improve quality outcomes, enhance resident education, and shorten length of stay. J Gen Intern Med 22: 1073–1079.
  7. Cowan M, Shapiro M, Hays R, et al. (2006) The effect of a multidisciplinary hospitalist/physician and advanced practice nurse collaboration on hospital costs. J Nurs Adm 36: 79–85.
  8. Vazirani S, Hays RD, Shapiro MF, et al. (2005) Effect of a multidisciplinary intervention on communication and collaboration among physicians and nurses. Am J Crit Care 14: 71–77
  9. Dowd BE, Greene WH, Norton EC (2014) Computation of Standard Errors. Health Serv Res 49: 731–750.
  10. Elixhauser A, Steiner C, Harris DR, Coffey RM (1998) Comorbidity measures for use with administrative data. Med Care 36: 8–27.
  11. Volpp KG, Small DS, Romano PS (2013) Teaching hospital five-year mortality trends in the wake of duty hour reforms. J Gen Intern Med 28: 1048–1055.
  12. Bilimoria KY, Chung J, Ju MH, et al. (2013) Evaluation of surveillance bias and the validity of the venous thromboembolism quality measure. JAMA 310: 1482–1489.
  13. Bosch M, Faber M, Cruijsberg J, et al. (2009) Effectiveness of patient care teams and the role of clinical expertise and coordination: a literature review. Med Care Res Rev 66: 5S-35S.
  14. Pannick S, Davis R, Ashrafian H, Byrne BE, Beveridge I, et al (2015) Effects of Interdisciplinary Team Care Interventions on General Medical Wards: A Systematic Review. JAMA Intern Med. 175: 1288–98.
  15. Kara A, Johnson C, Nicely A, Neimeier MR, Hui SL (2015) Redesigning inpatient care: Testing the effectiveness of an Accountable Care Team model. Journal of Hospital Medicine 10: 773–779.
  16. O’Leary KJ, Wayne DB, Landler MP, et al. (2009) Impact of localizing physicians to hospital units on nurse-physician communication and agreement on the plan of care. J Gen Intern Med 24: 1223–1227.

LDL and beyond: New emerging LDL biomarkers in lipidology

DOI: 10.31038/JCRM.2019225

Abstract

Lipidology as super-specialty is evolving both in terms of risk prediction but also to uncover the hidden mysteries within humans suffering from atherosclerotic cardiovascular disease (ASCVD) associated complication with apparently similar LDL concentration and particle size. Over decades since LDL discovery in 1950, the science has covered miles to allow us to learn more about the villainous nature of LDL lipoprotein i.e., ApoB, size wise fractions of LDL particles especially the small dense and large buoyant LDL types and oxidized LDLs. However, the recent evidence suggest exploring the morphology of LDLp within plaques suggest the varying concentration of sphingolipids to phosphatidylcholine in LDL-aggregates. This discovery has allowed newer insights into the pathophysiological mechanisms leading to plaque instability and rupture though an accelerated atherosclerotic mechanistic phenomena. This newer development will also allow us to segregate individuals with similar LDL phenotypes in terms of concentration and particle size to end up with ASCVD related complications. This brief communication discusses briefly discusses the recent LDL-plaque relationship and highlights new lipid biomarkers to further allow personalized segregation of cardiovascular disease (CVD) risk.

Key words

LDL-cholesterol (LDLc), small dense LDL-cholesterol (sdLDLc), Large buoyant LDL-cholesterol (lbLDLc), LDL-aggregates, Oxidized LDL, Lipoprotein associated phospholipase A2 (Lp-LPA2), ApoB

1. Introduction

While cholesterol was acknowledged as one of the components being present in the blood from 16th century onwards, it was Oncley et al in 1950 who isolated the beta globulin from fraction-III by means of ultracentrifugation. [1] Since then it was realized that the increasing LDL lipoprotein concentration emerged strongly as a risk for various atherosclerotic cardiovascular diseases (ASCVD) and was thus included as a primary prevention target parameter. [2] Though multiple studies have highlighted LDL lipoprotein concentration as the culprit, but later research further dissected LDL fractions to identify particle size to be more related with ASCVD. [3] Down the line researchers were able to segregate LDL particles between two broad categories including small dense LDL particles (sdLDc) and large buoyant LDL particles (lbLDLc), where the former category is associated with more atherogenicity and ASCVD. [4] Guidelines followed the initial research and quickly adopted the concept of particle size and some labs even marketed the LDL-particle size as of now. [5] The traditional concept of LDL cholesterol concentration measurements is still, however in vogue across the world and evolved from calculation based methods to directly measuring techniques which have improved at least the precision of LDL measurement. [6] Form the point of view developing and under developed economies the strategy still remains the most cost-effective, well-understood in terms of data interpretation and feasibility in terms of instrument availability. While the reliance on conventional lipid profile data currently seem to be the logical option for many set ups across the globe still, there are gaps with this “LDL concentration approach” to predict ASCVD risk. [7] LDL Lipoprotein structure has more to offer, than just the cholesterol content as the origin from VLDL to movement within circulation and with dumping down physiologically through LDL receptors into liver and pathologically into vasculature is highly variable between subjects. [8] Data suggest simple LDL concentration measures does not provide optimal appraisal of ASCVD in many subjects. Ramasamy et al in his very recent publication has clearly highlighted the limitations in lipid measurement technologies to highlight the need to develop biomarkers to better predict cardio vascular disease (CVD) risk. [7] Lawler et al using Nuclear Magnetic Resonance (NMR) Spectroscopy evaluated different fractions of LDL particles and concluded that small LDL particle was associated with CVD risk.[9] Finally literature at least now clearly acknowledges the LDL sub-fractions to be differently linked with ASCVD, and the whole lipoprotein risk evaluation using traditional lipid markers are poorly equated with future CVD prediction. [10]

2. Emerging biomarkers in Lipidology

a. Small dense LDL-cholesterol (sdLDLc)

The initial search comes in through discovery of LDL-fractions where an initial broader categorization was made as to segregate LDL particles into two categories i.e., sdLDLc and large buoyant LDL cholesterol (lbLDLc). sdLDLc in current research has been considered as risk for CVD. [11] However, lbLDLc were not considered atherogenic which clearly challenges the use of LDLc in clinics for identifying ASCVD risk.

b. ApoB measurements

Alongside the protein components within lipoprotein also entered clinical market as ApoA as surrogate for HDLc and ApoB for LDLc. The Insulin Resistance Atherosclerosis Study (IRAS) have graded ApoB measurements to be more predicative than LDLc.[12] However, research shows ApoB not to provide any additional information than conventional LDLc. [13,14]

c. Lipoprotein associated phospholipase A2 (Lp-LPA2)

This enzyme is found mainly in LDLc where it helps contributes to atherosclerosis but confers some anti-atherogenic advantages to HDLc as well. Lp-PLA(2) studies collaboration group have identified a strong association of enzyme activity and mass with various ASCVD adverse outcomes like stroke, heart diseases and hypertension. Similarly, Anderson J et al have demonstrated Lp-LPA2 as an independent risk factor for predicting coronary artery disease (CAD). [16] Though appealing in terms of its role to cleave oxidized phospholipids and acting as a chemo-attractant to bring inflammatory proteins and cells to unstable plaque, still large trials like JUPITER and HPS have not found additional benefit of its utilization for both primary and secondary prevention of ASCVD than conventional LDLc. [17,18] Another issues haunting Lp-PLA(2) is the measurement variability due to assay formats, which stands mandatory before its clinical use in routine. [19] So it seems that Lp-PLA(2) use in clinical arena is bound to face delays or may never be used due to incoming better markers.

d. LDL Particles

Over the last 2 decades LDL particles have been found to have multiple sizes, where the literature has identified varying atherogenic potential for LDL-sub particles. Gourgari et al have identified in a study LDL-particle size to be higher in polycystic ovarian syndrome subjects (PCOS) in comparison to controls which was related with markers of inflammation and insulin resistance. [20] Similarly others have highlighted LDL particles to be more related with ASCVD. [3] However, the contrasting evidence highlighted in the Multi-Ethnic Study of Atherosclerosis(MESA) observed slightly greater benefit by using LDLp/HDLp ratio but identified this risk prediction for coronary heart disease (CHD) to get attenuated after adjustment of standard lipid variables. [21]

e. Oxidized LDL

For some time researchers did thrive on the concept of LDL concentration and particle size, but emerging evidence from kinetic studies identified various post-translational modifications like oxidative changes. [22, 23] These oxidized LDL (oxLDLc) are considered to result in certain “damage associated molecular patterns” (DAMP), which are later to result in vascular inflammation. [22] So oxLDLc within vessel walls can act as new LDL biomarkers; however, no standardized lipid lowering therapy is yet available to prevent this oxidative damage in LDL.[23]

f. LDL-aggregates

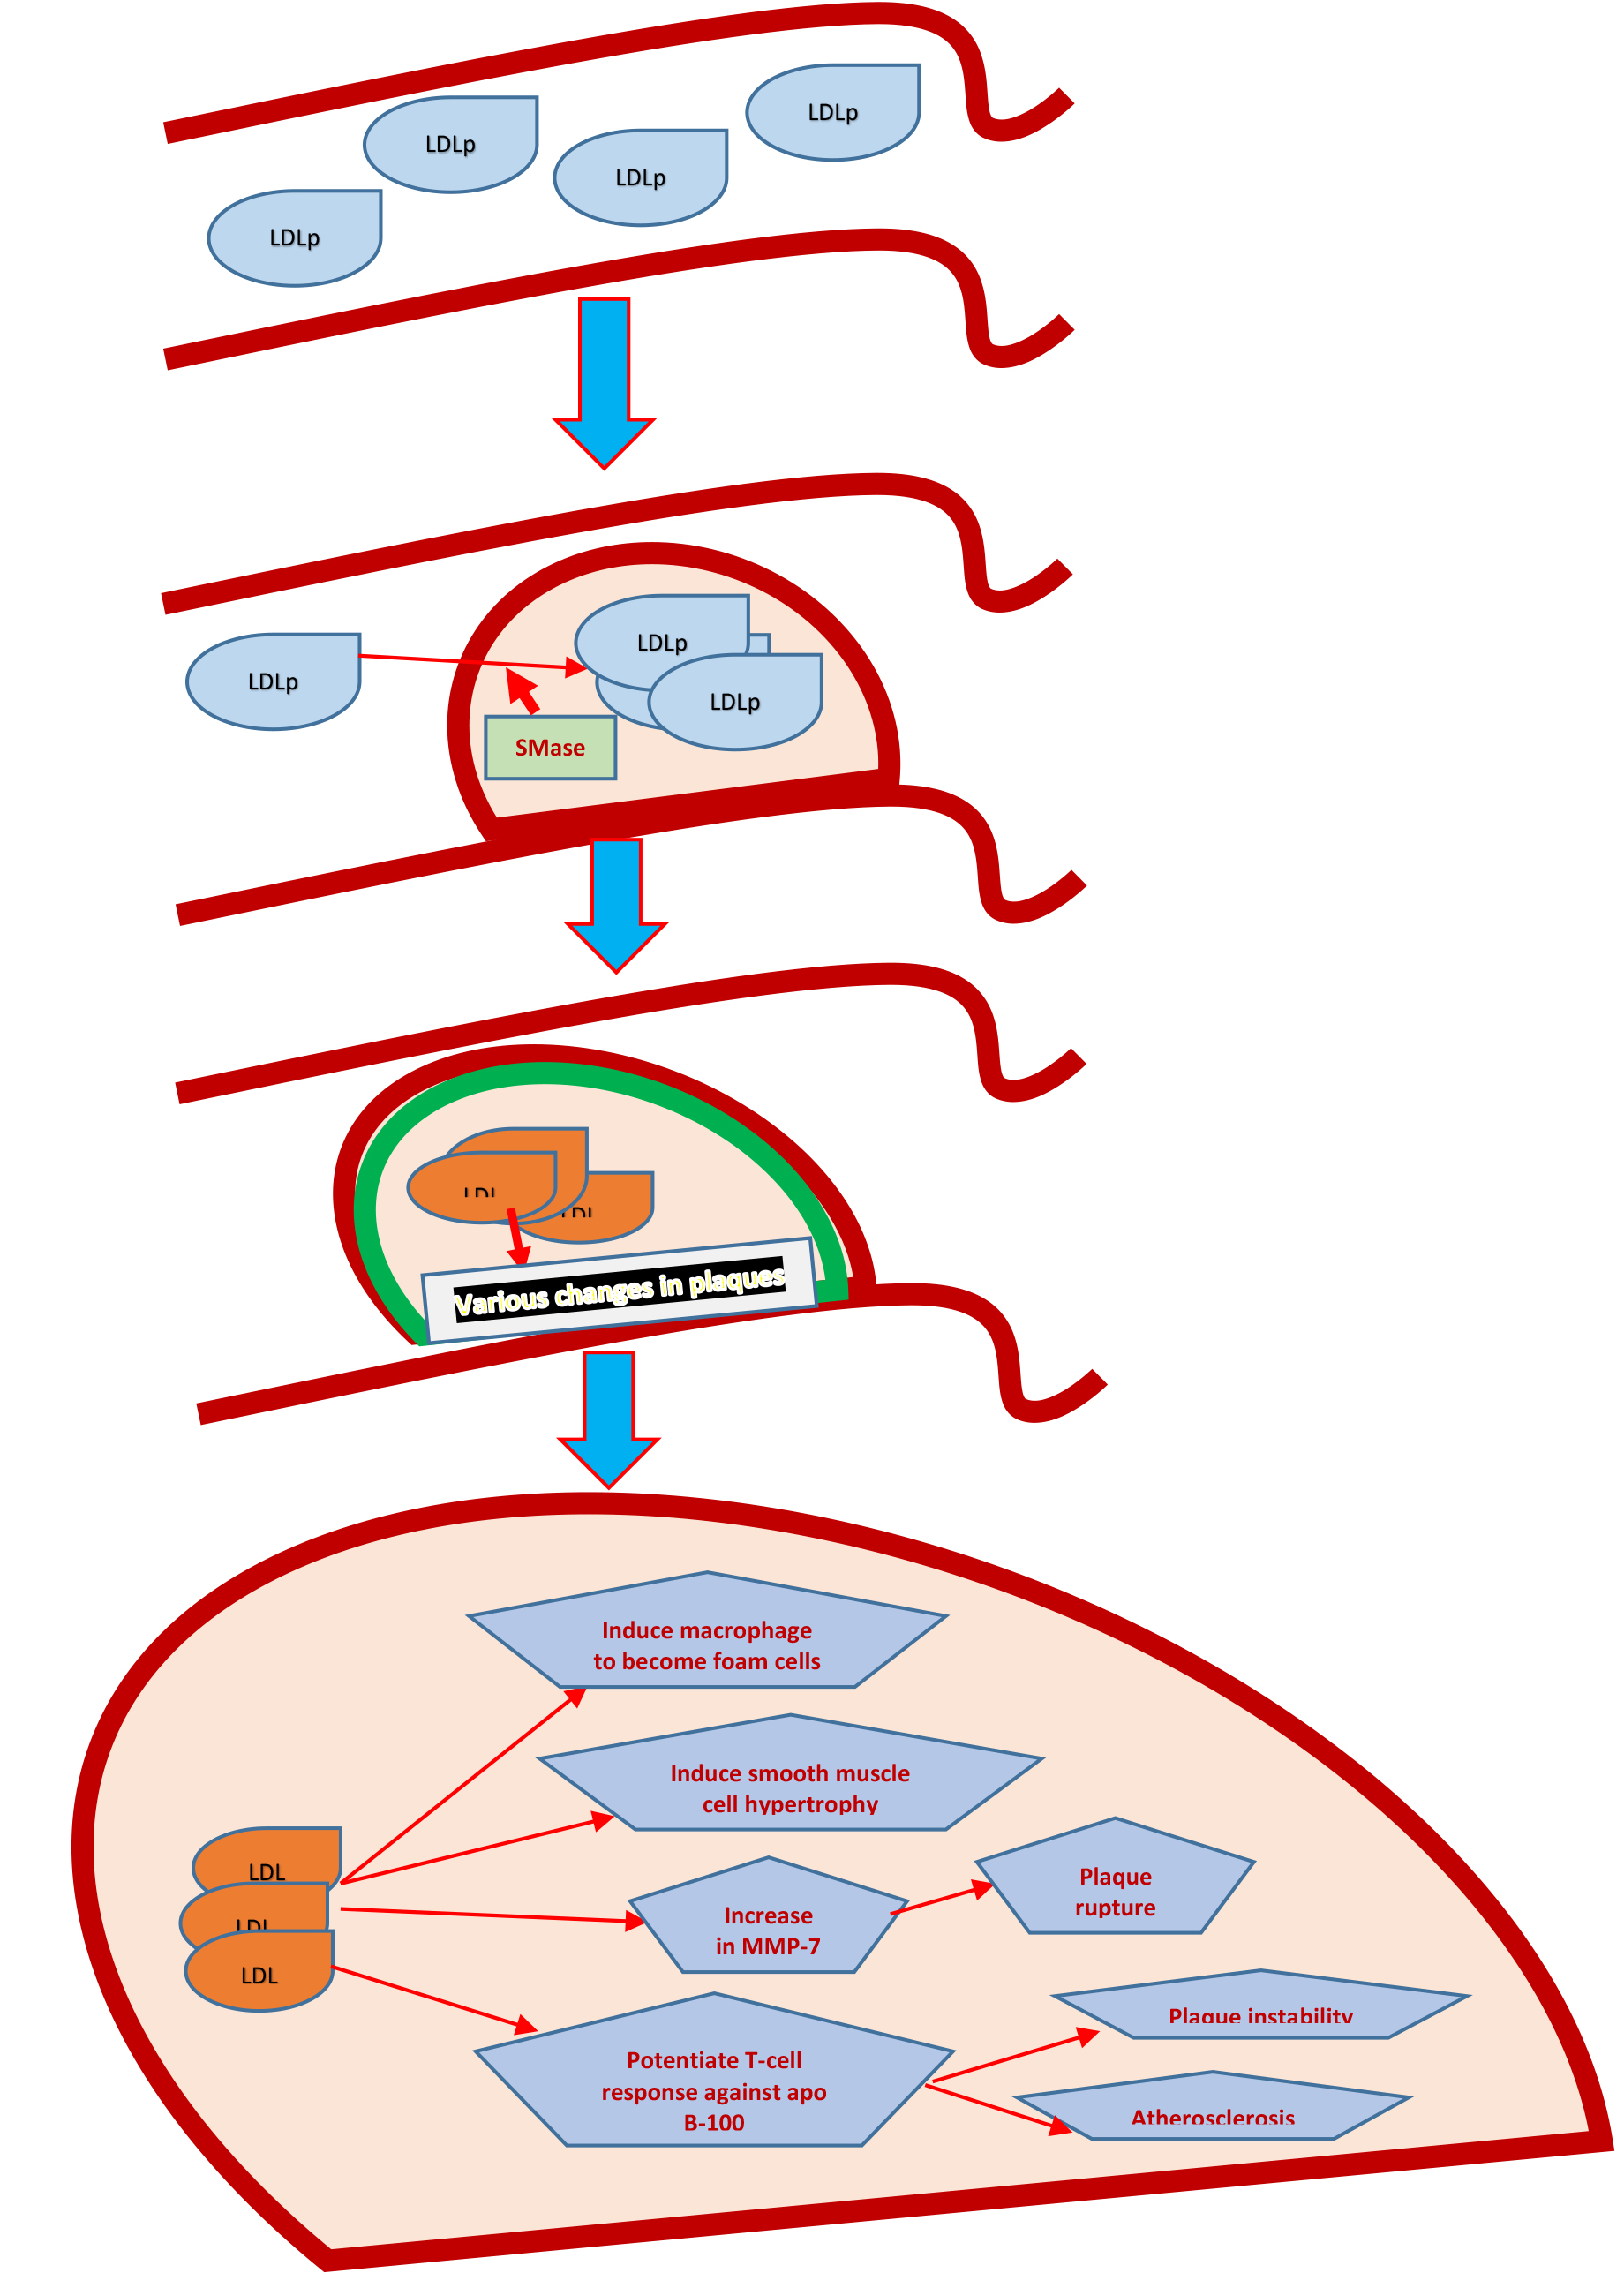
Within vessel wall it has been demonstrated that LDL particles aggregate. [24] These aggregates of LDL particles within arterial walls are quite atherogenic and can cause changes like conversion of macrophages into foam cells and accumulation within smooth muscles to cause accelerated atherosclerosis and plaque formation by the enzyme sphingomyelinase (SMase). [24, 23] LDL-aggregates, though not in correlation with conventional lipid and inflammatory markers but still have been observed to change with lifestyle modifications, use of PCSK9 inhibitors and other treatment modalities. These LDL-aggregates are distinguished by the fact that they have increase sphingolipids to phospatidylcholine ratio, which accelerates the process of atherosclerosis and in turn predispose plaques to rupture.Therefore, LDL-aggregates may emerge as powerful diagnostic and monitoring tool in future. [23–25]

3. Futuristic incorporation in lipid clinic care pathways

While current clinical market poses both economic issues and lack of quality research, still visibility is now here that conventional lipid markers are not able to predict ASCVD in multiple cases and the need is ever appreciated for advance lipid biomarkers to address both personalized medicine and health economics. The below mentioned algorithm is meant for a dedicated lipid clinic where an individualized diagnosis of lipid pathology could be diagnosed to avoid pan-medical trials and to provide specific interventional approached to reduce ASCVD risk for the patients and genetic solutions for the family members.

This data, albeit discussed recently in literature replies to the critical question raised in the clinics that “why ASCVD prevalence did not correspond with LDL concentration and particle size?” Deeper insight intoLDLp interaction within plaque, ratio of sphingolipid / phosphatidylcholine as prevails within LDLp and the activity of sphingomyelinase (SMase) all finally converge towards plaque progression, rupture and thus the acute consequences resulting from the ASCVD. It is anticipated that SMase activity and genetic alterations in LDL aggregation will probably follow these phenotypic changes to clarify the mutations and polymorphisms underlying the varying development of plaques and onward ASCVD risk among individuals.

4. Closing remarks

Incorporation overtime to address one of the crucial villains to cause ASCVD would require additional biomarker arsenal to allow meaningful data to segregate risk prediction among individuals with similarities baseline LDL phenotypes i.e., Aggregation-prone LDLp and Aggregation-resistant LDLp. In this regard advanced lipid clinics can extend help to incorporate LDL particle measurements, phenotyping of LDL classes, functional assays to asses to learn LDL aggregation and oxidized LDL types. Molecular diagnostics can also be added to specifically diagnose the underlying genetic pathology. A one-time assessment can help predict risk for ASCVD related morbidity and mortality along with avoiding people with unnecessary lifelong medication, concerns and as a very powerful primary prevention tool. Perhaps larger tertiary care set ups in country should develop tools and arsenals to perform advanced lipid testing within dedicated lipid clinics to address the multifactorial pathogenesis of ASCVD to address the pushing needs to “personalized medicine”, cost-effective care provision and finally to segregate .patients who need lipid lowering treatment or otherwise.

Consent for publication: Not applicable (No individual data was presented)

Competing interests: The author has no competing interests to declare.

Data funding: There are no funding sources to disclose.

JCRM 2019-108 - SikhindharKhan UK_F1

Figure 1. The process of LDLp entry into carotid intima, to changeswithin the plaque resulting in plaque instability and onward rupture.

JCRM 2019-108 - SikhindharKhan UK_F2

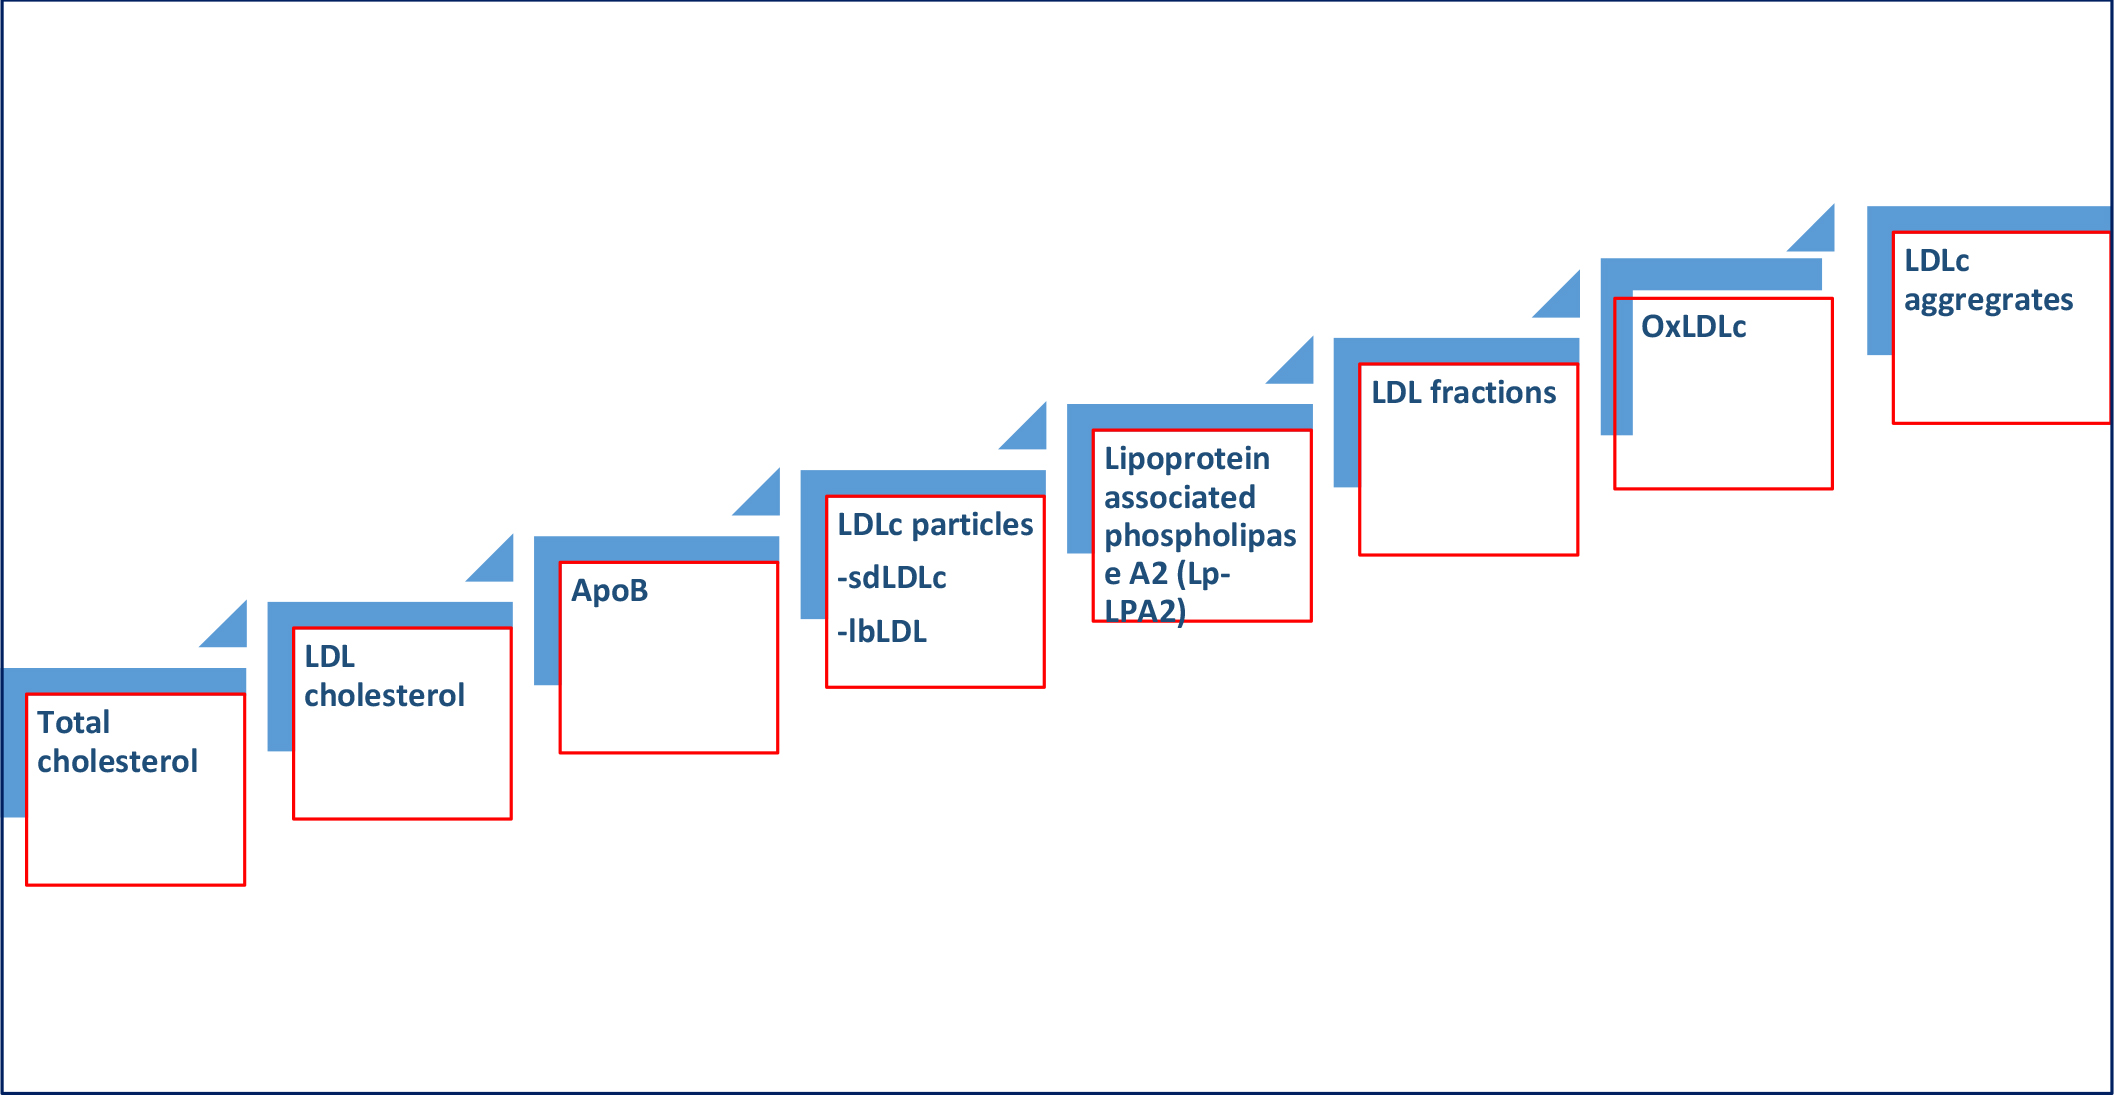
Figure 2. Evolution LDL biomarkers for predicting adverse ASCVD consequences

References

  1. Oncley JL, Gurd FRM, Melin M (1950) Preparation and properties of serum and plasma proteins XXV. Composition and properties of human serum β-lipoprotein. J. Am. Chem. Soc. 68: 458–464.
  2. Piepoli MF, Hoes AW, Agewall S, Albus C, Brotons C, Catapano AL, et al. (2016) ESC Scientific Document Group. 2016 European Guidelines on cardiovascular disease prevention in clinical practice: The Sixth Joint Task Force of the European Society of Cardiology and Other Societies on Cardio vascular Disease Prevention in Clinical Practice (constituted by representatives of 10 societies and by invited experts) Developed with the special contribution of the European Association for Cardiovascular Prevention & Rehabilitation (EACPR). Eur Heart J. 37(29): 2315–2381. doi: 10.1093/eurheartj/ehw106. [Crossref]
  3. Otvos JD, Mora S, Shalaurova I, Greenland P, Mackey RH, Goff DC Jr. (2011) Clinical implications of discordance between low-density lipoprotein cholesterol and particle number. J Clin Lipidol. 5(2): 105–13. doi: 10.1016/j.jacl.2011.02.001. [Crossref]
  4. Srisawasdi P, Vanavanan S, Rochanawutanon M, Kruthkul K, Kotani K, Kroll MH (2015) Small-dense LDL/large-buoyant LDL ratio associates with the metabolic syndrome. Clin Biochem. 48(7–8): 495–502. doi: 10.1016/j.clinbiochem.2015.01.011. [Crossref]
  5. Kulkarni KR (2006) Cholesterol profile measurement by vertical auto profile method. Clin Lab Med. 26(4): 787–802. [Crossref]
  6. Miller WG, Myers GL, Sakurabayashi I, Bachmann LM, Caudill SP, Dziekonski A, et al. (2010) Seven direct methods for measuring HDL and LDL cholesterol compared with ultracentrifugation reference measurement procedures. Clin Chem. 56(6): 977–86. doi: 10.1373/clinchem.2009.142810. [Crossref]
  7. Ramasamy I (2018) Update on the laboratory investigation of dyslipidemias. Clin Chim Acta. 479: 103–125. doi: 10.1016/j.cca.2018.01.015. [Crossref]
  8. Silva IT, Almeida-Pititto Bd, Ferreira SR (2015) Reassessing lipid metabolism and its potentialities in the prediction of cardiovascular risk. Arch Endocrinol Metab. 59(2): 171–80. doi: 10.1590/2359-3997000000031. [Crossref]
  9. Lawler PR, Akinkuolie AO, Chu AY, Shah SH, Kraus WE, Craig D, et al. (2017) Atherogenic Lipoprotein Determinants of Cardiovascular Disease and Residual Risk Among Individuals With Low Low-Density Lipoprotein Cholesterol. J Am Heart Assoc. 6(7). pii: e005549. doi: 10.1161/JAHA.117.005549. [Crossref]
  10. Diffenderfer MR, Schaefer EJ (2014) The composition and metabolism of large and small LDL. Curr Opin Lipidol. 25(3): 221–6. doi: 10.1097/MOL.0000000000000067. [Crossref]
  11. Gerber PA, Nikolic D, Rizzo M (2017) Small dense LDL: an update. Curr Opin Cardiol. 32(4): 454–459. doi: 10.1097/HCO.0000000000000410. [Crossref]
  12. Williams K, Sniderman AD, Sattar N, D’Agostino R Jr, Wagenknecht LE, Haffner SM (2003) Comparison of the associations of apolipoprotein B and low-density lipoprotein cholesterol with other cardiovascular risk factors in the Insulin Resistance Atherosclerosis Study (IRAS). Circulation. 108(19): 2312–6. [Crossref]
  13. Fernández-Friera L, Fuster V, López-Melgar B, Oliva B, García-Ruiz JM, Mendiguren J, et al. (2017) Normal LDL-Cholesterol Levels Are Associated With Subclinical Atherosclerosis in the Absence of Risk Factors. J Am Coll Cardiol. 70(24): 2979–2991. doi: 10.1016/j.jacc.2017.10.024. [Crossref]
  14. Sniderman AD, Robinson JG (2018) ApoB in clinical care: Pro and Con. Atherosclerosis. pii: S0021-9150(18)31456-4. doi: 10.1016/j. atherosclerosis.2018.11.001. [Crossref]
  15. Lp-PLA (2) Studies Collaboration, Thompson A, Gao P, Orfei L, Watson S, Di Angelantonio E, Kaptoge S, et al. (2010) Lipoprotein-associated phospholipase A(2) and risk of coronary disease, stroke, and mortality: collaborative analysis of 32 prospective studies. Lancet. 375(9725): 1536–44. doi: 10.1016/S0140-6736(10)60319-4. [Crossref]
  16. Anderson JL (2008) Lipoprotein-associated phospholipase A2: an independent predictor of coronary artery disease events in primary and secondary prevention. Am J Cardiol. 101(12A): 23F-33F. doi: 10.1016/j.amjcard.2008.04.015. [Crossref]
  17. Ridker PM, MacFadyen JG, Wolfert RL, Koenig W (2012) Relationship of lipoprotein-associated phospholipase A2mass and activity with incident vascular events among primary prevention patients allocated to placebo or to statin therapy: an analysis from the JUPITER trial. Clin Chem 58: 877–86.
  18. Heart Protection Study Collaborative Group. Lipoprotein-associated phospholipase A2 activity and mass in relation to vascular disease and nonvascular mortality. J Intern Med 2010;268: 348–58. [Crossref]
  19. McConnell JP, Jaffe AS (2008) Variability of lipoprotein-associated phospholipase A2 measurements. Clin Chem. 54(5): 932–3. doi: 10.1373/clinchem.2008.103358. [Crossref]
  20. Gourgari E, Lodish M ,Shamburek R, Keil M, Wesley R, Walter M, et al. (2015) Lipoprotein Particles in Adolescents and Young Women With PCOS Provide Insights Into Their Cardiovascular Risk. J Clin Endocrinol Metab. 100(11): 4291–8. doi: 10.1210/jc.2015–2566. [Crossref]
  21. Steffen BT, Guan W, Remaley AT, Paramsothy P, Heckbert SR, McClelland RL, et al. (2015) Use of lipoprotein particle measures for assessing coronary heart disease risk post-American Heart Association/American College of Cardiology guidelines: the Multi-Ethnic Study of Atherosclerosis. Arterioscler Thromb Vasc Biol. 35(2): 448–54. doi: 10.1161/ATVBAHA.114.304349. [Crossref]
  22. Choi SH, Sviridov D, Miller YI (2017) Oxidized cholesteryl esters and inflammation. Biochim Biophys Acta Mol Cell Biol Lipids. 1862(4): 393–397. doi: 10.1016/j.bbalip.2016.06.020. [Crossref]
  23. Laufs U, Weingärtner O (2018) Pathological phenotypes of LDL particles. Eur Heart J. 39(27): 2574–2576. doi: 10.1093/eurheartj/ehy387.
  24. Deevska GM , Sunkara M, Morris AJ, Nikolova-Karakashian MN (2012) Characterization of secretory sphingomyelinase activity, lipoprotein sphingolipid content and LDL aggregation in ldlr-/- mice fed on a high-fat diet. Biosci Rep. 32(5): 479–90. doi: 10.1042/BSR20120036. [Crossref]
  25. Ruuth M, Nguyen SD, Vihervaara T, Hilvo M, Laajala TD, Kondadi PK, et al. (2018) Susceptibility of low-density lipoprotein particles to aggregate depends on particle lipidome, is modifiable, and associates with future cardiovascular deaths. Eur Heart J. 39(27): 2562–2573. doi: 10.1093/eurheartj/ehy319. [Crossref]

Mediastinal Mass in a Brain Tumor Patient Treated with Chemotherapy: Lymphoma after Temozolomide

DOI: 10.31038/JCRM.2019224

Abstract

Patients with brain tumors are frequently treated with combination chemotherapy and radiation therapy. Alkylating agents, such as Temozolomide, have known carcinogenic effects and are associated with secondary malignancies. This case illustrates the FDG PET / CT findings of an astrocytoma patient treated with Temozolomide presenting with an unknown mediastinal mass, with lymphoma being the most likely diagnosis.

Keywords

Temozolomide, brain tumor, astrocytoma, secondary malignancy, Fluorodeoxyglucose (FDG) PET / CT, lymphoma

Case Report

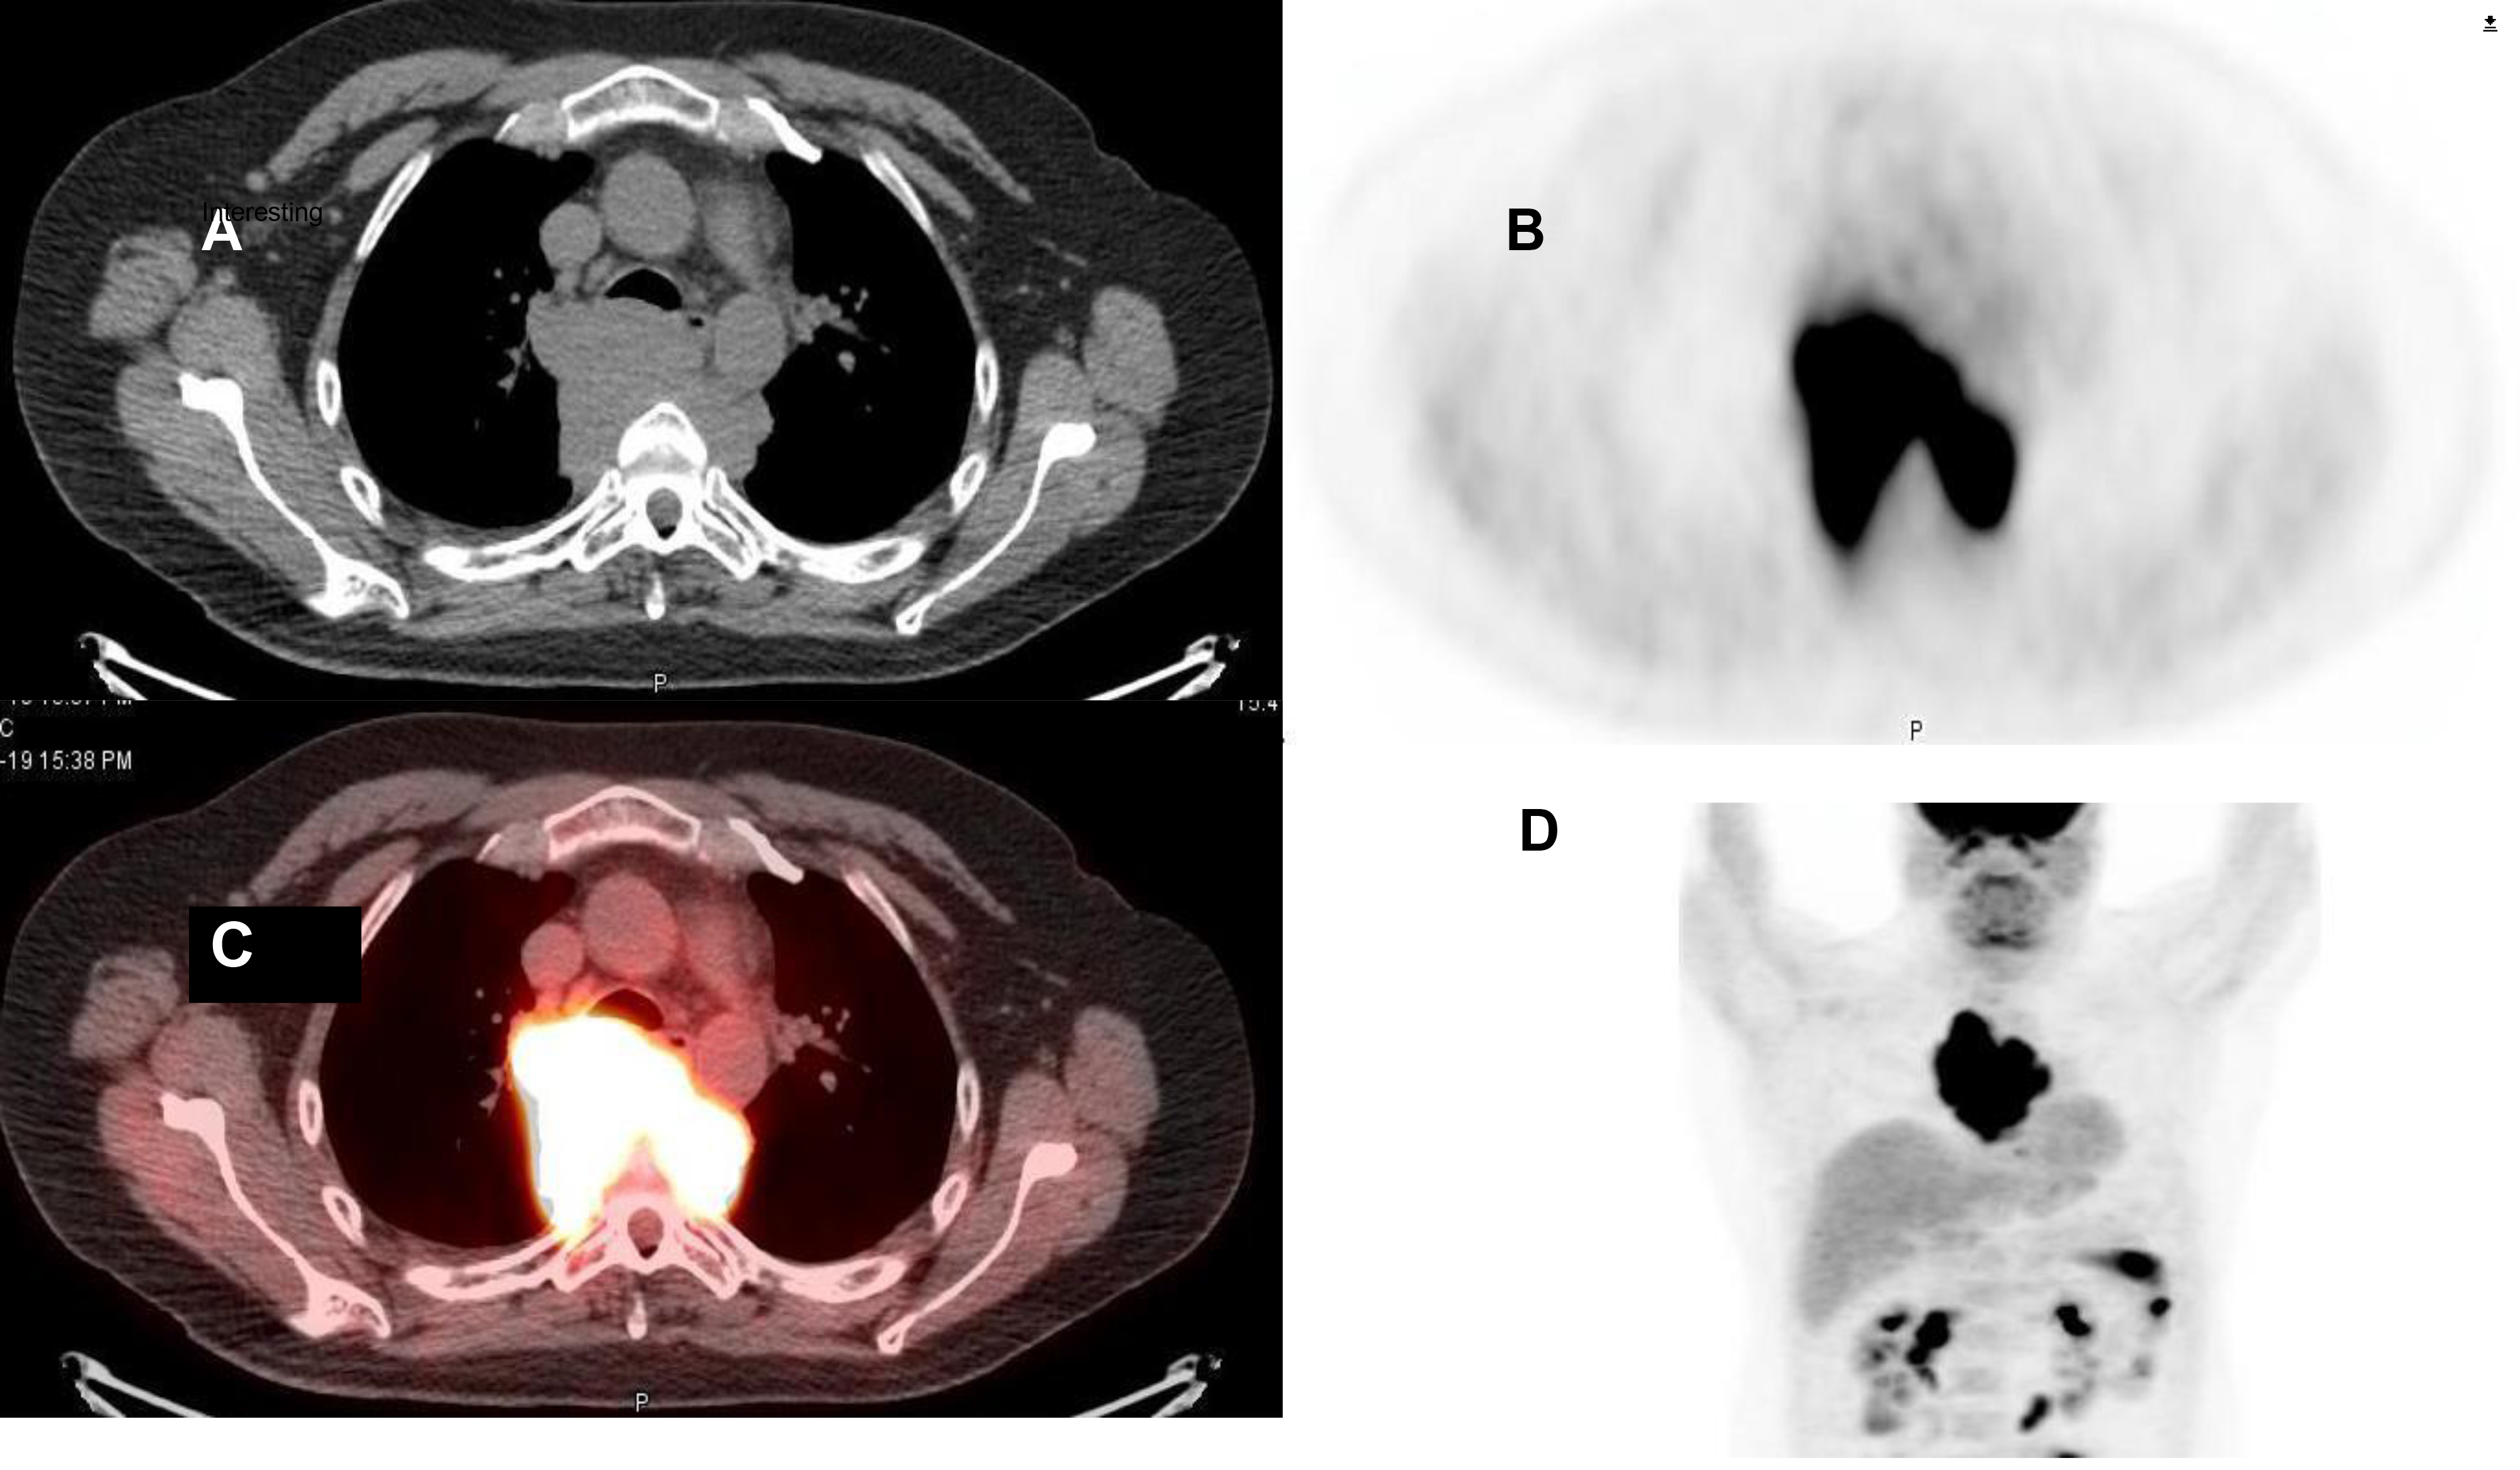
Figure 1. A 41-year-old male with a history of brain tumor and prior chemotherapy presented with numerous symptoms including back pain. He underwent tumor resection resulting in a pathologic diagnosis of transformed astrocytoma and also received Temozolomide therapy (50 mg/m2) over approximately 4 years. Upon presentation, an MRI revealed leptomeningeal spread, and additionally, a posterior mediastinal mass. Subsequently, a PET/CT was obtained following intravenous administration of 14.2 mCi of fluorine-18 fluorodeoxyglucose (18F-FDG). This study demonstrated intense uptake in the mediastinal mass (Figure 1; A-transaxial CT; B- transaxial FDG PET; C-transaxial fused PET / CT; D-maximum intensity projection FDG PET).

JCRM 2019-110 - Austin Dixon USA_F1

Figure 1.

Biopsy confirmed lymphoid malignancy suspicious for Hodgkin’s disease. Brain tumor therapies with radiation and Temozolomide have demonstrated clinical efficacy [1]. The differential diagnosis for a secondary malignancy in patients with brain malignancies treated with Temozolomide includes hematologic malignancies, however, the only solid malignancy previously reported is lymphoma [2–10]. A recent literature review demonstrated 5 reported cases of lymphoma [7]. All of the other 12 patients either had myelodysplasia or aplastic anemia [7].

Metastatic disease from primary brain tumors outside of the nervous system is extremely uncommon occurring in <2% of the cases; this is attributed to physical barriers including the dura mater and the thickened basement membrane of the blood vessels [11]. In the clinical context of a brain tumor previously treated with Temozolomide, and a suspected extracranial malignant tumor by FDG PET / CT, lymphoma is the primary diagnostic consideration.

REFERENCES

  1. Stupp R, Taillibert S, Kanner AA, Kesari S, Steinberg DM, Toms SA, Taylor LP, Lieberman F, Silvani A, Fink KL, Barnett GH, Zhu JJ, Henson JW, Engelhard HH, Chen TC, Tran DD, Sroubek J, Tran ND, Hottinger AF, Landolfi J, Desai R, Caroli M, Kew Y, Honnorat J, Idbaih A, Kirson ED, Weinberg U, Palti Y, Hegi ME, Ram Z. Maintenance therapy with tumor- treating fields plus temozolomide vs temozolomide alone for glioblastoma: A randomized clinical trial. Jama. 2015; 314: 2535–2543
  2. Karremann M, Kramer N, Hoffmann M, Wiese M, Beilken A, Corbacioglu S, Dilloo D, Driever PH, Scheurlen W, Kulozik A, Gielen GH, von Bueren AO, Durken M, Kramm CM. Haematological malignancies following temozolomide treatment for paediatric high- grade glioma. European journal of cancer (Oxford, England : 1990). 2017; 81: 1–8
  3. Goyal S, Singh RR, Balukrishna S, Bindra M, Backianathan S. An early and rare second malignancy in a treated glioblastoma multiforme: Is it radiation or temozolomide? Journal of clinical and diagnostic research : JCDR. 2015; 9: Td05–07
  4. Broes K, Van Ginderachter L, Joosens E, Maes A, Theunissen K, Schepers S, Deben K, Claes J, Mebis J, Cox T. Secondary non-hodgkin lymphoma of the ethmoid sinus after temozolomide. B-ent. 2015; 11: 73–76
  5. Van Ginderachter L, Cox T, Drijkoningen R, Achten R, Joosens E, Maes A, Theunissen K, Mebis J. Non-hodgkin lymphoma after treatment with extended dosing temozolomide and radiotherapy for a glioblastoma: A case report. Case reports in oncology. 2013; 6: 45- 49
  6. Momota H, Narita Y, Miyakita Y, Shibui S. Secondary hematological malignancies associated with temozolomide in patients with glioma. Neuro-oncology. 2013; 15: 1445- 1450
  7. Clark SW, Taylor J, Wang DL, Abramson JS, Batchelor TT. Plasmablastic lymphoma after standard-dose temozolomide for newly diagnosed glioblastoma. Neurology. 2013; 81: 93- 94
  8. Natelson EA, Pyatt D. Temozolomide-induced myelodysplasia. Advances in hematology. 2010; 2010: 760402
  9. Sharma A, Gupta D, Mohanti BK, Thulkar S, Dwary A, Goyal S, Muzumder S, Das P. Non- hodgkin lymphoma following temozolomide. Pediatric blood & cancer. 2009; 53: 661–662
  10. Su Y-W, Chang M-C, Chiang M-F, Hsieh R-K. Treatment-related myelodysplastic syndrome after temozolomide for recurrent high-grade glioma. Journal of Neuro- Oncology. 2005; 71: 315–318
  11. Ray A, Manjila S, Hdeib AM, Radhakrishnan A, Nock CJ, Cohen ML, Sloan AE. Extracranial metastasis of gliobastoma: Three illustrative cases and current review of the molecular pathology and management strategies. Molecular and clinical oncology. 2015; 3: 479–486

Association Between Age and Short-Term Patient Reported Pain Scores After Complex Spinal Fusion for Adult Deformity Correction: Is Perception of Pain Different?

DOI: 10.31038/JCRM.2019223

Abstract

OBJECTIVE: Complex spinal deformities requiring ≥5 fusion levels is challenging, and significantly impacts the quality of life for the patients. Patient reported pain scores are becoming increasingly important as it sheds insight into the patient’s perception of health stat, as well as serving as a proxy of satisfaction for patients with spine deformity undergoing corrective surgery. However, with an aging population, the impact of age on perception of pain before and after undergoing complex deformity correction is understudied. The aim of this study was to evaluate whether there was an association between age and patient-reported pain scores after complex spinal fusions.

METHODS: The medical records of 92 adult (≥18 years old) spine deformity patients undergoing elective, primary complex spinal fusion (≥5 levels) for deformity correction at a major academic institution from 2010 to 2015 were reviewed. Patients were grouped by age: young (<65 years old) and older (≥65 years old). We identified 43 (46.7%) patients ≥65 years old and 49 (53.3%) <65 years old (Elderly: n = 43 vs. Young: n = 49). Patient demographics, comorbidities, intraoperative and postoperative complication rates were collected for each patient. Inpatient patient-reported pain scores and ambulatory status were also collected. The primary outcome of this study was patient-reported pain scores.

RESULTS: Patient demographics and comorbidities were slightly different between both cohorts, with the Elderly cohort having a greater proportion of patients with hypertension, hyperlipidemia, and osteoarthritis, Table 1. The median number of fusion levels operated, length of surgery, estimated blood loss, and complication rates were similar between both cohorts, Table 2. Moreover, the post-operative complication profiles between the cohorts were also similar, except for the Elderly having a higher rate of post-operative delirium (16.3% vs. 0.0%), Table 3. Baseline (p = 0.1885), First-(p = 0.3331) and Last-(p = 0.1990) post-operative patient reported pain scores were similar between cohorts, Table 4. However, the Elderly cohort trended to have a greater reduction of pain from baseline to Last pain score, compared to the Young cohort (Elderly: -2.4 ± 4.1 vs. Young: -0.69 ± 4.5, p = 0.0556), Table 4. While ambulation immediately before discharge was similar in both groups, the Elderly cohort had significantly fewer ambulatory steps on the first post-operative ambulatory day compared to Young cohort (Elderly: 40.2 ± 63.4 vs. Young: 106.0 ± 134.6, p = 0.0042), Table 4.

CONCLUSIONS: Our study suggests that age may have an impact in patient perception of pain and improvement after complex spinal fusions (≥5 levels). Consideration of patients’ age may facilitate tailored pain management and physical therapy regimens in deformity patients undergoing correction surgery.

INTRODUCTION

In the last decade, patient-reported outcomes (PRO) measures have grown to be a significant proxy for overall quality of care [1]. In spine surgery, many hospitals use a variety of PRO metrics as a mean to qualify surgical effectiveness and satisfaction [2,3]. One particular PRO that has been shown to have the greatest influence on patients’ functional status and satisfaction has been pain scores. Pain is the driving factor for most patients to undergo elective deformity correction surgery. In a study by author et al. of xx patients undergoing deformity surgery, demonstrated that 80% of patients presenting to clinic have pain as a driving factor. Complex spine surgery involving 5-levels and greater impact patients significantly, however it has provided tremendous quality of life, functionality and pain reduction. Identifying risk factors that influence perception of pain after deformity correction surgery is necessary to better overall quality of care.

With an aging population, there has been an expansion of patients presenting with adult spine deformity (ASD) [4,5]. Elderly patients undergoing complex spine deformity surgery have unique surgical challenges due to increasing medical comorbidities, fragility and physiological changes associated with age. Similarly, geriatric patients present with a varying perception of pain, functionality and disability. Previous studies have demonstrated mixed associations with age and pain scores, with some demonstrating a negative correlated with age [6,7], greater pain with increasing age[8–10], and even no correlation at all [11–13]. However, previous studies have mostly looked at spinal fusions involving less than 3 levels, with a paucity of data in complex spinal fusion (≥5 levels) patients.

The aim of this study was to evaluate whether there was an association between age and patient-reported pain scores after complex spinal fusions.

METHODS

The medical records of 92 adult (≥18 years old) spine deformity patients undergoing elective, primary complex spinal fusion (≥5 levels) for deformity correction at a major academic institution from 2010 to 2015 were reviewed. Institutional review board approval was obtained prior to study initiation. Inclusion criteria included patients with 1) available demographics and treatment; 2) who underwent an elective, primary complex spinal fusion (≥5 levels) for deformity correction; and 3) who had baseline and post-operative patient reported pain scores. Patients were grouped by age: young (<65 years old) and older (≥65 years old). We identified 43 patients (46.7%) ≥65 years old and 49 patients (53.3%) <65 years old (Elderly: n = 43 vs. Young: n = 49). Patient demographics, comorbidities, intraoperative and postoperative complication rates were collected for each patient. Inpatient patient-reported pain scores and ambulatory status were also collected. The primary outcome of this study was the difference in patient-reported pain scores between elderly and young patients undergoing complex spine deformity surgery.

Baseline characteristics and demographic variables evaluated included patient age, sex, and body mass index (BMI). Comorbidities included depression, anxiety, chronic obstructive pulmonary disease (COPD), diabetes, congestive heart failure (CHF), coronary artery disease (CAD), atrial fibrillation (A-Fib), prior myocardial infarction (MI), hypertension (HTN), hyperlipidemia (HLD), and osteoarthritis. Other preoperative variables collected included alcohol use, smoking status, and home narcotic use.

Intraoperative variables included number of fusion levels, operative time, estimated blood loss (EBL), administration of packed red blood cell (PRBC) or cell-saver transfusions, and whether an osteotomy was performed. Other operative variables assessed included use of somatosensory stimulus evoked potentials (SSEP), transcranial motor evoked potentials (TcMEP), electromyography (EMG), and fluoroscopy. Additionally, whether patients received bone graft and intra-operative drain placement were also collected. Intraoperative complications collected included spinal cord injury, nerve root injury, and incidental durotomy.

Postoperative complications included length of stay in hospital (LOS), ICU transfer rate, delirium, urinary tract infection (UTI), fever, ileus, deep and superficial surgical site infection (SSI), wound dehiscence, draining wounds, pneumonia, hypertension (HTN), hypotension, hematoma, anemia, MI, weakness, sensory deficit, and urinary retention.

Baseline and post-operative inpatient patient-reported pain scores and ambulatory status were also collected. Pain scores were recorded on a scale from 0 to 10 first post-operative day and prior to discharge. Ambulatory status included the number of days from the operating room to ambulation, the number of steps of first ambulatory steps, and the number of steps of last ambulatory steps.

Parametric data were expressed as means ± standard deviation (SD) and compared using the Student’s t-test. Nonparametric data were expressed as median [interquartile range] and compared via the Mann-Whitney U test. Nominal data were compared with the χ2 test. A multivariate nominal logistic regression was used to assess the association between age and patient-reported pain scores. All tests were two-sided and were statistically significant if the p-value was less than 0.05. Statistical analysis was performed using JMP®, Version 13. SAS Institute Inc., Cary, NC, 1989–2007.

RESULTS

Patient Demographics and Preoperative Variables

There were 92 adults (≥18 years old) who met the inclusion criteria of this study (Elderly: n = 43; Young: n = 49), Table 1. Overall, the average age for the Elderly cohort was 71.6 ± 4.7 years and for the Young cohort was 41.4 ± 16.8 years. There were no significant differences in gender or BMI between the cohorts (Elderly: 26.8 ± 4.3 kg/m2 vs. Young: 41.4 ± 16.8 kg/m2, p = 0.7759), Table 1. The prevalence of some comorbidities between the cohorts were similar, including depression (p = 0. 5103), anxiety (0. 7253), COPD (p = 0. 3116), diabetes (p = 0. 3733), CHF (p = 0. 3729), CAD (p = 0. 0656), A-Fib (p = 0. 1253), and prior MI (p = 0. 3116). The Elderly cohort had a higher rate of HTN (Elderly: 72.1% vs. Young: 34.7%, p = 0.0003), HLD (Elderly: 55.8% vs. Young: 24.5%, p = 0.0021), and osteoarthritis (Elderly: 53.5% vs. Young: 16.3%, p = 0.0002) but a lower percentage of alcohol use (Elderly: 41.9% vs. Young: 20.4%, p = 0. 0257). Current smoking (p = 0.4929) and pre-operative narcotic use (p = 0. 2971) did not differ between the cohorts, Table 1.

Table 1. Demographic and Comorbidities

Variables

Elderly
(n = 43)

Young
(n= 49)

P-Value

Female (%)

72.1

65.3

0.4845

Age (Years)

71.6 ± 4.7

41.4 ± 16.8

<0.0001*

BMI (kg/m2)

26.8 ± 4.3

27.2 ± 7.2

0.7759

Depression (%)

30.2

36.7

0.5103

Anxiety (%)

25.6

22.5

0.7253

COPD (%)

9.3

4.1

0.3116

Diabetes (%)

14.0

8.2

0.3733

CHF (%)

2.3

6.1

0.3729

CAD (%)

18.6

6.1

0.0656

A-Fib (%)

9.3

2.0

0.1253

Prior MI (%)

9.3

4.1

0.3116

HTN (%)

72.1

34.7

0.0003*

HLD (%)

55.8

24.5

0.0021*

Osteoarthritis (%)

53.5

16.3

0.0002*

Alcohol Use (%)

41.9

20.4

0.0257*

Current Smoker (%)

11.6

16.7

0.4929

Pre-Op Narcotic Use (%)

54.8

43.8

0.2971

Intraoperative Variable and Complications

The median number of fusion levels (Elderly: 9 [7–10] vs. Young: 9 [7–13], p = 0.2844) and operative time (Elderly: 339.3 ± 147.0 mins vs. Young: 312.7 ± 103.1, p = 0.3232) were similar between cohorts, Table 2. The Young cohort had a higher rate of SSEP (Elderly: 25.0% vs. Young: 46.5%, p = 0.0415) and TcMEP (Elderly: 7.5% vs. Young: 34.9%, p = 0.0025), but the utilization of EMG (p = 0.8070) and fluoroscopy (p = 0.1064) were similar between cohorts, Table 2. The Elderly cohort also had a higher rate of PRBC Transfusions (Elderly: 70.0% vs. Young: 38.8%, p = 0.0030), Table 2. There were no significant differences in the other surgical variables, including intra-operative EBL (Elderly: 1544.8 ± 1265.0 mL vs. Young: 1384.2 ± 1521.1 mL, p = 0.5819), cell-saver transfusions (Elderly: 76.7% vs. Young: 67.4%, p = 0.3179), and the performance of osteotomy (Elderly: 18.6% vs. Young: 14.3%, p = 0.5758) between the cohorts, Table 2. There were also no significant differences in nerve root/spinal cord injuries (p = 0.000) or incidental durotomy (p = 0.5854), Table 2. The proportion of patients receiving bone graft (p = 0.1732) and having a drain placement (p = 0.8986) were also similar between the cohorts, Table 2.

Table 2. Intraoperative Variables and Complications

Variables

Elderly
(n = 43)

Young
(n= 49)

P-Value

Median # of Levels [IQR]

9 [7 – 10]

9 [7 – 13]

0.2844

Osteotomy (%)

18.6

14.3

0.5758

SSEP (%)

25.0

46.5

0.0415*

TcMEP (%)

7.5

34.9

0.0025*

EMG (%)

25.0

22.7

0.8070

Fluoroscopy (%)

50.0

67.4

0.1064

Bone Graft (%)

88.4

95.9

0.1732

Operative Time (mins)

339.3 ± 147.0

312.7 ± 103.1

0.3232

EBL (mL)

1544.8 ± 1265.0

1384.2 ± 1521.1

0.5819

PRBC Transfusions (%)

70.0

38.8

0.0030*

Cell Saver Transfusions (%)

76.7

67.4

0.3179

Drain Placement (%)

88.4

87.5

0.8986

Nerve/Spinal Cord Damage (%)

0.0

0.0

0.000

Durotomy (%)

9.3

6.3

0.5854

SSEP = Sensory Stimulus Evoked Potentials; TcMEP = Transcranial Motor Evoked Potentials;

Postoperative Complications

There were no significant differences in overall LOS between the cohorts (Elderly: 8.3 ± 5.4 days vs. Young: 6.4 ± 3.1 days, p = 0.0525) or ICU transfer (Elderly: 56.1% vs. Young: 50.0%, p = 0.5657), Table 3. Compared to the Elderly group, the Elderly cohort experienced a significantly higher incidence of post-operative delirium (Elderly: 16.3% vs. Young: 0.0%, p = 0.0033) and anemia (Elderly: 58.1% vs. Young: 29.2%, p = 0.0053), Table 3. There were no significant differences in the incidence of other post-operative complications, including UTI (p = 0.1314), fever (p = 0.2102), ileus (p = 0.4929), Deep SSI (0.2437), wound dehiscence (p = 0.5053), draining wounds (p = 0.1349), superficial SSI (p = 0.3476), pneumonia (p = 0.3412), HTN (p = 0.0670), hypotension (p = 0.8379), hematoma (p = 0.9373), MI (p = 0.1308), weakness (p = 0.8084), sensory deficits (p = 0.000), and urinary retention (p = 0.2093), Table 3.

Table 3. Postoperative Complications

Variables

Elderly
(n = 43)

Young
(n= 49)

P-Value

LOS (Days)

8.3 ± 5.4

6.4 ± 3.1

0.0525

ICU Transfer (%)

56.1

50.0

0.5657

Delirium (%)

16.3

0.0

0.0033*

UTI (%)

9.3

2.1

0.1314

Fever (%)

4.9

12.5

0.2102

Ileus (%)

11.6

16.7

0.4929

Deep SSI (%)

7.3

2.1

0.2437

Wound Dehiscence (%)

4.7

2.1

0.5053

Draining Wound (%)

4.7

0.0

0.1349

Superficial SSI (%)

0.0

2.1

0.3476

Pneumonia (%)

0.0

2.1

0.3412

Hypertension (%)

11.6

2.1

0.0670

Hypotension (%)

14.0

12.5

0.8379

Hematoma (%)

2.3

2.1

0.9373

Anemia (%)

58.1

29.2

0.0053*

MI (%)

4.7

0.0

0.1308

Weakness (%)

7.0

8.3

0.8084

Sensory Deficit (%)

0.0

0.0

0.0000

Urinary Retention (%)

2.3

8.3

0.2093

Pre- and Post-Operative Patient Reported Pain Scores and Ambulatory Status

Baseline pain scores (Elderly: 6.0 ± 2.7 vs. Young: 5.1 ± 3.5, p = 0.1885) as well as the first pain score (Elderly: 6.4 ± 3.0 vs. Young: 5.8 ± 2.7, p = 0.3331) and the last pain score (Elderly: 3.5 ± 3.5 vs. Young: 4.4 ± 3.1, p = 0. 1990) were similar between both cohorts, Table 4. There were no significant differences between the change from baseline to first pain score (Elderly: +0.44 ± 3.4 vs. Young: +0.71 ± 3.8, p = 0.7180), but the elderly trended to have a greater reduction of pain (Elderly: -2.4 ± 4.1 vs. Young: -0.69 ± 4.5, p = 0.0556), Table 4. Additionally, there were no significant differences in the number of days from the operating room to ambulation (p = 0.9904) or the number of steps of last ambulatory steps (p = 0.0789), Table 4. However, the Elderly cohort had significantly fewer ambulatory steps on the first post-operative ambulatory day compared to Young cohort (Elderly: 40.2 ± 63.4 vs. Young: 106.0 ± 134.6, p = 0.0042), Table 4.

Table 4. Pre- and Post-Operative Patient Reported Pain Scores and Ambulatory Status

Variables

Elderly
(n = 43)

Young
(n= 49)

P-Value

Pain Scores

Baseline Pain Score

6.0 ± 2.7

5.1 ± 3.5

0.1885

First Pain Score

6.4 ± 3.0

5.8 ± 2.7

0.3331

Last Pain Score

3.5 ± 3.5

4.4 ± 3.1

0.1990

∆Baseline-First Pain Score

+0.44 ± 3.4

+0.71 ± 3.8

0.7180

∆Baseline-Last Pain Score

-2.4 ± 4.1

-0.69 ± 4.5

0.0556

Ambulatory Status

Days from OR to Ambulation (Days)

2.0 ± 1.4

2.0 ± 1.3

0.9904

# of Steps of First Ambulatory Steps (ft)

40.2 ± 63.4

106.0 ± 134.6

0.0042*

# of Steps of Last Ambulatory Steps (ft)

189.1 ± 153.3

271.7 ± 278.1

0.0789

DISCUSSION

In this retrospective study, we show that elderly patients (≥65 years old) had a greater pain reduction compared to younger patients after complex spinal fusions (≥5 levels) for adult deformity correction.

Previous studies have demonstrated associations between age and complications after adult deformity correction surgery. In a retrospective review of 206 patients undergoing spinal fusion for scoliosis correction, Smith et al. found that total perioperative complications were significantly higher in the 65–85 year age range than in 25–44 and 44–85 year age ranges [10]. Similarly, in another retrospective analysis of 46 patients who underwent a thoracic or lumbar arthrodesis (≥5 spinal levels), Daubs et al. demonstrated that patients older than age 69 years had a 9-fold greater likelihood to have a major complication [12]. In another retrospective review of a prospective multicenter study of 480 patients who underwent spinal surgery for deformity correction, Soroceanu et al. demonstrated that older age trended to be a predictor for a higher medical complication rate [14]. Analogous to the aforementioned studies, our study showed that elderly patients had increasing rates of post-operative anemia and incidences of delirium compared to the younger cohort.

Along with complication rates, previous studies have explored the impact age has on PROs after deformity correction surgery. In the Smith et al. study of 206 patients, the authors showed that elderly patients had initial greater disability and greater neck and back pain [10]. In a retrospective study of 55 patients who underwent ≥5 levels of spinal fusion to the sacrum with iliac fixation, Elsamadicy et al. found no significant difference in pain scores between young and elderly cohorts after surgery[13]. Similarly, in the retrospective analysis of 46 patients who underwent a thoracic or lumbar arthrodesis (≥5 spinal levels), Daubs et al. reported that age had no impact on disability (ODI) scores [12]. Our study showed that elderly patients trended to have worse pain scores before spinal fusion, but the surgery brought a greater improvement of pain than the younger cohort by their last day in the hospital. This suggests that elderly people have better patient-reported outcomes and that spinal surgery may be more beneficial for them than the younger cohort.

Previous studies have also looked at the impact of age on long-term patient-reported outcomes collected during follow-up. In a retrospective review of 374 patients who had undergone a 3-column pedicle subtraction osteotomy, Scheer et al. showed that the older patients had greater improvement in 2-year disability and Scoliosis Research Society-22 questionnaire (SRS) total scores [9]. Furthermore, disability scores and leg pain at 2-year follow up were significantly more improved among elderly patients than younger ones [9]. In contrast, in a multicenter prospective study of 56 patients who underwent primary spinal deformity surgery for scoliosis, Birdwell et al. found that age had no effect on rates of improvement in pain in a 2-year follow-up [11]. In a prospective study of 40 patients with posterior reconstruction with an instrumented fusion from the thoracic spine to the sacrum, Crawford et al. demonstrated that the elderly cohort had worse Physical Component Score (PCS) but higher MCS scores at baseline [17]. However, at two-year follow-up, there were no significant differences in any of the scores [17].

In an era of trying to reduce medical costs, a few studies have looked at the impact of age and pain on cost following surgery. In a retrospective analysis of 76 US patients undergoing spinal fusion (≥5 levels) for deformity correction, Yagi et al. reported that direct hospital costs for the initial surgery averaged to $71,638 ± 23,246 and 2-year follow up costs came out to be $44,479 ± 10,943 [18]. In a retrospective study of a prospective, consecutive, multicenter database of 514 patients who underwent surgery for adult spinal deformity, Fischer et al. demonstrated that age greater than 55 years was associated with cost-effectiveness, as measured by cost/QALY [19]. Two important factors that affect cost are pain medication use and hospital length of stay. In a retrospective study of 78 postoperative patients requiring morphine, Macintyre et al. found that the strongest correlator with increased morphine requirement was increasing age [8]. In a prospective longitudinal study of 752 patients who underwent an elective laminectomy and fusion for degenerative lumbar conditions, Sivaganesan et al. found that the average 90-day cost of surgery was $29,295, and the amount of preop and postop opioid use was a significant driver of that cost [20]. Concerning length of stay, in a retrospective study of 55 patients who underwent ≥5 levels of spinal fusion to the sacrum with iliac fixation, Elsamadicy et al. found no difference length of stay between young and elderly cohorts [13]. In contrast, in a prospective cohort study of 411 patients admitted to a New York hospital with a hip fracture, Morrison et al. found that greater pain is associated with longer length of stay and long-term functional impairment, both of which increases costs [21]. Analogously, in the Romano et al. study of 10,416 patients, the authors reported that patients older than 70 years of age were had a 1.8 times longer length of stay those 31–40 years of age [16]. In a retrospective study of 480 patients undergoing surgery for adult spinal deformity, McCarthy et al. found that a 1-year increase in patient age increased index costs by $2,600, and an extra day in the hospital increased index costs by $4,600 [22]. Thus, reducing pain, and therefore pain medication use, and hospital length of stay would help drive down the costs of complex spinal surgery.

This study has limitations with potential implications for study interpretation. Although all variables were recorded pre-, peri-, and postoperatively, they were reviewed retrospectively and, as such, are limited by the weaknesses inherent to retrospective analyses. Furthermore, a relatively small patient sample size from only one academic center was used, making broad conclusions difficult and potentially biasing our results for particular patient population or treatment paradigms. Despite these limitations, this study has demonstrated that an elderly age is associated with a greater reduction in pain after complex spinal fusion (≥5 levels) for deformity correction.

CONCLUSIONS

Our study suggests that age may have an impact in patient perception of pain and improvement after complex spinal fusions (≥5 levels). Consideration of patients’ age may facilitate tailored pain management and physical therapy regimens in deformity patients undergoing correction surgery.

References

  1. McGirt MJ, Parker SL, Asher AL, Norvell D, Sherry N, Devin CJ. (2014) Role of prospective registries in defining the value and effectiveness of spine care. Spine (Phila Pa 1976). 39(22 Suppl 1): S117–128. [Crossref]
  2. Black N. (2013) Patient reported outcome measures could help transform healthcare. BMJ (Clinical research ed). 346: f167. [Crossref]
  3. Yamashita K, Ohzono K, Hiroshima K. (2006) Patient satisfaction as an outcome measure after surgical treatment for lumbar spinal stenosis: testing the validity and discriminative ability in terms of symptoms and functional status. Spine (Phila Pa 1976). 31(22): 2602–2608. [Crossref]
  4. Di Capua J, Lugo-Fagundo N, Somani S, et al. (2018) Diabetes Mellitus as a Risk Factor for Acute Postoperative Complications Following Elective Adult Spinal Deformity Surgery. Global Spine J. 8(6): 615–621. [Crossref]
  5. Cowan JA, Jr., Dimick JB, Wainess R, Upchurch GR, Jr., Chandler WF, La Marca F. (2006) Changes in the utilization of spinal fusion in the United States. Neurosurgery. 59(1): 15–20; discussion 15–20. [Crossref]
  6. De Benedittis S, Lorenzetti A, Migliore M, Spagnoli D, Tiberio F, Villani RM. (1996) Postoperative Pain in Neurosurgery: A Pilot Study in Brain Surgery. Neurosurgery. 38(3): 466–470. [Crossref]
  7. Wallace MS, Wallace AM, Lee J, Dobke MK. (1996) Pain after breast surgery: a survey of 282 women. PAIN®. 66(2): 195–205. [Crossref]
  8. Macintyre PE, Jarvis DA. (1996) Age is the best predictor of postoperative morphine requirements. Pain. 64(2): 357–364. [Crossref]
  9. Scheer J, Lafage V, Smith J, et al. Impact of age on the likelihood of reaching a minimum clinically important difference in 374 three-column spinal osteotomies: Clinical article. Vol 202014. [Crossref]
  10. Smith JS, Shaffrey CI, Glassman SD, et al. (2011) Risk-Benefit Assessment of Surgery for Adult Scoliosis: An Analysis Based on Patient Age. Spine. 36(10): 817–824. [Crossref]
  11. Bridwell KH, Berven S, Glassman S, et al. (2007) Is the SRS-22 Instrument Responsive to Change in Adult Scoliosis Patients Having Primary Spinal Deformity Surgery? Spine. 32(20): 2220–2225. [Crossref]
  12. Daubs MD, Lenke LG, Cheh G, Stobbs G, Bridwell KH. (2007) Adult Spinal Deformity Surgery: Complications and Outcomes in Patients Over Age 60. Spine. 32(20): 2238–2244. [Crossref]
  13. Elsamadicy AA, Adogwa O, Sergesketter A, et al. (2017) Impact of Age on Change in Self-Image 5 Years After Complex Spinal Fusion (≥5 Levels). World neurosurgery. 97: 112–116. [Crossref]
  14. Soroceanu A, Burton DC, Oren JH, et al. (2016) Medical Complications After Adult Spinal Deformity Surgery: Incidence, Risk Factors, and Clinical Impact. Spine (Phila Pa 1976). 41(22): 1718–1723. [Crossref]
  15. Wang MC, Chan L, Maiman DJ, Kreuter W, Deyo RA. (2007) Complications and mortality associated with cervical spine surgery for degenerative disease in the United States. Spine (Phila Pa 1976). 32(3): 342–347. [Crossref]
  16. Romano PS, Campa DR, Rainwater JA. (1997) Elective Cervical Discectomy in California: Postoperative In-Hospital Complications and Their Risk Factors. Spine. 22(22): 2677–2692. [Crossref]
  17. Crawford CH, Carreon LY, Bridwell KH, Glassman SD. (2012) Long fusions to the sacrum in elderly patients with spinal deformity. European Spine Journal. 21(11): 2165–2169. [Crossref]
  18. Yagi M, Ames CP, Keefe M, et al. (2018) A cost-effectiveness comparisons of adult spinal deformity surgery in the United States and Japan. European Spine Journal. 27(3): 678–684. [Crossref]
  19. Fischer CR, Terran J, Lonner B, et al. (2014) Factors Predicting Cost-effectiveness of Adult Spinal Deformity Surgery at 2 Years. Spine Deformity. 2(5): 415–422. [Crossref]
  20. Sivaganesan A, Chotai S, Parker SL, McGirt MJ, Devin CJ. (2018) Drivers of Variability in 90-Day Cost for Elective Laminectomy and Fusion for Lumbar Degenerative Disease. Neurosurgery. [Crossref]
  21. Morrison RS, Magaziner J, McLaughlin MA, et al. (2003) The impact of post-operative pain on outcomes following hip fracture. Pain. 103(3): 303–311. [Crossref]
  22. McCarthy IM, Hostin RA, Ames CP, et al. (2014) Total hospital costs of surgical treatment for adult spinal deformity: an extended follow-up study. The Spine Journal. 14(10): 2326–2333. [Crossref]

EUS in the Management of High-Risk Gastrointestinal Precancerous Lesions before Endoscopic Resection

DOI: 10.31038/JCRM.2019222

Abstract

Aim: To investigate the evaluation of EUS for the high-risk gastrointestinal precancerous lesions (HRGIPCL) before endoscopic resection.

Methods: The patients with HRGIPCL scheduled for endoscopic resection, were randomized to preoperatively performing EUS (Group A) versus without EUS (Group B). Data were prospectively collected as follows: routine endoscopic results, EUS findings, therapeutic maneuvers, resected lesion size, final diagnosis and the grades of therapeutic maneuvers.

Results: 116 patients with 156 HRGIPCL were included in Group A and 116 with 140 HRGIPCL in Group B. In terms of routine endoscopic results, resected lesion size (1.84 ± 1.30cm in Group A vs 1.70 ± 0.97cm in Group B) and final diagnosis, no differences were found between two groups (P >0.05). 207 endoscopic mucosal resection (EMR) was performed for 157 patients (114 EMR for 81 patients in Group A vs 93 for 76 in Group B), 14 endoscopic piecemeal mucosal resection (EPMR) for 14 patients (7 in Group A vs 7 in Group B), and 72 endoscopic submucosa dissection (ESD) for 67 patients (32 ESD for 30 patients in Group A vs 40 for 37 in Group B). No significant differences were observed between two groups (P >0.05). 33 adverse events occurred with significant differences between two groups (11 in Group A vs 22 in Group B, P < 0.05). The grades of therapeutic maneuvers in Group A was higher than that in Group B (P < 0.05).

Conclusion: It was helpful to be evaluated by EUS for HRGIPCL before endoscopic resection.

Key Words

endoscopic ultrasonography; high-risk; gastrointestinal; precancerous lesions; low grade intraepithelial neoplasia; laterally spreading tumor; large gastrointestinal adenoma; endoscopic mucosal resection; endoscopic piecemeal mucosal resection; endoscopic submucosa dissection

INTRODUCTION

We can find the early gastrointestinal cancer and remove it through endoscopy [1–8], Can we nip in the bud, blocking the early cancer at the precancerous stage [9]?

It is a common treatment option to endoscopically find and remove the high-risk gastrointestinal precancerous lesions (HRGIPCL), for example, low grade intraepithelial neoplasia (LGIN), laterally spreading tumor (LST) and large gastrointestinal adenomas. Will endoscopic ultrasonography (EUS) be helpful preoperatively? Because, as we all know, it was usually helpful for the early malignant lesions to be valuated using EUS before endoscopic removal [10–13].

MATERIALS AND METHODS

Patients

From April 2009 to March 2015, the patients with HRGIPCL scheduled for therapeutic endoscopic intervention, were randomized to preoperatively performing EUS (Group A) versus no EUS (Group B). Based on our clinical experiences and the relevant literatures [9,14–16], we classified the following lesions as HRGIPCL: LGIN, LST (>1.0 cm), sessile or rebagliati polyps (limited to tubular, tubulovillous and villous adenomas, >1.0 cm). All the lesions had undergone routine endoscopy, biopsy and histopathological examination, and the malignant ones including high grade intraepithelial neoplasia (HGIN) had been excluded from the study. This study got the approval from Weihai Municipal Hospital Ethics Committee. After each patient signed an informed consent, each endoscopic exploration began.

Procedures

All the endoscopic procedures were carried out by four endoscopists, assisted by three nurses. EUS was performed with a radial echoendoscope (Olympus GF-UM2000, Olympus Medical Systems Corp, Tokyo, Japan). Therapeutic endoscopic intervention were done using gastroscopy, colonoscopy, snare, single use electrosurgical knife [including IT Knife 2 (KD-611L), Hook Knife (KD-620LR), Dual Knife (KD-650L) and Triangle Tip Knife (KD-640L), Olympus Medical Systems Corp, Tokyo, Japan)], or Hybrid Knife (ERBE Elektromedizin GmbH, Tuebingen, Germany). ERBE VIO 200D (ERBE Elektromedizin GmbH, Tuebingen, Germany), was used as Electrosurgical Generator.

All the endoscopic explorations were conducted under intravenous anesthesia administered by two anesthesiologists: intravenous fentanyl and midazolam followed by propofol.

Data were prospectively collected as follows: age, sex, routine endoscopic results, EUS findings, therapeutic maneuvers, resected lesion size, final diagnosis, the grades of therapeutic maneuvers, and endoscopic complications.

Statistical analysis

Quantitative variables were described as mean ± standard deviation. Kolgomorov-Smirnoff test was used to verify the normal distribution of quantitative data, and T-test was used for testing significance between quantitative variables. Chi-square test was used to detect significant difference among qualitative variables. The P-value under 0.05 was considered significant.

RESULTS

General information

116 patients were included in Group A and 116 in Group B. In terms of age, sex and preoperatively routine endoscopic results, no differences were found between two groups (P >0.05). The above data were shown in Table 1.

Table 1. General information

Group A

Group B

P-value

Total

116

116

Gender

0.130

Men

70

81

Women

46

35

Mean age (years)

61.66 ± 10.10

59.08 ± 10.91

0.062

Indication

(Number of patients/ lesions)

116/156

116/140

0.537

Location of lesion

0.523a/0.233b

Esophagus

0/0

1/1

Stomach

23/25

24/27

Duodenum

0/0

2/2

Large intestine

93/131

89/110

Pattern of Lesion

0.299a /0.517 b

LST

37/42

32/36

Sessile

74/100

81/96

Rebagliati

13/14

7/8

Preoperative pathology of Lesion

0.097a /0.068 b

LGIN

34/38

40/41

Tubular adenomas

47/67

59/70

Tubulovillous adenomas

40/50

27/29

Villous adenomas

1/1

0/0

LST: laterally spreading tumor; LGIN: low grade intraepithelial neoplasia
a: P-value according to the number of patients; b: P-value according to the number of lesions

Therapeutic maneuvers, resected lesion size and final diagnosis

207 endoscopic mucosal resection (EMR) was performed for 157 patients (114 EMR for 81 patients from Group A vs 93 for 76 from Group B), 14 endoscopic piecemeal mucosal resection (EPMR) for 14 patients ( 7 in Group A vs 7 in Group B), and 72 endoscopic submucosal dissection (ESD) for 67 patients (32 ESD for 30 patients belonging to Group A vs 40 for 37 belonging to Group B). There were no significant differences (P = 0.398>0.05). According to the preoperative EUS findings, 3 patients preferred surgical operation rather than planned endoscopic removal in Group A.

The mean size of resected lesions was 1.84 ± 1.30cm in Group A and 1.70 ± 0.97cm in Group B, without significant differences (P = 0.293> 0.05).

According to pathological diagnoses of removed specimens, including surgical specimens, final diagnoses were shown in Table 2. There were no significant differences between two groups (P = 0.096 > 0.05).

Grades of therapeutic maneuvers

On the basis of the principle, that is, it was helpful for the gastrointestinal early malignant lesions to be evaluated by EUS before endoscopic resection, we developed a scoring system as shown in Table 3. According to this scoring system, the grades of therapeutic maneuvers in Group A was higher than that in Group B (P = 0.000 < 0.05). The above data were shown in Table 4.

Table 3. The scoring system of therapeutic endoscopic maneuvers for HRGIPCL

Grades according to postoperative pathology

Benign lesions

HGIN

Early cancer

Advanced cancer

Evaluation by EUS

0

1

2

3

Without evaluation by EUS

0

0

0

0

HRGIPCL: high-risk gastrointestinal precancerous lesions;
HGIN: high grade intraepithelial neoplasia

Table 4. Grades of therapeutic endoscopic maneuvers for HRGIPCL in two groups

Grades /Number

P-value

Benign lesions

HGIN

Early cancer

Advanced cancer

Total

Group A

0/125

1/27

2/2

3/2

37/156

0.000

Group B

0/114

0/19

0/5

0/2

0/140

HRGIPCL: high-risk gastrointestinal precancerous lesions;
HGIN: high grade intraepithelial neoplasia

Adverse events

5 cases of endoscopic procedures followed by appended surgery which included 1 early signet ring cell cancer from Group A, 2 early cancer with suspicious residual tumor and 2 advanced cancer from Group B.

28 cases of endoscopic complications included 16 bleeding (6 in Group A and 10 in Group B), and 12 perforation (4 in Group A and 8 in Group B). 1 bleeding in Group B, and 3 perforation(1 in Group A and 2 in Group B ) underwent surgical operation.

In terms of complications, no significant difference were observed between the two groups (P = 0.058 > 0.05). However, 11 adverse events in Group A were less than 22 in Group B (P = 0.018 < 0.05).

DISCUSSION

Generally, EUS had better to be performed before the endoscopic resection is carried out for the early gastrointestinal cancer. Though, EUS is not usually required prior to the endoscopic removal for HRGIPCL. This is maybe due to that HRGIPCL is often considered as benign lesions by endoscopists with preconceived ideas. In fact, the so-called HRGIPCL may be just the tip of the iceberg [9,14]. May EUS be helpful before the therapeutic endoscopic procedures for HRGIPCL?

In our study, 46 HGIN and 11 gastrointestinal cancers were finally found in the 296 preoperative so-called HRGIPCL. Moreover, of these 11 cancers, there were 4 advanced cancers (2 from Group A and 2 from Group B). Some studies had similar findings. O’Brien MJ et al found HGIN among 35% of colorectal villous adenomas (>1 cm) [17]. Moreover, of 43 colorectal adenomas(≥2.5 cm), Elizabeth D. Euscher et al observed 5 invasive carcinoma [14].

In the Group B, these 2 advanced colorectal cancers preoperatively appeared as one LST and one sessile tubulovillous adenomas. Both of them underwent the surgery following the failed ESD. Moreover, in the Group B, one gastric early cancer after ESD and one colorectal cancer after EPMR, both accepted appended surgery because the cancer cells were observed on bottoms of resected lesions. Though, no cancer tissue were found in the postoperative specimen. However, the gratified results were observed in the Group A. Based on the preoperative EUS findings, those 2 advanced colorectal cancers being formerly regarded as sessile tubulovillous adenomas, both preferred to the surgery instead of the endoscopic resection.

Furthermore, there was such a surprised case in the Group A. One LGIN at the anterior wall of the junction of gastric body and antrum, was found by the gastroscope in his health check. A month later, he accepted the second gastroscopy, and the previous lesion area seemed to return to normal. EUS was still performed in accordance with the established procedures. The thickened hypoechoic mucous layer, with the incomplete muscularis mucosa and submucosa, was observed. Then, the jumbo biopsy was finished, and its histopathologic behaviors showed the moderately differentiated mucinous adenocarcinoma infiltrating into the submucosa. The final surgical specimens displayed the same pathological diagnosis and no lymph node metastasis.

Additionally, a large rectal LST in Group B, gave us a profound lesson. During the process of ESD, injection bleeding occurred, and endoscopic hemostasis failed, leading to hypovolemic shock, and following by surgery, because of a thick vascular broken end. In fact, ultrasonography preoperatively found a suspicious blood vessel within the thickening rectal mucosa. Unfortunately, it did not attract our enough attentions. We usually thought a crude vessel in bulky pedicle polyp. This lesson told us that EUS help to discovery the coarse vascellum hiding in the lesion, regardless of its shape, thus avoiding uncontrollable intraoperative bleeding.

However, we have to acknowledge the shortcomings of EUS [18–20]. It can usually reveal whether the cancer has invaded the muscularis propria. That is, it can distinguish the early gastrointestinal cancers from the advanced ones. Though, EUS is difficult to accurately define the depth of tumor reaching in the submucosa. So, before ESD for early cancer, if EUS says “NO”, we can choose to believe EUS, and if EUS says “YES”, we can choose to doubt EUS [21,22]. Before the endoscopic removal for early cancer, it is primary to preliminary screen the early cancers and advanced ones out from HRGIPCL. Obviously, EUS is qualified for this task, though the procedures and findings of EUS are all fairly subjective.

At the same time, many studies have shown that, the mucosal microstructure including the pit pattern and microvascular pattern demonstrated by chromoendoscopy and magnifying endoscopy, was very helpful to determining early gastrointestinal cancer, and identifying some early cancers suitable for endoscopic resection [23–28]. However, at present, this approach was mainly applied to esophageal cancer. It was still difficult to be used for gastric cancer and colorectal cancer. Even so, in fact, we had not yet mastered this method well. In order to be proficient in this means, it was necessary to carefully observe a large number of early gastrointestinal cancers by chromoendoscopy and magnifying endoscopy. Therefore, we thought that it was more difficult to master this method than to apply EUS for evaluating the gastrointestinal cancers. Apparently, it would be better to combine these two methods.

In summary, our study showed that EUS could help reduce the incidence of adverse events during the endoscopic removal of HRG IPCL. Thence, we thought that it was helpful to be evaluated by EUS for HRGIPCL before endoscopic resection.

Author contributions: Gao XZ, Chu YL, Wang RR, Qiao XL and Wang XF designed research; Gao XZ, Chu YL, Qiao XL, Wang XF, Wang RR, Yu SY and Liu F performed research; Chu YL, Wang RR, Li T analyzed data; Chu YL, Gao XZ, Wang RR and Li T wrote the paper.

Conflicts of interest: There are no conflicts of interest.

REFERENCES

  1. Deyhle P, Largiader F, Jenny S, Fumagalli I. (1973) A method for endoscopic electroresection of sessile colonic polyps. Endoscopy, 5(1): 38–40.
  2. Takuji Gotoda, Hwoon-Yong Jung. (2013) Endoscopic resection (endoscopic mucosal resection/endoscopic submucosal dissection) for early gastric cancer. Digestive Endoscopy. 25(Suppl. 1): 55–63. [Crossref]
  3. Hirao M, Masuda K, Asanuma T, Naka H, Noda K, et al. (1988) Endoscopic resection of early gastric cancer and other tumors with local injection of hypertonic saline-epinephrine. Gastrointest Endosc. 34(3): 264–269. [Crossref]
  4. Gotoda T, Kondo H, Ono H, Saito Y, Yamaguchi H, et al. (1999) A new endoscopic mucosal resection procedure using an insulation-tipped electrosurgical knife for rectal flat lesions: report of two cases. Gastrointest. Endosc. 50(4): 560–3. [Crossref]
  5. Eguchi T, Gotoda T, Oda I, Hamanaka H, Hasuike N, et al. (2003) Is endoscopic one-piece mucosal resection essential for early gastric cancer? Dig. Endosc. 15(2): 113–16.
  6. Yokoi C, Gotoda T, Hamanaka H, Oda I. (2006) Endoscopic submucosal dissection (ESD) allows curative resection of local recurrent early gastric cancer after prior endoscopic mucosal resection. Gas-trointest. Endosc. 64(2): 212–18. [Crossref]
  7. Katsumi Yamamoto, Tomoki Michida, Tsutomu Nishida, Shiro Hayashi, Masafumi Naito, et al. (2015) Colorectal endoscopic submucosal dissection: Recent technical advances for safe and successful procedures. World J Gastrointest Endosc. 7(14): 1114–1128.
  8. Miguel A Tanimoto, M Lourdes Guerrero, Yoshinori Morita, Jonathan Aguirre-Valadez, Elisa Gomez, et al. (2015) Impact of formal training in endoscopic submucosal dissection for early gastrointestinal cancer: A systematic review and a meta-analysis. World J Gastrointest Endosc. 16; 7(4): 417–428. [Crossref]
  9. Sung HY, Cheung DY, Cho SH, Kim JI, Park SH, et al. (2009) Polyps in the gastrointestinal tract: discrepancy between endoscopic forceps biopsies and resected specimens. Eur J Gastroenterol Hepatol. 21(2): 190–5. [Crossref]
  10. Nirav Thosani, Harvinder Singh, Asha Kapadia, Nobuo Ochi, Jeffrey H. Lee, et al. (2012) Diagnostic accuracy of EUS in differentiating mucosal versus submucosal invasion of superficial esophageal cancers: a systematic review and meta-analysis. Gastrointest Endosc, 75(2): 242–253. [Crossref]
  11. Ji Min Park, Chang Wook Ahn, Xian Yi, Hoon Hur, Kee Myung Lee, et al. (2011) Efficacy of Endoscopic Ultrasonography for Prediction of Tumor Depth in Gastric Cancer. J Gastric Cancer. 11(2): 109–115. [Crossref]
  12. Tanabe R, Higaki S, Gondo T, Sakaida I. (2012) Preoperative evaluation of early colorectal cancer using an ultrasound mini probe. Hepato-gastroenterology 59 (118): 1794–9. [Crossref]
  13. Christian Jenssen, Maria Victoria Alvarez-Sánchez, Bertrand Napoléon, Siegbert Faiss. (2012) Diagnostic endoscopic ultrasonography: Assessment of safety and prevention of complications. World J Gastroenterol. 18(34): 4659–4676. [Crossref]
  14. Euscher ED, Niemann TH, Lucas JG, Kurokawa AM, Frankel WL. (2001) Large colorectal adenomas. An approach to pathologic evaluation. Am J Clin Pathol. 116(3): 336–40. [Crossref]
  15. Scott R Steele, Eric K Johnson, Bradley Champagne, Brad Davis, Sang Lee, David Rivadeneira, et al. (2013) Endoscopy and polyps-diagnostic and therapeutic advances in management. World J Gastroenterol. 19(27): 4277–4288. [Crossref]
  16. Sheehan KM, O’Connell F, O’Grady A, Conroy RM, Leader MB,et al. (2004) The relationship between cyclooxygenase-2 expression and characteristics of malignant transformation in human colorectal adenomas. Eur J Gastroenterol Hepatol. 16(6): 619–25. [Crossref]
  17. O’Brien MJ, Winawer SJ, Zauber AG, Gottlieb LS, Sternberg SS, et al. (1990) The National Polyp Study. Patient and polyp characteristics associated with high-grade dysplasia in colorectal adenomas. Gastroenterology. 98(2): 371–9. [Crossref]
  18. Thosani N, Singh H, Kapadia A, Ochi N, Lee JH, et al. (2012) Diagnostic accuracy of EUS in differentiating mucosal versus submucosal invasion of superficial esophagealcancers: a systematic review and meta-analysis. Gastrointest Endosc. 75(2): 242–53. [Crossref]
  19. Park JM, Ahn CW, Yi X, Hur H, Lee KM, et al. (2011) Efficacy of endoscopic ultrasonography for prediction of tumor depth in gastric cancer.. J Gastric Cancer. 11(2): 109–15. [Crossref]
  20. Kiyonori Kobayashi, Mitsuhiro Kida, Tomoe Katsumata, Shigeru Yoshizawa, Kaoru Yokoyama, et al. (2003) Clinical role of endoscopic ultrasonography for the diagnosis of early colorectal cancer and selecting the treatment procedure. Dig Endosc, 15(4): 298–305.
  21. Gavin C Harewood, Maurits J Wiersema, Heidi Nelson, Robert L Maccarty, Janet E Olson, et al. (2002) A prospective, blinded assessment of the impact of preoperative staging on the management of rectal cancer. Gastroenterology. 123(1): 24–32. [Crossref]
  22. Hawes RH. (1993) New staging techniques: Endoscopic ultrasound. Cancer. 71(suppl): 4207- 4213. [Crossref]
  23. InoueH. (2001) Magnification endoscopy in the esophagus and stomach. Digestive Endoscopy. 13(Suppl 1): S40–41.
  24. ArimaM, TadaM, ArimaH. (2005) Evaluation of microvascular patterns of superficial esophageal cancers by magnifying endoscopy. Esophagus, 2(4): 191–197.
  25. Tatsuya Yoshida, Hiroshi Kawachi, Keita Sasajima, Akira Shiokawa, shin-ei Kudo. (2005) The clinical meaning of a nonstructural pattern in early gastric cancer on magnifying endoscopy. Gastrointest Endosc. Gastrointestinal Endoscopy. 62(1): 48–54. [Crossref]
  26. Uedo N, Fujishiro M, Goda K, Hirasawa D, Kawahara Y, et al. (2011) Role of narrow band imaging for diagnosis of early-stage esophagogastric cancer: current consensus of experienced endoscopists in Asia-Pacific region. Dig Endosc. 23 Suppl 1: 58–71. [Crossref]
  27. Hewett DG, Kaltenbach T, Sano Y, Tanaka S, Saunders BP, et al. (2012) Validation of simple classification system for endoscopic diagnosis of small colorectal polyps using narrow-band imaging. Gastroenterology. 143(3): 599–607. [Crossref]
  28. Hayashi N, Tanaka S, Hewett DG, Kaltenbach TR, Sano Y, et al. (2013) Endoscopic prediction of deep submucosal invasive carcinoma: validation of the narrow-band imaginginternational colorectal endoscopic (NICE) classification. Gastrointest Endosc. 78(4): 625–32. [Crossref]

Cruzain Inhibitors as Prominent Molecules with The Potential to become Drug Candidates against Chagas Disease

DOI: 10.31038/JPPR.2019233

Abstract

Chagas disease, a parasitic, endemic infection affects about 10–15 million of people all over Latin America. In addition, Chagas disease has an increased global impact in nonendemic areas due to immigration patterns. More than 10, 000 deaths are caused by this disease each year, and nearly 70 million people are susceptible to infection. Although Chagas disease was identified more than 100 years ago, current therapeutic options for this condition are limited mainly to two ineffective drugs, benznidazole and nifurtimox. These two drugs are not optimal as currently applied because they show substantial toxicity, require long courses of administration and have inconsistent efficacy. In light of these problems, safer and more effective therapeutic options for patients with Chagas disease are clearly needed. Many candidate drugs are currently being tested. Among them, cruzapain inhibitors are considered promising agents that have been shown to have potential for more effective treatment of the chronic form of Chagas disease. In this work we review briefly the most significant advance in the design of new molecules able to kill Trypanosoma cruzi via an inhibition of the enzyme cruzain (also referred to as cruzipain, the full-length native enzyme).

Keywords

Chagas disease; Anti-chagasic drugs; Cruzain; Irreversible cruzain inhibitors; Reversible cruzain inhibitors; Vinyl sulfones; Vinyl nitroalkenes; Amidonitriles; Lipinski’ parameters and in silico study

Introduction

Among 17 Neglected Tropical Diseases (NTDs), Chagas Disease (CD, American trypanosomiasis) has been considered one of the most important tropical protozoan afflictions [1–3]. To treat parasitic infections like CD, there are four general tools, e.g. diagnostics, vector control agents, vaccines and drugs. Nevertheless, these disease-specific technologies are still deficient and have narrow use because of their inadequate efficacies and toxicities, or because they do not avoid reinfection. This also applies to Chagas disease, an important health problem in Central and South America [4, 5]. Since 1908 it is well-known that the CD is caused by infection with the haemoflagellate protozoan Trypanosoma cruzi, which is transmitted in rural areas to humans and other mammals by reduviid bugs such as Rhodnius prolixus, Triatoma dimidiate and Triatoma infestans, so-called kissing bugs, the most important vectors. The latter insects were usually reported in sub-Amazonian endemic regions (southern South America), while R. prolixus and T. dimidiata habit northern South America and Central America. Despite to the morbidity and mortality of CD, until now two old drugs are used to treat Chagas disease, namely the nitro derivatives based on imidazole and furan rings, – benznidazole (1) and nifurtimox (2), discovered in 1965 and in 1971, respectively. These drugs are known under the names Rochagan® and Lampit®, respectively (Figure 1).

Benznidazole and nifurtimox require long-term administration and often show efficacy problems, including insufficient activity in established, chronic forms of the disease (very low cure rates in the chronic stage). Having a bad reputation both in terms of safety and efficacy, these old medications must be replaced by new safer and more efficacious drugs. Some developed molecules are being investigated in clinical trials. Among them, it should be mentioned new 2-substituted 5-nitroimidazole, fexinidazole (3) and repurposed antifungal triazole, posaconazole (4) (Figure 1).

JPPR 19 - 117 Vargas-Méndez LY_F1

Figure 1. Chemical structures of anti-chagasic drugs and drug candidates based on azole scaffold.

Fexinidazole has been identified as a new promising drug candidate for treatment of African trypanosomiasis [6], but it was demonstrated that it could be used in the chemotherapy for Chagas disease [7, 8]. Successful treatment with posaconazole of a patient with chronic Chagas disease and systemic lupus erythematosus was reported in 2010 [9].

Since this time, posaconazole is the drug with more advanced development in both experimental model and clinical trial [10, 11]. However, despite the promising results obtained in the animal model, the clinical trials of this drug candidate did not meet expectations. Testing a combination of posaconazole and beznidazole called chagasazol, it was concluded that this triazole is not effective as mono-pharmaceuticals in the treatment of patients in chronic asymptomatic phase with respect to beznidazole[12].

While the antiprotozoal toxicity of nitroimidazoles (1, 3) and nitrofurans (2) are thiol-dependent on reduction by nitroreductases of the nitro group, which generates cytotoxic species that cause damage to DNA, lipids and proteins [13], triazoles like posaconazole (4) are inhibitors of the sterol biosynthesis pathway, in particular C14-α-demethylase inhibitors [7, 14].

Thus, the approach to antiparasitic chemotherapy is usually based on two broad classes of targets, – trypanothione reductasa (TR) and sterol 14α-demethylase (CYP 51), which are specific to the parasite. Other alternative potential targets of responsible parasite for CD, T. cruzi are trans-sialidase (TS), tubulin, kinetoplastid DNA and cruzain (also referred to as cruzipain, the full-length native enzyme) [15, 16].

Cruzain and Identification of its Inhibitors

Cruzain (EC 3.4.22.51), the major papain-like cysteine peptidase of T. cruzi, is a principal virulence factor and a chemotherapeutic target with remarkable pre-clinical validation evidence [17–19].

The studies of the basic biochemistry of T. cruzi have allowed the identification of novel targets for CD chemotherapy. Killing T. cruzi through an inhibition of the enzyme cruzain is a different approach in therapies for Chagas disease. Being a member of the papain C1 family of cysteine protease, this enzyme hydrolyzes chromogenic peptides at the carboxyl arginine or lysine residue and requires at least one more amino acid between the terminal arginine or lysine and the amino-blocking group.

Thus, cruzain enzyme is essential for the viability and virulence of T. cruzi [20]. From currently available information in the Protein Data Bank (PDB) [21] it is known that cruzain consists of two domains: one with α-helices form and the other of antiparallel β-sheets. The active site, located at the interface between the two domains, encloses the catalytic triad formed by Cys25, His159 and Asn175. Cruzain has four relevant subsites for ligand binding (S1, S2, S3 and S1’) [22, 23].

During early development of cysteine protease inhibitors for CD therapy different class of many small peptidyl molecules were designed, synthetized and tested; among them, there were diazomethane inhibitors, fluoromethyl ketones, oxygen-containing heterocycles and vinyl sulfones. All these molecules bind a peptide or pseudopeptide backbone of cysteine protease (i.e., cruzain) to form a covalent adduct that inactivates the enzyme. Unfortunately, irreversible inhibitors may also inhibit host protease enzymes and possibly cause unacceptable side effects. Such irreversible inhibitors, especially peptidyl vinyl sulfones have become interesting leads in clinical trials [24].

The most outstanding vinyl sulfone, which was efficacious in pre-clinical models of T. cruzi infection, including immunocompetant and immunodeficient mice and dogs, is the irreversible cruzain inhibitor K-777(5) [25, 26]. Vinyl sulfone K-777 (5, known also as K11777), a potent cruzain inhibitor (IC50 = 5 nM) that inhibits the enzyme by attaching irreversibly to the catalytic Cys25 thiol group: first, conjugate addition of the thiolate of the cysteine at the active site to the double bond occurs that leads to the formation of carbanion, and then the resulting carbanion is subsequently protonated driving the process thermodynamically to the more stable enzyme−inhibitor complex (Figure 2).

JPPR 19 - 117 Vargas-Méndez LY_F2

Figure 2. Structure of K-777, three-dimensional structural representation of cruzain crystallized with this inhibitor and simplified inhibition scheme.21

These results indicated that there were no laboratory abnormalities, histologic abnormalities, or auto-immune phenomena. However, in 2005 it was announced that due to severe problems related to elevated hepatotoxicity of K-777 could lead to the abandonment of this project [27]. Since then, a number of more rigorous follow-up safety studies were done. Thus, while K777 continues to undergo preclinical evaluation, which may lead towards a possible human clinical trial [28], more selective, reversible inhibitors would be more suitable, the ideal drugs.

In general, three are two approaches to designing reversible inhibitors: (a) modifying K777 structure and (b) modifying structure of active inhibitors of human cathepsins that were designed for other diseases related to these enzymes. It should be evoked that cruzain is closely related to the human cysteine protease family of cathepsins, especially cathepsins L, B and K, which is the primary enzyme involved in bone formation process.

Both routes have active development. Indeed, modifying K777 structure (approach a), recently diverse reversible inhibitors, which contain electrophilic groups that serve as a ‘warhead’ that binds to cruzipain through a covalent bond to the active site cysteine, have been designed. Among them were first epoxysulfones and then halogenated vinyl sulfones [29, 30] and dipeptidyl nitro alkenes [31]. The latter molecules like a nitro alkene (6) (Figure 3) resulted in a new type of highly potent covalent reversible inhibitors of cysteine proteases. The results showed that this dipeptidyl nitro alkene (6) should bind in a comparable manner as the corresponding vinyl sulfones. However, chemical nature of the arising nitroalkane carbanion is quite different to the one of agent K-777, since the acidity of the corresponding acid, namely, the nitro alkane, is higher, and thus, the basicity of the carbanion is lower [30]. Moreover, the authors commented that the docking experiments indicate that a reaction, i.e. a nucleophilic attack at the double bond, should be possible.

JPPR 19 - 117 Vargas-Méndez LY_F3

Figure 3. Potent inhibitor (6) of cruzain with Ki values of 0.44 nM.

However, it should be noted that this molecular inhibitor exhibited a high affinity for human cathepsins, cathepsin B and cathepsin L showing Ki values of 8 and 11 nM, respectively. Thus, this cruzain inhibitor lucks a good selectivity index (SI) of human cathepsins/cruzain ratio.

An excellent example of the approach (b) is the development of new cathepsin K inhibitors based on amidoacetonitrile moiety [23, 32–34] that led to the identification of a peptidomimetic α-amido nitrile MK-0822 called odanacatib (7) (Figure 4), which was selected in the clinical development for osteoporosis and bone metastasis in 2008 [35].

JPPR 19 - 117 Vargas-Méndez LY_F4

Figure 4. Structure of odanacatib and simplified scheme of its specific interaction with cruzain that occurs in the binding pocket with Cys-SH.

Unfortunately, in 2016 odanacatib was dropped because of adverse events [36]. However, specific interaction of this molecule and related aminonitrile compounds with cysteine proteases consists of the nucleophilic attack of the thiolate moiety (Cys-SH) at the triple C ≡ N bond and thus the reversible formation of thioimidate adducts suggested that reversible cruzain inhibitors could be successful anti-T. cruzi agents [37].

Given the structural similarities between cruzain and the cathepsins, a drug discovery effort was mounted to identify an odanacatib analogs locking for the best selectivity (human cathepsins/cruzain). Division of the scaffold of this drug into three portions that it was identified as P1, P2, and P3 aided much to find new suitable cruzain inhibitors. Realizing focused screening of diverse cysteine protease inhibitors collection, first it could be identified amidonitrile (8) with basic moieties in P3 portion of model drug odanacatib (7) [38].

However, the basic nature of (8) is likely associated with lysosomotropism in which the accumulation of the compound in lysosomes could lead to unexpected activity against human cathepsins. Diverse related studies confirmed the potential of cruzain inhibitors as anti-T. cruzi therapies and allowed to identify two orally active, reversible cruzain inhibitors Cz007 (9) and Cz008 (10) (Figure 5).

JPPR 19 - 117 Vargas-Méndez LY_F5

Figure 5. Drug odanacatib as a model for developing new reversible cruzain inhibitors.

These structural non peptidic amidonitrile analogs of odanacatib have been found to be potent cruzain inhibitors displaying in vivo activity in a murine model of acute T. cruzi infection [39, 40]. Recently, several large libraries of α-amidoacetonitriles were also prepared and tested their inhibitory activity against the T. cruzi cysteine protease cruzain and anti-trypanosomal effects. A Ki value of 16 nM and an EC50 value of 28 μM were observed for the most potent of these inhibitors [41].

In silico computational studies through Molinspiration software

Being small nitrogen-containing molecules, the above mentioned compounds (1–10) are capable to exert non-covalent interactions (hydrophobic and electrostatic interactions as well as hydrogen bonds, metal co-ordination, van der Waals forces, etc.) with some active sites in organisms that ends with pharmacological activity manifestation. This pharmacological activity is also influenced by certain simple physicochemical parameters (descriptors).

Usually, four most important parameters of small molecules are used to predict their oral bioavailability; these descriptors are molecular weight (MW), lipophilicity (Log P), H-bond donors (HBD) and H-bond acceptors (HBA). All these are involved in the Lipinski “rule of five” (RO5), which states that good absorption or permeation of a compound is more likely when there are less than 5 H-bond donors, 10 H-bond acceptors, the MW is smaller than 500 Da and the calculated Log P (cLog P) is smaller than 5 [42]. These simple filters can help in selecting drug-like compounds. However, RO5 compliance is not a guarantee that a compound will be drug-like. Additionally, other descriptors such as number of rotatable bonds (ROTB), topological polar surface area (TPSA) and molecular volume (MV) are considered very useful parameters in activity–structure relationship (SAR) studies. All these properties could be easily calculated by diverse software available online.

Considering above backgrounds and paying attention to the importance of knowing these physicochemical properties, we used Molinspiration software [43] for actual anti-chagastic drugs 1–4 and candidate drug, promising cruzain inhibitors 5–10 (Table 1).

Table 1. Molecular descriptors calculated for drugs and drug candidates (1–10) according to the Lipinski’s Rule using the Molinspiration Cheminformatics software.

Comp.

MWa

cLogPb

cLogSc

HBAd

HBDe

ROTBf

TPSAg

MVh

n
violations

1

260.25

0.78

–2.618

7

1

5

92.75

224.99

0

2

287.30

0.71

–2.767

8

0

3

108.71

229.37

0

3

265.29

2.58

–3.783

6

0

4

72.88

220.23

0

4

762.86

6.15

–11.01

12

0

13

104.73

678.93

3

5

574.75

4.32

–6.975

8

2

11

98.81

531.04

1

6

383.45

3.81

–4.958

7

2

11

96.18

359.60

0

7

525.57

3.96

–6.847

6

2

10

99.06

439.67

1

8

595.68

5.85

–8.528

6

2

12

80.18

539.00

2

9

632.65

5.16

–8.876

7

2

12

122.85

527.23

2

10

487.57

4.33

–6.498

6

3

10

80.18

446.16

0

a Molecular Weight (g/mol); b Logarithm of the partition coefficient between n-octanol and water; c Logarithm of the solubility measured in mol/L; d Number of hydrogen-bond acceptors; e Number of hydrogen-bond donors; f Number of rotatable bonds; g Polar Surface Area (Å2); h Molecular volume.

Analyzing the results obtained, it can be noted that two classic anti-chagastic drugs, benznidazole (1) and nifurtimox (2), and drug candidate fexinidazole (3) are very small, highly soluble molecules with poor capacity of permeability through membranes (weak lipophilicity); its cLogP are 0.78, 0.71 and 2.58, respectively. In addition, they are molecules with low flexibility properties (ROTB = 3–5). In contrast, drug candidates (4–10) are more lipophilic molecules (6.15 <cLogP > 3.81) with elevated MW (383.45–762.86) and MV (359.60–678.93).

Among them, antifungal drug, posaconazole (4) that was proposed in CD treatment, resulted to be the biggest molecule with the highest lipophilicity parameter (cLogP = 6.15) and flexibility properties (ROTB = 13). Additionally, posaconazole has a better ability of intermolecular hydrogen bonding (HBA = 12), which is partially responsible for the interactions with secondary and tertiary structures of proteins and nucleic acids.

The physicochemical descriptors of cruzain inhibitor amidonitriles (8, 9) derived from drug odanacatib (7), are very close to the one of posaconazole that inhibits the ergosterol production by binding and inhibiting the lanosterol-14α-demethylase. Noteworthy, these cruzain inhibitors and posaconazole are structurally different, very lipophilic molecules with more than two RO5 violations.

Own odanacatib molecule, possessing MW more than 500 g/mol, has one RO5 violation. Moreover, its more elaborated amidonitrile derivative (10) does not show any RO5 violation like dipeptidyl nitro alkene (6), a K777 analog (Table 1). However, it should be commented that there are plenty of examples available for such prediction violation amongst the existing drugs [44].

Thus, both approaches to designing reversible inhibitors (modifying from drug odanacatib and agent K777) result in promising cruzain inhibitors as anti-T. cruzi therapies. However, it is believed that α-amidoacetonitriles derived from odanacatib have more outlooks in anti-chagastic drug research [45].

Interesting results were obtained also analyzing bioactivity score for these compounds. According to the predicted bioactivity score, drug and drug candidates (1–4) do not make to switch any tested biological targets, while especially designed cruzain inhibitor agents (5–10) may alter selectively proteases (Table 2) that confirm generally its biochemical behavior. Unfortunately, simple in silico evaluation of these drug candidates does not allow anticipating their SI properties.

Table 2. Molinspiration bioactivity score for compounds (1–10)*

Comp.

GPCR ligand

Ion channel modulator

Kinase inhibitor

Nuclear receptor ligand

Protease inhibitor

Enzyme inhibitor

1

–0.33

–0.39

–0.49

–0.71

–0.05

–0.02

2

–0.93

–1.40

–0.73

–1.61

–0.81

–0.58

3

–0.47

–0.22

–0.38

–0.41

–0.38

–0.09

4

–1.45

–2.82

–2.34

–2.54

–1.12

–2.07

5

0.21

–0.20

–0.18

–0.17

0.65

0.07

6

0.36

0.10

–0.16

–0.19

0.45

0.11

7

0.34

0.01

–0.11

0.04

1.16

0.27

8

0.19

–0.40

–0.32

–0.25

0.74

–0.20

9

0.07

–0.65

–0.41

–0.22

0.81

–0.18

10

0.13

–0.11

–0.02

–0.12

0.58

–0.11

* Marked in bold parameters indicated a pronounced bioactivity score

Additionally, it can be noted that tested inhibitors (5–8) could modify other important biological targets: all four molecules would affect G protein–coupled receptor (GPCR) (score = 0.19–0.34), drug odanacatib (7) would work also as an enzyme inhibitor (score = 0.27). These protein covalent binding properties possibly cause unacceptable side effects.

Conclusion

Chagas disease represents an emerging worldwide challenge and there is an urgent, unmet need for safe and effective medication and thus, the last few years have seen a revolutionary improvement of the in vitro and in vivo screening methodologies to search for new anti-Chagas therapies.

The studies on reversible cruzain α-amidoacetonitrile-based inhibitors represent a valuable step in the search for new drugs for the treatment of a neglected disease that continues to affect the lives of millions of people.

The RO5 methodology appears to be as useful today in defining therapeutically relevant pharmacokinetic drugability and could help in this search. This simple and brief in silico analysis not only could help to design better new molecules with suitable pharmacological properties, but also comprehend its possible mechanism of action. It is evident that one of the important rational approaches for the fast advance of novel trypanocidal chemotherapy would be one focused on drugs ready to enter to clinical trials or on the clinical evaluation of drug association with existing trypanocidal agents to get extra effectiveness and fewer secondary effects [46].

References

  1. Rassi A Jr, Rassi A, Marin-Neto JA (2010) Chagas disease. Lancet 375: 1388–1402. [crossref]
  2. Bern C (2015) Chagas’ Disease. N Engl J Med 373: 456–466. [crossref]
  3. Cavalli A, Bolognesi ML (2009) Neglected tropical diseases: multi-target-directed ligands in the search for novel lead candidates against Trypanosoma and Leishmania. J Med Chem 52: 7339–7359.
  4. Chatelain E (2015) Chagas disease drug discovery: toward a new era. J Biomol Screen 20: 22–35. [crossref]
  5. Bonney KM (2014) Chagas disease in the 21st century: a public health success or an emerging threat? Parasite 21: 11. [crossref]
  6. Torreele E, Trunz BB, Tweats D, Kaiser M, Brun R, et al. (2010) Fexinidazole: a new oral nitroimidazole drug candidate entering clinical development for the treatment of sleeping sickness. PLoS Negl Trop Dis 4: 923.
  7. Caldas S, Caldas IS, Cecílio AB, Diniz LF, Talvani A, et al. (2014) Therapeutic responses to different anti-Trypanosoma cruzi drugs in experimental infection by benznidazole-resistant parasite stock. Parasitology 141: 1628–1637.
  8. Bahia MT, de Andrade IM, Martins TA, do Nascimento ÁF, Diniz Lde F, et al. (2012) Fexinidazole: a potential new drug candidate for Chagas disease. PLoS Negl Trop Dis 6: 1870. [crossref]
  9. Pinazo MJ, Espinosa G, Gállego M, López-Chejade PL, Urbina JA, et al. (2010) Successful treatment with posaconazole of a patient with chronic Chagas disease and systemic lupus erythematosus. Am J Trop Med Hyg 82: 583–587.
  10. Molina I, Salvador F, Sánchez-Montalvá A (2015) The use of posaconazole against Chagas disease. Curr Opin Infect Dis 28: 397–407.
  11. Molina I, Gómez i Prat J, Salvador F, Treviño B, Sulleiro E, et al. (2014) Randomized trial of posaconazole and benznidazole for chronic Chagas’ disease. N Engl J Med 370: 1899–1908. [crossref]
  12. Alonso-Padilla J, Rodríguez A (2014) High throughput screening for anti-Trypanosoma cruzi drug discovery. PLoS Negl Trop Dis 8: 3259. [crossref]
  13. Hall BS (2011) Wilkinson SR. Activation of benznidazole by trypanosomal type I nitroreductases results in glyoxal formation. Antimicrob Agents Chemother 56: 115–123.
  14. Diniz LF, Urbina JA, de Andrade IM, Mazzetti AL, Martins TAF, et al. (2013) Benznidazole and posaconazole in experimental Chagas disease: positive interaction in concomitant and sequential treatments. PLoS Negl Trop Dis 7: 2367.
  15. Sueth-Santiago V, Decote-Ricardo D, Morrot A, Freire-de-Lima CG, Lima MEF (2017) Challenges in the chemotherapy of Chagas disease: Looking for possibilities related to the differences and similarities between the parasite and host. World J Biol Chem 8: 57–80.
  16. Lepesheva GI (2013) Design or screening of drugs for the treatment of Chagas disease: what shows the most promise? Expert Opin Drug Discov 8: 1479–1489. [crossref]
  17. Du X, Guo C, Hansell E, Doyle PS, Caffrey CR, et al. (2002) Synthesis and structure-activity relationship study of potent trypanocidal thio semicarbazone inhibitors of the trypanosomal cysteine protease cruzain. J Med Chem 45: 2695–2707.
  18. Cazzulo J, Stoka V, Turk V (2001) The major cysteine proteinase of Trypanosoma cruzi: a valid target for chemotherapy of Chagas disease. Curr Pharm Design 7: 1143–1156.
  19. Branquinha MH, Oliveira SSC, Sangenito LS, Sodre CL, Kneipp LF, det al. (2015) Cruzipain: an update on its potential as chemotherapy target against the human pathogen Trypanosoma cruzi. Curr Med Chem 22: 2225–2235.
  20. Duschak VG, Couto AS (2009) Cruzipain, the major cysteine protease of Trypanosoma cruzi: a sulfated glycoprotein antigen as relevant candidate for vaccine development and drug target. A review. Curr Med Chem 16: 3174–3202.
  21. Protein Data Bank, http://www.rcsb.org/pdb.
  22. Gillmor SA, Craik C, Fletterick RJ (1997) Structural determinants of specificity in the cysteine protease cruzain. Protein Sci 6: 1603–1611.
  23. Martinez-Mayorga K, Byler KG, Ramirez-Hernandez AI, Terrazas-Alvares DE (2015) Cruzain inhibitors: efforts made, current leads and a structural outlook of new hits. Drug Discov Today 20: 890–898.
  24. McKerrow JH (1999) Development of cysteine protease inhibitors as chemotherapy for parasitic diseases: insights on safety, target validation, and mechanism of action. Int J Parasitol 29: 833–837.
  25. Doyle PS, Zhou YM, Engel JC, McKerrow JH (2007) A cysteine protease inhibitor cures Chagas’ disease in an immunodeficient-mouse model of infection. Antimicrob Agents Chemother 51: 3932–3939.
  26. Barr SC, Warner KL, Kornreic BG, Piscitelli J, Wolfe A, et al. (2005) A cysteine protease inhibitor protects dogs from cardiac damage during infection by Trypanosoma cruzi. Antimicrob Agents Chemother 49: 5160–5161.
  27. Urbina JA (2010) Specific chemotherapy of Chagas disease: relevance, current limitations and new approaches. Acta Tropica 115: 55–68.
  28. Sajid M, Robertson SA, Brinen LS, McKerrow JH (2011) Cruzain: the path from target validation to the clinic. In Cysteine Proteases of Pathogenic Organisms. Robinson MW, and John P. Dalton JP, Eds. Adv Exp Med Biol. Boston: Springer 712: 100–115.
  29. Doherty W, James J, Evans P, Martin L, Adler N, et al. (2014) Preparation, anti-trypanosomal activity and localisation of a series of dipeptide-based vinyl sulfones. Org Biomol Chem 12: 7561–7571.
  30. Schirmeister T, Kesselring J, Jung S, Schneider T, Weickert A, et al. (2016) Quantum chemical-based protocol for the rational design of covalent inhibitors. J Am Chem Soc 138: 8332–8335.
  31. Latorre A, Schirmeister T, Kesselring J, Jung S, Johe´ P, et al. (2016) Dipeptidyl nitroalkenes as potent reversible inhibitors of cysteine proteases rhodesain and cruzain. ACS Med Chem Lett 7: 1073–1076.
  32. Ferreira LG, Andricopulo AD (2017) Targeting cysteine proteases in trypanosomatid disease drug discovery. Pharm Therap180: 49–61.
  33. Frizler M, Lohr F, Furtmann N, Kla¨s J, Gu¨tschow M (2010) Structural optimization of azadipeptide nitriles strongly increases association rates and allows the development of selective cathepsin inhibitors. J Med Chem 54: 396–400.
  34. Frizler M, Stirnberg M, Sisay MT, Gutschow M (2010) Development of nitrile-based peptidic inhibitors of cysteine cathepsins. Curr Top Med Chem 10: 294–322.
  35. Gauthier JY, Chauret N, Cromlish W, Desmarais S, Duong LT, et al. (2008) The discovery of odanacatib (MK-0822), a selective inhibitor of cathepsin K. Bioorg Med Chem Lett 18: 923–928. [crossref]
  36. Mullard A (2016) Merck &Co. drops osteoporosis drug odanacatib. Nat Rev Drug Discov 15: 669. [crossref]
  37. Nicoll-Griffith DA (2012) Use of cysteine-reactive small molecules in drug discovery for trypanosomal disease. Expert Opin Drug Discov 7: 353–366.
  38. Black WC, Bayly CI, Davis DE, Desmarais S, Falgueyret JP, et al. (2005) Trifluoroethylamines as amide isosteres in inhibitors of cathepsin K. Bioorg Med Chem Lett 15: 4741–4744. [crossref]
  39. Beaulieu C, Isabel E, Fortier A, Masse F, Mellon C, et al. (2010) Identification of potent and reversible cruzipain inhibitors for the treatment of Chagas disease. Bioorg Med Chem Lett 20: 7444–7449.
  40. Ndao M, Beaulieu C, Black WC, Isabel E, Vasquez-Camargo F, et al. (2014) Reversible Cysteine Protease Inhibitors Show Promise for a Chagas Disease Cure. Antimicrob Agents Chemother 58: 1167–1178.
  41. Avelar LA, Camilo CD, de Albuquerque S, Fernandes WB, Gonçalez C, et al. (2015) Molecular Design, Synthesis and Trypanocidal Activity of Dipeptidyl Nitriles as Cruzain Inhibitors. PLoS Negl Trop Dis 9: 0003916.
  42. Lipinski CA (2004) Lead- and drug-like compounds: the rule-of-five revolution. Drug Discov Today Technol 1: 337–341. [crossref]
  43. Molinspiration Cheminformatics Software, https://www.molinspiration.com .
  44. Benet LZ, Hosey CM, Ursu O, Oprea TI (2016) BDDCS, the Rule of 5 and drugability. Adv Drug Deliv Rev 101: 89–98. [crossref]
  45. Ang KK, Ratnam J, Gut J, Legac J, Hansell E, et al. (2011) Mining a cathepsin inhibitor library for new antiparasitic drug leads. PLoS Negl Trop Dis 5: e1023. [crossref]
  46. Duschak, VG (2016) Targets and patented drugs for chemotherapy of Chagas disease in the last 15 years-period. Recent Patentes Anti-infect Drug Discov 11: 74–173.

The American Psychiatric Association Fails to Recognize the Value of Neuroimaging in Psychiatry

DOI: 10.31038/IMCI.2019212

Abstract

Recently, the American Psychiatric Association (APA) published a position paper stating that neuroimaging provided no benefit to the diagnosis and treatment of psychiatric disorders. In the position statement and the accompanying 46-page review of the subject literature, the APA makes a strong case for the failure of functional magnetic resonance imaging to elaborate useful diagnostic biomarkers for psychiatric disorders. However, the APA fails to consider and do not include in the analysis, extensive research on the clinical value of Positron Emission Tomography (PET) and Single Photon Emission Computed Tomography (SPECT) neuroimaging. Herein, the International Society of Applied Neuroimaging (ISAN) will elaborate on the incongruity between the categorical system of psychiatric diagnoses and neuroimaging findings. We further explore the manner in which neuroimaging can and should contribute to psychiatric diagnosis and to guiding psychiatric treatment. Lastly, we describe several examples of neuroimaging applications which meet or exceed the criteria set forth by the APA to define a neuroimaging biomarker, including the diagnosis of Alzheimer’s disease and other dementias, the differential diagnosis of ADHD, and the diagnosis of traumatic brain injury. The position of ISAN is that neuroimaging is not to be feared. Neuroimaging does not replace the diagnostician; rather, it aids the diagnostician in complex cases.

Keywords

ADHD, Depression, Neuroimaging, PET, SPECT, TBI, Traumatic brain injury, fMRI, functional MRI

Introduction

Recently, the American Psychiatric Association (APA) published a position paper stating “neuroimaging has yet to have a significant impact on the diagnosis or treatment of individual patients in clinical settings” 1]. Surely, the APA guiding its profession must be a good thing. Unfortunately, there is one far-reaching problem. This sweeping statement made by the APA might be correct for Functional Magnetic Resonance Imaging (fMRI), but it is certainly not true for Positron Emission Tomography (PET) and Single Photon Emission Computed Tomography (SPECT) neuroimaging. Both these functional scanning techniques have clearly proven benefits in diagnosis and in guiding treatment of psychiatric patients [2]. The APA position paper focused almost exclusively on fMRI data and did not review these other widely used functional neuroimaging techniques. More troubling, was that the APA then generalized its conclusions about fMRI to all neuroimaging techniques without supportive evidence.

The tendency to take unsupportable positions is not new to the APA. Psychiatry has attempted to neatly package mental illness into diagnostic categories which unfortunately have little to do with the underlying neurobiology [3]. While neuroimaging studies have demonstrated that these diagnostic entities are, in fact, made up of multiple endophenotypes of neurophysiological disruption, the APA has done nothing to alter the categorical system elaborated in the Diagnostic and Statistical Manual (DSM) in its fifth iteration [3].

When the APA officially declared that using neuroimaging to look at the brain has no clinical value in psychiatry, it took a step backwards scientifically. The APA ignored data which did not fit with this rigid position. By deciding to be august, rather than accurate, the APA robbed themselves, psychiatrists, and the general public of effective and promising neuroimaging opportunities that could improve clinical care. The resistance to actually looking at brain function by psychiatrists is startling.

As President of the International Society of Applied Neuroimaging (ISAN), I encouraged the Society to respond rapidly with a letter-to-the-editor. Much to our dismay, the letter was rejected by the Journal, but not because of poor writing quality. Rather, it was rejected because the Journal claimed there could be no rebuttal to such APA position papers.

Herein, we will elaborate on the incongruity between DSM categories and neurobiological data, compare and contrast the APA’s position [1] with some of the available data which they did NOT examine in their analysis of neuroimaging, and demonstrate how imaging can and should augment the diagnostic and treatment process. We will demonstrate that neuroimaging has already proven itself valuable in the psychiatric treatment of individual patients, as well as how neuroimaging can advance the field going forward.

The Incongruity between DSM Diagnostic Categories and Neuroimaging Findings

Depression

Using the DSM diagnostic criteria for Major Depressive Disorder,[3] it is possible to have over 20 different phenotypes of this single diagnosis. Patients can have increased motor activity or decreased motor activity. They can have insomnia or hypersomnia. They can have weight gain or weight loss. It is difficult to see how such a multi-faceted presentation can represent a single diagnostic entity which would benefit in the same way from the same medications and/or treatments. Indeed, experts agree that depression is not just one thing, despite the efforts of mainstream psychiatry to classify it into a single illness category. Nassir Ghaemi, MD, noted expert on psychopharmacology recently wrote:[4]

“Psychiatry…practice(s) non-scientifically; we use hundreds of made-up labels for professional purposes, without really getting at the reality of what is wrong with the patient…We have a huge amount of neurobiology research now to conclude that the 20th century neurotransmitter theories of psychopharmacology basically are false. The dopamine and monoamine (serotonin) hypotheses of schizophrenia and depression are wrong…we now know that drugs have major second messenger effects which (cause) neuroplastic changes in the brain, including connections between neurons. The brain is literally re-sculpted.”[4]

Neuroimaging studies have shown there are several neurophysiological substrates for depression. Functional brain scans, such as SPECT (single photon emission computed tomography) or PET (positron emission tomography) have shown that while patients may present with the same symptoms of depression, they can have very different processes occurring in their brains. Indeed, some of the anatomic circuits of depression and mood regulation have been revealed by converging evidence from SPECT, PET and fMRI studies of depression, as well as the analysis of both lesions resulting in depressive symptoms and surgical lesions used to treat severe cases of depression [5,6]. These convergent findings have revealed a network of brain regions, including the dorsal prefrontal cortex, ventral prefrontal cortex, anterior cingulate gyrus, amygdala, hippocampus, striatum, and thalamus in the pathophysiology of depression.[7–9] Drevets and others have emphasized that depression is the result of multiple pathophysiological processes and the dysfunction of multiple pathways [5,10]. It is not one disorder.

Distinct subtypes of depression now can be detected. Depression is often associated with decreased activity (and therefore metabolism and perfusion) of the frontal lobes, the insular cortex, and the anterior cingulate gyrus [5–10]. However, some patients with depression have increased perfusion in the precuneus, which correlates with rumination and self-criticism [11]. Some patients with depression also have decreased temporal lobe function. Many patients with depression show increased thalamic activity (metabolism or perfusion) [12]. Portions of the thalamus have direct connections to the amygdala, the seat of fear and anxiety [13]. SPECT and PET neuroimaging can also predict who will respond to certain antidepressants. For example, those who are likely to respond to SSRI antidepressants show increased perfusion in the ventral frontal cortex and anterior cingulate 14,15]. The response to SSRI antidepressants is often decreased perfusion in these areas, as well as in the thalamus. In contrast, some patients with depression have markedly decreased dorsal frontal cortex and medial frontal cortex perfusion. These patients are less likely to respond to SSRI medications, but may respond better to noradrenergic antidepressants [9,16]. Treatment-resistant depression may show markedly increased perfusion in the subgenual cingulate [10].

Neuroimaging also helps to diagnose neurological disorders which may masquerade as psychiatric conditions. For example, over 40% of patients who experience a concussion (also known as mild traumatic brain injury [TBI]) will develop depression over the subsequent year [17,18]. There is no reason to expect patients with TBI to respond the same way as those who have endogenous depression. Similarly, toxic brain injury [19,20], Parkinsonian syndromes [21], and dementia in the elderly [22] can all present as depression.

Attention-Deficit Hyperactivity Disorder (ADHD)

There is overwhelming neurobiological evidence for the existence of multiple forms of ADHD based on neuroimaging. A multitude of functional imaging studies utilizing a diversity of modalities; including SPECT, fMRI, PET, and quantitative electroencephalogram (qEEG) repeatedly demonstrated similar results in children and in adults. Some of these studies, reviewed by Dr. Cherkasova and Dr. Hechtman,[23] show reduced activity during a concentration task in the prefrontal cortex, orbital frontal cortex, and caudate nuclei in some patients with ADHD. In addition, abnormal function and anatomy have been reported in the cerebellum of some patients with ADHD. Others diagnosed with ADHD have poorly functioning temporal lobes.[23] Significant clinical experience has shown that patients with symptoms of ADHD can also present with diffuse over-activity of the cerebral cortices, involving not only the frontal lobes, but also the temporal and parietal lobes. This clinical observation is supported by recent research looking at subclasses of ADHD endophenotypes [24,25], rather than bearing the underlying presumption that all ADHD looks the same on neuroimaging.

Fully recognizing that the plural of anecdote is not data, we offer two examples of these alternate endophenotypes of ADHD and how they responded differently to medications. The first patient was a 7 year old female who was diagnosed with ADHD by her pediatrician, but became wildly out of control on stimulant medications. A trial of the non-stimulant medication atomoxetine, which is FDA-approved for the treatment of ADHD, led to aggression. This phenomenon has been previously described by Henderson and Hartman [26] who found that fully one-third of all new starts on atomoxetine experienced aggression, hypomania, or mania. Off all medication, the patient was still struggling in school academically and was often hyperactive and impulsive at home and at school. However, the patient was not grandiose, hypersexual, excessively giddy, or showing reduced need for sleep as would be expected in mania. Thus, this seemed less likely to be a burgeoning case of Bipolar Disorder. Her Connor’s Continuous Performance test for ADHD was positive.

A SPECT scan (Figure 2) revealed diffusely increased activity throughout the cerebral cortices. The overactive frontal lobes became even more active during a concentration task, in contrast to the usual situation in ADHD as illustrated in Figure 1 above. Based on the SPECT findings, the patient was treated with an anticonvulsant, oxcarbazepine, to calm the overactive areas. Within a few weeks of starting treatment, the patient was less hyperactive and more focused. She demonstrated marked improvement in her academic performance. She remained stable and free of symptoms for the subsequent 43 months until lost to follow-up.
IRCI 18 - 107 - Theodore A. Henderson_F1

Figure 1. Tc-99m-HMPAO perfusion SPECT scan data presented in sagittal tomogram. The color scale is scaled relative to the patient’s mean cerebral perfusion. Mean blood flow (72%) is in yellow. Color shifts occur at approximately every 0.5 SD (3 %) relative to the patient’s mean. Baseline (A) and concentration (B) scan of a neurotypical patient demonstrating increased frontal lobe (red elipse) and orbitofrontal cortex (arrow) perfusion during concentration. Baseline (C) and concentration (D) scan of a patient with ADHD demonstrating decreased frontal lobe (red elipse) and orbitofrontal cortex (arrow) perfusion during concentration.
IRCI 18 - 107 - Theodore A. Henderson_F2

Figure 2. Tc-99m-HMPAO perfusion SPECT scan data presented in sagittal tomogram (upper row) and in surface rendering (lower row). The color scale is as in Figure 1. Baseline (upper left) and concentration (upper right) scan of the patient demonstrating increased frontal lobe (red elipse) and orbitofrontal cortex perfusion at baseline, which become even more active during concentration. Surface rendering shows the diffuse hyperperfusion throughout the cerebral cortices.

The second case is a 10 year old female who struggled with poor attention and poor academic performance, but did not demonstrate hyperactivity. She had a trial of stimulant medications, but became anxious and agitated. She underwent a qEEG evaluation and was diagnosed with severe auditory and visual attention deficits. She then underwent over $10,000 worth of neurofeedback, but showed only slight transient benefit. Her Connor’s Continuous Performance test for ADHD was negative.

A SPECT scan (Figure 3) revealed temporal lobe hypoperfusion and no evidence of frontal lobe deactivation during a concentration task. Based on clinical experience and the appearance of temporal lobe dysfunction, she was started on donepezil (Aricept), an acetylcholinesterase inhibitor. Within one month, her reading speed had increased and her math skills were improving. By three months, she had gained approximately two years in math skills and 1.5 years in reading comprehension skills. Donepezil was shown in a small study to improve ADHD symptoms [27]. Doyle and colleagues [28] also reported on an open-label case series of patients with autism spectrum disorder who showed reduced ADHD-like symptoms in response to donepezil. However, an 18-week open-label trial in children with ADHD and tics failed to show improvement in ADHD-like symptoms [29].
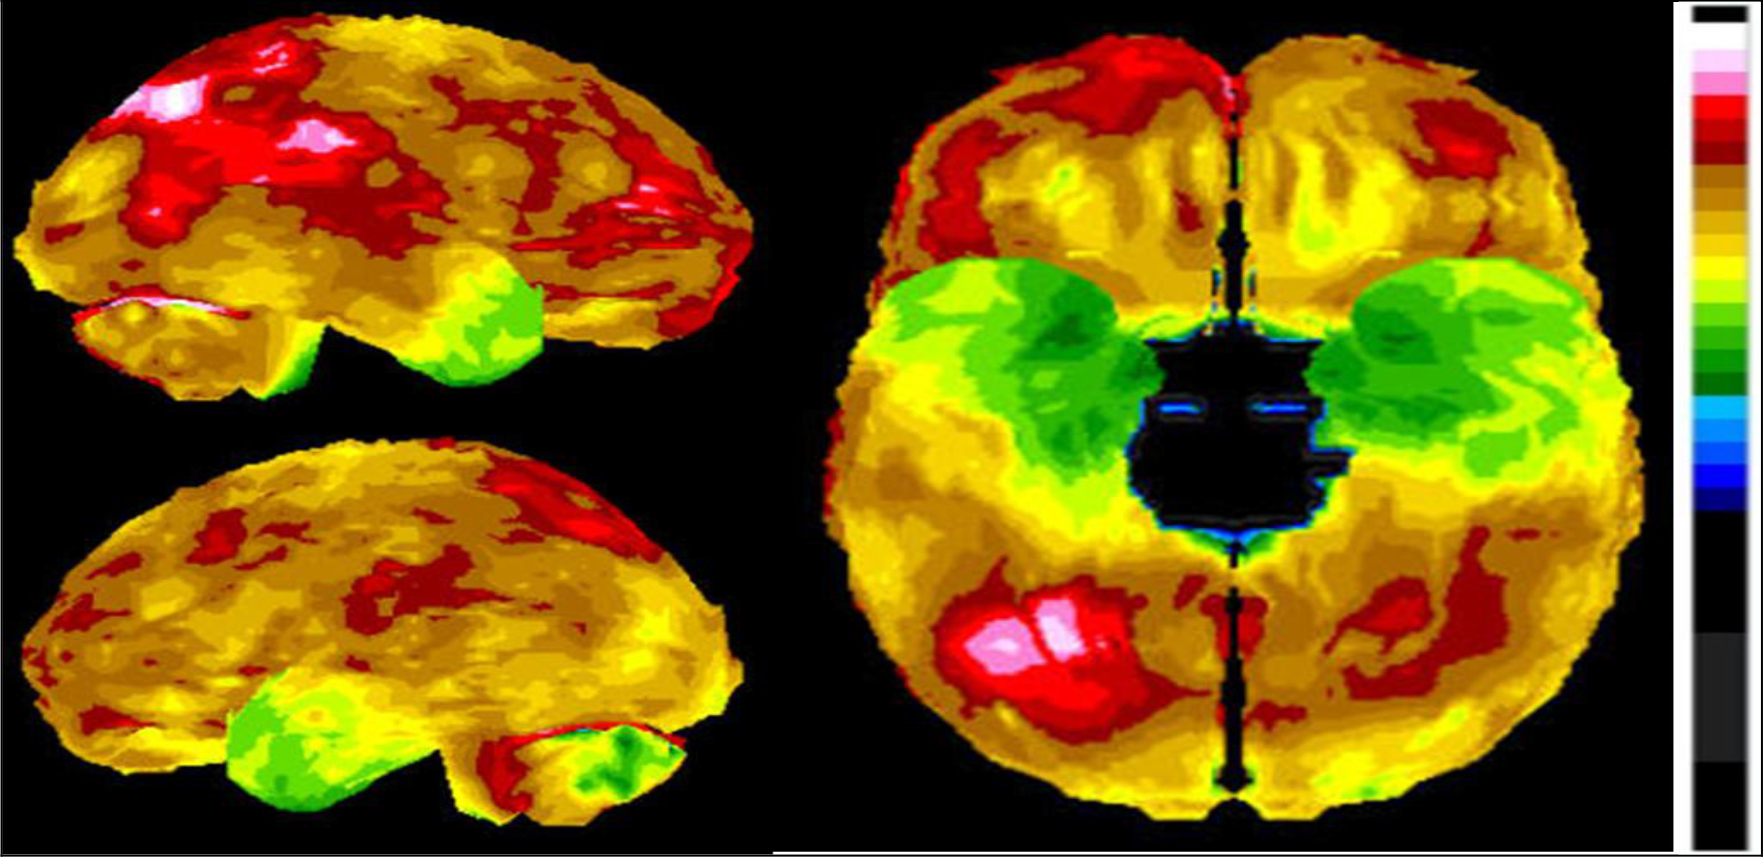
IRCI 18 - 107 - Theodore A. Henderson_F3

Figure 3. Tc-99m-HMPAO perfusion SPECT scan data presented in surface rendering. The color scale is as in Figure 1. The decreased perfusion (green) is clearly visible in the temporal lobes.

A separate important point is that inattention is a non-specific symptom. Inattention, is found not only in ADHD, mania, anxiety, and depression, but it is also found in TBI, carbon monoxide poisoning, cadmium toxicity, lead toxicity, schizophrenia, post-traumatic stress disorder (PTSD), post-coronary bypass syndrome, multiple sclerosis, substance abuse, space-occupying lesions, CNS infections, dementia, and a litany of other conditions which alter frontal lobe functioning. While, an interview will not help distinguish among these possibilities, neuroimaging can differentiate many of these categories. Can neuroimaging provide a pathognomonic imaging result (a fingerprint, if you will) for each of these conditions? No, but it can eliminate several possibilities and lead you closer to a definitive diagnosis. For example, if a perfusion SPECT scan shows a diffuse pattern of decreased function, ADHD become much less likely and systemic effects such as metal [30], mold [31], or other [32] toxicity, carbon monoxide poisoning,[33] or infection [34] become more likely. Rather than treating the patient with a stimulant, a clinician would be directed by the scan results to seek a cause for the brain dysfunction.

The APA takes a position

The APA has now taken the position that there is no reason to look at the brain. In a two-page position paper [1] in the September 2018 issue of the American Journal of Psychiatry, the APA concluded, “According to this standard, the psychiatric imaging literature currently does not support the application of a diagnostic biomarker to positively establish the presence of any primary psychiatric disorder”. This bold statement was backed up by a separate 44-page review article prepared by a workgroup of APA neuroimaging researchers issued in electronic form [35]. Notably the review focused almost entirely on Functional Magnetic Resonance Imaging (fMRI) and neglected the extensive literature on SPECT and PET neuroimaging in psychiatric disorders.

The International Society of Applied Neuroimaging (ISAN) rapidly responded with a letter-to-the-editor. Much to our dismay, the letter was rejected. Curiously, the letter was rejected because the Journal claimed there could be no rebuttal to such APA position papers. The APA has delivered this condemnation of neuroimaging in a manner that prevented any objection, rebuttal, or discussion. It is, simply put, an indefinite moratorium.

The APA’s position had essentially three elements [1] which we will address in turn:

  1. A neuroimaging finding to have diagnostic value must have sensitivity and specificity of no less than 80% verified by at least two independent studies,
  2. The psychiatric imaging literature does not support the application of neuroimaging in psychiatric diagnostics or treatment,
  3. Neuroimaging has not had a significant impact on the diagnosis and treatment of psychiatric disorders.

Element 1: First, the APA workgroup set unrealistic standards for diagnostic biomarkers in psychiatry. A “biomarker” is a measurable or detectable indicator of the presence or severity of a disease. The APA workgroup leaned heavily on the example of amyloid imaging in Alzheimer’s disease;[35] however, they seem to miss the point that Alzheimer’s disease is a degenerative disease characterized by the accumulation of abnormal proteins – tau and amyloid, which can be quantified and visualized at autopsy. In contrast, psychiatric disorders are not so simply distinguished based on pathological markers. Rather, psychiatric disorders as defined in the DSMV are constructs conceived by a committee. Not surprisingly then, fully 60% of the DSMV diagnoses failed to stand up to diagnostic testing when subjected to field trials.[36] As an example, Major Depressive Disorder constitutes a single psychiatric diagnosis, but a patient can meet the criteria for this disorder with more than two dozen combinations of divergent symptoms as described above; yet, it is considered a single diagnosis.

Moreover, comorbidity (the presence of two or more diagnoses) is the rule, rather than the exception in psychiatry. Patients with ADHD frequently have comorbid anxiety, oppositional disorders, or learning disorders [2,37–39]. Patients with depression have a very high rate of comorbid anxiety [2,40]. Patients with PTSD, particularly veterans, often have comorbid TBI [41,42]. These comorbid diagnoses cloud the diagnostic process. The DSMV was not designed with the brain in mind and has done little to adopt the lessons learned about the neurobiology of psychiatric disorders. Furthermore, functional aspects of the brain do not neatly fit into DSMV categories [2].

In addition, it is almost laughable that the criteria for sensitivity and specificity were set at 80% by the APA workgroup. It was as if the APA was setting an insurmountable barrier for neuroimaging biomarkers. Many of the tests which are used daily in medicine and in psychiatry, in particular, lack this level of accuracy. For example, the PTSD checklist, a widely accepted scale for assessing the presence or absence of PTSD, has 70% sensitivity and 90% specificity [43]. The Draw-A-Clock test used in neurology to diagnose dementia has a sensitivity of 66% and a specificity of 65% [44]. The Hamilton depression scale and the Zung depression scale, both widely accepted self-rating scales for depression, lack sensitivity or specificity which measure up to the APA workgroup’s standard [45,46]. Looking outside psychiatry, the prostate specific antigen test remains a standard of care in screening for prostate cancer, despite low sensitivity and specificity. Similarly, multiparametric MRI has a sensitivity of 50% and a specificity of 69% [47] to detect prostate cancer, but is widely utilized. While these tests fail to meet the stringent standard proposed by the APA, they remain central to clinical care and disease detection and management.

Element 2: The review offered by the APA Workgroup [35] is heavily weighted to functional MRI and neglected extensive literature using other forms of neuroimaging. Curiously in fact, a large number of replicated studies using perfusion SPECT and fluoro-deoxyglucose-PET (FDG-PET) to identify disorders and differentiate among overlapping diagnoses were not included in the APA workgroup report. We will offer just three examples. First, numerous published, peer-reviewed studies by independent investigators show that both FDG-PET and SPECT meet the criteria set by the workgroup committee in diagnosing Alzheimer’s disease as described above [48]. FDG-PET and SPECT both have sensitivity and specificity in the diagnosis of Alzheimer’s disease between 82–89%.[48] Moreover, FDG-PET and SPECT are superior to amyloid imaging in the differential diagnosis of the various forms of dementia.[48] To be specific, a positive amyloid scan can reliably be considered evidence of Alzheimer’s disease or its precursor (sensitivity = 89%; specificity = 87%) [49]. However, the non-specific binding in amyloid scans increases dramatically with age to over 40% in patients over 80 years [48,50] Thus, the specificity of amyloid imaging declines dramatically with age. Furthermore, if an amyloid scan is negative, then the patient presumably does not have Alzheimer’s disease, but it is impossible to differentiate among the alternative forms of dementia with an amyloid scan. FDG-PET and SPECT are superior in this regard [48], and can provide clear evidence aiding in the differential diagnosis.

Second, perfusion SPECT [51,52] can readily distinguish ADHD from controls. Indeed, SPECT differentiated children who were highly likely to respond favorably to stimulants from non-responders [51]. As illustrated above, SPECT neuroimaging can provide important clues which aid in the clinical management of presumptive ADHD cases, which do not respond in a typical fashion to stimulant medications. Nonetheless, Lee and colleagues [51] characterized a reasonably sized sample of 40 medication-naïve children with ADHD compared to 17 controls using SPECT plus statistical parametric analysis before and after treatment with methylphenidate. Statistical analysis confirmed that subjects with ADHD showed decreased perfusion (activity) of the prefrontal cortex and middle temporal gyrus, but showed increased perfusion (activity) in the somatosensory cortex and anterior cingulate gyri, compared to controls. After treatment with methylphenidate, ADHD subjects showed increased perfusion of the prefrontal cortex relative to their own pre-medication scans. Perfusion in the somatosensory cortex and striatum was reduced [51]. These SPECT studies have been confirmed by numerous fMRI studies which have found similar impairment of the fronto-striatal networks. For example, Pliska and colleagues [53] found that adolescents with ADHD (N = 17) failed to show increased perfusion (activation) in the anterior cingulate bilaterally and the left ventrolateral prefrontal cortex during an inhibitory task (Stop Signal Task) compared to 15 age-matched controls. Smith and colleagues [54] similarly described decreased perfusion in the left rostral mesial frontal cortex during one interference-type concentration task and decreased perfusion in the bilateral inferior prefrontal (right more significant than left) and temporal lobes during a switch task.[54]

Third, perfusion SPECT is extremely accurate in differentiating TBI from controls and TBI from PTSD[55–57]. Notably, there is tremendous overlap (33% to 42%) between the clinical presentation of TBI and PTSD in veterans [58,59]. Diagnostic instruments routinely used by the Veterans Administration (VA) are neither sensitive, nor specific [60]. For instance, several of the symptoms assessed by questions in the Clinician-Administered PTSD scale [61] could be a result of TBI, such as sleep difficulties, irritability, poor concentration, and memory difficulties. Using perfusion SPECT neuroimaging, TBI and PTSD can be differentiated with a sensitivity of 92% and a specificity of 85% based on a study of 196 veterans [55]. Furthermore, these results were replicated in a separate civilian population of over 24,000 individuals [56]. These findings certainly meet the APA workgroup criteria for a psychiatric biomarker – greater than 80% sensitivity and specificity and replicated with independent data.
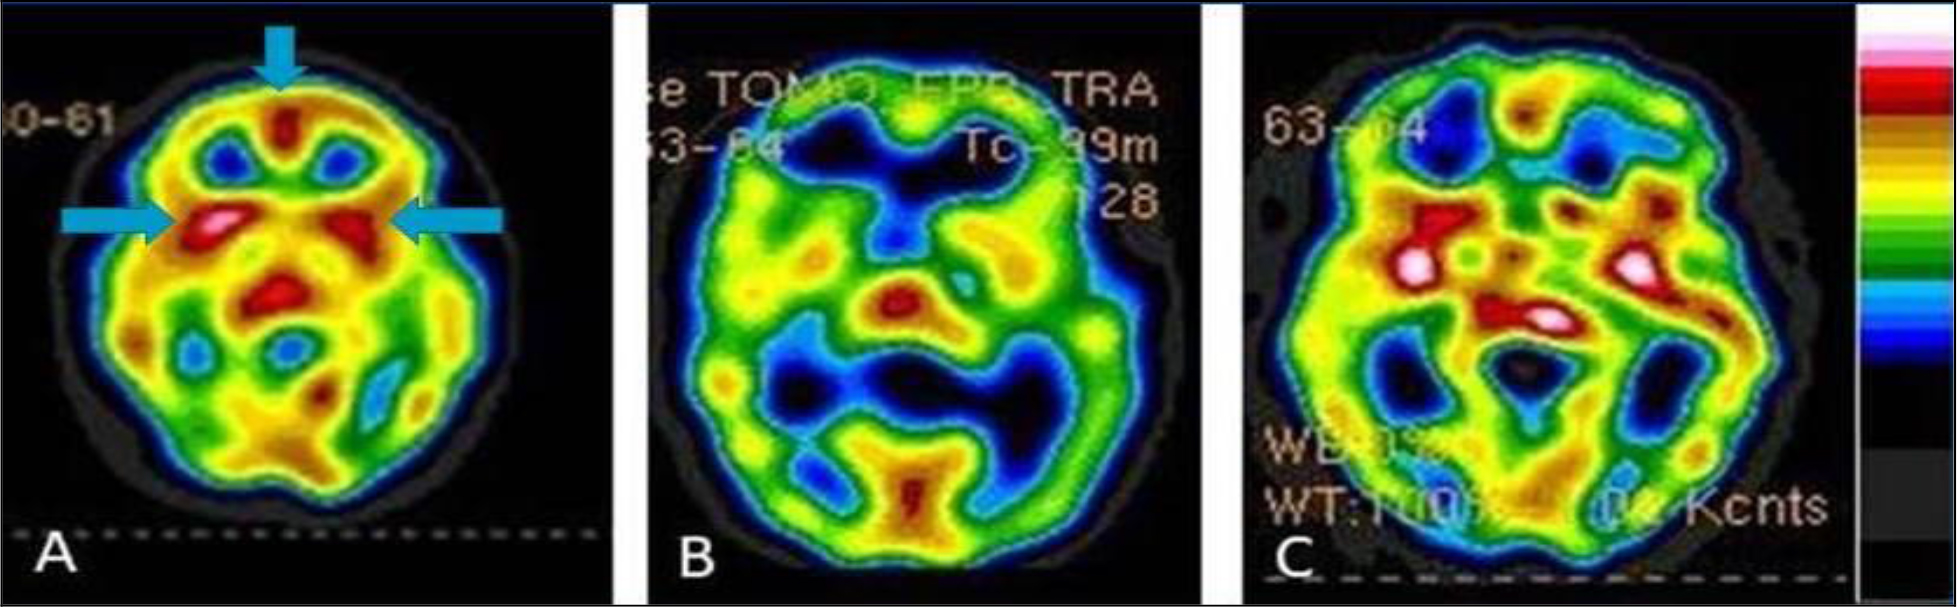
IRCI 18 - 107 - Theodore A. Henderson_F4

Figure 4. Tc-99m-HMPAO perfusion SPECT scan data presented in transverse tomogram at the level of the basal ganglia. The color scale is as in Figure 1. SPECT scans showing PTSD (A), TBI (B), and the combination of PTSD and TBI (C). Over-activity of the basal ganglia (horizontal arrows) and anterior cingulate (vertical arrow) can be seen in the PTSD case, while decreased activity in these areas is seen in TBI. Each has a very distinct appearance visually and when the default-mode network is analyzed, these conditions can be differentiated with 94% accuracy.

Element 3: The APA workgroup’s claim that neuroimaging has not had a significant impact on the diagnosis and treatment of psychiatric illnesses assumes that neuroimaging can only be helpful if it provides a pathognomonic “fingerprint” for a DSM diagnosis. Notwithstanding the absurdity of expecting imaging of the human brain to yield a hallmark of a disorder invented by a committee, issues of comorbidity and the shared final neurophysiological outcome of multiple “diagnoses” make it highly unlikely that we will have neuroimaging “fingerprints” for disorders.

Neuroimaging, like all forms of diagnostic imaging, allows a clinician to eliminate possibilities and narrow the differential diagnosis. This progression is central to any medical diagnostic process. For example, we routinely use chest X-rays in the diagnostic workup of various disorders. There is an intrinsic assumption that chest X-rays give the diagnosis. Let’s look at the example of a large solitary pulmonary mass of size greater than 4 cm. According to Reeder and Felson’s definitive text Gamuts in Radiology [62] this could be an abscess, bronchogenic carcinoma, alveolar cell carcinoma, metastasis, arteriovenous malformation, bronchial adenoma, fluid filled cyst, hamartoma, hematoma, inflammatory pseudotumor, organized nodular pneumonia, lipoid pneumonia, loculated pleural fluid, lymphoma, pneumoconiosis, pulmonary sequestration, sarcoma, or Wegener’s granuloma. How does one distinguish the likely correct diagnosis from this long list of diagnostic possibilities? It is done by clinical correlation and additional testing. The diagnosis is made ultimately by the physician as a result of synthesizing the imaging data, the testing data, and the clinical information. Psychiatry should be no different. Psychiatric diagnoses should be made based on the synthesis of data – laboratory data, clinical data, and neuroimaging data. But ultimately, the physician makes the diagnosis, not the lab test. Neuroimaging is a tool which only assists in the diagnostic process.

Neuroimaging can be diagnostic

The APA workgroup ignored several neuroimaging modalities which have demonstrated value in the differential diagnosis of TBI, dementia and other psychiatric disorders and focused almost exclusively on fMRI. One interpretation of the APA workgroup report is that fMRI has failed to live up to the expectations set forth by academia over two decades ago. Despite hundreds of millions of dollars in research funding and hundreds of years of collective research time, the over one hundred MRI research centers in the United States has failed to provide a psychiatric biomarker.

On the other hand, functional neuroimaging can offer clues and information about psychiatric disorders and their comorbid conditions. Functional neuroimaging helps clinicians to unravel complex cases. For example, ruling out toxic exposure or TBI can be highly valuable in the differential diagnosis of complex case. The highly sensitive and specific ability of SPECT neuroimaging to differentiate TBI from PTSD not only meets the APA criteria, but offers hope to tens of thousands of veterans who suffer from one or both disorders [63].

The introductory sentence of the APA position paper clearly signals the fear that drives the APA’s position, “In response to claims being made that brain imaging technology had already reached the point at which it could be useful for making a clinical diagnosis and for helping in treatment selection in individual patients, the APA Assembly passed an action paper…”[1]

Conclusion

The members of ISAN call upon the APA to re-examine neuroimaging in psychiatry with inclusion of SPECT and FDG-PET research. Rather than set unrealistic expectations for a neuroimaging biomarker, understand the value of incremental steps in a differential diagnosis. Furthermore, ISAN encouraged the APA to explore the use of SPECT and FDG-PET in psychiatry with those who are actually knowledgeable about their practical applications. We acknowledge that interpreting SPECT requires thorough training, just as with interpreting amyloid scans. SPECT scans are technically demanding and poor quality scans can be misleading and dissuasive. On the other hand, high quality SPECT scans with quantitative analysis can provide striking insights into the function of the brain across a diversity of psychiatric conditions. Lastly, neuroimaging is not something to be feared. Neuroimaging does not replace the diagnostician; rather, it can aid the diagnostician in complex cases.

References

  1. First MB, Drevets WC, Carter C, Dickstein DP, Kasoff L, et al. (2018) Clinical Applications of Neuroimaging in Psychiatric Disorders. Am J Psychiatry 175: 915–916. [crossref]
  2. Henderson TA (2018) Brain SPECT imaging in neuropsychiatric diagnosis and monitoring. EPatient 2018 1: 40–47.
  3. American Psychiatric Association (2013) Diagnostic and statistical manual of mental disorders (5th ed.). Arlington VA. American Psychiatric Association, 2013.
  4. http://boards.medscape.com/forums?128@363.ovpaa3yod6L@.2a37df02!comment=1&cat=All
  5.  Price JL, Drevets WC (2012) Neural circuits underlying the pathophysiology of mood disorders. Trends Cogn Sci 16: 61–71. [crossref]
  6.  Masdeu JC1 (2011) Neuroimaging in psychiatric disorders. Neurotherapeutics 8: 93–102. [crossref]
  7. Nagafusa Y, Okamoto N, Sakamoto K, Yamashita F, Kawaguchi A, et al. (2012) Assessment of cerebral blood flow findings using 99mTc-ECD single-photon emission computed tomography in patients diagnosed with major depressive disorder. J Affect Disord 140: 296–299. [crossref]
  8. Willeumier K, Taylor DV, Amen DG (2019) Decreased cerebral blood flow in the limbic and prefrontal cortex using SPECT imaging in a cohort of completed suicides. Transl Psychiatry 1:28.
  9. Kito S, Hasegawa T, Koga Y (2012) Cerebral blood flow ratio of the dorsolateral prefrontal cortex to the ventromedial prefrontal cortex as a potential predictor of treatment response to transcranial magnetic stimulation in depression. Brain Stimul 5: 547–53.
  10. Drevets WC, Savitz J, Trimble M (2008) The subgenual anterior cingulate cortex in mood disorders. CNS Spectr 13: 663–681. [crossref]
  11. Dumas R, Richieri R, Guedj E, Auquier P, et al (2012) Improvement of health-related quality of life in depression after transcranial magnetic stimulation in a naturalistic trial is associated with decreased perfusion in precuneus. Health Qual Life Outcomes 10: 87.
  12. Conway CR, Sheline YI, Chibnall JT, Bucholz RD, et al. (2012) Brain blood-flow change with acute vagus nerve stimulation in treatment-refractory major depressive disorder. Brain Stimul 5: 163–71.
  13. Dougherty DD1, Weiss AP, Cosgrove GR, Alpert NM, Cassem EH, et al. (2003) Cerebral metabolic correlates as potential predictors of response to anterior cingulotomy for treatment of major depression. J Neurosurg 99: 1010–1017. [crossref]
  14.  Brockmann H, Zobel A, Joe A, Biermann K, Scheef L, et al. (2009) The value of HMPAO SPECT in predicting treatment response to citalopram in patients with major depression. Psychiatry Res 173: 107–112. [crossref]
  15. Brody AL, Saxena S, Silverman DH, Alborzian S, Fairbanks LA, et al. (1999) Brain metabolic changes in major depressive disorder from pre- to post-treatment with paroxetine. Psychiatry Res 91: 127–139. [crossref]
  16.  Thornton JF, Schneider H, McLean MK, van Lierop MJ, Tarzwell R (2014) Improved outcomes using brain SPECT-guided treatment versus treatment-as-usual in community psychiatric outpatients: a retrospective case-control study. J Neuropsychiatry Clin Neurosci 26: 51–56. [crossref]
  17. Jorge RE1, Robinson RG, Moser D, Tateno A, Crespo-Facorro B, et al. (2004) Major depression following traumatic brain injury. Arch Gen Psychiatry 61: 42–50. [crossref]
  18. Fann JR, Burington B, Leonetti A, Jaffe K, et al. Psychiatric illness following traumatic brain injury in an adult health maintenance organization population. Arch Gen Psychiatry, 2004.61(1):53–61.
  19. Condray R, Morrow LA, Steinhauer SR, Hodgson M, Kelley M (2000) Mood and behavioral symptoms in individuals with chronic solvent exposure. Psychiatry Res 97: 191–206. [crossref]
  20. Bowler RM, Mergler D, Rauch SS, Bowler RP (1992) Stability of psychological impairment: two year follow-up of former microelectronics workers’ affective and personality disturbance. Women Health 18: 27–48. [crossref]
  21. Postuma RB, Aarsland D, Barone P, Burn DJ, Hawkes CH, et al. (2012) Identifying prodromal Parkinson’s disease: pre-motor disorders in Parkinson’s disease. Mov Disord 27: 617–626. [crossref]
  22. Stella F, Radanovic M, Balthazar ML, Canineu PR, de Souza LC, et al. (2014) Neuropsychiatric symptoms in the prodromal stages of dementia. Curr Opin Psychiatry 27: 230–235. [crossref]
  23. Cherkasova MV, Hechtman L (2009) Neuroimaging in attention-deficit hyperactivity disorder: beyond the frontostriatal circuitry. Can J Psychiatry 54: 651–664. [crossref]
  24. Stevens MC, Pearlson GD, Calhoun VD, Bessette KL. (2018) Functional Neuroimaging Evidence for Distinct Neurobiological Pathways in Attention-Deficit/Hyperactivity Disorder. Biol Psychiatry Cogn Neurosci Neuroimaging 3: 675–685.
  25. Lecei A, van Hulst BM, de Zeeuw P, van der Pluijm M, et al. (2019) Can we use neuroimaging data to differentiate between subgroups of children with ADHD symptoms: A proof of concept study using latent class analysis of brain activity. Neuroimage Clin 21: 101601.
  26. Henderson, TA, Hartman K (2004) Aggression, Mania, and Hypomania Induction Associated with Atomoxetine. Pediatrics 114: 895–896.
  27. Wilens TE, Waxmonsky J, Scott M, Swezey A, et al. (2005) An open trial of adjunctive donepezil in attention-deficit/hyperactivity disorder. J Child Adolesc Psychopharmacol 15: 947–955.
  28. Doyle RL, Frazier J, Spencer TJ, Geller D, et al. (2006) Donepezil in the treatment of ADHD-like symptoms in youths with pervasive developmental disorder: a case series. J Atten Disord 9: 543–549.
  29. Cubo E, Fernández Jaén A, Moreno C, Anaya B, et al. (2008) Donepezil use in children and adolescents with tics and attention-deficit/hyperactivity disorder: an 18-week, single-center, dose-escalating, prospective, open-label study. Clin Ther 30: 182–189.
  30. Geier DA, Pretorius HT, Richards NM, Geier MR (2012) A quantitative evaluation of brain dysfunction and body-burden of toxic metals. Med Sci Monit 18: CR425–431. [crossref]
  31.  Rea WJ, Didriksen N, Simon TR, Pan Y, Fenyves EJ, et al. (2003) Effects of toxic exposure to molds and mycotoxins in building-related illnesses. Arch Environ Health 58: 399–405. [crossref]
  32.  Véra P, Rohrlich P, Stiévenart JL, Elmaleh M, Duval M, et al. (1999) Contribution of single-photon emission computed tomography in the diagnosis and follow-up of CNS toxicity of a cytarabine-containing regimen in pediatric leukemia. J Clin Oncol 17: 2804–2810. [crossref]
  33. Tsai CF, Yip PK, Chen SY, Lin JC, et al. (2014) The impacts of acute carbon monoxide poisoning on the brain: Longitudinal clinical and 99mTc ethyl cysteinate brain SPECT characterization of patients with persistent and delayed neurological sequelae. Clin Neurol Neurosurg 119: 21–27.
  34. Shroff G (2018) Single-photon emission tomography imaging in patients with Lyme disease treated with human embryonic stem cells. Neuroradiol J 31: 157–167.
  35. First MB, Drevets WC, Carter C, Dickstein DP, Kasoff L, et al (2018) Clinical Applications of Neuroimaging in Psychiatric Disorders. Am J Psychiatry 175: 915–916.
  36.  Regier DA, Narrow WE, Clarke DE, Kraemer HC, Kuramoto SJ, et al. (2013) DSM-5 field trials in the United States and Canada, Part II: test-retest reliability of selected categorical diagnoses. Am J Psychiatry 170: 59–70. [crossref]
  37. Spencer T, Biederman J, Wilens T (1999) Attention-deficit/hyperactivity disorder and comorbidity. Pediatr Clin North Am 46: 915–27.
  38. Newcorn JH, Halperin JM, Jensen PS, Abikoff HB, Arnold LE, et al. (2001) Symptom profiles in children with ADHD: effects of comorbidity and gender. J Am Acad Child Adolesc Psychiatry 40: 137–146. [crossref]
  39. Pliszka SR (2003) Psychiatric comorbidities in children with attention deficit hyperactivity disorder: implications for management. Paediatr Drugs 5: 741–50.
  40. McElroy E, Fearon P, Belsky J, Fonagy P, et al. (2018) Depression/anxiety Networks of Depression and Anxiety Symptoms Across Development. J Am Acad Child Adolesc Psychiatry 57: 964–973.
  41. Henderson TA (2016) TBI and PTSD symptoms appear similar, but clinical treatments must differ: Some treatment can do more harm than good when proper diagnosis is not made. Behav Healthc 36: 34, 36–7.
  42. Hoge CW, Castro CA, Messer SC, McGurk D, et al. (2008) Combat duty in Iraq and Afghanistan, mental health problems and barriers to care. US Army Med Dep J :7–17.
  43.  Spoont MR, Williams JW Jr, Kehle-Forbes S, Nieuwsma JA, Mann-Wrobel MC, et al. (2015) Does This Patient Have Posttraumatic Stress Disorder?: Rational Clinical Examination Systematic Review. JAMA 314: 501–510. [crossref]
  44. Seigerschmidt E, Mösch E, Siemen M, Förstl H, Bickel H (2002) The clock drawing test and questionable dementia: reliability and validity. Int J Geriatr Psychiatry 17: 1048–1054. [crossref]
  45. Bagby RM1, Ryder AG, Schuller DR, Marshall MB (2004) The Hamilton Depression Rating Scale: has the gold standard become a lead weight? Am J Psychiatry 161: 2163–2177. [crossref]
  46.  Biggs JT, Wylie LT, Ziegler VE (1978) Validity of the Zung Self-rating Depression Scale. Br J Psychiatry 132: 381–385. [crossref]
  47. Hicks RM1, Simko JP, Westphalen AC, Nguyen HG, Greene KL, et al. (2018) Diagnostic Accuracy of 68Ga-PSMA-11 PET/MRI Compared with Multiparametric MRI in the Detection of Prostate Cancer. Radiology 289: 730–737. [crossref]
  48. Henderson TA (2012) The diagnosis and evaluation of dementia and mild cognitive impairment with emphasis on SPECT perfusion neuroimaging. CNS Spectrums 17: 176–206.
  49. Yeo JM, Waddell B, Khan Z, Pal S (2015) A systematic review and meta-analysis of (18)F-labeled amyloid imaging in Alzheimer’s disease. Alzheimers Dement (Amst) 1: 5–13.
  50. Rowe CC, Ng S, Ackermann U, Gong SJ, Pike K, et al. (2007) Imaging beta-amyloid burden in aging and dementia. Neurology 68: 1718–1725. [crossref]
  51. Lee JS, Kim BN, Kang E, Lee DS, et al. (2005) Regional cerebral blood flow in children with attention deficit hyperactivity disorder: comparison before and after methylphenidate treatment. Hum Brain Mapp 24: 157–64.
  52. Cho SC, Hwang JW, Kim BN, Lee HY, et al. (2007) The relationship between regional cerebral blood flow and response to methylphenidate in children with attention-deficit hyperactivity disorder: comparison between non-responders to methylphenidate and responders. J Psychiatr Res 41: 459–65.
  53.  Pliszka SR, Glahn DC, Semrud-Clikeman M, Franklin C, Perez R 3rd, et al. (2006) Neuroimaging of inhibitory control areas in children with attention deficit hyperactivity disorder who were treatment naive or in long-term treatment. Am J Psychiatry 163: 1052–1060. [crossref]
  54.  Smith AB1, Taylor E, Brammer M, Toone B, Rubia K (2006) Task-specific hypoactivation in prefrontal and temporoparietal brain regions during motor inhibition and task switching in medication-naive children and adolescents with attention deficit hyperactivity disorder. Am J Psychiatry 163: 1044–1051. [crossref]
  55. Raji CA, Willeumier K, Taylor D, Tarzwell R, et al. (2015) Functional neuroimaging with default mode network regions distinguishes PTSD from TBI in a military veteran population. Brain Imaging Behav 9: 527–34.
  56. Amen DG, Raji CA, Willeumier K, Taylor D, et al (2015) Functional Neuroimaging Distinguishes Posttraumatic Stress Disorder from Traumatic Brain Injury in Focused and Large Community Datasets. PLoS One 10: 0129659.
  57. https://www.neurologyadvisor.com/traumatic-brain-injury/advanced-neuroimaging-can-guide-interventions-in-traumatic-brain-injury/article/578028/
  58. Lew HL (2005) Rehabilitation needs of an increasing population of patients: Traumatic brain injury, polytrauma, and blast-related injuries. J Rehabil Res Dev 42: xiii-xvi. [crossref]
  59. Taylor BC, Hagel EM, Carlson KF, Cifu DX, et al. (2012) Prevalence and costs of co-occurring traumatic brain injury with and without psychiatric disturbance and pain among Afghanistan and Iraq War Veteran V.A. users. Medical Care 50: 342–346.
  60. http://www.cbs46.com/story/36965673/untested-vets-thousands-ofthe-potentially-misdiagnosed-fail-to-get-re-tested-for-tbi
  61. http://www.clintools.com/victims/resources/assessment/ptsd/protected/CAPSIV.pdf
  62. Reeder, MM, Felson B (1975) Gamuts in Radiology. Cincinnati, OH. Audiovisual Radiology of Cincinnati, Inc. 1975.
  63. https://www.psychiatryadvisor.com/home/topics/suicide-and-self-harm/veteran-suicides-fuel-widespread-demands-for-answers/


Physiology of Connective Tissues and Fascia Update Knowledge for Orthopaedic Surgeons & Rehabilitation Carers

DOI: 10.31038/IJOT.2019224

Abstract

Unlike traditional views, fascia and connective tissues are not just unimportant structure without special function. Instead, fascia can be considered a large organ without boundaries, existing as a wide-spread network, carrying multiple function. In musculoskeletal functions, fascia supports joint mobilizations, helping to form architecture of stabilizing and motivating complex controlling joint stabilities and movements. Although fascia does carry a simple function of providing tissue protection and gliding, it fulfils this role via active channels. Fibrocytes contained in the fascia are actively responding to stress and tension; while stem cells are supporting tissue regeneration.

Proprioceptive receptors in the fascia carry messages to the brain central which respond quickly and actively to stabilization requirements and other activities. The interstitial fluid within the fascia and neighboring cells and muscles are not simple “leakages” from vascular and lymphatic channels. Instead, the cellular activities within the fascia which helps to form the architecture of bodily movements, could be an important influencing force of both vascular and lymphatic circulation. The interstitial fluid, therefore, deserves to be considered the third fluid system of the human body with its specific function. The new discoveries of the fascia, therefore, carry special implications on physiological and pathological changes relevant to therapy and rehabilitation.

Classical view of Connective Tissues

Since anatomical dissections started in quest for better understanding of the human body, connective tissues existing outside and surrounding important structures and organs are revealed and described. The general attitude of anatomists and later surgeons (who dissect and give constructive measures to tissues and organs) towards connective tissues is that they are simple separating sheets of life tissues without specific function. Subsequent, observations have made a variety of fibrous connective tissues which have been given specific terminologies like: aponeurosis, ligament, tendon, retinaculum, joint capsule, epineurium, meninges, vessel coverages and periosteum. All these structures belong to simple interconnecting tensional tissues, and many varieties have been called “fascia” which in Latin, refers to bound together straps and bundles. Since fascia and other connective tissues are simple separation structures carrying no specific function, destruction and disturbance of which is expected to be followed by spontaneous replacement of a thicker and more fibrotic tissues.

Reveal of the Complicated Function of Connective Tissues and Fascia

a) Musculoskeletal Function

When joint motions were studied in details, biomechanical observations revealed that although muscle contraction is the main motivating force, contractile tissues around and special fascial arrangements all participate in synchronous supportive contractile or relaxant activities. It is now clear that connective tissues carry two district functions: to allow structural gliding and to facilitate transfer of forces. Tissue gliding is important for functional protection. The fact that important structures like muscles and organs always possess two layers of soft tissue coverages (fascia), one inner sheet wrapping tight the structure and one outside sheet to facilitate gliding. In the case of muscles and joints, the surrounding fascia ensures that the related joint remains stable in whatever position change [1].

The classical observation that fascia helps to hold small vessels and nerves which need to provide nutrition and messages in their role of interconnection. The real situation is that not only does the fascia provide passages for the vascular and nerve channels but nerve receptors: muscle spindles; Golgi tendon organs and Ruffini corpuscles; laminated or paciniform corpuscles; and free nerve endings are scattered around [1]. The implication is that movements affecting the fascia would be simultaneously initiating neurological messages up and down the fascia, possibly also extending to the connecting network of connective tissues [2]. The Myofascial connections between the adjacent muscle groups would allow much dynamic planning for therapeutic measures designed for musculoskeletal disorders [3].

b) Fascial Cytology

Cells in the fascial connective tissues carry specialized functions. There are two main types: fibrocytes and stem cells. The fibrocytes are provided with integrin receptors on their surfaces and are mechanically coupled to the actin cytoskeleton of the cell, forming a pathway to sense external forces and allow the cell to respond with changes of cell shape. The cells can activate internal chemical signaling pathways, increase stress-fiber assembly and adhesive strength, and form focal adhesions in response to externally applied mechanical forces [4].

The dynamic properties of the fibrocytes help with muscular activities suitable for different forms of stress and requirements. They are also responsible for the cyclin changes of intramuscular pressure which assists in venous return of blood to the heart. The presence of nerve fibrils and sensors within the fascia network has granted the fascia a specific functional role. Mechanoreceptors, also called muscle receptors are arranged in the context of force transmissions i.e. around and within muscle and connective tissues. Other receptors for proprioception are concentrated in those areas where tensile stresses are mostly felt and they are responsible for the maintenance of joint integrity and stability. Since the fascial system all over the body overlooks the proprioceptive stability of the whole body, the role of the connective tissues as an important proprioception stabilizer in the locomotor apparatus, individually and in collaboration with the Central Nervous System cannot be overstressed [1].

Another type of cells in the soft tissues of the fascia is the stem cells that possess regenerative power obviously responsible for the reparative need of musculoskeletal tissues. The dynamic nature of the stem cells: their versatility of regenerative direction and their ability to freely move following the network of fascial arrangement is well known but yet has not been thoroughly studied. Not only are the mechanisms of cellular transformation to various deficiency or reparative needs important, but the mobility of the cells is crucial. The relationship between inflammation and cellular degradation occurring within the soft tissues would be of major concern.

c) Fluid Flow

The proper function of mechanical stability and neural transmission demands an efficient fluid flow within the fascial network. Likewise, the same dynamic flow would allow efficient movement of stem cells. It has always been taken for granted that interstitial fluid occurs between cells, tissues and organs and that it passively serves the neighboring tissues and structures without additional role in the overall well-being of the system. The feeding of the interstitial fluid is also taken for granted that either the general vascular circulation or the lymphatic system would be taking care of this spatial fluid. It is of course true that the interstitial fluid comes from both the general circulation and the lymphatic system. But the discovery of neural sensors and special cells within the fascia and in the interstitial fluid itself has changed the old belief.

The general vascular circulation is responsible to maintain the normal fluid balance of the body while at the same time taking care of the lymphatic system. Venous return and lymphatic flow on the other hand are assisted by the “muscle pump” of the lower limb: a manifestation of programmed muscle contractions. Studies of the fascia and interstitial fluid revealed that cellular activities in the fascia are constantly regulating fluid flow and muscle contractures actively. It is therefore concluded that three systems of fluid flow are interconnecting and they are mutually influencing one another’s functional flow efficiency in a harmonious balance. This balance is crucial for the transport of nutrients, passage of neurological messages and tissue repair [5].

Significance of the New Findings

The existence of the three circulating fluid systems that maintains a harmonious balance of activities in the musculoskeletal system gives special insight for the orthopaedic field. Surgeons during their surgical dissections would give special considerations to the fascia, particularly when it is related directly to ligaments, aponeurosis and tendons. Rehabilitation workers would be giving special attention to their routine stretches and manipulations to ensure that the effects would stimulate fascial stretches and movements so as to achieve effective stimulations to the nerve receptors and different types of cells in the soft tissue. Individuals aware of the special fascial physiology would start adopting a life style that ensures mobility and efficiency of fluid flow. The adaptation carries a comprehensive change of attitude not only for leisure training but also during work hours.

One scientific report was published in March 2018 describing in detail the fascial anatomy and the interstitial fluid and its contents. It was postulated that those structures could be important in cancer metastasis, edema, fibrosis and mechanical functioning of many tissues and organs [6]. Indeed, fascia exist not only in musculoskeletal structures, but everywhere in the human body. It exists in close harmony with its adjacent tissues and organs sharing their functional need, while at the same time help to fulfill the physiological role of the blood circulatory and lymphatic garaging systems.

References

  1. Van den Wal J (2009) Architecture of Connective Tissue in the musculoskeletal system: Fascia Research II Elsevier, Munchen 2009: 21–27.
  2. Goddard MD, Red ID (1965) Movements induced by straight leg raising in the lumbo-sacral roots, nerves and plexus, and in the intrapelvic section of the sciatic nerve. J Neurol Neurosurg Psychiatry 28: 12–18.
  3. Huijing PA (2003) Muscular force transmission necessitates a multi-level integrative approach to the analysis of function of skeletal muscle. Exerc Sport Sci Rev 31: 167–175.
  4. Grinnell F (2003) Fibroblast biology in three-dimensional collagen matrices. Trends Cell Biol 13: 264–269
  5. Peter Chin Wan Fung, Regina Kit Chee Kong (2016) The Integrative Five-Fluid Circulation System in the Human Body. Open J Molecular and Integrative Physiology 6: 45–97.
  6. Benias PC, Wells RG, Theise ND (2018) Structure and Distribution of an unrecognized interstitium in Human Tissues.  www.anature.com/scientific report.

Saying NO to Drugs: Two Mind Sets & Messaging Direction

DOI: 10.31038/JPPR.2019232

Abstract

We present a way to understand what messages may resonate with ordinary people regarding the negative effects of drugs. We identify six Questions or categories of statements, mix and match them, and present the combinations (vignettes) to ordinary respondents, over the web. The responses to the vignettes are deconstructed into the contribution of each individual element. We find clear differences by gender, age, and education, but NO patterns which lead to general knowledge. We divide the respondents by the pattern of their individual responses to the elements, which division reveals two equal size mind-sets. Mind-set 1 responds to scare tactics, facts. There is little in the way of convincing these respondents. Mind-set 2 responds to what it will to them, personally, at an emotional level. These respondents can be reached and convinced by the proper messaging.

Introduction

The notion of ‘addiction’ is not a new one. The notion of a drug problem is certainly not a recent development. Historically, the drugs involved in the world of ‘drug problems’ have been related to the products created out of poppy seeds, products that promised relief from pain, but were found to be addictive. The literature, stories, poetry, plays, is replete with depictions of people in opium dens (ref.) Famous characters in the literature of the time were featured as addicts to one or another opium-derived product, such as the legendary detective created by Arthur Conan Doyle, namely Sherlock Holmes [1, 2]. Wars have been fought over drugs, such as the Opium Wars in China.

For a long time, the topic of addiction has been one applying to alcohol, tobacco, and drugs [3] As a species, homo sapiens appears to have a predilection to become addicted to something or other. People, in fact, can be described as being addicted to gambling, addicted to a sport, a hobby, even addicted to work [4]. We hear of addiction to foods, to sweets, with the word ‘crave’ used to describe the desire for food in the same way that the drug addict ‘craves’ a ‘fix.’ People can be even be said to be addicted to each other, especially at the early stages of infatuation. This paper focuses on addiction to drugs, specifically on what one communicates to avoid addiction.

The scholarly literature is replete with studies documenting the nature of addiction. These studies usually concern the nature of addiction of people at different stages of life, in different circumstances. There is a sense that the pattern of addiction may co-vary with who the person is, and the situation in which the finds himself or herself [5–7]. There is a notion, however, that the mind of the individual may be very important in the nature of the addiction to which a person is subject [8]. The point of view about the link between personality and addiction, and the possibly ‘addiction-leaning personality’ can be found in the research reports going back three quarters of a century, to 1944 [9], and undoubtedly earlier with the works of psychoanalysts such as Freud and Jung [10].

On almost a daily basis we hear stories about the opioid crisis, a drug problem which has taken the place of previous big stories about crack and heroin, and before that morphine and opium. As a species, we humans can become addicted quite easily to many of these drugs, which cause an initial rush or feeling of wellness, but which can slowly become the master of the person, forcing that person to do anything to get the daily ‘fix, ’ (Kolodny et. al., 2015.) Addiction has become more than a problem. It has become an entire causa-belli, war cry, as activists blame food companies for making food ‘addicting’ [12].

In Western Europe drugs have been a problem in the real life, as products like heroin and morphine, so touted for health and freedom from agonizing pain have been found to be remarkably addictive. The many studies on these drugs could themselves occupy several books, just for a literature review. The social issues of addiction, the change in personality, and the creation of entire subcultures of addiction have been documented again and again. One need only go to sources such as Google® Scholar to see the dramatic, ever increasing number of papers devoted to drug dependency.

In recent years the focus on opium-based drugs has taken a back seat to the emerging problem of opiods, available by prescription (e.g., oxycontin), given for pain relief, and powerfully addictive. What started out as a new way to get rid of pain has, in turn, morphed into a social problem, involving over-prescriptions, unnecessary prescriptions to satisfy addiction, and a decline in the moral character of some individuals in the medical professional and cooperating pharmacies.

What is missing in all of these studies is a profound understanding of how to prevent drug addiction. There is now widespread appreciation of the addiction problem, especially its prevalence, and the group mantras of messages which are supposed to communicate the will to resist drugs and addictions, such as ‘Say NO to Drugs.’ These are important slogans, analogous to patriotic war slogans, memorable, rallying cries, designed to inspire. Yet there is a gaping lack of knowledge. What inspires an individual person? What specific messages can one use to communicate about avoiding drugs?

We deal here with applying the method of experimental design of messages to identify specific messages which might work. This study is not designed to provide the ultimate data, but rather designed to explore whether the methods subsumed in the science of Mind Genomics can be used to convey messages about drugs with the same efficacy as sending messages about food. The latter, messages about food and drink, are designed to persuade consumers to buy the product. The former, message about drugs and addiction, are designed to inform about the perils of addiction, with the hope of reducing drug abuse.

As part of a new effort to understand the mind of the next generation, the so-called ‘millennials, ’ we embarked on a series of projects in which millennial respondents of college age were to select a topic of interest to predefined groups of four researchers. It would be the task of this ad hoc ‘research group’ to generate the different messages to be tested within the structure of a Mind Genomics experiment. That is, we changed the typical structure of research, wherein professionals design the study, and test with the appropriate sample of respondents.

The rationale for letting the millennials become the researchers comes from the desire to understand how they respond about the topic of drugs. By instructing the millennials to come up with the test stimuli, and then test those stimuli, we discover both what is important to the millennial from the messages they choose, and how these messages convince respondents in the general population.

Method

The foundations of Mind Genomics have been treated in a variety of papers and books, to which the reader is referred [13–15] Briefly, Mind Genomics begins with a topic, asks a series of questions which ‘tell a story, ’ provides a set of answers to each question (messages), combines these messages into combinations, presents the combinations to respondents, obtains ratings, deconstructs the ratings into the contribution of the individual messages, and finally creates both new-to-the-world mind-sets, as well as a PVI, a personal viewpoint identifier, to assign new people to one of the mind-sets previously discovered through the Mind Genomics experiment.

We begin with the set of questions and answers, i.e., Questions or categories of ideas, and then the specific elements pertaining to each Question. The Questions and the elements appear in Table 1. We have phrased the Question as a question, which is how the development of the test elements occurs. The research group works with a topic, comes up with the requisite number of questions or Questions (here six), the order of the questions or Questions which thus ‘tell a story, ’ and then the relevant elements or answers to each question.

Table 1. The test stimuli.


Question A: What is the damage that drugs can wreak on your body?

A1

Anything that makes you less than you is not for you, especially drugs and alcohol…  

A2

Keep healthy teeth…smoking and other drugs harm them

A3

Drug use can make you ill and an overdose can kill Some drugs can kill your brain cells and brain cells cannot grow back

A4

Drug use can lower your lung capacity

A5

Keep a healthy heart…stay away from drugs

A6

Drug use can make you ill and an overdose can kill


Question B: How do drugs affect your personality and social life?

B1

Drugs can change the person you are…without realizing it Enjoy every day of your life, without having to rely on drugs to make you feel normal Don’t associate with the wrong people…taking drugs isn’t cool

B2

A person can undergo a complete personality change when under the influence of drugs

B3

Friends are there to help when you’re down … Drugs drag you down further

B4

Drugs can limit the friends you keep

B5

Enjoy every day of your life, without having to rely on drugs to make you feel normal

B6

Don’t associate with the wrong people…taking drugs isn’t cool


Question C: What are the effects of drugs on your family?

C1

Family will always be there, but the “high” will go away… 

C2

Your bond with drugs can break the bonds in your family

C3

If your children look to you as an example, you are, in effect, giving them permission to abuse drugs 

C4

Drug addicted parents can seldom offer a stable family life to their children

C5

Every minute spent using drugs is a minute lost with a loved one

C6

Babies of drug addicts are far more likely to be underweight and to suffer from birth complications


Question D: What financial damage does drug addiction wreak on you?

D1

Drug use interferes with your ability, which can make it harder to earn money

D2

The price you pay for drugs is more expensive then you think…they can cost you your life

D3

Drugs cost a lot of money… which can be invested in more positive things

D4

Court costs, legal fees, fines, a higher insurance rates all come with drug abuse

D5

Drugs can make you sell your belongings for money

D6

Addiction does more than harm your body…it can do lasting damage to your pocketbook and future earnings


Question E: How are drugs associated with crime and punishment?

E1

The #1 reason for arrest in the U.S is for Marijuana possession

E2

Buying and taking drugs supports criminals and terrorists 

E3

Don’t be apart of crime…being under the influence can make you do things you’ll regret

E4

Possessing drugs is a crime…a criminal record limits what you can do

E5

 Addicts guilty of NO other crime than illegal possession of narcotics, are filling the jails, prisons, and penitentiaries of the country

E6

Almost all the opium in the U.S is made and grown in Afghanistan and funds terrorist groups


Question F: What are other social problems emerging from the addiction to drugs?

F1

You have NO idea how many people died getting that drug into America

F2

Everyone has hopes and dreams for the future, but for addicts those hopes and dreams only focus down to where the next score is coming from

F3

Taking drugs definitely gives you a new lifestyle, but it is the lifestyle of a sad loser with NO prospects

F4

Outdoor cannabis cultivation, particularly on public lands, is causing increasing environmental damage

F5

Some of the most bitter ethnic and religious conflicts worldwide are fueled by drug income

F6

Chronic cannabis smokers present low fertility

When we look at the six questions in Table 1, we see that the millennials focus on the damage done by drugs. This insight, simply by itself, is valuable. It means that the younger people focus on drugs and damage, on negative effects. One might say that their questions are obvious, but not necessarily? Would, in fact, a PR company given the same task come up with the same Questions as the millennials? We don’t know. We do know, however, that this type of exercise forces the millennials to think about drug abuse in their own way, from their own perspective.

Creating vignettes by experimental design

Mind Genomics uncovers the contribution of the different elements by incorporating these elements into combinations, test vignettes. The vignettes comprise either three or four elements, a maximum of one element from a Question, but often NO element from a Question. The composition of the vignettes is dictated by an underlying experimental design, ensuring that the 36 elements are statistically independent across the set of 48 vignettes created for each respondent. Each element appears five times across the 48 vignettes, and thus is missing from 43 of the 48 vignettes. Finally, each respondent evaluates a unique set of 48 vignettes, created according to the same experimental design, but with the combinations different [13] This strategy ensures that the test vignettes cover a wide number of possible combinations. Furthermore, the strategy means that one need not know which combinations to create ahead of time. The more conventional approach would create a fixed set of 48 vignettes, present this fixed set of vignettes in different orders to respondents, average the ratings, and by so doing get a stable data set. Mind Genomics dispenses with that single set of vignettes.

The interview

The actual experiment begins with an invitation to panelists who are members of an on-line panel. These individuals have agreed to participate, in return for rewards dispensed by the company which provides the panel. Working with a panel company makes it easy to do these experiments, in return for a modest payment per respondent for the participation.

When the respondent agrees to participate, the respondent hits the embedded link in the email invitation, from which the interaction begins. Figure 1 shows the orientation page for the study. The orientation page tells the respondent a little about the study but provides NO information about what is expected. That lack of information is important. Anything in the orientation page providing greater detail is likely to set up the expectations of a ‘correct answer’ and thus bias the data in ways that are unknown.

Mind Genomics-019 - JPPR Journal_F1

Figure 1. The respondent introduction to the study on abusing drugs.

Each respondent evaluated 48 different vignettes, rating each vignette on two rating scale attributes. This paper will present results only from the first scale (How likely are you to say NO to drugs based on this information.) Figure 2 shows an example of a vignette. The experimental design dictated that 36 of the 48 vignettes would comprise four elements, one from each of four Questions, and that the remaining 12 of the 48 vignettes would comprise three elements, one from each of three Questions.

Mind Genomics-019 - JPPR Journal_F2

Figure 2. Example of a four-element vignette created according to the experimental design, for a specific respondent.

Transformation of the ratings from a 9-point to a binary scale and regression modeling

One of the ongoing ‘discoveries’ emerging from Mind Genomics is that users of the data report that they have difficulty understanding exactly what a scale point means. They understand the anchors of the scale (not likely and very likely, respectively), but they do not know how to interpret the values on the scale. Rather than label each point, a task which itself is fraught with biases of interpretation, we transform the rating scale into a binary scale, with ratings 1–6 transformed to the number 0, and ratings 7–9 transformed to 100. This transformation has been consistently used since 1985, and appears to work well, except for some countries wherein the respondents often ‘up-rate’ the vignettes, and which require a slightly more stringent transformation (1–7 transformed to 0, 8–9 transformed to 100.)

The transformation accomplishes its purpose, which is to make the user’s interpretation of the results simple. The numbers now deal with either NO (not interested in saying NO to drug) or yes (interested in saying NO to drugs). In order to ensure that the OLS (ordinary least-squares) regression will not crash, we add a small random number (<10–5) to each transformed number. The random number does not materially affect the results, but does ensure that the OLS regression will work for a respondent who limits his or her ratings either to the low end of the scale (1–6, all transformed to 0), or the high end of the scale *7–9, all transformed to 100).

OLS regression is the preferred way to analyze the data. OLS regression deconstructs the binary rating into the contribution of both the additive constant (basic interest in avoiding drugs, in the absence of elements, viz., an estimated baseline), and the contribution of the 36 individual elements. Even when the respondent avers that she or he simply cannot state how much of the rating is due to each element, the OLS regression reveals that contribution.

How the individual regression models fit the original 9-point ratings

During the past two decades, numerous complaints have emerged among communities of professionals engaged in polling consumers. The complaints emerge out of the reality that consumers are increasing being asked to fill out questionnaires, virtually for every action they take in the commercial environment. When a consumer purchases a product on line or in a store, when a consumer uses a bank service or a medical service, when a consumer travels and stays at a hotel, one can be fairly certain that in an increasing proportion of those transactions there will be a follow-up request for the consumer to rate the transaction and even to provide deeper responses, e.g., through an automated interview.

The consequence is that the respondents are increasingly hesitant to participate in the studies, and the quality of the data from those who do participate have dropped. In previous studies with Mind Genomics, we have presented the distribution of goodness of fit statistics across individuals to assess the quality of data. The statistic used, the multiple R-squared, shows the proportion of variability in the ratings accounted for by the multiple linear regression.

Figure 3 shows the distribution of the R-squared values across the 50 respondents. What is remarkable is the very high individual models for goodness of fit. We attribute the quality of data to the importance of the topic. For other topics of far less social relevance, such as a credit card, the good of fit statistics are far poorer. It should be noted that whether we average good fitting models (such as those for this study) or average ‘noisy’ models (such as those for a credit card), the measure of central tendency, will still reveal what is important, and what is not important. Our focus here is simply to show how respondents pay attention to this important topic.

Mind Genomics-019 - JPPR Journal_F3

Figure 3. Distribution of the goodness-of-fit of the 50 individual models for Say NO to Drugs. The model relates the presence/absence of the elements to the 9-point rating (before the binary transformation).

How the individual elements drive the interest in Saying NO to Drugs

Our first substantive analysis deals with the degree to which the 36 different messages drive the response to say ‘I’ll say not to drugs.’ (see Table 2.) Recall that the dependent variable, the 9-point scale, was transformed to a binary scale, after which the OLS regression was run on the 50 individual data sets, one from each respondent, with each data set comprising 48 cases or observations.

Table 2. Performance of all of the elements as drivers of ‘saying NO to drugs’.


Say NO To Drugs (Question #1) – Coefficients of the Binary Model

Total


Base Size

50


Additive Constant

48

F2

Everyone has hopes and dreams for the future, but for addicts those hopes and dreams only focus down to where the next score is coming from

10

B5

Enjoy every day of your life, without having to rely on drugs to make you feel normal

9

B3

Friends are there to help when you’re down .. Drugs drag you down further

7

B4

Drugs can limit the friends you keep

7

C6

Babies of drug addicts are far more likely to be underweight and to suffer from birth complications

6

A6

Drug use can make you ill and an overdose can kill

5

C4

Drug addicted parents can seldom offer a stable family life to their children

5

D6

Addiction does more than harm your body…it can do lasting damage to your pocketbook and future earnings

5

F1

You have NO idea how many people died getting that drug into America

5

B1

   Drugs can change the person you are…without realizing it Enjoy every day of your life, without having to rely on drugs to make you feel normal Don’t associate with the wrong people…taking drugs isn’t cool

4

F3

Taking drugs definitely gives you a new lifestyle, but it is the lifestyle of a sad loser with NO prospects

4

B2

A person can undergo a complete personality change when under the influence of drugs

3

E6

Almost all the opium in the U.S is made and grown in Afghanistan and funds terrorist groups

3

F5

Some of the most bitter ethnic and religious conflicts worldwide are fueled by drug income

3

A2

Keep healthy teeth…smoking and other drugs harm them

2

C3

If your children look to you as an example, you are, in effect, giving them permission to abuse drugs 

2

C5

Every minute spent using drugs is a minute lost with a loved one

2

D4

Court costs, legal fees, fines, a higher insurance rates all come with drug abuse

2

E3

Don’t be a part of crime…being under the influence can make you do things you’ll regret

2

C2

Your bond with drugs can break the bonds in your family

1

F6

Chronic cannabis smokers present low fertility

1

A3

Drug use can make you ill and an overdose can kill Some drugs can kill your brain cells and brain cells cannot grow back

0

A1

Anything that makes you less than you is not for you , especially drugs and alcohol…  

-1

D5

Drugs can make you sell your belongings for money

-1

E2

Buying and taking drugs supports criminals and terrorists 

-1

A4

Drug use can lower your lung capacity

-2

B6

Don’t associate with the wrong people…taking drugs isn’t cool

-2

D1

Drug use interferes with your ability, which can make it harder to earn money

-2

D3

Drugs cost a lot of money… which can be invested in more positive things

-2

D2

The price you pay for drugs is more expensive then you think…they can cost you your life

-3

A5

Keep a healthy heart…stay away from drugs

-4

C1

Family will always be there, but the “high” will go away… 

-4

E4

Possessing drugs is a crime…a criminal record limits what you can do

-4

E5

 Addicts guilty of NO other crime than illegal possession of narcotics are filling the jails, prisons and penitentiaries of the country

-4

E1

The #1 reason for arrest in the U.S is for Marijuana possession

-5

F4

Outdoor cannabis cultivation, particularly on public lands, is causing increasing environmental damage

-5

Table 3. The strong performing elements, by gender, as drivers of ‘saying NO to drugs’.


Male

Female


Base Size

12

38


Additive constant

29

54

B5

Enjoy every day of your life, without having to rely on drugs to make you feel normal

23

4

B4

Drugs can limit the friends you keep

20

3

F2

Everyone has hopes and dreams for the future, but for addicts those hopes and dreams only focus down to where the next score is coming from

18

7

F5

Some of the most bitter ethnic and religious conflicts worldwide are fueled by drug income

17

-1

A6

Drug use can make you ill and an overdose can kill

16

1

C6

Babies of drug addicts are far more likely to be underweight and to suffer from birth complications

16

3

B2

A person can undergo a complete personality change when under the influence of drugs

14

0

F3

Taking drugs definitely gives you a new lifestyle, but it is the lifestyle of a sad loser with NO prospects

14

1

D2

The price you pay for drugs is more expensive then you think…they can cost you your life

13

-8

E3

Don’t be a part of crime…being under the influence can make you do things you’ll regret

13

-2

A4

Drug use can lower your lung capacity

11

-6

B1

Drugs can change the person you are…without realizing it Enjoy every day of your life, without having to rely on drugs to make you feel normal Don’t associate with the wrong people…taking drugs isn’t cool

10

3

F6

Chronic cannabis smokers present low fertility

9

-2

A1

Anything that makes you less than you is not for you, especially drugs and alcohol…  

8

-4

A2

Keep healthy teeth…smoking and other drugs harm them

8

0

D6

Addiction does more than harm your body…it can do lasting damage to your pocketbook and future earnings

8

3

B3

Friends are there to help when you’re down.. Drugs drag you down further

3

8

When we average the individual models from the 50 respondents, we see the following:

  1. Additive constant = 48 = conditional probability that the respondent will say ‘NO to drugs” in the absence of any elements in a vignette. For the total the additive constant is 48, meaning that in the absence of elements, we already have a moderate predisposition to say that they will say NO to drugs. The experimental design ensures that each vignette comprises 3–4 elements, so the additive constant is an estimated parameter. The additional motivation will come from the elements themselves.
  2. The sorted elements. Previous studies suggest that coefficients about 8 or higher correspond to elements which have a meaningful effect when used. We use the term ‘meaningful’ rather than statistically significant because a coefficient can have the value of 2 or 3 and be statistically significant owing to the large number of ratings, and thus the increased likelihood that even a small coefficient will be statistically significant.
  3. The two elements which score strongly combine both the positive and the negative. It may well be that the key to increasing donation is a combination of the so-called ‘carrot and stick, ’ and not just the ‘stick’ alone.

    Everyone has hopes and dreams for the future, but for addicts those hopes and dreams only focus down to where the next score is coming from

    Enjoy every day of your life, without having to rely on drugs to make you feel normal

Gender differences

We now focus only on those elements which perform strongly (coefficient > 6.51) for either males or females. Our data suggests dramatic differences, and reveals a new, unexpected pattern emerging from the additive constant and the performance of the elements.

  1. The study incorporated more females than males. That, however, is simply a observation, and does not affect the differences between the genders:
  2. The additive constant is far higher for the females than for the males (54 vs 29.) In practical terms, this means that the interesting in ‘staying NO to drugs’ is basically higher among females than it is among males. In the absence of elements, the conditional probability of a female saying “NO” is almost twice as high as the conditional probability for a male.
  3. Males respond very strong to some of messages, however, with coefficients of 15 or higher, a value that has been operationally accepted as a very strong driver of the dependent variable, in our case the likelihood of saying NO.
  4. The strong messages for male are primarily emotional and personal, bringing in the respondent, but also talking about the negatives of drugs. The only exception is the element talking about ethnic and religious conflicts, which do not bring in the respondent to the element, but simply state a fact.

    Enjoy every day of your life, without having to rely on drugs to make you feel normal

    Drugs can limit the friends you keep

    Everyone has hopes and dreams for the future, but for addicts those hopes and dreams only focus down to where the next score is coming from

    Some of the most bitter ethnic and religious conflicts worldwide are fueled by drug income

    Drug use can make you ill and an overdose can kill

    Babies of drug addicts are far more likely to be underweight and to suffer from birth complications

  5. There is only one strong message for females, the one which talks about friendship.

    Friends are there to help when you’re down … Drugs drag you down further

Age differences

Do we see the same strong differences by age that we did by gender? Table 4 shows us that the three age groups exhibit virtually the SAME additive constant, 47–49. The quite large differences emerge in the performance of the elements.

Table 4. The strong performing elements, by age, as drivers of ‘saying NO to drugs’.


Age 18–29

Age 30–52

Age 53+


Base Size

13

19

18


Additive constant

47

49

48


Age 18–29 (Respond to concrete information)


F1

You have NO idea how many people died getting that drug into America

18

-1

3

F2

Everyone has hopes and dreams for the future, but for addicts those hopes and dreams only focus down to where the next score is coming from

13

6

10

F5

Some of the most bitter ethnic and religious conflicts worldwide are fueled by drug income

12

-11

12

C2

Your bond with drugs can break the bonds in your family

11

-7

4

C6

Babies of drug addicts are far more likely to be underweight and to suffer from birth complications

9

4

5

D3

Drugs cost a lot of money… which can be invested in more positive things

9

-8

-4

D5

Drugs can make you sell your belongings for money

9

-4

-5

A6

Drug use can make you ill and an overdose can kill

8

4

2


Age 30–52 (Appeal to emotion and well-being)


B5

Enjoy every day of your life, without having to rely on drugs to make you feel normal

-3

12

14

A2

Keep healthy teeth…smoking and other drugs harm them

-9

10

1

B4

Drugs can limit the friends you keep

4

9

8

B3

Friends are there to help when you’re down … Drugs drag you down further

-3

7

13


Age 53+ (information that a parent might convey to a child)


F3

Taking drugs definitely gives you a new lifestyle, but it is the lifestyle of a sad loser with NO prospects

3

-7

16

B1

Drugs can change the person you are…without realizing it Enjoy every day of your life, without having to rely on drugs to make you feel normal Don’t associate with the wrong people…taking drugs isn’t cool

-5

3

12

E3

Don’t be a part of crime…being under the influence can make you do things you’ll regret

-11

3

9

B2

A person can undergo a complete personality change when under the influence of drugs

-4

2

9

C4

Drug addicted parents can seldom offer a stable family life to their children

5

1

9

C3

If your children look to you as an example, you are, in effect, giving them permission to abuse drugs 

-5

-1

9

D6

Addiction does more than harm your body…it can do lasting damage to your pocketbook and future earnings

-1

5

8

E6

Almost all the opium in the U.S is made and grown in Afghanistan and funds terrorist groups

1

1

8

  1. The types of messages which drive the different ages to say NO suggest patterns, but there may be some elements which perform well but depart from that pattern. Nonetheless, Table 4 suggests different types of information to which the three age-groups respond:
  2. Age 18–29: They respond to concrete information, messages which paint a clear ‘word-picture.’
  3. Age 30–52: They respond to messages which talk about the loss of ‘feeling good.’
  4. Age 53+: They respond to messages which sound very much like a parent or older adult might convey to a younger person.

Where the person lives

The three groups differ in the additive constant (especially city versus rural and suburban), as well aa differing dramatically in the messages which drive each group to say ‘NO to drugs’ (Table 5.)

Table 5. The strong performing elements, by where one lives, as drivers of ‘saying NO to drugs’.


Rural

Suburban area outside a city

City


Base Size

14

20

16


Additive constant

42

46

56


Rural – Elements which deal with about drugs and bad endings


B3

Friends are there to help when your down … Drugs drag you down further

19

4

-1

F2

Everyone has hopes and dreams for the future, but for addicts those hopes and dreams only focus down to where the next score is coming from

14

11

4

B1

 Drugs can change the person you are…without realizing it Enjoy every day of your life, without having to rely on drugs to make you feel normal Don’t associate with the wrong people…taking drugs isn’t cool

12

4

-2

B6

Don’t associate with the wrong people…taking drugs isn’t cool

12

-5

-12

C3

If your children look to you as an example, you are, in effect, giving them permission to abuse drugs 

12

5

-12

E6

Almost all the opium in the U.S is made and grown in Afghanistan and funds terrorist groups

12

2

-3

D6

Addiction does more than harm your body…it can do lasting damage to your pocketbook and future earnings

11

2

2

C5

Every minute spent using drugs is a minute lost with a loved one

10

1

-2


Suburban – Bad for your wallet, your family, your social life


B5

Enjoy every day of your life, without having to rely on drugs to make you feel normal

8

22

-7

A6

Drug use can make you ill and an overdose can kill

5

15

-9

F1

You have NO idea how many people died getting that drug into America

-4

12

6

C6

Babies of drug addicts are far more likely to be underweight and to suffer from birth complications

9

10

-2

B2

A person can undergo a complete personality change when under the influence of drugs

7

10

-9

A2

Keep healthy teeth…smoking and other drugs harm them

6

8

-8

D4

Court costs, legal fees, fines, a higher insurance rates all come with drug abuse

5

8

-9


City – Very little reaches them, other than changing lifestyle


B4

Drugs can limit the friends you keep

4

7

10

F3

Taking drugs definitely gives you a new lifestyle, but it is the lifestyle of a sad loser with NO prospects

-10

7

12

  1. The additive constant, the basic proclivity to say ‘NO to drugs’ is higher for those respondents who live in the city, lower for those in a rural area.
  2. Rural – talk about drugs and bad endings.
  3. Suburban – talk about the financial problems with drugs, and the difficulties with family and social life.
  4. City – very little reaches them except other than it eventuates in a less pleasant social life.

The respondent’s education

We see substantial differences by education, as shown by in
Table 6. The differences do not tell as clear a story as did the differences among the previous complementary subgroups.

Table 6. The strong performing elements, by one’s education, as drivers of ‘saying NO to drugs’.


Completed high school

Some
college

College Vocational School


Base Size

10

17

23


Additive constant

64

30

55


High School – High constant, NO specifics


Some College-NO clear pattern, but many elements drive positive response of ‘Say NO’


B4

Drugs can limit the friends you keep

-2

20

2

B5

Enjoy every day of your life, without having to rely on drugs to make you feel normal

1

19

6

D6

Addiction does more than harm your body…it can do lasting damage to your pocketbook and future earnings

-6

18

-1

C5

Every minute spent using drugs is a minute lost with a loved one

-3

17

-7

C4

Drug addicted parents can seldom offer a stable family life to their children

-2

14

1

A4

Drug use can lower your lung capacity

-13

14

-8

B1

Drugs can change the person you are…without realizing it Enjoy every day of your life, without having to rely on drugs to make you feel normal Don’t associate with the wrong people…taking drugs isn’t cool

-5

10

4

A2

Keep healthy teeth…smoking and other drugs harm them

-14

8

4

B2

A person can undergo a complete personality change when under the influence of drugs

-10

11

3

A3

Drug use can make you ill and an overdose can kill Some drugs can kill your brain cells and brain cells cannot grow back

-7

8

-3

F6

Chronic cannabis smokers present low fertility

-3

11

-5

A1

Anything that makes you less than you is not for you, especially drugs and alcohol…  

-13

10

-5

D2

The price you pay for drugs is more expensive then you think…they can cost you your life

-19

11

-6

D1

Drug use interferes with your ability, which can make it harder to earn money

-10

11

-9

B6

Don’t associate with the wrong people…taking drugs isn’t cool

-3

8

-11

E4

Possessing drugs is a crime…a criminal record limits what you can do

-7

8

-12


College and Vocational School – Focus on a bad life


F2

Everyone has hopes and dreams for the future, but for addicts those hopes and dreams only focus down to where the next score is coming from

3

11

11

B3

Friends are there to help when you’re down … Drugs drag you down further

-3

8

9

C6

Babies of drug addicts are far more likely to be underweight and to suffer from birth complications

-9

12

8

F1

You have NO idea how many people died getting that drug into America

-1

6

8

F3

Taking drugs definitely gives you a new lifestyle, but it is the lifestyle of a sad loser with NO prospects

0

-1

8

The key patterns are the following:

  1. Those who finished their formal education in high school show the highest additive constant, 64. They will say NO to almost everything about drugs. The specific elements do not make much of a difference, and certainly do not drive a particularly strong response.
  2. Those who have had some college, but did not finish, show a low additive constant (30), but they respond strongly to some elements, shown below. The elements do not suggest a specific pattern, but they seem to be the type of advice a parent might give to a child

    Drugs can limit the friends you keep

    Enjoy every day of your life, without having to rely on drugs to make you feel normal

    Addiction does more than harm your body…it can do lasting damage to your pocketbook and future earnings

    Every minute spent using drugs is a minute lost with a loved one

  3. Those who have finished college and vocational school respond to drugs as destroying a person’s opportunities.

    Everyone has hopes and dreams for the future, but for addicts those hopes and dreams only focus down to where the next score is coming from

(At least) two mind-sets for giving to ‘Say NO to drugs’

One of the key tenets of Mind Genomics is that within any sphere of experience where people make judgments, there are differences among people which are systematic, and t, for the particular topic, may be likened to color primaries, namely red, yellow, and blue, respectively. It is not that people are different, which of course they are, but rather that there are groups of ideas which ‘travel together. A person can be characterized as more likely to respond in one pattern or another. The pattern most resembling the way a person responds is the person’s mind-set.

The above-mentioned description of the mind-sets for a sphere of experience means that there are no single mind-sets across all behavior, but rather each individual sphere of experience can be described as having its own particular experience-relevant set of primaries. Furthermore, these primaries emerge from the actual topic-specific study. That is, to discover the primaries or mind genomes for ‘Say NO to drugs’ we have to do the study, and let these genomes emerge.

The statistics to uncover these genomes or primaries is quite simple:

  1. For each respondent, create the model relating the presence/absence of the 36 elements to the binary response, which we did before.
  2. Array the models as a series of rows, considering only the coefficients, and not the additive constant. Its will be the pattern of coefficients which interests us, not the magnitudes of the individual coefficients.
  3. Define a distance all pairs of respondents, based upon the pattern of their 36 coefficients. The distance we choose is the quantity (1-R), where R is the Pearson correlation computed using the two sets of coefficients, one for each respondent. The Pearson correlation goes from a low of -1 (perfect inverse correlation, and thus maximal distance of 2) to no relation (distance of 1), to a perfect linear relation (distance of 0.)
  4. Array the respondents in two groups so that the variability between the averages of the 36 coefficients in each group is high, and the variability with the groups is low. Today’s statistical packages do these analyses quickly.
  5. Compute the average coefficient for each element for each of the two segments or clusters. If there is a clear story, not necessarily perfect, then stop at two clusters or segments, interpret the meaning of the clusters.
  6. If there is no clear story, and if there is a sense that the clusters are jamming together different types of messages, then move to three segments, and look for the story.
  7. The objective of the clustering is to create a minimal set of reasonably different groups, with ‘different’ defined as groups about which one can write a different story. By the tine one reaches four segments, most meaningful stories emerge.
  8. The results from our 50 respondents suggest two equal sized groups, although equality of size is not necessary for meaningful segmentation.
  9. The two segments represent two mind-sets. The two mind-sets show radically different responses to the elements, as the segmentation is set up to produce. The interesting part of the mind-sets is what they are, and how does one recognize a person as having a specific mind-set. The mind-sets are not simply distributed by gender, age, where the respondent lives, and the level of education that the respondent has attained.
  10. Mind-set 1 comprises individuals who respond to ‘raw facts.’ They will be hard to convince. Their additive constant is 49, but there are only two strong elements

    Drug use can make you ill and an overdose can kill

    You have NO idea how many people died getting that drug into America

  11. Mind-set 2 comprises individuals who respond strongly to word pictures about what drugs do, and what drugs will do to them. The key is that they respond to the more elaborate messages.

Identifying the messages and what to say

The emergence of at least two mind-sets suggests that it will be possible to adjust the message to be more effective for at least one of the two mind-sets, the Personalizer (Mind-Set 2.) These respondents react to descriptions of what drugs do, and how drugs affect their lives. These respondents react strongly to the messages that have been used to combat drug dependency. Sadly, however, they comprise only half the population, and generally are difficult to discover if all one knows is age, gender, and where one lives. Just because a person has a certain profile in terms of geo-demographics or even in terms of interests, attitudes, and behaviors does not mean that one will belong to one mind-set or the other.

What is needed is a way to penetrate the mind of a person, early on, uncover the mind-set of a person, and make sure that the person, as an individual, is targeted with the messages appropriate for the person’s mind-set. We see from this small study that only half of the respondents react to the standard messages used in public-service campaigns. The other half of the respondents simply do not react. Further work is needed to discover what messages are appropriate for the non-responsive mind-set.

One initial way to make great progress in finding the messaging to help ‘Say NO to drugs’ is to assign a person to one of the two mind-sets. If the person is in the responsive Mind-Set, one should simply give that individual the ‘message’ appropriate for the mind-set. If the person is in the other mind-set, i.e., the non-responsive group, the messages won’t work, but this respondent could be invited to participate to future studies of the type reported here, such studies to be done with members of the non-responsive mind-set until the proper, motivating messages are discovered.

How then does one find these people who belong to the non-responsive mind-set? One way creates a Personal Viewpoint Analyzer (PVI), a set of questions, the pattern of answers to which assigns a person to one of the two mind-sets. The method uses the pattern of coefficients in Table 7, selecting the messages which best differentiate between the two mind-sets. Figure 4 shows the PVI created specifically for this study, a device which can begin to separate new people into one of the two mind-sets. A working version of the PVI as of this writing (Spring, 2019) is located at this website: http://162.243.165.37:3838/TT28/.

Table 7. The strong performing elements, by two emergent mind-sets, as drivers of ‘saying NO to drugs’.


Mind Set 1

Mind Set 2


Base Size

24

26


Additive Constant

49

47


Mind-Set 1 – The raw facts


A6

Drug use can make you ill and an overdose can kill

9

0


Mind-Set 2
Personalizer: Responds to words pictures of what drugs will do to them


B5

Enjoy every day of your life, without having to rely on drugs to make you feel normal

2

15

B1

Drugs can change the person you are…without realizing it Enjoy every day of your life, without having to rely on drugs to make you feel normal Don’t associate with the wrong people…taking drugs isn’t cool

-6

14

B3

Friends are there to help when you’re down … Drugs drag you down further

0

13

F2

Everyone has hopes and dreams for the future, but for addicts those hopes and dreams only focus down to where the next score is coming from

6

12

B4

Drugs can limit the friends you keep

3

11

E6

Almost all the opium in the U.S is made and grown in Afghanistan and funds terrorist groups

-4

10

C6

Babies of drug addicts are far more likely to be underweight and to suffer from birth complications

2

9

B2

A person can undergo a complete personality change when under the influence of drugs

-3

9

B6

Don’t associate with the wrong people…taking drugs isn’t cool

-15

9

D4

Court costs, legal fees, fines, a higher insurance rates all come with drug abuse

-5

8

Mind Genomics-019 - JPPR Journal_F4

Figure 4. The Personal Viewpoint Identifier (PVI) to assign new individuals to one of the two mind-sets. The pattern of responses to the five questions identifies a person as belonging to one of the two mind-sets.

Table 8. Number of mentions in the open-end question regarding reasons for avoiding drugs.

Reason for avoiding drugs
Phrases emerging from the open end question

Number
of Mentions

Harmful to Self/Family Friends

25

Too Expensive

7

Illegal

4

Past Addictions

1

Bad Example for my Child/Children

1

As in any work in progress, this PVI is simply a first approximation of what could be accomplished. The ideal approach would be to run 2–5 or more of these small-scale studies, changing the elements which don’t work, until one finds the elements which best put a group of 50–100 respondents into two or more clearly different, hopefully totally different mind-sets, strongly responsive to different messages. In our preliminary study we find only one of these groups. If circumstance dictate stopping here with the discovery of only one group, and messaging proceeds, that messaging should comprise elements which appeal to the other group (Mind-Set 1), which we label as ‘non-responsive’ and ‘only the facts.’

Open End Analysis

At the end of the session, and just before the study was over, the respondents were asked to write a short paragraph about the reasons that they find most compelling for avoiding drugs. The open-ends are not part of the study, per se, but rather enable the researcher to get additional information about drugs from individuals who have just been exposed to different sets of messages about what’s bad about drug.

The pattern of open-end responses suggests respondents say that they are most likely to avoid drugs because of the harmful effects (personal health) to themselves as well as to their families and friends. Cost is the next most frequently mentioned reasons. Other rationales for avoiding drugs include legal ramifications, past addiction, and a harmful example to children.

Discussion and conclusions

As of this writing (Spring, 2019), it is becoming increasingly clear that the so-called ‘drug problem’ is far more serious and insidious than ever before, primarily due to the increasing legality of some prescription drugs which cause addiction, e.g., opioids.

This paper presents an inexpensive, rapid, scalable way to attack the drug issue by understanding the mind of the individual, not treated like an addict, but rather treated like a consumer. That is, the objective is to understand how to communicate to ordinary people, before they become addicted, sending them messages. If we are to believe the preliminary numbers from a base of 50 respondents, then there are at two mind-sets. The first mind-set (‘The Raw Facts’) reacts to very little. More work is needed to find the deterring messages. The other mind-set reacts (‘Personalizer’) reacts strongly to messages about what the drug will do to them.

As we look at the increasing magnitude of the drug problem, could it be that the messaging is inadequate, and geared effectively to Mind-Set 2, the ‘Personalizer?’ Furthermore, could it be that we have not yet found the appropriate messages, if any, for Mind-Set 1, the ‘Raw Facts.’ Certainly, only one message or element among the 36 tested by this small sample suggests the need for more studies, studies that are remarkably inexpensive, easy to iterate, and scalable. Fortunately, the PVI, the personal viewpoint identifier, allows us to identify the individuals who belong to each mind-set, and thus enable us to classify each respondent ahead of time.

It would be ironic if the tools of today’s marketing, specifically the notion of mind-types and consumer segmentation, could be extended to the understanding and amelioration of addiction. The irony, of course, is that the same science used to drive consumers to purchase and to consume, themselves often called addiction in the most severe cases, would now be turned into the very tool used to message people to avoid sources of addiction. Certainly, the affordability of the Mind Genomics science deserves more application to the social and personal tragedies of addiction.

References

  1. Dalby JT (1991) Sherlock Holmes’s cocaine habit. Irish Journal of Psychological Medicine 8: 73–74.
  2. Peschel RE, Peschel E (1989) What physicians have in common with Sherlock Holmes: discussion paper. J R Soc Med 82: 33–36. [crossref
  3. Carver H, Elliott L, Kennedy C. and Hanley J (2017) Parent–child connectedness and communication in relation to alcohol, tobacco and drug use in adolescence: An integrative review of the literature. Drugs: education, prevention and policy 24: 119–133.
  4. Vitaro F, Brendgen M, Ladouceur R & Tremblay RE (2001) Gambling, delinquency, and drug use during adolescence: Mutual influences and common risk factors. Journal of gambling studies 17: 171–190.
  5. Hanneman GJ (1973) Communicating drug-abuse information among college students. Public Opinion Quarterly 37: 171–191.
  6. Kandel DB & Logan JA (1984) Patterns of drug use from adolescence to young adulthood: I. Periods of risk for initiation, continued use, and discontinuation. American journal of public health 74: 660–666.
  7. Yamaguchi K, Kandel DB (1984) Patterns of drug use from adolescence to young adulthood: II. Sequences of progression. Am J Public Health 74: 668–672. [crossref
  8. Kido T & Swan M (2013) March. Exploring the Mind with the Aid of Personal Genome-Citizen Science Genetics to Promote Positive Well-Being. In AAAI Spring Symposium: Data Driven Wellness.
  9. Felix RH (1944) An appraisal of the personality types of the addict. American Journal of Psychiatry 100, 462–467.
  10. Crowley RM (1939) Psychoanalytic literature on drug addiction and alcoholism. Psychoanalytic Review 26: 39–54.
  11. Yamaguchi, K. & Kandel, D.B., 1984. Patterns of drug use from adolescence to young adulthood: III. Predictors of progression. American Journal of Public Health, 74, 673–681.
  12. Lindgren E, Gray K, Miller G, Tyler R, Wiers CE, et al (2018) Food addiction: A common neurobiological mechanism with drug abuse. Froniers of Bioscience (Landmark Ed) 23: 811–836.
  13. Gofman A & Moskowitz HR eds., (2012) Rule Developing Experimentation: A Systematic Approach to Understand & Engineer the Consumer Mind. Bentham Science Publishers.
  14. Moskowitz HR (2012) ‘Mind genomics’: The experimental, inductive science of the ordinary, and its application to aspects of food and feeding. Physiology & behavior 107: 606–613.
  15. Moskowitz HR & Gofman A, Inovation Inc, (2011) System and method for performing conjoint analysis. U.S. Patent 7,941,335.
  16. Moskowitz HR, Gofman A, Beckley J & Ashman H (2006) Founding a new science: Mind genomics. Journal of sensory studies 21: 266–307.