Author Archives: author

Isolated Fractures of the Greater Trochanter; MRI Reveals Majority with Intertrochanteric Involvement

DOI: 10.31038/IJOT.2020335

Abstract

Introduction: It is unclear, how many of the isolated fractures of the greater trochanter who have further extension into the intertrochanteric area.

Method: Data have been retrospectively pulled from patients between October 1999 and September 2019 CAT scans and MRI scans were made with an isolated fracture of the greater trochanter on a plain radiograph, in the emergency department at Aarhus University Hospital, Denmark – to further analyse the extent of the fracture into the intertrochanteric region, if one was present.

Result: 59 patients were included. 25.4% of the fractures did not have further extension into the intertrochanteric region and 74.6%, had to some degree extension into the intertrochanteric region.

Discussion: The majority of seemingly isolated fractures of the greater trochanter have a non-displaced extension into the intertrochanteric region. MRI seems to be CAT-scanning superior in determining in-bone involvement. Further prospective studies with blinded randomization and larger cohorts are required to further power the strengths of the findings.

Keywords

Isolated trochanteric hip fracture, Intertrochanteric involvement, MRI vs. C, Extension of fracture not visual

Introduction

Hip fractures incidents increases exponentially with age, and with approximately 3,000/100,000 hip fractures per year in women older than 85 years, hip fractures are a common fracture in orthopaedic patients [1]. Correct and early diagnosis is important in lowering mortality, as these fractures are often seen in elderly and fragile patients [2,3]. Trauma mechanism and patient symptoms dictates further diagnostics and plain radiograph is often considered first choice in the line of determining treatment. If a fracture of the hip is visualized, treatment would often rely on surgical intervention, within a short time frame.

Isolated fracture of the Greater Trochanter (GT) is relatively uncommon. One study found that among 455 hip fractures only 2% were isolated fractures of the GT [4], thus demanding further diagnostic imaging other than radiographs, as proven by multiple studies [5-10], to determine whether the Intertrochanteric (IT) space is involved. IT-involvement does not clearly and explicit show on plain radiographs, however, when it does, it should be classified as an IT fracture.

Literature shows that, when further diagnostic imaging is needed Magnetic Resonance Imaging (MRI) is preferred as this imaging modality has a high sensitivity examining soft tissue like bone marrow. Fractures are identified when a large area of poorly defined bone oedema is present in a linear lesion in a T1-weighted image. Contrary to the normal hyperdense area of the bone, a fracture would show as a dark hypodense area [11].

It is unclear how many isolated trochanteric fractures defined on radiographs that really represents IT-fractures. Therefore, the aim of this paper is to quantify the frequency of IT-involvement of seemingly isolated GT fractures, and to what extend the IT space is affected.

Methods

Between October 1999 and September 2019 patients presenting with a confirmed isolated fracture of the GT in plain radiographs and who received further diagnostic imaging by either MRI or Computed Axial Tomography (CAT)-scans in the emergency department at Aarhus University Hospital were collected by one surgeon on site. Retrospectively, data where controlled for radiographs, CAT and MRI scans and obtained using the online imaging system, IMPAX (Agfa Healthcare, Mortsel, Belgium). Patients were excluded from the study if scans were not obtainable. Demographical data were obtained through IMPAX as well.

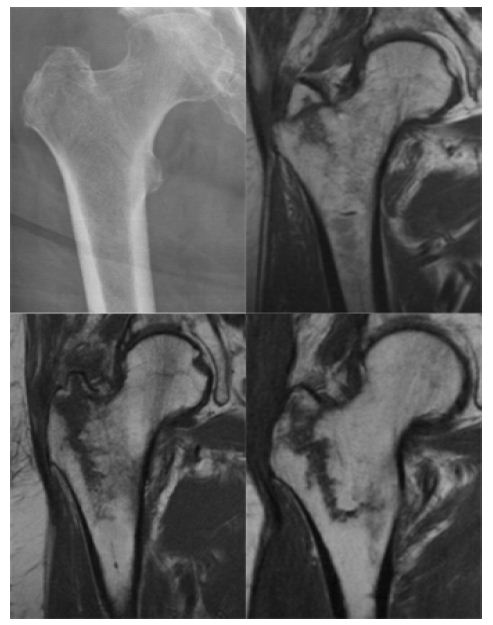
All CAT and MRI scans were assessed by all authors (JN, RT and DW) to determine the extent of the fracture into the IT space. Consensus was reached in all cases. The fracture extension of the IT space was determined as either ‘No involvement’, ‘One third of the IT space’, ‘Two thirds of the IT space’, ‘Borderline intertrochanteric fracture’ or ‘IT”, see Figure 1. Furthermore, the distribution of the involvement was determined from fractioning the frequency of the fracture type in the group by the sample size (n/N) times 100.

fig 1

Figure 1: Illustrates how the graduation of intertrochanteric involvement was evaluated.
Top left: A radiograph of an isolated fracture of the great throchanter.
Top right: Isolated fracture of the great throchanter with 1/3 of the interthrocanteric space involved.
Bottom left: Isolated fracture of the great throchanter with 2/3 of the interthrocanteric space involved.
Bottom right: Bordering intertrochanteric fracture.

Results

59 patients were included in this study. Of these 19 were men and 40 women with a mean age of 68 (range 46 – 98). One patient was excluded due to the patient having a prosthesis in the femur, and further two were excluded due to a collum femoris fracture. 46 patients underwent only MRI-scans after the concluding x-ray, 12 patients had only CAT-scans done, and two patients had both CAT-scans and an MRI.

CAT and MRI where assessed, and the distribution and extension of IT-involvement were measured (Table 1). Table 1 shows 25.4% of the fractures did not have further extension into the IT-region. Half of the descriptions were based on only CAT-scans as the additional diagnostic imaging, the other half was MRI confirmed. 74.6% of isolated fractures of the GT, had extension into the IT-region, one patient had a definite IT fracture only discovered through MRI.

Table 1: Distribution of intertrochanteric involvement in isolated fractures of the greater trochanter.

It Involvement

No Involvement 1/3 2/3 Bordering Intertrochanteric Fracture

Intertrochanteric Fracture

No.

15 16 18 9

1

% of

25.4 27.1 30.5 15.3

1.7

In the two cases, where both MRI and CAT were utilized, it was discovered that the CAT scan was not able to rediscover the IT involvement, being linear bone edema that was visualized on the MRI scan. Hereby wrongly concluding no IT involvement in the first place.

Discussion

This paper found that more than 74% of seemingly isolated fractures of the greater trochanter on plain radiographs have in addition a coexisting non-displaced involvement of the IT region towards the medial cortex of the femur, near the area of the lesser trochanter. As other studies [5-7,10,12,13] concluded, this in general counts for the majority of isolated fractures of the greater trochanter.

In two cases CAT-scans seemed to be MRI-scans inferior, when extension proven by MRI, could not be rediscovered on CAT-scans. This may undermine the general use of CAT-scans when determining in-bone involvement in fractures. All fractures found on CAT-scans were also identified on MRI-scans.

Specific guidelines for the treatment of isolated GT-fractures have yet to be defined. Studies suggest that the involvement of the IT space plays a role in determining what treatment the patient should be offered. Park et al., [7] suggest that if the extension is only located within the lateral one third, conservative treatment with immediate weight-bearing would suffice. Furthermore, they advise that in cases of extension through the medial one third of the femur or cortex, the fracture would be unstable, and should undergo immediate surgical intervention. Nevertheless, international consensus on this topic is yet to be reached.

The treatment strategy for this kind of fracture remains inconclusive, due to the rarity of the fracture. However, studies examining this issue found that cases with IT involvement extending up to two thirds of the IT area, conservative treatment with immediate weight-bearing, and the assistance of a walker aid, showed no fall-outs in boney-union or fibrous union in the healing of the fracture in all 43 patients [7,12,13]. However, further medial involvement would destabilize the fracture, making immediate weight bearing, or non-surgical intervention, a hazard for the patient.

This paper carries a high external validity. While the fracture itself is uncommon, the patient group of elderly patients and the trauma mechanism with low-energy impact fall to the hip is one of the most common emergency room incidents. The image-diagnostic findings and their attainableness are simple in interpretation and are already common hold in most hospitals.

Looking at seemingly isolated fractures of the GT, a definitive IT fracture, or secondary displacement, from the available literature, is rare, and conservative treatment with immediate weight-bearing seems to be safe and effective in the bony union of the fracture. However, further imaging should always be considered, considering that the majority of seemingly isolated fractures of the greater trochanter have to a variable extent involvement of the IT area – and further visualization of the fracture line, is imminent in determining further treatment, because surgical intervention with stabilization of the fracture, should be considered in bordering IT fractures. Otherwise, early weight-bearing could cause an unstable fracture to progress into a complete IT fracture.

Limitations to this paper include having no follow-up in patient outcome, to further affirm immediate weight-bearing as the first choice of treatment in fractures of the GT with IT extension. Inclusion of patients is done by one surgeon and thereby not exhaustive for the period. This paper is retrospective in composition and would not be able to randomize patients to either surgical intervention or conservative treatment in a randomized controlled trial. In addition, a larger scale of patients would be required to higher the power of the hypothesis.

Conclusion

This paper observed, that 74.6% of seemingly isolated fractures of the GT has a non-displaced extension of the fracture line into the IT region. This extension is best visualized via MRI, deeming CAT-scanning inferior when determining in-bone involvement. Furthermore, some extensions can be well handled conservatively – however if surgery is required, visualization of the IT space should only be done via MRI.

References

  1. Dhanwal DK, Dennison EM, Harveyb NC, Cooper C (2011) Epidemiology of hip fracture: Worldwide geographic variation. Indian J Orthop 45: 15-22 [crossref]
  2. Bredahl C, Nyholm B, Hindsholm KB, Mortensen JS, Olesen AS (1992) Mortality after hip fracture: Results of operation within 12 h of admission. Injury 23: 83-86. [crossref]
  3. Fernandez MA, Griffin XL, Costa ML (2015) Management of hip fracture. Br Med Bull 115: 165-172.
  4. Moon NH, Shin WC, Do MK, Woo SH, Son SM, et al. (2018) Diagnostic strategy for elderly patients with isolated greater trochanter fractures on plain radiographs. BMC Musculoskelet Disord 19: 256. [crossref]
  5. Craig JG, Moed BR, Eyler WR, van Holsbeeck M (2000) Fractures of the greater trochanter: Intertrochanteric extension shown by MR imaging. Skeletal Radiol 29: 572-576. [crossref]
  6. Feldman F, Staron RB (2004) MRI of Seemingly isolated greater trochanteric fractures. American Journal of Roentgenology 183: 323-329. [crossref]
  7. Park JH, Shon HC, Chang KS, Kim Ch, Byun SE, et al. (2018) How can MRI change the treatment strategy in apparently isolated greater trochanteric fracture? Injury 49: 824-828. [crossref]
  8. Omura T, Takahashi M, Koide Y, Inoue T (2000) Evaluation of isolated fractures of the greater trochanter with magnetic resonance imaging. Arch Orthop Trauma Surg 120: 195-197. [crossref]
  9. Lee KH, Kim HM, Kim YS, Jeong C, Moon CW, et al. (2010) Isolated fractures of the greater trochanter with occult intertrochanteric extension. Arch Orthop Trauma Surg 130: 1275-1280.
  10. Chung PH, Kang S, Kim JP, Kim YS, Lee HM, et al. (2016) Occult intertrochanteric fracture mimicking the fracture of greater trochanter. Hip Pelvis 28: 112-119. [crossref]
  11. Speer KP, Spritzer CE, Bassett FH, Feagin JA, Garrett, WE (1992) Osseous injury associated with acute tears of the anterior cruciate ligament. Am J Sports Med 20: 382-389. [crossref]
  12. LaLonde B, Fenton P, Campbell A, Wilson P, Yen D (2010) Immediate weight-bearing in suspected isolated greater trochanter fractures as delineated on MRI. Iowa Orthop J 30: 201-204. [crossref]
  13. Kent WT. Whitchurch, Siow M, Chun L, Bardesi J, et al. (2020) Greater trochanteric fractures with lntertrochanteric extension identified on MRI: What is the rate of displacement when treated nonoperatively? Injury.

Early Cognitive Patterns and Feelings of Guilt in People Living with HIV/AIDS

DOI: 10.31038/ASMHS.2020415


The experience of People Living with HIV/AIDS is a phenomenon that preoccupies many health professionals. In the African cultural context, the existence of meanings and interpretations related to HIV has contributed to the development of beliefs that make it difficult for those infected to live it. Several studies index the stigma and discrimination against PLHIV as the main determinant of their vulnerability. Thus, the diagrams express the situations undergone and can constitute a core of the personality disorders. We seek to understand how the early maladjusted patterns affect the experiences of PLHIV/AIDS placed on ARVs. To do this, the completion of the YSQ-S3 questionnaire allowed us to select three HIV positive adults placed on antiretrovirals at the district hospital of Efoulan. Data collection was done through semi-structured interviews. Cross-cutting thematic content analysis shows that, the early maladjusted patterns have an impact on the emotional and behavioral experiences of PLHIV as soon as they were diagnosed with HIV. These patterns act on the experiences of PLHIV by generating cognitive distortions that induce a poor perception of the situations and reinforce unsuitable patterns and strategies. Feelings of guilt, shame, social isolation and avoidance are consequences of maintaining maladjusted early cognitive patterns on the participants in our study. The findings of this analysis were interpreted and discussed based on cognitive approaches of early schemas, functionalist and psychoanalytic approaches.

Keywords

Early maladjusted patterns, Feelings of guilt, Experience, Adults, Antiretrovirals

Background

The chronic disease is characterised by permanence, irreversibility and residual disability, Timmreck (1982). According to WHO (2005), these diseases are characterised by the extent of their impact on daily life not only for patients but also for those around them. Chronic disease disrupts everything in individuals, from their state of health to their quality of life, their friendships and family, their hobbies and their professional life. HIV/AIDS discovered in the United States in 1983 by Luc Montagnier has remained for long, one of the deadliest diseases in the history of diseases on the planet and has aroused great scientific interest at the medical and psychosocial level. Advances in medicine have led to the discovery of antiretroviral drugs which prevent the multiplication of viruses in cells. Several studies have been carried out on the factors involved in the experience of People Living with HIV (PLHIV). These include works [1] which have highlighted the feeling of guilt by highlighting stigma as its main determinant. They also showed that self-stigma was the major form of stigma. It is estimated in their study at 46% compared to stigma in interpersonal relationships evaluated at 40% and stigma in health services which is 11%. Dietiker (2013) argues that guilt in PLHIV results from moral judgment. This judgment then triggers various feelings such as shame, annoyance, anger, sadness or anxiety. Several laws have been put in place to fight stigma and discrimination against PLHIV. Despite this, some PLHIV still experience negative emotions such as guilt, shame, and sadness. We can therefore question the individual’s antecedents, the past of PLHIV which could be significant factors in their experience. In the African cultural context and particularly in Cameroon, the representation of HIV is a common and collective thought that likens it to death, slow poison, bad luck, a mystical disease. In this context, AIDS represents the imminent potentiality of finitude. At the mental level, AIDS is synonymous with death.  The announcement shatters, breaks up and causes a real collapse of the subject, whose only random hope is a miraculous cure.

At the social level, AIDS is a sex disease resulting from a life of debauchery, it is a punishment from God, and pushes PLHIV to live in shame, withdrawal, guilt and many other negative feelings.  To this end, the psychological and even psychopathological consequences of HIV/AIDS are serious and emerge as soon as the diagnosis is announced, both in the patient and his family circle. Since the start of this infection, the United Nations, nations, non-governmental organisations and associations have implemented multiple strategies that can help deal with this scourge. The political stakes in the fight against AIDS in Cameroon are real [2]. Many African states have mobilised, each at their own pace and in their own way, to fight against what appears more and more clearly as a mortgage on the future of the continent [2]. In Cameroon, the government set up a year after the effective start of this pandemic, i.e. in 1986 the National Committee for the Fight against AIDS (CNLS) which is placed under the supervision of the Ministry of Public Health. This committee is responsible for overseeing the application of government policies for the prevention and treatment of HIV/AIDS. It was from the year 2000 that he began to develop national strategic plans for the fight against HIV, AIDS and STIs which set out objectives to be achieved within a specific period. Encouraging progresses have been observed, such as the significant increase in the number of approved treatment centers, HIV/AIDS treatment units in the various district hospitals and health facilities, and free ARVs since 2007. All the above is necessary and shows that there is an international and national mobilisation to block the way to HIV/AIDS. Several laws have been put in place to fight discrimination, stigma and violence which are the factors that slow down viral load testing and suppression. Despite all these efforts, the experience of PLWHIV placed on ARVs is still a call for concern to many health actors. Through this research, we wish to understand the participation of inappropriate early cognitive patterns in the daily life of PLWHIV. Early schemas like all schemas are unconscious representations of the subject concerning himself and/or others acquired during his life experience, through relationships with the characters who were present around him during his childhood. The individual will forge representations on his personal value, on the confidence he has in himself, on his capacities for autonomy, for regulating emotions, on the degree of confidence/mistrust he may have towards others etc. These representations can naturally be quite positive: the subject will then build early positive, non-dysfunctional patterns which will allow him to move forward in life with confidence.

Methodology

The Efoulan district hospital located in Yaounde, Cameroon, was chosen as the site for this study. It is a reference structure in the District health system, it has a specific framework (UPEC) for the care of PLWHIV. It presents a technical platform enabling it to ensure the health activities inherent to its level of action.

The participants in this study are PLWHIV placed on antiretrovirals at the Efoulan District Hospital, precisely at the Care Unit. These are especially young adults between the ages of 25 and 45 who take their medication regularly at Efoulan District Hospital. We chose to work with persons of this age range (adults), because they are in a period of cognitive maturation, autonomy and fulfillment. For ethical reasons, we use aliases for our participants in this study. In the same vein, we have abbreviated the names of the various specialists mentioned in the interview corpus.

This research is a qualitative research with a fundamental aim. We chose the clinical method for achieving the objective of this study and opted for the case study.

The Young Schema Questionnaire (YSQ-S3) also allowed us to select three participants. Data collection was carried out through semi-structured interviews using an interview guide. We opted for a content analysis and a cross-cutting thematic analysis in order to capture the speech of all the participants as a whole, and to obtain the indicators that can summarise the multiple meanings of the messages in the speech of the participants.

Results

As part of our study, we met three Cameroonian PLWHIV placed on antiretrovirals at the Efoulan District Hospital. They were two women and a man; whom we named: Niaie 34 years old, Zena 28 years old and Philippe 29 years old.

Our three participants were assessed through Young’s YSQ-S3 questionnaire and the results demonstrate the presence of significant maladaptive early patterns.

Theoretical data show that experience is defined by certain cognitions. Behavior, whether normal or pathological, is regarded as the expression of a specific cognition, that is, information processing [3]. In this light, cognitivist theories value the primacy of cognitions, of thought over the expression of behavior. Living with HIV, and living with this epidemic, is cognitively treated by PLHIV as a mistake, that is, the failure to respect a certain social norm. Indeed, the feeling of guilt, shame, abandonment, fear and isolation that they experience is in this light, the consequence of the unconscious representations that they have on themselves, on others and on the world. These unconscious representations which are in turn the consequence of an individual’s development from childhood to adolescence and of the events he would have experienced during this development. People living with HIV accumulate in their live history repeated traumatic announcements: announcement of serious viral disease, woebegoneness of experience with a chronic disease and social stigmatisation [4]. Using the different approaches, we will interpret and discuss the results of the analysis of the data collected from the participants of this study, focusing on their experiences since the first time they were informed of their ill state.

The Traumatic Experience of the Announcement of the Diagnosis

Previous work shows that the announcement of HIV status is a dramatic event that inevitably overwhelms a person’s capacity for development. Thus, it is an event that carries a highly traumatic charge because it is a source of “external violence” thanks to the unthinkable, alienating and potentially fatal situation in which it places the subject [5]. The trauma in question is no longer limited to the sexual aspect as described by Freud (1920), it is about the economic overflow of the subject which corresponds to an extensive breach of the shield-excitation system available to the individual for keep away from external stimuli [6]. The declaration of HIV seropositivity disrupts an individual’s system of thought, belief and information processing by creating in them an ambient vulnerability. This announcement produces an intense traumatic shock which has consequences in the entire psychic life of the HIV-positive subject. To talk about the traumatic experience of the declaration of seropositivity among our participants, it is important to appeal to phenomenological theory. This will focus on the traumatic phenomenon of the announcement of HIV status as it appears to the subject’s conscience. We shall hence invoke the descriptive approach. That which deals with what patients’ experience, studies their states of mind and aims to unveil meanings (Ionescu, 2006). From this phenomenological approach, we therefore try to bring to the surface the traumatic experience of the announcement of seropositivity from the speeches of our participants who have experienced it, by trying to interpret it based on the nonsense of the trauma mentioned during the interview.

From this phenomenological perspective of trauma, Barrois (1998) evokes “the confrontation with the unthinkable of death; the invasion through the anguish of annihilation; breaks in continuity; breaks in the function of the frame and the container-content relationships; ruptures of the unity of the individual, in a word the cessation of meaning” [7]. Interviews with our participants show that the declaration of HIV status is an unpredictable emotional shock. It was a direct confrontation with the reality of death and nothingness. In the same vein, the traumatic event creates “a hole in the signifier” [7,8] shows that the only thing devoid of signifier is our death, without “representation’’, for lack of having benefited from a prior presentation. For him, trauma directly confronts the subject with the reality of death and the latter has the words to designate this death, which he may be unaware of [8]. It’s a moment of shock that is accompanied by a psychic defense of protest, denial of this news. Only the idea of death presents itself to the person with a feeling of wanting to give up everything, of dying. For [8] this experience of nonsense is characterised by the collapse of three narcissistic convictions: invulnerability, environmental protection, helping others. We see this in our study with the onset of feelings of guilt, vulnerability, hopelessness and shame experienced by participants after being informed they had this disease. These reactions are due to the early cognitive patterns that our participants already possessed. They played a significant role in processing the information of these participants.

According to a study [9], in traumatic contexts, one can easily have access to guilt. According to these authors, this guilt is conscious and connects to other older guilt, more or less unconscious. The current guilt in this study relates to the guilt of not haven avoided contracting HIV. Old or unconscious guilt, linked to the childhood history of PLHIV and referring to events, real or phantasmal contexts, including oedipal conflicts and fantasies that reality has not sufficiently denied [9]. A study [10] go in the same direction as these two authors when he evokes the childhood history and the lived events like determining the vulnerability of an individual and they specify that, the maladaptive schemas are likely to occur in place throughout the life of the individual.

On the one hand, in the African context, HIV/AIDS is a source of representations, meanings and theories of all kinds. As such, the people who have it as well as those around them are victims of all these interpretations which contribute to making them feel guilty, despise, stigmatise and discriminated (Megnemendong, 2016). According to, Desclaux, (2002) HIV/AIDS is a social disease which is often more difficult to live with for people with the disease and their families than the clinical manifestations of the virus attack due to hostile attitudes fueled by pejorative connotations they encounter in their life world. These attitudes towards PLWHIV amplify the situation of PLWHIV who carry inappropriate early patterns when they seek to adjust. The reactions after the announcement shows that our participants living in this context incorporated these beliefs or representations. Seen in this light, according to Young’s pattern theory (2005), we can say that the reactions of the participants in our study to the statement of their status, are the manifestation of the early maladaptive patterns that they carry from their childhood until the day of diagnosis. It is from the announcement that the punitive and imperfection/shame patterns are activated, and the individual begins to experience feelings of guilt and shame. The environment in which PLHIV live contributes to the maintenance of these patterns.

Ultimately, we can say that it is the outcome of the cognitive processing of environmental information accompanying HIV/AIDS that the declaration and experience with HIV becomes difficult, painful for people who carry the early maladaptive patterns. People with maladaptive early schemas adopt inadequate coping strategies that make their daily life difficult because they generate cognitive distortions. These cognitive distortions induce a bad perception of the situation and reinforce the patterns. Thus, the results of this research show that the experience of PLWHA is riddled with intense emotions such as feelings of guilt, shame, fear of being abandoned by others and anguish of death, etc.

Interpretation and Discussion of Results from the Experiences of PLWHIV on the Emotional and Behavioral Level

The results of this study show that PLHIV with maladaptive early patterns and inappropriate strategies experience feelings of guilt, shame, abandonment and avoidance strategies in their emotional and behavioral experience. According to pattern theory, this feeling is the outcome of maintaining patterns of punitive, shame/imperfection and abandonment. These maladaptive patterns that they acquired during their development precisely during childhood and adolescence through their relationship with those around them. The results of this study show that the participants experienced events during childhood and adolescence with those around them that could lead to inappropriate early patterns in their cognition. This turns to have consequences on their emotional life and on their behavioral experience because all the actions of the individual depend on the patterns they carry. Obviously, taking into consideration the questionnaire, demonstrated the presence in these participants of certain unsuitable early patterns such as punitive patterns, shame, abandonment, emotional deprivation, etc. Thus, the results of the interviews show that our three participants manifest in their daily lives the feeling of guilt, the feeling of shame, the anxiety of being rejected or abandoned. These feelings experienced by our subjects, according to a study [10], are a consequence of maintaining patterns such as punitive, shame/imperfection, pattern of abandonment and others that they have acquired during their development. At this level, there are two types of consequences of the patterns: on the behavioral level, the short-term consequences reinforce the unsuitable behavior, that is; the unsuitable strategies put in place to cope with the situation and the long-term consequences that reinforce patterns like guilt, shame/imperfection and the like.

In addition, by summoning the functionalist theories which study the adjustment of man to his environment by emphasizing on the behavior of the individual and particularly on the goal of behavior and the adaptation of an organism to its environment, it emerges that, the individual can use an emotion to adapt to his environment. Barret and Campos (1987) qualify guilt as a social emotion. For these authors socialisation fundamentally influences the development of guilt and which is in turn influenced by this emotion. For them, the feeling of guilt fulfills the regulatory functions of interpersonal behavior, that is, the regulation of social interactions and intra-personal functions. In this light, we could say that it is a feeling that regulates interactions between PLWHIV and those around them, also the relationship that PLHIV have with them. If we say that the feeling of guilt is a social construct, this amounts to saying that, based on their emotions, PLHIV manifest a feeling of guilt in order to adapt to the lived realities of their illness. It would be following an attempt of adjustment that, PLHIV will experience feelings of guilt, shame, and abandonment in front of those around them and will also feel their narcissism affected. These coping strategies are recognised according to pattern theory as inadequate because they have long-term consequences which are the reinforcement and maintenance of early maladaptive patterns and the short-term consequences which reinforce these maladaptive behaviors. Here we therefore perceive how the early maladaptive schemas generate paradoxical cognitions in our subjects who seek to appropriate the situation by feeling guilty and avoiding any context that would make them feel ashamed. Indeed, it should be noted that these PLWHIV live in a society in which the HIV-positive person is regarded to be the main person responsible for their disease. This cultural context leads the PLWHIV who have an early maladaptive punitive schema to perceive themselves as primarily responsible for their situation. This is also true for those who have a pattern of shame, they have integrated the belief that AIDS is a disease of shame and manifest this shame in their daily lives.

Here, the results of the analysis show that PLHIV who already have a punitive, shame/imperfection pattern, in front of a situation, they select events or phenomena that activate and maintain this pattern and they avoid those that are likely to modify them, this is called submitting to the schema. Unlike the punitive scheme where the subject adopts a strategy of submission, the subject possessing the schemas of shame/imperfection, abandonment adopts a strategy of avoiding these schemas. This is justified by the fact that the participants avoid any situation which is likely to cause one to feel shame, abandonment or rejection; this is called the schema avoidance strategy [11-19].

These results agree with the work [3] which valued the psycho-cognitive determinism of the feeling of guilt because the feeling of guilt manifested by our subjects can be taken as the consequence of the development of their cognitions. For this author, the emergence of a feeling of guilt in a subject is linked to the development of his cognition [3]. And he adds that the subject’s cognitive processing of information is also largely influenced by social norms. Thus, cognitivist theories establish a link between the subject’s cognitions and his behavior, emotions and feelings. Feelings like shame and guilt are thus the outcome of a cognitive process.

As a result of the inability to fulfill one of their wishes, PLHIV manifest feelings of guilt. The desires expressed by PLWHA are numerous and the non-satisfaction of these desires provokes in them frustration feelings and passions. Among these we have the desire related to sex, the desire to have a child and the desire to marry.

In fact, Philippe’s desire is to give birth to another baby, but this desire is associated with the anxiety of passing the disease on to his partner. He finds himself in an ambivalent situation, this situation provoking in him feelings of self-reproach, worry and other painful feelings. People living with HIV have this lack of fulfillment of their desire which causes them to feel guilty.

From a psychoanalytic perspective, guilt is the expression of a tension between the Ego and the Superego from the actual or fantasised transgression of a prohibition. “It results from the subject’s attacks on his love objects that he fears having fantasized about having destroyed” [9]. Take the example of Zena who feels guilty because she did not follow her father’s instructions. The guilt in her comes from breaking the prohibition and the object of love her can be on herself or a part of her body.

The theoretical perspectives evoked below indeed account for how the feeling of guilt manifests itself in people in situation. Cognitivist theory through [10]) and the work [3] have shown the role of cognition in the development of the feeling of guilt. For the first, the integration of early maladaptive patterns during childhood and during development is a determinism to the experience of emotions in general, feelings of guilt and shame in particular. For the second, these feelings are thus the culmination of a cognitive process and with inappropriate early schemas, PLWHIVs appropriate themselves with paradoxical cognitions. Returning to the functionalist theory where the feeling of guilt is an attempt by man to adjust to his living environment, we have seen that, PLWHIV feel these emotions in order to adapt to their environment but possessing inadequate early patterns, hence, the latter could adopt inappropriate adjustment strategies. We also highlighted the social context in which PLWHA live, which indeed has an impact on the maintenance of patterns. In addition, psychoanalyst theory was brought up and emphasized that the feeling of guilt is the result of the real or fantasized transgression of a norm or a prohibition.

Conclusion

We questioned the role of maladaptive early cognitive patterns in the experience of PLWHIV placed on antiretrovirals. Emphasis was placed on the theoretical model of cognitive schemas mainly the early maladaptive schemas developed by Aaron (1976) and then by Young (2003). This approach explains the feeling of guilt through the maintenance of certain early maladaptive patterns. We relied on this theoretical approach to conduct the study. We opted for the qualitative method through the case study. This method was chosen for its ability to provide an in-depth analysis of the phenomena in their context of emergence. According to our inclusion and exclusion criteria, including Young’s YSQ-S3, three participants were selected for this study. Using the interview guide, data was collected through semi-structured interviews. The results show that the early maladaptive patterns have an impact on the emotional, behavioral and psychosomatic experiences of PLWHIV. As soon as the disease is announced, several early patterns such as the punitive pattern, shame/imperfection, abandonment, emotional over-control, mistrust, fear are put in place and influence the processing of information of PLWHIV. It is therefore from these patterns that they adopt coping strategies centered on emotions such as avoidance, denial, guilt and shame. Participants rely on the early maladaptive patterns to behave in different situations. Functionalist theories show that PLHIV manifest a feeling of guilt in order to adapt to the realities related to the experience of the disease in their living environment. These feelings regulate social interactions, interpersonal behavior and intrapersonal behavior. Seen in this way, we have noted that the environment has a major role in the experience of PLWHIV. However, invoking psychoanalytic theory, the latter showed that the feelings of guilt experienced by the participants result from the feeling of having transgressed a social norm, a prohibition and, also from the feeling of not satisfying a desire. In a cultural context rich in prohibition, this feeling is more and more significant. As for the theory of early maladaptive patterns, we have seen that the experience of the feeling of guilt, shame, abandonment and social isolation in PLWHIV is due to the activation and maintenance of certain patterns such as the punitive pattern, shame, abandonment and some maladaptive coping strategies are guided by conditional and unconditional patterns.

This study shows the need for a psychological support, strictly speaking, to people living with HIV/AIDS as soon as the diagnosis is announced. Also, she shows the importance of taking into account the events that marked their childhood and adolescence.

References

  1. Zerbo Ky, Deslaux O, El Asamar A, Makhlouf-Obermeyer K, Msellati C, et al. (2014) The stigmatization of PLWHIV in Africa: analysis of its forms and manifestations in Bukina Faso. Public Health 26: 375-384.
  2. Tsala Tsala JP (2004) The elevator and the staircase – the fight against AIDS in Cameroon. Sahara-J: Journal of Social Aspects of HIV/AIDS 1: 139-156. [crossref]
  3. Kagan J (1984) The nature of the child. New York: Basic book.
  4. Bourdet SL, Mazoyer VA (2012) Resiliency factors in women with HIV in assisted reproduction. Eres connections 98: 165-178.
  5. Duclos, K. (2000). Traumatic impact of the announcement of HIV seropositivity on therapeutic adherence, clinical and projective approach. Clinical and Projective Psychology 6: 279-304.
  6. Thome-Renault A (1995) The trauma of the announced death: psychosomatics and AIDS. Paris, Dunod.
  7. Barrois C (1998) Traumatic neuroses. Paris: Dunod.
  8. Crocq L (2013) Psychic trauma: Psychological care for victims. Paris: Elsevier Masson.
  9. Ciccone A, Ferrant A (2009) Shame, Guilt and Trauma. Paris: Dunod.
  10. Young J, Klosko J, Weishaar M (2005) Schema therapy: cognitive approach to personality disorders. Brussels: De Boeck.
  11. Pascal B (2015) Diagram therapy: principles and practical tools. Paris: Elsevier Masson.
  12. Bouvard M, Denis A, Roulin J (2018) Psychometric properties of French version of the Young Schema Questinnaire Short form (YSQ-S3). The Spanish Journal of Psychology
  13. Brassard C (2017) Validation of dream speech analysis grids: identifying representations of attachment and early maladaptive patterns in dreams. University of Sherbrooke, Sherbrooke.
  14. Brunel ML (1995) The place of emotions in psychology and their role in conversational exchanges. Mental Health in Quebec 20: 177-205.
  15. James W (1884) What is an emotion. Mind 9: 188-205.
  16. Jobin G, Lessard J (2011) AIDS: rites and hospitality: at the crossroads of spirituality and health. Quebec: PUL.
  17. Ndje Ndje M, Tsala Tsala JP (2017) Feeling of guilt in Caesarized first-time births and identification of the maternal role. Journal of Psychotraumatology and Mediation 2: 140-147.
  18. World Health Organization (WHO) (2005). Mental Health & HIV / AIDS therapy series. WHO: Geneva.
  19. Poujol and Poujol (2007) The feeling of guilt: what psychologists and philosophers say about it.

Chitons (Mollusca: Polyplacophora) from the Venezuelan Coasts, Southern Caribbean: A Checklist and Brief Review in Advance of Their Knowledge

DOI: 10.31038/AFS.2021311

Introduction

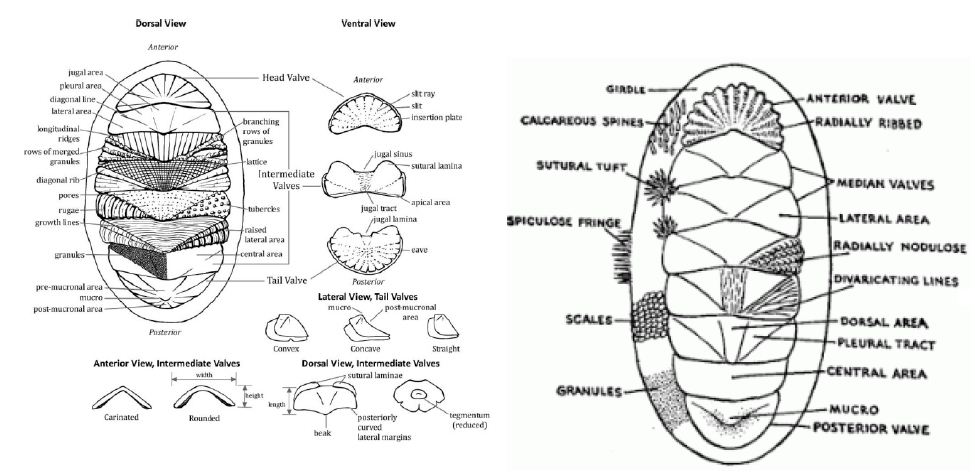
Chitons or polyplacophores constitute a of the eight classes of the filum Mollusca. They are generally small, flattened and elongated animals, provided with eight (8) overlapping dorsal plates or valves, bordered by a belt of scales and/or calcareous spicules formed by the mantle, called perinotum. The cavity of the mantle encloses the foot, which is expands forming a large sole, which not only serves for the locomotion but also to maintain firm contact with the surface of the substrates where they live (Gracia C. et al. 2005: 117) (Figure 1).

fig 1

Figure 1: Structural morphology of Chitons. Source: GOOGLE, Creative Commons.

In relation to the taxonomic Class Polyplacophora, some 850 recent species of Chitons are known, most of which live in the Western Pacific and the Western coast of Central America, while in the Caribbean and the European Mediterranean they are more poorly represented (Tejeda et al. 2015: 112), being that in the essential pioneering contribution of Kaas (1972) 34 species were already reported for the Caribbean and the Gulf of Mexico.

Background

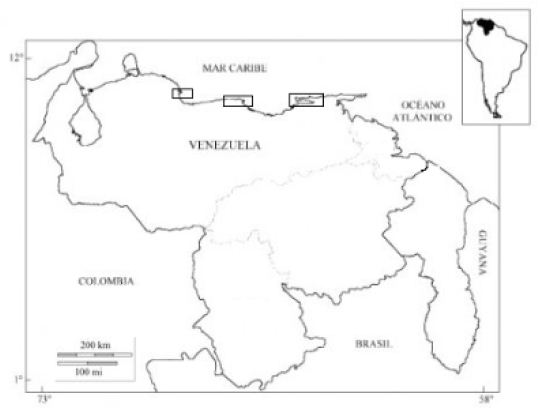
A general synthesis about the current knowledge of the shallow water polyplacophoran molluscs (chitons) occurring in the Southern Caribbean of Venezuela is presented, involving bibliographical revision/database (summarized informations [1] from the “Northeast” region, coastal & insular, and [2] from “Los Roques Archipelago Marine National Park”), and historical rescue of informations (field notebooks) which includes inedit “personal report” of manual collection of specimens (total of 17 specific forms) in three (3) coastal areas (Northeast (CaA) – Sucre State (~ 10°38 44″N & 63°02’ 20″W) in “Golfo de Cariaco” (Cariaco Gulf) region, with 12 species; Central (CaB) – Vargas (“Catia La Mar” sector ~ 10º36’N & 67º02’W) & Miranda (“Los Totumos/Higuerote” sector ~ 10º29’00N & 66º06’00”W) States, with 14 species; and Central Western (CaC) – Morrocoy National Park, Falcón State (~10°51′22″N & 68°18′22″W), with 9 species) (Figure 2 – Map & Table 1) of the country between the years 1976 and 1989, parallel to field studies of cnidarian fauna – sea anemones [3].

Table 1: Checklist of the Chitons (Mollusca: Polyplacophora) known today for Venezuela (Southern Caribbean) and distribution on the coastal areas “previously verified in field” (Figure 2).

Detected Species

CaA

CaB

CaC

Class Polyplacophora Gray, 1821
Subclass Neoloricata Bergenhayn, 1955
Order Chitonida Thiele, 1909
Suborder Acanthochitonina Bergenhayn, 1930
Family Acanthochitonidae Pilsbry, 1893
Americhiton andersoni (Watters, 1981)
Americhiton belesae (Abbott, 1954)
Acanthochitona hemphilli (Pilsbry, 1893) X
Acanthochitona pygmaea (Pilsbry, 1893)

X

Acanthochitona retrojecta (Pilsbry, 1894)
Acanthochitona rhodea (Pilsbry, 1893)
Acanthochitona venezuelana Lyons, 1988
Suborder Chitonina Thiele, 1909
Family Chaetopleuridae Plate, 1899
Chaetopleura apiculata (Say, 1834)

X

Family Lepidochitonidae Iredale, 1914
Lepidochitona liozonis (Dall & Simpson, 1901)

X

X

Lepidochitona sp 1
Lepidochitona sp 2
Family Chitonidae Rafinesque, 1815
Acanthopleura granulata (Gmelin, 1791)

X

X

X

Chiton marmoratus Gmelin, 1791

X

X

X

Chiton squamosus Linnaeus, 1764

X

X

Chiton viridis Spengler, 1797

X

Leptochiton cancellatus (G. B. Sowerby II, 1840)

X

X

X

Rhyssoplax janeirensis (Gray, 1828)

X

Family Callistoplacidae Pilsbry, 1893
Callistochiton portobelensis Ferreira 1976

X

Ceratozona squalida (Adams, 1845)

X

X

X

Family Ischnochitonidae Dall, 1899
Ischnochiton erythronotus (C.B. Adams, 1845)

X

X

X

Ischnochiton hartmeyeri Thiele, 1916
Ischnochiton papillosus (C.B. Adams, 1845)

X

X

X

Ischnochiton striolatus (Gray, 1829)

X

X

X

Stenoplax boogii (Haddon, 1886)

X

Stenoplax purpurascens (Haddon, 1886)

X

X

X

Abbreviations: CaA: Northeast Area; CaB: Central Area; CbC: Central Western Area.
Source informations: Archive/DataBase of the “Project AM”.

fig 2

Figure 2: Venezuelan coastal areas (rectangles) where manual collections of polyplacophores (chitons) were carried out by us between the years 1976 and 1989: Northeast region – CaA (right angle), Central region – CaB (center angle), Central Western region – CaC (left angle). Credit Map: Original by A. Ignacio Agudo-Padrón, Project AM.

Unfortunately, the samples were “lost” in the course of a catastrophic event (flood), before it can be formally deposited in a scientific institution/museum (… this collection also included species obtained during the period in several coastal insular and mainland localities & representative marine environments of the country … an unhappy, irreparable and heartbreaking loss !!).

Counting up still, recently (since the year 2014), with the invaluable participatory assistance and support of “Northeast” (Sucre State) local researcher ecologists, naturalists and collaborating informants (Bello-Pulido et al. 2016), with field collections carried out during the years 2015 and 2016, totalling 36 geographical sampling points, distributed in five (5) large predominantly rocky coastal bioregions, taxonomically involving five (5) families, eight (8) genera and eleven (11) certain species (Figure 3).

fig 3

Figure 3: Shallow water polyplacophoran (chitons) biodiversity in Northeast coastal region of Venezuela: CHITONIDAE Leptochiton cancellatus (G. B. Sowerby II, 1840), CALLISTOPLACIDAE Ceratozona squalida (Adams, 1845), LEPIDOCHITONIDAE Lepidochitona liozonis (Dall & Simpson, 1901), ISCHNOCHITONIDAE Stenoplax purpurascens (Haddon, 1886), CHITONIDAE Acanthopleura granulata (Gmelin, 1791). (Photos: Jesús Antonio Bello-Pulido, collaborator of the “Project AM”).

Results & Conclusions

A updated checklist/inventory including a confirmed general total of 25 species, taxonomically distributed in 12 genera and six (6) families, complements the present brief report (Table 1), which makes it possible to make important preliminary comparisons with the polyplacophore fauna of other important Caribbean regions, such as Colombia ([4], with 22 species), Puerto Rico ([5], with 29 recognized species ~ the place with the greatest diversity of polyplacophores in the region), the Hispaniola Island ([6], with 23 known species) and, most recently, Cuba ([7], with 27 species).

Particularly, the Caribbean/eastern surf chiton species CALLISTOPLACIDAE Ceratozona squalida (C. B. Adams, 1845) (Figure 3 and Table 1) was one of the first relevant species recorded in the field by us in Venezuela (June 18 1982), with several specimens found in the Northeast region – CaA (“Playa San Luis” <San Luis Beach> sector, Cumaná city ~ 10°27′00″N & 64°10′00″W, Sucre State) in the rubble of a ramp/dock of cement & stones half-buried on sands of the coastal urban area – tides zone, encrusted with algae, together with a beautiful specimen of caribbean branching anemone Lebrunia neglecta (- danae) Duchassaing & Michelotti, 1860 (see González-Muñoz et al. 2016: 29 – Appendix 2, Table 3, “record no. 25″) [8].

At least a one very little/diminute chiton species with tufts of glass-hair-like bristles – ACANTHOCHITONIDAE cf. Acanthochitona andersoni Watters, 1981, Acanthochitona venezuelana Lyons, 1988 or Acanthochitona pygmaea (Pilsbry, 1893) – exist in the environment (reef substrate, loose dead coral) of the restrict “Refúgio de Fauna Silvestre Isla de Aves” (Bird Island Wildlife Refuge ~ 15°41′00″N & 63°37′00″W), Northern sector of the Venezuelan Caribbean Sea, occurrence that still needs to be properly investigated. Meantime, Narciso & Caballero (2011) cite the record of seven (7) unspecified Polyplacophoran species for this little insular locality, with specimens/vouchers deposited in the Reference Collection of the “Foundation for the Defense of Nature – FUDENA”.

Among other potential forms still pending confirmation in the country, highlights the iconic species CHITONIDAE Tonicia schrammi (Shuttleworth, 1856), the “gold-flecked chiton”, typical representative of the Caribbean Polyplacophoran fauna < http://www.marinespecies.org/photogallery.php?album=704&pic=103379 ; https://www.conchology.be/?t=68&u=1096898&g=97858aa8e0d2e81d7c41f5884d1fc0c4&q=0a23a7694181e63fa3a9c05450ac6178 >.

Finally, all the species listed in the present contribution (Table 1) were previously revised through the global platform “WoRMS – World Register of Marine Species” < http://www.marinespecies.org/ >, checking your current taxonomic status/situation.

References

  1. Capelo JC, Buitrago J (1998) Distribución geográfica de los moluscos marinos en el Oriente de Venezuela. Memória 58: 109-160.
  2. Jiménez M, Allen T, Fernández J, Narciso S (2014) Moluscos asociados al coral Montastrea annularis em el Parque Nacional Archipiélago de Los Roques. Acta Biol. Venez 34: 233-243.
  3. González-Muñoz R, Simões N, Guerra-Castro EJ, Hernández-Ortíz C, Carrasquel G et al. (2016) Sea anemones (Cnidaria: Actiniaria, Corallimorpharia, Ceriantharia, Zoanthidea) from marine shallow-water environments in Venezuela: new records and an updated inventory. Marine Biodiversity Records: 9.
  4. Gracia CA, Díaz JM, Ardila NE (2005) Quitones (Mollusca: Polyplacophora) del Mar Caribe Colombiano. Biota Colombiana 6: 117-125.
  5. Garcia-Rios CI (2005) Los quitones (Mollusca: Polyplacophora) em Puerto Rico. Santo Domingo, República Dominicana: Universidad Autónoma de Santo Domingo, V Congreso de Biodiversidad Caribeña, Volume V, Conference paper.
  6. Herrera-Moreno A, Fernández LB (2010) Lista de espécies de quitones (Mollusca: Polyplacophora) conocidas para la Hispaniola. Novitates Caribaea 3: 62-68.
  7. Tejeda CR, Maceira1 D, Cedar García-Ríos C, Espinosa J (2015) Listado actualizado y claves para Polyplacophora (Mollusca) en Cuba. Novitates Caribaea 8: 112-119.
  8. Kaas P (1972) Polyplacophora of the Caribbean region. Studies on the Fauna of Curacao and other Caribbean Islands 137: 1-162.

Simple Surface Texturing for Green Energy-Silicon Solar Energy

DOI: 10.31038/NAMS.2021411

Abstract

To date, solar energy storage coupled with nanomaterials, surface engineering becomes an essentially critical method for functional electrode design. Despite years of research on nanoscale materials for energy storage, commercial batteries still make use of microscale materials for electrodes. This is due to a combination of manufacturing challenges for nanoscale materials and the reactive nature of nanoscale materials that leads to high irreversible capacities associated with solid electrolyte interphase formation.

Surface texturing is a powerful tool to decouple bulk material properties from surface characteristics that often bottleneck energy storage applications of nanomaterials and has been successfully used to improve the efficiency of photodetectors and solar cells due to a reduction in reflections at the surface.

Therefore, the simple surface texturing methods for green energy-silicon solar energy are marked aim to provide the vital information about the growing field related to surface engineering in solar energy with environmental friendly nature.

Keywords

Solar energy, Surface texturing, Green energy

Introduction

Solar energy, as a popular green energy, is radiant light and heat from the Sun. The large magnitude of solar energy available makes it a highly appealing source of electricity. The International Energy Agency has said that solar energy can make considerable contributions to solving some of the most urgent problems the world now faces: The development of affordable, inexhaustible and clean solar energy technologies will have huge longer-term benefits. It will increase countries’ energy security through reliance on an indigenous, inexhaustible and mostly import-independent resource, enhance sustainability, reduce pollution, lower the costs of mitigating climate change, and keep fossil fuel prices lower than otherwise. These advantages are global. Hence the additional costs of the incentives for early deployment should be considered learning investments; they must be wisely spent and need to be widely shared [1-5].

In a textured surface, rather than being lost, the reflected light can strike the silicon surface again to minimize reflection. Any “roughening” of the surface reduces reflection by increasing the chances of reflected light bouncing back onto the surface, rather than out to the surrounding air.

Photovoltaic Effect

The mechanism of solar energy is on the basis of photovoltaic effect. In simple terms, the photovoltaic effect describes the conversion of light into an electric current. To describe this mechanism more formally, it is best to think of light in terms of a stream of photons where each photon carries one quantum of energy. Each photon is associated with just one wavelength or frequency. High-frequency photons have more energy than the ones with low frequency [6-8].

Intrinsic Semiconductor

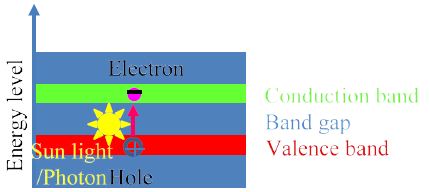
In a pure semi-conductor the outermost electron of the underlying molecule is not heavily bound. An incoming photon with enough energy can promote the electron from the valence band to become a free electron in the conduction band as shown in Figure 1. This in turn leaves a positive hole in the valence band. The minimum energy that is necessary for this to happen is called the band gap. The band gap varies from material to material and also varies with temperature, which is why performance of solar modules deteriorates with higher temperatures. However, in an intrinsic semiconductor, no resulting electric current is observed, since the promoted electrons re-combine again with the holes.

fig 1

Figure 1: Schematic diagram of intrinsic semiconductor.

Doped Semiconductors

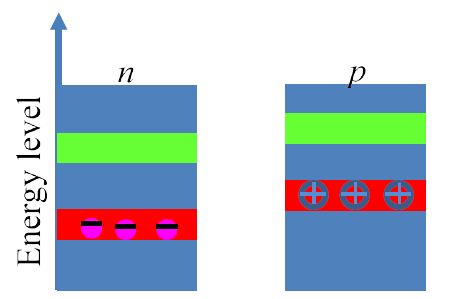
Doping means the addition of a small percentage of foreign atoms in regular crystal lattice of the semiconductor as shown in Figure 2.

fig 2

Figure 2: Schematic diagram of doped semiconductors.

n-Type

Adding atoms with one electron more creates a layer with more electrons in the valence band, pushing the overall energy level down. In Silicon, n-type dopants are Antimony, Arsenic or Phosphorous.

p-Type

Adding atoms with one electron less creates a layer with fewer negative electrons in the valence band, pushing the overall energy level up. For instance: In Silicon, add Boron, Aluminum or Gallium.

Semiconductor with p-n Junction

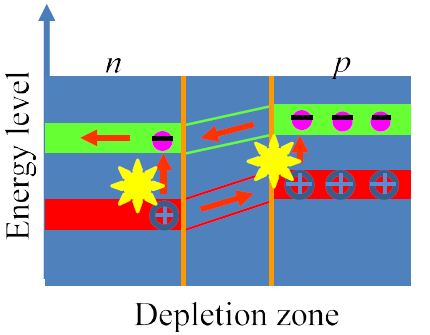
Where p-type and n-type layers join at the pn junction, electrons and holes diffuse to create the charge-free depletion zone. Moreover, the junction creates a slope in the resulting energy bands. Now, when a photon promotes an electron to the conduction band, it can subsequently “roll down” through the depletion zone into a lower energy band rather than instantly re-combine with a hole. This is what generates the photo current as shown in Figure 3.

fig 3

Figure 3: Schematic diagram of semiconductor with pn junction.

Solar Cell Working Steps

It is well known that up to now, the most commonly known solar cell is configured as a large-area pn junction made from silicon. Its working steps are listed as follows:

(i) Photons in sunlight hit the solar panel and are absorbed by semiconducting materials, such as silicon.

(ii) Electrons are excited from their current molecular/atomic orbital. Once excited an electron can either dissipate the energy as heat and return to its orbital or travel through the cell until it reaches an electrode. Current flows through the material to cancel the potential and this electricity is captured. The chemical bonds of the material are vital for this process to work, and usually silicon is used in two layers, these layers have different chemical electric charges and subsequently both drive and direct the current of electrons.

(iii) An array of solar cells converts solar energy into a usable amount of direct current (DC) electricity.

(iV) An inverter can convert the power to alternating current (AC).

Principle of Texturing for Antireflection

Energy conversion efficiency is a critical consideration in the application of solar cells, especially for the silicon solar cells. Texturing has been used as a technique to improve the efficiency of photodetectors and solar cells due to a reduction in reflections at the front surface.

The anti-reflecting features may be cones, pyramids, pillars, and other features, and, when such features are used for diffusion and for the scattering of light may they be distributed in a random fashion. It should be noted that any feature that produces the desired diffusive light scattering is one that closely approximates a Lambertian scattering surface at the desired wavelengths of radiation. Lambertian scattering is ideal diffuse scattering providing light distributed over the whole half sphere or solid angle of 2π steradians [9,10]. Manipulating the feature sizes, dimensions, etc. allows the light anti-reflecting and light diffusing region to be tunable for a specific wavelength. Varying the material near or deposited upon the anti-reflecting and light diffusing region can also be used to enhance these characteristics.

Texturing will also change the absorption in the remaining part of the infrared and the visible light regions but this will not yet be considered. In the near infrared the index of refraction of silicon is η = 3.42 and the reflectance is about R = 30% from a single surface and transmittance through a single surface is T = 70% for normal incident waves. The absorption coefficient of silicon is very low in the near infrared. If there is no backside reflector radiation under normal incidence is reflected first from the first surface. There are successive reflections from both the back and internal reflections from the front surface resulting in a total transmittance, if there is no reflective layer or the oxide layer, of

Ttot=(TT)(1+R2+R4+…)=(TT)/(1-R2)

This result has been obtained using the sum of a geometric series. If both top and back surfaces are just polished silicon–air then this results in a total transmittance of 54% and a reflectance of 46%. The internal absorption, A, of infrared light where the absorption coefficient, α, is very low due multiple internal reflections in a sample of thickness, d, with a polished backside is:

A=αd(1+R2)(1+R1R2+R12R22+…)=αd(1+R2)/(1-R1R2)

The enhancement, Enh, in internal absorption by multiple internal reflections with a polished backside is

Enh=(1+R2)/(1-R1R2)

One of the difficulties in silicon technology is realizing a backside reflector. Metal directly on a silicon backside has been found in practice not to be a good reflector. One approach in thin film technology has been to deposit silicon on an oxide over a textured metal. In doing so the desire has been to use thicker oxides to try to planarize the oxide top surface for silicon deposition. While the metal may be a diffusive reflector but the reflected light is refracted towards the normal upon entering the silicon. The light in the silicon will not appear to originate from a Lambertian scattering source. If the backside of the silicon is textured and a thin oxide or dielectric used before metal deposition, when the oxide is thin, much less than a quarter wave length then the reflected light is not affected by the thin oxide and the reflection into the silicon can be Lambertian scattering.

A random array of such etched “cusps” into the backside of a silicon wafer can be provided by porous silicon and chemical etches. A porous silicon or metal catalyst etch can provide vertical holes at random locations, these can then be etched with a conventional isotropic silicon etch to round off the shape corners resulting in a cusp like structure. A thin layer of oxide can either be grown or oxide or another dielectric deposited and the backside covered by a reflective metal. In this manner a random array of cusp like scattering centers can be formed on the back of silicon solar cells.

Starting with the 1990s, silicon solar cells with 23.4% efficiency have been obtained. One of the known ways to increase the conversion efficiency is the reducing of the radiation losses at the front surface of the cell. There have been reported various methods of increasing silicon solar cell efficiency by improving the structure light trapping such as: rear surface preparation to assure the reflection of unabsorbed light at the first path through structure and front surface texturing reducing the surface reflection to the maximum [11-14]. Front surface texturing of single crystalline silicon cells depends on the etching solution that can be isotropic or anisotropic, on the crystallography orientation, <100> or <111> of the silicon wafers and on the etching mask geometry [15].

Common Processes of Fabrication of Texturing Surfaces to Obtain an as-low-as-Possible Reflectance

Optical Lithography

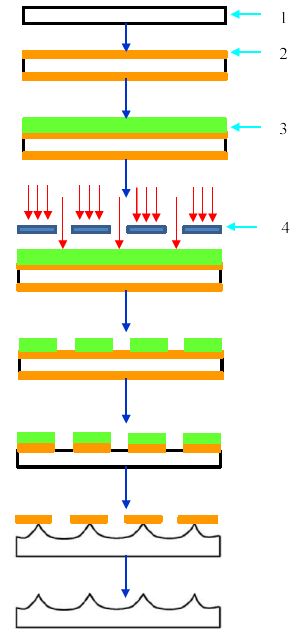
Silicon wafer surface texturing has been realized using MEMS technology [16]. The technological flow is shown in Figure 4.

fig 4

Figure 4: Technological flow for texturing surface realization: (1) silicon wafer, (2) silicon dioxide layer used as a masking layer for etching, (3) positive photoresist and (4) photolithographic process using mask.

The first step of the technological flow presented is the growth of a silicon dioxide layer used as a masking layer for etching. In the next step, by a photolithographic process based on positive photoresist, the patterned holes in silicon dioxide are formed.

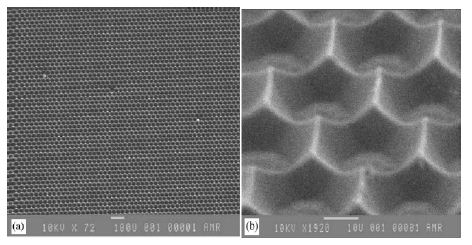
Figure 5 shows the image of the surface etched in the (HNO3:HF-50:1) solution, where Figure 5(a) presents a perspective view of the texturized surface while Figure 5(b) shows a plane view of the same structure [15]. It illustrates that hexagon texturing was formed uniformly and hexagon diagonal line was of 20 µm and the etching depth was of 7 µm at the end of etching. As a result, this process determines a significant reducing of the incident radiation reflection, the surface reflectance being under 5%. This method applied to solar cells leads to an important increase of light trapping in the structure, so that conversion efficiency over 20% is obtained.

fig 5

Figure 5: Scanning electron microscopy (SEM) image of the surface. (a) a perspective view of the texturizied surface (b) a plan view of the same structure. (Etched in the (HNO3:HF-50:1) solution).

The efficiency of a solar cell strongly depends on the interaction between the incoming light beam and the surface of the device. Any process enhances light-surface interaction increases absorption probability of the light; thus, improves generated current, in turn. Generated current could be improved either by light trapping or by increased device thickness. Considering fabrication costs and recombination losses, mechanically thin optically thick wafers are being focused on in terms of light trapping properties. Surface texturing among the other methods is an effective and more lasting technique in reducing reflections and improving light trapping.

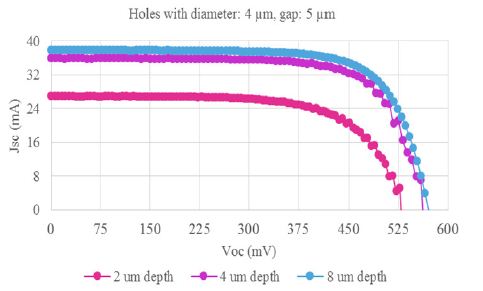
Fabricated solar cells with different patterns ended up with different device performance. Amongst them, holes of 4 μm diameter and 5 μm gap showed a remarkable trend for varying hole depths. As plotted in Figure 6, increasing hole depth resulted in better cell performance [17,18].

fig 6

Figure 6: Jsc (mA) versus Voc (mV) comparison of surfaces having holes with diameter: 4 μm, gap: 5 μm, and depth: 2-4-8 μm.

Wet Acidic Texturing

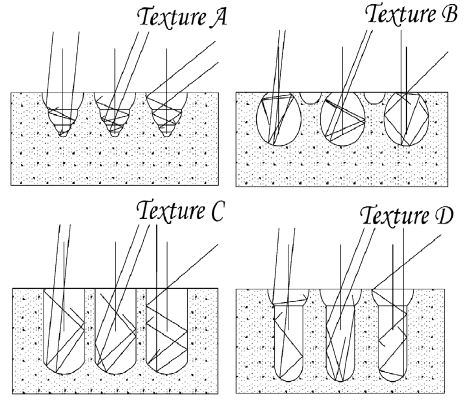
Yerokhov et al. [19] developed a mathematical model of the macroporous silicon of the real layer with the multidimensional and multilayers macroporous crater-like surface for the cost-effective solar cells, which is easily possible to realize by chemical and electrochemical etching as shown in Figure 7.

fig 7

Figure 7: Possibility of texture formation on silicon surfaces by macroporus silicon layers using different geometrical models. In every figure, one can find three light ways to a texture body (10°, 30°, 45°).

Ju et al. [20] investigated a vapor texturing method, which has several advantages such as avoiding the step formation between grains, damage removal and texturing, relatively small etching depth (nano-scale) and aesthetically pleasing uniform appearance of the fabricated solar cells.

Initially, the wafers were cleaned by immersing them in an ultrasonic bath containing 3 wt% HCl and deionized (DI) water in the ratio 1:10 at 23°C for 3 min, which produces uniform surface cleaning.

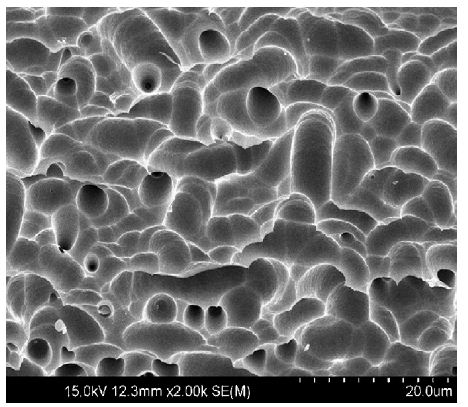
Both saw damage removal and acid texturing achieved in a single step with the saw damage removal with texturing (SDRWT) process by using acidic solution. The acidic etching solution contains HF:HNO3:CH3COOH:DI water in the ratio of 8:21:10:8. The precleaned wafers were immersed in the prepared acidic etchant, which is maintained at 26°C, which monitored using an anti-corrosive thermocouple during texturing. After 3 min, the wafers were removed from the texturing bath and completely immersed in the deionized (DI) water flow to stop the reaction, then, thoroughly rinsed thereafter. Subsequent to cleaning via DI water, the wafers were dried by a spinning method. The etching depth was calculated as 4 µm both sides of the wafers. A SEM picture of the SDRWT surface using acidic solution is shown in Figure 8.

fig 8

Figure 8: SEM picture of mc-Si wafer surface after acid texturing (SDRWT).

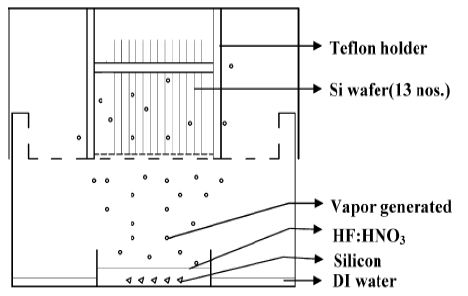
The SDRWT processed mc-Siwafers in a teflon holder was placed over the container with an optimized mixture of HF:HNO3 in the ratio 7:3. Then, the vapor was generated by adding 8 g of silicon to the HF:HNO3 mixture. The volume of HF:HNO3 used for the present investigation is 200 ml. The schematic of the vapor texturing setup is shown in Figure 9.

fig 9

Figure 9: Schematic representation of the vapor texturing setup.

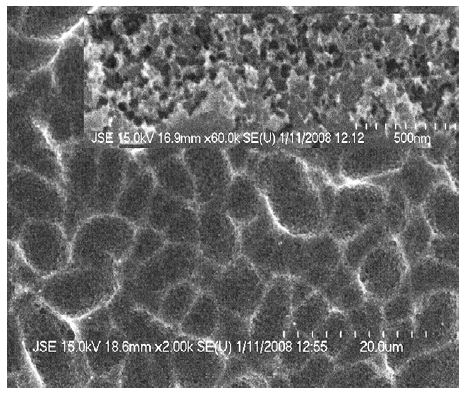
Uniform and homogeneous surface texturization was obtained in mc-Si wafers by the vapor texturing method, and it is also suitable for very thin wafers, due to minimal loss of material. The reflectance is about 6.5%. The reduction in reflectance can be explained by the roughness of the surface after nano-scale porous formation, which is shown in Figure 10, and the higher magnification is shown inside (nano-scale porous surface with pore size less than 50 nm). The improvement in the reflectance spectra with the nano-scale porous layer is due to interference effects in the layer, which implies that the nano-scale porous layer has different optical properties compared to the bulk mc-Si.

fig 10

Figure 10: Nano-scale porous formation after vapor texturing (inside higher magnification).

Texturing the surfaces of silicon wafer is one of the most important ways of increasing their efficiencies. The texturing process reduces the surface reflection loss through photon trapping, thereby increasing the short circuit current of the solar cell. To date, the texturing of crystalline silicon is usually carried out using alkaline solutions. Such solutions resulted in anisotropic etching that leads to the formation of random pyramids. Before the texturing process is carried out, saw-damage etching is performed in order to remove the surface defects and damage caused by wire sawing. In general, potassium hydroxide (KOH) solution is used for saw-damage etching. This etching results in a fairly flat surface.

There are two major losses that reduce the conversion efficiency of silicon solar cells: optical losses and electrical losses. Optical loss by surface reflection can be prevented by the use of an anti-reflection coating or by surface texturing. It is well known that polished wafers reflect 30% of the incident light. By contrast, textured surfaces and anti-reflection-coated surfaces reflect only 10% and 3% of the incident light, respectively. Reducing the extent of surface reflection can increase the short circuit current and thereby increase the conversion efficiency of the solar cell.

Alkali hydroxide etchants, such as potassium hydroxide (KOH) and sodium hydroxide (NaOH), have been widely used to texture crystalline silicon solar cells. However, these days, simple and quaternary ammonium hydroxide etchants, typically tetramethyl ammonium hydroxide (TMAH) (firstly proposed by Tabata et al. in 1992 in order to make high-efficiency crystalline Si solar cells, the light reflection from the surface should be minimized and the formation of pyramidal surface of Si decreases the reflection substantially. To satisfy the requirement, alkaline-based anisotropic etchants (e.g. KOH, NaOH) have been widely used. However, as the alkaline-based solutions result in the mobile ion contamination to IC devices, a special effort has been made to develop new anisotropic etchants that do not introduce any mobile ions so that they can be IC fabrication compatible. Among these etchants, tetramethyl ammonium hydroxide (TMAH, (CH3)4NOH) solution shows full compatibility with IC technologies, nontoxic, and good anisotropic etching characteristics. Compared to alkaline-based etchants, TMAH is readily controllable and its etch rate is constant over long etch times [21]) TMAH are used instead of KOH and NaOH due to problems associated with metal ion contamination.

The major ion involved in the silicon etching process is the hydroxyl ion (OH), which attacks the silicon surface:

Si + 2OH → Si(OH)22+ + 4e

Ions from the silicon crystal react with H2O in the solution. At the same time, the H2O dissociates and generates hydrogen gas:

4H2 + 4e → 4H2O

4H2O → 4OH + 2H2

The regenerated hydroxyl ions attack the neutral silicon again, thereby causing the reactions to continue.

Representative result of texturing for solar cell is forming random pyramids on the surface. Such pyramids are produced by anisotropic etching, which is caused by the difference in the densities of the planes in the (100) and (111) directions. Since the plane in the (111) direction is denser than that in the (100) direction, the etching rate in the (111) direction is much slower.

Isopropyl alcohol (IPA) is added in order to control the etching rate and thereby prevent an explosive reaction between the silicon surface and the OH ions. In general, as-cleaned wafers or wafers that have been saw-damage etched using an alkaline etchant are used for the fabrication of solar cells. The random pyramids formed on these wafers are typically 7-10 mm in size. Acidic etching of silicon is isotropic in nature and therefore results in the surface features to become ‘‘round’’ in shape [22].

The mono-crystalline silicon wafers employed were boron-doped (100) wafers with resistivities 6-12 Ωcm. The thickness of wafers was 270 µm. The surfaces of the wafers were first cleaned in order to eliminate any organic and metal impurities. Both a sulfuric acid mixed with hydrogen peroxide solution (SPM) and a hydro chloric acid mixed with hydrogen peroxide solution (HPM) were used for this cleaning process, based on a standard RCA cleaning procedure [23]. After rinsing the wafers with sufficient de-ionized water (DIW) between each cleaning step, wafers were dipped in buffed oxide etching (BOE) solution in order to remove the native oxide layer. For comparison, wafers with three different surface morphologies were prepared.

Sample 1 was not saw-damage-etched wafer and Sample 2 was saw-damage etched with KOH solution. The final wafer was saw-damage etched with an aqueous acid mixture (Sample 3). All of the wafers were then anisotropically etched using solution mixture of KOH and IPA. The relevant chemical composition and process conditions are listed in Table 1.

Table 1: Chemical composition and process conditions.

Process

Chemical composition

Temperature (°C)

Time

Cleaning SPM

H2SO4:H2O2=2:1

80

10 min

HPM

HCl:H2O2:DIW=1:2:5

85

10 min

Saw-damage etching Sample 2

KOH

80

10 min

Sample 3

HF:HNO3:CH3COOH=1:2:3+fluoric surfactant

RT

10-60 s

Texturing

KOH:IPA:DIW=1:6:55

80

30 min

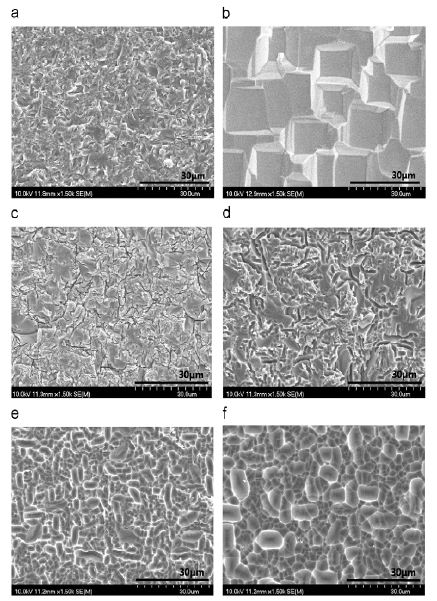
The surface of Sample 1 just after cleaning was very rough and had many defects and damaged areas. When such defects and damaged areas are allowed to remain, it is difficult to fabricate uniform and well-aligned solar cell. Moreover, the efficiency of the solar cell was decreased by increased surface recombination probability of the electrons and holes. For these reasons, defects and damaged areas are removed by saw-damage etching, normally using an alkaline etchant. KOH was used (Sample 2). During the etching process, the wafers were isotropically etched at a rate of 2 mm/min against the (100) direction. The etching clearly reduces the surface roughness, as shown in Figure 11(b). Square shapes (10 mm width, 5 mm high in average) were formed on the surface during the etching process. As time progressed, the squares become wider, thereby flattening the surface.

However, when using an acidic solution (Sample 3) to remove saw-damages, it remained round in shape on the surface as shown in Figures 11c-11f. The mechanism of acidic saw-damage etching is shown below.

Oxidation 3Si + 4HNO3 → 3SiO2 + 4NO + 2H2O

Removing Oxide 3SiO2 + 18HF → 3H2SiF6 + 6H2O

fig 11

Figure 11: SEM images of the silicon surface: (a) as-cleaned wafer (Sample 1), (b) saw-damage-etched wafer using an alkaline solution (Sample 2), (c) saw-damage-etched wafer using an acidic solution (Sample 3) for 10 s, (d) for 20 s, (e) for 30 s, and (f) for 60 s.

First, silicon oxidation occurs upon exposure to nitric acid. Then, hydro fluoric acid removes the oxidized layer, thereby forms H2SiF6. At the same time, acetic acid acts as a buffering agent that prevents nitric acid from decomposing intoNO3 or NO2.

In general, the etching time is a combination of the chemical reaction time and the transport time by diffusion. The process limitation is determined by the slowest time. In such case, the diffusion time is longer than the reaction time. In a transport-limited process like this, the etching selectivity is small and the surface is less important than in reaction-limited processes.

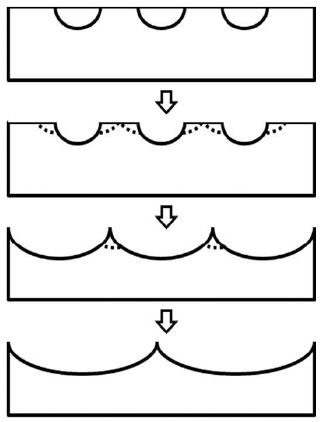
As a result, isotropic etching occurs. After etching, the surface is marked with round shapes. In the cross-sectional view, a wave-like surface was observed. The round crater-like features on the surface resulted from the conditions at the initial starting point of the etching process. Due to the relatively low concentration of HNO3, the reaction starts at sites of low activation energy (e.g., a surface defect) then diffuses into neighborhood sites. Therefore, as Figure 12 shows, the diameter of the round craters increases as time progresses.

fig 12

Figure 12: Schematic diagram of the silicon etching with an acidic etchant.

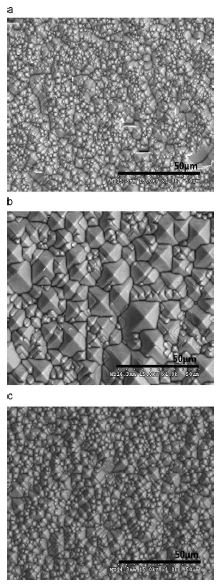
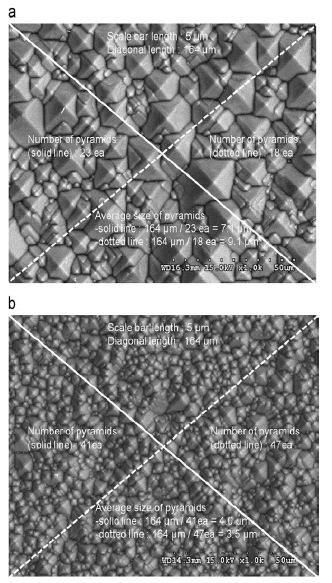
Upon texturing, using a solution of KOH in IPA, random pyramids were formed on all of different types of wafers. In the case of the just cleaned wafer (Sample 1), many defects remain on the surface after texturing (Figure 13(a)). However, Samples 2 and 3 do not show these defects due to saw-damage etching, as shown clearly from Figure 11. In order to define the size of the pyramids after texturing, intercept method was used. First, draw the diagonal line on the SEM image from Figure 13. As the scale bar indicates 50 mm, the length of line is 164 mm. Then count the number of pyramids caught by the diagonal lines. The length of diagonal line divided by number of pyramids gives the average value of pyramids size (Figure 14).

fig 13

Figure 13: SEM images of the silicon surface after texturing with KOH+IPA mixture solution: (a) sample 1, (b) sample 2, and (c) sample 3 with 60 s etching.

fig 14

Figure 14: Intercept method using SEM image of Figure 13: (a) sample 2 and (b) sample 3.

The pyramids of Sample 2 were 7-10 mm in size. By comparison, the pyramids of Sample 3 were just 3-4 mm in size. These results show that the surface condition before the texturing step affects the formation of the pyramids.

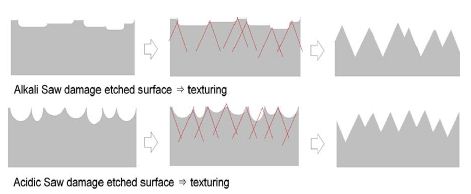
When round craters on the surface are formed by acidic saw-damage etching, there could be more exposure of (111) planes that have lower etching rate due to high density of plane and resistivity. It seems to act as a stable starting point for etching. Hence, reducing the size of the pyramids means that more pyramids can form on the same surface area (Figure15).

fig 15

Figure 15: Schematic representation of the texturing process on different saw-damage-etched wafers.

Among the three solar cells, Sample 1 showed the lowest conversion efficiency. This can be caused by the many defects on its surface that increase series resistance. In contrast, Sample 3 showed the best cell characteristics. Compared to Sample 2, Sample 3 has a similar open circuit voltage (Voc) and fill factor (FF) but a higher short circuit current (Jsc) of about 3.4 mA/cm2. The increased Jsc indicates an improvement in the photo generation, as would be predicted from the lower reflectance observed in Figure 6. Therefore, this can explain that improved textured surface by acidic saw-damage etching contributes to enhance conversion efficiency by effective photon trapping evidenced by decreased reflectance and increased Jsc.

Chu et al. [24] proposed a simple and cost-effective approach for texturing crystalline silicon wafers without surfactant added in alkaline etchants.

The etching experiments were carried out using 300’’, p-type, <100>; oriented, crystalline silicon wafers with resistivity 1-3 Ωcm. Before texturization, the wafers were etched in 10% hydrofluoricacid (HF) to remove native oxide and rinsed in deionized water. The wafers were then etched in KOH (1 wt%) solutions at different temperatures for 10, 15, and 20 min. The etching solution was heated with a temperature-controlled hot plate. The hydrogen bubbles produced during etching were trapped on the wafer surfaces utilizing the stainless steel metal grids with different square openings with 1, 1.5, 2, and 3 mm square opening for texturing at 1 and 2 mm wafer-to-grid separations.

The pyramids fabricated using the proposed approach is dependent not only on the conditions of the KOH etchants but also on the structures of the metal grids to the silicon wafers.

Figure 16 shows the SEM photos of the surface morphology of the silicon wafers textured in the KOH solution at 90°C for20 min using the metal grids with different sizes of openings. The separation between the wafers and the grids was kept at 1 mm (Since the typical diameter of the bubbles was around 2-3 mm. Therefore, the bubbles could not function as the etch mask effectively during the etching. The bubble trapping capability of the grid decreased if the wafer and the grid were further separated.).

fig 16

Figure 16: The SEM photos of the surface morphology of the silicon wafers textured in 1 wt% KOH solution at 90 °C for 20 min using metal grids with (a) 1, (b) 1.5, (c) 2, and (d) 3 mm2 openings.

Without any antireflection coating, an average weighted reflectance of 15.1% is achieved. In addition to the fact that isopropyl alcohol (IPA) was no longer needed in the etching process, the cost of the raw materials used throughout the entire texturization (buffered-HF pre-treatment, KOH-only texturing and HCl/buffered-HF/DI-water post-treatment) of the proposed approach is 0.105 USD/wafer, a considerable reduction if compared with the cost of 0.154 USD/wafer in the conventional texturing process.

Nowadays different technologies of crystalline silicon (c-Si) solar cells, consisting in mono, poly, and multi c-Si, represent nearly 80% of the total worldwide photovoltaic (PV) production.

For wet texturing solutions consisting of potassium hydroxide (KOH) or sodium hydroxide (NaOH), combined with deionized water (DI H2O) and isopropyl alcohol (IPA) were used to produce pyramid-like structures on c-Si surfaces with low reflectance values. SEM images of textured c-Si surfaces processed by different KOH/IPA/DI H2O based solutions listed in Table 2 are shown in Figure 17.

Table 2: Parameters of 6 different c-Si texturing processes using chemical solutions based on KOH/IPA/DI H2O.

Process

KOH (wt%) IPA (vol%) Temperature (°C) Time (min)
1A 1.5 3.8 70

30

1B

1.5 3.8 70 50
2A 1 8 80

30

2B

1 8 80 50
3A 1.35 7 70

30

3B

1.35 7 70

50

fig 17

Figure 17: SEM images of textured c-Si surfaces processed by different KOH/IPA/DI H2O based solutions listed in Table 2.

For c-Si solar cells the tendency is to reduce the amount of silicon, since this represents the main cost of the overall solar cell, therefore one direction followed is the research of the development of ultrathin c-Si wafers.

On the other hand, there is a constant research on how to improve the c-Si solar cells fabrication processes, with the aim to increases the conversion efficiency, the study of light trapping in the silicon surface has attracted much attention, since a reduction in the amount of light reflected form the solar cell surface, results on an increase of the short circuit current (Isc) and therefore on the efficiency.

This issue has been partially solved using anti reflective coatings (ARC), as silicon oxide-SiO2 [Green 2003], silicon nitride-SiNx [25] and sol-gel Al doped zinc oxide-AZO [26], among others. Some of those films have demonstrated excellent optical transmittance (~90%) in the 400-1100 nm wavelength range. As well, for HIT solar cells, transparent conductive oxides (TCOs) as indium tin oxide-ITO are widely used due to their very high transmission values (close to 90% in the range of 300-900 nm of the electromagnetic spectrum) and low resistivity [27].

Another way to increase the conversion efficiency is texturing the c-Si wafer surface with alkaline solutions; this technique has been widely studied and incorporated to industry, since the pyramid-like structures that are produced are very suitable to reduce the reflected light to values below 15% [28].

Moreno et al. [29] used (100) CZ c-Si wafers of 10 cm2 and resistivity of 5-15 Ωcm for wet texturing processes; the KOH concentration was varied from 1 to 1.5 wt%, the IPA concentration was varied from 3.8 to 8 vol%, the temperature was in the range of 70-80°C, and two different times (30 and 50 min) were employed.

The diffused reflectance (R) as a function of the wavelength (in the range of 300-700 nm) of the textured samples using different KOH based solutions included as reference, the R value of a flat polished wafer, was tested. Results show that the average R of the reference wafer is 36%, while for samples 3A/3B is of above 27%. Larger reduction is observed in samples 1A, 2A and 2B with R of 18%, the sample 1B has the lowest value of R (13%).

Kim et al. [30] investigated how the wet chemical etching process to form random pyramids was affected by surface conditions.

The p-type (100) mono-crystalline silicon wafers with a resistivity of 0.5-3.0 Ωcm and thickness of 200 µm was used. To witness the texturing behavior, three different surface wafers were prepared, namely saw-damage etched (SDE), polished, and as-cut wafers.

Figure 18 shows scanning electron microscopy (SEM) images of the different surface conditions. The saw-damage etching process was performed with potassium hydroxide (KOH) for 10 min, at 80°C. The polished wafer was prepared by using chemical mechanical polishing (CMP). After preparing the different surface wafers, the texturing process was carried out using a 20 wt% tetra-methyl ammonium hydroxide (TMAH) solution with isopropyl alcohol (IPA) at 80°C. Analysis of the process was performed after 2, 5, 10, 20, 30, and 60 min.

fig 18

Figure 18: SEM images of textured surfaces over times 2, 5, 10, 20, 30, and 60 min for saw-damage etched, polished, and as-cut wafer samples; (a) surface and (b) tilted images.

The extent of the change in the morphology of the textured surfaces over texturing time is expressed in Figure 18. After 30 min of texturing time, the SDE sample is completely covered by pyramids. On the other hand, the as-cut and polished samples take more than 60 min to be covered. Surface texturing is an anisotropic wet-chemical etching technique that is commonly used to form random pyramids by utilizing differences in etching rates for the planes in the (1 0 0) and (1 1 1) direction. The saw-damage etching process carries out isotropic wet-chemical etching to eliminate micro-cracks caused by the use of a strong alkaline solution (e.g., KOH) for wire sawing. However, this process creates squares and inclined planes due to incomplete isotropic etching, as illustrated in Figure 19, where the inclined plane is rough with no flat character.

fig 19

Figure 19: SEM images of an inclined plane after saw-damage etching to give a saw-damage etched wafer surface.

For the SDE sample, Figure 18(b) (2, 5, and 10 min) shows that pyramids are preferentially created in an inclined plane of squares that are generated through the saw-damage etching process. Because (1 1 1) planes are exposed by the inclined plane of squares, the SDE sample takes less texturing time than do the other sample types.

For the polished sample, pyramids are randomly created. The etching rate of the polished wafer is similar to any other defect-free surface; however, the as-cut sample was completely covered by secondary pyramids that were created after the first set of pyramids.

The etching reaction exhibited on the as-cut wafer is active due to the inherent surface defects, and for up to 10 min, many defects remain on the surface after texturing. After 20 min, the surface morphology does not indicate these defects, instead of the squares created by the saw-damage etching process since similar surface shapes were observed. During the texturing process of the as-cut wafer, texturing pyramids are created and surface defects are removed simultaneously.

As a result, texturing the surface of a silicon wafer brings about a reduction in the surface reflectance. The weighted reflectance of each sample is 11.0, 13.8, and 23.1% in SDE, polished, and as-cut wafer, respectively. However, each sample exhibits an almost equivalent reflectance after 60 min of texturing process time, where the reflectance is 10.7, 10.9, and 11.0%.

Lee et al. [31] proposed a process called electro-less etching to investigate the density and size of silicon nanowires on a pyramid-textured silicon surface and its photovoltaic performance, especially on the minority-carrier recombination lifetime of silicon nanowires, and photovoltaic performance on the density and size of silicon nanowires on the pyramid-textured silicon surface.

The as-cut (1 × 1 cm2) p-type silicon wafers with a resistivity of 1-3 Ωcm and a thickness of 200 µm were etched by using 2 wt% potassium hydroxide (KOH) solution to produce randomly distributed square-based pyramids on the silicon surface and to remove sawing damage. The pyramid-textured silicon wafers were dipped into the mixture solution of AgNO3 (0.068 g), deionized water (160 ml), and hydrofluoric acid (46 ml) for 30 s to deposit Ag nanoparticle masks on the pyramid-textured silicon surface. Then, the pyramid-textured silicon wafers with Ag nanoparticle masks were etched with a mixture solution of FeNO3 (8.16 g), hydrofluoric acid (HF: 46 ml), and deionized water (160 ml) for 0, 1, 2, 3, 4, 5, 7, 10, and 15 min, to produce silicon nanowires on the wafer surface.

The surface morphology of the pyramid-textured silicon surface as a function of the etching time of silicon nanowires is shown in Figure 20.

Selective alkaline etching using KOH produced uniformly distributed square-based silicon (111) pyramids, as shown in a cross-sectional and top view SEM image (inset, bottom left) in Figure 20a. Deposition of Ag nanoparticles using the mixture solution of AgNO3, deionized water, and hydrofluoric acid for 30 s followed by electro-less etching using the mixture solution of FeNO3, hydrofluoric acid, and deionized water for 1 min produced silicon nanowires 56 µm in diameter and 211 µm in height on the pyramid-textured silicon surface, as shown in the SEM, top view SEM image (inset, bottom left), and TEM image (inset, bottom right) in Figure 20b. The diameter of silicon nanowires on the pyramid-textured silicon surface increased initially up to ~56 nm when the electro-less etching time increased up to 2 min, and then maintained with ~109 nm although the electro-less etching increased further, as shown in Figure 20b-20i. Otherwise, the height of silicon nanowires on the pyramid-textured silicon surface increased from ~211 nm to ~1175 nm when the electro-less etching time increased from 1 min to 15 min, Figures 20b-20i. In particular, silicon nanowires tended to collapse with electro-less etching times that exceeded 10 min, as evident in Figures 20h and 20i.

fig 20

Figure 20: Surface morphology of silicon nanowires on pyramid-textured silicon surface depending on electro-less etching time: (a) 0, (b) 1 min, (c) 2 min, (d) 3 min, (e) 4 min, (f) 5 min, (g) 7 min, (h) 10 min, and (i) 15 min.

Results indicate that silicon nanowires on a pyramid-texture silicon surface probably enhance power conversion efficiency (PCE) by weakening the dependence of the light incident angle on PCE.

It illustrates that the silicon nanowire fabrication method using the Ag nanoparticle mask and electro-less etching is expected to be a key engineering technique that makes it possible to achieve maximum photovoltaic performance of silicon solar cells. Note that the p-type silicon photovoltaic cell with silicon nanowires on {111} pyramid-textured silicon surface enhanced ~10% in PCE compared to a conventional p-type silicon photo-voltaic cell that skipped anti-reflective coating process (plasma enhanced chemical vapor deposition). In addition, the process cost of the deposition of Ag nanoparticle mask and electro-less etching is probably similar or cheaper than that of anti-reflective coating process.

Srivastava et al. [32] reported a simple and fast etching process yet effective for nano-scale texturing of mc-Si surface using silver assisted wet chemical etching.

As-cut (1-2 Ωcm, B-doped) p-type mc-Si wafer of thickness ~250 µm and 100 × 100 mm2 size are used as the starting material. Samples of 50 mm diameter are diced from the large mc-silicon wafers in order to have the identical electrical/electronic properties. The samples are first cleaned and etched in an HNO3:HF:CH3COOH = 5:1:1 (v/v) etching solution to remove the saw damages. Thereafter, the samples are chemically polished (CP) in HF and HNO3 solution at ~4°C [33].

Three steps were taken: (i) deposition of a thin Ag layer onto the polished mc-Si using electro-less metal deposition in an aqueous 4 M HF solution containing 8 mM AgNO3 (for 10 s); (ii) etching of the Ag deposited samples in H2O:HF:H2O2::10:2:1 (v/v) solution at room temperature for 0-180 s; and (iii) removal of residual Ag particles from the samples in NH4OH + H2O2 solution. Finally, the mc-Si samples are rinsed in de-ionized water and blown dry with nitrogen.

The surface of the etched samples are black in appearance for etch duration; 20 s < tetch < 45 s; even under illumination at angles away from normal to the surfaces. For tetch > 45 s surface is brownish, as shown in Figure 21. The relevant detailed structures are shown in Figure 22. Results show that the nano-textured mc-Si surface with reflectance <5% enhances the photocurrent by ~20% in the short circuit current.

fig 21

Figure 21: Optical images of mc-Si samples, ST (where the suffix, T = CP, 30, 60, 90, 120 and 180 represent polished, 30 s, 60 s, 90 s, 120 s and 180 s texturization time, respectively.)

fig 22

Figure 22: SEM images of a typical mc-Si surface (a) lateral view, (b) cross sectional view and (c) magnified cross sectional view showing nanotextured features formed at an angle (~30°) to the normal to the surface. Nano-textures are different in density and alignment with respect to the normal to the silicon surface. Grain boundaries are indicated by arrows in (a) and (b).

Future Prospects

Understanding the final wastes of wet acidic texturing is a critical issue to environmental pollutions. Unfortunately, it is still an area where a huge knowledge gap exists. The fate of final wastes and the resulting implications for environments-such as contaminated earth, pipelines, crops, under water, etc. are not well understood. The wider use of etchants in wet acidic texturing has increased their release into the environment through soil, water, and air, which may lead to unintended contamination of terrestrial and aquatic ecosystems.

The present state of knowledge in treatment with wastes of wet acidic texturing is still in a foundational stage along with silicon solar cell with nanostructures. Not only is data limited and inconclusive regarding texturing wastes’ and nano-silicon structures distributed in solar cells’ impacts in our daily life, but more information is needed on properties that control their effects in environments. Moreover, the interplay of these factors gives confounding results making it almost impossible to predict.

Therefore, the difference between the potential benefits and harm from wet acid texturing is quite subtle and a large knowledge gap exists on the long-term impacts to the environment, especially on the human health.

References

  1. Herche W (2017) Solar energy strategies in the U.S. utility market. Renewable and Sustainable Energy Reviews 77: 590-595.
  2. Kannan N, Vakeesan D (2016) Solar energy for future world: – A review. Renewable and Sustainable Energy Reviews 62: 1092-1105.
  3. Sampaio PGV, González MOA (2017) Photovoltaic solar energy: Conceptual framework. Renewable and Sustainable Energy Reviews 74: 590-601.
  4. Shah TR, Ali HM (2019) Applications of hybrid nanofluids in solar energy, practical limitations and challenges: A critical review. Solar Energy 1831: 173-203.
  5. Wolfe KD, Dervishogullari D, Passantino JM, Stachurski CD, Jennings GK, et al. (2020) Improving the stability of photosystem I-based bioelectrodes for solar energy conversion. Current Opinion in Electrochemistry 19: 27-34.
  6. Akbari H, Browne MC, Ortega A, Huang MJ, Hewitt NJ, Norton B, McCormack SJ (2019) Efficient energy storage technologies for photovoltaic systems. Solar Energy 192: 144-168.
  7. Hernández-Callejo L, Gallardo-Saavedra S, Alonso-Gómez V (2019) A review of photovoltaic systems: Design, operation and maintenance. Solar Energy 188: 426-440.
  8. Skoko SM, Ciric RM (2017) Laboratory exercises of photovoltaic systems-Review of the equipment, methodology, trials and results. Renewable and Sustainable Energy Reviews 79: 293-303.
  9. Heimsath A, Nitz P (2019) The effect of soiling on the reflectance of solar reflector materials – Model for prediction of incidence angle dependent reflectance and attenuation due to dust deposition. Solar Energy Materials and Solar Cells 195: 258-268.
  10. Yun MJ, Sim YH, Cha SI, Seo SH, Lee DY (2019) 3-Dimensional dye sensitized solar cell sub-module with oblique angled cell array for enhanced power and energy density output utilizing non-linear relation in cosine law of light incident angle. Solar Energy 177: 355-363.
  11. Bonilla RS, Jennison N, Clayton-Warwick D, Collett KA, Rands L, et al. (2016) Corona charge in SiO2: kinetics and surface passivation for high efficiency silicon solar cells. Energy Procedia 92: 326-335.
  12. Grant NE, Kho TC, Fong KC, Franklin E, McIntosh KR, et al. (2019) Anodic oxidations: Excellent process durability and surface passivation for high efficiency silicon solar cells. Solar Energy Materials and Solar Cells 203: 110155.
  13. Subramani T, Chen JY, Sun YL, Jevasuwan W, Fukata N (2017) High-efficiency silicon hybrid solar cells employing nanocrystalline Si quantum dots and Si nanotips for energy management. Nano Energy 35: 154-160.
  14. Tamang A, Sai H, Jovanov V, Bali SIH, Matsubara K, et al. (2016) On the interplay of interface morphology and microstructure of high-efficiency microcrystalline silicon solar cells. Solar Energy Materials and Solar Cells 151: 81-88.
  15. Manea E, Budianu E, Purica M, Cristea D, Cernica I, et al. (2005) Optimization of front surface texturing processes for high-efficiency silicon solar cells. Solar Energy Materials & Solar Cells 87: 423-431.
  16. Lindroos V, Tilli M, Lehto A, Motooka T (2010) Handbook of Silicon Based MEMS Materials and Technologies. Norwich, NY, William Andrew; Oxford: Elsevier Science.
  17. Altinoluk SH, Ciftpinar HE, Demircioglu O, Es F, Baytemir G, et al. (2016) Light trapping by micro and nano-hole texturing of single crystalline silicon solar cells. Energy Procedia 92: 291-296.
  18. Basu PK, Khanna A, Hameiri Z (2015) The effect of front pyramid heights on the efficiency of homogeneously textured inline-diffused screen-printed monocrystalline silicon wafer solar cells. Renewable Energy 78: 590-598.
  19. Yerokhov VY, Hezel R, Lipinski M, Ciach R, Nagel H, et al. (2002) Cost-effective methods of texturing for silicon solar cells. Solar Energy Materials & Solar Cells 72: 291-298.
  20. Ju M, Gunasekaran M, Kim K, Han K, Moon I, et al. (2008) A new vapor texturing method for multicrystalline silicon solar cell applications. Materials Science and Engineering B 153: 66-69.
  21. Tabata O, Asahi R, Funabashi H, Shimaoka K, Sugiyama S (1992) Anisotropic etching of silicon in TMAH solutions. Sensors and Actuators A: Physical 34: 51-57.
  22. Park H, Kwon S, Lee JS, Lim HJ, Yoon S, et al. (2009) Improvement on surface texturing of single crystalline silicon for solar cells by saw-damage etching using an acidic solution. Solar Energy Materials & Solar Cells 93: 1773-1778.
  23. Kern W (2018) Overview and Evolution of Silicon Wafer Cleaning Technology. Handbook of Semiconductor Water Cleaning Technology 3-85.
  24. Chu AK, Wang JS, Tsai ZY, Lee CK (2009) A simple and cost-effective approach for fabricating pyramids on crystalline silicon wafers. Solar Energy Materials & Solar Cells 93: 1276-1280.
  25. Duttagupta S, Ma FJ, Hoex B, Mueller T, Aberle AG (2012) Optimised antireflection coatings using silicon nitride on textured silicon surfaces based on measurements and multidimensional modelling. Energy Procedia 15: 78-83.
  26. Verma A, Khan F, Kumar D, Kar M, Chakravarty BC, et al. (2010) Sol-gel derived aluminum doped zinc oxide for application as anti-reflection coating in terrestrial silicon solar cells. Thin Solid Films 518: 2649-2653.
  27. Park YS, Kim E, Hong B, Lee J (2013) Characteristics of ITO films with oxygen plasma treatment for thin film solar cell applications. Materials Research Bullutin 48: 5115-5120.
  28. Leonard F (2012) Texturing, reflectivity, diffuse scattering and light trapping in silicon solar cells. Solar Energy 86: 319-325.
  29. Moreno M, Murias D, Martínez J, Reyes-Betanzo C, Torres A, et al. (2014) A comparative study of wet and dry texturing processes of c-Si wafers for the fabrication of solar cells. Solar Energy 101: 182-191.
  30. Kim H, Park S, Kang B, Kim S, Tark SJ, et al. (2013) Effect of texturing process involving saw-damage etching on crystalline silicon solar cells. Applied Surface Science 284: 133-137.
  31. Lee IJ, Paik U, Park JG (2013) Solar cell implemented with silicon nanowires on pyramid-texture silicon surface. Solar Energy 91: 256-262.
  32. Srivastava SK, Singh P, Yameen M, Prathap P, Rauthan CMS, et al. (2015) Antireflective ultra-fast nanoscale texturing for efficient multi-crystalline silicon solar cells. Solar Energy 115: 656-666.
  33. Green MA (2003) Crystalline and thin film silicon solar cells: state of the art and future potential. Solar Energy 74: 181-192.

mRNA Vaccines for SARS-CoV-2 are “95% Effective”: What Does That Mean?

DOI: 10.31038/JNNC.2020344


In a recent paper, Polack et al. [1], who are members of the C4591001 Clinical Trial Group, stated that the Pfizer vaccine for SARS-CoV-2 is 95% effective. The Clinical Trial Group and their paper are funded by BioNTech and Pfizer. The statement that the mRNA vaccines for SARS-CoV-2 manufactured by Pfizer and Modern are 95% effective has been made countless times in the media and by the heads of the CDC and NIAID and other physicians and public health authorities. But what does “95% effective” actually mean? It is a relative risk number. What are the raw data reported by Polack et al. [1]? In their trial, 21,720 participants received the active vaccine and 21,728 received placebo. Altogether, 162 participants in the placebo group developed COVID-19 illness compared to 8 in the vaccine group; 9 participants in the placebo group developed severe COVID-19 disease compared to 1 in the vaccine group. This is a reduction in COVID-19 illness of 95% (the rate of illness in the vaccine group was 8/162 = 5% of the rate in the placebo group). There were no deaths in either group. This means that there is no evidence that mRNA vaccines reduce the risk of death from COVID-19 illness.

Doing the arithmetic on the raw data, the risk of severe illness in the vaccine group was 1/21,720 = 0.00005, while it was 9/21,728 = 0.0004 in the placebo group: expressed as percentages, the risks for severe illness were 0.005% in the vaccine group and 0.04% in the placebo group. That is, the absolute reduction in risk of severe illness conferred by the vaccine was 0.035%, less than one tenth of one percent. These results by themselves are a very remarkable finding: less than 1 in 2000 individuals in the placebo group developed a severe COVID-19 illness and none died.

If we assume that the population of the United States is 330,000,000 people and we assume that the vaccines are equally effective in children, and if we assume that 10% of the population has been infected, this means that there are 33,000,000 currently or previously infected individuals in the country. If we then assume that the vaccine reduces the risk of getting severe disease by 0.035%, this means that the number of cases of severe illness in the country would have been reduced by 0.00035 x 33,000,000 = 11,500 cases if everyone got vaccinated in January, 2019. However, that number is much higher than reality, because the rates of serious COVID-19 illness are extremely low in children: the Pfizer trial enrolled only people 16 years of age or older. Polack et al. [1] state that the vaccine efficacy was the same when they controlled for age, sex, race, ethnicity, baseline body-mass index, and the presence of coexisting conditions. This means that the effectiveness of the vaccine is no higher in certain racial or ethnic groups than in others, nor is it higher in certain age groups or weight categories than others.

It is impossible to generate a precise number, but, based on the data, one must conclude that the mRNA vaccines, if administered to everyone in the United States, could prevent only a few thousand cases of serious COVID-19 illness over the next year. From the data, we know that the vaccines can prevent death in fewer than one in 21,000 people. This means that your risk of death if you get the vaccine is reduced by less than 1/21,000 = 0.00005 or less than 0.005%. None of these numbers have anything to do with being pro or anti-vaccine. They are just the facts. An assessment of the cost-benefit from COVID-19 mRNA vaccines should be balanced against their costs in terms of side effects, financial costs, and diversion of resources from other social and public health needs. Telling the public that the mRNA vaccines for COVID-19 are 95% effective leads to a false sense of safety and security, much like stating that face masks are effective for reducing viral transmission in public [2]. There is no evidence that mRNA vaccines reduce the rate of coronavirus transmission in public: if they do not, or do so by only a tiny amount, then it is not socially irresponsible to decline to take the vaccine. It is irresponsible not to practice social distancing and not to quarantine if symptomatic, but there is no evidence that declining the vaccine will increase anyone else’s risk of serious illness or death to a meaningful extent. Public health policies should be based on these facts, not on scare tactics, a false sense of security, or political ideology distorting the data and the science.

References

  1. Polack FP, Thomas SJ, Kitchin N, Absalon J, Gurtman A et al (2020) Safety and efficacy of the BNT162b2 mRNA Covid-19 vaccine. New England Journal of Medicine 383: 2603-2615 [crossref]
  2. Ross CA (2020) Differences in evaluation of hydroxychloroquine and face masks for SARS-CoV-2. Journal of Neurology and Neurocritical Care 3: 1-3.

Association between Blood Pressure Variability and Functional Outcomes after Successful Mechanical Thrombectomy in Acute Ischemic Stroke

DOI: 10.31038/JNNC.2020343

Abstract

Background/objective: Optimal blood pressure parameters for patients that undergo successful mechanical thrombectomy (MT) are not clearly defined. Our study sought to investigate the relationship of blood pressure variability on clinical outcomes after successful revascularization and determine optimal thresholds for BP parameters that correlate with a poor functional outcome.

Keywords

Mechanical thrombectomy, Stroke, Blood pressure, Variability, Risk score

Introduction

Intravenous (IV) thrombolysis and endovascular therapy with mechanical thrombectomy (MT) increase functional independence, improve mortality and are standard of care in patients with acute ischemic stroke (AIS) due to large vessel occlusion (LVO) [1-3]. While these advancements have revolutionized stroke care, optimal blood pressure management following successful MT has yet to be definitively determined. Hypertension and impairment of cerebral autoregulation are common after AIS, and procedural management can predispose patients to blood pressure variability, including hypotension [4-6]. If cerebral autoregulation is impaired, small fluctuations in blood pressure may result in excessive changes in cerebral blood flow and contribute to secondary brain injury (SBI) [7].

To date there are no randomized controlled trial data regarding blood pressure management after successful MT, resulting in heterogeneity in post MT management [8]. Most institutions have adopted target values of Systolic Blood Pressure (SBP) less than 180, extrapolated from retrospective studies, thrombolysis trials and post-tPA guidelines [1,2,8-10]. Allowance of SBP of up to 180/105 by the American Heart Association/American Stroke Association is largely based on the assumption that increasing cerebral perfusion pressure to an ischemic area may curtail further ischemia or infarction. However, these BP recommendations were made based on sustained revascularization rates from tPA of under 40%, and does not take into consideration the effect of higher recanalization rates from MT of 70-80% [11-13]. After successful revascularization, there is a concern of reperfusion-related hemorrhagic transformation (HT), therefore lower BP goals have been suggested, for instance the DAWN trial investigators used SBP<140 for 24 hours post-MT in these patients [14].

Many studies focus on maximum values of BP parameters, even though BP variability may also play an important role in functional outcomes in patients receiving MT [13,15,16]. Recent studies show that blood pressure reductions before and/or during MT [17-19] as well as blood pressure increases and fluctuations following MT [13,16] are associated with worse outcomes [15,16]. These variable conclusions highlight the complexity of BP management after MT and suggest that perhaps blood pressure management should be tailored to patient physiology such as autoregulatory capacity, phase of injury and success of the intervention. We aimed to study if acute blood pressure variability, rather than absolute parameters affected functional outcome after successful revascularization. We hypothesized that a higher BP variability after successful MT would correlate with poor functional outcomes and sought to determine optimal BP cutoffs that correlated with poor outcome. In addition, our goal was to develop an individualized risk score to predict a patient’s functional outcome 90 days after successful revascularization based on their post-MT BP parameters and demographics.

Methods

Study Design and Patient Selection

We conducted a retrospective observational study on a consecutive sample of 314 AIS patients between January 2015 and December 2017 at the only tertiary medical center in the state of West Virginia. Of 314 patients that were reviewed, 107 patients underwent MT for LVO. LVO was defined as a proximal middle cerebral artery (M1, M2), terminal intracranial internal carotid artery (ICA) occlusion, or tandem occlusions. Tandem occlusions were defined as simultaneous extracranial cervical ICA critical stenosis or complete occlusion with concomitant large vessel intracranial occlusion. Posterior circulation occlusions were excluded from this analysis. Out of 107 patients, 20 were excluded due to unsuccessful recanalization. Success of recanalization was quantified using the Thrombolysis in Cerebral Infarction (TICI) score, categorized as unsuccessful for TICI 0, 1, 2a and successful for TICI 2b, 2c and 3. Of the 87 patients who had successful MT, 44 received tPA. IV tPA was not given if they met our institutional tPA exclusion criteria, and the most common reason it was withheld in our population was due to being outside of the tPA window. The study was approved by the Institutional Review Board of West Virginia University and the need for informed consent was waived.

Patients’ baseline characteristics and demographics including age, gender, National Institutes of Health Stroke Scale (NIHSS) at admission and BP values, were collected and included in our data analysis. SBP, diastolic blood pressure (DBP) and Mean arterial Pressure (MAP) values were measured and recorded at least once every hour for the first 24 hours following MT as standard of care. These demographics are displayed in Table 1, which demonstrates baseline demographics of the cohort, stratified by outcome.

Table 1: Baseline Characteristics of Sample Population, displayed by event outcome.

 Outcome

 Poor MRS at 90 days  Death at 90 days

 HT

Variable

No (n = 45) Yes (n = 33) No (n = 60) Yes (n = 18) No (n = 54) Yes (n = 33)
Age 65.3 (15.9) 74.0 (11.3) 67.5 (15.9) 74.1 (8.0) 70.8 (13.9)

63.3 (17.9)

NIHSS

12.8 (7.9) 18.3 (7.6) 14.4 (8.4) 17.5 (7.1) 15.1 (8.9) 15.6 (7.1)
Female 19 (42.2%) 19 (57.6%) 29 (48.3%) 9 (50.0%) 30 (55.6%)

13 (39.4%)

Male

26 (57.8%) 14 (42.4%) 31 (51.7%) 9 (50.0%) 24 (44.4%) 20 (60.6%)
SBP Mean 122.9 (13.1) 126.1 (11.9) 122.9 (13.0) 128.7 (10.5) 123.4 (13.8)

125.3 (9.3)

SBP SD

13.0 (4.2) 15.6 (4.5) 13.5 (4.3) 16.0 (4.8) 14.2 (4.8) 13.3 (3.6)
SBP Range 55.2 (17.3) 67.6 (20.0) 58.2 (19.1) 68.1 (18.9) 60.8 (21.2)

56.9 (15.2)

DBP Mean

64.4 (10.0) 63.4 (10.1) 63.5 (9.8) 65.7 (10.8) 62.8 (10.6) 67.4 (9.2)
DBP SD 11.0 (4.2) 12.4 (4.3) 11.4 (4.4) 12.3 (3.9) 12.1 (4.5)

10.4 (3.3)

DBP Range

50.2 (21.7) 58.1 (20.0) 51.9 (21.7) 58.8 (19.2) 55.0 (21.5) 49.0 (19.5)
MAP Mean 83.9 (9.1) 84.3 (9.4) 83.3 (9.1) 86.7 (9.2) 83.0 (9.7)

86.7 (7.5)

MAP SD

10.1 (3.1) 11.4 (3.3) 10.4 (3.1) 11.5 (3.4) 11.0 (3.5)  9.8 (2.5)
MAP Range 44.8 (15.6) 52.2 (17.6) 46.5 (16.4) 52.4 (17.6) 49.1 (17.7)

44.1 (14.5)

HT, Hemorrhagic Transformation; DBP, diastolic blood pressure; MAP, mean arterial pressure; SBP, systolic blood pressure, Min, Minimum; Max, Maximum; SD, Standard Deviation. Values are reported as mean (sd), n (%). Nine subjects removed from Poor MRS and Death due to missing MRS score.

BP was measured using arterial lines, or if unavailable, non-invasive BP cuffs. Maximum, minimum, ranges and standard deviation (SD) of SBP, DBP and MAP values during this 24-hour period were extracted or calculated. Additional data that was collected for each patient included stroke etiology, stroke risk factors, NIHSS at time of discharge, mRS at 90days, death at 90 days, and presence of any HT. MRS at discharge, death at discharge and symptomatic HT, which we defined as evidence of HT on neuro-imaging in conjunction with NIHSS increase ≥4 were initially recorded but excluded from analysis given the few number of events in our small sample size. Choice of procedural anesthesia as well as a device for MT were chosen by the Neuro-interventionalist.

Outcome Definition

Primary outcomes of this study were to determine if absolute values and variability of SBP, DBP, MAP, when modeled separately and together, were associated with poor functional outcomes. Functional outcomes were measured as poor mRS (MRS 3-6) and mortality rates at 90days. Secondary outcomes of this study included HT during admission.

Statistical Analysis

Logistic regression was used to model the outcomes of interest, which were stratified into binary outcomes. Associations between the predictors and outcome variables were explored using both ULR and MLR analyses. Optimum cutoffs of variables of interest were identified based on known prevalence of these outcomes for poor functional outcomes of interest. We used the same set of predictors in Table 1 for conducting both analyses. Continuous variables were reported using descriptive methods with measures of central tendency (mean, median), and variability (standard deviation) based on the normality of the distribution. Categorical variables were reported using proportions and percentages. We used Akaike Information Criterion (AIC) for selecting which predictors to include in an optimal multivariate model. Predictors without a table entry were not selected by the stepwise AIC algorithm. Demographic variables that were not selected in the stepwise procedure were added to results of the logistic regression model and the logistic regressions were re-run to create a final multivariate regression model. Receiver Operating Characteristic (ROC) analysis was performed for poor functional outcomes of interest to determine the overall highest average area under the curve (AUC) for both analyses. Statistical analysis and graphical representations were performed using R statistical programming environment (Version 4.1.0). We used 95% Confidence Intervals (CI) to express statistical results with a two-sided significance level of 0.05. Study design and all statistical analyses were conducted in consultation with a professional biostatistician.

Results

A total of 87 patients met our inclusion criteria. The baseline characteristics of the sample population are shown in Table 1.

Univariate Association of Blood Pressure Parameters and Poor Functional Neurologic Outcome after MT

Our univariate logistic regression (ULR) analysis, shown in Table 2, demonstrated that of the variables of interest, age, NIHSS, SBP SD, SBP range and DBP mean were found to significantly correlate with poor outcome measures. A higher SD of SBP from the mean (OR=1.150, CI 1.033-1.299) and wider SBP range (OR=1.037, CI 1.011-1.066) in the first 24 hours after MT were associated with poor MRS at 90 days. Specific cutoffs with a high sensitivity and moderate specificity for SD of SBP from mean and SBP range leading to poor MRS at 90 days could be identified, with a SBP SD>12 (sensitivity=83.4%, specificity=42.2%) and SBP range>55mmHg (sensitivity=75.8%, specificity=51.1%), being associated with poor functional outcomes. A SBP SD>12 (sensitivity=86.2%, specificity=36.7%) was also associated with increased mortality at 90 days. A higher DBP mean (OR=1.045, CI 1.002-1.094), at a cutoff of mean DBP>60mmHg (sensitivity=73.9%, specificity=50.0%) was associated with a higher risk of HT. These relationships are displayed in Table 3. A higher age (OR=1.052, CI 1.013-1.100), at a cutoff of >68 (sensitivity=75.8%, specificity=48.9%) and NIHSS (OR=1.096, CI 1.031-1.173), at a cutoff of >14 (sensitivity=81.8%, specificity=62.2%) were associated with a poor MRS at 90 days, however a higher age, at a cutoff of 68 (sensitivity=75.8%, specificity=48.9%) was associated with a lower risk of HT (OR=0.970, CI 0.940-0.997) in our study. MAP parameters again were not correlated with any of the outcomes we measured. The fitted probabilities of univariate analysis of BP parameters for functional outcomes was not robust, with an AUC range of 0.6-0.7, so we followed up our analysis with a comprehensive MLR approach to identify more complex relationships between blood pressure and functional outcomes after MT.

Table 2: Results of univariate logistic regression analysis modeled for 3 functional outcomes.

 Variable

Poor MRS at 90 days

 Death at 90 days

 HT

 Age

1.052 (1.013, 1.100)

0.970 (0.940, 0.997)

 NIHSS

1.096 (1.031, 1.173)

 SBP SD

1.150 (1.033, 1.299)

1.132 (1.005, 1.289)
 SBP Range

1.037 (1.011, 1.066)

 DBP Mean

1.045 (1.002, 1.094)

Results are displayed as Odds Ratios for 95% confidence intervals for 3 functional outcomes: Poor MRS at 90, Hemorrhagic Transformation (HT) and Mortality at 90 days. Sex, SBP mean and MAP variables were not statistically significant and removed for conciseness.

Table 3: Using univariate logistic regression analysis, cut-offs, or points that maximized sensitivity and specificity were identified for significant predictors.

 Outcome

Variable

Cutoff Sensitivity Specificity

PLR

 Poor MRS at 90 days

Age

68.0 75.8% 48.9%

1.48

NIHSS

14.0 81.8% 62.2%

2.17

SBP SD

12.0 83.4% 42.2% 1.44
SBP Range 55.0 75.8% 51.1%

1.55

 Death at 90 days

SBP SD

12.0 86.2% 36.7%

1.36

 Hemorrhagic Transformation

Age

70.0 72.7% 59.3% 1.79
DBP Mean 60.0 73.9% 50.0%

1.48

Multivariate Association of Blood Pressure Parameters and Poor Functional Neurologic Outcome after MT and Development of a Risk Score

The results of our final MLR analysis of patients with AIS that underwent successful MT is displayed in Table 4. Due to the nature of the stepwise AIC selection, not all of the predictors selected to be included in the algorithm exhibited a ‘statistically significant’ confidence interval but despite this, we retained and described these variables as the importance or contribution of a predictor in a MLR model should not be judged solely on the grounds of ‘statistical significance’ [20]. Our MLR analysis confirmed findings from our ULR analysis that a higher SBP SD from the mean was associated with a poor MRS at 90 days (OR=1.156, CI 1.020-1.34) and a higher DBP mean was selected as predictive of HT(OR=1.045, CI 0.995-1.10). In addition, MLR analysis found that a higher overall SBP mean was associated with higher death at 90 days (OR=1.055, CI 1.055-1.11) and a higher DBP range was selected as predictive of HT (OR=1.066, CI 0.997, 1.15). MAP parameters again were not correlated with any of the outcomes we measured.

Table 4: Odds ratios and 95% confidence intervals of the multivariable logistic regression analysis for variables shown in Table 1, modeled for 3 functional outcomes.

Parameter

Poor MRS at 90 Days

Death at 90 Days

 HT

Age

1.038 (0.998, 1.09)

1.051 (0.998, 1.12)

0.980 (0.947, 1.01)

NIHSS

1.087 (1.019, 1.17)

1.040 (0.973, 1.12)

1.008 (0.951, 1.07)

SBP SD

1.156 (1.020, 1.34)

SBP Range
SBP Mean

1.055 (1.005, 1.11)

DBP SD

0.660 (0.442, 0.94)

DBP Range

1.066 (0.997, 1.15)

DBP Mean

1.045 (0.995, 1.10)

3 functional outcomes are Poor MRS at 90 days, Death at 90 days, Hemorrhagic Transformation. Intervals excluding 1 correspond to p < 0.05. Empty cells denote that the parameter was not selected during the stepwise selection procedure and entire rows with no entries were removed for conciseness.

It also confirmed our ULR findings that a higher age and NIHSS were associated with poor functional outcomes including MRS at 90 days (OR=1.038, CI 0.998-1.09; OR=1.087, CI 1.019-1.17) and death at 90 days (OR=1.051, CI=0.998-1.12, OR=1.040, CI=0.973-1.12) respectively. A higher age was associated with a lower HT (OR=0.980, CI 0.947, 1.01). MAP parameters were removed from the logistic regression model as they were not selected using our stepwise AIC algorithm as they due to lack of contribution to predictive power. This MLR approach reinforced that no single BP parameter by itself was a strong predictor of functional outcome, but our MLR model that included age, NIHSS and BP parameters had a strong predictive value for the outcome MRS at 90 days (AUC=0.80), followed by death at 90 days (AUC=0.75) and HT (AUC=0.73). ROC analysis using the multivariate model to determine a poor functional outcome are displayed in Figure 1. Using age, NIHSS, BP predictor variables, we attempted to develop a risk model equation for developing poor MRS at 90 days, and the predictive performance of this equation was determined by the Area Under the Receiver Operating Characteristic (AUROC) curve (AUROC=0.80).

fig 1

Figure 1: Receiver Operating Characteristic (ROC) curves for each functional outcome, from multivariate logistic regression analysis. Outcomes are Death 90, death at 90 days; HT, Hemorrhagic Transformation during hospitalization; MRS 90, Modified Rankin Scale at 90 days.

Log odds of having a poor MRS at 90 days=-6.245 + (Age)*0.037 + (NIHSS)*0.083 + (SBP SD)*0.145

The AUROC curve for this risk model was 0.80, or in other words, there is a 80% chance that this equation will be able to distinguish between patients who will develop a poor functional outcome at 90 days, and those who won’t develop this outcome based on their demographic and 24 hour blood pressure data.

Discussion

In patients with successful MT, our results demonstrate that a higher SBP variation from the mean in the first 24 hours was associated with poor MRS at 90 days using both ULR and MLR analyses. This is corroborated by other studies that showed that higher BP parameters after MT such as absolute SBP15,16 and MAP are associated with poor outcomes [15,16]. Goyal et al. stratified patients into three BP groups and found that high maximum SBP following MT was independently associated with increased likelihood of mortality and functional dependence at 3 months. Rather than maximum BP parameters, our study suggests that SBP variation of >12mmHg from the mean was associated with poor functional outcomes and this may be a useful treatment determinant to study prospectively in the future. Some literature suggests that a BP below a cutoff such as 130/70 yields favorable outcomes, but many of these studies did not take into account success of revascularization, which can have a major impact on brain physiology post MT [21]. In addition, studying variation from the mean factors in individual blood pressures rather than relying on an arbitrary cutoff. This is important because individual autoregulatory capacities could vary immensely, and treatment based on a BP cutoff for one patient with adequate collateralization and intact autoregulation may be suboptimal for a patient with different physiology.

According to our findings, a higher DBP mean and range, or maximal fluctuations from the mean were associated with a higher odd of developing HT, complementary to several other studies that had similar findings [13,15,22,23]. Following successful revascularization in AIS in the setting of impaired cerebrovascular autoregulation, systemic blood pressure may be directly transmitted to the cerebral vasculature, leading to hyperemia from reperfusion injury, HT, cerebral edema, further oligemia due to cerebral edema, neuronal death and result in poor functional outcomes. These can be accelerated in the presence of compromised blood brain barrier integrity and HT can be a marker of reperfusion injury in this setting [13,24]. This phenomenon has been well described after carotid revascularization but also likely occurs after AIS. In addition, presence of viable collaterals likely factor into development of HT as well, adding to the complexity of determination of ideal blood pressure management surrounding MT. In the aging population where arterial stiffness and widened pulse pressure are prevalent, small changes in DBP can result in marked changes in cerebral perfusion pressure [25]. If this occurs below the lower limit of autoregulation (LLA), cerebral perfusion becomes passive during systole, and completely arrests in diastole, resulting in periods of interrupted blood flow and worsened ischemia [26]. Conversely when the DBP is higher than limit of autoregulation, it can be associated with hyperemia and amplified in the setting of impaired cerebrovascular autoregulation due to AIS or poor collateral circulation.

Our study found that a higher age was associated with poor functional outcomes except for HT, corroborated by other studies that found an association between age and worse functional outcome and greater length of stay in AIS [27]. As expected, a higher NIHSS score was also associated with poor MRS at 90 days. This probably speaks to stroke burden, degree of cerebral autoregulation impairment and other complications associated with malignant infarction such as cerebral edema, HT, respiratory failure, infections, as well as withdrawal of life supporting measures. We suspect that the association between a higher age with lower odds of HT reflect the strong negative correlation that age had with DBP mean in our study, rather than a true relationship as current literature supports a positive correlation between advancing age and HT in AIS [28,29]. For instance, higher DBP mean was associated with higher HT but also a lower age, which makes sense physiologically, as mean DBP and pulse pressure decrease with ageing due to loss of arterial elastance [25,30]. But since DBP mean was negatively correlated with age, lower age appeared to be associated with higher HT. This highlights the limitations of a retrospective nature of this study that is unable to correct for variables with close associations and limited to identifying associations rather than cause-and-effect relationships.

Even though our results demonstrate important associations between SBP variability, mean DBP and poor functional outcomes, it is important to note that all BP parameters influence one another, and accounting for the BP variables together along with age and NIHSS results in a much better predictive ability than consideration and treatment of a single parameter alone. For instance, BP parameters when modeled together using MLR had a much better AUC (0.73-0.80) or predictive ability for a poor functional outcome, compared to being studied individually using ULR (AUC of 0.60-0.70) for the same functional outcomes. The MLR model accounts for complex inter-relationships between BP parameters, thus increasing the explanatory and predictive power of the model. Moreover, heterogeneity in patient pathophysiology for instance in stroke etiology and variation in autoregulatory capacity may have been accounted for better in the MLR model. This suggests that future prospective studies should consider that BP parameters are inter-dependent, and perhaps they should be considered together, along with patient age and NIHSS when developing treatment targets in future interventional trials. In addition, using this stronger predictive model, we were able to model a risk score for the development of a poor functional outcome in these patients, which can practically be used to predict patient’s functional outcome at 90 days from successful revascularization based on 24 hour post MT BP data.

Our study has several limitations. The retrospective design limits our findings to associations and limits our ability to consider other potentially important variables such as performance of decompressive hemicraniectomy and degree of impaired cerebral autoregulation which may influence functional outcome. The small sample size reduces the power of our study and limited our statistical ability to assess and incorporate potential curvilinear (eg. U-shaped) relationships in the predictor variables. A limitation of using a ULR is that the results may be multifaceted as only one parameter is considered at a time, however our results are exploratory with an intention to reproduce the results with larger prospective study. The single center retrospective design may result in a systematic selection bias and limit generalizability, though the homogenous management strategies including blood pressure, type of anesthesia and choice of neuro-interventional devices may have served as strengths in our study.

A key unresolved issue is whether elevated blood pressures post MT marks the presence of dysregulated cerebrovascular physiology in patients destined for a poor outcome, or whether treatment of these targets, when optimized can modify outcome. Further large, prospective randomized controlled trial studies are needed to assess the impact of BP control after successful MT prior to drawing practice-changing conclusions.

Conclusions

Our study demonstrates that a higher SBP variability within the first 24 hours after successful MT is associated with a higher likelihood of poor 90-day functional outcome, and a higher mean as well as fluctuations of DBP are associated with a higher rate of HT. A SBP variability of >12mmHg was associated with poor 90-day functional outcomes and this may be a useful treatment determinant to study in the future. We developed a risk model with excellent discrimination based on BP parameters and patient demographics to predict poor functional outcome at 90 days after revascularization. Further large prospective randomized control trials considering BP variability and ranges are needed to validate optimal BP targets following successful MT to optimize recovery in these patients.

Competing Interests

The authors declare that they have no competing interests.

Funding Information

This was not a sponsored study and therefore, there was no funding involvement.

References

  1. Tissue Plasminogen Activator for Acute Ischemic Stroke. New England Journal of Medicine. (1995) 333: 1581-1588. [crossref]
  2. Hacke W, Kaste M, Bluhmki E, Brozman M, Dávalos A, et al. (2008) Thrombolysis with Alteplase 3 to 4.5 Hours after Acute Ischemic Stroke. New England Journal of Medicine 359: 1317-1329. [crossref]
  3. Yang P, Zhang Y, Zhang L, Zhang Y, Treurniet KM, et al. (2020) Endovascular Thrombectomy with or without Intravenous Alteplase in Acute Stroke. New England Journal of Medicine 382: 1981-1993 [crossref]
  4. Qureshi AI, Ezzeddine MA, Nasar A, Suri MF, Kirmani JF, et al. (2007) Prevalence of elevated blood pressure in 563704 adult patients with stroke presenting to the ED in the United States The American Journal of Emergency Medicine 25: 32-38. [crossref]
  5. Aries MJ, Elting JW, Keyser JD, Kremer BP, Vroomen PC (2010) Cerebral Autoregulation in Stroke. Stroke 41: 2697-2704. [crossref]
  6. Valent A, Sajadhoussen A, Maier B, Lapergue B, Labeyrie MA, et al. (2020) A 10% blood pressure drop from baseline during mechanical thrombectomy for stroke is strongly associated with worse neurological outcomes. Journal of NeuroInterventional Surgery 12: 363-369.
  7. Blanco PJ, Müller LO, Spence JD (2017) Blood pressure gradients in cerebral arteries: a clue to pathogenesis of cerebral small vessel disease. Stroke Vasc Neurol 2: 108-117.
  8. Mistry EA, Mayer SA, Khatri P (2018) Blood Pressure Management after Mechanical Thrombectomy for Acute Ischemic Stroke: A Survey of the StrokeNet Sites. Journal of stroke and cerebrovascular diseases 27: 2474-2478. [crossref]
  9. Yong M, Kaste M (2008) Association of Characteristics of Blood Pressure Profiles and Stroke Outcomes in the ECASS-II Trial. Stroke 39: 366-372. [crossref]
  10. Powers WJ, Rabinstein AA, Ackerson T, Adeoye OM, Bambakidis NC, et al. (2018) 2018 Guidelines for the Early Management of Patients With Acute Ischemic Stroke: A Guideline for Healthcare Professionals From the American Heart Association/American Stroke Association. Stroke 49: e46-e99. [crossref]
  11. Bhatia R, Hill MD, Shobha N, Menon B, Bal S, et al. (2010) Low rates of acute recanalization with intravenous recombinant tissue plasminogen activator in ischemic stroke: real-world experience and a call for action. Stroke 41: 2254-2258. [crossref]
  12. Demchuk AM, Goyal M, Yeatts SD, Carrozzella J, Foster LD, et al. (2014) Recanalization and Clinical Outcome of Occlusion Sites at Baseline CT Angiography in the Interventional Management of Stroke III Trial. Radiology 273: 202-210. [crossref]
  13. Mistry EA, Mistry AM, Nakawah MO, Khattar NK, Fortuny EM, et al. (2017) Systolic Blood Pressure Within 24 Hours After Thrombectomy for Acute Ischemic Stroke Correlates With Outcome. J Am Heart Assoc 6: e006167. [crossref]
  14. Nogueira RG, Jadhav AP, Haussen DC, Bonafe A, Budzik RF, et al. (2018) Thrombectomy 6 to 24 Hours after Stroke with a Mismatch between Deficit and Infarct. New England Journal of Medicine 378: 11-21. [crossref]
  15. Anadani M, Orabi MY, Alawieh A, Goyal N, Alexandrov AV, et al. (2019) Blood Pressure and Outcome After Mechanical Thrombectomy With Successful Revascularization. Stroke 50: 2448-2454. [crossref]
  16. Goyal N, Tsivgoulis G, Pandhi A, Chang JJ, Dillard K, et al. (2017) Blood pressure levels post mechanical thrombectomy and outcomes in large vessel occlusion strokes. Neurology 89: 540-547. [crossref]
  17. Maïer B, Fahed R, Khoury N, Labreuche J, Taylor G, et al. (2019) Association of Blood Pressure During Thrombectomy for Acute Ischemic Stroke With Functional Outcome. Stroke 50: 2805-2812. [crossref]
  18. Valent A, Sajadhoussen A, Maier B, Lapergue B, Labeyrie MA, et al. (2019) A 10% blood pressure drop from baseline during mechanical thrombectomy for stroke is strongly associated with worse neurological outcomes. Journal of NeuroInterventional Surgery 12: 363-369. [Crossref].
  19. Petersen NH, Ortega-Gutierrez S, Wang A, Lopez GV, Strander S, et al. (2019) Decreases in Blood Pressure During Thrombectomy Are Associated With Larger Infarct Volumes and Worse Functional Outcome. Stroke 50: 1797-1804. [crossref]
  20. Wasserstein RL, Lazar NA (2016) The ASA Statement on p-Values: Context, Process, and Purpose. The American Statistician 70: 129-133.
  21. Choi KH, Kim JM, Kim JH, Kim JT, Park MS, et al. (2019) Optimal blood pressure after reperfusion therapy in patients with acute ischemic stroke. Scientific reports 9: 5681.
  22. Blech B, Chong BW, Sands KA, Wingerchuk DM, Jackson WT, et al. (2019) Are Postprocedural Blood Pressure Goals Associated With Clinical Outcome After Mechanical Thrombectomy for Acute Ischemic Stroke? Neurologist 24: 44-47. [crossref]
  23. McCarthy DJ, Ayodele M, Luther E, Sheinberg D, Bryant JP, et al. (2020) Prolonged Heightened Blood Pressure Following Mechanical Thrombectomy for Acute Stroke is Associated with Worse Outcomes. Neurocrit Care. 32: 198-205. [crossref]
  24. Park JH, Ovbiagele B (2017) Post-stroke diastolic blood pressure and risk of recurrent vascular events. Eur J Neurol 24: 1416-1423. [crossref]
  25. Pinto E (2007) Blood pressure and ageing. Postgrad Med J 83: 109-114. [crossref]
  26. Varsos GV, Richards HK, Kasprowicz M, Reinhard M, Smielewski P, et al. (2014) Cessation of Diastolic Cerebral Blood Flow Velocity: The Role of Critical Closing Pressure. Neurocritical Care 20: 40-48. [crossref]
  27. Black-Schaffer RM, Winston C (2004) Age and functional outcome after stroke. Topics in stroke rehabilitation 11: 23-32. [crossref]
  28. Marsh EB, Llinas RH, Schneider ALC, Hillis AE, Lawrence E, et al. (2016) Predicting Hemorrhagic Transformation of Acute Ischemic Stroke: Prospective Validation of the HeRS Score. Medicine (Baltimore) 95: 2430-2430. [crossref]
  29. Pande SD, Win MM, Khine AA, Zaw EM, Manoharraj N, et al. (2020) Haemorrhagic transformation following ischaemic stroke: A retrospective study. Scientific reports 10: 5319.
  30. Steppan J, Barodka V, Berkowitz DE, Nyhan D (2011) Vascular stiffness and increased pulse pressure in the aging cardiovascular system. Cardiol Res Pract 263585. [crossref]

A Safety Signal’s Significance with the COVID-19 Coronavirus

DOI: 10.31038/IMROJ.2020544

Introduction

The global pandemic involving COVID-19 (coronavirus) has produced unprecedented challenges for the medical, healthcare providers and our world community. The World Health Organization (WHO 2020) initially declared COVID-19 a pandemic, pointing to the over numerous cases of the coronavirus illness in over a hundred countries and territories around the world and the sustained risk of further global spread [1,2]. The term pandemic is most often applied to new influenza strains, and the Centers for Disease Control and Prevention (CDC) use it to refer to strains of virus that are able to infect people easily and spread from person to person in an efficient and sustained manner. Such a declaration refers to the spread of a disease, rather than the severity of the illness it causes. A pandemic declaration can result in increased levels of stress, anxiety, panic and levels of functional depression for some individuals [3]. Recognized is the realization that these unusual circumstances create significant uncertainty and unease in the professional and personal lives of health care professionals and their patients.

Definition of a Safety Signal

“Safety signals” are learned cues that predict the nonoccurrence of an aversive event. As such, safety signals are potent inhibitors of fear and stress responses. Investigations of safety signal learning have increased over the last few years due in part to the finding that traumatized persons are unable to use safety cues to inhibit fear, making it a clinically relevant phenotype.

The coronavirus has traumatized some which has been recognized as a state of heightened fear or anxiety in environments globally. This symptom has been conceptualized as a generalization of the fear conditioned during the traumatic experience that becomes resistant to extinction. As opposed to danger learning where a cue is paired with aversive stimulation, safety learning involves associating distinct environmental stimuli also known as safety signals that can be used an applied when aversive events occur as in a global pandemic.

During periods of high stress such as during this Covid-19 pandemic, fear often permeates the lives of many because if the unknown nature of this illness. This occurs because of the absence of a learned safety signal. Such safety signals can inhibit fear responses to cues in the environment. As such, safety signals are only learned when the subject expects danger but it does not necessarily occur. More fundamental to the clinical importance of a safety signal is the distinction between safe and dangerous circumstances. Thus, identifying the mechanisms of safety learning represents a significant goal for basic neuroscience that should inform future prevention and treatment of trauma and other anxiety disorders.

With COVID-19 global pandemic, the World Health Organization (2020) continues to ask countries to “take urgent and aggressive action.” World leaders continue holding international teleconferences with health officials to address the most effective way to protect the public and develop public health policy for the coronavirus that has caused multiple illnesses and deaths worldwide.

Transitioning the Pandemic

The urgency has created stressful life experiences for all ages that pose the potential for illness resulting for some in disabling fear, a hallmark of anxiety and stress-related disorders [4]. Researchers at Yale University and Weill Cornell Medicine report on a novel way that could help combat such anxiety experienced at times like these. When life events as the spread of the Corvid 19 triggers excessive fear and the absence of a safety signal. In humans, a symbol or a sound that is never associated with adverse events can relieve anxiety through an entirely different brain network than that activated by fear and worry. Each individual must find their own “safety signal” whether that is a mantra, song, a person, or even an item like a stuffed animal that represents the presence of safety and security.

The Centers for Disease Control and Prevention (CDC), the World Health Organization (WHO), and other reputable agencies have advocated on how to address the coronavirus by washing hands frequently, avoid sharing personal items, and maintaining social distance from others beyond immediate family.

While it’s still unclear exactly how much of the current coronavirus outbreak has been fueled by asymptomatic, mildly symptomatic, or pre-symptomatic individuals, the risk of contagion exists. A yet to be published article in the CDC journal “Emerging Infectious Disease” (CDC 2020) reports that the time between cases in a chain of transmission is less than a week, with more than 10% of patients being infected by someone who has the virus but does not yet have symptoms according to Dr. Luren Meyers, a professor of integrative biology at UT Austin, who was part of a team of scientists from the United States, France, China and Hong Kong examining this viral threat.

Earlier this year, researchers in China published a research letter in the Journal of the American Medical Association, outlining a case of an asymptomatic woman in Wuhan, China who reportedly spread the virus to five family members while traveling to Anyang, China-all of whom developed COVID-19 pneumonia. The sequence of events suggests that the coronavirus may have been transmitted by the asymptomatic carrier,” [5].

Prevention Interventions

Coordinated regional efforts are underway under the direction of the Centers for Disease Control and Prevention (CDC) that provides guidelines aimed at prevention intervention. Each individual should make the effort to create one’s own “safety signal” by following the recommendations of the CDC (2020). Know how it spreads and that there is currently no vaccine to prevent coronavirus disease (COVID-19). Critical for prevention is avoided exposing the virus. The virus is thought to spread mainly from person-to-person. Between people who are in close contact with one another. Through respiratory droplets produced when an infected person coughs or sneezes. These droplets can land in the mouths or noses of people who are nearby or possibly be inhaled into the lungs.

Disinfecting by washing hands often with soap and water for at least twenty seconds especially after you have been in a public place or after blowing your nose, coughing, or sneezing. If soap and water are not readily available, use a hand sanitizer that contains at least 60% alcohol. Cover all surfaces of your hands and rub them together until they feel dry. Avoid touching the eyes, nose, and mouth with unwashed hands Put distance between yourself and other people if COVID-19 is spreading in your community. This is especially important for people who are at higher risk of getting immune compromised illness.

Health care calls for “sheltering in place” are effort to provide primary prevention it’s important to stay home to slow the spread of COVID-19, and if you must go out, practice personal quarantine. While we stay home, don’t let fear and anxiety about the COVID-19 pandemic become overwhelming. Managing mental health issues can be aided by taking breaks from watching, reading, or listening to news stories and social media. It remains important to take the time to connect with others. Networking with friends and loved ones over the phone or via video chat about the thoughts and feelings experienced during this pandemic is very important to maintain mental health daring three times. Employ the use mindful meditation, eating healthy meals, exercising regularly, and getting plenty of sleep.

Take steps to protect yourself and others. Stay sheltered in place especially when you’re sick. Shelter in place means to seek safety within the building one already occupies, rather than to evacuate the area or seek a community emergency shelter. The American Red Cross says the warning is issued when “chemical, biological, or radiological contaminants which would include exposure to the coronavirus.

Efforts must be made to cover one’s mouth and nose with a tissue when you cough or sneeze or use the inside of your elbow. Throw used tissues in the trash. Immediately wash your hands with soap and water for at least 20 seconds. If soap and water are not readily available, clean your hands with a hand sanitizer that contains at least 60% alcohol.

It is important to wear a facemask for your own health as well as the health of others. Everyone should wear a facemask when they are around other people (e.g., sharing a room or vehicle) and before entering a healthcare provider’s office. If someone is not able to wear a facemask due to breathing difficulties, then these individuals should cover all coughs and sneezes, and people who are caring for theme should wear a facemask when they enter ones room. Wear a facemask when caring for someone who is showing any signs or symptoms of respiratory infection and fever.

When considering the anxiety and apprehension individuals may experience with the vulnerabilities of the present pandemic and future epidemics of this proportion, patient medical education can provide a buffer against the Prevention interventions that include cleaning and disinfecting objects and surfaces that are touched regularly. This includes tables, doorknobs, light switches, countertops, handles, desks, phones, keyboards, toilets, faucets, and sinks. If surfaces are dirty, clean them: Use detergent or soap and water prior to disinfection. With first signs of symptoms, take advantage of Virtual Care in an effort to minimize unnecessary visits to an emergency room or health care provider’s office, which can also decrease the spread of illness and/or infection of many conditions, including COVID-19. Finally, each individual is encouraged to establish one’s own “safety signal” by adhering to the multiple precautions that include the guidelines developed and promoted by the World Health organization and the Centers for Disease Control and Prevention (CDC 2020).

References

  1. Centers for Disease Control (2020) Coronavirus Disease 2019 (COVID-19).
  2. World Health Organization (2020) Coronavirus disease 2019 (COVID-19): Situation Report-38.
  3. Miller TW (2015) Problem Epidemics in Recent Times. Health & Wellness. Lexington Kentucky: Rock point Publisher Incorporated.
  4. Miller TW (2010) Handbook of Stressful Transitions across the Life Span. New York: Springer Publishers Incorporated.
  5. Huang C, Wang Y, Li X, et al. (2020) Clinical features of patients infected with 2019 novel coronavirus in Wuhan, China. Lancet 395: 497-506.

Case Study: Telemedicine for Arrhythmia Care: Early Detection of Co-Existing Conditions

DOI: 10.31038/JCRM.2020344


After two years of dedication to the research study Telemedicine: Enabling Patients in Self-Care Behaviors (TEPSCB) I am continually pleased with the phenomenon of detecting co-existing diseases much earlier than with conventional approaches to patient visits. Identifying co-existing diseases is not an end point of the study but is a benefit which has been observed with several individuals in the Telemedicine group. Historically, the arrhythmia department within our local Midwest tertiary care facility has seen patients on a six month or yearly return visit basis. These appointments have been arranged as an in person visit and have entailed an office visit with labs, electrocardiogram (ECG), and follow up phone calls to answer any post visit questions. Currently, with the TEPSCB study, 30 patients are enrolled in the telemedicine group having telemedicine video visits occurring once monthly for three months. Another 30 patients are enrolled in the conventional six-month in person visit group. With more frequent and readily accessible video visits it has become very easy to diagnose and treat co-morbid conditions which can otherwise exacerbate arrhythmias.

The Telemedicine: Enabling Patients in Self-Care Behaviors study has demonstrated several instances in which diabetes mellitus, hypertension, and other conditions can be identified within a few short months and thus the patient receives care much quicker than with conventional six-month visits. This case study will enlighten the ease with which earlier video visits enable ongoing feedback, symptom reporting, and earlier response from our health care team. To fully understand the case study, please allow some background on the Telemedicine: Enabling Patients in Self-Care Behaviors. The following is the theory behind the study and the inspiration for the study. It becomes important to give the background of the initiation of the Telemedicine: Enabling Patients in Self-Care Behaviors.

The first outcome of the study is to determine if patients enrolled in a telemedicine program for the care of cardiac arrhythmias have any difference in [1] time of arrhythmia recognition, [2] time of arrhythmia diagnosis by a healthcare provider, and [3] time of treatment initiation compared with patients enrolled in standard care for cardiac arrhythmias. In addition, this study examines patient’s self-efficacy related to medication use, functional self-efficacy, and perceived arrhythmia symptoms. The second outcome of the telemedicine arrhythmia pilot study includes a theme noted in the Integrated Theory of Health Behavior Change (ITHBC) which assists the individual in increasing one’s involvement in one’s own healthcare via a process of increased social support, increased self-awareness, and increased self-efficacy (Ryan, P., 2009). This theory relates directly to the arrhythmia population in its focus upon the patient’s self-awareness, increased social support (promoted with the frequent telemedicine visits and teaching for patients and family), and increased self-efficacy and understanding of one’s arrhythmia and management of one’s arrhythmia. The intent of this outcome is to assist, enable, and educate the patient in managing day to day changes in one’s arrhythmia symptoms. This process is aimed at increasing one’s self-efficacy in coping with the arrhythmia and increasing one’s ability to react to arrhythmia changes. The second outcome is measured with the MUSE, FSES and the ASTA surveys which measure participants medication use self-efficacy, functional status self-efficacy, and arrhythmia self-efficacy. The surveys are given to all participants at the beginning and end of the study.

This type of telemedicine program is based upon several studies which have shown improved clinical outcomes with the use of telemedicine. One such telemedicine study includes those with an Implantable Cardioverter Defibrillator (ICD). The TRUST trial compares the use of a telephone video conference to conventional in person follow up visits. The TRUST trial determined the efficacy and safety for monitoring ICDs and the reduction of in person follow up appointments (Dalouk, K. et. al., 2017; Varma, N. et.al, 2010). This telemedicine trial was a retrospective trial looking at the time to first appropriate ICD therapy (device shocking in the presence of a dangerous arrhythmia) and the time to first inappropriate ICD therapy (device shocking in the presence of a non-dangerous arrhythmia) (Dalouk, K. et.al., 2017). The TRUST trial compared the safety and usefulness of remote monitoring in ICD recipients and conventional in person ICD follow up visits. Endpoints respective to the study included non-inferior outcomes for telemedicine in those who had no care visit available near their homes with in-person visits. There was no difference between home monitoring and those with conventional appointments with adverse event rates of 10.4 for each group. (Dalouk, K., et al., 2017; Varma, N. et. al., 2013).

This telemedicine arrhythmia pilot study has tried to mimic the early detection data of the TRUST trial. An outcome of the telemedicine arrhythmia project is quality improvement to gain a timely recognition, diagnosis, and prompt treatment of abnormal arrhythmias. Through this early detection, treatment may entail a change in the AAD drug, a change in the dose of the drug, or an adjustment to the heart rate parameters and rhythm programing of a device. In addition, recognition of the need for a procedure which may eliminate the source of the arrhythmia via radiofrequency ablation (Lee, H-C., Huang, K., and Shen, W-K., 2011). Needed treatment may be quite simplistic as a minor change in dosing of medication, eliminating the medication, changing to another medication, or making subtle or large changes in the pacemaker or ICD programming, which may eliminate the arrhythmia (Varma, N. et.al, 2015).

Utilizing the study to determine if there is any difference in the time of recognition, diagnosing and treatment of any new arrhythmia with individuals in the Telemedicine versus the Standard visit group has already shown an improved time to diagnosis and treatment in the telemedicine group. The final statistics are not determined as this is an ongoing study. All 60 participants have been randomized and over 1/3 of the participants have already completed the study. The initial overall consensus is the telemedicine group simply due to the frequent follow up visits and the use of monitors such as the Kardia, loop recorders, pacemakers and internal cardioverter defibrillators (ICDs) has a clear advantage and tendency toward improved time to recognize, diagnose and treat the arrhythmia.

The case study involves a young woman who enrolled in the study and was randomized to the telemedicine group. She is a woman who is 49 years old with a distant history of a premature ventricular contraction (PVC) with a PVC ablation in 2013 and episodes of paroxysmal supraventricular tachycardia. She was feeling well for many years and over the last one year has ongoing palpitations, chest pain and fatigue which became disabling. She had a normal left ventricular ejection fraction (EF) of 60% in 2018, which became worse over the span of two years. Her chief complaint remained strong and painful palpitations, chest pain with activity and fatigue. Over several months her complaints continued to include symptoms of chest pressure, fatigue, and activity intolerance.

Her event monitors continued to show 1-2% PVCs, short episodes of SVT with an SVT burden of 2-3%. She underwent a treadmill stress test and nuclear medicine stress test which were both negative for ischemic heart disease. She had been seen in our office every six months for follow up appointments, prior to enrolling in the TEPSCB. She began to feel much worse and felt her symptoms were completely related to an arrhythmia etiology, despite her relatively negative event monitors. She was very symptomatic and always related her chest pain, fatigue, and palpitations to an arrhythmia. She enrolled in the Telemedicine study and was randomized to the telemedicine group. Once in the study she had a series of monthly appointments via Zoom ™ meetings in which her symptoms, possible work up strategies and options were discussed. Via these frequent and concentrated video visits she underwent updated MRIs and PET scans which led to the question if she had sarcoidosis of the heart.

The following include results of her studies:

Hx of a Biallelic mutation of HFE2 gene which has been seen with hemochromatosis. Further testing showed the mutation however was not consistent with iron overload of the heart.

Gene RX: Hereditary Hemochromatosis

Cardiac MRI March 2020

No late gadolinium enhancement. LV Ejection Fraction (EF) 45%, RV (EF) 30%. Note of RV EF decreased from a prior study showing 48% the year prior.

Cardiac MRI July 2020

Late gadolinium enhancement at the mid ventricular level involving the inferior septum and the inferior wall in a non-ischemic distribution. LV Ejection Fraction (EF) 47% and RV (EF) 46%.

PET Scan: June 2020

Nuclear Medicine PET

LV perfusion is noted as normal. There is increased FDG myocardial uptake most intense in the mid inferolateral wall, but also including at a lower intensity the inferior, inferoseptal and anterolateral segments consistent with myocardial inflammation.

The PET scan showed increased FDG. The Triponin was negative There was no other evidence of inflammation and no evidence of Sarcoidosis.

Chart Sarcoidosis

Zio Patch

8/2020 5 beats of nun-sustained ventricular tachycardia and an 8 beat run of supraventricular tachycardia.

Echocardiogram

Showing variable decreased LV ejection fraction.

The patient work-up was expeditiously arranged and with her gene mutation, iron deposits within the heart were suspected, but were not present. There was also concern for the possibility of sarcoidosis, but the PET scan, negative troponin and no other inflammation eliminated this possibility. She was evaluated with the genetics department, structural heart disease specialists, and the heart failure group. She was diagnosed with heart failure and her diuretic dosing and angiotensin converting enzyme were increased and she underwent physical therapy to assist in improving symptoms of heart failure. Within 3-4 months her symptoms improved greatly.

This case study is an example of a very expeditious evaluation of symptoms of chest pressure, fatigue, and activity intolerance The TEPSCB assisted in meeting regularly with this young lady and expedited video appointments to update symptoms, discuss ongoing testing, and refer her to a myriad of specialist to evaluate for suspected myocardial inflammation and determine a treatment plan. The diagnosis of sarcoidosis was thankfully negative. The telemedicine study allowed a very timely evaluation, prompt diagnosis of heart failure and improved treatment. This case study shows, although not a main endpoint of the Telemedicine: Enabling Patients in Self-Care Behaviors (TEPSCB) study, that prompt diagnosis of a coexisting condition is greatly expedited with the use of telemedicine and video visits.

There are many concurrent diagnosis’ which can occur with arrhythmias and it often takes months to years to evaluate such concurrent diagnosis, as office visits, work up and chief complaints progress through several changes over time. A telemedicine evaluation can speed the process of the assessment of these items and expedite prompt care. In the case of sarcoidosis key elements of the diagnosis of sarcoidosis are evaluated promptly in this example. In the case of a sarcoidosis work up, key elements of sarcoidosis are either confirmed or eliminated. This example case has failed to show these elements and the required inflammation needed for a sarcoidosis diagnosis and is only positive for a heart failure diagnosis.

Keywords

Telemedicine, Arrhythmia, Co-existing, Early detection

References

  1. Dalouk K, Gandhi N, Jessel P, MacMurdy K, Zarraga I, et al. (2017) Outcomes of telemedicine video-conferencing clinic versus in-person clinic follow-up for implantable card`ioverter-defibrillator recipients, Circulation Arrhythmia Electrophysiology
  2. Lee, H-C, Huang K, Shen, W-K (2011) Use of antiarrhythmic drugs in elderly patients, Journal of Geriatric Cardiology 8 (3): 184-194. [crossref]
  3. Ryan P (2009) Integrated theory of health behavior change: Background and intervention development, Clinical Nurse Specialist 23 (3): 161-172. [crossref]
  4. Varma N, Epstein A, Irimpen A, Schweikert R, Love C (2010) Efficacy and safety of automatic remote monitoring for implantable cardioverter-defibrillator follow-up: The Lumos-T safely reduces routine office device follow-up, TRUST trial, Circulation 122: 325-332. [crossref]
  5. Varma N, Ricci, R (2013) Telemedicine and cardiac implants: what is the benefit? European heart journal 34 (25), 1885-1895.
  6. Varma N, Ricci, R (2015) Impact of remote monitoring on clinical outcomes, Journal of Cardiovascular Electrophysiology 25, (12).

COVID-19 and Autism – Part 2

DOI: 10.31038/IGOJ.2020332

Abstract

When severe cases of febrile viral infections occur in pregnant women, there is an increased risk of autism in the offspring a year or two after the birth.It wouldseem that the primary reason for this is increased levels of blood pro-inflammatory cytokines and unenhanced amounts of IL10, an anti-inflammatory interleukin.Most important is the decreased concentration of insulin-like growth factor-1, which slows the myelination of new neurons, causing dysconnectivity of cerebral nerve circuits.

Keywords

Coronavirus, Cytokine,Dysconnectivity, Inflammatory, Interleukin, Myelination

Introduction

In the preceding parts of this report [1,2], the apparent relationship between severe maternal inflammatory disease during pregnancy (e.g., COVID-19) and the increased incidence in their children’s autism was discussed. Under these conditions, the need for insulin-like growth factor (IGF1) to promote the myelination of new nerves in the fetus was emphasized.The postpartum persistence of an IGF1 deficiency could lead to the development of brain dysconnectivity and autistic behavior in the neonate at age 1-2 years.Plausible etiologies of this in the baby will be considered here. Central to this phenomenon is the important rise in the biosynthesis of interleukins.They are a part of the immune system and are synthesized by lymphocytes, monocytes, macrophages, and endothelial cells.Cytokines include lymphokines, interferons, tumor necrosis factors, interleukins, and chemokines [3-5].

The involvement of Interleukins(IL) in cellular functions can be divided into two main groups:

Th1 – units that promote cell-mediated immune response and the production of IFNg, IL-2, and TNF-b;

Th2 – units that possess various cytokines including IL-4, IL-5, IL-6, IL-9, IL-10, and IL-13.An imbalance between these two main groups can possibly lead into the pathogenesis of autism.

It can be noted for the healthy neonate that in the period between birth and the first year or two of extrauterine life, the accumulation of various cytokines continues independently on the course preset by the balance established before and atbirth.This condition apparently involves the equilibrium between IL-10 and the pro inflammatory interleukins primarily.Direct maternal physical influences on the baby’s neural health terminate at birth.The child’s potential neurologic status will be determined by ante- and postpartum genetic and environmental factors, especially the capacity to synthesize enough IGF1 to establish a functional, healthy neurologic milieu autonomously [6].

Autism Initiation – Phase #1 (Prenatal)

It would appear that the generation of autism begins with the intrauterine fetus exposed before birth to elevated maternal temperatures (e.g., caused by COVID-19, influenza, SARS-CoV, H5N1, or MERS-CoV infection) and groups of interleukins due to the disease.On the one hand, myelination of new fetal nerves is primarily dependent on the presence of sufficient IGF1.In the developing baby, ante- and postpartum, rising interleukin levels are matched with falling IGF1.In laboratory animals, a link has been demonstrated between maternal immune activation and autism-like outcomes.In a post-mortem study of human brains, elevated cytokines andinfection states have been observed.Children with inflammatory diseases typically have reduced IGF1 and elevated IL-6 [1,2].Overall, a balance between pro-inflammatory and anti-inflammatory functional cytokines is needed for good health. Antepartum maternal infection can promote the release of specific cytokines such as IL6 into the mother’s bloodstream.In a meta-analysis of >40,000 autism cases, maternal infection during pregnancy was correlated with autism in the babies.In contrast, IL-10 is anti-inflammatory.In a study of 69 severe type COVID-19 human patients where IL-6 was used as a monitoring marker, elevated levels of LDH, C-reactive protein, ferritin, and D-dimer were commonly found.In IL10-deficient mice, inflammatory bowel disease is enhanced. Over-secretion of cytokines, especially IL-6, is a sign warning of a possible “cytokine storm”.Typically, the cytokine, IL-10, offsets the increase of IL-6 [7-12]. In a study of 538 autistic children versus 421 typically developing controls, the risk of autism from fever in the gravidas was attenuated among mothers who used antipyretics [13].

Autism Promotion – Phase #2 (Birth To 1-2 Years)

In this covert phase, the classical characteristics of autism have not yet emerged, but quantitative changes in the underlying cytokines are progressing.Bioactive cytokines appear to participate in the resistance to or involvement in the development of autism.For example, the pro-inflammatory group would include IL-1a, IL-6, IL-8, and IL-17, in contradistinction to IL-10.In a situation where the release of IL-6 is gradually enhanced, the production of IGF1 is reduced.A safeguard for this is the counterpart release of IL-10.However, if the baby has already developed autistic tendencies from intrauterine exposure to pathologic febrile conditions (e.g., maternal COVID-19), the production of IL-10 do not increase and the amount of IGF1 would fall.With sufficient decline, developmental phase #2 will be nearing its completion, and phase #3, with overt manifestations of autism, will begin.

In a study with laboratory mice, injection of IGF1 decreased vascular expression of the cytokines IL-6 and TNFa.In other words, circulating IGF1 apparently decreases inciting reactions.This is in combination with the role of IGF1 in promoting essential myelination in new nerves to accelerate the transmission of commands for bodily actions.As a result, the preliminary circuits created in the newborn are fixed in place for longterm function. Without this, nervous pathways, especially in the brain, would be of reduced utility, accuracy, and velocity.Grossly autistic behavior is typically restrained before age 1 year.This would suggest that altered neurogenesis due to IGF1 deficiency is continuing in the growing baby between birth and 1 year without noticeable external factors effecting these changes in most cases. In transgenic mice, it was found that increased serum IL-6 was associated with low serum IGF1 levels and growth delay.A typical precursor of autism in humans is the finding of cytokines TNFa, IL-6, IL-1b in the fetus’s brain or liver, whereby the IGF1 level would be insufficient.In addition to promoting myelination of nerves, IGF1 reduces provocative responses and suppresses oxidative stress, risk of autism, and atherosclerosis progression.

If a developing fetus is exposed continuously to increased levels of IL-6 and reduced IGF1 during gestation, the neonate is at increased risk for affected cognition by 12 months old and altered brain architecture, executive function, behavior, and working memory at 2 years of age [14-17].

Autism Persistence – Phase #3 (Age >2 Years)

In this overt phase in particular, bioactive cytokines seem to participate in theresistance to or participation in the development of autism.As noted above, functional interleukins are typically divided into two opposing groups.For example, the first group would typically include IL-1a, IL-6, IL-8, and IL-17, and the second, IL-10.In a situation where the release of IL-6 is gradually enhanced, the production of IGF1 is reduced, as noted earlier.A safeguard for this in an unaffected child is the analogous release of IL-10.However, if the baby has already developed autistic tendencies from intrauterine exposure to provoking conditions (e.g., fever due to maternal COVID-19), the production of IL-10 would not be increased and the amount of IGF1 would fall. In another study, children aged 3-11 years who were diagnosed as autisticwere tested for cytokine status.Interleukin groups Th1 and Th2 were found to be elevated in the blood of autistic children above unaffected controls, whereas the concentration of IL-10 displayed no compensatory increase between the two groups.In a further observation of children in ages 2-5 years, the levels of interleukins IL-1b and IL-6 in autistic youngsters were twice those of normally developing children. Elevation of IL-6 in humans with autism is a common finding.In a meta-analysis with 743 autistic participants and 592 healthy controls, quantities of IL-1b, IL-6, and IL-8 were significantly higher in affected individuals.No difference was found between the two groups tested for 12 other common cytokines.Also, the cerebrospinal fluid from autistic patients revealed increased IL-6, IL-8, and IFNg.The postmortem examination of autistic human brains typically exposed marked over-production of IL-1b, IL-6, IL-17, and TNFa. Mice with elevated brain IL-6 display alterations in excitatory/inhibitory synaptic transmissions [18-30].

Conclusions

Increasing attention is being given to the employment of IGF1 as a means for attenuating or preventing autism [31,32].For example, in reference #1 in this report, the proposed use of breast feeding to replace deficient IGF1 in babies before symptoms of autism appear is advocated.Recently conveyed data indicate that coronavirus in the mother does not ascend into the breast milk during pregnancy [33].The neonatal goal is to prevent the production of insufficiently myelinated neo-neurons which could result in brain dysconnectivity in the infant.Alternatively, modifications of the IGF1 polypeptide for use in ameliorating autism-like conditions such as Phelan-McDermid and Rett Syndrome have been tested [31,34].

The data presented here clearly demonstrate the participation of pro-inflammatory cytokines in the generation of autism.In many cases this is due to a febrile process in thegravid mother.Fever together with pro-inflammatory interleukins is an apparent factor promoting autism increase in the neonate.It remains to be determined if this is only in some, most, or all cases of autism.

Declaration of Competing Interests

The authors declare that they have no known competing financial interests or personal relationships that could have appeared to influence the work reported in this paper.

Acknowledgements

The authors wish to thank Roberta Zuckerman for her helpful discussions about the presentation of this communication, as well as Aviva Adler, librarian, for her cooperative assistance in locating relevant literature references.

References

  1. Steinman G (2020) Covid-19 and autism.Med Hypoth142:109797. [crossref]
  2. Steinman G (2020) Febrile coronavirus and autism.J Endo Metab Res1:1-7.
  3. Mosaad M, Nasralah M, Quinn T, et al.(2014) Inflammation In The cause of autism.G. Steinman, (eds.), Baffin Books Pub, New York, chap. 6C.
  4. Wei H, ChadmanKK, McCloskey DP, Ashfaq M Sheikh, Mazhar Malik, et al.(2012) Brain IL-6 elevation causes neuronal circuitry imbalances and mediates autism-like behaviors.BiochimBiophysActa1822:831-842. [crossref]
  5. Bilbo SD, Black CL, Bolton JL, RichaHanamsagar, Phuong K Tran (2018) Beyond infection – maternal immune activation by environmental factors, microglial development, and relevance for autism spectrum disorders. ExpNeurol 299:241-251. [crossref]
  6. Iyer SS, Cheng G (2012) Role of Interleukin 10 transcriptional regulation in inflammation and autoimmune disease.Crit Rev Immunol32:23-63. [crossref]
  7. Hempel L, Korholz D, BonigH, A Klein-Vehne, J Packeisen, et al.(1995) Interleukin-10 directly inhibits the interleukin-6 production in T-cells.Scand J Immunol41:462-466. [crossref]
  8. Moore KW, MalefytRdW, Coffman RL, et al.(2001) Interleukin-10 and the interleukin-10 receptor.Annu Rev Immuno19:683-765.[crossref]
  9. Ruan Q, Yang K, Wang W (2020) Clinical predictors of mortality due to Covid-19 based on an analysis of data of 150 patients from Wuhan, China.Inten Care Med46:846-848. [crossref]
  10. Strober W, Fuss IJ (2011) Proinflammatory cytokines in the pathogenesis of inflammatory bowel diseases. Gastroent 140:1756-1767. [crossref]
  11. Liu T, Zhang J, Yang Y (2019) The potential role of IL-6 in monitoring coronavirus disease 2019.The LancetD-20-02786.
  12. Masi A, Glozier N, Dale R (2017) The immune system, cytokines, and biomarkers in autism spectrum disorder.Neurosci BullDoi:10.1007/s12264-017-0103-8. [crossref]
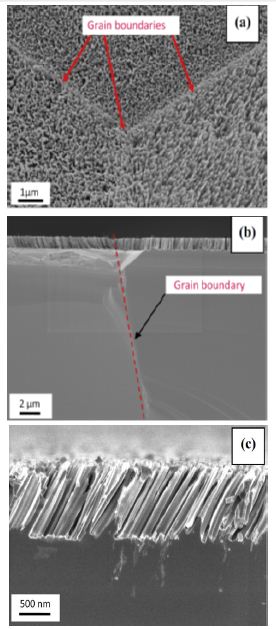
  13. Zerbo O, Iosif A, Walker C (2013) Is maternal influenza or fever during pregnancy associated with autism or developmental delays? Results from the CHARGE Study.J Autism DevDisord43:25-33. [crossref]
  14. Cirillo F, Lazzeroni P, SartoriC (2017) Inflammatory diseases and growth: Effects on the GH-IGF axis and on growth plate. Int J MolSci18:1878-1887. [crossref]
  15. Martins-Filho PR, Tanajura DM (2020) Covid-19 during pregnancy: Potential risk for neurodevelopmental disorders in neonates? Europ J ObsGynReprodBiol250:255-256. [crossref]
  16. Sukhanov S, Higashi Y, ShaiS-Y (2007) IGF-1 reduces inflammatoryresponses, suppresses oxidative stress, and decreases atherosclerosis progression in apoE-deficient mice.ArtiosclerThrombVascBiolDoi: 10.1161/ATVBAHA.107.156257. [crossref]
  17. Yoshikawa T, Hill T, Li K (2009) Severe acute respiratory syndrome (SARS) corononavirus-induced lung epithelial cytokines exacerbate SARS pathogenesis by modulating intrinsic functins of monocyte-derived macrophages and dendritic cells. J Virol83:3039-3048. [crossref]
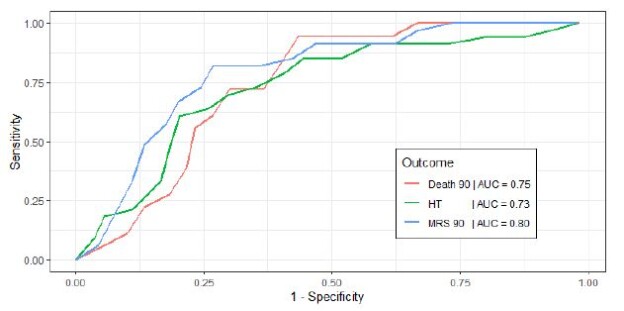
  18. Ashwood P, KrakowiakP, PicciottoIH (2011) Associations of impaired behaviors with elevated plasma chemokines in autism spectrum disorders. J Neuroimmunol232: 196-199. [crossref]
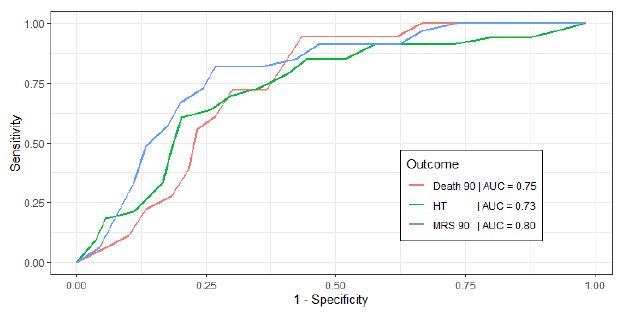
  19. Vargas DL, Nascimbene C, KishnanC (2005) Neuroglial activation and neuroinflammation in the brain of patients with autism.Ann Neurol57:67-81. [crossref]
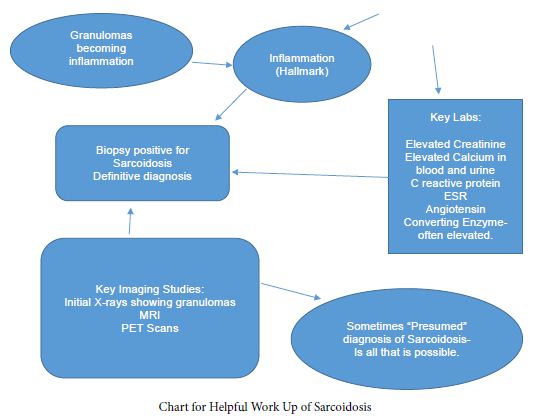
  20. Siniscalco D, Schultz S, BrigidaA, et al.(2018) Inflammation and neuro-immune dysregulations in autism spectrum disorders.Pharm11:56-69. [crossref]
  21. Patterson PH (2011) Maternal infection and immune involvement in autism.Trends Mol Med17:389-394. [crossref]
  22. Jacome MCI, Chacon LMM, Cuesta HV (2016) Peripheral inflammatory markers contributing to comorbidities in autism.BehavSci (Basel) 6:29. [crossref]
  23. Ashwood P, KrakowiakP, Hertz-PicciottoI (2011) Elevated plasma cytokines in autism spectrum disorders provide evidence of immune dysfunction and are associated with impaired behavioral outcome.Brain BehavImmun25:40-45. [crossref]
  24. Zie J, Huang L, XiaohongL, et al.(2017) Immunological cytokine profiling identifies TNF-a as a key molecule dysregulated in autistic children. Oncotarget 8:82390-82398. [crossref]
  25. Turner MD, Nedjai B, Hurst T, et al.(2014) Cytokines and chemokines: At the rossroads of cell signalling and inflammatory disease.BiochimBiophysActa1843:2563-2582. [crossref]
  26. Pardo CA, Vargas DL, Zimmerman AW (2005) Immunity neuroglia and neuro-Inflammation in autism.Int Rev Psychiatry71:485-495.[crossref]
  27. Molloy CA, Morrow AL, Meinzen-DerrJ (2006) Elevated cytokine levels in children with autism spectrum disorder. J Neuroimmun172:198-205. [crossref]
  28. MontanoMendoza VM (2020) Interleukin-17: A potential therapeutic target in Covid-19. J Infect81:e136-138. [crossref]
  29. Lima MES, Barros LCM, Aragao GF (2020) Could autism spectrum disorders be a risk factor for Covid-19? Med Hypoth144:109899. [crossref]
  30. Raucci F, Mansour AA, CasilloGM, et al. (2020) Interleukine-17A (IL-17A), a key molecule of innate and adaptive immunity, and its potential involved in Covid-19-related thrombotic and vascular mechanisms.Autoimmun Rev17:102572. [crossref]
  31. Steinman G, Mankuta D (2020) The role of oligopeptides in preventing autism.MedHypoth138:109604.
  32. Steinman G, Mankuta D (2019) Molecular biology of autism’s etiology – an alternative mechanism.Med Hypoth130:109272. [crossref]
  33. Dumitriu D, Emeruwa UN, HanftE (2020) Outcomes of neonates born to mothers with severe acute respiratory syndrome coronavirus 2 infection at a large medical center in NYC. JAMA Peddoi:10.1001/jamapediatrics.2020.4298. [crossref]
  34. Linker SB, Mendes APD, Marchetto MD (2020) IGF-1 treatment causes unique transcriptional response in neurons from individuals with idiopathic autism. MolecAutism11:55-67. [crossref]

Free-Living Wild Birds and Factors Influencing Their Survival in Captivity: A Synopsis

DOI: 10.31038/IJVB.2020433

Abstract

Free-living wild birds are adapted to the natural unrestricted existence but their roles in the epidemiology of avian diseases and zoonosis have necessitated using them in experimental studies. Some of these free-living wild birds include Laughing doves, Speckled pigeons, Cattle egrets, Village weavers and African silver bills. The use of these birds in experimental studies therefore requires capture and transportation of the birds followed by creation of an artificial environment to mimic their natural habitat. This new created habitat no matter how conducive it seems to be would have impact on the survival of these birds ranging from psychological to physical. The outcome of these impacts on the other hand could be falsely interpreted to result from the experimental study and this could be misleading. Survival of several wild birds in captivity ranged from 4% for captive-bred birds to 41% for captured wild birds over a 2-month period with annual post-release survival of 89%. Also, due to the survival mechanisms developed by wild birds in terms of feeding diversity, reproduction and disease tolerance in the wild, captivity would have effects on these instincts leading to lethal consequences. Hence in this article, some free-living wild birds and the factors affecting their survival in captivity, though not limited to these, are being discussed.

Keywords

Wild birds, Habitat, Impact, Captivity, Survival

Introduction

Free-living wild birds are birds with unrestricted migratory potentials and move independently. These birds have over time developed abilities to survive in their natural habitat which involves moving from one location to the other in search for food as well as suitable environment for reproduction. Due to their free-living nature, these wilds tend to play significant roles in the spread of diseases. This can be evident from studies where antigens of and antibodies against disease causing agents have been detected in some free-living wild birds. The mode of infection of these birds could only be speculated from their migration to locations where the infectious agents are present. Some of these infectious agents could cause clinical signs in other domestic animals but not in the free-living wild birds [1]; Fagbohun et al. [2-4]. The significant roles that these wild birds play in the epidemiology of diseases would only be better understood from using them in experimental studies, thus requiring putting them in captivity. Outcome of such experimental studies might be affected by alteration in the natural instincts of the birds and could lead to severe consequences. Hence, this article is focused on some free-living wild birds and factors influencing their survival in captivity.

Some Free-Living Wild Birds

Laughing Dove

The laughing dove (Spilopelia senegalensis) is a slim pigeon belonging to the order Columbiforme and family Columbidae [5]. It is distinguished from other doves by its call which sounds like human laughter [6], and a rufous and black chequered necklace gives it a distinctive pattern [5]. It is a resident breeder in Africa, the Middle East and the Indian Subcontinent [7]. This small long-tailed dove is found in dry scrub and semi-desert habitats [8].

The laughing dove is primarily an inhabitant of woodland and savanna, but is also found around  human habitations, in farmland, villages and towns [5]. It feeds primarily on seeds, but it also eats other vegetable matter, such as fruit, as well as small insects, particularly termites [8,9]. The laughing dove typically occurs individually or in pairs but might also gather in flocks [10] at watering points, roosting spots, or in area of food abundance [11].

Laughing doves are mostly sedentary but some populations may however exhibit migratory potentials [5]. This is evidenced by recovery of the birds, originally ringed in Gujarat 200 km north in Pakistan and landing of exhausted birds on ships in the Arabian Sea [12]. Birds that landed on ships might have been introduced to new regions [5,13].

Speckled Pigeon

The Speckled pigeon (Columba guinea) or (African) rock pigeon is a large pigeon belonging to the order columbiforme and family columbidae [14]. It has rufous on the back and wings with white spots heavily spotted on the wings. It is a resident breeder in most parts of Africa south of the Sahara [15].

The speckled pigeon lives mainly in open country, farmland, savannahs, grasslands, with nearby trees such as palms or baobabs [12]. It is also found in urban areas where it is often seen on roof tops [16]. It feeds mainly on seeds and cultivated grains [16]. It gathers in large numbers where grains or groundnuts are abundant. It is very gregarious and flocks may reach several hundreds of birds, mixed with other pigeon’s species and doves [14]. It walks and runs easily on the ground. It has a strong and fast flight, and flies very high in the sky with regular wing beats [15]. Like laughing doves, the speckled pigeons are sedentary and may exhibit migratory potentials [15].

Cattle Egret

The cattle egret (Bulbucus ibis) is a cosmopolitan species of heron (family Ardeidae) found in the tropics, subtropics and warm temperate zone [17,18]. It is a white bird adorned with buff plumes in the breeding season [19] and is the only member of the monotypic genus Bubulcus [18]. It is originally native to parts of Asia, Africa and Europe [20], but has undergone a rapid expansion in its distribution due to wider human farming [18]. This bird maintains a special relationship with cattle where it removes ticks and flies from cattle and consumes them, thus implicated in the spread of tick-borne animal diseases [21].

The cattle egret feeds on insects, such as grasshoppers, crickets, flies (adults and maggots) [21], and moths, as well as spiders, frogs, and earthworms [22]. They usually nest in colonies and forage in fields with grazing livestock [20]. They are both sedentary and migratory [20], and migration is from cooler areas to warmer areas triggered by rainfall [19]. Due to their migratory potentials, cattle egrets have been implicated in the spread of poultry infections such as infectious bursal disease [3,23], Newcastle disease [24] and chicken infectious anaemia [4].

Village Weaver

Village weaver (Ploceus cucullatus), also known as the spotted backed weaver or black-headed weaver, belongs to the order Passeriforme and family Ploceidae [25]. It is a species of bird widely distributed in the sub-Saharan Africa and occurs in a wide range of open or semi-open habitats, including woodlands and human habitation [26]. It frequently forms large noisy colonies in towns, villages and hotel grounds where it builds a large coarsely woven nest made of grass and leaf strips with a downward facing entrance suspended from a tree branch [27]. It has a strong conical bill, dark reddish eyes and yellow nape and crown [25].

Village weavers feed principally on seeds and grain, can be crop pests, and also readily feed on insects [27]. They have very strong migratory potentials with dearth of information on their role in the spread of diseases (Craig and de Juana 2017).

African Silver Bill

The African silver bill (Euodice cantans) belongs to the order Passeriformes and family Estriididae [28]. It is a common resident breeding bird in dry savanna habitat, south of the Sahara Desert but has also been introduced to other countries such as Portugal, Qatar and United States [29]. It has a long black pointed tail, stubby silver-blue bill, finely vermiculated light-brown upper parts, whitish underparts, black rump and black wings (BirdLife International 2012c). However, both sexes are similar and the immature birds lack the vermiculations. It is an inactive bird that stays in flocks all year round and usually breeds in loose colony [30].

The African silver bill feeds mainly on grass seeds [28] but has been reported to take aphids from water mint [31]. There is paucity of information on the migratory role of this bird in the spread of diseases but their presence around poultry houses is not uncommon [28].

Influencing Factors on Survival of Free-living Wild Birds in Captivity

Stressors

Stressors in captured wild birds could be in the form of capture, shipping/transportation, acclimatization and/or a new environment for birds already in captivity. These have the potential to reduce immunity, thus making the birds susceptible to new infections or could result in subclinical infections that may become life threatening [32-34]. In breeding and non-breeding house sparrows, trapping has been reported to initiate stress response [35].

Diseases

The introduction of new wild birds to a facility is posed with the risk of disease transmission [34,36]. Hence, the observation of all newly captured birds for clinical signs of disease, injury, or abnormal behavior must be carried out [33]. These include faecal examinations for intestinal parasites as well as visual examination for external parasites [36].

Social Factors

The studies of social behavior of group-living species may require housing of different bird species in groups in the same enclosure [37]. Due to the diversity of housing needs, mix species housing is unsuitable to avoid disease transmission between species [36]. Also, several species of wild birds may be routinely held in a single facility, provided that inter-species dominance over food or nervous responses of one species to another’s calls does not result in additional stress [38]. However, mixed-species housing has been adopted in certain experimental conditions such as in the study of brood parasitism by viduine finches on estrildids, and a study of interspecific song acquisition [38].

Feed

There is greater diversity of feeds in the wild [39], hence, natural diet, including micronutrients, such as carotenoids involved in immune function should be considered for each species [40]. Wild birds in captivity require palatable, uncontaminated, and nutritionally balanced food daily or according to their particular requirements for survival [41]. However, feeding ad libitum could be problematic in species such as psittacines due to development of obesity resulting from the constant feed supply and the relative lack of activity in confinement [42]. Also, the reduction of total nutritional breadth has been associated with the consumption of minimal variety of seeds in seed eaters (Pruitt et al. 2008). Also, the unwillingness to feed on the floor has been reported in vigilant, predator-phobic birds newly placed in a large cage thus, requiring feeding on the floor or other location that enhances flight and increases energetic expenditure to maintain fitness [43].

It has been reported that feeding wild birds with varied diet early in life may enhance them to accept broad healthy diets as adults [44-46].

Lighting

Since many species of birds see into the ultraviolet range [47,48], their survival in captivity is dependent on the availabity of light [49]. These bird species use ultraviolet cues in various visual behaviors such as mate choice and foraging [50]. Also, full spectrum light has been reported to be beneficial in young birds in diseases such as rickets [51]. Therefore, in captivity, wild birds normally should be maintained on photoperiods natural to the species. Furthermore, behavioral problems such as aggression resulting from increasing hormone levels may also be managed by increasing the duration of the periods of darkness [50].

Temperature

The maintenance of a temperature range appropriate to the species is essential for their survivals in captivity [52]. However, daily temperature fluctuations should be minimized to avoid repeated large demands on the birds’ metabolic and behavioral processes to compensate for changes in the thermal environment [52]. Extreme temperature changes may be stressful to the immune system or even lethal, and birds should be kept away from areas with appreciable fluctuations in temperature [53]. The time of year, ambient temperature and breeding activities have been reported to alter the optimal diet even within species [54].

Space

The concept of space is important for birds in captivity [55]. This allows for natural behaviors such as exercise, foraging, social interaction, relieves “boredom” and offset the development of abnormal repetitive behaviors [56].

Conclusion

Free-living wild birds are important source of companion to several individuals as well as being used for tourist attraction globally. Their ability to serve these purposes effectively is largely dependent on their welfare and survival in this new environment. These birds should be provided comfortable environment that mimics their natural habitat to ensure maximum survival. Hence, further studies on the optimum requirement for each species of wild bird in captivity should be conducted to promote ethical experimental studies involving them.

References

  1. DiarmidMcA (1955) Aspergillosis in free-living wild birds. Journal of Comparative Pathology 65:246-249.[crossref]
  2. PaixaoSevada A, Funada MR, Richtzenhain L, Guimaraes MB, de Oliveira Souza et al. (2011) Genotyping of Cryptosporidium spp. from free-living wild birds from Brazil. Veterinary Parasitology 175:27-32.[crossref]
  3. Orakpoghenor O, Oladele SB, Abdu PA (2020a) Research Note: Detection of infectious bursal disease virus antibodies in free-living wild birds in Zaria, Nigeria. Poultry Science99:1975-1977.
  4. Orakpoghenor O, Oladele SB, Abdu PA (2020b) Chicken anaemia antibody status of laughing doves, speckled pigeons, Cattle egrets, Village weavers and African silver bills in Zaria, Nigeria. Journal of Veterinary Research Advances 2:18-21.
  5. BirdLife International. (2015a). “Spilopeliasenegalensis”. IUCN Red List of Threatened Species. Version 2015.4. International Union for Conservation of Nature.
  6. Underhill LG, Underhill GD, Spottiswoode CN (1999) Primary moult and body-mass of the cape turtle doveStreptopeliacapicola, and its abundance relative to the laughing dove S. senegalensis, in the Western Cape. Ostrich 70:196-199.
  7. Cheke, AS(2005) “Naming segregates from the Columba-Streptopelia pigeons following DNA studies on phylogeny.” Bulletin of the British Ornithologists’ Club 125: 293-295.
  8. Adang KL, Ezealor AU, Abdu PA, Yoriyo KP (2008) Food habits of four sympatric columbids (Aves: Columbidae) in Zaria, Nigeria. Continental Journal of Biological Sciences 1:1-9.
  9. Satheesan SM, Prakash R, Datye H (1990) Biometrics and food of some doves of the genus Streptopelia. Journal of the Bombay Natural History Society 87:452-453.
  10. Siegfried WR, Underhill LG (1975) Flocking as an anti-predator strategy in doves. Animal Behaviour 23:504-508.
  11. Burton M, Burton R (2002) International Wildlife Encyclopaedia: Third Edition. Marshall Cavendish, New York.
  12. Ali S, Ripley SD (1981) Handbook of the Birds of India and Pakistan. 3: 155-157.
  13. Kumar PA (1977) Assisted migration of birds by ships. Journal of the Bombay Natural History Society 74:531-533.
  14. BirdLife International. (2017). Species factsheet: Columba guinea.
  15. BirdLife International. (2012a). “Columba guinea”. IUCN Red List of Threatened Species. Version 2013.2. International Union for Conservation of Nature.
  16. Harris E, de Crom EP, Labuschagne J, Wilson A (2016) Urban environment use by Speckled (Columba guinea) and Feral (Columba livia) pigeons on the University of South Africa’s Muckleneuk campus. Applied Ecology and Environmental Research 14:399-419.
  17. Ojija F (2015) Ecology and influence of age and habitats on the diurnal activity patterns of Cattle egret (Bubulcus ibis). International Journal of Scientific and Technology Research 4:107-111.
  18. BirdLife International. (2015b). “Bubulcus ibis”. IUCN Red List of Threatened Species. Version 2015.4. International Union for Conservation of Nature.
  19. North American Bird Conservation Initiative (NABCI) (2016) The State of North America’s Birds 2016. Environment and Climate Change Canada: Ottawa, Ontario.
  20. Telfair RC (2006) Cattle egret (Bubulcus ibis). In: Poole, A. (ed). The Birds of North America Online. Cornell Lab of Ornithology, Ithaca, New York.
  21. Seedikkoya K, Azeez PA, Shukkur EAA (2005) Cattle egret (Bubulcus ibis) habitat use and association with cattle. Forktail 21:174-176.
  22. Siegfried WR (1971) The food of the cattle egret. Journal of Applied Ecology 8:447-468.
  23. Fagbohun OA, Oluwayelu DO, Owoade AA, Olayemi FO (2000a) Serological survey of infectious bursal disease virus antibodies in Cattle egrets, pigeons and Nigerian laughing doves. African Journal of Biomedical Research3:191-192.
  24. Fagbohun OA, Oluwayelu DO, Owoade AA, Olayemi FO (2000b) Survey for antibodies to Newcastle disease virus in Cattle egrets, pigeons and Nigerian laughing doves. African Journal of Biomedical Research 3:193-194.
  25. BirdLife International. (2012b). “Ploceuscucullatus”. IUCN Red List of Threatened Species. Version 2013.2. International Union for Conservation of Nature.
  26. Gill F, Donsker D (2017) Old World sparrows, snowfinches and weavers. World Bird List Version 7.1. International Ornithologists’ Union.
  27. Craig A, de Juana E (2017) Village weaver (Ploceuscucullatus). In: delHoyo J, Elliott A, Sargatal J, Christie DA. and de Juana E. (eds.). Handbook of the Birds of the World Alive. Lynx Edicions, Barcelona.
  28. BirdLife International. (2012c). “Lonchuracantans”. IUCN Red List of Threatened Species. International Union for Conservation of Nature.
  29. Arnaiz-Villena A, Ruiz-del-Valle V, Gomez-Prieto P, Reguera R, C. Parga-Lozano, et al. (2009) Estrildinae Finches (Aves, Passeriformes) from Africa, South Asia and Australia: A molecular phylogeographic study. The Open Ornithology Journal 2:29-36.
  30. Baptista LF, Robin L, Eleanor V, Douglas AB (1999) Relationships of some mannikins and waxbills in the estrildidae. Journal fürOrnithologie 140:179-192.
  31. Meinertzhagen R (1954) The education of young ospreys. International Journal of Avian Science 96:153-155.
  32. Macro I, Mentaberre G, Ponjoan A, Bota G, Manosa S, Lavin S (2006) Capture myopathy in little bustards after trapping and marking. Journal of Wild life Diseases 42:889-891.[crossref]
  33. Ferrell ST, Snowden K, Marlar AB, Garner M, Lung NP (2007) Fatal hemoprotozoal infections in multiple avian species in a zoological park. Journal of Zoo and Wildlife Medicine 28:309-316.[crossref]
  34. Laiolo P, Serrano D, Tella JL, Carrete M, Lopez G, et al. (2007) Distress calls reflect poxvirus infection in lesser short-toed lark (Calandrellarufescens). Behavioural Ecology 18:507-512.
  35. Lynn SE, Porter AJ (2008) Trapping initiates stress response in breeding and non-breeding house sparrows (Passer domesticus): implications for using unmonitored traps in field studies. Journal of Avian Biology 39:87-94.
  36. Parmley EJ, Pearl DL, Vogt NA, Yates S, Campbell GD, et al. (2015) Factors influencing mortality in a captive breeding population of Loggerhead Shrike, Eastern subspecies (Laniusludovicianusssp) in Canada. Biomedical Central Veterinary Research 11:1-7.
  37. Lange H, Leimar O (2004) Social stability and daily body mass gain in great tits. Behavioural Ecology 15:549-554.
  38. Hahn BA, Silverman ED (2007) Managing breeding forest songbirds with non-specific song playbacks. Animal Conservation 10:436-441.
  39. Koutsos EA, Matson KD, Klasing KC (2001) Nutrition of birds in the order Psittaciformes: A review. Journal Avian Medicine 15:257-275.
  40. Blount JD, Metcalfe NB, Birkhead TR, Surai PF (2003) Carotenoid modulation of immune function and sexual attractiveness in zebra finches. Science 300:125-127.[crossref]
  41. Barrett LF, Mesquita B, Ochsner KN, Gross JJ (2007) The experience of emotion. Annual Review of Psychology 58:373-403.
  42. Pruitt KD, Hewitt DG, Silvy NJ, Benn S (2008) Importance of native seeds in white-winged dove diets dominated by agricultural grains. Journal of Wildlife Management 72:433-439.
  43. Schnegg A, Gebhardt-Heinrich SG, Keller P, Visser H, Steiger A (2007) Feeding behaviour and daily energy expenditure of domesticated budgerigars (Melopsittacusundulatus): Influence of type of housing and vertical position of the feeder. Applied Animal Behavior Science 108:302-312.
  44. Liukkonen-Anttila T, Putaala A, Hissa R (1999) Does shifting from a commercial to a natural diet affect the nutritional status of hand-reared grey partridges Perdixperdix? Wildlife Biology 5:147-156.
  45. Van Heezik Y, Lei P, Maloney R, Sancha E (2005) Captive breeding for reintroduction: Influence of management practices and biological factors on survival of captive kaki (black stilt). Zoo Biology 24:459-474.
  46. Moore SJ, Battley PF (2006) Differences in the digestive organ morphology of captive and wild Brown Teal (Anaschlorotis) and implications for releases. Bird Conservation International 16:253-264.
  47. Cuthill IC, Partridge BC (2000). Ultraviolet vision in birds. Advances in the Study of Behavior 29:59-190.
  48. Rajchard J (2009) Ultraviolet (UV) light perception by birds: a review. VeterinarniMedicina 8:351-359.
  49. Lustick S (1973) The effect of intense light on bird behavior and physiology. Bird Control Seminar Proceedings 6:171-186.
  50. Maddocks SA, Cuthill IC, Goldsmith AR, Sherwin CM (2001) Behavioural and physiological effects of absence of ultraviolet wavelengths for domestic chicks. Animal Behaviour 62:1013-1019.
  51. Edwards HM, Elliot MA, Sooncharernying S, Britton WM (1994) Quantitative requirement for cholecalciferol in the absence of ultraviolet-light. Poultry Science 73:288-294.[crossref]
  52. Ardia DR, Perez JH, Chad EK, Voss MA, Clotfelter ED (2009) Temperature and life history: experimental heating leads female tree swallows to modulate egg temperature and incubation behavior. Journal of Animal Ecology 78:4-13.[crossref]
  53. Laurila M, Hohtola E (2005) The effect of ambient temperature and simulated predation risk on fasting-induced nocturnal hypothermia of pigeons in outdoor conditions. Journal of Thermal Biology 30:392-399.
  54. Harper EJ (2000) Estimating the energy needs of pet birds. Journal of Avian Medicine and Surgery 14:95-102.
  55. Dawkins MS (2006) A user’s guide to animal welfare science. Trends in Ecology and Evolution 21:77-82.[crossref]
  56. Meehan CL, Millam JR, Mench JA (2003) Foraging opportunity and increased physical complexity both prevent and reduce psychogenic feather plucking by young Amazon Parrots. Applied Animal Behaviour Science 80:71-85.