Author Archives: author

Phosphorus Outsourcing to Lake Kinneret (Israel) is Significantly Affected by Climate Conditions

DOI: 10.31038/GEMS.2021342


Long-term records [1-4] in the drainage basin of Lake Kinneret has indicated that since the mid-1980`s, significant changes in climate conditions have occurred, and trends of dryness in the Kinneret drainage basin have been documented, including a temperature increase and precipitation decline. The precipitation decline and consequently the reduction in river discharge resulted in a decrease in TP flux into Lake Kinneret. The known external TP sources are natural bedrock erosion, dust deposition, and anthropogenic intervention in the drainage basin, as well as soil degradation and agricultural-eco-tourism developments within the Hula Valley. Among internal sourcing of Phosphorus in Lake Knneret, reductive conditions and microbial activity in the anoxic hypolimnion sediments are significant during the 8th month of stratification period. The major contribution within the external TP inputs is due to the erosive action which is dependent on river discharge. The TP concentrations in the Jordan River were found to be significantly related to the discharge ranges. The river discharge has been a consequence of climate conditions, of precipitation. During the 1950`s the Hula natural wetlands and old Lake Hula (part of the Kinneret drainage basin) was drained and the land was converted to agricultural development and consequently the ecological features of the Hula Valley were modified. Nutrient fluxes downstream into lake Kinneret were predicted. The significance enhancement of the impact of precipitation and discharge fluctuations on TP outsourcing through erosive action was documented: higher and lower discharge enhances and reduces TP load, respectively. The total TP flushing range from the Hula Valley peat soil through the subterranean channels where TP is migrated are not precisely known but probably Lake Kinneret as collectors of those is excluded. Long-term records of TP concentrations in headwaters and potential resources in the Hula Valley confirmed the significant influence of climate conditions on the outsourcing of TP. The impacts of agricultural development, external fertilizer loads and migratory cranes in the winter (50,000 during 5 months) are probably insignificant. As a result of the old lake Hula and wetland drainage, the unique natural composition of exceptionally diverse fauna and flora was devastated. The newly created arable land became a source of income to the residents of northern Israel. For 40 years, it was successfully cultivated, agricultural products (mostly cotton, corn, alfalfa, and vegetables) were economically produced, and nutrient flux into Lake Kinneret did not threaten the lake’s water quality. Nevertheless, as a result of inappropriate management, enhancement of dust storms devastating fresh sprout-germinates and blocking of drainage canals, irrigation methods were not appropriate for optimal soil moisture management, soil fertility decreased and Ground Water Table (GWT) was lowered. The soil structure of the upper layer became oxidized and deteriorated, heavy dust storms became frequent, and the soil surface subsided (7-10 cm/year). Underground fires occurred often. increased rodent population outbreaks which caused severe damage to agricultural crops and to the stability of drainage canal banks. Moreover, agricultural cultivation of 8% in the middle of Hula Valley land was gradually abandoned. Therefore, during 1990-1997, the entire drainage area underwent a reclamation project, Hula Reclamation Project (HRP). The project was aimed primarily at decreasing the nutrient fluxes from the Hula Valley soil while implementing modern irrigation methods and innovation of economical land use accompanied by integrate eco-tourism. The HRP comprised several operational stages: increasing the soil moisture by elevating the GWT, changing the irrigation method, renewing the drainage system in the entire valley, and creating a new shallow lake namely ‘Agmon-Hula’. This shallow lake was designed to be a collector for the entire valley and to provide an appropriate service for eco-tourism. A plastic sheet (4-mm thickness) was placed vertically (0-4.5 m) along 2.8 km, crossing the valley in an east-west position, to partition the southern part of the valley aimed at prevention of underground leakage of pollutants into Lake Kinneret. Lake Agmon was proposed to support sufficient volume for the collection of peat soil-drained-nutrient-rich water effluent and was also mixed with fresh Jordan River water to prevent deterioration of water quality. Nutrient-rich polluted water from Lake Agmon-Hula was transferred for irrigation usage outside the Kinneret drainage basin. Natural attractions (migratory Cranes) were designed for observational touring of the aquatic vegetation landscape, bird watching and sport fishing recreation. The original design was successfully implemented, and crane wintering provided an attractive experience for tourists.

Conclusive Remarks

The Kinneret region has undergone changes in climate conditions, prominently dryness. These changes enhanced processes of decline in rainfall-river discharge, and were accompanied by changes in nutrient dynamics and decreases in input concentrations. These modifications in nutrient dynamics were not likely to have been affected by the presence of Cranes in the Hula Valley. The seasonal changes in TP concentration of the Agmon-Hula effluent are due to the onset and offset of submerged macrophytes. The fate of prominent part of the movable phosphorus produced in the Hula Valley ecosystem is unclear. Phosphorus input into Lake Kinneret through river discharge is affected primarily by climate change. The concentration and consequently total load of phosphorus in the outflow of Lake Agmon-Hula by is significantly affected by submerged macrophytes and, to a lesser extent by cranes.

References

  1. Gophen M, Levanon D (eds) (1993-2006) Hula Project, Annual Reports: Migal-Sientific Research Institute, Jewish National Fund (Keren Kayemet LeIsrael), US Forestry Service International Project, Israeli Water Authority.
  2. Gonen E (ed) (2007) Hula Project Annual Report, Jewish National Fund (Keren Kayemet LeIsrael) Migal-Scientific Research Institute and Israeli Water Authority, pg: 133.
  3. Barnea I (ed) (2008) Hula Project Annual Report, Jewish National Fund (Keren Kayemet LeIsrael) Migal-Scientific Research Institute and Israeli Water Authority pg: 159.
  4. Barnea I (ed) (2008-2018) Hula Project Annual Report, Jewish National Fund (Keren Kayemet LeIsrael) Migal-Scientific Research Institute and Israeli Water Authority pg: 232.

Bee Pollen Production, Physicochemical and Bio-functional Properties, and Safety Utilization: A Review

DOI: 10.31038/NRFSJ.2021415

Abstract

Pollen is a fine to coarse astonishing natural product that plays a critical role in plant reproduction. Pollen is collected when the worker bees visiting flower’s blossom and their bodies touch the stamen. Pollen is collected with a pollen trap, made out of a grid, and placed on the entrance of the beehive. Beebread is bee collected pollen that stored in the honey combs and it is fermented and naturally preserved. The quality of the pollen is influenced by the harvesting techniques, technologies used, and post-harvest handling, drying and storage situations. Properly dried bee collected pollen that stored in a cool, dry and dark place keeps its sensory and microbiological quality for a storage period of two years.

Bee collected pollen is very rich in protein, fatty-acids, free sugars, carbohydrates, and it contains trace amounts of minerals, phenolic acids, flavonoids and vitamins. Pollen can be regarded as a promising therapeutic and natural food supplement. Bee collected pollen is defined as a valuable food however, due to the small quantities that are required and consumed it should be rather regarded as a supplement functional food. Its functional biological property is due to the high content of flavonoids, polyphenols and considerable radical scavenging capacity. As a functional food pollen can strengthen immunity and help the body to fight bacteria, and make the body to perform a quality tissue repair. Recently, due to the increased awareness of consumers the consumption of functional foods can improve their health and pollen began to be considered as a functional food ingredient. Pollen as bee hive product is not a widely commercialized product in Ethiopia. Having diversified natural vegetation cover that are used as a pollen source, there is a large untapped potential to produce this valuable products and then promoting and supporting pollen production and commercialization shall be the priority area of intervention in Ethiopia. The purpose of this review work is to understand and summarize the current knowledge on nutritional, bio-functional and health benefits of bee collected pollen and to set conclusion and recommendations. The review work is conducted through methods of setting the outline, reading and understanding the current articles, summarizing the relevant information’s and finally set conclusion and point out recommendations.

Keywords

Flavonoids, Pollen, Beebread, Antioxident, Bioavailability, Fermentation, Pelle

Introduction

Background

Pollen is a fine to coarse powdery substance that encompasses pollen grains. Pollen grains are highly dynamic micro-scale structures with a hard coat that protects the gametophytes during the process of their movement from the stamens to the pistil of flowering plants [1]. According to pollen is an astonishing natural material that plays a critical role in plant reproduction and transfers viable cellular material between different reproductive parts of plants [2,3]. Pollen is collected when the worker bees visiting flower’s blossom and their bodies touch the stamen. Bees can use the pollen for the feeding and development of the bee brood. According to pollen contains high protein that is necessary for the nourishment of honey bee broods inside the beehives [4]. Moreover, it is also the source of nutritional and mineral substances for royal jelly produced by worker bees. The average amount of pollen that a bee colony needs is estimated at 13.4 to 17.8 kg per year. Sufficient amount of pollen is important for colony maintenance and to increase production and productivity [5].

The pollen is compress into the pollen basket by using their hind legs. The bees moistens the pollen with secretion from its mouth which helps the pollen stick together and to the basket hairs. The bees enrich the pollen with their own substances and made a pollen pellets. The secretion from the bees contains different enzymes like. Amylase and Catalase. A pollen load contains up to 10 percent nectar, which is necessary for packing [6].

According to bee collected pollen is the main source of nutrients to the development of bee colonies [7,8]. Pollen is a very important factor for the development of the bee brood and supplies the necessary foods like proteins, lipids and minerals [7]. Moreover, bee pollen has gained increasing attention for its antioxidant capacity and has been used as food supplement and additives contributing on the health benefits of human [9]. On this understanding the Egyptians describe the pollen as a life-giving dust.

Pollen production allows beekeepers to diversify their sources of revenue, mitigating the effects of fluctuations in honey price and enabling beekeepers to diversify their products (Shelley et al., 2018). Pollen is collected with a pollen trap, made out of a grid, placed on the entrance of the hive. Based on the floral variety, pollen composed a complex chemical composition and bioactive compounds. According to bee collected pollen is the main source of protein and provides with essential amino acids that are important for brood rearing and queen feeding [10,11]. Bees can collect, conserve and store pollen in the hexagonal cell of the honey comb and mixing it with nectar and glandular secretions and transform into a product known as “bee-bread”. It is a partially fermented pollen mixture that stored in the honey combs. Based on the study of bee pollen that stored in the honey comb can undergo transformation processes [12]. The transformation process can use to prolong the shelf life of the beebread and to improve the nutritional and functional properties. The biochemical transformation process is mediated by lactic acid bacteria and made a beebread [13]. The composition and nutritional value of the bee bread is different than pollen pellets. Compared to bee-pollen, bee-bread may be better tolerated by the human digestions [14].

According to the study of they characterized the bee bread as a higher nutritional value than pollen and better digestibility and richer in chemical compositions [15]. Moreover, since the components of bee bread are partially fermented it is better absorbed by the human body than pollen and is more easily assimilated [13]. On the hand the presence of high lactic-acid levels in beebread can affect storage and being a food with a short shelf life [16].

Pollen is collected when the bees pass through the openings of pollen traps on the entrance of beehives. The pollen pellets are removed and subjected to further processing and drying processes for prolonging the shelf-life. The color of pollen loads is sometimes variable and reflects the diversity of plant species that the pollen is collected [17]. According to bee collected pollen and bee bread have a high nutritional value and include bioactive compounds and regarded as functional foods [18]. The significant number of bioactive compounds, carbohydrates, enzymes, vitamins, fatty acids, essential amino acids or carotenoids depends on the botanical and geographical origin. Bee collected pollen can be regarded as a promising therapeutic and natural food supplement. Its functional biological property is due to the high content of flavonoids, polyphenols and considerable radical scavenging capacity

Objectives

General Objectives

The objectives of this review work is to understand and summarize the current knowledge, the source, production and post-harvest process, nutritional and functional benefits of bee collected pollen and to summarize the present research information’s.

Specific Objectives

The Specific objective of this paper were to review

  • On the current production of bee pollen.
  • On physicochemical properties of bee pollen.
  • On bio-functional properties and health benefits of bee pollen
  • On proper utilization and handling practices of bee pollen

Literature Review

Bee Pollen Production and Harvesting

Production

Foraging bees visit different plant species to collect pollen and nectar and bring back to the beehives. According to the bees can carry the pollen by their hind legs as pollen pellets and store in the cell of honey combs [19]. During this process, the bees mix the pollen with nectar and salivary secretions and become the “bee bread,” The beebread is representing a main food reserve for the development of beehive colony [20]. The quality of the pollen is influenced by the harvesting techniques, technologies used, and post-harvest handling, drying and storage situations. The humidity in pollen is an ideal culture medium for micro-organisms like bacteria and yeast. To preserve and to control the spoilage of pollen daily harvest and immediate placement in a freezer is fundamentally important to maximum the quality of pollen. Moreover, fresh bee pollen should be kept in an airtight container and should not clump together (Figures 1-6) [21].
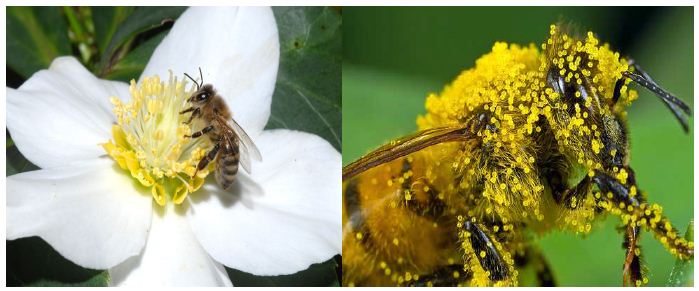
fig 1

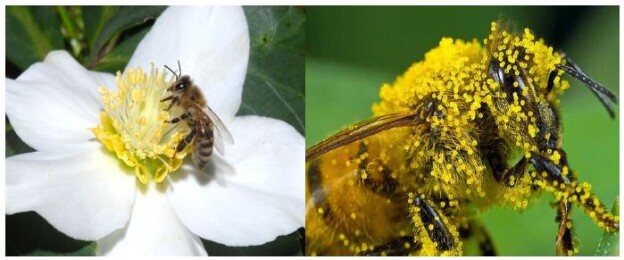
Figure 1: Bee collecting the pollen and pollen dusts on the body of the bees [62]. Source: Bogdanov (2016).
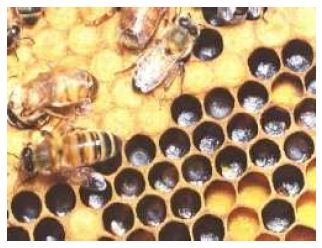
fig 2

Figure 2: Bee Bread in honey comb.

fig 3

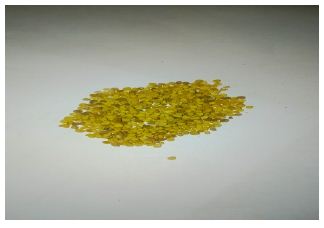
Figure 3: Pollen produced from EMDIDI demonstration site (2020).
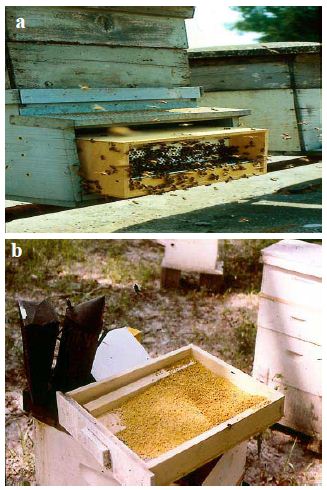
fig 4

Figure 4: (a) Pollen tray fixed on the beehive (b) Harvested pollen with pollen trap.
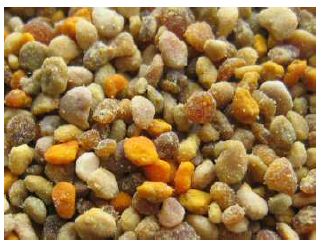
fig 5

Figure 5: Dried pollen pellets. Source: Bogdanov (2016).
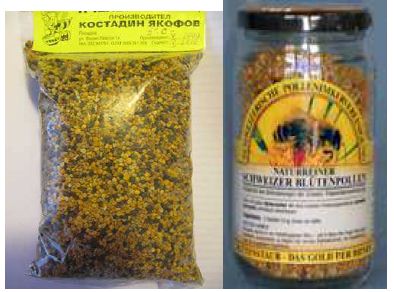
fig 6

Figure 6: Commercially processed and packed pollen.

According to pollen collection has received relatively little attention when compared to honey, royal jelly, and propolis [14,21]. However, bee-collected pollen is an important source of essential amino acids, antioxidants, flavonoids minerals, vitamins, and lipids [22]. Beekeepers can fix the pollen traps in the hive entrance through which the worker bees cannot pass easily with both legs carrying pollen pellet so they are forced to drop them onto trays. The collected pollen is periodically removed from the trapping trays [23]. The pollen pellets are removed and subjected to further processing and drying processes for prolonging the shelf-life. Currently, there are only few countries like, (Spain, China, Hungary, Argentina and Brazil) where commercially produce pollen with significant contribution on national economically. Countries such as Brazil, Argentina, Switzerland, Spain and Mexico have established official quality standards and recognized pollen as a food product.

Based on the study of beebread is produced from the pollen [13]. The bees are adding honey and enzymes and transform the bee pollen to beebread. Pollen transformation in beebread occurs as a result of successive interventions of different enzymes, and some species of microorganisms, that are naturally present in pollen. According to during the fermentation process, the wall of the pollen is disrupted and makes the beebread has a better bioavailability than pollen pellets [12]. Comparatively with the pellets of bee pollen, beebread is better tolerated by the human organism and has a lower pH (3.8-4.3) [4].

Ethiopia has a huge potential to produce beehive products because of its endowment with diversity bee flora vegetation resources and climate. According to Gemechis (2014), more than 400 plant species are already identified as major bee flora plants that the bees can collect pollen and nectar. A sample of bee pollen was collected from the demonstration site of Ethiopia meat and dairy industry development institute.

According to the pollen is removed and collected from the bees by pollen traps before the bees enter in the hives [24]. Depending on, ease of cleaning, installation and harvesting there are different designs of pollen traps. Pollen should be collected daily in humid climates but less frequently in drier climates. According to avoid deterioration of the pollen and growth of bacteria, moulds and insect larvae, pollen should be air dried immediate after harvest [25]. Bees can collect about 15 to 40 kg of pollen per year [26]. Foraging bees carry the pollen to the hive in the form of pollen loads. Global production of the pollen is around 1500 tons per year. Depending on the pollen source plant species, the pollen grains differ in shape, color, size, and weight. The color of pollen varies, ranging from bright yellow to black.

Harvesting

Bee pollen is collected by beekeepers with the use of pollen traps, devices that fit over the entrance to a hive and contain openings just big enough for a returning forager to squeeze through [27]. In the process of squeezing through the opening in the trap, the pollen carried on the hind legs of the bee are knocked off and falls through a screen into a drawer where it is collected by the beekeeper. Pollen is collected when the bees pass through the openings of pollen traps on the entrance of beehives. The pollen stuck to the bodies of the bees falls on the trapping tray. Human intervention starts at this stage that collect, preserve, sort, purify, dry, pack and marketing for human consumption [25].

To prevent additional contamination and bacterial replication, frequent collection of pollen from pollen traps and can be need immediate air drying, processing and preservation [25].

Handling and Processing

Drying and Processing. Fresh pollen typically contains 10- 12 percent water, while the moisture content of dried pollen is around 4 percent. According to Anderson et al., drying the pollen in the sun may decrease the potency of pollen by as much as 50 percent due to oxidation of natural antioxidants in the pollen [10]. As a result, the best way to preserve pollen once it is collected is to freeze it immediately after harvest. According to some international standards of bee pollen, the maximum drying temperature is 42°C, and water content is about 6 percent [25]. As per current Bulgarian norms, the fresh pollen, collected from apiaries, should be dried at temperatures up to 45°C and should have residual water content not higher than 12 percent.

The color of pollen loads is sometimes variable and reflects the diversity of plant species that. the pollen is collected [17]. The color is usually in various shades of yellow, gray-white, orange, reddish, greenish and blue. Depending of the plant species pollen grains differ in shape, color, size, and weight. The color identification of bee collected pollen pellets showed an evident variability of the botanical origin.

Preservation and Storage. Based on the data of available literature Parvanov and Dinkov (2017), the more specific requirements to the processing, storage and labeling of bee pollen as a food product are proposed with regard to food safety. Moreover, preservation of its natural physical, chemical and organoleptique characteristics can be fundamentally important aspects of pollen quality. Experience in Switzerland showed that from a microbiological and sensory point of view pollen remains stable until 1.5 years of storage at room temperature. On the other hand, according to pollen that stored in a cool, dry and dark place keeps its sensory and microbiological quality for a storage period of 2 years [28]. Besides, freezing the pollen at -20°C in pure nitrogen can preserve its highest biological activities.

Beebread is a product of the hive obtained from pollen collected by bees, the bees add honey, digestive enzymes and then carried in the hive and preserved in the honey combs. According to the study of Adriana et al., and Denisow, beebread is the fermented and naturally preserved pollen that gathered by bees and mixed with its own digestive enzymes [20,28]. According to there is a significant antioxidant activity in beebread and a significant correlation between the biological activity and its botanical origin [29]. As functional food pollen is one of the main health enhancing properties, it is due to its strong antioxidant activity. However, pollen can lose a considerable amount of its antioxidant activity (about 59%) after one year duration. This loss might be due to the decrease of phenolic compounds.

Nutritional and Functional Benefits

Nutritional Importance and Quality Aspects of Pollen

Pollen could be considered as valuable food due to its nutritional compounds like (high amounts of lipids, proteins, carbohydrates) and minerals like (Ca, Mg, Fe, Zn, Cu). Moreover, bee collected pollen is very rich in protein, fatty-acids, free sugars, carbohydrates, and it contains trace amounts of minerals, phenolic acids, flavonoids and a range of vitamins [30,31]. According to bee collected pollen and bee bread have a high nutritional value and include bioactive compounds and regarded as functional foods [18]. Moreover, pollen is rich in proteins, simple sugars, essential amino acids and omega fatty acids. According to Leila, bee pollen extract is used as beef burger fortification and also has a great inhibitory effect on lipid oxidation in beef burger [32]. It is proposed as alternative raw material to substitute a synthetic antioxidant in beef burger production. The combination of antioxidant properties with nutritive value and health-promoting effects of bee pollen suggests its potential application as food ingredient in meat products. Consequently, the need to strengthen the beekeeping productive chain, particularly in aspects related to innovation and new product development.

Current literature Adriana et al., suggests that beebread is a good source of Polyunsaturated Fatty Acids (PUFAs) that are crucial for human nutrition [28]. Beebread helps to regulate the lipid metabolism and exerts a positive effect on the immune system of patients suffering from chronic arthritis. Due to its rich biochemical and physicochemical composition bee pollen is preferred as a natural food supplement [33]. Bee pollen is considered an increasingly popular food supplement. Pollen consumption and marketing has recently developed. However, according to Fuenmayor et al., bee collected pollen is practically unrecognized as a food product for a long time [19]. On the other hand, chemical composition and physical parameters of bee collected pollen are primarily influenced by its floral source and geographical origin. At present there are only few countries like (Spain, China, Hungary, Argentina and Brazil) where commercially produce pollen. Moreover, countries such as Brazil, Argentina, Switzerland, Spain and Mexico have established official quality standards and recognized pollen as a food product [34].

According to there are only a few countries have established microbiological criteria for dried pollen [35]. Moreover, Switzerland, Argentina, and Brazil are the first countries that implemented official quality regulations. However, there is no specific international agreement regarding the quality of bee collected pollen (DeMelo et al., 2015). Moreover, to keep the beneficial dietary and therapeutic properties of pollen, its quality must be monitored and should be regulated [35].

Bee pollen is normally acidic, with a pH between 3.4 and 5.1, and composed of 15 percent proteins including essential amino acids. The nutritional and nutraceutical quality of pollen is decreased with subjected to storage conditions. However, pollen can be considered as an excellent source of polyphenols and flavonoids, considering its average content of about 1.6 g/100 g and 1.4 gm/100 g, respectively [36].

Bee pollen is defined as a valuable food however, due to the small quantities that are consumed and required, it should be rather regarded as a supplement functional food. On the other hand, even though some countries have national standard, there is no international quality and regulatory standards that defining the compositional requirements of bee collected pollen [37].

According to Bogdanov (2017), the old Egyptians describe pollen as a nurturing food. Moreover, it is known as the main exceptionally complete nourishment natural food product. Pollen provision is conveyed worldwide for dietary purposes and as diet supplement. On the other hand, the nutritional content of bee pollen may be partly released by digestive systems and only a proportion of bee pollen constituents are assimilated by humans.

The nutritional value of pollen is often evaluated by the protein and carbohydrate concentration, flavonoids and lipids content as well as the presence and quantity of essential amino acids. Bee pollen is characterized by very high protein content, but it varies greatly from 7-35 percent depending on the plant source. According to Marek, pollen can contains over 25 different micro and macro elements such as iron, calcium, phosphorus, potassium, copper, zinc, selenium, and magnesium [38]. The presence of adequate levels of macro and microelements is very important for the proper course of different metabolic processes. Moreover, mineral components are necessary for proper regulation of metabolic pathways and physiological processes [8]. Their adequate intake is essential for the maintenance of homeostasis, cell protection, functionality, and health.

The activity of pollen like vitamins and enzymes is deteriorated after two or three months of storage [13]. Scientists from the International Honey Commission (IHC), was proposed quality criteria and international standards of pollen quality. The standard is recommend the limits for the number of aerobic microorganisms (<10 cfu/g), yeast and mold (<5.104 cfu/g), Enterobacteriaceae (max 1.102 cfu/g), E. coli (absent in 1 g), Salmonellaspp (absent in 10 g), and Staphylococcus aureus (absent in 1 g) (Campos et al., 2008) [39].

Pollen as a Functional Food

Bee collected pollen and bee bread have a high nutritional value and rich in proteins, simple sugars, essential amino acids and omega fatty acids include bioactive compounds. Thus, compounds have a positive effect on human health and regarded as functional foods. These features strengthen immunity and help the body to fight bacteria, which will keep the body healthy and can perform a quality tissue repair of the body [40]. Furthermore, according to Margaoan et al. Bee-collected pollen and beebread are appreciated mainly for their high nutritional value [41]. Both products are rich in proteins, essential amino acids, sugars, fatty acids (including omega 3 and omega 6 fatty acids), vitamins, macro and microelements. Moreover, regarded as functional foods because they are rich in polyphenolic compounds and exhibit significant antioxidant properties [36].

Bee pollen is a valuable product greatly appreciated by the natural medicine because of its potential medical and nutritional applications [42]. It applied to antifungal, antimicrobial, antiviral, and anti-inflammatory treatments. According to strong medical effect of bee pollen is originates from the richness of bioactive compounds [43]. The significant number of bioactive compounds, carbohydrates, enzymes, vitamins, fatty acids, essential amino acids or carotenoids depends on the botanical and geographical origin of the pollen. High amounts of phenolic acids and flavonoids acid stimulate antioxidant, antimicrobial, anticarcinogenic, antiviral and anti-inflammatory activities [44]. This natural product owing to its biochemical diverse could be used for immunity system enhancement, regulation of the function of digestive system, and antimicrobial, anti-aging and anti-anemic activities.

Antimicrobial effects of bee pollen are well known, possibly mediated by glucose oxidase activity, deriving from honeybee secretion, while plant phenolics and flavonoids could also be involved [20]. According to Marek et al., bee collected pollen remains a good source of energy having 1692 kJ (404.3 kcal) in 100 g and referred as a perfect complete foodstuff [38]. Besides, because of its unique composition, it remains termed as a super foodstuff. Recently, there has been a renewed interest in the research of the composition as well as biological properties of bee collected pollen [18].

Bioactive Constituents and Health Benefits of Bee Pollen

Bioactive Constituents

According to Afra et al., bee pollen can be regarded as a promising therapeutic and natural food supplement [45]. Its functional biological property is due to the high content of flavonoids, polyphenols and considerable radical scavenging capacity. However, further experimental research and clinical studies will be required to verify the effectiveness of bee pollen extracts. Various pollen products can be found on the market in the form of granules, capsules, tablets, pellets, and powders.

According to the most important bioactive substances in bee collected pollen are phenolic compounds and carotenoids [45]. The phenolic compounds are responsible for the color of the pollen grains and for the bitter taste characteristic of pollen. Carotenoids are particularly important for biological functions, such as antioxidant activity. Moreover, pollen contains more than 100 enzymes and coenzymes, 16 fatty acids, all known vitamins. Furthermore, flavonoids, carotenoids, trace elements, and antioxidants are compounds that contribute to the potential bioactivities properties of bee collected pollen [6]. The presence of more than 250 substances with high biological activity was determined in the pollen from different plant species [42].

Health Benefits

Apitherapy is becoming more and more recognized among contemporary and conventional treatment methods as it uses therapeutic effect of standardized, pharmacologically active fractions obtained from bee products [42]. The extracts of bee pollen collected from flowers of different angiosperms can be regarded as a promising therapeutic food supplement. Its functional biological property is mainly due to the high content of flavonoids and polyphenols [45]. Flavonoids and phenolic acids are the main phenolic compounds of bee-pollen and have a role in reduction of the scavenging of free radicals that harm our cells [19].

Bee collected pollen and bee bread are rich in proteins, simple sugars, essential amino acids and omega fatty acids which have a positive effect on human health. It strengthens immunity and helps the body to fight bacteria, which will keep the body healthy, and can perform a quality tissue repair [4]. According to Nemat et al., the bee collected pollen can protect the body against potentially harmful molecules called free radicals [46]. The damage the body tissue by free radicals is linked to chronic diseases such as cancer and type two diabetes.

The studies of the past few years suggest that the biologically active substances found in bee pollen can act as strong antimicrobial, antioxidant and anticarcinogenic properties [43]. On the other hand, bee pollen can demonstrate a wide range of healing effects and increase the level of (Adenine Tri phosphate) ATP, and consequently neutralize an effect of many toxic agents, besides increase immunity and improve the energy balance of the tissues [38]. Moreover, antioxidants in bee pollen may protect lipids from oxidizing. The oxidization of lipids can restrict blood vessels and raising heart disease risk [47]. On the other hand, bee collected pollen may boost the immune system and help to avoid illnesses and unwanted reactions in the body and kill potentially harmful bacteria such as E. coli, Salmonella, Pseudomonas aeruginosa [48]. Strong medical benefits of this bee product originate from the richness of bioactive compounds.

According to the diversity of active natural metabolites, especially vitamins, carotenoids, and polyphenols, in pollen has valued significant biological activity [49]. Moreover, pollen can be expressed as the antioxidant, antibacterial, and anti-carcinogenic activity. According to the beneficial effect of bee pollen in the human diet, is considered as a health-promoting food [50]. Pollen has a great role in the protection of vital cell components from oxidative damage of free radicals. Pollen can neutralize the free radicals and prevent incidence of various diseases such as cancer and cardiovascular and neurodegenerative diseases [49]. Due to the high nutritional value and pronounced health-promoting properties, and the potential use as a supplement to the human diet, bee-pollen represents a valuable natural product. Pollen remains perceived as a society drug in China and Germany as a result of having a few important phytochemicals, flavonoids and carotenoids [51].

Physicochemical Characteristics and Chemical Compositions

Physicochemical Characteristics

Physicochemical characteristics of bee pollen depend on its botanical origin and the nutritional composition has some variations among different countries (Tables 1 and 2). There are plenty of studies that focus on the characterization of physical-chemical properties of bee-pollen. According to Leila, bee pollen is studied as potential treatments that suit to enhanced nutritional and bioactive value for humans. The physicochemical properties of bee-collected pollen can be affected both by processing techniques Ranieri et al., and storage conditions [52]. Freshly collected pollen contains from 15% to 30% of water. Consequently, it needs to be promptly processed to boost its physicochemical stability and avoiding microbial development [53].

Table 1: Bee pollen regulatory standards of some countries.

Quality Parameters

Regulatory Specifications

Argentina Brazil

Mexico

1 PH

5.00

5.00

5.00

2 Moisture gm/100gm maximum

8.00

4.00

8.00

3 Ash gm/100gm maximum

4.00

4.00

2.20

4 Lipid gm/100gm maximum

6.00

5.00

6.50

5 Proteins gm/100 minimum

15.00

8.00

12.00

Source: Enero (2014)

Table 2: Pollen and bee bread in reference to human nutritional requirements.

No

Component

Bee Pollen Bee Bread RDI for 15 g

References

1 Proteins

7-40%

14-37%

5-22%

Kaškonienė 2015; Fuenmayor et al., 2014; Hoffman et al., 2013; Zuluaga et al., 2015
2 Carbohydrates

24-60%

24-34%

1-4.6%

 Barene et al., 2015
3 Lactic acid

0.56%

3.2%

Barene et al., 2015
4 Lipids

1-18%

6-13%

0.1-4%

Campos et al., 2016
5 Flavonoids

0.2-2.5%

0.03%

Komosińska et al., 2015

According to Urcan et al., the chemical composition of bee collected pollen depends strongly on botanical and geographic origin, climate, soil type and season [54]. The bees are very selective when gathering pollen and that the bulk of the collected pollen comes from few plant species. On the other hand, the identification of botanical origin of both pollen and beebread is of paramount importance since their biological, nutritional, antioxidant and antibacterial properties are directly related to their composition [55].

Chemical Composition

According to Sattler et al., the chemical composition of bee collected pollen is fundamentally influenced by the botanical diversity from which it was collected [7]. On the other hand, the botanical contribution, storage time, nutritional status of the plant and environmental conditions in the phase of pollen collection are also influence the composition. Pollen is rich in biologically active substances and composed of about 200 substances [42]. The basic chemical substances are proteins, amino acids, carbohydrates, lipids and fatty acids, phenolic compounds, enzymes, and coenzymes as well as vitamins and bio-elements.

Small differences among composition of bee pollen could results in gathering area or season in floral species, environmental conditions including soil type, however, the major differences are mainly attributed to botanical origin [56]. According to Silva et al., the chemical composition of bee pollen depends strongly on the plant source and geographic origin [57]. Based on the study of Komosinska et al., bee pollen is normally acidic, with a pH between 3.4 and 5.1, and composed of 20% proteins (including essential amino acids) such as methionine, lysine, threonine, histidine, leucine, isoleucine, valine, phenylalanine, and tryptophan [42]. Moreover, bee collected pollen contains 55% total carbohydrates with 25% of reducing sugars (primarily fructose and glucose), 5% lipids, 1.6% phenolic compounds, 0.7% vitamins, and 1.6% bio chemical-elements [19].

According to proline and glutamic acid content of bee pollen is associated with bee pollen quality [58]. Moreover, concentration glutamic acid greater than 20 mg/g indicates the freshness, whereas lower proline value indicates aging and technological process. Amylase, phosphatase and glucose-oxidase are the functional enzymes that found in beebread [13]. Additionally, beebread contains largest quantity of amino acids like glutamic acid, aspartic acid and proline.

The study conducted by Adriana et al., conclude that beebread is categorize as a valuable special foods, that contains proteins, essential amino acids, fatty acids, carbohydrates, minerals and bioactive compounds [28]. The calcium content of Ethiopian Zea mays pollen investigated by Admassu was higher than potassium content a different situation comparative with previous scientific basis [59]. The pollen composition varies greatly according to its botanical origin. Table 3 presents average bee-pollen composition as well as the data of Brazilian, Hungary, Poland, Slovenia, India, Romania, Spain, China and Bulgaria. And Table 1 represents the quality parameters and regulatory specifications of pollen from Argentina, Brazil and Mexico.

Table 3: Physicochemical composition of commercial bee collected pollen from different countries.

No

Parameters

Countries
Hungary Poland Slovenia India Romania Spain China

Bulgaria

1 pH

4.40

4.50 5.40 4.30 4.90 4.40 5.00

4.40

2 Free acidity (meq-kg)

243.00

332.00 207.00 383.00 237.00 241.00 351.00

310.00

3 Moisture (gm/100 gm)

4.90

4.00 5.90 9.10 5.10 5.20 2.00

4.60

4 Ash (g/100 g)

1.70

2.60 2.40 3.30 2.30 1.60 4.30

1.80

5 Lipids (gm/100 g)m

4.90

5.70 5.90 8.00 4.90 5.00 5.20

5.60

6 Protein (gm/100 gm)

16.30

25.60 21.40 26.10 22.30 20.80 17.60

19.20

7 Sodium (mg/kg)

219.00

236.00 240.00 113.00 84.00 379.00 125.00

199.00

8 Potassium (mg/kg)

3607.00

5797.00 5244.00 4794.00 4869.00 3622.00 9542.00

4608.00

9 Calcium (mg/kg)

1461.00

1654.00 1462.00 2376.00 1657.00 589.00 1620.00

665.00

10 Iron (mg/kg)

40.90

56.20 42.10 197.00 89.40 57.70 63.30

47.40

11 Magnesium (mg/kg)

635.00

1194.00 1135.00 1430.00 865.00 484.00 2636.00

577.00

12 Zinc (mg/kg)

34.30

53.20 44.30 31.30 48.70 44.30 31.40

51.90

13 Insoluble Dietary fiber (gm/100 gm)

9.60

5.70 0.00 12.80 8.00 8.60 0.00

5.90

14 Soluble Dietary fiber (gm/100 gm)

0.80

2.30 0.00 1.70 0.90 3.20 0.00

2.00

15 Total dietary fiber (gm/100 gm)

10.50

8.10 0.00 14.60 9.00 11.90 0.00

7.90

Source; Fuenmayor (2014)

The study on Rodica et al., is discover that the bee collected pollen and bee bread have a high nutritional value including bioactive compounds, which have a positive effect on human health [4]. These products are rich in proteins, simple sugars, essential amino acids and omega fatty acids. Beebread, that a product of bee collected pollen has become lately a product of high commercial value and a fair evaluation of chemical composition is needed to guarantee the quality.

Utilization and Handling Practices of Bee Pollen

The crude nutrients measurement in bee collected pollen and bee bread cannot accurately determine their nutritional and functional value. Consequently, the nutrients are encapsulated inside the hard to crack pollen grains that affect the digestibility and bioavailability the nutrients in the pollen. Moreover, according to Zuluaga et al., pollen is partially digested in human body on average about 60 percent of proteins in the pollen is digested, while the digestibility of protein in beebread is about 94.7 percent [26]. The digestibility and bioavailability of pollen is directly related to the morphological characteristics of the outer wall of the pollen [34].

The outer layer of the pollen is partly fractured during the natural fermentation and transformation process in beebread. Thus, makes beebread a better bioavailability than pollen and therefore, the functionally and energetically rich content of pollen can be assimilated and used easier by the human body (Mutsaers et al., 2005). The quality of bee pollen, in terms of nutrition, depends mainly on its digestibility and bioavailability.

According to Fan et al., pollen grain outer walls consist of two layers: the outermost (exine) and the inner surface (intine), thus layers are affect the bioavailability of nutrients in the pollen and hence, before consumption further softening process and treatment is important [3]. In order to increase the digestibility, pollen grains are crushed or dissolved in warm water and the pollen grains crack after 2-3 h, and leads to the release of nutrients. In addition, pollen may be mixed with many other food products, for example, with honey, yogurt, and jams [40]. Pollen shall need to chew thoroughly because in raw form of pollen only 10%-15% the nutrients are used however, the mechanical grinding process, improve the bioavailability of this product’s by 60-80% [42].

Based on the study of Aleksandar et al., pollen is recognized as an excellent dietary supplement for human nutrition [49]. Moreover, pollen as food supplement sources can be found in different forms on the market (granules, capsules, tablets, pellets, and powders). However, the digestibility of pollen’s nutrients is strongly affected by the presence of a pollen shell. The shells of the pollen grain can decrease the bioavailability of nutrients by 50% and more. Dried grains of pollen have a hard shell (intine and exine) that can significantly affect the penetration of the digestive enzymes into the pollen pellets. The hard shell can affect the biodegradability, bioavailability and absorption of the important nutrients. In order to increase the digestibility and the functionality, the pollen grains should be ground and dissolved in warm water, whereby the accessibility of nutrients increases to 60-80% [16].

Recently, due to the increased awareness of consumers the consumption of functional foods can improve their health and pollen began to be considered as a functional food and feed ingredient [16].

Moreover, a number of fermented pollen-based food products have been developed. Based on the study of adding bee collected pollen as food additives and supplementation can improve the food products and thus, significantly increased the content of sugars, proteins, ash, fibers, and polyphenols, and the antioxidant potential of the final products [60].

The thermal properties of pollen are very important, especially when pollen is used as a supplement in the products that require thermal treatment or roasting at higher temperatures may decompose the nutritional and functional constituents of pollen [60]. In recent years, bee pollen is considered to be one of the most bioactive products for human consumption. However, related to the construction of the chemical structure of pollen, it reduced the availability of adequate nutrients and bioactive compounds. Hence, before consumption, of bee pollen should be subject to the process of transformation [26].

According to Carlos et al., bee pollen has had a growth in consumption in recent years due to the recognition of its nutritional and bioactive potential. However, several reports have shown that the external structure of the grain limits the absorption of nutrients in the human gastrointestinal tract [61-63]. However, pollen grains structural modification could be achieved through fermentative processes, and favoring the release of compounds found in the pollen. Moreover, literature mentions that this natural modification improves the nutritional and bioactive characteristics of bee pollen [34]. The potassium, protein, dietary fiber and lipids levels in bee collected pollen indicated the possibility of using pollen as a dietary supplement. Moreover, further analysis focused on bioactive components and properties and characterizing the volatile fraction and sensory characteristics are recommended for fully characterizing Ethiopian bee pollens.

Conclusion and Recommendations

Conclusion

The quality of pollen is influenced by the harvesting techniques, technologies used, and post-harvest handling, drying and storage situations. Even though, some countries have national standard, there is no international standards that defining the compositional requirements of bee collected pollen. The chemical structure of pollen can reduced the bioavailability of adequate nutrients and bioactive compounds, in order to increase the digestibility and bioavailability pollen grains and therefore, further softening process and treatment is essentially important to crushed and dissolve the pollen grains. Compared to other food products, pollen and bee bread have a significant amount of biologically active nutrients that meet the human body needs to a good functioning of the immune system and resistance against illnesses, as well as supporting the healing processes.

Due to the small quantities that are consumed and required, pollen should be rather regarded as a supplement functional food. Application of bee collected pollen in the formulation of functional food products is in progress, and pollen’s addition to a food matrix generally improves the nutritional, functional, techno-functional, and sensory properties of the newly formulated food products. Having diversified natural vegetation cover that used as a pollen source and having a large bee colony population in Ethiopia, pollen production is not a widely commercialized product. Therefore, promoting and supporting pollen production, postharvest handling and quality standard development, and commercialization aspects shall be the priority area of intervention.

Recommendations

  • Bee collected pollen and bee bread are becoming a valuable and pronounced foods, however, further detailed studies on assimilation and bioavailability of the ingredients, health claims and applications shall be considerable areas of research.
  • Assessing the nutritional composition and bio-functional properties of pollens produced at different agro ecological area of Ethiopia shall be fundamentally important area of consideration.
  • Commercializing production and promoting the bio-functional properties and health benefits of pollen can be a considerable area of apiculture industry development intervention in Ethiopia.

References

  1. Srivastava P (2019) Status Report on Indian bee keeping and honey processing. J Multi sweet Group 2-6. Birks H, Birks H, Ammann B (2016) The fourth dimension of vegetation. J Science 354: 412-413. [crossref]
  2. Teng F, Soohyun P, Qian S, Xingyu Z, Qimin L, et al. (2020) Transformation of hard pollen into soft matter. J Nature Communications 11: 1-10.
  3. Rodica M, Mirela S, Alina V, Erkan T, Banu Y, et al. (2019) Bee Collected Pollen and Bee Bread: Bioactive Constituents and Health Benefits. J Antioxidents 8: 568-578. [crossref]
  4. Avni D, Hendriksma HP, Dag A, Uni Z, Shafir S (2014) Nutritional aspects of honey bee-collected pollen and constraints on colony development in the eastern Mediterranean. J Insect physiology 69: 65-73. [crossref]
  5. Bogdanov S (2015) Pollen: Production, Nutrition and Health: A Review. J American College of Nutrition 1-30.
  6. Sattler J, Melo D, Granato E, Araújo A, Freitas O, et al. (2015) Impact of origin on bioactive compounds and nutritional composition of bee pollen from Southern Brazil: A screening study. J Food Research International 77: 82-91.
  7. Melo A, Estevinho J, Sattler B, Souza A, Freitas O (2016) Effect of processing conditions on characteristics of dehydrated bee collected pollen and correlation between quality parameters. J Food Science and Technology 65: 808-815.
  8. Ares A, Valverde J, Bernal M, Nozal J, Bernal (2018) Extraction and determination of bioactive compounds from bee pollen. J Pharmaceutical and Biomedical Analysis 147: 110-124. [crossref]
  9. Anderson K, Carroll M, Sheehan T, Mott B, Maes P, et al. (2014) Hive-stored pollen of honey bees: many lines of evidence are consistent with pollen preservation, not nutrient conversion. Mol Ecol 23: 5904-5917. [crossref]
  10. Pierre L, Vaughn B, James D, Zachary Y, Huang J, et al. (2019) Seasonal variation of pollen collected by honey bees (Apis mellifera) in developed areas across four regions in the United States. J Plose One 14: 1-24. [crossref]
  11. Dhananjay V, Snehal K, Dhananjay M (2019) Solid State Fermentation of Bee-Collected Pollen. J Current Microbiology and Applied Sciences 8: 1557-1563.
  12. Barene I, Daberte I, Siksna S (2015) Investigation of bee bread and development of its dosage forms. J Medicine 21: 16-22.
  13. Tomás A, Falcão S, Russo P, Vilas M (2017) Potentialities of beebread as a food supplement and source of nutraceuticals: Botanical origin, nutritional composition and antioxidant activity. J Apic Res 56: 219-230.
  14. Habryka C, Kruczek M, Drygas B (2016) Bee products used in apitherapy. World Scientific News 48: 254-258.
  15. Kieliszek M, Piwowarek K, Kot A, Chlebowska A (2018) Pollen and bee bread as new health-oriented products; A review. J Trends in Food Science and Technology 71: 170-180.
  16. Deveza M, Keller K, Lorenzon M, Nunes L, Sales É, et al. (2015) Mycotoxicological and palynological profiles of commercial brands of dried bee pollen. Brazilian. J Microbiology 46: 1171-1176. [crossref]
  17. Kaškonienė V, Kaškonas P, Maruška A (2015) Volatile compounds composition and antioxidant activity of bee pollen collected in Lithuania. J Chemical Papers 69: 291-299.
  18. Fuenmayor B, Zuluaga D, Díaz M, María C, Saverio M (2014) Evaluation of the physicochemical and functional properties of Colombian bee pollen. J MVZ Córdoba 19: 4003-4014.
  19. Denisow M (2016) Influence of the commercial processing and floral origin on bioactive and nutritional properties of honey bee-collected pollen. J Sci Food Agric 96: 4303-4309.
  20. Canale A, Benelli G, Castagna A, Sgherri C, Poli P, et al. (2016) Microwave-assisted drying for the conservation of honeybee pollen. J Materials 9: 363.
  21. Ranieri A, Benelli G, Castagna A, Sgherri C, Signorini F, et al. (2019) Freeze-drying duration influences the amino acid and rutin content in honeybee-collected chestnut pollen. Saudi J Biol Sci 26: 252-255. [crossref]
  22. Carlos B, Carlos D, Consuelo M, Marta C, María C, et al. (2014) Evaluation of the physicochemical and functional properties of Colombian bee pollen. J Revista MVZ Córdoba 19: 4003-4014.
  23. Vaida A, Vilma K, Paulius K, Karolina B, Audrius M (2019) Comparison of Physicochemical Properties of Bee Pollen with Other Bee Products. J Biomolecules 9: 819. [crossref]
  24. Parvanov P, Dinko D (2017) Proposals for desiccated bee pollen production and labeling. J Nutr Hum Health 1: 13-16.
  25. Zuluaga C, Serrato J, Quicazan M (2015) Chemical, nutritional and bioactive characterization of colombian beebread. J Chemical Engineering Transactions 43: 175-180.
  26. Fernandes P, Serrão J (2000) Nutritive value and apparent digestibility of bee-collected and bee-stored pollen in the stingless bee. J Apidologie 31: 39-45.
  27. Adriana U, Liviu Al, Daniel S, Carmen I (2017) Chemical Composition and Biological Activities of Beebread Review. J Bulletin of University of Agricultural Sciences and Veterinary Medicine 74: 1-9.
  28. Markiewicz R, Naliwajko SK, Bartosiuk E, Moskwa J, Isidorov V, et al. (2013) Chemical composition and antioxidant activity of beebread, and its influence on the glioblastoma cell line (U87MG). J Apiculture Science 57: 147-157.
  29. Campos M, Olena L, Anjos O (2016) Chemical composition of bee pollen. Chemistry, biology and potential applications of honeybee plant-derived products. Bentham eBooks 67-88.
  30. Anjos O, Santos A, Dias T, Estevinho L (2017) Application of FTIR-ATR spectroscopy on the bee pollen characterization. J of Apicultural Research 56: 210-218.
  31. Leila F, Daiane P, Bianca R, Ligia B, Almeida M, Solange T (2019) Fortification of beef burger with the addition of bee pollen from Apis J Food and Agriculture 31: 895-901.
  32. GENÇAY Ç, Nezahat P (2017) Protein Analysis of Anzer Bee Pollen by Bradford Method. J Food Chemistry 17: 21-32.
  33. Bogdanov S (2011) The Bee Pollen Book. Muehle thurnen, Switzerland: J Bee Product Science 1-14.
  34. Estevinho M, Afonso S (2011) Antifungal effect of lavender honey against Candida albicans, Candida krusei and Cryptococcus neoformans. J Food Science and Technology 48: 640-643. [crossref]
  35. Antonella C, Giovanni B, Giuseppe C, Cristina S, Francesca S, et al. (2020) Drying Techniques and Storage: Do They Affect the Nutritional Value of Bee-Collected Pollen. J Molecules 25: 1-15. [crossref]
  36. Maria G, Campos Bogdanov S, Chirstian Frigerio (2010).What is the future of Bee-Pollen. J Api-Product and Api-Medical Science 2: 131-144.
  37. Marek K, Kamil P, Anna M, KotS, Anna C (2018) Pollen and bee bread as new health-oriented products: A review. J Trends in Food Science & Technology 71: 170-180.
  38. Melo A, Estevinho M, Almeida L (2015) A diagnosis of the microbiological quality of dehydrated beepollen produced in Brazil. J Applied Microbiology 61: 477-483. [crossref]
  39. Bobis O, Marghitas I, Dezmirean D, Morar O, Bonta V, et al. (2010) Quality Parameters and Nutritional Value of Different Commercial Bee Products. J Sci Biotechnol 67: 1-2.
  40. Margaoan R, Strant M, Varadi A, Topal E, Yücel B, et al. (2019) Bee Collected Pollen and Bee Bread: Bioactive Constituents and Health Benefits. J Antioxidants 8: 568.
  41. Komosinska K, Olczyk P, Kaźmierczak J, Mencner L, Olczyk K (2015) Bee pollen Chemical composition and therapeutic application. Evidence based Complementary and Alternative Medicine J Hindawi 2015: 297425. [crossref]
  42. Koroglu A (2018) Bee pollen and its pharmacological properties. J Bio-molecules 27: 93-97.
  43. Ivanisova E, Kacaniova M, Francakova H, Petrova J, Hutkova J, et al. (2015) Bee bread perspective source of bioactive compounds for future Scientific Journal for Food Industry 9: 592-598.
  44. Afra M (2018) Bee pollen properties: uses and potential pharmacological applications-a review. J Analytical and Pharmaceutical Research 7: 513-515.
  45. Nemat K, Yadollah S, Mahdi M (2009) Chronic inflammation and oxidative stress as a major cause of age-related diseases and cancer. J National Library of Medicine 3: 73-80. [crossref]
  46. Anna R, Agata K, Robert K., Krzysztof J, Maciej K, et al. (2018) Protective Effect of Polyphenol-Rich Extract from Bee Pollen in a High-Fat Diet. J Library of medicine 23: 805. [crossref]
  47. Nanias P, Sandra R, Alfredo T, Xesus F, Leticia M (2014) Biological activities of commercial bee pollens: antimicrobial, antimutagenic, antioxidant and anti-inflammatory. J Food Chemistry Toxicol 63: 3-9. [crossref]
  48. Aleksandar Ž, Danijel D, Miroljub B, Mohammad A, Mirjana B (2020) The Application of Pollen as a Functional Food and Feed Ingredient;-The Present and Perspectives. J Biomolecules 10: 2-36. [crossref]
  49. Mirjana M, Jelena T, Irena V, Branko Š, Dušanka M (2019) Phenolic Composition Influences the Health-Promoting Potential of Bee-Pollen. J Bio-molecules 9: 783. [crossref]
  50. Avsar C (2016) Phenolic Composition, Antimicrobial and Antioxidant Activity of Castanea sativa Mill. Pollen Grains from Black Sea Region of Turkey. J International Food Research 23: 1711-1716.
  51. Arruda V, Pereira A Estevinho L, Almeida L (2013) Presence and stability of B complex vitamins in bee pollen using different storage conditions. J Food Chem Toxicol 51: 143-148. [crossref]
  52. Di Cagno R, Filannino P, Cantatore V, Gobbetti M (2019) Novel solid-state fermentation of bee-collected pollen emulating the natural fermentation process of bee bread. J Food Microbiol 82: 218-230.
  53. Urcan A Marghitas L, Dezmirean D, Bobis O, Bonta V, Mure C, et al. (2017) Chemical Composition and Biological Activities of Beebread Review. J Sci Biotechnol 7: 4-6.
  54. Velásquez P, Rodríguez K, Retamal M, Giordano A, Valenzuela L, et al. (2017) Relation between composition, antioxidant and antibacterial activities and botanical origin of multifloral bee pollen. J Appl Bot Food Qual 90: 306-314.
  55. Araújo S, Chambó E, Costa M, Cavalcante S, Silva D, et al. (2017) Chemical Composition and Biological Activities of Mono and Hetero floral Bee Pollen of Different Geographical Origins. J National Library Medicine 18: 921. [crossref]
  56. Silva T, Natividade C, Silva F (2014) Identification of sugar, amino acids and minerals from the Pollen of jandaıra stingless bees (Melipona subnitida). J Food and Nutrition Science 5: 1015-1021.
  57. Dominguez D, Bohoyo GD, Herna MT, Gonzalez D (2011) Influence of the commercial processing and floral origin on bioactive and nutritional properties of honey bee-collected pollen. J Food Science and Technology 46: 2204-2211.
  58. Admassu k, Ensermu S, Teshome G, Peter B, Lulsegde M (2017) Proximate composition and antioxidant power of bee collected pollen from moist Afromontan forests in southwest Ethiopia. J Agricultural Science Research 7: 83-95.
  59. Krystyjan M, Gumul D, Ziobro R, Korus A (2015) The fortification of biscuits with bee pollen and its effect on physicochemical and antioxidant properties in biscuits. J Food Sci Technol 63: 640-646.
  60. Carlos M, Zuluaga D, Marta Q (2019) Effect of fermentation on structural characteristics and bioactive compounds of bee-pollen based food. J Apic Sci 63: 1-14.
  61. Bogdanov S (2016) Pollen Collection, Harvest, Composition, Quality The Bee Pollen Book 1-14.
  62. Mărgăoan L, Mărghitas D, Dezmirean C, Mihai O (2010) Bee Collected Pollen General Aspects and Chemical Composition, Bulletin USAMV. Animal Science and Biotechnologies 67: 254-259.
Application of a Device in Times of Pandemic: Safety for the Patient and Medical Personnel

DOI: 10.31038/IJAS.2021221

Introduction

In Colombia, 500,000 COVID-19 cases and 15,800 deaths have been reported, among which health personnel cases and deaths amount to 5,619, and 43 respectively [1]. Age is an independent risk factor for suffering from a severe disease, with the ages of 65 and over representing the highest risk. In the US, individuals over the age of 65 represent 45% of hospital admissions, 53% of intensive care unit admissions, and 80% of fatalities [2]. In Colombia, the installed capacity of beds in the ICU for the care of COVID-19 increased by 36%, most of them in mechanical ventilation. The increase in life expectancy and the decrease in the birth rate have led to a significant increase in the average age of the population, where probably a third of geriatric patients will undergo a surgical procedure [3]. From the anesthetic point of view, this has implications in airway management due to an increase in the difficulty of positive pressure ventilation.

On the other hand, the highest viral load of SARS-CoV-2 has been reported in sputum and secretions of the upper respiratory tract, especially nasal [4]. However, tracheal intubation is considered a high-risk procedure for health personnel due to the risk of exposure by aerosolization [5]. For this reason, in airway management, the most experienced professional should be chosen, simulation exercises of personal protective equipment protocols implemented, adequate spaces to manage the airway allocated, airway management equipment for patients diagnosed with or suspected of having COVID-19 made available, necessary or potentially necessary medications guaranteed, airway management guidelines in times of pandemic developed further, and the situations that lead to potential aerosolization avoided or reduced.

Device Description

In 2017, the authors first published the description of a new device for the ventilation of edentulous patients called NIPARA, (NI) Niño, (PA) Pauwels, (R) Raffan, and (A) Arango, demonstrating a significant improvement in the coupling of the face mask by an increase in positive pressure ventilation and a decrease in the loss of escape volume between the mask and the patient, which in theory reduces the potential aerosolization of this intervention.

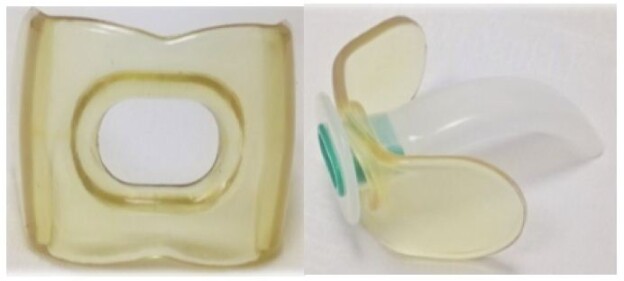
The device consists of an intraoral extended U-shaped plastic plate, latex-free plastic materials (4.6 inches x 1.4 inches) with right and left side extensions. In the midline, it has a mating surface on both the top and bottom that engages the labial frenulum allowing intraoral retention, and the lateral extensions are placed between the gums and cheeks. The device is inserted using the same insertion technique as conventional oropharyngeal cannulas inserted into the device’s central hole. Once the NIPARA is inserted, the face mask is used as usual by resting it on the patient’s face for manual positive pressure ventilation before the intubation of the patient (Figure 1) [6].

fig 1

Figure 1: NIPARA device.

Discussion

Ventilation with a face mask is a procedure that produces a high degree of aerosolization, and all the strategies that decrease it, such as two-hand ventilation and two operators providing an adequate seal to the face or rapid sequence induction, are indicated in the time of induction of anesthesia. Assessment of the airway’s difficulty in Covid-19 patients can be carried out with the MACOCHA scale before the procedures [7].

This article mainly focuses on the face mask ventilation maneuver in the emergency, resuscitation, surgery, or intensive care setting, where patient and staff protection is essential. Therefore, according to the principles of the Safe Airway Society for the management of the airways and endotracheal intubation for the group of adult patients with COVID-19, it is crucial to follow the rapid sequence intubation protocol, to decrease long periods of high-flow oxygenation or non-invasive ventilation because of its potential aerosol generation. Due to the proximity of the medical staff to the patient’s airway, it is essential to minimize the risk of aerosolization generation with these procedures [8]. Among the predictors of difficult ventilation are edentulous patients, since it is difficult to obtain an adequate seal between the mask and the patient’s face due to the loss of vertical dimension, allowing air leakage [9].

In the first semester of 2020, during the Covid-19 Pandemic, 4,951 patients have been operated on at Foundation Santa Fe de Bogotá University Hospital, Bogotá, Colombia.

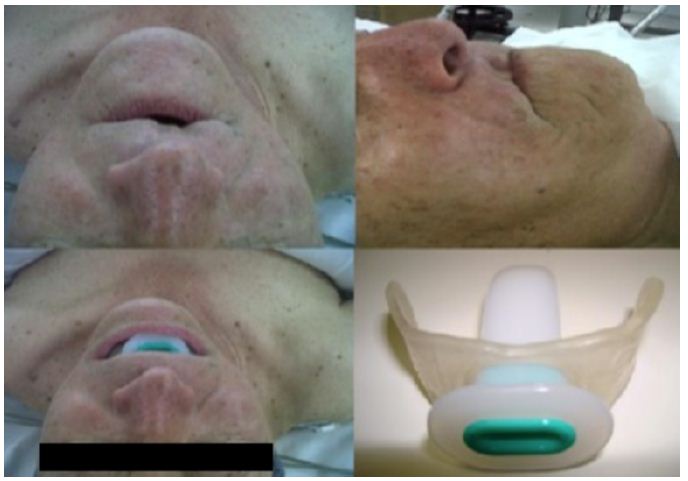
Near to 27% were (a group of 1,347 patients) over 60 years of age, for which the possibility of being edentulous according to the National Study of Oral Health of Colombia is approximately 33% which is probably equivalent to 440 patients that required some support of the airway and surely to be ventilated with the safety protocols. Thus, by restoring the vertical facial dimension of edentulous patients with NIPARA, a better adaptation of the facial mask is achieved and lower resistance to ventilation, thus reducing the possibility of particle aerosolization (Figure 2) [10].

fig 2

Figure 2: A patient using and not using NIPARA before ventilation.

Conclusion

This article does not intend to change the safety protocols already established or indicate mask ventilation in all patients. However, if necessary, the NIPARA can be a low-cost device, a useful, easy-to-use, and safe tool taking into account that the population older than 65 represents a high percentage of patients who go to hospitals and require ventilation either in endoscopy procedures, surgery, intensive care unit or in an emergency room. Additionally, they present total edentulism, making it difficult to seal between the marking and the patient’s face, generating an aerosol outlet with a high risk of contamination.

References

  1. https://covid19.minsalud.gov.co/
  2. Enfermedad de Coronavirus 2019 (Covid-19). BMJ. Best Practice, Agosto 10, 2020.
  3. Nazar C, Zamora HM, Fuentes HR, Lema FG (2015) Paciente adulto mayor y cirugía no cardíaca: ¿qué debemos saber? Rev Chil Cir 67: 309-317.
  4. Wang W, Xu Y, Gao R, Lu R, Han K, et al. (2020) Detection of SARS-CoV-2 in Different Types of Clinical Specimens. JAMA 323: 1843-1844. [crossref]
  5. Wu Z, McGoogan JM (2020) Characteristics of and Important Lessons from the Coronavirus Disease 2019 (COVID-19) Outbreak in China: Summary of a Report of 72 314 Cases from the Chinese Center for Disease Control and Prevention. JAMA 323: 1239-1242. [crossref]
  6. Niño MC, Pauwels A, Raffan F, Arango E, Romero DJ, et al. (2017) Efficacy of a new device to optimize positive pressure ventilation via face mask in edentulous patients: a randomized trial. Expert Rev Med Devices 14: 315-320. [crossref]
  7. Joint statement: Supporting doctors in the event of a Covid-19 epidemic in the UK. 2020. Chief Medical Officers of Wales, Scotland, Northern Ireland, England, National Medical Director NHSE/I, General Medical Council.
  8. Brewster DJ, Chrimes N, Do TB, Fraser K, Groombridge CJ, et al. (2020) Consensus statement: Safe Airway Society principles of airway management and tracheal intubation specific to the COVID-19 adult patient group. Med J Aust 212: 472-481. [crossref]
  9. Racine SX, Solis A, Hamou NA, Letoumelin P, Hepner DL, et al. (2010) Face mask ventilation in edentulous patients: a comparison of mandibular groove and lower lip placement. Anesthesiology 112: 1190-1193. [crossref]
  10. Estudio Nacional de Salud Bucal IV, Ministerio de Salud y Protección Social 2013-2014.

How Reliable is Galectin-3 Immunohistochemical Expression for Differentiation between Metastatic and Benign Thyroid Neoplasms?

DOI: 10.31038/EDMJ.2021532

Abstract

Background: Galectin-3 has been reported to have substantial accuracy in detection or excluding malignant nodules with prior indeterminate FNAC and per operative findings. Keeping this fact in mind, Thus, Galectin-3 can have a pivotal role in separating benign from the malignant thyroid neoplasms.

We aim to determine the frequency and intensity of Galectin-3 immunohistochemical expression studied in the benign and malignant thyroid neoplasms confirmed on histopathology.

Materials and Methods: This descriptive, observational, cross-sectional study was conducted from 5th November 2017 to 4th May 2018 in the Department of Histopathology, Foundation University Medical College, Islamabad Campus & Department of Surgery, Fauji Foundation Hospital, Rawalpindi.

We studied 78 thyroid specimens diagnosed with thyroid neoplasms on histopathology. Out of these 39 were benign cases (follicular adenoma and hurthle cell adenoma) and 39 were malignant cases (papillary thyroid carcinomas, follicular carcinoma, medullary carcinoma and poorly differentiated carcinoma). Each specimen was examined grossly and microscopically and checked for immunohistochemical staining pattern of Galectin-3 under the microscope.

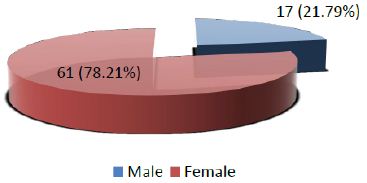
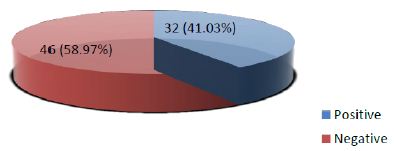
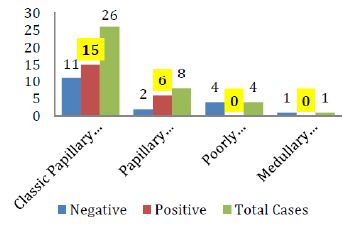
Results: Age range in this study was from 15 to 65 years with mean age of 44.97 ± 10.78 years. Out of these 78 patients, 17 (21.79%) were male and 61 (78.21%) were female with male to female ratio of 1:3.6. Frequency of positive Galectin-3 immuno histochemical expression among thyroid neoplasms was found in 32 (41.03%) cases with Galectin-3 showing positive staining in 21 (53.85%) of all malignant and 11 (28.21%) of all benign cases. Among the malignant neoplasms,  positivity was seen most frequently in papillary thyroid carcinomas as compared to the other malignancies.

Conclusion: This study concluded that positive Galectin-3 immunohistochemical expression is seen both in benign and malignant thyroid neoplasm, but its expression is more in malignant thyroid neoplasms (53.85%) as compare to the benign lesions (28.21%). Therefore, we recommend that Galectin-3 immunohistochemical marker cannot be used alone for the routine diagnosis of malignant thyroid lesions as it has shown less sensitivity and specificity. Moreover it also has shown no significant role in differentiating between the benign and the malignant thyroid neoplasms.

Keywords

neoplasm, marker, malignant, benign, expression

Introduction

Thyroid gland is an important part of the endocrine system located at the base of the neck. It is chiefly composed of two types of cells, follicular and parafollicular cells. The follicular cells make thyroxine, which has important functional impacts on various systems and general metabolism. The parafollicular cells, also known as C cells arise from the neural crest and are involved in the calcitonin production, which has vital role in maintaining calcium homeostasis [1].

Thyroid neoplasms including both benign and malignant lesions are common entities encountered in daily clinical practice. Most of the lesions (95%) arise from the follicular epithelial cells of the thyroid gland [2].

Thyroid cancer is the most common among the endocrine tumors and its incidence has been increasing in the last three decades [3]. An estimated mortality rate of thyroid cancer is 0.5 to 10 cases per 100,000. The annual male and female percentage is 6.3% and 7.1% for white population, 4.3% and 8.4% for blacks and for Asian population patients it is 3.4% and 6.4% respectively.3These tumors can clinically present as a solitary nodule along with the normal thyroid gland or as a dominant nodule in the background of a multinodular goiter. 5% of the solitary thyroid nodules are found to be neoplastic [4].

In Pakistan, thyroid neoplasms are common especially in the northern areas, which are mainly attributable to the iodine deficiency or excess. Thyroid cancer accounts for 1.2% of all the malignancies diagnosed in our country with the papillary thyroid carcinoma being most common. The female to male ratio in Pakistan is  reported as 2.2:1 [5].

Patients can present with both the features of hyper and hypothyroidism in both benign and malignant lesion. This makes it clinically difficult to diagnose the exact underlying cause. Here comes the role of histopathology, which can correctly diagnose the lesion, but there are some neoplasms that have very confusing morphological details and these cannot be exactly categorized into benign or malignant, only on the basis of histopathology. This scenario is mostly seen in the follicular and the Hurthle cell neoplasms. The gross appearance and the microscopic details are perplexing for a pathologist. Moreover, the cytological details are also much overlapping in various benign versus malignant lesions [2].

The final diagnosis of the lesion being benign and malignant has profound effects on the clinical outcome and prognosis of the patient. Several articles have reported the significance of immnohistochemical markers to solve this problem. Galectin-3, p63 and Ki67 have been reported quite accurate to detect or exclude malignancy in nodules with prior indeterminate FNAC and per operative findings [6].

In this study, role of Galectin-3 will be quantified to differentiate and classify the thyroid lesions into benign and malignant categories. Galectin-3 belongs to the family of lectins. Galectin-3 is synthesized in both the nucleus and cytoplasm, and also expressed at the cell surface. It is also found extracellularly in the general circulation. Galectin-3 specifically binds to the beta galactoside containing intracellular, extracellular and cell surface associated glycol conjugates so it is over expressed in oncogenic pathology of thyroid [7-8].

In Pakistan, limited data is available regarding the role of galectin-3 as a diagnostic tool to differentiate malignant thyroid neoplasms from benign lesions. So, this study can have beneficial effects in the diagnostics and further treatment of such lesions.

Materials and Methods

There was a total of 78 thyroid specimens included in this study (39 benign and 39 malignant neoplasms). All of these patients were operated at the Department of Surgery, Fauji Foundation Hospital Rawalpindi during a period of six months from 5th November 2017 to 4th May 2018. The specimens were processed in the department of Histopathology, Foundation University Medical College Islamabad. The benign conditions included Follicular adenoma and Hurthle cell adenoma. The malignant conditions included Papillary thyroid carcinoma (both classic type and follicular variant), Follicular thyroid carcinoma, Medullary thyroid carcinoma and poorly differentiated carcinoma.

The hospital ethical committee granted the approval for data collection.  The data included patient’s demographic details, clinical presentation, previous laboratory test record and clinical suspicion. The specimens were examined both grossly and microscopically in the laboratory. The thyroid specimens were fixed in 10% formalin and were sliced properly. The representative sections were processed in the tissue processor (SAKURA TISSUE TEK-R TEC5 MODEL 220-240) for the paraffin sectioning. After this step, 4-5µm thick sections were cut using rotatory microtome (SAKURA ACCU-CUT MODEL SRM 200 CW). Hematoxylin and eosin stain (H&E) was used for staining the slides and get them ready to see under the microscope.

For the immunohistochemistry, representative histological sections of the thyroid neoplasm were used. The sections were deparaffinised by xylene and then were rehydrated by ethanol. Tri-sodium citrate buffer (pH 6.0 to 6.2) was used for the antigen retrieval. When the slides came back to room temperature, endogenous peroxidase activity was blocked by 0.6% H2O2. After this step lyophilized mouse monoclonal Galectin-3 antibody in the dilution of 1:100 was applied for an hour. Washing was done with tris- buffered saline (TBS). Then for 20 minutes super enhancer was added. Polymer horseradish peroxidase (HRP) was applied for 30 minutes as a secondary antibody and washing was done again with TBS. Subsequently Diamine Benzidine (DAB) chromogen was applied for 5 minutes. Mayer’s Haematoxylin was used for counter staining followed by clearing and mounting. Positive and negative controls were also applied.

Two consultant histopathologists examined the H&E stain and immunohistochemical marker (Galectin-3) under the Olympus light microscope. The sections with the best staining were selected for examination and reported likewise. Morphology and staining was noted and grading of Galectin-3 was done by Weber KB et al and Hermann ME et al guidelines. The intensity and distribution of Galectin-3 staining (cytoplasmic) on a scale of 0 to 3 was done as follows:

0 No staining

1+ Weak/slight staining

2+ Moderate staining

3+ Intense staining

The proportion of stained cells was interpreted as;

1+ < 5% of cells

2+ 5% to 50% of cells

3+ >50% of cells

The lesions with the particular cytoplasmic staining of more than 5% ofthe tumor cells was taken as positive for Galectin-3 regardless of its intensity.

Results

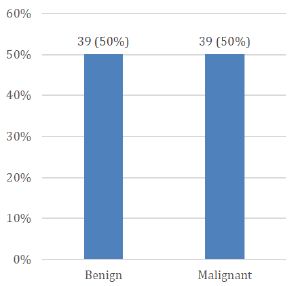
Age range in this study was from 15 to 65 years with mean age of 44.97 ± 10.78 years as shown in Table- I. Out of these 78 patients, 61 (78.21%) were female and 17 (21.79%) were male with female to male ratio of 3.6:1 (Figure I). On the basis of histopathological diagnosis half (39) cases belonged to benign neoplasms and other half (39) were diagnosed as malignant neoplasms as shown in Figure II.

Table 1: Age distribution of patients (n=78), having Mean ± SD = 44.97 ± 10.78 years.

Age (in years)

No. of Patients %age
15-40 27

34.62

41-65

51 65.38
Total 78

100.0

fig 1

Figure 1: Distribution of patients according to Gender (n=78)

fig 2

Figure 2: Distribution of patients according to histopathological features (n=78)

Frequency of positive Galectin-3 immunohistochemical expression among thyroid neoplasms was found in 32 out of 78 (41.03%) cases while 46 out of total 78 (58.97%) were showing negative galectin-3 staining (Figure III).

fig 3

Figure 3: Frequency of Galectin-3 immunohistochemical expression among thyroid neoplasms confirmed on histopathology (n=78)

A detailed look at the further breakdown of galectin-3 staining among benign neoplasms reveal that 11(28.1%) among 39 benign cases were positive for the stain. For the malignant neoplasms, total 21(53.85%) among 39 cases were positive. On the other side 28(71.79%) benign cases and 18(46.15%) malignant cases showed negative galectin-3 staining. The p-value calculated was 0.021 which is not significant (Table- II)

Table 2: Stratification of Galectin-3 immunohistochemical expression among benign and malignant thyroid neoplasms


Galectin-3 immunohistochemical expression


p-value

Positive

Negative

Benign

11 (28.21%) 28 (71.79%)  

0.021

Malignant 21 (53.85%)

18 (46.15%)

The Stratification of Galectin-3 immunohistochemical expression with respect to age groups showed total 27 cases within the age range of 115- 40 years out of which 10 cases were positive. Total 51 cases belonged to the age range of 41-65 years out of which 22 showed positive galectin-3 staining. The p-value calculated was 0.602 which is again insignificant (Table- III)

Table 3: Stratification of Galectin-3 immunohistochemical expression with respect to age groups


Galectin-3 immunohistochemical expression


p-value

Positive

Negative

15-40 years

10 17  

0.602

41-65 years 22

29

Similarly Table IV shows the breakdown of the cases according to gender. Total 8 out of 17 cases among male patients were positive for Galectin-3 and 24 out of 61 cases of female patients were showing the positive staining. The p-value calculated was 0.567 which is again insignificant.

Table 4: Stratification of Galectin-3 immunohistochemical expression with respect to gender

Galectin-3 immunohistochemical expression


p-value

Positive

Negative

Male

08 09 0.567
Female 24

37

The breakdown of Galectin-3 positivity in the various histological types of malignant and benign thyroid neoplasms is also shown in figure IV & V respectively.

fig 4

Figure 4: Galectin-3 staining in various histological types of Thyroid carcinomas

fig 5

Figure 5: Galectin-3 staining in various histological types of Thyroid adenomas

Discussion

Immunohistochemical markers have been extensively investigated for their potential diagnostic and prognostic utility in different thyroid tumors. Among these, they have deduced Galectin-3 to be a promising marker. Galectin-3 belongs to lectin family [9]. And a constellation of other normal tissues and tumors masses express Galectin-3 [10]. An intense nuclear localization of galectin-3 in tumors is seen in malignant transformation of thyroid tissue [11]. Research studies suggest Galectin-3 expression may serve as a potential diagnostic and prognostic marker of some cancers [12]. However, galectin-3 has not been established as a  universal and specific marker of thyroid neoplasia. Yet it can serve as a parameter in diagnostic approach for these tumors and for possible potential therapeutic target [13-16].

In 2015 a study was conducted in India regarding the staining pattern of Galectin-3 in thyroid neoplasms. The results showed 86% sensitivity and 85% specificity, with Galectin-3 showing positive staining in 87% of all malignant and 15% of all benign cases [2] In 2016, another study was conducted in Italy to check the diagnostic accuracy of the various immunohistochemical stains and they found galectin-3 to be 84.2% sensitive and 94.5% specific in detecting the thyroid neoplasms [7].

In contrast, our study shows less frequency of positive Galectin-3 immunohistochemical expression among thyroid neoplasms i.e. total 32 (41.03%) cases with Galectin-3 showing positive staining in 53.85% of all malignant and 28.21% of all benign cases. In 2002 a study was conducted regarding the staining pattern of Galectin-3 in thyroid neoplasms. The results showed high frequency of staining in papillary thyroid carcinomas only and no significant staining in the other type of carcinomas. Moreover, it also showed positive results in follicular adenomas which made them conclude that galectin-3 is not a sensitive marker if used alone [8] Our study also shows the same results.

A systematic review and meta-analysis on galectin-3 as a biomarker found that it may be a potentially useful immuno-marker to distinguish between patients with papillary thyroid carcinoma (PTC) and patients without PTC. In addition, lymph node metastasis is more frequently seen in PTC patients with positive expression of galectin-3 [17]. Our study also gives us the result that although galectin-3 is sensitive for detecting papillary thyroid carcinomas but it is not much sensitive in detecting other carcinomas from benign lesions (adenomas) as shown in figures IV & V.

Galectin-3, HBME-1, and cytokeratin-19 may be helpful in diagnosis of malignant thyroid tumors as evidenced by a study, although the expression of these markers may be seen in benign lesions as well. However, cytokeratin-19 is investigated for its diagnostic prowess. It was found that the marker and its combinations with other markers have higher sensitivities in accurate diagnosis of papillary carcinoma than the other combinations. But these immunohistochemical markers have limited role in differentiation between benign and malignant lesions [18].

Another important point which was noted in this study was that the carcinomas showing positive galectin-3 gave mostly focal positivity rather then the diffuse strong positivity in comparison to the results of the study done by Manivannan et al [18] . That study, which was done in 2012, demonstrated that galectin-3 staining pattern is significant in differentiating benign from malignant follicular neoplasms as well as follicular variant of papillary thyroid carcinoma. Diffuse positivity for galectin-3 was associated with malignant thyroid follicular neoplasms while focal weak positivity favours adenomas. On the other hand, a previous study have demonstrated that there was no marked difference in the staining intensity for intra cytoplasmatic or intranuclear expression of galectin-3 in benign and malignant thyroid neoplasms [19].

Thin-Prep fine needle aspiration cytology  showing increased expression levels of galectin-3 were seen with cellular hyperproliferation, hypertrophy, and pathophysiological situations associated with adenomas and thyroid carcinomas [20-21]. A comparison of glypican-3 (a member of the glypican family of heparan-sulfate proteoglycans bound to the plasma membrane) with galectin-3 demonstrated that galectin-3 had higher sensitivity in diagnosing thyroid carcinoma; however, specificity is low for differentiating follicular-patterned neoplasm [22]. These markers have also been investigated preoperatively and postoperatively, the preoperative serum galectin-3 level showed potential diagnostic value, as it was significantly higher in the cancer patients than in the control subjects (p < 0.05). [23]

Galectin-3 is also used in combination with other biomarkers for a differential diagnosis of thyroid lesions. The most commonly combined biomarkers are Hector Battifora mesothelial epitope-1 (HBME-1) and cytokeratin-19 [24-27]. However galectin-3 may not be used as single discriminators between follicular thyroid adenoma and carcinoma [24-27].  Some studies show that galectin-3 and HBME-1 have an excellent sensitivity and specificity for malignant thyroid lesions (100 and 89.1%, respectively) [26]. Despite core needle biopsies leading to the diagnosis of the majority of thyroid nodules, the accuracy is increased by also observing the galectin-3, cytokeratin-19 and HBME-1 panels, indicating their additional diagnostic value when combined with routine histology and not when used alone [24-27].  It was also reported that galectin 3, cluster of differentiation (CD) and, to an extent, HBME-1, are useful immunocytochemical parameters with the potential to support the fine needle aspiration cytology diagnosis of PTC, particularly in situations where the differential diagnoses is complicated [28].

Studies have noted variable Galectin-3 expression in poorly differentiated thyroid cancers also [29]. However, in majority of cases (75% to 100% of reported cases) of anaplastic thyroid carcinoma, Galectin-3 positivity was identified suggesting that differentiated thyroid carcinoma can progress or undergo anaplastic transformation [26,29]. In the present study and study by Herrmann et al., small number of cases of MTC and poorly differentiated carcinoma are reported with inconsistent Galectin-3 expression, making diagnostic application of Galectin-3 in these rare histological subgroups unlikely [30].

Zhu et al. reported several markers expression like HBME-1, CK-19, Galectin-3, and RET in several papillary thyroid carcinoma. The expression was found to be higher in papillary thyroid carcinoma as compared to benign neoplasia. However, they did not report any of these as specific markers for papillary thyroid carcinoma [31].

Conclusion

Galectin-3 immunohistochemical expression is found in the cases of both benign thyroid tumors and malignant neoplasms although more  commonly seen in malignant ones. So, it cannot be used alone for the routine diagnosis of malignant thyroid lesions as it shows less sensitivity and specificity. It also has expressed limited role in differentiating between the benign and the malignant thyroid neoplasms.

References

  1. Braverman LE, Cooper D. (2012) Werner & Ingbar’s The Thyroid: A Fundamental and Clinical Text. 10th Philadelphia: Lippincott Williams & Wilkins. p. 10.
  2. Sumana BS, ShaShidhar S, Shivarudrappa AS, (2015) Galectin-3 Immunohistochemical Expression in Thyroid Neoplasms. Journal of Clinical and Diagnostic Research 9:EC07. [crossref]
  3. Pellegriti G, Frasca F, Regalbuto C, Squatrito S, Vigneri R. (2013) Worldwide Increasing Incidence of Thyroid Cancer: Update on Epidemiology and Risk Factors. Journal of Cancer Epidemiology. [crossref]
  4. Dwivedi SS, Khandeparkar SG, Joshi AR, Kulkarni MM, Bhayekar P, Jadhav A, et al. (2016) Study of Immunohistochemical Markers (CK-19, CD-56, Ki-67, p53) in Differentiating Benign and Malignant Solitary Thyroid Nodules with Special Reference to Papillary Thyroid Carcinomas. Journal of Clinical and Diagnostic Research 10:EC14-9. [crossref]
  5. Asif F, Ahmad MR, Majid A. (2015) Risk Factors for Thyroid Cancer in Females Using a Logit Model in Lahore, Pakistan. Asian Pacific Journal of Cancer Prevention 16:6243-7. [crossref]
  6. Fortuna-Costa A, Gomes AM, Kozlowski EO, Stelling MP, Pavão MS. (2014) Extracellular Galectin-3 in Tumor Progression and Metastasis. FrontOncol 4:138. [crossref]
  7. Trimboli P, Guidobaldi L, Amendola S, Nasrollah N, Romanelli F, Attanasio D, et al. (2016) Galectin-3 and HBME-1 Improve the Accuracy of Core Biopsy in Indeterminate Thyroid Nodules. Endocrine 52:39-45. [crossref]
  8. Fukumori T, Kanayama H, Raz A. (2007) The Role of Galectin-3 in Cancer Drug Resistance. Drug Resistance Updates 10:101-8. [crossref]
  9. Hirabayashi J, Kasai K. (1993) The Family of Metazoan Metal-Independent Beta-Galactoside-Binding Lectins: Structure, Function and Molecular Evolution. Glycobiology 3:297-304. [crossref]
  10. Dumic J, Dabelic S, Flogel M. (2006) Galectin-3: An Open-Ended Story. Biochimica et Biophysica Acta 1760:616-35. [crossref]
  11. Paron I, Scaloni A, Pines A, Bachi A, Liu FT, Puppin C, Pandolfi M, Ledda L, Di Loreto C, Damante G et al. (2003) Nuclear Localization of Galectin-3 in Transformed Thyroid Cells: A Role in Transcriptional Regulation. Biochemical and Biophysical Research Communications 302:545-53.
  12. Danguy A, Camby I, Kiss R. (2002) Galectins and Cancer. Biochimica et Biophysica Acta 1572:285-93. [crossref]
  13. Van den Brule F, Califice S, Castronovo V. (2004) Expression of Galectins in Cancer: A Critical Review. Glycoconjugate Journal 19:537-42. [crossref]
  14. Johnson KD, Glinskii OV, Mossine VV, Turk JR, Mawhinney TP, Anthony DC, et al. (2007) Galectin-3 As a Potential Therapeutic Target in Tumors Arising from Malignant Endothelia. Neoplasia 9:662- 70. [crossref]
  15. Sawangareetrakul P, Srisomsap C, Chokchaichamnankit D, Svasti J. (2008) Galectin-3 Expression in Human Papillary Thyroid Carcinoma. Cancer Genomics & Proteomics 5:117- 22. [crossref]
  16. Nangia-Makker P, Nakahara S, Hogan V, Raz A. (2007) Galectin-3 in Apoptosis, a Novel Therapeutic Target. Journal of Bioenergetics and Biomembranes 1:79- 84.
  17. Tang W, Huang C, Tang C, Xu J, Wang H. (2016) Galectin-3 may serve as a Potential Marker for Diagnosis and Prognosis in Papillary Thyroid Carcinoma: A Meta-Analysis. OncoTargets and Therapy 9:455–60. [crossref]
  18. Manivannan P, Siddaraju N, Jatiya L, Verma SK. (2012) Role of Pro-Angiogenic Marker Galectin-3 in Follicular Neoplasms of Thyroid. Indian Journal of Biochemistry and Biophysics 49:392–4. [crossref]
  19. Sumana BS, Shashidhar S, Shivarudrappa AS. (2015) Galectin-3 Immunohistochemical Expression in Thyroid Neoplasms. Journal of Clinical and Diagnostic Research 9:EC07–11. [crossref]
  20. Papale F, Cafiero G, Grimaldi A, Marino G, Rosso F, Mian C, Barollo S, Pennelli G, Sorrenti S, De Antoni E, Barbarisi A. (2013) Galectin-3 Expression in Thyroid Fine Needle Cytology (t-FNAC) Uncertain Cases: Validation of Molecular Markers and Technology Innovation. Journal of Cellular Physiology 228:968–74. [crossref]
  21. Salajegheh A, Dolan-Evans E, Sullivan E, Irani S, Rahman MA, Vosgha H, Gopalan V, Smith RA, Lam AK. (2014) The Expression Profiles of the Galectin Gene Family in Primary and Metastatic Papillary Thyroid Carcinoma with Particular Emphasis on Galectin-1 and Galectin-3 Expression. Experimental and Molecular Pathology 96:212–8. [crossref]
  22. Al-Sharaky DR, Younes SF. (2016) Sensitivity and Specificity of Galectin-3 and Glypican-3 in Follicular-Patterned and other Thyroid Neoplasms. Journal of Clinical and Diagnostic Research 10:EC06–10. [crossref]
  23. Yilmaz E, Karsidag T, Tatar C, Tüzün S. (2015) Serum Galectin-3: Diagnostic Value for Papillary Thyroid Carcinoma. Ulus Cerrahi Derg 31:192–6. [crossref]
  24. Paunovic I, Isic T, Havelka M, Tatic S, Cvejic D, Savin S. (2012) Combined Immunohistochemistry for Thyroid Peroxidase, Galectin-3, CK19 and HBME-1 in Differential Diagnosis of Thyroid Tumors. APMIS 120:368–79. [crossref]
  25. Abd-El Raouf SM, Ibrahim TR. (2014) Immunohistochemical Expression of HBME-1 and Galectin-3 in the Differential Diagnosis of Follicular-Derived Thyroid Nodules. Pathology, Research and Practice 210:971–8. [crossref]
  26. Trimboli P, Guidobaldi L, Amendola S, Nasrollah N, Romanelli F, Attanasio D, et al. (2016) Galectin-3 and HBME-1 Improve the Accuracy of Core Biopsy in Indeterminate Thyroid Nodules. Endocrine 52:39–45.
  27. Durry MF, Miskad UA, Leiwakabessy WN, Cangara MH. (2016) Diagnostic Value of Galectin-3 and Hector Battifora Mesothelial Epitope (HBME)-1 as a Marker for Malignancy in the Diagnosis of Thyroid Lesions. Pathology International 48:S122–3.
  28. Das DK, Al-Waheeb SK, George SS, Haji BI, Mallik MK. (2014) Contribution of Immunocytochemical Stainings for galectin-3, CD44, and HBME1 to Fine-Needle Aspiration Cytology Diagnosis of Papillary Thyroid Carcinoma. Diagn Cytopathol 42:498–505.
  29. Bartolazzi A, Gasbarri A, Papotti M, Bussolati G, Lucante T, Khan A, et al. (2001) Application of an Immunodiagnostic Method for Improving Preoperative Diagnosis of Nodular Thyroid Lesions. Lancet 357:1644–50. [crossref]
  30. Herrmann ME, LiVolsi VA, Pasha TL, Roberts SA, Wojcik EM, Baloch ZW. (2002) Immunohistochemical Expression of Galectin-3 in Benign And Malignant Thyroid Lesions. Archives of Pathology & Laboratory Medicine 126:710–13. [crossref]
  31. Zhu X, Sun T, Lu H, Zhou X, Lu Y, Cai X, Zhu X. (2010) Diagnostic Significance of CK19, RET, galectin-3 and HBME-1 Expression for Papillary Thyroid Carcinoma. Journal of Clinical Pathology 63:786-9. [crossref]

D-Dimer – As a Biomarker for Severity of COVID-19

DOI: 10.31038/EDMJ.2021531

Abstract

Introduction: Covid-19 disease is a global pandemic caused by severe acute respiratory syndrome coronavirus 2 (SARS‑CoV‑2). Researchers all over the world are trying their best to identify its causative factors, patho- physiology and treatment modalities. Retrospective cohort studies carried out in China showed significant mortality and morbidity associated with high D dimers value in admitted patients. We aimed to see the association of D dimers with the prognosis of covid-19.

Methods: This Retrospective Cross-sectional study was done at Benazir Bhutto hospital Rawalpindi during May –June 2020 obtaining a sample of 200 patients. All those patients being admitted in COVID ward were assessed on the basis of D dimers and their 28 day outcome. Ethical approval was solicited from the Institutional Research Forum of Rawalpindi Medical University.

Results: The study yielded 200 participants in which the patients with moderate severity of the disease had a mean age of 40.33±6.65, that with severe disease had a mean age of 53.18±12.1 and critical patients had a mean age of 56.67±14.79. The disease severity is significantly related to increased mean age of the patient (p = 0.050). Mean serum ferritin levels in patients with moderate disease was 235.67±22.27 micrograms per liter, the patients with severe disease had mean value of 760.75±574.63 micrograms per liter and critical patients had a mean ferritin level of 974.10±773.85 micrograms per liter. This revealed that the ferritin levels increased significantly in patients with severe disease

Conclusion: Our findings establish a consistent increase in the levels of D-dimers with increasing severity of the disease, from mild to severe to critical patients. D –Dimers are important predictors of prognosis and disease severity which can be utilized to evaluate the treatment outcomes in COVID-19 infection. Further studies are recommended to find out the cut-off value of D-dimers as a biomarker of disease severity.

Introduction

Covid-19 disease is a global pandemic caused by severe acute respiratory syndrome coronavirus 2 (SARS‑CoV‑2) [1]. It was initially identified in city of Wuhan in December 2019 [2]. World Health Organization declared corona virus as a pandemic on 11 March 2020 [3]. It is a virus of zoonotic origin thought to be transmitted by air borne route. Symptoms of COVID-19 can be relatively non-specific; most common symptoms are fever, dry cough ,sore throat ,shortness of breath, myalgias, abdominal pain ,diarrhea, loss of sense of smell and taste  [4]. Approximately one in five patients who become symptomatic become critical and suffer breathing difficulties, persistent chest pain, sudden confusion, difficulty waking, and bluish face or lips. Complications include pneumonia, acute respiratory distress syndrome, sepsis, septic shock, and kidney failure [5]. Covid-19 related complications are associated with high mortality rate.

Researchers all over the world are trying their best to identify its causative factors, patho- physiology and treatment modalities. Retrospective cohort studies carried out in China showed significant mortality and morbidity associated with high D dimers value in admitted patients [6]. COVID related  Acute Respiratory Distress Syndrome (ARDS) showed a pro coagulant pattern and this state depicted significant mortality with pulmonary embolism. Covid-19 infection triggered a inflammatory cytokine response which initiated a thrombotic state .It was observed in many studies mortality was reduced by anticoagulation with Low Molecular Weight Heparin (LMWH). The coagulation abnormalities seen in COVID are different from that seen in DIC (sepsis). In DIC, thrombocytopenia is a key finding along with elevated clotting time. However, in cohorts non-surviving patients had an average platelet count and a pro thrombin time which falls within the normal range. It thus may be more likely that local rather than disseminated thrombin generation is at play in COVID-19 patients [7-9].

The main aim of our study was to see the association of D dimers with the prognosis of covid-19. Our study investigated COVID patients and role of D dimers in their mortality and morbidity. There is lack of international & local studies, therefore our study will have a huge impact on researchers and the national data base.

Material & Methods

This Retrospective Cross-sectional study was done at Benazir Bhutto hospital Rawalpindi, which was nominated by Punjab government as COVID Dedicated Unit. Sampling technique used was consecutive sampling. Total sample size obtained was 200 patients. All those patients being admitted in COVID wards during 2 months May- June 2020 were assessed on the basis of D dimers and their 28 day outcome. As d dimers is an easy and inexpensive test was used a screening tool for risk stratification of Covid-19 patients.

Cases of corona virus infection were confirmed by RT-PCR. A patient diagnosed as COVID-19 on the basis of ABI 7500 Real Time RT-PCR detection system after RNA extraction (Qiagen Viral RNA Mini Kit) with internal and external positive controls, using the SARS-CoV-2 protocol.

Inclusion & Exclusion Criteria

Confirmed COVID-19 cases were included in our study where as pregnant women, patients having any hematologic malignancy, chronic liver disease, acute coronary syndrome, surgery or trauma within 30 days and patients without D-dimer testing upon admission were excluded from our study.

Data Collection Technique

Demographic, clinical lab data and outcome (survival or death) was collected form patient records and recorded on self-designed proforma. Disease Severity was be defined as per WHO criteria into moderate, severe, critical with ARDS and Critical with Sepsis/Septic shock. Patients were grouped into two : group A (D-dimer < 500ng/ml) and Group B ( D-dimer ≥ 500ng/ml).

Data Analysis

Data was analyzed via SPSSv25.0. Numerical data was represented as mean and standard deviation. Independent sample t test was used to compare difference of means of numerical variables across severity of the disease according to WHO criteria. Categorical variables were represented as frequencies (%). Distribution of frequencies across severity was compared by Chi-Square test. ROC curve was plotted to determine the cut-off point for D-Dimer to predict mortality.

Ethical Consideration

Ethical approval was solicited from the Institutional Research Forum of Rawalpindi Medical University before securing access to patient data.

Results

The study yielded 200 participants with a mean age of 53.82±12.94 years. On the basis of stratification of severity, the patients with moderate severity of the disease had a mean age of 40.33±6.65, that with severe disease had a mean age of 53.18±12.1 and critical patients had a mean age of 56.67±14.79. The disease severity is significantly related to increased mean age of the patient (p = 0.050). At the time of admission, the patients with moderate disease had a mean SpO2 of 94.67±1.15%, patients with severe disease had a mean SpO2 of 80.79±6.39%, and critical patients had a mean SpO2 of 70.43±15.46%. The mean oxygen saturation at the time of admission decreased with increasing severity (p = 0.000). The patients with moderate disease had a mean arterial partial pressure of oxygen (pO2) of 66.67±6.61 mmHg, patients with severe disease had a mean pO2 of 58.19±9.45 mmHg, and critical patients had a mean pO2 of 44.54±10.21 mmHg. The mean partial pressure of oxygen showed a decline with increasing severity (p = 0.000). Regarding mean arterial partial pressure of carbon dioxide in the patients, the patients with moderate disease had pCO2 of 34.67±6.61 mmHg, patients with severe disease had a mean pCO2 of 27.35±5.92 mmHg, and critical patients had a mean pCO2 of 25.06±3.99 mmHg. The mean partial pressure of carbon dioxide showed a decline with increasing severity (p = 0.002). Mean serum ferritin levels in patients with moderate disease was 235.67±22.27 micrograms per liter, the patients with severe disease had mean value of 760.75±574.63 micrograms per liter and critical patients had a mean ferritin level of 974.10±773.85 micrograms per liter. This revealed that the ferritin levels increased significantly in patients with severe disease. Upon investigating the levels of C-Reactive protein, mean serum CRP levels in patients with moderate disease was 235.67±22.27 mg/L, the patients with severe disease had mean value of 760.75±574.63 mg/L and critical patients had a mean ferritin level of 974.10±773.85 mg/L.

Discussion

Laboratory Hemostasis is believed to provide a very strong evidence in screening, definitive diagnosis and prognosis of many human pathologies [10]. Measuring the levels of D-dimers is one of them. D-dimers are the products of fibrin degradation, which serve as a biomarker in a lot of diseases associated with coagulopathies e.g in coronary artery atherosclerosis, Disseminated intravascular disease and Venous Thromboembolism [11]. D-dimer levels have played a significant role in the evaluation of patients suffering from Community Acquired Pneumonia [12], 2009 novel influenza A (H1N1) [13] and various other members of Coronaviridae family. Covid-19 has also been associated with an increased risk of Venous Thromboembolism [14-15-16]. Hence, the coagulopathy involved in Covid-19 infections can serve as a major determinant of disease prognosis [17]. The levels of D-dimers are consistently elevated in patients suffering from Covid-19 [18-19-20]. In this study, we aimed to explore the association of D-dimer levels with disease severity of Covid-19.

Our findings establish a consistent increase in the levels of D-dimers with increasing severity of the disease, from mild to severe to critical patients [Table 1]. The severity of these patients depended on the duration for which these patients remained in the hospital under care. A strong association was established between these two (Eta sq. 0.128). Many studies concluded the increasing levels of D-dimers to be associated with severity of Covid patients. Huang et al. studies the data of 41 patients and reported a five-fold increase in critical patients  (median: 2.4 mg/L; IQR: 0.6–14.4 mg/L) as compared to the non-critical ones (median: 0.5 mg/L; IQR: 0.3–0.8 mg/L; p  = 0.004) [21]. Another study was performed by Zhou et al. (16). He reported a nine-fold increase in patients who died of Covid (median: 5.2 mg/L; IQR: 1.5–21.1 mg/L) than in those who survived (median: 0.6 mg/L; IQR: 0.3–1.0 mg/L; p  < 0.001). Tand et al. [22] and Wang et al. [23] also had consistent findings as ours. Moreover, irrespective of age, BMI, sex, Hypertension or Diabetes, increased coagulation biomarkers in Covid patients invariably required an increased Oxygen supply, which again can be linked as increased severity in patients having adverse coagulopathies [24].

Table 1: Showing study variables and their severity along with p value.

Study variables

Number

(n)

Percentage

(%)

Severity  

p-value

Gender

Male

126 63 1 96 29 126 0.496
Female 74 37 2 53 19 74
Shortness of Breath

Yes

179 89.5 2 134 43 179 0.429
No 21 10.5 1 15 5

21

Fever

Yes

100 50.0 1 77 22 100 0.659
No 100 50.0 2 72 26 100
Cough

Yes

46 23.0 1 77 22 100 0.494
No 154 77.0 2 72 26 100
Sore Throat

Yes

19 9.5 0 17 2 19 0.282
No 181 90.5 3 132 46

181

Diarrhea

Yes

11 5.5 1 6 4 11 0.057
No 187 93.5 2 141 44

187

Diabetes Mellitus

Yes

94 47.0 2 62 30 94 0.033
No 106 53.0 1 87 18

106

Hypertension

Yes

94 47.0 0 73 21 94 0.212
No 106 53.0 3 76 27

106

Ischemic Heart Disease

Yes

37 18.5 0 27 10 37 0.648
No 163 81.5 3 122 38

163

Chronic Obstructive Pulmonary Disease

Yes

9 4.5 0 6 3 9 0.755
No 191 95.5 3 143 45

191

Asthma

Yes

11 5.5 0 9 2 11 0.810
No 189 94.5 3 140 46

189

Rheumatoid Arthritis

Yes

3 1.5 0 3 0 3 0.594
No 197 98.5 3 146 48

197

Chronic Kidney Disease

Yes

7 3.5 0 5 2 7 0.914
No 193 96.5 3 144 46

193

Hepatitis B/C Infection

Yes

7 3.5 0 6 1 7 0.773
No 193 96.5 3 143 47

193

Hypothyroidism

Yes

7 3.5 0 5 2 7 0.913
No 193 96.5 3 144 46

193

PCR

Positive

152 76.0 3 108 41 152 0.117
Negative 48 24.0 0 41 7

48

Arterial Blood Gases (ABG) Interpretation

Normal

68 34.0
Acute respiratory Failure 1 126 63.0

Acute respiratory Failure 2

2 1.0
Compensated/Chronic Respiratory Failure 4

2.0

Oxygen Flow

Normal

110 55.0
High Flow 60

30.0

Low Flow

30

15.0

Oxygen Support Device

NRBM

108 54.0
Nasal canula 3

1.5

BIPAP

8 4.0
Face Mask 42

21.0

Ventilator

30 15.0
None 8

4.0

Methylprednisolone Therapy

Yes

101 50.5 2 73 26 101 0.702
No 99 49.5 1 76 22 99
Dexamethasone Therapy

Yes

156 78.0 2 73 26 101 0.151
No 44 22.0 1 76 22 99
Ivermectin Therapy

Yes

117 58.5 3 98 16 117 0.000
No 83 41.5 0 51 32

83

Tocilizumab Therapy

Yes

25 12.5 0 20 5 25 0.692
No 175 87.5 3 129 43 175
Heparin Therapy

Yes

177 88.5 3 134 40 177 0.377
11.5 0 15 8 23
Outcome

Expired

36 18.0 0 0 36 36 0.000
Improved 160 80.0 3 148 9

160

Critical

4 2.0 0 1 3 4
Severity

Moderate

3 1.5
Severe 149

74.5

Critical

48

24.0

The underlying biological plausibility and pathogenesis behind increased D-dimers in Covid-19 can be understood by the disease triggering an inflammatory response. Covid-19 is associated with increased acute phase reactant proteins e.g CRP, as shown in [Table 2] of our findings. Other studies also show a consistent increase in CRP levels with an associated mortality rate of 30 days in coronavirus patients [25]. In the consequence of inflammation, proinflammatory cytokines such as Interleukin 1 (IL-1), Interleukin 6 (IL-6) and tumor necrosis factor-α (TNF-α) are elevated [20]. This results in a cytokine storm that triggers monocytes and macrophages to express tissue factor which leads to thrombin generation [26]. There is also an endothelial damage which results in increased plasma concentrations of tissue-type plasminogen activator (t-PA), upto six-fold increase [27]. This explains the increased levels of D-dimers in Covid-19 patients. Moreover, an accompanied increase in metalloproteinases explains the extracellular matrix modification, resulting in capillary damage and pulmonary edema. The remarkable fibrinolytic profile of Covid patients has also been explained by the studies performed in mice [28]. However, it is noteworthy that increased fibrinolytic profile can still not be translated as DIC or hyper fibrinolytic state. Although coagulopathy may reflect some similar findings, but Covid coagulopathy has a very complex etiology, resulting from intricate interactions between the immune system and coagulation system in the host [29].

Table 2: Showing underlying biological plausibility and pathogenesis behind increased D-dimers in Covid-19.

table 2 (1)

table 2(2)

table 2(3)

table 2(4)

table 2(5)

The ROC curve of our findings for the D-dimer test with severity of Covid diseases is shown in [Figure 1]. The area under the curve (AUC) is 0.699.  It can be utilised to determine a definitive cut-off value to support the International Society of Thrombosis and Haemostasis (ISTH) arbitrary definition of raised D-dimers in coronavirus patients as done by Zhang et al [30].

fig 1

Figure 1: ROC for D-Dimer as a Predictor of Outcome in COVID-19 Infection Area Under the Curve (AUC) is 0.669

Limitations

There are a few limitations in our study that need to be known. Firstly, the burden of the pandemic itself and an emergency situation in Pakistan has hindered the practicality of Cohort, Case-control or Randomized Control Trial- which could have provided a greater pool of Clinical and Lab findings; making even better associations possible. Secondly, we cannot exclude the strong association of confounding factors with coagulopathies- hence a stratified analysis of these confounders can give us a better picture of using D-dimers as a prognostic marker in Covid-19 patients. Moreover, limitations in the measurement of plasma D-dimer concentration may also exist at the level of Laboratory methods and skills involved at human level [31].

Conclusion

COVID-19 infection is characterized by hypercoagulability, inflammation, and multi-organ damage mediated by cytokines. These pathologies are manifested by appearance of several acute phase proteins and inflammatory markers in the serum. The levels of these biomarkers are variable in various stages of COVID-19 infection in relation to severity. The prognosis can be predicted by these serum biomarkers. In this study, D-dimers are measured in patients at various stages of disease severity. D-dimers are important predictors of prognosis and disease severity. These biomarkers can be utilized to evaluate the treatment outcomes in COVID-19 infection. Further studies are recommended to find out the cut-off value of D-dimers as a biomarker of disease severity.

Conflict of Intrest

Nill to disclose

Funding

Nill to disclose

References

  1. Zu ZY, Jiang MD, Xu PP, et al. (2020) Coronavirus Disease 2019 (COVID-19): A Perspective from China. Radiology Aug;296(2):E15-E25. doi: 10.1148/radiol.2020200490. Epub 2020 Feb 21. [crossref]
  2. Sahin AR, Erdogan A, Agaoglu PM, et al. (2020) 2019 novel coronavirus (COVID-19) outbreak: a re-view of the current literature. EJMO 4(1):1_7.
  3. https://www.who.int/news/item/23-01-2020-statement-on-the-meeting-of-the-international-health-regulations-(2005)-emergency-committee-regarding-the-outbreak-of-novel-coronavirus-(2019-ncov)
  4. Hopkins C. “Loss of sense of smell as marker of COVID-19 infection”. Ear, Nose and Throat surgery body of United Kingdom. Retrieved 28 March 2020.
  5. Interim Clinical Guidance for Management of Patients with Confirmed Coronavirus Disease (COVID-19)”. S. Centers for Disease Control and Prevention (CDC) Retrieved 11 April 2020. https://www.cdc.gov/coronavirus/2019-ncov/hcp/clinical-guidance-management-patients.html.
  6. Lippi G, Favaloro EJ (2020) D-dimer is Associated with Severity of Coronavirus Disease 2019: A Pooled Analysis. Thromb Haemost May;120(5):876-878. doi: 10.1055/s-0040-1709650. Epub 2020 Apr 3. [crossref]
  7. Tang N, Li D, Wang X, et al. (2020) Abnormal coagulation parameters are associated with poor prognosis in patients with novel coronavirus pneumonia. J Thromb Haemost Apr;18(4):844-847. doi: 10.1111/jth.14768. Epub 2020 Mar 13. [crossref]
  8. Ranucci M, Ballotta A, Di Dedda U, et al. (Jul. 2020) The procoagulant pattern of patients with COVID-19 acute respiratory distress syndrome. J Thromb Haemost 18(7):1747-1751. doi: 10.1111/jth.14854. Epub 2020 May 6. [crossref]
  9. Wang T, Chen R, Liu C, et al. (May 2020) Attention should be paid to venous thromboembolism prophylaxis in the management of COVID-19. Lancet Haematol 7(5):e362-e363. doi: 10.1016/S2352-3026(20)30109-5. Epub 2020 Apr 9. [crossref]
  10. Lippi G, Favaloro EJ (Jun. 2018) Laboratory hemostasis: from biology to the bench. Clin Chem Lab Med 27;56(7):1035-1045. doi: 10.1515/cclm-2017-1205.  [crossref]
  11. Soomro AY, Guerchicoff A, Nichols DJ, et al. (Jul. 2016) The current role and future prospects of D-dimer biomarker. Eur Heart J Cardiovasc Pharmacother 2(3):175-84. doi: 10.1093/ehjcvp/pvv039. Epub 2015 Sep 27. [crossref]
  12. Chalmers J.D., Singanayagam A., Scally C., et al. (2009) Admission D-dimer can identify low-risk patients with community-acquired pneumonia. Emerg. Med. 53:633–638. doi: 10.1016/j.annemergmed.2008.12.022. [crossref]
  13. Wang Z.F., Su F., Lin X.J., et al. (2011) Serum D-dimer changes and prognostic implication in 2009 novel influenza A(H1N1). Res 127:198–201. doi: 10.1016/j.thromres.2010.11.032. [crossref]
  14. Helms J., Tacquard C., Severac F., et al. (2020) High risk of thrombosis in patients with severe SARS-CoV-2 infection: A multicenter prospective cohort study. Intensive Care Med 46:1089–1098. doi: 10.1007/s00134-020-06062-x. [crossref]
  15. Leonard-Lorant I., Delabranche X., Severac F, et al. Acute Pulmonary Embolism in COVID-19 Patients on CT Angiography and Relationship to D-Dimer Levels. Radiology. 2020:201561. doi: 10.1148/radiol.2020201561. [crossref]
  16. Fauvel C., Weizman O., Trimaille A., et al. (2020) Pulmonary embolism in COVID-19 patients: A French multicentre cohort study. Heart J. 41:3058–3068. doi: 10.1093/eurheartj/ehaa500. [crossref]
  17. Tang N., Li D., Wang X., et al. (2020) Abnormal coagulation parameters are associated with poor prognosis in patients with novel coronavirus pneumonia. Thromb. Haemost. 18:844–847. doi: 10.1111/jth.14768. [crossref]
  18. Thachil J (2020) All those D-dimers in COVID-19. Thromb. Haemost. doi: 10.1111/jth.14939. [crossref]
  19. Lippi G. (2020) Favaloro E.J. D-dimer is Associated with Severity of Coronavirus Disease 2019: A Pooled Analysis. Haemost. 120:876–878. doi: 10.1055/s-0040-1709650. [crossref]
  20. Huang C, Wang Y, Li X et al. (2020) Clinical features of patients infected with 2019 novel coronavirus in Wuhan, China. Lancet 395(10223):497–506. [crossref]
  21. Zhou F, Yu T, Du R et al. (2020) Clinical course and risk factors for mortality of adult inpatients with COVID-19 in Wuhan, China: a retrospective cohort study. Lancet S0140-6736(20)30566-3. [crossref]
  22. Tang N, Li D, Wang X, et al. (2020) Abnormal coagulation parameters are associated with poor prognosis in patients with novel coronavirus pneumonia. J Thromb Haemost Doi: 10.1111/jth.14768. [crossref]
  23. Wang D, Hu B, Hu C, et al. (2020) Clinical characteristics of 138 hospitalized patients with 2019 novel coronavirus-infected pneumonia in Wuhan, China. JAMA Doi: 10.1001/jama.2020.1585. [crossref]
  24. https://onlinelibrary.wiley.com/doi/10.1111/jth.15067
  25. Huang I, Pranata R, Lim MA, et al. (Jan.-Dec. 2020) C-reactive protein, procalcitonin, D-dimer, and ferritin in severe coronavirus disease-2019: a meta-analysis. Ther Adv Respir Dis 14:1753466620937175. doi: 10.1177/1753466620937175. [crossref]
  26. Levi M, Thachil J. (2020) Coronavirus disease 2019 coagulopathy: disseminated intravascular coagulation and thrombotic microangiopathy-either, neither, or both. Semin Thromb Hemost 46:781–784. doi: 10.1055/s-0040-1712156. [crossref]
  27. Liu ZH, Wei R, Wu YP, et al. (2005) Elevated plasma tissue-type plasminogen activator (t-PA) and soluble thrombomodulin in patients suffering from severe acute respiratory syndrome (SARS) as a possible index for prognosis and treatment strategy. Biomed Environ Sci BES 18:260–264. [crossref]
  28. Gralinski LE, Bankhead A, Jeng S, et al. (2013) Mechanisms of severe acute respiratory syndrome coronavirus-induced acute lung injury. mBio 4:e00271–e313. doi: 10.1128/mBio.00271-13. [crossref]
  29. Iba T, Levy JH, Levi M, et al. (Sep. 2020) Coagulopathy of Coronavirus Disease 2019. Crit Care Med 48(9):1358-1364. doi: 10.1097/CCM.0000000000004458. [crossref]
  30. Zhang L et al. (2020) D-dimer levels on admission to predict in-hospital mortality in patients with Covid-19. Journal of Thrombosis and Haemostasis 18, 1324–1329. [crossref]
  31. Hardy M., Lecompte T., Douxfils J, et al. (2020) Management of the thrombotic risk associated with COVID-19: Guidance for the hemostasis laboratory. J. 18:17. doi: 10.1186/s12959-020-00230-1. [crossref]

Severity of 1st and 2nd Curve of COVID-19 Pandemic in Islamabad, Pakistan

DOI: 10.31038/EDMJ.2021533

Abstract

Introduction: Coronavirus disease of 2019 started started in Wuhan China as an epidemic causing pneumonia-like illness. It became a global pandemic in a period of two months. On January 30, 2020, the World Health Organization (WHO) declared the outbreak of COVID-19 as the sixth global public health emergency (PHEIC), and on March 11, 2020, the WHO declared COVID-19 a pandemic. The waves in the epidemiological curve of the pandemic show the the progression of the pandemic. Our study aims at evaluating the the patient characteristics in first and second curve of COVID-19 pandemic.

Materials and Methods: We conducted a prospective study of all hospitalized cases of SARS COV-2 infection in KRL Hospital Islamabad, admitted between March 2020 and February 2021. All patients admitted upto August 2020 were considered in 1st wave & all those admitted from September 2020 to February 2021 were considered in 2nd wave which divided the study groups into two equal parts i.e., 6 months.

Results: In this study, the average length of stay in both waves was similar (10 days). The second wave of the pandemic inflicted younger patients greater than the first wave of the pandemic. The difference of severity of disease in the patient presenting in the first and second waves was insignificant (p > 0.05).

Conclusion: COVID-19 cases presented differently in both first and second waves of COVID-19 pandemic. The comparison of case presentation and severity of disease may help the healthcare professionals and epidemiologists to valuate the treatment and management methods. It may highlight the effectiveness of administrative aspects of controlling the pandemic.

Introduction

Coronavirus-19 (COVID-19), produced by the acute respiratory tract coronavirus 2 (SARS-CoV-2), has become a global epidemic, posing a serious health threat worldwide. Several countries have seen the pattern of two reported cases, the first wave in spring and the second in late summer and autumn [1-3]. On January 30, 2020, the World Health Organization (WHO) declared the outbreak of COVID-19 as the sixth global public health emergency (PHEIC), and on March 11, 2020, the WHO declared COVID-19 a pandemic [4]. The first case of COVID-19 was reported from Karachi on February 26, 2020, when the estimated population of Pakistan was 204.65.3,4 million [5]. As a result of the outbreak, the government introduced a series of rigorous prevention measures, including home confinement, followed by a three-month period of increased social networking, performance and hard work. With social life in the country it was back to normal, without the obligation to wear a mask and keep the public space safe. Unfortunately, the number of patients with COVID-19 began to skyrocket in August and a month later it showed the same numbers as in April. This has forced the government to reinstate drastic measures to prevent, including the closure of facilities and facilities, the closure of parks, restaurants, cultural and sports activities, and the curfew. The number of cases in Pakistan has continued to grow since then, sometimes downwards, and at the time of writing this article seems to be declining slightly. The second wave of COVID-19 was predicted months ago and already existed in some countries [6]. After the relaxation of the measures in the summer, the second wave began in mid-September 2020 and expanded until March 2021 [7]. While some countries have a second wave that is much better than the first. Meanwhile more than 20,000 people have died compared to less than 10,000 across the first wave, which is a clear indication that the medical services at hospitals were second only around [8].

This study investigated the severity and characteristics of the two waves in hospitalized patients in Islamabad.

Material & Methods

We conducted a prospective study of all hospitalized cases of SARS COV-2 infection in KRL Hospital Islamabad, admitted between March 2020 and February 2021.

All patients admitted unto August 2020 were considered in 1st wave & all those admitted from September 2020 to February 2021 were considered in 2nd wave, which divided the study groups into two equal parts i.e. 6 months.

All the patients who were hospitalized with diagnosis of SARS-COV-2 (Covid Pneumonia) were included in the study. Those with suspected SARS-COV-2 infection but no laboratory confirmation were excluded from the study. SARS-COV-2  infection was confirmed using RT-PCR using swab samples from upper respiratory tract  (nasopharyngeal / oropharyngeal swabs).

The Ethical Review Board, KRL Hospital Islamabad, approved this study.

Results

fig 1

Figure 1: (1st wave) showing month wise data of all COVID-19 PCR tests conducted and positivity rate for COVID-19 infection. 57027 tests performed till 30th September 2020. COVID-19 PCR positivity rate was 2.1% which equal to national positivity rate.

fig 2

Figure 2: (1st wave)The average length of stay was 10 days with high recovery rate at 99%.

fig 3

Figure 3: (1st wave) Asymptomatic: With no symptoms, only PCR positive. Mild Symptoms: Fever (1000F – 1020F) shortness of breath on exertion, body aches, maintaining>95% oxygen saturation at room air. Moderate: Fever (1010F – 1030F) shortness of breath, myalgia’s, oxygen saturation at 3-5 liters max with NIV nasal cannula. Sever Disease illness: Fever (1010F – 1030F) shortness of breath, body aches, myalgia, prominent changes on imaging and difficulty in maintaining blood oxygen saturation with NIV nasal cannula (highly oxygen dependent).

fig 4

Figure 4: Second Wave showing month wise data of all COVID-19 PCR tests conducted and positivity rate for COVID-19 infection.

fig 5

Figure 5: (Second Wave) The average length of stay was 10 days with high recovery rate at 99%.

fig 6

Figure 6: (Second Wave) Asymptomatic: With no symptoms, only PCR positive. Mild Symptoms: Fever (1000F – 1020F) shortness of breath on exertion, body aches, maintaining >95% oxygen saturation at room air. Moderate: Fever (1010F – 1030F) shortness of breath, myalgia’s, oxygen saturation at 3-5 liters max with NIV nasal cannula. Sever Disease illness: Fever (1010F – 1030F) shortness of breath, body aches, myalgia, prominent changes on imaging and difficulty in maintaining blood oxygen saturation with NIV nasal cannula (highly oxygen dependent).

Discussion

Pakistan is one of the most populous countries globally, which had about 0.9 million cases of COVID-19 until now [9]. The time span for the first wave ranged till August 2020, and that of the second was from September 2020 to February 2021, and both these waves had their peak for around about one month in which we reported the highest cases. It was observed that there was an inverted U wave pattern of seroprevalence of SARS CoV-2 infection; the same pattern was observed in another study [10]. One of the significant thing that came into account is the age of patients who were infected by the deadly and lethal virus, which was surprisingly younger people, children, and women, as also revealed by Fan G. et al [11] which may be due to poor compliance with social distancing and other Standard Operating Procedures (SOPs) may have resulted in spreading of the pandemic in younger patients. This may be due to some myths that the virus can only infect the elderly, which is a foolish thing to say, but these young people can also infect their own elderly, and when they do, the prudent time will be gone.

The high incidence of seropositive COVID-19 in younger patients resulted in depression in the case fatality rate, as shown by Iftimie S et al. [12]. There were many reasons for decreased case fatality rate, which includes firstly, the younger the patients, the better would be the immunity; secondly, now we had better understandings, perceptions, and comprehension of pathophysiology of plague, thirdly, Dexamethasone was used frequently because of the results published by Horby PW et al. [13], and Remdisivir was also proved to be a benchmark in preventing death and mitigating the hospital stay of the patient, which other researchers also witnessed [14] and last but not least the Planned and organized effort of Government in implementing the smart lock-down policy was worth it. However, the treatment plan of COVID-19 patients was changed in the second wave, so it was impossible to compare the effectiveness of the management plan.

Although we had a high proportion of patients having moderate and severe symptoms in the second wave as compared to the first wave, which is contrary to other studies [15-16-17], the recovery rate wasn’t changed despite the higher number of severe seropositive COVID-19 patients, which is mainly due to reasons mentioned above. At the same time, hospital stay remained consistent in both of the waves.

As Pakistan conducted lesser Real-Time Polymerase Chain Reaction (RT-PCR) tests than other major countries of the world, it would be useless to compare the number of the confirmed cases of SARS CoV with that of foreign countries. However, considering the number of deaths in western countries is much more than in Pakistan, albeit the exact reason is not known, genetic makeup could also be the reason for significantly fewer deaths [18].

This study has some limitations, including a small sample size and uni-centric research, due to which we couldn’t apprehend the bigger picture. And due to limited resources and restricted contact tracing measures, we can only locate the tip of the iceberg, but the real problem which should be addressed wasn’t in our hands. The cases of re-infection couldn’t be examined in detail because of the lack of facilities that depict viral genome, and the determinants of infectivity in first and second waves couldn’t be studied in detail. And as we know, there was a whole different set of medications in treatment for COVID-19 patients in both waves, so that will be unfruitful to compare the effectiveness of medicines.

In summary, we had a slightly higher seroprevalence of COVID-19 in the second wave; it was more common in younger patients. At the same time, the hospital admission tenure in both of the waves was the same. There were more severe and moderate category cases, but now, the mortality rate hasn’t changed because of having a better approach towards this ailment. Pre-existing comorbidities in the second wave were the same as that of the first one. Developing countries like Pakistan cannot afford different waves of COVID-19 because our healthcare is always working on its total efficiency; any more addition will result in the collapse of the system. Our only way out from this is to vaccinate the mob as much as possible so that the level of herd immunity can be achieved. Being healthcare professionals, our moral and ethical obligation is to spread awareness about the disease and the vaccine. And we also have to break myths which is one of the biggest obstacles in not getting the jab.

Conclusion

Covid-19 pandemic struck the world extremely hard in terms of world wide spread and mortality. The pattern of COVID-19 spread and severity varied during first and second waves of the pandemic. The account of the changes in the behavior of the waves of the pandemic is crucial for the evaluation of the preparedness for the pandemic. The evolution of the pandemic can be halted by active surveillance and adequate measures to bring the epidemiologic curve to the baseline.

References

  1. Vahidy FS, Drews AL, Masud FN, Schwartz RL, Boom ML, Phillips RA, et al. (2020) Characteristics and outcomes of COVID-19 patients during initial peak and resurgence in the Houston metropolitan area. JAMA 324: 998–1000. [crossref]
  2. Fan G, Yang Z, Lin Q, Zhao S, Yang L, He D. (2020) Decreased case fatality rate of COVID-19 in the second wave: a study in 53 countries or regions. Transbound Emerg Dis. Epub ahead of print. [crossref]
  3. Saito S, Asai Y, Matsunaga N, Hayakawa K, Terada M, Ohtsu H, et al. (2020) First and second COVID-19 waves in Japan: A comparison of disease severity and characteristics: Comparison of the two COVID-19 waves in Japan. J Infect. S0163-4453(20)30693-9. [crossref]
  4. World Health Organization. Naming the coronavirus disease (COVID-19) and the virus that causes it. https://www.who.int/emergencies/diseases/novel-coronavirus-2019/technical-guidance/naming-the-coronavirus-disease-(covid-2019)-and-the-virus-that-causes-it. Accessed March 16, 2020.
  5. Government of Pakistan; Ministry of Planning, Development & Special Initiatives; Pakistan Bureau of Statistics. Pakistan Statistical Year Book 2018 (Provisional).
    http://www.pbs.gov.pk/sites/default/files//PAKISTAN%20STATISTICAL%20YEAR%20BOOK%202018.pdf.
  6. Renardy M, Eisenberg M, Kirschner D. (2020) Predicting the second wave of COVID-19 in Washtenaw County, MI. J Theor Biol. 507: 110461. [crossref]
  7. Vicente Soriano, Pilar Ganado-Pinilla, Miguel Sanchez-santos, et al. (2021) Main differences between the first and second waves of COVID-19 in Madrid, Spain. International Journal of Infectious Diseases, 105 (2021) 374-376. https://doi.org/10.1016/j.ijid.2021.02.115. [crossref]
  8. Graichen H. (2021) What is the difference between the first and the second/third wave of Covid-19? – German perspective. J Orthop. Mar-Apr;24:A1-A3. doi: 10.1016/j.jor.2021.01.011. Epub 2021 Jan 27. [crossref]
  9. Official Updates Coronavirus – COVID-19 in Pakistan (https://www.covid.gov.pk/)
  10. Hattori T, Saito A, Chiba H, Kuronuma K, Amishima M, Morinaga D, Shichinohe Y, Nasuhara Y, Konno S. (Mar. 2021) Characteristics of COVID-19 patients admitted into two hospitals in sapporo, Japan: Analyses and insights from two outbreak waves. Respiratory Investigation 1;59(2):180-6. [crossref]
  11. Fan G, Yang Z, Lin Q, Zhao S, Yang L, He D. (Mar. 2021) Decreased case fatality rate of COVID‐19 in the second wave: a study in 53 countries or regions. Transboundary and emerging diseases 68(2):213-5. [crossref]
  12. Iftimie S, López-Azcona AF, Vallverdú I, Hernández-Flix S, De Febrer G, Parra S, Hernández-Aguilera A, Riu F, Joven J, Andreychuk N, Baiges-Gaya G. (Mar. 2021) First and second waves of coronavirus disease-19: A comparative study in hospitalized patients in Reus, Spain. PloS one 31;16(3):e0248029. [crossref]
  13. Horby PW, Mafham M, Bell JL, Linsell L, Staplin N, Emberson J, Palfreeman A, Raw J, Elmahi E, Prudon B, Green C. (Oct. 2020) Lopinavir–ritonavir in patients admitted to hospital with COVID-19 (RECOVERY): a randomised, controlled, open-label, platform trial. The Lancet 24;396(10259):1345-52. [crossref]
  14. Costanzo M, De Giglio MA, Roviello GN. (Aug. 2020) SARS-CoV-2: recent reports on antiviral therapies based on lopinavir/ritonavir, darunavir/umifenovir, hydroxychloroquine, remdesivir, favipiravir and other drugs for the treatment of the new coronavirus. Current medicinal chemistry 1;27(27):4536-41.
  15. Sho Saito MD, Terada M, Shinya Tsuzuki MD. First and second COVID-19 waves in Japan: A comparison of disease severity and characteristics. [crossref]
  16. Shen KL, Yang YH, Jiang RM, Wang TY, Zhao DC, Jiang Y, Lu XX, Jin RM, Zheng YJ, Xu BP, Xie ZD. (2020) Updated diagnosis, treatment and prevention of COVID-19 in children: experts’ consensus statement (condensed version of the second edition). World Journal of Pediatrics 16(3):232-9. [crossref]
  17. Dong Y, Mo X, Hu Y, Qi X, Jiang F, Jiang Z, Tong S. (2020) Epidemiology of COVID-19 among children in China. Pediatrics 1;145(6). [crossref]
  18. Ellinghaus D, Degenhardt F, Bujanda L, Buti M, Albillos A, Invernizzi P, Fernández J, Prati D, Baselli G, Asselta R, Grimsrud MM. (June 2020) Genomewide association study of severe COVID-19 with respiratory failure. N Engl J Med https://doi. org/10.1056/NEJMoa2020283. [crossref]
  19. Saeed, U., Uppal, S.R., Piracha, Z.Z. et al. (2021) Evaluation of SARS-CoV-2 antigen-based rapid diagnostic kits in Pakistan: formulation of COVID-19 national testing strategy. Virol J18 https://doi.org/10.1186/s12985-021-01505-3. [crossref]

Italian Digestive Endoscopists and Anesthesiologists Publish a Joint Document of Good Clinical Practice: It was Time!

DOI: 10.31038/IMROJ.2021645

Introduction

The problem of sedation in Digestive Endoscopy (DE) has been a source of debate and controversy both within the world of endoscopists and anesthetists and this not only in Italy but in Europe and around the world. Finally the Italian Society of Digestive Endoscopy (SIED) was able to initiate a debate with Italian Society of Anesthesia Analgesia Intensive Care Resuscitation (SIAARTI) and produce a common document of Good Clinical Practice applicable to all Services of national, public and accredited private Digestive Endoscopy Centers, in which the Anesthesiologists Specialist (AS) should be present. Therefore, in this article, a summary of the document is proposed which, starting from the European guidelines of the two disciplines [1-3], wanted to outline appropriate and sustainable clinical- organizational paths, identifying the risks and the necessary skills, as well as the responsibilities, to guarantee the quality and safety of the diagnostic-therapeutic treatments offered in DE.

Methodology

A Panel of experts was set up, made up of 5 representatives from each of the two Scientific Societies who shared the methodology, defined a series of “clinical questions” to which answers in terms    of operative proposals. Then  the  group  proceeded  to  carry  out  the Literature Review updated, to elaborate a Survey at the Italian Endoscopy Centers to have “current information “ on clinical practices in ED, to prepare a document and submit it to the respective Councils and scientific boards.

The Document

The document is divided into 7 points:

  1. Definition of Sedation-Analgesia-Procedural, in
  2. Pre-procedural assessment and risk stratification of patients who are candidates for SAP in ED, defining the precautions to be activated (starting with the withdrawal times of solids and liquids).
  3. SAP settings and minimum monitoring
  4. Responsibility profiles for SAP in Definition of the role of the doctor of ED.
  5. Drugs for sedation and definition of an appropriate use of Propofol for
  6. Post-procedural control of the patient undergoing SAP, and management of possible
  7. Definition of the training path and maintenance of the skills of the candidate personnel to perform the SAP in

As part of the document, the authors have introduced and shared some updated and appropriate standard concepts or approaches:

A first concept intoduced is included in the definition of Procedural Sedation-Analgesia (PSA) which defines  a  condition  obtained  with a hypnotic and/or analgesic to make an effective diagnostic or therapeutic endoscopic procedure possible, ensuring that the patient is closely monitored to prevent potential adverse effects! The “PSA” definitively replaces the ambiguous concept and term of “conscious” or “alert” sedation as sedation always determines a reduction in the level of consciousness and from being conscious it can become deep even without the use of hypnotics. Another important concept is that the figure of the “non-anesthesiologist operator who becomes” Anesthesia provider”, or sedo-anesthesia administrator, is also contemplated in the anesthesiological literature [4].

Is absolutely mandatory for the endoscopist who wants to sedate the patient that first of all defines the risk of the patient (ASA score) [5]. Based on this assessment, the endoscopist must decide who to sedate independently and who to submit to anesthesiologist assistance and clearly summarizes the criteria for candidacy for Non-anesthesiologist sedation (NAS).

Are reported and shared the minimum standards that are necessary to perform the SAP in security and also specifies which and how many human resources are required for the correct management of the SAP.

Furthermore, for the first time in the Italian context, the profiles of responsibility in sedation are declared and shared: it is the endoscopist who decides the type of drug/s and the dosage, but administration and monitoring are the responsibility of the nurse in a team that has obviously been trained for the monitoring and management of sedation [1,6,7].

With  regard to sedation drugs in particular, the paragraph of   the document addresses the problem of the use of Propofol in NAS. This problem which remains very controversial in the world but in particular in Italy where the Italian Drugs Agency (AIFA) has also recently expressed itself restrictively, reiterating that the use of Propofol remains the prerogative of anesthesiologists. Despite this, the panel based on the new knowledge/information and clinical evidence emerging from the current scientific literature [3,7-13] which demonstrates the safety of the drug if used with adequate training states that it is necessary to take into account the effective skills of the endoscopist teams, that if they are prepared for the administration   of Propofol, in agreement with the AR of their own hospital they  can choose to administer Propofol in the NAS. Particularly valuable then is the part of the document on the management of the possible complications of sedation which are all listed explaining the cause, prevention and possible treatment.

The training and maintenance of the skills of the candidate personnel to perform the SAP in ED is described in the last paragraph. but in reality is the “core” of the Document and of the problem of self-managed sedation by non-anesthesiologist. In fact, if the staff is trained according to the SAP program performed in NAS as proposed by the main scientific societies in the sector [6,14], it increases the safety of sedoanalgesia performed with all available drugs including Propofol.

Conclusion

The document reports the position of the Panel of experts on some points summarized in a final “Take Home Message”:

  • It is not possible to perform diagnostic and therapeutic endoscopic procedures without sedation
  • Sedation today is Procedural Sedation-Analgesia (SAP) which defines a condition obtained with a hypnotic and/or an analgesic
  • A pre-procedural  assessment  and  risk  stratification   of the patients to be sedated in Settings appropriate to the recommendations of the Reference Guidelines is

In accordance with the “Profiles of responsibility”, the endoscopy teams can autonomously sedate ASA1 and 2 patients for procedures that are not too long or too complex after adequate training provided by the Departments/Units of RA.

References

  1. Hinkelbein J, Lamperti M, Akeson J, et (2017) European Society of Anaesthesiology and European Board of Anaesthesiology guidelines for procedural sedation and analgesia in adults. Eur J Anaesthesiol 34: 1-19. [crossref]
  2. Foley EM, Wolfe RE, Burstein J, et al. (2016) Utility of Procedural Sedation as a Marker for Quality Assurance in Emergency Medicine. J Emerg Med 50: 711-714. [crossref]
  3. Dumonceau JM, Riphaus A, Schreiber F, et al. (2015) Non-anesthesiologist administration of propofol for gastrointestinal endoscopy: European Society of Gastrointestinal Endoscopy, European Society of Gastroenterology and Endoscopy Nurses andAssociates Guideline – Updated June 2015. Endoscopy 47: 1175-1189. [crossref]
  4. World Health Organization-World Federation of Societies of Anaesthesiologists (WHO-WFSA) International Standards for a Safe Practice of Anesthesia (2018) Adrian Gelb, Wayne W. Morriss, Walter Johnson, Alan F. Merry, on behalf of the International Standards for a Safe Practice of AnesthesiaWorkgroup. Can J Anesth 126: 2047-2055. [crossref]
  5. Mayhew D, Mendonca V, Murthy BVS (2019) A review of ASA physical status – historical perspectives and modern Anaesthesia 74: 373-379. [crossref]
  6. Dumonceau JM, A Riphaus, U Beilenhoff, et al. (2013) European Curriculum for Sedation Training in Gastrointestinal Endoscopy: Position Statement of the European Society of Gastrointestinal Endoscopy (ESGE) and European Society of Gastroenterology and Endoscopy Nurses and Associates (ESGENA ) Endoscopy 45: 496-504. [crossref]
  7. Burtea ED, Dimitriu A, Maloş AE et (2018) Periprocedural role of Nurses during Interventional Endoscopic procedures under deep sedation. Curr Health Sci J 44: 14-18. [crossref]
  8. Vargo JJ, Zuccaro G Jr, Dumot JA, et al. (2002) Gastroenterologist –administered propofol versus meperidine and midazolam for advanced upper endoscopy : a prospective, randomized trial . Gastroenterology 123 : 373-375. [crossref]
  9. Conigliaro R, Fanti L, Manno M, Brosolo P (2017) Italian Society of Digestive Endoscopy (SIED). position paper on the non-anaesthesiologist administration of propofol for gastrointestinal Dig Liver Dis. 49: 1185-1190. [crossref]
  10. Rex DK, Deenadayalu VP, Eid E, et (2009) Endoscopist-directed administration of Propofol: a worldwide safety experience. Gastroenterology 137: 1229-1237. [crossref]
  11. Byrne MF, Chiba N, Singh H, et (2008) Propofol use for sedation during endoscopy in adults: a
  12. Canadian Association of Gastroenterology position statement. Can J Gastroenterol 22: 457-459. [crossref]
  13. Vargo JJ, Cohen LB, Rex DK, Kwo PY (2009) American Association for the Study of Liver Diseases; American College of Gastroenterology ; American Gastroenterological Association, American Society for Gastrointestinal Endoscopy Position statement: nonanesthesiologist administration of Propofol for GI endoscopy. Gastroenterology 137: 2161-2167.
  14. Daza JF, Tan CM, Fielding RJ, et (2018) Propofol administration by endoscopists versus anesthesiologists in gastrointestinal endoscopy: a systematic review and meta- analysis of patient safety outcomes. Can J Surg 61: 226-236. [crossref]
  15. Cabadas Avión R, Baluja A, OjeaCendón M, et al. (2019) Effectiveness and safety of gastrointestinal endoscopy during specific sedation training program for non – anesthesiologists. Rev Esp Enferm Dig 111: 199-208. [crossref]

Effects of Radiation on Mitochondrial Defective Lymphoblastoid Cells

DOI: 10.31038/IMROJ.2021643

Abstract

Background: Ionizing radiation results in an increase in ROS and can be further enhanced in cells with damaged mitochondria, inducing persistent damage and genomic instability, leading to cancer. DNA damage response (DDR) is activated post radiation, and combined with ROS can result in telomere length changes. Mitochondria play a key role in mediating non-targeted effects post radiation exposure. Mitochondrial DNA (mtDNA), due to its less efficient repair as compared to nuclear DNA, is more severely affected by radiation exposure and mutations in essential mtDNA genes can further exacerbate oxidative stress.

Aim: We evaluated the impact of mitochondrial defects on radiation-induced DDR and telomere length changes, biomarkers that can foreshadow cancer development.

Methods: To better understand this relationship, we have used lymphocytes containing various mitochondrial mutations and studied the kinetics of DNA damage and telomere length changes over time post radiation exposure. In this study we investigated the kinetics of DNA damage response and telomere length changes in cells in lymphoblastoid cell lines with known mitochondrial mutations following a 0.5 Gy dose of Xray or 1 GeV/um Fe ion.

Results: Our studies suggest that cells containing different mitochondrial mutations have unique DNA damage and telomere length effects following radiation exposure. The effects on telomere length also reveal differences dependent upon the radiation quality of exposure. Results revealed cells with a mitochondrial mutation in the ND4 subunit of complex 1 showed a decreased growth rate, higher levels of persistent DNA damage, and telomere instability as compared to wild type. In contrast the ATPase 6 mitochondrial mutant showed more subtle changes.

Conclusion: These findings point to the importance of mitochondrial integrity and the role it may play in cellular changes that promote cancer. In total results indicate mitochondrial mutations can influence DNA damage kinetics and telomere length and have long-term consequences in regaining homeostasis following radiation exposure. These results may aid in understanding the rationale for the persistent genomic instability following a low dose of radiation and changes leading to cancer promotion.

Keywords

DNA Damage, Mitochondria, Radiation, Telomere

Introduction

Ionizing radiation is believed to cause changes within cells that lead to either the initiation and/or promotion of cancer. Although previous studies have focused mainly on mutations as the primary culprit in increasing cancer risk, non-targeted effects are also thought to impact cancer risk [1]. Reactive oxygen species (ROS) are induced by ionizing radiation and can persist for long time periods following radiation [2], perhaps playing a role in non-targeted effects that lead to cancer development.

ROS are produced by water radiolysis following ionizing radiation exposure, and generated more predominantly by γ-rays and X-ray (low linear energy transfer, or LET, radiation) as compared to high LET radiation, which causes more direct effects [3]. Unrepaired mitochondrial and nuclear DNA damage is thought to further increase ROS levels and increase oxidative stress within the cells [4] and thus increases in ROS have been linked to higher levels of DNA damage [5]. Mitochondrial mutations can result in a chronic production of superoxide radicals within the cytoplasm [6]. This is especially important given the DNA within the mitochondria is less efficiently repaired [7], and thus at a greater risk to the effects of radiation. In addition, mtDNA mutations have been associated with aging and cancer [8-10].

Early studies out of the Little laboratory were some of the first to note that cells may exhibit damage following radiation that is not from direct exposure. In these studies, they noted an increase in sister chromatid exchanges which were much higher than expected given the low dose exposure the cells received [11]. This elevated level also lasted for many generations following the exposure, indicating a persistent nature of the insult. Since this time additional studies investigating the nature of this damage have been initiated and more recent work has revealed an important role for the mitochondria in non-targeted effects (NTE) within cells following radiation [12]. In this latter work they noted that irradiated cells released mtDNA into vesicles that acted as signals to bystander cells, whereas irradiated cells lacking mtDNA did not show an increase in DNA damage levels in un-irradiated bystander cells. This work strengthens the notion that mtDNA play important roles within the cell and influence the DNA damage response in a non-targeted manner.

Mitochondria have essential roles within cells providing energy and generating ATP [13]. Established lymphoblastoid cell lines containing mitochondrial mutations have been used to study how radiation effects may differ in cells with defective mitochondria [14,15]. One such line, from a patient with Leigh’s syndrome, contains a mutation in a region of the mtDNA that encodes for the ATP6 gene, a part of complex V in ATP synthesis [16]. Another cell line is from a patient with Leber’s optic atrophy and has a mutation in the ND4 gene, a component of complex I in the ATP synthesis machinery [17]. A previous study by Kulkarni et al., [15] noted that cell lines with mitochondrial mutations responded uniquely to ionizing radiation as compared to normal human lymphoblastoid cells, showing increased chromosomal aberrations and reduced mitotic indices. Further subsequent work from this same group [14] also revealed differences in mitochondrial gene expression over time post radiation exposure and suggested that people with these mitochondrial mutations are likely sensitive to mutagens and that caution should be used if they are provided radiation therapy.

In this study we were interested in better understanding the contribution defective mitochondria have on the biological effects observed post a dose of radiation which most normal cells can easily repair damages (0.5 Gy). To test the impact of radiation on cells containing defective mitochondria, we assayed DNA damage foci and telomere length kinetics over time, focusing on persistent and late effects (weeks post exposure), in lymphoblastoid cells with and without known mitochondrial defects. Much later time points were focused on due to the link between persistent longer-term DDR signaling and cancer [18]. Additionally, given that differential effects may be expected following low vs high LET radiation exposure, we also assayed telomere length changes in these cell lines exposed to both radiation qualities. In total, our findings implicate the mitochondria as playing an important role in the biological effects observed, and suggest that particular mitochondrial defects result in more or less severe outcomes.

Methods

Cell Lines

All lymphoblastoid cell lines were acquired from Coriell cell repositories (Camden, NJ) and passaged to produce enough frozen down stocks of similar passage for these experiments. GM15510 and GM15036 are normal human lymphoblastoid cell lines without known mutations, whereas GM13740 and GM10744 are cell lines containing mitochondrial mutations. GM13740 was obtained from a male subject 12 years of age, diagnosed with Leigh Syndrome. GM13740 contains a T to G transversion at the nucleotide pair 8993, resulting in a leucine to arginine at position 156 in subunit 6 of the mitochondrial H(+)-ATPase. GM10744 is from a male 53-year-old subject diagnosed with Leber Optic Atrophy, and contains a causing a guanine to adenine transition mtDNA mutation at position 11778 (11778G>A) in the NADH dehydrogenase subunit 4 gene (MTND4). All cell lines were cultured in 1640 RPMI medium (Gibco) containing 15% Fetal bovine serum (Gibco), 1.1% Antibiotic-antimitotic (Gibco) and 2 mM L-glutamine (Gibco). Cell culture flasks were kept in a humidified incubator at 37°C and at 5% CO2 concentration.

Radiation Exposures

Cells were seeded at 1 x 10⁶ cells/mL in 8 mL of culture medium and placed into T25 vented flasks (Corning) for each timepoint acquisition and incubated overnight. Cells were then exposed to 0 Gy (Control) and 0.5 Gy of X-ray at a dose rate of approximately 0.55 Gy/min using a Faxitron X-Ray Source. Once irradiated, the cells were returned to the incubator and harvested on days 1, 3, 8, 10, 13, and 16 days (depending upon the endpoint, not all days were each endpoint collected, see figures for specifics) post X-Ray or Fe ion exposure. For 1 GeV/um Fe ion exposure NASA’s Space Radiation Laboratory (NSRL) was used. Fe ion exposure was at a dose rate of approximately 23.52 cGy/min. NSRL uses heavy ions from Brookhaven National Laboratory’s (Upton, NY) booster accelerator to produce the various ion beams used for testing cellular effects to space radiation.

Growth Curve

Cells were counted and set up in multiple T25 flasks, and total numbers of cells were counted on various days following this initial set up. Half the flasks for each line were irradiated to define effects of 0.5 Gy dose of X-ray on growth. Separate flasks were set up in duplicate to count on days 1, 3, 8, 10, 13, and 16 post X-ray or mock irradiation. Flasks for future cell counts were all fed on days which cell counts were performed. To count cells, cells were removed from flasks, spun down, supernatant removed and trypan blue used to define % viability (typically between 75-90% for all lines) on each day counts were taken. Cells from a portion of the culture were also counted on a coulter counter to define absolute numbers of cells within the culture. The average number of total cells on each day with SEM is shown in Figure 1. The population doublings were calculated during exponential growth from counts on Days 3 and 10 and compiled in Table 1.

fig 1(1)

fig 1(2)

Figure 1: Growth curves for wild type (GM15510 and GM15536) and mitochondrial defective (GM13740 and GM13744) lymphoblastoid lines. Comparison of growth for lines without radiation (A) and following 0.5 Gy of X-ray (B). The growth for each line is also compared below this for control (0 Gy) and irradiated (0.5 Gy), for GM15510 (C), GM15036 (D), GM13740 (E) and GM10744 (F). Cells were seeded into multi-well plates on day 0 and counted on days 1, 3, 8, 10, 13 and 16.

Table 1: Days required for one population doubling for each lymphoblastoid line.

Cell Line

0 Gy

0.5 Gy

GM15510

2.47

3.70

GM15036

2.67

3.56

GM13740

2.98

4.45

GM10744

3.21

5.69

Gh2ax Foci Staining and Analysis

On days 1, 3, and 13 post X-ray exposure cells were plated onto poly-l-lysine coated chamber slides (Lab Tek), fixed twice with 1.5% PFA for 10 minutes at room temperature, followed by a 100% methanol fixation for 10 minutes at 4°C. Within a week post fixation, slides were subsequently stained for γH2AX. Primary and secondary antibodies were diluted 1:1 in a 1%BSA/Odyssey Buffer (LI-COR, Lincoln, NE) mixture. Cells were blocked with 1% BSA for one hour and then incubated with an anti-phospho-histone H2A.X (Ser139) antibody, clone JBW301, at a dilution of 1:600 (Millipore, Sigma, Burlington, MA). Wells were washed three times for 10 minutes each with a 1:1 solution of 1%BSA in PBS and Odyssey Buffer mixture, and then incubated with a secondary antibody (1:800) Alexa Fluor 594 goat anti-rabbit (Life Technologies, Carlsbad, CA). Cells were washed two times in PBS for 10 minutes each before counterstaining with 300 nM DAPI. Cells were mounted with Vectashield Mounting Medium (Vector Laboratories, Burlingame, CA) and imaged using a Nikon Eclipse TE2000 Inverted microscope with a 40X Objective. Two independent experiments were performed a total of at least 400 cells were scored for each cell line and treatment group to define numbers of gH2AX radiation induced foci (RIF). In a few cases we were unable to score 400 cells, and in these cases between 130-275 cells were scored.

Telomere Length Measurements

The Flow-FISH Assay for Quantifying Telomere Length

The Telomere PNA (peptide nucleic acid) Flow-FISH/ FITC kit (Agilent, Santa Clara, CA) was used to examine telomere length on days 3 and 16 post X-Ray or Fe ion exposure. Briefly, cells were counted and 1 x 10⁶ cells frozen down in 80% FBS/20% DMSO on each day of collection and kept at -80°C until further analysis. Vials were thawed at 37°C, brought up in medium containing 10% serum and washed in PBS. Each sample was divided into four aliquots and placed into 1.5 ml Eppendorf tubes and labeled A-D. Samples were centrifuged at 500 x g and supernatant removed. 300 ul of hybridization solution was added to 2 of the tubes and 300 ul of telomere PNA/Probe/FITC in Hybridization solution was added to the other 2 tubes. Lids were closed and tubes mixed by vortexing. The tubes were placed on a pre-warmed heating block adjusted to 82°C. Tubes were removed after 10 minutes and again mixed using the vortex and placed in the dark at room temperature overnight. The following day 1 ml of 1X wash solution was added to each of the 4 tubes and vortexed. The tubes were then placed on a pre-warmed heating block at 40°C for 10 minutes. Samples were then mixed on the vortex and centrifuged at 500 x g. This was repeated a second time following removal of the supernatant and a DNA staining solution (containing RNAse and PI) was then added and samples were left at 2-8°C for 2-3 hours prior to analysis on a BD FACSCalibur flow cytometer.

Analysis of Flow Cytometry Files

Samples were analyzed using a logarithmic scale FL1-H for FITC probe (levels of FITC corresponding to lengths of telomere) and on linear scale FL3-H for DNA staining. Samples were analyzed using Flowjo software (Becton Dickinson) and strategy for gating is noted in Figure 2. For analysis, the average fluorescent levels (corresponding to the length of the telomere) for each sample are compared to its non-irradiated control level of fluorescence.

fig 2

Figure 2: Gating Scheme for telomere analysis. A visual example of a cell stained with PNA telomere probe in (A). Stained cells were analyzed on a BD FACSCaliber and resulting files gated using Flowjo software (BD). Primary cell population was gated on in FSC vs SSC (B) and doublets were eliminated by plotting FL1 (H) vs (W) (C). This gated population was then used to identify the G1 population (D) and the mean FL1 (FITC) fluorescence (E) was then determined based on the total G1 population of cells. Mean FL1 values are compared to controls levels to provide the relative telomere lengths for each cell line and treatment.

Statistical Analysis

To examine potential cell line differences for telomere length changes and for the percentage of cells with >3 foci, we utilized a resampling statistical procedure to construct a bootstrapped sampling distribution of the difference between values for each comparison. Each bootstrap distribution was constructed from 10,000 resamples, which were then used to construct a 95% confidence interval of the resulting differences. Using this method, and under a null of no difference, confidence intervals not containing a zero difference are significant at p < 0.05. We utilized the program R bootstrapping routine (as implemented in artofstat.com/web-apps).

Results

Growth of Lymphoblastoid Lines

The growth rate plus and minus 0.5 Gy X-ray was defined for each lymphoblastiod line (Figure 1). Cell counts were defined on days 1-16 after having seeded 5 x 10⁶ cells on day 0. Duplicate samples were set up and counted each day using a coulter counter (Beckman Coulter, Indianapolis, IN).

All lines grew fairly similarly both plus and minus radiation with the exception of one of the mitochondrial mutant lines, GM10744, appeared to slightly decrease the growth rate for all cell lines. When viewing population doubling times as calculated during exponential growth (Day 3 to Day 10) for each line (Table 1) the mitochondrial mutant lines showed a slightly higher number of days needed for a population doubling as compared to the normal wild type lines, both with and without radiation.

Gh2ax Foci Kinetics

The kinetics of γH2AX radiation induced foci (RIF) were defined over time post 0.5 Gy X-ray. γH2AX are generally regarded to be a marker a marker of DNA double strand breaks (DSB) [19], and the activation of the DNA damage response (DDR) has been shown to be an important element in the progression of cancers [2,20]. Levels of RIF were binned based on the number of foci per cell and the number of cells containing greater than 3 foci quantified for days 1, 3 and 10 post X-ray exposure (Figure 3). which grew at a lower rate as compared to the other lines. In comparing each line’s growth following 0.5 Gy X-ray to the same line without radiation (C-F), radiation.

Normal control cells can contain lower numbers of RIF in the process of normal growth, so to better distinguish cells that were more heavily affected by the radiation exposure we centered on cells with at least 3 RIF. A representative image of cells showing various binned categories of foci is shown in Figure 3A. Our results show fairly similar levels of foci in control non-irradiated cells for all cell lines. Day 1 post radiation maximal levels were observed for all lines (Figure 3B), with the mitochondrial defective line (GM10744) showing the greatest induction. Levels of RIF decreased for wild type cells in subsequent days but remained elevated over control for the two mitochondrial defective lines. On day 10 post radiation, we observe that both GM15510 and GM15536 returned to per-radiation levels. Only the mitochondrial defective lines GM13740 and GM10744 showed residual foci above control levels. This persistent DDR would predict that these cell lines would have a greater potential of becoming genomically unstable and having a greater risk of becoming transformed.

fig 3(1)

fig 3(2)

Figure 3: Kinetics of gH2AX foci post 0.5 Gy X-ray. A representative image of cells taken using a 40X objective shows the various categories of foci scored for each cell line, treatment and day (A). The percent of cells with greater than 3 RIF in averaged control samples and on days 1, 3 and 10 post exposure for all lines (B) and for each line separately (C–F).

Radiation Quality Effects on Telomere Length and Influence of Mitochondrial Mutations

The change in telomere length following X-ray exposure was also monitored on days 3 and 16 (Figure 4). Relative telomere lengths as compared to controls are plotted. Significant differences are noted on day 3 between the mitochondrial defective line GM10744 and both GM15536 (WT) and GM13740 on day 3. GM10744 was the only line to show a lengthening of the telomere on day 3 which increased further in length on day 16. On day 16 significant differences were noted between both WT lines, with GM15536 showing a slightly higher average length and GM15510 a slightly lower average telomere length. All lines on day 16 were significantly different from GM10744 which showed a marked increase in average telomere length. Given low LET radiation, like X-ray, is known to produce its more of its effects through indirect action, whereas high LET radiation, like Fe ions, is known to produce more direct effects, we chose to also compare telomere length changes for these lines following a high LET exposure. Following high LET exposure, we did not see the persistent lengthened telomere phenotype we noted post X-ray but instead a shorter averaged telomere length on both day 3 and 16 for the mitochondrial defective cell line GM10744. All lines showed significant differences with GM10744 on both days. The WT line GM15510 also showed a longer average telomere length on day 3 post Fe ion but then returned to close to base line levels on day 16. It is of interest that opposite effects are observed for the mitochondrial mutant line GM10744 depending on whether the exposure is a result of high or low LET radiation, and that persistent effects are observed and appear to be unresolved even weeks post exposure.

fig 4(1)

fig 4(2)

Figure 4: Relative average telomere lengths for various lymphoblastoid cell lines. Average relative telomere lengths were determined for each cell line on day 3 post X-ray (A), day 16 post X-ray (B), day 3 post 1 GeV/um Fe ion exposure (C) and day 16 post 1 GeV/um Fe ion exposure (D). The Y axis is the relative telomere length as compared to control fluorescence levels, thus if equal to control levels it would have a value of 1.0.

Discussion

In total, this work suggests that mitochondrial mutations may be important in affecting radiation outcomes and potentially impacting cancer risk. Persistent DNA DSBs have been shown to serve as a biomarker of cancer and was one of the endpoints we chose to assay over time. In addition, telomere length has been associated with cancer risk, thus another endpoint assayed for in this study. We used lymphoblastoid lines with and without known mitochondrial mutations to help shed light on the importance of the mitochondria on the biological outcome following radiation exposure and its effect on cancer risk.

In terms of cell growth, both mitochondrial defective lines revealed slightly delayed growth, exhibiting longer population doubling times, both with and without radiation (Figure 1 and Table 1). In comparing the effects on growth with and without radiation within each cell line, wild type lines showed a decrease of 50% in population doubling comparing irradiated samples to controls, whereas irradiated mitochondrial defective lines decreased population doubling time by 70% of control values. Thus, there was a slightly greater effect of radiation on the growth in the mitochondrial mutant cells. Previous work by Kulkarni et al. [14] comparing the normalized cell viability for GM15036, GM13740 and GM10744 using the MTS assay, revealed that GM13740 appeared resistant to radiation as compare to other lines. In addition, GM13740 showed a slight decrease in normalized cell viability as compared to controls. This would indicate that the mitochondrial mutant line GM10744 grows equally well whether irradiated or not and only GM13740 shows a decrease in viability following radiation exposure using the MTS assay. Our results using standard absolute counts did not reveal GM10744 to show any greater resistance to radiation, in fact all lines showing a slight decrease with irradiation. We suspect the differences observed between our results and the work by Kuldarni et al. [14] are due to the assay used and the normalization of viability. Although the slight differences in growth we observed were not a major point of in this paper, future studies verifying these differences using a different method of quantifying the changes would be important to conclusively prove how growth is affected with and without radiation in these mitochondrial cell lines.

Other higher dose gH2AX studies have been done previously by others with these cell lines (2 and 4 Gy) looking at earlier time points (1-24 h) post exposure [14]. In this previous work they observed that post radiation exposure GM13740 had more breaks than either GM10744 or GM15036 at both 1 and 24 h timepoints. Whereas GM10744 and GM15036 levels of phosphorylation returned to baseline by 24 h. In our studies evaluating the kinetics of DNA damage response at later time points, to define persistent DDR, we noted that the mitochondrial mutant line, GM10744, revealed the greatest induction as well as the greatest persistence over the period of study (Days 1-10). However significant differences (p<0.05) were only noted on days 3 and 10, and only between one of the wild type lines, GM15036 and the mitochondrial mutant line, GM10744 (Figure 3B). In comparing levels within each cell line on each day, significant differences were noted in wild type line, GM15510, between control and day 1, and control and day 3. The other wildtype line, GM15036, did not show much of an induction on day 1 and revealed levels fluctuating around control on subsequent days. The mitochondrial mutant line, GM13740, revealed a unique pattern of a slight induction, which did not vary on subsequent days and remained at this persistently elevated state that was not significantly elevated over controls. Lastly, the second mitochondrial mutant line, GM10744, showed maximal phosphorylation levels on day 1, and some reduction on subsequent days, still showing significant elevation on days 3 and 10, and the greatest level of persistent DDR for any of the lines. Thus, our results suggest that mitochondrial mutations can impact the level of DNA damage signaling and its persistence, both of which are known risk factors in cancer [7]. Our results at 0.5 Gy fit well with previous work looking at levels of expression of various DNA repair genes in these cell lines. Following the 0.5 Gy dose the GM13740 line did not show a decrease in the repair genes, whereas the GM13744 line did. At higher doses (1-4 Gy) however, both of these cell lines showed a reduction in DNA repair protein expression (~50% reduction).

Telomeres play important roles in chromosome maintenance and genome stability, and previous studies have suggested a connection between telomere dysfunction and cancer initiation and development [8]. Thus, in the current work we also assayed telomere length for changes post radiation in this cohort of cell lines. Our results at 0.5 Gy fit well with previous work looking at levels of expression of various DNA repair genes in these cell lines [20]. Following the 0.5 Gy dose the GM13740 line did not show a decrease in the repair genes, whereas the GM13744 line did. At higher doses (1-4 Gy) however, both of these cell lines showed a reduction in DNA repair protein expression (~50% reduction). As high LET radiation is thought to exert its effects through more of a direct, rather than indirect mechanism (that often involves ROS), we also assayed telomere length following a 0.5 Gy dose of 1 GeV/um Fe ion exposure. Surprisingly, unique effects were observed following high LET as compared to low LET radiation. The mitochondrial mutant line, GM10744, showed a significantly shorter telomere length than any of the other lines and this shorter length was persistent from day 3 to day 16. Other differences were also noted in the other cell lines comparing high to low LET radiation, including an early lengthening and delayed lengthen for the wild type lines, GM15510 and GM15036, respectively. GM13740, the other mitochondrial mutant line showed a greater shortening with high LET exposure, which was significantly different from wild type lines on day 3 but then lengthened to wildtype line GM15036 length by day 16. Thus, all telomeres appear to be more destabilized following the high LET radiation but in particular mitochondrial mutant lines are more severely affected.

Prior telomere studies have more often seen a link between short telomeres and certain cancers (skin, urogenital, breast, lung, head and neck and lymphoma [21-27]. However, additional published work has indicated various disease states are related to extremes in both short and long telomere lengths, and suggested that long telomeres carried a greater risk of cancer susceptibility than short telomere length in humans [28]. Cancers which have been associated with long telomeres include melanoma [29,30], soft tissue sarcomas [31] and non-Hodgkin lymphoma [3]. Thus, both extremes in both long and short telomeres as measured in peripheral blood lymphocytes may increase cancer risk. The rationale for the link between shortened telomeres and cancer risk is that short telomeres are unable to properly cap the ends of their chromosomes and these sticky ends can then fuse to other chromosomes, resulting in genomic instability. However, the molecular mechanisms for telomere lengthening is uncertain, but been speculated that longer telomeres cause an elevated cancer risk as they allow cells to continue to proliferate, evade cellular senescence, and this then allows these cells to accumulate genetic lesions [32]. Future studies would be needed to uncover the mechanism involved and to determine whether additional cancer types are associated with a longer or shorter telomere phenotype and the relationship to radiation quality.

There are at three primary ways that have been used to measure telomere length, and strengths and weakness for each method. In this study we chose to perform flow FISH as previous work had shown it to be more accurate and reproducible as compared to the qPCR method to determine telomere length [33]. Flow-FISH was also shown to have a better agreement with TRF analysis results by Southern blot (typically much more labor-intensive but often regarded as the gold standard) as compared to qPCR [33]. Thus, we believe our study results using flow FISH are accurate but further studies using another means could be useful in validating our results.

Although the work suggests that mitochondrial mutations may impact the DNA damage kinetics and telomere length of the cells following radiation, to better substantiate these findings additional experiments using the GM10744 corrected for this mutation should be studied. Cell lines corrected for this mutation and/or another cell lines with the same mutation in MTND4, would aid in more firmly establishing the importance of mitochondrial mutations and their effect on these processes and their potential link to cancer development.

Conclusion

In total this work reveals that both the DDR and telomere dysfunction are more prevalent in cells containing mitochondrial mutations. The severity of the effect however appears to related to the underlying mitochondrial mutation. This work suggests that damage to mtDNA may lead to increases in genomic instability and pave the way to a greater cancer risk. This work also highlights the fact that different qualities of radiation impact the biological results and predict that high LET radiation may be more damaging. Future more detailed studies monitoring ROS expression and its relationship to DDR and telomere length, as well as assaying for telomerase levels may help to better understand the mechanism linking defective mitochondria to these findings and the relationship to cancer formation.

References

  1. Kadhim M, Salomaa S, Wright E, Hildebrandt G, Belyakov OV , et al. (2013) Non-targeted effects of ionising radiation–implications for low dose risk. Res 752: 84-98. [crossref]
  2. Bartkova J, Horejsi Z, Koed K, Kramer A, Tort F, et al. (2005) DNA damage response as a candidate anti-cancer barrier in early human tumorigenesis. Nature 434: 864-870. [crossref]
  3. Lan Q, Cawthon R, Shen M, Weinstein SJ, Virtamo J, et al. (2009) A prospective study of telomere length measured by monochrome multiplex quantitative PCR and risk of non-Hodgkin lymphoma. Clinical cancer research an official journal of the American Association for Cancer Res 15: 7429-7433. [crossref]
  4. Rowe LA, Degtyareva N, Doetsch PW (2008) DNA damage-induced reactive oxygen species (ROS) stress response in Saccharomyces cerevisiae. Free rad. biol. & med 45: 1167-1177. [crossref]
  5. Yang JL, Weissman L, Bohr VA, Mattson MP (2008) Mitochondrial DNA damage and repair in neurodegenerative disorders. DNA repair 7: 1110-1120. [crossref]
  6. Hahn A, Zuryn S (2019) Mitochondrial Genome (mtDNA) Mutations that Generate Reactive Oxygen Species. Antioxidants 8. [crossref]
  7. Yakes FM, Van Houten B (1997) Mitochondrial DNA damage is more extensive and persists longer than nuclear DNA damage in human cells following oxidative stress. PNAS 94: 514-519. [crossref]
  8. Jakupciak JP, Maragh S, Markowitz ME, Greenberg AK, Hoque MO, et al. (2008) Performance of mitochondrial DNA mutations detecting early stage cancer. BMC cancer 8: 285. [crossref]
  9. Sun N, Youle RJ, Finkel T (2016) The Mitochondrial Basis of Aging. Cell 61: 654-666. [crossref]
  10. Brandon M, Baldi P, Wallace DC (2006) Mitochondrial mutations in cancer. Oncogene 25: 4647-4662.
  11. Nagasawa H, Little JB (1992) Induction of sister chromatid exchanges by extremely low doses of alpha-particles. Cancer res 52: 6394-6396. [crossref]
  12. Ariyoshi K, Miura T, Kasai K, Fujishima Y, Nakata A, et al. (2019) Radiation-Induced Bystander Effect is Mediated by Mitochondrial DNA in Exosome-Like Vesicles. Scientific reports 9: 9103.
  13. Trifunovic A, Wredenberg A, Falkenberg M, Spelbrink JN, Rovio AT, et al. (2004) Premature ageing in mice expressing defective mitochondrial DNA polymerase. Nature 429: 417-423.
  14. Kulkarni R, Marples B, Balasubramaniam M, Thomas RA, Tucker JD (2010) Mitochondrial gene expression changes in normal and mitochondrial mutant cells after exposure to ionizing radiation. Res 173: 635-644. [crossref]
  15. Kulkarni R, Reither A, Thomas RA, Tucker JD (2009) Mitochondrial mutant cells are hypersensitive to ionizing radiation, phleomycin and mitomycin C. Res 663: 46-51. [crossref]
  16. Sofou K, De Coo IF, Isohanni P, Ostergaard E, Naess K, et al. (2014) A multicenter study on Leigh syndrome disease course and predictors of survival. Orphanet journal of rare diseases 9: 52. [crossref]
  17. Yu-Wai-Man P, Griffiths PG, Hudson G, Chinnery PF (2009) Inherited mitochondrial optic neuropathies. Journal of medical genetics 46: 145-158. [crossref]
  18. Noda A (2018) Radiation-induced unrepairable DSBs their role in the late effects of radiation and possible applications to biodosimetry. rad. Res 59. [crossref]
  19. Bonner WM, Redon CE, Dickey JS, Nakamura AJ, Sedelnikova OA, et al. (2008) GammaH2AX and Nat. Rev. Cancer 8: 957-967. [crossref]
  20. Gorgoulis VG, Pefani DE, Pateras IS, Trougakos IP (2018) Integrating the DNA damage and protein stress responses during cancer development and treatment. Pathol 246: 12-40. [crossref]
  21. Kulkarni R, Thomas RA, Tucker JD (2011) Expression of DNA repair and apoptosis genes in mitochondrial mutant and normal cells following exposure to ionizing radiation. mol. Mutagen 52: 229-237. [crossref]
  22. Deng Y, Chang S (2007) Role of telomeres and telomerase in genomic instability, senescence and cancer. Laboratory investigation a journal of technical methods and pathology 87: 1071-1076. [crossref]
  23. Wang Z, Zhang Z, Guo Y, Shui H, Liu G, et al. (2018) Shorter Telomere Length Is Associated with Increased Breast Cancer Risk in a Chinese Han Population A Case-Control Analysis. breast cancer 21: 391-398. [crossref]
  24. Yamada-Hishida H, Nobeyama Y, Nakagawa H (2018) Correlation of telomere length to malignancy potential in non-melanoma skin cancers. Oncology let 15: 393-399. [crossref]
  25. Jang JS, Choi YY, Lee WK, Choi JE, Cha SI, et al. (2008) Telomere length and the risk of lung cancer. Cancer science 99: 1385-1389. [crossref]
  26. Yamada S, Misawa K, Mima M, Imai A, Mochizuki D, et al. (2021) Telomere shortening in head and neck cancer association between DNA demethylation and survival. Cancer 12: 2165-2172. [crossref]
  27. Widmann TA, Herrmann M, Taha N, Konig J, Pfreundschuh M (2007) Short telomeres in aggressive non-Hodgkin’s lymphoma as a risk factor in lymphomagenesis. Hem 35: 939-946.
  28. McNally EJ, Luncsford PJ, Armanios M (2019) Long telomeres and cancer risk the price of cellular immortality. Clin. Invest 129: 3474-3481. [crossref]
  29. Nan H, Du M, De Vivo I, Manson JE, Liu S , et al. (2011) Shorter telomeres associate with a reduced risk of melanoma development. Cancer res 71: 6758-6763. [crossref]
  30. Burke LS, Hyland PL, Pfeiffer RM, Prescott J, Wheeler W, et al. (2013) Telomere length and the risk of cutaneous malignant melanoma in melanoma-prone families with and without CDKN2A mutations. PloS one 8: e71121. [crossref]
  31. Xie H, Wu X, Wang S, Chang D, Pollock RE, et al. (2013) Long telomeres in peripheral blood leukocytes are associated with an increased risk of soft tissue sarcoma. Cancer 119: 1885-1891. [crossref]
  32. Hackett JA, Greider CW (2002) Balancing instability dual roles for telomerase and telomere dysfunction in tumorigenesis. Oncogene 21: 619-626. [crossref]
  33. Gutierrez-Rodrigues F, Santana-Lemos BA, Scheucher PS, Alves-Paiva RM, Calado RT (2014) Direct comparison of flow-FISH and qPCR as diagnostic tests for telomere length measurement in humans. PloS one 9: e113747. [crossref]

How are Vitamin B12 and S-Adenosylmethionine Related?

DOI: 10.31038/IMROJ.2021642


An important biological form of Vitamin B12, known as coenzyme B12 or 5’-deoxyadenosylcob(III)alamin (AdoCbl), features a weak covalent bond between cobalt(III) and C5’ of 5’-deoxyadenosine. AdoCbl functions as a coenzyme for enzymes that catalyze isomerization reactions following a chemical pattern in which a carbon-bound hydrogen changes places with a group bonded to an adjacent carbon. Approximately a dozen such reactions are known in mammals and bacteria, but not in plants. These include methylmalonyl-coenzyme A mutase, glycol dehydratases, glutamate mutase, lysine 5,6-aminomutase and others. All of these reactions proceed by homolytic scission of the Co(III)—C5’ bond in AdoCbl to form cob(II)alamin and the 5’-deoxyadenosyl-5’-yl radical, which abstracts a hydrogen atom from the substrate to form, transiently, 5’-deoxyadenosine and a substrate-based radical. The substrate radical undergoes the requisite rearrangement to the product-related radical, which is quenched by hydrogen transfer from C5’ of 5’-deoxyadenosine to form the final product and regenerate AdoCbl.

For many years the AdoCbl-dependent reactions were regarded as a unique family [1]. However, in 1970 H. A. Barker and associates discovered a pyridoxal phosphate (PLP)) and S-adenosyl-L-methionine (AdoMet)-dependent lysine-2,3-aminomutase (LAM) in bacteria and found it to follow the chemical pattern of AdoCbl-dependent lysine 5,6-aminomutase but not to require AdoCbl [2]. In 1987 Moss and Frey found that C5’ in the 5’-deoxyadenisyl group of AdoMet mediates H-transfer in exactly the same manner as the 5’-deoxyadenosyl moiety of AdoCbl in the B12-dependent reactions [3].

In AdoMet, the bond linking C5’-of the 5’-deoxyaenosyl group to sulfur in methionine is strong (> 60 kcal/mol), unlike the weak Co‑C5’ bond in AdoCbl, (31 kcal/mol) complicating cleavage of AdoMet to the 5’-deoxyadenosyl radical. The finding of an iron-sulfide cluster in LAM in 1991-92 [4,5] offered a possible solution. LAM purified anaerobically was found to contain a [3Fe–4S] cluster and to be activated by Fe2+ and a reducing agent, to form [4Fe–4S]1+. Electron transfer from the reduced cluster to AdoMet could lead to cleavage of the C5’—S bond, with transient formation of the 5’-deoxyadenosyl radical.

Electron transfer-dependent cleavage of AdoMet suggested a chemical reaction mechanism involving four radicals. Lysine bound through its 6-aminogroup as an aldimine with PLP could react with the 5’-deoxyadenosyl radical to form the PLP-lysyl-C3 radical, which would rearrange to a PLP-lysyl-C2 radical through an aza-cyclopropyl radical intermediate. Three of these four radicals have been identified as kinetically competent intermediates by rapid-mix freeze-quench electron paramagnetic spectroscopy [6].

AdoMet, formerly regarded solely as the principal biochemical methylating agent, was found to be required for four apparently unrelated enzymes in 1984-2000: pyrivate-formate lyase [7,8], biotin synthase [9], lipoyl synthase [10], and anaerobic ribonucleoside triphosphate reductase [11]. All of the reactions involved the cleavage of unreactive C–H bonds in substrates, and all of them were found in the 1990s to incorporate the [4Fe–4S] cluster.

By the turn of the century, the genes encoding the above-referenced enzymes had been published. Heidi J. Sofia and her associates compared the translated amino acid sequences of these enzymes and found the iron-sulfide binding motif CxxxCxxC in common. They then searched the available genomic database for this motif and an AdoMet binding motif. They found nearly 600 proteins with the CxxxCxxC and an AdoMet binding motif in the database available at that time [12]. The members of this group were associated with more than forty distinct biochemical processes in all three kingdoms of life. Dr. Sofia and associates named this the Radical SAM superfamily.

At the time of its discovery, the Radical SAM enzymes engaged in catalysis of key steps in metabolism, the biosyntheses of vitamins and antibiotics, chemical modifications of enzymes and nucleic acids, activation of glycyl radical enzymes,, and maturation of complex metalloenzymes, as well as methylation of chemically unreactive, non-nucleophilic carbon and phosphorus atoms in metabolites. With the increase in genomic information, the size of the Radical SAM superfamily has grown to more than 500,000 proteins engaged in more than 90 distinct biological processes. Increasingly penetrating mechanistic investigations have verified the intermediacy of the 5’-deoxyadenosyl radical [13,14]. The number of Radical SAM enzymes utilizing AdoMet as the source of the 5’-deoxyadenosyl radical now outnumbers those utilizing AdpCbl by a factor of at leas six. The former primacy of AdoCbl in this capacity is overthrown by the simpler molecule AdoMet. Presumably, the Radical SAM enzymes preceded the AdoCbl enzymes in evolution.

References

  1. Frey PA (2010) Cobalamin coenzymes in enzymology. In Comprehensive Natural Products II Chemistry and Biology, Mander L, Lui HW, (Eds.), Elsevier: Oxford 7: 501-546.
  2. Chirpich TP, Zappia V, Costilow RN, Barker HA (1970) Lysine 2,3-aminomutase. Purification and properties of a pyridoxal phosphate and S-adenosylmehtionine-activated enzyme. J Biol Chem 245: 1778-1789. [crossref]
  3. Moss M, Frey PA (1987) The role of S-adenosylmethionine in the lysine 2,3-aminomutase reaction. J Biol Chem 262: 14859-1462. [crossref]
  4. Petrovich RM, Ruzicka FJ, Reed GH, Frey PA (1991) Metal cofactors of lysine 2,3-aminomutase. J Biol Chem 266: 7656-7660.
  5. Petrovich RM, Ruzicka FJ, Reed GH, Frey PA (1992) Characterization of iron-sulfur clusters in lysine 2,3-aminomutase by electron paramagnetic resonance spectroscopy. Biochemistry 31: 10774-10781. [crossref]
  6. Frey PA, Hegeman AD, Ruzicka FJ (2008) The radical SAM superfamily. Crit. Rev. Biochem Mol Biol 43: 63-88. [crossref]
  7. Knappe J, Neugebauer FA, Blaschkowski HP, Gänzler M (1984) Post translational activation introduces a free radical into pyruvate-formate lyase. Proc Natl Acad Sci USA 81: 1332-1335. [crossref]
  8. Broderick JB, Henshaw TF, Cheek J, Wojtuszewski K, Smith SR, et al. (2000) Pyruvate formate lyase-activating enzyme: strictly anaerobic isolation yields active enzyme containing a [3Fe–4S]+ cluster. Biochem Biophys Res Commun 269: 451-456. [crossref]
  9. Sanyal I, Cohen G, Flint DH (1994) Biotin synthase: purification, characterization as a [2Fe–2S] cluster protein, and in vitro activity of the Escherichia coli bioB gene product. Biochemistry 33: 3625-3631. [crossref]
  10. Ollagnier-de Choudens S, Fontecave M (1999) The lipoate synthase from Escherichia coli is an iron-sulfur protein. FEBS Lett. [crossref]
  11. Ollagnier S, Mulliez F, Schmidt PP, Eliasson R, Gaillard J, et al. (1997) Activation of the anaerobic ribonucleotide reductase from Escherichia coli. The essential role of the iron-sulfur center for S-adenosylmethionine reduction. J Biol Chem 272: 24216-24223. [crossref]
  12. Sofia HJ, Chen G, Hetzler BG, Reyes-Spindola JF, Miller NE (2001) Radical SAM, a novel protein superfamily linking unresolved steps in familiar biosynthetic pathways with radical mechanisms: functional characterization using new analysis and information visualization methods. Nucleic Acids Res 29: 1097-1106. [crossref]
  13. Magnusson OT, Reed GH, Frey PA (2001) Characterization of an allylic analogue of the 5’-deoxyadenosyl radical: an intermediate in the reaction of lysine 2,3-aminomutase. Biochemistry 40: 7773-7782. [crossref]
  14. Broderick WE, Hoffman, BM, Broderick JB (2018) Mechanism of radical Initiation in the radical S-adenosyl=l=methionine superfamily. Acc Chem Res 51: 26.

Ovarian Cystadenocarcinoma with an Osteosarcoma Component

DOI: 10.31038/IMROJ.2021641

Abstract

Ovarian cystadenocarcinoma with an osteosarcoma component, is a very rare tumor. We aimed to describe a case of an osteosarcoma arising in an ovarian squamous cell carcinoma.

Keywords

Chemotherapy, Ovary osteosarcoma, Surgery

Introduction

Ovarian, cystadenocarcinoma with an osteosarcoma component (OCS) also known as malignant mixed müllerian tumor (MMMT), is a very rare gynecological malignancy accounting for 1-3% of ovarian malignancies [1]. OCS is a mixed tumor composed of carcinomatous and sarcomatous components. The sarcomatous component may be either homologous, including endometrial stromal sarcoma, fibrosarcoma and leiomyosarcoma, or heterologous. We report a case of ovarian cystadenocarcinoma with an osteosarcoma component.

Case Presentation

A 63-year-old woman presented a tumor in the abdomen in December 2020. The tumor was restricted. Imaging findings, including computed tomography and magnetic resonance imaging, revealed a multilocular cyst tumor. Imaging also showed that the patient had massive ascites.

Total abdominal hysterectomy, bilateral adnexectomy, omentectomy, lymphadenectomy (pelvic and para-aorta), peritonectomy of vesicouterine excavation, resection of disseminated lesion of Douglas’ pouch and a biopsy of the colonic mesentery were performed without residual disease.

The immunohistochemical analysis showed that the sarcomatous component was positive for vimentin, alpha SMA and CD10 and negative for AE1/AE3, CK7, CK20, desmin, CD31, CD34, AFP, hCG, HMB-45, S-100 and factor VIII; the Ki-67 (MIB-1) index was 30%.

For cystadenocarcinoma the immunohistochemical analysis showed positivity for AE1/AE3 and EMA and negativity for PAS, ALB, CK7, CK20, vimentin, alpha SMA, desmin, CD10, CD34, AFP, HCG, CD56 and synaptophysin, chromogranin; the Ki-67 (MIB-1) index was 25%.

Postoperatively, the patient was treated with six cycles of combination chemotherapy with paclitaxel and carboplatin as adjuvant therapy. The patient was free of disease at the 7-month follow-up consultation.

Discussion

OCS is an extremely rare tumor among ovarian cancers, with a frequency of occurrence of 1-3% [1]. Carcinosarcomas of the female genital tract are often found after menopause at a median age of 60 to 70 years old. OCS has a worse survival rate than high-grade ovarian cancer at the same FIGO stage, with a median overall survival ranging from 7 to 27months [1].

Histologically, OCS contains both carcinomatous (malignant epithelial) and sarcomatous (mesenchymal) components. The sarcomatous component may consist of homologous tissue that are native to the ovary or heterologous tissue not native to the ovary. The optimal treatment of OCS remains uncertain due to this tumor’s rare occurrence. Many cases of OCS undergo surgical treatment and chemotherapy, similar to epithelial ovarian cancer [2]. In one of the larger studies, including 50 patients with OCS, the disease-free survival for patients with complete resection was 19 months. The overall survival of complete resection and optimal and suboptimal surgery is reportedly 47, 18 and 8 months, respectively [3]. Optimal surgical cytoreduction, including total abdominal hysterectomy, bilateral adnexectomy, omentectomy, pelvic and para-aortic lymph node dissection, and tumor debulking is important for improving the prognosis of OCS. Following debulking surgery for OCS, adjuvant chemotherapy is typically recommended. However, there is no consensus regarding the most effective regimen for such a rare malignancy [4]. in this it was difficult to decide on the chemotherapy regimen. The prognosis of ovarian squamous cell carcinoma is extremely poor compared with that of typical epithelial ovarian cancer, which has a 5-year survival rate of 50% in stage I, 25% in stage II, 12% in stage III and 0% in stage IV [5]. In OCS, similar to epithelial ovarian cancer, platinum-based chemotherapy is considered a key drug. Combination chemotherapy, such as carboplatin and paclitaxel or ifosfamide, exhibits a higher response rate than single-agent platinum chemotherapy [5]. Several studies have described the clinical effectiveness of combination chemotherapy with carboplatin and paclitaxel in ovarian squamous cell carcinoma [6,7]. Given the above findings, combination chemotherapy with carboplatin and paclitaxel was selected in the present case.

Conclusion

This is a rare report of Ovarian cystadenocarcinoma with an osteosarcoma. Combination chemotherapy with paclitaxel and carboplatin may be an effective choice as adjuvant. Further study is required in order to identify the best principles of treatment and how to manage the new cytotoxic drug, targeted therapy and immunotherapy for OCS.

References

  1. Berton-Rigaud D, Devouassoux-Shisheeboran M, Ledermann JA, et al. (2014) Gynecologic Cancer InterGroup (GCIG) consensus review for uterine and ovarian carcinosarcoma. Int J Gynecol Cancer 24: S55-60.
  2. Rutledge TL, Gold MA, McMeekin DS, Huh WK, Powell MA, et al. (2006) Carcinosarcoma of the ovary-a case series. Gynecol Oncol 100: 128-132. [crossref]
  3. Rauh-Hain JA, Growdon WB, Rodriguez N, Goodman AK, Boruta DM 2nd, et al. (2011) Carcinosarcoma of the ovary: a case-control study. Gynecol Oncol 121: 477-481.
  4. Shylasree TS, Bryant A, Athavale R (2013) Chemotherapy and/or radiotherapy in combination with surgery for ovarian carcinosarcoma. Cochrane DatebaseSyst Rev 28: CD006246. [crossref]
  5. Kashimura M, Shinohara M, Hirakawa T, Kamura T, Matsukuma K (1989) Clinicopathologic study of squamous cell carcinoma of the ovary. Gynecol Oncol 34: 75-79. [crossref]
  6. Duska LR, Garrett A, Eltabbakh GH, Oliva E, Penson R, et al. (2002) Paclitaxel and platinum chemotherapy for malignant mixed müllerian tumors of the ovary. Gynecol Oncol 85: 459-463. [crossref]
  7. Eltabbakh GH, Hempling RE, Recio FO, O’Neill CP (1998) Remarkable response of primary squamous cell carcinoma of the ovary to paclitaxel and cisplatin. Obstet Gynecol 91: 844-846. [crossref]