Author Archives: author

Heart Involvement in Hemoglobinopathies: Two Case Reports and Brief Review of Litterature

DOI: 10.31038/JCCP.2022511

Background

Hereditary haemoglobin disorders, also termed haemoglobinopathies, include mainly beta -thalassemia and sickle cell disease and represent the most common monogenic disorders in human. Cardiac complications are still a leading cause of mortality and morbidity in patients with haemoglobinopathy, have dramatically reduced in patient populations receiving modern regular therapy and follow-up.

Abstract

Τhe two main determinants of cardiovascular phenotype in haemoglobinopathy patients are the underlying molecular defect responsible for the main disease and the therapy applied for its management. The spectrum of cardiovascular manifestations in haemoglobinopathies is wide and includes ventricular dysfunction, pulmonary hypertension, thromboembolic events.

We report a case of thalassemia and one of sickle cell disease having different clinic phenotype with brief literature review.

Keywords

Heart failure, Hemoglobinopathies, Mortality

Case One

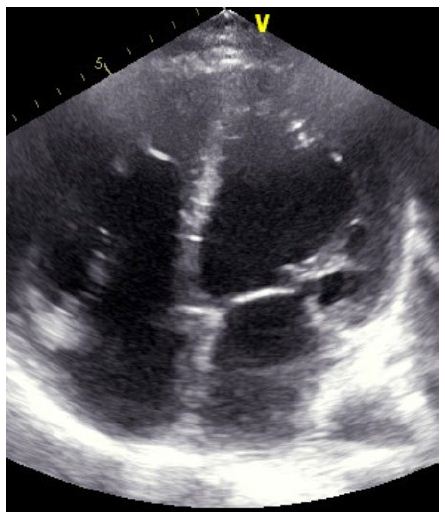
A patient 32-year-old male who was receiving periodic transfusions with intermittent chelation therapy for Cooley’s Anaemia came to our clinic with complaint of dyspnoea on exertion (DOE) in the past two years. The patient was followed up at the haematology department. He had a splenectomy at three years old. On the physical examination the patient had a global heart failure chart, high abundance ascites and hepatomegaly. He was in rapid atrial fibrillation. After treatment of congestion and slowing atrial fibrillation, the patient was explored by an echocardiography. Severe LV systolic dysfunction with a LVEF of about 20%; mitral regurgitation up to moderate degree was observed (Figure 1). The right ventricle is very dilated with massive and laminar tricuspid insufficiency due to lack of coaptation of the cusps thus creating a tricuspid hiatus. A restrictive filling pattern in both ventricles with both ventricular systolic dysfunctions were evident in this patient, also a lower right ventricular function: free wall TDI peak systolic velocity was 7 cm/sec. The patient was probed by MRI revealing advanced hepatic and cardiac hemochromatosis. Endocrine pancreas is also reached in view of high glycaemic dosage relating to secondary diabetes. Our patient died while in hospital because he had an electrical storm.

fig 1

Figure 1: Echocardiography: four chamber 2D apical view : Biventricular dilated cardiomyopathy

Case Two

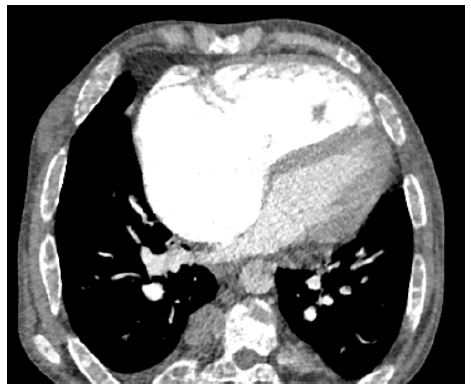
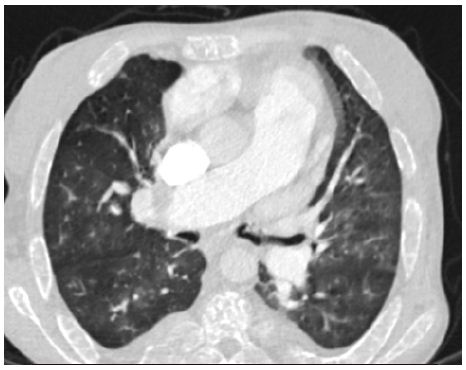
A patient 28-year-old male who was receiving periodic transfusions with intermittent chelation therapy for Sickle cell disease (SCD) came to our clinic with complaint of dyspnoea on exertion (DOE) in the past two years. The patient was followed up at the haematology department; she was on foldin, hydrea and vitamin C. On the physical examination the patient had only an enlarged jugular vein, high abundance ascites and hepatomegaly. At the electrocardiogram revealed a regular rhythm and a complete right bundle brunch block. At echocardiography, LVEF was about 60%. The right ventricle is much dilated (Figure 2) with massive tricuspid insufficiency due to a diastasis in tricuspid valve. A lower right ventricular function: free wall TDI peak systolic velocity was 4 cm/sec. Estimation of systolic pulmonary artery pressure from tricuspid insufficiency was about 120 mmHg which was very high and supra-systemic. The patient was explored by cardiac CT-scan revealing advanced pulmonary hemochromatosis (Figure 3), no pulmonary emboli and very enlarged right cardiac cavities. Our patient died of acute chest syndrome during hospitalization.

fig 2

Figure 2: Cardiac CT scan : very dilated right ventricle in a SCD patient

fig 3

Figure 3: Pulmonary CT scan: Pulmoary hemochromatosis in a SCD patient

Discussion

Thalassemia heart disease involves mainly left ventricular dysfunction caused by transfusion-induced iron overload. In addition to the left ventricular abnormalities right ventricular dysfunction represents a common, yet less well explored complication in the cardiopulmonary spectrum of the disease. Biventricular dilated cardiomyopathy is still considered as the leading cause of mortality in patients with betathalassemia major [1,2]. In B-Thalassemia , the defect in haemoglobin is quantitative, characterized by a reduction or total depletion of 𝛽 chain synthesis, and the severity of 𝛽 chain deficiency determines the clinical phenotype, which extends from the severe and transfusion-dependent thalassaemia major to the milder and often transfusion-independent thalassaemia intermedia [3]. The heart takes up physiologic amounts of iron through transferrin receptors, but this process is tightly regulated and does not lead to iron overload. When transferrin-binding capacity is exceeded, circulating low molecular weight non-transferrin-bound iron (NTBI) species appear. NTBI is oxidatively active and can enter through nonspecific, poor-regulated cation channels in the heart, leading to cardiac iron overload [4]. Pulmonary hypertension (PH) in thalassemia is associated with vasoconstriction, vascular smooth muscle proliferation, and irregular endothelium in pulmonary arteries with associated thrombosis. These conditions all contribute to luminal narrowing, and eventual right ventricular failure. It includes plexiform and concentric medial hyperplastic pulmonary vascular lesions, and in situ pulmonary artery thrombosis [5,6]. These pulmonary vascular abnormalities may have resulted from chronic embolic disease in other patients [5]. Advancing age and a history of splenectomy are major risk factors for PH in this population [7,8]. Another phenomena can explains this phenomena as the process of haemolysis disables the arginine-nitric oxide pathway through the simultaneous release of erythrocyte arginase and cell-free haemoglobin Both nitric oxide and its obligate substrate arginine are rapidly consumed [9]. Outcome of heart failure, in advanced cardiac iron overload states, is dismal [10-12]. Compared to reported 3-month mortality rate of 58% in the pre-chelation era, recent findings indicate an improved prognosis over older series. Five-year survival was 48% and positively associated with left ventricular systolic function. All deaths occurred among patients with biventricular cardiomyopathy, shortly after involvement. Such improved survival is explained by the widespread use of chelation treatment and possibly also by better management of anaemia and use of angiotensin-converting enzyme inhibitors. Although LV Iron overload cardiomyopathy is a leading cause of death in patients with thalassaemia major this complication appears to be uncommon in SCD patients. Left ventricular dysfunction due to sickle cell disease is rare [13]. In SCD, the defect in haemoglobin is qualitative, as a substitution at the sixth amino acid residue in the 𝛽 chain results in synthesis of an abnormal haemoglobin, termed haemoglobin S, instead of the normal haemoglobin A [14]. Left ventricular systolic dysfunction is uncommon in patients with SCD: A meta-analysis of 19 controlled case studies has shown similar LV ejection fraction (LVEF) in homozygous S patients compared to healthy controls [15]. Accordingly, the prevalence of an LVEF < 50 % is low, ranging from 0% to 2.5% in ultrasound cohorts studies and 0% to 4% in smaller CMR studies [16,17]. SCD-related PH involves several mechanisms. First, as pulmonary pressure is the product of flow and pulmonary vascular resistances, high cardiac output in SCD induces elevated pulmonary pressure whether pulmonary vascular resistances are altered or not [18,19]. Second, chronic volume overload might lead to LV failure and subsequent pulmonary venous hypertension [20,21]. Third, intravascular haemolysis could induce pulmonary arterial vasculopathy mainly driven by nitric oxide scavenging due to free plasma haemoglobin [22]. Finally, several other mechanisms may participate including, chronic hypoxaemia, post-embolic PH, SCD-related lung injury, chronic liver disease, and asplenia.

In SCD, the pulmonary vascular bed is commonly affected [23]. Pneumonia may be difficult to distinguish from pulmonary infarction and both may coexist. Intravascular sickling may cause pulmonary vascular occlusion in the absence of radiologic changes, and in some patients bone marrow and fat released from infarcted bone may embolize to the lungs [24]. In the autopsy series of Gerry et al, 30% of adults and 22% of children had right ventricular hypertrophy. Three of these patients had had right ventricular failure, considered to be due to cor pulmonale [25].

Conclusion

The main cardiac involvement during major beta thalassemia is left ventricular dysfunction or in extreme cases biventricular dilated cardiomyopathy on the other hand sickle cell disease mainly causes right ventricular dilatation and dysfunction secondary to sickle cell lung pathology. A major near-term issue to address is the establishment of criteria for early disease-specific treatment of patients with MBT and SCD to avoid cardiovascular complications

Abbreviations

DOE: Dyspnoea on Exertion
 
MRI: Magnetic Resonance Imaging
 
SCD: Sickle Cell Disease

LVEF: Left Ventricle Ejection Fraction

MBT: Major Beta-thalassemia

References

  1. Grisaru D, Rachmilewitz EA, Mosseri M, Gotsman M, Lafair JS, et al. (1990) Cardiopulmonary assessment in beta-thalassemia major. Chest 98:1138‑42. [crossref]
  2. Levy RI, Moskowitz J (1982) Cardiovascular research: decades of progress, a decade of promise. Science 217: 121-12 [crossref]
  3. Rund D, Rachmilewitz E (2005) Beta-thalassemia. N Engl J Med 353: 1135-1146.
  4. Wood JC (2009) Cardiac complications in thalassemia major. Hemoglobin 33: 81-86.
  5. Sonakul D, Pacharee P, Thakerngpol K (1988) Pathologic findings in 76 autopsy cases of thalassemia. Birth Defects Orig Artic Ser 23: 157-176. [crossref]
  6. Morris CR, Gladwin MT, Kato GJ (2008) Nitric oxide and arginine dysregulation: a novel pathway to pulmonary hypertension in hemolytic disorders. Curr Mol Med 8: 620-632. [crossref]
  7. Atichartakarn V, Likittanasombat K, Chuncharunee S, Chandanamattha P, Worapongpaiboon S et al. (2003) Pulmonary arterial hypertension in previously splenectomized patients with beta-thalassemic disorders. Int J Hematol 78: 139-145. [crossref]
  8. Phrommintikul A, Sukonthasarn A, Kanjanavanit R, Nawarawong W (2006) Splenectomy: a strong risk factor for pulmonary hypertension in patients with thalassaemia. Heart Br Card Soc 92: 1467-1472. [crossref]
  9. Rother RP, Bell L, Hillmen P, Gladwin MT (2005) The clinical sequelae of intravascular hemolysis and extracellular plasma hemoglobin: a novel mechanism of human disease. JAMA 293: 1653-1662. [crossref]
  10. Engle MA, Erlandson M, Smith CH (1964) Late Cardiac Complications Of Chronic, Severe, Refractory Anemia With Hemochromatosis. Circulation 30: 698-705. [crossref]
  11. Engle MA (1969) Cardiac involvement in Cooley’s anemia. Ann N Y Acad Sci 119: 694-702. [crossref]
  12. Felker GM, Thompson RE, Hare JM, et al. (2000) Underlying causes and long-term survival in patients with initially unexplained cardiomyopathy. N Engl J Med 342: 1077-1084. [crossref]
  13. Falk RH, Hood WB (1982) The heart in sickle cell anemia. Arch Intern Med 142: 1680-1684.
  14. Rees DC, Williams TN, Gladwin MT (2010) Sickle-cell disease. The Lancet 376: 2018-2031.
  15. Poludasu S, Ramkissoon K, Salciccioli L, Kamran H, Lazar JM (2013) Left ventricular systolic function in sickle cell anemia: a meta-analysis. J Card Fail 19: 333-341. [crossref]
  16. Desai AA, Patel AR, Ahmad H, Groth JV, Thiruvoipati T, et al. (2014) Mechanistic Insights and Characterization of Sickle Cell Disease Associated Cardiomyopathy. Circ Cardiovasc Imaging 7: 430-437. [crossref]
  17. Wood JC, Tyszka JM, Carson S, Nelson MD, Coates TD (2004) Myocardial iron loading in transfusion-dependent thalassemia and sickle cell disease. Blood 103: 1934-1936. [crossref]
  18. Mushemi-Blake S, Melikian N, Drasar E, Bhan A, Lunt A, et al. (2015) Pulmonary Haemodynamics in Sickle Cell Disease Are Driven Predominantly by a High-Output State Rather Than Elevated Pulmonary Vascular Resistance: A Prospective 3-Dimensional Echocardiography/Doppler Study. Connes P, éditeur. PLOS ONE 10: 0135472. [crossref]
  19. Caughey MC, Hinderliter AL, Jones SK, Shah SP, Ataga KI (2012) Hemodynamic Characteristics and Predictors of Pulmonary Hypertension in Patients with Sickle Cell Disease. Am J Cardiol 109: 1353-135 [crossref]
  20. Junqueira FP, Fernandes JL, Cunha GM, T A Kubo T, M A O Lima C, et al. (2013) Right and left ventricular function and myocardial scarring in adult patients with sickle cell disease: a comprehensive magnetic resonance assessment of hepatic and myocardial iron overload. J Cardiovasc Magn Reson 15: 83. [crossref]
  21. Fonseca GHH, Souza R, Salemi VMC, Jardim CVP, Gualandro SFM (2012) Pulmonary hypertension diagnosed by right heart catheterisation in sickle cell disease. Eur Respir J 39: 112-118. [crossref]
  22. Farmakis D, Aessopos A (2011) Pulmonary Hypertension Associated With Hemoglobinopathies: Prevalent But Overlooked. Circulation 123: 1227-1232. [crossref]
  23. Bromberg PA (1974) Pulmonary aspects of sickle cell disease. Arch Intern Med 133: 652-657
  24. Baroldi G (1969) High Resistance of the Human Myocardium to Shock and Red Blood Cell Aggregation (Sludge). Cardiology 54: 271-277. [crossref]
  25. Gerry JL, Bulkley BH, Hutchins GM (1978) Clinicopathologic analysis of cardiac dysfunction in 52 patients with sickle cell anemia. Am J Cardiol 42: 211-216. [crossref]

Specification of a Model of Multiculturalism about Entrepreneurial Migratory Flows

DOI: 10.31038/ASMHS.2022623

Abstract

The objectives of this study were to explore the relationships between categories around the undertaking of migratory flows in order to specify a model for their systematic study. A documentary, exploratory and transversal study was carried out with an intentional selection of sources indexed to international repositories; Dialnet, Latindex and Redalyc, considering the publication period from 2007 to 2019, as well as the search for keywords. A relationship structure was observed between three preponderant categories in the literature: acculturation, multiculturalism and interculturalism in which significant differences were established with respect to selected extracts from the consulted literature. However, there was no appreciable collaborative and consensual learning among the judges who evaluated the marks in three qualification rounds, although the design of the research limits the findings to the informative sample. These results demonstrate the specification of a model in order to establish differences between the categories and anticipate exclusion or inclusion scenarios between migratory flows and native communities, as well as the relevance of entrepreneurship in the local development of both groups.

Keywords

Migration, Entrepreneurship, Development, Setting, Acculturation

Introduction

Roughly, migratory flows allude to a process of passage, stay and return that has been explained by three epistemic foundations: a) acculturation; B) selectivity and c) identity. It is a multidimensional process in which each phase and each dimension unveils the differences between governors and governed in terms of sustainable, human and local development policies, and mainly explains the asymmetries between migratory flows and native spheres [1].

The concept of migration is multidimensional, but the studies related to migrant cultures with respect to native cultures have focused on a generalizing concept of rupture, crossing, stay and return in the economic and occupational order. Many occupational studies, emphasizing dependence, conformity, and obedience of migrant cultures with respect to native culture, are destined for human, local and regional development only with migrant cooperation in services or agroindustrial activities [2]. The phenomenon of migration has been approached from an ethnocentric, polyculture or multicultural approach, focusing on the adjustment of migrant cultures with respect to the laws, values, and norms of native cultures [3]. In that sense, substantial justice from multiculturalism is the integration of social justice and cultural justice, or, the concatenation of economic, political and social rights with respect to cultural differences and self-determination.

From these approaches, migration has been understood as a process of acculturation, assimilation, adaptation, and selectivity of talents with respect to an internal labor market that demands the environment and the capacities required to carry out local development, through the distribution of the labor force in strategic sectors such as agro-industry or services. The selectivity of talents that moved from emerging to developed countries is only possible in the cases of the so-called economy 4.0 [4].

This is because the perspectives of migration have considered the native cultures as active and vital in the development process whereas migrant cultures are passive or collaborative in the endogenous development of native cultures, coupled with substance justice, as antecedent of interculturalism, the concepts of impartiality such as granting rights to minorities, self-government or political and legal autonomy, polyethics or equality dissemination guarantees among members of a group, as well as the specificity and cultural legitimacy embodied in dialogue, negotiation and co-responsibility subscribe to the construction of a new model for the study of migrant cultures in relation to native cultures ([3]: page 255).

In this sense, the notion of social justice was linked to the consequences of immigration as it warned about asymmetries in terms of rights and obligations, opportunities and capabilities, as well as between commitments and responsibilities between migrant cultures and native cultures [5].

Well, the study of migratory flows no longer as passive entities and dependent on native cultures gestate in the work of entrepreneurship and innovation that distinguish this new wave of its predecessors focused on compliance and obedience, now observed at migration as active and innovative entities. These are migratory flows with civic virtues oriented towards a sense of identity and belonging to a universal community, observed by their degree of empathy, commitment, altruism, solidarity, satisfaction and happiness [5].

The theoretical, conceptual, empirical and hypothetical frameworks with respect to entrepreneurial migratory flows are grouped into 1) acculturation, assimilation, and adaptation; 2) selectivity and human capital; 3) identity, spheres, networks, and multi and intercultural flows.

The acultural, assimilative or adaptive perspective distinguishes migrants and natives not only from the place of origin, its uses, and customs but also its objectives, tasks, and goals. It is logic of profit and utility as a preponderant and determining factor of the relations between migratory and native flows. In this sense, development policies with such an approach highlight the achievements and scope of programs based on sustainable rather than human or local development, since it is assumed that the labor market will generate and disseminate the bases for establishing the quality of life and subjective well-being related to health, education, and employment. These are sector programs and strategies in which support and incentives, as well as financing, are aimed at containing migratory flows according to the needs of the labor market [6].

In this way, entrepreneurial migrant flows are circumscribed to the inclusion and social protection policies that the receiving State implements in order to promote development in the economy of industrial production and services. Migrants are considered a skilled and specialized workforce, a fundamental part of the gearing of the productive and service sectors. It is assumed that the State must protect the interests of the natives by postponing the stay of migrants and encouraging their abilities; knowledge, and skills from and with the corresponding occupational health [7].

The selectivity approach considers that the development will be gestated from the policies of business promotion and market opening. Regionalism and multilateralism are essential to encourage sustained development and, immediately, human and local development. The aim is to promote policies for evaluation, accreditation, and certification of the quality of the processes and achievements of institutions and organizations sponsored by business development policies, as well as market-opening policies. In this process of selectivity, migratory flows are evaluated by their degree of intellectual capital in relation to the requirements of the labor market [8].

The undertaking of migratory flows is considered as a phase or instance subsequent to the implementation of business promotion policies, but above all, as a result of health, educational and labor policies with emphasis on the evaluation, accreditation, and certification of objectives, tasks and goals both institutional and organizational, since, it is precisely in these instances where the asymmetries between natives and migrants are resolved in favor of sustainable, human and local development. It is considered that the selection of the best talents, intellectual capitals, skills, and knowledge will build a culture of entrepreneurship, innovation, and success [9].

The paradigm of identity, unlike acculturation and selectivity, warns that the asymmetries between migrants and natives are due to the establishment of spheres, networks and flows since migrants establish relations of empathy and commitment by virtue of their abilities and the natives are organized rather in terms of a culture of domination. Among other differences, the migrant customs and practices are oriented and tolerated by the natives from their consensual diversity, which means, the migrants are considered as different in their traditions, but at the same time, indispensable for the development of the country. A receiver as the economy that expels those [10].

Therefore, the policies implemented from this approach recognize the differences between migrants and natives that will determine sustained, human and local development. That is to say, programs and strategies do not seek to dilute asymmetries, but to increase them in favor of the recognition, admiration, and respect of personal attributes, organizational innovations, state integrality and national competitive advantages [11].

This is how development policies are properly structured based on differences between migrants and natives, but the approach distances and approaches groups according to programs and strategies implemented at different levels: sustainable, human and local [12].

From the theoretical point of view, the study of migration supposes, without a doubt, the establishment of an agenda, which from a thorough review of the literature (that is, the state of the art, the state of the question or of the state of knowledge), alluding to the issue of migration. In effect, starting from an epistemological criterion, two major groups of theoretical discussion approaches are established [13].

Since it was about social work, it was thought to privilege the “intervention”; however, the concept of intervention has been questioned and even replaced by the term of intercession. Indeed, in the past with the Benefactor State, social work would have to contribute to economic and social development. Instead, now paradoxically, with neoliberalism in between, society comes to participate more; however, the work of social work is to promote dialogue, management, and evaluation. In other words: intercession, mediation between the State and organizations. Social work will intercede in the communication of the different actors of civil society. This is your future [9].

Entrepreneurship consists of empowering opportunities (including the generation of their own opportunities); as well as optimize resources and strengthen capacities [14]. Entrepreneurship is also a historical process in which levels of development are reflected according to migratory flows. Therefore, the learning of entrepreneurship is, undoubtedly, an indicator of development.

In this sense, social work has generated models for the study of entrepreneurship, understood as learning from actors involved in the journey and stay with an entrepreneurial culture so that, upon return, with the use of certain capital, learning, the knowledge and skills, favorably affect, in this case, in the commercialization of a product (organic coffee).

Studies related to knowledge networks, also known as neural networks, have established associations between different variables, such as beliefs, attitudes, intentions, and behaviors; in order to demonstrate a node learning (group) with respect to a neuron (or network system).

In the case of migratory flows [Exit (expulsion) ⇨ Crossing (travel) ⇨ Stay (residence-work) ⇨ Return (return to the place of origin)] is possible to note the degree of entrepreneurship, if they are considered as nodes in a particular network of migrants returning to their place of origin, provided with resources, skills, knowledge and expertise; all this oriented to investment in the local economy [15].

However, studies of migratory flows have focused their interest on the dominant native cultures by proposing laws, values, and norms are ethnocentric, polycultural or multicultural, although they limit the entrepreneurial capacities of migratory flows, they can adapt, assimilate the dominant lifestyles and be selected according to their skills and knowledge to achieve their insertion in society [16].

Precisely, the objective of this work was to explore the relationships between the categories of acculturation, multiculturalism and interculturalism reported in the literature from 2007 to 2019 in repositories such as; Dialnet, Latindex, and Redalyc in order to specify a model for the study of the phenomenon in endogenous development with local entrepreneurship.

Method

A documentary, exploratory and transversal study was carried out. A non-probabilistic selection of sources indexed to Dialnet, Latindex and Redalyc was made, considering the period of publication from 1999 to 2017, as well as the key words: “migration”, “entrepreneurship”, “inclusion”, “development” and “networks”.

An array of content analysis in order to set the agenda, axes and discussion topics related to migration was used. The matrix includes the coding, weighting of judges’ evaluations around the revised information (Table 1).

Table 1: Content Analysis Matrix

Model

Indicator Coding Weighing

Interpretation

Acultural Adaptation, assimilation and return 0 = vertical exclusion, 1 = horizontal exclusion, 2 = vertical inclusion, 3 = horizontal inclusión 0 to 1 0 points as vertical exclusion threshold Agenda, axes and discussion topics focused on exclusion and social injustice
Multicultural Insertion, Selectivity andreincersion 0 = vertical exclusion, 1 = horizontal exclusion, 2 = vertical inclusion, 3 = horizontal inclusión 11 to 20 points as selective inclusion threshold : vertical Agenda, axes and discussion topics focused on social justice based on the legal framework and native culture
Intercultural Entrepreneurship andinnovation 0 = vertical exclusion, 1 = horizontal exclusion, 2 = vertical inclusion, 3 = horizontal inclusión 21 to 30 points as horizontal social inclusion threshold Agenda, axes and discussion topics focused on participation, dialogue and co-responsibility between migrant and native cultures

Source: self-made

The coding was established by judges who evaluated the findings matrix (Table 1A in the annex) based on criteria such as 0 = vertical exclusion, 1 = horizontal exclusion, 2 = vertical inclusion and 3 = horizontal inclusion.

For example: the information related to “Identity, globalization and equity” was evaluated on Thursdays as a content or extract of vertical exclusion, as the dominant culture prevails as regards migrant cultures disseminated in identities such as diaspora, ferry wheels or nomads. The latter oriented to equity by a multicultural legal framework that raises the self-determination of groups as long as these conform to the laws of the recipient country.

The weighting threshold, considering that three models prevail for the study of the migratory phenomenon: acculturation, multiculturalism and interculturalism, was structured as: 0 to 10 information oriented to the study of vertical exclusion, from 11 to 20 information directed towards the selective exclusion vertical and 21 to 30 information oriented to the study of horizontal inclusion.

Following the same example of “identity, globalization and equity”, it reached a score of 9, evidencing that it is information oriented to the study of exclusion, focused on the vertical asymmetries between the dominant cultures that may be the native with respect to the migrant cultures that can be identities such as: nomads, diaspora and ferry wheel.

The threshold of 0 to 10 points of 30 possible was interpreted as a reflection of an agenda, axes and content issues related to exclusion and social injustice for evidencing asymmetries between native cultures and migrant cultures regarding economic, political, social and sexual rights .

The threshold of 11 to 20 points out of 30 possible was interpreted as a reflection of a genre, axes and debate topics focused on the possibility of dialogue between migrant and native cultures with respect to human development, health, education and employment, which, being equitable, substantially improves the selectivity of talents and directly affects productivity as well as competitiveness.

The threshold of 21 to 30 points was interpreted as a reflection of an agenda, axes and discussion topics focused on the social inclusion of migrant cultures through dialogue with native cultures. This supposes a deliberative participation, whether informed or reasoned with respect to equity in terms of economic, political and social rights.

Based on the Delphi technique, the content of the concepts and indicators of migratory flows was analyzed with respect to development: sustainable, human and local, as well as with inclusion and social protection.

The information was compared and integrated considering, year, author, concept, technique and findings in order to be able to synthesize the information and expose it to 10 expert judges in the problem, who evaluated the content following the criterion of vertical exclusion, horizontal exclusion, vertical and horizontal inclusion to highlight the differences and similarities between migrant cultures and native cultures.

The confidentiality and anonymity of the judges was guaranteed in writing with respect to their responses, as well as the results of the study, which informed the participants that these findings would not negatively or positively affect their economic, political and social status.

Two tables or matrices were drawn up to show the differences and similarities in terms of the categories of development and social protection, indicators of exclusion and vertical as well as horizontal inclusion.

A model of trajectories and axes of dependency relations between the variables used in the revision of the literature was specified in order to be able to discuss the scope and limits of the results, as well as future research lines concerning the problem, the phenomenon and object of study.

Results

Table 2 shows the descriptive values of the instrument or matrix of content analysis, which demonstrate the normal distribution of the coded responses of the literature consulted and the expert judges who evaluated the contents.

Table 2: Instrument Descriptions

E

M S K A C1 C2 C3

R1

χ2 Df p χ2 df p χ2 df

p

e1

2,67

0,89 0,75 0,70 13,25 14

<,05

e2

2,91

0,83 0,73 0,76 15,23 14

<,05

e3

2,03 0,94 0,60 0,77 14,36 18 <,05
e4 2,43 0,85 0,84 0,73 13,26 10

<,05

e5

2,78 0,80 0,63 0,78 14,36 13 <,05
e6 2,15 0,81 0,61 0,83 15,47 11 <,05

e7

2,09 0,96 0,59 0,82 14,25 11 <,05
e8 2,79 0,85 0,73 0,84 14,23 15

<,05

e9

2,56 0,87 0,64 0,74 14,56 13

<,05

e10

2,75 0,93 0,83 0,72 15,42 12 <,05
R2

e1

2,90 0,94 0,63 0,80 13,25 17 <,05
e2 2,86 0,96 0,74 0,85 15,49 15 <,05

e3

2,75 0,98 0,84 0,89 13,46 10 <,05
e4 2,98 0,89 0,74 0,83 14,35 15

<,05

e5

2,84 0,85 0,77 0,67 14,35 16 <,05
e6 2,70 0,88 0,80 0,84 14,35 13

<,05

e7

2,84 0,99 0,82 0,88 13,24 12 <,05
e8 2,80 0,94 0,73 0,73 15,32 12

<,05

e9

2,78 0,93 0,72 0,72 13.45 13 <,05
e10 2,45 0,84 0,89 0,75 15.46 16

<,05

R3

e1 2,63 0,79 0,82 0,84 15,47 13

<,05

e2

2,70 0,84 0,80 0,85 14,35 15 <,05
e3 2,64 0,85 0,73 0,80 15,47 18 <,05

e4

2,53 0,96 0,86 0,83 15,46 13 <,05
e5 2,58 0,98 0,75 0,74 14,36 15 <,05

e6

2,51 0,99 0,77 0,77 14,38 13 <,05
e7 2,43 0,86 0,63 0,85 16,54 15

<,05

e8

2,58 0,88 0,85 0,73 16,58 12 <,05
e9 2,50 0,84 0,95 0,75 13,24 11

<,05

e10

2,74 0,82 0,82 0,80 12,34

13

<,05

Source: Elaborated with data study
E: Extract, R: Round, M: Median, S: Standard Deviation, K: Kurtosis, A: Asimetry, C: Category: C1: Acultural, C2: Multicultural, C3: Intercultural; χ2: ji squared, DF: Degree Fredom, P: Level of significance.

It is possible to appreciate a consensus based on the relationships between extracts and categories, but not in terms of collaborative learning between the sources since the first round includes equal or less consensus for the first and second, but favorable for the third category.

That is, the literature consulted seems to agree on differences between acculturation, multiculturalism and interculturalism with respect to the selected extracts, but only for this intercultural category are there consensuses in the qualifications of judges as the evaluation rounds go on.

Ell means that acculturation and multiculturalism seem to be controversial for judges in relation to interculturalism. Entrepreneurial migratory flows seem to be assumed as part of a system of balances between resources and demands, opportunities and challenges, resources and capacities among political and social actors, although the lack of consensus regarding their structure of relationships, communication and motivation seems to indicate that these are emerging phenomena that literature has not been able to assess.

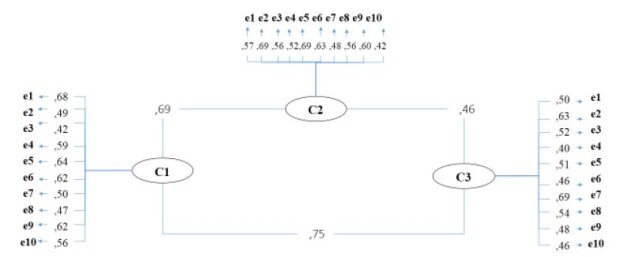
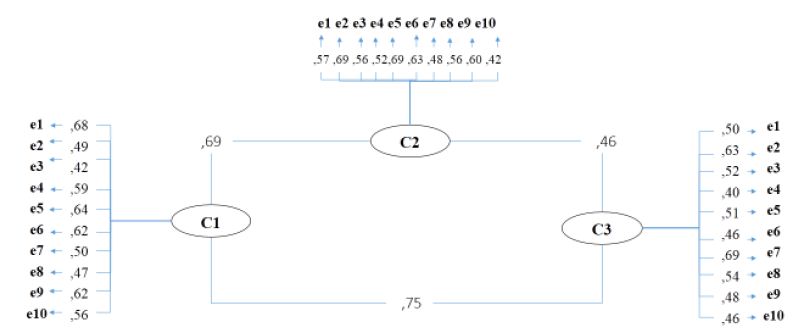
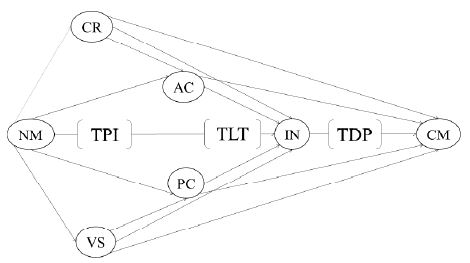
Figure 1 shows the relationships between the categories with respect to the extracts qualified by expert judges in the subject areas.

fig 1

Figure 1: Structure of Categorical Relationships.
Source: Elaborated wit data study.
E: Extract, C: Category: C1: Acultural, C2: Multicultural, C3: Intercultural; relations between categories and extracts.

It is possible to appreciate that there are relations close to the unity between the categories established by the literature and the extracts qualified by expert judges, although category 2 and category 3 maintain a close relationship to zero, suggesting that multiculturalism and interculturalism are mutually scenarios Exclusive to the entrepreneurial local development.

In contrast, acculturation and interculturalism seem to converge in terms of endogenous entrepreneurial development, suggesting that it is an antecedent and consequent relationship. That is to say, interculturalism will emerge from acculturation and not from multiculturalism.

Discussion

Within the framework of male and female gender relations focused on employment opportunities and capacities, the discussion of the similarities and differences between the concepts of human, sustainable and local development can be located in two indicators of social development: 1) the dignity of life and 2) the quality of life [17], as well as at the institutional level regarding its lack of coordination at the different levels of government, federal, state and municipal [18].

The dignity of life refers to human and social rights as mediators of public action and social necessity [17]. It is to say, it is assumed from the social development approach that the differences of rights between men and women are gestated after both identities, masculine and feminine, are victims of a crucible of violations of their rights. This is so because, even though they are different in their opportunities and capacities, they share common development problems and strategies.

This is the case of quality of life, refers to health; nutrition, housing, education, environment, culture and longevity ([17]: 66). These are opportunities and capacities for access and usefulness of each of these privileges, once again circumscribed between the recognition and ignorance of female identity and masculine identity.

In this way, social development is the product of public and private actions, programs and strategies aimed at dignity and health, reflected in the quality of life, but at the same time part of a vicious circle of similarity (shared problem) and differentiation (development privileges). Therefore, it is necessary to have a state rectory [18].

From this definition of social development, it will be possible to derive the differences and similarities between human, sustainable and local development. It will be essential to establish the definitions, objectives, instruments and goals that distinguish them, since the scarcity or lack of dignity and quality of life is the common denominator [19].

However, it is necessary to consider that the differences related to employment opportunities and capacities between men and women are limited to the imperfections of the labor market ([17]: 66). Therefore, the policies of collection and redistribution will be fundamental to clarify the solidarity that characterizes masculine identities and feminine identities, mainly cooperation oriented to their development [20].

From a matrix around sustainable, human and local dimensions, it is possible to notice differences and similarities if the diagnosis is considered in terms of the absence or scarcity of rights, objectives, instruments and goals (Table 3).

Table 3: Matrix of similarities and differences in development

Dimension

Diagnostics (absence or inefficiency, inefficiency and ineffectiveness of rights) Objectives (effectiveness of rights) Instruments (efficiency of rights)

Goals  (rights, effectiveness)

Sustainable (generation of health, educational and employment opportunities with an emphasis on social equality: female claim, afro-descendant, indigenist and older adult to overcome poverty) State dismantling (page 72); lack of leadership of SEDESOL (minute 6:25), federal, state and municipal lack of coordination (minute 4:15), polarization (minute 3:48), social inequality (p.74), containment and reduction of public expenditure (pp. 71 and 72), business exemptions and reduction of state employment ( p.72), discontinuous growth (p.70), limited business contribution (p.71), competition in services and commerce (p.71), state malformation; macroeconomic management (p.72), extreme poverty (minute 3:30), feminization of poverty (p.73) by race and age (p.74), educational lag, access to health, access to housing, income (p. 7:50 to 9:13) Interinstitutional coordination (minute 6:35) restoration of civil trust (p.72), social integration (p.73). Social policy: focus, coordinate and influence (minute 4:00 to 5:00), institutional scaffolding (minute 4: 48), public investment (page 71), social dialogue (page 73), representation and governance (p. 72), solidarity and social integration (p.71), governmental responsibility (p.73); transparency (p.73), national crusade against hunger (minute 7:10), popular insurance affiliation (minute 8: 20), subsidy and productive linkage (9: 10) Sustained growth (p.70).
Human (capacity building for dignity and quality of life in health, education and employment) Mobility requirements (p.66 and 67), institutional precariousness (p.67), informal work (p.68), unemployment (p.70). Overcoming poverty (p.68), strengthening human capital (p.69). Universal care (p.67); education (p.66). Family welfare (page 68).
Local (Public and private support and services through cooperative solidarity) Abandonment of state centrality (p.74), end of assistentialism and paternalism (p.75), political corruption and social untying (p.71), institutional administrative centralism (p.71), scarcity of fiscal resources, monetary precariousness, labor exclusion (p.67), social distrust (p.72). Employment opportunities (page 66), promotion of positive interactions between cultures and communities (p.75). Social and economic compensation (p.66), migration and remittances (p.67), social capital (p.66 and 68), solidarity and trust (p.69), promotion of survival strategies (p.69). Labor stability (p.70) , equitable remuneration (p.66 ).

Source: Modified from [17,18]

In this way, sustainable development refers to an area in which the State generates opportunities and contributes to the capacities of civil society to reduce inequalities between cultures, localities, communities, families and individuals [21].

If sustainable development orients social equality in order to overcome the poverty of the most excluded sectors, then human development will focus on the promotion of health, education and labor rights in order to establish capacity building that will culminate in the scope of dignity and quality of life [22].

In this way, human needs and expectations will correspond to the policies of strengthening human capital through social care in general and education in particular, generating the desired social well-being [23].

However, the abandonment of the welfare paternalism of the state rectory supposes local policies focused on the reconstruction of the social fabric and the recovery of civil trust through the promotion of solidary and cooperative relations, social and economic compensations, indicated by labor equity and remunerative [24].

In each of the dimensions of sustained development, human and local, the effectiveness, efficiency and effectiveness of rights is the central issue in the state and civil agenda, deriving in cultures, races, gender identities, ages, levels of education and income [25] .

The differences and similarities between the sustained, human and local developments allow observing the inequality between men and women, among other items. This is so, because the problems, objectives, instruments and goals seem to disfavor the feminine identity over the masculine identity not only evidenced in the poor number, but also in the opportunities generated by institutions and companies, which favor a competition logic focused on the conviction of success, an essential attribute of male identity and to the detriment of conservation ethics, a fundamental feature of female identity [26].

In this way, policies of sustained, human and local development, focusing their emphasis on competence rather than solidarity, will favor male identity, but at the same time they not only exclude female identity in the health, education or labor fields. , but also confine the male identity to these areas bypassing the relative to family as is the case of paternity rights [27].

The phenomenon of masculine youth migratory flows can be understood from the asymmetries and similarities between the processes of inclusion and social protection, considering that human rights are the universal and integral implementation instrument [28,29].

That is to say that social inclusion, being an ethics, vocation and discourse of equality, not only implies the exercise of rights in the foundation of programs and strategies, but also is aimed at reducing the barriers that inhibit the construction of citizenship , cohesion, belonging and democratic life. Through administrative decentralization, social recognition, the social pact, the negotiation of conflicts and the expansion of rights for their social redistribution [30].

If social inclusion is reflected in social protection as synonymous with social assistance, then masculinities in their youth and migratory flows would have ample possibilities of being included and protected, but this last question implies social assistance related to progressivity, equality, integrality, institution, participation, transparency, accessibility and accountability [31].

In other words, social and economic rights must not only be guaranteed by the State, they must be inserted in a policy, program and strategy aimed at eradicating inequalities, indicated by their regression in terms of opacity of resources and inaccessibility of information [32].

In this way, the similarities and differences between inclusion and social protection are central issues in the political and civil agenda, mainly in relation to a diagnosis of inequality and social exclusion, as well as in the objectives, instruments and goals aimed at the inclusion of from protection [33].

“Grosso modo” (Table 4), social inclusion is the effect of social protection understood as a policy, program and integral strategy for managing demands and redistribution of resources in order to regulate: 1) social assistance, 2) social security and 3) the labor market [28].

Table 4: Matrix of differences and similarities between protection and social inclusion

Dimension

Diagnosis (lack of efficacy, efficiency and effective rights) Objective (effectiveness of rights) Instrument (efficiency of rights)

Goal (effectiveness of rights)

Inclusion (ethics, vocation and discourses of social equality for the exercise of social and economic rights) Ethics of inequality (p.332), distortion of citizenship (p.332), absence of cohesion, social belonging and democratic life (p.332), Equality in well-being (page 332), dignity, autonomy and freedom (page 344), democratic participation (page 344), universality of rights (page 346). Decentralization of responsibilities (page 346), social recognition without distinction of gender, race, ethnicity, age, belonging to specific socioeconomic groups or geographic location (page 332), social pacts (page 333), conflict negotiation (p. 333), expansion of rights (p.333), cohesion and social identity (p.333). Social redistribution (p.332), discourses of rights (p.332),
Protection (Implementation of economic and social rights based on standards of progressivity, equality, integrality, institutionality, participation, transparency, access and accountability) Policy of social inequality (p.332), regressivity that inhibits the exercise of social and economic rights (p.333), illegality and labor informality (minute 4: 33), multidimensional poverty (minute 6:49), differential needs (p. minute 9: 35), transitional (minute: 9:55) and chronic (minute 10:10), female uniparental leadership (minute 11: 22). Municipal operational technical coordination (minute 17:40), information and opaque management (minute 18:35), Reduction of social inequality (p.332) from integrality (minute 6:20), identification of demands and guarantee of access to resources (minute: 3:21), promotion of decent work (minute 4:06), focused on income (minute 2: 10), Universal policies (p.332), horizontal integrality (minute 6:50), vertical administration (7: 10 minute), sectoral transversality (minute 8: 03), institutional coordination (minute 16:40), promotion of human rights; economic and social with an inalienable sense (p.331 and 332), coverage of needs (p.335), conflict control systems (minute 20:15), Social assistance, contributory social security and regulation of the labor market (minute 15: 10 to 16: 25). Multi-sectoriality of state intervention (minute 6: 49); legal commitments (p.332), social security (p.342) and social assistance (p.342)

Source: Modified from [28,29]

That is to say that social exclusion, indicated by social inequality and determined by the regression of economic and social rights, is reflected in illegality and labor informality, multidimensional poverty, differentiated needs, and directly impacts single-parent families headed by women; It supposes a lack of technical and operational municipal coordination fed by an absence of informative transparency and accountability, justifies social protection [34].

In this sense, social protection is the implementation of strategies and mechanisms of assistance, security and the labor market as part of universal, comprehensive policies, verticality in its elaboration and horizontal implementation. It implies a sectoral transverse condition; an institutional coordination in the coverage of needs and a control of conflicts between political and civil actors [35].

Understood as a strategy of assistance, security and labor regulation, the differences and similarities between social inclusion as an ethic derived from social protection show that: 1) migrant flows occupy a place in the integration of social protection through demographic bonus; however, 2) migrant masculine identities would only be a priority while they are in a productive age; 3) both migrant flows and masculine identities are more prone to state exclusion, since it prioritizes the sectors of the future [36].

From the intercession model of social work, which proposes the incidence of contextual repertoires on narratives and discourses, fifteen former migrants settled in Xilitla, SLP, in the Huasteca Potosina, were interviewed in order to interpret and establish the influence, they had throughout their journey, stay and return, all this in the face of acculturation, selectivity, identity and governance; as well as before the rationality: economic, multicultural, intercultural and ethnocentric, having as evident background to the enterprising culture of the EU [37-47].

The former migrant traders of organic coffee had an apprenticeship in entrepreneurship based on the transparency of the management of their micro-enterprise. Each peso was used for the development of your business. The merchants without experience in migration had an apprenticeship of the enterprise based on the specificity of their sales. Each weight should be invested in a single product.

A specification refers to the establishment of axes, trajectories, relationships and hypotheses around a process in which the variables reviewed in the state of knowledge reflect a particular context or scenario, but their expected relationships anticipate conflicts and changes.

In this way, a preponderant axis: the integrality of the public policies on the other nodes; diversity, security, activism and co-responsibility. Each path of dependency relationship between each of the five factors allows the establishment of hypotheses that can be contrasted in the immediate future if the theoretical, conceptual and empirical frameworks reviewed in the state of knowledge are fulfilled.

The model proposes the study of entrepreneurial migratory flows based on the leadership of the State through the integrality of social policies, as well as the diversification of social protection and public social security, although in another aspect, movements for social security They propose a co-responsibility in the management and administration of public services in the field of social entrepreneurship.

It is a model delimited by two political and social actors around the establishment of a business promotion system that is distinguished by its degree of social protection, comprehensive strategies, local security and openness to social demands, as well as the construction of a co-government or governance indicated by its degree of co-responsibility.

However, the co-governance or governance scheme also implies the inclusion of other public and private sectors and actors, such as joint-stock companies and cooperative societies. This means that the model is limited to two actors that, although they are the predominant axes of co-government, whose management and administration capacity is regulated by civil organizations and government institutions.

In this way, the selection of indexed sources can be extended to repositories such as EBSCO, SCOPUS, ELSELVIER or SCIELO. This would include variables that explain the dialogue between the governors and the governed in terms of entrepreneurship, mainly in terms of the innovation of development policies.

In the case of the Delphi technique used to analyze the content and its specification in a model, it could be complemented with the neural network technique in order to be able to establish possible scenarios from available data and feasible dependency relationships. It is the same case of the data mining technique, which would delimit the study scenario to a context and space in which entrepreneurship contrasts with protectionism or corruption.

Regarding the model of complex trajectories of interdependence between the factors subtracted from the literature consulted, it is possible to amplify such a model using the logic of structures, which warns measurement errors that can indicate the similarity or difference of constructs in the explanation of a problematic.

Finally, in relation to the works of [9,13], in which entrepreneurship has its origin in local identity, regional roots, attachment to the place, and the sense of community as a substantial part of the uses and customs oriented to profit and profit. Present work rather considers that it is the interdependence between migrant and native cultures that generates an entrepreneurial hybrid, and that although the local identity is its foundation, also the labor expectations that drive the crossing, the stay and the return of migrants is a factor determinant of a migrant’s work cycle.

Subsequently, it is recommended: a) to carry out an intensive processing of information in other repositories; b) adopt other content analysis techniques; c) generate integral models, that include entrepreneurial migratory flows and entrepreneurial spheres; c) as well as the discussion between the historical identity of the place of origin with respect to the labor expectation of the migrant receiving context.

Conclusion

The contribution of this work to the state of the question lies in the establishment of five assumptions that explain the trajectories of interdependence between five nodes or factors used in the state of the matter and specified in a model for addressing entrepreneurial migratory flows. It deals with the integrality, diversification, security, participation and co-responsibility of the political and social actors in the construction of a system of co-management and co-administration of resources and public services related to social entrepreneurship, business development, microfinance or microcredit focused on the localities that receive or boost migratory flows.

The discussion about social entrepreneurship, as a process of state management or administration, or, because of civil participation in self-management and self-organization, is being rethought towards models of co-government, co-management, co-administration and co-responsibility, which they indicate a rapprochement of public administration with organized civil society, but in terms of social protection, policies, strategies and programs are disjointed. Therefore, opening the debate is necessary to establish an integral system of social entrepreneurship, at least between the governors and the governed.

References

  1. García C (2019) Dimensions of the theory of human development. Ehquidad 11: 27-54.
  2. Sánchez A, Juárez M, Bustos JMY, García C (2018) Contraste de un modelo de expectativas laborales en exmigrantes del centro de México. Gestión de las Personas y Tecnología 32: 21-36.
  3. Cruz E (2014) Multiculturalism, interculturalism and autonomy. Social Studies 43: 243-269.
  4. González M, Iglesias C (2015) Decisions on housing tenure and acculturation of the foreign population resident in Spain. Economic Trimester 82: 183-209.
  5. Tena J (2010) Towards a definition of civic virtue. Convergence 53: 311-337.
  6. Carreón J (2013) Discourses on labor migration, return and social reincession based on group identity in Xilitla, micro-region of Huasteca Potosina (Mexico). In L. CANO (coord.), Poverty and social inequality. Challenges for the reconfiguration of social policy. (pp. 153-174). Mexico: UNAM-ENTS.
  7. Sánchez A, Quintero ML, Sánchez R, Fierro E, García C (2017) Governance of social entrepreneurship: Specification of a model for the study of local innovation. Nomads 51: 21.
  8. Carreón J (2016) Human development: Governance and social entrepreneurship. Mexico: UNAM-ENTS 143.
  9. García C, Carreón J, Hernández J, Bustos JM (2016) Governance of risk from the perception of threats and the sense of the community. In S. VÁZQUEZ, BG Cid, E. MONTEMAYOR (coord.), Risks and social work (pp. 71-94). Mexico: UAT.
  10. Carreón J, Hernández J, Quintero Ml (2016) Specification of a local development model”. In D. Del-CALLEJO, ME CANAL and G. HERNÁNDEZ (coord.), Methodological guidelines for the study of development (pp. 149-168). Mexico: Universidad Veracruzana.
  11. Carreón J, Hernández J, Bustos JM, García C (2017) Business promotion policies and their effects on risk perceptions in coffee growers in Xilitla, San Luis Potosí, central Mexico. Poiesis 32: 33-51.
  12. Rodríguez RF (2010) Xenophobic speech and agenda setting. A case study in the Canary Islands press (Spain). Latin Magazine of Social Communication 65: 222-230.
  13. Carreón J, Morales M, Rivera B, Garcia C, Hernández J (2014b) Migrant entrepreneur and trader: State of knowledge. Tlatemoani 15: 1-30.
  14. García C (2018) Coffee farming enterprise in migrants from the huasteca region of central Mexico. Equidad & Desarrollo 30: 119-147.
  15. Campillo C (2012) The strategic management of municipal information. Analysis of issues, their treatment and irruption in the municipality of Elche (1995-2007). Magazine of Strategy, Trend and Innovation of Communication 3: 149-170.
  16. Albert MC, Espinar E, Hernández MI (2010) The immigrants as a threat. Migratory processes in Spanish television. Convergence 53: 49-68.
  17. Sojo C (2006) Social development, integration and public policies. Luminar Social and Humanistic Studies 4: 65-76.
  18. Robles R (2013) Ministry of Social Development. Interview on eleven TV.
  19. Carreón J, Hernández J, Morales MI, Rivera Bl, Limón GA, et al. (2014a). Towards the construction of a civil sphere of identity and public security. Realities 4: 23-36.
  20. Carreón J, Hernández J, García C (2015) Migratory identity in the establishment of an agenda. Dialogues of Law and Politics 16: 69-87.
  21. Fuentes F, Sánchez S (2010) Analysis of the entrepreneur profile: A gender perspective. Applied Economics Studies 28: 1-28.
  22. García C (2008) The psychosocial dynamics of the migratory communities. Approaches 1: 137-152.
  23. Gutiérrez R (2013) The linguistic dimension of international migrations. Languages and Migrations 5: 11-28.
  24. García C, Carreón J, Hernández J, Aguilar A, Rosas F, et al. (2015) Differences in reliability against risk, uncertainty and conflict between coffee farmers in Xilitla, Mexico. Eureka 12: 73-93.
  25. Long H (2013) The relationships between learning orientation, market orientation, entrepreneurial orientation, and firm performance. Management Review 20: 37-46.
  26. Rentería V (2015) Socioeconomic panorama of international migration originated in Latin America and the Caribbean: state of the art. University Act 25: 40-50.
  27. Yepes I (2014) Scenarios of Latin American migration: Transnational family life between Europe and Latin America. Roles of the CEIC 107: 1-27.
  28. Martínez R (2011) Inclusive social protection: A comprehensive look, a rights approach. Seminar, Argentine social protection in Latin American perspective: inclusion and integrity challenges.
  29. Cecchini S, Filgueira F, Martinez R, Rossel S (2015) Social protection instruments. Latin American roads towards universalization. New York: UN-ECLAC. 321.
  30. Rodríguez A (2009) New perspectives to understand business entrepreneurship. Thought and Management 26: 94-119.
  31. Yuangion Y (2011) The impact of strong ties on entrepreneurial intention. An empirical study based on the mediating role of self-efficacy. Journal Entrepreneurship 3: 147-158.
  32. Amujo O, Otubango O, Adeyinka B (2013) Business news configuration of stakeholders opinions and perceptions of corporate reputation of some business organizations. International Journal of Management and Strategie 6: 1-27.
  33. Ariza M (2002) Migration of family and transnationality in the context of globalization: some points of reflection. Mexican Journal of Sociology 64: 53-84.
  34. Trimano L, Emanuelli P (2012) Social representations and citizen practices in the rural community: A contribution from strategic communication. Latin Magazine of Social Communication. 67: 494-510.
  35. Ferreiro F (2013) Women and entrepreneurship: A special reference to business incubators in Galicia. RIPS 12: 81-101.
  36. García C, Bustos Jm, Carreón J, Hernández J (2017) Theoretical and conceptual frameworks around local development. Margin 85: 1-11.
  37. Sandoval FR, Carreón J, García C, Valdés O (2015) Formalization of dependency relationships between water and social variables for the management of sustainable local development. Kaleidoscope 2: 85-93.
  38. Anguiano M, Cruz R, García R (2013) International migration of return. Trajectories and labor reintegration of Veracruz migrants. Population Papers 19: 115-147.
  39. Barrón A (2013) Unemployment among agricultural day laborers, an emerging phenomenon. Development Problems Magazine 175: 55-79.
  40. Fuentes G, Ortiz L (2012) The Central American migrant passing through Mexico, a review of his social status from the perspective of human rights. Convergence 58: 157-182.
  41. Gavazzo N (2011) Actions and reactions: Forms of discrimination against Bolivian migrants in Buenos Aires. Journal of Social Sciences 24: 50-83.
  42. Granados J, Pizarro K (2013) Paso del Norte, how far you are staying. Implications of return migration to Mexico. Demographic and Urban Studies 28: 469-496.
  43. Izcarra S (2011) Migratory networks versus labor demand: the elements that shape the migratory processes. Convergence 57: 39-59.
  44. Martínez G (2014) Chiapas: social change, migration and life course. Revista Mexicana de Sociología 76: 347-382.
  45. Pérez M, Rivera M, Uribe I (2014) Migration from the perspective of employers of an agro-industry in the Altos de Jalisco, Mexico. Social Studies 43: 112-136.
  46. Sabino J (2014) Internal migration and size of locality in Mexico. Demographic and Urban Studies 29: 443-479.
  47. Wieviorka M (2007) Identities, globalization and inequality. Puebla: UIA.

Talking about Menstruation: A Path to Strength Peers’ Commitment Fostering Health Literacy

DOI: 10.31038/AWHC.2022513

Abstract

A paradigm shift in education is currently happen, with a change in the core concepts and practices. There is no doubt that this global challenge of implementing multichannel education boosted the opportunity to acquire digital skills. The excessive use of technology showed a double-edged sword effect, it allowed us to continue working and communicating, especially since the pandemic’s onset, but on the other hand, social skills were weakened by digital isolation. No one knows who is not hidden behind a screen nor can access the body language, which is a valuable tool in the teaching-learning process.

Meanwhile, now that we are expectant and eager to return to normalcy, the growing lack of motivation and poor social interactions come across in the academic community. This evidence highlights how urgent it is to promote strategies to engage, support, and strengthen peer relationships.

The perception of this established emptiness in interpersonal relationships, lead on the great challenge that was to get across the menstruation topic, that cuts across all generations and ages, and is still a subject where there are many alternative conceptions, about which there is little opening to talk about. One academic forum was implemented to speak openly about taboos and overcome constraints, strategies such as games, critical questions, and challenges were presented to be solved with cooperative work, allowing connections between peers and developing their sense of belonging to the same community. Thirty-six health care university students strongly participated by sharing their time, talent, and expertise, making this forum an extremely enriching learning experience for all stakeholders. The results revealed that non-formal approach, not only increases literacy, but also breaks barriers and opens new possibilities for students to actively engage with peers.

Keywords

Menstruation forum, Collaborative learning, Non-formal activities, Peer commitment, Health literacy

Introduction

In a context of social isolation, not only as a consequence of the pandemic, but also due the increasingly growing dependency on technologies and social media, the dissemination of strategies that promote global health literacy should be a priority social responsibility of all educational institutions.

Based on the fact that the young European people are falling in trust, demonstrating a decline in community commitment, the insightful outcomes of non-formal educational methodologies have proven to be an increasingly useful tool for lifelong learning, collaborative work, team building, and project development.

In the European arena of academic education, a structured and conscious change in teaching and learning processes is on process [1,2]. More innovative and dynamic learning environments, linking education to robust formal and non-formal methodologies, are being applied in various contexts. However, for multifactorial reasons the student-centred learning, outlined by the Bologna process, remains under-developed and the promotion of active and meaningful learning is far away from reaching its full potential.

When some particular situation is able to disturb the whole world like what is still happening due to COVID-19 pandemic, world consciousness changes in all areas of society. Despite all negative impacts and changes to daily life, online teaching-learning processes during the lockdown period, undoubtedly accelerated digital skills acquisition and the development of online learning platforms’ potential. Not intending to set obstacles neither to minimize educational digital innovation, some major drawbacks in the on-line process were perceived, namely: it is not suitable for hands-on practical experience; self-motivation, essential time management, and informatics previous skills are needed; as well as the negative impact in the relationship between knowledge and social attitudes. It is unquestionably that face-to-face feedback is more personalized and that a cautious professor can more easily understand non-verbal signals indicating constraints or difficulties in the learning process. Finally, the social isolation undermined the sense of belonging that is crucial for a meaningful learning experience.

In agreement with the fact that the collaborative learning process is a widely recognised pedagogical practice that promotes socialization helping learners to capitalize on one another’s specific skills and gain relevant insights [3,4], this was the chosen strategy to implement our contents. There are several educational approaches that can be applied in order to build knowledge with collaboration, strengthening the social bounds, and mutual engagement in academic contexts [3,5,6]. All of them share the teamwork and can be a strong approach to be implemented in this period of returning to traditional classes, since they reinforce positive interdependence, individual and group accountability, interpersonal and social skills, and also the relevant feelings of belonging.

The positive effects of youth learning engagement are not restricted to changes in the academic environment and community. These young people will continue their journey outside the university campus passing on information, performing positive social changes and pinpointing gaps in society education. Considering that health literacy is often low, even among health care students, and that the menstruation topic is still a subject mainly analysed as a physiological event, not being naturally approached in all its scopes, we believe that a change of the mind-set about menstruation can have a significant impact on youth education/proactivity [7-11].

Being aware that it is necessary to build trust to overcome resistance to change, we share one experience in implementing a collaborative learning experience using the community forum model as a non-formal approach. The forum was designed to deepen menstruation issues, break down taboos and look into menstruation over the dominant preconcert and simultaneously strength and rescue the peer commitment between students.

Spreading reliable knowledge on a non-formal way with students from university health degrees, granted us confidence that health literacy will be improved in the context where people act. Nonetheless, more than contributing to promote health literacy, this paper intends to describe a forum that can be replicated as a methodology and strength the spirit of community.

Methodology

The organization of an academic forum involves a lot of previous work in contextualised planning, challenging, and sequential activities. The participants in this activity were 36 health courses students (future nurses, nutritionists, and physiotherapists), including 14 male and 22 female. These data were used to understand menstruation literacy in these two groups.

After gathering the expectations of the students, an ice breaker activity was used to start working on an unfamiliar environment and get all involved with the issue. In this specific forum the activity chosen was a network game, where alternative conceptions on the subject had emerged. The main steps to apply the network game were: (1) main words related with menstruation were written and placed inside envelopes; (2) participants were divided into groups. In each group, the spokesperson picked one envelope, read the word and everyone had to think about concepts associated with that main word; (3) the wool ball was launched from an element to another until all elements have contributed with a related idea; (4) the person holding the ball of wool began and so the construction of the web of words.

Three initial questions were distributed among students: one regarding biological knowledge, one about menstrual perception practices and another one regarding concern hygiene awareness. The anonymous answers were posted it on the wall.

The concepts inherent to menstruation were initially developed by the students that shared prior knowledge, describing, labelling and explaining some images that were presented. After a brain storming, the concepts consolidation guaranteed that all doubts were clarified.

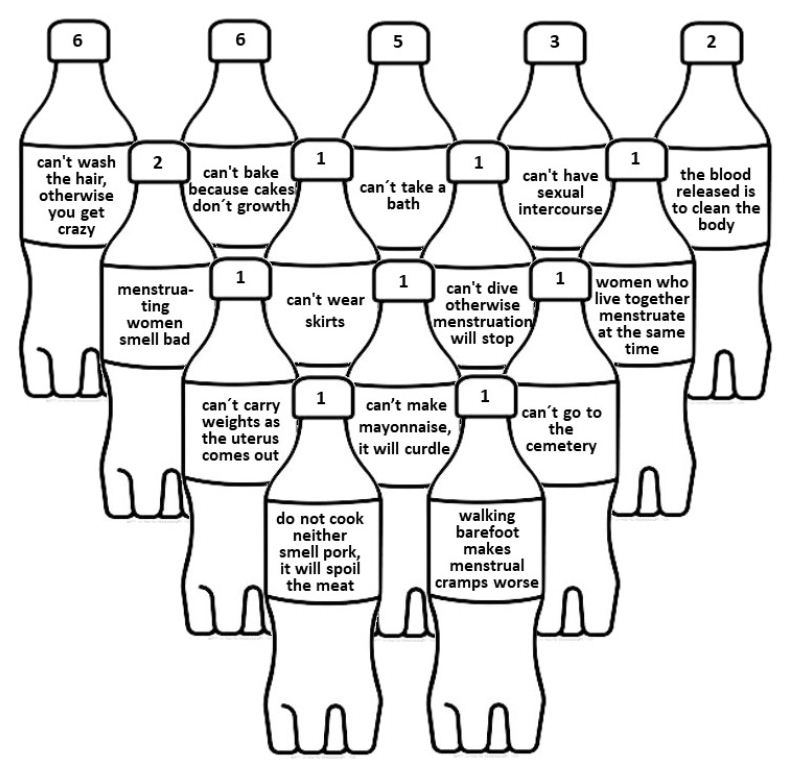
As a team strengthening and engaging activity, the bowling bottle game was performed to deconstruct pre-existent myths. The bowling game was developed in three distinct steps: (1) each participant wrote a story of customs, a myth or taboo about menstruation and sticked it around one bottle, facing inwards; (2) the bottles were arranged as a bowling game and, one at a time, participants throwed a ball and overturn bottles; (3) the overturned sentence(s) were read and a scientific explanation, when it exists, was shared to clarify or deconstruct the social custom.

The acquisition and/or consolidation of knowledge was evaluated in a more classic way using a quiz, containing six questions regarding biological knowledge, four questions about menstrual perception practices and four questions concern hygiene awareness. The questions were adapted from the [8], and some of them were reformulated to accept closed answers as intended in a questionnaire applied on the kahoot platform.

The main findings of all forums were obtained by using a hand evaluation approach. Participants drew their hand on a piece of paper and recorded it in the drawing according to the scheme: thumb finger – to “point-out” something good, something they really enjoyed; index finger – to “highlight” something they would like to emphasize; middle finger – to “improve” something they did not like so much; ring finger – to “engage” with something they treasured from the activity/event; and in the little finger – to “others” little things they want to add.

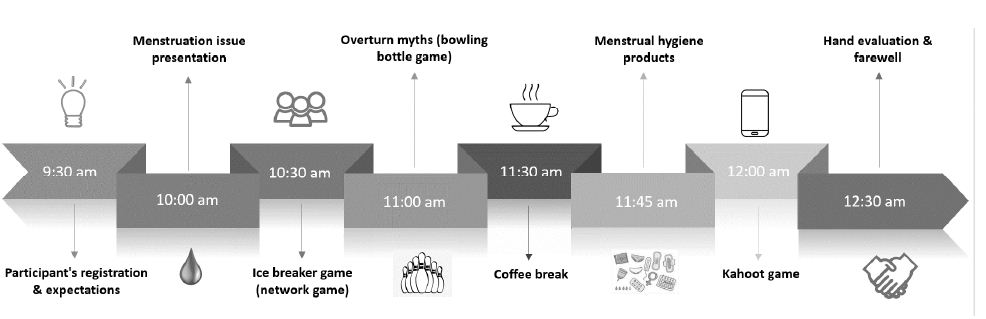
Furthermore, the time for coffee break and socialization was very important since a non-formal environment was required. Although the methodology only strengthened the most relevant non formal tools, it was not on propose to minimize all the essential procedures for the implementation of the event. The Figure 1 details the timeline for all activities that were applied in this forum.

fig 1

Figure 1: Timeline diagram representing all moments of the academic forum

Results

The academic forum was applied to 36 undergraduate students from Atlântica Health School, Portugal. More than an innovative environment, the forum provided a more intimate learning experience. The students strongly participated and there was a generalized commitment with all the proposed activities in a relaxed environment, sharing and questioning emerging spontaneously in an explicit student’s complicity.

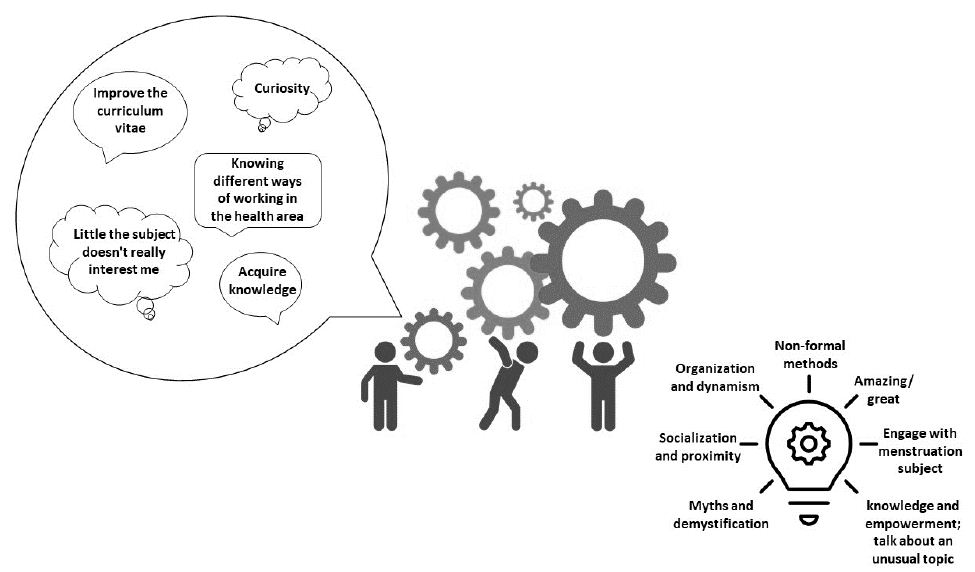
Getting into the forum results, the 36 students’ initial expectations were generally low, 35% of the students were more interested in curriculum enrichment, or even with little interest on the topic and 65% expressed the look for knowledge and curiosity about the strategy.

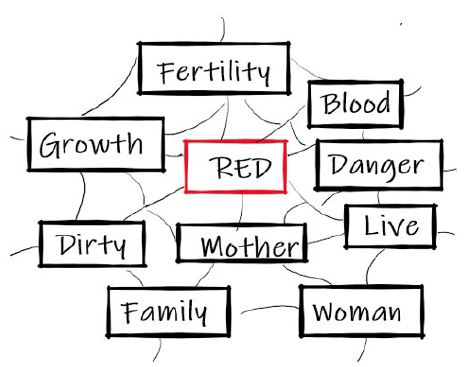
The rescue and students’ engagement started with the use of their assets in a non-formal ice breaker activity. The outstanding word cloud resulting from the network game (Figure 2), firmly helped participants to share their personal stories and built meaningful relationships through the topic.

fig 2

Figure 2: One example of a web of words obtained on the network game

Expanding the issue with collaborative work always boosts the team energy and motivation, and improve participants ability to problem solving. So, a vigorous collaboration among peers and professors was applied, to overcome the misconceptions surrounding the menstruation issue. The entire team worked in the bottle bowling game and, more than highlight that the empirical evidence about menstruation awareness still remain in Portuguese society, results revealed that their clarification go further when we work together.

The myth more citrated were associated with menstrual perception practices and hygiene awareness, for example: “walking barefoot make the menstrual cramps worse”; “can´t take a bath”, “during menstruation can´t was the hair, otherwise you get crazy” and “can´t bake because cakes don´t grow”. Other myths that may have some connection with the cultural legacy were: “can´t go to the cemetery” and “do not cook neither smell pork, it will spoil the meat”. Since some ideas came up several times, the number of repetitions was registered on the bottle cap as showed in Figure 3.

fig 3

Figure 3: Diagram of the bowling game represented the bottles with the sentences and the number of repetitions

Back to the wall, the anonymous answers to the three starting questions showed incoherent, disorganized answers, only revealing empirical knowledge with a lack of scientific support, and not suitable at all for students in the health area.

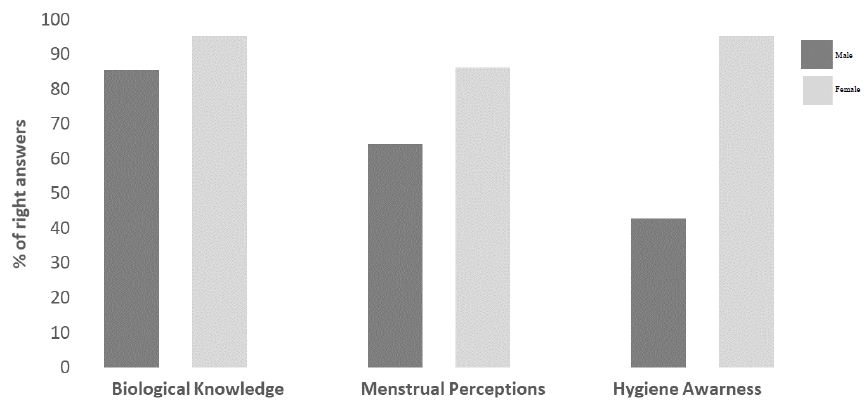
After experiencing this team learning approach, the global results of the Kahoot questionnaire revealed higher percentage of right answers in biological knowledge questions (91%), followed by menstrual perceptions (69%) and hygiene awareness (64%). Comparisons between males and females showed an overall female tendency for higher scores (Figure 4).

fig 4

Figure 4: Questionnaire percentage results organised by group of questions and sex

These results are in agreement with the final balance made for students who shared orally their difficulties in solving the questionnaire. Boys highlighted that their knowledge of the subject had improved considerably, that they never felt so comfortable talking about the topic and it was an excellent experience to be able to share the information with more experienced colleagues.

Despite this positive output, the forum success was only validated by comparison between the initial expectations of the students and the assessment about the forum that they performed at the end of the entire event (hand evaluation). This linked comparative analysis is represented in Figure 5.

fig 5

Figure 5: Expectations and evaluation of the academic forum process

The hand evaluation exercise showed that students really pointed out, highlighted and engaged with the non-formal methodologies. In the “point out finger”, knowledge and empowerment in general, and specifically environmentally friendly new hygiene products, obtained 55%. Non-formal activities, socialization and proximity obtained the remaining 45% of answers. The 39% of the “highlight finger” opinions revealed openness to talk and the contact with all menstrual hygiene products whilst 36% indicated non-formal and dynamism, and the last 25% myths and demystification. Nothing to declare got the majority of the statements from the “improve finger” (61%) and some students suggested that the subject deserves more time. The “engage finger” shared 50% with the non-formal approach, and 50% with the menstrual subject and ecological products. The “little finger” revealed opinions and adjectives that support carrying out more similar initiatives.

Figure 5 indicates the transformation of the initial expectations into the main findings obtained at the end of the event. The dynamic process represents the forum and reveals a significant change between the initial and final ideas and/or concepts of the students. The gaps and the initial curiosities resulted in very positive evaluations and one of the findings was the verbalization of a lasting commitment to the theme and method.

Conclusions

Despite clearly living in a time of great technological challenges, the exclusive application of education technology is not a magic solution for everything or for everyone.

The implemented actions aim to create tools that can be applied and used in different contexts, to reverse significant learning losses but also to implement new strategies to recover social emotional learning. Empower people, regardless of social and cultural background, fostering agents of well-being, in their local environment to promote positive social changes; it is a huge promotion of health literacy.

According to other studies that highlighted better learning achievements in university institutions through collaborative non-formal education, this focus on the student helps them to maintain a constant motivation and affection towards their study [12-14]. The analysed forum proved to be a strong tool for brainstorming matters important to public health that are outside the syllabus. Based on collaborative learning, students were cognitively, socially, and emotionally challenged to critical thinking. By talking freely about one of the oldest non issues, the menstruation, they acquired relevant insights and tacit knowledge, and strengthened all interpersonal relationships, allowing the build of constructive relationships, improving communication and trust.

The implementation of non-formal methods is not by itself a guarantee of success. The chosen activities and the timing of their application were key to promote the participation and engagement of the students, one of the most important criteria for successful dynamics. Doubtless, brainstorming around the several inaccurate biased ideas was the moment when the contribution, building of awareness, learning, and transference of knowledge fulfilled most participants, confirming that we become stronger when working together sharing ideas and knowledge. By getting into reflection teamwork maximized the available potential to achieve the needed results and, therefore, contributed more effectively towards a successful outcome.

Nonetheless, despite all the efforts expended previously, the reward finally came when all the evaluation processes applied, such as observation of body language, formal responses to questionnaires, and evaluation of the entire forum were very positive and encouraging. Feedback opinions such as “great and amazing engagement with non-formal methodologies” showed that it was possible to overcome all participants’ expectations and allowed the validation of the total event.

The forum validation was fundamental to add value on the research consolidation and to support a continuous improvement. To rescue students’ commitment, all academic community need training and additional support on a set of tools, not only to assess the learning levels of their students, but also to rescue their social emotional learning skills.

Community should be prepared to change their mind-set, taking the challenge of non-formal methods and embrace engaging activities. All in all, the initial low expectations of the menstruation forum were transformed in very positive outputs.

Empower people with knowledge to recognize the influence of their emotions on their attitudes, grant that they bring home a message about emotional literacy. As a consequence, not only a better self-awareness is expected, but also the improvement of the relationship and structure of the community, where our youth and young adults belong.

References

  1. EHEA – European Higher Education Area (2015) Widening participation for equity and growth: A strategy for the development of the social dimension and lifelong learning in the European Higher Education Area to 2020.
  2. EHEA – European Higher Education Area (2020) Bologna Process Implementation Report.
  3. Le JJ, Wubbels T (2018) Collaborative learning practices: teacher and student perceived obstacles to effective student collaboration. Cambridge Journal of Education 48: 103-122.
  4. Kromydas T (2017) Rethinking higher education and its relationship with social inequalities: past knowledge, present state and future potential. Palgrave Commun 3.
  5. Millis BJ (2010) Why faculty should adopt cooperative learning approaches. In: Millis BJV, Sterling V (eds.) Cooperative learning in higher education-across the disciplines, across the academy (pp. 1-11). Stylus Publishing.
  6. Scager K, J Boonstra, T Peeters, J Vulperhorst, F Wiegant (2017) Collaborative Learning in Higher Education: Evoking Positive Interdependence. CBE-Life Sciences Education 15: 1-9.
  7. Eschler J, A Menking, S Fox, U Backonja (2019) Defining Menstrual Literacy With the Aim of Evaluating Mobile Menstrual Tracking Applications. CIN: Computers, Informatics, Nursing 37: 638-646.
  8. Pires AM, AC Sousa (2020) Girls experience of menstruation: One Portuguese reality. Case Report Review Open Access 1: 118.
  9. PEN-Period Empowerment Network Project (2020) Period Empowerment Handbook: Re-educating society about menstruation through youth work. Terram Pacis Editorial TPOER-012-PEH/25-MAY-20.
  10. Sousa AC, AM Pires (2020) Opinion: Menstruation One of the Oldest Non-Issues. Womens Health Science Journal 4: 000148.
  11. Armour M, K Parry, C Curry, T Ferfolja, M Parker, et al (2021) Using an online intervention to improve menstrual health literacy and self-management in young women: a pilot study.
  12. Grajcevci A, Shala A (2016) Formal and Non-Formal Education in the New Era. Action Researcher in Education 7: 119-130.
  13. Rocca C, La M, Margottini, R Capobianco (2014) Collaborative Learning in Higher Education. Open Journal of Social Sciences 2: 61-66.
  14. Walsh L, Kahn P (2009) Collaborative Working in Higher Education. The Social Academy.

Mind Genomics Cartographies of Everyday Anxiety Producers

DOI: 10.31038/ASMHS.2022622

Abstract

In 15 parallel studies dealing sources of anxiety, public and private, separate groups of approximately 120 respondents each evaluated different combinations (vignettes) of messages about anxiety -provoking situations. The vignettes presented the nature of the situation, the effect on people, the effort to contain the problem, and the individual’s response to the situation. Each respondent evaluated 60 unique combinations of these vignettes, rating each vignette on a 9-point scale (1=Can deal with it.9= Cannot deal with it.) Data suggest that the basic level of anxiety is approximately the same across the 15 sources of anxiety, but that the elements, the messages dramatically differ in their respective abilities to drive or to reduce anxiety. Surprising, many of the so-called efforts to deal with the anxiety, especially from the sources outside one’s family (e.g., government, local hospitals, etc.) increased anxiety, rather than diminishing it. The database (Deal with It!) shows the contribution to insights and to the social record from databases of studies of social situations, created in a systematic manner according to experimental design of ideas (Mind Genomics.)

Introduction

Anxiety is a leitmotif of our times, with a popular and an academic, as well as an artistic literature virtually unfathomable. A sense of the vastness of our concern may be given by today’s arbiter of social internet, Google, which counts the number of available websites dealing with a topic. Table 1 presents Google Scholar hits for different topics dealing with anxiety. The table is sorted by number of hits. These topics constitute the 15 assessed in the Deal With It! set of Mind Genomics cartographies.

Table 1: Google Scholar hits for the topic coupled with ‘anxiety’. Data up to2003


 Topic

Hits as of 2003

1 Relationships

 1,130,000

2 Environment

 954,000

3 Social Interactions

 413,000

4 War

 372,000

5 Sexual Failure

145,000

6 Lose Health

 116,000

7 Aging

111,000

8 Failure of Health Care

 109,000

9 Lose Income

 57,700

10 Obesity

 56,300

11 Infectious Disease

 40,500

12 Phobias

 26,800

13 Terrorism

 20,900

14 Franken Food (Genetically modified)

 18,800

15 Lose Assets

 18,000

Anxiety pervades our life. It is the bread and butter of psychologists and others in the helping professions.. It is the topic of numerous self-help websites. And it is something familiar to many of us. Anxiety comes in such variety that the sheer vastness of the topic suffices to make one anxious, just dealing with that unwieldly richness.

This paper deals with anxiety as a situation presented in text form to a respondent, instructed to rate the degree that she or he can ‘deal’ with the situation or cannot deal with the specific described situation. We avoid the general topic of ‘anxiety’ and present the topic as something with which a person can deal. That is, we make the situation somewhat concrete by particularizing the events.

The origin of these studies emerged from consumer research promoted at first by an ingredients company, McCormick & Company, in 2001, but with a focus on food, not anxiety. That early focus led to a set of 30 parallel studies in what makes people really desire a food, called naturally ‘Crave It!’ [1,2]. The success of Crave It! quickly led to several other series of so-called It! studies, focusing first on food, then on beverages, on good-for-you foods, and finally and snack foods.

The early focus on foods also sparked focus on the approach to study situations. The major study to emerge was the use of this It! approach to study the responses to anxiety provoking situations. Rather than dealing with topics that were positive, the effort was focused on understanding how the different aspects of an anxiety-producing situation drive the response of ‘Can deal with it (rating = 1).to. Cannot deal with it (rating = 9)’. This paper presents an extensive analysis of those data.

Since the early research in 2003, Mind Genomics has been applied to anxiety-relevant situations,, such as the anxiety of teens in a doctor’s office [3]; anxiety in social situations [4], anxiety about the toxicity of house plans [5], and anxiety in the midst of a crisis in the pharmaceutical industry [6] The hallmark of these studies is the disciplined deconstruction of the issues into messages, their recombination by experimental design, the analysis of the new combinations, and the emergence of insight data about how people make decisions using the information provided [7,8].

Combining Mind Genomics with Anxiety – A Step by Step Development of the It! Cartography

The easiest way to understand what Mind Genomics may contribute to the study of anxiety is through an experiment, or in this case 15 experiments, run simultaneously, with similar patterns of elements, and similar patterns of analysis [4]. We call these experiments ‘cartographies’ because they ‘map out a terrain’ rather than focus on affirming or falsifying a hypothesis in the tradition of the more typical hypothetico-deductive approach to science. That is, we search for patterns, for regularities, upon which hypotheses can be developed. In sum, Mind Genomics as we see below is ‘hypothesis-generating.’

Step 1 – Create the Raw Material

The basic input for the Mind Genomics study is a topic, followed by a set of questions presenting different aspects of that topic and ‘telling a story’, and finally each question giving a set of answers which provide specific information. These answers take the form of a stand-alone phrases. Later the actual test stimuli will comprise vignettes, combinations of these answers (but never the questions.) It is vital that the answers, the elements, be able to stand alone, and make sense.

Figure 1 presents the 15 studies. The viewpoint of an It! project or even a single Mind Genomics cartography that there may be important things in a topic, the precision of learning will not be increased by repeating the same experiment many times, producing precision. It is better to cover many different topics, even if the coverage is more error prone because the resources are more fruitfully expended studying different topics, not the same topic with more people.

fig 1

Figure 1: The 15 studies, shown by the 15 topics. The figure shows the ‘wall of choice.’ Respondents could see the available studies, choose one, and do the corresponding Mind Genomics study

Table 1 presents the three of the studies (Terrorism, Infectious Disease, Obesity). Table 1 shows the four questions, nine answers for each question, language and topic attempting to be parallel across the 15 studies. It was impossible to make the elements exactly parallel, since it was also vital to have the elements seem real and relevant.

Across the 15 studies and 36 elements per study, there were 540 elements. The 36 elements for a study were divided into the four questions. Within each question the types of elements were to be similar to each other across studies, although often this requirement some editing and wordsmanship to make the element both match the anxiety provoking situation, but be similar in form to the other elements of this type across the remaining 14 studies. Table 2 gives a sense of the 36 elements created for three parallel studies; terrorism, Infectious disease, and obesity, respectively

Table 2: Example of elements for three parallel studies; terrorism, infectious disease, and obesity


 Terrorism

 Infectious disease

Obesity

  Question 1: What is happening?
A1 The media talking about potential terrorism acts… The media talking about diseases that are spread by human contact or by the air… The media talking about the increase in obesity…
A2 A bomb threat for a building that is a false alarm… You have a dry cough and don’t feel so good… You’ve added a few pounds…
A3 A bomb under your car… You are getting a fever and don’t feel so good… You’ve added a lot of extra weight….
A4 Bombs blowing up in the middle of a building… You have some red bumps on your skin and don’t feel so good… You can’t take the weight off…
A5 Fire raging through a building… Your feel really run down… You can lose it….but you just can’t keep the weight off…
A6 Contamination of the food supply… You have been on an airplane that just came from some place that has some known infectious diseases People look at your body and judge you…
A7 A deadly disease like smallpox or anthrax let loose…. You have to travel to a place that has some known infectious diseases You just can’t control the eating…
A8 A Computer virus let loose that impacts your everyday businesses… You know the disease has arrived in your country You eat right, exercise, and still can’t keep the weight off…
A9 A dirty nuclear bomb set off … You have to touch people that you know have some infectious disease You are uncomfortable because of your weight doing what everyone does naturally…
Question 2: Who is affected?
B1 In a non-populated area… No one you know is affected… You tell no one how you are affected…
B2 In a heavily populated area… People you work with OR will be working with are affected… People you work with are affected by your size…
B3 An area crowded with children… Children are affected… Your children are affected by your size…
B4 An area crowded with senior citizens… Senior citizens are affected… Your parents are affected by your size…
B5 An area filled with tourists… Tourists are affected… Strangers are affected by your size
B6 When you least expect it… You never expected it to happen to you or someone close to you…. You never expected it to happen to you or someone close to you….
B7 During a Yellow alert… People are getting sick in the location you have to travel to… People around you are embarrassed…
B8 During an Orange alert… Your health office warns you not to travel to this location… People around you are so judgmental…
B9 During a Red alert… The area you are traveling to is going to be or is quarantined People around you don’t see you for who you are…
Question 3: How do you react?
C1 You are all alone… and you feel helpless… You think about it when you are all alone…and you feel so helpless You think about it when you are all alone…and you feel so helpless
C2 You think about it, you just can’t stop thinking about it… and you feel uneasy…. When you think about it, you just can’t stop…. When you think about it, you just can’t stop….
C3 You’d drive any distance to get away from it… You’d drive any distance to get away from it… You’d drive any distance to get away from it…
C4 You are scared … inside and out You are scared … inside and out You are scared … inside and out
C5 You experience it all … seeing, smelling, tasting You experience it in all your senses… You experience it in all your senses…
C6 All the stress just builds up… you feel overwhelmed All the stress just builds up… you feel overwhelmed All the stress just builds up… you feel overwhelmed
C7 You experience temporary memory loss because there’s just too much to take in…. You experience temporary memory loss because there’s just too much to take in…. You experience temporary memory loss because there’s just too much to take in….
C8 While surrounded by family and friends…. Family and Friends play a big role in your life… Family and Friends play a big role in your life…
C9 At a special moment… in your life At a turning point in your life…. At a turning point in your life….
Question 4: Who or what can help ?
D1 You trust that God will keep you safe You trust your God will help you get through this You trust your God will help you get through this
D2 You believe that international cooperation in the United Nations will keep you safe You believe Charities will help you get through this You believe your doctor will help you get through this
D3 You think United Nations Forces will keep you safe You believe whatever insurance you have will help you get through this You believe talking to a therapist will help you get through this
D4 You believe that Homeland Defense will keep you safe You trust that the government and the airports will stop this from entering your country You believe talking to diet counselor will help you get through this
D5 You believe that the Center for Disease Control will keep you safe You believe your Local Hospital will get you through this You believe a plastic surgeon will help you get through this
D6 You think that your Local police will keep you safe You trust your doctor will get you through this You believe that the food industry will work to help you find the right foods to eat
D7 You think that your Local hospital will keep you safe You believe your company will help you get through this You believe work will help you get through this
D8 It’s important for the Media will keep you informed It’s important for the Media to keep you informed It’s important for the Media to keep you informed
D9 You need to contact your friends and family to make sure they are OK… Your family and friends will help get you through this… Your family and friends will help until you get through this…

Step 2: Create Vignettes according to an Experimental Design

The heart of Mind Genomics is the use of combinations of stimuli, these combinations indicated by the underlying design. The design itself is simply a shell, ensuring that the elements are statistically independent of each other (allowing for OLS, ordinary east squares regression), and that the elements are laid out in such a way that each element appears equally often, and is absent an equal number of times from the full set of vignettes.

With the 4×9 design, the most popular during the early years, 2000-2006, a total of 60 combinations, called hence vignettes, comprised at most one element from a question, but quite often one or two of the questions was deliberated not allowed to contribute an element. The benefit of the design is that is can be automatically populated simply by a replacement table. The researcher need not have to think about the statistically issues. Figure 2 shows an example of a vignette comprising four elements. By design some vignettes comprised four elements (one answer from each question), other vignettes comprised three elements (one of the for questions did not contribute an element), and still other vignettes comprised two elements (two of the four questions did not contribute an element.) Each element appeared equally often.

fig 2

Figure 2: Example of a four-element vignette for Terrorism

Each respondent evaluated a unique set of vignettes. The uniqueness was established by a permutation scheme which kept the mathematical structure intact but simply permuted the elements. This produces 60 unique combinations for each respondent. The experimental designed was prescribed by a permutation approach [8,9], and automatically embedded in the technology.

The rationale for the incomplete experimental design is the downstream ability to perform an OLS (ordinary least squares) regression analysis on the data of each individual respondent. This is known as a within-subjects design. Were there even as few as one respondent, it would still be possible to create a model showing the number of rating points that could be attributed to each of the 36 elements. That property of individual-level modeling will become important for clustering the data together to create mind-sets, an important aspect of Mind Genomics

Figure 2 presents a sample vignette that the respondent was shown. The vignette is simple, comprising simply the elements prescribed by the underlying experimental design, these elements simply placed there without any effort to connect that. The rating scale appears at the bottom. Although many marketing professionals prefer to test concepts which are full, more polished, with better production value, the reality is that the focus is on the respondent’s evaluation of the different vignettes, and the discovery regarding which specific elements drive the response. It is counterproductive, in fact, to make the vignette ore dense, more connected. The respondent ends up wading through additional ‘stuff’ to get to the information. It is the information, not the connectives, which are importance, and as a consequence, the spare structure shown in Figure 2 is ideal. The respondent does not get fatigued.

Step 3: Acquire Respondents

The respondents were invited to participate by an online-panel provider, Open Venue LTD, headquartered in Toronto, but providing respondents in both Canada and the United States. The respondent was invited to the general study by Open Venue Ltd. The respondents who participated was led to the ‘wall of available studies.’ Studies whose quotas were filled (approximately 120 completed respondents) ‘disappeared’ from the wall, so only the available studies with incomplete quotas appear for the choice.

The respondent was allowed to pick any study. Once the respondent selected the study, the respondent was led to the appropriate website. The first slide was the orientation slide (Figure 3). The orientation slide provides very little information about the study. Rather, the slide describes the topic by a few words, moves into the rating scale, and states that all the vignettes differ from each other. This last statement, viz., no repeat vignettes, emerged from exit interviews, where respondents said that they felt they were evaluating the same vignettes The reality is that the respondents were evaluating the same elements, but different combinations of the elements.

fig 3

Figure 3: The orientation page at the start of each of the 15 Deal With It! studies. The only thing which changed from study to study is the name of the topic (Welcome to the Deal With It! Terrorism Study)

It is worth noting that the majority of Mind Genomics studies conducted during the past 25 years have been studies in which a third party, e.g., Open Venue Ltd., has used its panel. Respondents do not like to spend 10 minutes of their time unless they feel that their efforts are valuable, or unless there is a reciprocal arrangement of give/receive on both ends. The number of completes for a compensated study, here about 33%, is far greater than the number of completes were these studies to rely upon the donated time of respondents without compensation. No matter how interesting or exciting the study, most respondents really want ‘something’ in the way of compensation.

Step 4: Surface Analysis – How Many Respondents Participated vs. How Many Dropped Out?

The objective in this Mind Genomics It! study was to recruit approximately 120 respondents for each of the 15 studies, or approximately 1800 respondents. Figure 1 shows the ‘wall’. The respondent who participates could choose any of the studies available on the ‘wall.’ Without an artificial limitation, there would have been a preponderance of respondents choosing sexual failure, aging and war. To ensure an approximately equal number of respondents for each study, once the study reached about 120-125 completed respondents, the choice of the study disappeared. This strategy ensure the base sizes.

As part of the overall effort to balance the base size, the studies were launched at the same time, and the number of log-ins, as the number of completes were recorded on a daily basis for the first few days, and then done again after a three day hiatus. The rate of log-ins gives a sense of the interest in the topic. Figure 4 shows the cumulative number of log-ins over a two week period.

fig 4

Figure 4: Cumulative log-ins for each study over a two week period. (No study exceed 125 respondents after successful log-in)

The key information in Figure 4 comes from the shape of the curve, and the number of log-ins need to reach the target quota of 120 respondents. The patterns can be deconstructed as follows:

a. Steep at first – lots of respondents are interested. Most of the topics are like that. Examples are Relationships and Phobias

b. Less steep at first – not as many respondents immediately interested. The best example is aging.

c. Concave downwards – the curve goes up, flattens into an asymptote. The study starts off strong but then fewer respondents are interested at the end. Example are Environment, Obesity

d. Linear all the way – the curve keeps going up in a straight line. The level of interest is the same from start to finish Examples are is Relationships and Aging.

e. Level at day 15 is low. The number of logins to reach quota is smaller. People are interested in the topic. The best example is Lose Income.

f. Level at day 15 is high. The number of logins to reach quota is higher. Many more people ‘drop out of the experiment along the way, so they are not counted as part of the quota. Good examples are Relationship and Aging

The second surface analysis is to understand who participated. Knowing WHO the respondent is for many studies helps only when one wants to identify the specifics of the target population either because the study is most pertinent to them now or because there may emerge a strong linkage between the results of the study and the particular applicability of those results to a self-defined group. Thus, respondents were instructed to provide information about their interests and lifestyle, as well as on their previous behaviors. This information should make the study more relevant as a source of information about what concerns people.

When we deal with 15 different studies, these studies dealing with different causes of anxiety and frustration, the patterns of who participated across the 15 studies interesting, even if there is no practical application as yet. Furthermore, the pattern of participation becomes even more interesting when one realizes that the respondents were free to select the study which interested them. After the respondent finished evaluating the test vignettes, the respondent completed a self-profiling questionnaire, telling the researcher about themself. The questionnaire instructs the respondent to self-classify in terms of gender, age, income, location where living, how severe is their experience with the anxiety, how frequently they experience the situation, the location, the ways they use to cope with the anxiety, and so forth.

Table 4 shows a reduced form, with the 15 topics as the data columns, the rows showing a few of the self-profiling questions answer by the respondent. We do not look at many classification levels, simply because the vast amount of data would simply overwhelm. Table 4 shows by shaded cells the most frequent anxiety situation for each of the classification questions. It is clear from Table that respondents have varying degrees of interest in the topic. The data do not suggest randomness. Rather, the frequency of choice of a topic may indirectly reflect the basic interest in the topic. The clearest evidence of that is the is the comparison of two topics situated next to each other in Table 4. The data speak for themselves. These are aging and sexual failure, respectively, with 123 and 124 respondents, respectively.

Age 31-50 Aging chosen by 38 respondents, sexual failure by 64 respondents

Age 51-7 4 Aging chosen by 81 respondents, sexual failure by 41 respondents

(other ages not shown in Table 3)

Table 3: The composition of respondents who participated in the 15 Deal With It! studies. The columns show the studies. The rows show a partial breakout of the subgroups, defined both how he the respondent experiences the anxiety, and who the respondent is from a geo-demographic viewpoint

table 3(1)

table 3(2)

Step 5: Relating the Elements to the Ratings Using Regression Modeling

The essence of Mind Genomics is the ability to relate the presence/absence of the elements to the response, using regression analysis. The fact that the combination were systematically created means that we can actually measure the degree of ‘causation’, viz., that the presence of a specific element actually covaries in a specific way with the rating.

The first step when we relate the elements to the ratings is to decide whether the ratings need to be ‘transformed.’ For most basic science it is entirely adequate to work with the original rating scales, and apply statistical procedures to the ratings. When we deal with the world of application, however, we face a problem. The problem is simple, and is stated something like the following: ‘What does a 7.08 mean?’ Is a 7.08 good or bad? What should i do with that rating of 7.08? The foregoing question uses the value of 7.08 just as an example.

Fortunately, the issue of ‘what does a scale point mean’ is not a new one. The consumer researchers often have opted for yes/no scales, and have converted the rating scale to a binary scale. Thus, in conventional consumer research the respondent might be instructed to rate ‘purchase intent’ on a five point scale, ranging from 1=definitely not buy 5=definitely buy. Rather than working with the actual rating assigned by the respondent, the consumer researcher may transform the rating to a more easily understand binary scale. The typical consumer researcher will transform the ratings 1, 2, and 3 to 0, and the ratings 4 and 5 to 100, respectively. The thus data which had started out as a simple scale (often called a category scale or a Likert scale) becomes a binary scale (not buy/buy.)

The foregoing analysis was done for these data. The respondents used a 9-point scale. The transformation was ratings 1-6 → 0, and ratings 7 → 100, respectively. As a prophylactic measure prior to regression, a vanishingly small random number (<10-5) was added to each transformed rating. The rationale was to ensure that the regression analysis would work even when a respondent assigned all vignettes a rating of 1-6 (which would transform to 0) or a rating of 7-9 (which would transform to 100.) The regression analysis requires a vanishingly small bit of variability in the dependent variable, the transformed ratings.

After the ratings were transformed, the Mind Genomics program separately estimated the following equation for each respondent: Transformed Rating (Binary) = k0 + k1(A1) + k2(A2). k36(D9.) The analysis was straightforward for the simple reason that the 60 vignettes evaluated by each respondent constituted a self-standing experimental design. That is, the data are ‘readable’ down to a base size of one respondent. One would never base the conclusion on one respondent so the approach is either to average the corresponding coefficients from the models of all respondents OR put in all the respondents from a single group into one analysis.

The equation provides a useful summary of the patterns in the data. We can think of the equation as showing the contributions of the different elements to the binary response of either I can’t deal with this (ratings 7-9, now converted to 100), or the binary response of I can deal with this, or may/may not be able to deal with this (ratings 1-6.)

As an analogy, think of a statue standing on its base. The base is the additive constant. The base can be low (low additive constant), or high, or very high (very high additive constant.) Following the base are the different parts of the statue that can be placed atop one another. The parts can be small (low positive coefficients) and can even take away some of the base and thus reduce the height (negative coefficients.) Or the parts can be large (high coefficients), or can even take away a lot of the base (high negative coefficients.)

The analogy of the statue goes one step further, namely the height can be calculated by adding together the additive constant (the base), and the coefficients of up to four elements, as long as the elements come from different questions. The elements can either add to the height (positive coefficients) or diminish the height (negative coefficients.)

Step 5: The Strongest Anxiety-producing Situations as shown by the Additive Constant

The additive constant provides a measure of basic likelihood to say, ‘I can’t deal with it’ (viz., ratings 7-9) in the absence of elements. The underlying 4×9 experiment design ensured that every vignette was populated by a minimum of two elements, a maximum of four elements, and that each of the four questions could contribute at most one element. The additive constant ends up being a purely estimated parameter, one useful to estimate the likely response to the (presumed) anxiety-provoking situation.

Previous studies with Mind Genomics suggest very low additive constants for items or services which do not excite interest. Examples include credit cards, whose additive constants hover around 10-20. To build interest in the credit card is hard. The offeror will have to discover elements which have high coefficients, elements to be added to the offering. In contrast, there are items which enjoy high additive constants, such as pizza, with an additive constant around 65-70. That means that in the absence of any elements, and just knowing the offering of pizza, around 65-70% of the responses will be positive. Returning to th example of th credit card, only 10% of the responses will be positive when the respondent knows the offering is a credit card. Again, other elements have to add to the offering.

Table 4 shows the 15 additive constants, one for each topic. The columns show the 15 studies. The rows show the key groups beginning with total panel, then genders, and then ages. There were other classification groups, but in the interest of clarity, only these are presented.

Table 4: The additive constants for the total panel and for key subgroups. Additive constants of 30 or higher are highlighted

table 4

To allow the patterns to emerge more clearly, all the additive constants of value 30 or higher are shown in shaded form. These are the anxiety provoking situations which, in theory, would generate at least 30% ratings of 7-9 (cannot deal with it), in the absence of elements.

The pattern of anxiety-provoking situations is clear from the additive constant. The big effects occur most strongly with ‘Lose Income.’ Then there are five more, ranging from obesity to relationships which are quite strong. The lowest level is occupied by Franken Foods (viz., non GMO), War, and Terrorism. Keep in mind that this study was run in 2003, after 9/11. Yet there is no free floating anxiety operative for terrorism as there is for losing one’s income, obesity, and sexual failure, three events or conditions which are real.

The ‘Deal with It!’ studies were open to everyone. The period around 2003 would see studies filling up into the hundreds of respondents. Surprisingly, however, The Deal with It study filled up very slowly, with most of the respondent being women, typically around three out of every four respondents. Nonetheless with the within-subjects design, even the 30 or so male respondents provide statistically stable data. That stability allows us to compare males and females. Females are anxious at a basic level about losing income, and losing assets respectively These are the important gender differences, viz., high additive constant, and large difference between the genders.

Step 6: The Elements Which Provoke the Strongest Anxiety Responses, and the Elements Which Provoke the Smallest Anxiety Response

The set of 15 studies provides 540 elements, each with a coefficient from the total panel showing the degree to which the element drives a rating of 7-9, viz., i cannot deal with what is being presented. Fortunately, the additive constants are similar to each other, and need not be considered. Recall that the additive constant is the predisposition for a respondent to feel anxiety (rate 7-9) in the absence of elements. Since the additive constants are reasonably close to each other (Table 4), we can feel comfortable looking at the magnitudes of the coefficients.

Table 5 shows the elements which provoke the great amounts of anxiety, namely elements with coefficients of +10 or higher for the total panel. Of the seven great anxiety-provoking elements, surprising three of these end up being statements about who will help you get through this (viz., loss of health being helped by charities and one’s company; the United Nations will keep us safe from terrorism.) There is no clear pattern for these severe anxiety-provoking elements, other than they are impersonal symbols of authority.

Table 5: Elements which reduce anxiety

Elements which reduce anxiety (Bigger negative = More Anxiety Reducing)

Study

Element

Coeff

Relationships Your family and friends will help until you get through this…

-12

Relationships You trust your God will help you get through this

-12

Lose your income You trust your God will help you find new income

-12

Lose your health You trust your God will help you get through this

-10

Lose assets You trust your God will help you get through this

-10

Social interactions You trust your God will help you get through this

-10

Relationships Family and Friends play a big role in your life…

-8

Aging Your family and friends will help get you through this…

-8

Sex failure You believe passage of time will help you get through this

-8

Lose your assets You trust your God will help you get through this

-8

War It’s important for the Media to keep you informed

-7

Lose your assets People you work with are affected by this situation…

-7

Aging You trust your God will help you get through this

-7

Obesity Your family and friends will help until you get through this…

-7

Lose your health Family and Friends play a big role in your life….

-7

Sex failure No one you know is affected by this situation…

-7

Obesity Family and Friends play a big role in your life…

-7

Lose your assets Family and Friends play a big role in your life…

-7

The second tier of elements, coefficients between 11 and 20, comprise mostly solutions. It is surprising that the presumed help to reduce anxiety instead ends up provoking anxiety (Table 4a).

Table 4a: Strongest anxiety-producing elements

Study

Elements which very strongly drive anxiety

Coeff

Lose Assets You lose your home….

25

Lose Health You believe Charities will help you get through this

25

Lose Health You believe your company will help you get through this

22

Terrorism A bomb under your car…

21

Aging Living in an old age home….

20

Terrorism A dirty nuclear bomb set off …

20

Terrorism You believe that international cooperation in the United Nations will keep you safe

20

Elements which strongly drive anxiety
Aging You believe your plastic surgeon you have will help you get through this

19

Terrorism You think United Nations Forces will keep you safe

19

Relationships You believe dating services will help you get through this

18

Aging You believe Charities will help you get through this

17

Environment You trust that the Local government will keep the earth and you safe

17

Failure of Health Care You believe Charities will help you get through this

17

Relationships You believe talking to a lawyer or the courts will help you get through this

17

Sexual Failure You were raped….

17

Environment You trust that the Environmental Protection Agency will keep the earth and you safe

16

Environment You believe that the Businesses impacted will work to keep the earth and you safe

16

environment A radioactive plume of dust over you….

16

Lose Health You believe whatever Supplemental insurance you have will help you get through this

16

War A dirty nuclear bomb set off…

16

Environment You trust that the government will keep the earth and you safe

15

Income Loss You believe your insurance will help you find new income

15

Infectious Disease You believe Charities will help you get through this

15

Lose Assets You believe Charities will help you get through this

15

Lose Health Your doctor says you don’t have long to live…

15

Sexual Failure You believe dating services will help you get through this

15

Social Interactions You believe taking the right drugs will help you get through this

15

Social Interactions You believe Food or Drink will help you get through this

15

Terrorism Bombs blowing up in the middle of a building…

15

Aging You believe your company will help you get through this

14

Environment

You believe that international cooperation will keep the earth and you safe

14

Infectious Disease You believe your company will help you get through this

14

Failure of Health Care You believe your company will help you get through this

14

Terrorism A deadly disease like smallpox or anthrax let loose….

14

Infectious Disease You believe whatever insurance you have will help you get through this

13

Lose Health Losing control of your bodily functions….

13

Infectious Disease You trust that the government and the airports will stop this from entering your country in a big way

12

Failure of Health Care The medical procedures you need are not covered by your insurance….

12

Lose Health Your body eating itself away from within….

12

Lose Health You believe whatever insurance you have will help you get through this

12

Relationships You believe Food or Drink will help you get through this

12

Relationships You believe Charities will help you get through this

12

Social Interactions You believe Charities will help you get through this

12

Terrorism You believe that the Center for Disease Control will keep you safe

12

Income Loss You trust the government will help you find new income

11

Income Loss You lose your job because you have done something wrong…

11

Failure of Health Care You believe your Local Hospital will get you through this

11

Lose Assets You believe Local government services will help you get through this

11

Obesity You believe that the food industry will work to help you find the right foods to eat

11

Phobias You’re afraid of speaking in public….and you must give a very important speech for your company to an audience of thousands….

11

Phobias You’re afraid of spiders crawling near you…. and you have to reach in a dark musty space….

11

Environment You believe that Greenpeace will keep the earth and you safe

10

Frankenfoods You trust the government will keep the earth and you safe

10

Infectious Disease You have to touch people that you know have some infectious disease….

10

Failure of Health Care You believe whatever Supplemental insurance you have will help you get through this

10

Lose Assets You lose your pension…

10

Lose Assets You lose your car…

10

Lose Health You believe your Local Hospital will get you through this

10

Social Interactions Afraid to go out of the house….

10

Terrorism Contamination of the food supply…

10

Terrorism You believe that Homeland Defense will keep you safe

10

The Deal With It! studies were designed with ‘helping or ameliorating’ elements expected to score low on the 9-point scale, and thus expected to generate low coefficients, presumably negative one in the regression model (after binary transformation.) A negative coefficient tells us the degree to which adding the element to the vignette is expected to reduce the rating, below 7-9 anywhere to 1-6. We focus here on the elements with high negative coefficients, elements expected to drive the ratings down to around 1-3.

Table 5 shows those elements generating coefficients of -12 to -7. There are far fewer elements which reduce the rating of anxiety (viz., which move the rating from 7-9.) God and family and friends are the key elements which reduce anxiety. The other efforts, bringing in government, companies, etc., not only did not reduce anxiety, but rather increased anxiety, as Table 4 shows.

Step 7 – Most Seemingly Reasonable Solutions End Up Backfiring

One of the ingoing theses of the Deal With It! study is that the solutions selected would be effective, maybe perhaps strongly effective at times, weakly effective at others. The presumption was that those respondents suffering most severely would generate the biggest negative coefficients. Towards this end, the next analysis considered only those respondents who self-reported that they perceive themselves to suffer from the problem, and furthermore, rated their suffering extremely high (viz., 5 on a 5 point scale.) For these respondents we then looked at the performance of all elements which presented ‘solutions,’ or at least potential solutions.

Table 6 shows the coefficients for the elements. The only elements which appear in Table 6 are those which score strongly either in ability to decrease anxiety (high negative coefficients, -10 or lower), or on their ability to increase anxiety (high positive coefficients, +10 or higher.)

Table 6: Strong performing elements either reducing anxiety (negative coefficients +10.) The elements in the table are chosen from presume ‘solutions to the problem dealt with in the particular study.’ The table is sorted by the coefficients of those who say they ‘suffer extremely’ from the topic of the individual study

table 6(1)

table 6(2)

Table 6 surprised, because very few of the elements thought to be solutions to the problem are perceived as solutions. Rather, most of them are perceived as increasing anxiety, rather than decreasing anxiety. That is, the solutions are perceived as problems, not solutions. The only real solution appears to be God, which will be dealt with in the last analysis.

Step 8: In God We Trust

This analysis was occasioned by the observation that across the 10 studies where God was mentioned, most of them featured God as a believable reducer of anxiety, viz., someone or something which can help people ‘Deal With It’. Table 7 shows that in most of the studies and among the three groups (total, sufferer, extreme sufferer), the statement about God reduces the anxiety. The coefficients are mostly negative, many of them strongly negative, with values -10 or lower. These results suggest that at least as of 2003, Americans may have been become more secular, but God was still a comforting thought and presence to them across many of the topic issues causing anxiety.

Table 7: Coefficients for elements mentioning God, reported for Total Panel, for those self-reporting that they suffer anxiety regarding the study topic, or suffer extreme anxiety regarding the topic study

table 7

Step 9 – Uncovering Mind-sets based upon Anxiety-provoking Elements

A hallmark of the Mind Genomics approach is the hypothesis that people differ from each other in their responses to the various situations and ‘things’ in their everyday world, especially those situations and things which call forth emotional responses. The underlying difference among people is not new; individual differences have been recognized since the time of Aristotle and Plato, as well as Machiavelli, not to mention writers, poets, politicians, and the like [10,11]

The contribution of Mind Genomics is the ability to use a small, short experiment, inexpensive and scalable experiment to uncover patterns of responses to the everyday, working at the level of the granular experience. In doing so, Mind Genomics follows a well-trod path, finding its roots in psychology (especially those of individual differences), and consumer research (psychographic segmentation; [12]).

The segmentation approach for Mind Genomics works with the set of coefficients from the study, clustering the coefficients [13]. Those respondents in the same cluster are ‘similar to each other’ based upon the pattern of the coefficients. Those respondents in different clusters are ‘dissimilar to each other,’ again based on the pattern of coefficients. The clustering method is a mathematical treatment of the data, attempting to put the ‘things’ (here the respondents) into a small set of meaningful, interpretable groups.

The studies here featured different groups of elements, customized to fit the specific topic. As a consequence, the cluster analysis had to be conducted separately for each study. To get a sense of the different mind-sets, we created two clusters or mind-sets, doing separately for each of the 15 topics. Table 8 shows the base sizes and the additive constant for each of the mind-sets. For the most part, the additive constants for the two complementary mind-sets are similar in magnitude. It will be in the patterns of coefficients where the differences occur, generally in the elements which provoke anxiety (viz., the positive coefficients).

Table 8: Base sizes and additive constants for the two complementary mind-sets (MS1, MS2) for each topic

table 8

The elements which drive the strongest anxiety for the two mind-sets (now called Types) appear at the top of Table 9. We use the phrase Mind-Set Types to denote the fact that the mind-sets were developed separately for each topic. The elements which reduce the anxiety, appear in the bottom of Table 9. Keeping in mind that each study was subject to its own clustering analysis, it appears that there are two themes running through the mind-sets, themes which reveal themselves from the positive coefficients (anxiety-provokers), but not from the negative coefficients (anxiety-reducers).

Table 9: Elements which most strongly drive anxiety (top of table) and which most strongly reduce anxiety (bottom of table) for the 15 topics, for the two mind-set types

 Topic

Mind-Set Type A Anxiety Provokers

Mind-Set Type B Anxiety-Provokers

Aging Living in an old age home…. 30 You believe Charities will help you get through this 32
Environment A radioactive plume of dust over you…. 28 You trust that the Environmental Protection Agency will keep the earth and you safe 31
Lose Health Insurance The medical procedures you need are not covered by your insurance…. 15 You believe your Local Hospital will get you through this 37
Franken Food You are scared … inside and out 11 You trust the government will keep the earth and you safe 21
Lose Income You lose your job because you have done something wrong… 14 You believe your insurance will help you find new income 25
Infectious Disease You have to touch people that you know have some infectious disease…. 16 You believe Charities will help you get through this 31
Lose Health Your doctor says you don’t have long to live… 32 You believe Charities will help you get through this 39
Lose Assets You lose your home…. 34 You believe Charities will help you get through this 33
Obesity You just can’t control the eating… 12 You believe a plastic surgeon will help you get through this 26
Phobias You’re afraid of flying….and you must fly across the ocean…. 17 You believe Charities will help you get through this 23
Relationships You believe dating services will help you get through this 5 You believe dating services will help you get through this 32
Sexual Failure You were raped…. 21 You believe dating services will help you get through this 37
Social Interactions You just can’t function…. 14 You believe Food or Drink will help you get through this 28
Terrorism A dirty nuclear bomb set off … 39 You think United Nations Forces will keep you safe 34
War A dirty nuclear bomb set off… 23 You believe international cooperation in the United Nations will keep you safe 28
Topic MindSet A- Anxiety Reducers Mind-Set B – Anxiety Reducers
Aging You trust your God will help you get through this -12 Not having as much energy as you used to…. -10
Environment You believe that Greenpeace will keep the earth and you safe -10 You trust that God will keep the earth and you safe -6
Lose Health Insurance You trust your God will help you get through this -15 You are scared … inside and out -15
Franken Food You believe international cooperation will keep the earth and you safe -6 It’s important for the Media to keep you informed -11
Lose Income You trust your God will help you find new income -18 Business downturns that result in layoffs in your company…. -7
Infectious Disease You trust your God will help you get through this -11 Your family and friends will help get you through this… -5
Lose Health You trust your God will help you get through this -19 Family and Friends play a big role in your life…. -7
Lose Assets You trust your God will help you get through this -10 A burglar steals your jewelry and other things that are important to you… -10
Obesity Family and Friends play a big role in your life… -11 You trust your God will help you get through this -10
Phobias You trust your God will help you get through this -13 You’re afraid of being in crowds…. and you must go shopping at Christmas time…. -9
Relationships Not getting along with your partner… 10 Not getting along with your partner… -7
Sexual Failure You believe passage of time will help you get through this -11 You have performance issues…. -11
Social Interactions You believe talking to a therapist will help you get through this -15 You trust your God will help you get through this -8
Terrorism A Computer virus let loose that impacts your everyday businesses… -2 You need to contact your friends and family to make sure they are OK… -11
War You trust that God will keep you safe -14 Seeing my friends or family getting called up to go fight… -5

The underlying pattern which continues to emerge is that Mind-Set A respondents strongly to actual events which are presumed to provoke anxiety. In contrast, Mind-Set B respondents respond strongly to social institutions which presumably should reduce anxiety but for respondents in this second group of 15 mind-sets ends up increasing anxiety.

The story is different when we look at the elements which reduce anxiety (bottom of Table 9). Mind-Set Type A believes in the elements which presumably ameliorate anxiety, being designed to do so. In contrast, Mind-Set Type B, which showed the aberrant responses to helping elements (provoking anxiety) appear to be totally random in what ends up ameliorating anxiety (viz., elements with highest negative elements). Generally their negative numbers are far smaller than the negative numbers of Mind-Set Type A, suggest two radically different groups when it comes to what seems to drive anxiety.

Discussion and Conclusions

A cursory exploration of the topic of ‘anxiety’ brings up tens of thousands of ‘hits’ and many papers dealing with the manifold dimensions of anxiety. One could look at the topic of anxiety from deep inside the person, such as the approach espoused by psychoanalysis, or perhaps move a little more to the surface with cognitive behavioral therapy. Certainly, anxiety is no stranger to the world of clinical psychology, or business psychology, because of its prevalence and potentially damaging effects. Clinical psychology can teach us a lot about anxiety, from cause to manifestation to effects.

Moving beyond the clinical world is the effects of anxiety on the person’s performance in the world, experiences, and interactions with the world of the everyday. Whether this be anxieties about what a person doe (e.g., relationships, sexual failure, etc.), to who a person is (e.g., aging), to what external events occur (e.g., lose health, lose assets), there is the need to understand the surround of this life-relevant interaction. There has been a lot published on these different, relevant aspects of anxiety. A Google Search of the phrase ‘Anxiety in everyday life’ brings up 12.5 million hits as of this writing (winter, 2022.) The same phrase in Google Scholar (r) as of winter, 2022, brings up 1.6 million hits. When we limit the search to end at 2003, the number of hits drops to 155,000.

The foregoing observations tell us that there is a great interest in the topic of anxiety. At the same time, a search through the literature, or in Google Scholar (r) reveals the scattered nature of the topic. Each author focuses on that which is interesting, going in deeply. One does not have any sense of the world of anxiety dealt with in the coherent way done by a set of parallel Mind Genomics cartographies. The goal of the Mind Cartography is to systemize the data, and create understanding of the topic from the point of view of the everyday. Mind Genomics approach provides a way to understand anxiety and to allay it in a way which seems both practical and theoretical, working at the level of the granular, and yet giving a vision of a galaxy of such topics. Relevant data for the topics might be assembled painstakingly from the published literature, but without a coherent set of raw data underlying the studies. With Mind Genomics, a few weeks, and a modest budget, the entire study can be repeated. The integrated database of the granular aspects of daily experience promote new-to-the-world discoveries, easily found, analyzed, synthesized, and integrated in both current thinking and visions of new vistas.

Acknowledgments

The author would like to acknowledge the early collaborations with Jacqueline H. Beckley and Hollis Ashman (deceased), which led to the IT! studies, one of which was Deal With It! presented here.

References

  1. Beckley J, Moskowitz HR (2002) Databasing the consumer mind: the crave it!, drink it!, buy it! & healthy you! databases. In Institute of Food Technologists, Annual Meeting, Anaheim, California.
  2. Moskowitz HR (2004) Evolving Conjoint Analysis: From Rational Features/Benefits to an Off-the-Shelf Marketing Database. In Marketing Research and Modeling: Progress and Prospects 215-230. Springer, Boston, MA.
  3. Gabay G, Moskowitz HR (2015) Mind Genomics: What Professional Conduct Enhances the Emotional Wellbeing of Teens at the Hospital? Journal of Psychological Abnormalities Child 4: 147.
  4. Gofman A (2009) Extending psychophysics methods to evaluating potential social anxiety factors. Medicine 17: 1337-1342.
  5. Keene SA, Kalk TN, Clark DG, Colquhoun TA, Moskowitz HR (2017) Indoor plant toxicity concerns some consumers. In; Proceedings of the 2017 Annual Meeting of the International Plant Propagators’ Society, pp. 361-366.
  6. Moskowitz H, Rabino S, Gofman A, Moskowitz D (2007) Effective and confident communications in the midst of a major crisis: An experiment in the pharmaceutical context. International Journal of Pharmaceutical and Healthcare Marketing 1: 318-348.
  7. Moskowitz HR, Gofman A (2007) Selling blue elephants: How to make great products that people want before they even know they want them. Pearson Education.
  8. Moskowitz HR, Gofman A, Beckley J, Ashman H (2006) Founding a new science: Mind genomics. Journal of Sensory Studies 21: 266-307.
  9. Gofman A, Moskowitz H (2010) Isomorphic permuted experimental designs and their application in conjoint analysis. Journal of Sensory Studies 25: 127-145.
  10. Stanovich KE (1999) Who is rational?: Studies of individual differences in reasoning. Psychology Press.
  11. Stanovich KE, West RF (2000) Individual differences in reasoning: Implications for the rationality debate? Behavioral and brain sciences 23: 645-665.
  12. Wells WD (1975) Psychographics: A critical review. Journal of marketing research 12: 196-213.
  13. Diday E, Simon JC (1976) Clustering analysis. In: Digital Pattern Recognition (pp. 47-94.) Springer, Berlin, Heidelberg.

Aging Offenders, Mental Health and Reentry Challenges

DOI: 10.31038/ASMHS.2022621

Introduction

Older prisoners represent one of the fastest growing demographics in correctional facilities. Indeed, the number of state inmates aged 55 and older tripled from 2001 to 2016 comprising 13% of the total United States (U.S.) prison population [1-3]. The graying of our nation’s prisons is estimated to continue as experts project older inmates will constitute one-third (over 400,000) of the total prison population by 2030 [4]; a trend that goes beyond U.S. borders [5,6]. By way of example, the United Kingdom reported a 159% increase in prisoners aged 50 to 59 and a staggering 243% rise in prisoners aged 60 and above over the past two decades [7]. Many of these older inmates will be released to the community requiring support and assistance with immediate needs such as food, housing and transportation; often neglected, however, are linkages to mental health (MH) treatment and related services. This is especially important since it is not likely that the MH needs of inmates were adequately addressed prior to release, nor is it likely that sufficient plans, if any, were made to monitor these needs upon reentry.  While scholars argue that the correlation between MH and criminal behavior is largely indirect [8], we know that the mentally ill (MI), are more likely to return to prison when their conditions are not addressed in the community [9-11].

Literature Review

Statistics demonstrate the scope of the problem: a national survey finds that over two-thirds (68%) of older prison inmates report having a history of a MH disorder and almost one-quarter (22.6%) report to have experienced serious psychological distress (SPD) [9]. In addition to this, over one-quarter of inmates 55 and older report having a drug abuse or dependence disorder with nearly one-fifth reporting drug use at the time of their offense [12]. Estimates suggest, however, that only 40% of state prisoners and 26% of federal prisoners who met the threshold for past 30-day SPD reported they were receiving treatment [13], with their likelihood of receiving treatment on release being even lower [14,15]. Moreover, despite the importance, most leave prison with only several weeks of prescription medications and no plan in place for acquiring refills [16,17]. A survey on the transitional health care of released offenders reported that 13 states provided 2 weeks or less of prescription medication to MI offenders, 11 states dispensed enough for 30-days, and one state gave out a 2-month supply [17]. This is disconcerting when we consider that untreated or unmedicated persons with MI are at greater odds of clinical decompensation affecting all areas of life [16,18]. Moreover, most MI offenders have no health insurance on release with more than half (60%) reporting no benefits 8 to 10 months following discharge [19], further negating their ability to receive needed treatment in the community.

The strong link between long-term MH and poor physical health [20,21] means that for older offenders with MI, their clinical conditions are often further compromised by chronic health problems as they age. Indeed, older offenders are more likely to suffer from a variety of chronic diseases and comorbid disorders such as hypertension, heart disease, cancer and diabetes, with more than half reporting a minimum of one disability [13,22-24]. Additionally, older inmates’ psychopathology may be compromised by impaired cognitive function [25]; the clinical and symptomatic nature of which can be further exacerbated by the incarceration experience [26]. Thus, coupled with the challenges related to their MH and physical health needs on reentry, intellectual deterioration can further compromise the social and/or occupational functioning of older offenders [25,27], all of which can severely hinder their ability to successfully reintegrate into society.

A related reentry challenge for aging offenders is their greater likelihood of experiencing disengagement from family and friends, reducing vital social support networks [28,29]. In their study of recently released prisoners in Massachusetts, [29] found social support to be weakest among older releasees and those with a history of MI and addiction; 40% of older offenders and 30% with MI and addiction reported no family support on release. This is not unexpected given that older offenders, particularly those with MH and substance use disorders are more likely to have experienced conflict with family and friends or be estranged due to extended periods of separation [29,30].

It is clear then, that in addition to the more typical challenges of reentry, older offenders with MI have complex and special long-term needs which are further compounded by physical health issues and social functioning that often worsens with age. This is particularly salient among offender populations as they have been found to prematurely age; this is also referred to as “accelerated aging”, which defines the “threshold for older adults in this population to begin at 50 or 55” or in some studies even younger [31]. High-risk lifestyles (e.g., drug use, crime), socio-economic disadvantage, lack of preventative health care, and stressors of the carceral environment are said to age offenders physiologically 10 to 15 years beyond their chronological age [32-34].

Due to myriad problems and extensive medical needs, older offenders are one of the most expensive populations to house in prison, and therefore, we should be exceedingly focused on their reentry success.  Indeed, it is estimated that institutional healthcare costs of geriatric offenders are two to three times that of younger inmates [23]. The Pennsylvania Department of Corrections (PADOC), for example, reports medication costs at an astronomical rate of $3.2 million per month for inmates 50 and older independent of other healthcare costs, along with three long-term special care units at a cost of $500 per day per inmate [35]. Moreover, those with MIs are more likely to have disciplinary problems [36,37] with associated institutional expenses estimated to exceed 9 million dollars each year in the U.S. [38]; additionally, misconduct often leads to longer stays in prison [11], increasing overall housing costs.

Mental Health Court and Reentry

We suggest expanding the use of mental health courts (MHCs) in facilitating the reentry process to help fill the gap in providing support, structure and resources to this vulnerable population. Based on the drug court model which focuses on problem-solving in a non-adversarial setting, MHCs offer individualized treatment plans along with judicial supervision in a supportive environment. In our experience working with Strategies That Result In Developing Emotional Stability (STRIDES), a federal MHC program in the Eastern District of Pennsylvania, the participants were assisted in all areas of life that went beyond what is typically provided in drug and most specialty courts such as linkages to treatment, housing and work opportunities. STRIDES’ participants received help with acquiring driver’s and occupational licensing, clothing and groceries, and they were connected with agencies and volunteers to assist with parenting, financial literacy and ancillary legal needs. We observed older offenders, who with the help of the STRIDES Program, were able to stay productive and successfully navigate the many challenges faced during the transition to community supervision. Thus, MHC teams comprised of judges, attorneys, supervision and treatment agencies that collaborate to provide the best outcomes for their participants are uniquely positioned to help older offenders with their myriad complicated issues.

MHCs can be an excellent adjunct to reentry for inmates with further criminal justice monitoring as part of parole/mandatory release programs and special initiatives for older inmates such as medical or elderly release programs. In addition to providing the much-needed support and services, MHC participants could earn time off supervision for successful participation, therefore limiting further involvement in the criminal justice system and producing cost savings. Moreover, MHCs have overall been found to reduce recidivism [39-43], the primary goal of reentry, but they also demonstrate success in other important areas including reductions in hospitalizations, increased medication compliance, and other indicators of mental health recovery as well as the lessening of criminogenic needs (e.g., pro-criminal attitudes, antisocial patterns) [44-46].

We are cognizant that even though there are over 450 MHCs in 46 states (as of yearend 2020; [47]), the ability of these courts to handle the burgeoning population of older MI offenders isn’t realistic, thus, it is essential that potential participants are carefully selected based on those who would most benefit from the available services. Consideration could also be given to the utilization of other types of specialty courts (e.g., reentry courts, veterans’ courts) that are able to serve the complex treatment and other needs of the MI and provide the necessary interventions to improve their reentry process.

“Absent significant changes in sentencing and release policies, the number of aging and infirm men and women confined in US prisons will continue to grow. The rising tide of aging prisoners in the United States makes imperative renewed and careful thinking about how to protect the rights of the elderly while in prison” [30]. While we agree with the argument made by Human Rights Watch, we suggest that these protections must extend beyond the prison walls to include reentry, community supervision and the entire reintegration process. Moreover, aside from more principled considerations, a concerted effort must be established to assist those who are advanced in age and in poor mental health so that we can make a more sensible use of limited financial and human resources and allow these often-neglected offenders to become productive members of society in a more dignified manner.

References

  1. Carson EA (2020) Prisoners in 2019 (NCJ-255115). Washington, DC: U.S. Department of Justice, Office of Justice Programs, Bureau of Justice Statistics.
  2. Carson EA, Anderson E (2016) Prisoners in 2015 (NCJ 25022). Washington, DC: U.S. Department of Justice, Office of Justice Programs, Bureau of Justice Statistics.
  3. Carson EA, Cowhig MP (2020) Mortality in State and Federal prisons, 2001-2016 – Statistical tables (NCJ 251920). Washington, DC: U.S. Department of Justice, Office of Justice Programs, Bureau of Justice Statistics.
  4. American Civil Liberties Unions (2012). At America’s expense: The mass incarceration of the elderly. New York, NY.
  5. Seaward J, Wangmo T, Vogel T, Graf M, Egli-Alge M, et al. (2021) What characterizes a good mental health professional in court-mandated treatment settings?: Findings from a qualitative study with older patients with mental health care professionals. BMC Psychology 9: 121.
  6. Sodhi-Berry N, Knuiman M, Alan J, Morgan VA, Preen DB (2015) Pre- and post-sentence mental health service use by a population cohort of older offenders (≥45 years) in Western Australia. Social Psychiatry and Psychiatric Epidemiology 50: 1097-1110. [crossref]
  7. parliament.UK (2020). Aging prison population.
  8. Skeem JL, Winter E, Kennealy PJ, Louden JE, Tatar JR II (2014) Offenders with mental illness have criminogenic needs too: Toward recidivism reduction. Law and Human Behavior 38: 212-224. [crossref]
  9. Bronson J, Berzofsky M (2017) Indicators of Mental Health Problems Reported by Prisoners and Jail (NCJ-250612). Washington, DC: U.S. Department of Justice, Office of Justice Programs, Bureau of Justice Statistics.
  10. Houser KA, Saum CA, Hiller ML (2019) Mental health, substance abuse, co-occurring disorders, and 3-year recidivism of felony parolees. Criminal Justice & Behavior 46: 1237-1254.
  11. James DJ, Glaze LE (2006) Mental health problems of prison and jail inmates (NCJ 213600). Washington, DC: U.S. Department of Justice, Office of Justice Programs, Bureau of Justice Statistics.
  12. Bronson J, Stroop J, Zimmer S, Berzofsky M (2017) Drug use, dependence, and abuse among state prisoners and jail inmates, 2007-2009 (NCJ-250546). Washington, DC: U.S. Department of Justice, Office of Justice Programs, Bureau of Justice Statistics.
  13. Maruschak LM, Bronson J, Alper M (2021) Survey of prison inmates, 2016 disabilities reported by prisoners (NCJ 252642). Washington, DC: U.S. Department of Justice, Office of Justice Programs, Bureau of Justice Statistics.
  14. Lurigio AJ (2001) Effective services for parolees with mental illness. Crime & Delinquency 47: 446-461.
  15. Petersilia J (2003) When prisoners come home: Parole and prisoner reentry. New York, NY: Oxford University Press.
  16. Binswanger IA, Nowels C, Corsi KF, Long J, Booth RE, et al. (2011) “From the prison door right to the sidewalk, everything went downhill,” A qualitative study of the health experiences of recently released inmates. International Journal of Law and Psychiatry 34: 249-255. [crossref]
  17. Flanagan NA (2006) Transitional health care for offenders being released from United States prisons. Canadian Journal of Nursing Research Archive 36: 38-58. [crossref]
  18. Mayo Clinic (2020) Schizophrenia.
  19. Baillargeon J, Hoge SK, Penn JV (2010) Addressing the challenges of community reentry among released inmates with serious mental illness. American Journal of Community Psychology 46: 361-375. [crossref]
  20. Kendrick T (1996) Cardiovascular and respiratory risk factors and symptoms among general practice patients with long-term mental illness. British Journal of Psychiatry 169: 733-739. [crossref]
  21. Osborn DPJ (2001) The poor physical health of people with mental illness. The Western Journal of Medicine 175: 329-332. [crossref]
  22. Gates ML, Staples-Horne M, Walker V, Turney A (2017) Substance use disorders and related health problems in an aging offender population. Journal of Health Care for the Poor and Underserved 28: 132-154. [crossref]
  23. Schlager M (2013) Rethinking the reentry paradigm: A blueprint for action. Durham N.C.: Carolina Academic Press.
  24. Skarupski KA, Gross A, Schrack JA, Deal JA, Eber GB (2018) The health of America’s aging prison population. Epidemiologic Reviews 40: 157-165. [crossref]
  25. Calipari ES (2018) Boosting motivation and cognitive deficits in mental illness.
  26. Baidawia S, Trottera, O’Connor DW (2016) An integrated exploration of factors associated with psychological distress among older prisoners. The Journal of Forensic Psychiatry & Psychology 27: 815-834.
  27. Hugo J, Ganguli M (2014) Dementia and cognitive impairment: Epidemiology, diagnosis, and treatment. Clinics in Geriatric Medicine 30: 421-442. [crossref]
  28. Wyse J (2018) Older men’s social integration after prison. International Journal of Offender Therapy and Comparative Criminology 62: 2153-2173. [crossref]
  29. Western B, Braga AA, Davis J, Sirois C (2015) Stress and hardship after prison. American Journal of Sociology 120: 1512-1547. [crossref]
  30. Human Rights Watch (2012) Old behind bars: The aging prison population in the United States. Washington, DC.
  31. Bryson WC, Cotton BP, Barry LC, Bruce ML, Piel J, et al. (2019) Mental health treatment among older adults with mental illness on parole or probation. Health Justice 7: 4.
  32. Aday RH (2003) Aging prisoners: Crisis in American corrections. Westport, CT: Praeger.
  33. Aday RH, Krabill JJ (2012) Older and geriatric offenders: Critical issues for the 21st In L. Gideon (Ed.), Special needs offenders in correctional institutions (pp. 203-232). Thousand Oaks, CA: Sage.
  34. Wahidin A, Aday RH (2010) Later life and imprisonment. In D. Dannefer & C. Phillipson (Eds.), The SAGE handbook of social gerontology (pp. 587-596). Thousand Oaks, CA: Sage.
  35. Pennsylvania Department of Corrections (2020-2021) FY 2020-2021 Budget.
  36. Houser KA, Welsh W (2014) Examining the association between co-occurring disorders and seriousness of misconduct by female prison inmates. Criminal Justice & Behavior 41: 650-666.
  37. Houser KA, Belenko S, Brennan PK (2012) The effects of mental health and substance abuse disorders on institutional misconduct among female inmates. Justice Quarterly 29: 799-828.
  38. Lovell D, Jemelka R (1996) When inmates misbehave: The costs of discipline. The Prison Journal 76: 33-44.
  39. Anestis JC, Carbonell JL (2014) Stopping the revolving door: Effectiveness of mental health court in reducing recidivism by mentally ill offenders. Psychiatric Services 65: 1105-1112. [crossref]
  40. Costopoulos JS, Wellman BL (2017) The effectiveness of one mental health court: Overcoming criminal history. Psychological Injury and Law 10: 254-263.
  41. Hiday VA, Ray B (2010) Arrests two years after exiting a well-established mental health court. Psychiatric Services 61: 463-468. [crossref]
  42. Lowder EM, Desmarais SL, Baucom DJ (2016) Recidivism following mental health court exit: Between and within-group comparisons. Law and Human Behavior 40: 118-127. [crossref]
  43. McNiel DE, Binder RL (2007) Effectiveness of a mental health court in reducing criminal recidivism and violence. The American journal of psychiatry 164: 1395-1403. [crossref]
  44. Campbell MA, Canales DD, Wei R, Totten AE, MacAulay WAC, et al. (2015) Multidimensional evaluation of a mental health court: Adherence to the risk-need-responsivity model. Law and Human Behavior 39: 489-502. [crossref]
  45. Han W, Redlich AD (2016) The impact of community treatment on recidivism among mental health court participants. Psychiatric Services 67: 384-390.
  46. Wells BC (2015) Why a federal mental health court? The District of Utah’s pioneering rise court. The Judges’ Journal 54: 14-17.
  47. National Drug Court Resource Center (2021).

Audit on Incidences of Oxaliplatin Induced Hypersensitivity Reactions during Infusion in Day Care Oncology at a Tertiary Care Hospital, Karachi, Pakistan

DOI: 10.31038/CST.2022722

Abstract

Objective: Due to increased occurrence of hypersensitivity reactions with Oxaliplatin in the preceding months, it was decided to conduct an audit on incidences of hypersensitivity reactions induced by Oxaliplatin during infusion and measures that can be taken to prevent such reactions.

Method: We performed a prospective observational study of patients who admitted for oxaliplatin based chemotherapy between 16th October 2019 and 26th December 2019.

All patients coming to oncology day care for infusion of oxaliplatin based chemotherapy protocols were included in this audit.

Inclusion Criteria: (1) Patients aged more than 18 years age of both genders. (2) Patients coming for chemotherapy regimen with oxaliplatin.

Exclusion Criteria: (1) Patients with known hypersensitivity to other chemotherapeutic agents in an Oxaliplatin based regimen. (2) All patients receiving oxaliplatin anywhere except daycare oncology facility.

Result: OXALIPLTIN AUDIT RESULTS • Total number of patients: 109 • No Reaction: 86 • Reaction without prior intervention: 6 • No reaction after prior intervention: 9 • Reaction with prior intervention: 8.

Conclusion: The number of patients with hypersensitivity reactions is considerably high, therefore we decided to give injection solumedrol, antihistamine and prolong the duration of infusion in patients who experienced hypersensitivity reactions in previous cycles and these premedication measures significantly declined the incidents of hypersensitivity reactions due to Oxaliplatin.

Keywords

Drug reaction, Oxaliplatin, Prolong duration of infusion, Steroids, Antihistamine

Introduction

Oxaliplatin is a chemotherapeutic drug mostly used in gastrointestinal malignancies mostly in colorectal cancers with excellent results but it was noticed during last few months that oxaliplatin induced  hypersensitive reactions increasing with time therefore we decided to do audit in order to find out the number of incidents, reason and ways to manage these types of reactions  which usually presented during infusions, common side effects noticed were choking feeling, difficulty in swallowing, numbness of legs and difficulty in walking these symptoms settle within 60 minutes, roughly between 30 minutes to 60 minutes and these side effects were very distressing for patients.

Methods

This prospective observational study is designed to analyze and measure the incidences of hypersensitivity reactions to patients receiving Oxaliplatin infusions. Their initial assessment was performed which includes the height, weight, sex, diagnosis, and cycles per protocol identified. Data of patients was collected from 16th October 2019 till 26th December 2019. All patients above 18 years of age, from both genders, coming to oncology day care for infusion of Oxaliplatin based chemotherapy protocols were included in this audit. The Exclusion criteria excluded all the patients who were receiving Oxaliplatin based chemotherapy regimens anywhere except the daycare facility and all those who had a history of known hypersensitivity to other chemotherapeutic agents in an Oxaliplatin based regimen.

The Medical Record numbers were noted alongside of the patient’s name, type of reaction and the relevant treatment management collected. The Standard time of infusion of oxaliplatin as per international protocol was set at 2 hours. In the patients with a history of hypersensitivity reaction oxaliplatin infusion time was prolonged along with administration of intravenous Hydrocortisone and intravenous Pheniramine maleate. The incidence and findings of hypersensitivity reactions were then recorded on the same day as well as on the following cycles. Those with a known history of hypersensitivity reaction were given either intravenous Hydrocortisone/ Pheniramine maleate or prolonged Infusion time or a combination of these. The patients were afterwards observed for the signs and symptoms of hypersensitivity if any and the findings were then recorded. The study was performed to observe the incidence of hypersensitivity reactions in patients receiving oxaliplatin based regimens in a daycare setting. Those with a known history of hypersensitivity reaction were given either injection hydrocortisone or injection Pheniramine maleate or duration of infusion is Prolonged, but in few patients all three interventions were done.

Inclusion Criteria

(1) Patients age more than 18 years of both gender.

(2) Patients coming for chemotherapy regimen with oxaliplatin at day care oncology.

Exclusion Criteria

(1) Patients less than 18 years of age.

(2) Reactions with other chemotherapeutic drugs in regimen will not be considered.

Results

A total of a hundred and nine sessions of oxaliplatin infusion were recorded eighty-six of these were uneventful the remaining twenty-three sessions with oxaliplatin were recorded with hypersensitivity reactions out of these six sessions were without prior history of hypersensitivity reaction while the rest 17 comprised of the sessions of patients with a known history of hypersensitivity to Oxaliplatin. In 9 out of the 17 sessions the patients received intravenous hydrocortisone or intravenous Pheniramine maleate or a combination of both without prolonging the infusion time above the standard of 2 hours. In the remaining 8 patients the infusion time was also prolonged to a maximum of 4 hours along with receiving intravenous hydrocortisone and intravenous Pheniramine maleate while the rest had documented hypersensitivity reactions as shown in Figure 1.

fig 1

Figure 1: OXALIPLTIN AUDIT RESULTS • Total number of patients: 109 • No Reaction: 86• Reaction.23-Reaction without prior intervention: 6 • No reaction after prior intervention: 9• Reaction with prior intervention: 8.

A total of 109 Oxaliplatin based regimens infusion sessions were observed,86 of these sessions was uneventful without any reaction or history of previous cycles hypersensitivity reaction. The remaining 23 sessions included 6 sessions without any prior history of hypersensitivity to oxaliplatin while the other 17 comprised of the sessions of patients with a known history of hypersensitivity to Oxaliplatin in particular. In 9 out of the 17 sessions the patients received intravenous hydrocortisone or intravenous Pheniramine maleate or a combination of both without prolonging the infusion time above the standard of 2 hours. In the remaining 8 patients the infusion time was also prolonged to a maximum of 4 hours along with receiving intravenous hydrocortisone and intravenous Pheniramine maleate 9 out of 17 sessions in patients with known hypersensitivity had uneventful infusions after receiving interventions like injection Hydrocortisone, Pheniramine maleate (as pre-chemotherapy medications added to the standard pre-chemotherapy regimen) and duration of infusion is also prolonged. The rest 8 showed symptoms of mild to moderate hypersensitivity reactions to Oxaliplatin such as rash, itching, hoarseness of voice even after receiving the interventions with intravenous injections of hydrocortisone and pheniramine maleate time duration of infusion was 2 hours. No patient complained of difficulty in breathing and none of the patients in these 23 sessions developed anaphylaxis to Oxaliplatin. All the patients had their complaints resolved within a maximum of 60 minutes and therefore were discharged home in a stable condition.

Administration of injections Pheniramine maleate, hydrocortisone along with prolonged infusion time, in nine out of the seventeen sessions of chemotherapy had uneventful outcome. The rest eight patients’ infusions reported mild to moderate reactions which were managed smoothly with intravenous hydrocortisone, intravenous Pheniramine maleate at day care oncology.

Conclusion

While the incidence of hypersensitivity to oxaliplatin is common, adding intravenous injection hydrocortisone and intravenous injection Pheniramine maleate to the standard pre-chemotherapy regimens and prolonging infusion times in patients with known hypersensitivity, can considerably reduce the severity and progression of these symptoms in subsequent cycles. Furthermore, the chances of regimen change solely due to Oxaliplatin hypersensitivity are also reduced to negligible following these interventions.

Discussion

Oxaliplatin is a very commonly used chemotherapeutic drug in gastrointestinal malignancies Oxaliplatin is placed in third generation platinum compound and is the most effective first line chemotherapeutic agent for colorectal cancer in combination with 5FU and leucovorin. It is indicated for pancreatic, gastric, and testicular cancers combined with bevacizumab, capecitabine, irinotecan and other cytotoxic agents. However, moderate to severe hypersensitivity reactions during or after oxaliplatin infusion usually require cessation of chemotherapy or substitution of the key therapeutic drug oxaliplatin with some other less effective chemotherapeutic drug which largely interferes with improved patient prognosis [1]. In patients who even after receiving premedication with intravenous hydrocortisone and intravenous Pheniramine maleate need to start with desensitization protocol which in such cases are very effective [2,3].

Oxaliplatin is a very commonly used chemotherapeutic drug in gastrointestinal malignancies, it was noticed that during infusion patients’ complaint of numbness of hands and very occasionally complaint of numbness of legs with difficulty in walking which lasts for few minutes, rash all over the body and itching, difficulty in swallowing and choking feelings which last for few minutes. Hypersensitivity reactions facial flushing, tongue swelling, pruritic, tachycardia, dyspnea, headache, chills, fever, burning sensation and dizziness mostly seen with oxaliplatin in colorectal cancer. Fever alone is not the only symptom of oxaliplatin hypersensitivity reaction, but this may indicate that patient may develop serious reactions in following cycles as seen international study of papers published which show patients’ blood pressure was 95/43mm, pulse 120/min and oxygen saturation 88% to 90% patient was hospitalized for management and recovered in 8 hours [4-5].

In few cases serious hypersensitivity reactions were reported in 12% of patients treated with oxaliplatin, whereas 1% of these patients may face a life-threatening situation . Extended steroid premedication with slower oxaliplatin infusion rate can be employed for safety in patients after severe hypersensitivity reaction with oxaliplatin , intravenous dexamethasone or hydrocortisone in prechemotherapy was added with oxaliplatin and will be considered very effective in decreasing the hypersensitivity reactions [6].

Total number of entries of patients were hundred and nine. Patients without reaction 86, Patients with reaction 23. The remaining 23 sessions included 6 sessions without any prior history of hypersensitivity to oxaliplatin while the other 17 comprised of the sessions of patients with a known history of hypersensitivity to Oxaliplatin,9 out of the 17 sessions the patients received intravenous injection hydrocortisone and intravenous injection Pheniramine maleate as prechemotherapy and finish infusion in 4 hours and 8 numbers of patients received intravenous injection hydrocortisone and intravenous injection Pheniramine maleate without increase duration of infusion and finish in 2-hours, number of patients not given injection anti-histamines and injection intravenous hydrocortisone 0, in 17 number of patients  who had reaction for the first time 6, number of patients who had reaction in follow up cycles 17.

Treatment and prevention consist of increase duration of infusion plus intravenous antihistamine, and use of intravenous steroids [7,8].

Way Forward

Desensitization protocol could help patients who experience severe hypersensitivity reactions and patient can receive treatment with oxaliplatin which consider as active and effective treatment for colorectal cancer.

References

  1. Bano N, Najam R, Mateen A (2013a) Neurological adverse effects in patients of advanced colorectal carcinoma treated with different schedules of FOLFOX. Chemother Res Pact.
  2. Arotcarena R, Barthelemy P, Piot M, et al. (2001) Read ministration of oxaliplatin using a rapid desensitization method after severe anaphylactic reaction. Gastroenterol Clin Biol 25: 206-7.
  3. Alvarez-Cuesta E, Madrigal-Burgaleta R, Angel-Pereira D, et al. (2015) Delving into cornerstones of hypersensitivity to antineoplastic and biological agents: value of diagnostic tools prior to desensitization. Allergy 70: 784-794. [crossref]
  4. Anderson BJ, Peterson LL (2015) Systemic capillary leak syndrome in a patient receiving adjuvant oxaliplatin for locally advanced colon cancer. J Oncol Pharm Pract. [crossref]
  5. Alliot C, Messouak D, Beets C, et al. (2001) Severe anaphylactic reaction to oxaliplatin. Clin Oncol (R Coll Radiol) 13: 236.
  6. Benedik J (2015) Hypersensitivity: case report. Reactions.137. Bahl M, Dean T (2015) An intermediate step for the management of hypersensitivity to platinum and taxane chemotherapy. Curr Oncol 22: 220.
  7. Brockow K, Przybilla B, Aberer W, et al. (2015) Guideline for the diagnosis of drug hypersensitivity reactions. Allergo J Int 24: 94-105.[crossref]
  8. Bano N, Najam R, Qazi F, et al. (2014) Gastrointestinal Adverse Effects in Advanced Colorectal Carcinoma Patients Treated with Different Schedules of FOLFOX. Asian Pac J Cancer Prev 15: 8089-93. [crossref]

Characterization of Patients with Acute Appendicitis in the Elderly

DOI: 10.31038/SRR.2021414

Abstract

In recent years, acute appendicitis is presented more frequently in geriatric age due to increased life expectancy and is associated with a higher incidence of perforation and high mortality.

Objective: To characterize the behavior of acute appendicitis in the elderly at “Enrique Cabrera” Hospital over a period of ten years.

Methods: A retrospective descriptive study was carried out by reviewing 114 medical records of patients over 60 years of age treated at “Enrique Cabrera” Hospital, who underwent an urgent surgical intervention for acute appendicitis, during the period from January 2011 and December 2020. The most important variables analyzed were: age, sex, clinical picture, operative finding, complications and biopsy reports.

Results: The age group between 60 and 69 years, male sex, predominated. Typical abdominal pain prevailed over atypical. The most frequent operative finding was uncomplicated acute appendicitis. Surgical site infection was the most common complication. There was a satisfactory response in all the operated patients.

Conclusions: Patients older than 60 years operated by Acute appendicitis were predominant in males between 60 and 69 years of age, with typical abdominal pain and classic signs of appendicitis. illness. The suppuration phase of the appendix. A favorable evolution of the patients was observed operated.

Keywords

Acute appendicitis, Older adult, Life expectancy

Introduction

The first who drew attention to inflammation of the appendix cecal and gave it the name of acute appendicitis was Vidusenen 1561. In 1886 Kronlein performed the first appendectomy for apendicitis perforated, the patient died. Later in 1887 T.G. Morton of Philadelphia performed the first successful appendectomy. In Cuba, in 1893, Dr. Francisco Plá presented a presentation at the Society of Clinical Studies of Havana, about the first case of acute appendicitis, and it was in 1900 that Dr. Enrique Fortún performed the first appendectomy.Acute appendicitis occurs in the elderly with a frequency between 5 and 10%. In those under 65 years of age, mortality is 0.2%, while in those over 65 years of age it is 4.6%.2,3 Specifically in Cuba, the number of people aged 60 and over has varied from 11.3% in 1985 to 20.4% in 2018 and 21.3% in 2020. In 2025, Cuba will be the oldest country in America.1 Acute appendicitis in geriatric patients is a challenge for the surgeon, since this group of patients is always accompanied by comorbid conditions, so any delay in diagnosis and treatment significantly increases the already recognized high morbidity and mortality of abdominal sepsis in the elderly. In accordance with the above, the American Society of Anesthesiology (ASA), presented a classification to define surgical risk, according to the functional limitations caused by coexisting diseases. It is important to point out that when comparing the mortality curves according to the ASA classification, it is concluded that postoperative mortality is more related to coexisting diseases than to chronological age. In addition to this classification, it should be taken into account account that there is a progressive decline in the physiology of the elderly, in such a way that that the physiological reserve that is usually adequate for elective surgery may be insufficient when it comes to an emergency or a postoperative complication. The diagnosis of acute appendicitis is essentially clinical. The Examination of the abdomen is performed by areas where there is less pain. Digital rectal examination should be performed routinely. We must bear in mind that the symptoms are late and nonspecific and that the elderly have low sensitivity to pain and the febrile response is usually discreet. An atypical clinical picture is common in elderly patients.Sometimes it is difficult to establish a definitive diagnosis of acute appendicitis in the geriatric patient. With the purpose of reduce complications and mortality from this disease, it is that the following work is carried out with the objective of:characterize the behavior of acute appendicitis in adults in the “Enrique Cabrera” Hospital over a period of ten years.

Methods

An observational, descriptive longitudinal study was carried out retrospectively in the period between January 2011 and December 2020. The patients were studied from their admission until hospital discharge. Universe and sample. The universe was made up of all patients over 60 years of age who underwent surgery for acute appendicitis at the “Enrique Cabrera” General Teaching Hospital, with a total of 114 cases. It was not necessary to use a sampling method, nor to calculate the  sample size since we refer toe total number of patients over 60 years operated for acute appendicitis. Inclusion criteria. Patients older than 60 years intervened surgically for acute appendicitis.

Data processing and analysis. patient information operated for acute appendicitis was obtained from the medical records of the General Surgery Service of the “Enrique Cabrera” Hospital and then transferred to a data collection form that was subsequently processed and analyzed with the Microsoft Office Excel 2010 program. The results were expressed through descriptive statistics in absolute frequencies, percentages and arithmetic mean Ethical parameters. The principles referring to the code of ethics in accordance with the Declaration of Helsinki. It was guaranteed security and confidentiality of the information, clarifying that the data derived from the research would be used for scientific purposes. The study was approved by the Hospital Ethics Committee.

Results

As can be seen in Table 1, the age group was comprised of between 60 and 69 years with 64.9%. The male sex was the one with the highest incidence with 54.4%.

Table 1: Distribution of patients over 60 years operated

Age

 Male  Female  Total
 No.  %  No.  %  No.

 %

60-69

 36

 31,6  38  33,3  74

 64,9

70-79

 20

 17,5  10  8,8  30

 26,3

80-89

 6

 5,3  4  3,5  10

 8,8

90 or more

 –

 –  –  –  –

 –

Total

 62

 54,4  52  45,6  114

 100,0

Source: Information obtained from medical records

Abdominal pain was the symptom present in 100% of the patients. patients, typical abdominal pain prevailed in 62 of them (54.4%), only 18 had fever. There were 94 with positive Blomberg’s sign, 80 cases (70.2%) had a painful Mc Burney point, only six had tachycardia, all of which is shown in Table 2.

Table 2: Distribution according to clinical picture

 Clinical picture

 N= 114

 %

Symptoms
Typical abdominal pain

 62

 54,4

Atypical abdominal pain

 52

 45,6

Nausea

 36

 31,6

Vomiting

 40

 35,1

Fever

 18

 15,8

Chills

 2

 1,8

Diarrhea

 2

 1,8

Constipation

 2

 1,8

Anorexia

 8

 7,0

 Signs
Tachycardia

 6

 5,3

RHA decreased

 3

 2,6

Blomberg’s sign

 94

 82,4

Abdominal contracture

 20

 17,5

Holman’s sign

 44

 38,6

Painful Mc Burney point

 80

 70,2

Cope and Chapman sign

 8

 7,0

Rowsing’s sign

 6

 5,3

Lanz sore spot

 8

 7,0

Pathological digital rectal examination

 8

 7,0

Vaginal touch

 3

 2,6

Source: Information obtained from medical records

Table 3 shows us that in the 100 leukograms recovered from the medical records, leukocytosis was observed in 78% of 78%. No we were able to retrieve the results of fourteen leukograms in the medical records. In all cases where it was possible to perform computerized axial tomography, the diagnosis was positive.

Table 3: Distribution of complementary

Complementary

 No.

 %

Leukocytosis with shift to the left

 78/100

 78,0

Positive abdominal ultrasound

 4/38

 10,5

Computerized axial tomography

 4/4

 100,0

Pathological urine

 20/62

 32,2

Source: Information obtained from medical records

Most of the patients assessed preoperatively by the fitness classification of the American Society of Anesthesiology corresponded to ASAII 80 cases (70.2%), which is observed in Table 4.

Table 4: Distribution according to physical status classification by the American Society of Anesthesiology

 ASA

 No.

 %

 I

 8

 7,0

 II

 80

 70,2

 III

 26

 22,8

 IV

 –

 –

 Total

 114

 100,0

Source: Information obtained from medical records

Table 5 shows that the most common anatomical-pathological diagnosis frequent was suppurative appendicitis in 74 patients 65.0%. In six of them confirmed appendiceal gangrene 5.2%.

Table 5: Distribution according to anatomo-pathological stages of inflammation of the cecal appendix

 Biopsy

 No.

 %

Catarrhal

 8

 7,0

Phlegmonous or suppurative

 80

 70,2

Gangrenous

 26

 22,8

Normal

 —

 —

 Total

 114

 100,0

Source: Information obtained from medical records

Discussion

Acute appendicitis occurred more frequently in patients aged between 60 and 69 years, which coincides with that reported by other authors [1,2]. The lower frequency in ages older than 69 years is related to appendicular atrophy due to the involution of the lymphoid tissues of the appendix [3,4]. In the study, the incidence of the disease prevailed in the sex masculine with respect to the feminine. In the reviewed literature, supports that from the sixth decade of life the difference with regarding sex, it ceases to manifest itself [5-7]. The physiological changes that occur with aging modify the functioning of each organ, an example of this is the perception of pain, which is usually less marked with increasing age, the same happens with fever, due to depression senile immune system called immunosenescence. In our patients, the most important symptom was pain. abdominal, different from the younger ones, in which if thesequence of the appearance of pain, first visceral and then somatic. When diarrhea or constipation is present in the clinical picture, as occurred in two patients in the study, it is related to pelvic or retroileal appendicitis where appendicitis, due to its unusual position near the rectum, generates said symptom.. On physical examination it was found that the signs considered cardinal for the diagnosis of acute appendicitis as they are the sign of Blomberg, painful Mc Burney point and others were manifested, but in a lower frequency than that presented in young people, which coincides with other studies reviewed [8-11]. The above is explained because the perception of pain decreases, due to The diseases Concomitant cardiovascular events that limit the cardiovascular response, such as increased heart rate. Regarding the laboratory tests, the leukogram reported a acceptable sensitivity to corroborate the suspected diagnosis of inflammatory process of the appendix. The use of abdominal ultrasound is not a routine indication for the diagnosis of acute appendicitis, but it was performed in most patients, as an aid to the differential diagnosis. The anatomical-pathological study of the appendix showed advanced stages of acute appendicitis, suppurative in most of the 57 patients who underwent surgery. The rate of appendiceal perforation (including perforation and gangrene) was low in the study compared to other investigations reporting rates from 30% to 70%. 2,9 Perforation of the appendix is the single most important predictor of mortality and late diagnosis is the main cause of this. The most common postoperative complication was site infection. operative, which coincides with other studies such as that of González E. and others [12,13]. Study morbidity was low and mortality nil, other sources literature report it below 1%. In our study, showed a satisfactory postoperative evolution of the patients. Acute appendicitis is a disease that occurs in the elderly patient with attenuated symptoms due to involution of the lymphoid tissues of the appendix, in addition to the physiological changes that occur with aging, which they modify the functioning of each organ [14-16]. In 2025, Cuba will be the oldest country in America and the sagacity and experiences of our surgeons in the diagnosis of this disease, morbidity and mortality will be very low or zero.

Conclusions

Patients over 60 years of age who underwent surgery for acute appendicitis were predominantly male, between 60 and 69 years of age, with typical abdominal pain and classic signs of the disease. The suppuration phase of the appendix was mostly confirmed. A favorable evolution of the patients was observed

Conflicts of Interest

The authors declare no conflicts of interest.

Author Contributions

Pedro Rolando Lopez Rodríguez: he reviewed clinical histories and searched for bibliography. He chose the sampling method selecting the study population and analyzed and discussed the table content. Olga Caridad León González: Helped in the review of medical records and search literature, performed statistical processing, calculated arithmetic mean and standard deviation of quantitative variables. Jorge Agustin Satorre Rocha: Performed the statistical processing, calculated and interpreted the chi-square and associated variables according to Duncan’s docima. Eduardo Garcia Castillo: He reviewed the literature on the subject looking for data worldwide epidemiological data, designed the study methodology, classified the research, processed the information and limited the bibliographical references according to Vancouver standards. He wrote the document. Luis Marrero Quiala: He reviewed the literature on the subject looking for data worldwide epidemiological data, designed the study methodology, classified the research, processed the information and limited the bibliographical references according toVancouver standards. He helped draft the document.

References

  1. Bouza PG, Villoch BR, Placencia DO, Sosa TI (2021) Calidad de la atención al anciano en dos policlínicos del municipio de Santiago de Cuba. Rev MEDISAN 25: 51-65.
  2. Pol Herrera PG,López Rodríguez PR, León González OC, Cruz Alonso JR, Satorre Rocha JA (2014) Evaluación postoperatoria de pacientes de la tercera edad con el diagnóstico de la apendicitis aguda.Rev Cubana Cir 53: 1-8.
  3. Rodríuguez FZ (2019) Tratamiento de la Apendicitis Aguda. Rev Cubana Cir 58: 1-12.
  4. Lin KB, Chan CL, Yang NP, Lai RK, Liu YH et al.(2015) Epidemiology of appendicitis and appendicectomy for the low-income population in Taiwan.
  5. Durán MV, Pino DV, Tallón AL, Pareja CF (2018) Protocolo multidisciplinar sobre la atención del paciente con apendicitis aguda.
  6. Wray CJ, Kao LS, Millas SG.(2013) Acute appendicitis: Controversies in Diagnosis and Management. Curr Probl Surg 50: 54-86. [crossref]
  7. Roesch DF, Pérez-Morales AG, Romero-SG, Remes-Troche JM, Jiménez-García VA.(2012) Nuevos paradigmas en el manejo de la apendicitis. Cir gen 34: 143-9.
  8. Lin KB, Chan CL, Yang NP, Lai RK, Liu YH, et al.(2015) Epidemiology of appendicitis and appendicectomy for the low-income population in Taiwan. BMC Gastroenterology 15: 13 p [crossref]
  9. Souza-Gallardo LM, Martínez-Ordaz JL.(2017) Tratamiento de la apendicitis aguda. Rev Med Inst Mex Seguro Soc 55: 76-81.
  10. Ruffolo C, Fiorot A, Pagura G, Antoniutti M, Massani M,(2013). Acute appendicitis: what is the gold standard of treatment? World J Gastroenterol 19: 8799-8807.
  11. Rodríguez FZ. (2019) Consideraciones Urgentes en torno al diagnóstico de la Apendicitis aguda Rev Cubana Cir 57: 1-6.
  12. Melendez Flores JE, Cosio Dueñas H, Sarmiento Herrera WS (2019) Sensibilidad y especialidad de la Escala de Alvarado en el diagnóstico de pacientes atendidos por apendicitis aguda en hospitales de Cusco.Horiz Med 19: 8-12.
  13. González E, Huespe P, Oggero S, Dietrich A, Campana JP, et al. (2017) Apendicitis aguda en adultos: tratamiento en un Hospital Universitario. Acta Gastroenterol Latinoam 47: 53-7.
  14. Bulian DR, Kaehler G, Magdeburg R, Butters M, Burghardt J, Albrecht R, et al. (2017) Analysis of the First 217 Appendectomies of the German NOTES Registry. Ann Surg 265: 534-538.
  15. Similles C, Symeonides P, Shorthouse AJ, Tekkis PP. (2010) A meta-analysis comparing conservative treatment versus acute appendectomy for complicated appendicitis (abscess or phlegmon). Surgery 147: 818-829 [crossref]
  16. Gandy RC, Wang F. (2016) Should the non-operative management of appendicitis be the new standard of care? ANZ J Surg 86: 228-231.

The Effect of Prosody and Its Suprasegmentals on Voice Production

DOI: 10.31038/JCRM.2022512

Abstract

Purpose: The purpose of this clinical research is to illustrate the impact of prosody on speech and voice production. Prosody impacts speech and comprehension of content, as it incorporates the suprasegmentals involved in the production of the speaking voice (e.g., intonation, vocal intensity, speech rate, word juncture, speech rhythm, and pausing appropriately). When providing therapy to clients from foreign countries (and clients with dysphonia), it is important to address the above prosodic features to enhance vocal quality, speech rhythm, as well as articulation, as these features have an impact on listener comprehension of the message.

Methods: The waveforms of both groups (control and participant) will be recorded on the Multidimensional Voice Program as they read the paragraph for the purpose of comparing and analyzing the waveforms of the two groups in terms of the components of prosody. Additionally, seven raters will listen to the recordings and evaluate them in terms of the following areas: speech rhythm, intonation, intensity, stress, pitch variation, and speech rate. The raters will be given a chart with names of the suprasegmentals and circle those they find deviant or incorrect for each recording; additionally, they will rate the degree of deviance on a scale of 1-5 (with 5 being the most deviant) in terms of the suprasegmental interference with voice and intelligibility.

Results and Conclusion: The results showed that incorrect use of voice/speech production in the context of prosody negatively affected vocal production and speech intelligibility, or clear comprehension of the message, as per the raters. The raters’ evaluations were consistent with each other and reflected the aspects of the waveforms in terms of the suprasegmentals (e.g., little to no pitch, low intensity, incorrect stress, pausing inappropriately).

Keywords

Suprasegmentals-vocal intensity, Intonation, Stress, Speech rate, Speech rhythm

Introduction

Prosody incorporates the melodic and rhythmic areas of speech (e.g., intonation, stress within sentences, words/multisyllabic words, length of sounds, intensity (variation between soft and loud voice), and the sharing of brain activations, particularly in the right hemisphere auditory areas [1]. According to Wagner and Watson, prosody can be defined as “a level of linguistic representation at which the acoustic-phonetic properties of an utterance vary independently of its lexical items” (e.g., phonological rhythm, semantic relationships, predictability of the linguistic material) [2]. Prosody is associated with emotion in speech. For example, intensity, vocal pitch, rhythm, and rate of an utterance are influenced by vocal emotion, which reveals the attitude and meaning of the speaker. The authors’ results show mixed support for hemispheric lateralization of speech prosody, particularly in the temporal lobe auditory areas in comparison to the frontal lobe evaluative area. Mannell (2007) states that prosody is the study of those aspects of speech that approach a level above the individual phoneme, often including the sequences of words and phrases. Prosody may also be thought of as the grammar of language [3].

Steedman (1991) stated that prosody reflects syntax because syntax and meaning are connected in terms of prosody [4]. Another aspect of prosody concerns head movements [5]. These authors found in their study that rhythmic head motion communicates linguistic information (e.g., the head movements correlated with pitch and intensity of the speaker’s voice). In this animation study, head movements were allowed to be manipulated without changing characteristics of the visual or acoustic speech; a greater number of syllables were identified by participants when natural head motion was present compared to when head motion was eliminated or distorted. The authors’ results suggested that non-verbal movements may be important in the perception of speech. According to Paige et al. (2014), appropriate prosody during oral reading contributes to comprehension processing, along with accuracy and automaticity [6]. Wagner and Watson (2010) state that there are debates on how to characterize the acoustic-phonetic properties of pitch accent and boundaries and how they are linked to discourse, as well as syntactic and semantic structure [2]. It is not clear how prosodic structure fits into models of language production. However, the study of Munhall et al. “demonstrated an interaction between visual prosody and the identification of individual words in a set of statement sentences” [5]. There were correlations between head movements and vocal acoustics, indicating that head gestures may be a contributing factor to word processing.

Cutler et al. (1986) contend that prosodic research in the comprehension of spoken language falls into three main areas: the recognition of spoken words, the computation of syntactic structure, and the processing of structure in terms of the contribution of accentuation and de-accentuation [7]. Hahn (2004) reports evidence that accent and comprehensibility are distinct constructs but overlaps [8]. The author notes that primary stress, placed correctly, showed that listeners recalled significantly more content in comparison to when the primary stress was missing or incorrectly placed. This finding suggests the importance of suprasegmentals regarding voice production, the latter in terms of variation in pitch, intensity, and stress.

Mannell (2007) points out that prosody overlaps with emotion in speech because the acoustic features used to express prosody (e.g., pitch, rhythm, vocal intensity, and rate of utterance) are affected by emotion in the voice [3]. Additionally, further research can open a greater understanding regarding the difficulties processing emotional speech (which incorporates voice production) in populations with pathologies.

Foote and Trofimolovich noted that for non-native listeners, “segmental accuracy and fluency appeared to underlie listener” perceptions of second language speech in a reading task [9]. For native listeners, word stress, accuracy, and second language reading/listening proficiency influenced perception [9].

Wagner and Watson (2010) point out that duration has been shown to correlate with prominence in English to signal word stress as well as phrase prominence [2]. Duration also signals phrasing and indicates lexical contrasts between words. The durational lengthening at the end of prosodic constituents tends to occur when the gestures slow down [2]. Fundamental frequency can also indicate primary prominence by a higher pitch in the word, which points to the importance of voice use.

According to an article from Wikipedia, intonation has been described in different ways: the division of speech into units, highlighting certain words or syllables, and the choice of pitch (rise or fall) [10]. Stress functions as a way of making a syllable prominent and may also be related to individual words as well as sentence stress (prosodic stress). Stress is associated with pitch prominence, increased duration, increased loudness, and the acoustic quality of vowels – all a part of voice production.

Ben-David et al. determined in their research that “emotional prosody and semantics are separate but not separable channels, and it is difficult to perceive one without the other” [11]. Behrman (2014) points out that although a non-native accent is not a communication disorder, it may have a negative effect on communication [12]. This author investigated prosodic training outcomes of non-native speakers of American English with a single participant by using segmental and prosody training for accent management. The results showed improved prosody patterns as well as increased accuracy of pronunciation. Listeners could more easily understand the content secondary to the contribution of segmental and prosody training. Klopfenstein (2009) confers with Behrman (2014) regarding the importance of prosody for speech intelligibility, which incorporates voice production [12,13]. Klopfenstein (2009) notes that prosody is often marginalized and misunderstood in the field of Speech-Language Pathology [13], indicating the importance of prosody or speech intelligibility (e.g., difficulty with prosody in the speech of people who are deaf or who have neurological disorders, as these individuals may not always be able to interpret vocal and speech messages). It appears that the suprasegmentals are very relevant to address in therapy. According to Grigos & Patel (2007) [14], stress functions as a way of making a syllable prominent and may be related to individual words as well as sentence stress (prosodic stress). Stress is associated with voice (e.g., pitch prominence, increased duration, and increased loudness, which refers to the acoustic quality of vowels).

The aim of the research by Groen et al. (2018) [15], was to determine the input of decoding skills from prosody skills. Their participants were fifth grade children with age-appropriate decoding but weak comprehension skills. The children with poor comprehension scored significantly below the chronological-age controls on all prosody tasks and below younger comprehension controls on a speech rhythm task. It appeared that children with poor comprehension demonstrate a delay in the perception and production of speech prosody. Therefore, it is seen that the relationship between text reading prosody and reading comprehension is not exclusively a question of decoding, illustrating the importance of suprasegmentals.

Felps et al. (2008) tested a method that transforms foreign-accented speech to resemble its native-accented counterpart [16]. Accent is contained in prosody while formant structure and speaker identity are attributed to vocal tract length and glottal shape. The study used natural speech and concluded that both areas can be complementary.

Ben-David et al. found that “prosody and semantics are integral, and it is difficult to perceive one without the other” [11]. The influence of prosody, however, has a much greater impact on the emotional rating of speech than semantics. The authors state that knowing this information can improve communication techniques and allow a better understanding of difficulties that clients with pathologies have in processing emotional speech. Furthermore, the findings of Bruce et al. (2012) revealed that non-native accented speech has a negative impact on comprehension, even in terms of simple tasks [17]. Their conclusion is that accents, varying in both segmental and prosodic features, can interfere with successful interactions between non-native accented speakers and native listeners, particularly native listeners with aphasia.

Research by Anderson-Hsieh et al. (1992) compared the relative contributions to intelligibility in terms of prosody, segmentals, and syllable structure [18]. In researching eleven different language groups, they determined that the various components of prosody (lexical stress, intonation, relative duration of weak and strong syllables) most likely contribute to intelligibility in different ways.

According to Amano-Kusumoto and Hosom (2011) [19], intelligibility at one level cannot be compared to intelligibility at another level; for example, speech intelligibility at the phoneme level cannot be used to predict intelligibility at the sentence level. That is, word, syllable, and sentence intelligibility levels are dependent on each other, while phoneme intelligibility impacts word intelligibility. An unclear sound phoneme may be recovered from a larger context, whereas phoneme intelligibility impacts word intelligibility. In terms of sentence intelligibility, these authors found that gender does not play a role in the relationship between fundamental frequency and sentence intelligibility. These researchers discovered that the listener’s age and hearing status (impaired vs. non-impaired) affects intelligibility between conversational and clear speech. Formant transitions, temporal envelope, F1 and F2 ranges, formant bandwidth, and Voice Onset Time (VOT) are factors that can be part of prosody as they are a part of increased intelligibility. The authors also contend that in elderly people, who have temporal processing deficits and prosodic features, may have difficulty with perceiving certain aspects of speech.

Non-native English speakers must learn to understand pronunciation, stress, intonation, and vowel/consonant sounds from people in different parts of the world [20]. In a word identification task, high frequency words showed higher intelligibility than lower frequency words [21]. Anderson-Hsieh et al. (1992) and Derwing et al. (1998) concluded that suprasegmentals play a more important role than segmentals (phonemes) in the intelligibility of speech pronunciation and comprehensibility in communicative contexts, and that prosodic deviance had a greater effect on non-native language learners [18,22].

Field (2005) produced an initial first language study that showed misplacing stress in words can seriously impair speech intelligibility, implying that how the voice is used for stress affects intelligibility [23]. The author found that in two syllable words, there was no effect on intelligibility when primary stress was on the first syllable. When there was a rightward shift of stress, for example, in the word “turbine,” there was an effect on intelligibility. Overall, the statistics showed that intelligibility was decreased significantly rightward than leftward. According to Lepage and Busa (2014) [24], incorrectly stressing a word had little effect on intelligibility if stressed vowels retained their quality and unstressed vowels were reduced. The authors also found that misplaced leftward stress impairs intelligibility significantly more than misplaced rightward stress.

Bond and Small (1983) stated that native English speakers rely more on stressed syllables of words than the unstressed syllables [25]. The authors found that the participant groups responded similarly to misallocation of stress. Grosjean and Gee (1987) suggest that stressed syllables may provide a code that links to a representation of the word in the native language listener’s mind. Research by Cutler and Clifton (1984) showed that stress misplacement seems to seriously impair intelligibility for native listeners, more when it is shifted to the right [26,27]. Vowel reduction and stress misallocation, when put together, have a detrimental effect on intelligibility. In the study of Yenkimaleki and Heuvan (2018), Derwing et al. (1998) showed that training second language learners, with emphasis on word stress, incorporating voice, led to better intelligibility [22,28].

According to Field (2005) previous research has shown that suprasegmentals have a higher correlation than segmentals (speech sounds) in terms of intelligibility, which indicates the importance of using the voice properly [23]. Previous psycholinguistic studies have highlighted the importance of stressed syllables over unstressed syllables in cases of “slips of the ear.” In fact, native speakers tend to identify misplaced stress more than mispronunciation of a phoneme, which indicates that misplaced stress is more important to the intelligibility of a word than the pronunciation of a phoneme [23]. In his study, Field found that there was a larger decrease in intelligibility when there was a stress shift to an unstressed syllable that did not have a change in vowel quality [23]. Hearing a weak quality vowel in a stressed syllable may reduce intelligibility in a native listener. Stressed syllables help identify words that are already stored in the mental lexicon of a native listener and perhaps an experienced non-native listener. Decreased intelligibility may also be related to a change in vowel quality; a full quality syllable has a closer relationship to the orthographic representation of a word with which a listener is familiar. In this case, it would thus be easier for the listeners to distinguish which word was being said, even if there was a stress shift. Field found, in his study, that there was a higher decrease in intelligibility with a lexical stress shift to the right of a word than to the left. It appears that stress, which incorporates how one uses his/her voice, has a significant effect on speech intelligibility.

Lepage and Busa (2014) indicated that incorrect vowel reduction is more damaging than misplacement of word stress, and that word stress and vowel reduction should be an area of concern for those clinicians who provide voice therapy, as well as teachers of pronunciation [24]. Furthermore, according to Sapir et al. (2001) intensive voice treatment can improve voice quality, loudness, articulation, prosody, and intelligibility [29].

Intelligibility and Pausing

Studies by Tolhurst (1957), Picheny et al. (1986), Li and Loizou (2008), Smiljanic and Bradlow (2008), and Hazan and Baker (2011) show that speakers have some control over the intelligibility of their speech by adopting various speaking styles that increase listeners’ understanding [30-34]. The authors, Tolhurst (1957), Picheny et al. (1986), Li and Loizou (2008), Smiljanic and Bradlow (2008), and Hazan and Baker (2011), found that improving the suprasegmental aspects (e.g., appropriate speech rate, appropriate pausing, and alteration of intonation patterns) all increased perceiving intelligibility of conversational speech at different levels.

According to Dreher and O’Neill (1957) and Summers et al. (1988) [35,36], the Lombard speech effect (the involuntary tendency of speakers to increase their vocal effort when speaking in loud/noisy environments) has been shown to be more intelligible than speech in a quiet environment. Nevertheless, it is important to be aware of not abusing one’s voice when increasing intensity.

Prosody and Neurological Problems

Reduced prosody can be seen in neurological diseases such as Parkinson’s disease where voice and speech abnormalities occur, along with reduced prosody. Additionally, it appears that voice production is a component of speech intelligibility and working on voice production can enhance speech intelligibility. These factors impact speech intelligibility which relates to issues of social, economic, and psychological well-being [37]. Yenkimaleki and Heuvan (2018) found that prosodic feature awareness training is beneficial to both speech production and speech recognition [28].

Patel et al. (2012) found that exaggerated and redundant prosodic cue use has been seen among adults with dysarthria secondary to Cerebral Palsy (CP) [38]. It is possible that these speakers heighten their prosodic contrasts to increase intelligibility. Although intensity range and fundamental frequency were similar across groups, the children with dysarthria spoke more slowly, and their fundamental frequency (F0) was more variable than the group without dysarthria. Furthermore, there was a decrease in intelligibility when these children increased F0 and duration further than a normal range (or the range usually used). The authors suggested that there could be interventions working on prosody (which is a component of voice production) to improve intelligibility of children with dysarthria. The authors noted that it was difficult to state the effectiveness of therapy because of the diversity of prosodic problems. Overall, however, there were improvements in acoustic and/or perceptual ratings of prosody, even though the participants were not within normal limits. Some important information was gleaned from this study such as the importance of addressing the slow rate of speech which increases severity. The authors also suggest that enhancing word-level prosodic features may increase intelligibility, and that children with CP may benefit from targeted intervention regarding prosody early in the treatment phase. Fundamental frequency can also indicate primary prominence by a higher pitch in the word. Kochanski et al. (2005) [39], however, state that loudness is the best acoustic correlate.

Need for the Study

Greater research is needed to determine the role and contribution of the suprasegmemtals (e.g., intonation, vocal intensity, stress, speech rate and rhythm) in voice production, prosody, and speech intelligibility, not only for clients with foreign accents. Although correct voice production is addressed in voice therapy, the suprasegmentals can enhance the production of vocal output and have a positive effect on voice. Work on the suprasegmentals related to prosody for individuals with foreign accents and individuals who would benefit from this therapy can increase speech intelligibility and voice production.

Questions Asked

  1. In the present study, which suprasegmentals (e.g., intonation, pausing appropriately, vocal intensity) can most negatively affect speech/voice on a scale of 1-5, with 5 being the highest)?
  2. Which aspect/s of prosody were least affected in terms of accent?
  3. Is there a difference in ratings among the three groups of raters, that is, the professors, the graduate students, and the undergraduate students, all of whom are in the department of Speech Communication Arts and Sciences?

Method

The following is a small-end clinical study on Prosody: The suprasegmentals of speech were evaluated by both instrumental and raters’ assessments. Instrumental evaluation of the participants’ waveforms of males and females from different countries (e.g., China, Italy, and Hungary) read a paragraph aloud, and their speech and voices were evaluated on the Multidimensional Voice Program instrument, reflected in the waveforms. Ten individuals (males and females in the control group) read the same paragraph aloud for comparison with the accent group. No hearing problems were reported or observed in either the participant or control group. People with hearing loss tend to raise the fundamental frequency of their voices to enhance their perception to increase identification of their own voice Akil et al. (2017) [40]; this action did not occur with either the participants or the control group. Participant raters also listened to the recorded tapes of both groups (participant and control) and evaluated the prosody of each person in each group. The prosody of each tape was evaluated along seven suprasegmental dimensions for both the participant group and the control group: (1) pausing appropriately at linguistic junctures; (2) intonation (pitch variation); (3) speech rate (too fast or too slow); (4) intensity (too loud or too soft); (5) connected speech (smooth or choppy); (6) word-sentence stress; (7) within normal limits. Therefore, each individual rater contributed 84 ratings in total. For the accent group, the raters circled the suprasegmental in each person’s tape recording in which they found a problem (e.g., lack of intonation, choppy speech, and monotone voice) as noted above. The raters assessed the degree of negative impact that the suprasegmental had on voice and speech on a scale of 1-5, with 5 being the most negative. Any suprasegmental not circled indicated that this aspect of prosody was appropriate (e.g., vocal intensity).

Instrumental Results on the Multidimensional Voice Program

The waveforms in this study indicated a difference in prosody between the control group and foreign participants, which needs to be addressed when working with foreign accents. As noted, the 21 participant raters listened to the audiotapes of the paragraph readings by the individuals from different countries as well as those from the control group. The results of the data from the Multidimensional Voice Program show the difference in waveforms between the accent group and control group in terms of prosody. See Figures 1-3 for examples of prosody related to foreign accent: pitch variation, intensity, and pausing. The results of the data from the Multidimensional Voice Program were in accord with the raters’ prosody evaluation (pitch variation, intensity, and pausing appropriately).

In comparison to the control group, the above examples of the foreign accent group show reduced vocal intensity, limited pitch variation, and inappropriate pausing (choppy speech) in comparison to the control group whose waveforms indicate suitable pitch variation, pausing appropriately, sufficient intensity (Figures 4-6) which follow.

As noted above, the examples of the foreign accent group (Figures 1-3) show reduced vocal intensity, limited pitch variation, and inappropriate pausing, in comparison to the control group (Figures 4-6), where these areas of prosody indicate sufficient intensity, and both appropriate pausing and pitch variation. In sum, the figures relating to the two groups show prosody and voice differences between the control group and the accent group as observed in the waveforms.

fig 1

Figure 1: Foreign (African) Accent

fig 2

Figure 2: Foreign (Japanese) Accent

fig 3

Figure 3: Foreign (Urdu) Accent

fig 4

Figure 4: Control Group

fig 5

Figure 5: Control Group

fig 6

Figure 6: Control Group

Participant Raters’ Results

Seven raters from each of the following groups–professors, graduate, and undergraduate speech pathology students compared and listened to the recordings of both the participants and the control group. The raters evaluated the prosody of the two groups on a scale of 1 to 5, with 1 being within normal limits. They found the following characteristics in the accent group: excessive pausing, inappropriate pausing, monotone voice or limited pitch variation, choppy speech, prolonged speech, slow rate, too loud or too soft. These results appeared to confirm the data seen on the waveforms. According to the raters, the suprasegmentals which most negatively affected speech/voice production were the following from the highest to lowest degree of frequency.

Choppy Speech: Frequency: 198 (67.3%)

Pitch Variation (monotone): Frequency: 184 (62.6%)

Excessive Pausing Frequency: 146 (49.7%)-related to choppy speech

Speech Rate (too slow): Frequency: 135 (45.9%)

The characteristics found in the control group were all within regular limits, compared to the accent group. The waveforms on the instrument appeared aligned with the raters’ evaluations of the participants.

Questions Answered:

  1. In the present study, which suprasegmentals had the most negative effect on prosody on a scale of 1-5, with 5 being the most difficult?
  2. The participants had the most difficulty pausing appropriately and using pitch variation, resulting in choppy speech, a monotone voice, and speaking too slowly.

  3. Is there a difference in ratings among the three groups of raters, that is, the professors, the graduate students, and the undergraduate students, all of whom are in the department of Speech Communication Arts and Sciences?
  4. The three rater groups evaluated all the participants (both control and accent groups) and were consistent in their ratings regarding the above characteristics for the accent group: choppy speech production, monotone voice, speaking too slowly, and inappropriate pausing. The control group, however, demonstrated appropriate pausing, pitch variation, speech rate (prosody was consistently rated within normal limits).

  5. Which aspects of prosody were the least affected by accent, according to the raters?

The least affected aspects were loudness (intensity) and word stress, that is, for this group of participants.

Discussion

This study was undertaken to bring attention to problems with prosody and how the suprasegmentals of speech and voice (e.g., intonation, vocal intensity, rate and rhythm, stress) not used appropriately can have a negative effect on prosody and thus listener comprehension. Viewing the waveforms of the participants in comparison to the control group’s waveforms, it is obvious that the participants exhibit almost a flat waveform with very little pitch variation, which is how their speech was perceived by the raters who listened to their recordings. These suprasegmentals are important for listener comprehension of the content and to impart the value of prosody to the clients in terms of listener comprehension. The above findings highlight the importance of addressing suprasegmentals during voice and speech therapy for clients who have difficulty with prosody to increase the intelligibility of their speech.

It is possible that the suprasegmentals may not always be addressed in therapy, even though a negative effect on voice and speech may occur if not used correctly. Not addressing prosody, when necessary, can reduce progress in terms of obtaining the most positive outcome. Individuals with voice problems must learn how to use their voices without phonotrauma and work on the suprasegmentals as well (if needed) which can enhance voice, listener comprehension of the message, and meaning. Working on the suprasegmentals can also have a positive effect on speech production. That is, correcting one prosodic feature can have a positive effect on another feature. For example, reducing choppiness may increase pitch variation and improve the client’s use of voice, as well as listener comprehension. Excessively slow rate, lack of pitch variation, low vocal intensity, incorrect stress, can reduce the meaning of the information heard and deprive the vocal folds from being appropriately engaged (e.g., to change the pitch for meaning). Field (2005) [23], for example, wrote an initial first language study that showed misplacing stress (which involves how one uses the voice) in words can seriously impair speech intelligibility. As noted, Ben-David et al. (2016) found that prosody and semantics are integral as one has an influence on the other [11]. The authors note, however, that prosody has a greater impact on the emotional rating of speech in comparison to semantics, and voice often incorporates emotion.

As noted, studies by Tolhurst (1957), Picheny et al. (1986), Li and Loizou (2008), Smiljanic and Bradlow (2008), and Hazan and Baker (2011) showed that speakers demonstrate some control over the intelligibility of their speech by implementing various speaking styles to increase listeners’ understanding. The authors determined that improving the suprasegmental features (e.g., appropriate speech rate, more appropriate pausing, pitch variation, appropriate vocal intensity, and alteration of intonation patterns, without any vocal abuse) improved conversational speech perception. It is the present principal investigator’s experience that intelligibility and voice improve when incorporating appropriate prosody (suprasegmentals) during therapy.

Articulation, of course, is important in terms of both voice production and articulation, which can support voice. Inappropriate prosody, however, may reduce intelligibility even more than just producing a speech sound incorrectly. For example, if a person has a few speech sound substitutions (e.g., l/r, d/th, i/I (seat for sit)), the content may be understood. From the present research, however, when a person does not, for instance, connect words in sentences, speaks with a monotone voice, has significantly reduced vocal intensity, listeners may have greater difficulty understanding that person than one with a few related articulation errors. Additionally, when working with one suprasegmental, another suprasegmental can become incorporated in the therapy. For example, improving pitch variation and connected speech can lead to improvements in intensity, appropriate speech rate, and appropriate pausing; additionally, precise articulation can take effort off the larynx. Improvements in these aspects can be a part of voice therapy and very motivating to the client as voice is enhanced. Prosody also gives the individual an avenue to express him or herself more meaningfully. Grigos and Patel note that “there is evidence to suggest that children master the suprasegmental aspects of speech before segmental features” indicating that prosodic control appears concurrently with language development and has an influence on the production of early infant vocalizations and words [14].

Most of the speakers featured in the clips/tapes of the present study were chosen because each had detectable accents and prosodic difficulties. There were, however, two clips of people from other countries who were judged to have regular prosody and vocal production. These latter clips/tapes indicate that one can have an accent and maintain appropriate prosody and suprasegmentals to which all the raters in this study agreed. These clips are not shown in the article, but they are similar to the waveforms of the control group, indicating appropriate prosody.

All of the participants in the clips/tapes of the present study were chosen because each had detectable accents with prosodic difficulties. Two clips of participants from foreign countries, however, not shown in this article, were judged by the raters to have regular prosody and vocal production in line with those of the control group. These two clips indicate that one can have an accent and maintain or learn to speak with appropriate prosody and suprasegmentals.

The following authors summarize the importance of prosody and its suprasegmentals on the impact on voice: McCabe and Altman (2017) stress that prosody in speech/voice production is essential as it provides contextual meaning in speech in terms of the variation of frequency, rate, and tone [41]. Prosody gives layers of meaning beyond the word. It communicates emotional and social elements that may not always be expressed through words. Voice therapy can offer individuals with prosodic difficulty methods to improve their prosody and thus their communication. Furthermore, according to Schirmer (2010) [42], a speaker’s prosody contributes to “shaping a word’s affective representation in memory” and may produce attitude changes in listeners that can have a lasting effect on listener behavior.

Nakatani and Schaffer (1978) found that stress and rhythm in terms of prosody affect speech naturalness as well as intelligibility, or the ease with which speech can be understood [43]. The findings of Patel et al. (2011) suggest that fundamental frequency and intensity are integrated to sustain the contrast between stressed and unstressed words [44,45].

Limitations

This study was limited because the raters evaluated the accented speech of individuals (the participants from different countries) who all read the same paragraph aloud, the latter to obtain consistency, in terms of the content, for comparison. Additionally, the study incorporated a small number of individuals with accents (participants).

Conclusion

The findings of this research revealed that voice production, which involves prosody related to the physiological components of voice and speech (e.g., intonation, pausing appropriately, breath support, articulation), should be part of voice therapy since prosody has a significant effect on voice production and listener comprehension. A recording device needs to be incorporated in the sessions, so that the clients can hear their improvements.

Acknowledgments

I am grateful to Dr. Howard Spivak, statistician, for his very helpful input into this article; I also thank the Brooklyn College professors and students who participated in this study by rating the accent tape recordings. I appreciate Dr. Alla Chavarga’s assistance in summarizing and discussing the results. I am especially appreciative of the contributions and assistance of Deema Farraj, Brooklyn College student, for her excellent assistance on the computer, editing the manuscript, and insightful input into this study.

References

  1. Belyk M, Brown S (2014) Perception of affective and linguistic prosody: An ALE meta-analysis of neuroimaging studies. Soc Cogn Affect Neurosci 9: 1395-1403. [crossref]
  2. Wagner M, Watson DG (2010) Experimental and theoretical advances in prosody: A review. Lang Cogn Process 25: 905-945. [crossref]
  3. Mannel R (2007) Introduction to Prosody theories and models. Macquarie University.
  4. Steedman M (1991) Structure and intonation. Lang 67: 260-296.
  5. Munhall KG, Jones JA, Callan DE, Kuratate T, Vatikiotis-Bateson E (2004) Visual prosody and speech intelligibility: Head movement improves auditory speech perception. Psychol Sci 15: 133-137. [crossref]
  6. Paige DD, Rasinski T, Magpuri-Lavell T, et al. (2014) Interpreting the relationships among prosody, automaticity, accuracy, and silent reading comprehension in secondary students. J Lit Res 46: 123-156.
  7. Cutler A (1986) Forbear is a homophone: Lexical prosody does not constrain lexical access. Lang Speech 29: 201-220.
  8. Hahn LD (2004) Primary stress and intelligibility: Research to motivate the teaching of suprasegmentals. TESOL Quart 38: 201-223.
  9. Trofimovich PA (2016) Multidimensional scaling study of native and non-native listeners’ perception of second language speech. Percept Mot Skills 122: 470-489. [crossref]
  10. Wikimedia Foundation. (2021, December 15). Prosody (linguistics). Wikipedia. Retrieved December 15, 2021, from https://en.wikipedia.org/wiki/Prosody_(linguistics)
  11. Ben-David, BM, van Lieshou P (2016) Prosody and semantics are separate but not separable channels in the perception of emotional speech. Test for rating of emotions in speech. J Speech Lang Hear Res 59: 72-89. [crossref]
  12. Behrman A (2014) Segmental and prosodic approaches to accent management. Amer J Speech Lang Pathol 23: 546-561. [crossref]
  13. Klopfenstein M (2009) Interaction between prosody and intelligibility. Intl J Speech Lang Pathol 11: 325-331. [crossref]
  14. Grigos MI, Patel R (2007) Articular movement associated with the development of prosodic control in children. J Speech Lang Hear Res 50: 119-130. [crossref]
  15. Groen MA, Veenendaal NJ, Verhoeven L (2018) The role of prosody in reading comprehension: evidence from poor comprehenders. J Res in Read 42: 37-57.
  16. Felps D, Bortfeld H, Gutierrez-Osuna R (2008) Prosodic and segmental factors in foreign-accent conversion [PDF file]. Department of Computer Science, Texas A&M University, Technical Report tamu-cs-tr-2008-7-1.
  17. Bruce C, To CT, Newton C (2012) Accent on communication: The impact of regional and foreign accent on comprehension in adults with aphasia. Disabil Rehabil 34: 1024-1029. [crossref]
  18. Anderson-Hsieh J, Johnson R, Koehler K (1992) The relationship between native speaker judgements of non-native pronunciation and deviance in segmentals, prosody and syllable structure. Lang Learn 42: 529-555.
  19. Amano-Kusumoto A, Hosom JP (2011) A review of research on speech intelligibility and correlations with acoustic features [PDF file]. Center for Spoken Language Understanding (CSLU) Tech Rept 001: 1-16.
  20. Jung MY (2010) The intelligibility and comprehensibility of world English’s to non-native speakers. Pan-Pacific Assoc Appl Linguis 14: 141-163.
  21. Levi SV, Winters SV, Pisoni DB (2007) Speaker-independent factors affecting the perception of foreign accent in a second language. J Acoust Soc Amer 121: 2327-2338. [crossref]
  22. Derwing T, Munro MJ, Wiebe G (1998) Evidence in favor of abroad framework for pronunciation instruction. Lang Learn 48: 393-410.
  23. Field J (2005) Intelligibility and the listener: The role of lexical stress. TESOL Quart 39: 399-423.
  24. Lepage A, Busà MG (2014) Intelligibility of English L 2: The effects of incorrect word stress placement and incorrect vowel reduction in the speech of French and Italian learners of English [PDF file]. Proceedings of the International Symposium on the Acquisition of Second Language Speech Concordia Working Papers in Applied Linguistics 5: 387-400.
  25. Bond ZS, Small LH (1983) Voicing, vowel, and stress mispronunciations in continuous speech. Percept Psychophys 34: 470-474.
  26. Grosjean F, Gee JP (1987) Prosodic structure and spoken word recognition. Cogn 25: 135-155. [crossref]
  27. Cutler A, Clifton C Jr (1984) The use of prosodic information in word recognition. In H. Bouma & D. G. Bouwhuis (Eds.), Attention and performance X: Control of language processes. Hillsdale, NJ: Erlbaum 183-196.
  28. Yenkimaleki M, Heuven VJ (2018) The effect of teaching prosody awareness on interpreting performance: An experimental study of consecutive interpreting from English into Farsi. Perspect 26: 84-99.
  29. Sapir S, Pawlas AA, Ramig LO, Hinds SL, Countryman S, et al. (2001) Effects of Intensive Phonatory-Respiratory Treatment (LSVT) on voice in two individuals with multiple sclerosis. J Med Speech Lang Pathol 9: 141-151. [crossref]
  30. Tolhurst G-C (1957) Effects of duration and articulation changes on intelligibility, word reception and listener preference. J Speech Hear Disord 22: 328-334. [crossref]
  31. Picheny MA, Durlach NI, Braida LD (1986) speaking clearly for the hard of hearing II: Acoustic characteristics of clear and conversational speech. J Speech Hear Res 29: 434-446. [crossref]
  32. Li N, Loizou P (2008) Factors influencing intelligibility of ideal binary-masked speech: Implications for noise reduction. J Acoust Soc Amer 123: 2287-2294. [crossref]
  33. Smiljanic´ R, Bradlow A (2008) Speaking and hearing clearly: Talker and listener factors in speaking style changes. Lang Linguist Compass 3: 236-264. [crossref]
  34. Hazan V, Baker R (2011) Acoustic-phonetic characteristics of speech produced with communicative intent to counter adverse listening conditions. J Acoust Soc Amer 130: 2139-2152. [crossref]
  35. Dreher JJ, O’Neill JJ (1957) Effects of ambient noise on speaker intelligibility for words and phrases. J Acoust Soc Amer 29: 1320-1323. [crossref]
  36. Summers WV, Pisoni DB, Bernacki RH, et al. (1988) Effects of noise on speech production: Acoustical and perceptual analyses. J Acoust Soc Amer 84: 917-928. [crossref]
  37. Ramig LO, Sapir S, Fox C, Countryman S (2001) Changes in vocal loudness following intensive voice treatment (LSVT) in individuals with Parkinson’s disease: a comparison with untreated patients and normal age-matched controls. Mov Disord 16: 79-83. [crossref]
  38. Patel R, Hustad, KC, Connaghan KP, et al. (2012) Relationship between prosody and intelligibility in children with dysarthria. J Med Speech Lang Pathol 20: 17. [crossref]
  39. Koschanski G, Grabe E, Colman J, et al. (2005) Loudness predicts prominence: fundamental frequency lends little. J Acoust Soc Amer 118: 1038-1054. [crossref]
  40. Akil F, Yollu, Umur U, Ozturk O., Yener, M. 10: 2017.
  41. McCabe DJ, Altman KW (2017) Prosody: An overview and applications to voice therapy. Glob J Oto 7: 555719.
  42. Schirmer A (2010) Mark my words: Tone of voice changes affective word representations in memory. PLoS One 5: e9080. [crossref]
  43. Nakatani LH, Schaffer JA (1978) Hearing “words” without words: prosodic cues for word perception. J Acoust Soc Am 63: 234-245. [crossref]
  44. Patel R, Niziolek C, Reilly K, Guenther FH (2011) Prosodic adaptations to pitch perturbation in running speech. J Speech Lang Hear Res 54: 1051-159. [crossref]
  45. Cooper N, Cutler A, Wales R (2002) Constraints of lexical stress on lexical access in English: Evidence from native and non-native listeners. Lang Speech 45: 207-228. [crossref]

Corporate Reputation of the Schools and Faculties of Social Work around Training by Competences of Intellectual Capital

DOI: 10.31038/ASMHS.2022615

Abstract

Corporate governance as a knowledge management system has been approached from the organizational reputation as a result of alliances with institutions. In the health sector, the demand for quality service has led to a system of professional internships and deregulated social service in which the image of the universities and health centers involved is in question. The objective of the present work was to contrast a model for the study of the phenomenon with the intention of specifying the relationships between variables. A non-experimental, exploratory and cross-sectional study was carried out with a non-probabilistic and intentional sample of 1018 administrators, professionals and students from the health sector. It was found that the case monitoring factor reflected the image of universities as trainers of intellectual capital by competencies. In relation to the consulted literature, lines of research are proposed to specify the model.

Keywords

Corporation, Training, Reputation, Competencies, Responsibility

Introduction

Within the framework of human development, health is a fundamental item for observing the corporate reputation of the School and Faculties of Social Work, understanding that it is about expectations of users, administrators, professionals and students regarding the quality of service public and depending on spending on prevention and care [1].

Mexico occupies the third last place in terms of health, public, social works, prepayments, out-of-pocket expenses, among other items related to prevention and care, which add up to 6% of the Gross Domestic Product (GDP) [2].

The corporate reputation of Public Health Institutions (ISP) and Higher Education Institutions (HEI) can be established if spending is associated with user expectations [3]. The 2015 economic census and the survey on the quality of public services note a medium and low performance of public centers and hospitals [4].

The average expenditure on medications and medical consultation is in second place once food and personal hydration have been paid for [5].

If it is considered that spending on hydration accounts for 20% of income for the popular, marginalized and excluded sectors, the prevention of diseases transmitted by hydration, when associated with spending on professional medical care, as well as on medicines, accounts for 40% for areas peri-urban areas from where they move to central cities to work, study or seek employment and education opportunities [6].

Regarding the formation of intellectual capital, Mexico occupies the penultimate place in the OECD in terms of adolescents and young people who do not have access to study or work, which is added to 14% of expectations of low quality of public education [6].

It is possible to infer that the reputation of corporate governance, health and medical assistance institutions, as well as the formation of intellectual capital, are on the decline, and a diagnosis of the HEIs that train health professionals is urgent, among which are the Schools and Faculties of Social Work [7].

Corporate Reputation Theory

Figure 1 shows the theoretical and conceptual frameworks that explain corporate reputation understood as the expectations of employees, directors and clients alluding to effective responses to environmental contingencies, context requirements or social demands [8].

fig 1

Figure 1: Corporate Reputation Theory.
TPI = Stakeholder Theory, TLT = Transformative Leadership Theory, TDP = Prospective Decision Theory: NM = Norms, VS = Values, CR = Beliefs, AC = Attitudes, PC = Perceptions, IN = Intentions, CM = Behaviors
Source: Self made.

The Stakeholders Theory warns that employees, shareholders, leaders and clients not only have a direct and significant participation in the company but also confront peripheral actors such as protesters, the media or institutions that seek to counteract the prestige of the company. institution in order to increase its credibility and position itself in the market [9].

Around the conflict between the interested parties and external factors to public health institutions, corporate governance is created as a shield of empathy, trust, commitment and satisfaction that guarantees the union of shareholders, leaders, employees and clients against the environmental threats, but it is in terms of reputation and prestige that differences and similarities between internal and external actors are resolved [10].

However, it is known that adhocratic organizational cultures, as well as traditional leadership, promote internal asymmetries in the face of external threats to the detriment of corporate reputation and prestige [11].

It will be the transforming cultures and leaderships who will manage knowledge to establish competitive advantages in the formation of intangible assets such as training and training of intellectual capital, future artificial and emotional intelligence cadres that will be decisive in entrepreneurship and innovation [12].

In such a context and scenario of cultures and transformative leaderships, decision makers are oriented towards vision and prospective missions as a second competitive advantage coupled with the formation of intangible assets [13].

This is the case of strategic alliances and knowledge management between HEIs and community, public or collective health institutions where systems of professional practices and social service are established in order to train future health professionals, among whom are social workers [14].

The Theory of Prospective Decisions posits that organizations prefer intentions and decisions aimed at maximizing risks and profits over strategies to reduce risks and reduce benefits [15].

In the case of the formation of human capital, a prospective decision suggests risks in the formation with high benefits in the prestige and reputation of the HEI or the health center. These are early professional internship strategies for students who have not covered the minimum credits, or social services who have not accredited seminars or basic subjects [16].

Another aspect to consider refers to the lack of resources for the hiring of professionals and the employment of interns and social workers to remedy the deficit of attention to public health services, or their use in health promotion, campaigns of prevention or allocation of medications to vulnerable groups [17].

In sum, stakeholder theory, transformational leadership theory, and prospective decision theory suggest the need for a comprehensive, specific, and up-to-date diagnosis of corporate governance, reputation, and institutional prestige, as well as expectations. of shareholders, directors, talents and users of HEIs in strategic alliances with collective health centers [18].

Given that corporate governance in general and training reputation and prestige in particular are little studied objects in the HEIs where the Schools and Faculties of Social Work are located, it is necessary to carry out a comprehensive diagnosis of the skills of future professionals with the purpose of inferring the intangible value of public universities in strategic alliances with health centers, as well as their differences and similarities in terms of professional skills [19].

Formulation

Will there be significant differences between HEIs in central, western and northern Mexico in terms of training skills for health services?

Hypothesis

Null Hypothesis

There will be significant differences between the HEIs studied with respect to the professional training of skills for public health services

Alternate Hypothesis

There will be no significant differences between the study HEIs regarding the professional training of skills for public health services

Method

An exploratory study was carried out with a sample of students, directors and professionals of the Social Work of Health in HEIs in the center, west and northeast of Mexico, considering their affiliation to a public university with an internship system in health centers, accreditation of the minimum percentage for social service and professional practices (Table 1).

Table 1: Descriptions of the study sample


Students

professionals Administrative Sex Age

Entry

UAEH

93

37 14 Female(45%) Male(55%) M=25.3 SD=3.89

M=$346.1 SD=$9.3

UAEM

91

3. 4 12 Female(57%) Male(43%) M=29.8 SD=4.78

M=342.1 DE=$8.3

UAEMEX

90

33 eleven Female(67%) Male(33%) M=27.3 SD=3.80

M=$432.1 SD=$7.1

UAM

89

30 10 Female(49%) Male(51%) M=28.6 SD=2.79

M=367.2 DE=$8.2

UAQ

87

29 9 Female(44%) Male(56%) M=36.1 SD=1.32

M=$342.1 SD=9.3

UAT

85

27 8 Female(52%) Male(48%) M=33.1 SD=1.67

M=$396.1 SD=$10.4

UNAM

84

25 7 Female(43%) Male(57%) M=37.1 SD=4.35

M=$354.1 SD=71.1

USON

83

24 6 Female(60%) Male(40%) M=39.8 SD=2.34

M=$359.8 SD=$5.4

Source: Prepared with study data

The Corporate Reputation Scale (ERC-28) was built based on items selected from the consulted literature, which measured expectations of the parties involved regarding objectives, tasks and goals related to entrepreneurial and innovative knowledge skills such as collaborative work. professional (Table 2).

Table 2: Construction of the ERC-28

Competence

Definition Indicator Coding

Interpretation

Accompaniment It refers to an emotional ability to establish a bond of social, family or personal support with the user of the health service (Vaquero, 2012) Data relating to cases of self-medication or self-harm 0=“not at all likely” to 5=“quite likely” High scores refer to a corporate governance focused on the reputation and professional training prestige of the accompaniment
Accession It refers to the ability to motivate the user to use the health service in terms of consultation requests, medications and advice. (Kolade, Olakkeke, & Omotayo, 2014) (Data referring to the cases of rehabilitation and desertion to treatments 0=“not at all likely” to 5=“quite likely” High scores refer to a corporate governance focused on the reputation and professional training prestige of adherence to treatment
Advisory It refers to an ability to establish effective and accessible processing routes for health service users (Rondeaeu, 2017) Data alluding to the time of delay in each of the phases of the health service from the request for care to the rehabilitation 0=“not at all likely” to 5=“quite likely” High scores refer to a corporate governance focused on the reputation and professional training prestige of the management consultancy
Interview It refers to an ability to establish empathy with the user of health services, their needs, shortcomings and opportunities for a risk-free life (Olajide, 2014) Data alluding to the user’s detachment and trust towards health professionals, bureaucracy and administrative managers 0=“not at all likely” to 5=“quite likely” High scores refer to a corporate governance focused on the reputation and professional training prestige of the diagnostic interview
Mediation It refers to an ability to reduce differences and conflicts, as well as to establish points of agreement between the parties (Kelinde, 2012). Data related to conflicts and conciliations 0=“not at all likely” to 5=“quite likely” High scores refer to a corporate governance focused on the reputation and professional training prestige of conflict mediation
Promotion It refers to an ability to disseminate data and prevention strategies for illnesses and accidents for a risk-free life (Jinfeng, Runtian, & Quian, 2014). Data alluding to illnesses and accidents that affect occupational, emotional or biophysical health 0=“not at all likely” to 5=“quite likely” High scores refer to a corporate governance focused on the professional training reputation and prestige of health promotion
Follow-up It refers to an ability to establish parameters of quality of care in terms of satisfaction of the user of the health service (Melero and López, 2017) Data alluding to the quality of care and customer satisfaction 0=“not at all likely” to 5=“quite likely” High scores refer to a corporate governance focused on the reputation and professional training prestige of case monitoring

Source: Self made

The surveys were carried out in the facilities of the HEIs and health centers with a prior written guarantee of confidentiality, anonymity and non-affectation of the results. The information was processed in the Statistical Package for Social Sciences (SPSS version 25.0).

Reliability and validity analyzes of the instrument, hypothesis tests for differences between groups, as well as correlations, general linear models and structural equation models were carried out to establish the trajectories of dependency relationships between the variables and indicators of the ERC-15.

The following parameters were estimated: 1) mean, 2) standard deviation, 3) bias, 4) kurtosis, 5) asymmetry, 6) Crombach ‘s alpha , 7) Student’s t – test, 8) analysis of variance F-test, 9) KMO test, 10) Bartlett test, 11) Pearson correlations, 12) beta regressions, 13) goodness of fit, and 14) residuals.

Results

Table 3 shows the statistical properties of the ERC-28 in which reliability alpha values higher than the indispensable minimum of .700 are observed for the general instrument (alpha of .780) and the subscales (respective alphas of .776; .781); .756; .790; .719; .750; .732).

Table 3: Descriptives of the CKD-28

R

M D yes C TO F1 F2 F3 F4 F5 F6 F7
R1 1.32 ,821 1.59 1.54 ,782

,360

R2

1.25 .943 1.65 1.65 ,793 .469
R3 1.43 .972 1.67 1.29 ,784

,540

R4

1.39 ,784 1.83 1.03 ,763 .457
R5 4.37 1.30 1.75 1.17 ,751 ,564

R6

4.21 1.21 1.60 1.81 ,759 .439
R7 4.21 1.43 1.73 1.43 ,783 ,406

R8

4.43 1.46 1.83 1.12 .752 .326
R9 3.45 ,864 1.95 1.14 ,714 .435

R10

3.50 .975 1.61 1.03 ,750 .329
R11 3.56 ,931 1.68 1.05 ,762 .438

R12

3.52 ,831 1.92 1.24 ,741 ,384
R13 1.39 4.36 1.61 1.16 ,739 .438

R14

1.45 4.18 1.74 1.46 .752 .548
R15 1.46 4.39 1.82 1.67 ,751 ,324

R16

1.21 4.39 1.93 1.02 ,754 .455
R17 4.56 1.52 1.62 1.13 ,749 .421

R18

4.35 1.48 1.79 1.15 ,731 ,486
R19 4.25 1.32 1.73 1.15 ,743 ,340

R20

4.67 1.14 1.82 1.45 ,724 ,389
R21 2.46 2.35 1.70 1.24 ,743 ,398

R22

2.57 2.14 1.82 1.13 ,763 .412
R23 2.54 2.43 1.71 1.15 ,716

,378

R24

2.14 2.87 1.94 1.17 ,730 ,420
R25 4.50 ,871 1.84 1.06 ,753

.423

R26

4.67 .943 1.74 1.09 ,726 ,379
R27 4.18 ,921 1.92 1.17 ,743

.421

R28

4.39 .953 1.75 1.18 ,750 .347

R=Reactive, M=Mean, D=Standard Deviation, S=Skew, C=Kurtosis, A=Alpha removing the value of the item. Adequacy (KMO=.732), Sphericity ⌠X2=23.6 (5df) p=.000⌡Extraction method: principal axes, rotation: promax. F1=Accompaniment (18% of the total variance explained), F2=Adherence (17% of the total variance explained), F3=Advice (15% of the total variance explained), F4=Interview (13% of the total variance explained), F5=Mediation (11% of the total variance explained), F6=Promotion (8% of the total variance explained), F7=Follow-up (5% of the total variance explained). All items are answered with one of five options: 0=“not at all likely” to 5=“quite likely”.
Source: Self made.

The correlation matrix shows discriminant validity by including values close to zero, but the covariance matrix warns of the possibility of excluding other factors due to values close to unity (Table 4).

Table 4: Correlation and covariance matrices


F1

F2 F3 F4 F5 F6 F7 F1 F2 F3 F4 F5 F6

F7

F1

1,000

1.59
F2

2. 3. 4*

1,000 ,743

1.83

F3

,313

.246 1,000 ,831 .674

1.79

F4

.435*

,318 .239 1,000 .932 ,756 ,794 1.68
F5

,294

.268** .217*** .246 1,000 ,748 .865 ,874 ,608 1.50
F6

.105

.106 .443 .128 .319* 1,000 ,693 ,608 ,792 ,704 ,893

1.68

F7

,392

.146 .329 .236* .246 .246 1,000 ,761 .642 .775 .872 ,768 ,798

1.72

F1=Accompaniment, F2=Adhesion, F3=Counseling, F4=Interview, F5=Mediation, F6=Promotion, F7=Follow-up: * p <.01; ** p <.001; *** p <.0001.
Source: Prepared with study data.

The sum of the percentages of explained variance (87%) revealed the preponderance of seven factors that can converge in a common factor of the second order (Figure 2).

figure 2

Figure 2: Structural model of trajectories of dependency and reflective relationships.
C = Corporate Reputation: F1 = Accompaniment, F2 = Adhesion, F3 = Advice, F4 = Interview, F5 = Mediation, F6 = Promotion, F7 = Follow-up; r = Reactive, d = Disturbance, e = Measurement error
Source: Prepared with study data.

The second-order factor related to corporate reputation included the eight first-order factors established from the review of the literature. The structural model included as a reflective factor the competence of case follow-up (.67). In other words, the corporate reputation of the social work public service is centered on the academic and administrative training of monitoring skills rather than on the skills of support, adherence, advice, interview, mediation and health promotion.

The fit and residual parameters ⌠X2=345.23 (56df) p=.008; GFI=.997; CFI=.990; NFI=.995; RMSEA=.009; RMR=.007⌡ suggest the non-rejection of the null hypothesis regarding the differences between the competencies reviewed in the literature with respect to the structural model.

Discussion

The present work has established the contrast of a model for the study of seven exploratory factorial dimensions of corporate reputation in HEIs in central, western and northern Mexico, although the type of non-experimental study, the type of intentional selection and the type of exploratory factor analysis limit the results to the study sample, suggesting lines of research and intervention related to the follow-up of cases as a factor reflecting the organizational phenomenon.

[1,3,19-28] contrasted models to observe corporate reputation in its reflective dimensions: 1) aversive or entrepreneurship and real innovation of the organization; 3) responsive or ecological footprint of the organizational production; 3) prospective or expected future of the organization, concluding that organizations seem to go through a process that goes from aversion to risks indicated by cultures, leaderships and adhocratic climates towards a propensity for the future indicated by cultures, leaderships and conciliatory climates of the organization image of collaborative knowledge networks.

In the present work, an exploratory model of seven factors has been contrasted in which the institutional follow-up of user cases is the hallmark of HEIs that, in alliance with health centers, train future operational-administrative cadres. The factor reflecting the follow-up of cases is part of the dimension of responsiveness cited in the literature.

Therefore, it is necessary to: a) build an instrument to explore the indicators of the responsive dimension as a preponderant factor of corporate reputation; b) contrast an exploratory model in order to establish the convergent and divergent validity of the scale; c) associate the responsive dimension with the aversive and prospective dimensions in order to build an integral model.

Conclusion

The present work has contrasted a model of seven dimensions reflecting the reputation of HEIs specialized in Social Work in Health, which is centered on the competence of case follow-up. In relation to the findings reported in the literature, the model can be specified in the responsive dimension, this being the one that would explain the distance or closeness that the respondents refer to as the competitive advantage of their academic and professional training.

References

  1. Bustos JM, Ganga F, Llamas B, Juárez M (2018) Contrast of a prospective decision model in implications for a university governance of sustainability. Margin 89: 1-16.
  2. Garcia C (2018a) Reliability and validity of an instrument that measures knowledge management in a public university in central Mexico. Tlatemoani 27: 285-304.
  3. Sánchez R, Villegas E, Sánchez A, Espinosa F, García C (2018) Model for the study of organizational clarity and corporate social responsibility. Synchrony 22: 467-483.
  4. García C, Espinosa F, Carreón J (2018) Model of intangible assets and capitals in organizations. International Journal of Research in Humanities and Social Studies 5: 1-12.
  5. Garcia C (2018b) Interpretations of knowledge management discourses for the understanding of narratives of innovative entrepreneurship. Inclusions 5: 96-111.
  6. Garcia C, Martinez E, Rivera PE (2018) Labor flexibility in higher education. Inclusions 5: 51-69.
  7. Villegas E, Garcia C, Hernandez TJ (2018) Establishment of a science and technology policy for the incubation of innovative knowledge micro-enterprises. Inclusions 5: 19-26.
  8. Rubio A, Jiménez IC, Mercado C (2017) Online corporate reputation in the hotel industry: The case of tripadvisor. Market Economic & Business Journal 48: 579-593.
  9. Perrini F, Vurro C (2013) Stakeholders orientation and corporate reputation: A quantitative study on US companies. Emerging Issues in Management 1: 53-65.
  10. Babie V, Arslanagic M, Mehic E (2013) Importance of internal marketing for service companies’ corporate reputation and customer satisfaction. Journal of Business Administration research 12: 49-57.
  11. Barnnett M, Jermier JM, Lafferty BA (2006) Corporate reputation: The definitional landscape. Corporate Population Review 9: 26-38.
  12. Blajer A (2014) Corporate reputation and economic performance the evidence from Poland. Economic & Sociology 7: 194-207.
  13. Cariton R, Moura RC (2012) The impact of R&D intensity on corporate reputation: interaction effect of motivation with high social benefit. Intangible Capital 8: 216-238.
  14. Beheshtifar M, Korouki A (2013) Reputation: An important component of corporation value. International Journal of Academic Research in Business & Social Science 3: 15-20.
  15. Casimiro MC, Matos A (2017) The impact of corporate reputation in a dairy company. Business & Economics Journal 8: 1-11.
  16. Marquina P, Arellano R, Velázquez I (2014) A new approach for measuring corporate reputation. Administration 54: 53-66.
  17. Martinez P, Rodriguez I (2013) Intellectual capital and relational capital: The role of sustainability in developing corporate reputation. Intangible Capital 9: 262-280.
  18. Fiala R, Prokov M (2013) The relationships among reputation, inter-organizational trust and alliance performance. University Act 99: 899-908.
  19. Hernández TJ, Sánchez A, Espinosa F, Sánchez R, García C (2018) Model of lucidity, entrepreneurship and innovation in coffee microenterprises in central Mexico. Eureka 15: 96-107.
  20. Garcia C, Rivera PE, Martinez E (2018) Institutionalist academic culture in Cuernavaca, Modelos (Mexico). Inclusions, 5: 84-96.
  21. Garcia C, Rivera PE, Martinez E (2018) Institutionalist academic culture in Cuernavaca, Modelos (Mexico). Inclusions, 5: 84-96.
  22. Jinfeng L, Runtian J, Quian C (2014) Antecedents of corporate reputation and customer citizenship behavior. International Business & Management 9: 128-132.
  23. Kelinde O (2012) Organizational culture and its corporate image: A model juxtaposition. Business & Management Research 1: 121-132.
  24. Kolade OJ, Olakkeke O, Omotayo O (2014) Organizational cityzenship behavior, hospital corporate image and performance. Journal of Competitiveness 6: 36-49.
  25. Melero I, Lopez ML (2017) Identifying link between corporate social responsibility and reputation: Some considerations family firms. Journal Evolutionary Studies in Business 2: 191-230.
  26. Olajide FS (2014) Corporate social responsibility practices and stakeholders’ expectations. Research in Business & Management 1: 13-31.
  27. Rondeau KV (2017) The impact of world ranking systems on graduate schools of business: promoting the manipulation of image over the management of substance. World Journal of Education 7: 62-73.
  28. Cowboy A (2012) Online reputation in the framework of corporate communication. An insight into research trends and career prospects. Communication 3: 49-63.

Spatial Variability of Elemental Concentrations in Three Marine Fishes along the Coastal Waters of Andhra Pradesh

DOI: 10.31038/JPPR.2022512

Abstract

In the presented study, three different marine fish species were collected from four locations along the coastal waters of Andhra Pradesh. The samples were analysed using Hand-held XRF. Concentrations of ten elements (As, Cd, Cu, Fe, Mn, Se, Zn, Ca, K and Mg) were quantified in muscle, liver and gill tissues of Rastrelliger kanagurta, Euthynnnus affinis and Saurida tumbil collected from Visakhapatnam harbour, Kakinada harbour, Pudimadaka and Bheemili. There was a clear spatial variation in the concentration of elements collected from different locations. However, significant differences in elemental concentrations among the three studied species and tissues were observed and these may be related to different accumulation patterns of the species. The results showed that concentrations of As and Cd were above the threshold limits. However, the exposure for the population depends on their dietary habits and continued exposure to the heavy metals may cause adverse effects.

Keywords

Marine fish, HHXRF, Heavy metal

Introduction

During the last few years, aquatic ecosystems have been affected by various types of contaminations due to garbage and effluents delivering by different sectors like domestic, agricultural, commercial, and pharmaceutical and other industrial activities of human beings living around the coastal lines. In recent years [1], much attention has been paid to study about health benefits of essential elements (Fe, Zn, Cu, Mn) derived from fishes of the marine environment due to consumption of sea fishes and change in their concentration due to pollution impact causing associated health hazards besides the accumulation of non-essential elements or heavy metals (Hg, Cd, Pb) in the fishes. Nutritionists consider fish products to be a major source of quality protein, vitamins, minerals and long-chain polyunsaturated fatty acids (omega-3), docosahexaenoic acid (DHA) and also contain organic and inorganic micronutrients like vitamin D, selenium etc. [2]. Fishes are recommended mainly to the elderly, infant’s brain and nerves function, cardiac patients i.e., abnormal heart strokes and those with digestive problems due to their reduced energy levels and higher mineral content [3]. Consuming fish may decrease the risk of depression, Alzheimer’s disease, arthritis and diabetes etc. On the other hand, Toxicologists tend to regard aquatic pollution as a major vector for non-essential elements like Hg, Cd, Pb accumulation [4]. These elements are mainly present in marine environments due to industrial wastewater loads, soil erosion, municipal sewage discharges from rural and urban areas, agricultural land runoff [5]. Natural phenomena such as earthquakes, landslides, tornadoes, cyclones, and weathering of rocks also contribute towards heavy elements contribution for pollution. The contaminated water is the major source of elements bioaccumulation in the various vital organs (Liver, Kidney, gills) of the fish. Discharge of agricultural wastes like agrochemicals, Organic matter and industrial wastewater without pre-treatment into lakes, rivers and oceans resulting in an increase of non-essential elemental concentration in such water environments exhibiting damage on aquatic life [6]. Elemental pollutants as particles, elemental ions; inorganic and organic compounds in rivers and oceans also damage aquatic life [7,8]. Heavy elements, which especially collected in the organs of fishes, such as spleen and kidneys may be transmitted and accumulated in human organs through their consumption [9] and can cause a risk of kidney, brain and nervous system damage to human beings. Therefore, the introduction of non-essential elements into the food chain threatens human health and also to aquatic life. Essential elements may also become toxic to the human body if their intake is higher than the standard values of WHO [10].

The consumption of fish is significant for human beings living in coastal areas like Visakhapatnam and constitutes an important component in the intake of food items. Hence, continuous monitoring and analysing elemental concentration levels in fish belong to coastal areas became vital to understand the pollution impact on human beings those who consume frequently or regularly. Research on the detection of elements in fishes of these coastal areas is important because elemental concentration could cause growth disorders, reproductive disorders, immune suppression and histopathological alteration in the gills, kidney, liver and skin, as well as abnormalities in fish bones [11]. The health hazards associated with the consumption of contaminated fishes are up to 20-40 times greater than those associated with contaminated drinking water [12]. This is because fish have the ability to contain elemental concentration up to ten times higher than the observed environmental value [13]. Thus, fish may be considered biological indicators of elemental pollution and as a potential risk factor if contaminated fish are consumed by human beings. Absorption of elemental ions takes place through the skin, gills and digestive tract of fishes, which are transmitted to other parts of the body through the blood [14]. Muscles have been widely analysed for elemental concentration as they constitute the most edible portion of fish that poses a risk to human health who consumes them [15]. However, the liver, gills and kidneys collect the elements more effectively than the muscles since they are active metabolic tissues and primary organs for accumulating the majority of elements in fish [16]. The concentration level of elements in the gills indicate their concentration presented in the water in which the fish are found, and the liver’s concentration represents the retention of the elements, whereas the muscle is not regarded to be active tissue in the accumulation of elements [17]. Many organizations like the United States Food and Drug Administration (USFDA), the Food and Agriculture Organization (FAO) and the World Health Organization (WHO) have established limitations for human consumption of trace elements. The FAO/WHO Committee on Food Additives has set the provisional values of tolerable weekly intake (PTWI) and the dietary intakes of food additives and certain food contaminants. These specific values are significant for the safety levels of these elements in humans [18].

Materials and Methods

Samples Collection and Preparation

In the present study, three marine fishes commonly consuming by the people of Andhra Pradesh namely (Rastrelliger kanagurta (22-24 cm, TL), Euthynnus affinis (28-32 cm, TL) and Saurida tumbil (30-34 cm, TL) were collected freshly from four locations of coastal waters namely Visakhapatnam harbour (Geographical coordinates (17.6958° N, 83.3025° E), Kakinada harbour (16°58′30″N, 82°16′44″E), Pudimadaka fish landing centre (17.4927° N, 83.0028° E) and Bheemili fish landing centre (17.890382°N 83.455465°E). The sample collection areas along the coastal waters of Andhra Pradesh are shown in Figure 1. Photographs of the collected marine fishes belong to the Visakhapatnam harbour is presented in Figure 2. These fishes were individually packaged into polythene bags, stored in an ice box and brought to the laboratory. The selected species were collected three times during the winter season. The collected fishes were washed with distilled water and carefully dissected to obtain the muscle, gills and liver of the fish; subjected for determination of elemental concentrations accumulated in the respective parts. These samples were then kept at around -20°C in a deep freezer overnight in the laboratory. The frozen samples were lyophilized in a microprocessor-controlled freezing method. The lyophilization works at around -50°C which absorbs water molecules from the samples, drains off the samples making them completely dry. Then the dried specimens were ground using agate mortar and pestle to obtain fine powder with minimal contamination. The samples were kept separately with unique identification number in airtight packets.

fig 1

Figure 1: Sample collection areas along the coastal waters of Andhra Pradesh

fig 2

Figure 2: Fish Samples collected at Vishakapatnam fishing harbour

Experimental Method

The experimental work was carried out in BARC (Division of Nuclear Physics), Mumbai with Hand-held XRF (HHXRF) technique. In the XRF spectrometer, samples were excited by the X-rays emanating from an X-ray tube (Rh X-ray tube) having enough energy for ejecting electrons from various inner shells belonging to the atoms in the specimen. The vacancies in the inner shells of atoms are then occupied by electrons coming from the outer shells of the atoms causing the emission of characteristic X-rays; conventionally it can be referred to as X-ray fluorescence (XRF). In HHXRF, a silicon drift detector (SDD) was employed for the measurement of X-ray energies. The Silicon Drift Detector (SDD) contains graphene window that enables the detection of low Z elements (Al, S and P). These low Z elements usually cannot be detected by the conventional XRF system which uses a beryllium window. The powdered samples were placed in a cubic box and irradiated by Rhodium X-ray tube. Spectrum has been obtained for each sample in twenty seconds. The energy of the beams used for beam 1 is between 12 and 36 keV, whereas for beam 2, it varies between 0 to 12 KeV [19]. The HHXRF experimental set-up is as shown in Figure 3. The validity of the HHXRF set up was performed by analyzing Certified reference material (CRM) obtained from European Commision – Joint Research Centre, Institute for Reference Materials and Measurements – (ERMBB422 – Fish muscle) – was used for quantification of the elements and verifying the reliability of the data obtained by the present system.

fig 3

Figure 3: HHXRF set up

Results and Discussion

Concentrations of accumulated elements namely As, Cd, Cu, Fe, Mn, Se, Zn, Ca, K and Mg in different tissues belong to the fishes collected from four different locations are determined by using the obtained spectra. The observed results relating to the fishes collected from Visakhapatnam fishing harbour are compared with those collected from Kakinada fishing harbour, Pudimadaka, Bheemili as displayed in the Table 1. There is a clear spatial variation in the concentration of elements collected from different locations, however significant differences in elemental concentrations among the three studied species are observed; which may be related to different accumulation patterns of the species. The obtained XRF spectrum of the certified reference material (ERMBB422) is shown in Figure 4. The correlation coefficients among the evaluated average concentration values of various elements observed due to the three species are computed and shown in Tables 2-4.

Table 1: Concentrations of elements present in three different fish species collected at four locations

Element

Species Tissue Visakhapatnam Kakinada Pudimadaka

Bheemili

As

Rastrelliger kanagurta Muscle BDL BDL BDL BDL
Liver 6.0 ± 4.4 8.3 ± 5.8 5.3 ± 4.0 BDL
Gills 9.3 ± 6.7 BDL BDL BDL
Euthynnus affinis Muscle 11.0 ± 2.8 5.3 ± 0.6 7.3 ± 4.9 BDL
Liver 45.5 ± 2.1 15.7 ± 2.1 28.0 ± 16.5 37.7 ± 26.3
Gills 6.7 ± 4.6 2.7 ± 2.1 7.5 ± 0.7 BDL
Saurida tumbil Muscle 4.0 ± 2.6 BDL 2.7 ± 2.1 4.3 ± 3.2
Liver 17.0 ± 2.8 14.3 ± 10.1 18.0 ± 14.1 11.0 ± 4.4
Gills 7.3 ± 4.9 16.0 ± 11.3 BDL 12.7 ± 3.8

Cd

Rastrelliger kanagurta Muscle 29.5 ± 4.9 25.7 ± 3.1 23.0 ± 5.0 30.0 ± 1.4
Liver 31.5 ± 10.6 29.0 ± 5.3 22.7 ± 3.8 29.0 ± 9.9
Gills 11.7 ± 8.1 15.0 ± 10.4 13.7 ± 9.8 15.3 ± 11.0
Euthynnus affinis Muscle 28.0 ± 2.6 26.3 ± 3.5 25.3 ± 5.7 15.3 ± 11.0
Liver 42.3 ± 11.2 38.7 ± 16.2 35.3 ± 4.2 14.3 ± 10.1
Gills BDL BDL BDL 15.0 ± 10.4
Saurida tumbil Muscle 25.5 ± 3.5 21.7 ± 3.2 27.5 ± 6.4 25.3 ± 2.5
Liver 31.0 ± 7.0 23.0 ± 2.8 27.0 ± 5.7 12.3 ± 8.4
Gills BDL 15.7 ± 11.5 15.0 ± 10.4 15.0 ± 10.4

Cu

Rastrelliger kanagurta Muscle BDL BDL BDL BDL
Liver 52.5 ± 16.3 69.3 ± 24.5 66.0 ± 33.4 47.5 ± 16.3
Gills 35.3 ± 24.8 BDL BDL BDL
Euthynnus affinis Muscle 11.0 ± 7.8 14.5 ± 6.4 6.0 ± 4.4 BDL
Liver 58.0 ± 45.6 81.3 ± 31.5 38.7 ± 18.8 44.3 ± 30.9
Gills 8.3 ± 5.8 BDL BDL BDL
Saurida tumbil Muscle BDL BDL BDL BDL
Liver 39.7 ± 21.6 42.7 ± 30.6 48.0 ± 7.1 21.0 ± 4.0
Gills BDL BDL BDL BDL

Fe

Rastrelliger kanagurta Muscle 113.7 ± 47.3 94.7 ± 24.0 106.7 ± 14.5 97.5 ± 3.5
Liver 1574.0 ± 596.8 1538.7 ± 567.0 1910.7 ± 593.7 1311.5 ± 509.8
Gills 1304.0 ± 1304.2 950.3 ± 325.4 595.7 ± 98.0 550.0 ± 69.3
Euthynnus affinis Muscle 193.0 ± 174.0 287.0 ± 87.9 177.3 ± 98.9 45.3 ± 31.8
Liver 1628.7 ± 1638.4 3430.0 ± 1841.3 2097.0 ± 2065.0 2090.0 ± 1524.2
Gills 519.0 ± 70.7 589.7 ± 128.2 4047.7 ± 5345.8 302.0 ± 209.6
Saurida tumbil Muscle BDL 13.3 ± 9.2 BDL BDL
Liver 940.0 ± 546.5 1383.3 ± 858.2 1382.0 ± 745.3 748.3 ± 212.1
Gills 487.0 ± 208.1 450.3 ± 111.1 518.5 ± 157.7 418.7 ± 269.1

Mn

Rastrelliger kanagurta Muscle 23.7 ± 16.7 BDL BDL 17.0 ± 12.1
Liver 19.3 ± 13.6 BDL 37.0 ± 9.9 35.5 ± 9.2
Gills 41.0 ± 7.1 53.5 ± 3.5 57.0 ± 5.7 70.5 ± 14.8
Euthynnus affinis Muscle BDL BDL BDL 18.3 ± 12.7
Liver 17.0 ± 12.1 20.3 ± 14.4 40.5 ± 0.7 BDL
Gills 72.5 ± 38.9 52.3 ± 9.1 104.5 ± 53.0 20.7 ± 14.2
Saurida tumbil Muscle 17.0 ± 12.1 18.7 ± 13.3 15.0 ± 10.4 26.3 ± 1.2
Liver 24.0 ± 16.5 15.3 ± 11.0 BDL BDL
Gills 88.0 ± 10.5 68.3 ± 1.2 93.0 ± 41.0 75.7 ± 23.0

Se

Rastrelliger kanagurta Muscle BDL BDL 1.5 ± 0.7 BDL
Liver 15.0 ± 11.3 17.7 ± 10.8 21.7 ± 10.7 20.0 ± 15.6
Gills 15.3 ± 13.8 7.7 ± 2.5 5.7 ± 1.2 8.0 ± 2.8
Euthynnus affinis Muscle 3.7 ± 2.1 6.0 ± 3.0 5.3 ± 4.9 BDL
Liver 26.7 ± 20.4 16.7 ± 11.7 26.3 ± 13.8 2.7 ± 2.1
Gills 10.5 ± 3.5 8.3 ± 3.1 6.3 ± 2.9 1.7 ± 1.2
Saurida tumbil Muscle BDL BDL 1.5 ± 0.7 BDL
Liver 2.7 ± 1.2 2.7 ± 1.2 2.0 ± 1.4 1.7 ± 0.6
Gills BDL 1.7 ± 1.2 BDL 1.7 ± 1.2

Zn

Rastrelliger kanagurta Muscle 113.7 ± 82.6 87.3 ± 31.8 76.3 ± 1.2 59.0 ± 1.4
Liver 326.0 ± 36.8 334.7 ± 101.6 312.7 ± 116.2 263.5 ± 72.8
Gills 618.7 ± 681.0 262.3 ± 14.6 269.7 ± 40.4 305.0 ± 8.5
Euthynnus affinis Muscle 56.7 ± 9.1 61.7 ± 16.5 47.3 ± 4.7 20.3 ± 14.4
Liver 577.7 ± 270.8 568.3 ± 290.8 835.3 ± 512.6 295.7 ± 205.5
Gills 286.3 ± 117.0 359.3 ± 71.0 290.7 ± 54.8 88.3 ± 61.2
Saurida tumbil Muscle 43.3 ± 8.4 35.3 ± 0.6 34.5 ± 4.9 36.0 ± 1.0
Liver 198.7 ± 64.3 176.7 ± 38.1 145.5 ± 37.5 130.7 ± 14.0
Gills 172.0 ± 7.5 167.0 ± 4.6 147.0 ± 4.2 159.7 ± 18.5

Ca

Rastrelliger kanagurta Muscle 0.78 ± 1.14 0.08 ± 0.01 0.07 ± 0.02 0.06 ± 0.05
Liver 0.10 ± 0.10 0.09 ± 0.03 0.06 ± 0.01 0.05 ± 0.04
Gills 4.02 ± 3.47 7.11 ± 0.55 7.16 ± 1.41 5.00 ± 4.33
Euthynnus affinis Muscle 0.05 ± 0.02 0.10 ± 0.08 0.07 ± 0.02 0.02 ± 0.01
Liver 0.16 ± 0.05 0.18 ± 0.13 0.79 ± 0.71 0.02 ± 0.02
Gills 8.87 ± 0.98 7.79 ± 0.52 6.79 ± 1.01 2.96 ± 2.05
Saurida tumbil Muscle 0.69 ± 0.91 0.15 ± 0.07 0.06 ± 0.07 0.22 ± 0.10
Liver 0.08 ± 0.06 0.05 ± 0.03 0.04 ± 0.04 0.03 ± 0.01
Gills 6.46 ± 0.83 5.49 ± 0.33 3.93 ± 3.48 5.04 ± 0.59

K

Rastrelliger kanagurta Muscle 1.33 ± 0.41 2.13 ± 1.17 2.54 ± 0.88 1.80 ± 1.56
Liver 1.15 ± 1.00 1.63 ± 0.38 1.85 ± 0.48 1.05 ± 0.91
Gills 1.30 ± 0.75 0.82 ± 0.03 0.79 ± 0.08 0.54 ± 0.47
Euthynnus affinis Muscle 2.26 ± 0.10 2.08 ± 0.42 2.62 ± 0.10 1.42 ± 0.99
Liver 1.81 ± 0.18 1.90 ± 0.39 1.79 ± 0.23 1.22 ± 0.84
Gills 0.55 ± 0.20 0.67 ± 0.17 0.65 ± 0.13 0.50 ± 0.34
Saurida tumbil Muscle 2.85 ± 0.29 2.35 ± 0.41 1.71 ± 1.50 2.81 ± 0.14
Liver 5.84 ± 7.66 1.19 ± 0.24 0.65 ± 0.60 1.30 ± 0.19
Gills 0.99 ± 0.08 1.02 ± 0.08 0.60 ± 0.52 1.16 ± 0.22

Mg

Rastrelliger kanagurta Muscle 0.62 ± 0.43 BDL BDL BDL
Liver BDL BDL 0.72 ± 0.50 0.76 ± 0.53
Gills 0.83 ± 0.58 1.77 ± 0.06 2.50 ± 0.26 1.63 ± 1.46
Euthynnus affinis Muscle 0.66 ± 0.46 0.53 ± 0.37 BDL BDL
Liver BDL BDL 0.72 ± 0.50 BDL
Gills 0.89 ± 0.62 1.03 ± 0.91 1.61 ± 1.12 0.67 ± 0.46
Saurida tumbil Muscle BDL BDL BDL BDL
Liver 0.67 ± 0.46 0.74 ± 0.66 0.64 ± 0.45 0.72 ± 0.50
Gills 0.78 ± 0.54 1.10 ± 1.05 0.83 ± 0.72 0.67 ± 0.46

BDL: below detection limit.
Concentration of As, Cd, Cu, Fe, Mn, Se and Zn are in ppm.
Concentration of Ca, K and Mg are in %.

fig 4

Figure 4: Spectra of muscle tissue of Rastrelliger kanagurta collected from Visakhapatnam (a), Kakinada (b), Pudimadaka (c) and Bheemili (d)

Table 2: Correlation between elements present in tissues of Rastrelliger kanagurta


As

Cd Cu Fe Mn Se Zn Ca K

Mg

As

1

Cd

-0.537

1

Cu

-0.499

0.555

1

Fe

-0.882

-0.011 0.746

1

Mn

0.508

-0.833 -0.259

-0.023

1

Se

-0.535

0.473 0.505 0.936 -0.716

1

Zn

0.770

-0.506 -0.653 0.721 0.330 0.485

1

Ca

0.736

-0.861 -0.755 -0.055 0.820 -0.525 0.361

1

K

-0.290

0.408 0.721 -0.238 -0.748 0.002 -0.453 -0.700

1

Mg

1

-0.643 -0.963 -0.351 0.785 -0.923 -0.094 0.886 -0.718

1

Table 3: Correlation between elements present in tissues of Euthynnus affinis


As

Cd Cu Fe Mn Se Zn Ca K

Mg

As

1

Cd

0.192

1

Cu

0.610

0.519

1

Fe

0.284

0.532 0.944

1

Mn

-0.660

0.196 -0.929 0.398

1

Se

0.564

0.864 0.571 0.338 -0.405

1

Zn

0.558

0.705 0.708 0.609 -0.060 0.888

1

Ca

-0.496

-0.295 -0.345 0.087 0.796 -0.169 0.037

1

K

0.134

0.522 -0.066 -0.148 -0.582 0.215 -0.027 -0.789

1

Mg

-0.253

0.205 -0.101 0.815 0.910 -0.060 0.162 0.677 -0.569

1

Table 4: Correlation between elements present in tissues of Saurida tumbil

As

Cd Cu Fe Mn Se Zn Ca K

Mg

As

1

Cd

-0.140

1

Cu

0.889

0.832

1

Fe

0.531

0.503 0.873

1

Mn

0.254

-0.853 -1.000 -0.367

1

Se

0.555

0.510 0.547 0.660 -0.498

1

Zn

0.839

-0.241 0.463 0.546 0.533 0.678

1

Ca

0.080

-0.643 0.382 -0.487 0.934 -0.407 0.450

1

K

-0.010

0.628 0.015 0.023 -0.557 0.562 -0.090 -0.431

1

Mg

0.008

-0.429 -0.501 -0.483 0.311 -0.327 0.031 0.548 -0.271

1

From the evaluated results that displayed in the Table 1, comprehensively one can draw the following statements:

  1. As expected, accumulation levels of heavy metals namely arsenic and cadmium belonging to Visakhapatnam fishing harbour are higher relative to other places indicating higher pollution levels as commercial activities and anthropogenic garbage discharge are more than other places leading to more exposure to pollution
  2. In the case of nutritional elements such as copper (Cu) and iron (Fe) concentration levels are found to be more in the fish species collected from Kakinada fishing harbour followed by Pudimadaka (Saurida tumbil and Rastrelliger kanagurta for Cu and Fe respectively).
  3. Se, Zn and Ca contents were found in higher concentrations among the fish species belonging to Visakhapatnam fishing harbour followed by Pudimadaka
  4. Detection of Mn, K and Mg seems to be higher in the species related to Pudimadaka when compared with the other places.
  5. Fish species belonging to Bheemili are reflecting no nutritional elements higher relative to other places.
  6. Though the commercial activities due to domestic transport and international export of goods besides thrown of garbage by local habitants are higher, some of the nutritional elements and antioxidants at Kakinada fishing harbour and Visakhapatnam fishing harbour found to be higher, indicating the need to develop effective pollution management systems at these places.

Detection of Heavy Metals

Arsenic

Arsenic (As) is widely distributed in the environment as a result of anthropogenic and naturally occurring processes. This is a trace element that is potentially toxic to all living beings; however, its toxicity varies based on its different chemical forms [20]. The United States Food and Drug Administration [21] reported that seafood products including fish constitute 90% of overall exposure to arsenic. Accumulated arsenic concentration among various tissues of the selected species of fish taken from the above-mentioned locations are analysed for monitoring the level of pollution and the obtained concentrations found to vary between 2.7 ± 2.1 ppm to 45.5 ± 2.1 ppm. The highest concentration is detected in the liver tissue of Euthynnus affinis species collected from Visakhapatnam. However, the arsenic level is below the limit of detection relating to the muscle tissue of Rastrelliger kanagurta belong to all the locations. It is also clear that the concentration of all the tissues pertaining to Rastrelliger kanagurta related to Bheemili is below the detection limit. The Australia New Zealand Food Standards Code [22] states that the maximum allowable concentration of As is 2.0 mg/kg ww. The species Euthynnus affinis was collected in Visakhapatnam (assuming that the muscle is the only edible part) exceeded the ANZFA recommended value (9.6 mg/kg) dw (assumed to be 79% moisture). The EPA has established 1.3 mg/kg of arsenic in fresh water fish tissue as the basis for protecting human health [23]. The maximum concentration of As in fish according to Brazilian legislation is 1.0 mg/kg [24]. Sharif et al. [25] investigated the concentration of arsenic in tropic marine fish species from Bangladesh with reported values varied between 2.84 and 3.92 mg/kg dw.

Cadmium

Cadmium also considered as one of the toxic elements that could present in fish organs at higher concentrations [26]. It leads to chronic toxicity although it occurs at a concentration level of 1 mg/kg [27]. Christensen et. al [28] considered cadmium to be potentially more hazardous than other metals. The National Health and Medical Research Council (ANHMRC) standard for Cd concentration in seafood products in Australia is 2.0 mg/kg [29], while the authorities of Western Australia suggested 5.5 mg/kg concentration for Cd [30]. Under Spanish legislation Cd concentrations are limited to 1 mg/kg [31]. The maximum concentration of Cd for fish laid down by Brazilian legislation amounts to 1.0 mg/kg [32]. The concentration of Cd in fish samples in this study varies from 11.7 ± 8.1 ppm to 42.3 ± 11.2 ppm. The liver of Euthynnus affinis that collected from Visakhapatnam is found to show the highest level of cadmium. Based on the results obtained in the present experimental study; it can be understood that the observed Cd in fishes collected from all the four locations exceeds the aforementioned standard values and longer period of Cd accumulation in fishes may be hazardous to health.

Detection of NUTRITIONAL Elements

Copper

Copper is vital and necessary for synthesizing of haemoglobin [33]. Its deficiency may cause disorders in blood and nervous system in adults [34]. However, high consumption of Cu would result in adverse health effects [35]. The observed concentration of Cu in the present study ranges from 6.0 ± 4.4 ppm to 81.3 ± 31.5 ppm, however, it was found to be less than the limit of detection in muscle tissues of Rastrelliger kanagurta and Saurida tumbil related to all the three locations of the present study. The liver tissue of Euthynnus affinis that belong to Kakinada is found to have the highest level of Cu. The maximum permitted Cu limit proposed by FAO and ANHMRC is 30 mg/kg fresh weight [36,37]. The UK Food Standards Committee report states that the Cu content of food must be less than 20 mg/kg wet weight [38]. Legislation has also been passed in some countries about the maximum permissible Cu concentration in meals. For instance, Turkish law has set the Cu concentration as 5 mg/kg, while Spanish law suggested the concentration of 20 mg/kg ww [39]. The Australian Food Standard Code has set a maximum level of Cu to 10 mg/kg ww [40]. Taking into account the water content of 79% of fish muscles, no species studied exceeded prescribed limits of different agencies (assuming the muscle as the only edible part).

Iron

Iron deficiency frequently results with anaemia causing reduced levels of working capacity besides impaired mental development. The recommended daily allowance for children and adults (males and females) is 11 mg/day and 18 mg/day, respectively [41]. The concentration levels of iron in the present study ranges in between 13.3 ± 9.2 ppm to 4047.7 ± 534.5 ppm. The highest concentration of Fe is found in gills of Euthynnus affinis that procured from Pudimadaka. Earlier Karadede et al. [42] and Chale [43] observed values of iron concentration are 200.86 µg/g and 125 µg/g respectively. Reported these data are exhibiting fair agreement with the values of Iron observed in the present studies. The values for iron reported by Tariq et al. [44] and Asharaf et al. [45] are 0.782 to 4.217 and 1.550 to 6.715 µg/g respectively. These values are lower than the present values of iron. Iron is a mineral and essential for life. An adequate dietary intake of iron is extremely important in reducing anaemia. The deficiency of iron occurs when there is a high demand for it, e.g., while growing, in pregnancy periods and during menstrual loss, the intake usually is not adequate or contains minerals that prevent iron from being absorbed [46]. The low bioavailability of iron is regarded as a major factor leading to its deficiency in many countries.

Manganese

Manganese is used in iron alloys, electric coils, dry battery cells and glass ceramics etc. which may be regarded as the mains sources of pollution of the manganese. While manganese is a low-toxicity element, it has significant biological interest. There are no established manganese limits in the fish samples. The obtained Mn concentration in the present work ranges in the range 15.0 ± 10.4 ppm to 104.5 ± 53.0 ppm. The highest level of Mn is found in gills of Euthynnus affinis that collected from Pudimadaka while the lowest concentration found be in muscle tissue of Saurida tumbil procured from Pudimadaka. However, it is not detected in muscle tissue of Euthynnus affinis that collected from Visakhapatnam, Kakinada and Pudimadaka. Manganese can be present in any body tissue that has contributed to the functioning of many organic systems. Manganese is required to support normal immune function, to regulate blood glucose levels and cellular energy, digestion, reproduction, bone growth and even as a cellular antioxidant [47]. Although elevated levels of Mn can cause toxicity in humans, no RDA was established. The US National Academy of Sciences [48] determined adequate intakes (AI) of Mn as 2.3 and 1.8 mg/day for adult males and females respectively. The observed Mn concentration is consistent with the values for the fish collected from the Gumti River in Bangladesh [49].

Selenium

Selenium is an essential trace element for living organisms as a nutrition. It is known as an antioxidant and protection agent against toxic elements, heart disease and cancer. Selenium deficiency may cause multiple pathologic conditions. However, depending upon the concentration, it may also become toxic to humans, certain plants and animals [50]. In the present study, the observed concentration of Se the analysed samples ranged from 1.5 ± 0.7 ppm to 26.7 ± 20.4 ppm. However, the concentration of Se is below the detection limit in the muscle tissue of Rastrelliger kanagurta and Saurida tumbil that collected from Visakhapatnam, Kakinada and Bheemili. The RDA for adult men and women is 55 mg per day [51]. In Brazil, no maximum level of Se in fish is established.

Zinc

Being heavy metal, Zn has the tendency to bioaccumulate in fatty tissue of marine fish and known to impact their reproductive physiology [52]. Chronic exposure to Zn and Cu has been reported as related to Parkinson’s disease [53] and they may act on their own or together for a period of time to cause the illness [54]. The concentration of Zn in the muscle tissue of Rastrelliger kanagurta is much higher than the other two species collected from all the four locations of the present study. The liver of Euthynnus affinis that belongs to Pudimadaka is found to have highest level of Zn while the lowest concentration observed in muscle tissue of Euthynnus affinis procured from Bheemili. The quantity of Zn found in all fish samples is well below 1000 mg/kg standard established by ANHMRC [55,56] and WHO [56]. Zinc is a significant trace element of human nutrition and in a wide range of biochemical functions of human metabolism. The deficiency of Zn in humans leads to many disorders, but excessive consumption can cause adverse effects [57]. The RDA for Zn intake is 11 mg/day and 8 mg/day for men and women up to age 19, respectively, and Tolerable Upper Level of Intake (UL) is 40 mg/d for that age group [58].

Calcium

Ca is extremely essential to human body and is required to build teeth and healthy bones. It affects the coagulation of the body, stimulates muscles and nervous systems; works as a cofactor of vitamin D and also for the functioning of the parathyroid gland. Muscles cannot contract without calcium. Calcium is vital to regulate heart rate, maintains normal blood pressure and allows the control of electrical impulses in the brain [59]. The concentration of Ca in the present study ranges in between 0.02 ± 0.01 %. to 8.87 ± 0.98 %. The highest concentration of Ca is found in the gills of Euthynnus affinis that collected from Visakhapatnam while the lowest concentration observed in the muscle and liver tissues of Euthynnus affinis procured from Bheemili. The recommended levels of individual intake of Ca for adults (19 y to 50 y) is 1000 mg/d and tolerable upper intake level is 2.5 g/d. [60].

Potassium

Potassium (K) is very important for the cells, and without it one would not be able to survive. It is mainly found in intracellular fluids. Potassium stimulates neural impulses; muscular contractions and is significant for maintaining osmotic pressure. Potassium regulates the acid-alkaline balance of the body, stimulates the functioning of the kidneys and adrenals, and also helps in the conversion of glucose into glycogen. It is necessary for biosynthesis of proteins. Potassium is the third most abundant mineral in the human body [59]. The recommended mean intake of K is 2300 mg/day in adult females and 3100 mg/day in adult males. The concentration of K in the present study lies in the range 0.50 ± 0.34 % to 5.84 ± 7.66 %. The concentration of K is found highest in the liver tissue of Saurida tumbil collected from Visakhapatnam and lowest concentration found in the gills of Euthynnus affinis that brought from Bheemili.

Magnesium

Magnesium is required for over 300 bio-chemical reactions in human body. It helps in the maintenance of normal nerve and muscle functions, supports the healthy immune system, maintains a stable heart rate, and is useful for bones to stay strong. It is also required to adjust blood sugar levels. It helps to produce energy and protein. In the present study, the Mg concentration ranges from 0.53 ± 0.37 % to 2.50 ± 0.26 %. The highest concentration is found in the gills of Rastrelliger kanagurta that belong to Pudimadaka while the lowest concentration is obtained in the muscle tissue of Euthynnus affinis that collected from Kakinada. The recommended levels of individual intake of Mg for males (19-30 y) is 400 mg/d; above 31 y allowed to take 420 mg/d; in case of females (19-30 y) it is 310 mg/d while beyond 31 y 320 mg/d may be taken up. The tolerable upper intake level is 350 mg/d for all the adults beyond 19 y.

Statistical Analysis

The Pearson correlation coefficients among the heavy metals observed related to Rastrelliger kanagurta, Euthynnus affinis and Saurida tumbil were calculated and shown in Tables 2, 3 and 4 respectively. A strong correlation between any two elements suggests a common absorption mechanism, or a common source and may also be a lack of metabolism regulation. For Rastrelliger kanagurta, arsenic (As) found to show significant positive correlation with Mg (1), Ca (0.736) Zn (0.77) and strong negative correlation with Fe (-0.882). Similarly, Cd also showing strong negative correlation with Ca (-0.861) and Mn (-0.833). Copper is exhibiting positive correlation with Fe (0.746) and K (0.721) while indicating strong negative correlation with Mg (-0.963) and Ca (-0.755). Fe showed strong positive correlation with Se (0.936) and Zn (0.721). Mn indicating strong positive correlation with Ca (0.820) and Mg (0.785) and moderate negative correlation with K (-0.748) and Se (-0.716). Se showed strong negative correlation with Mg (-0.923). Ca found to show strong positive correlation with Mg (0.886) and moderate negative correlation with K (-0.7). K exhibits moderate negative correlation with Mg (-0.718). For Euthynnus affinis, cadmium (Cd) indicating strong positive correlation with Se (0.864) and Zn (0.705). Cu showed strong positive correlation with Fe (0.944) and Zn (0.708) and strong negative correlation with Mn (-0.929). Fe exhibited strong positive correlation with Mg (0.815). Mn indic      ating strong positive correlation with Mg (0.910) and Ca (0.796). Se showed strong positive correlation with Zn (0.888) while Ca exhibited moderate negative correlation with K (-0.789).

In the case of Saurida tumbil, strong positive correlation has been obtained between As-Cu (0.889), As-Zn (0.839), Cd-Cu (0.832), Cu-Fe (0.873), Mn-Ca (0.934) and a strong negative correlation also been observed between Cd-Mn (-0.853) and Cu-Mn (-1).

The results obtained through the statistical analysis are shown in Tables 2-4 for the fishes Rastrelliger kanagurta, Euthynnus affinis, Saurida tumbil respectively. Based on the linkages/association of heavy metals with the nutritional elements that observed in this correlation studies, the following statements can be made for the interpretation of observed data.

  1. The observed arsenic (As) concentration of Rastrelliger kanagurta, Euthynnus affinis and Saurida tumbil is beyond the threshold value and strongly assosiated with nutritional elements Mg, Cu and Zn. Cadmium (Cd) is also associated with Mn, Ca, Se and Cu. So, these heavy metals toxicological impact not only show directly but also affect indirectly through the nutritional elements on consumers.
  2. Among the three fishes studied in the present investigations, As is associated significantly showing positive correlation with the nutritional elements namely Zn and Cu in the Saurida tumbil fish species and Mg in the case of Rastrelliger kanagurta. Some nutritional elements such as Fe, Se, Mn etc. found to show positive correlation with arsenic in one fish species while those elements exhibiting negative correlation or assosication exhibiting antagonish behaviour in the other fish species. This type of behaviour may be understood on the lines of physiology and metabolic system of respective fish species. Hence this type of results show indirect effect on consumers by the nutritional elements due to the As and Cd contents.
  3. Copper (Cu) is showing positive correlation with iron (Fe) and negative association with Mn in all the three fishes studied in the present studies. Similarly Mn is exhibiting positive correlation with calcium (Ca) and Mg in all the fishes, further Ca also found to show positive association with Mg for all the fish species.
  4. Interestingly important nutritional elements found to reflect useful behaviour with the presence of them relating with one another in all the fishes.

Conclusion

Concentrations of ten elements (As, Cd, Cu, Fe, Mn, Se, Zn, Ca, K and Mg) are quantified in the muscle, liver and gill tissues of Rastrelliger kanagurta, Euthynnus affinis and Saurida tumbil collected from Visakhapatnam harbour, Kakinada harbour, Pudimadaka and Bheemili. There is a clear spatial variation in the concentration of observed elements related to the fish species/samples collected from different locations. In the present study, significant differences in elemental concentrations have been observed in three fish species and these may be related to different accumulation patterns of the species besides anthropogenic garbage, industrial effluents, variation in local climatic conditions that show impact on the various elements/metals’ accumulation in water, which in turn might enter into fish organs. The evaluated results are showing the higher levels or concentrations of As and Cd accumulation beyond the threshold limits of them. However, exposure is a function of dietary habits of consumers and continued exposure to these heavy elements can lead to adverse effects.

Acknowledgment

The authors would like to thank DST-SERB, New Delhi for the financial support in the form of a project.

Conflicts of Interest

The authors do not have any relevant financial or non-financial competing interest.

References

  1. Amal H, Azza K (2014) Determination of metals in tuna species and bivalves from Alexandria, Egypt. The Egyptian Journal of Aquatic Research 40: 9-17.
  2. Afonso C, Lourenco HM, Cardoso C, Bandarra NM, Carvalho ML, et al. (2013) From fish chemical characterization to the benefit- risk assessment-part A. Food Chem 137: 99-107. [crossref]
  3. Cahu C, Salen P, Lorgeril M de (2004) Farmed and wild fish in the prevention of cardiovascular diseases: assessing possible differences in lipid nutritional values. Nutrition, Metabolism and Cardiovascular Diseases 14: 34-41. [crossref]
  4. Guérin T, Sirot V, Volatier JL, Leblanc JC (2007). Organotin levels in seafood and its implications for health risk in high-seafood consumers. Science of the Total Environment 388: 66-77. [crossref]
  5. Altundag H, Dundar MS (2009) Determination of thallium after preconcentration on amberlite IR-120 by ICP-MS. Fresenius Environmental Bulletin 18: 98-101.
  6. Aydemir F, Altundag H, Imamoglu M (2012) Removal of Cr (VI) from aqueous solution by hazelnut husk carbon. Fresenius Environmental Bulletin 21: 3589-3594.
  7. Ozparlak H, Arslan G, Arslan E, (2012) Determination of some metal levels in muscle tissue of nine fish species from Beys,ehir Lake, Turkey. Turkish Journal of Fisheries and Aquatic Sciences 4: 761-770.
  8. Dundar MS, Altundag H (2002) Heavy metal determinations of house dusts in Adapazari City, Turkey after Earthquake. Trace Elements and Electrolytes 19: 55-58.
  9. Altundag H, Dundar MS, Dogancı S, Celik M, Tuzen M (2013) The use of a sequential extraction procedure for heavy metal analysis of house dusts by atomic absorption spectrometry. Journal of AOAC International 96: 166-170.
  10. Celik U, Oehlenschlager J (2007) High contents of cadmium, lead, zinc and copper in popular fishery products sold in Turkish supermarkets. Food Control 18: 258-261.
  11. Vitek T, Spurny P, Mares J, Zokova A (2007) Acta Vet. Brno 76.
  12. Foran JA (1990) Toxic substances in surface waters. Environ Sci Technol 24:604-608.
  13. Yilmaz F, Ozdemir N, Demirak A, Tuna AL (2006) Heavy metal levels in two fish species Leuciscus cephalus and Lepomis gibbosus. Food Chem 100: 830-835.
  14. Khan B, Hizbullah K, Said M, Tariq K (2012). Heavy metals concentration trends in three fish species from Shah Alam River (Khyber Pakhtunkhwa Provine, Pakistan). Journal of Natural and Environmental Sciences 3: 1-8.
  15. Rajeshkumar S, Liu Y, Zhang X, Ravikumar B, Bai G, et al. (2008) Studies on seasonal pollution of heavy metals in water, sediment, fish and oyster from the Meiliang Bay of Taihu Lake in China. Chemosphere 191: 626-638.
  16. Chovanec A, Hofer R, Schiemer F (2003) Chapter 18 fish as bioindicators, in: trace metals and other contaminants in the environment. Elsevier, pg: 639-676.
  17. Alhashemi AH, Sekhavatjou MS, Kiabi BH, Karbassi AR (2012). Bioaccumulation of trace elements in water, sediment, and six fish species from a freshwater wetland, Iran. Microchemical journal 104: 1-6.
  18. Cot-Committee on Toxicology (2004), Advise on fish consumption: Benefits and risks. Food standards Agency and the Department of Health. Norwich, UK.
  19. Paul S, Joseph D, Majumdar M (2021) Health risk assessment of Macro, Trace-elements and heavy metal in various Indian Antidiabetic Polyherbal formulations. Sci. Pollut. Res. 28: 40929-40937. [crossref]
  20. Devesa V, Vélez D, Montoro R (2008). Effect of thermal treatments on arsenic species contents in food. Food and Chemical Toxicology 46: 1-8. [crossref]
  21. USFDA (1993) Guidance document for arsenic in shellfish (pg: 25-27). Washington, DC: US Food and Drug Administration.
  22. ANZFA (2011) Australian and New Zealand Food Standards Code, Standard 1.4.1- Contaminants and Natural Toxicants (F2011C00542).
  23. Burger J, Gochfeld M (2005) Heavy metals in commercial fish in New Jersey. Environmental Research, 99: 403-412. [crossref]
  24. ANVISA (1998) Agência Nacional de Vigilância Sanitária. Portaria Ns.
  25. Sharif AKM, Alamgir M, Krishnamoorthy KR, Mustafe AI (1993b) Determination of Arsenic, Mercury, Selenium and Zinc in Tropical Marine Fish by Neutron Activation. Journal of Radioanalytical and Nuclear Chemistry 170: 299-307.
  26. Türkmen M, Türkmen A, Tepe Y, Töre Y, & Ates A (2009). Determination of metals in fish species from Aegean and Mediterranean Seas. Food Chemistry 113s.
  27. Friberg L, Piscator M, Nordberg Gs (1971). Cadmium in the Environment. Cleveland, Ohio: The Chemical Rubber Co, Press.
  28. Christensen FC, Olson EC (1957) Cadmium poisoning; report of a fatal case, with discussion of pathology and clinical aspects. Archives of Industrial Health 16: 8-13. [crossref]
  29. Plaskett D, Potter IC (1979). Heavy metal concentrations in the muscle tissue of 12 species of teleost from Cockburn Sound, Western Australia. Australian Journal of Marine and Freshwater Research 30: 607-616.
  30. Demirak A, Yilmaz F, Tuna AL, Ozdemir N (2006) Heavy metals in water, sediment and tissues of Leciscuscephalus from a stream in southwestern Turkey. Chemosphere 63: 1451-1458. [crossref]
  31. ANVISA (1998) Agência Nacional de VigilânciaSanitária. Portaria N.
  32. Sivaperumal P, Sankar TV, Nair PGV (2007). Heavy metal concentrations in fish, shellfish and fish products from internal markets of India vis-a-vis international standards. Food Chemistry 102: 612-620.
  33. Dabbaghmanesh H, Salehi NM, Siadatan J, Omrani GR (2011). Copper concentration in a healthy urban adult population of Southern Iran Mohammad. Biological Trace Element Research 144: 217-224. [crossref]
  34. Gorell JM, Johnson CC, Rybicki BA, Peterson EL, Kortsha GX, et al. (1997) Occupational exposures to metals as risk factors for Parkinson’s disease. Neurology 48: 650-658. [crossref]
  35. Bebbington GN, Mackay NJ, Chvojka R, Williams RJ, Dunn A, et al. (1977). Heavy metals, selenium and arsenic in nine species of Australian commercial fish. Australian Journal of Marine and Freshwater Research 28: 277-286.
  36. Dural M, Goksu MZL, Ozak AA (2007) Investigation of heavy metal levels in economically important fish species captured from the Tuzla lagoon. Food Chemistry 102: 415-421.
  37. Cronin M, Davies IM, Newton A, Pirie JM, Topping G, et al. (1998). Trace metal concentrations in deep sea fish from the North Atlantic. Marine Environmental Research 45: 225-238.
  38. Demirak A, Yilmaz F, Tuna AL, Ozdemir N (2006) Heavy metals in water, sediment and tissues of Leciscuscephalus from a stream in southwestern Turkey. Chemosphere 63: 1451-1458. [crossref]
  39. Alam MGM, Tanaka A, Allinson G, Laurenson LJB, Stagnitti F, et al. (2002) A comparison of trace element concentrations in cultured and wild carp (Cyprinus carpio) of Lake Kasumigaura, Japan. Ecotoxicology and Environmental Safety 53: 348-354. [crossref]
  40. Schümann K, Ettle T, Szegner B, Elsenhans B, Solomons NW (2007). On risks and benefits of iron supplementation recommendations for iron intake revisited. Journal of Trace Elements in Medicine and Biology 21. [crossref]
  41. Karadede H, Oymak, SA, Ünlü E (2004) Heavy metals in mullet, Liza abu, and catfish, Silurustriostegus, from the Atatürk Dam Lake (Euphrates), Turkey. Environ. Int. 2004, 183–188.
  42. Chale FMM (2002) Trace metal concentrations in water, sediments and fish tissue from Lake Tanganyika. Total Environ 299: 115-121. [crossref]
  43. Tariq J, Jaffar M, Ashraf M (1994) Trace metal concentration, distribution and correlation in water, sediment and fish from the Ravi River, Pakistan. Res. 19: 131-139.
  44. Ashraf M, Tariq J, Jaffar M (1991) Contents of trace metals in fish, sediment and water from three freshwater reservoirs on the Indus River, Pakistan. Res. 12: 355-364.
  45. Lynch SR, Baynes RD (1996) Deliberations and evaluations of the approaches, endpoints and paradigms for iron dietary recommendations. American Institute of Nutrition 2404S, 2409S.
  46. Aschner J, Aschner M (2005). Nutritional aspects of manganese homeostasis. Molecular Aspects of Medicine 26: 353-362. [crossref]
  47. National Academy of Sciences (2001) Dietary Reference Intakes for vitamin A, vitamin K, arsenic, boron, chromium, copper, iodine, iron, manganese, molybdenum, nickel, silicon, vanadium, and zinc. A report of the panel on micronutrients, subcommittees on upper reference levels of nutrients and of interpretation and use of dietary reference intakes, and the standing committee on the scientific evaluation of dietary reference intakes. Washington DC: National Academy Press.
  48. Amin MN, Begum A, Mondal MGK (2011) Trace element concentrations present in five species of freshwater fish of Bangladesh. Bangladesh journal of scientific and industrial research 46: 27-32.
  49. Al-Saleh I (2000). Selenium status in Saudi Arabia. Journal of Trace Elements in Medicine and Biology 14.
  50. Institute of Medicine (2001) Dietary reference intakes for vitamin C, vitamin E, selenium, and carotenoids. Food and Nutrition Board. Washington, DC: The National Academies Press.
  51. Ghosh BB, Mukhopandhyay MK, Bagchi MM (1985). Proc. National Seminar on Pollution Control and Environmental Management (pg: 194-199).
  52. Gorell JM, Johnson C C, Rybicki BA, Peterson EL, Kortsha GX, et al. (1997). Occupational exposures to metals as risk factors for Parkinson’s disease. Neurology 48: 650-658. [crossref]
  53. Prasad AS (1983) The role of Zinc in gastrointestinal and liver disease. Clinics in Gastroenterology 12: 713-741. [crossref]
  54. Bebbington GN, Mackay NJ, Chvojka R, Williams RJ, Dunn A, et al. (1977). Heavy metals, selenium and arsenic in nine species of Australian commercial fish. Australian Journal of Marine and Freshwater Research 28: 277-286.
  55. Cliton HI, Ujagwung GU, Michael H (2008) Trace metals in the tissues and shells of TympanotonusFuscatus var. Radula from the Mangrove Swamps of the Bukuma Oil Field, Niger Delta. European journal of Scientific Research 24: 468-476.
  56. Scherz H, Kirchhoff E (2006). Trace elements in foods: zinc contents of raw foods – a comparison of data originating from different geographical regions of the world. Journal of Food Composition and Analysis 19.
  57. Institute of Medicine (2001) Dietary reference intakes for vitamin C, vitamin E, selenium, and carotenoids. Food and Nutrition Board. Washington, DC: The National Academies Press.
  58. Garbunov AV, Lyapunov SM, Okina OI, Frontasyeva MV, Pavlov SS, Nuclear and related analytical techniques in ecology: Impact of geological factors on the balance of trace elements in the human organism.
  59. Allison A, Yates PhD, Rdsandra A, Schlicker PhD, Carol W, et al. (1998) Dietary Reference Intakes: The New Basis for Recommendations for Calcium and Related Nutrients, B Vitamins, and Choline. Journal of the American Dietetic Association. 98: 699-706. [crossref]