Abstract
In 15 parallel studies dealing sources of anxiety, public and private, separate groups of approximately 120 respondents each evaluated different combinations (vignettes) of messages about anxiety -provoking situations. The vignettes presented the nature of the situation, the effect on people, the effort to contain the problem, and the individual’s response to the situation. Each respondent evaluated 60 unique combinations of these vignettes, rating each vignette on a 9-point scale (1=Can deal with it.9= Cannot deal with it.) Data suggest that the basic level of anxiety is approximately the same across the 15 sources of anxiety, but that the elements, the messages dramatically differ in their respective abilities to drive or to reduce anxiety. Surprising, many of the so-called efforts to deal with the anxiety, especially from the sources outside one’s family (e.g., government, local hospitals, etc.) increased anxiety, rather than diminishing it. The database (Deal with It!) shows the contribution to insights and to the social record from databases of studies of social situations, created in a systematic manner according to experimental design of ideas (Mind Genomics.)
Introduction
Anxiety is a leitmotif of our times, with a popular and an academic, as well as an artistic literature virtually unfathomable. A sense of the vastness of our concern may be given by today’s arbiter of social internet, Google, which counts the number of available websites dealing with a topic. Table 1 presents Google Scholar hits for different topics dealing with anxiety. The table is sorted by number of hits. These topics constitute the 15 assessed in the Deal With It! set of Mind Genomics cartographies.
Table 1: Google Scholar hits for the topic coupled with ‘anxiety’. Data up to2003
|
Topic |
Hits as of 2003 |
|
| 1 | Relationships |
1,130,000 |
| 2 | Environment |
954,000 |
| 3 | Social Interactions |
413,000 |
| 4 | War |
372,000 |
| 5 | Sexual Failure |
145,000 |
| 6 | Lose Health |
116,000 |
| 7 | Aging |
111,000 |
| 8 | Failure of Health Care |
109,000 |
| 9 | Lose Income |
57,700 |
| 10 | Obesity |
56,300 |
| 11 | Infectious Disease |
40,500 |
| 12 | Phobias |
26,800 |
| 13 | Terrorism |
20,900 |
| 14 | Franken Food (Genetically modified) |
18,800 |
| 15 | Lose Assets |
18,000 |
Anxiety pervades our life. It is the bread and butter of psychologists and others in the helping professions.. It is the topic of numerous self-help websites. And it is something familiar to many of us. Anxiety comes in such variety that the sheer vastness of the topic suffices to make one anxious, just dealing with that unwieldly richness.
This paper deals with anxiety as a situation presented in text form to a respondent, instructed to rate the degree that she or he can ‘deal’ with the situation or cannot deal with the specific described situation. We avoid the general topic of ‘anxiety’ and present the topic as something with which a person can deal. That is, we make the situation somewhat concrete by particularizing the events.
The origin of these studies emerged from consumer research promoted at first by an ingredients company, McCormick & Company, in 2001, but with a focus on food, not anxiety. That early focus led to a set of 30 parallel studies in what makes people really desire a food, called naturally ‘Crave It!’ [1,2]. The success of Crave It! quickly led to several other series of so-called It! studies, focusing first on food, then on beverages, on good-for-you foods, and finally and snack foods.
The early focus on foods also sparked focus on the approach to study situations. The major study to emerge was the use of this It! approach to study the responses to anxiety provoking situations. Rather than dealing with topics that were positive, the effort was focused on understanding how the different aspects of an anxiety-producing situation drive the response of ‘Can deal with it (rating = 1).to. Cannot deal with it (rating = 9)’. This paper presents an extensive analysis of those data.
Since the early research in 2003, Mind Genomics has been applied to anxiety-relevant situations,, such as the anxiety of teens in a doctor’s office [3]; anxiety in social situations [4], anxiety about the toxicity of house plans [5], and anxiety in the midst of a crisis in the pharmaceutical industry [6] The hallmark of these studies is the disciplined deconstruction of the issues into messages, their recombination by experimental design, the analysis of the new combinations, and the emergence of insight data about how people make decisions using the information provided [7,8].
Combining Mind Genomics with Anxiety – A Step by Step Development of the It! Cartography
The easiest way to understand what Mind Genomics may contribute to the study of anxiety is through an experiment, or in this case 15 experiments, run simultaneously, with similar patterns of elements, and similar patterns of analysis [4]. We call these experiments ‘cartographies’ because they ‘map out a terrain’ rather than focus on affirming or falsifying a hypothesis in the tradition of the more typical hypothetico-deductive approach to science. That is, we search for patterns, for regularities, upon which hypotheses can be developed. In sum, Mind Genomics as we see below is ‘hypothesis-generating.’
Step 1 – Create the Raw Material
The basic input for the Mind Genomics study is a topic, followed by a set of questions presenting different aspects of that topic and ‘telling a story’, and finally each question giving a set of answers which provide specific information. These answers take the form of a stand-alone phrases. Later the actual test stimuli will comprise vignettes, combinations of these answers (but never the questions.) It is vital that the answers, the elements, be able to stand alone, and make sense.
Figure 1 presents the 15 studies. The viewpoint of an It! project or even a single Mind Genomics cartography that there may be important things in a topic, the precision of learning will not be increased by repeating the same experiment many times, producing precision. It is better to cover many different topics, even if the coverage is more error prone because the resources are more fruitfully expended studying different topics, not the same topic with more people.
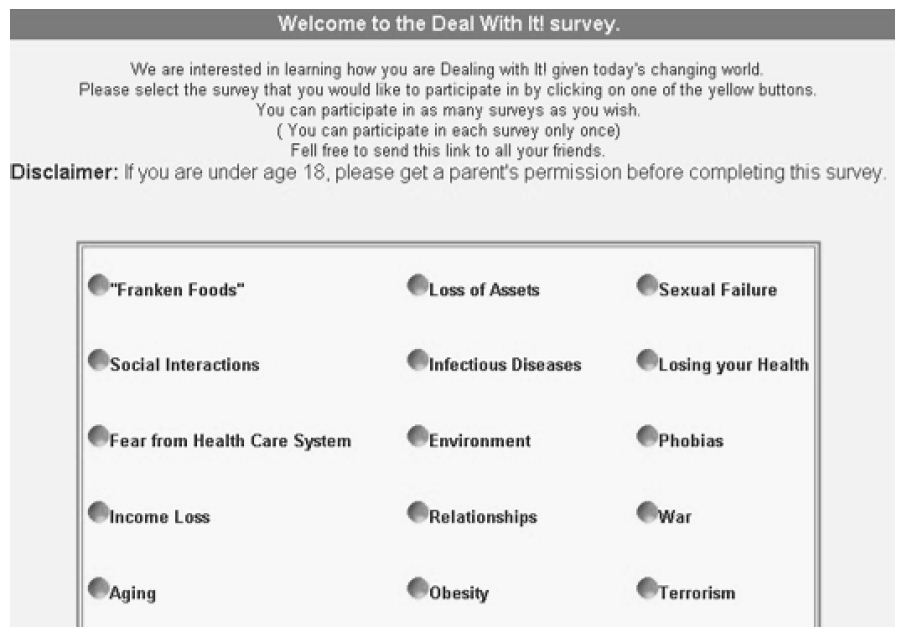
Figure 1: The 15 studies, shown by the 15 topics. The figure shows the ‘wall of choice.’ Respondents could see the available studies, choose one, and do the corresponding Mind Genomics study
Table 1 presents the three of the studies (Terrorism, Infectious Disease, Obesity). Table 1 shows the four questions, nine answers for each question, language and topic attempting to be parallel across the 15 studies. It was impossible to make the elements exactly parallel, since it was also vital to have the elements seem real and relevant.
Across the 15 studies and 36 elements per study, there were 540 elements. The 36 elements for a study were divided into the four questions. Within each question the types of elements were to be similar to each other across studies, although often this requirement some editing and wordsmanship to make the element both match the anxiety provoking situation, but be similar in form to the other elements of this type across the remaining 14 studies. Table 2 gives a sense of the 36 elements created for three parallel studies; terrorism, Infectious disease, and obesity, respectively
Table 2: Example of elements for three parallel studies; terrorism, infectious disease, and obesity
|
Terrorism |
Infectious disease |
Obesity | ||
| Question 1: What is happening? | ||||
| A1 | The media talking about potential terrorism acts… | The media talking about diseases that are spread by human contact or by the air… | The media talking about the increase in obesity… | |
| A2 | A bomb threat for a building that is a false alarm… | You have a dry cough and don’t feel so good… | You’ve added a few pounds… | |
| A3 | A bomb under your car… | You are getting a fever and don’t feel so good… | You’ve added a lot of extra weight…. | |
| A4 | Bombs blowing up in the middle of a building… | You have some red bumps on your skin and don’t feel so good… | You can’t take the weight off… | |
| A5 | Fire raging through a building… | Your feel really run down… | You can lose it….but you just can’t keep the weight off… | |
| A6 | Contamination of the food supply… | You have been on an airplane that just came from some place that has some known infectious diseases | People look at your body and judge you… | |
| A7 | A deadly disease like smallpox or anthrax let loose…. | You have to travel to a place that has some known infectious diseases | You just can’t control the eating… | |
| A8 | A Computer virus let loose that impacts your everyday businesses… | You know the disease has arrived in your country | You eat right, exercise, and still can’t keep the weight off… | |
| A9 | A dirty nuclear bomb set off … | You have to touch people that you know have some infectious disease | You are uncomfortable because of your weight doing what everyone does naturally… | |
| Question 2: Who is affected? | ||||
| B1 | In a non-populated area… | No one you know is affected… | You tell no one how you are affected… | |
| B2 | In a heavily populated area… | People you work with OR will be working with are affected… | People you work with are affected by your size… | |
| B3 | An area crowded with children… | Children are affected… | Your children are affected by your size… | |
| B4 | An area crowded with senior citizens… | Senior citizens are affected… | Your parents are affected by your size… | |
| B5 | An area filled with tourists… | Tourists are affected… | Strangers are affected by your size | |
| B6 | When you least expect it… | You never expected it to happen to you or someone close to you…. | You never expected it to happen to you or someone close to you…. | |
| B7 | During a Yellow alert… | People are getting sick in the location you have to travel to… | People around you are embarrassed… | |
| B8 | During an Orange alert… | Your health office warns you not to travel to this location… | People around you are so judgmental… | |
| B9 | During a Red alert… | The area you are traveling to is going to be or is quarantined | People around you don’t see you for who you are… | |
| Question 3: How do you react? | ||||
| C1 | You are all alone… and you feel helpless… | You think about it when you are all alone…and you feel so helpless | You think about it when you are all alone…and you feel so helpless | |
| C2 | You think about it, you just can’t stop thinking about it… and you feel uneasy…. | When you think about it, you just can’t stop…. | When you think about it, you just can’t stop…. | |
| C3 | You’d drive any distance to get away from it… | You’d drive any distance to get away from it… | You’d drive any distance to get away from it… | |
| C4 | You are scared … inside and out | You are scared … inside and out | You are scared … inside and out | |
| C5 | You experience it all … seeing, smelling, tasting | You experience it in all your senses… | You experience it in all your senses… | |
| C6 | All the stress just builds up… you feel overwhelmed | All the stress just builds up… you feel overwhelmed | All the stress just builds up… you feel overwhelmed | |
| C7 | You experience temporary memory loss because there’s just too much to take in…. | You experience temporary memory loss because there’s just too much to take in…. | You experience temporary memory loss because there’s just too much to take in…. | |
| C8 | While surrounded by family and friends…. | Family and Friends play a big role in your life… | Family and Friends play a big role in your life… | |
| C9 | At a special moment… in your life | At a turning point in your life…. | At a turning point in your life…. | |
| Question 4: Who or what can help ? | ||||
| D1 | You trust that God will keep you safe | You trust your God will help you get through this | You trust your God will help you get through this | |
| D2 | You believe that international cooperation in the United Nations will keep you safe | You believe Charities will help you get through this | You believe your doctor will help you get through this | |
| D3 | You think United Nations Forces will keep you safe | You believe whatever insurance you have will help you get through this | You believe talking to a therapist will help you get through this | |
| D4 | You believe that Homeland Defense will keep you safe | You trust that the government and the airports will stop this from entering your country | You believe talking to diet counselor will help you get through this | |
| D5 | You believe that the Center for Disease Control will keep you safe | You believe your Local Hospital will get you through this | You believe a plastic surgeon will help you get through this | |
| D6 | You think that your Local police will keep you safe | You trust your doctor will get you through this | You believe that the food industry will work to help you find the right foods to eat | |
| D7 | You think that your Local hospital will keep you safe | You believe your company will help you get through this | You believe work will help you get through this | |
| D8 | It’s important for the Media will keep you informed | It’s important for the Media to keep you informed | It’s important for the Media to keep you informed | |
| D9 | You need to contact your friends and family to make sure they are OK… | Your family and friends will help get you through this… | Your family and friends will help until you get through this… | |
Step 2: Create Vignettes according to an Experimental Design
The heart of Mind Genomics is the use of combinations of stimuli, these combinations indicated by the underlying design. The design itself is simply a shell, ensuring that the elements are statistically independent of each other (allowing for OLS, ordinary east squares regression), and that the elements are laid out in such a way that each element appears equally often, and is absent an equal number of times from the full set of vignettes.
With the 4×9 design, the most popular during the early years, 2000-2006, a total of 60 combinations, called hence vignettes, comprised at most one element from a question, but quite often one or two of the questions was deliberated not allowed to contribute an element. The benefit of the design is that is can be automatically populated simply by a replacement table. The researcher need not have to think about the statistically issues. Figure 2 shows an example of a vignette comprising four elements. By design some vignettes comprised four elements (one answer from each question), other vignettes comprised three elements (one of the for questions did not contribute an element), and still other vignettes comprised two elements (two of the four questions did not contribute an element.) Each element appeared equally often.
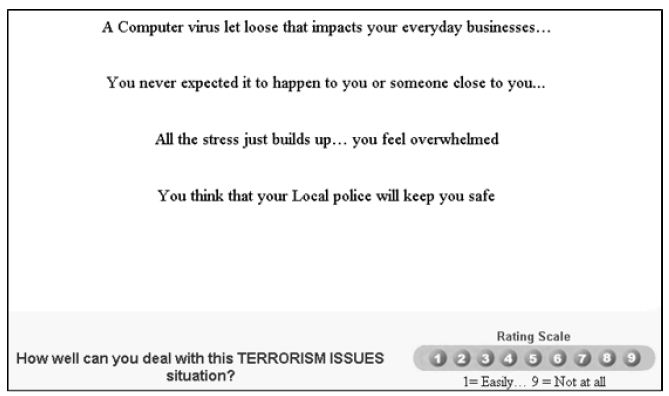
Figure 2: Example of a four-element vignette for Terrorism
Each respondent evaluated a unique set of vignettes. The uniqueness was established by a permutation scheme which kept the mathematical structure intact but simply permuted the elements. This produces 60 unique combinations for each respondent. The experimental designed was prescribed by a permutation approach [8,9], and automatically embedded in the technology.
The rationale for the incomplete experimental design is the downstream ability to perform an OLS (ordinary least squares) regression analysis on the data of each individual respondent. This is known as a within-subjects design. Were there even as few as one respondent, it would still be possible to create a model showing the number of rating points that could be attributed to each of the 36 elements. That property of individual-level modeling will become important for clustering the data together to create mind-sets, an important aspect of Mind Genomics
Figure 2 presents a sample vignette that the respondent was shown. The vignette is simple, comprising simply the elements prescribed by the underlying experimental design, these elements simply placed there without any effort to connect that. The rating scale appears at the bottom. Although many marketing professionals prefer to test concepts which are full, more polished, with better production value, the reality is that the focus is on the respondent’s evaluation of the different vignettes, and the discovery regarding which specific elements drive the response. It is counterproductive, in fact, to make the vignette ore dense, more connected. The respondent ends up wading through additional ‘stuff’ to get to the information. It is the information, not the connectives, which are importance, and as a consequence, the spare structure shown in Figure 2 is ideal. The respondent does not get fatigued.
Step 3: Acquire Respondents
The respondents were invited to participate by an online-panel provider, Open Venue LTD, headquartered in Toronto, but providing respondents in both Canada and the United States. The respondent was invited to the general study by Open Venue Ltd. The respondents who participated was led to the ‘wall of available studies.’ Studies whose quotas were filled (approximately 120 completed respondents) ‘disappeared’ from the wall, so only the available studies with incomplete quotas appear for the choice.
The respondent was allowed to pick any study. Once the respondent selected the study, the respondent was led to the appropriate website. The first slide was the orientation slide (Figure 3). The orientation slide provides very little information about the study. Rather, the slide describes the topic by a few words, moves into the rating scale, and states that all the vignettes differ from each other. This last statement, viz., no repeat vignettes, emerged from exit interviews, where respondents said that they felt they were evaluating the same vignettes The reality is that the respondents were evaluating the same elements, but different combinations of the elements.
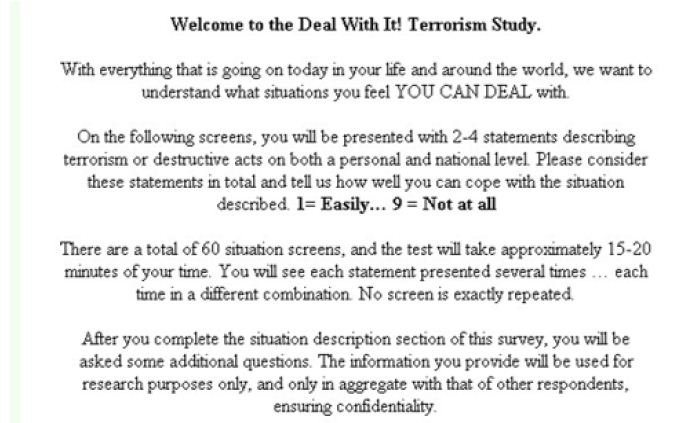
Figure 3: The orientation page at the start of each of the 15 Deal With It! studies. The only thing which changed from study to study is the name of the topic (Welcome to the Deal With It! Terrorism Study)
It is worth noting that the majority of Mind Genomics studies conducted during the past 25 years have been studies in which a third party, e.g., Open Venue Ltd., has used its panel. Respondents do not like to spend 10 minutes of their time unless they feel that their efforts are valuable, or unless there is a reciprocal arrangement of give/receive on both ends. The number of completes for a compensated study, here about 33%, is far greater than the number of completes were these studies to rely upon the donated time of respondents without compensation. No matter how interesting or exciting the study, most respondents really want ‘something’ in the way of compensation.
Step 4: Surface Analysis – How Many Respondents Participated vs. How Many Dropped Out?
The objective in this Mind Genomics It! study was to recruit approximately 120 respondents for each of the 15 studies, or approximately 1800 respondents. Figure 1 shows the ‘wall’. The respondent who participates could choose any of the studies available on the ‘wall.’ Without an artificial limitation, there would have been a preponderance of respondents choosing sexual failure, aging and war. To ensure an approximately equal number of respondents for each study, once the study reached about 120-125 completed respondents, the choice of the study disappeared. This strategy ensure the base sizes.
As part of the overall effort to balance the base size, the studies were launched at the same time, and the number of log-ins, as the number of completes were recorded on a daily basis for the first few days, and then done again after a three day hiatus. The rate of log-ins gives a sense of the interest in the topic. Figure 4 shows the cumulative number of log-ins over a two week period.
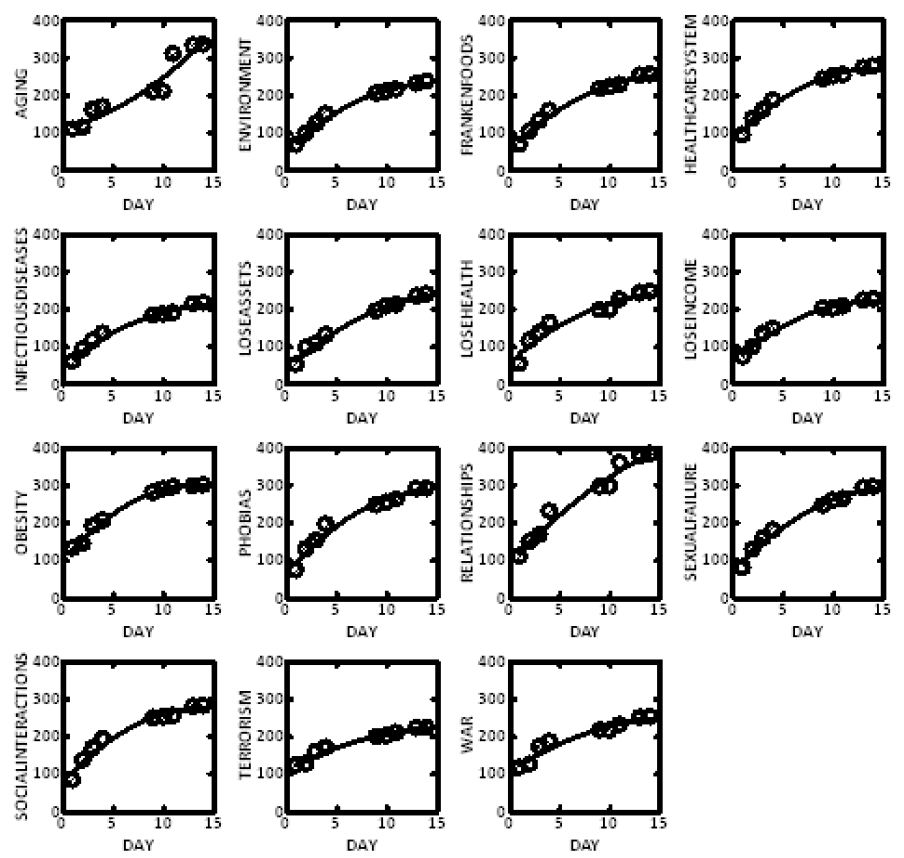
Figure 4: Cumulative log-ins for each study over a two week period. (No study exceed 125 respondents after successful log-in)
The key information in Figure 4 comes from the shape of the curve, and the number of log-ins need to reach the target quota of 120 respondents. The patterns can be deconstructed as follows:
a. Steep at first – lots of respondents are interested. Most of the topics are like that. Examples are Relationships and Phobias
b. Less steep at first – not as many respondents immediately interested. The best example is aging.
c. Concave downwards – the curve goes up, flattens into an asymptote. The study starts off strong but then fewer respondents are interested at the end. Example are Environment, Obesity
d. Linear all the way – the curve keeps going up in a straight line. The level of interest is the same from start to finish Examples are is Relationships and Aging.
e. Level at day 15 is low. The number of logins to reach quota is smaller. People are interested in the topic. The best example is Lose Income.
f. Level at day 15 is high. The number of logins to reach quota is higher. Many more people ‘drop out of the experiment along the way, so they are not counted as part of the quota. Good examples are Relationship and Aging
The second surface analysis is to understand who participated. Knowing WHO the respondent is for many studies helps only when one wants to identify the specifics of the target population either because the study is most pertinent to them now or because there may emerge a strong linkage between the results of the study and the particular applicability of those results to a self-defined group. Thus, respondents were instructed to provide information about their interests and lifestyle, as well as on their previous behaviors. This information should make the study more relevant as a source of information about what concerns people.
When we deal with 15 different studies, these studies dealing with different causes of anxiety and frustration, the patterns of who participated across the 15 studies interesting, even if there is no practical application as yet. Furthermore, the pattern of participation becomes even more interesting when one realizes that the respondents were free to select the study which interested them. After the respondent finished evaluating the test vignettes, the respondent completed a self-profiling questionnaire, telling the researcher about themself. The questionnaire instructs the respondent to self-classify in terms of gender, age, income, location where living, how severe is their experience with the anxiety, how frequently they experience the situation, the location, the ways they use to cope with the anxiety, and so forth.
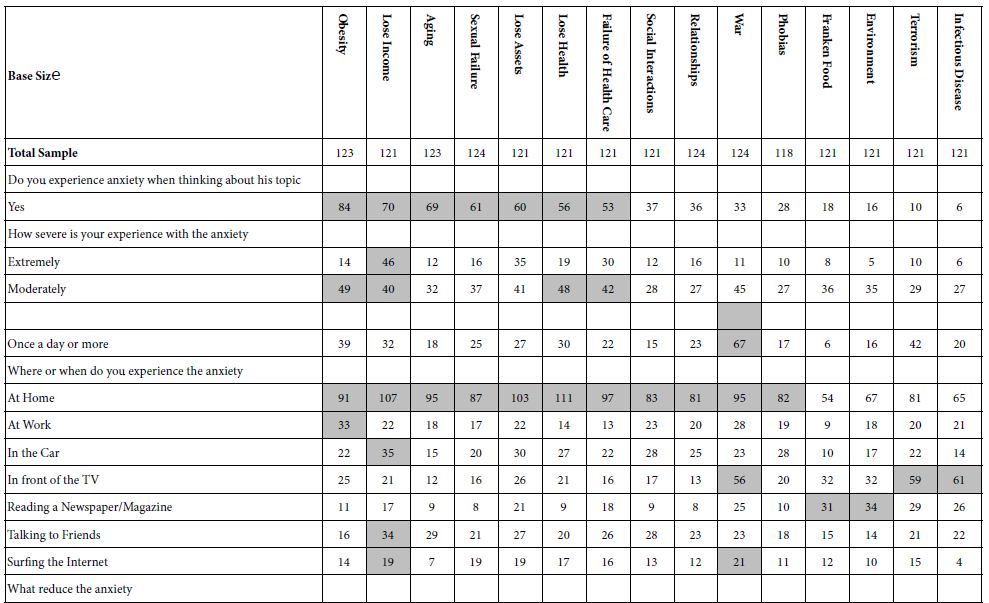
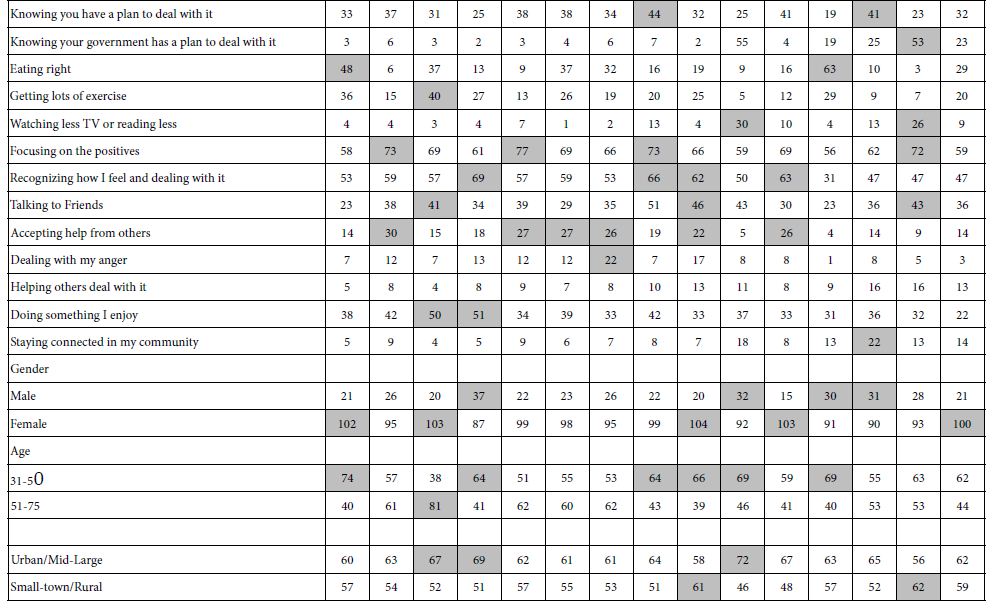
Table 4 shows a reduced form, with the 15 topics as the data columns, the rows showing a few of the self-profiling questions answer by the respondent. We do not look at many classification levels, simply because the vast amount of data would simply overwhelm. Table 4 shows by shaded cells the most frequent anxiety situation for each of the classification questions. It is clear from Table that respondents have varying degrees of interest in the topic. The data do not suggest randomness. Rather, the frequency of choice of a topic may indirectly reflect the basic interest in the topic. The clearest evidence of that is the is the comparison of two topics situated next to each other in Table 4. The data speak for themselves. These are aging and sexual failure, respectively, with 123 and 124 respondents, respectively.
Age 31-50 Aging chosen by 38 respondents, sexual failure by 64 respondents
Age 51-7 4 Aging chosen by 81 respondents, sexual failure by 41 respondents
(other ages not shown in Table 3)
Table 3: The composition of respondents who participated in the 15 Deal With It! studies. The columns show the studies. The rows show a partial breakout of the subgroups, defined both how he the respondent experiences the anxiety, and who the respondent is from a geo-demographic viewpoint
Step 5: Relating the Elements to the Ratings Using Regression Modeling
The essence of Mind Genomics is the ability to relate the presence/absence of the elements to the response, using regression analysis. The fact that the combination were systematically created means that we can actually measure the degree of ‘causation’, viz., that the presence of a specific element actually covaries in a specific way with the rating.
The first step when we relate the elements to the ratings is to decide whether the ratings need to be ‘transformed.’ For most basic science it is entirely adequate to work with the original rating scales, and apply statistical procedures to the ratings. When we deal with the world of application, however, we face a problem. The problem is simple, and is stated something like the following: ‘What does a 7.08 mean?’ Is a 7.08 good or bad? What should i do with that rating of 7.08? The foregoing question uses the value of 7.08 just as an example.
Fortunately, the issue of ‘what does a scale point mean’ is not a new one. The consumer researchers often have opted for yes/no scales, and have converted the rating scale to a binary scale. Thus, in conventional consumer research the respondent might be instructed to rate ‘purchase intent’ on a five point scale, ranging from 1=definitely not buy 5=definitely buy. Rather than working with the actual rating assigned by the respondent, the consumer researcher may transform the rating to a more easily understand binary scale. The typical consumer researcher will transform the ratings 1, 2, and 3 to 0, and the ratings 4 and 5 to 100, respectively. The thus data which had started out as a simple scale (often called a category scale or a Likert scale) becomes a binary scale (not buy/buy.)
The foregoing analysis was done for these data. The respondents used a 9-point scale. The transformation was ratings 1-6 → 0, and ratings 7 → 100, respectively. As a prophylactic measure prior to regression, a vanishingly small random number (<10-5) was added to each transformed rating. The rationale was to ensure that the regression analysis would work even when a respondent assigned all vignettes a rating of 1-6 (which would transform to 0) or a rating of 7-9 (which would transform to 100.) The regression analysis requires a vanishingly small bit of variability in the dependent variable, the transformed ratings.
After the ratings were transformed, the Mind Genomics program separately estimated the following equation for each respondent: Transformed Rating (Binary) = k0 + k1(A1) + k2(A2). k36(D9.) The analysis was straightforward for the simple reason that the 60 vignettes evaluated by each respondent constituted a self-standing experimental design. That is, the data are ‘readable’ down to a base size of one respondent. One would never base the conclusion on one respondent so the approach is either to average the corresponding coefficients from the models of all respondents OR put in all the respondents from a single group into one analysis.
The equation provides a useful summary of the patterns in the data. We can think of the equation as showing the contributions of the different elements to the binary response of either I can’t deal with this (ratings 7-9, now converted to 100), or the binary response of I can deal with this, or may/may not be able to deal with this (ratings 1-6.)
As an analogy, think of a statue standing on its base. The base is the additive constant. The base can be low (low additive constant), or high, or very high (very high additive constant.) Following the base are the different parts of the statue that can be placed atop one another. The parts can be small (low positive coefficients) and can even take away some of the base and thus reduce the height (negative coefficients.) Or the parts can be large (high coefficients), or can even take away a lot of the base (high negative coefficients.)
The analogy of the statue goes one step further, namely the height can be calculated by adding together the additive constant (the base), and the coefficients of up to four elements, as long as the elements come from different questions. The elements can either add to the height (positive coefficients) or diminish the height (negative coefficients.)
Step 5: The Strongest Anxiety-producing Situations as shown by the Additive Constant
The additive constant provides a measure of basic likelihood to say, ‘I can’t deal with it’ (viz., ratings 7-9) in the absence of elements. The underlying 4×9 experiment design ensured that every vignette was populated by a minimum of two elements, a maximum of four elements, and that each of the four questions could contribute at most one element. The additive constant ends up being a purely estimated parameter, one useful to estimate the likely response to the (presumed) anxiety-provoking situation.
Previous studies with Mind Genomics suggest very low additive constants for items or services which do not excite interest. Examples include credit cards, whose additive constants hover around 10-20. To build interest in the credit card is hard. The offeror will have to discover elements which have high coefficients, elements to be added to the offering. In contrast, there are items which enjoy high additive constants, such as pizza, with an additive constant around 65-70. That means that in the absence of any elements, and just knowing the offering of pizza, around 65-70% of the responses will be positive. Returning to th example of th credit card, only 10% of the responses will be positive when the respondent knows the offering is a credit card. Again, other elements have to add to the offering.
Table 4 shows the 15 additive constants, one for each topic. The columns show the 15 studies. The rows show the key groups beginning with total panel, then genders, and then ages. There were other classification groups, but in the interest of clarity, only these are presented.
Table 4: The additive constants for the total panel and for key subgroups. Additive constants of 30 or higher are highlighted

To allow the patterns to emerge more clearly, all the additive constants of value 30 or higher are shown in shaded form. These are the anxiety provoking situations which, in theory, would generate at least 30% ratings of 7-9 (cannot deal with it), in the absence of elements.
The pattern of anxiety-provoking situations is clear from the additive constant. The big effects occur most strongly with ‘Lose Income.’ Then there are five more, ranging from obesity to relationships which are quite strong. The lowest level is occupied by Franken Foods (viz., non GMO), War, and Terrorism. Keep in mind that this study was run in 2003, after 9/11. Yet there is no free floating anxiety operative for terrorism as there is for losing one’s income, obesity, and sexual failure, three events or conditions which are real.
The ‘Deal with It!’ studies were open to everyone. The period around 2003 would see studies filling up into the hundreds of respondents. Surprisingly, however, The Deal with It study filled up very slowly, with most of the respondent being women, typically around three out of every four respondents. Nonetheless with the within-subjects design, even the 30 or so male respondents provide statistically stable data. That stability allows us to compare males and females. Females are anxious at a basic level about losing income, and losing assets respectively These are the important gender differences, viz., high additive constant, and large difference between the genders.
Step 6: The Elements Which Provoke the Strongest Anxiety Responses, and the Elements Which Provoke the Smallest Anxiety Response
The set of 15 studies provides 540 elements, each with a coefficient from the total panel showing the degree to which the element drives a rating of 7-9, viz., i cannot deal with what is being presented. Fortunately, the additive constants are similar to each other, and need not be considered. Recall that the additive constant is the predisposition for a respondent to feel anxiety (rate 7-9) in the absence of elements. Since the additive constants are reasonably close to each other (Table 4), we can feel comfortable looking at the magnitudes of the coefficients.
Table 5 shows the elements which provoke the great amounts of anxiety, namely elements with coefficients of +10 or higher for the total panel. Of the seven great anxiety-provoking elements, surprising three of these end up being statements about who will help you get through this (viz., loss of health being helped by charities and one’s company; the United Nations will keep us safe from terrorism.) There is no clear pattern for these severe anxiety-provoking elements, other than they are impersonal symbols of authority.
Table 5: Elements which reduce anxiety
|
Elements which reduce anxiety (Bigger negative = More Anxiety Reducing) |
||
|
Study |
Element |
Coeff |
| Relationships | Your family and friends will help until you get through this… |
-12 |
| Relationships | You trust your God will help you get through this |
-12 |
| Lose your income | You trust your God will help you find new income |
-12 |
| Lose your health | You trust your God will help you get through this |
-10 |
| Lose assets | You trust your God will help you get through this |
-10 |
| Social interactions | You trust your God will help you get through this |
-10 |
| Relationships | Family and Friends play a big role in your life… |
-8 |
| Aging | Your family and friends will help get you through this… |
-8 |
| Sex failure | You believe passage of time will help you get through this |
-8 |
| Lose your assets | You trust your God will help you get through this |
-8 |
| War | It’s important for the Media to keep you informed |
-7 |
| Lose your assets | People you work with are affected by this situation… |
-7 |
| Aging | You trust your God will help you get through this |
-7 |
| Obesity | Your family and friends will help until you get through this… |
-7 |
| Lose your health | Family and Friends play a big role in your life…. |
-7 |
| Sex failure | No one you know is affected by this situation… |
-7 |
| Obesity | Family and Friends play a big role in your life… |
-7 |
| Lose your assets | Family and Friends play a big role in your life… |
-7 |
The second tier of elements, coefficients between 11 and 20, comprise mostly solutions. It is surprising that the presumed help to reduce anxiety instead ends up provoking anxiety (Table 4a).
Table 4a: Strongest anxiety-producing elements
|
Study |
Elements which very strongly drive anxiety |
Coeff |
| Lose Assets | You lose your home…. |
25 |
| Lose Health | You believe Charities will help you get through this |
25 |
| Lose Health | You believe your company will help you get through this |
22 |
| Terrorism | A bomb under your car… |
21 |
| Aging | Living in an old age home…. |
20 |
| Terrorism | A dirty nuclear bomb set off … |
20 |
| Terrorism | You believe that international cooperation in the United Nations will keep you safe |
20 |
| Elements which strongly drive anxiety | ||
| Aging | You believe your plastic surgeon you have will help you get through this |
19 |
| Terrorism | You think United Nations Forces will keep you safe |
19 |
| Relationships | You believe dating services will help you get through this |
18 |
| Aging | You believe Charities will help you get through this |
17 |
| Environment | You trust that the Local government will keep the earth and you safe |
17 |
| Failure of Health Care | You believe Charities will help you get through this |
17 |
| Relationships | You believe talking to a lawyer or the courts will help you get through this |
17 |
| Sexual Failure | You were raped…. |
17 |
| Environment | You trust that the Environmental Protection Agency will keep the earth and you safe |
16 |
| Environment | You believe that the Businesses impacted will work to keep the earth and you safe |
16 |
| environment | A radioactive plume of dust over you…. |
16 |
| Lose Health | You believe whatever Supplemental insurance you have will help you get through this |
16 |
| War | A dirty nuclear bomb set off… |
16 |
| Environment | You trust that the government will keep the earth and you safe |
15 |
| Income Loss | You believe your insurance will help you find new income |
15 |
| Infectious Disease | You believe Charities will help you get through this |
15 |
| Lose Assets | You believe Charities will help you get through this |
15 |
| Lose Health | Your doctor says you don’t have long to live… |
15 |
| Sexual Failure | You believe dating services will help you get through this |
15 |
| Social Interactions | You believe taking the right drugs will help you get through this |
15 |
| Social Interactions | You believe Food or Drink will help you get through this |
15 |
| Terrorism | Bombs blowing up in the middle of a building… |
15 |
| Aging | You believe your company will help you get through this |
14 |
| Environment |
You believe that international cooperation will keep the earth and you safe |
14 |
| Infectious Disease | You believe your company will help you get through this |
14 |
| Failure of Health Care | You believe your company will help you get through this |
14 |
| Terrorism | A deadly disease like smallpox or anthrax let loose…. |
14 |
| Infectious Disease | You believe whatever insurance you have will help you get through this |
13 |
| Lose Health | Losing control of your bodily functions…. |
13 |
| Infectious Disease | You trust that the government and the airports will stop this from entering your country in a big way |
12 |
| Failure of Health Care | The medical procedures you need are not covered by your insurance…. |
12 |
| Lose Health | Your body eating itself away from within…. |
12 |
| Lose Health | You believe whatever insurance you have will help you get through this |
12 |
| Relationships | You believe Food or Drink will help you get through this |
12 |
| Relationships | You believe Charities will help you get through this |
12 |
| Social Interactions | You believe Charities will help you get through this |
12 |
| Terrorism | You believe that the Center for Disease Control will keep you safe |
12 |
| Income Loss | You trust the government will help you find new income |
11 |
| Income Loss | You lose your job because you have done something wrong… |
11 |
| Failure of Health Care | You believe your Local Hospital will get you through this |
11 |
| Lose Assets | You believe Local government services will help you get through this |
11 |
| Obesity | You believe that the food industry will work to help you find the right foods to eat |
11 |
| Phobias | You’re afraid of speaking in public….and you must give a very important speech for your company to an audience of thousands…. |
11 |
| Phobias | You’re afraid of spiders crawling near you…. and you have to reach in a dark musty space…. |
11 |
| Environment | You believe that Greenpeace will keep the earth and you safe |
10 |
| Frankenfoods | You trust the government will keep the earth and you safe |
10 |
| Infectious Disease | You have to touch people that you know have some infectious disease…. |
10 |
| Failure of Health Care | You believe whatever Supplemental insurance you have will help you get through this |
10 |
| Lose Assets | You lose your pension… |
10 |
| Lose Assets | You lose your car… |
10 |
| Lose Health | You believe your Local Hospital will get you through this |
10 |
| Social Interactions | Afraid to go out of the house…. |
10 |
| Terrorism | Contamination of the food supply… |
10 |
| Terrorism | You believe that Homeland Defense will keep you safe |
10 |
The Deal With It! studies were designed with ‘helping or ameliorating’ elements expected to score low on the 9-point scale, and thus expected to generate low coefficients, presumably negative one in the regression model (after binary transformation.) A negative coefficient tells us the degree to which adding the element to the vignette is expected to reduce the rating, below 7-9 anywhere to 1-6. We focus here on the elements with high negative coefficients, elements expected to drive the ratings down to around 1-3.
Table 5 shows those elements generating coefficients of -12 to -7. There are far fewer elements which reduce the rating of anxiety (viz., which move the rating from 7-9.) God and family and friends are the key elements which reduce anxiety. The other efforts, bringing in government, companies, etc., not only did not reduce anxiety, but rather increased anxiety, as Table 4 shows.
Step 7 – Most Seemingly Reasonable Solutions End Up Backfiring
One of the ingoing theses of the Deal With It! study is that the solutions selected would be effective, maybe perhaps strongly effective at times, weakly effective at others. The presumption was that those respondents suffering most severely would generate the biggest negative coefficients. Towards this end, the next analysis considered only those respondents who self-reported that they perceive themselves to suffer from the problem, and furthermore, rated their suffering extremely high (viz., 5 on a 5 point scale.) For these respondents we then looked at the performance of all elements which presented ‘solutions,’ or at least potential solutions.
Table 6 shows the coefficients for the elements. The only elements which appear in Table 6 are those which score strongly either in ability to decrease anxiety (high negative coefficients, -10 or lower), or on their ability to increase anxiety (high positive coefficients, +10 or higher.)
Table 6: Strong performing elements either reducing anxiety (negative coefficients +10.) The elements in the table are chosen from presume ‘solutions to the problem dealt with in the particular study.’ The table is sorted by the coefficients of those who say they ‘suffer extremely’ from the topic of the individual study
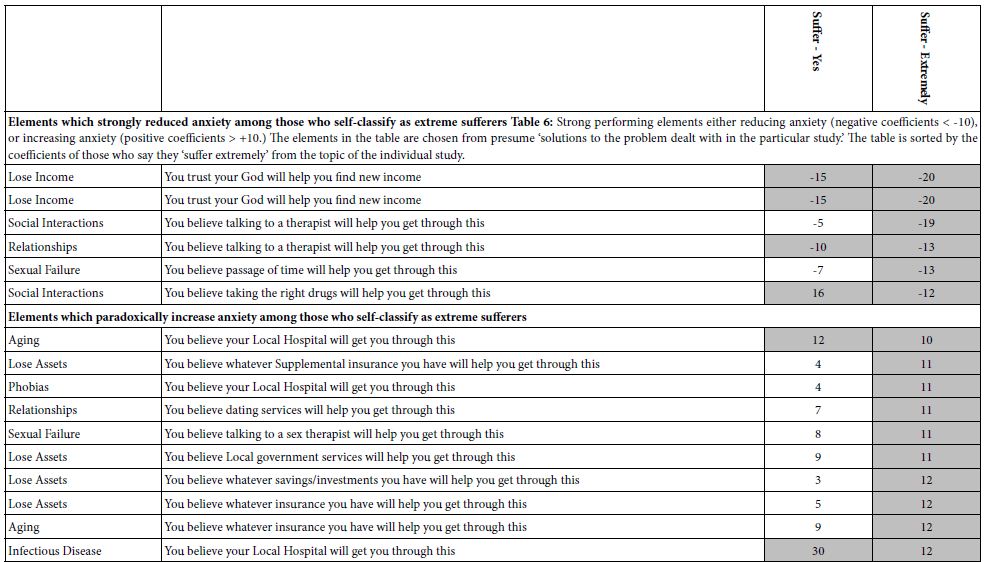
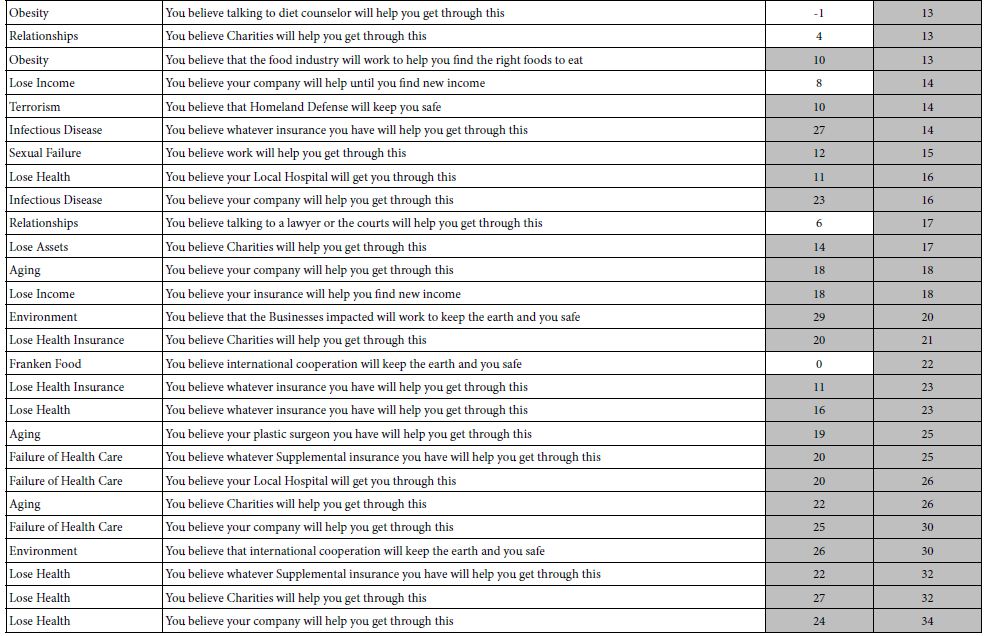
Table 6 surprised, because very few of the elements thought to be solutions to the problem are perceived as solutions. Rather, most of them are perceived as increasing anxiety, rather than decreasing anxiety. That is, the solutions are perceived as problems, not solutions. The only real solution appears to be God, which will be dealt with in the last analysis.
Step 8: In God We Trust
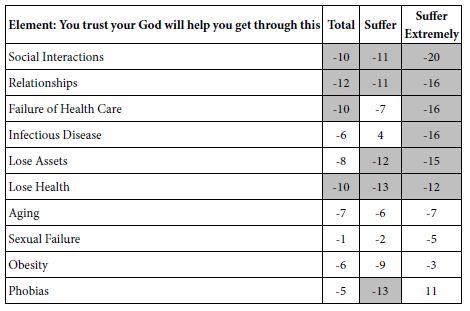
This analysis was occasioned by the observation that across the 10 studies where God was mentioned, most of them featured God as a believable reducer of anxiety, viz., someone or something which can help people ‘Deal With It’. Table 7 shows that in most of the studies and among the three groups (total, sufferer, extreme sufferer), the statement about God reduces the anxiety. The coefficients are mostly negative, many of them strongly negative, with values -10 or lower. These results suggest that at least as of 2003, Americans may have been become more secular, but God was still a comforting thought and presence to them across many of the topic issues causing anxiety.
Table 7: Coefficients for elements mentioning God, reported for Total Panel, for those self-reporting that they suffer anxiety regarding the study topic, or suffer extreme anxiety regarding the topic study
Step 9 – Uncovering Mind-sets based upon Anxiety-provoking Elements
A hallmark of the Mind Genomics approach is the hypothesis that people differ from each other in their responses to the various situations and ‘things’ in their everyday world, especially those situations and things which call forth emotional responses. The underlying difference among people is not new; individual differences have been recognized since the time of Aristotle and Plato, as well as Machiavelli, not to mention writers, poets, politicians, and the like [10,11]
The contribution of Mind Genomics is the ability to use a small, short experiment, inexpensive and scalable experiment to uncover patterns of responses to the everyday, working at the level of the granular experience. In doing so, Mind Genomics follows a well-trod path, finding its roots in psychology (especially those of individual differences), and consumer research (psychographic segmentation; [12]).
The segmentation approach for Mind Genomics works with the set of coefficients from the study, clustering the coefficients [13]. Those respondents in the same cluster are ‘similar to each other’ based upon the pattern of the coefficients. Those respondents in different clusters are ‘dissimilar to each other,’ again based on the pattern of coefficients. The clustering method is a mathematical treatment of the data, attempting to put the ‘things’ (here the respondents) into a small set of meaningful, interpretable groups.
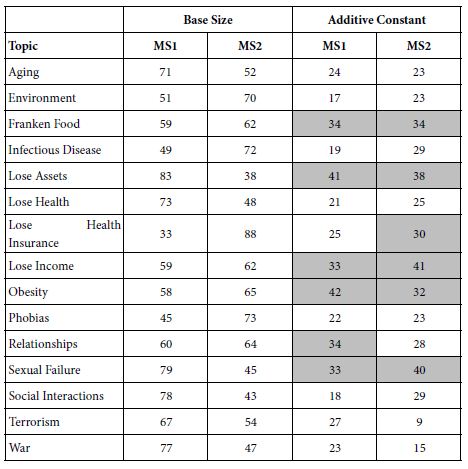
The studies here featured different groups of elements, customized to fit the specific topic. As a consequence, the cluster analysis had to be conducted separately for each study. To get a sense of the different mind-sets, we created two clusters or mind-sets, doing separately for each of the 15 topics. Table 8 shows the base sizes and the additive constant for each of the mind-sets. For the most part, the additive constants for the two complementary mind-sets are similar in magnitude. It will be in the patterns of coefficients where the differences occur, generally in the elements which provoke anxiety (viz., the positive coefficients).
Table 8: Base sizes and additive constants for the two complementary mind-sets (MS1, MS2) for each topic
The elements which drive the strongest anxiety for the two mind-sets (now called Types) appear at the top of Table 9. We use the phrase Mind-Set Types to denote the fact that the mind-sets were developed separately for each topic. The elements which reduce the anxiety, appear in the bottom of Table 9. Keeping in mind that each study was subject to its own clustering analysis, it appears that there are two themes running through the mind-sets, themes which reveal themselves from the positive coefficients (anxiety-provokers), but not from the negative coefficients (anxiety-reducers).
Table 9: Elements which most strongly drive anxiety (top of table) and which most strongly reduce anxiety (bottom of table) for the 15 topics, for the two mind-set types
|
Topic |
Mind-Set Type A Anxiety Provokers |
Mind-Set Type B Anxiety-Provokers |
|||
| Aging | Living in an old age home…. | 30 | You believe Charities will help you get through this | 32 | |
| Environment | A radioactive plume of dust over you…. | 28 | You trust that the Environmental Protection Agency will keep the earth and you safe | 31 | |
| Lose Health Insurance | The medical procedures you need are not covered by your insurance…. | 15 | You believe your Local Hospital will get you through this | 37 | |
| Franken Food | You are scared … inside and out | 11 | You trust the government will keep the earth and you safe | 21 | |
| Lose Income | You lose your job because you have done something wrong… | 14 | You believe your insurance will help you find new income | 25 | |
| Infectious Disease | You have to touch people that you know have some infectious disease…. | 16 | You believe Charities will help you get through this | 31 | |
| Lose Health | Your doctor says you don’t have long to live… | 32 | You believe Charities will help you get through this | 39 | |
| Lose Assets | You lose your home…. | 34 | You believe Charities will help you get through this | 33 | |
| Obesity | You just can’t control the eating… | 12 | You believe a plastic surgeon will help you get through this | 26 | |
| Phobias | You’re afraid of flying….and you must fly across the ocean…. | 17 | You believe Charities will help you get through this | 23 | |
| Relationships | You believe dating services will help you get through this | 5 | You believe dating services will help you get through this | 32 | |
| Sexual Failure | You were raped…. | 21 | You believe dating services will help you get through this | 37 | |
| Social Interactions | You just can’t function…. | 14 | You believe Food or Drink will help you get through this | 28 | |
| Terrorism | A dirty nuclear bomb set off … | 39 | You think United Nations Forces will keep you safe | 34 | |
| War | A dirty nuclear bomb set off… | 23 | You believe international cooperation in the United Nations will keep you safe | 28 | |
| Topic | MindSet A- Anxiety Reducers | Mind-Set B – Anxiety Reducers | |||
| Aging | You trust your God will help you get through this | -12 | Not having as much energy as you used to…. | -10 | |
| Environment | You believe that Greenpeace will keep the earth and you safe | -10 | You trust that God will keep the earth and you safe | -6 | |
| Lose Health Insurance | You trust your God will help you get through this | -15 | You are scared … inside and out | -15 | |
| Franken Food | You believe international cooperation will keep the earth and you safe | -6 | It’s important for the Media to keep you informed | -11 | |
| Lose Income | You trust your God will help you find new income | -18 | Business downturns that result in layoffs in your company…. | -7 | |
| Infectious Disease | You trust your God will help you get through this | -11 | Your family and friends will help get you through this… | -5 | |
| Lose Health | You trust your God will help you get through this | -19 | Family and Friends play a big role in your life…. | -7 | |
| Lose Assets | You trust your God will help you get through this | -10 | A burglar steals your jewelry and other things that are important to you… | -10 | |
| Obesity | Family and Friends play a big role in your life… | -11 | You trust your God will help you get through this | -10 | |
| Phobias | You trust your God will help you get through this | -13 | You’re afraid of being in crowds…. and you must go shopping at Christmas time…. | -9 | |
| Relationships | Not getting along with your partner… | 10 | Not getting along with your partner… | -7 | |
| Sexual Failure | You believe passage of time will help you get through this | -11 | You have performance issues…. | -11 | |
| Social Interactions | You believe talking to a therapist will help you get through this | -15 | You trust your God will help you get through this | -8 | |
| Terrorism | A Computer virus let loose that impacts your everyday businesses… | -2 | You need to contact your friends and family to make sure they are OK… | -11 | |
| War | You trust that God will keep you safe | -14 | Seeing my friends or family getting called up to go fight… | -5 | |
The underlying pattern which continues to emerge is that Mind-Set A respondents strongly to actual events which are presumed to provoke anxiety. In contrast, Mind-Set B respondents respond strongly to social institutions which presumably should reduce anxiety but for respondents in this second group of 15 mind-sets ends up increasing anxiety.
The story is different when we look at the elements which reduce anxiety (bottom of Table 9). Mind-Set Type A believes in the elements which presumably ameliorate anxiety, being designed to do so. In contrast, Mind-Set Type B, which showed the aberrant responses to helping elements (provoking anxiety) appear to be totally random in what ends up ameliorating anxiety (viz., elements with highest negative elements). Generally their negative numbers are far smaller than the negative numbers of Mind-Set Type A, suggest two radically different groups when it comes to what seems to drive anxiety.
Discussion and Conclusions
A cursory exploration of the topic of ‘anxiety’ brings up tens of thousands of ‘hits’ and many papers dealing with the manifold dimensions of anxiety. One could look at the topic of anxiety from deep inside the person, such as the approach espoused by psychoanalysis, or perhaps move a little more to the surface with cognitive behavioral therapy. Certainly, anxiety is no stranger to the world of clinical psychology, or business psychology, because of its prevalence and potentially damaging effects. Clinical psychology can teach us a lot about anxiety, from cause to manifestation to effects.
Moving beyond the clinical world is the effects of anxiety on the person’s performance in the world, experiences, and interactions with the world of the everyday. Whether this be anxieties about what a person doe (e.g., relationships, sexual failure, etc.), to who a person is (e.g., aging), to what external events occur (e.g., lose health, lose assets), there is the need to understand the surround of this life-relevant interaction. There has been a lot published on these different, relevant aspects of anxiety. A Google Search of the phrase ‘Anxiety in everyday life’ brings up 12.5 million hits as of this writing (winter, 2022.) The same phrase in Google Scholar (r) as of winter, 2022, brings up 1.6 million hits. When we limit the search to end at 2003, the number of hits drops to 155,000.
The foregoing observations tell us that there is a great interest in the topic of anxiety. At the same time, a search through the literature, or in Google Scholar (r) reveals the scattered nature of the topic. Each author focuses on that which is interesting, going in deeply. One does not have any sense of the world of anxiety dealt with in the coherent way done by a set of parallel Mind Genomics cartographies. The goal of the Mind Cartography is to systemize the data, and create understanding of the topic from the point of view of the everyday. Mind Genomics approach provides a way to understand anxiety and to allay it in a way which seems both practical and theoretical, working at the level of the granular, and yet giving a vision of a galaxy of such topics. Relevant data for the topics might be assembled painstakingly from the published literature, but without a coherent set of raw data underlying the studies. With Mind Genomics, a few weeks, and a modest budget, the entire study can be repeated. The integrated database of the granular aspects of daily experience promote new-to-the-world discoveries, easily found, analyzed, synthesized, and integrated in both current thinking and visions of new vistas.
Acknowledgments
The author would like to acknowledge the early collaborations with Jacqueline H. Beckley and Hollis Ashman (deceased), which led to the IT! studies, one of which was Deal With It! presented here.
References
- Beckley J, Moskowitz HR (2002) Databasing the consumer mind: the crave it!, drink it!, buy it! & healthy you! databases. In Institute of Food Technologists, Annual Meeting, Anaheim, California.
- Moskowitz HR (2004) Evolving Conjoint Analysis: From Rational Features/Benefits to an Off-the-Shelf Marketing Database. In Marketing Research and Modeling: Progress and Prospects 215-230. Springer, Boston, MA.
- Gabay G, Moskowitz HR (2015) Mind Genomics: What Professional Conduct Enhances the Emotional Wellbeing of Teens at the Hospital? Journal of Psychological Abnormalities Child 4: 147.
- Gofman A (2009) Extending psychophysics methods to evaluating potential social anxiety factors. Medicine 17: 1337-1342.
- Keene SA, Kalk TN, Clark DG, Colquhoun TA, Moskowitz HR (2017) Indoor plant toxicity concerns some consumers. In; Proceedings of the 2017 Annual Meeting of the International Plant Propagators’ Society, pp. 361-366.
- Moskowitz H, Rabino S, Gofman A, Moskowitz D (2007) Effective and confident communications in the midst of a major crisis: An experiment in the pharmaceutical context. International Journal of Pharmaceutical and Healthcare Marketing 1: 318-348.
- Moskowitz HR, Gofman A (2007) Selling blue elephants: How to make great products that people want before they even know they want them. Pearson Education.
- Moskowitz HR, Gofman A, Beckley J, Ashman H (2006) Founding a new science: Mind genomics. Journal of Sensory Studies 21: 266-307.
- Gofman A, Moskowitz H (2010) Isomorphic permuted experimental designs and their application in conjoint analysis. Journal of Sensory Studies 25: 127-145.
- Stanovich KE (1999) Who is rational?: Studies of individual differences in reasoning. Psychology Press.
- Stanovich KE, West RF (2000) Individual differences in reasoning: Implications for the rationality debate? Behavioral and brain sciences 23: 645-665.
- Wells WD (1975) Psychographics: A critical review. Journal of marketing research 12: 196-213.
- Diday E, Simon JC (1976) Clustering analysis. In: Digital Pattern Recognition (pp. 47-94.) Springer, Berlin, Heidelberg.