Author Archives: author

Clinical Case of Malignant Acrospiroma, Treatment Results Evaluation

DOI: 10.31038/CST.2017242

Introduction

Malignant acrospiroma (MA) – is rather rare tumor with eccrine ductal and secretory differentiation, including clear cell component. This type of tumor appears more often in elderly people (average male patient age is 51 years, female patient – 55 years). The tumor corresponds to solitary intradermal, exophytic or mixed type node 0.5-2 cm or more in diameter, hemispheric, tight-elastic texture, on wide base, covered with unchanged skin, sometimes with ulcers. Small percent of cases have clear discharge from tumor. Considering the same architecture of malignant nodular hydradenoma and benign analogue, it is difficult to find the difference between them, although undisputed manifestation of malignance is vessel and perineural invasion, lymphogenic metastasis.

The tumor is very aggressive and liable to metastasis. It is important to notice that there are no direct histological and clinical signs, predicting biological behavior of the tumor. Despite chemotherapy, patients with metastasis has fatal outcome vary rapidly. There no proved data of chemotherapy impact on malignant acrospiroma.

Description of MA clinical case

Patient, 58 years, applied to Dnipropetrovsk Multi-field Clinical hospital #4 in Jan 2017 to the Department of Oncology and Medical Radiology of Dnipropetrovsk Medical Academy with complaints to fatigue and tumor formation.

Anamnesis

Patient consider himself sick since Autumn 2016, when above mentions complaint appeared for the first time. Incisional biopsy was performed in Nov 2016, and then the patient was sent to the Department of Oncology and Medical Radiology of the Dnipropetrovsk Multiffield Clinical Hospital #4

Pathohistological conclusion as of 16 Nov 2016:

Tumor has the structure of malignant eccrine acrospiroma with ulceration.

Life history

Catarrhal diseases are 1-2 times per year. No addictions. No allergies. No hemotrasfusions, traumas and surgeries. Diabetes mellitus type II, more than 2 years. No cancer family history.

Physical examination

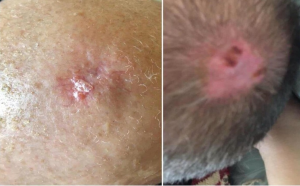
Formation in left parietal region, round in shape with indeterminate boundaries, 2 cm in diameter, with tissue lysis and perifocal inflammation.

Investigation data

1. Pathohistological conclusion №10291-96/16 as of 16 Nov 2016: Tumor has the structure of malignant eccrine acrospiroma with local ulceration.

2. X-ray assessment of the chest as of 11 Jan 2017: Radiological signs of metastasis in lungs.

3. Endocrinologist assessment as of 13 Jan 2017: Diabetes mellitus type II, compensated.

4. Therapeutist assessment as of 13 Jan 2017: Essential hypertension II gr. Coronary heart disease: atherosclerotic cardiosclerosis, Heart failure I.

5. CT assessment of chest, abdominal cavity and pelvis as of 17 Jan 2017: CT-signs of multiple secondary changes on lungs, increased mediastinal lymph nodes, metastasis in liver S4. Cholelithiasis. Concernments in right kidney. Mass lesion in left lobe of thyroid gland.

6. CT assessment of brain as of 17 Jan 2017: CT-signs of encephalopathy.

7. Echocardiography as of 20 Jan 2017: Satisfactory myocardial contractility, LVEF – 60%.

8. Punctate from thyroid gland as of 26 Jan 2017: Accumulation of polymorphic cells of follicular epithelial tissue, stroma elements.

9. CA results as of 20 Jan 2017: 19.05 U/mL.

10. Hematology as of 13 Jan 2017

– HB 120 g/L

– RBC 4.08 × 10¹²/L

– WBC 7.56 × 10⁹/L

– SOE 28 mm/h

– lymphocytes 28.7 %</p

Hematology was done 2 days before chemotherapy and 5 days after. Patient had chemotherapy-induced leucopenia and neutropenia grade I-II CTC AE, recovered after drug administration. No chemotherapy cycles delayed.

11. Hematology as of 03 Jul 2017

– HB 134 g/L

– RBC 4.58 x 10^12/L

– WBC 5.34 x 10^9/L

– SOE 8 mm/h

– lymphocytes 28.7 %

– monocytes 6%

12. Chemistry as of 13 Jan 2017

– total bilirubin – 7.3 mmol/L

– ALT – 21 IU/L

– AST – 23 IU/L

– total protein – 55.8 g/L

– alkaline phosphatase – 74 IU/L

13. RW as of 13 Jan 2017 – negative

14. AID as of 13 Jan 2017 – negative

15. Hepatitis B and C as of 13 Jan 2017 – negative

Diagnosis

Malignant acrospiroma, T2N0M1 stage IV (mts in lungs and liver), clinical group 2

Clinical case was discussed on board of doctors. Chemotherapy was prescribed.

Received treatment:

1. Carboplatin – VISTA AUG 6

2. Docetaxel – VISTA 75 mg/m2 IV

3. Fluorouracil – VISTA 500 mg/m2 IV

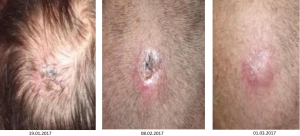
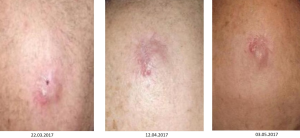
Visual clinical dynamics in the course of the treatment.

Recommendation at discharge

1. Family doctor supervision

2. Control blood analysis in 7-21 days.

3. CT assessment of chest, abdominal cavity and pelvis after 3months:

Complete diagnosis at discharge

Malignant acrospiroma, T2N0M1 stage IV (mts in lungs and liver), condition after non-radical surgery, after 8 cycles of chemotherapy clinical group II.

Patient had positive dynamics after chemotherapy treatment, complete response as per RECIST 1.1. Patient had not complaints.

CT assessment of chest, abdominal cavity and pelvis with IV contrast as of 28 Jun 2017: CT-signs of stable size of thyroid gland left lobe formation, positive dynamics due to disappearance of lesions in lungs, mediastinal lymph nodes, liver lesions. No new lesions.

Patient has fully active lifestyle, and he is under family doctor and oncologist supervision [Figure 1].

CST 2017-223 Figure1
CST 2017-223 Figure2
CST 2017-223 Figure3

Figure 1. Clinical Case of Malignant Acrospiroma

Systemic Treatment of Breast Cancer Depending on BMI using L-Carnitine

DOI: 10.31038/CST.2017241

Abstract

Aim: The aim of this retrospective study the effect of body mass index on the efficiency of treatment of breast cancer, improve treatment outcomes for breast cancer by individualization of treatment measures taking into account the characteristics of the metabolism of the patient.

Keywords:

body mass index, breast cancer, obesity, overall survival

Background

The incidence of breast cancer in the world in general and in Ukraine in particular is growing. In 2015, in Ukraine the incidence reached 70.0 per 100 thousand female populations.

According to the Ministry of Health in Ukraine 26% of the female population for 2015 was overweight or obese. Obesity – a chronic metabolic character, which is the result of the interaction of the endogenous factors, environmental conditions and lifestyle. Endogenous factors could be considered a violation of the genetic and hormonal balance. The external conditions include irregular rhythm nutrition, use of substandard products. By disorders include sedentary lifestyle lifestyles.

Obesity is the first risk factor for metabolic syndrome, diabetes type II, cardiovascular disease and some forms of cancer, including breast cancer.

Since overweight is a risk factor for breast cancer, there is reason to believe that among patients with breast cancer the percentage of obese women is higher than in the population. The risk of breast cancer in postmenopausal women by 30% more than in premenopausal, women with obesity – 50%. Furthermore it was proven that obesity is associated with poor prognosis in patients with breast cancer, regardless of menopausal status. [1]

The leading role in achieving long-term results of treatment with systemic methods, such as chemotherapy or hormone therapy. The purpose of systemic therapy is the eradication of micro metastases in the case of radical surgical treatment or reduction of tumor load in case of treatment of locally advanced or metastatic cancer. The calculation of the dose of chemotherapy conducted mainly in the area of the body. [2] Thus to avoid complications associated with overdose of chemotherapy, the standard practice is to calculate the dose of 2.0 m2 patients whose body area more than this. Preparations hormonal action used in standard dosage for an adult without constitutional features. Along with this recent literature there is information that women are overweight effectiveness of systemic treatments may be lower than expected. Other data refute this information. [3]

In view of the above, the study on the impact of body mass index on the effectiveness of systemic treatment for breast cancer is an actual scientific problem and promising area of research.

Overexpression of Her-2/neu in ER-positive breast cancer cells can cause Tamoxifen to behave as an agonist and stimulate cell growth. Implicit in this mechanism for resistance is cross-talk activation between the ER and the epidermal growth factor receptor (EGFR/ Her-2/neu) pathways [3]. Treatment with various signal transduction inhibitors has been used in combination with endocrine therapy to overcome resistance, such as Gefitinib, which targets the internal tyrosine kinase domain of EGFR, and Trastuzumab, which blocks the external domain of Her-2/neu [4].

Recently, complementary and alternative medicine (CAM) is widely accepted among patients with breast cancer, which may provide several beneficial effects including reduction of therapy-associated toxicity, improvement of cancer-related symptoms, fostering of the immune system, and even direct anticancer effects [5]. Carnitine is a trimethylated amino acid, naturally synthesized in the liver, brain and kidney from protein-bound lysine and methionine. Several factors such as sex hormones and glucagon may impact on Carnitine distribution and level in tissues [6]. L-Carnitine plays an important role in cell energy metabolism through mediating the transport of long chain fatty acids across the inner mitochondrial membrane. Carnitine has a modulating effect on the function of acetylcholine excitatory neurotransmitter, glutamate excitatory amino acid,insulin growth factor-1 (IGF-1) and nitric oxide (NO). L-Carnitine may have a dual protective effect by enhancing the energy dynamics of the cell and inhibiting cell membrane hyper excitability [15], which make it an ideal nutrient for cancer prevention and treatment [7]. ex hormones, especially estrogens, have been implemented in the development of breast cancer. Breast cancer risk increases after menopause, where aromatization of androgens to estrogens in adipose tissue is the most important source of estrogen in blood and peripheral tissues [11]. Weight increase and obesity subsequent to menopause have been identified as the most important risk and negative prognostic factors for breast cancer in postmenopausal women. Obesity results in increased circulating levels of insulin and insulin-like growth factor, which by acting as mitogens for epithelial breast cells, stimulate their growth and neoplastic degeneration. Mechanisms may combine to explain the association which links together menopause, the subsequent body weight increase, and hormone-dependent breast cancer [12]. Body mass index of Letrazol-treated breast cancer patients included in the present study was positively correlated with estrogen level (E2) which is consistent. [11], who showed that the increased breast cancer risk seen in postmenopausal women with adiposity might be related to elevated sex hormone level.

Materials and Methods

The study included 754 patients with breast cancer between the ages of 30 and 77 (57.6 ± 1) years of age who were treated according to our clinic, department of oncology and medical radiology.

Dnipropetrovsk medical academy at Municipal Institution “Dnipropetrovsk City Multi-field Clinical Hospital #4”, Dnepropetrovsk state medical academy from 2005-2016. All patients were evaluated according to the following data: stage of the disease, age and BMI at the time of diagnosis, the size, histological type and metastases. IHC type, MRI methods, Bioelectrical impedance analysis, Ultrasounds analysis.

Tumor size was evaluated after measuring its maximal diameter and distributed in accordance with the International TNM-classification (7th edition, 2009). The histological type and degree of differentiation of the tumor was evaluated respectively by the National Standards of diagnostics and treatment of malignant neoplasms, reflecting the recommendations of leading international organizations. BMI is calculated by the formula: I = m×h2, where m – body weight (kg); h – height (m). According to these calculations the patients were divided in accordance with the WHO criteria into the following groups: those with a BMI 30 kg/m2 – obese. The material for the histopathological study was obtained during surgery. We examined the relative risk of relapse and death with regard to the BMI categories adjusting for eight factors known to be predictors of disease-free survival (DFS) and overall survival (OS): menopausal status, nodal status tumor size, vessel invasion, estrogen receptor (ER) status, progesterone receptor status, tumor grade and treatment regimens, ECOG.

By analyzing archival material to consider the particular response to systemic treatment of breast cancer women with deficiency of body weight, normal, high and overweight. Explore options for determining the individual characteristics of lipid metabolism of patients with breast cancer and their possible use for predicting the effectiveness of treatment. To determine the lipid metabolism will be applied anthropological research methods, bioimpedansnoho measurement, CT [13,14].

Results

In this retrospective study, among 754 patients with breast cancer, 45% were identified with excess body weight, and 31% – of various obesity degree. Patients with a BMI 30 kg/m2, 10 % more often associated with metastatic RLN, which is an indirect sign of higher metastatic potentials. Patients with normal BMI had significantly longer overall survival (OS) and disease-free survival (DFS) than patients with intermediate or obese BMI in pairwise comparisons adjusted for other factors. We found a strong correlation between obesity and lymph node involvement These observations suggest that obesity may potentiate the metastatic spread of breast tumors. Distant metastases were also found more often in obese patients in bone or visceral sites in patients <45 years of age at diagnosis. Patients with normal mass by IHC with triple negative cancer 45% and 20% with BRCA + and patients with obesity 55% that’s with IHC luminal A.B but 2 group receive L Carnitine in group with L carnitine by ECOG better and calendar Chemotherapy was as planed and less Adverse Advents than group Patients without support L Carnitine And less hematological complication.

Conclusions

In conclusion, this retrospective investigation of our patient demonstrates that BMI is an independent prognostic factor for OS in patients with breast cancer. We have supporting evidence that obese BMI represents a poor risk feature for outcome, especially in pre-/premenopausal patients, most of whom received chemotherapy without hormonal therapy.A lifestyle intervention reducing dietary fat intake, with modest influence on body weight, may improve relapsefree survival of breast cancer patients receiving conventional cancer management. Longer, ongoing nonintervention follow-up will address original protocol design plans, which requires 3 years of follow-ups after completion of recruitment. The prominent role of L–Carnitine in the present study belongs to the level of Her-2/neu, Ki67, which were significantly reduced after L-Carnitine supplementation. Thus, L-CAR as add on therapy to TAM, in addition to its ability to foster the immune system and improve the patients` fatigue and quality of life, may offer better cancer prognosis, which may be, in part, a prospective trial to overcome Chemotherapy and Letrazol resistance.

References

  • Jordan VC, O’Malley BW (2007) Selective estrogen-receptor modulators and antihormonal resistance in breast cancer. J Clin Oncol 25: 5815-5824. [crossref]
  • Samaddar JS, Gaddy VT, Duplantier J, Thandavan SP, Shah M, et al. (2008) A role for macroautophagy in protection against 4-hydroxytamoxifen-induced cell death and the development of antiestrogen resistance. Mol Cancer Ther 7: 2977-2987. [crossref]
  • Baneshi MR, Warner P, Anderson N, Edwards J, Cooke TG, et al. (2010) Tamoxifen resistance in early breast cancer: statistical modelling of tissue markers to improve risk prediction. Br J Cancer 102: 1503-1510. [crossref]
  • Johnston SR (2009) Enhancing the efficacy of hormonal agents with selected targeted agents. Clin Breast Cancer 9 Suppl 1: S28-36. [crossref]
  • Porter NS, Jason LA, Boulton A, Bothne N, Coleman B (2010) Alternative medical interventions used in the treatment and management of myalgic encephalomyelitis/chronic fatigue syndrome and fibromyalgia. J Altern Complement Med 16: 235-249. [crossref]
  • Kraemer WJ, Volek JS, Dunn-Lewis C (2008) L-carnitine supplementation: influence upon physiological function. Curr Sports Med Rep 7: 218-223. [crossref]
  • Schubert C, Hong S, Natarajan L, Mills PJ, Dimsdale JE (2007) The association between fatigue and inflammatory marker levels in cancer patients: a quantitative review. Brain Behav Immun 21: 413-427. [crossref]
  • Thomson DM, Krupey J, Freedman SO, Gold P (1969) The radioimmunoassay of circulating carcinoembryonic antigen of the human digestive system. Proc Natl Acad Sci U S A 64: 161-167. [crossref]
  • Gion M, Plebani M, Mione R, Penzo C, Meo S, et al. (1994) Serum CA549 in primary breast cancer: comparison with CA15.3 and MCA. Br J Cancer 69: 721-725. [crossref]
  • Passing H, Bablok (1983) A new biometrical procedure for testing the equality of measurements from two different analytical methods. Application of linear regression procedures for method comparison studies in clinical chemistry, Part I. J Clin Chem Clin Biochem 21: 709-720. [crossref]
  • Mahabir S, Baer DJ, Johnson LL, Dorgan JF, Campbell W, et al. (2004) The effects of moderate alcohol supplementation on estrone sulfate and DHEAS in postmenopausal women in a controlled feeding study. Nutr J 3: 11. [crossref]
  • Mahabir S, Baer DJ, Johnson LL, Hartman TJ, Dorgan JF, et al. (2006) Usefulness of body mass index as a sufficient adiposity measurement for sex hormone concentration associations in postmenopausal women. Cancer Epidemiol Biomarkers Prev 15: 2502-2507. [crossref]
  • Macciò A, Madeddu C (2011) Obesity, inflammation, and postmenopausal breast cancer: therapeutic implications. ScientificWorldJournal 11: 2020-2036. [crossref]
  • Steiber A, Kerner J, Hoppel CL (2004) Carnitine: a nutritional, biosynthetic, and functional perspective. Mol Aspects Med 25: 455-473. [crossref]

The Alpha-Fetoprotein Receptor Binding Fragment: Localization of Third Domain Interaction Sites of DNA Repair Proteins

DOI: 10.31038/CST.2017232

Abstract

Although much has been published on the domain structures of human alpha-fetoprotein (AFP), the AFP third domain (AFP-3D) has emerged as an important fragment regarding the binding, docking, and interaction sites for hydrophobic ligands, multiple receptors, ion channels, and cell cycle proteins. In keeping with previous reports, studies have shown beyond doubt that certain amino acid (AA) sequences on AFP-3D provide a docking interface for protein-to-protein interactions (complexing) for such proteins. By means of a computer software program designed to study such “in silico” interactions, certain AA sequences on AFP-3D were identified which could plausibly interact with a group of DNA damage-sensing and repair (DDSR) proteins. The DDSR proteins identified included: 1) BRCA1 and BRCA2 2) FANC1 and FANCD2 3) nibrin 4) ATM and ATR and 5) DNA-PK kinase. Following the mapping of the AFP-3D with DDSR protein interaction sites, the computer-derived AFP-AA identification sequences were examined for similarities and comparisons to previously reported ligand, receptor, channel and other protein interaction sites on AFP-3D. Literature searches revealed that the association of AFP with the DDSR proteins showed correlations not only with clinical serum AFP levels, but also with an intracytoplasmic nonsecreted form of AFP, which interacts with transcription factors, cell death (apoptosis) proteins, nuclear receptors, and enzymes (caspases). The DDSR proteins that interacted with AFP were also found to be involved with cell cycle checkpoint proteins, cyclins and their dependent kinases, and ubiquitin ligases. Finally, both the clinical and experimental reports on the AFP-3D association with DDSR proteins were consistent with the “in silico” findings of this report.

Key Words

Alpha-fetoprotein, DNA repair, BRCA proteins, chromosome instability, Fanconi anemia

Introduction

Human alpha-fetoprotein (HAFP) has a long history of clinical use as a tumor-associated biomarker, employed to detect both fetal defects during pregnancy and adult cancers.[1, 2] Moreover, much of the biochemistry of the HAFP polypeptide has been elucidated over the five decades since AFP was first discovered. HAFP is a single chain polypeptide with an average molecular mass of 69 kDa, depending on its carbohydrate micro-heterogeneity.[3, 4] The secondary structure of this oncofetal protein exhibits a triplicate domain molecular structure, configured by intramolecular loops dictated by 15 disulfide bridges culminating in a helical V- or U-shaped structure.[3] This fetal protein has been classified as a member of the albuminoid gene family, consisting of AFP, albumin, alpha-albumin, vitamin D binding protein, and the AFP-related (ARG) protein.[5] Similar to albumin, HAFP binds to a vast array of ligands, including various drugs, dyes, steroid hormones, heavy metals, flavonoids, fatty acids, and phytoestrogens.[6] Unlike albumin, AFP has proven to be a notable growth factor capable of either cellular enhancement or inhibition.[7].

HAFP is known to bind to multiple cell surface receptors and intracytoplasmic proteins. Recent reviews by the author (GJM) and others have reported the existence of at least three major groups of cell surface receptors, namely, 1) including the scavenger receptor protein family 2), the mucin glycoprotein superfamily, and 3) the chemokine receptor family of proteins.[8-10] The intracellular HAFP binding proteins encompass the a) retinoic acid receptor b) the caspases c) PI3K/AKT (protein kinase-A), d) mTOR e) GAAD153 and f) PTEN. [11, 12] During the last decade, the carboxy-terminal third domain of HAFP (AFP-3D) has been confirmed to be a major binding interface for both cell surface receptors and hydrophobic ligands. [13, 14] Furthermore, the AFP-3D has been touted as a promising agent (fragment) for the selective delivery of anti-cancer agents.[15- 17] Recombinant fragments of AFP-3D have been produced which demonstrate high purification yields, good efficiency of expression, recoverable refolding capabilities, and retention of biological activities. [18-20] In some instances, the AFP-3D recombinant fragment behaves similarly to full-length AFP, while maintaining its capabilities to bind cell surface receptors and intracytoplasmic proteins.[19]

The localization of additional protein binding and interaction sites on AFP-3D, other than the three major receptor and intracellular binding sites mentioned above, continues to be a topic of focus in the biomedical literature. The pursuit to identify additional protein binding/interaction sites on AFP-3D fragments has not abated. Activity sites of interest include receptor blockade and/or inactivation, decoy ligand binding, blunting receptor responses, selective delivery of drugs, and nucleotide agents (miRNAs) and other cargos that are transported into cancer cells or other targeted cells. Such participating cells include lymphoid/leukemic cells, monocytes, macrophages, T-cells, dendritic cells, and various bone marrow cells (stem cells). Thus, knowledge gained from such activities of AFP could conceivably make it possible to modulate, control, and monitor target site interactions and might affect, dictate, or influence signal transduction pathways.

Aims and Objectives

The aims of the present review and prospectus were to search out, identify and localize, and describe plausible sites of interaction of DNA damage-sensing and repair (DDSR) proteins on the AFP-3D fragment. To achieve these aims, computer modeling and molecular software were used to pinpoint sites of possible interaction between the AFP-3D fragment and various proteins of the DDSR protein pathways. The identified proteins and their respective AFP-3D amino acid docking sequences are discussed concerning their relevance to protein-to-protein binding interactions and possible outcomes for DNA repair. Computer modeling and analysis were also employed to compare the DNA-repair protein localized sites to the ligands, receptors, and protein interaction sites previously localized on the AFP-3D fragment. Members of the DNA-repair pathways identified by this process are addressed regarding their biological activities with other ligand and protein interaction sites on AFP-3D. Finally, prior experimental and/or clinical reports of AFP-derived peptide interactions with DNA-repair proteins are addressed in view of their present “in silico” localizations.

Computer Molecular Docking Software

The computer modeling and molecular docking interaction sites of the DDSR proteins were identified and localized by use of a proprietary computer software (Peptimer Discovery Platform) developed and generously provided by Serometrix, LLC (Pittsfield/Syracuse, NY). This software tool was described in detail in earlier publications.[8, 21, 22] Use of the software simulation of protein-to-protein interaction site localization has been repeatedly confirmed and validated by means of in vitro cell-based assays and microarray analyses including receptor binding kinetics. Previous experimental verifications of AFP- 3D interaction sites using this software simulation have included cell cycle proteins, scavenger receptors, immunodeficiency-associated proteins, chemokine receptors, selective and non-selective cation channels, and lysophospholipid and mucin receptors.

DNA Damage Sensing and Repair

Most, if not all cancer cells, have an unstable genome comprising DNA-damaged pathways. In fact, it is uncommon to find a single tumor without a genetic defect. Genomic instability arises either from losing telomeres from the end of a chromosome or from breaks in the DNA contained in the chromosome. After a cell has divided multiple times, its telomeres become critically short. Often, the cell either dies or stops growing, as in end-stage differentiation or aging. If the cell does not stop dividing (i.e., cancer), it leaves chromosomes with broken ends and DNA breaks in mid-chromosome regions. Such breaks are meant to be addressed by a DNA repair mechanism to restore the damage, but if neglected or bypassed, can lead to loss of gene function and a predisposition to cancer.

Since DNA damage can lead to cancer, the cell possesses an intrinsic repair response to DNA damage and to agents causing it. Many human cancers are related to mutations that affect proteins involved in a cellular DNA damage response. For example, DDSR protein mutations in ataxia telangiectasia-mutated (ATM) and Fanconi Anemia (FANCD2) genes [23] can be linked directly to a predisposition to both leukemias and lymphomas. Mutations in other DDSR proteins, such as p53, BRCA1, and BRCA2, can cause ovarian and breast cancers. Mutations in others, such as ATM kinase, are the root causes of chromosome instability in DNA repair disorders which lead to lymphoid and leukemic cancers. When nuclear DNA is damaged, cells rely on specific intracellular signaling pathways to halt cell division before the DNA is copied into another cell. Two such pathways are the cell cycle ATM-CHK2 (checkpoint-2) and the ATRCHK1 (checkpoint-1) pathways.

DNA Repair Proteins

1) The BRCA1 and BRCA2 Proteins

The breast cancer susceptibility genes BRCA1 and BRCA2 were the first breast cancer genes to be identified. BRCA1 and BRCA2 display autosomal inheritance, and the primary tumors are associated with female breast and ovarian cancers. Mutations in BRCA1 and BRCA2 proteins occur in 10-30% of women with germline alterations; such alterations inactivate the BRCA2 allele, while a second allele is inactivated by somatic mutations.[24, 25] Both the DDSR genes are known to participate in homologous recombination pathways and cell cycle control.[26] Interestingly, many of the characteristics of the BRCA2 protein are similar to the FANCD1 gene (see below), and BRCA1 proteins share biological effects common to both proteins. The FANCD1/BRCA2 and BRCA1 proteins interact by binding and forming multi-protein complexes with FANCN proteins, and these complexes function in the DNA repair pathways.[27] Moreover, the FANC and BRCA, RAD51, and CHEK2 proteins can work in concert as multi-protein complexes in the repair of DNA damage.

A) BRCA1. The BRCA1 gene is located on the long q-arm of chromosome 17, consisting of 1,863 amino acids, which encompasses four major domains including a 1) zinc finger (C3HC4 type) 2) nuclear localization signal 3) nuclear export signal motif and 4) BRCA1 C-terminus (BRCT) domain. There are six isoforms which are known to be associated with BRCA1. The human gene encodes a tumor suppressor protein that is responsible for repairing damaged DNA and for destroying cells when DNA cannot be repaired. BRCA1 is also involved in the repair of chromosomal damage, with a role in the repair of DNA double-stranded breaks.[28, 29] If BRCA1 is damaged by mutation and DNA damage is not properly repaired, these events may increase the risk for breast cancer. BRCA1 and BRCA2 are known as proto-oncogenes termed “breast cancer susceptibility type 1 genes” and code for proteins regulating cell growth and differentiation in cells of breast and other tissues. BRCA1 can combine with other proteins, such as tumor suppressors, DNA damage sensors, RNA polymerase-II, and histone deactylase to form large multi-subunit protein complexes. BRCA1 can also play roles not only in DNA repair, but in transcription, ubiquitination, transcriptional regulation, and other cell functions.[30, 31]

B) BRCA2. The BRCA2 gene and protein product, similar to BRCA1, are tumor suppressors referred to as caretaker genes/ proteins found in all humans and primates. The BRCA2 gene is referred to as the “breast cancer type 2 susceptibility gene,” responsible for repairing damaged DNA and chromosomal damage, and inducing cell death in cells where DNA cannot be repaired.[31] The gene is located on the long q-arm of chromosome-13 encoding a protein of 3,418 AAs. Some functions of BRCA2 and BRCA1 are interrelated, even though their molecular structures differ in size. BRCA2 binds to single-strand DNA and directly interacts with the recombinase enzyme RAD51 to stimulate strand invasion, which is a vital step of homologous recombination.[32] PALB2, a partner and localizer of BRCA2, functions synergistically with BRCA2 by linking to a piccolo protein to further promote strand invasion. [33] Like BRCA1, the BRCA2 protein can regulate the activity of other genes and play multiple roles during development.

C) FANCD2, FANC1.The Fanconi anemia (FA) genes comprise a total complementation groups of 19 genes, inherited in an autosomal recessive manner. The FANCD2 gene is located on chromosome 3p with 1,328 AAs, while FANC1 has been localized on chromosome 15q26 having 1,451 AAs. FA genes respond to DNA damage to repair corrupted DNA and protect against chromosome instability.[27] The DNA damage repaired by FA genes encompasses broken and misshapen chromosomes, broken chromatids, and triradial and quadri-radial structures. The lack of DNA repair allows mitosis to proceed with corrupted DNA and enhances damaged cell survival, thus increasing genomic instability. Several components of the FA-DNA repair pathway are the FANCD2-FANC1 heterodimer, the FANCD1-BRCA2 complex, and the BRCA2-interacting protein-1 dimer.[34] In response to DNA damage, the FA protein complexes are activated by the AT kinase and the AT-RAD3-related kinase (ATR).[35] The activated FA protein complexes function as E3 ubiquitin ligases which monoubiquitinate the FAND2/ FANC1 heterodimer. This protein complex then translocates to the chromatin fraction where it combines with other FANC proteins at damaged nuclear replication points.[36] Mutated FA complementation proteins have been linked to the DNA damage/repair at the G2/M checkpoint response during cell cycle progression. However, an absence of G2/M transition arrest can occur with unrepaired double stranded breaks bypassing the checkpoint (CHK1) inhibition at the G2 cell cycle phase.

D) Nibrin.The protein nibrin (NBN) is a 754 AA protein whose gene is located on chromosome 8q21. NBN is a cell cycle regulatory factor, associated with the repair of doublestranded breaks which pose the threat of serious damage to the genome.[37, 38] NBN is associated with the BRCA1/RAD50- containing complex and plays a role in the cellular response to DNA damage and the maintenance of chromosome integrity. [39] The NBN complex is involved not only in double-strand break repair, but in DNA recombination, maintenance of telomere integrity, cell cycle checkpoint control, and meiosis. The complex containing NBN displays single-strand nuclease activity and is involved in control of intra-S phase as well as G1 and G2 checkpoints. The NBN gene is the root cause of the Nijmegen breakage syndrome and related human disorders.

E) The DNA Kinases.The other DNA repair kinases involved in ataxia telangiectasia-mutated ATM, ABL, RAD-related kinases, DNA-PKs, and cell cycle checkpoint kinases, together with their AFP-3D locations, are discussed below and listed in Table 1 (see ref. 24). In addition, the kinase activities of other DNA, cell cycle, and checkpoint protein interactions with AFP-3D are listed in Table 2. Although modest in effect, these kinase assays demonstrate and confirm the interactions of AFP-3D with many DNA and cell cycle-related enzymes.

Table 1. The DNA-repair protein kinases involved in ataxia telangiectasia and RAD-related kinases are displayed according to their properties. The AFP amino acid sequences that interact with these kinases are shown in the right column.

DNA Kinase NCBI Accession # Amino Acid

Length

Molecular Mass (Kd) Catalytic Kinase Type Potential HAFP Amino Acid Binding Sites
1) Ataxia telangiectasia mutated (ATm) Q13315

AAB65827

NP_000042

3065 348,395 P13/P14 kinase, FAT domain, Ser/Thr/tyr, checkpoint kinase 399GLEEQKY

429NAFLVAYT

449AITRKMAA

461CCQLSEDK

485CIRHEMTP

508RPCFSSLV

529DKFIFHKD

565AFSDDKFI

577GLLEKCCQ

2) Ataxia telangiectasia and RAD3-related (ATR) CAA70298

Q13535

NP_001175

2644 300,454 P13 kinase, Ser/Thr/tyr, RNA helicase, DNA repair protein 426YYLQNAFL

429NAFLVAYT

444SELMAITR

500CTSSYANR

504YANRRPCF

529DKFIFHKD

549KQEFLINL

3) DNA-dependent protein kinase DNA-PK (ATm-related)

DNA-PKCS

P78527


4128 469,090 DNA-PK, P13K, Ser/Thr/tyr, molecular sensor of DNA damage 421KLFEYYLQ

429NAFLVAYT

461CCQLSEDK

481IGHLCIRH

508RPCFSSLV

4) Serine/threonine protein kinase (CHK2) checkpoint 096017 543 60,453 Required for checkpoint-mediated cell cycle arrest, activation of DNA repair, apoptosis, and negative regulation or cell cycle 436KKAPQLTS

440QLTSSELM

5) c-ABL1 Abelson murine leukemia oncogene homolog-1, partner with Philadelphia chromosome P00519 1130 125,804 Cytoplasmic and nuclear protein tyrosine kinase, DNA binding, cell cycle function 421KLGEYYA

477ADIIIGHL

500CTSSYANR

597QKLISKTR

Ser = serine; Thr = threonine; tyr = tyrosine;
PK = protein kinase; RAD3 = DNA helicase domain; FAT = Focal Adhesion Tyrosine Kinase
*Ataxia telangiectasia mutated (ATm) is P13/P14 kinase FAT domain Ser/Thr/tyr, checkpoint kinase AFP = alpha-fetoprotein.

Table 2. The percent of kinase enzyme activity following AFP-3D GIP peptide treatment is listed below.  The control assay was 100% and the inhibition or enhancement is listed as percent activity of the control assays performed in IC50 titration curves.  Note that AFP-3D kinase inhibition is associated with Ser/Thr kinases while Tyr kinases are associated mostly with enhancements.

I.  Kinase Enzyme Name Type c-SRC 2,3* Inhibition Percent ± SD Activity
1) ASK-1 Ser/Thr 28 ± 4 Oxidative stress, MAP-kinases
2) cdK3/cyclin E Ser/Thr 18 ± 0 G1 → S cell cycle control
3) cdK5/p35 Ser/Thr 28 ± 3 G2 → M transition, histone binding
4) MKK7B Ser/Thr 18 ± 9 G2-M arrest, MAP kinase
5) MSK2 Ser/Thr 18 ± 1 Stress, chromatin binding
6) MST1 Ser/Thr 17 ± 14 Histone, telomerase-related
7) PKCa Ser/Thr 23 ± 2 Cell cycle checkpoint
II.  Kinase Enzyme Name Type SRC 2,3 Enhancement Percent ± SD Activity
1) EpHA4 Tyr 30 ± 10 Neurons, cell migration
2) EpHB4 Tyr 19 ± 2 Cell migration, vascular development
3) Erb-B4 Tyr 18 ± 2 Epidermal growth factor signal, mitogenesis
4) EGFR1 Tyr 22 ± 4 Epidermal growth factor receptor, DNA synthesis
5) FGFR2 Tyr 18 ± 1 Adhesion-related mitogenesis, diff.
6) IGF-1R Ser/Thr 18 ± 1 Insulin growth factor, cell division
7) Met Tyr 21 ± 0 Proto-oncogene tumor growth

* Ser/Thr – Serine/thyronine kinase; Tyr – tyrosine kinase;
c-Src – a non-receptor kinase protein of the Ser/Thr or tyrosine type that phosphorylates these residues in other proteins
‡ The kinase activity screen for AFP-3D peptides was performed via the commercial “kinase profiler” by the Upstate Biosignaling Corp., Dundee Technology Park, Dundee, United Kingdom.

Computer Analysis of AFP-3D Interaction with DNA-Repair Proteins

The third domain of AFP is known to interact with a myriad of proteins and compounds including hydrophobic ligands, receptors, and cytoplasmic binding proteins. Previous publications from the author (GJM) and others have confirmed and verified these reports (see above). These interacting agents include fatty acids, steroids (estrogens), retinoids, cation channels, cell cycle proteins, and chemokine, mucin, and scavenger receptors.[8, 9, 11, 13, 23] These interacting agents have previously been mapped to the aminoterminal, middle, and carboxy-terminal portions of the AFP-3D. [8, 13] The amino terminal portion of AFP-3D is known to interact with fatty acids, estrogens, steroids, retinoids and lysophospholipids, while the middle and carboxy-terminus portions react with scavenger, mucin, and cation channels. Lastly, the carboxy-terminal fragment displays interaction sites with cell cycle proteins, cation channels, chemokine receptors, and dimerizing proteins. Data from the present study now reveal that DNA repair proteins represent additional binding/interaction sites on the AFP-3D fragment.

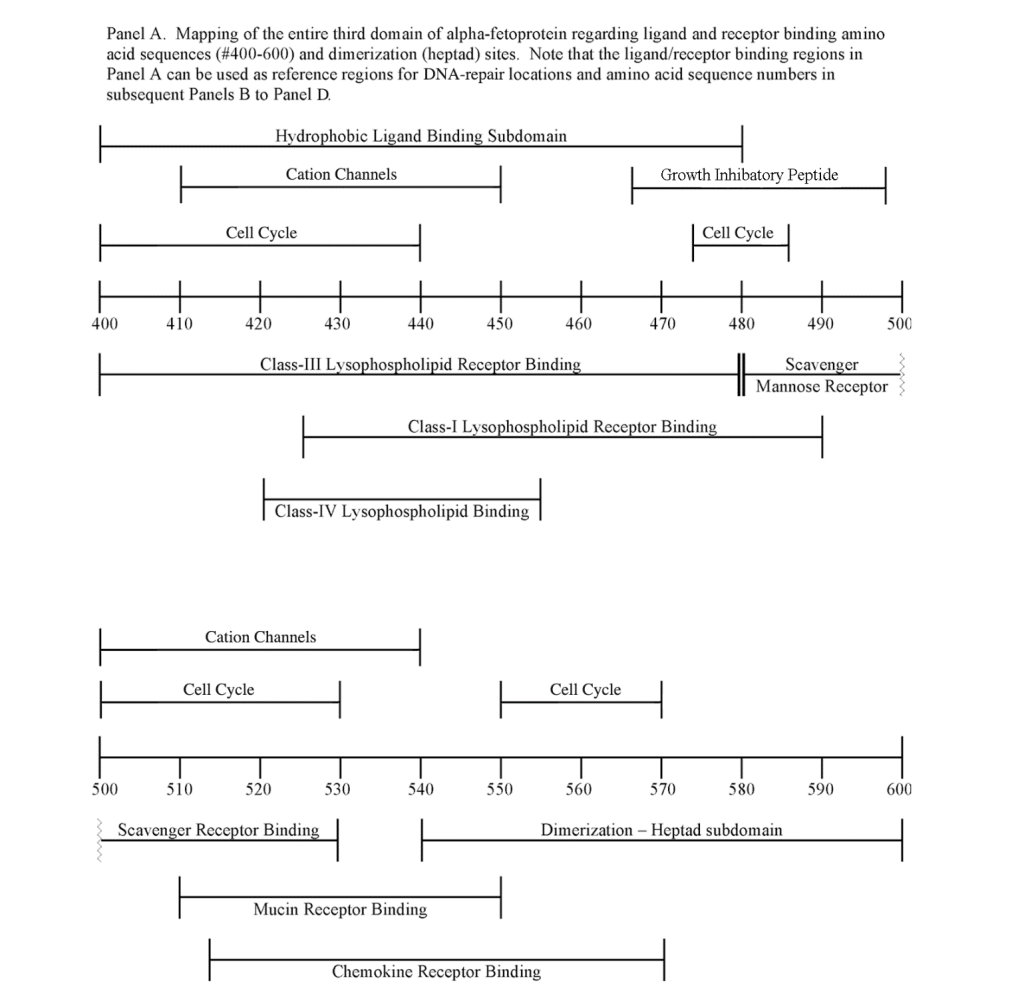
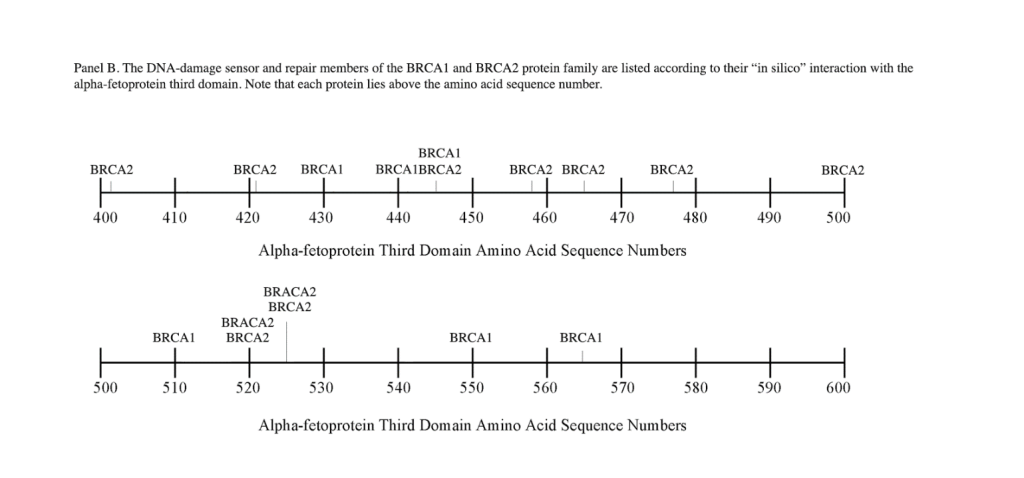
The DNA repair protein interaction sites similar to previous ligands and receptors, were distributed in patterns of interspaced clustered groups throughout the AFP third domain. The BRCA1/BRCA2 sites were heavily distributed on the first half of the AFP-3D fragment from AA #420 to 500, with another cluster localized at AA #510 to 530 with outliers at AA #550 to 565 (Figure 1). Figure 1, Panel A shows that BRCA1/BRCA2 sites were localized within the hydrophobic ligand binding and lysophospholipid receptor subdomain. This site further overlaps with the Growth Inhibitory Peptide (GIP) and cell cycle protein segment, together with the anterior portion of the scavenger receptor sites. The BRCA1/BRCA2 interacting sites at AA #510 to 530 were found to be localized among the cell cycle and cation channel proteins and the mucin/chemokine receptor binding sites.

CST 2017-211 - PanelA

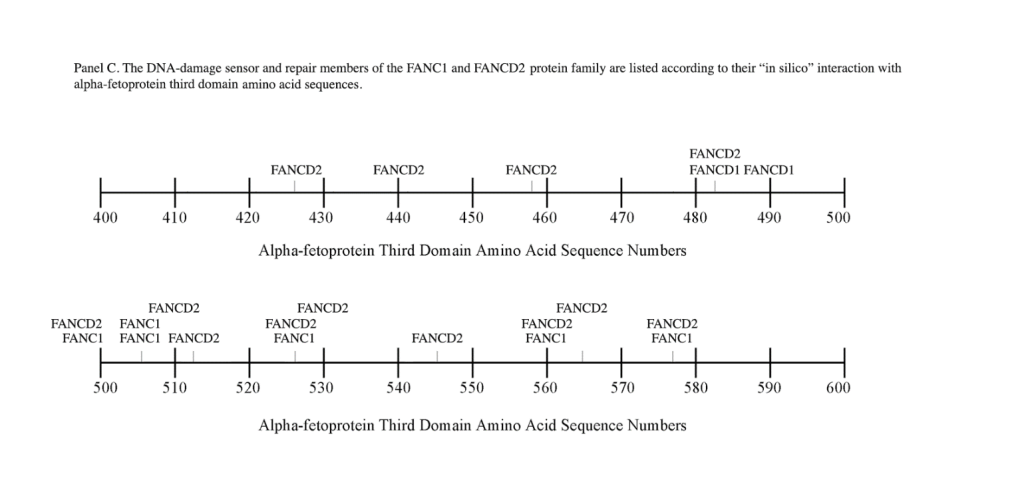
The FANC1/FANCD2 interaction sites were scantily localized at AA #430 to 460 and AA #480 to 490 in contrast, the FANC proteins were heavily distributed within the second half of the AFP-CD segment extending from AA #500 to 580 (Figure 1). As shown with the BRCA1/BRCA2 proteins, the FANC proteins localized among the hydrophobic ligand-binding areas and the GIP segment in the first half of the AFP-3D segment. However, in the second half of AFP-3D, the FANC protein sites were distributed among the scavenger, mucin, and chemokine receptors in addition to the cation channel protein binding/interaction sites.

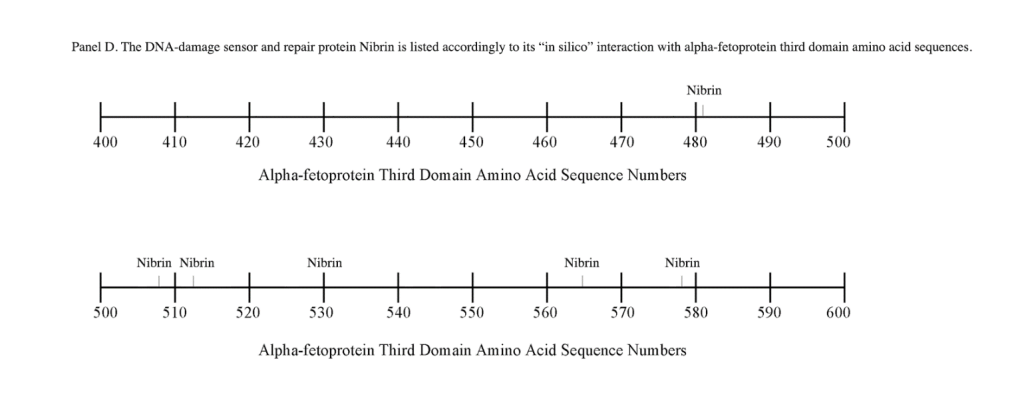
The third DNA repair protein, nibrin, was localized to the AFP- 3D, largely in the second half of the AFP third domain from AA #500 to 530 and AA #565 to 580, with an outlier at AA #480. These regions correspond largely to the scavenger, mucin, and chemokine receptor regions of AFP-3D together with the corresponding protein interaction sites at the GIP AA segment.

Proposed Relationship of DNA Repair Proteins with the AFP-3D Hydrophobic Binding and Receptor Sites

As described above, the DNA repair proteins localization sites were found to coincide with previously identified hydrophobic ligand and receptor binding sites. Prior reports in the literature have described associations and interrelationships that exist between the hydrophobic ligands and the receptors hence, the DNA repair protein pairing localizations may be more than a mere coincidence. For example, the BRCA gene expression is known to be significantly reduced in human (MCF-7) rat mammary tumorigenesis by the supplementation of omega-3 fatty acids (docosahexaenoic acid) in the diet.[40, 41] Prior research showed that BRCA1 acts as a scaffold protein in multiple cellular functions such as transcription, DNA repair, and ubiquitination by interaction with acetyl-CoA carboxylase.[42, 43] BRCA1 is also implicated in novel signaling pathways associated with fatty acid-dependent breast cancer proliferation when associated with supplemented diet fatty acids and ERK1/2, p53-p21 WAF1/CIP1, MAPK, p27 KIP1, and NF-KappaB proteins.[44] The N-3 and N-6 polyunsaturated fatty acids are reported to have differential effects on gene expression of BRCA1 and BRCA2 in human breast cancer cell lines (MCF-7, MDA-MB-231).[45, 46] In contrast, BRCA1 and BRCA2 had no relationships with scavenger receptors and chemokine receptors, as shown in Figure 1 (panels A & B). Moreover, present findings support the association reported in the literature of BRCA1/ BRCA2 DNA-repair proteins with the cell cycle proteins (Figure 1, panels A & B). It was found that the cell cycle proteins were coincident with DNA repair proteins in the localization sites of AA #480 to 490 and AA #510 to 580. Prior studies support this relationship, showing a cyclin-D induced gene amplification and hypermethylation together with CdK12 inhibition in human breast cancer BRCA positive patients.[47-50] In light of the dual localization of mucin receptors and BRCA1/BRCA2 (AA #510 to 530), DNA repair proteins have been studied to determine whether pre- and postoperative CA125 levels are associated with BRCA mutation carriers in ovarian cancer screenings.[51, 52]

CST 2017-211 - PanelB

CST 2017-211 - PanelC

CST 2017-211 - PanelD

Regarding FANC protein localization with hydrophobic ligand and receptor interaction sites, no associations were found relating DNA repair to either fatty acids, mucin receptors, lysophospholipids or cation channels however, DNA repair interaction sites were observed at AA #481 to 504, a known GIP and chemokine receptor area (Figure 1, panel C). Indeed, one study demonstrated a link between chemokine CXCR5 receptors and FANCA-modulated neddylation pathways involved in membrane targeting and cell mobility.[53] Regarding the nibrin protein interaction sites on AFP-CD, NBN sites were largely localized to the second half of the 3D fragment. Nibrin was found to be localized with the ataxia telangiectasia-mutated (ATM) protein, checkpoint kinase-2, and the RAD-related protein (see Table 1, panels A & D), as well as the BRCA1/BRCA2 proteins all of which contribute to breast cancer susceptibility.[54-56] These protein complexes are involved in the dysfunction of specific DNA double-strand break-repair signaling pathways. Other reports of putative ATM in vitro interaction targets include nibrin, RAD17, PTS, and ATM itself.[57]

Relationship of AFP to DNA Damage and Repair Disorders

The correlation of AFP to DNA damage/repair and chromosome instability disorders is well documented, in part because AFP is a biomarker for both immunodeficiency diseases and anemia disorders.[23, 27] Elevated AFP serum levels have been reported in immunodeficiency disorders such as ataxia telangiectasia (AT) and ataxia ocular apraxia (AOA2). The AOA2 disorder displays aberrant DNA repair proteins, ATM mutated in AT and senataxin in AOA, and ATR in AT and RAD3-related disorders.[58, 59] AFP intracellular levels have also been correlated with intracytoplasmic levels of GADDI53 (growth arrest and DNA damage-inducible gene I53) in vascular smooth muscle cell death.[60]

AT is a chromosomal instability disorder caused by an autosomal recessive gene. AT is characterized by increased cell radio-sensitivity and multiple chromosomal aberrations in the DNA of immune cells these include gaps, breaks, dicentrics, and multiple-radial configurations. Most patients (90%) with AT display high serum AFP levels, which can range from 30 to 400 ng/mL.[61-63] ATM interaction sites on AFP-3D were presently localized at AA #429 to 485, AA #500 to 506, and AA #560 to 580 (Figure 1). Patients with AT also exhibit aberrant cell checkpoint proteins that allow continuation through the cell cycle, despite DNA breaks that require repair before the next replication stage occurs. As a consequence, AT patients show a propensity to develop cancer later in life.

Once cloned, the ATM protein was found to be a kinase that shares sequence homology with RAD-3, a kinase that regulates passage (via checkpoints) through the cell cycle after DNA damage has occurred. ATM is also involved with the PI3-kinase signal transduction pathway. [64] The RAD-3 kinase has been cloned and named the AT-RAD3- related (ATR) kinase. The ATR kinase was presently localized on AFP- 3D in two clusters, one at AA #426 to 444 and the other at AA #500 to 539. The former cluster lies directly within the hydrophobic ligand binding region, the cation channel, and the lysophospholipid receptor interaction sites. The latter site was localized among the scavenger, mucin, and chemokine receptor and cell cycle interaction sites. It is of interest that the latter site coincides with cell cycle-associated checkpoint proteins during cell cycle progression.[65, 66] Non-mutated AT/ATR protein kinases sense the presence of double stranded DNA damage and are known to mediate an appropriate repair response. Lastly, a phosphoinositol kinase-3 (PI3-kinase) that associates with the ATM/ATR protein complex, termed DNA-PKCS (Table 1), is a required kinase associated with DNA repair of non-homologous end joining, whose absence results in chromosomal aberrations.[67] The DNA-PKCS interaction sites were localized on AFP-3D at AA #420 to 481, coinciding with hydrophobic binding and the cation channel sites, as well as cell-cycle associated and lysophospholipid receptor interaction sites (Table 1, Figure 1, panel A).

Fanconi’s Anemia (FA) is another DNA-damage/repair disorder associated with both chromosome instability and elevated serum AFP levels both in early infancy and adults. FA represents a progressive, autosomal recessive disorder that exhibits DNA damage, chromosomal breaks, bone marrow failure, and a predisposition to malignancies. [68] Cells from FA patients further display a delay and/or arrest in the G2-to-mitotic transition phase of the cell cycle. As discussed earlier, the FANC proteins represent a complementation group made up of multiple different proteins. However, the present study only addresses FANC1 and FAND2. The origin and source of elevated AFP in FA is presently unknown, since liver dysfunction abnormalities and disease (cancer) are not involved with FA. The author.[27] has suggested that the origin of AFP synthesis and production may lie in the existence of three stem-progenitor cell types present in adult bone marrow namely, fetal hepatic stem/progenitor cells and intrinsic hematopoietic stem/ progenitor cells (HSPC). A third stem bone marrow cell termed the “mesenchymal stem cell” is capable of migrating to the liver and differentiating into hepatocyte-like stem cells following hepatic failure, regeneration, and liver transplantation. Interestingly, the classical hepatic oval cell population surrounding bile ducts are the actual cells that secrete AFP and express the immature stem cell markers CD34 and CD45. Thus, small to moderate amounts of AFP production/secretion could occur in acutely anemic bone marrow with no detectable liver damage, dysfunction, or disease in the FA patient.

Concluding Remarks

It is well-established in the literature that the AFP-3D houses subdomain interaction (interface) sites for a myriad of ligands, receptors, cation channels, cell cycle proteins most recently, DNA damage/repair proteins have been added to this list.[8, 9, 13] These third domain protein interaction sites were first detected by computer analysis, and then verified in cell-based assays, microarray analysis, in vitro cell cultures, and in vivo animal (xenograft) models. For example, an RNA global microarray analysis using AFP-3D derived peptides (see GIP sequence, Figure 1) demonstrated that DNA repair proteins do indeed react with the AFP-GIP amino acid sequences #464-496.[14] The microarray analysis showed that the GIP AA sequences downregulated the mRNA of FANCD2 and up-regulated BRCA1 and RAD54c (Table 2). In addition, histone-1-H4g (DNA-repair) and checkpoint suppressor-1 were greatly downregulated, while multiple DNA repair proteins were modestly upregulated in proteins such as BRCA1 ring domain and RAD5/c (Table 3). Hence, published data confirms that AFP AA sequences on AFP-3D can interact and regulate the RNA of DNA repair proteins in conjunction with cell cycle progression proteins. It is conceivable that the different ligands, proteins, channels, and receptors could react simultaneously in combination with, or in competition with, direct or adjacent interaction sites.

Table 3. Global RNA microarray data following AFP-derived peptide treatment:  Transcripts displaying 1.0 or larger log fold (log base 2.0) decrease for genes associated with cell division and proliferation processes, ubiquitization, and DNA repair proteins obtained from human MCF-7 breast cancer cells in vitro.*

GENE PROTEIN TITLE
Part I.  Cell Cycle Regulation/DNA Repair FOLD DECREASE (–)  


CELL FUNCTION

1. Checkpoint suppressor-1 (CHES1)(FOXN3) –9.2 S-phase checkpoint
2. Cyclin-E** –4.6 Regulates G-S transition
3. Transcription Dp-1 (TFDP1) –4.3 G1 to S-phase transition
4. CDC20 cell division homolog –4.3 Regulation of cell cycle
5. Histone-1, H4g (HIST1H4G) –3.2 DNA repair/replication
6. Fanconi anemia-D2 (FRANCD2) –2.0 DNA repair/synthesis
7. TAF-1-like polymerase –0.8 DNA repair/synthesis
8. Excision repair cross complement –0.5 DNA repair
 
Part II. Cell Cycle Phase Transition and DNA Repair FOLD INCREASE (+)  


CELL FUNCTION

1. RAD5/c +1.5 DNA repair
2. Polymerase DNA directed kappa +0.5 DNA repair
3. BRCA1 associated ring domain +0.4 DNA repair
4. Methyl GpG binding domain +0.4 DNA repair
5. CDC2 cell division C2 +0.4 G1-S, G2-M transition
6. RAD54 homolog-B +0.4 DNA repair
7. Ubiquitin-specific protease-1 +0.3 DNA repair
8. S-phase kinase-associated protein-2 +0.3 G1-S-phase transition

* Expression of 716 transcripts was significantly altered in MCF-7 cells after 8 days of treatment with GIP as compared to treatment with the scrambled peptide.  Four-hundred thirty RNAs were down-regulated, while 286 RNAs were upregulated.
** Real time PCR.  Collaborative data was provided by Kathleen Arcaro, University of Massachusetts, Amherst, MA (14).

The interaction sites described in this report obviously have links to other proximal and/or distal sites along the AFP third domain fragment. As discussed above, literature-based reports have documented that DNA-repair proteins do in fact interact with cell cycle checkpoint proteins to arrest cell cycle progression.[69] Furthermore, BRCA1/BRCA2 can act as scaffold proteins in the ubiquitinization of cell cycle proteins through a proteasomal pathway [70] As shown above, BRCA1/BRCA2 were found to be associated with fatty acid-dependent breast cancer growth.[40-43] Prior reports have further demonstrated that computer-derived cation channel interaction sites were localized at hydrophobic ligand as well as lysophospholipid receptor binding sites.[71] Thus, it is plausible that the clustered localization of channel and cell cycle proteins with DNA repair proteins could be physiologically relevant.

In the present report, evidence was presented that several mutated proteins of the DNA-damage/repair pathways are associated with cancer susceptibility, tumorigenesis, and enhancement of tumor progression, most notably in breast and ovarian cancer, but in other cancers as well. The BRCA and FA-related protein mutations leading to anemia subjects these patients to develop tumors later in life.[72] A significant connection of AFP to FA-mutated DNA repair proteins lies in the elevations of serum AFP in such anemic patients. There are further correlations with breast cancer and its associated BRCA1/ BRCA2 mutated proteins. Sarcione et al. has reported that a circulating bound form of serum AFP, as opposed to free circulating AFP, exists in some female breast cancer patients. This bound form of AFP could be experimentally released by high KCl solutions and measured by immunological assays.[73] Although the bound entity is not known, an IgM molecule has been similarly reported to complex with serum AFP as a bound form.[73] It has also been reported that an intracytoplasmic non-secreted form of AFP is present in normal cells, as well as cancer cells. The non-secreted cytoplasmic AFP (cAFP) form has been shown to participate in kinase regulation, transcription, apoptosis, nuclear hormone binding, transnuclear passage, and regulation of nuclear gene expression.[74, 75] One mechanism of this AFP interaction in cytoplasmic protein activities involves the heterodimerization of AFP with proteins such as cytoplasmic caspases and retinoic acid nuclear receptors.[76] (Figure 1, panel A). Thus, these observations support the contention that cAFP reacts with intracytoplasmic proteins such as the BRCA1/BRCA2, FANC1/FANCD2, nibrin, ATM, and ATR, as suggested by the present report. Furthermore, the reported observations of interaction of AFP-3D with cell cycle proteins, together with the DNA-repair proteins association with cell cycle checkpoints, allows for speculation that AFP could mask, interfere, enhance, or interpose itself into the DNA-repair process of the cell cycle checkpoint regulation pathway. The RNA microarray analyses (Table 3) are consistent with this supposition. The above studies beg the question of whether cAFP (by means of the third domain) is a prime regulatory factor in the overall scheme of DNA repair during cell cycle progression.

Acknowledgements: The author thanks Kathleen Arcaro, University of Massachusetts, Amherst, MA for providing data on the RNA microarray analysis. The author also wishes to thank Mr. Andrew Bentley (Wadsworth Center Photography and Medical Illustration Department) for his expertise in producing the figures and graphic art illustrations and Ms. Tracy Godfrey for her typing, corrections, revisions, and processing of this manuscript.

Competing interests: The author declares that he has no competing interests.

Funding information: The author has no such involvement

Abbreviations

AA – amino acid
AFP – alpha-fetoprotein 3D – third domain
DNA – deoxyribonucleic acid
DDSR – DNA damage-sensing and repair
PI3K – phosphoinositol kinase
mTOR – mechanistic target of rapamycin
GAAD153 – growth arrest and DNA damage-inducible-protein-153
PTEN – phosphatase and tensin homolog
ATM – ataxia telangiectasia-mutated
FA – Fanconi’s anemia
CHK – checkpoint
BRCA – breast cancer
RAD (ATR) – AT-related repair of DNA
NBN – nibrin
ABL – Abelson leukemia oncogene
GIP – growth inhibitory peptide
CdK-cyclin dependent kinase
PTS – 6-pyruvoyltetrahydropterin synthase
AOA – ataxia ocular apraxia
PKC – protein kinase- C.

References

  • Mizejewski GJ (2002) Biological role of alpha-fetoprotein in cancer: prospects for anticancer therapy. Expert Rev Anticancer Ther.
  • Mizejewski GJ (2004) Biological roles of alpha-fetoprotein during pregnancy and perinatal development. Exp Biol Med (Maywood) 229: 439-463. [crossref]
  • Mizejewski GJ (2001) Alpha-fetoprotein structure and function: relevance to isoforms, epitopes, and conformational variants. Exp Biol Med (Maywood). 2001 May.
  • Mizejewski GJ (1997) alpha-fetoprotein as a biologic response modifier: relevance to domain and subdomain structure. Proc Soc Exp Biol Med 215: 333-362. [crossref]
  • Naidu S, Peterson ML, Spear BT (2010) Alpha-fetoprotein related gene (ARG): a new member of the albumin gene family that is no longer functional in primates. Gene 449: 95-102. [crossref]
  • Herve F, Rajkowski KM, Martin MT, Dessen P, et al. (1986) Drug-binding properties of rat alpha-foetoprotein. Specificities of the phenylbutazone-binding and warfarin-binding sites. Biochem J.
  • Li MS, Li PF, He SP, Du GG, Li G (2002) The promoting molecular mechanism of alpha-fetoprotein on the growth of human hepatoma Bel7402 cell line. World J Gastroenterol 8: 469-475. [crossref]
  • Mizejewski GJ (2015) The alpha-fetoprotein third domain receptor binding fragment: in search of scavenger and associated receptor targets. J Drug Target.
  • Mizejewski GJ (2013) Review of the adenocarcinoma cell surface receptor for human alpha-fetoprotein; proposed identification of a widespread mucin as the tumor cell receptor. Tumour Biol.
  • Atemezem A, Mbemba E, Marfaing R, Vaysse J, Pontet M, et al. (2002) Human alpha-fetoprotein binds to primary macrophages. Biochem Biophys Res Commun 296: 507-514. [crossref]
  • Mizejewski GJ (2015) Nonsecreted cytoplasmic alpha-fetoprotein: a newly discovered role in intracellular signaling and regulation. An update and commentary. Tumour Biol.
  • Li M, Li H, Li C, Zhou S, et al. (2009) Alpha fetoprotein is a novel protein-binding partner for caspase-3 and blocks the apoptotic signaling pathway in human hepatoma cells. Int J Cancer.
  • Mizejewski GJ (2016) The alpha-fetoprotein (AFP) third domain: a search for AFP interaction sites of cell cycle proteins. Tumour Biol.
  • Mizejewski GJ (2011) Mechanism of Cancer Growth Suppression of Alpha-Fetoprotein Derived Growth Inhibitory Peptides (GIP): Comparison of GIP-34 versus GIP-8 (AFPep). Updates and Prospects. Cancers (Basel).
  • Posypanova GA, Gorokhovets NV, Makarov VA, Savvateeva LV, et al. (2008) Recombinant alpha-fetoprotein C-terminal fragment: the new recombinant vector for targeted delivery. J Drug Target.
  • Posypanova GA, Makarov VA, Savvateeva MV, Bereznikova AV, et al. (2013) The receptor binding fragment of alpha-fetoprotein is a promising new vector for the selective delivery of antineoplastic agents. J Drug Target.
  • Yabbarov NG, Posypanova GA, Vorontsov EA, Obydenny SI, et al. (2013) A new system for targeted delivery of doxorubicin into tumor cells. J Control Release.
  • Sharapova OA, Pozdnykova NV, Laurinavichyute DK, Yurkova MS, et al. (2010) High-efficient expression, refolding and purification of functional recombinant C-terminal fragment of human alpha-fetoprotein. Protein Expr Purif.
  • Sharapova OA, Iurkova MS, Andronova SM, Fedorov AN, et al. (2011) [High-efficient renaturation of immobilized recombinant C-terminal fragment of human alpha-fetoprotein]. Prikl Biokhim Mikrobiol.
  • Sharapova OA, Pozdniakova NV, Laurinavichiute DK, Iurkova MS, et al. (2010) [Purification and characterization of recombinant human alpha-fetoprotein fragment, corresponding to the C-terminal structural domain]. Bioorg Khim.
  • Carter DC, He XM, Munson SH, Twigg PD, Gernert KM, et al. (1989) Three-dimensional structure of human serum albumin. Science 244: 1195-1198. [crossref]
  • Osmond RI, Das S, Crouch MF (2010) Development of cell-based assays for cytokine receptor signaling, using an AlphaScreen SureFire assay format. Anal Biochem 403: 94-101. [crossref]
  • Mizejewski G (2014) Alpha-fetoprotein as a biomarker in immunodeficiency diseases: relevance to ataxia telangiectasia and related disorders. J Immunodeficiency and Disorders.
  • Duncan JA, Reeves JR, Cooke TG (1998) BRCA1 and BRCA2 proteins: roles in health and disease. Mol Pathol 51: 237-247. [crossref]
  • Friedenson B (2007) The BRCA1/2 pathway prevents hematologic cancers in addition to breast and ovarian cancers. BMC Cancer 7: 152. [crossref]
  • Yoshida K and Miki Y (2004) Role of BRCA1 and BRCA2 as regulators of DNA repair, transcription, and cell cycle in response to DNA damage. Cancer Sci.
  • Lakhi NA and Mizejewski GJ (2016) Alpha-fetoprotein and Fanconi Anemia: Relevance to DNA Repair and Breast Cancer Susceptibility. Fetal Pediatr Pathol.
  • Starita LM, Parvin JD (2003) The multiple nuclear functions of BRCA1: transcription, ubiquitination and DNA repair. Curr Opin Cell Biol 15: 345-350. [crossref]
  • Wang Y, Cortez D, Yazdi P, Neff N, et al. (2000) BASC, a super complex of BRCA1-associated proteins involved in the recognition and repair of aberrant DNA structures. Genes Dev.
  • Paterson JW (1998) BRCA1: a review of structure and putative functions. Dis Markers 13: 261-274. [crossref]
  • Henderson BR (2005) Regulation of BRCA, BRCA2 and BARD1 intracellular trafficking. Bioessays 27: 884-893. [crossref]
  • Xia B, Sheng Q, Nakanishi K, Ohashi A, Wu J, et al. (2006) Control of BRCA2 cellular and clinical functions by a nuclear partner, PALB2. Mol Cell 22: 719-729. [crossref]
  • Buisson R, Dion-Cote AM, Coulombe Y, Launay H, et al. (2010) Cooperation of breast cancer proteins PALB2 and piccolo BRCA2 in stimulating homologous recombination. Nat Struct Mol Biol.
  • Kondo N, Takahashi A, Mori E, Noda T, et al. (2011) FANCD1/BRCA2 plays predominant role in the repair of DNA damage induced by ACNU or TMZ. PLoS One.
  • O’Driscoll M, Ruiz-Perez VL, Woods CG, Jeggo PA, et al. (2003) A splicing mutation affecting expression of ataxia-telangiectasia and Rad3-related protein (ATR) results in Seckel syndrome. Nat Genet.
  • Smogorzewska A, Matsuoka S, Vinciguerra P, McDonald ER, 3rd, et al. (2007) Identification of the FANCI protein, a monoubiquitinated FANCD2 paralog required for DNA repair.
  • Desai-Mehta A, Cerosaletti KM and Concannon P (2001) Distinct functional domains of nibrin mediate Mre11 binding, focus formation, and nuclear localization. Mol Cell Biol.
  • Chen YC, Su YN, Chou PC, Chiang WC, Chang MC, et al. (2005) Overexpression of NBS1 contributes to transformation through the activation of phosphatidylinositol 3-kinase/Akt. J Biol Chem 280: 32505-32511. [crossref]
  • Zhong Q, Chen CF, Li S, Chen Y, Wang CC, et al. (1999) Association of BRCA1 with the hRad50-hMre11-p95 complex and the DNA damage response. Science 285: 747-750. [crossref]
  • Jourdan ML, Mahéo K, Barascu A, Goupille C, De Latour MP, et al. (2007) Increased BRCA1 protein in mammary tumours of rats fed marine omega-3 fatty acids. Oncol Rep 17: 713-719. [crossref]
  • Bernard-Gallon DJ, Vissac-Sabatier C, Antoine-Vincent D, Rio PG, et al. (2002) Differential effects of n-3 and n-6 polyunsaturated fatty acids on BRCA1 and BRCA2 gene expression in breast cell lines. Br J Nutr.
  • Moreau K, Dizin E, Ray H, Luquain C, Lefai E, et al. (2006) BRCA1 affects lipid synthesis through its interaction with acetyl-CoA carboxylase. J Biol Chem 281: 3172-3181. [crossref]
  • Hilakivi-Clarke L, Olivo SE, Shajahan A, Khan G, Zhu Y, et al. (2005) Mechanisms mediating the effects of prepubertal (n-3) polyunsaturated fatty acid diet on breast cancer risk in rats. J Nutr 135: 2946S-2952S. [crossref]
  • Menendez JA, Mehmi I, Atlas E, Colomer R, et al. (2004) Novel signaling molecules implicated in tumor-associated fatty acid synthase-dependent breast cancer cell proliferation and survival: Role of exogenous dietary fatty acids, p53-p21WAF1/CIP, ERK1/2 MAPK, p27KIP,  BRCA,  and NF-kappaB. Int J Oncol.
  • Kachhap SK, Dange PP, Santani RH, Sawant SS, et al. (2001) Effect of omega-3 fatty acid (docosahexanoic acid) on BRCA1 gene expression and growth in MCF-7 cell line. Cancer Biother Radiopharm.
  • Bernard-Gallon DJ, Maurizis JC, Rio PG, Bougnoux P, Bignon YJ (1998) Effects of monounsaturated and polyunsaturated fatty acids (omega-3 and omega-6) on Brca1 protein expression in breast cell lines. J Natl Cancer Inst 90: 1234-1235. [crossref]
  • Locke I, Kote-Jarai Z, Fackler MJ, Bancroft E, et al. (2007) Gene promoter hypermethylation in ductal lavage fluid from healthy BRCA gene mutation carriers and mutation-negative controls. Breast Cancer Res.
  • Johnson SF, Cruz C, Greifenberg AK, Dust S, et al. (2016) CDK12 Inhibition Reverses De Novo and Acquired PARP Inhibitor Resistance in BRCA Wild-Type and Mutated Models of Triple-Negative Breast Cancer. Cell Rep.
  • Osin P, Gusterson BA, Philp E, Waller J, et al. (1998) Predicted anti-oestrogen resistance in BRCA-associated familial breast cancers. Eur J Cancer.
  • Plevova P,  Cerna D, Balcar A, Foretova L, Zapletalova J, et al. (2010) CCND1 and ZNF217 gene amplification is equally frequent in BRCA1 and BRCA2 associated and non-BRCA breast cancer. Neoplasma 57: 325-332. [crossref]
  • Fields MM, Chevlen E (2006) Ovarian cancer screening: a look at the evidence. Clin J Oncol Nurs 10: 77-81. [crossref]
  • Tierney BJ, McCann GA, Cohn DE, Eisenhauer E, et al. (2012) HO-3867, a STAT3 inhibitor induces apoptosis by inactivation of STAT3 activity in BRCA1-mutated ovarian cancer cells. Cancer Biol Ther.
  • Renaudin X, Guervilly JH, Aoufouchi S and Rosselli F (2014) Proteomic analysis reveals a FANCA-modulated neddylation pathway involved in CXCR5 membrane targeting and cell mobility. J Cell Sci.
  • Uzunoglu H, Korak T, Ergul E, Uren N, et al. (2016) Association of the nibrin gene (NBN) variants with breast cancer. Biomed Rep.
  • Cerosaletti KM and Concannon P (2003) Nibrin forkhead-associated domain and breast cancer C-terminal domain are both required for nuclear focus formation and phosphorylation. J Biol Chem.
  • Damiola F, Pertesi M, Oliver J, Le Calvez-Kelm F, et al. (2014) Rare key functional domain missense substitutions in MRE11A, RAD50, and NBN contribute to breast cancer susceptibility: results from a Breast Cancer Family Registry case-control mutation-screening study. Breast Cancer Res.
  • Keimling M, Volcic M, Csernok A, Wieland B, et al. (2011) Functional characterization connects individual patient mutations in ataxia telangiectasia mutated (ATM) with dysfunction of specific DNA double-strand break-repair signaling pathways. FASEB J.
  • Suraweera A, Becherel OJ, Chen P, Rundle N, et al. (2007) Senataxin, defective in ataxia oculomotor apraxia type 2, is involved in the defense against oxidative DNA damage. J Cell Biol.
  • Asaka T, Yokoji H, Ito J, Yamaguchi K, et al. (2006) Autosomal recessive ataxia with peripheral neuropathy and elevated AFP: novel mutations in SETX.
  • Igase M, Okura T, Nakamura M, Takata Y, et al. (2001) Role of GADD153 (growth arrest- and DNA damage-inducible gene 153) in vascular smooth muscle cell apoptosis. Clin Sci (Lond).
  • Waldmann TA, McIntire KR (1972) Serum-alpha-fetoprotein levels in patients with ataxia-telangiectasia. Lancet 2: 1112-1115. [crossref]
  • Ishiguro T, Taketa K, Gatti RA (1986) Tissue of origin of elevated alpha-fetoprotein in ataxia-telangiectasia. Dis Markers 4: 293-297. [crossref]
  • Stray-Pedersen A, Borresen-Dale AL, Paus E, Lindman CR, Burgers T, et al. (2007) Alpha fetoprotein is increasing with age in ataxia-telangiectasia. Eur J Paediatr Neurol 11: 375-380. [crossref]
  • Lavin MF, Khanna KK, Beamish H, Spring K, et al. (1995) Relationship of the ataxia-telangiectasia protein ATM to phosphoinositide 3-kinase. Trends Biochem Sci.
  • Dierov J, Dierova R and Carroll M. BCR/ABL translocates to the nucleus and disrupts an ATR-dependent intra-S phase checkpoint. Cancer Cell. 2004 Mar.
  • Dart DA, Adams KE, Akerman I and Lakin ND (2004) Recruitment of the cell cycle checkpoint kinase ATR to chromatin during S-phase. J Biol Chem.
  • Hartley KO, Gell D, Smith GC, Zhang H, et al. (1995) DNA-dependent protein kinase catalytic subunit: a relative of phosphatidylinositol 3-kinase and the ataxia telangiectasia gene product.
  • Yang YG, Herceg Z, Nakanishi K, Demuth I, et al. (2005) The Fanconi anemia group A protein modulates homologous repair of DNA double-strand breaks in mammalian cells.
  • Nilsson I, Hoffmann I (2000) Cell cycle regulation by the Cdc25 phosphatase family. Prog Cell Cycle Res 4: 107-114. [crossref]
  • Carlucci A, D’Angiolella V2 (2015) It is not all about BRCA: Cullin-Ring ubiquitin Ligases in ovarian cancer. Br J Cancer 112: 9-13. [crossref]
  • Mizejewski GJ (2016) Review of the Third Domain Receptor Binding Fragment of Alpha-fetoprotein (AFP): Plausible Binding of AFP to Lysophospholipid Receptor Targets. Current Drug Targets.
  • L, Liu P, Evans TC, Jr. and Ettwiller LM (2017) DNA damage is a pervasive cause of sequencing errors, directly confounding variant identification.
  • Sarcione EJ and Biddle W (1987) Elevated serum alpha fetoprotein levels in postmenopausal women with primary breast carcinoma. Dis Markers.
  • Beneduce L, Castaldi F, Marino M, Tono N, et al. (2004) Improvement of liver cancer detection with simultaneous assessment of circulating levels of free alpha-fetoprotein (AFP) and AFP-IgM complexes. Int J Biol Markers.
  • Jingting J, Changping W, Ning X, Yibei Z, et al. (2009) Clinical evaluation of serum alpha-fetoprotein-IgM immune complexes on the diagnosis of primary hepatocellular carcinoma. J Clin Lab Anal.
  • Li M, Li H, Li C, Guo L, et al. (2009) Cytoplasmic alpha-fetoprotein functions as a co-repressor in RA-RAR signaling to promote the growth of human hepatoma Bel 7402 cells. Cancer Lett.

Hormonal Aspects of Post-Traumatic Stress Disorder

DOI: 10.31038/EDMJ.2017125

Abstract

Post-Traumatic Stress Disorder (PTSD) is a common and debilitating condition in the United States affecting an estimated 7.7 million adults annually. Women are twice as likely to be diagnosed as men. Individuals who have been exposed to military combat, victims of natural disasters, concentration camp survivors, and victims of violent crime are at particular risk for PTSD, but not all victims of trauma will suffer from PTSD. Hallmarks of the disorder include intrusive memories, flashbacks, and nightmares which result in compensatory behaviors to avoid triggering stimuli, as well as emotional blunting. Management of PTSD typically involves medication and psychotherapy, especially cognitive-behavioral therapy, but complementary and alternative medicine, or mind-body approaches that occur outside of traditional medical venues, are also being utilized.

The proposed mechanisms for PTSD are multifaceted. Dysregulation of neuroendocrine pathways and feedback loops have been commonly implicated in the pathogenesis of PTSD, but a definitive unifying framework for the etiology of this disorder has not yet been identified. Dysregulation of the Hypothalamic-Pituitary-Adrenal (HPA) axis is commonly invoked in the pathogenesis or pathophysiologic response to PTSD, but abnormalities of adrenal catecholamines, neuroendocrine transmitters in the brain, the pituitary-thyroid axis, and sex hormone regulation have also been identified.

The goal of this report is to review the literature to-date that examines the potential role of hormones in PTSD, and to explore limitations to methodologies and testing that might account for variation in the literature.

Keywords

PTSD, hormones, neuroendocrine, HPA

Introduction

Post-Traumatic Stress Disorder (PTSD) was first recognized as a distinct diagnostic entity in 1980 by the American Psychiatric Association when it was included in the DSM-III. Despite a 36-year history, however, it remains underdiagnosed and misunderstood. PTSD’s emergence as a distinct diagnosis filled an important void in psychiatric theory and practice by acknowledging that an external trauma may cause symptoms, as opposed to the view that such symptoms are attributable to an individual’s weakness (e.g., a traumatic neurosis). Exposure to any traumatic event can induce PTSD, although it is difficult to predict who will be affected and who will not. Those diagnosed with PTSD are predictably at risk for a reduced quality of life, substance abuse, suicide, reduced productivity, domestic violence, impaired relationships, and other risky and unhealthy behaviors [1]. The U.S. Department of Defense has invested significant resources into the research, development, and implementation of PTSD programs. Consequently, the majority of studies to date have been performed on males with active combat experience. Unfortunately, only 23 to 40 percent of veterans who screen positive for PTSD seek and receive medical care [2]. Pharmacological and cognitive therapy interventions for those who suffer from PTSD have been shown to have some positive effects, but many veterans do not seek medical assistance for their symptoms and consequently self-medicate. When they do seek treatment, patients may instead turn to complementary and alternative treatments [3].

The intent of this review is to examine the neuroendocrine dysregulation associated with PTSD, consider potential treatment avenues, and explore potential causes for the apparently conflicting data that have appeared over the decades.

For the purposes of this review, a query of the PubMed database was performed in the fall of 2016 that cross-referenced “Post Traumatic Stress Disorder” or “PTSD” with the following terms: pathophysiology, endocrine, hormones, cortisol, catecholamines, pituitary, testosterone, symptoms, human studies, and military literature. These terms were expected to link the endocrine phenomena with psychiatric topics of interest. A total of 58 studies were identified and are reviewed here.

Part 1: The Role of Hormones in the Pathogenesis of Post-Traumatic Stress Disorder

The Hypothalamo-Pituitary-Adrenal (HPA) System

Stimulation of the HPA axis begins in the paraventricular nucleus (PVN) of the hypothalamus. Under normal physiology the PVN receives crosstalk from the suprachiasmatic nucleus to modulate diurnal variations [4]. However, in response to stressors, the PVN releases corticotropin releasing hormone (CRH) and arginine vasopressin. In turn, CRH acts on the anterior pituitary gland to stimulate secretion of ACTH, which then acts on the adrenal cortex to stimulate secretion of cortisol. Hormones at each step of this cascade feedback on preceding levels to attenuate additional secretion.

The most relevant data gathered regarding the pathogenesis of PTSD pertain to the HPA axis and support disturbed feedback inhibition and blunted cortisol responses to stress. Studies that have evaluated ACTH levels in patients with PTSD have demonstrated normal concentrations, or levels that are comparable to control groups, but Bremner et al. have documented higher cerebrospinal fluid (CSF) concentrations of CRH in Vietnam veterans with PTSD as compared to healthy controls [5]. They surmise that higher concentrations of CRH in the CSF of PTSD patients reflect alterations in stress-related neurotransmitter systems and that higher CSF CRH concentrations may play a role in disturbances of arousal in such patients. Savic et al. examined 400 participants divided into four groups: 133 individuals with current PTSD, 66 subjects with a history of PTSD, 102 trauma controls without PTSD, and 99 healthy controls [6]. ACTH concentrations were assessed after overnight dexamethasone suppression, and no significant differences were observed between groups. Similarly, a pilot study by Muhtz et al. examined 14 patients with chronic PTSD and 14 healthy controls without PTSD [7]. They combined a low dose (0.5 mg) of oral dexamethasone at 23:00 followed by 100 mcg IV CRH 16 hours later. ACTH was measured at -15, 0 and every 15 minutes thereafter for a total of 135 minutes. No significant differences were observed in ACTH levels between the two study groups, but they did find that individuals with a history of early childhood trauma had higher post-suppression ACTH levels than those without childhood trauma. They suggest that the type of trauma may play a role in the multifactorial metabolic derangements of PTSD. In general, these data underscore that no differences exist in ACTH levels among groups, but a question remains about whether CRH is elevated and whether this affects the dynamics of stress arousal in patients.

Conversely, De Kloet et al. evaluated 23 veterans with PTSD, 22 trauma patients without PTSD, and 24 healthy controls in the afternoon following overnight administration of 0.5 mg dexamethasone [8]. They found that there were marginally higher ACTH concentrations among the PTSD patients at 16:00 on a day when dexamethasone was not given (p =0.06) and at 20:00 on a day following administration of dexamethasone (p=0.04), but there was not a significant difference between the study groups in the degree of post-dexamethasone suppression. As shown in Figure 1, PTSD patients also demonstrate a significantly blunted salivary cortisol (a surrogate for free cortisol) upon awakening as compared to healthy control subjects (but not trauma control subjects). Kellner et al. also found no difference when comparing ACTH concentrations between 17 individuals with PTSD and 17 healthy controls without PTSD [9]. These data indicate that no reproducible, clinically significant differences exist between the ACTH levels of PTSD patients as compared with unaffected control subjects.

Figure 1. Salivary cortisol response to awakening among 23 Dutch Military Veterans with PTSD (solid squares) as compared to 24 Healthy Control subjects (solid circles).  Adapted from de Kloet et al. [7].

Figure 1. Salivary cortisol response to awakening among 23 Dutch Military Veterans with PTSD (solid squares) as compared to 24 Healthy Control subjects (solid circles). Adapted from de Kloet et al. [7].

Other investigators, however, have been able to demonstrate some dysregulation of the pituitary-adrenal axis through careful assessment. In attempt to elucidate the mechanism of an observed paradoxical increase in CRH in the setting of reduced baseline cortisol concentrations among patients with PTSD, Yehuda et al. performed an elaborate study among 19 male and female subjects with PTSD as compared to 19 male and female controls [10]. They posited two potential mechanisms for this finding, including enhanced negative feedback of cortisol on the hypothalamus versus reduced adrenal responsiveness to ACTH in PTSD. They tried to discriminate between these two possibilities by measuring ACTH and cortisol at baseline and in response to overnight dexamethasone suppression. They demonstrated that the ACTH-to-cortisol ratio did not differ between groups before or after dynamic testing, but that the subjects with PTSD showed greater suppression of ACTH and cortisol in response to dexamethasone than did the controls. These results, summarized in Figure 2, suggest that enhanced cortisol negative feedback inhibition of ACTH secretion occurs in patients with PTSD, as opposed to reduced adrenal output of cortisol in response to ACTH stimulation [10]. These findings may explain why no significant differences in ACTH levels can be appreciated between PTSD and control groups.

Figure 2. Percent suppression of ACTH from baseline by 0.5 mg of dexamethasone overnight among patients with PTSD versus patients without PTSD. Adapted from Yehuda et al. [11].

Figure 2. Percent suppression of ACTH from baseline by 0.5 mg of dexamethasone overnight among patients with PTSD versus patients without PTSD. Adapted from Yehuda et al. [11].

Contrary to the studies above, Ströhle et al. studied 8 adults with PTSD and 8 healthy age- and sex-matched controls without PTSD in a similar experiment. They found that patients with PTSD had a decreased ACTH response to CRH after pretreatment with dexamethasone, suggesting a “hyporeactive” stress hormone system [11]. Some of Yehuda’s earlier work had raised the possibility that these studies may not have measured ACTH accurately, asserting that ACTH levels must be determined through repeated sampling over a short period of time. Using the gold-standard metyrapone test in individuals with PTSD, there was a significant increase in ACTH and in the cortisol precursor, 11-deoxycortisol, in subjects with PTSD as opposed to those without it. This suggests that the HypothalamoPituitary–Adrenal (HPA) axis is releasing higher concentrations of ACTH in individuals with PTSD in comparison to individuals without PTSD [12]. These conclusions are something of an outlier among the greater PTSD literature pertaining to ACTH, and they should spur reassessment of the best methodologies to accurately measure hormonal dynamics in PTSD as research moves forward.

A majority of the research exploring cortisol levels in patients with PTSD demonstrates lower ambient cortisol levels as compared to healthy controls and other psychiatric groups. Yehuda et al. showed this when comparing Holocaust survivors with PTSD to Holocaust survivors without PTSD and found that chronic PTSD was associated with reduced serum cortisol concentrations [13]. They suggest that the continuing high stress levels associated with PTSD may be exhausting the HPA axis and resulting in decreased cortisol levels. Similarly, Boscarino compared service veterans who were deployed in Vietnam with Vietnam-era veterans who were not in the theater of combat [14]. He controlled for the level of combat, as well as for multiple other potentially confounding variables, and his results indicate that those who were deployed in the combat theater had a higher prevalence of PTSD, and that theater veterans with current PTSD had lower cortisol concentrations than those who did not have PTSD. These findings suggest the importance of considering combat exposure in addition to the DSM diagnosis criteria when studying PTSD and cortisol concentrations. Overall, these two studies complement the observations referenced in the aforementioned studies pertaining to ACTH by demonstrating that cortisol levels are lower than expected in populations with prolonged hyperarousal states.

Another study, by Goenjian et al., compared adolescents from two cities in Armenia that were near the occurrence of a 6.9 magnitude earthquake. Specifically, the city of Spitak was at the epicenter of the earthquake and the city of Yerevan was at the periphery. The adolescents were old enough at the time of the earthquake to remember it. According to the DSM-IV, PTSD symptoms are grouped into different categories. Category B includes persistent re-experiencing of the traumatic event. Category C includes persistent avoidance of stimuli associated with the trauma and numbing of general responsiveness. Category D includes persistent symptoms of increased arousal. PTSD symptom scores were significantly higher among adolescents from Spitak, and they found a negative correlation between PTSD category C and D symptoms and baseline cortisol levels. Category B symptom scores narrowly missed statistical significance (p=0.06). There were no independent effects of sex or any other clinical or hormonal variables on these findings. The study supports the proposition that individuals with PTSD may have enhanced negative feedback inhibition of cortisol, resulting in lower cortisol levels [15]. When compared to the findings by Boscarino, these data also suggest that there is no significance to the type of trauma, in this case natural disaster as opposed to combat, that produces this blunted cortisol response.

Also addressing the nature and severity of trauma, Olff et al. explored HPA axis changes among civilians with chronic PTSD due to trauma such as sexual abuse, loss of a loved one, disaster, or motor vehicle accident. The control group consisted of healthy volunteers without PTSD. The results showed that plasma cortisol levels were significantly reduced in the PTSD group compared to the control group. In addition, the average cortisol levels were lower after controlling for potentially confounding variables, such as sex, age, body mass index (BMI), and smoking. A negative linear relationship between cortisol levels and the severity of PTSD symptoms was also found. The authors suggest that these findings raise the question as to whether some of the discrepant findings related to serum cortisol and PTSD in the medical literature may be attributable to the differing severity of trauma in different studies [16]. In the larger picture, this study underscores that the blunting of cortisol among PTSD patients may occur with many different types of trauma and suggests a relationship between the severity of trauma and the degree of cortisol blunting.

In attempt to elucidate the potential role of reduced cortisol binding globulin (CBG) concentrations as a mechanism for decreased cortisol concentrations in PTSD, Kanter et al. studied thirteen Vietnam veterans and found that while plasma cortisol levels were significantly lower among PTSD patients than among control subjects without PTSD, they also found that CBG levels were increased in the PTSD patients compared to controls [17]. Wahbeh et al. evaluated salivary cortisol levels (as a reflection of free cortisol) in PTSD and found that the levels were lower among 51 combat veterans with PTSD as compared with 20 veterans without PTSD [18]. He further found that adding age, BMI, smoking, medications affecting cortisol, awakening time, sleep duration, season, depression, perceived stress, service area, combat exposure, and lifetime trauma as covariates to the model did not reduce the significance of the relationship between PTSD and salivary cortisol. These data contribute to the overall understanding of PTSD dynamics by eliminating the role of CBG in the blunted cortisol findings.

Not surprisingly, there are also studies that have found elevated cortisol levels in individuals with PTSD. One study, by Wang et al., described the occurrence of PTSD and plasma cortisol concentrations among 48 survivors of a coal mining disaster in China. They found that plasma cortisol levels were significantly higher in PTSD patients six months after the disaster than in survivors without PTSD, and this relationship was maintained after adjusting for age and BMI. In this study, the cortisol levels at six months were also correlated with somatic symptoms, interpersonal symptoms, depression, anxiety, and hostility scores on the PTSD Symptom Checklist 90-Revised (PCL- 90-R), a widely used 90-item self-report instrument that includes nine subscales that target various domains of psychopathology [19]. Another study from China, by Song et al., examined 34 earthquake survivors with PTSD, 30 earthquake survivors with subclinical PTSD, and 34 normal controls [20]. They found that the survivors with PTSD and those with subclinical PTSD both demonstrated significantly higher levels of serum cortisol as compared to the control group. A study that included Vietnam combat veterans with PTSD also found that they had higher cortisol concentrations compared to the control group [21]. Another study that included Croatian combat veterans with PTSD demonstrated fewer glucocorticoid receptors on the surfaces of lymphocytes among the PTSD patients compared to healthy controls. This inverse association has been identified in a number of psychiatric diagnoses and potentially explains the observation of elevated cortisol concentrations [22]. Wheeler et al. compared the cortisol production rates between 10 control subjects and with 10 individuals with chronic PTSD and a history of childhood trauma, domestic violence, or war trauma. They demonstrated no difference in cortisol production rates between the two groups using stable isotopic methods in the unprovoked state, but they did demonstrate significantly reduced urinary free cortisol levels in the chronic PTSD group [23]. These studies show that there may be cortisol dynamics related to the proximity in time to a traumatic event, and that observed elevations in cortisol are probably not related to up-regulations in cortisol production in the adrenal gland.

In attempt to evaluate the impact of time on cortisol levels, Simmons et al. examined exposure to lifetime traumatic events and changes to cortisol levels in hair samples, a relatively new and reliable method for assessment of integrated cortisol over time [24]. The sample population included 70 children who were also enrolled in a longitudinal study of brain development and who had experienced a variety of trauma as reported by parents using the LITE-PR screening measure. Three cm of hair representing approximately 3 months of growth were removed from the vertex. They discovered that hair cortisol concentrations (HCC) are positively correlated with lifetime trauma and is a potentially cost-effective and reliable biomarker of HPA dynamics among children. Of note, these findings in children are consistent across studies but are inconsistent with HCC studies in adults. The explanation for this discrepancy may be rooted in the temporal proximity of the trauma to the sampling. This study reinforces the previously mentioned studies suggestive of enhanced cortisol early after the traumatic event.

As previously introduced, salivary cortisol measurements are another recent non-invasive method to assess cortisol levels. Yoon and Weierich measured salivary cortisol and alpha-amylase in 20 women who met criteria for diagnosis of PTSD per DSM-IV to evaluate HPA and Sympathetic Nervous System (SNS) reactivity to trauma reminders [25]. On two separate occasions, subjects underwent the Structured Clinical Interview for DSM-IV (SCID) to describe their traumatic event, and submitted salivary samples before, during and after the SCID. The alpha-amylase levels reflect SNS responses at each time point, whereas the salivary cortisol levels indicate HPA activity approximately 20 minutes prior to the sample collection. They found blunted cortisol activity and marked SNS activity when exposed to stressors (i.e., the description of the trauma during SCID). They conclude that the blunted cortisol is a protective mechanism when HPA is chronically activated to protect the body from long-term immunosuppression; a concept reinforced by multiple studies over time. This theory also partially explains the phenomenon of enhanced SNS activity such that under normal physiology, cortisol downregulates SNS response, while in these patients, the blunted cortisol fails to mediate this effect. This study is important because it reinforces and attempts to explain ongoing observations in the PTSD-HPA literature as well as integrate it into other systems of interest, such as the effect of PTSD on catecholamines.

In summary, there appears to be a preponderance of evidence supporting the idea that patients with PTSD exhibit decreased cortisol concentrations compared with unaffected individuals, as well as disturbed feedback regulation of cortisol on the hypothalamus. This latter point has been demonstrated by enhanced ACTH suppression following exogenous glucocorticoid administration. Additionally, blunted cortisol responses over time may leave the sympathetic nervous system relatively unchecked, thus contributing to the tonic hypervigilance these patients experience. As might be expected, those with a history of more severe trauma or stress exhibit more severe symptomatology.

A. The Catecholamines: Epinephrine & Norepinephrine

There is limited literature on epinephrine and norepinephrine in the setting of PTSD, but the majority of the literature suggests that norepinephrine is elevated in such patients. Blanchard et al. examined plasma norepinephrine in Vietnam veterans with combat experience. Group one contained combat veterans with diagnosed PTSD and group two was comprised of combat veterans without PTSD. The veterans were exposed to auditory stimuli simulating a combat experience with increasing volume for three minutes. PTSD veterans exhibited significant increases in plasma norepinephrine from pre-stimulus and post-stimulus (p<0.001) compared to combat veterans without PTSD, who did not show changes due to the auditory stimulus. Moreover, veterans with PTSD who experienced an increase in plasma norepinephrine also showed a concomitant increase in heart rate. In addition, there was no difference in baseline norepinephrine levels between the two groups [26]. Geracioti et al., using a stressor, looked at serial cerebrospinal fluid (CSF) norepinephrine concentrations sampled via an indwelling spinal canal subarachnoid catheter over a number of hours. They discovered that CSF norepinephrine concentrations were significantly higher in the participants with PTSD than the healthy control group. Geracioti asserts that the higher baseline CSF norepinephrine concentrations were related to CNS hyper-activation in PTSD, even in the absence of a specific stressor [27]. Taken in the context of the data presented thus far, this CNS activation may be related to the previously mentioned elevations in CRH and underscores the theory that blunted cortisol fails to attenuate the sympathetic nervous system.

The cause of elevated levels of norepinephrine appears to be a low concentration of the norepinephrine transporter (NET) in the stressed state. The NET is responsible for attenuating signaling by clearing norepinephrine from synaptic clefts, thus resulting in lower levels of arousal. Expanding upon rodent studies in which repeated exposure to stress is associated with decreased NET in the locus coeruleus, Pietrzak et al. used Positron emission tomography (PET) with [11C]- methylreboxetine to assess NET availability in this crucial region. They compared healthy adult humans, patients exposed to trauma but without PTSD symptoms, and patients with PTSD symptoms, and found that PTSD was associated with significantly reduced NET availability in the locus coeruleus, and that greater norepinephrine activity with PTSD was associated with an increased severity of anxious arousal symptoms [28]. This established consistency among animal and human studies about stress exposure and attenuation of NET availability.

Correspondingly, Kosten et al. suggest that PTSD patients have increased sympathetic nervous system activity. They examined urinary norepinephrine and epinephrine levels at two-week intervals during the course of hospitalization without the use of a stressor. Patient groups included those with PTSD, major depressive disorder, bipolar disorder type I (manic), paranoid schizophrenia, and undifferentiated schizophrenia. The patients with PTSD had significantly higher mean urinary norepinephrine and epinephrine levels than the other groups, and the higher levels were sustained throughout the hospitalization [29]. These data further suggest that evidence of persistent catecholamine elevations are not limited to PTSD and encompass a number of other psychiatric diagnoses.

In summary, human studies demonstrate increased levels of both plasma and CSF norepinephrine among subjects with PTSD, a finding also demonstrated in animal studies.

B. Thyrotropin (TSH) and the Thyroid Gland

The medical literature suggests that the pituitary-thyroid axis may be altered in patients with PTSD, but results are mixed, with the majority of research suggesting increased thyroid hormone concentrations. Goenjian et al. examined adolescents with PTSD and a history of trauma resulting from the Spitak earthquake in Armenia in 1988. The study population was divided into two groups: 33 adolescents who experienced trauma at the epicenter in Spitak, and 31 adolescents who lived at the periphery of the earthquake zone. The group exposed to trauma had significantly higher basal thyrotropin (TSH) concentrations than the non-trauma-exposed group, suggesting that higher TSH levels may reflect an underlying comorbid depression, which is known to be associated with hypothyroidism, or an agerelated, trauma-induced decrease in sensitivity to thyroid hormone feedback on the pituitary and/or hypothalamus [15]. Conversely, Olff et al. studied 39 chronic PTSD patients and 44 healthy volunteers and found that average TSH levels were lower in PTSD patients than in the controls after controlling for sex, age, BMI, and smoking, suggesting enhanced negative feedback from thyroid hormones [16]. These discrepant TSH data may be attributable to a number of potential confounders, including variable coping mechanisms, types of trauma, or other comorbidities.

In effort to sort out these discrepant TSH findings, Wang et al. identified a positive correlation between levels of Total Triiodothyronine (TT3), Free T3 (FT3), and Total Thyroxine (TT4) and the frequency of PTSD symptoms [30]. The most significant relationship was observed between a measure of current PTSD symptoms (e.g., CAPS- 2 hyperarousal scores) and TT3. The authors suggest that these results might indicate a “high thyroid, high hyperarousal” PTSD subtype, or alternatively, might suggest a “high thyroid, high hyperarousal” phase in the course of PTSD. Similarly, Wang and Mason found elevations in serum FT3 levels and PTSD symptoms among World War II veterans, as shown in Figure 3. Specifically, they found a significant positive relationship between TT3 and FT3 and PTSD hyperarousal symptoms [31]. A multivariate analysis including all thyroid measures showed a significant overall difference between the PTSD group and the control group, with significant elevations of serum TT3, FT3, and the TT3/FT4 ratio in the World War II PTSD group as compared to the control subjects. No significant mean differences were found in levels of TT4, FT4, thyroid binding globulin (TBG), or TSH between the groups. Importantly, the observed alterations of thyroid function in conjunction with PTSD symptoms appear to be chronic and detectable more than 50 years after the war. These data show that the dominant finding among PTSD patients is elevated T3, and when taken in the context of the data previously presented, is consistent with in accordance with a poorly attenuated sympathetic nervous system that leads to greater systemic arousal.

Figure 3.  Mean Free T3, Free T4, and TSH concentrations in 12 World War II veterans with PTSD (solid bars) as compared to 18 healthy, age matched control subjects (stippled bars).  Adapted from Wang et al. [30].

Figure 3. Mean Free T3, Free T4, and TSH concentrations in 12 World War II veterans with PTSD (solid bars) as compared to 18 healthy, age matched control subjects (stippled bars). Adapted from Wang et al. [30].

Karlović et al. found significantly higher concentrations of TT3 compared to a control group in their study of 43 male Croatian soldiers with combat-related chronic PTSD and 39 healthy men [32]. There was a significant correlation between TT3 levels and the number of traumatic events experienced in both the overall PTSD group and in those with PTSD and comorbid alcohol dependence. Additionally, soldiers with chronic combat-related PTSD, with or without comorbid alcohol addiction, had significantly higher values of TT3 than controls. There was a significant correlation between TT3 levels and symptoms of increased arousal in both of the above groups. Mason et al. similarly evaluated 96 American combat veterans and 24 healthy controls [33], and they found moderately elevated TT4 levels (but not FT4 levels), as well as elevations in both TT3 and FT3, and elevated T3/T4 ratios among combat veterans with PTSD. They also found increases in TBG levels, but no difference in TSH levels. This same group conducted another study that compared thyroid hormone levels between Israeli combat veterans with PTSD and American combat veterans with PTSD and compared both groups to an unaffected group of combat veterans without PTSD. They found significantly higher mean TT3 levels among the veterans of both cultures with PTSD compared to the unaffected control group, but there was no significant difference found between TT3 levels when comparing the results of the Israeli combat veterans with PTSD to the American combat veterans with PTSD [34]. These data raise the question whether there are crosscultural or ethnic confounders to the findings of elevated T3 among PTSD patients.

In summary, patients with either a distant history of PTSD or a more recent PTSD diagnosis appear to have significant alterations in the pituitary-thyroid axis. An elevation of T3 is the most consistent finding, and this elevation appears to be correlated with the common symptom of hyperarousal. Alterations in the feedback of thyroid hormone on TSH secretion also appears to be common in patients with PTSD.

C. Prolactin

Although prolactin is a well-recognized stress-response hormone, little research has been done examining prolactin concentrations in individuals with PTSD [35, 36]. Vidović et al. measured prolactin levels in 39 Croatian war veterans with PTSD and 25 healthy volunteers on two occasions approximately 6 years apart and found prolactin levels were significantly higher in the PTSD subjects at both assessments [35]. Grossman et al. studied veterans exposed to combat with and without PTSD, as well as healthy controls, and found that both groups of veterans, with and without PTSD, demonstrated significantly greater prolactin suppression in response to dexamethasone as compared to healthy control participants [36]. The authors suggest that perhaps the increased suppression of prolactin is associated with combat exposure rather than with PTSD. Olff et al. reported significantly lower basal prolactin concentrations in patients with PTSD compared to healthy volunteers, and although this finding was not affected by adjustment for depression, smoking, BMI or demographic variables, adjustment for age did obviate the observation, with prolactin levels being significantly lower in the older participants [16]. Dinan et al. reported no significant difference in prolactin between female patients with PTSD and healthy controls, suggesting normal functioning of the 5-Hydroxytryptophan (5-HT) receptor system [37]. In summary, there is no consensus that the regulation of prolactin is routinely disrupted in PTSD.

D. Somatostatin and Growth Hormone:

There are a limited number of studies examining serum growth hormone (GH) and GH regulation in patients with PTSD. Van Liempt et al. assessed nocturnal GH secretion in 13 veterans with PTSD, 15 unaffected trauma controls, and 15 healthy controls [38]. They reported that plasma GH was significantly reduced in the PTSD group compared to healthy controls. The authors also reported a correlation between sleep fragmentation, which was more common in the PTSD subjects, and GH secretion. When given a memory test before and after sleep, the veterans with PTSD who awoke more frequently during the night and who had lower GH secretion were able to remember fewer words during the test. This suggests that sleep dependent memory may be interrupted by frequent awakenings and/or reduced secretion of GH. After an earthquake in Northern China, Song et al. assessed earthquake survivors with PTSD, subclinical PTSD (i.e., subjects who met all but the severity criterion of a DSM-IV diagnosis of PTSD), and healthy controls. The survivors with PTSD, but not those with subclinical PTSD, had significantly higher serum GH levels than did the healthy controls. There was no statistically significant difference in GH levels between the PTSD participants and those with subclinical PTSD [20]. As previously discussed, Goenjian et al. examined 8th grade students who lived near the epicenter of an earthquake in Spitak, Armenia, as well as others who were from the periphery of the earthquake zone in Yerevan, and they found significantly higher pre-exercise concentrations of GH in the group from Spitak compared to the group from Yerevan [15]. In general, these discrepant data do not support meaningful patterns of GH dysregulation among PTSD patients at this time.

Morris et al. explored the GH response to clonidine stimulation testing in subjects with combat-related PTSD but without depression, PTSD plus depression, and healthy veteran controls, and they found a significantly blunted GH response in the patients with PTSD without depression [39], but the GH response to clonidine among combat veterans with depression was not different from that of control subjects. Conversely, Dinan et al. studied the GH response to stimulation with desipramine and found no significant difference between female trauma patients with PTSD and unaffected control subjects [37]. These two studies also show discrepancy in GH patterns and fail to demonstrate the statistical significance of their findings.

To examine the question of growth hormone’s role in PTSD in a different way, Bremner et al. examined somatostatin, a welldocumented endogenous inhibitor of GH secretion. Their study reported higher CSF somatostatin concentrations in PTSD patients than in control subjects without PTSD, and further, that CSF concentrations of somatostatin were significantly correlated to CSF CRH concentrations in Vietnam combat veterans but not in healthy controls [5]. These data appear to extend the previously discussed findings pertaining to paradoxically elevated CSF CRH levels.

In summary, higher CSF concentrations of somatostatin and blunted responses to GH stimulation testing among patients with PTSD suggest that dysregulation of GH secretion may be associated with the diagnosis of PTSD, but the role of this dysregulation in the etiology or pathogenesis of the condition remains unclear.

E. Other Hormones (Oxytocin, Vasopressin, Testosterone)

Very little research has been done to explore the relationship between oxytocin and PTSD. Heim et al. examined women who experienced different severities of childhood abuse and found that decreased CSF oxytocin concentrations were associated with maltreatment and emotional abuse. Not all of the women in this study had PTSD, however, and when examined, it was found that CSF oxytocin levels were not associated with PTSD [40]. Research into the potential therapeutic effects of oxytocin as a memory enhancer and as a hormone that evokes a “sense of safety” in settings other than PTSD, is only in its infancy [41,42].

There is also a dearth of research exploring the relationship between Vasopressin and PTSD. Pitman, Orr and Lasko examined the effects of intranasal vasopressin on the heart rate, skin conductance, and lateral frontalis electromyographic (EMG) responses during personal combat imagery among 43 Vietnam veterans with PTSD in a double-blind, placebo controlled study, and found that vasopressin had a specific effect on EMG responses [41]. Specifically, lateral frontalis reactivity was greater during the viewing of personal combat imagery with vasopressin than with either placebo or oxytocin administration. The authors summarize that the findings are consistent with a potential role for stress hormones in PTSD symptomatology, but that the lack of a control group without PTSD prohibits firm conclusions.

Literature on testosterone concentrations in male patients with PTSD has yielded mixed results, with some literature reporting elevated testosterone concentrations among males with PTSD, but other reports finding no statistically significant relationship. As shown in Figure 4, Karlović et al. studied four groups of patients: 17 combat soldiers with PTSD and no comorbid psychiatric disorders, 31 combat soldiers with PTSD and comorbid alcohol dependence, 18 combat soldiers with PTSD and comorbid major depression, and 34 healthy control combat soldiers without PTSD or other psychiatric disorders [43]. Analysis by ANCOVA found that patients with “pure” PTSD had significantly higher serum testosterone concentrations as compared to patients who had PTSD combined with depression or alcohol dependence. Importantly, the entire group of PTSD subjects, without considering comorbid conditions, showed no significant differences in basal serum testosterone concentrations as compared to control subjects. Mason et al. longitudinally evaluated androgen levels among individuals being treated as inpatients for PTSD, major depression, bipolar disorder, or paranoid schizophrenia, as well as 24 healthy male control subjects [44]. They found that the patients with PTSD had significantly higher basal serum testosterone levels compared to patients with major depressive disorder or bipolar disorder at all test points. At the last testing point, the PTSD group also had a statistically higher serum testosterone level than the control group. The PTSD group and the group with paranoid schizophrenia did not significantly differ with the group who had major depression at any time.

Figure 4. Approximate median fasting morning concentrations of total testosterone among patients with combat-related PTSD with and without comorbid conditions as compared with healthy control combatants.  Adapted from Karlovic et al. [42].

Figure 4. Approximate median fasting morning concentrations of total testosterone among patients with combat-related PTSD with and without comorbid conditions as compared with healthy control combatants. Adapted from Karlovic et al. [42].

Conversely, Spivak et al. found no statistically significant difference in morning testosterone levels between chronically untreated PTSD subjects and healthy control subjects. The participants included 21 Israeli combat veterans with PTSD and 18 healthy Israeli males with some combat exposure but no PTSD. The authors suggest that a possible explanation for the difference between their findings and the findings of others may relate to the greater severity of PTSD in these untreated subjects [45].

In summary, although certain subgroups of subjects with PTSD appear to have increased concentrations of testosterone compared to other subgroups, there are not consistently increased levels of testosterone among male PTSD patients as compared to healthy control subjects in observational studies. Although potentially promising, the therapeutic efficacy of treating PTSD patients with oxytocin agonists, vasopressin, or anti-androgen therapy, remains to be established.

Part 2: Caution Surrounding Assay Methodologies and Critical Review of the Literature

Schumacher et al. stress the need for critical interpretation on the part of the reader in the context of the relationship between hormonal perturbations and PTSD [46]. They underscore the necessity for using well-validated assays in any study in which hormone concentrations are a critical component. Moreover, the DSM has undergone serial updates since PTSD achieved its formal diagnosis classification in 1980, and this evolution may affect sample selection among older studies. Secondly, there are a wide variety of self-assessment tools for PTSD, and responses to these instruments will vary across countries, cultures and languages, and the instruments themselves will undergo revisions through the years. Thus, the methods of assessment in 1980 may bear little resemblance to methods used today. Moreover, techniques for monitoring hormone dynamics in 2016 are more precise than they were 36 years ago. All of these factors must be considered when interpreting data that span decades and cultural or geographical boundaries. Thus, it is important that the reader carefully consider research data to tease out important confounders, especially as new data and improved assays become available.

Schumacher et al. go on to declare that “gas or liquid chromatography (GC or LC) that is coupled to tandem mass spectrometry (MS) represent the gold standards” for accurate and sensitive analyses of steroids, but they acknowledge that this methodology is associated with high cost [46]. The tandem GC/MS technique markedly reduces molecular interference and background noise. In instances where multiple steroid isomers have similar MS profiles, the preceding chromatography should have already separated these isomers into different strata. Unfortunately, the utility of radioimmunoassays (RIA) that have been employed since the 1970s are limited because steroid hormones have low molecular weights and are not especially immunogenic, and the use of validated RIAs that are preceded by specific purification and separation steps has decreased over time, in favor of the use of frequently unvalidated commercial kits due to ease of use. Furthermore, publication requirements on the part of reference journals have become less strict, so the burden of validation ultimately lies on the reader’s attention to the RIA procedures that are published. The authors urge caution when a study’s assay methodology is not described in detail.

Yehuda noted that cortisol measured in a single venous sample is not a reliable estimate of basal cortisol dynamics, especially if the process of venipuncture (or anticipation thereof) induces transient fluctuations of the hormone [12]. The advent of salivary or hair cortisol sampling offer two ways to address the confounder of acute sampling-related stress. Another strategy is to obtain serial venous samples via IV catheter and allow patients to recover from the acute stress of IV placement prior to sampling. It is given that every study has limitations, ranging from small study sizes, gender differences, variable types of trauma, comorbid depression, substance abuse, unidentified confounders, mishandled samples, or medication regimens may impact interpretation and external validity of results [21,47]. In sum, it is reasonable to consider that confounding variables will be a significant factor when considering the complex and poorly understood nature of psychiatric disease [47-58].

Summary and Conclusions

In this report, we reviewed 58 studies published between 1985 and 2016 that examined the hormonal dynamics of PTSD and their potential implications for novel therapeutics in the treatment of PTSD. With respect to the HPA Axis, the majority of research supports the finding of lower cortisol levels and an impaired negative feedback mechanism (as evidenced by enhanced ACTH suppression following dexamethasone administration) that may be rooted in decreased CRH secretion. This suggests a potential future treatment that targets CRH1 receptors with, for example, a long-acting CRH analogue.

Multiple studies demonstrate that norepinephrine levels are elevated in patients with PTSD compared to healthy controls, supporting the concept of “adrenal overdrive” in such patients. Only one study shows an elevation in both epinephrine and norepinephrine.

There also appears to be a consistent alteration in the pituitarythyroid axis, with elevated T3 levels being the most typical finding, and this elevation consistently correlates with hyperarousal symptoms. Alterations in the feedback of thyroid hormone on TSH secretion may also be operative in patients with PTSD, as these patients are more likely to show TSH on the low end of the normal range.

While there is no consistent alteration in prolactin levels in individuals with PTSD, there are higher CSF concentrations of both somatostatin and blunted responses to GH stimulation testing among patients with PTSD. This suggests that dysregulation of GH secretion may be associated with the diagnosis of PTSD, but the role of this dysregulation in the etiology or pathogenesis of the condition remains unknown. Finally, although certain subgroups of subjects with PTSD may have increased concentrations of testosterone compared to other subgroups, there are not consistently increased levels of testosterone among PTSD patients as compared to healthy controls. Although promising, the therapeutic potential of oxytocin agonists, or with testosterone or vasopressin antagonists, remains to be established.

Overall the neuroendocrine patterns observed over time suggest a complex interplay among the adrenal axis, thyroid hormones, catecholamines and somatostatin, but additional work is required to elucidate potential targets for therapy. In short, the pathophysiology of PTSD and its relationship to neuroendocrine dysregulation function is a multifactorial and dynamic process that exists on a spectrum with other psychiatric and organic dysfunctions. The concept of being able to understand PTSD as an isolated entity is probably unrealistic and counterintuitive to the needs of treating the whole person. However, accumulating evidence is showing that the cornerstones of hormonal dysregulation (summarized in Table 1) may provide an important framework for determining how to mitigate the effects of exposure to trauma and how to optimize plan management practices in the future.

Table 1. Summary of comparisons obtained from this literature review of hormone abnormalities related to PTSD as compared to controls. Blank cells indicate no data available. A dash ( – ) indicates that data showed no differences.

Hormone Plasma CSF Urine Saliva Hair References
TSH ↑↓ 15, 29
FT4 15, 29
FT3 15, 29-32
TT4 15, 29, 32
TT3 15, 29-33
PRL ↑↓ 35
Estrogen

 (FM only)

66
Progesterone

(FM only)

66
Testosterone

(M only)

42 – 44
CRH 6, 8, 10, 11, 14-16, 64, 67, 69
ACTH ↑↓ 9, 10, 11, 14, 15, 16, 64
Cortisol ↑↓ ↓↑ 7, 11-17, 19, 20, 22-24, 36, 46, 48, 64, 70
Somatostatin 4
GH/IGF-1 ↑↓ 19, 36-38, 61
Oxytocin 39, 40, 41
Vasopressin 40
Norepinephrine 20, 25-28, 46
Epinephrine 20, 28, 46

List of Abbreviations

5-HT: 5-Hydroxytryptophan
ACTH: Adrenocorticotropic Hormone
ADHD: Attention Deficit Hyperactivity Disorder
ANCOVA: Analysis of Covariance
BMI: Body Mass Index
CAPS-2: Clinician Administered PTSD Scale, v. 2
CBG: Corticotropin Binding Globulin
CRH: Corticotropin Releasing Hormone
CSF: Cerebrospinal Fluid
DSM-III: Diagnostic and Statistical Manual, v. 3
DSM-IV: Diagnositic and Statistical Manual, v. 4
EMG: Electromyography
FSH: Follicle Stimulating Hormone
FT3: Free T3
GH: Growth Hormone
HCC: Hair Cortisol Concentration
HPA: Hypothalamic-Pituitary-Adrenal
LC: Liquid Chromatography
LH: Leutinizing Hormone
LITE-PR: Lifetime Incidence of Traumatic Events-Parent Report
NATO: North Atlantic Treaty Organization
NET: Norepinephrine Transporter
PCL-C: PTSD Check List-Civilian Version
PCL-M: PTSD Check List-Military Version
PRL: Prolactin
PTSD: Post-Traumatic Stress Disorder
PVN: Paraventricular Nucleus
RIA: Radioimmunoassay
SCID: Structured Clinical Interview for DSM-IV
SCL-90-R: Symptom Check List-Revised
SNS: Sympathetic Nervous System
T3: Tri-iodothyronine
T4: Thyroxine
TBG: Thyrotropin Binding Globulin
TSH: Thyroid Stimulating Hormone
TT3: Total T3
TT4: Total T4
UN: United Nations

References

  • Hourani L, Council C, Hubal R, Strange L (2011) Approaches to the primary prevention of posttraumatic stress disorder in the military: A review of the stress control literature. Military Medicine 176: 721-730.
  • Buchanan C, Kemppainen J, Smith S, MacKain S, Wilson C (2011) Awareness of posttraumatic stress disorder in veterans: A female spouse/intimate partner perspective. Military Medicine 176: 743-751.
  • Grodin M, Piwowarczyk L, Fulker D, Bazazi A, Saper R (2008) Treating survivors of torture and refugee trauma: A preliminary case series using qigong and t’ai chi. Journal of Alternative Complementary Medicine 14: 801-806.
  • Nader N1, Chrousos GP, Kino T (2010) Interactions of the circadian CLOCK system and the HPA axis. Trends Endocrinol Metab 21: 277-286. [crossref]
  • Bremner J, Licinio J, Darnell A, et al. (1997) Elevated CSF corticotropin-releasing factor concentrations in posttraumatic stress disorder. Am J Psychiatry 154:624-629.
  • Savic D, Knezevic G, Damjanovic S, Spiric Z, Matic G (2012) The role of personality and traumatic events in cortisol levels–where does PTSD fit in? Psychoneuroendocrinology 37: 937-947. [crossref]
  • Muhtz C, Wester M, Yassouridis A, Wiedemann K, Kellner M (2008) A combined dexamethasone/corticotropin-releasing hormone test in patients with chronic PTSD–first preliminary results. J Psychiatr Res 42: 689-693.
  • De Kloet CS, Vermetten E, Heijnen CJ, Geuze E, Lentjes EG, Westenberg HG (2007) Enhanced cortisol suppression in response to dexamethasone administration in traumatized veterans with and without posttraumatic stress disorder. Psychoneuroendocrinology 32: 215-226.
  • Kellner M, Yassouridis A, Hübner R, Baker DG, Wiedemann K (2003) Endocrine and cardiovascular responses to corticotropin-releasing hormone in patients with posttraumatic stress disorder: a role for atrial natriuretic peptide? Neuropsychobiology 47: 102-108.
  • Yehuda R, Golier JA, Halligan SL, Meaney M, Bierer LM (2004) The ACTH response to dexamethasone in PTSD. Am J Psychiatry 161: 1397-1403. [crossref]
  • Ströhle A, Scheel M, Modell S, Holsboer F (2008) Blunted ACTH response to dexamethasone suppression-CRH stimulation in posttraumatic stress disorder. J Psychiatr Res 42: 1185-1188.
  • Yehuda R (1997) Sensitization of the Hypothalamic-Pituitary-Adrenal Axis in Posttraumatic Stress Disorder. Annals of the New York Academy of Sciences 821: 57–75.
  • Yehuda R, Kahana B, Binder-Brynes K, Southwick SM, Mason JW, et al. (1995) Low urinary cortisol excretion in Holocaust survivors with posttraumatic stress disorder. Am J Psychiatry 152: 982-986.
  • Boscarino JA (1996) Posttraumatic stress disorder, exposure to combat, and lower plasma cortisol among Vietnam veterans: findings and clinical implications. J Consult Clin Psychol 64:191-201.
  • Goenjian AK, Pynoos RS, Steinberg AM, et al. (2003) Hypothalamic-pituitary-adrenal activity among Armenian adolescents with PTSD symptoms. J Trauma Stress 16: 319-323.
  • Olff M, Güzelcan Y, de Vries GJ, Assies J, Gersons BP (2006) HPA- and HPT-axis alterations in chronic posttraumatic stress disorder. Psychoneuroendocrinology 31: 1220-1230.
  • Kanter ED, Wilkinson CW, Radant AD, et al. (2001) Glucocorticoid feedback sensitivity and adrenocortical responsiveness in posttraumatic stress disorder. Biol Psychiatry 50: 238-45.
  • Wahbeh H, Oken BS (2013) Salivary cortisol lower in posttraumatic stress disorder. J Trauma Stress 26: 241-248. [crossref]
  • Wang HH, Zhang ZJ, Tan QR, et al. (2010) Psychopathological, biological, and neuroimaging characterization of posttraumatic stress disorder in survivors of a severe coal mining disaster in China. J Psychiatr Res 44: 385-392.
  • Song Y, Zhou D, Wang X (2008) Increased serum cortisol and growth hormone levels in earthquake survivors with PTSD or subclinical PTSD. Psychoneuroendocrinology 33: 1155-1159. [crossref]
  • Pitman R, Orr S. Twenty-four-hour urinary cortisol and catecholamine excretion in combat-related posttraumatic stress disorder. Biological Psychiatry 27: 245-247.
  • Gotovac K, Sabioncello A, Rabatic S, Berki T, Dekaris D (2003) Flow cytometric determination of glucocorticoid receptor (GCR) expression in lymphocyte subpopulations: Lower quantity of GCR in patients with post-traumatic stress disorder (PTSD). Clin Exp Immunol 131: 335–339.
  • Wheler GH1, Brandon D, Clemons A, Riley C, Kendall J, et al. (2006) Cortisol production rate in posttraumatic stress disorder. J Clin Endocrinol Metab 91: 3486-3489. [crossref]
  • Simmons JG, Badcock PB, Whittle SL, et al. (2016) The lifetime experience of traumatic events is associated with hair cortisol concentrations in community-based children. Psychoneuroendocrinology 63: 276-281.
  • Yoon SA, Weierich MR (2016) Salivary biomarkers of neural hypervigilance in trauma-exposed women. Psychoneuroendocrinology 63: 17-25. [crossref]
  • Blanchard EB, Kolb LC, Prins A, Gates S, McCoy GC (1991) Changes in plasma norepinephrine to combat-related stimuli among Vietnam veterans with posttraumatic stress disorder. J Nerv Ment Dis 179: 371-373.
  • Geracioti TD Jr, Baker DG, Ekhator NN, West SA, Hill KK, et al. (2001) CSF norepinephrine concentrations in posttraumatic stress disorder. Am J Psychiatry 158: 1227-1230. [crossref]
  • Pietrzak RH, Gallezot JD, Ding YS, Henry S, Potenza MN, Southwick SM, et al. (2013) Association of posttraumatic stress disorder with reduced in vivo norepinephrine transporter availability in the locus coeruleus. JAMA Psychiatry 70: 1199-1205.
  • Kosten TR, Mason JW, Giller EL, Ostroff RB, Harkness L (1987) Sustained urinary norepinephrine and epinephrine elevation in post-traumatic stress disorder. Psychoneuroendocrinology 12: 13-20.
  • Wang S, Mason J, Southwick S, Johnson D, Lubin H, Charney D (1995) Relationships between thyroid hormones and symptoms in combat-related posttraumatic stress disorder. Psychosom Med 57: 398-402.
  • Wang S, Mason J (1999) Elevations of serum T3 levels and their association with symptoms in World War II veterans with combat-related posttraumatic stress disorder: Replication of findings in Vietnam combat veterans. Psychosom Med 61: 131-138.
  • Karlovic D, Marusic S, Martinac M (2004) Increase of serum triiodothyronine concentration in soldiers with combat-related chronic post-traumatic stress disorder with or without alcohol dependence. Wien Klin Wochenschr 116: 385-390.
  • Mason J, Southwick S, Yehuda R, et al. (1994) Elevation of serum free triiodothyronine, total triiodothyronine, thyroxine-binding globulin, and total thyroxine levels in combat-related posttraumatic stress disorder. Arch Gen Psychiatry 51: 629-641.
  • Mason J, Weizman R, Laor N, et al. (1996) Serum triiodothyronine elevation in Israeli combat veterans with posttraumatic stress disorder: a cross-cultural study. Biol Psychiatry 39: 835-838.
  • Vidovic´ A, Gotovac; K, Vilibic´ M, et al. (2011) Repeated assessments of endocrine- and immune-related changes in posttraumatic stress disorder. Neuroimmunomodulation. 18: 199-211.
  • Grossman R, Yehuda R, Boisoneau D, Schmeidler J, Giller EL Jr. (1996) Prolactin response to low-dose dexamethasone challenge in combat-exposed veterans with and without posttraumatic stress disorder and normal controls. Biol Psychiatry 40: 1100-1105.
  • Dinan TG1, Barry S, Yatham LN, Mobayed M, Brown I (1990) A pilot study of a neuroendocrine test battery in posttraumatic stress disorder. Biol Psychiatry 28: 665-672. [crossref]
  • Van Liempt S, Vermetten E, Lentjes E, Arends J, Westenberg H (2011) Decreased nocturnal growth hormone secretion and sleep fragmentation in combat-related posttraumatic stress disorder; potential predictors of impaired memory consolidation. Psychoneuroendocrinology 36: 1361-1369.
  • Morris P, Hopwood M, Maguire K, Norman T, Schweitzer I (2004) Blunted growth hormone response to clonidine in post-traumatic stress disorder. Psychoneuroendocrinology 29: 269-278.
  • Heim C, Young LJ, Newport DJ, Mletzko T, Miller AH, et al. (2009) Lower CSF oxytocin concentrations in women with a history of childhood abuse. Mol Psychiatry 14: 954-958. [crossref]
  • Pitman RK, Orr SP, Lasko NB (1993) Effects of intranasal vasopressin and oxytocin on physiologic responding during personal combat imagery in Vietnam veterans with posttraumatic stress disorder. Psychiatry Research 48:107-117.
  • Olff M, Langeland W, Witteveen A, Denys D (2010) A psychobiological rationale for oxytocin in the treatment of posttraumatic stress disorder. CNS Spectr 15: 522-530. [crossref]
  • Karlovic D, Serretti A, Marcinko D, Martinac M, Silic A, Katinic K (2012) Serum testosterone concentration in combat-related chronic posttraumatic stress disorder. Neuropsychobiology 65: 90-95.
  • Mason JW, Giller EL, Kosten TR, Wahby VS (1990) Serum testosterone levels in post-traumatic stress disorder inpatients. J Traum Stress 3: 449–457.
  • Spivak B, Maayan R, Mester R, Weizman A (2003) Plasma testosterone levels in patients with combat-related posttraumatic stress disorder. Neuropsychobiology 47: 57-60.
  • Schumacher M, Guennoun R, Mattern C, et al. (2015) Analytical challenges for measuring steroid responses to stress, neurodegeneration and injury in the central nervous system. Steroids 103: 42-57.
  • Lemieux AM and Coe CL (1995) Abuse-related posttraumatic stress disorder: Evidence for chronic neuroendocrine activation in women. Psychosom Med 57: 105-115.
  • Morris P, Hopwood M, Maguire K, Norman T, Schweitzer I (2003) Blunted growth hormone response to clonidine in post-traumatic stress disorder. Psychoneuroendocrinology 29: 269-278.
  • Ludascher P, Schmahl C, Feldmann Jr RE, Kleindienst N, Scheider M, et al. (2015) No evidence for differential dose effects of hydrocortisone on intrusive memories in female patients with complex post-traumatic stress disorder–a randomized, double-blind, placebo-controlled, crossover study. Journal of Psychopharmacology 29: 1077-1084.
  • Kim EJ, Pellman B, Kim JJ (2015) Stress effects on the hippocampus: a critical review. Learn Mem 22: 411-416. [crossref]
  • Belda X, Fuentes S, Daviu N, Nadal R, Armario A (2015) Stress-induced sensitization: The hypothalamic-pituitary-adrenal axis and beyond. The International Journal on the Biology of Stress 18: 269-279.
  • Thompson DJ, Weissbecker I, Cash E, Simpson DM, Daup M, Sephton SE (2015) Stress and cortisol in disaster evacuees: An exploratory study on associations with social protective factors. Applied Psychophysiology Biofeedback 40: 33-44.
  • Wassell J, Rogers SL, Felmingam KL, Bryant RA, Pearson J (2015) Sex hormones predict the sensory strength and vividness of mental imagery. Biol Psychol 107: 61-68. [crossref]
  • Contoreggi C (2015) Corticotropin releasing hormone and imaging, rethinking the stress axis. Nucl Med Biol 42: 323-339. [crossref]
  • Nagaya N, Maren S (2015) Sex, steroids, and fear. Biol Psychiatry 78: 152-153. [crossref]
  • Bangasser DA, Kawasumi Y (2015) Cognitive disruptions in stress-related psychiatric disorders: A role for corticotropin releasing factor (CRF) Hormones and Behavior 76: 125-135.
  • Duan H, Wang L, Zhang L, Liu J, Zhang K, Wu J (2015) The relationship between cortisol activity during cognitive task and posttraumatic stress symptom clusters. PLOS One 10: 1-13.
  • Greene-Shortridge TM1, Britt TW, Castro CA (2007) The stigma of mental health problems in the military. Mil Med 172: 157-161. [crossref]
Screening of Silent Myocardial Ischemia in Diabetics Followed In Parakou’s Hospitals In 2014

DOI: 10.31038/EDMJ.2017124

Abstract

Introduction: Myocardial ischemia is often asymptomatic and remains a first cause of morbidity and mortality in diabetic’s patients. This study aimed to determine the prevalence of Silent Myocardial Ischemia (SMI) among diabetics.

Methods: It was a cross sectional and analytic study with prospective data collection from April to August 2014. We included all consent diabetes aged 18 years and over. All patients with clinical and/or electrocardiographic abnormalities suggestive of coronaropathy or those with sub maximal stress test were not included. SMI was retained when the stress test was positive according to SFC/ALFEDIAM de 2004 guidelines.

Results: The stress test has been done for 108 diabetics. The mean age was 50,2±11,2 years and the sex-ratio 1,6. The diabetes was type 2 in 91,5% and controlled in 66%. These patients have another cardiovascular risk factors in 87,8%. At rest, the electrocardiogram was not normal in 54,9%. After stress test 11% of diabetics were diagnosed for SMI. The history of stroke is the only one factor associated with SMI.

Conclusion: These data show that SMI was frequent among diabetic in Parakou independently of diabetes’ age and the resting electrocardiogram result. SMI screening is necessary to improve the management of diabetes in this city.

Keywords

screening; silent myocardial ischemia; diabetic complications; stress test; Africa

Introduction

Le diabète, associée ou non à d’autres facteurs de risque cardiovasculaires, est une véritable menace de santé publique [1]. En effet, les complications cardiovasculaires, principalement l’atteinte coronarienne, représentent la première cause de morbidité et de mortalité chez les sujets diabétiques [2,3]. Plus de 75 % des diabétiques décèdent d’accidents cardiovasculaires, au premier rang desquels l’insuffisance coronarienne responsable de 50 % des décès [4]. Malheureusement, du fait de l’existence de la neuropathie autonome cardiaque qui lui est associée, l’insuffisance coronarienne se présente souvent sous forme silencieuse chez les diabétiques. Elle doit être recherchée, quelle que soit la durée d’évolution du diabète afin de réduire la morbi-mortalité cardiovasculaire [5]. Le dépistage de l’ischémie myocardique silencieuse (IMS), bien que controversé, contribue à l’optimisation du traitement du diabétique [6, 7]. Il est donc indispensable chez le diabétique et fait appel à différentes techniques, dont l’épreuve d’effort (EE) [7]. Elle est proposée en première intention et éviterait le recours abusif aux moyens invasifs d’explorations [8]. Nous rapportons ici les résultats d’un dépistage systématique de l’IMS chez les diabétiques suivis en milieu hospitalier à Parakou en 2014.

MATERIEL ET METHODES

Cadre et nature de l’étude

L’étude s’est déroulée dans le service de diabétologie du Centre Hospitalier Universitaire Départemental du Borgou (CHUD-B) et dans le service de cardiologie de l’Hôpital d’Instruction des Armées (HIA-Pk) de la ville de Parakou. Il s’était agi d’une étude transversale descriptive et analytique avec un recueil prospectif des données, sur la période du 1er Avril au 31 Août 2014.

Population d’étude

Notre population d’étude était représentée par l’ensemble des patients reçus en consultation pendant la période d’étude. Étaient inclus, tous les patients diabétiques âgés d’au moins 18ans, n’ayant aucun signe d’appel d’insuffisance coronarienne (douleur thoracique, dyspnée) et ayant donné leur consentement à la réalisation de l’étude. Nous avions exclus les patients qui avaient une épreuve d’effort sous maximale négative. Le recrutement des patients était systématique.

Variables et technique de collecte

La variable dépendante était la fréquence de l’IMS, et les variables indépendantes étaient représentées par les caractéristiques socio démographiques, les données de l’électrocardiogramme de repos, les facteurs de risque cardiovasculaire notamment, le diabète, l’hypertension artérielle, l’obésité, la dyslipidémie, la sédentarité, et les caractéristiques du diabète notamment son ancienneté, son équilibre, ses complications dégénératives.

La technique de collecte était une entrevue individuelle et l’outil utilisé était une fiche d’enquête prétestée sur laquelle ont été recueillies les données clinique et paraclinique. L’entrevue a été menée à l’unité de diabète, puis les patients ont été revus à l’HIA-Pk pour la réalisation de l’épreuve d’effort. L’épreuve d’effort était démaquillée. En effet les dérivés nitrés, les antagonistes calciques de brèves durées d’action, bétabloquants et tout autre vasodilatateur ont été suspendus 48 heures avant le jour de l’examen. Le test d’effort a été réalisé sur un cyclo-ergomètre et a consisté en une augmentation de la puissance par palier de 25 watts (W) toutes les trois minutes. L’épreuve d’effort a été dite maximale lorsque la fréquence cardiaque du sujet à l’effort atteignait au moins 85% de la fréquence maximale théorique (220-âge) [9]. L’IMS a été définie par les critères suivant [7] :

  • absence de symptômes évocateurs d’ischémie myocardique (dyspnée, douleur thoracique)
  • absence d’anomalie de la repolarisation ni d’ondes Q de nécrose à l’ECG de repos
  • épreuve d’effort maximale positive (sous décalage du segment ST de 2mm sur 80ms après le point J et/ou une inversion de l’axe des ondes T ou douleur thoracique angineuse ou instabilité hémodynamique ou rythmique)

L’hypertension artérielle (HTA) a été retenue devant toute tension artérielle supérieure ou égale à 140mmHg pour la systolique et /ou 90mmhg pour la diastolique, ou une tension artérielle normale sous traitement antihypertenseur. A été considéré comme tabagique, tout patient qui a consommé au moins une fois tout produit de tabac. Ce tabagisme était dit ancien lorsque la dernière consommation remontait à plus de trois ans.

L’alcoolisme était abusif, lorsque la consommation quotidienne d’alcool supérieure à l’équivalent de 20g d’alcool par jour pour la femme et 30g pour l’homme. L’excès pondéral, a été défini par un indice de masse corporelle (IMC)≥25kg/m². Les recommandations de l’IDF 2005 chez les africains subsahariens avaient été utilisées pour définir l’obésité abdominale. Il s’agissait d’un tour de taille supérieur ou égal à 94cm chez l’homme et 80cm chez la femme [10]. Etait sédentaire, tout patient qui faisait moins de 30 minutes d’activité physique 3 fois par semaine et/ou reste plus de 8 à 12 heures en position assise ou couchée chaque jour. L’artériopathie chronique oblitérante des membres inférieurs a été recherchée à l’aide du questionnaire d’Edimbourg [11]. L’Accident vasculaire cérébral a été évoqué devant la notion d›un déficit neurologique focal d’installation brutale. Etaient considérés comme ayant une neuropathie, les patients ayant un score DN4 (douleur neuropathique en quatre questions) d’au moins 4/10 [12]. La néphropathie retenue devant la présence de protéinurie à la bandelette urinaire. La rétinopathie a été diagnostiquée au fond d’oeil et classée en quatre stades par un ophtalmologue.

Les données ont été analysées par le logiciel Epi info 3.5.1. Les graphiques et tableaux ont été confectionnés avec Microsoft Excel 2007. Les comparaisons de fréquences ont été effectuées à l’aide du test Chi carré de Pearson ou de Fisher selon le cas. Le seuil de significativité était de 5%.

Sur le plan éthique, les patients ayant une IMS dépistée ont été pris en charge par un cardiologue. L’accord du comité local d’éthique a été obtenu et la confidentialité des données recueillies a été respectée.

RESULTATS

Au total, 108 patients diabétiques ont été inclus durant la période d’étude. Nous en avons exclus quatre pour épreuve d’effort sous-maximale négative. Notre étude a finalement porté sur 104 diabétiques.

Caractéristiques du diabète

La moyenne d’âge des patients était de 50,2±11,2 ans, avec des extrêmes de 22 ans et 72 ans. La sex-ratio était de1,6. Le diabète était de type 2 chez 91,5%. L’ancienneté moyenne du diabète était de 6,6 ± 5,9 ans (4mois à 9 ans). La glycémie a varié de 0,83 à 4,4 g/l avec une moyenne de 1,6 ± 0,7g/L. Le diabète était contrôlé dans 65,9% des cas. Les autres facteurs de risque cardiovasculaire cumulés par les diabétiques étaient principalement l’obésité (88%) et l’l’HTA (61%). Le profil lipidique n’a pu être exploré chez les diabétiques pour inaccessibilité technique. Dans 87,8% des cas, les patients avaient au moins un facteur de risque associé au diabète. Les complications du diabète étaient dominées par la rétinopathie (66,7%) et les neuropathies périphériques (53,7%). Le tableau I présente la prévalence de chaque facteur, le nombre de facteurs cumulés par les patients et les complications dégénératives.

Tableau I : Prévalence des facteurs de risque cardiovasculaire et des complications chez les diabétiques suivis à Parakou en 2014

  Effectif Pourcentage
Facteurs de risque cardiovasculaire cumulés

Hypertension Artérielle

Tabagisme

Obésité

Sédentarité

Excès d’alcool


63

9

91

19

19


61

8,5

88

18,3

18,3

Nombre de facteur de risque cardiovasculaire cumulés

0

1 et 2

3 et plus


13

64

27


12,5

61,5

26

Complications dégénératives

Rétinopathie diabétique*

Neuropathie périphérique

Artériopathie symptomatique

Néphropathie

Accident Vasculaire Cérébral


29

56

99

16

2


66,7

53,7

19,5

15,9

1,9

* n=43

Etude de l’électrocardiogramme et prévalence de l’IMS (tableau II)

Tableau II : Caractéristiques électrocardiographiques  et prévalence de l’ischémie myocardique silencieuse chez les diabétiques suivis à Parakou en 2014

  Fréquence Prévalence
Au repos

ECG normal

Surcharge atriale gauche

Surcharge ventriculaire gauche

Extrasystoles

Altération diffuse de la repolarisation

Déviation axiale gauche


47

28

29

4

9

11


45,1

26,8

28

3,6

8,6

11

A l’effort

Test positif

Test négatif


11

93


11

89

Au repos, la fréquence cardiaque moyenne était de 82,6±13,5 bpm, avec des extrêmes de 56 et 112 bpm. L’électrocardiogramme (ECG) était anormal chez 57 sujets (54,8%). La surcharge ventriculaire gauche et celle auriculaire gauche étaient les anomalies prédominantes.

A l’effort, la charge moyenne assurée était de 195 ±53,5 Watts avec des extrêmes de 75 et 325 Watts. L’épreuve d’effort était positive chez 11 patients soit une prévalence de 11%. La figure 1 montre en iconographie un sous décalage horizontal du segment ST de 2,7mm en V5, observé chez un patient de 64ans ayant mené une épreuve d’effort maximale avec une charge de 200W.

Figure n°1: Dépistage de l’ischémie myocardique silencieuse chez les diabétiques suivis è Parakou en 2014 : Sous décalage du segment ST à l’effort chez un sujet de 64ans.

Figure n°1: Dépistage de l’ischémie myocardique silencieuse chez les diabétiques suivis è Parakou en 2014 : Sous décalage du segment ST à l’effort chez un sujet de 64ans.

Facteurs associés à l’IMS (tableau III)

Il n’y avait pas de relation statistiquement significative entre l’IMS et l’âge, l’ancienneté du diabète, la glycémie à jeun, l’HbA1c, la fréquence cardiaque de repos, le nombre de facteurs de risque cumulés, la tension artérielle. Parmi les complications athéromateuses, seul l’accident vasculaire cérébral était statistiquement associé à l’IMS. Les anomalies de l’ECG de repos n’étaient pas associées à l’existence d’une IMS.

Tableau III : Facteurs associés à l’ischémie myocardique silencieuse (IMS) chez les diabétiques suivis à Parakou en 2014

  IMS présente IMS absente p
Facteurs de risque cardiovasculaire

Age moyen (années)

Sex-ratio

IMC (kg/m²)

Tour de taille (cm)

Hypertension artérielle (%)

Tabac (%)


54,2 ±10

0,8

30,3 ± 19,2

91,7 ± 10,7

55,6

0


49,7 ±11,2

1,7

27,8 ± 8,9

95,2 ± 12,8

61,6

9,6


0,257

0,301

0,506

0,537

0,724

1


Caractéristiques du diabète

Ancienneté moyenne (années)

Taux moyen d’hémoglobine glyquée (%)

Nombre moyen  de facteur de risque

cardiovasculaire cumulés


6,4 ±3,7

6,8 ±1


1,7 ± 0,9


6,6 ±3,1

6,9 ±1,2


1,9 ± 1,2


0,926

0,864


0,647

Complications dégénératives (%)

Rétinopathie diabétique

Neuropathie périphérique

Artériopathie symptomatique

Néphropathie

Accident Vasculaire Cérébral


10

44

22

0

11


9

54,8

19,2

17,8

   0


0,372

0,726

1

0,341

0,004

Caractéristiques de l’électrocardiogramme de repos

Fréquence cardiaque moyenne (bpm)

Anormal (%)


79,3 ±9,6

77,8


82,9 ±13,9

52,1


0,449

0,143

Discussion

L’objectif de cette étude était de déterminer la prévalence de l’IMS au sein des patients diabétiques suivis en milieu hospitalier à Parakou. Pour ce faire un dépistage par test d’épreuve d’effort a été fait systématiquement chez chaque patient. Ce dépistage systématique n’est pas rentable en termes de rapport coût/efficacité et une approche basée sur l’évaluation préalable du risque cardiovasculaire global a été proposée par l’ALFEDIAM depuis 2004 [7]. Le plateau technique disponible à Parakou, au moment de l’étude, ne permettait pas cette évaluation risque de façon précise. En effet, il n’était pas possible d’avoir le profil lipidique des patients ni un dépistage précis de l’artériopathie oblitérante des membres pelviens avec un doppler. En sachant que la plupart des patients vus à l’hôpital dans notre pays ont déjà une complication dégénérative [13], il nous a paru plus logique d’évaluer tous les diabétiques à la recherche de l’IMS. L’épreuve d’effort est l’examen de première intention recommandée pour le dépistage de l’IMS même si sa sensibilité, sa spécificité et sa valeur prédictive négative sont faibles [14].

L’IMS est fréquemment observée chez le diabétique et sa prévalence varie entre 10 et 30% selon le niveau de risque cardiovasculaire des patients et le test de dépistage utilisé [15]. Dans notre étude, elle était de 11%. Elle est similaire à celle retrouvée dans une étude Milanaise en 1997 où l’IMS a été dépistée dans 12,1 % des cas par l’épreuve d’effort [16]. D’autres études ont trouvé des fréquences plus élevées à partir de l’épreuve d’effort. Janand-Delenne et al en 1999 en France (15,7%) [17], Sahli et al en Tunisie en 2012 (21%) [18], Sadoudi et al en 2014 en Algérie (29%) [19]. Houénassi et al, ont trouvé à Cotonou en 2005, un taux d’ischémie silencieuse de 21,4% à partir d’une association de méthodes diagnostiques (EE et échodoppler cardiaque) [20]. Cette forte proportion d’IMS rapportée par ces différents auteurs, pourrait s’expliquer d’une part, par certaines caractéristiques du diabète, notamment, la grande ancienneté et le mauvais équilibre. En effet, Janand-Delenne et al, Sadoudi et al ont rapporté respectivement une ancienneté de 16,5±7,1 ans et 14,2±7,6 ans, contre 6,6±5,9 ans dans notre étude. Aussi, Sahli et al, ont constaté un mauvais équilibre du diabète dans leur étude (HbA1c moyenne 8,08± 1,9 % contre 6,8 ±1% dans notre étude). D’autre part, l’inclusion des patients ayant un ECG de repos ischémique par Houénassi et al, pourrait expliquer la forte fréquence d’IMS notée dans leur étude. La fréquence de l’IMS dans notre étude aurait été encore plus basse, si d’autres méthodes diagnostiques plus approfondies avaient été utilisées. En effet, dans l’étude Milanaise, on note une baisse de la fréquence de l’IMS à 6,4 %, lorsqu’une réponse positive à deux tests était exigée (EE et scintigraphie couplée à l’effort). Le même constat a été fait dans l’étude de Sadoudi et al où la fréquence d’IMS est passée de 29% à partir de l’épreuve d’effort à 13% à la coronarographie. Aussi, Araz et al [21] ont trouvé une fréquence de 15,5% à la scintigraphie myocardique de stress. Cette fréquence est passée à 9,6% à la coronarographie. Gokcel et al, [22] ont trouvé une fréquence de 8,9% à la scintigraphie myocardique. Cette fréquence est passée à 7,6% à la coronarographie. L’épreuve d’effort présente des limites devant d’autres méthodes diagnostiques de l’IMS telles que la scintigraphie myocardique et la coronarographie. Il ressort de tout ce qui précède que la prévalence de l’IMS est plus faible dans notre série où la majorité des patients ont un risque cardiovasculaire plutôt élevé. Ceci est probablement en rapport avec la faible prévalence d’atteinte coronarienne qui contraste avec le fort taux de complications cérébrovasculaire observé chez le noir afro caraibéen [23, 24].

Dans notre étude, l’âge n’était pas associé à l’existence de l’IMS. Pourtant dans la littérature, l’âge supérieur à 60 ans est associé à une prévalence élevée d’IMS chez les diabétiques [20,25,26]. La petite taille de notre échantillon pourrait expliquer cette absence d’association. De même, ni l’ancienneté du diabète, ni son équilibre n’était associé à la survenue d’IMS dans notre série. Sadoudi et al, Araz et al avaient observé des relations significatives. Selon les travaux de Sahli et al, le taux moyen de l’HbA1c était significativement plus élevé chez les diabétiques ayant une IMS que ceux sans IMS [18]. Le mauvais équilibre glycémique a un effet délétère sur le risque artériel chez les diabétiques (macroangiopathie), bien qu’il apparait comme un facteur de risque plus puissant pour la survenue des complications micro-vasculaires. Seul l’antécédent personnel d’accident vasculaire cérébral est apparu comme la complication du diabète associée à l’IMS dans notre étude. D’autres travaux ont plutôt retrouvé l’AOMI, [17,27, 28], la rétinopathie [17,28] et la néphropathie [19]. L’IMS est presque toujours associée à d’autres complications du diabète ; d’où la nécessité de son dépistage chez les patients diabétiques. Nous n’avons pas trouvé d’association significative dans notre étude entre l’IMS et les facteurs de risque. D’autres études comme nous, ont également fait ce même constat [17,27, 28]. Néanmoins dans l’étude de Gokcel et al [22], l’hypertension artérielle, est apparue comme le seul facteur de risque lié à l’IMS. Le diabète à lui seul constitue un haut risque de maladies cardio vasculaires.

A l’issue de notre étude, l’état de l’ECG de repos normal n’était pas associé à l’absence d’IMS. Ceci est contraire aux résultats de Mbaya et al qui rapporte que l’existence d’une dilation de l’oreillette gauche et d’une hypertrophie ventriculaire gauche chez le diabétique à haut risque cardiovasculaire, pourrait témoigner d’une IMS [29].

Conclusion

Au terme de notre étude, il ressort que les diabétiques suivis en milieu hospitalier à Parakou ont souvent d’autres facteurs de risque cardiovasculaire associés et des complications dégénératives asymptomatiques. L’ischémie myocardique silencieuse (IMS) est présente dans cette population de diabétique et est associée aux autres complications dégénératives sans relation avec relation avec l’ECG de repos. L’épreuve d’effort à la recherche de l’IMS devrait faire partie du bilan systématique de nos patients diabétiques africains.

Conflit d’interet: Néant

Contribution Des Auteurs

  • Conception de la recherche et supervision: HOUENASSI DM
  • Collecte des données et rédaction de l’article: CODJO HL, OGOUYEMI WP
  • Revue de littérature et relecture du manuscrit: ADJAGBA P, DOHOU SHM, SONOU DA, HOUNPONOU M, ALASSANI A, WANVOEGBE A

References

  • Jaussaud J, Douard H, Catargi B. Dépistage de l’ischémie myocardique silencieuse chez le diabétique. Revues Générales 2013; 294: 11-6.
  • Hammoud T, Tanguay JF, Bourassa MG (2000) Management of coronary artery disease: therapeutic options in patients with diabetes. J Am Coll Cardiol 36: 355-365. [crossref]
  • ANAES (1999) Recommandations pour la pratique clinique, suivi du patient diabétique de type 2 à l’exclusion de suivi des complications. c1999.
  • Kusnik–Joinville O, Weill A, Ricordeau P, Allemand H (2008) Diabète traité en France en 2007: un taux de prévalence proche de 4% et des disparités géographiques croissantes. Bulletin épidémiologique hebdomadaire 43: 409.
  • Mankai A, Abid N, Bouzid K, Othmen R, Ibrahim H, Janhani N (2013) Dépistage de l’ischémie myocardique silencieuse chez des diabétiques de type 2. Diabetes & Metabolism S1: A74
  • Young LH, Wackers FJ, Chyun DA, Davey JA, Barrett EJ, Taillefer R, et al. Cardiac outcomes after screening for asymptomatic coronary artery disease in patients with type 2 diabetes. The DIAD study : a randomized controlled trial. JAMA 301:1547-1555
  • Puel J, Valensi P, Vanzetto G, Lassmann-Vague V, Monin JL, et al. (2004) [Identifying myocardial ischaemia in diabetics. SFC/ALFEDIAM joint recommendations]. Arch Mal Coeur Vaiss 97: 338-357. [crossref]
  • Paries J, Brulport-Cérisier V, Valensy P (2005) Predictive value of silent myocardial ischemia for cardiac events in diabetic patients.influence of age in a french multicenter study. Diabetes Care 29: 2722-7.
  • [No authors listed] (1997) [Guidelines of the French Society of Cardiology for exercise testing of adults in cardiology]. Arch Mal Coeur Vaiss 90: 77-91. [crossref]
  • The IDF consensus worldwide definition of metabolic syndrome. IDF2005. http://www.idf.org/webdata/docs/Diabetes_meta_syndrome.pdf
  • Aboyans V, Lacroix P, Waruingi W, Bertin F, Pesteil F (2000) Traduction française et validation du questionnaire d’Edimbourg pour le dépistage de la claudication intermittente. Arch Mal Coeur et des Vaiss 93: 1173-7.
  • Bouhassira D1, Attal N, Alchaar H, Boureau F, Brochet B, et al. (2005) Comparison of pain syndromes associated with nervous or somatic lesions and development of a new neuropathic pain diagnostic questionnaire (DN4). Pain 114: 29-36. [crossref]
  • Houénassi DM, Tchabi Y, Awanou B, Véhounkpé-Sacca J, Yovo RAD, et al. (2013)Évolution du risque cardiovasculaire des patients traités pour HTA à l’hôpital d’instruction des armées de Cotonou. Ann Cardiol Angeiol 62 :12-6.
  • Rubler S, Gerber D, Reitano J, Chokshi V, Fisher V (1987) Predictive value of clinical and exercise variable for detection of coronary artery disease inmen with diabetes mellitus. Am J Cardiol 59: 1310-3.
  • Langer A, Freeman MR, Josse RG, Steiner G, Armstrong PW (1991) Detection of silent myocardial ischemia in diabetes mellitus. Am J Cardiol 67: 1073-1078. [crossref]
  • Milan study on atherosclerosis and diabetes (MiSAD) group. Prevalence of unrecognized silent myocardial ischemia and its association with atherosclerotic risks factors in noninsulin-dependent diabetes mellitus. Am J Cardiol 79 : 134-9.
  • Janand-Delenne B1, Savin B, Habib G, Bory M, Vague P, et al. (1999) Silent myocardial ischemia in patients with diabetes: who to screen. Diabetes Care 22: 1396-1400. [crossref]
  • Sahli N, Temessek A, Tertek H, Antit M, Khadraoui E, Trabelsi N (2012) L’équilibre glycémique du diabète de type 2 et l’ischémie myocardique silencieuse. Diabetes & Metabolism 38: A116.
  • Sadoudi Y, Merad B (2014) Apport de l’épreuve d’effort dans le dépistage de l’ischémie myocardique silencieuse chez les femmes diabétiques. Diabetes & Metabolism 40: A34
  • Houénassi M, Amoussou-guénou D, Tchabi Y, Djrolo F, Sacca-Véhounkpé J, et al. (2007) Dépistage de l’insuffisance coronaire du diabétique au CNHU de cotonou. Bénin Médical 35: 25-9.
  • Araz M, Celen Z, Akdemir I, Okan V (2004) Frequency of silent myocardial ischemia in type 2 diabetic patients and the relation with poor glycemic control. Acta Diabetol 41: 38-43. [crossref]
  • Gokcel A, Aydin M, Yalcin F, Yapar AF, Ertorer ME, et al. (2003) Silent coronary artery disease in patients with type 2 diabetes mellitus. Acta Diabetol 40: 176-180. [crossref]
  • Lip GY, Barnett AH, Bradbury A, Cappuccio FP, Gill PS, et al. (2007) Ethnicity and cardiovascular disease prevention in the United Kingdom: a practical approach to management. J Hum Hypertens 21: 183-211. [crossref]
  • McGruder HF, Malarcher AM, Antoine TL, Greenlund KJ, Croft JB (2004) Racial and ethnic disparities in cardiovascular risk factors among stroke survivors: United States 1999 to 2001. Stroke 35:1557–61.
  • Varenne O (2008) Comment détecter la maladie coronaire athéromateuse chez les patients diabétiques de type 2. Arch of cardiovascular Disease 101: 30-35.
  • Booth G, Kapral M, Fung K (2006) Relation betwen age and cardiovascular disease in men and women with diabetes compared with non-diabetic people: a population based retrospective cohort study. Lancet 368: 29-36.
  • Le Feuvre C, Barthélemy O, Dubois-Laforgue D, Maunoury C, Mogenet A (2005) Stress myocardial scintigraphy and dobutamine echocardiography in the detection of coronary disease in asymptomatic patients with type 2 diabetes. Diabetes & Metabolism 2: 135-42.
  • Naka M, Hiramatsu K, Aizawa T, Momose A, Yoshizawa K (1992) Silent myocardial ischemia in patients with non-insulin-dependent diabetes mellitus as judged by treadmill exercise testing and coronary angiography. Am Heart J 123: 46–53.
  • Mbaye A, Yaméogo NV, Ndiaye MB, Kane AD, Diack B, et al. (2011) [Screening of silent myocardial ischaemia by dobutamine stress echocardiography among type 2 diabetics at high cardiovascular risk in Senegal]. Ann Cardiol Angeiol (Paris) 60: 67-70. [crossref]

A Study on the Influence of Spirituality on the Efficacy of Antitumor Therapies with Natural Anticancer Agents in Untreatable Metastatic Cancer Patients

DOI: 10.31038/CST.2017225

Abstract

The recent discoveries of the existence of natural anticancer agents either from plants, such as Aloe, Myrrh and Magnolia, or from the human body, namely the pineal hormones, allowed the possibility to elaborate new therapeutic natural combinations as a link between the commonly used palliative and curative cancer therapies, which would have not considered in a separate manner. The present study was carried out to evaluate the influence of the spiritual status on the efficacy of a natural anticancer combination containing pineal anticancer hormones in association with Aloe, Myrrh and Magnolia extracts in a group of 70 untreatable metastatic solid tumor patients with life expectancy less than 1 year. The spiritual sensitivity was evaluated by an appropriate faith test for patients affected by an untreatable disease. The percentages of both objective tumor regressions and disease control obtained in patients with high faith score were significantly higher with respect to those found in patients with low faith score. On the same way, the 3- year percent of survival achieved in patients with high faith score was significantly longer than that found in the other group. This study would suggest the efficacy of an antitumor therapeutic strategies with natural anticancer agents also in metastatic cancer patients form whom no other standard antitumor treatment was available, with a greater efficacy in the presence of a real status of spiritual faith.

Keywords

spirituality, cancer disease, psychoneuroimmunology

Introduction

Being cancer a biological war between a human host and an apparently unconscious tumor mass, it is obvious that the prognosis of the neoplastic diseases may depend on both tumor characteristics and the psychobiological identity of cancer patients. Tumor characteristics regard histology, disease extension, biological grading and eventual genetic mutations of cancer cells. At the other side, the individual identity of the single cancer patients involves their consciousness status, psychological behaviour, life style, but also and mainly their endocrine, neuroendocrine and immune status in addition to their clinical conditions [1]. Until some years ago, the human diseases were considered to be due to organicistic or psychosomatic reasons. On the contrary, with the progressive advances in the area of Psychoneuroendocrinoimmunology (PNEI), it was understood that the psychospiritual status of patients may influence the biological body not only through the nervous system, but also through complex nervous, neuroendocrine and endocrine interactions with the immune cells, which after their activation may interact with the endocrine and nervous systems by releasing immunomodulating proteins, the so-called cytokines, which are also able to exert neuroendocrine effects by realising complex feed-back circuits between neuroendocrine and immune systems [2].

As far as the psychological and spiritual point of view is concerned, must be remarked that until few years ago and yet up to now by most researchers, the spirituality has been simply considered only as a part of the psychological status of humans, and only recently some preliminary clinical investigations have suggested that the spirituality is a different condition from both psychology and religion [3]. As far as the relation between psychology and spirituality is concerned, it is possible to affirm that the Psychology represents the analysis of the emotional life, which has its energetic matrix in the sexuality, whereas the Spirituality regards the reality of the different consciousness states. At the other side, the relation between Religion and Spirituality, according to a definition previously reported in the literature [4], the Spirituality is the research of the ultimate meaning of life, while Religion is only a set of beliefs and ritual practices within a well defined religious institution, then it would simply represents one of the possible ways to realize own self spirituality, even though more widely followed with respect to an individual manner to live and feel the spiritual dimension. Then, the individual spirituality may be realized through the same religion or other mysticai experiences, and it Is not a simpie set of emotions, but it constitutes a status of consciousness. Moreover, in agreement with PNEI discoveries [5], both emotions and consciousness states require a well defined psychoneuroendocrine mediation. Then, from a clinical point of view, the two major problems concern the identification of adequate methods to clinically investigate not only the religious profile of patients, but also their spiritual sensitivity, as well as of possible eventual blood biochemical parameters able to reflect the psychological and spiritual status of patients and its influence on the clinical course of the neoplastic disease. However, most studies carried out up to now have been generally limited to the investigation of the influence of the personal religion rather than the real status of cancer patients. In any case, even though limited to the investigation of the influence of religion on the prognosis of cancer, preliminary clinical results seem to suggest that the religious support may allow an increase in the survival time of advanced cancer patients and to improve their clinical status, even though through still unknown mechanisms [3, 4]. The recent advances in PNEI knowledgements, by demonstrating that the immune responses in vivo are physiologically under a psychoneuroendocrine modulatory control [6,7], which represents the biochemical mediation of the spiritual and psychological status of the patients, may allow the hypothesis that the spiritual status may influence the clinical course of the neoplastic disease and the efficacy of the different antitumor therapies by stimulating the immune system and piloting it in an antitumor way through the activation of well-defined psychoneuroendocrine circuits [8]. Moreover, it has to be considered that until about 20 year ago, almost all scientific investigations in the oncological area were limited to the identification of possible carcinogens in the nature, either endogenous molecules, such as estrogens and androgens, or exogenous substances, capable of inducing the malignant transformation. On the contrary, more recent researches have demonstrated the existence of several antitumor plants containing well characterized anticancer molecules, in particular aloe hemodin from Aloe [9], guggulsterone from Myrrh [10] and honokiol from Magnolia [11], as well as more surprisingly the evidence of anticancer endogenous molecules, which would be responsible for the natural immunobiological resistance against cancer onset and growth, in particular some indole hormones released by the pineal gland, namely melatonin (MLT) [12] and 5-methoxytryptamine (5-MTT) [13], and the great group of beta-carbolines [14], which are mainly produced by pineal gland itself. All those natural anticancer agents has no important toxicity. Therefore, the existence of both endogenous and exogenous anticancer agents with a complete lack of biological toxicity but with well known antitumor properties, would justify their empioyment in the medical Oncology in an attempt to realize a link between the simple palliative and the curative therapies of cancer, since several anticancer natural agents, according to the PNEI knowledgements, may deserve both palliative and antitumor effects on cancer progression at least in terms of survival time. The present study was performed to investigate the influence of the spiritual status of consciousness on the antitumor efficacy of a psychoneuroendocrine regimen with antitumor pineal hormones in association with the most investigated anticancer plants in a group of metastatic solid tumor patients, for whom there is no other standard effective therapy of their tumor, by evaluating the spiritual status through a previously described clinical test to explore the spiritual faith in patients affected by an untreatable disease [15].

Materials and Methods

The study included 70 untreatable metastatic solid tumor patients. Eligibility criteria were, as follows: histologically proven metastatic solid neoplasm, measurable lesions, no availability of standard antitumor therapies because of progression on previous chemotherapies, age or low performance status (PS), and life expectancy less than 1 year. Patients affected by metastatic breast cancer or prostate carcinoma were excluded from the study, because of the availability for those tumors of well tolerated hormonal therapies also by the standard medical Oncology. The faith test for patients affected by an untreatable disease employed in the study was performed by the observation of the clinicians in an attempt to exclude possible unconscious mental manipulations in their answers by the patients, and it consisted of the analysis of five major criteria [15], by assigning 20 points to each single criterion, with a maximum score of 100 points and by defining the presence of a real status of spiritual faith for a minimal score of at least 60 points or more. The five criteria were, as follows: 1) complete self-consciousness by the patients of the severity of their diagnosis and prognosis in terns of life expectancy: the absence of an adequate knowledge of the severe prognosis would transform the faith in a simple illusion; 2) lack of excessive anxiety: the anxiety would represent the opposite mental condition with respect to a real spiritual faith; 3) lack of an exaggerated attribution of value by the patients to the professional capacities of the single clinicians, being their disease as considered as untreatable on the basis of the standard medical therapies;4) lack of an excessive analytic tendency by the patients to understand the chemical mechanisms involved in the efficacy of treatments instead of their significance in terms of reactivation of an effective biological natural anticancer resistance; 5) perception of own neoplastic disease not only as a personal problem, despite pain and other intolerable symptoms, but also as an individual manifestation of a general universal suffering involving all humans. The clinical characteristics of patients are reported in Table 1. Lung cancer, pancreatic adenocarcinoma and colorectal cancer were the neoplasms most frequent in our patients. The PNEI strategy of cancer cure consisted of the oral administration of the two most investigated anticancer pineal hormones, MLT and 5-MTT, in association with a phyto-therapeutic regimen consisting of the administration of extracts of the most investigated antitumor plants, including Aloe arborescens, Myrrh and Magnolia. MLT was given at 100 mg/day during the dark period of the day, while 5-MTT was administered at 5 mg in the early afternoon. Magnolia cortex, with a honokiol content of at least 50%, was given at 500 mg twice/day. Finally, Aloe and Myrrh were given at a dose of 10 ml twice/day of a mixture of 60% Aloe and 40% Myrrh. Patients with brain metastases also received Boswellia at 1000 mg/day in the morning, because of its anti-oedema effect. The clinical response was assessed by the WHO criteria by repeating the radiological examinations at 3-month intervals. Data were statisticaliy analyzed by the chi-square test. The survival curves were calculated by the Kaplan-Meyer method and statisticaliy analyzed by the log-rank test.

Table 1. Clinical characteristics of 70 untreatable metastatic solid tumor patients.

CHARACTERISTICS

M/F:

Median age

Median PS (ECOG)

37 / 33
65 years (range 43 — 92)
1 (0—3)
RELIGIOUS FAITH

– Specific religion:

– Catholic Christian religion:

– Protestant Christian religion:

– Oriental Christian religion:

– Buddhism:

– Islam:

– No religion or undefined religion:


29/ 70 (41%)

23

2

1

2

1

41/70 (59%)

TUMOR HISTOTYPE

– Lung cancer:

– Nonsmall celi:

– Smail celi:

– Pancreatic adenocarcinoma:

– Colorectal cancer:

– Gastric adenocarcinoma:

– Biliary tract cancer:

– Hepatocarcinoma:

– Bladder carcinoma:

– Gynecoiogic tumors:

– Ovarian cancer:

– Endometrial adenocarcinoma:

– Melanoma:

– Soft tissue sarcoma:


18

15

3

14

13

5

4

3

3

4

3

1

2

4

METASTASIS SITES

– Soft tissues:

– Bone:

– Lung:

– Liver:

– Liver + lung:

– Peritoneum:

– Brain:


PREVIOUS CHEMOTHERAPY:


18

2

16

18

6

4

6


52/70(74%)

Results

The clinical response achieved in our patients is reported in Table 2. A complete response (CR) was obtained in 2/70 (3%) patients, who were affected the former by gastric cancer and the latter by lung adenocarcinoma. A partial response (PR) was achieved in other 9 patients (colon cancer: 2; melanoma: 2; lung cancer:1; pancreatic cancer:1; endometrial adenocarcinoma:1; biadder cancer:1; biliary tract carcinoma: 1). Then, an objective tumor regression was observed in 11/70 (16%) patients. A stable disease (SD) was found in other 41 patients. Therefore, a disease control (CR + PR + SD) was obtained in 52/70 (74%) patients, whereas the remaining 18 patients (26%) had a progressive disease (PD). A faith score of at least 60 points was found in 51/70 (73%) patients. By considering faith score in relation to the other individuai variables, no significant differences between males and females was observed in the percent of values of at least 60 points (28/37 (76%) vs 22/33 (67%). On the same way, no difference in the percent of high faith score occurred in relation to the three most frequent neoplasms (lung: 12/18 (67%); colon: 9/13 (69%); pancreas: 9/14 (64%)). Moreover, more surprisingly there was no significant difference in the percent of faith score of at least 60 between patients who followed a specific religion and those who had no religion or no defined religion (22/29 (76%) vs 29/41 (71%). Finally, by considering the clinical response in relation to the faith score, the percent of objective tumor regressions (CR+PR) achieved in patients with faith score of 60 or more was significantly higher with respect to that found in patients with values iess than 60(11/51(19%) vs 1/19 (5%), P<0.05). On the same way, the percent of DC (CR+ PR+SD) achieved in patients with high faith score was significantly higher than that observed in those with low faith score (44/51(86%) vs 8/19 (42%), P< 0.01). Table 3 shows the clinical response in relation to the differeni values of faith score. A progressive increase in the percent of DC occurred concomitantly with the increase in faith score values. Finally, the 3-year survival curves observed in our patients are illustrated in Figure 1. The percentage of 3-year survival reached by patients with faith score of at least 60 was significantiy higher than that found in patients with low faith score (P<0.05).

Table 2. Clinical response (WHO criteria) in 70 untreatable cancer patients in relation to their faith score

                                                                  CLINICAL RESPONSE  +
Patients n CR PR CR+PR SD DC PD
Overall patients 70 2 (3%) 9 11 (16%) 41 52 (74%) 18 (26%)
Faith score > 60 51 2 8 10 (19%)* 34 44(86%)** 7 (14%)
Faith score < 60 19 0 1 1(5%) 7 8(42%) 11(58%)

+ CR: complete response; PR: partial response; SD: stable disease; DC (CR + PR + SD): disease control; PD: progressive disease
* P< 0.05 vs low faith score; ** P< 0.01 vs low faith score

Table 3. Clinical response (WHO criteria) in 70 untreatable cancer patients in relation to the different values of faith score

                                                                     CLINICAL RESPONSE
FAITH SCORE(points) n CR PR CR + PR SD DC PD
20 5 0 0 0 1 1 (20%) 4 (80%)
40 14 0 2 2(14%) 6 8 (57%) 6 (43%)
60 33 0 3 3(9%) 18 21(64%) 12 (36%)
80 15 1 3 4(27%) 9 13 (87%) 2 (13%)
100 3 1 0 1(33%) 2 3 (100%) 0

Discussion

This study, carried out in a considerable number of untreatable metastatic cancer patients, would suggest that a neuroendocrine approach with endogenous anticancer molecules, such as the antitumor pineal hormones, and natural antitumor plants, may counteract cancer growth also in patients, who had been considered as untreatable according to the standard anticancer treatments. Moreover, the study shows that the efficacy of therapy is higher in cancer patients with a true spiritual faith, al least in the untreatable ones, even though it cannot be excluded that the reduced therapeutic efficacy observed in patients with low faith score may be simply due to an interruption or a discontinuation of therapy. In any case, even though we are only at the beginning of the possibility to understand the psychochemical mechanisms responsible for mediating the influence of the spiritual faith on the clinical course of the neoplastic diseases, the recent advances in PNEI knowledgements have demonstrated the possibility to modulate the immune system, including the anticancer immunity, by acting on its psychoneuroendocrine regulation [2, 16]. Then, in agreement with the PNEI discoveries, showing a stimulatory effect of both pleasure and spiritual sensitivity and an inhibitory one of stress and depression on the anticancer immunity, it is probable that the increased efficacy of cancer therapies with natural antitumor agents and the prolonged survival time achieved in patients with evidence of spiritual faith may mainly be due to an improvement in the potency of the immune reaction against cancer dissemination [17-19]. Moreover, the study would show that the presence of a real spiritual faith is relatively independent from the adhesion to a specific well defined religion, then it would represent an individual variable rather than to depend on external behaviours, such as the religious practices, by confirming the observations of previous authors, who had considered religion and spirituality as different human conditions [3, 4]. In more detail, since the anticancer action of the pineal hormones and of most antitumor piants is due to both antiproliferative and immunomodulating effects [20], at present, according to the PNEI discoveries, it is possible at present to identify two major functional psychoneuroendocrine systems involved in the mediation of the influence of emotions and spirituality on the anticancer immunity, consisting of the former brain opioid system-pituitary adrenal gland, which is related to stress, pain, anxiety and depression and which plays an inhibitory effect on the anticancer immunity by stimulating T regulatory (T reg) and inhibiting T helper-1 (TH1) lymphocyte functions [21], and the latter brain cannabinergic-mirror neuron-pineal gland functional axis, which on the contrary is related to both pleasure perce1ption and spiritual sensitivity, and which enhances the anticancer immunity by stimulating TH1 and inhibiting T reg activities [22-24]. In any case, both systems would be essential for the survival of the biological species, since the opioid system-pituitary-adrenal gland functional axis would play a fundamental role in the adoptive mechanisms to the environmental and social conditions, while at the other side the cannabinergic system-mirror neuron systems-pineal gland axis would be in relation to the both biological and mind evolution , as suggested by the appearance of cannabinoid receptors in a subsequent time with respect to that of the opioid ones [22], as well as by the evidence of the fundamental role of mirror neurons in the processes of imitation, learning, language, memory and self-consciousness [23] and of the involvement of pineal molecules, such as the beta-carbolines, in mind expansion [25]. If successive studies will confirm the possibility to prolong the survival time and improve the clinical status of metastatic cancer patients, for whom no other standard therapy may be available, by the administration of natural endogenous and exogenous anticancer molecules, the application of the faith score could allow to predict the probability of efficacy of natural treatments themselves, as well as for the commonly used anticancer therapies in relation to the different tumor histotypes and disease extensions.

References

  • Rubinow DR (1987) Brain, behaviour and immunity: an interactive system. J Natl Cancer Inst Monogr 10: 79-82.
  • Besedovsky H, Sorkin E, Keller M, Müller J (1975) Changes in blood hormone levels during the immune response. Proc Soc Exp Biol Med 150: 466-470. [crossref]
  • Stefanek M, McDonald PG, Hess SA (2005) Religion, spirituality and cancer: current status and methodological challenges. Psychooncology 14: 450-463. [crossref]
  • Balducci L, Meyer R (2001) Spirituality and medicine: a proposal. Cancer Control 8: 368-376. [crossref]
  • Antoni MH1 (2003) Psychoneuroendocrinology and psychoneuroimmunology of cancer: Plausible mechanisms worth pursuing? Brain Behav Immun 17 Suppl 1: S84-91. [crossref]
  • Del Rey A, Besedovsky H, Sorkin E, Dinarello CA (1987) Interleukin-1 and glucocorticoid hormones integrate an immunoregulatory feedback circuit. Ann N Y Acad Sci 496: 85-90. [crossref]
  • Manfredi B, Sacerdote P, Bianchi M, Locatelli L, Veljic-Radulovic J, et al. (1993) Evidence for an opioid inhibitory effect on T cell proliferation. J Neuroimmunol 44: 43-48. [crossref]
  • Lissoni P (1999) The pineal gland as a central regulator of cytokine network. Neuro Endocrinol Lett 20: 343-349. [crossref]
  • Lissoni P, Rovelli F, Brivio F, Zago R, Colciago M, et al. (2009) A randomized study of chemotherapy versus biochemotherapy with chemotherapy plus Aloe arborescens in patients with metastatic cancer. In Vivo 23: 171-175. [crossref]
  • Hanus LO, Rezanka T, Dembitsky VM, Moussaieff A (2005) Myrrh–Commiphora chemistry. Biomed Pap Med Fac Univ Palacky Olomouc Czech Repub 149: 3-27. [crossref]
  • Fried LE, Arbiser L. Honokiol (2009) A multifunctional antiangiogenic and antitumor agent. Antioxid Redox Signal 11: 1139-1148.
  • Maestroni GJ (1993) The immunoneuroendocrine role of melatonin. J Pineal Res 14: 1-10. [crossref]
  • Sze SF, Ng TB, Liu WK (1993) Antiproliferative effect of pineal indoles on cultured tumor cell lines. J Pineal Res 14: 27-33. [crossref]
  • Song Y, Wang J, Teng SF, Kesuma D, Deng Y, et al. (2002) Beta-carbolines as specific inhibitors of cyclin-dependent kinases. Bioorg Med Chem Lett 12: 1129-1132. [crossref]
  • Lissoni P, Messina G, Balestra A, Colciago M, Brivio F, Fumagalli L, et al. (2008) Efficacy of cancer chemiotherapy in relation to synchronization of cortisol rhythm, immune status and psychospiritual profile in metastatic non-small cel lung cancer. In Vivo 22: 257-262.
  • Riley V (1981) Psychoneuroendocrine influences on immunocompetence and neoplasia. Science 212: 1100-1109. [crossref]
  • Buswell RS (1975) Letter: The pineal and neoplasia. Lancet 1: 34-35. [crossref]
  • Maestroni GJ, Conti A, Pierpaoli W (1988) Pineal melatonin, its fundamental immunoregulatory role in aging and cancer. Ann N Y Acad Sci 521: 140-148. [crossref]
  • Reiter RJ (2004) Mechanisms of cancer inhibition by melatonin. J Pineal Res 37: 213-214. [crossref]
  • Brzezinski A1 (1997) Melatonin in humans. N Engl J Med 336: 186-195. [crossref]
  • Hassan ATM, Hassan ZM, Moazzeni SM, Mostafaie A, Shahabi 5, et al. (2009) Naloxone can improve the antitumor immunity by reducing the CD+CD25+Foxp3+ regulatory T celis in BALB/c mice. mt J Immunopharmacol 9: 1381-1386.
  • Grotenhermen F (2004) Pharmacology of cannabinoids. Neuro Endocrinol Lett 25: 14-23. [crossref]
  • Rizzolatti G, Craighero L (2004) The mirror-neuron system. Annu Rev Neurosci 27: 169-192. [crossref]
  • Messina G, Lissoni P, Bartolacelli E, Magotti L, Clerici M, et al. (2010) Relationship between Psychoncology and psychoneuro endocrinoimmunology (PNEI).: enhanced T regulatory lymphocyte activity in cancer patients with self-punishment evaluated by Rorschach test. In Vivo 24: 75-78.
  • Ishida J, Wang HK, Bastow KF, Hu CQ, Lee KH (1999) Antitumor agents 201. Cytotoxicity of harmine and beta-carboline analogs. Bioorg Med Chem Lett 9: 3319-3324. [crossref]

WHR is a Better Predictor of Type 2 DM Among Urban Adults in Jos, North Central, Nigeria

DOI: 10.31038/EDMJ.2017123

Abstract

Background

Obesity is considered the strongest risk factor for Type 2 DM and numerous studies have demonstrated this association

Objective

To compare the Body mass index (BMI), the Waist Circumference (WC) and the Waist Hip-Ratio (WHR) in predicting Type 2 Diabetes

Methods

This is a cross sectional study involving 709 subjects recruited from a multi-stage sampling method in the study location. Demographic data and anthropometric variables were obtained according to a standard protocol. Plasma glucose analysis in the fasting state and 2hours after ingestion of 75g glucose were done. We estimated the predictive value of obesity parameters WC, WHR, BMI in the prediction of diabetes. Receiver- Operator Characteristic (ROC) curves were used to determine the predictive power of each variable.

Results

The age range off our subjects was 20-89. There were 308 males (43.4%) and 401 females (56.6%). We documented 29 subjects with incident diabetes (previously undiagnosed) comprising 14 males and 15 females. The ROC curve showed that WHR had the highest AUC.

Conclusion

The ROC curve analysis indicated that WHR was better than WC and BMI in predicting type 2 diabetes.

Introduction

Obesity is an important risk factor for cardio metabolic diseases, including diabetes, hypertension, dyslipidaemia and coronary heart disease (CHD). Obesity is considered the strongest risk factor for type 2 diabetes [1]. Several leading health institutions including the WHO and the National Institute of Health (U.S.A) have provided guidelines for classifying weight status based on BMI [2, 3]. These have agreed that men and women who have a BMI ≥30kg/m2 are considered obese and are generally at higher risk for adverse health events than are those who are considered overweight (BMI between 25.0 and 29.9kg/m2) or lean (BMI between 18.5 and 24.9kg/m2). Therefore, BMI has become the gold “standard” for identifying patients at increased risk for adiposity – related adverse health outcomes [4].

Body fat distribution is also an important risk factor for obesityrelated diseases. Excess abdominal fat (also known as central or upper body fat) is associated with an increased risk of cardiometabolic disease.

Waist Circumference (WC) is often used as a surrogate marker of abdominal fat mass, because WC correlates with abdominal fat mass (subcutaneous and intra-abdominal) [5] and with cardiometabolic disease risk [6]. Men and Women who have waist circumference greater than 102cm and 88cm, respectively are considered to be at increased risk for cardiometabolic disease [7].

IDF recently proposed new waist circumference cut off points as criteria for central obesity [8, 9]. The values are ethnic and gender specific. European values are 94cm for men and 80cm for women, for Asians 90cm for men and 80cm for women. Sub-Saharan Africans are to use European values until more specific data are available.

Methods

We analysed the data of a population based cross-sectional study of 800 urban adults in jos, North Cental, Nigeria. In brief, a multistage sampling technique was used to select 800 subjects who met the inclusion criteria.In the first stage, Jos Municipality was selected ,and in second stage, 2 wards were selected randomly from 40 wards by simple balloting and then in third stage a household survey was done and 800 subjects from 340 households selected systematically(every second household) were identified and invited to participate in the study.

The study procedure was explained to all subjects and written informed consent was obtained from each subject. A questionnaire (Appendix C) was administered to obtain relevant demographic, social and medical history. The questionnaire for data collection, physical measurements and biochemical parameters was adapted and modified from WHO STEPS instrument [10]. All anthropometric measurements were done standardized. The following anthropometric measurements were taken:

i. Weight (kg): Was measured to the nearest 0.1kg with subjects in minimal clothing and without shoes using a standard weighing scale.

ii. Height (m): Was measured to the nearest 0.1cm with a stadiometer with subjects barefoot and without headgear.

iii. Body Mass Index (BMI): Was calculated as weight in kg divided by the square of height in meters (m2 ) i.e. kg/m2 .

iv. Waist circumference (cm): Was measured to the nearest 0.1 cm using a non-stretch metric tape as the horizontal level at the mid-point between the lowest rib and the iliac crest.

v. Hip circumference (cm): Was measured to the nearest 0.1cm as the largest circumference of the gluteal region or as the maximal circumference around the buttocks (posteriorly) and the pubic symphysis (anteriorly).

vi. Waist – to – Hip Ratio (WHR): Was calculated as the waist circumference (cm) divided by the hip circumference (cm).

Fasting blood sugar was measured after 8-12 hours of overnight fast in the morning by the glucose oxidase method. Diabetes was diagnosed as Fasting plasma glucose ≥ 7.0 mmol/l and/or 2 hours plasma glucose ≥11.1 mmol/l after a 75g oral anhydrous glucose load.

The WHO criteria for Obesity with BMI was used. BMI of 18.5- 24.9 for normal, 25.0-29.9 overweight and ≥ 30.0 as obese. Abnormal WC was done with IDF criteria of less than in males and less than in females. Abnormal WHR was determined using……

Statistical analyses was done with SPSS version 16. The Receiver Operator Characteristic (ROC) curve analysis was used to determine which of the anthropometric indices best correlates with glucose intolerance.

Results

Age and Sex distribution of Subjects

Eight hundred subjects were enrolled into the study, of whom 709 responded and participated in the survey giving a response rate of 88.6%. A total of 308 (43.4%) male subjects and 401 (56.6%) female subjects participated in the study giving a male to female ratio of 1: 1.3. The mean (SD) age of study subjects was 43.21 (14.73) years with a range of 20 to 89 years. The mean (SD) age of the male subjects was 42.19 (15.3) years while that of female subjects was 43.99 (14.39) years, females being slightly older, however this difference was not significant,(t=1.62, p=0.10). The age and sex distribution of the study subjects is shown in Table 1.

Table 1. Age and Sex distribution of Study Participants (Responders)

      Age (Years)                   Sex              Total    Percentage (%)
Males Females
20-29

30-39

40-49

50-59

60-69

≥70

76

78

50

59

29

16

77

91

90

61

54

28

153

169

140

120

83

44

21.6

23.8

19.8

16.9

11.7

6.2

Total 308(43.4%) 401(56.6%) 709(100%) 100

X2=11.26 , P=0.046

The comparative ability of the Indices to correctly identify Diabetes mellitus was tested using the Receiver Operator Characteristic (ROC) Curve analysis.

The ROC Curves for DM in Male subjects

The ROC Curves of the Anthropometric Indices associated with the presence of DM in Male subjects are shown in Figure 1. The AUC’s for BMI, WC, WHR were 0.79(p<0.001), 0.83(p<0.001),0.87(p<0.001) respectively showing that although all the studied indices had significant abilities to identify DM in male subjects, WHR was the best in this population.

Figure 1. ROC Curves of the anthropometric Indices associated with the presence of DM in male subjects.

Figure 1. ROC Curves of the anthropometric Indices associated with the presence of DM in male subjects.

All the indices had significant AUC compared to the Null hypothesis true area of 0.5. Since WHR had the highest AUC (0.87), as seen in the curves, it has the best predictive ability for DM in males.

Discussion

The ROC curve analysis for type 2 diabetes in men in this study had AUC’s of 0.79, 0.83, 0.87 for BMI, WC, WHR respectively while that of women in this study had AUC’s of 0.74, 0.69, 0.74 for BMI, WC, WHR respectively.

The findings of this study showed that all the studied anthropometric Indices had significant ability to identify subjects with DM, however WHR was superior to both WC and BMI in predicting Diabetes in men. In women, the WHR yielded equal predictive ability with BMI and both were superior to WC in predicting diabetes in women.

This contrasts with Caucasian studies [11,12]where WC performed better than WHR as a predictor of type 2 DM. The ROC curve analysis for type 2 diabetes in men in this study had AUC’s of 0.79, 0.83, 0.87 for BMI, WC, WHR respectively. These AUC’s are higher than the ones obtained in the EPIC-Potsdam study [13] for type 2 diabetes in men with AUC’s of 0.75, 0.76, 0.74 for BMI, WC, WHR respectively. For men, WHR had the highest AUC in this study while WC had the highest AUC in the EPIC-Potsdam study. In women, for type 2 diabetes, the AUC’s in this study were 0.74, 0.69, 0.74 which was lower than the AUC’s in the EPIC-Potsdam study, 0.80, 0.83, 0.81 for BMI, WC and WHR respectively. BMI and WHR had the highest AUC in this study while WC had the highest AUC in the EPIC-Potsdam study.

In the D.E.S.I.R. study, [14] for type 2 diabetes, in men, BMI had a higher AUC than WC or WHR (0.77 as against 0.74 and 0.66) while in women, WC had a higher AUC than BMI or WHR (0.82 as against 0.77 and 0.77). This differs also from this study which in men, WHR had a higher AUC than BMI or WC (0.87 as against 0.83 and 0.79) and in women, BMI and WHR had higher AUC’s than WC (0.74 as against 0.69) [Figure 1].

Thus while WC co-relates better and appears to be more sensitive than BMI or WHR in identifying type 2 diabetes in Caucasians, WHR co-relates better and probably more sensitive than BMI or WC in identifying type 2 diabetes in our study population. We observed that in our subjects while some had normal BMI and WC, such subjects may have abnormal WHR. This is reflected in the fact that Obesity was commonest using WHR in our study population. This was in agreement with the general observation that native Africans tend to have smaller physical frame than their Caucasian counterpart. This finding suggests that native Africans deposit fat differently from Caucasians whom appear to have larger waist circumference than Africans. Hoffman et al, found that Caucasians had a greater visceral adipose tissue mass and smaller subcutaneous adipose tissue mass compared with African-americans respectively [15]. Mechanisms to explain the racial difference in visceral adipose tissue content are lacking [15]. BMI performed least in its discriminative ability to identify DM in men but performed better than WC in women. BMI is unable to differentiate between fat mass and muscle mass and does not identify abdominal obesity which has been shown to correlate more strongly with obesity related health risks than peripheral obesity [16]. Some Nigerian studies also showed that BMI compared to other anthropometric indices performed poorly as an index of obesity among Nigerian adults with diabetes mellitus [17]. In our subjects with DM, body fat distribution represented by WHR was more sensitive than WC or BMI in identifying them. WHR may be a better measure of central obesity than WC in this population.

Conclusion

The results of our study contrasts with earlier studies in Caucasians with WHR predicting diabetes better than BMI and WC and also discriminated diabetic from nondiabetic subjects with higher accuracy in men. Since obesity, metabolic syndrome, diabetes and cardiovascular diseases are highly prevalent in our population, this results emphasize the application of WHR as an appropriate discriminative tool for identification of diabetes.

References

  • WHO Expert Committee on Diabetes Mellitus: second report (1980). World Health Organ Tech Rep Ser 646: 1-80. [crossref]
  • World Health Organization (1998) Obesity: Preventing and managing the Global Epidemic: Report of a WHO consultation on Obesity. Geneva, WHO.
  • National Institute of Health (1998): National Heart, Lung and Blood Institute. Clinical guidelines on the identification, evaluation, and treatment of overweight and obesity in adults – the evidence report. Obes Res 6 (Suppl.2): S51 – S209.
  • Klein S, Allison D, Heymsfield SB, Kelley DE, et al. (2007) Waist circumference and cardiometabolic risk. A consensus statement from shaping America’s Health: Association for Weight Management and Obesity Prevention: NAASO, the Obesity Society, the American Society for Nutrition; and the American Diabetes Association. Diabetes Care 30: 1647 – 1652.
  • Pouliot MC, Depes JP, Lemieux S (1994) Waist circumference and abdominal saggital diameter: Best simple anthropometric indices of abdominal visceral adipose tissue accumulation and related cardiovascular risk in men and women. AM J Cardiol 73: 460 – 468.
  • Kissebah AH, Vydelingum N, Murray R, Evans DJ, Hartz AJ, et al. (1982) Relation of body fat distribution to metabolic complications of obesity. J Clin Endocrinol Metab 54: 254-260. [crossref]
  • Wang Y Rimm EB, Stampfer MJ, Willett WC, Hu FB (2005) Comparison of abdominal adiposity and overall obesity in predicting risk of type 2 diabetes among men. Am J Clin Nutr 81: 555-563. [crossref]
  • Alberti KG, Zimmet P, Shaw J; IDF Epidemiology Task Force Consensus Group (2005) The metabolic syndrome–a new worldwide definition. Lancet 366: 1059-1062. [crossref]
  • Alberti KG, Zimmet P, Shaw J (2006) Metabolic Syndrome-a new worldwide definition. A Consensus Statement from the International Diabetes Federation. Diabet Med 3: 469-480.
  • World Health Organisation (2008) WHO STEPwise approach to chronic disease risk factor surveillance- Instrument version 2.0, Questionnaire file. Department of Chronic Diseases and Health promotion.
  • Wei M, Gaskill SP, Haffner SM, Stern MP (1997) Waist circumference as the best predictor of Noninsulin dependent diabetes mellitus (NIDDM) compared to body mass index, waist hip ratio and other anthropometric measurements in Mexican Americans- a 7-year prospective study. Obes Res 5: 16-23.
  • Falkenberg M (2001) Check your waist circumference! Overweight, obesity and abdominal obesity risk factors of type 2 diabetes. Lakartidningen 98: 3520- 3522.
  • Schuleze SB, Heidemann C, Schienkiewitz A, Bergmann MM, Hoffmann K, Boeing H (2006) Comparison of Anthropometric characteristics in predicting the incidence of Type 2 Diabetes in the EPIC – Potsdam study. Diabetes care 29: 1921 – 1923.
  • Balkau B, Sapinho D, Petrella A, Mhamdi L, Cailleau M, Arondel D, et al. (2006) and the D.E.S.I.R. Study group: Prescreening tools for diabetes and obesity-associated dyslipidemia: Comparing BMI, Waist and WHR. The D.E.S.I.R Study. Eur J Clin Nutri 60: 295 – 304.
  • Hoffman DJ, Wang Z, Gallagher D, Heymsfield SB (2005) Comparison of visceral adipose tissue mass in adult African Americans and whites. Obes Res 13: 66-74. [crossref]
  • Kahn SE, Prigeon RL, Schwartz RS, Fujimoto WY, Knopp RH, et al. (2001) Obesity, body fat distribution, insulin sensitivity and Islet beta-cell function as explanations for metabolic diversity. J Nutr 131: 354S-60S. [crossref]
  • Okubadejo N, Fasanmade A (2004) Concomitant hypertension and type 2 diabetes mellitus in Nigerians: Prevalence of obesity and its indices compared to normotensive diabetics. Niger Med J 45:79-83.

Low-Dose Molecular Breast Imaging Using Tc-99m Sestamibi: The Impact of Isotope Decay, Tracer Washout and Body Habitus on Image Count Density

DOI: 10.31038/CST.2017224

Abstract

Aim: The aim of this study was to examine the factors influencing count density in low-dose molecular breast imaging and their impact on image quality.

Methods: One hundred patients scheduled for a diagnostic MBI procedure were imaged using a commercially available MBI system following the SNM Practice Guideline for Breast Scintigraphy, with one modification. Each 20 mCi (740 MBq) diagnostic dose of Tc-99m sestamibi was separated into two syringes, with each containing 10 mCi (370 MBq) or with one containing 5 mCi (185 MBq) and the other containing 15 mCi (555 MBq). Patients were randomly injected with 5 mCi, 10 mCi, or 15 mCi and imaged bilaterally in the craniocaudal (CC) view. The remaining fraction of the 20 mCi was then injected, followed by a standard four-view study.

Results: The two sets of CC view images were analyzed to determine the average count density for a given acquisition time and injected activity, after application of an effective half-life correction factor to account for the time-related combined effect of radioactive decay and cellular washout. The average count density of the MBI images was reduced by radiopharmaceutical decay and washout and imaging time should be adjusted accordingly in low dose imaging.

Conclusions : It was observed that the patient weight was one physical characteristic that should be considered for optimal image quality, with the dose increasing in proportion to the patient weight.

Keywords:

Breast Cancer, Breast Specific Gamma Imaging, Molecular Breast Imaging, Low Dose Imaging, Dense Breasts

Introduction

Imaging procedures can be classified into two groups: screening exams and diagnostic exams. The term “screening” is applied to imaging examinations performed on patients without signs or symptoms of disease while “diagnostic” examinations are conducted in response to clinical signs and symptoms present in a particular patient. The majority of medical imaging procedures are performed as diagnostic examinations, however the use of imaging to screen for disease, as is the case in mammography, has significantly increased in recent decades [1]. Mammography does have limitations in its ability to detect breast cancer in women with dense breast tissue [3]. The use of breast MRI has been proposed as an alternative screening examination [4]. Due to the high cost per procedure, its use continues to be limited to high-risk screening populations for whom costeffectiveness has been established [5]. Studies have suggested wholebreast ultrasound as a means to improve cancer detection in patients with dense breast and as a screening examination in women with high risk. Because of its low positive-predictive value and lower sensitivity than MRI, its use has not been broadly accepted [6].

There has been significant interest in the use of nuclear medicine imaging to detect breast malignancies [7, 8] with numerous peerreviewed published articles examining various aspects of its use. Molecular breast imaging (MBI), is a relatively new method for breast cancer detection employing gamma cameras specifically designed to image the breast, primarily using the radiotracer Tc-99m sestamibi [9, 10]. These studies indicate that its sensitivity for the detection of breast malignancies, especially in dense breasts, is comparable to that of MRI and is much higher than that of mammography and ultrasound. The primary limitation to this effort has been the radiation dose to patients (6.7 mSv from the 20 mCi of Tc-99m sestamibi). This dose is acceptable in a diagnostic population where the likelihood of malignancy is significantly higher. However, dose reductions should be achieved if it is to be used for screening; an effort that is being investigated [11]. The purpose of this prospective trial was to evaluate the hypothesis that the count density of MBI breast images scales linearly with the administered dose and to examine patient characteristics that influence the count density when performing low-dose MBI studies to maintain sufficient image quality.

Materials and methods

Study Design

A total of 100 patients scheduled for a routine diagnostic MBI procedure were invited to participate in the prospective dosereduction protocol. The study has been approved by the institutional review board and all subjects signed an informed consent form. Patients enrolling were imaged using a commercially available MBI system (Dilon Technologies, Newport News, Virginia) and imaging was conducted following the SNM Practice Guideline for Breast Scintigraphy with one modification [12]. Each 20 mCi diagnostic dose was separated into 2 syringes containing either two 10 mCi doses or a 5 and a 15 mCi dose. Patients were randomized into initially receiving doses of 5, 10 or 15 mCi, followed by bilateral craniocaudal (CC) acquisitions of 10 minutes. The remaining fraction of the full 20 mCi dose was then delivered and a normal 4-view imaging procedure consisting of bilateral CC and mediolateral oblique (MLO) images was conducted with an acquisition time of 10 minutes for each view. This protocol allowed for a direct comparison between low-dose and normal-dose CC images for each breast of each patient.

Prior to each injection, the activity in each syringe was measured in a dose calibrator. The activity of each dose, the time of each injection and the time between injections were recorded. For the last 60 patients (patients 41-100) the activity remaining in the syringe after the injection was also measured. The patients were typically injected in the arm contralateral to the side of clinical concern, if any, and imaging was performed on the suspicious breast first. Imaging was typically initiated about 10 minutes after injection of the radiopharmaceutical.

Image Analysis

A region-of-interest (ROI) encompassing the breast was drawn on each low-dose and normal-dose image. The total counts and the number of pixels in the ROI were recorded. The average count/pixel was determined and that value was divided by the pixel area (0.1024 cm2/pixel) to determine the average count density (in counts/cm2). Most images were taken for a total of 10 minutes (600 seconds). For images taken for times other than the nominal 10 minutes, the average count density was normalized to a 10-minute acquisition for comparison purposes. The low-dose photon density was compared to the normal-dose photon density for each patient, with each patient serving as her own control. An example set of images showing the region-of-interest and the corresponding average count/pixel value for both the low-dose and normal-dose images is shown in Figure 1.

Figure1. Examples of breast images taken at a low dose and at the normal dose showing the regions used to determine the average count density in each.  The total counts in the region and the number of pixels in the region were used to calculate the average count/pixel value.

Figure 1. Examples of breast images taken at a low dose and at the normal dose showing the regions used to determine the average count density in each. The total counts in the region and the number of pixels in the region were used to calculate the average count/pixel value.

A dose-normalized count density (counts/cm2/mCi) was calculated for the images by dividing the count density by the injected dose. The injected dose was determined by a measurement of the activity immediately before the injection and in some cases that dose was reduced by a measurement of the dose remaining in the syringe after the injection. Only the last 60 patients had post-injection measurements taken. The injected dose for the normal-dose image was the sum of the injected dose for the low-dose image plus the injected dose from the remaining fraction of the full 20 mCi dose.

Six images were typically recorded for each patient; two at low dose (left and right CC) and four at the normal dose (bilateral CC and MLO). The relationship between the count density in the image and the injected dose, which is typically assumed in nuclear medicine and fundamental to any effort to lower the radiation dose to the patient, was explored using two comparisons. First, the ratio of the count density in the low-dose image to the count density in the normaldose image was compared with the ratio of the measured injected low dose to the measured injected normal dose. Second, the ratio of the count density to the measured injected dose (dose normalized count density) was compared for the low dose and normal dose cases. In each case the comparison was done on a patient-by-patient basis such that each normal-dose image could serve as a control for the low-dose image (Figure 2).

Figure 2.  Examples of breast images taken at a low dose and at the normal dose showing the area where the local contrast was calculated.  The algorithm calculates the average counts in the breast and then highlights the pixels in areas where this average value is exceeded and calculates the contrast.

Figure 2. Examples of breast images taken at a low dose and at the normal dose showing the area where the local contrast was calculated. The algorithm calculates the average counts in the breast and then highlights the pixels in areas where this average value is exceeded and calculates the contrast.

Dose Corrections

To account for known time-related changes to the injected dose due to both physical effects (radioactive half-life) and physiological effects (radiotracer washout), radioactive decay and tissue washout corrections must be applied to determine the actual activity of tracer remaining in the breast tissue at the time of imaging. The decay correction is based on the well-known half-life of Tc-99m (361.2 minutes):

Decay Correction = D × 0.8909^T

where T = time in hours and D = Dose

The washout correction is based on modeling of Sestamibi washout from breast tissue as measured in previously published literature [13], assuming a half-life of Sestamibi in the breast tissue of 3 hours:

Washout Correction = D × exp(-T/3)

When used together, these corrections permit the direct comparison of images take at various time points.

Results

Dose Measurements

One hundred patients were enrolled in the study. The activity in the syringe prior to injection of the patient was recorded for both portions of the divided dose. The protocol was modified after the first 40 patients, to record the dose remaining in the syringe after each injection. This remaining dose was subtracted from the dose measured in the syringe prior to the injection to determine the actual injected dose. The total dose administered to the 100 patients is shown in the graph in Figure 3, for both the first 40 patients where no postinjection measurement was made and the last 60 patients where the dose remaining in the syringes was subtracted from the pre-injection dose. For the last 60 patients, the average actual dose injected for the 5 mCi, 10 mCi, and 15 mCi low dose groups was 3.4 mCi (SD=.5 mCi), 8.2 mCi (SD=1.1 mCi), and 12.5 mCi (SD=1.6 mCi), respectively. The average actual total dose injected for all groups in the last 60 patients was 15.3 mCi (SD=2.1 mCi). The percentage of the dose administered to the various dose groups was: 66% (SD= 10%) for the 5 mCi group, 78% (SD=9%) for the 10 mCi group, 80% (SD=9%) for the 15 mCi group and 74% (SD = 9%) for the normal-dose (20 mCi) group. These results indicated that the dose remaining in the syringe after the injection was a significant fraction of the initial dose prior to injection for this group of 60 patients and are consistent with previously reported values [14] where 20% (+- 8%) was retained in syringes of various types.

CST 2017-209_Fig3

Figure 3. Graph showing the dose administered to the patients. Diamonds indicate the low dose and crosses indicate the normal dose. For the first 40 patients, the dose remaining in the syringe was not recorded and therefore the initial dose measured in the syringe prior to the injection was used for these patients. For the last 60 patients, the dose remaining in the syringe was subtracted from the initial dose and the actual delivered dose was calculated.

Image Count Density

The count density for the low-dose and normal-dose images were determined for the right CC image for each patient as described earlier. The ratio of the low-dose and normal-dose count densities was then compared with the ratio of the doses. A plot of this relationship is shown in Figure 4a for the last 60 patients, for which post-injection measurements of the dose remaining in the syringe were made. The quantitative analysis was restricted to these patients with complete information. A linear fit to these results indicates a coefficient of 1.11 (R2=0.96), i.e. slightly higher than 1. This implies that as the dose is increased, there is an 11% larger increase in the uptake. This represents a result that is contrary to what is typically assumed in nuclear medicine imaging and warrants further study. As discussed previously, both physical and physiological corrections were used to adjust the injected low dose for that dose remaining at the time of the second dose. After applying the corrections discussed earlier, a linear coefficient of 0.98 (R2=0.94) was determined, significantly close to a coefficient of 1 (see Figure 4b).

Figure 4a

Figure 4a

Figure 4b

Figure 4b

Figure 4. Comparison of the dose normalized count density for the low dose and normal dose images. The results show the relationship a) before and b) after the normal dose was corrected for the decay of the isotope and washout of the radiopharmaceutical. The dashed line represents a slope of 1 and the solid line is a fit to the data (see text).

For the second comparison, the count density (as determined from the average counts per cm2 in the 10-minute breast image) was divided by the dose to determine the dose normalized count density (in counts/cm2/mCi). This value is independent of dose and should be the same for both the low-dose and normal dose-images, for any given patient. This relationship is shown in Figure 5a for the last 60 patients in the study. A linear fit to these data indicated a coefficient of 0.90 (R2 = 0.89). This deviation from a linear slope of 1 again indicates the fact that low-dose and high-dose injections give different count densities in the resulting images. After applying the corrections to the normal dose calculation, a linear coefficient of 0.98 (R2 = 0.87) is obtained for the same patient results (see Figure 5b).

Figure 5a

Figure 5a

Figure 5b

Figure 5b

Figure 5. Comparison of the ratio of the low and normal uptake to the ratio of the low and normal dose. The results show the relationship a) before and b) after the normal dose was corrected for the decay of the isotope and washout of the radiopharmaceutical. The dashed line represents a slope of 1 and the solid line is a fit to the data (see text).

Discussion

The data suggest that after correcting for the decay and washout of the radiopharmaceutical there is a linear relationship between the injected dose and the count density in the image.There was, however, a variation of uptake among patients given the approximate same doses. This can be seen in Figure 4b, where the average dose-normalized count density was 64.5 counts/cm2/ mCi, but with standard deviation of 21.5 counts/cm2/mCi. This represents a +- 33% variation in the uptake.

Various factors potentially have an influence upon this uptake, some related to patient metabolism and others to the clinical protocol used to administer the dose and perform the imaging. Recent papers have shown that patient fasting and peripheral warming increases the count density in the images and exercise causes a drop in count density in the images [15]. Another study indicated that menopausal status and postmenopausal hormone therapy increased the count density in the images [16] and there is a weak dependence of the count density on breast density and phase of the patient’s menstrual cycle when the imaging is performed [17]. These factors were not recorded as part of this study and potentially contributed to the wide variation in the measured photon density in the images.

CST 2017-209_Fig6

Figure 6. The dose normalized count density for various patients’ weights. The dose values for the first 40 patients (hollow diamonds) have been corrected for the dose remaining in the syringe after the injections, such that they can be compared to the last 60 patient (filled diamonds). The results indicate that there is an upper limit on the count density that decreases with patient weight which is shown by the dashed line in the graph.

The dose-normalized count density measured in the right MLO images versus patient weight for all patients in the study is shown in Figure 6.The count density measurements for the first 40 patients were reduced by 25%, which was the mean fraction of activity remaining in the syringe after injection for the last 60 patients for whom postinjection activity measurements were made. This was done to estimate the actual injected dose for those patients. Of particular note was the fact that there appeared to be an upper limit on the dose-normalized count density in the images, which decreased with patient weight. A line indicating this approximate upper limit has been included in the graph. The equation representing this line is given by:

Uptake (counts/cm2/mCi) = 150 – weight (kg)

This allows us to derive an equation that can be used to adjust the dose given to patients so that image quality can be maintained for heavier patients:

Weighted Dose = Base Dose * (100 / (150-Weight (kg) ) ) for [50< Weight < 125]

Conclusion

The relationship between the count density in the image and the injected dose is typically assumed in nuclear medicine and fundamental to any effort to lower the radiation dose to the patient. Quantitative measurements of the count density (counts/cm2) in gamma camera images of the breast acquired in 100 patients after two subsequent injections of Sestamibi confirm that there is a linear relationship between the image count density and the injected dose only after the decay of the isotope and washout of the agent were considered. This indicates that the decay of the isotope and the washout of the agent between the two injections have a measurable effect on quantitative measurements of the count density. The half-life of the Tc99m isotope is approximately 6 hours, which results in an 11% decrease in the activity over a typical 1-hour imaging sequence. The washout of the Sestamibi varies with the patients’ metabolism, but is typically more rapid than the decay of the isotope. A conservative estimate of 3 hours was used for the calculations in this study. This means that up to 20% of the Sestamibi could washout during a one-hour imaging sequence. In consideration of this decay and washout, the imaging time for each image in a sequence should be adjusted such that all the images in the sequence have approximately the same count density.

Also important in quantifying the actual dose delivered to the patient is a measurement of the dose remaining in the syringe after the injection. In the 60 patients for whom a post-injection measurement was made, an average of 25% of the initial measured dose remained in the syringe after the injection. Therefore, in a typical 20 mCi administered dose, only 15 mCi is actually received by the patient.

While a direct correlation between observed count density and patient weight was not observed, the appearance of an upper limit in the measured count density for a given weight was observed. This upper limit was described by the relationship:

Uptake (counts/cm2/mCi) = 150 – weight (kg)

Consideration of this relationship should dictate that the administered dose be increased as patient weight increases, so that a more constant count density can be achieved for all patient weights. Low-dose imaging can also be hampered by the fact that certain patients exhibit low uptake of tracer compared with other patients of the same weight. As previously discussed, this may be related to various metabolic or physiologic factors. A potential solution would be to adjust the acquisition time to achieve a standard count density in the image on a real-time basis during the acquisition. This requires monitoring the average pixel value during the acquisition and having the acquisition terminate based on that value.Alternatively, efforts have been made to increase the count density in the images by increasing the sensitivity of the MBI camera system through collimator design [18] or by using two detector heads, one on either side of the breast [19]. In this geometry, the reduction in spatial resolution with distance is compensated by the proximity of any area of interest to one of the two detectors [20]. Image combination method can also be used with a two-camera system to enhance the detectability of lesions either by enhancement of the signal to background [18].

An alternative to increase the performance of the molecular breast imaging procedure is to transition from two-dimensional imaging to three-dimensional imaging. Previously suggested concepts have shown increased performance for three-dimensional dedicated SPECT systems and quasi-three-dimensional tomosynthesis systems [21]. These systems have demonstrated superior performance but have yet to be widely implemented. A simple but elegant design that may gain acceptance is the concept of a variable-angle slanthole (VASH) collimator [22]. This type of concept could be easily retrofitted to existing MBI systems, could be used for molecular breast tomosynthesis (MBT), and be easily adapted to perform gammaguided biopsies. Analogous to the leap in diagnostic value seen by the recent transition from digital mammography to digital breast tomosynthesis, the transition from planar molecular breast imaging to 3-dimensional MBT may be a similarly important advancement in diagnosing cancers in the underserved population of high-risk women with dense breast tissue.

This study of 100 patients indicated that the average count density of the MBI images was reduced by radiopharmaceutical decay and washout and imaging time should be adjusted accordingly in low dose imaging. It was also observed that the patient weight was one physical characteristic that should be considered for optimal image quality, with the dose increasing in proportion to the patient weight.

Disclosures:

Benjamin Welch is an employee of Dilon Technologies and possess Dilon stock

Douglas Kieper is a previous employee of Dilon Technology and retains Dilon stock

Marcela Böhm-Vélez has nothing to disclose

Thomas Chang has nothing to disclose

Antoinette Cockroft has nothing to disclose

IRB statement:

This study has been approved by an institutional review board and all subjects signed an informed consent form.

References

  • Van Steen A, Van Tiggelen R (2007) Short history of mammography: a Belgian perspective. JBR-BTR 90: 151-153. [crossref]
  • Hendrick RE (2010) Radiation doses and cancer risks from breast imaging studies. Radiology 257: 246-253. [crossref]
  • Kolb TM, Lichy J, Newhouse JH (2002) Comparison of the performance of screening mammography, physical examination, and breast US and evaluation of factors that influence them: an analysis of 27,825 patient evaluations. Radiology 225: 165-175. [crossref]
  • Saslow D, Boetes C, Burke W, Harms S, Leach MO, et al. (2007) American Cancer Society guidelines for breast screening with MRI as an adjunct to mammography. CA Cancer J Clin 57: 75-89. [crossref]
  • Mainiero MB, Lourenco A, Mahoney MC, Newell MS, Bailey L, et al. (2013) ACR Appropriateness Criteria Breast Cancer Screening. J Am Coll Radiol 10: 11-14. [crossref]
  • Lee CH, Dershaw DD, Kopans D, et al. (2010) Breast cancer screening with imaging: recommendations from the Society of Breast Imaging and the ACR on the use of mammography, breast MRI, breast ultrasound, and other technologies for the detection of clinically occult breast cancer. J Am Coll Radiol 7:18-27.
  • Liberman M, Sampalis F, Mulder DS, Sampalis JS (2003) Breast cancer diagnosis by scintimammography: a meta-analysis and review of the literature. Breast Cancer Res Treat 80: 115-126. [crossref]
  • Sun Y, Wei W, Yang HW, Liu JL (2012) Clinical usefulness of breast-specific gamma imaging as an adjunct modality to mammography for diagnosis of breast cancer: a systemic review and meta-analysis. Eur J Nucl Med Mol Imaging Nov 14, 2012.
  • Rhodes DJ, Hruska CB, Phillips SW, Whaley DH, O’Connor MK (2011) Dedicated dual-head gamma imaging for breast cancer screening in women with mammographically dense breasts. Radiology 258:106-118.
  • Holbrook A, Newell MS (2015) Alternative Screening for Women with Dense Breasts: Breast Specific Gamma Imaging (Molecular Breast Imaging). AJR 204:252-256.
  • Mettler FA Jr, Huda W, Yoshizumi TT, Mahesh M (2008) Effective doses in radiology and diagnostic nuclear medicine: a catalog. Radiology 248: 254-263. [crossref]
  • Goldsmith SJ, Parsons W, Guiberteau MJ, Stern LH, Lanzkowsky L, et al. (2010) SNM practice guideline for breast scintigraphy with breast-specific gamma-cameras 1.0. J Nucl Med Technol 38: 219-224. [crossref]
  • Del Vecchio SD, Ciarmello A, Pace P, et al. (1997) Fractional retention of technetium-99m-sestamibi as an index of p-glycoprotein expression in untreated breast cancer patients. J Nucl Med 38: 1348-51.
  • Swanson TN, Troung DT, Paulsen A, Hruska CB, O’Conner MK (2013) Adsorption of Tc-99m sestamibi onto Plastic Syringes: Evaluation of Factors Affecting the Degree of Adsorption and Their Impact on Clinical Studies. J Nucl Med Technol 41: 247-252.
  • O’Connor MK, Hruska CB, Tran TD, Swanson T, Conners AL, et al. (2015) Factors influencing the uptake of 99mTc-sestamibi in breast tissue on molecular breast imaging. J Nucl Med Technol 43: 13-20. [crossref]
  • Hruska CB, Rhodes DJ, Conners AL, Jones K, Carter RE, et al. (2015) Background Parenchymal Uptake During Molecular Breast Imaging and Associated Clinical Factors. AJR 204: March 2015.
  • Hruska CB, Conners AL, Vachon CM, O’Connor MK, Shuster LT, et al. (2015) Effect of menstrual cycle phase on background parenchymal uptake at molecular breast imaging. Acad Radiol 22: 1147-1156. [crossref]
  • Keller EL (1968) Optimum dimensions of parallel-hole, multi-aperture collimators for gamma-ray cameras. J Nucl Med 9: 233-235. [crossref]
  • Kieper D, Majewski S, Welch B (2008) Method to improve cancerous lesion detection sensitivity in a dedicated dual-head scintimammography system.
  • Weinmann AL, Hruska CB, O’Connor MK (2009) Design of optimal collimation for dedicated molecular breast imaging systems. Med Phys 36: 845-856. [crossref]
  • Williams MB, Judy PG, Gunn S, Majewski S (2010) Dual-modality breast tomosynthesis. Radiology 255: 191-198. [crossref]
  • Gopan O, Gilland D, Weisenberger A, Kross B, Welch B (2014) Molecular Imaging of the Breast Using a Variable-Angle Slant Hole Collimator, IEEE Transactions on Nuclear Science 6: 1143-1152.

Synthesis and Evaluation of Novel Hydroxamic Acid Based Histone Deacetylase Inhibitors as Anti-Cancer Agents

DOI: 10.31038/CST.2017223

Abstract

Background: HDAC inhibition is known to modulate expression of tumour suppressor genes and induce cell differentiation, growth arrest and apoptosis. The aim of this study was to evaluate the efficacy of a novel series of hydroxamic acid based HDAC inhibitors in cell based assays and tumour xenograft models.

Material and Methods: A series of novel hydroxamate derivatives were synthesized and evaluated. HDAC enzyme inhibitory activity was measured using Hela nuclear extracts. Anti-proliferative activity was assessed in a panel of cancer cell lines. Anti-apoptotic activity was evaluated by caspase-3 activation. In vivo efficacy was evaluated in lung adenocarcinoma xenograft model.

Results: The compounds showed potent HDAC inhibitory activity and anti-proliferative activity in several cancer cell lines. In an in vivo A549 lung xenograft model, the compounds exhibited significant tumor growth inhibition.

Conclusion: The novel HDAC inhibitors showed anti-proliferative activity against several human cancer cell lines and also anti-tumor activity in a Mouse xenograft model.

Keywords:

Histone deacetylation, HDAC inhibitor, Vorinostat

Introduction

Histone acetylation/deacetylation is mediated by a class of enzymes known as Histone acetyl transferase (HATs) and histone deactylases (HDACs). HDACs (histone deacetylases) are important enzymes in the regulation of gene expression in eukaryotic cells [1]. HDACs are key enzymes involved in the regulation of histone and non-histone proteins [2]. Increased levels of HDACs in tumor cells are known to be closely associated with tumor initiation, progression and metastasis [3-4]. Inhibition of Histone deacetylases is known to play an important role in epigenetic regulation by inducing cell death, apoptosis, and cell cycle arrest in cancer cells.

Histone deacetylase (HDAC) inhibitors are a diverse group of small molecule drugs that induce a broad range of effects on cancer cells, including cell cycle arrest, apoptosis, cell differentiation, autophagy and anti-angiogenic effects [5]. Histone deacetylase inhibitors (HDACi) have emerged as a class of therapeutic agents that induce tumor cell cytostasis, differentiation and apoptosis in various hematologic and solid malignancies [6-7]. These drugs inhibit HDAC, and several of them have been developed as anti-cancer agents as they have a significant effect specifically on tumor-cell proliferation compared to non-malignant cells.

HDACs inhibitors can be divided into four major structural classes: (1) small molecular weight carboxylates; (2) hydroxamic acids; (3) benzamides; and (4) cyclic peptides [8-9]. Vorinostat (Zolinza) and Romidepsin (Istodax) are the only HDACs inhibitors currently approved by the U.S. Food and Drug Administration (FDA) for the treatment of refractory cutaneous T-cell lymphoma (CTCL) [10-11].

Most of the HDAC inhibitors that have entered clinical trials have limitations, including low bioavailability, low potency, cardiovascular safety issues, and potential for drug-drug interactions through cytochrome P450 inhibition [12]. Therefore, there is still a clinical opportunity for novel, orally available efficacious HDAC inhibitors with a wider safety margin. HDAC inhibitors exhibit anti-proliferative activity in both in vitro and in vivo pre-clinical models of cancer, with many of them being evaluated as anticancer therapeutics in the clinic. However, keeping in mind the poor bioavailability and efficacy in solid tumors, there still remains an unmet medical need to discover newer HDAC inhibitors derived from novel structural classes of compounds.

In the present paper, we report the identification of novel hydroxamic acid based small-molecule HDAC inhibitors by mediumthroughput screening of a compound library using a fluorescence based assay with Hela Nuclear extracts as the enzyme source. A focused library of about 100 compounds was designed and synthesized, among which several compounds showed equivalent or higher potencies against HDAC as compared to Vorinostat. The hit compounds from the primary screening were evaluated for their effects on cellular proliferation in a panel of human cancer cell lines. We identified four compounds which showed a potent GI50 in the low micromolar range. Several of these novel HDAC inhibitors could be promising new lead structures for further development as improved anticancer drugs. In conclusion, the screening of a library of compounds for HDAC inhibitory activity and anti-proliferative effect in cancer cells has identified several promising new leads for further development.

Materials and methods:

Synthesis of HDAC inhibitors

The compound library was obtained from the Medicinal chemistry department at Anthem Biosciences.

Based on general formula 1, about 100 hydroxamic acid derivatives were designed and synthesized.

General formula I

General formula I

These compounds were synthesized as described in below synthetic scheme 1.

Scheme 1

Scheme 1

Reactions of the compound 1 with sodium azide in dimethylformamide at 40 oC resulted compound 2. Then the compound 3 was synthesized by standard click chemistry by reacting the compound 2 with appropriate alkyne in the presence of copper iodide and Hunig’s base in dimethylformamide [13]. Reaction of the compound 3 with hydroxyl amine in the presence of suitable bases such as sodium methoxide in methanol yielded the compounds of general formula I.

Out of nearly 100 compounds synthesized, 4 compounds i.e. PAT-1101, PAT-1103, PAT-1118 and PAT-1125 were identified as hit molecules from the primary screening. Suitable salts of the four compounds were prepared to improve their drug like properties.

Preparation of Hela Nuclear extracts:

Nuclear fractions prepared from Hela cells as per established protocols were used as a source of HDAC enzyme. Hela cells obtained from ATCC were cultured in complete growth medium containing 10% fetal bovine serum supplemented with antibiotics. Subconfluent cells were harvested and washed in phosphate buffered saline (PBS). 1×10⁷ cells were resuspended in 1 mL of cold lysis buffer containing 10 mM Tris HCl (pH 7.5), 10 mM NaCl, 15 mM MgCl2, 250 mM Sucrose, 0.1 mM EGTA and 0.5% NP-40. The cell lysate was then maintained on ice for 15 min. To the lysate, 4 mL of Sucrose buffer containing 30% sucrose, 10 mM Tris HCl (pH 7.5), 10 mM NaCl and 3 mM MgCl2 was added and the resultant mixture was centrifuged at 1500 rpm for 10 min at 4 deg C. The resultant pellet was resuspended in 1 mL of Tris-HCl buffer (10 mM Tris-HCl, pH 7.5, 10 mM NaCl) and recentrifuged at 1500 rpm for 10 min at 4 deg C. The resultant supernatant was discarded and the isolated nuclei was resuspended in 100 µL of cold extraction buffer containing 50 mM HEPES pH 7.5, 420 mM NaCl, 5 mM EDTA, 1mM EGTA, and 10% glycerol. The solution was sonicated for 30 sec and incubated on ice for 30 min following which it was centrifuged at 10000 rpm for 10 min at 4 deg C. The supernatant was collected and used as the enzyme source for HDAC assay.

In vitro HDAC inhibition Assay:

HDAC inhibition assay was performed using a fluorescence based assay with a fluorescent substrate (Boc-Lys (Ac)-AMC Substrate) as reported previously [14-15]. Stock solutions of the compounds were prepared in 100% DMSO. 3 µg of the nuclear extracts was preincubated with the compounds for 10 min at 30 deg C. The substrate was diluted in 50 µL of assay buffer (25 mM Tris HCl pH 8.0, 137 mM NaCl, 2.7 mM KCl, 1mM MgCl2) and added to a 96-well plate. The plate was incubated for a further 45 min at 30 deg C. The reaction was terminated by the addition of 50 µL of developer and incubated for 15 min at 30 deg C. The fluorescent deacetylated substrate was detected at lexc of 340/40 and lemi of 460/40 using a Microplate Reader (BioTek Instrument Inc.). The fluorescent signal was compared with the DMSO treated wells and the percentage inhibition was determined. IC50 (50% HDAC inhibitory concentration) was determined by testing in a wide concentration range of 0.001, 0.01, 0.1, 1 and 10μM.

Cell proliferation assays:

Anti-proliferative activity of the compounds was tested against a panel of cancer cell lines including Lung, Cervix, Colon, Brain, Renal, Leukemia, Prostate, Pancreas, Skin, Bone, Breast, Ovary cancer by using a standard MTT assay. Human cancer cell lines (American Type Culture Collection) were cultured in complete media containing 10% heat inactivated fetal bovine serum and 100 U/ml Penicillin, 100 µg/ml Streptomycin in a 37°C, 5% CO2 humidified incubator and passaged twice weekly. Cells were seeded in 96-well plates at a density of 3X10³ cells per well in 100 µL and were allowed to attach for 24 h. Stock concentrations of the compounds were made in DMSO. 100 µL of media containing various concentrations of compounds (1, 10 and 100 µM) were added to the cells and were incubated for 48 hours. Vorinostat was tested as a reference compound in the assay. On the day of termination, 50 µL of MTT (3-(4,5-dimethylthiazol- 2-yl)-2,5-diphenyl-2H-tetrazolium bromide) (Sigma, St Louis, MO, USA) solution (5mg/mL) was added to the medium and the cells were incubated for 3 hours. The medium was then aspirated and 100% DMSO was added to solubilize the violet MTT-formazan product. The absorbance at 570 nm was measured on a 96-well plate reader by spectrophotometry (Biotek Synergy HT). Assays were performed in duplicates for each concentration. Results are expressed as percentage of growth inhibition with respect to the DMSO treated control wells. A dose response curve was generated and GI50 values were interpolated from the growth curves using GraphPad Prism software.

Apoptosis assay (Caspase-3 activation):

Caspase-3 activity was measured in HT-29 cells using a commercially available kit (Sigma- Aldrich). Briefly, HT-29 cells were cultured in McCoy’s 5a medium containing 10% FCS and antibiotics. On the day of the study 10,000 cells were seeded into each well of a 96 well plate and incubated for 12-16 h. The compounds were added at concentrations ranging from 0.1 µM to 30 µM and incubated for 48 h. The cells were then lysed in lysis buffer and the lysates were used to perform the assay according to the manufacturer’s instruction. The assay is based on the hydrolysis of acetyl Asp-Glu-Val-Asp 7-amido- 4-methylcoumarin (Ac-DEVD-AMC) by caspase 3, resulting in the release of the fluorescent 7-amino-4-methylcoumarin (AMC) which is measured at an excitation and emission wavelength of 360 nm and 460 nm respectively.

In vivo anti-tumor activity in A549 lung adenocarcinoma xenograft model:

All experimental procedures involving animals were approved by the Institutional Animal Ethics Committee of Anthem Biosciences. In vivo anti-tumor activity of the HDAC inhibitors was assessed in 6 week old Athymic Nude mice. Animals were purchased from Harlan Laboratories, Indianapolis IN (presently Envigo) and housed in individually ventilated cages under controlled conditions and maintained on a 12-h light/12-h dark cycle, with food and water supplied ad libitum. A549 (lung adenocarcinoma) obtained from ATCC were cultured in RPMI-1640 growth medium containing 10% FBS and antibiotics. Sub-confluent monolayers were harvested and a cell suspension of >90% viability was prepared in 1X HBSS, pH 7.4 (Hank’s Balanced Salts Solution, Sigma) and mixed with an equal volume (1: 1) of ice cold Matrigel® (Corning Life Sciences). 0.1 mL of the cell suspension containing 1×10⁶ cells was injected into the flank region of the animals under isoflurane anesthesia. Animals were monitored daily during the period between inoculation and palpable tumor growth. Tumor volume was calculated using the formula, Tumor volume = (length × width2)/2. Tumor bearing mice were randomized into control and treatment groups (n=8) when the tumor volume reached ~100 mm3. The compounds were formulated in a vehicle containing 0.5% Carboxy methyl cellulose and 0.1% Tween 80 in water and administered by oral gavage to tumor bearing mice once daily for 21 days. The compounds were tested at 150 mg/kg. The Control group received the vehicle alone. Clinical signs were observed daily and tumor volume and was body weight was measured twice weekly during the study.

Data Analysis:

The terminal tumor volumes from in vivo xenograft studies were subjected to one-way ANOVA analysis followed by Dunnett’s test when there were multiple treatment groups. Results were considered statistically significant when P < 0.05.

Results

HDAC enzyme inhibition:

The biological activity of the HDAC inhibitors was assessed in vitro using a cell free HDAC enzymatic assay. Several compounds exhibited potent HDAC-inhibitory activity with IC50 values of in the nanomolar range (Table 1). Our results indicate that the in vitro HDAC inhibition potency is higher than the reference compound Vorinostat (Figure 1).

Table I. Characterization of hit compounds

Compound M. Wt. (g/mol) Molecular

Formula

HDAC IC50 (nM)
PAT-1101 403.49 C23H25N5O2.HCl 4
PAT-1103 419.49 C23H25N5O3.HCl 1
PAT-1118 393.45 C21H23N5O3.HCl 23
PAT-1125 377.45 C21H23N5O2.HCl 4
Vorinostat 264.32 C14 H20 N2 O3 78

HDAC inhibitory activity of synthesized compounds was measured using Hela cell nuclear extract as the enzyme source by a fluorescence based assay as described under the Materials and Methods section. IC50 was calculated from concentration versus percentage inhibition plotted using Graph Pad Prism software.

Figure 1. Structures of compounds

Figure 1. Structures of compounds

Anti-proliferative activity in cancer cells:

The growth-inhibitory activity of 4 compounds identified through the primary HDAC inhibitory screening was assessed in vitro in a panel of Human cancer cell lines. Cells were treated with the HDAC inhibitors at various concentrations and GI50 was determined. All the 4 compounds identified resulted in a dose-dependent inhibition of cellular proliferation at low micro molar concentrations in most of the cell lines tested (Table 2). The inhibitory effect of PAT-1101, PAT- 1103, PAT-1118, PAT-1125 on the proliferation of cancer cells was comparable or superior to that of Vorinostat against several cell lines under our experimental conditions.

Table 2. Anti-proliferative activity of hit compounds expressed as Mean Growth inhibitory concentration (GI50 in µM) in a panel of cancer cell lines

Tissue Cell line Growth inhibition: GI50 concentration (µM)
PAT-1101 PAT-1103 PAT-1118 PAT-1125 Vorinostat
Colon


Colo-205 0.31 ± 0.06 0.2 ± 0.03 0.3 ± 0.071 0.4 ± 0.04 1.6 ± 0.1
HCT-116 0.10 ± 0.11 0.2 ± 0.05 1.2 ± 0.018 0.2 ± 0.04 2.2 ± 0.0
HT-29 0.15 ± 0.13 0.4 ± 0.13 1.5 ± 0.65 2.1 ± 0.46 3.6 ± 2.6
Lung A549 1.58 ± 1.1 2.0 ± 1.52 4.5 ± 2.33 2.2 ± 2.22 5.9 ± 2.4
NCI-H23 0.52 ± 0.04 0.4 ± 0.09 2.3 ± 1.14 0.5 ± 0.24 3.2 ± 1.0
NCI-H460 0.3 ± 0.04 0.45 ± 0.28 2.4 ± 0.85 1.9 ± 0.74 4.4 ± 1.4
Prostate DU-145 0.079 ± 0.04 0.1 ± 0.03 0.3 ± 0.124 0.1 ± 0.04 1.3 ± 0.0
PC-3 3.5 ± 2.7 1.7 ± 1.02 13.4 ± 3.3 4.8 ± 1.4 8.3 ± 0.6
Ovary SK-OV-3 0.04 ± 0.016 0.5 ± 1.2 1.8 ± 0.20 1.7 ± 0.16 4.4 ± 1.5
PA-1 0.08 ± 0.04 0.04 ± 0.01 0.2 ± 0.037 0.1 ± 0.01 0.3 ± 0.05
Cervix Ca Ski 0.42 ± 0.15 0.4 ± 0.28 1.2 ± 0.22 1.1 ± 0.73 6.0 ± 5.3
Hela-229 1.0 ± 0.27 0.6 ± 0.38 1.4 ± 0.26 0.7 ± 0.47 4.7 ± 3.2
Hela-S3 0.23 ± 0.12 0.2 ± 0.02 0.6 ± 0.16 0.2 ± 0.08 2.9 ± 0.5
Brain IMR-32 0.25 ± 0.07 0.2 ± 0.02 0.9 ± 0.201 0.2 ± 0.04 1.8 ± 0.2
U-87-MG 0.76 ± 0.66 1.1 ± 0.73 2.7 ± 0.74 1.0 ± 0.33 6.7 ± 1.1
SH-SY-5Y 0.34 ± 0.033 0.2 ± 0.03 0.2 ± 0.06 0.1 ± 0.0 0.8 ± 0.4
Breast MCF-7 3.5 ± 2.6 2.1 ± 2.63 5.7 ± 1.62 5.5 ± 1.2 5.5 ± 1.2
Renal ACHN 0.09 ± 0.02 0.2 ± 0.08 0.7 ± 0.11 0.1 ± 0.04 1.6 ± 0.5
786-O 2.65 ± 0.08 1.5 ± 0.70 2.5 ± 1.01 2.0 ± 1.1 4.4 ± 2.0
Leukemia RPMI-8226 0.15 ± 0.05 0.2 ± 0.25 0.5 ± 0.43 0.3 ± 0.16 2.2 ± 2.3
K562 0.19 ± 0.05 0.2 ± 0.08 0.3 ± 0.074 0.2 ± 0.04 2.2 ± 0.7
Pancreas PANC-1 1.03 4 6.6 1.4 21.9
Skin A431 0.28 ± 0.05 0.2 ± 0.03 1.2 ± 0.533 0.4 ± 0.08 1.9 ± 1.0
Bone KHOS 11.7 ± 1.1 4.6 ± 0.55 2.8 ± 0.36 10.3 ± 3.26 29.3 ± 7.2

Anti-proliferative effect of the compounds in a panel of cancer cell lines obtained from ATCC using MTT reagent as described under Materials and Methods. Results are represented as GI50 or the concentration of the compound which inhibits 50% of cell growth. GI50 was calculated using GraphPad Prism software. The Mean GI50 was derived from individual assays performed in triplicates

Induction of Apoptosis in Human Cancer Cells:

We further investigated the compounds’ ability to induce apoptosis in cancer cells and to determine if the apoptosis was caspase dependent. In this regard, compound induced Caspase-3 activation in HT-29 cells was measured using a fluorescence based assay. The compounds significantly activated caspase-3 enzyme with an EC50 which was similar to that of Vorinostat (Table 3).

Table 3.Caspase-3 activation assay

Compound EC50 (µM)
PAT-1101 6.59
PAT-1103 3.62
PAT-1118 1.50
PAT-1125 4.09
Vorinostat 4.52

Anti-tumor Activity in Human Tumor Xenograft Models:

To assess the tumor growth inhibitory activity of the HDAC inhibitors in vivo, we evaluated their effect in a subcutaneous human xenograft model in Athymic Nude mice. The anti-tumor efficacy was evaluated in mice engrafted with A549 lung adenocarcinoma cells. Once daily oral administration of PAT-1103, PAT-1118 and PAT-1125 resulted in a significant tumor growth inhibition (TGI) after 21 days (Figure 2). The tumor growth inhibition (TGI) achieved as a result of treatment was between 67 and 69% at 150 mg/Kg dose. The efficacy was superior to that of Vorinostat which produced 54% tumor growth inhibition at the same dose (Table 4). Furthermore, there were no adverse clinical signs and no significant reduction in body weight in the treated mice compared to the vehicle control group.

Figure 2. Anti-tumor efficacy of HDAC inhibitors in A549 lung tumor xenograft

Figure 2. Anti-tumor efficacy of HDAC inhibitors in A549 lung tumor xenograft
Tumor growth kinetics in Nude mice subcutaneously implanted with 1×10⁶ A549 cells and treated with HDAC inhibitors or Vorinostat at 150 mg/kg, p.o,( n=8 in each group) once daily for 21 days.

Table 4.Tumor growth Inhibition (TGI) in subcutaneous A549 lung tumor xenograft models established in Nude mice

Compound Dose (mg/Kg, p.o) Mean Tumor volume (mm3)  on Day 21 % TGI
Control (Vehicle) 0 598.5 ± 72.9
PAT-1101 150 611.8 ± 125.4 3
PAT-1103 150 282.0 ± 34.7** 68
PAT-1118 150 272.4 ± 42.8** 67
PAT-1125 150 346.4 ± 67.9** 69
Vorinostat 150 342.10 ± 42.80* 54

TGI: Tumor growth inhibition was calculated with respect to the Vehicle treated Control group on Day 21. *P<0.05, **P<0.001, One way ANOVA followed by Dunnett’s test compared to Control

Discussion

We have synthesized and identified a series of hydroxamic acid derivatives designed to inhibit HDAC resulting in anti-cancer activity. In vitro mechanism of action studies demonstrate that the compounds are able to inhibit HDAC with nanomolar potency and activate apoptosis pathways such as caspaze-3 enzyme activation and cause cell death in a wide range of cancer cell lines. Four compounds PAT-1101, PAT-1103, PAT-1118 and PAT-1125 that were identified from the primary screening were tested against a panel of cancer cell lines. All the compounds exhibited anti-proliferative activity against the cancer cell types, with greater or similar potency than that of leading HDAC inhibitors in development. The compounds being novel HDAC inhibitors with good cytotoxic activity against a variety of Human tumor cell lines. Studies to evaluate the drug-likeness of the compounds such as pharmacokinetic profiling and in vivo safety studies would help in developing them as anti-cancer drugs. Improved bioavailability and safety profile of these compounds would help in determining their potential to be more effective in clinical trials than other HDAC inhibitors with poor pharmacokinetic properties and dose limiting side effects.

Acknowledgements

The Authors sincerely thank the management of Anthem Biosciences for their constant support and encouragement in carrying out this study.

Conflict of interest: None

References

  • Hildmann C, Riester D, Schwienhorst A (2007) Histone deacetylases–an important class of cellular regulators with a variety of functions. Appl Microbiol Biotechnol 75: 487-497. [crossref]
  • Witt O, Deubzer HE, Milde T, Oehme I (2009) HDAC family: What are the cancer relevant targets? Cancer Lett 277: 8-21. [crossref]
  • Haberland M, Johnson A, Mokalled MH, Montgomery RL, Olson EN (2009) Genetic dissection of histone deacetylase requirement in tumor cells. Proc Natl Acad Sci U S A 106: 7751-7755. [crossref]
  • Weichert W (2009) HDAC expression and clinical prognosis in human malignancies. Cancer Lett 280: 168-176. [crossref]
  • Marks PA (2010) The clinical development of histone deacetylase inhibitors as targeted anticancer drugs. Expert Opin Investig Drugs 19: 1049–1066.
  • Mercurio C, Minucci S, and Pelicci PG (2010) Histone deacetylases and epigenetic therapies of hematological malignancies. Pharmacol Res 62:18-34.
  • Stimson L, Wood V, Khan O, Fotheringham S, La Thangue NB (2009) HDAC inhibitor-based therapies and haematological malignancy. Ann Oncol 20: 1293-1302. [crossref]
  • Drummond DC, Noble CO, Kirpotin DB, Guo Z, Scott GK (2005) Clinical development of histone deacetylase inhibitors as anticancer agents. Annual Review of Pharmacology and Toxicology 495–528
  • Marks PA, Richon VM, Rifkind RA (2000) Histone deacetylase inhibitors: inducers of differentiation or apoptosis of transformed cells. Journal of the National Cancer Institute 15: 1210–1216.
  • Prince HM, Bishton MJ, Harrison SJ (2009) Clinical studies of histone deacetylase inhibitors. Clinical Cancer Research 12: 3958–3969.
  • Marks PA, Breslow R (2007) Dimethyl sulfoxide to vorinostat: development of this histone deacetylase inhibitor as an anticancer drug. Nature Biotechnology 25: 84–90.
  • Piekarz RL, Frye R, Turner M, et al. (2009) Phase II multi-institutional trial of the histone deacetylase inhibitor romidepsin as monotherapy for patients with cutaneous T-cell lymphoma. Journal of Clinical Oncology 32: 5410–5417.
  • Elaut G, Rogiers V, Vanhaecke T (2007)The pharmaceutical potential of histone deacetylase inhibitors. Curr Pharm Des 13: 2584-2620. [crossref]
  • Das, Jagattaran, Natesan, Selvakumar; Trehan, et al. (2003) Preparation of triazolyl-phenyl substituted morpholine/thiomorpholine derivatives as antibacterial agents. PCT Int Appl 2003059894.
  • Dennis Wegener, Christian Hildmann, Daniel Riester, Andreas Schober, Franz-Josef Meyer-Almes, et al. (2008) Identification of novel small-molecule histone deacetylase inhibitors by medium-throughput screening using a fluorigenic assay. Biochemical Journal J 413:143-150;

Evaluation of antioxidant and polyphenolic content of a Sri Lankan poly herbal formulae and assessment of its in vitro antiproliferative activity on RD and MCF-7 cancer cells compared to healthy CC1 cells

DOI: 10.31038/CST.2017231

Abstract

Background: Evidence of cancer cure or improvement of quality of life in cancer patients has been reported using prescriptions based on traditional knowledge, but not scientifically investigated. The objectives of the current study is to evaluate the anti-proliferative action of a poly herbal drug which is currently used in traditional medicine name “Le Pana Guliya (LPG)”

Methods: The aqueous extract of LPG was freeze dried. Total phenolic content was assayed using Folin Ciocalteu reagent. Antioxidant activity of the extract was evaluated using DPPH radical scavenging assay in vitro. Brine shrimp assay was conducted to determine the cytotoxicity (LD50) of the LPG. The cell viability was determined by MTT assay and cytotoxicity by LDH leakage assay after 24 and 48 hours incubation with LPG. Morphological Changes after the treatment of the drug was observed using an inverted light microscope. RD, MCF-7 cells and CC1 cells were used in all experiments.

Results: The TPC of the LPG was 5.31 ± 0.14 W/W% of GAE and antioxidant capacity is comparable to ascorbic acid. LPG exhibited strong cytotoxic activity against RD and MCF-7 cell lines with MTT assay. A 50% leakage of LDH was observed at concentrations less than 30μg/mL and 10 μg/mL for both RD and MCF-7 cells respectively after 24 hour exposure. While, LPG exhibited strong cytotoxic activity against RD and MCF-7 cells the brine shrimp and CC1 cells results (EC50>100μg/mL) suggest that the LPG have minimum cytotoxicity towards the normal healthy cells.

Conclusion: The present study provides evidence for potent anti cancer activity of LPG on RD and MCF-7 cells. The brine shrimp bio-assay and CC1 cells results suggests that the extract have minimum cytotoxicity towards the normal healthy cells.

Keywords

Anti-proliferative activity, Cytotoxicity, MTT assays, LDH assay, Brine shrimp assay, Light microscopy, RD cells, MCF-7, CC1, DPPH

Introduction

Natural products have played an imperative role in the lead-finding of candidates for the development of present-day cancer chemotherapy due to their low toxicity and side effects. They offer a valuable source of a wide variety of chemical structures with biological activities (lead molecules) for the development of novel drugs [1]. Approximately 60% of all drugs currently undergoing clinical trials for cancer treatment are natural products or compounds derived from natural products [2, 3]. These substances embrace some of the most exciting new chemotherapeutic agents currently available for use in a clinical setting [3].

Sri Lanka is gifted with many plants which have vast medicinal value. Use of plants for medicinal preparations is a primary part of the Sri Lankan cultural life and this is implausible to change in the years to come. The Sri Lankan traditional medicine system shows extensive use of plant products in cancer treatment. A significant surge of interest in chemoprevention research has thus led to the discovery of many phytochemicals as successful chemo preventive agents.

Many traditional healers and folklore medical practitioners in the country have been treating cancer patients for many years using various medicinal plant species. There is evidence of case reports on cancer cure using traditional knowledge, but they are not scientifically investigated. In addition to use of a single plant, poly herbal formulations of drugs are intensively used in Sri Lanka. The poly herbal drug ‘Le Pana Guliya’ (LPG) found in Ola leaf inscriptions is prescribed to treat different types of cancers by traditional doctors.This study was aimed at investigating of its cytotoxic effect against two different cancer cell lines compared with healthy CC1 cells.

Materials And Methods

Chemicals and equipment

Chemicals needed for cell culture and cytotoxicity studies were purchased from Sigma –Aldrich (St Louis, MO63178, USA). 1-Diphenyl-2-picrylhydrazyl (DPPH), TritonX-100, was purchased from Fluka. Tris base was purchased from Promega (Madison, WI 53711–5399, USA). All chemicals used were of analytical grade.
Shimadzu UV 1601 UV visible spectrophotometer (Kyoto, Japan) was used to measure the absorbance. LFT 600 EC freeze dryer was used to obtain the freeze dried powder of the poly herbal drug. Cells were incubated at 37°C in a humidified CO2 incubator (SHEL LAB/Sheldon manufacturing Inc. Cornelius, OR 97113, USA). Inverted fluorescence microscope (Olympus Optical Co. Ltd. 1X70-S1F2, Japan) for observation of cells, and photographs were taken using microscope digital camera (MDC200 2M PIXELS, 2.0 USB). Deionized water from UV ultra-filtered water system (Waterproplus LABCONCO Corporation, Kansas city, Missouri 64132–2696) and distilled water was used in all experiments.

Cell cultures

Human Rhabdomyosarcoma cell line (RD), and human breast adenocarcinoma cell line (MCF-7) were cultured in Dulbecco’s Modified Eagle Medium (DMEM), supplemented with 10% heat inactivated fetal bovine serum (FBS), penicillin (100 U/mL) and streptomycin (100 U/mL). The cells were maintained in 25 cm2 plastic tissue culture flasks at 37oC in a humidified atmosphere containing 5% CO2 in air. Exponentially growing cells were used in all experiments. The normal rat fibroblast (CC1) cell line was employed as the control.

Preparation of poly-herbal extract

The poly herbal drug (5 g) soaked in distilled water (100 mL) was kept in the rotary shaker for 48 hours in an air tight dark bottle. The extract was then filtered through a layer of muslin cloth and filtrate was centrifuged at 3,000 rpm for 15 minutes at 4oC to remove any debris.

The supernatant was freeze dried, and stored at -20°C in an air tight vial until used. The freeze dried extract was reconstituted with distilled water for experimental purposes.

Antioxidant activity

The DPPH assay was used to determine the radical scavenging activity of the extract, as reported previously by Perera (2008) [4]. Briefly different concentrations of plant extract (100 µL) was mixed with DPPH reagent prepared in absolute ethanol (100 µM, 900 µL) and incubated for 30 minutes in darkness at 37oC, in a water bath. The percentage of de-colorization was obtained spectro-photometrically at 517 nm. The control was prepared as above without adding extract while L-ascorbic acid was used as the positive control.

At least three independent tests were performed for each sample. Percentage inhibition was calculated from the following formula:

CST 2017-214 Fomula1

The effective concentration of the sample required to scavenge the respective radical by 50% (EC50) was calculated using the linear segment of the curve obtained with percentage inhibition against concentration.

Total phenolic content (TPC)

The total phenolic content of the lyophilized sample (n = 6) of the poly herbal drug was determined using the Folin-Ciocalteu method [5].

Brine shrimp bioassay

Brine shrimp assay was conducted to determine the cytotoxicity (LD50) of the poly herbal drug as explained previously by Soysa (2014) and Middleton (2005) [6, 7].

Briefly, dried cysts of brine shrimps (10 mg) were allowed to hatch at room temperature in sterile sea water. After 24 hours the free nauplii were selected and 10 were added to each petridish containing different concentrations of the extract in sea water. After 24 and 48 hours, the petridishes were observed using a magnifying glass and the number of survived nauplii in each petridish was counted.

The mortality end-point of this bioassay was defined as the absence of controlled forward motion during 30 seconds of observation [7].

The percentage lethality was determined by comparing the surviving larvae of the test and the control. The percentage survival was calculated as:

CST 2017-214 Fomula2

Cell viability assay

The effect of aqueous extract of the drug on the cell viability was determined by MTT assay. The live cells reduce yellow MTT to purple formazan crystals by mitochondrial dehydrogenase enzyme [8]. Cells were suspended in the growth medium and seeded in 24-well plates at 2 x 10⁵ cells/well for overnight. The cells were then treated with different concentrations of the drug at 37oC for 24 and 48 hours. A positive control with cyclohexamide (50 g/mL) and a negative control without the drug were simultaneously conducted.

Percentage viability of the cells treated with the drug was calculated comparing the viability of the un-treated cells.

After 24/48 hours, the utilized growth media was subsequently replaced with 1.0 mL of minimum essential media (MEM), and 100 µL of MTT (5 mg/mL in PBS). The cells were incubated at 37o C for 4 hours and the medium was carefully removed. The formazan product was dissolved in acidified isopropanol (0.05 M HCl in isopropyl alcohol (IPA); 750 µL) and absorbance was read at 570 nm. Cell survival was expressed as a percentage of viable cells of treated samples to that of untreated cells (negative control). The drug extracts were prepared in triplicate and each experiment was performed in triplicates to each preparation.

Lactate dehydrogenase (LDH) activity

Cytotoxicity induced by the LPG evaluated by lactate dehydrogenase (LDH) leakage into the culture medium, as explained in Fotakis and Timbrell (2006) [9]. Cells seeded in 24 well plates (2 x 10⁵ cells/well) were exposed to different concentrations of the drug. After 24/48 hours incubation the culture medium was aspirated and centrifuged at 4000 rpm for 5 min in order to obtain a cell free supernatant. The cell lysate was prepared by treating the cells with Triton X 100 (0.1%; 1 mL) and sonicating the contents for 20 seconds. The final suspension was centrifuged at 4000 rpm for 5 minutes. Medium and the lysate were subjected to LDH assay. The activity of LDH in the medium was determined using a commercially available, LDH assay kit (HUMAN).

Negative control and positive control with cyclohexamide (50g/mL) were also carried out along with the experiment to measure the percentage LDH leakage.

The absorbance was measured at 340 nm at intervals of 15 seconds for 1.5 minutes using an air blank. The rate of decline (gradients of the graphs) of NADH concentration was used to calculate the LDH activity in the supernatant and the lysate.

The percentage LDH leakage to the medium was calculated using the following equation.

CST 2017-214 Fomula3

Where total LDH activity = LDH activity of supernatant + LDH activity of the lysate.

Light microscopy

RD, MCF-7 and CC1 cells grown at 70% confluence were treated with different concentrations of aqueous drug extracts for 24, 48 and 72 hours and observed under phase-contrast inverted fluorescence microscope (40X). The changes in morphology were compared with positive and negative controls.

Statistical analysis

All the results of the experiments were expressed as the mean ± standard deviation (Mean ± SD). The measurements were performed in triplicate and values shown are representatives of at least three independent experiments. Least square linear regression analysis was applied using Microsoft excel to determine the EC50/LD50 values and for the calibration curves.

R2 > 0.99 was considered as linear for the calibration curves.
Significant differences of each test result were statistically analyzed using “Mann-Whitney U” test significances with 95% significance using SPSS version 16.

Results

Anti-oxidant capacity and total Phenolic content

The aqueous extracts of the poly herbal drug showed moderate free radical scavenging activity with a value of EC50 = 68.0 ± 2.8 g/mL with compared to the positive control, L- ascorbic acid (3.4±0.9g/mL; n=6).
The percentage total phenolic content of the aqueous extract of the poly herbal drug was 5.3 ± 0.1 W/W % of Gallic Acid Equivalence (GAE).

Brine shrimp bioassay

LPG shows no lethality towards the brine shrimp even after 48 hours exposure up to a concentration of 10 to 2000 μg/mL. This results show that the aqueous extract either does not possess any significant (p>0.05) alterations in the cellular functions or no significant cytotoxity.

Cell viability assay

The effect of LPG on cell viability of RD, MCF-7 and CC1 cells was evaluated by tetrazolium assay (MTT).
Multiple concentrations of the aqueous extract of the poly herbal drug were used and effective concentrations were calculated for each cell line (EC50) from dose response curve. The percentage cell viability of RD, MCF-7 and CC1 are shown in Figure 1.

CST 2017-214 Figure1

Figure 1. The percentage cell viability of on RD, CC1 and MCF-7 cell lines as determined by MTT assay, (a) after 24 hours treatment (b) 48 hours and (c) 72 hours with aqueous extract of the poly herbal drug. The data are presented as mean ± SD of six independent experiments.

The aqueous extract of the LPG exhibited no significant cytotoxic activity (p>0.05) against CC1 cell line, achieving an EC50 of 85.3 ± 9.8 µg/mL after 72 hour incubation.

On the contrary, the aqueous extract of the poly herbal drug exhibited significant cytotoxic activity (p<0.05) against RD and MCF-7 cell lines compared to the CC1 cells as shown in Table I.

Table I. EC50 values obtained for MTT assay for the three different cell lines.

CST 2017-214 Table1

*All results were mean of 6 independent measurements ± standard deviation. “Mann-Whitney U” test at 95% confidence level showed a significant difference (p < 0.05) in both RD and MCF-7 cells compared to CC1 cells.

After 24 and 48 hour incubation with Cyclohexamide (Positive control) at a concentration of 50µg/mL, the percentage viability showed by tested cells depicted in Table 2. The percentage cell viability obtained for MTT assay at a concentration of 50µg/mL of LPG was calculated using respective regression equations to compare the capacity to inhibit cell proliferation, with that of the positive control. The values are shown in Table 2.These results exhibited the significant cytotoxicity (p< 0.05) exert by the aqueous extract of LPG against cancer cells compared to CC1 cells as determined by MTT assay.

Table 2. Percentage cell viability obtained by MTT assay at 50 µg/mL Cyclohexamide (+ve Control) and 50 µg/mL LPG after 24 hours and 48 hours exposure

CST 2017-214 Table2

*All results were mean n=6 measurements ± standard deviation in three independent experiments.

Lactate dehydrogenase (LDH) assay

Measurement of LDH activity is also an indicator of cell viability through evaluation of the cell membrane permeability. The enzyme activity is measured externally, as it leaks from dead cells which lose their membrane integrity. The LDH release curves for RD, MCF-7 and CC1 cell lines treated with different concentrations of the LPG suggested that the cytotoxic effect of the extract was concentration dependent (Figure 2).

CST 2017-214 Figure2

Figure 2. Lactate Dehydrogenase (LDH) release from RD, MCF-7 and CC1 cells with aqueous extract of the poly herbal drug, (a) after 24 hour, (b) after 48 hour incubation. The data are presented as mean ± SD of six independent experiments.

Fifty percent leakage of LDH to the media was observed at 26.9± 1.6 and 30.5 ±2.8μg/mL for RD and MCF-7 cells after 24 hour incubation respectively. After 48 hours of incubation with LPG the EC50 values further decreased and 50% LDH leakage arise at 8.2± 0.2 and 6.0± 0.2 μg/mL for RD and MCF-7 cells respectively. In contrast to RD and MCF-7 cells the CC1 cells showed 50% leakage of LDH at 159.3± 3.1 and 103.1 ±5.2μg/mL LPG concentrations after 24 and 48 hours respectively.

Light microscopy

Morphological alterations of RD, MCF-7 and CC1 cell lines upon exposure to the aqueous extract of the poly herbal drug was observed under the phase contrast inverted microscope. The microscopic observations revealed that the aqueous extract has a significant cytotoxic effect on RD and MCF-7 cells compared to the negative control. However CC1 cells treated with the drug did not show significant cell death (Figure 3).

CST 2017-214 Figure3

Figure 3. Light microscopy images of RD, MCF-7 and CC1 cells treated with their respective EC50 values of LPG, with magnification of 40X. (Black arrow – indicates healthy spindle shape cells; Red arrow – dead and shrinkage cells due to the LPG treatment).

Discussion

Cancer has become the most leading cause of death worldwide. It has become an emerging health problem affecting both developing and developed countries. According to the World Health Organization reports published in 2014, 8.2 million patients have died from cancer in 2012 and the number of annual cancer cases reported in 2012 was 14 million. It has been also estimated that the number of annual cancer cases would have increased from 14 million in 2012 to 22 million within the next two decades [10]. The most effective treatment approaches in cancer are chemotherapy and radiotherapy. Nevertheless, the higher incidence in side effects, have made investigators engage in finding novel anticancer compounds with less adverse effects. As a result of this, plants and other natural sources have provided nearly 60% of anti cancer agents which are currently in use [11]. Especially the most novel chemotherapeutic agents more than ever before are botanical in kind [2].

Traditional folklore medicine which involves the use of natural elements uses either single or multiple herbs as a mixture (polyherbs) for treatment of diseases. The use of polyherbal formulation is found to be more effective than the use of a single herb as the active phytochemical constituents of the individual plants are insufficient to achieve the desirable therapeutic effect. But when combining the herbs in a particular ratio the synergistic effect produced by the active phytochemicals of several plants give a better therapeutic effect [12].

Polyherbal preparations are used worldwide for treatment of various disease conditions including cancer. As the polyherbal formulations have gained more attention, many studies have been conducted to identify the mechanism of action and the efficacy of these polyherbal preparations. A latest study [13] which gives a global perspective on polyherbal formulations reports that for the past six years, only 2 publications have been made regarding polyherbal formulations that show/have anticancer activity.

Zyflamend® used in China [14], Sho-saiko-to® used in Japan [15] and Arbudhcure® used in India [16] are few of the polyherbal preparations used for cancer treatment where attempts have been made to validate scientifically for their mechanism of action and therapeutic efficacy.

With compared to the aforementioned poly herbal drugs the polyherbal LPG is not commercialized and no scientific research has been carried out up to this study to identify its mechanism of action or evaluate its effectiveness on treatment of cancer even though it is being used to treat 32 different types of cancer in traditional medicinal system in Sri Lanka.

Secondary metabolites of plants including phenolic compounds are very important for their essential functions in reproduction, growth and in defense mechanisms [17]. Phenolic compounds also provide natural antioxidants for protection against many diseases including cancers. It has been reported that antioxidant effects of plants are mainly attributed to the radical scavenging activity of phenolic compounds such as flavonoids, polyphenols, tannins, and phenolic terpenes. The polyphenols have the capability to scavenge ROS as well as oxidatively generated free radicals which derive from bio-molecules [18].

As depicted in results the quantitative measurement of poly phenolic content obtained in the present study showed that the water extract of LPG has moderate levels of polyphenols. Similarly the EC50 values obtained for the different samples of LPG for DPPH assay showed higher values compared to EC50 of ascorbic acid which evidently indicate that the LPG has a lower anti-oxidant capacity.

It was reported by several authors, that the proliferation of cancer cells are inhibited by the high antioxidant and poly phenolic content present in plant extracts [14, 19]. This probable fact that presence of low polyphenolic content and low antioxidant potential was explained in Hamberger and Hastettman 1991[20], as possible changes occurring in the chemical composition of the plant materials during the processes of the drug manufacturing that could result in a reduced pharmacological activity in mixtures. Thus it can be suggested that even though the LPG exerts an effective antiproliferative activity and cytotoxicity, the mechanism of action must be in a different pathway compared to most of the other traditional medicinal drugs which exert antiproliferative activity via the phenolics and antioxidants.

Cytotoxic action in brine shrimp assay is brought about by the active ingredients present in the drug by disturbing the fundamental mechanisms associated with cell growth, mitotic activity, differentiation and function [21]. According to previous reports a crude plant extract is toxic (active) if it has an LD50< 1000 µg/mL while non-toxic (inactive) if LD50> 1000 µg/mL [22]. The present study evidently indicates that the aqueous extract of LPG shows no lethality towards the brine shrimp even after 48 hours of exposure within the concentrations tested ranging 10 to 2000 µg/mL. This results show that the aqueous extract either does not possess any significant (p>0.05) alterations in the cellular functions or no significant cytotoxicity. Similar results were observed in a previous study which shows anticancer activity of the plant extract of Flueggea leucopyrus against HEp 2 cells but no toxicity for brine shrimps [6].

In this study the cell viability of the tested cell lines were determined by the MTT reduction assay. Each cell type was treated with different concentration of LPG extract and incubated for 24 and 48 hours. The EC50 value was obtained from the graph between the percentages of cell viability versus concentrations of LPG extract (Figure 1). The values were used to describe the degree of cytotoxicity of the extract towards cell lines. The cell viability of CC1 cells were further determined after 72 hours due to the high viability of the cells at 48 hours of incubation (187.58 ± 9.59 µg/mL).

It was established by the American National Cancer Institute (NCI), that if a crude extract shows EC50< 30 µg/mL after an incubation of 72 hours it is considered as cytotoxic [23]. However crude extract with EC50 less than 20µg/mL after 48 hours incubation is supposed to be highly cytotoxic [24]. Present study shows a potent cytotoxic effect on RD and MCF-7 cells with the aqueous extract of the LPG even at 24 hours which is much lower than the value specified by the NCI. However, the extract was less cytotoxic towards normal mouse fibroblast cell line CC1.

After 24 and 48 hours of incubation with Cyclohexamide (Positive control) at a concentration of 50μg/mL, the percentage viabilities of the tested cells are showed in Table 2. In contrast, the percentage viability obtained for MTT assay at the same concentration of LPG (50 μg/mL) treatment was markedly lower for RD and MCF-7 cells (Table 2).The EC50values obtained for MTT assay indicate that the cytotoxicity of the LPG extract against the cancer cell lines is within the limit of cytotoxicity (EC50 < 30 μg/mL), as reported by the American National Cancer Institute (NCI) over 72 hour post exposure and it is beyond the limits for CC1 cells (Table 1) Thus LPG shows significant anti-proliferative activity on cancer cells studied compared to the standard anti cancer drug. Cyclohexamide showed a % cell viability of 69.93 ± 9.26% and 49.31 ± 3.88% for 24 and 48 hours respectively for CC1 cells, suggesting its high toxicity towards the normal cells compared to the LPG (Table 2).

It is reported that the poly herbal anticancer drug Zyflamend® shows an EC50 value of 200 µg/mL against prostate cancer cell line (PCC) after an incubation period of 96 hours [14]. Japanese poly herbal drug Sho-saiko-to® shows an EC50 value of 353.5 µg/mL against human hepatocellular carcinoma (HCC-KIM) at 72 hour incubation [15], while Arbudhcure® shows an EC50 of 33.0 µg/mL against HeLa cells for 48 hours post exposure to the respective drug [16]. The current study demonstrates that LPG shows higher anti-proliferative activity on four different cancer cell lines investigated in the present study in comparison with aforementioned polyherbal drugs.

Measurement of LDH activity is another indicator of cell viability through evaluation of the cell membrane permeability. Previous studies suggest that LDH is a more reliable and accurate marker of cytotoxicity, since damaged cells is fragmented completely during the course of prolonged incubation with substances [25]. The intracellular LDH release to the medium is a measure of irreversible cell death. Xia (2007) [26] reported that there is a correlation between the direct involvement of LDH up regulation and subsequent induction of apoptosis, which is ideal for an effective anti cancer drug.

Fifty percent leakage of LDH to the media was observed at 26.9± 1.6 and 30.5 ±2.8μg/mL for RD and MCF-7 cells after 24 hour incubation respectively. After 48 hours of incubation with LPG the EC50 values further decreased and 50% LDH leakage arise at 8.2± 0.2 and 6.0± 0.2 μg/mL for RD and MCF-7 cells respectively. In contrast to RD and MCF-7 cells the CC1 cells showed 50% leakage of LDH at 159.3± 3.1 and 103.1 ±5.2μg/mL LPG concentrations after 24 and 48 hours respectively. These results indicate that the LPG is having minimal cytotoxic effect on control cells while it possesses a remarkable cytotoxicity on two cancer cell types studied.

Morphological alterations of RD, MCF-7 and CC1 cell lines upon exposure to the aqueous extract of the LPG revealed that even at low concentrations the morphology of the RD and MCF-7 cells changed into an irregular shape with extremely condensed nuclear contents, signs of membrane blebbing, suggesting an autophagic mechanism of cell death. The untreated cells (negative control)of RD and MCF-7 cell lines show cells with normal morphology (Spindle shape/ elongated cells) that adhered to the culture plate with no signs of cells death and growth disorders.

The positive control also shows the typical morphological changes which indicate the cellular damage in RD and MCF-7 cells. In contrast to the RD and MCF-7 cells the CC1 cells do not show any significant morphological changes even after 72 hour incubation with the extract.

Conclusions

The present study provides strong evidence for potent anti-cancer activity of the poly herbal drug “Le Pana Guliya” on RD and MCF-7 cells compared to controls. The brine shrimp and CC1 cells results suggest that the extract has minimum cytotoxicity towards the normal healthy cells. This calls for further studies on the active components and the mechanism of action involved in cytotoxicity of the chemotherapeutic action of LPG.

Acknowledement: The financial support by World Class University Research Grant No. AP/3/2012/CG/10is highly acknowledged.

Conflict of Interest: No conflict of interest between authors.

References

  • Vuorelaa P, Leinonenb M, Saikkuc P, Tammelaa P, Rauhad JP, Wennberge T and Vuorela H (2004) Natural products in the process of finding new drug candidates. Current Medicinal Chemistry11:1375-1389.
  • Biswas J, Roy M and Mukherjee A (2015) Anticancer Drug Development Based on Phytochemicals. Journal of Drug Discovery, Development and Delivery 2: 1012.
  • Hosseini A and Ghorbani A (2015) Cancer therapy with phytochemicals: evidence from clinical studies. Avicenna Journal of Phytomedicine 5:84-97.
  • Perera MGAN, Soysa SSSB, Abeytunga DTU and Ramesh R (2008) Antioxidant cytotoxic properties of three traditional decoctions used for the treatment of cancer in Sri Lanka. Pharmacognosy Magazine 4: 172-181.
  • Velioglu, YS, Mazza G, Gao L and Oomah BD (1998) Antioxidant activity and total phenolics in selected fruits, vegetables, and grain products. Journal of Agricultural Food & Chemistry 46: 4113–4117.
  • Soysa P, De Silva IS and Wijayabandara J (2014) Evaluation of antioxidant and antiproliferative activity of FlueggealeucopyrusWilld (katupila). BMC Complementary and Alternative Medicine 14:274.
  • Middleton P, Stewart F, Al-Qahtani S, Egan P, O’Rourke C and Sarker SD (2005) Antioxidant, antibacterial activities and general toxicity of Alnusglutinosa, Fraxinus excelsior and Papaverrhoeas. Iranian Journal of Pharmaceutical Research 2:81-86.
  • Mosmann T (1983) Rapid colorimetric assay for cellular growth and survival: application to proliferation and cytotoxicity assays. Journal of Immunological Methods 65:55-63.
  • Fotakis G and Timbrel J (2006) A In vitro cytotoxicity assays: Comparison of LDH, neutral red, MTT and protein assay in hepatoma cell lines following exposure to cadmium chloride. Toxicology Letters 160: 171–177.
  • World Cancer report 2014. International Agency for Research on Cancer (IARC) 2014, World health organization.
  • Cragg GM and Newman DJ (2000) Antineoplastic agents from natural sources: achievements and future directions. Expert Opinion on Investigational Drugs 9:2783-2797.
  • Parasuraman S, Thing GS and Dhanaraj SA (2014) Polyherbal formulation: Concept of ayurveda. Pharmacognosy Reviews 8:73-80.
  • Aslam MS, Ahmad MA, Mamat AS, Ahmad MZ and Salam F (2016) An Update Review on Polyherbal Formulation: A Global Perspective. Systematic Reviews in Pharmacy 7:35-41.
  • Zhao Y, Donohoe D, Huang EC and Whelan J (2015) Zyflamend, a polyherbal mixture, inhibits lipogenesis and mTORC1 signalling via activation of AMPK. Journal of Functional Foods 18:147-158.
  • Yano H, Mizoguchi A, Fukuda K, Haramaki M, Ogasawara S, Momosaki S and Kojiro M (1994) The herbal medicine sho-saiko-to inhibits proliferation of cancer cell lines by inducing apoptosis and arrest at the G0/G1 phase. Cancer Research 54: 448-454.
  • Pankajaakshan PK and Hashim KM (2014) Anti-cancer activity of Arbudhcure prepared from Aswathy medical hall. European Journal of Experimental Biology 4:22-25.
  • Prior RL, Wu, X and Schaich, K (2005) Standardized methods for the determination of antioxidant capacity and phenolics in foods and dietary supplements. Journal of Agriculture and Food chemistry 53: 4290-4302.
  • Valko M, Leibfritz D, Moncola J, Cronin MTD, Mazura M and Telser J (2007) Free radicals and antioxidants in normal physiological functions and human disease. Review. International Journal of Biochemistry and Cell Biology 39: 44-84.
  • Suryavanshi S, Choudhari A, Deshpande R, Kulkarni O and Kaul-Ghanekar R (2011) Analyzing the antioxidant potential of aqueous and ethanolic preparations of an herbal composition (HC9) and evaluating their cytotoxic activity in breast cancer cell lines. Biotechnology, Bioinformatics and Bioengineering 1:513-522.
  • Hamberger M, Hastettman K (1991) Bioactivity in plants: the link between phytochemistry and medicine. Phytochemistry 30:3864-3874.
  • Meyer BN, Ferrigni NR, Putnam JE, Jacobsen LB, Nichols DE and McLaughlin JL (1982) Brine shrimp: A convenient general bioassay for active plant constituents. Journal of Planta Medica 45: 31-34.
  • Olowa LF and Nuñeza OM (2013) Brine Shrimp Lethality Assay of the Ethanolic Extracts of Three Selected Species of Medicinal Plants from Iligan City, Philippines. International Research Journal of Biological Sciences 2: 74-77.
  • Abdel-Hameed ES, Salih A, Bazaid SA, Shohayeb MM, El- Sayed MM and El-Wakil EA (2012) Phytochemical studies and evaluation of antioxidant, anticancer and antimicrobial properties of Conocarpus erectus L. growing in Taif, Saudi Arabia. European Journal of Medicinal Plants 2: 93-112.
  • Mahavorasirikul W, Viyanant V, Chaijaroenkul W, Itharat A, Na-Bangchang K (2010) Cytotoxic activity of Thai medicinal plants against human cholangiocarcinoma, laryngeal and hepatocarcinoma cells in vitro. BMC Complement Altern Med 10: 55. [crossref]
  • Sarveswaran S, Marati RV and Marathaiveeran PB (2006) Effects of Terminalia arjuna bark extract on apoptosis of human hepatoma cell line (HEPG2). Journal of Gastroenterology 12: 1015-1024.
  • Xia GH, Chen BA, Shao ZY, Lu HX, Konstanze D and Hartmut D (2007) Mechanism of 2-methoxyestradiol-induced apoptosis in myelodysplastic syndrome MUTZ-1 cell line. Zhongguo Shi Yan Xue Ye Xue Za Zhi 15:296-301.