Author Archives: author

The correlation of follicular fluid Anti Mullerian Hormone (AMH) and follicular fluid soluble receptor of Advanced Glycation End products (sRAGEs) with IVF outcome, in women with Polycystic Ovarian Syndrome

DOI: 10.31038/IGOJ.2018122

Abstract

Aim: The aim of this study was to investigate the association between follicular fluid (FF) AMH and follicular fluid (FF) soluble receptor of Advanced Glycation End products (sRAGEs) in women with Polycystic Ovarian Syndrome (PCOS) regarding IVF outcome parameters.

Methods: FF AMH, serum AMH and FF sRAGEs were measured in 49 women undergoing IVF in the IVF Department of University Hospital of Alexandroupolis from December 2014 to May 2015. Women were divided in two groups, the PCOS women and the non PCOS women (Group A 38 non PCOS women and Group B 12 PCOS women). FF AMH, serum AMH and FF sRAGE values of Group A were compared to those of group B. The correlation of these values with IVF outcome parameters was investigated in both groups.

Results: We did not find a correlation among the factors studied (serum AMH, FF AMH and FF sRAGES). FF sRAGE levels were found to be higher in PCOS women (p-value <0,01). No correlation of FF sRAGE concentration and number of oocytes retrieved during IVF or number of embryos was noted in PCOS women. FF sRAGE levels were only found to be negatively correlated with the quality of the oocytes retrieved in non PCOS women (r= -0.484, p-value= 0.003). The higher the FF sRAGE concentration, the lower the quality of the oocytes was found to be. A negative correlation was also noted between FF sRAGE levels and BMI in non PCOS women (r= -0.401, p-value=0.014).

Conclusion: These findings support that FF sRAGEs could not be used combined with AMH measurements (serum and FF) to predict IVF outcome but could be used separately and only in non PCOS women.

Keywords

AMH, oxidative stress, sRAGEs, PCOS, ovarian reserve, IVF outcome

Introduction

Firstly described in 1935 by Stein Leventhal 1], Polycystic Ovary Syndrome (PCOS),  is the most common endocrine disorder among reproductive-aged women and the main cause of female infertility due to anovulation, affecting the 19,9 % of Caucasian women under the Rotterdam criteria [2]. It is, therefore, understood that determining ovarian reserve- the quality and quantity of ovarian follicles at a given point in time and being able to predict total IVF outcome in women with PCOS is of great importance in Assisted Reproduction Technology (ART) [3].

Ovarian reserve markers

Up to date, many markers including FSH, estradiol, inhibin B, anti-Müllerian hormone (AMH), the antral follicle count (AFC), the ovarian volume (OVVOL) and the ovarian blood flow, have been studied and proposed as ovarian reserve markers [3].

Among them, the use of AMH seems to be widely accepted and has gained value in everyday clinical practice. AMH is a member of TGF-b glycoprotein superfamily, mainly expressed in granulosa cells of growing antral and pre-antral follicles in the gonadotropin independent phase [4]. AMH inhibits follicle sensitivity to follicle-stimulating hormone (FSH) and therefore affects follicular growth [5]. In clinical practice, AMH has been found to have high specificity and sensitivity in predicting ovarian response to Controlled Ovarian Stimulation (COS). Positive correlation with oocyte retrieval, role in poor responders’ prediction and a relation with life birth rate after IVF have also been noted [6–9]. AMH declines during reproductive age from puberty to menopause until it is almost undetectable [10, 11]. The idea of age related ovarian reserve diminishment and subsequent decline of ovarian function and reproductive potential have led scientist to seek for ovarian aging markers that could be used in practice as ovarian reserve markers.

Oxidative stress and ovarian aging

It is known that aerobic organisms develop the ability to use oxygen to efficiently emit energy. The prevention of oxidation during this procedure is controlled by antioxidant defense mechanisms and is of great importance. Any imbalance of the available antioxidant mechanisms combined with uncontrolled oxidation of biomolecules, mainly by the reactive oxygen species (ROS), results in oxidative stress. Many types of molecules like nucleic acids, proteins, lipids and carbohydrates may be damaged by oxidative stress suggesting that proteins, membranes and carbohydrate complexes could be victims of oxidative stress resulting in unrepaired DNA damage, telomerase loss, altered proteins and lipid destruction. These catastrophic oxidative events accumulate with age, cause tissue damage and in humans plays a significant role in the pathophysiology of many pathological situations and diseases, including the age related ovarian quality and quantity decline [12,13]. Thus, oxidative stress has been proposed to be involved in the pathogenesis of infertility. ROS concentrations have been proposed by many researchers to affect negatively fertilization and implantation [14]. More recently, the Advanced Glycation End products (AGEs) have been proposed to get involved in ovarian function decline [15, 16].

Advanced Glycation end products (AGEs), are the products of one of the most important modifications that occurs after translation, the nonenzymatic glycation of proteins, lipids, and nucleic acids [17, 18]. AGEs may either cause the formation of cross links between key molecules in the basement membrane of the extracellular matrix (ECM) or act via binding to receptors. Two types of receptors have been described. The first one is the multi-ligand transmembrane receptor, the RAGE (receptor for advanced glycation end products), known as the inflammatory receptor [17, 18]. RAGEs are expressed by several cell types, like endothelium, smooth muscle cells and ovaries and their activation may lead to unfavorable cellular conditions like proinflammation, cellular toxicity, and cellular damage via activating nuclear factor-κB [19, 20]. The second receptor that has been described is the soluble RAGE (sRAGE). sRAGE is an extracellular form of RAGE, lacking the cytosolic and transmembrane domains. It is able to adverse intracellular effects AGEs can cause and therefore is known as anti-inflammatory receptor [17, 18].

Prolonged exposure to AGEs, during reproductive life, has been shown to be able to cause subtle oxidative damage to the follicles of the ovary by altering ovarian microenvironment. These changes in the ovarian microenvironment may have adverse effects on granulosa cells’ metabolism, in antioxidant defense, and the development of inadequate follicle vascularization with subsequent follicle hypoxia. Follicle health and maturation may be negatively affected and age related oocyte dysfunction events may occur [21]. Additionally, it has been found that ff sRAGE levels were higher in younger women than in advanced aged women undergoing IVF treatment [22].The idea that sRAGEs may have a protective role in these unfavorable events have led scientist to investigate the correlation of sRAGEs with ovarian reserve markers.

Ovarian reserve markers in PCOS

AMH levels in women with PCOS have been shown to be two to three times higher than in healthy controls and levels of AMH are on average 75 times higher in granulosa cells from PCOS ovaries, compared to levels in granulosa cells from normal ovaries because of the increased development of antral follicles compared to normal women [23,24]. Serum AMH has been shown to be a diagnostic marker of high specificity (92%) and sensitivity (67%) for PCOS [24].

Serum AGE levels and AGE-RAGE expression in theca and granulosa cells have been found to be higher in PCOS women than in healthy controls. This has been attributed to hyperglycemia, oxidative stress and insulin resistance in PCOS women [25, 26] and is linked to diminished ovarian reserve and abnormal folliculogenesis [27]. On the contrary, follicular fluid sRAGEs have been found to be lower in women with PCOS compared to non-PCOS women [28, 29].

It has been shown, in vitro, that the inappropriate prolonged activation of ERK1/2 path, which is critical for normal follicle growth and the beginning of ovulation, by AGEs via intervention in the action of LH, could be responsible for the impaired follicle growth and the subsequent ovulation dysfunction that characterizes PCOS women. Moreover, it is understood that AGEs accumulation in FF of PCOS women could lead to premature ovarian aging [30].

Methods & Materials

49 women from different regions of Greece, mainly from Thrace, who received IVF treatment in the IVF Department of University Hospital of Alexandroupolis from December 2014 to May 2015 were recruited for this study and were divided in two groups (Group A and Group B) . Group A consisted of 38 non PCOS women, while Group B of 12 PCOS women diagnosed under the Rotterdam criteria. Written consent was signed by all women.

Controlled Ovarian Stimulation (COS) was offered to all women, after preliminary control and appropriate COS protocol was chosen for each after study and evaluation of parameters like age, day 3 serum FSH, day 3 serum LH, serum AMH and others. During COS period all women were offered serial ultrasound examinations and serum Estradiol (E2) measurements in order to evaluate respond to stimulation. I.M b-HCG administration was decided when at least 3 of developing follicles reached diameter of 18 mm and oocyte retrieval (OR) was planned for 36 hours post. During OR, FF needed to measure AMH and s RAGEs was collected.

Follicular Fluid collection

During oocyte retrieval, follicular fluid was aspired and collected in tubes. The embryologist separated the oocytes in FF and placed them in a plate with culture substances. Meanwhile, FF was collected in a falcon and labeled with woman’s name. Following FF was centrifuged for 15 minutes in 3000 rpm, to remove any unnecessary element, like cumulus cells. After centrifugation was completed, supernatant serum was transferred to another falcon (labeled with woman’s name) and refrigerated in -70 degree of Celsius. This procedure was followed in all cases in order to collect the samples.

Moreover, in order to be able to distinguish PCOS from non PCOS samples, falcons were labeled with respective labels. Therefore, the samples of Groups A and B could easily be evaluated and compared. AMH and sRAGE measurements were carried out simultaneously by the same kit, special for each parameter. AMH was measured by Elisa method, according to kit’s manufacturer (Anshlab) instructions (UltraSensitive AMH/MIS ELISA AL-105-i). The kit Quantikine ELISA/ Human RAGE was used for the measurements for the FF sRAGE levels according to manufacturer’s instructions(R & D Systems).

Statistical Analysis

The IBM SPSS Statistics for Windows Program, Version 21.0. Released 2012, Armonk, NY: IBM Corp. was used for the statistical analysis in our study.

Demographic characteristics and clinical data of women recruited were evaluated by descriptive statistic methods. The ratio of MII oocytes to the total number of oocytes retrieved for each woman was defined as simple quantitative expression of Oocyte quality. We consider that this ratio adequately represents oocyte quality and were used as quantitative variable during analysis. T-test for independent variables was used to compare the quantitative variables between two groups while χ2 test was used to compare the qualitative variables. Significance levels for both cases was set at 0, 05.

The concentrations of the parameters studied (serum and FF AMH, FF sRAGE) were calculated and presented as mean values ± standard deviation for each group separately. The comparison of these concentrations between the two groups was made by t-test for independent variables with significance level of 0.05.

In each group, quantitative variables were examined for possible monofactor linear correlation among them by the Pearson correlation coefficient r and the relative p-values. Multifactor linear regression was applied to whole sample, in order to study the correlation of ff sRAGE, ff AMH and serum AMH levels, taking into consideration women’s age, BMI and PCOS presence. The results of this multifactor analysis were expressed via βήτα coefficient (βήτα mean value± standard error) and the relative p-values. In the mono factor and in the multifactor analysis the significance level was of 0.05.

Results

In the beginning, we completed the above analysis between the two groups, including all qualitative and quantitative variables we had collected. The demographic and clinical characteristics of all women are presented in Table 1. Infertility in non PCOS women was attributed to tubal factor (21, 6%), to male factor (24, 3%), to premature ovarian failure (8, 1%), to other factors (8, 1%), to more than one factors (18, 9%) or was unknown (18, 9%). PCOS women presented in great percentage more than one infertility factors (50%). PCOS women had higher E2 levels when compared to non PCOS women, had more growing follicles during stimulation, more oocytes after OR. They also had more MII oocytes and more embryos available for embryo transfer (p-value <0, 05). There were no other statistical significant differences between the two groups in the clinical and laboratory characteristics studied.

Table 1. Demographic and clinical characteristics of 49 recruited women (12 PCOS and 37 non PCOS). Quantitative variables: mean value± standard deviation, comparison with t-test for independent samples. Quantitative variables: number of patients, percentage within parenthesis, comparison with χ2 test. NS: statistically non significant, significance level 0.05.

Characteristics

PCOS women

Non-PCOS women

p- value

Age

34,0 ± 4,2

36,3 ± 5,5

NS

ΒΜΙ

22,8 ± 5,3

25,9 ± 4,7

NS

Day 3 FSH (mIU/ml)

6,8 ± 2,1

8,9 ± 3,6

NS

Day 3 LH (mIU/ml)

5,4± 2,1

5,27 ± 1,91

NS

Smoking (cigarettes/day)

5,0± 7,6

7,2 ± 8,8

NS

Alcohol (glasses/week)

0,41 ± 1,44

0,55 ± 1,96

NS

Total Gonadotrophin administrated for COS (IU’s)

2636 ± 2048

3600 ± 1191

NS

E2 during COS

3875 ± 2826

2200 ± 2197

0,04

Number of follicles

9,8 ± 2,8

7,4 ± 3,7

0,04

Serum AMH (ng/ml)

13,8 ± 22,7

4,6 ± 4,7

NS

Follicular fluid AMH (ng/ml)

3,1 ± 4,0

2,3 ± 2,1

NS

Follicular fluid sRAGE (pg/ml)

6237 ± 2784

4058 ± 1907

<0,01

Number of oocytes

12,0 ± 5,9

5,2 ± 3,7

<0,01

Number of MII oocytes

8,7 ± 5,2

3,5 ± 3,2

<0,01

Number of MII oocytes/ number of oocytes

0,76 ± 0,22

0,62 ± 0,32

NS

Number of embryos suitable for embryo transfer

6,1 ± 3,7

2,5 ± 2,3

<0,01

Infertility Factor


PCOS

6 (50%)


Tubal


8 (21, 6%)


Male


9 (24, 3%)


Premature ovarian insufficiency


3 (8, 1%)


Unknown


7 (18, 9%)


Other (Age, uterine abnormality, endometriosis)


3 (8, 1%)


Combined(more than one factor)

6 (50%)

7 (18, 9%)


Pituitary Suppression


NS

GnRH agonist

4 (33, 3%)

12 (32, 4%)


GnRH antagonist

4 (33, 3%)

19 (51, 4%)


Cumulus-oocyte complex quality


NS

Normal

9 (75%)

25 (67, 6%)


IMMCC, PMCC, POCC

3 (25%)

12 (32, 4%)


Fertilization method


NS

IVF

4 (33, 3%)

6 (16, 2%)


ICSI

7 (58, 3%)

26 (70, 3%)


IVF- ICSI

1 (8, 3%)

3 (8, 1%)


PREGNANCY


NS

βhCG (+)

3 (25%)

4 (10, 8%)


Other IVF outcome

9 (75%)

33 (89, 2%)


Total

12 (100%)

37 (100%)


Following, we made the below analysis and the graphic with the data of serum AMH, FF AMH and FF sRAGEs.

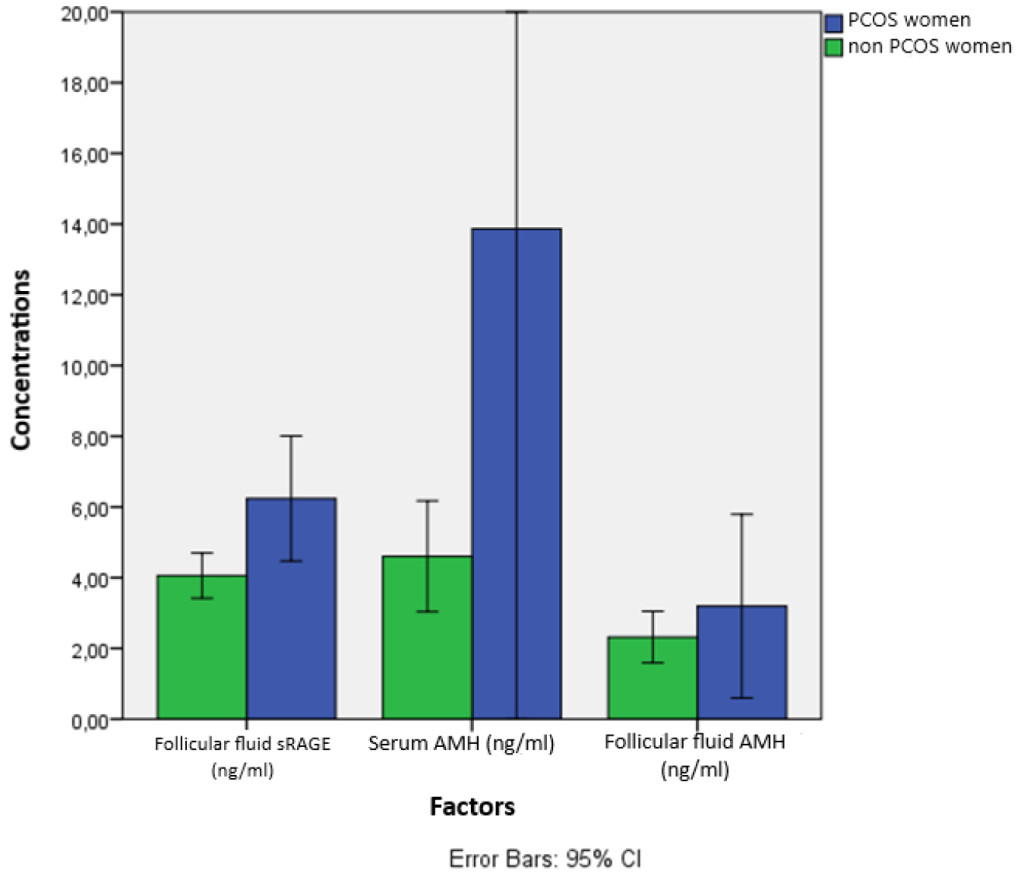
Serum AMH, FF AMH and FF sRAGEs levels of PCOS and non PCOS women are presented in Table 2 and in Figure 1. PCOS women were found to have higher FF sRAGE levels compared to non PCOS women (p-value <0, 01). On the contrary, the differences in serum and FF AMH levels were not found to be statistically significant between the two groups. Moreover, the deviation of the values (standard deviation) of the three factors studied is larger in PCOS women. This could be attributed to the small sample size (12 women) or could reflect the real heterogeneity of PCOS women, indeed.

Table 2. Serum AMH, FF AMH and FF sRAGE studied in 12 PCOS and in 27 non PCOS women. Mean values ± standard deviations are presented, comparison with t-test for independent samples. NS: statically non significant with significance value 0.05.

Factor

 PCOS women

non PCOS women

p- value

Serum AMH (ng/ml)

13,8 ± 22,7

4,6 ± 4,7

NS

Follicular Fluid AMH (ng/ml)

3,1 ± 4,0

2,3 ± 2,1

NS

Follicular Fluid sRAGE (ng/ml)

6,2 ± 2,7

4,0 ± 1,9

<0,01

IGOJ 2018-108-Bachur Manav Greece_F1

Figure 1. AMH and sRAGEs concentrations studies in serum and FF of 12 PCOS and 37 non PCOS. Mean values with 95% confidential intervals are presented.

This data is presented in the graph below (Figure 1).

Additionally, a multifactor analysis, regarding the three variables was made. The results were as following:

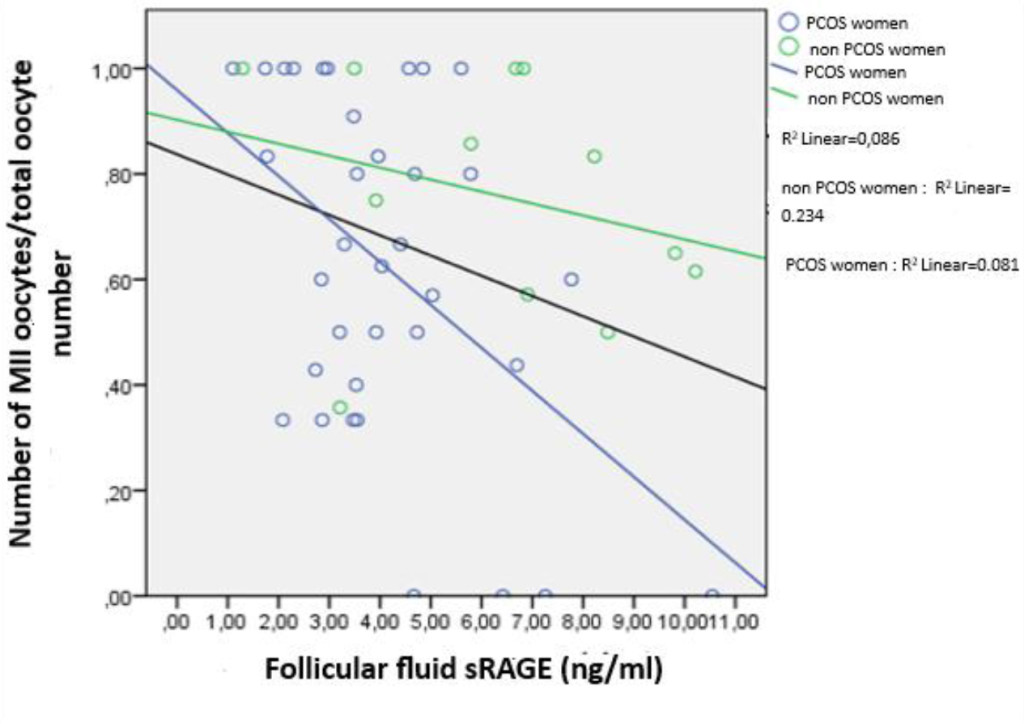
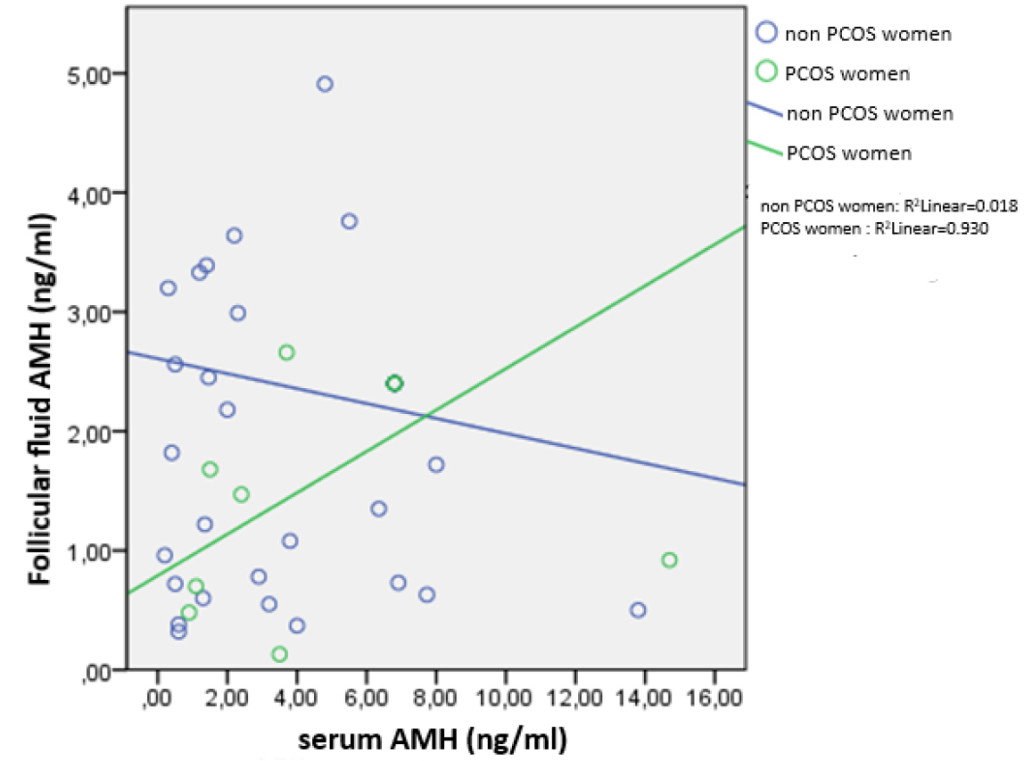
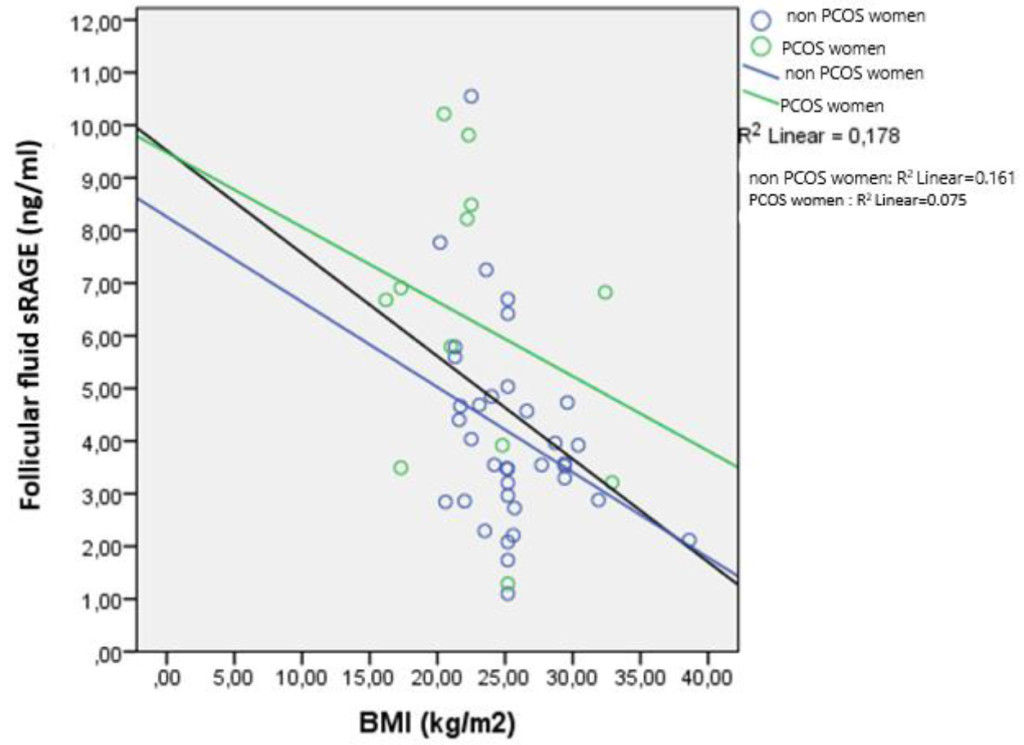
The most significant results of the monofactor analysis are presented summarized in Table 3. In PCOS women serum AMH, ff AMH and FF sRAGE levels were not found to be correlated with the number of the oocytes retrieved, the number of MII oocytes, with the embryo number or the ratio of MII oocytes to the total number of the oocytes retrieved. Serum AMH but not ff AMH was found to be a better marker of ovarian response in non PCOS women because it was found to be correlated with the number of MII oocytes and the number of the embryos available for embryo transfer. Only in non PCOS women, ff sRAGE levels were found to be negatively correlated with the quality of the oocytes, as it is expressed in the above mentioned ratio (r= -0.484, p-value= 0.003). This correlation is the most important finding of our study and is presented as a graph in Figure 2. Specifically, elevated ff sRAGE concentrations have been found to lead to lower Oocyte quality in non PCOS women. In PCOS women a high degree linear correlation of serum AMH and ff AMH, something that is not seen in non PCOS women, is noted (r= 0,965, p-value <0.001) (Figure 3). Neither serum AMH, nor ff AMH was found to be correlated with ff sRAGE levels in the sample studied. Lastly, ff sRAGE was found to have a negative correlation with BMI in non PCOS women (r= -0.401, p-value=0.014, Figure 4).
IGOJ 2018-108-Bachur Manav Greece_F2

Figure 2. Graph of the correlation of number of MII oocytes/total Oocyte number with the concentration of ff sRAGE in 12 PCOS and 37 non PCOS women. Statistical significant correlation was noted only in non PCOS women (Pearson r = -0.484, p-value = 0.003).
IGOJ 2018-108-Bachur Manav Greece_F3

Figure 3. Graph of the correlation of serum AMH with ff AMH in 12 PCOS and in 37 non PCOS women. Statistical significant correlation only in PCOS women (Pearson r=0.965, p-value <0.001).
IGOJ 2018-108-Bachur Manav Greece_F4

Figure 4. Graph of the correlation of ff sRAGE with the BMI of 12 PCOS and 37 non PCOS women. Statistically significant correlation is noted only in non PCOS women (Pearson r = -0.484, p-value = 0.003).

Table 3. Results of correlation of serum AMH and FF AMH with oxidative stress factors (ff SRAGEs) and with other clinical and laboratory factors in 12 PCOS and in 37 non PCOS women. Mono factor linear correlation based on Pearson’s r. NS: statistically non significant with significance levels 0.05%.

Factor correlation

PCOS women    

Non PCOS women


Pearson r

p- value

Pearson r

p- value

Number of oocytes , serum AMH


NS

0,287

NS (0,08)

Number of oocytes, FF AMH


NS


NS

Number of oocytes , FF sRAGE


NS


NS

Number of MII oocytes, serum AMH


NS

0,413

0,011

Number of MII oocytes, FF AMH


NS


NS

Number of MII oocytes, FF sRAGE


NS


NS

Number of MII oocytes/ Number of oocytes, serum AMH


NS


NS

Number of MII oocytes/ Number of oocytes, FF AMH


NS


NS

Number of MII oocytes/ Number of oocytes, FF sRAGE


NS

-0,484

0,003

Number of embryos, serum AMH πλάσματος


NS

0,362

0,028

Number of embryos, FF AMH


NS


NS

Number of embryos, FF sRAGE


NS


NS

Serum AMH, FF AMH

0,965

<0,001


NS

Serum AMH, FF sRAGE


NS


NS

FF AMH, FF sRAGE


NS


NS

Seum AMH, IU’s gonadotrophins


NS

-0,387

0,018

FF AMH, IU’s gonadotrophins


NS

-0,387

0,022

FF sRAGE, ΒΜΙ


NS

-0,401

0,014

Number of oocytes, age


NS

-0,474

0,003

Number of oocytes, FSH


NS

-0,340

0,039

Number of oocytes, IU’s gonadotrophins

-0,550

NS (0,06)

-0,445

0,006

Number of oocytes, E2

0,577

0,049

0,293

NS (0,07)

Number of oocytes, number of follicles

0,610

0,035

0,545

   <0,001

Number of MII ωαρίων, number of oocytes

0,812

0,001

0,874

<0,001

Number of MII ωαρίων/number of oocytes, FSH


NS

-0,336

0,049

Number of embryos, FSH


NS

-0,385

0,018

Number of embryos, ΒΜΙ

0,780

0,003


NS

Number of embryos, IU’s gonadotrophins

-0,579

0,049

-0,319

0,050

Number of embryos, number of oocytes

0,720

0,008

0,777

   <0,001

Number of embryos,number of MII oocytes

0,758

0,004

0,917

<0,001

Number of embryos, Number of MII oocytes/ number of oocytes


NS

0,504

0,002

Number of follicles , age

-0,840

0,001

-0,448

0,005

IU’s gonadotrophins, age


NS

0,526

0,001

IU’s gonadotrophins, FSH


NS

0,361

0,028

Lastly, with multifactor linear regression in all women, taking into consideration the age, serum AMH and ff AMH levels,  we found that ff sRAGE levels is independently correlated only with the BMI (β= -136.1, p-value =0.036) and the presence of PCOS(β= 1563.9, p-value = 0,045).

Discussion

In our study we tried to determine whether FF sRAGEs are correlated to serum AMH or FF AMH levels and to evaluate the association of these markers with IVF outcome parameters, in PCOS women receiving IVF treatment.

AHM has been widely used as an ovarian reserve marker in prediction of IVF outcome [8]. Additionally, many researchers have found that the severity of PCOS is positively correlated with the number of small antral follicles and that AMH plays a significant role in the pathogenesis of anovulation in women with PCOS. However, in our study, AMH values between PCOS and non PCOS women were not found to be statistically significant. Additionally, we did not find a correlation between ff AMH and serum AMH. Regarding the predictive value of AMH in IVF outcome, serum AMH was found to be correlated with the number of the number of MII oocytes and the number of the embryos only in non PCOS women. We did not find a correlation of ff AMH with the number of the oocytes retrieved or the number of the embryos available for embryo transfer neither in PCOS, nor in non PCOS women.

As above mentioned, AGEs have been incriminated for age-related ovarian dysfunction due to the effect of oxidative stress mechanisms in the ovarian microenvironment that results in insufficient vascularization, hypoxia of the ovary and malnutrition of the granulosa cells [21]. It is known that folliculogenesis is an inflammatory procedure and when combined with COS during IVF cycles large amounts of cytokines are produced and secreted into the follicular fluid. This environment could cause a huge AGE production and effect negatively oocyte quality. Jinno et al, in a study of 157 women undergoing IVF treatment (71 PCOS women included) reported that elevated AGE levels play a significant role in ovarian dysfunction and are associated with poor IVF outcome [31]. While, AGEs have been found to have negative correlation with follicular growth and IVF outcome, in 2014 Merhi et al was the first to report that FF sRAGEs are positively correlated with ovarian reserve, as measured by FF AMH (r=0.5, P = 0.0085) and the number of the oocytes retrieved (r=0,57, P=0.02) but only in non-PCOS women [16]. Recently Li et al, who studied 124 women undergoing IVF treatment, divided into two age groups, found that ff sRAGE levels are positively correlated with folliculogenesis and IVF outcome only in women of advanced age [22].

In our study, we did not find a statistically significant correlation between ff sRAGE levels and the number of the oocytes retrieved or the number of the embryos available for embryo transfer after the IVF treatment in none of the groups studied. But we did found that ff sRAGE levels seem to have an effect on the quality of the oocytes retrieved. In fact, we found that increased ff sRAGE levels are negatively correlated with the quality of the oocytes retrieved, as defined by the ratio of MII oocytes to the total number of the oocytes retrieved but only in non PCOS women(r= -0.484, p-value= 0.003). Given that the number of the embryos available for embryo transfer is correlated with the number and the quality of the oocytes retrieved, it seems that ff sRAGEs play a role in the IVF outcome, at least in non PCOS women. On the contrary to this hypothesis, it has been shown by Malickova et al, that FF sRAGE concentrations in women undergoing IVF were significantly higher in those having a positive IVF outcome [31].

We also found that PCOS women have higher FF sRAGE levels when compared to non PCOS women (p-value <0,01)but no correlation of these high FF sRAGE values with IVF outcome parameters were noted in this group as above mentioned. On the contrary to our study, Wang et al found that FF sRAGEs are significantly decreased in PCOS females compared to control groups and associated with lower total gonadotrophin doses. However, they did also not found a correlation o FF sRAGEs with other IVF outcome parameters (number of oocytes retrieved, fertilization rate, number of high quality embryos) [28].

Lastly, we found a negative correlation of FF sRAGE levels with BMI(r= -0.401, p-value=0.014). No correlation with FF sRAGE and women’s age was noted.

Therefore combining the above mentioned information and taking into consideration the small sample size, we can conclude that there is no correlation between the AMH protein and the oxidative stress agents. However, each of these factors could be used separately for the improvement and the prediction of IVF outcome. AMH can be used as an ovarian reserve marker and as a predictive marker of ovarian response during ovarian stimulation. On the other hand, FF oxidative stress agents (sRAGEs) could consist of a great marker of the quality of the oocytes retrieved during IVF treatment and an indirect marker of IVF outcome. The combination of both could be used, therefore, in order to improve the IVF outcome.

References

  1. Stein I, Leventhal M (1935) Amenorrhea associated with bilateral polycystic ovaries. Am J Obstet Gynecol 29: 181–5
  2. Yildiz BO, Bozdag G, Yapici Z, Esinler I, et al. (2012) Prevalence, phenotype and cardiomatabolic risk of polycystic ovary syndrome under different diagnostic criteria. Hum. Reprod 27: 3067–73.
  3. Broekmans FJ, Kwee J, Hendriks DJ, Mol BW, Lambalk CB (2006) A systematic review of tests predicting ovarian reserve and IVF outcome. Hum Reprod Update 12: 685–718. [crossref] 
  4. Dewailly D, Andersen CY, Balen A, Broekmans F, Dilaver N, et al. (2014) The physiology and clinical utility of anti-Mullerian hormone in women. Hum Reprod Update 20: 370–385. [crossref] 
  5. Pellatt L, Rice S, Dilaver N, et al. (2011) Anti-Müllerian hormone reduces follicle sensitivity to follicle-stimulating hormone in human granulosa cells. Fertil Steril 96: 1246–12451.e,
  6. RiggsRM, DuranEH, BakerMW, KimbleTD, et al. (2008) Assessment of ovarian reserve with anti-Müllerian hormone: a comparison of the predictive value of anti-Müllerian hormone, follicle-stimulating hormone, inhibin B, and age. Am J Obstet Gynecol 199: 202.e1–8.
  7. Broer SL, van Disseldorp J, Broeze KA, et al. (2013) IMPORT study group. Added value of ovarian reserve testing on patient characteristics in the prediction of ovarian response and ongoing pregnancy: an individual patient data approach. Hum Reprod Update 19: 26–36,
  8. La Marca A, Sighinolfi G, Radi D, Argento C et al. (2010) Anti-Mullerian hormone (AMH) as a predictive marker in assisted reproductive technology (ART). Hum Reprod Update 16: 113–30.
  9. Nelson SM, Yates RW, Fleming R (2007) Serum anti-Müllerian hormone and FSH: prediction of live birth and extremes of response in stimulated cycles–implications for individualization of therapy. Hum Reprod 22: 2414–2421. [crossref]
  10. La Marca A, Orvieto R, Giulini S, Jasonni VM et al. (2004) Mullerian-inhibiting substance in women with polycystic ovary syndrome: relationship with hormonal and metabolic characteristics. Fertil Steril 82: 970–972.
  11. Laven JS, Mulders AG, Visser JA, Themmen AP et al. (2004) Anti-Mullerian hormone serum concentrations in normoovulatory and anovulatory women of reproductive age. J Clin Endocrinol Metab 89: 318–323
  12. Betteridge DJ (2000) What is oxidative stress? Metabolism 49: 3–8. [crossref]
  13.  Kirkwood TB (2008) Understanding ageing from an evolutionary perspective. J Intern Med 263: 117–127. [crossref]
  14. Ashok Agarwal, Sajal Gupta, Rakesh K. Sharma (2005) Role of oxidative stress in female reproduction, Reprod Biol Endocrinol 3: 28
  15. Stensen MH, Tanbo T, Storeng R, Fedorcsak P (2014) Advanced glycation end products and their receptor contribute to ovarian ageing. Hum Reprod 29: 125–134. [crossref] 
  16. Merhi Z, Irani M, Doswell AD, Ambroggio J. Follicular fluid soluble receptor for advanced glycation end-products (sRAGE): a potential indicator of ovarian reserve. J Clin Endocrinol Metab 99: E226–33.
  17. Inagi R (2011) Inhibitors of advanced glycation and endoplasmic reticulum stress. Methods Enzymol 491: 361–380. [crossref] 
  18. Piperi Ch, Adamopoulos Ch, Dalagiorgou E, Diamanti-Kandarakis E et al. (2012) Crosstalk between Advanced Glycation and Endoplasmic Reticulum Stress: Emerging Therapeutic Targeting for Metabolic Diseases. The Journal of Clinical Endocrinology & Metabolism 97: 2231–2242.
  19. Schmidt AM, Yan SD, Yan SF, Stern DM (2000) The biology of the receptor for advanced glycation end products and its ligands. Biochim Biophys Acta 1498: 99–111. [crossref] 
  20. Fujii EY, Nakayama M (2010) The measurements of RAGE, VEGF, and AGEs in the plasma and follicular fluid of reproductive women: the influence of aging. Fertil Steril 94: 694–700. [crossref] 
  21. Tatone C, Amicarelli F, Carbone MC, Monteleone P, Caserta D, et al. (2008) Cellular and molecular aspects of ovarian follicle ageing. Hum Reprod Update 14: 131–142. [crossref]
  22. Li YJ, Chen JH, Sun P, Li JJ1 et al. Intrafollicular soluble RAGE benefits embryo development and predicts clinical pregnancy in infertile patients of advanced maternal age undergoing in vitro fertilization. J Huazhong Univ Sci Technolog Med Sci. 2017 Apr;37(2): 243–247. doi: 10.1007/s11596–017–1722-z. Epub 2017 Apr 11.
  23. Pellatt L, Hanna L, Brincat M, Galea R, Brain H, et al. (2007) Granulosa cell production of anti-Müllerian hormone is increased in polycystic ovaries. J Clin Endocrinol Metab 92: 240–245. [crossref] 
  24. Pigny P, Jonard S, Robert Y, Dewailly D. Serum anti-Mullerian hormone as a surrogate for antral follicle count for definition of the polycystic ovary syndrome. J Clin Endocrinol Metab 91: 941–5.
  25. Pertynska-Marczewska M, Diamanti-Kandarakis E, Zhang J, Merhi Z (2015) Advanced glycation end products: a link between metabolic and endothelial dysfunction in polycystic ovary syndrome? Metab Clin Exp 64: 1564–73.
  26. Hu H, Jiang H, Ren H, Hu X, et al. (2015) AGEs and chronic subclinical inflammation in diabetes: disorders of immune system. Diabetes Metab Res Rev 31: 127–37.
  27. Merhi Z (2014) Advanced glycation end products and their relevance in female reproduction. Hum Reprod 29: 135–145. [crossref] 
  28. Wang B, Li J, Yang Q, Zhang F, et al. (2017) Decreased levels of sRAGE in follicular fluid from patients with PCOS. Reproduction 153: 285–292. [crossref] 
  29. Garg D, Grazi R, Lambert-Messerlian GM, Merhi Z (2017) Correlation between follicular fluid levels of sRAGE and vitamin D in women with PCOS. J Assist Reprod Genet.
  30. Diamanti-Kandarakis E, Piperi C, Livadas S, Kandaraki E, et al. (2013) Interference of AGE-RAGE Signaling with Steroidogenic Enzyme Action in Human Ovarian Cells. San Francisco, CA: Endocrine Society.
  31. Jinno M, Takeuchi M, Watanabe A, Teruya K et al. (2011) Advanced glycation end-products accumulation compromises embryonic development and achievement of pregnancy by assisted reproductive technology. Hum Reprod 26: 604–10.
  32. Malickova K, Jarosova R., Rezabek K, Fait T, et al. (2010) Concentrations of sRAGE in serum and follicular fluid in assisted reproductive cycles – a preliminary study. Clin Lab 56: 377–38
The durability of oral diabetic medications: Time to A1c baseline and a review of common oral medications used by the primary care provider

DOI: 10.31038/EDMJ.2018232

Abstract

Introduction Cost of generic medications has risen more in the past few years than any other time in history. While medical insurance covers much of these costs, health care professionals can better provide medications that have the longest duration of action when compared to placebo-treated controls. This will save health care costs and improve prescribing accuracy.

Methods Papers in PubMed were identified with keywords placebo. The study must be at least 2 years in length to evaluate the change in A1c over time. The primary endpoint was time to A1c neutrality (return of A1c to baseline at a maximum dose of single oral agent). A medication would be considered at neutrality if the 95% CI crossed baseline. Time to neutrality was averaged for each medication within the class and each summarized for class effect.

Results: Effective therapy for the DPP-4 and sulfonylurea classes of medications are 3–4 years as compared to a 5-year time to A1c neutrality for metformin usage. In comparison, the projected time to A1c neutrality was approximately 6–8 years for rosiglitazone and pioglitazone. While only a few studies have been published in the SGLT-2 class of medication, the time to A1c neutrality was also 6–8 years with Canagliflozin and full dosage of Empagliflozin.

Conclusion: Metformin appears to have a 5-year duration of effect before the A1c returns to baseline. The sulfonylureas and DPP-4 inhibitors class of medications have one of the shortest durability which ranges between 3.3 to 4.4 years. In contrast, the SGLT-2 class of medication and the TZD class of medications has a projected time to A1c neutrality from 6–8 years. Diabetic duration of therapy as compared to placebo should be listed with those medications tested so the provider can choose wisely.

Introduction

ADA and AACE suggest that metformin be the first line medication for type 2 diabetes mellitus with many choices for the second line agent (ADA 2018, AACE 2016). Primary care health care professionals would benefit from understanding the potential durability of the diabetic medications to help improve compliance and reduce cost. Historically, sulfonylureas have been added second to metformin, fortunately, over the last 15 years, many combination agents have been developed that include metformin as one of the combo medications. So, the decision to choose the best second agent should be based on the evidence of safety and durability provided.

Limited studies have evaluated the long-term durability of a single diabetic agent on A1c control. The ADOPT trial used monotherapy with Metformin, Glyburide or Rosiglitazone and evaluated A1c changes over a 5-year period. Since the potential risk of rosiglitazone causing CV disease in 2008, the FDA has regulated that all diabetic medications have a CV trial to demonstrate safety. Prior to this regulation by the FDA, the ADOPT trial was a landmark study to evaluate the durability of single diabetic agents [1]. Since the 2008 FDA requirement, all oral diabetic medications have been evaluated with a major endpoint being cardiovascular safety which requires large sample size and longer duration of therapy. Oral diabetic meds were evaluated in randomized, single agent, placebo-controlled clinical cardiovascular trials (with one exception being the TECOS trial) were used to also evaluate the durability of these oral medications based on baseline A1c nadir, return to baseline and compared to placebo treatment.

Methods

Based on the approach of the ADOPT [1] trial, where monotherapy was tried with three separate agents over an extended period of time (minimum 2 years), the study was designed to evaluate newer diabetic medications when given in placebo driven clinical trials for a minimum of 2 years. Trials with the several class of medications have recently been completed and the data summarized [2–9].

The ADOPT trial demonstrated what monotherapy with metformin, glyburide or rosiglitazone will reduce A1c levels over a 5-year period. Since DM-2 is considered a progressive disease with slow loss of the beta cell function, the waning effect of each medication was documented and projected time to A1c neutrality was documented over the 5-year study [1].

The purpose of the trial was to clarify the duration of action of the more commonly used classes of medications. Traditionally the choice of medications has been limited and now there are over 20 combination oral medications for use in the treatment of type 2 diabetes. If the provider appreciates the duration of action of these medications then more appropriate choices can be made which should reduce the cost of medications and improve overall diabetic control.

Results

Three of the five FDA approved DPP-4 medications have had CV safety tested in a double-blind and placebo-controlled design.

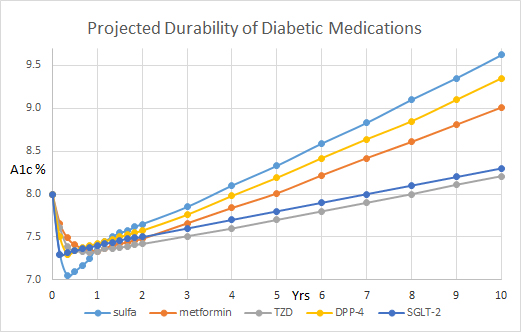
The first two agents’ saxagliptin (2) and alogliptin (8) were published on the same day (9/2/13) and they demonstrated a drop in A1c that was not significantly lower than baseline at the end of study. The Sitagliptin study showed a significant drop in A1c at 12 weeks but the difference from baseline was not significant after 34 weeks nor at the end of the 4-year study (Table 1 and Figure 1).

Table 1. Duration of A1c Effect over Time vs Placebo (Return to Baseline)

NAME

 Dose (mg) Total Daily

Baseline A1c (%)

Early (Nadir)

Mid level

End of Study

Time to A1c Neutrality

Alogliptin (EXAMINE)

30

8.0

-0.7/12w*

-0.36/3yrs*

3.3yrs

Sitagliptin (Green)

100

7.2

-0.3/4w (NS)

-0.2/34w (NS)

-0.1%/4yrs

4.0 yrs

Saxagliptin (Scirica)

 5

8.0

-0.5/104w

-0%/4yrs

4.0 yrs

Gliptins: (3–4 yrs)

Glipizide  (Feinglos)

2.5

8.0

-0.5/14w

3.0 yrs

Glyburide  (ADOPT)

20

7.3

-0.90/12w

3.7yrs

Sulfas: (3–4 yrs)

Metformin (ADOPT)

2500

7.3

-0.60/52w

5.0yrs

Metformin: (5 yrs)

Rosiglitazone (ADOPT)

4–8

7.3

-0.67/104w

8.0yrs

Pioglitazone (PROACTIVE)

45

7.8

-0.80/3yrs

6.0yrs

TZDs: (6–8 yrs)

Empagliflozin (EMPA)

10

    8.1

   -0.54/12w

-0.42/94w

-0.36/206w

5.0yrs

“

25

8.1

-0.60/12w

-0.47/94w

-0.42/206w

8.0yrs

Canaglifozin(CANVAS)

100/300

8.2

-0.70/26 w

-0.40/156w

-0.20/286w

7.0 yrs

SGLT-2: (5–7 yrs)

EDMJ 2018-105 - John A. Tayek USA_F1

Figure 1. Projected durability of diabetic medications.

The first of three DPP-4 clinical trials demonstrated that saxagliptin use for 2.1 years had no CV benefit and it reduced A1c from 8.0 to 7.7% which was 0.2% less than placebo [2]. Unfortunately, the SAVOR trial demonstrated that more saxagliptin-treated patients developed heart failure than placebo-treated patients (3.5% vs 2.8%; NNH = 143). This potential risk is listed with the FDA for health care professionals to evaluate and discuss with their patients [8]. Alogliptin treatment for 3 years dropped A1c from 8.0% to 7.67% which was 0.36% less than the placebo at the end of the 3 years but there was no cardiovascular benefit observed [3]. Sitagliptin was given for 3 years and it had no CV benefit and it reduced the A1c from 7.3% to 7.1% which was 0.29% less than the placebo at the end of the 3 years [4].

In comparison, monotherapy was provided with glyburide over 5 years and the results after 3 years demonstrated a significant drop in A1c from 7.3% to 7.1% (1). Low dose glipizide XL has 0.5% drop in A1c which nadirs, like glyburide at 12–14 weeks. Glipizide appears to have a shorter duration of action as it is projected to return to baseline at approximately 1 year. Likewise, metformin was given a monotherapy and the A1c dropped from 7.3% to 6.9% at 3 years. Rosiglitazone was also given and it dropped the A1c from 7.3% to 6.85% at 3 years [1]. The A1c returned to its baseline of 7.3% after 3.75 years of starting glyburide and after 5-years after starting metformin.

The TZD class of medications appears to provide for a longer duration of action. Interestingly, the A1c did not return to normal after 5 years of starting rosiglitazone as it remained significantly reduced at 7.1%. If you extend linear trend for A1c, it appears to take approximately 8 years for the A1c to return it to baseline of 7.3%. In the PROACTIVE trial, pioglitazone treatment for 3 years significantly reduced A1c from 7.8% to 7.0% at the end of 3 years [5]. The placebo-treated patients drop their A1c by 0.3% at the end of study which showed no difference from baseline.

Pioglitazone treatment in the PROACTIVE trial demonstrated a 0.8% drop in A1c at the end of the 3 years study with a predicted durability of 6.0 years [5]. In contrast, the Empagliflozin data demonstrated a 0.4% drop in A1c at the end of the 4-year study which projected to a 5-8 years durability of this therapy depend on the dose studied [6].

It would appear that the effective therapy for the DPP-4 class is approximately 3–4 years as compared to 5 years for the time for the A1c measurement to return the baseline level for metformin. The 5 year duration of action for metformin was confirmed in the Diabetes Prevention Trial where FBG was 106 mg/dl at baseline and returned to 106 mg/dl after 5 years [17]. In the placebo arm the FBG increased from 106 to 112 mg/dl over the 5-year period. In the 15 year follow up report the FBG increased to 117 mg/dl in the metformin arm, which is smaller then the projected change in A1c over time in Fig 1. In contrast, the projected time A1c baseline was approximately 6–8 years for rosiglitazone and pioglitazone. While only two large studies have been published in the SGLT-2 class of medication, it appears that the time to A1c neutrality was seen Canagliflozin was 7 years [7] and with Empagliflozin an estimated 5 years with a low dose and 8 years with high dose [6].

Discussion

The natural history of type 2 diabetes mellitus appears to be due to persistent loss of the beta-cell function over time. While there can be an increase in insulin resistance that can occur with aging or weight gain, the majority of the waning effect of diabetic medications are likely due to the natural loss of insulin secretion. Why this rate is different with different medication is unknown.

We know that fasting insulin levels are increased with glyburide treatment and remain neutral with both metformin and DPP-4 inhibitors. The mechanism of the DPP-4 inhibitors is to increase incretin levels (GLP-1 and GIP), which inhibits glucagon release, which in turn increases insulin secretion, decreases gastric emptying and decreases blood glucose levels. While metformin has a neutral effect, the administration of TZD medication and that of the SGLT-2 medication are associated with a significant reduction in the fasting insulin levels [10]. The reduction in the insulin levels is unlikely to play a major role in the durability because of the failure of Origins trial to delay the onset of DM-2, where basal insulin was administered for 5 years [11]. So, TZD and SGLT-2 class appear to have a direct drug effect on the beta cell and/or other pathways of insulin resistance. We know that liver fat, beta cell fat and selective muscle fat is reduced with TZD treatment [10]. Likewise, weight loss seen with the SGLT-2 inhibitors can be associated with similar changes in these tissues that could both reduce insulin resistance and increase insulin secretion.

Diabetes appears to be a progressive disease process with slow but consistent loss of control over 6 to 12 months of therapy in many patients. It is well known that the use of TZD reduces carotid intima thickness as compared to glimepiride [10], it reduces liver fat content by 54% [12] and improves insulin resistance and beta cell function [10]. Metformin prevents the production of glucose in both the liver and kidney which may reduce the insulin requirements associated with hormonal or metabolic factors that would otherwise rise insulin secretion.

This raises two interesting points: durability of each class of medications and potential mechanism of action of these medications. The best durability appears to be in the TZD and SGLT-2 classes which appears… to have a projected effect on A1c of greater than 6–8 years while metformin has limited benefit of approximately 5-years before the A1c returns to baseline [1]. The shortest durability is seen in the DPP-4 medications, which have 3–4 years projected time to A1c neutrality. Therefore, the time for A1c neutrality appears to be the shortest for the DPP-4 and sulfa classes of medications.

What to do about the waning effect of several classes of mediations: The current answer is unknown, but if the effective treatment benefit of a DPP-4 medication is approximately 3–4 years and metformin has 5 years, it seems clear that metformin has both durability and cost savings. The combinations agents with both metformin and DPP-4s may misleading health care professionals to its durability since metformin is likely doing the majority of the treatment effect. Interestingly, the use of rosiglitazone, the medication that caused the introduction of the FDA for Cardiovascular Outcome trials to confirm CV neutrality has been shown to have one of the two longest duration of benefit for A1c reduction over time.

Caution about the use of both Rosiglitazone and Pioglitazone exists in the medical literature. Rosiglitazone was put on restricted usage requiring REMS after Dr. Steve Nisson published his analysis of the increase CV risk that appears to be associated with rosiglitazone [15]. This REMS requirement for rosiglitazone was withdrawn by the FDA after publication of the RECORD trial where there was no CV risk associated with rosiglitazone [16]. This class of medications is contraindicated in CHF stage 3 or 4. They are known to cause intravascular fluid retention and also to cause lower extremity swelling which is likely due to pre-adipocyte differentiation into adipocytes. This class of medications lowers fasting insulin levels and also lower IGF-1 concentrations which likely explains the loss of bone mass over time. The TZD class of medications should be avoided in patients with significant osteoporosis.

In comparison to the downsides of using the TZD class of medication, there is growing evidence suggests that pioglitazone treatment has shown a 51% resolution of NASH and reduces fibrosis [13]. In addition, pioglitazone has been shown to help reduce recurrent CVA in diabetics [5] and pre-diabetics [14]. Similarly, the SGLT-2 medication Empagliflozin has been approved by the FDA to reduce CV risk and it has a projected long-term reduction in A1c levels. Based on the duration of action, potential CV risk reduction, this medication would be an excellent choice for diabetic patients at risk for CV events. Likewise, pioglitazone may be a wise choice for pre-diabetic or diabetic patients who have had a recent CVA event or have F3-F4 fibrosis or proven NASH. Additional CV outcome trials with newer diabetic medications will also provide the provider with duration of effect estimate which may help improve compliance and reduce health care costs.

In conclusion, the primary care provider should consider the durability of treatment in their treatment decision after starting metformin. The A1c durability of each agent should be included in treatment guidelines for ACP, ADA, AACE and European Diabetic Guidelines. In the time of abundant oral diabetic medications, effort should be used to educate health care professionals on the duration of action as well as potential non-diabetic risk and benefits of diabetic agents. More studies on the comprehensive effective long-term, placebo-controlled monotherapy treatment trials will allow the health care professionals can choose wisely for their patients.

In summary, the duration of A1c effect was 5 years for metformin and it appears to be a better choice over a sulfa and DPP-4 class of medications. A longer duration of action was seen with the SGLT-2 and TZD class of medications. These both have a long duration of action (6–8 yrs), and with their low cost may be considered in patients who would benefit from their use.

With the recent adoption by the ACP (American College of Physicians) that target A1c of < 8% is “at goal” for diabetic patients, then metformin should provide 5 years of acceptable diabetic control if stating at an A1c of 8%. Our data would suggest that mono-therapy with a SGLT-2 inhibitor or PPAR-gamma agonist (TZD) would keep someone at goal for approximately 7-8 years if the starting A1c was 8%. Using this stepwise triple therapy approach, it may be possible for a diabetic patient to maintain their A1c at goal for approximately 20 years.

Acknowledgement: The NIH Clinical Investigator Award KO8DK02083 and MO1-RR-00425 supported this grant

References

  1. Kahn SE, Haffner SM, Heise MA, Herman WH, Holman RR, et al. (2007) Glycemic durability of rosiglitazone, metformin, or glyburide monotherapy. N Engl J Med 355: 2427–2443. [crossref]
  2. Scirica BM, Bhatt DL, Braunwald E, Steg PG, Davidson J, et al. (2013) Saxagliptin and cardiovascular outcomes in patients with type 2 diabetes mellitus. N Engl J Med 369: 1317–1326. [crossref]
  3. White WB, Cannon CP, Heller SR, Nissen SE, Bergenstal RM, et al. (2013) Alogliptin after acute coronary syndrome in patients with type 2 diabetes. N Engl J Med 369: 1327–1335. [crossref]
  4. Green JB, Bethel MA, Armstrong PW, Buse JB, Engel SS, et al. (2015) Effect of Sitagliptin on Cardiovascular Outcomes in Type 2 Diabetes. N Engl J Med 373: 232–242. [crossref]
  5. Dormandy JA1, Charbonnel B, Eckland DJ, Erdmann E, Massi-Benedetti M, et al. (2005) PROactive Investigators. Secondary prevention of macrovascular events in patients with type 2 diabetes in the PROactive Study (PROspective pioglitAzone Clinical Trial In macroVascular Events): a randomized controlled trial. Lancet 366: 1279–1289. [crossref]
  6. Zinman B, Wanner C, Lachin JM, Fitchett D, Bluhmki E, et al. (2015) Empagliflozin, cardiovascular outcomes, and mortality in type 2 diabetes. N Engl J Med 373: 2117–2128. [crossref]
  7. Mahaffey KW, Neal B, Perkovic V, de Zeeuw D, Fulcher G, et al. (2017) Canagliflozin for primary and secondary prevention of cardiovascular events: Results from the CANVAS program. Circulation 137: 323–334.
  8. Kongwatcharapong J, Dilokthornsakul P, Nathisuwan S, Phrommintikul A, Chaiyakunapruk N (2016) Effect of dipeptidyl peptidase-4 inhibitors on heart failure: A meta-analysis of randomized clinical trials. Int J Cardiol 211: 88–95. [crossref]
  9. Feinglos M, Dailey G, Cefalu W, Osei K, Tayek J, et al. (2005) Effect of glycemic control of the addition of 2.5 mg glipizide GITS to metformin in patients with type 2 diabetes. DM Res Clin Prac 68: 167–182.
  10. Langerfeld MR, Forst T, Hohberg C, et al. (2005) Pioglitazone decreases carotid intima-media thickness independently of glycemic control in patients with type 2 diabetes mellitus: Results from a controlled randomized study. Circulation 17: 2525–2531. [crossref]
  11. Gerstein HC, Bosch J, Dagenais GR, Díaz R, Jung H, et al. (ORIGINS Investigators) (2012) Basal insulin and cardiovascular and other outcomes in dysglycemia. N Eng J Med 367: 319–328. [crossref]
  12. Belfort R, Harrison SA, Brown K, Darland C, Finch J, Hardies J (2006) A placebo-controlled trial of pioglitazone in subjects with nonalcoholic steatohepatitis. N Eng J Med 355: 2297–307. [crossref]
  13. Cusi K, Orsak B, Bril F, Lomonaco R, Hecht J, et al. (2016) Long-term pioglitazone treatment for patients with nonalcoholic steatohepatitis and prediabetes or type 2 diabetes mellitus: A randomized trial. Ann Intern Med 305–315. [crossref]
  14. Kernan WN, Viscoli CM, Furie KL, Young LH, Inzucchi SE, et al.  (2016) Pioglitazone after ischemic stroke or transient ischemic attack. N Engl J Med 374: 1321–1331. [crossref]
  15. Nissen SE, Wolski K (2007) Effect of rosiglitazone on the risk of myocardial infarction and death from cardiovascular causes. N Engl J Med 356: 2457–71. crossref]
  16. Mahaffery KW, Kafley G, Dickerson S, Burns S, Tourt-Uhlig S, et al. (2013) Results of reevaluation of cardiovascular outcomes in the RECORD trial. Am Heart J 166: 240–249. [crossref]
  17. Nathan DM et el (Diabetes Prevention Program Research Group), Long term effects of lifestyle intervention or metformin on diabetes development and microvascular complications over 15-year follow-up: the Diabetes Prevention Program Outcome Study. (2015) Lancet Diabetes Endocrinol 3: 866–875.

Liver Honeycomb Sign

DOI: 10.31038/CST.2018334

Case Report

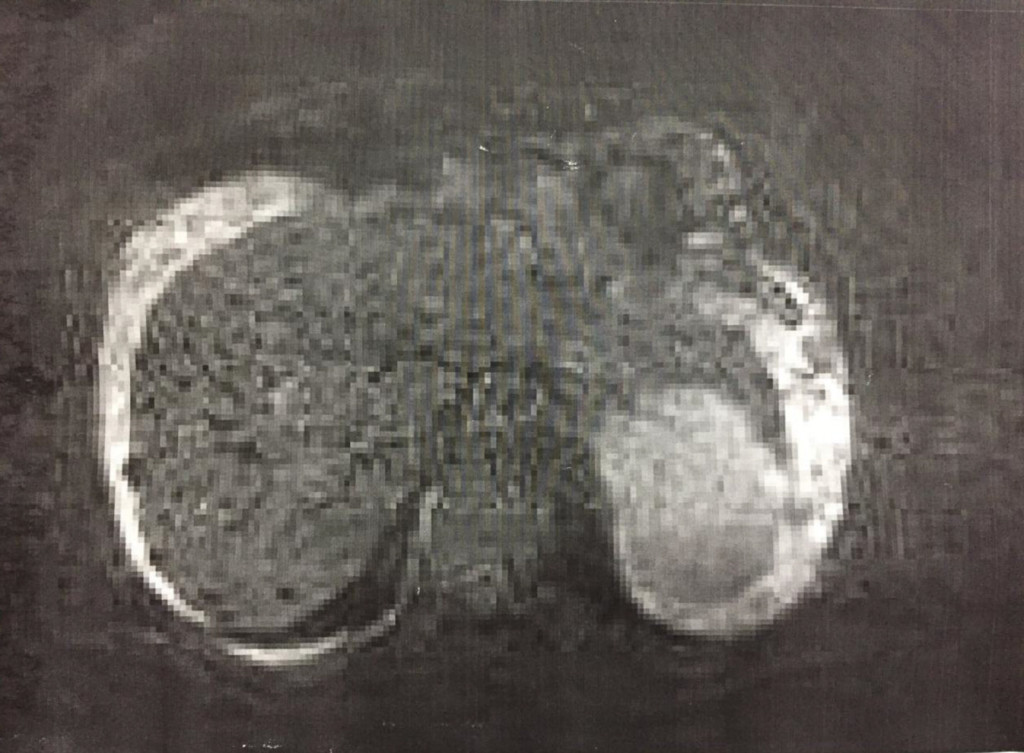
A 40-year-old man with a 20-years history of hepatitis B virus infection was diagnosed as post-hepatitis cirrhosis a month ago. He sought to take Chinese Herbs (CH), aiming to softening the cirrhotic nodules. Unexpectedly, he experienced fever and diarrhea for 1 week and abdominal pain for 2 days after taking CH of 7 days. Blood investigations revealed severe leucocytosis and raised liver enzymes and bilirubinemia, elevated Alpha Fetal Protein (AFP) and incredible severe coagulation disorders that coincided with the diagnosis of Disseminated Intravascular Coagulation (DIC). Computed tomography revealed some cirrhotic liver with partial enhancement. Magnetic Resonance Imaging (MRI) for the first time unveiled multiple low-signal vaculoses throughout the liver (honeycomb sign) in its diffused weighted imaging phase (Figure 1), which were potentially made up of necrotic nodules of varying sizes but less than 1 centimeter. Unlike melioid liver abscesses, his inflammatory was soon cured after antibiotic (Meropenem) using of 10 days. In this case, DIC was a confusing issue about its definitive cause that was thought to be associated with the advanced liver cirrhosis or nodules carcinomarization or drug-related liver injury or other blood malignancy. In any way, CH may play a key role in inducing these changes. Strangingly, DIC didn’t significantly improved following improved liver function and cured infection. Further evaluation of petron emission tomography / computed tomography confirmed hepatic nodules carcinoma transformation and extensive abdominal peritoneum metastasis, which also clarified the initial conundrum of DIC cause, fluctuating value of AFP and honeycomb sign. On 3-month following-up visit, he seemed to obtain benefit from CH performance of promoting hard nodules-resolving because AFP began to go better and clotting disorder also improved gradually.

Consent statement: The patient has given his written informed consent for his data to be submitted or published.

Conflicts of Interest: All authors declare that they have no conflicts of interest concerning on this manuscript.

Authors’ Contributions: Zhong Jia and Jia-Qing Huang were involved in compilation of the data and drafting of the article. Both authors read and approved the final manuscript.

CST 2018-114 - Jia Zhong China_F1

Figure 1. Magnetic Resonance Imaging (MRI)

Accreditation in hospitals: Should we implement the same standards in different types of hospitals? The case of a mental health hospital

DOI: 10.31038/ASMHS.2018232

Abstract

In the era of implementing quality standards as a mandatory process toward licensing, we raise the issue of implementing a generic standards for hospitals, or organizations, in general. Should we set different standards for different types of hospitals that implement to standards? This case study explores the specific issues that raise the dilemma. Regarding the fact that this hospital is the first mental health hospital in Israel to adopt the quality standards, it is crucial to understand the issue of adjusting the solutions for quality care.

Keywords

Accreditation, Quality service, Hospital types

Introduction

In the current era of globalization and the rapid changes that come with it, most governments are trying to improve management efficiency processes and performance [1, 2]. Since the 1980s, public reform has expanded around the world, in particular as a result of public pressure to improve services in exchange for the tax burden imposed on citizens [2, 3].

As we know, over the past several decades, Israel’s governments have adopted various reforms; the main one being privatized [4], which has led to competition in all areas of life, including healthcare services [5]. Healthcare organizations in Israel now face challenges such as reducing resources, narrowing the budget share, balancing the load in hospitals and improving quality of service. In light of this, the question of “how to provide quality care?” has been raised. In the next section, we will present the latest healthcare system reform in general and specifically in hospitals, in particular to Accreditation standards and the benefit to quality services [6].

Accreditation is a structured process of recognizing and promoting performance and adherence to standards either received from an authorized body or those that are newly developed, including updated existing standards. It is a system of organizational improvement centered on a certifying agency (or accrediting body) that assesses performance against pre-determined standards [7, 8].

Accreditation services in hospitals began around 1910 in the USA. The Association of American Surgeons has been promoting quality standards to increase safety and safety awareness in more than 16, 000 healthcare facilities in the USA. The organization has an international arm known as “Joint Commission International” (JCI), which currently operates in countries around the world and throughout Europe, South Africa, the Far East and Middle East [9].

Research shows that healthcare organizations benefit from increased quality service through the implementation of accreditation standards. The benefit of accreditation includes: patient safety and reduced clinical risk and others [10, 11], promotion of quality improvement activities, Implementation of processes that promote improvement, effective management [12], increased organizational learning [13, 14], improved organizational reputation [8, 15], improve organizational communication and cooperation between the staff and the community [10, 12, 13], and reduction in the cost of claims [16]. Studies shows that there is a correlation between clinical performances, safety and patient outcomes, and the implementation of accreditation [17].

At the national level, the agency responsible for carrying out quality improvement is the Ministry of Health’s Quality Assurance Department. They are tasked with overseeing quality assurance standards that meet national and accreditation-like system operations [6]. Due to the advantages of working in accordance with international standards for improving the quality and safety of care, the Health Ministry Director General decided at 2012 that hospital accreditation is a prerequisite for a licensing of all the general hospitals in Israel. For other hospitals (such as mental health hospitals) it is not mandatory. The JCI organization and their standards were selected by Israel’s Ministry of Health to be the competent authority for accreditation.

Case study

Accreditation standards exist for different types of health organizations such as hospitals, medical laboratories, home health care, nursing services, ambulatory services, medical transportation, etc. [18]. At the same time, we are not aware of specific standards for psychiatric hospitals. The Sha’ar Menashe Mental Health Center is the first psychiatric hospital in the world, to the best of our knowledge, to adopt the accreditation standard for all its departments.

The purpose of this article is to examine the decision of Sha’ar Menashe Hospital to fully implement the accreditation standard. It should be noted that the standard is adapted to general hospitals on the basis of their characteristics, which differ significantly from psychiatric hospitals. For example, in a general hospital, a patient is usually in need of treatment for a short period of time, several days to weeks. On the other hand, in a psychiatric hospital, a patient can stay in for treatment for a long period of time, which could last for months or even years. Treatment characteristics and the nature of patients are different and there is a long-standing acquaintance with patients in psychiatric hospitals [19].

The different characteristics of the types of organizations in addition to long-term acquaintance with the patient necessitate a different managerial approach [19]. In light of the above, we would like to examine whether the decision to adopt a standard intended for general hospitals in psychiatric hospitals is a correct decision and was it necessary to make adjustments before implementing the standard?

Regarding the attempt to implement the necessary standards of the JCI, Shaar Menashe mental health hospital’s managers have built a framework of standardization. The hospital had good work processes till that time, but the willing to adopt the new standards led to build the processes in the proper time constraints of the JCI. Most of the issues focused on schedule, oriented to the patient secure, such as: 5 day program for new patient, patient’ identification, mammography, patients’ discharge, summery of detailed disease within two weeks of discharge, ensuring continuity of treatment after release in the community for further treatment in the community.

After a process of more than a year in an attempt to meet the requirements of the accreditation standard at the Shaar Menashe Hospital and following the learning process, we have decided to present in this article as a case study the case of securing the patient through proper identification. In light of the general hospitals, clinical risks such as misidentification of patients that led to the wrong treatment, one of the major JCI standards is the proper patient identification clinical risk events. In order to reach the standard of this issue, the general hospital’s quality assurance solve the identification problem by adopting the process of attaching an identification handcuff on the patient’s hand. In an era in which we are required to use a variety of means to identify citizens (such as identification by means of a biometric ID), it is logical that this requirement will be a core requirement of an organization such as a hospital relative to its patients. It is known that in general hospitals, where there is a very high turnover rate of patients and attendants, and in order to prevent mistakes and unusual events (such as incorrect treatment of the patient), it is very important to attach an identification handcuff to the patient. On the other hand, in psychiatric hospitals where there are patients who stay for a long period of time and with minimum attendant’s turnover, the question arises whether there is a need to attach a handcuff or is there an alternative solution that can be used. It is important to note that examination of this requirement of the standard is not arbitrary. In fact, from the moment the decision was made at the Shaar Menashe Hospital, the therapists were forced to deal daily with patients who teared the handcuffs from their hands, wasting time on attaching a new handcuff to the patient’s hand and the economic costs incurred by the hospital in light of the widespread phenomenon. Every day, therapists face the challenge of spending precious time in preparing a patient plan, departmental activities for the patient, and more. Nevertheless, this financial expenditure to the hospital was available and it was possible to invest these resources, in infrastructure or in any means to improve the conditions of hospitalization and the level of treatment that patients receive. It seems that the same demands for organizations with different characteristics, even though they are in the same field, are an issue that needs to be considered. In other words, it is necessary to examine whether it was correct to create adjustments based on the characteristics of the organization.

Conclusions and Recommendations

A mental health hospital has to deal with unique issues which differ from the general hospital ones. For instance, one of the major issues of patients’ safety is seaside prevent. Yet, the need to meet the JCI standards under the health ministry regulations brought the quality assurance managers in the hospital to focus on those of the general hospital ones.

After examining this case and presenting the dilemma that arises from the requirement of the standard for attaching the patient’s handcuff identification, we bring the constant dilemma that arises when implementing generic standards – should the same standard be implemented in organizations with different characteristics? Organizational management standards are required for efficiency and organizational effectiveness, and mainly for managerial control. However, this issue should be examined in terms of organizational characteristics. In the present case, it could be more efficient, in our opinion, to examine the significance of the decision in light of the characteristics of the psychiatric hospital and to make adjustments. For example, we would recommend that the hospital, in the era of information technology, makes use of the digital medical record that each patient has and add the patient’s digital (or biometric) picture. Thus, at any time, the staff will be able to check the correlation between the patient in care and his record to which a picture was added. Even if we would assume that in most cases the staff is well acquainted with the patient, this implement provides a solution to situations in which there is no prior acquaintance. We can see that in many areas of our lives, we are required to meet the means of identification and today there are many technological means such as the biometric identification that could be adopted for this case. We must strive to introduce accreditation in managerial control, while adapting to the characteristics of unique organizations.

The health ministry encourages the hospitals to get the JCI accreditation (while in the general hospitals it is mandatory). Thus, it would be a benefit if the health ministry will present unique solutions for the mental health hospitals in a way that will help them to meet the JCI standards with solutions that meet their needs, while managing the resource utilization wisely, especially toward implementing the JCI standards in.

A quality care for the patients demands not only reaching the goal standards, but getting innovative solutions as well.

References

  1. Kettl DF (2005) The global public management revolution. 2nd (edn). Washington DC: The Brookings Institution, USA.
  2. Pollitt C, Bouckaert G (2004) Public management reform: a comparative analysis. Oxford: Oxford Press University, United Kingdom.
  3. Osborne D, Gaebler T (1992) Reinventing government. New York: Plume, USA.
  4. Galnoor I, Rosenbloom DH, Yaroni A (1998) Creating new public management reforms: lessons from Israel. Adm Soc 30: 393–420.
  5. Cohen N (2013) The self-provision of public healthcare services: a threat of democracy. J Politics Law 6: 128–133.
  6. Amit N, Livny N, Lev B (2006) The role of the ministry of health in quality promotion. In: Porat A, Rozen B (eds). Quality forum-quality promoting strategy. Jerusalem Smokler Center.
  7. Braithwaite J, Westbrook J, Johnston B, Clark S, Brandon M, et al. (2011) Strengthening organizational performance through accreditation research-a framework for twelve interrelated studies: the accredit project study protocol. BMC Res Notes 4: 390–398. [crossref]
  8. El-Jardali F, Jamal D, Dimassi H, Ammar W, Tchaghchaghian V (2008) The impact of hospital accreditation on quality of care: perception of Lebanese nurses. Int J Qual Health Care 20: 363–371. [crossref]
  9. Mahmoud-Salim F, Rahman MH (2017) The impact of joint commission international healthcare accreditation on infection control performance: a study in Dubai Hospital. Global Journal of Business & Social Review 5: 37–45.
  10. Simons R, Kasic S, Kirkpatric A, Vertesi L, Phang T, et al. (2002) Relative importance of designation and accreditation of trauma center during evolution of a regional trauma system. J Trauma 52: 827–834. [crossref]
  11. Griffith JR, Knutzen SR, Alexander JA (2002) Structural versus outcomes measures in hospitals: a comparison of Joint Commission and Medicare outcomes scores in hospitals. Qual Manag Health Care 10: 29–38. [crossref]
  12. Sutherland K, Leatherman,S (2006) Regulation and quality improvement: a review of the evidence. London: The Health Foundation, United Kingdom.
  13. Pomey MP, François P, Contandriopoulos AP, Tosh A, Bertrand D (2005) Paradoxes of French accreditation. Qual Saf Health Care 14: 51–55. [crossref]
  14. Touati N, Pomey MP (2009) Accreditation at a crossroads: are we on the right track? Health Policy 90: 156–165. [crossref]
  15. Bird SM, Cox D, Farewell VT, Goldstein H, Holt T, Smith P (2005) Performance indicators: good, bad and ugly. J R Stat Soc Ser A Stat Soc 168: 1–27.
  16. Lewis S (2009) Accreditation in health care and education: The promise, the performance, and lessons learned. Dubai: Access Consulting Ltd, UAE.
  17. Thornlow DK, Merwin E (2009) Managing to improve quality: The relationship between accreditation standards, safety practices, and patient outcomes. Health Care Manage Rev 34: 262–272. [crossref]
  18. Jovanovic B (2005) Hospital accreditation as method for assessing quality in healthcare. Arch Oncol 13: 156–157.
  19. Jones K, Sidebotham R (2013) Mental hospital at work. London: Routledge, United Kingdom.

Utility of Optical Density of Picrosirius Red Birefringence for Analysis of Cross-Linked Collagen in Remodeling of the Peripartum Cervix for Parturition

DOI: 10.31038/IGOJ.2018121

Abstract

We report on development of a rapid, quantitative analysis technique of collagen fibers in cross-linked structures to assess remodeling of the cervix during the transition from soft to ripening in preparation for birth. Optical density analysis of picrosirius red stain tissue using circular polarized birefringence light from fixed paraffin-embedded or frozen cervix from pregnant mice during phases of remodeling prior to birth. Data were analyzed using NIH Image J and extended recently to include studies of prepartum cervix in peripartum women. Our results, developed a rapid, consistent, technique to quantify cervical organization. This approach assesses the structure of collagen organization (the principle component of the cervix) and is essential for analysis of experimental outcomes that disrupt cervical morphology in rodent models of preterm birth. The technique, in this report has, for the first time permitted rapid, accurate assessment of the stages that define cervical ripening with large numbers of slides from individual animals. The approach integrates analysis of collagen organization, with distensability and inflammation, processes associated with cervical change before birth. This analysis further holds promise to evaluate other tissues, but also fibrolytic and fibrogenic changes in collagen associated with physiological or pathophysiological conditions.

Key words

pregnancy, remodeling, ripening, inflammation

Introduction

Identification of large protein using various stains have been used as early as the 17th century to label extracellular, cellular, and sub-cellular organ structures in tissue [1]. More recently, improved fixation and specificity of stains has allowed quantification of small cellular components and their structural organization. Collagens are the most abundant proteins in humans with type 1 the majority (98%) of the 28 identified types [2, 3], and common in all vertebrate species. The human cervix, composed predominately of collagen fibers, serves as a barrier to the vaginal biome and protects the developing contents of the uterus during pregnancy [4]. Junqueira’s group was the first to use picrosirius red stain to identify a reduction in collagen in cervix from intrapartum compared to nonpregnant women. Picrosirius red stains the principal forms of collagen in the cervix, mostly type 1, though type 3 is present to a lesser extent [5]. As Lattouf more recently concluded, picrosirius red stain is “simple, sensitive and specific for collagen staining….particularly useful to reveal the molecular order, organization and/or heterogeneity of collagen fiber orientation in different connective tissues” [6].

Evidence supporting this conclusion led our lab, well over a decade ago, to develop a protocol that uses birefringence of circular polarized light from picrosirius red stained cervix sections to study the progression of remodeling during the progression from phases of softening to ripening [7–11]. In multiple strains of mice and rats, and more recently in women at term and preterm delivery, this technique is reliable, consistent and essential to assess degradation of collagen organization during late term normal pregnancy or experimental manipulations.

Given the utility of picrosirius red stain with birefringence, physiological remodeling and inflammation-induced premature ripening of the cervix, the goal of this report was to document the current state of our method, which is likely to have broad value to accurately study collagen of other tissues and assess pathological or healing of fibrotic processes.

Methods

Cervix from pregnant mice were processed by immersion fixation in 4% paraformaldehyde, paraffin embedded, sectioned at 10 µm, heated at 60o C for 45 minutes using a slide warmer, then subjected to xylene incubations to remove paraffin, and rehydrated through a graded series of ethanol. Sections were counterstained with hematoxylin to identify cell nuclei (for cell counting), and washed in distilled water to remove background stain. These tissue processing procedures have been previously detailed [7]. Collagen in cervix sections was stained using a picrosirius red kit (Polysciences Kit #24901-500, Warrington, PA, USA). Following instructions, slides were first placed into Solution-A (a phosphomolybdic acid hydrate solution from the kit) for two minutes and then into Solution-B (Picrosirius Red-F3BA) for 60 minutes. Variations in incubation times of ±20 min were not found to improve staining. Slides were placed into Solution-C (0.01 N HCL) for 2 minutes, dehydrated through an ascending series of ethanol, and placed in xylene before coverslipped with Permount (Fisher Scientific, #SP15-100).

For analysis of collagen structural organization during phases of cervix remodeling, a Zeiss Axio Imager A1 microscope with circular polarized light filters was used to evaluate sections at 250x. In early development of this technique an additional microscope (Nikon Optiphot, with Plan apochromat objectives and Nomarski optics) was similarly validated for this method. In both cases, a Spot Pursuit 4MP digital camera was used for micrographs (Diagnostic Instruments, Sterling Heights, MI). In dim room illumination, initial regions of interest were visually identified. A representative sample of 4–6 grey scale photomicrographs were taken from 2 sections/mouse (8–12 total). A similar process was used for human tissue. Care was taken to avoid distorted morphology, including blood vessels, epithelial lumen, and section artifacts, i.e. tissue folds or tears. To ensure consistency in analysis across sections, as well as individuals and groups, microscope properties (field aperture, condenser, light intensity) were optimized and unchanged across viewing each study session. Cells counts were verified using two to three independent observers.

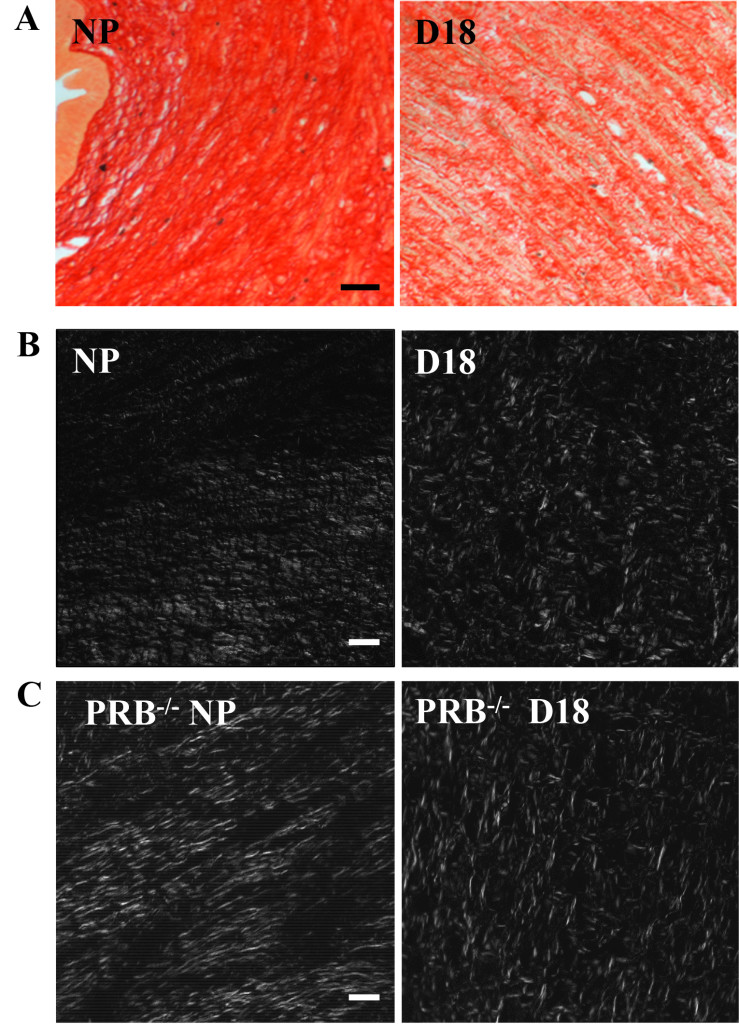
For image analyses, grey scale photomicrographs were filed into a date-labeled folder and batch processed to evaluate optical density using Image J software (NIH, Bethesda, MD; macro plug-in attached in Appendix). At the outset, a global calibration macro was set with the first photomicrograph. The macro first digitized the photomicrograph into an 8-bit grayscale image (Figure. 1B). The program automatically and without bias centered a 9-square box cross region for analysis. An average optical density (OD) was calculated with Rodbard transformation (performed by the program) for each of the 9 boxed regions together with total OD then exported as an output file to a Excel worksheet for statistical analyses. Data were analyzed by ANOVA (p<0.05 level of significance) with Tukey’s post-hoc analysis following Levene’s test (GraphPad Prism Software, Inc., La Jolla, CA).

Results and Conclusions

In the cervix from a nonpregnant mouse, collagen fibers were observed as a dense, uniform fascicle, stained by picrosirius red collagen fibers (Figure. 1A). The birefringence values further quantified this initial impression with values indicative of aligned and organized cross-linked fibers and bundles/fascicles (i.e., low light transmission values) characteristic of an unremodeled cervix. In contrast, by day18 postbreeding (gestation term is 19 days, (Figure 1B), birefringence values were significantly altered, correlating with the presence of numerous gaps and disorganized, nonparallel collagen fibers. This morphology is characteristic of cervical ripening and consistent with early electron microscope studies [12, 13], as well as, consistent with ripening processes of hypertrophy, edema, and increased distensability of the cervix near term. Digitizing this image in grayscale combined with Rodbard transformation (performed by Image J), increased the sensitivity to discriminate the decline in picrosirius red-stained cross-linked collagen was enhanced (Figure 1C).

The utility of picrosirius red stain to understand structural remodeling of the cervix prior to parturition is illustrated by studies of two genetically modified (knockout, KO) mouse models (Figure 2). In mice lacking the progesterone receptor B isoform, picrosirius red stain identified reduced extracellular cross-linked collagen in a temporal pattern that was similar as ripening found in wild type controls before term [14]. Moreover, in a second modified strain of mice lacking the prostaglandin F2 α receptor, pregnancy progressed while collagen structure was reduced similar to wild-type pregnant controls, however, neither labor nor term birth occurred in these animals [11]. The softening and ripening phases of cervix remodelling occurred in similar phases for both knockout models. Moreover, the use of our picrosirius red protocol critically distinguished, for the first time, the phases of cervical ripening from labor to birth in genetic modified animals in which progesterone mechanisms, thought to be essential for normal delivery, were deleted. In both models, the ability to assess cervical phases and collagen organization in processes thought as essential for normal inflammatory processes for parturition, were rapidly, quantitatively, easily, and determined.

These findings demonstrate the value of a rapid and replicable technique in which assessment of picrosirius red birefringence light can benefit analysis of critical biological questions about cross-linked collagen organization in tissue undergoing physiological change. Although used in the cervix, this technique has potential applications in other tissues or pathologies where fiber organization is disrupted. For example, this analysis may be useful to track the progression of fibrotic diseases of lung, kidney, or liver, as well as, to quantify therapeutic interventions of relevance for diverse pathologies including atherosclerosis, tumor growth, and metastatic processes, e.g. cardiovascular, scleroderma [7, 15]. Additionally, the use of transmitted light to determine collagen organization has been usefully employed in a variety of tissues, including human optic nerve [16], biological cells [17], and human skin [18].

Beyond tissue histology or biology, industrial applications would similarly benefit from a rapid assessment of other fibrous structures such as fabrics including Kevlar [19, 20], colloidal organization in liquid suspensions where knowledge of density, quantitative measurement, or dispersion properties are required.

Although useful in many biological situations, limitations of the use of picrosirius red stain to quantify collagen include its use in aqueous permeable fixed material and relatively thick (~10um) sections [20, 21]. Additionally, oral mucous and oral cavity fibrosis [22, 23], luminal crypts [21], or understandably, nonhomogeneous tissues with differing sub-layers encountered within the same region are problematic for analysis with this technique.

Microsoft PowerPoint - _Kirby et al PSRms Figures.pptx

Figure 1A. Illustrative photomicrographs of Picrosirius Red stained, 10µm thick paraffin sections from the cervix of a non-pregnant (NP) and a day18 (d18) pregnant mouse cervix. Term gestation is 19–20 days. Note the ability to visualize individual collagen fibers and fascicles in both sections at this relatively low magnification (250X, using a 20 power objective). The NP section is substantially darker reflecting the denser collagen fiber organization and corresponding reduced light transmission of cross-polarized light through the tissue. In contrast, at d18, as term gestation approaches, the collagen fiber organization is less dense and less organized. Individual fascicles have increased spacing, allowing greater light transmission through the tissue. Within Individual fascicles there is less organization and numerous irregularities as denoted by the overall lighter appearance (increased transmitted light and increased disorganization of individual fibers. Scale bar=50µm.

Figure 1 B and C. Photomicrographs of from nonpregnant (NP) and late term (d18) cervix from wild-type (WT) and progesterone receptor B knockout mice (PRBko). White areas illustrate birefringent illumination and more easily depicts differences in collagen organization. Fibers from non-pregnant animals have more linear structure, in contrast to late term D18 fibers which are dispersed and lack defined structure. Scale bar is 50µm for the two color images and 50µm for all grey scale images and is the same for all grey scale images.

IGOJ 2018-107 - Mike Kirby USA-F2

Figure 2. Histograms obtained from photomicrographs of Figure 1 A and B. Cervix optical density histograms (mean±SEM) from pregnant Prostaglandin Receptor 2 knockout (Ptgfr-/-) and PRB -/-) mice following picrosirius red processing (see methods). Optical density values denote an inverse relationship to collagen structure and organization. The more structured a tissue, the lower optical density values for that tissue. All statistical comparisons were performed using analysis of variance (ANOVA) with Tukey’s post-hoc analysis. “a” equals comparison to non-pregnant, “b” denotes comparison to D15. [11, 14]

In summary, the technique we have developed combining picrosirius red stain and birefringence analysis using circular cross polarized light has evolved over several years into an easy, rapid and essential technique, for our continued analysis in experimental manipulations of the rodent, human, and potentially other non-human primate cervical tissue. This technique is essential for rapid, accurate analysis of several hundred sections we commonly employ for each cervix. Our experimental manipulations are pivotal for understanding cervical processes promoting normal term delivery in rodent experimental models with our ultimate goal to understand the central and sometimes subtle process in humans.

Acknowledgements

This work was supported, in part, by NIH grant # R01-HD054931 (SY), and grateful support from the Department of Pediatrics, School of Medicine, Loma Linda University, and the John Mace Pediatric Research fund (MAK). All animal work was performed in accordance with an approved animal care protocol of the Loma Linda University Animal Care and Use Committee (IACUC), #89002.

Competing Interests: All authors declare and affirm the lack of competing interests, finical or otherwise, in this manuscript.

Abbreviations

ANOVA – analysis of variance

CA – State of California

DIH2O – double distilled water

DXX – estimated day post-conception

Inc. – incorporated business

MI – State of Michigan

NP – nonpregnant

OD – optical density

PP – postpartum, day of delivery animal

PRB ko – Progesterone receptor, gene deleted animal

Ptgfr ko – prostaglandin-F2-genetic gene-deleted animal

ROI – region of interest

WT – wild type

250X – total optical magnification as viewed through microscope objective

References

  1. Bracegirdle B (1977) The History of Histology: A Brief Survey of Sources. History of Science 15: 77–101.
  2. Mescher AL, Junqueira LCU (2016) Junqueira’s basic histology: Text and atlas (Fourteenth edition.). New York: McGraw-Hill Education.
  3. Sabiston DC, Townsend CM (2012) Sabiston Textbook of Surgery: The Biological Basis of Modern Surgical Practice. Elsevier Saunders.
  4. Junqueira LC, Zugaib M, Montes GS, Toledo OM, Krisztan RM, Shigihara KM (1980) Morphologic and histochemical evidence for the occurrence of collagenolysis and for the role of neutrophilic polymorphonuclear leukocytes during cervical dilation. Am J Obstet Gynecol. 138: 273–81.
  5. Uldbjerg N, Ekman G, Malmstrom A, Olsson K, Ulmsten U (1983) Ripening of the human uterine cervix related to changes in collagen, glycosaminoglycans, and collagenolytic activity. Am J Obstet Gynecol 147: 662–6.
  6. Lattouf R, Younes R, Lutomski D, Naaman N, Godeau G, et al. (2014) Picrosirius red staining: a useful tool to appraise collagen networks in normal and pathological tissues. J Histochem Cytochem 62: 751–758. [crossref]
  7. Kirby MA, Heuerman AC, Custer M, et al. (2016) Progesterone Receptor-Mediated Actions Regulate Remodeling of the Cervix in Preparation for Preterm Parturition. Reprod Sci 23: 1473–83.
  8. Dubicke A, Ekman-Ordeberg G, Mazurek P, Miller L, Yellon SM (2016) Density of Stromal Cells and Macrophages Associated With Collagen Remodeling in the Human Cervix in Preterm and Term Birth. Reprod Sci 23: 595–603.
  9. Dobyns AE, Goyal R, Carpenter LG, Freeman TC, Longo LD, et al. (2015) Macrophage gene expression associated with remodeling of the prepartum rat cervix: microarray and pathway analyses. PLoS One 10: e0119782. [crossref]
  10. Yellon SM, Burns AE, See JL, Lechuga TJ, Kirby MA (2009) Progesterone withdrawal promotes remodeling processes in the nonpregnant mouse cervix. Biol Reprod 81: 1–6.
  11. Yellon SM, Ebner CA, Sugimoto Y (2008) Parturition and recruitment of macrophages in cervix of mice lacking the prostaglandin F receptor. Biol Reprod 78: 438–444. [crossref]
  12. Feltovich H, Ji H, Janowski JW, Delance NC, Moran CC, Chien EK (2005) Effects of selective and nonselective PGE2 receptor agonists on cervical tensile strength and collagen organization and microstructure in the pregnant rat at term. Am J Obstet Gynecol 192: 753–60.
  13. Clark K, Ji H, Feltovich H, Janowski J, Carroll C, Chien EK (2006) Mifepristone-induced cervical ripening: structural, biomechanical, and molecular events. Am J Obstet Gynecol. 194: 1391–8.
  14. Yellon SM, Oshiro BT, Chhaya TY, Lechuga TJ, Dias RM, et al. (2011) Remodeling of the cervix and parturition in mice lacking the progesterone receptor B isoform. Biol Reprod 85: 498–502. [crossref]
  15. Kirby LS, Kirby MA, Warren JW, Tran LT, Yellon SM (2005) Increased innervation and ripening of the prepartum murine cervix. J Soc Gynecol Investig 12: 578–585. [crossref]
  16. Cense B, Chen TC, Park BH, Pierce MC, de Boer JF (2002) Invivo depth-resolved birefringence measurements of the human retinal nerve fiber layer by polarization-sensitive optical coherence tomography. Optics letters 27: 1610–2.
  17. Mourant JR, Freyer JP, Hielscher AH, Eick AA, Shen D, Johnson TM (1998) Mechanisms of light scattering from biological cells relevant to noninvasive optical-tissue diagnostics. Applied optics. 37: 3586–93.
  18. Pierce MC, Strasswimmer J, Park BH, Cense B, de Boer JF (2004) Advances in optical coherence tomography imaging for dermatology. The Journal of investigative dermatology 123: 458–63.
  19. Penn L, Larsen F (1979) Physicochemical properties of kevlar 49 fiber. Journal of Applied Polymer Science 23: 59–73.
  20. Rich L, Whittaker P (2005) Collagen and Picrosirius Red Staining: A Polarized Light Assessment of Fibrillar Hue and Spatial Distribution Braz. J Morphol Sci 22: 97–104.
  21. Nazac A, Bancelin S, Teig B, et al. (2015) Optimization of Picrosirius red staining protocol to determine collagen fiber orientations in vaginal and uterine cervical tissues by Mueller polarized microscopy. Microscopy research and technique 78: 723–30.
  22. Marcos-Garces V, Harvat M, Molina Aguilar P, Ferrandez Izquierdo A, Ruiz-Sauri A (2017) Comparative measurement of collagen bundle orientation by Fourier analysis and semiquantitative evaluation: reliability and agreement in Masson’s trichrome, Picrosirius red and confocal microscopy techniques. J Microsc 267: 130–42.
  23. Kamath VV, Satelur K, Komali Y (2013) Biochemical markers in oral submucous fibrosis: A review and update. Dent Res J (Isfahan) 10: 576–584. [crossref]

The Leg Length Discrepancies: Clinical and Radiographic Criteria for Evaluation

DOI: 10.31038/IJOT.2018111

Summary

The heterometry of the lower limbs in the developmental age can influence the development of the rachis, generating axial deviations or not good adaptations in walking; in adulthood it can have an important role in low back pain. In general, a heterometry must always be compensated in the evolutionary age, in order to align the rachis-pelvis-lower limb system for an optimal mechanical equilibrium of the subject. The clinical iter that leads to highlight and quantify the heterometry of the lower limbs is based on a careful observation of clinical and radiographic features; from the integration of all the references comes a reliable value for the purpose of mechanical compensation.

Keywords

lower limbs, heterometry, clinical examination

Introduction

In the global kinesiological assessment of a child is necessary a preliminary identification of a possible heterometry of the lower limbs (h.l.l.), considering the anatomical-functional relationship that exists between the rachis and the lower limbs for balance and correct joint function. The iliac bones are correlated in synergy with the lower limbs, the sacrum with the vertebral column [1]. In the developmental age the lower limbs are frequently with length differences often underestimated or more frequently misunderstood, with disharmonic reflexes on the growth or rehabilitative programming of the small patient. The h.l.l., can be idiopathic in the absence of diseases that cause anatomical districts and articular alterations or secondary to congenital or acquired joint pathologies of the hip (Epiphysiolysis, Dysplasias, Osteochondrosis, etc.), of the knee (asymmetric axial deviations) and of the foot (outcomes of diseases congenital, asymmetric pronator syndromes, etc.) [2].

The lack of or insufficient correction or often the overcorrection of the heterogeneous limb in the developmental age can exert an influence on the mechanical arrangement of the pelvis and of the rachis. There is often a discrepancy between specialists, about the presence and the extent of h.l.l. not carefully measured or based only on an inaccurate radiographic report. There is a clinical study, a semiological iter for the definition of h.l.l., supported by a radiographic study. A group of patients in developmental age has been evaluated by more specialists to identify h.l.l., and study the incidence of detection errors and their degree of significance (Figure 1).

IJOT2018-101-LuigiMolfettaItaly_F1

Figure 1. a: Iliac Crest Line; b: Sincondrosis Sacroiliac Line; c: Heads Femur Line; d: Little Trochanter Line

Material and Method

Clinical Analysis

Evaluation of the patient with an h.l.l., must be done during walking, in orthostasis and in clinostasis, looking for repeatable reperiences for all the evaluators. They must be correlated with the radiographic data. The patient’s walking allows detecting disharmony in the step or lameness; in general, a heterometry is manifested in the ambulation when it is equal to or greater than 1.0 cm, if it is of an inferior value it finds an intrinsic compensation and cannot be documented in the passage [3].

Clinical observation in walking in a posterior view better demonstrates this, since the posterior and Superior Iliac Spines (SIPS) can be seen. In orthostasis barefoot, on a podoscope, the following are to be considered:

  1. The level of Iliac Crests, assessed through the placement of the examiner’s hands on the same. This assessment may be imprecise, related to the experience of the examiner and disturbed by the presence of fat, the tickling of the patient, etc.
  2. The examination of the Postero-Superior Iliac Spine (SIPS), particularly evident in the thin subjects.
  3. The alignment of the gluteal folds and the poplite folds.
  4. Plantar support and asymmetric pronator syndromes, due to h.l.l.

In clinostasis after having mobilized the hips to eliminate contractures and bad functional adaptations and aligned the limbs slightly dividing, we proceeded to measure:

  1. The medial spino-malleolar distance, with limbs in full extension, from the antero-superior iliac spine up to the apex of the medial malleolus, in comparison with the contralateral limb.
  2. The medial navel-malleolar distance from the amelic to the apex of the medial malleolus.
  3. The unevenness of the knees flexed, at 90 °, with the feet juxtaposed and aligned on the back side of the heel; a repere on the knees records the difference in height of the rotule [3–7].

Radiographic Study

On the panoramic radiograph of the rachis in anterior-posterior projection the radiologist often reports the data of an heterometry, referring to the comparative level of the iliac crests projected on the radiographic grid. Considering the radiographic magnification (on average of 15%) and the symmetry of the pelvis in the radiography, the reading of an X-ray is based on the observation of the following features:

  1. The level of the iliac crests, projected on the radiographic grid, is the most widely used or even the only one.
  2. The tangent to the femoral heads, a true reference for the metric variations of the limbs.
  3. The tangent to sacro-iliac synchondrosis, inferiorly, considered a fixed, little variable and therefore reliable.
  4. The horizontal joining half of the small trochanters, if they appear symmetrical; this datum correlates with the tangent of the femoral heads (Figure 2).

IJOT2018-101-LuigiMolfettaItaly_F2

Figure 2. Heterometric values in study population.

Case Material

Twenty patients in the developmental age, 13 females and 7 males, aged between 10 and 16 years (average age of 12.8 years) who came to the observation for presumed scoliotic deficiency, were subjected to the examination of vertebral pathology, to clinical and radiographic evaluation for the recognition of an eventual h.l.l. Patients with pelvic dysmorphism and dysplastic hip disease were excluded. Each small patient was evaluated by 4 orthopaedic specialists (Table 1).

Table 1. Physician’s Evaluation in Study Population.

N°

sex

age

1° Physician

2° Physician

3° Physician

4° Physician

1

F

12

-1 cm

-1 cm

-1 cm

-1 cm

2

F

11

-0,5 cm

Non heter

Non heter

-0,5 cm

3

F

14

-0,8 cm

-0,5 cm

– 0,8 cm

-0,8 cm

4

M

14

-0,5 cm

-0,5 cm

– 0,8 cm

-0,5 cm

5

M

12

-1 cm

-1 cm

-1 cm

-1 cm

6

F

13

No heter.

Non heter.

Non heter.

Non heter.

7

F

13

-0,8 cm

– 1 cm

– 1 cm

– 1 cm

8

M

15

-0,8 cm

-0,5 cm

– 0,8 cm

-0,8 cm

9

F

10

-1 cm

-1 cm

-1 cm

-1 cm

10

M

12

No heter

-0,5 cm

-0,8

-1 cm

11

F

11

-0,5 cm

-0,5 cm

No heter

-0,8 cm

12

F

11

No heter

-0,5 cm

No heter

Non heter

13

M

15

-0,8 cm

-0,5 cm

– 0,8 cm

-0,8 cm

14

F

16

-0,5 cm

-0,5 cm

-0,5 cm

-0,5 cm

15

F

14

-0,5 cm

-0,5 cm

– 0,8 cm

-0,5 cm

16

F

13

No heter

No heter

-0,5 cm

No heter

17

M

12

-0,8 cm

-0,5 cm

– 1 cm

-0,8 cm

18

F

13

-0,5 cm

-0,5 cm

-0,5 cm

-0,5 cm

19

F

15

No heter

-0,5 cm

-0,5 cm

No heter

20

M

11

-1 cm

-1 cm

-1 cm

-1 cm

Results

The overall data on the 20 patients analyzed by 4 specialists are summarized in Table 1. Each specialist had evaluated 7 clinical parameters and 4 radiographic parameters. There was a unanimous correspondence between the 4 specialists for 7 cases (35%), a correspondence of 3 specialists on 4 for 10 cases (50%), a correspondence of 2 specialists on 4 in 2 cases (10%) and a complete discrepancy in 1 case (5%) (Figure 2). Among the clinical parameters the Spine-malleolar distance and the evaluation in clinostasis with flexed knees were very important, which for cases with h.l.l. they are constant results for all observers. The other data have meant confirmation for the former. About the radiographic data, the most significant and constant datum was the repere of the femoral heads, compared to the reticulum of the iliac crests, considered the main reference in the radiographic reports. In the group of study patients, according to the 4 different specialists, higher mean heterometric values were observed for the observer n ° 3 and n ° 4 with respect to the evaluation of the observer n ° 1 and n ° 2 (both with homogeneous heterometric values) resulting in a significant correlation of results, respectively: -0.6400 ± 0.3733 cm; -0.6250 ± 0.3726; – 0.5500 ± 0.3735cm; – 0.5500 ± 0.3204 cm. with p <0.0001 (Figure 3). No significant correlation was found between age and the evaluations of the 4 observers (respectively; p = 0.40; p = 0.28; p = 0.68; p = 0.13 = 0.13).

IJOT2018-101-LuigiMolfettaItaly_F3

Figure 3. The mean resulting in heterometric evaluation: study population.

Therefore the search for an h.l.l. it does not correlate with the patient’s age but with the accuracy of the clinical evaluation and with the observation of several semiological.

Discussion

An heterometry of the lower limbs causes a functional lumbar compensation curve; lumbar salience disappears both with the compensation of the same heterometry (equivalent rise) and with the Stagnara maneuver (deflection of the trunk in the discharge). The adaptive functional datum of the lumbar curve to the heterometry and its existence and existence. May be present in a patient with idiopathic scoliosis [4]. Preliminarily do not base the diagnosis of heterometry of the lower limbs on the sole radiographic reference, on presumed clockwise or anticorrosive rotations of the pelvis, without any anatomical-functional references. Some authors propose the use of QCT scans for data evaluation [5, 6]. The evaluation starts from the clinical examination in its entirety and is answered in the radiographic data; the sum of the evaluations concludes the clinical reasoning on the subject and expresses the extent of any heterometry. The search for heterometry on the radiograph of the panoramic spine should not only limit references on iliac crest.

On the frontal plane it is possible to detect asymmetries of a hemi-pelvis on the sagittal plane with alteration of the anteroversion or retroversion and on the transverse plane for modification of the intra-and extra-rotation. Total in the presence of retroversion of an emi-pelvis, h.l.l. is only apparent thanks to an posture adaptation of homologous lower limb, sometimes inducing a sub-division of contralateral hemi-pelvis. In such cases, this is a question before considering dismetric limbs [7]. The success has been more than ever positive among the clinical signs some have the value of greater reliability as precision of the spino-malleolar distance or the evaluation of an inflection compared to others. Among the radiographic signs, the tangent to the femoral heads represents the main reference point associated with the other three parameters. For all physicians were observed a correlation of the data, with no relation between the age and the evaluations of the specialists. Respect the search for h.l.l. is correlates with the accuracy of the clinical evaluation and with the examination of several semiological parameters, integrated for a diagnosis of probable certainty [8, 9].

References

  1. Morscher E (1972) Etiology and pathophysiology of leg length discrepancies. Orthopade 1: 1–8.
  2. Papaioannou T, Stokes I, Kenwright J (1982) Scoliosis associated with limb-length inequality. J Bone Joint Surg Am 64: 59–62. [crossref]
  3. Song KM, Halliday SE, Little DG (1997) The effect of limb-length discrepancy on gait. J Bone Joint Surg Am 79: 1690–1698. [crossref]
  4. Leali Tranquilli P, Valassina A “Le dismetria degli arti”, Argomenti di ortopedia e traumatologia Estratti, Verducci Editore.
  5. GREEN WT, WYATT GM, ANDERSON M (1946) Orthoroentgenography as a method of measuring the bones of the lower extremities. J Bone Joint Surg Am 28: 60–65. [crossref]
  6. Aaron A, Weinstein D, Thickman D, Eilert R (1992) Comparison of orthoroentgenography and computed tomography in the measurement of limb-length discrepancy. J Bone Joint Surg Am 74: 897–902. [crossref]
  7. Stanitski DF (1999) Limb-length inequality: assessment and treatment options. J Am Acad Orthop Surg 7: 143–153. [crossref]
  8. Goel A, Loudon J, Nazare A, Rondinelli R, Hassanein K (1997) Joint moments in minor limb length discrepancy: a pilot study. Am J Orthop (Belle Mead NJ) 26: 852–856. [crossref]
  9. Shapiro F (1982) Developmental patterns in lower-extremity length discrepancies. J Bone Joint Surg Am 64: 639–651. [crossref]

Shedding Light on the Potential Implications of Solar Eclipse on Psychiatric Patients

DOI: 10.31038/JNNC.2018115

Abstract

Astronomical phenomena have been purported to impact human behavior throughout history. Though literature regarding the potential influence of lunar phases on emotional status exists, reputable evidence based information detailing the impact of solar eclipses on psychiatric conditions is lacking. Our case study evaluates the potential psychiatric impact on patients in a state psychiatric hospital in Buffalo, NY that occurred on August 21st, 2017. Our case study reports that although the lowest count of restraint and seclusion events, as measured by evaluation of previously collected, de-identified and analyzed   routine facility performance improvement data, occured during the month of the solar eclipse which took place on August 21st 2017 when compared to any date within the previous 6 years, one patient experienced significant and unexpected psychiatric exacerbation. On April 28, 2024, another total solar eclipse will cross the United States. As Buffalo falls within the path of totality, this event would be an excellent opportunity for further analysis of these findings.

Key Words

Eclipse, behavior, restraint, seclusion, psychiatry

Introduction

Astronomical phenomena have been purported to impact human behavior throughout history. Historical perceptions of cosmic influences are predominantly based upon the beliefs that the moon can induce so- called “biological tides,” which are thought to provoke emotional disturbances [1]. Eclipses are one such event that has been suggested to impact human behavior.  In a solar eclipse, the moon aligns directly between the sun and the earth, and seemingly blocks the light of the sun.  A total solar eclipse is visible from the geographic location that is at the center of the moon’s shadow, while a partial solar eclipse may be seen in surrounding areas.  As the sun, moon and earth are not in direct alignment in the areas that  a partial eclipse is seen, the sun appears to have a dark shadow on part of its surface. Though unsubstantiated, several sources detailing the alleged impact of eclipses on the psyche are easily located with a simple Internet search. Literature regarding the potential influence of lunar phases on emotional status exists, however reputable information regarding the impacts of solar eclipses on psychiatric conditions is lacking [2]. Furthermore, the information that is available on solar eclipses is dated, focuses predominantly on suicide rates, and provides little insight into other psychiatric consequences of solar eclipses [3,4]. As “sun-gazing epidemics” in psychiatric hospitals have been described during these eclipses, further investigation into the impact of these phenomena on patients with mental illnesses is warranted [5].

On August 21, 2017, the first total solar eclipse in nearly four decades passed through the continental United States. As one of only fifteen total solar eclipses visible within the United States in the past century, the event was the subject of substantial media attention [6]. As the event date drew closer, speculation of the impact of the phenomenon on human behavior provoked debate and discussions within the scientific community. As previous publications suggest that psychiatric patients may be uniquely impacted by the event, curiosity over the potential implications of this upcoming event in psychiatric hospitals increased [7].

In an effort to provide further information on the role of a solar eclipse in psychiatric patient behavior, we present a case study evaluating trended data previously collected, de-identified and analyzed as part of  routine facility performance improvement actvities, on restraint and seclusion (R&S) orders at an inpatient state psychiatric hospital in Buffalo, New York. Because Buffalo, New York was out of the path of totality of the 2017 solar eclipse, the impact of a partial solar eclipse is reported in our findings. Restraint and seclusion was identified as the marker of the most extreme psychiatric exacerbation often representing a failure of first line PRN/STAT medication(s) given as a first line lower level intervention.

Case Report

Data previously collected, de-identified and analyzed  as part of a routine facility performance improvement activity on the number of R&S orders per month over the course of 6-years prior to the partial solar eclipse was compared to the quantity of orders during the month of August 2017.  On average, 13.75 R&S orders per month were entered in the years leading up to the eclipse (range 3–47). The quantity of R&S orders reached the lowest point (nadir) of 1 in August 2017, the month of the partial solar eclipse.

Figure 1 highlights the trend observed. No correlation was noted between time of year and historical number of R&S orders. Figure 2 details trends in the number of R&S orders during the month of August during the 6-years preceding the eclipse event.

JNNC18-102_F1

Figure 1. R&S Trends January 2011 – September 2017 (arrow highlights the nadir recorded in August 2017)

JNNC18-102_F2

Figure 2. R&S Order Trends during the month of August years 2011–2017

The only patient restrained during the month of the solar eclipse was a 30-year-old African American male with schizophrenia who had been admitted to the psychiatric center since November 18, 2016. Between January and June of 2017, thirty-six R&S orders were entered for this patient (average 4.5 orders per month). He was subject to a manual restraint on August 29, 2017, 8 days after the eclipse. Prior to this event, the patient no R&S orders had been entered for the patient since June 2, 2017.

The event prompting the August 29th restraint began with the patient’s sexual preoccupation with female staff and requests for these staff members to go into his room with him. He requested administration of as needed (PRN) oral lorazepam 2mg at 2040 and attempted to assault staff shortly afterwards. He was unable to be redirected or to follow simple directions, therefore a psychiatric emergency code was called. Patient was was subjected to a 2 person take down restraint without injury. Intramuscular chlorpromazine 100mg was ordered by the unit physician for acute treatment of this exacerbation episode. The patient attempted to grab the syringe from the administering nurse and stated that the staff member was the devil. Patient then received oral diphenhydramine 25mg at 2059 and was given an additional 25mg dose shortly afterwards per patient request. Patient responded to treatment with good effect. The patient did require PRN haloperidol and lorazepam during the month of August prior to his restraint, with a total of 12 administrations. Of note, PRN oral lorazepam 2mg, intramuscular lorazepam 2mg, and oral haloperidol 10mg were required on August 17th. Prior to this, administration of PRN psychiatric medications occurred sporadically, with only 1 dose given per occurrence during the month of August. On the day of the eclipse, the patient received 1 dose of PRN oral lorazepam 2mg. Following the eclipse, PRN oral haloperidol 10mg and oral lorazepam 2mg were given on August 25th and 29th.

Discussion

When focusing on an individual patient, the pattern of behavior provides further insight into the implications of the eclipse. Previous authors have found similar results indicating that human behavior may be influenced by the anticipation of major events. Though previously the patient had several aggressive incidents requiring R&S, over 2 months had passed between the patient’s most recent behavioral episode and the restraint following the eclipse. When considering the contrast of monthly R&S orders prior to the eclipse and during the month of August in the institution, the potential effect becomes even more pronounced. Of note, other factors unrelated to the eclipse may have played a role in these findings. First, any differences in acuity of patient specific psychiatric conditions throughout the timeline in question cannot be ascertained as the R&S events were only available as a de-identified quality management indicator. Additionally, during the period evaluated,  a performance improvement plan with a strategic emphasis to reduce the use of high risk interventions such as R&S was identified and implemented by the institution. While this may account for the overall reduced quantity of orders between 2011 and 2014, an uptick in R&S orders was noted in 2015.

A 2002 analysis conducted by Voracek and colleagues focused on the impact of a solar eclipse on suicide incidence in Austria. The investigation found a reduction in suicide rates at weeks 4, 3 and 1 prior to August 11, 1999 solar eclipse. prior to the August 11, 1999 solar eclipse. No significant changes in suicide incidence on the date of the eclipse were noted. The authors concluded that the anticipation of the event may have been protective against suicide. Of note, the timing of this eclipse also coincided with the turn of the millennium, which was another widespread media event. While it could be speculated that the reduction in suicide rate may have been partially related to a dual excitement surrounding both events, the temporal findings specifically leading up to the eclipse and immediately following the event suggest greater prominence of the eclipse in the findings observed [4].

In a follow-up to the 2002 analysis, Voracek and colleagues published a replication test providing information on suicide rates in Latvia and Romania during the 1999 solar eclipse. While no difference was noted in the incidence of suicide either 4-weeks before, during, or after the event in Latvia, the same trend in suicide reduction leading up to the eclipse was observed in Romania. Considering that Romania was within the path of totality while Latvia experienced a partial solar eclipse, the authors inferred that findings may be different in areas with varying degrees of salience. The findings in Romania thus provide further support for the hypothesis that anticipation of an eclipse may protect against suicide [4].

Although the psychological impact of anticipatory excitement cannot be excluded, confirmation of neurochemical changes may strengthen the hypothesis that solar eclipses may have psychiatric effects on humans. Boral et al, conducted a prospective evaluation of 13 psychiatric inpatients with the goal to evaluate the effects that a total solar eclipse may produce on behaviors and circulating hormones and to further identify potential correlations to the natural phenomenon. Hormones evaluated included Thyroxine (T4), Triiodothyronine (T3), Thyroid Stimulating Hormone (TSH), prolactin, and cortisol. Blood samples were collected twice daily for 6 days before and after the eclipse, during the event, and immediately after and behaviors were monitored 6 days prior to the eclipse, during the eclipse, and 6 days afterwards. Six patients experienced behavioral changes and in all cases, prolactin concentrations attained were significantly higher and abnormal behaviors became more pronounced immediately after the eclipse. Prolactin levels began gradually reducing in intensity to baseline over the 6 post eclipse days with no additional changes or abnormalities noted over the 6 post eclipse days with no additional changes or abnormalities noted [8]. This suggests a potential physiologic cause of peri-eclipse alterations in behavior.

Conclusion

The reduction in R&S utilization may suggest a positive impact of excitement associated with a solar eclipse on the behavior of psychiatric patients. Of note, the event described here was a partial solar eclipse based upon the location of the analyzed population. Therefore, results within the path of totality may provide different information. Nevertheless, these findings suggest that anticipation of a major event such as a solar eclipse may impact psychiatric behaviors. This may be in part due to a collective experience in which staff and patients interact on a different (common) level that what might be expected on any given day with institutional hierarchy and perceived imbalance of power. In addition, there is the possibility that patients may be on their best behavior in hopes of being granted privileges to witness the event firsthand. Lastly, as other authors have suggested neurochemical changes are likely associated with the potential psychiatric effects of solar eclipses, our analysis did not assess physiologic alterations.

On April 28, 2024, another total solar eclipse will cross the United States. As Buffalo falls within the path of totality, this event would be an excellent opportunity for further analysis of these findings.

References

  1. Biermann T, Estel D, Sperling W et al. ( 2005) Influence of lunar phases on suicide: the end of a myth? A population-based study. Chronobiology International 22: 1137–1143.
  2. Tejedor MJ, Etxabe MP, Aguirre-Jaime A (2010) Emergency psychiatric condition, mental illness behavior and lunar cycles: is there a real or an imaginary association?. Actas Esp Psiquiatr 38: 50–56.
  3. Voracek M (2002) Solar eclipse and suicide. Am J Psychiatry 159: 1247–1248. [crossref]
  4. Voracek M, Rancans E, Vintila M et al. (2004) Anticipation of total solar eclipse and suicide incidence. Psychiatria Danubina 16: 157–159. [crossref]
  5. Anaclerio AM, Wicker HS (1970) Self-induced solar retinopathy by patients in a psychiatric hospital. American Journal of Ophthalmology 69: 731–736. [crossref]
  6. Tran L. (2017 Aug 6) Preparing for the August 2017 total solar eclipse. Retrieved from: https://www.nasa.gov/feature/goddard/2016/preparing-for-the-august-2017-total-solar-eclipse
  7. Gralton E, Line C (1999) Eclipse of the sun August 1999: a psychiatric perspective. Psychiatric Bulletin 3: 500–502.
  8. Boral GC, Mishra DC, Pai SK, Ghosh KK (1981) Effects of total solar eclipse on mental patients: a clinicobiochemical correlation. Indian J Psychiat 23: 160–163.

Adjunctive Sarcosine and N-Acetylcysteine Use for Treatment-Resistant Schizophrenia

DOI: 10.31038/JNNC.2018114

Introduction

The pathophysiology of schizophrenia is not completely understood, but most hypotheses center around the core philosophy that schizophrenia is subject to the influence of neurotransmitters, specifically dopamine [1, 2]. While traditional psychotropic agents used to treat psychiatric illness correct neurotransmitter dysfunction to alleviate symptoms, there is growing evidence to suggest that inflammation, oxidative stress, and glutamate pathological changes have an effect in psychiatric conditions.

In the glutamate hypothesis of schizophrenia, abnormal glutamate uptake by glial cells can result in decreased N-methyl-D-aspartate (NMDA) receptor function [1, 3–7]. Dysfunction of NMDA receptors results in the disruption of downstream dopamine signaling. Specifically, hypofunction of the NMDA receptors in the mesolimbic dopamine pathway can result in hyperactivation of neurons, which can present as hallucinatory symptoms. Whereas, in the mesocortical pathway, NMDA receptor hypofunction can lead to negative symptoms, including anhedonia and impaired cognition. The affinity of glutamate for the NMDA receptor can be influenced by NMDA cofactors glycine and glutathione.

Modulation of the NMDA receptor via allosteric binding of glycine can enhance glutamate binding [1, 3–4]. Sarcosine (N-methyl glycine) is a type 1 glycine transporter inhibitor (GlyT1), that increases the synaptic concentration of glycine by preventing its reuptake by glial cells. Increased glycine in the synapse is proposed to augment glutamate binding at the NMDA receptor, in theory, alleviating the many symptoms of schizophrenia.

It is also thought that the abnormal metabolism of neurotransmitters in patients with schizophrenia can consequently result in oxidative stress and damaged neurons [5]. N- acetylcysteine (NAC) is thought to relieve oxidative stress by replenishing glutathione levels to prevent neurodegenerative effects and further cognitive dysfunction [5, 8–9]. NAC increases glutathione levels by delivering cysteine to the brain, which is necessary for glutathione synthesis. Similar to the cofactor glycine, increased glutathione levels will also augment glutamate binding at the NMDA receptor.

While current approved treatment options for
neuropsychiatric disorders, including schizophrenia, have
substantial documented efficacy, there are instances in which
response to these treatment options is suboptimal [10]. In these situations, patients can be further diagnosed with treatment-resistant schizophrenia. Complementary and alternative medicine (CAM) is a treatment intervention not approved by the Food and Drug Administration (FDA), however offers additional options When other treatments Fail. Both sarcosine and NAC are recognized as CAM therapy options. This report will discuss the efficacy and safety of adjunctive sarcosine and NAC in the treatment of treatment-resistant schizophrenia.

Current Literature Evaluating Sarcosine

Recent literature has evaluated the efficacy of sarcosine in the treatment of schizophrenia. In an open-label, preliminary trial by Amiaz et al., sarcosine was initiated in 22 patients with schizophrenia. To be included, subjects had to be stabilized on an antipsychotic regimen for at least four weeks prior to the addition of sarcosine. The antipsychotic agents patients were receiving included risperidone
(n = 7), quetiapine (n = 4), zuclopenthixol intramuscular (IM) injection (n = 4), olanzapine (n = 3), fluphenazine IM injection (n = 2) and paliperidone (n = 2). Five of the 22 patients received sarcosine 2g/day, while 17 patients received 4g/day. Significant improvement from baseline was noted  on the positive symptoms subscale of Positive and Negative Syndrome Scale (PANSS) following eight days of treatment (p = 0.007). Significant improvement was also seen on general psychopathology subscale of PANSS (p = 0.003). However, no significant improvement was detected in Clinical Global Impression Severity of Illness scale (CGI-S) (p = 0.08) and total PANSS score (p = 0.06) following treatment. The recruitment of this primary study was terminated following a documented safety issue reporting sarcosine may be linked to prostate cancer progression. This study was limited by the small sample size and short observation period.

A previous double-blind trial by Tsai et al. evaluated 38 patients with schizophrenia who received either adjunctive sarcosine or placebo in addition to their current antipsychotic therapy regimen for 6 weeks [12]. Patients were required to have been stabilized on their antipsychotic regimen for at least three months prior to enrollment in the study. The antipsychotic therapy regimens received included risperidone (n = 20), sulpiride (n = 6), haloperidol (n = 5), chlorpromazine (n = 1), fluphenazine decanoate (n = 1), trifluoperazine (n = 1), etumine (n = 1), sulpiride combined with chlorpromazine (n = 1), pipotiazine combined with chlorpromazine (n = 1) and medication free (n = 1). Significant improvements in positive (p < 0.0001), cognitive (p < 0.0001), and general psychiatric (p = 0.0002) symptom subscales of PANSS were observed in patients adjunctively treated with sarcosine when compared to placebo. Significant improvement was also found in Scales for the Assessment of Negative Symptoms (SANS) (p < 0.0001) and Brief Psychiatric Rating Scale (BPRS) (p = 0.0001) in patients receiving sarcosine therapy. When risperidone with adjunctive sarcosine was analyzed separately, similar results were found, as significant improvement was noted in PANSS, SANS and BPRS scales.

Lane et al. (2005) evaluated sarcosine use in patients experiencing acute exacerbations of schizophrenia [13]. It was difficult to derive clinically significant conclusions due to the numerous limitations of this study. However, improvement in general psychiatric symptoms, depression, and possibly negative symptoms was observed. Lane et al. (2008) assessed sarcosine use in 20 patients with schizophrenia as monotherapy as opposed to adjunctive therapy[14]. Compared to patients who received sarcosine 1g/day, patients who received sarcosine 2g/day experienced a 20% or greater reduction in total PANSS score. A follow-up double-blind trial, also conducted by Lane et al. (2010), randomized 60 patients with schizophrenia to receive sarcosine 2g/day or placebo[15]. Compared to placebo, sarcosine showed improvement in positive, negative and cognitive symptom subscales of PANSS. Improvement was also found among total PANSS (p=0.005), SANS (p=0.021), Quality of Life (QOL) scale (p = 0.025) and Global Assessment of Functioning (GAF) scale (p = 0.042). Similar to previous studies, the sarcosine treatment group had greater than a 20% reduction in total PANSS score. It is evident that adjunctive sarcosine therapy may provide significant benefit in patients with treatment-resistant schizophrenia who have exhausted traditional antipsychotic therapy options.

Current Literature Evaluating N-acetylcysteine (NAC)

A double-blind, placebo-controlled trial assessing the impact of adjunctive NAC in patients diagnosed with schizophrenia evaluated a primary outcome of improvement on PANSS score [5]. The treatment group received NAC 2g daily compared to placebo for 4 months. NAC was administered in addition to each patient’s current antipsychotic regimen. Four weeks following NAC discontinuation, the treatment group demonstrated a statistically significant improvement in PANSS total (p = 0.009), negative (p = 0.018) and general (p = 0.035) subscales. No significant improvement in PANSS positive subscale was found. A second randomized, double-blind, placebo-controlled trial assessed efficacy of NAC (up to 2g/day), in addition to risperidone (up to 6mg/ day), for 8 weeks in 42 patients with a baseline PANSS score greater than 20 [16]. A significant improvement in PANSS negative (p < 0.001) and total (p = 0.006) scales was found, but positive and general subscales lacked statistically significant improvements.

A systematic review and meta-analysis examined the efficacy and safety of adjunctive NAC in patients with schizophrenia among three randomized controlled trials [17]. Adjunctive NAC (2 to 6g/day) significantly improved total psychopathology (p = 0.03), but not general, positive or negative PANSS subscales. There were no significant differences observed in discontinuation rates or adverse effects (drowsiness, headache, nauseas and constipation) between placebo and treatment groups, which indicates favorable tolerability. These studies conclude that there is a modest benefit observed in augmenting maintenance antipsychotic therapy with NAC.

Case Report

A 43-year-old, single, white, female patient, with borderline intellectual functioning, has been continuously hospitalized at an inpatient New York State psychiatric institute since February 2003. She had been admitted to this same facility five times prior, with her first inpatient hospitalization dating back to June 1997, when she was diagnosed with schizophrenia, paranoid type. Her symptoms include paranoia, delusional ideation, hallucinations, disorganized thoughts, poor insight, impaired judgement, irritability, agitation and aggression. The patient has a history of physical and sexual abuse, as well as polysubstance abuse with marijuana, Lysergic Acid Diethylamide (LSD) and alcohol. The patient’s father reportedly suffered from schizophrenia, and died at age 48 from myocardial infarction.

Despite multiple treatment regimens over her lengthy hospital stay, the patient continued to have episodes of severe symptoms that interfered with daily functioning, including aggression. A trial of clozapine (Clozaril) was initiated, but was discontinued due to the development of myocarditis, leaving the patient ineligible for treatment rechallenge. After subsequent failed attempts to stabilize the patient with the use of alternative antipsychotic agents, either as monotherapy or in combination, including risperidone (Risperdal), olanzapine (Zyprexa), fluphenazine (Prolixin) and quetiapine (Seroquel), the patient’s treating psychiatrist requested a trial of CAM to augment her current psychiatric medication regimen of fluphenazine (Prolixin) decanoate 75mg intramuscular injection (IM) every other week along with oral doses of olanzapine (Zyprexa) 20mg twice daily, topiramate (Topamax) 200mg twice daily and lorazepam (Ativan) 2mg four times daily (Table 1). On 12/27/12, the patient was initiated on oral doses of NAC 600mg twice daily, followed by sarcosine 1g twice daily  on 1/17/13, for treatment resistant schizophrenia. The patient was additionally treated with chloral hydrate as needed (PRN) until it was removed from the market by the Food and Drug Administration (FDA) in October 2012. The patient received   hydroxyzine pamoate (Vistaril) 50mg every 4 hours PRN as a replacement for the chloral hydrate (Figures 1A-C).

JNNC18-103_F1

Figure 1A. Monthly PRN use before initiation of sarcosine.

JNNC18-103_F2

Figure 1B. Monthly PRN use after discontinuation of sarcosine.

JNNC18-103_F3

Figure 1C. Monthly PRN use during sarcosine therapy.

Table 1. Medication regimen changes over course of hospitalization.

Medication List 11/2/12

2013–2016

(date initiated)

Medication List 4/20/17

Calcium/Vitamin D 500mg/200units BID

Calcium/Vitamin D 500mg/200units BID

Calcium/Vitamin D 500mg/200units BID

Fluphenazine 5mg 4x daily

Discontinued: Fluphenazine 5mg 4x daily (11/16/12)

Fluphenazine 75mg IM injection every other week

Fluphenazine 75mg IM injection every other week

Fluphenazine 75mg IM injection every other week

Lactulose 20mg/30mL QHS

Lactulose 20mg/30mL QHS

Lactulose 20mg/30mL QHS

Lorazepam 2mg 4x daily

Lorazepam 2mg 4x daily

Lorazepam 2mg 4x daily

Olanzapine 20mg BID

Olanzapine 20mg BID

Olanzapine 20mg BID

Topiramate 200mg BID

Topiramate 200mg BID

Topiramate 200mg BID

Initiated: Propranolol 20mg BID (11/2012)

Propranolol 20mg BID

Initiated: N-Acetylcysteine 600mg BID (12/2012)

N-Acetylcysteine 600mg BID

Initiated: Sarcosine 1g BID (1/2013)

Sarcosine 1g BID

Initiated: Doxepin 50mg 4x daily (2/2013)

Doxepin 50mg 4x daily

Initiated: Bisacodyl 10mg twice weekly (2/2013)

Bisacodyl 10mg twice weekly

Initiated: Omeprazole 20mg QAM (4/2017)

Omeprazole 20mg QAM

Initiated: Thiothixene 10mg 4x daily (1/2016)

Thiothixene 10mg 4x daily

BID=twice daily
QHS=at bedtime
QAM=in the morning
4x daily=four times daily
All doses were administered by mouth unless otherwise noted

BPRS was utilized to document the progression of her treatment and the impact medication interventions had on her delusional thoughts and behaviors, including paranoia, anxiety and hostility. Prior to the initiation of NAC and sarcosine, the patient’s BPRS score was 72 in October 2012. Following the initiation of NAC and sarcosine, the patient’s BPRS score decreased, over the following 6 months of therapy, to a score of 50 in June 2013. Improvements were specifically seen in the areas of emotional withdrawal, conceptual disorganization, tension, mannerisms, hallucinatory behavior, uncooperativeness and blunted affect (Table 2).

Table 2. Improvement in BPRS score by date and domain. (highlighted boxes represent the score domains with the greatest improvements noted)

JNNC18-103_F4

Emergent psychiatric interventions, including Code Greens (CG) and Restraint and Seclusions (R/S), along with PRN medication use, were also included in the analysis to evaluate the efficacy of the patient’s psychiatric medication regimen, as these are indicators of symptoms pertaining to agitation and aggression (Table 3). In the one year prior to the initiation of NAC and sarcosine, the patient required 2 CG (3/12/12, 4/9/12) and had 4 assaults reported (1/2/12, 3/19/12, 5/6/12, 6/11/12). She did not have a R/S. In the year following the initiation of NAC and sarcosine, the patient required 2 CG (1/4/13, 9/23/13) and had 4 assaults reported (2/25/13, 3/24/13, 4/2/13, 7/5/13), with no R/S (Figure 1C). Hydroxyzine pamoate (Vistaril) use fluctuated from month to month. Of note, doxepin (Sinequan) 50mg four times daily was initiated on 2/1/13. Her aggressive behavior, documented by reported assaults and CG, significantly decreased following her assault on 4/2/13, which is when her BPRS score was decreasing towards 50 (Tables 2 and 3). From her assault on 7/5/13 and CG on 9/23/13 until June 2017 (4 years following the initiation of NAC and sarcosine), the patient only required 2 CG (10/12/14, 6/14/16). Of note, thiothixene (Navane) 10mg four times daily was added to the patient’s medication regimen on 1/19/16.

Table 3. Emergent Psychiatric Interventions.

Date (1 year prior to NAC and sarcosine initiation)

1/2/12

Assault

3/12/12

Code Green

3/19/12

Assault

4/9/12

Code Green

5/6/12

Assault

6/11/12

Assault

Date (Following initiation of NAC and sarcosine)

1/4/13

Code Green

2/25/13 (doxepin initiated on 2/1/13)

Assault

3/24/13

Assault

4/2/13 (BPRS score decreased to 50)

Assault

7/5/13

Assault

9/23/13

Code Green

10/12/14

Code Green

6/14/16 (thiothixene initiated on 1/19/16)

Code Green

The patient was maintained on fluphenazine (Prolixin Decanoate)  olanzapine (Zyprexa), thiothixene (Navane), topiramate (Topamax), lorazepam (Ativan), hydroxyzine pamoate (Vistaril), NAC and sarcosine, until sarcosine became unavailable in April 2017. The patient was subsequently given 500mg once daily starting on 4/20/17 to conserve the remaining sarcosine supply while the facility searched for alternative sources, but was given her last dose on 6/19/17. The BPRS score closest to the time of sarcosine discontinuation was 47 on 2/29/17. On 8/1/17, nearly 2 months after sarcosine discontinuation, the BPRS score was the same (47).

Of note, in January 2017, the patient required evaluation at an adjoining neurology clinic following ophthalmoplegia, loss of visual acuity in her right eye, and frequent headaches. The patient did present with recurrent headaches upon admission to the state psychiatric hospital. However, the frequency and severity of these headaches increased prior to her neurology consultation. An magnetic resonance imaging (MRI) scan revealed a mass extending through the orbital fissure along the cavernous sinus. The patient was subsequently diagnosed with Tolosa-Hunt Syndrome: a rare disorder characterized by non-specific inflammation in the superior orbital fissure and cavernous sinus [18]. The clinical presentation includes ophthalmoplegia and severe unilateral headaches with orbital pain. The patient received treatment with prednisone 60mg daily tapered to 15mg daily, in addition to acetaminophen (Tylenol) 650mg four times daily as needed, to alleviate her symptoms. Repeat MRI revealed minimal improvement in the mass. The patient continues to be followed by the neurology clinic with an uncertain prognosis.

Discussion

It is unknown whether symptomatic improvement can be attributed to one specific medication or a concomitant synergistic outcome. The patient’s BPRS score was report ed as 70 in November 2012. Following the initiation of NAC, the patient’s BPRS score decreased from 70 to 61 in December 2012. Following the initiation of sarcosine, the patient’s BPRS score was unchanged with a reported score of 61 in January 2012. If sarcosine were to elicit a psychotropic response, a decreased BPRS score would be expected shown as a steeper negative slope of the BPRS data line (shown in Figure 1A). The patient’s BPRS score decreased from 61 to 56 in February 2013, which could indicate a delayed response from sarcosine or be a result of doxepin (Sinequan) initiation. Following the initiation of doxepin (Sinequan) in February 2012, the patient’s BPRS score decreased from 56 to 54 in March 2013, and then continued trending downward.

There were no major fluctuations in PRN use following the initiation of NAC and sarcosine. Figure 1A shows a steep increase in hydroxyzine pamoate (Vistaril) use from December 2012 to January 2013. This was likely a result of the manufacturing discontinuation of chloral hydrate, because the patient was transitioned to hydroxyzine pamoate by the prescriber as the selected alternative to chloral hydrate. There were peaks of hydroxyzine pamoate (Vistaril) and diphenhydramine (Benadryl) use over the course of NAC and sarcosine treatment. These peaks of use tended to occur in May, and again between October and January. It is unclear what may have caused these changes in PRN use, but it may possibly be related to seasonal changes. Increased pain and discomfort, along with long-term steroid treatment may also have resulted in mood and behavioral changes leading to increased PRN use.

Sarcosine became unavailable in April 2017 due to the reclassification of sarcosine to a Category 1 substance by the FDA. Category 1 FDA designation excludes use of the agent for compounding until further efficacy and safety data is available for review [19]. The patient received her last dose of sarcosine on 6/19/17. Following the discontinuation of sarcosine, the patient’s hydroxyzine pamoate (Vistaril) use increased from 14 PRN doses in June 2017 to 26 PRN doses in July 2017.  The increased PRN use following sarcosine discontinuation occurred despite the sustained lower BPRS score and reduced reports of aggressive behavior (Table 3). This could be a result of a “placebo” effect with sarcosine use or may indicate that there could have been an improvement “plateau” with sarcosine use. It could also indicate that NAC is the agent responsible for this initial and continued improvement in BPRS score. Increased risk for loss of behavioral control could have possibly been mitigated by the administration of psychiatric medications as well as the use of behavioral interventions initiated by staff. Thus decreasing the need for a CG or R/S following sarcosine discontinuation.

It is of interest that this patient was diagnosed with Tolosa-Hunt Syndrome. There are previous reports linking sarcosine to the progression of prostate and breast cancer [11, 20, 21]. Two patients diagnosed with breast cancer later presented with diffuse orbital involvement of the extraocular muscles, simulating Tolosa-Hunt syndrome [21]. Breast cancer is known to metastasize and can involve ocular structures. The patient in this case does not have a known personal or  immediate family history of cancer to date. The association between sarcosine, cancer and Tolosa-Hunt syndrome is not clear, but should receive attention as the use of CAM becomes even more common.

Conclusion

There is evidence to suggest that CAM therapies, including sarcosine and NAC, can provide some therapeutic benefit to patients suffering from treatment-resistant schizophrenia who have exhausted other therapy options. The patient discussed in this case report experienced a decrease in her BPRS score following the initiation of NAC, however the magnitude of the decrease was more robust with NAC than that seen with the initiation of sarcosine.  When sarcosine was discontinued there was not an increase of BPRS scores as would be expected if sarcosine were the agent responsible for her improvement.

NAC may have been the agent responsible for the patient’s symptom improvement versus a concomitant synergistic outcome with NAC and sarcosine. However, the patient is still hospitalized to date, which does question the efficacy of these alternative medication therapy options. Little is known about the long-term effects of NAC or sarcosine, when used for any patient, whether diagnosed  with psychiatric illness or not. While there is no clear association, more studies pertaining to the long-term safety outcomes of NAC and sarcosine exposure should be explored before recommendations are made to promote this psychiatric therapy intervention.

References

  1. Yang AC, Tsai SJ (2017) New Targets for Schizophrenia Treatment beyond the Dopamine Hypothesis. Int J Mol Sci 18. crossref]
  2. Stahl SM, Grady MM Stahl’s (2011) Stahl’s Essential Psychopharmacology: Neuroscientific Basis and Practical Applications. (4th edn), Cambridge University Press, Cambridge, UK.
  3. Javitt DC, Zukin SR, Heresco-Levy U, Umbricht D (2012) Has an angel shown the way? Etiological and therapeutic implications of the PCP/NMDA model of schizophrenia. Schizophr Bull 38: 958–966. [crossref]
  4. Lee MY, Lin YR, Tu YS, Tseng YJ, Chan M, et al. (2017) Effects of sarcosine and N, N-dimethylglycine on NMDA receptor-mediated excitatory field potentials. J Biomed Sci 24: 18. [crossref]
  5. Berk M, Copolov D, Dean O, Lu K, Jeavons S, et al. (2008) N-acetylcysteine as a glutathione precursor for schizophrenia, double-blind, randomized, placebo-controlled trial. Biol Psychiatry 64: 361–368. [crossref]
  6. Dean O, Giorlando F, Berk M (2011) N-acetylcysteine in psychiatry: current therapeutic evidence and potential mechanisms of action. J Psychiatry Neurosci 36: 78–86. [crossref]
  7. Gysin R, Kraftsik R, Sandell J, Bovet P, Chappuis C, et al. (2007) Impaired glutathione synthesis in schizophrenia: convergent genetic and functional evidence. Proc Natl Acad Sci USA 104: 16621–16626. [crossref]
  8. Dringen R, Gutterer JM, Hirrlinger J (2000) Glutathione metabolism in brain metabolic interaction between astrocytes and neurons in the defense against reactive oxygen species. Eur J Biochem 267: 4912–4916. [crossref]
  9. Chen G, Shi J, Hu Z, Hang C (2008) Inhibitory effect on cerebral inflammatory response following traumatic brain injury in rats: a potential neuroprotective mechanism of N-acetylcysteine. Mediators Inflamm 2008: 716458. [crossref]
  10. Lehman AF, Lieberman JA, Dixon LB, McGlashan TH, Miller AL, et al. (2004) Practice guideline for the treatment of patients with schizophrenia, second edition. Am J Psychiatry 161: 1–56. [crossref]
  11. Amiaz R, Kent I, Rubinstein K, Sela BA, Javitt D, et al. (2015) Safety, tolerability and pharmacokinetics of open label sarcosine added on to anti-psychotic treatment in schizophrenia – preliminary study. Isr J Psychiatry Relat Sci 52: 12–15. [crossref]
  12. Tsai G, Lane HY, Yang P, Chong MY, Lange N (2004) Glycine transporter I inhibitor, N-methylglycine (sarcosine), added to antipsychotics for the treatment of schizophrenia. Biol Psychiatry 55: 452–456. [crossref]
  13. Lane HY, Chang YC, Liu YC, Chiu CC, Tsai GE (2005) Sarcosine or D-Serine add-on treatment for acute exacerbation of schizophrenia: a randomized, double-blind, placebo-controlled study. Arch Gen Psychiatry 62: 1196–1204. [crossref]
  14. Lane HY, Liu YC, Huang CL, Chang YC, Liau CH, et al. (2008) Sarcosine (N-methylglycine) treatment for acute schizophrenia: a randomized, double-blind study. Biol Psychiatry 63: 9–12. [crossref]
  15. Lane HY, Lin CH, Huang YJ, Liao CH, Chang YC, et al. (2010) A randomized, double-blind, placebo-controlled comparison study of sarcosine (N-methylglycine) and D-serine add-on treatment for schizophrenia. Int J Neuropsychopharmacol 13: 451–460. [crossref]
  16. Farokhnia M, Azarkolah A, Adinehfar F, Khodaie-Ardakani MR, Hosseini SM, et al. (2013) N-acetylcysteine as an adjunct to risperidone for treatment of negative symptoms in patients with chronic schizophrenia: a randomized, double-blind, placebo-controlled study. Clin Neuropharmacol 36: 185–192. [crossref]
  17. Zheng W, Zhang QE, Cai DB, Yang XH, Qiu Y, et al. (2018) N-acetylcysteine for major mental disorders: a systematic review and meta-analysis of randomized controlled trials. Acta Psychiatr Scand 137: 391–400. [crossref]
  18. Cohn DF, Carasso R, Streifler M (1979) Painful ophthalmoplegia: the Tolosa-Hunt syndrome. Eur Neurol 18: 373–381. [crossref]
  19. U.S. Food and Drug Administration (2017) Update: FDA revises final guidance on interim policy for certain bulk drug substances used in compounding. Washington, D.C, USA.
  20. Sreekumar A, Poisson LM, Rajendiran TM, Khan AP, Cao Q, et al. (2009) Metabolomic profiles delineate potential role for sarcosine in prostate cancer progression. Nature 457: 910–914. [crossref]
  21. Harnett AN, Kemp EG, Fraser G (1999) Metastatic breast cancer presenting as Tolosa-Hunt syndrome. Clin Oncol (R Coll Radiol) 11: 407–409. [crossref]

Dutta’s Innovative work to prevent PPH

DOI: 10.31038/IGOJ.2018115

Introduction

Haemorrhage killed more women than any other complications of pregnancy in the history of mankind. Placenta previa, abruption placenta and uterine rupture are in three important causes of ante partum haemorrhage seen frequently at tertiary level care hospital claiming high maternal mortality and morbidity till date present existing surgical technique to tackle major degree placenta previa is found to be not effective method to control haemorrhage during LUCS causing high incidence of maternal mortality and morbidity. Hence to prevent uncontrolled haemorrhage due to major degree placenta previa, author has advocated new surgical technique (Dutta’s) to prevent uncontrolled haemorrhage during LUCS.

Methodology

New technique (Dutta’s) were undertaken during LUCS operation in a stepwise Manner > delivery of baby following lower segment incision > bilateral uterine artery ligation > inj. Tranexamic acid (1000 gm) intramuscular > oxytocin infusion ( 10 unit) > delivery of placenta and its membrane and checked properly > if tear or laceration interrupted suture by catgut 1–0 > uterine wound were closed in two layers by catgut no 1 after securing bleeding from placental site or uterine wound > abdominal wall closed, after toileting the abdominal cavity, in presence of good uterine contraction. Main objective of the study to find out how to reduce maternal mortality and morbidity, after advocating (Dutta’s) new technique, during LUCS operation, for major degree placenta previa.

Benefits: Operative findings: good effectiveness to control bleeding, caesarean hysterectomy not required, immediate post operative bleeding – less. Maternal mortality – nil, maternal morbidity – less, good fetal outcome. Follow up up to two years: mentrual cycle normal, future fertility – good

Conclusion

Hence by adopting the new surgical technique (Dutta’s) during LUCS it was found to be simple, safe, quick procedure, reduce perfusion pressure, permits time for further steps thereby avoiding unnecessary ligation of hypogastric, bill and caesarean hysterectomy. Maternal mortality and morbidity were also found to be reduced. It is a suitable technique for rural based tertiary care hospital in absence of adequate blood transfusion facility.

Reference

  1. Damania KR, Salvi VS, Walvekar Vs. A Study of maternal mortality over 20 years. J Obst Gyn India 1989; 39: 61–5.
  2. Motwani MN, Sheeth J. Maternal Mortality from APH: Review of 20 years death. J Obst Gyn India 1990; 39: 364–6.
  3. Bowie JD, Rochester D, Cadkin AV, et al. Accuracy of placental localization by ultrasound. Radiology 1978; 128: 177–80.
  4. Cotton D, Read J, Paul R, et al. The conservative aggressive management of placenta praevia. Am J Obstet Gynecol 1989; 137: 687–95.
  5. Davis ME, Campbell A. The management of placenta praevia in the Chicago Lyingin Hospital. Surg Gynaec and Obst 1946; 83: 777.
  6. Evans, McShane. The efficacy of hypogastric artery ligation in obstetric haemorrhage. Surg Gynaecol Obstet 1985; 160: 250–3.
  7. Hill DJ, Beischer NA. Placenta praevia without antepartum haemorrhage Aust N Z J Obstet Gynaeclo 1980; 20: 21–3.
  8. Macafee CHG. Modern views on the management of placenta praevia. Post Card, Ded Journ 1949; 25: 297.
  9. McClure N, Dornal JC. Early identification of placenta praqevia (see comments). Br J Obstet Gynaecol 1990; 98–625.
  10. Render S. Placenta preavia and previous lower segment caesarean secton. Surg Gynaec and Obst 1954; 98: 625.
  11. Weiser EB. Managing second trimester placenta praevia. Contrib Gynecol Obstet 1980; 15: 187.

African KhoeSan Ancestry Linked to High-Risk Prostate Cancer

DOI: 10.31038/JMG.2018114

Abstract

Background: Genetic diversity is greatest within Africa, in particular Southern Africa. Within the United States, African ancestry has been linked to lethal high-risk prostate cancer. Here we investigate the contribution of African ancestral fractions to high-risk prostate cancer in two South African populations.

Methods: Genetic fractions were determined for 152 South African men of African (Black) or African-admixed (Coloured) ancestries, in which 40% showed high-risk prostate cancer.

Results: Averaging an equal African to non-African ancestral contribution in the Coloured, we found African ancestry to be linked to high-risk prostate cancer (P-value = 0.0477).

Adjusting for age, the associated African ancestral fraction was driven by a significant KhoeSan over Bantu contribution, defined by Gleason score ≥ 8 (P-value = 0.02329) or prostate specific antigen levels ≥ 20 ng/ml (P-value = 0.03713). Although not significant, the mean overall KhoeSan contribution was increased in Black patients with high-risk (11.8%) over low-risk (10.9%) disease. Using KhoeSan ancestry as a surrogate for high-risk prostate cancer, we identified four potential risk loci within chromosomal regions 2p11.2, 3p14, 8q23 and 22q13.2 (P-value = all age-adjusted < 0.01).

Conclusions: This is the first study to suggest a link between ancient KhoeSan ancestry and a common modern disease.

Key words

African ancestry; prostate cancer; KhoeSan; high-risk disease; ancestral fractions; ancestry informative markers

Introduction

High-risk prostate cancer (HRPCa) accounts for approximately 15% of diagnoses in Western countries, with significant potential for associated lethality [1]. Although a number of HRPCa classifications have been proposed, including variations in the requirement for clinical tumor staging and serum prostate specific antigen (PSA) levels, HRPCa is typically defined as pathological Gleason score (GS) ≥ 8 or PSA ≥ 20 ng/ml at diagnosis. In the United States, African American men are disproportionally affected by HRPCa and in turn present with the highest associated mortalities [2]. Additionally, HRPCa is disproportionally observed in men from sub-Saharan Africa and Southern Africa [3, 4]. In the latter study, compared with African Americans, Black South African men are at a 2.1-fold and 4.9-fold greater risk for presenting at diagnosis with GS ≥ 8 and PSA ≥ 20 ng/ml, respectively. While socioeconomic and lifestyle factors, as well as late detection, all contribute to the disproportionate impact of HRPCa within African Americans, the significance of genetic contribution is becoming increasingly evident [2,5]. However, data within Africa is severely lacking.

In addition to significant HRPCa presentation in Black South Africans, [4] HRPCa is also elevated within the African-admixed population from South Africa, the South African Coloured [4, 6]. While Black South Africans represent a uniquely African ancestry, predominantly Bantu, with contributing KhoeSan heritage, the Coloured arose as a result of intermarriage between initial European colonists, Dutch East Indian slaves and indigenous Bantu and KhoeSan Southern Africans [7, 8]. Therefore, the genetic ancestral fractions of the South African Coloured uniquely represent the broad spectrum of prostate cancer racial disparity reported in the United States, specifically African-biased high-risk, European-biased intermediate-risk (GS = 7) and Asian-biased low-risk prostate cancer (LRPCa; GS = 6). In this study we determine if African ancestry, specifically Bantu or KhoeSan African ancestry, is preferentially linked to HRPCa presentation in the region.

Participants and Methods

Study participants

South African men self-identifying as Black (n=68) or Coloured (n=84) presented at the urology clinics at Polokwane (Limpopo Province), Steve Biko (Gauteng Province) or Tygerberg (Western Cape Province) Academic Hospitals. Participants recruited within Limpopo and Gauteng form part of the previously described Southern African Prostate Cancer Study (SAPCS) [4,9] DNA was extracted from whole blood using standard methods (QIAGEN Inc., Germantown, Maryland).

Clinical and pathological presentation

Presence or absence of prostate cancer was provided by clinic-pathological diagnosis. All biopsy cores underwent independent rescoring for the 50 Black cases and 18 Black cancer- free patients as previously described [10] and the 84 Coloured cases (by AvW and WB). HRPCa defined as a GS ≥ 8, was confirmed for 33 Black (66%) and 27 Coloured (32%), or PSA ≥ 20 ng/ml (irrespective of pathological features), was observed for 36 Black (72%) and 39/81 Coloured (48%). LRPCa defined as a GS = 6, was observed for seven Black (14%) and 12 Coloured (14%), or PSA <10 ng/ml for six Black (12%) and 23 Coloured (28%). The remaining patients were classified as presenting with intermediate risk disease.

Genomic data generation

Illumina Infinium HumanCore Beadchip (>250K markers) genotype array data was either made available (68 Black)10 or generated (84 Coloured). Data inclusion was dependant on a GenTrain score (a measure representing the reliability of the genotype calls) of at least 0.5 or more (Illumina GenomeStudio 1.9.4) with further selection of autosomal markers based on a linkage disequilibrium r2 value >0.2 within a 50-variant sliding window, advanced by five variants at a time (SNP and Variation Suite 8.3.1, Golden Helix).

Determining ancestral fractions

Genomic data from population representatives (in brackets) for different African ancestral identifiers were used and defined as: KhoeSan (Ju/’hoan), [7] West African (Mandinka), Proto- Bantu (Yoruba), West Bantu (Bamoun and Fang), and East Bantu (Luhya), [11] while non- African ancestral identifiers included: Asian (Han Chinese) and European (Utah Americans) (Illumina iControl data). African American data (n=48) was sourced from the International Genome Sample Resource. Ancestral fractions were estimated using STRUCTURE 2.3.3 (5000/10000 burn-in iterations, 10000/20000 replicates) assuming different ancestral contributions (≥ five replications) [12].

Statistical analyses

Statistical analyses were performed in R (https: //www.r-project.org) using linear regression (lm) of continuous or categorical data. One-way ANOVA was used for establishing significant disease predictors. Two tailed t-test was used to determine an association between African ancestry and risk extremes, namely HRPCa versus LRPCa. RFMix analysis for local ancestry inference was used to estimate admixture across 22 individual pairs of autosomes [13]. Genotyping data of 84 Coloured patients were removed if unmapped to GRCh37, and phased using SHAPEIT2 with the 1000 Genomes Phase 3 reference panel [14]. RFMix was run with two expectation maximization iterations and 0.2 cM window size and results of each patient along with the population representatives described above were converted to genomic intervals with ancestral identifiers. The intervals where KhoeSan contributions between HRPCa and LRPCa (defined by either GS or PSA) differed greater than three times were compared using Fisher’ exact significance test and then Bonferroni correction (46 and 45 intervals compared based on GS and PSA values, respectively). Significant phased intervals greater than one megabase were chosen for single marker and haplotype block association tests using Haploview (https: //www.broadinstitute.org/haploview/haploview). The RFMix results with posterior probability greater than 0.9 were modelled for migration timing and gene flow estimation using the ancestry tracts analysis (TRACTS) program [15]. The best-fit model assuming KhoeSan, Bantu and Eurasian contributions, was selected based on likelihood values.

Results

Population specific ancestral fractions

STRUCTURE analysis using 10,295 autosomal markers provided detailed population substructure (Figure 1 based on eight reference populations). In contrast to African Americans, the African ancestral contributions to the study participants are almost exclusively Bantu and KhoeSan. While African Americans lack KhoeSan contributions, their African ancestral contribution is largely West African (non-Bantu with a lesser West/Proto-Bantu contribution) and East Bantu, with a significant European-biased non-African contribution.

The Bantu contribution in our study participants can be defined as uniquely Southern Bantu, 69.6% in the Black and 17.1% in the Coloured, with a smaller East Bantu fraction, 14.5% and 9%, respectively. KhoeSan contributions range from minimal up to 20.8% in the Black and as much as 68.1% in the Coloured.

While the Black participants show exclusive African heritage, the Coloured present overall with an almost equal non-African to African fraction. A 9-fold increase in the number of ancestry informative markers through limiting founder population inclusion (91,263 markers), allowed for further separation of the non-African Coloured fractions into European (range 0 to 62.3%) and Asian (range 0. 3 to 42.2%) (Supplementary Figure 1). To better understand the extent of African ancestral contributions in our study participants, we used TRACTS to model their migration history. Consequently, we defined the Coloured as migratory non-African, with significant KhoeSan contributions from 11 (31.5%) to 10 (7.1%) generations ago, followed by Bantu contributions appearing 8 (20.4%) and 7 (11.8%) generations ago (Figure 1). In contrast, the KhoeSan contribution to the Black population appeared as a single pulse migration event roughly 21 generations ago (11.1%; Optimal likelihoods value: -255.7).

JMG2018-104-VanessaHayesSA_F1

Figure 1. Population substructure of the study participants. (Top Panel) STRUCTURE analysis for 10,295 autosomal markers and eight ancestral populations for the 68 Black (50 cases and 18 controls) and 84 Coloured South African (SA) study participants compared with African Americans and reference populations from Africa (Ju/’hoan, Mandinka, Yoruba, Bamoun, Fang and Luhya) and outside of Africa (European and Han Chinese). (Middle Panel) Using STRUCTURE analysis we determined the African ancestral fractions, defined as KhoeSan, West/Proto-Bantu, East Bantu and Southern Bantu, as well as the non-African ancestral fractions, defined as European and Eurasian, within our study cohort with comparisons made with the African Americans. (Bottom Panel) Magnitude and origin of migrants is shown with different colors in bar and pie charts representing three ancestral contributions. The size of pie charts is proportional to percentage of migrants, with the earliest generation equal to 100% and a decrement in the next generation.

JMG2018-104-VanessaHayesSA_F3

Figure S1. Ancestral fractions determined using STRUCTURE analysis 84 South African Coloured men with PCa using 114,199 autosomal markers and K=4 (5000 burn in and 10000 reps). Ancestral contributions are defined as African-KhoeSan (yellow), African-Bantu (green), European (blue) and Asian (red).

African ancestral fractions linked to HRPCa

Presenting with an almost even distribution of African to non-African heritage, the Coloured provide an ideal genetic resource to further evaluate the African ancestral contribution to HRPCa. We observed a significant association between total African ancestry and prostate cancer pathology. Patients with HRPCa (GS ≥ 8) showed an average of 54.8% African ancestry compared to the 37.3% observed for patients with LRPCa (GS = 6) (t = 2.0974, P– value = 0.0477). Furthermore, we observed a significant KhoeSan over Bantu African contribution to HRPCa, specifically the average KhoeSan contributions to GS ≥ 8 versus 6 tumors was 31% and 20.1%, respectively (t = 2.4491, P-value = 0.0233) and for PSA ≥ 20 versus < 10 ng/ml tumors, 31% and 24.1%, respectively (t=2.1455, P-value = 0.0371).

Although the total KhoeSan contribution to the Black patients was less significant (range 0% to 21%), we did note a slight increase in total KhoeSan ancestral contribution within patients presenting with GS ≥ 8 versus 6 tumors (mean 11.8% vs 10.9%; t = 0.3249, P-value = 0.754).

HRPCa loci enriched for KhoeSan ancestral contribution

Associating excess KhoeSan contribution within HRPCa presentation in the Coloured, we performed a local-ancestry inference analysis for KhoeSan-specific enrichment, using RFMix [13]. The most significant age-adjusted KhoeSan ancestral association with GS ≥ 8 was observed at chromosome 22q13.2 (95 markers; GRCh37 positions 40,178,619–42,552,253; ANOVA P–value = 0.0062) and chromosome 2p11.2 (332 markers; positions 80,741,406- 85,833,046; ANOVA P-value = 0.0083) (Figure 2). While KhoeSan ancestry was also associated with an elevated PSA ≥ 20 ng/ml at 2p11.2 (ANOVA P-value = 0.0004), two additional PSA-HRPCa associated loci were identified, including chromosome 3p14 (127 markers; positions 57,971,523–59,436,405; ANOVA P-value = 0.0026) and 8q23 (79 markers; positions 111,028,667 to 112,656,042; ANOVA P-value = 0.0052). Performing haplotype and single marker association test we identified two markers, rs10103786 and rs4504665, within 8q23 that remained significant after correcting for multiple testing (1,000 permutations; Chi-Square = 15.365 and 11.245; P–value = 0.007 and 0.048, respectively).

JMG2018-104-VanessaHayesSA_F2

Figure 2. Candidate high-risk prostate cancer (HRPCa) chromosomal regions defined as an over-abundance of KhoeSan heritage. Legends show the proportion of Coloured patients presenting with HRPCa (red) versus low-risk prostate cancer (LRPCa; blue); asterisks (**) indicate regions with age-adjusted P-values < 0.01; 1/1, 0/1 or 0/0 represent the presence of KhoeSan ancestry within both DNA strands, a single strand or none, respectively. The local ancestry is defined using RFMix.

Discussion

We determined the contribution of African ancestral contributions defined as Bantu and KhoeSan to increased HRPCa presentation within South Africa. In contrast to African Americans, Black South Africans present with uniquely Bantu, specifically Southern over West Bantu or West non-Bantu contribution, with a single pulse KhoeSan contribution occurring over 550 years ago. The South African Coloured present, on average, with matched non-African to African genetic contributions. While the non-African fraction includes both European and Asian contributions, the African initiating admixture event predates African American admixture by two generations and includes significant KhoeSan contributions followed to a lesser extent by Bantu contribution. We demonstrate that the South African Coloured represents a unique and alternative resource to African American studies for identifying significant African ancestral contributions to elevated HRPCa.

Confirming an African ancestral link to HRPCa within the Coloured, we showed further that the observed significance appears to be driven largely by a KhoeSan over Bantu contribution. To the best of our knowledge, this is the first reported link between ancient KhoeSan ancestry and prognosis of a common modern condition. It would be reasonable to speculate that prostate cancer risk alleles would not be under negative selection within a hunter-gatherer society with an on average younger overall lifespan. Using KhoeSan ancestry as a surrogate for HRPCa, we identify four chromosomal regions as potential risk loci for aggressive presentation within the region. The 2p11.2 locus, enriched for both GS ≥ 8 and PSA ≥ 20 ng/ml, has previously been associated with PCa risk [16, 17]. A recent study, using capture-based Chromosome Conformation Capture (3C) sequencing, identified a significant physical long-range interaction between common variants within the largely non-coding 2p11.2 region and the candidate tumor suppressor gene CAPG, with expression quantitative trait locus signals at rs1446669, rs699664 and rs1078004 (absent within our array content) [18]. Additionally, the GS-associated 22q13.2 region has previously been associated with HRPCa in a roughly 1,000 strong Swedish genome-wide association study, with independent rs7291691 cross study validation. Located at position 38,778,569, the latter common variant is upstream of the region identified in this study, which may indicate a population specific impact [19]. Notably, the PSA-associated regions, 3p14 and 8q23, are both proximal to known prostate cancer risk loci, including a deletion of the 3p14.1–3p13 region HRPCa [20,21] and the common 8q24 prostate cancer risk loci [18].

In summary, this is the first study to link KhoeSan ancestry to prostate cancer, specifically HRPCa presentation within a uniquely admixed population with African, KhoeSan and Bantu, as well as non-African, European and Asian, ancestries. Using KhoeSan ancestry as a surrogate for HRPCa, we identify potential candidate loci, although one must caution that these regions are only suggestive and require larger study numbers to meet levels of genome-wide significance. However, previously two regions, 2p11 and 22q13 have been suggested as HRPCa risk loci, while two variants at 8q23 remained significant when accounting for multiple testing. Our findings suggest that modern humans earliest ancestors may have been carrying genomic signatures for HRPCa, which would not have been selected against due to later age of onset of prostate cancer.

Acknowledgements

The authors acknowledge the study participants, Sister Heather Money and nursing staff at Western Province Blood Transfusion Service (WPBTS), as well as additional urological members of the South African Prostate Cancer Study (SAPCS), Dr Richard L. Monare and Dr Smit van Zyl.

Contributors

DCP and VMH conceived and designed the study. DCP, PF, AvdM, PAV and MSRB enrolled study subjects and maintained clinical databases. MSRB and VMH direct, manage and fund the SAPCS. VMH sourced funding for genomic analyses. AvdM and MSRB provided clinical revision. AvW and WB performed pathological analyses. DCP and RJL isolated the samples, generated genomic data and provided genetic reports. DCP, WJ, EKFC and VMH performed data analysis and critical interpretation. DCP, WJ and EKFC performed statistical analyses. DCP, WJ and VMH drafted the manuscript. All authors reviewed the manuscript.

Funding

This work was supported by project grants supporting the Southern African Prostate Cancer Study (SAPCS) including: the Cancer Foundation of South Africa (CANSA), the National Research Foundation (NRF) of South Africa, and the Medical Research Council (MRC) of South Africa. Additional support was received from the Australian Prostate Cancer

Research Centre (APCRC) New South Wales (NSW) and by a Perpetual IMPACT grant to the Garvan Foundation, Australia. EFKC and DCP are supported by the Movember Australia and the Prostate Cancer Foundation Australia (PCFA) Prostate Cancer Bone Metastasis (ProMis) Movember Revolutionary Team Award (MRTA), while VMH is supported by the Petre Foundation and University of Sydney Foundation, Australia.

Competing interests: None declared.

Ethics approvals and permits: Participants were recruited and consented according to research ethics approvals granted from the Provincial Government of Limpopo (#32/2008) and the University of Limpopo Medical Research Ethics Committee (#MREC/H/28/2009), the University of Pretoria Human Research Ethics Committee (HREC #43/2010, including US Federal wide assurance FWA00002567 and IRB00002235 IORG0001762), Stellenbosch University HREC (#N08/03/072) or the SANBS HREC (#2012/11). DNA was shipped to Australia under the Republic of South Africa Department of Health Export Permits in accordance with the National Health Act 2003 (J1/2/4/2 #1/10, #1/12 and #3/15) and as per institutional Material Transfer Agreements. Genomic interrogation was performed in accordance with St Vincent’s Hospital (SVH) HREC site-specific approval (#SVH15/227).

References

  1. Chang AJ, Autio KA, Roach M 3rd, Scher HI (2014) High-risk prostate cancer-classification and therapy. Nat Rev Clin Oncol 11: 308–323. [crossref]
  2. Chang AJ, Autio KA, Roach M 3rd, Scher HI (2014) High-risk prostate cancer-classification and therapy. Nat Rev Clin Oncol 11: 308–323. [crossref]
  3. McGinley KF, Tay KJ, Moul JW1 (2016) Prostate cancer in men of African origin. Nat Rev Urol 13: 99–107. [crossref]
  4. Rebbeck TR, Devesa SS, Chang BL, et al. (2013) Global patterns of prostate cancer incidence, aggressiveness, and mortality in men of african descent. Prostate Cancer 2013: 560857.
  5. Tindall EA, Monare LR, Petersen DC, van Zyl S, Hardie RA, et al. (2014) Clinical presentation of prostate cancer in black South Africans. Prostate 74: 880–891. [crossref]
  6. Tan DS, Mok TS2, Rebbeck TR (2016) Cancer Genomics: Diversity and Disparity Across Ethnicity and Geography. J Clin Oncol 34: 91–101. [crossref]
  7. Heyns CF, Fisher M, Lecuona A, et al. (2011) Prostate cancer among different racial groups in the Western Cape: presenting features and management. S Afr Med J 101: 267–70.
  8. Petersen DC, Libiger O, Tindall EA, Hardie RA, Hannick LI, et al. (2013) Complex patterns of genomic admixture within southern Africa. PLoS Genet 9: e1003309. [crossref]
  9. Patterson N, Petersen DC, van-der-Ross RE, et al. (2010) Genetic structure of a unique admixed population: implications for medical research. Hum Mol Genet 19: 411–19.
  10. Tindall EA, Bornman MS, van-Zyl S, et al. (2013) Addressing the contribution of previously described genetic and epidemiological risk factors associated with increased prostate cancer risk and aggressive disease within men from South Africa. BMC Urol 13: 74.
  11. McCrow JP, Petersen DC, Louw M, et al. (2016) Spectrum of mitochondrial genomic variation and associated clinical presentation of prostate cancer in South African men. Prostate 76: 349–58.
  12. Henn BM, Gignoux CR, Jobin M, et al. (2011) Hunter-gatherer genomic diversity suggests a southern African origin for modern humans. Proc Natl Acad Sci U S A 108: 5154–62.
  13. Pritchard JK, Stephens M, Donnelly P (2000) Inference of population structure using multilocus genotype data. Genetics 155: 945–59.
  14. Maples BK, Gravel S, Kenny EE, Bustamante CD (2013) RFMix: a discriminative modeling approach for rapid and robust local-ancestry inference. Am J Hum Genet 93: 278–288. [crossref]
  15. Delaneau O, Marchini J (2014) 1000-Genomes-Project-Consortium. Integrating sequence and array data to create an improved 1000 Genomes Project haplotype reference panel. Nat Commun 5: 3934.
  16. Gravel S (2012) Population genetics models of local ancestry. Genetics 191: 607–619. [crossref]
  17. Akamatsu S, Takata R, Haiman CA, Takahashi A, Inoue T, et al. (2012) Common variants at 11q12, 10q26 and 3p11.2 are associated with prostate cancer susceptibility in Japanese. Nat Genet 44: 426–429, S1. [crossref]
  18. Kote-Jarai Z, Olama AA, Giles GG, et al. (2011) Seven prostate cancer susceptibility loci identified by a multi-stage genome-wide association study. Nat Genet 43: 785- 91.
  19. Du M, Tillmans L, Gao J, Gao P, Yuan T, et al. (2016) Chromatin interactions and candidate genes at ten prostate cancer risk loci. Sci Rep 6: 23202. [crossref]
  20. Sun J, Zheng SL, Wiklund F, Isaacs SD, Li G, et al. (2009) Sequence variants at 22q13 are associated with prostate cancer risk. Cancer Res 69: 10–15. [crossref]
  21. Feik E, Schweifer N, Baierl A, et al. (2013) Integrative analysis of prostate cancer aggressiveness. Prostate 73: 1413–26.