Author Archives: author

Career Outcomes for STEM, Social and Behavioral Sciences and Education Doctoral Alumni

DOI: 10.31038/ASMHS.2018233

Abstract

Traditionally doctoral students are trained to pursue tenure-track positions in research-intensive institutions. However, a survey of 914 PhD alumni at a public research university in a diverse array of disciplines finds that students move across employment sectors over a 15-year period. This study used a three-tier taxonomy to classify both short- and long-term employment outcomes based on employment sector, career type and job sector for Science, Technology, Engineering and Mathematics (STEM) and Social and Behavioral Sciences and Education (SBSE) doctoral alumni. The study is unique in that demographic information such as race, gender and citizenship status and academic performance measures were examined to gain a deeper understanding of career trajectories. The findings indicate differing career paths based on demographic characteristics, but also finds there is no correlation between academic performance metrics such as GPA and GRE scores and job placements in academia or outside of academia. This has significant implications for doctoral training and suggests that graduate programs must prepare students for both academic and alternative careers, particularly as tenure-track positions and U.S. federal research dollars continue to shrink. This study also adds to a growing body of literature on the need for rigorous data collection, and transparency to help students make informed choices about PhD training and career pathways.

Keywords

Career outcomes, doctoral training, STEM, Social and Behavioral Sciences and Education

Introduction

Graduate study is a high-stress pursuit [1]. Some of this stress results from uncertainty about career outcomes. Academic institutions have traditionally trained and prepared doctoral students for a single career pathway: tenure-track faculty positions. However, today’s knowledge-based economy offers doctoral students rich and varied career options, and doctorate holders have the potential to contribute to a broad spectrum of the US workforce. In this paper, we use data from a 15-year survey of Ph.D. alumni from a comprehensive research university to document the diversity of career pathways pursued by PhD students in Science, Technology, Engineering and Mathematics (STEM) fields and in the Social and Behavioral Sciences and Education (SBSE). We separate our examination of STEM and SBSE alumni, as we suspect that the career paths of alumni in these broad disciplinary areas may differ. We also analyze how career outcomes change for different cohorts by age, and how they correlate with demographics and academic performance indicators. This study provides a better understanding of the career trajectories of doctoral alumni, which has significant implications for appropriate training and advising of Ph.D. students. This in turn may lead to higher rates of career satisfaction and well-being for individuals over the course of their careers. Institutional transparency about career outcomes can also encourage students to explore all available career tracks and mitigate some of the stress inherent in the pursuit of a doctoral degree.

New research shows that Ph.D. holders are increasingly migrating to non-academic sectors despite a persistent culture in academia that emphasizes the singular path to success as the professoriate at a research-intensive university. National data sources and the research literature underscore the shift away from academic careers in specific disciplines. For example, only 17.7% of PhDs (in science, engineering and heath disciplines) in 2015 had secured tenure-track positions within five years of receiving their degree. This compares to a 25.9% tenure track placement in 2006 and a 27% placement in 1993 [2]. Similarly, the National Science Foundation’s Survey of Earned Doctorates (SED) found that 50% of science, engineering and health discipline PhDs are engaged in careers outside of academia within 14 years of graduation [3]. Almost 75% of all biomedical doctoral alumni engage in careers beyond academia, including for-profit, government and non-profit sectors [4,5]. The shift is present, though perhaps less stark, in the Social and Behavioral Sciences. A study of 3000 Social Science graduates who earned their degrees in the United States between 1995 and 1999 found that 77% hoped to obtain tenure-track positions, but only 40% found such positions within a year of earning their degree [6].

The steady exodus away from careers in academia can be attributed in part to a declining number of faculty jobs [7]. It also reflects some students’ loss of interest in a lifetime career in academia as they progress through doctoral programs [8–11]. Students may reassess their opportunities for success in hyper-competitive environments, which place a premium on publications and grants. When students observe the life-work imbalances of their faculty advisers, long postdoctoral training periods, and meager salaries for academics at early stages of their careers, these factors may also contribute to student interest in alternative paths [8]. For these reasons, and because students move between employment sectors in the course of a career, it becomes incumbent upon graduate institutions to inform current and former students about a wide-range of career options [7, 10, 12–14].

The move towards transparency about PhD career outcomes has gained momentum in recent years [13, 15–17], yet, the use of divergent taxonomies prevented aggregation and identification of national trends [18–22]. A unified and replicable taxonomy for the biomedical sciences was developed in 2017 by several groups, including the National Institutes of Health Broadening Experiences in Scientific Training (NIH-BEST) grantee consortium, the Association of American Medical Colleges’ Graduate Research Education and Training (AAMC GREAT) group, and Rescuing Biomedical Research (RBR). The consortium proposed a common three-tier taxonomy to standardize PhD career outcomes classifications: Tier 1 includes five employment sectors; Tier 2 comprises five career types; and Tier 3 includes 26 job functions [23], as shown in S1 Appendix. This taxonomy is flexible enough to adapt to disciplines beyond biomedical sciences and was used to categorize the 914 alumni in this study.

In addition to improved data collection and transparency about Ph.D. career outcomes, new training models and professional development offerings are crucial to helping students make the transition to work environments and cultures outside academia [10, 12, 24, 25]. The research literature indicates that employers look for transferrable skills such as the ability to work in collaborative teams, strong communication and presentation skills, and project management experience. The literature calls on faculty mentors and the graduate training community to strongly encourage mentees to fully explore myriad career options during their graduate studies [26]. Some also suggest the use of professional nonacademic mentors and successful alumni to provide students with guidance throughout a graduate program [24].

Wayne State University (WSU) is a comprehensive research institution with an enrollment that includes 1,500 doctoral students in 75 doctoral programs. Our PhD alumni work as professors, lead research labs, own consulting firms, teach undergraduates and work in executive management in industry and government. Like other academic institutions, our training models have long been based on the assumption that students would pursue tenure-track faculty positions. To gain a granular understanding of career trajectories, the Graduate School launched the 2015 Alumni Census project to collect employment information of doctoral alumni who graduated over a 15-year window from 1999 to 2014 [18]. Analyzing longitudinal data provided us with a deeper understanding of how our alumnus navigate through the early and middle stages of their careers.

In addition to looking at career changes over time, our study also collected demographic information on doctoral alumni so that we could better understand how race, gender and citizenship status interact with career outcomes. We also examined key metrics associated with academic performance such as GRE scores, cumulative GPA and time-to-PhD degree completion. Traditionally, strong performance in these metrics was believed to be correlated with securing a tenure-track position at a research institution, while lower performers on these types of measures were perceived as accepting positions outside academia at a higher rate; jobs which have been traditionally viewed as less prestigious.

To provide a short- and long-term snapshot, we used the career of the alumnus at the time of the data collection and “binned” these data in aggregate for alumni based on number of years from graduation (0–5 years; 6–10 years; and 10–15 years post-graduation). These aggregated career outcomes data were then classified according to the unified three-tier taxonomy, and used to ask the following questions: (a) in which employment sectors, career types, and job functions are WSU’s alumni engaged; (b) is there a distinction between the types of careers pursued based on gender, race and U.S. citizenship status of alumni; and (c) is there a correlation of career outcomes with academic characteristics such as GRE scores, doctoral GPA, and time-to-PhD degree completion?

To our knowledge, this report is unique. It is the first published research to examine doctoral career paths along with the demographics and academic preparedness of alumni in STEM and SBSE. There exists an abundance of literature on STEM career outcomes; however there is less robust information on SBSE career trajectories. This study attempts to close some of those information gaps and shed light on what we anticipate are divergent pathways. Specifically, we assume that STEM alumni, particularly those in engineering, would pursue jobs in business and industry, while SBSE PhDs would follow more traditional paths securing teaching and research positions in academic settings.

Methods & Materials

Alumni Census Project

 In 2015 WSU’s Graduate School launched an Alumni Census Project in which the current employment information of 496 STEM and 418 SBSE doctoral alumni who graduated from 1999–2014 were collected, as previously described [18]. The departments included in this study and the numbers of alumni surveyed in each are described in Table 1. The information gathered included a direct survey of alumni to indicate their current job placement, as well as information gathered directly from graduate programs and graduate faculty. Alumni were also asked to answer a series of questions about their career trajectories, including information on their first placement, the length of time they have been with their current employer as well as their various job titles over time to provide a rich view of their career progression. The complete survey is in S2 Appendix. Self-reported employment data were validated using alumni institutional websites, federal funding agency and publication records, Google, LinkedIn, and other professional social media sites.

Table 1a. STEM Majors

Departments

College of Engineering

College of Liberal Arts & Sciences

Grand Total

Chemical Engineer & Materials Science

58

58

Civil & Environmental Engineering

24

24

Computer Science

4

74

78

Electrical & Computer Engineering

70

70

Engineering Dean

36

36

Industrial & Manufacturing Engineering

53

53

Mathematics

50

50

Mechanical Engineering

65

65

Physics & Astronomy

1

61

62

Grand Total

311

185

496

Table 1b. SBSE Majors

Departments

College of Education

College of Liberal Arts & Sciences

School of Business

School of Social Work

Grand Total

Administrative & Organizational Studies

54

54

Anthropology

12

12

Business Administration

5

5

Economics

38

38

Political Science

22

22

Psychology

197

197

Social Work

3

3

Sociology

34

34

Teacher Education

4

4

Theoretical & Behavioral Foundations

49

49

Grand Total

107

303

5

3

418

Ethical Approval

This project was conducted with approval from Wayne State University’s Institutional Review Board on the Use of Human Subjects, IRB#094013B3E.

Data Reporting and Visualization

All data are reported in aggregate or with identifiable information removed. Data in which a group is below 4% are not reported in order to maintain confidentiality and anonymity of the individual(s).

Demographic characteristics used in the study include gender (men and women); race (Asian, Black, White); and citizenship status (U.S. citizen/permanent resident or non-U.S. citizen). The 496 STEM alumni include 106 women (21.4%) and 390 men (78.6%); 291 Asian (58.7%), 188 White (37.9%) and 17 Black (3.4%) alumni; 119 U.S. citizens/permanent residents (24%) and 377 non-U.S. citizens (76%), as shown in Table 2a. The 418 SBSE alumni include 266 women (63.6%), 152 men (36.4%); 307 White (74.5%), 56 Black (13.6%), 49 Asian (11.9%); 353 U.S. citizens/permanent residents (84.4%), and 65 non-U.S. citizens (15.6%), as shown in Table 2b. Note that we report race data in only three categories because the number of alumni in other race categories falls below our 4% reporting threshold. This reduces the number of SBSE alumni included in analyses that consider race from 418 to 412.

Academic characteristics assessed were (a) GRE-Quantitative and GRE-Verbal scores submitted at the time of graduate admission; (b) cumulative GPA at doctoral graduation; and (c) time to doctoral degree completion. For our analysis, GRE Quantitative scores (GRE-Q) are shown in blocks of scores of 137–145, 146–155, 156–166. GRE-Verbal scores (GRE-V) are shown in blocks of scores of 130–145, 146–155, 156–170. Note that the GRE is not a requirement for admission to all programs at WSU, therefore the numbers in these analyses do not total 496 (for STEM) or 418 (for SBSE). Data are expressed as percent of alumni in each score/year range.

Cumulative GPA at time of doctoral graduation is grouped as blocks of 3.0–3.5 GPA, 3.51–3.75 GPA, 3.76–4.0 GPA; and Time-to-Degree completion (TTD) in blocks of 3.5–5.0, 5.1–6.0, 6.1–7, 7+ years. At WSU, average Time-to-Degree for STEM doctoral students is 6.1 years and 6.9 years for SBSE students.

As we examined our data, we realized that the distributions of alumni in each of the three tiers: Employment Sectors, Career Types and Job Functions, change over time. Since most of these changes were seen in 5 year windows, we have depicted all data in three 5 year windows to visualize employment shifts; i.e., Window 1 (0–5 years); Window 2 (6–10 years); and Window 3 (11–15 years) immediately following graduation. Note that in this manuscript, the trajectory of each alumnus over a 15-year time period is not reported. Rather, the overall alumni aggregate employment data are shown in each time window from years following graduation within each of the three tiers at the specific time of the survey.

Outcome analyses were performed using SPSS version 25 (IBM 2018). Chi-Squared (Χ2) analyses with follow-up z tests employing a Bonferroni correction were used to test for significantly different proportions of alumni in different Employment Sectors, Career Types, and Job Functions over time. Since time windows contained different sets of participants, between-subjects analyses were conducted. Multinomial logistic regression analyses were then conducted to test for significant interactions between time windows and demographic characteristics. Singularities in the Hessian matrix due to small sample sizes in some cells prevented valid multinomial analysis. Because of the Hessian matrix violations, Chi-Squared (Χ2) analyses were used to test for significantly different proportions of demographic groups within each tier. As with time windows, post hoc z tests with Bonferroni corrections were used to test for significant effects if the omnibus Chi-square test was significant. Differences among comparison groups were considered to be statistically significant at p < .05.

Table 2a. Gender, race, and citizenship status of 15-year STEM doctoral alumni (n = 496)

Women

Men

Asian

Black

White

US citizen or Permanent Resident

Non-US Citizen

Total (496)

106

390

291

17

188

119

377

Asian (291)

51

240

291

21

270

Black (17)

6

11

17

12

5

White (188)

49

139

188

86

102

US Citizen or Permanent Resident (119)

36

83

21

12

86

119

Non-US Citizen (377)

70

307

270

5

102

377

Table 2b. Gender, race, and citizenship status of 15-year SBSE doctoral alumni (n =418)

Women

Men

Asian

Black

White

US Citizen or Permanent Resident

Non-US Citizen

Total (418)*

266

152

49

56

307

353

152

Asian (49)

31

18

49

18

31

Black (56)

35

21

56

48

8

White (307)

195

112

307

281

26

US Citizen or Permanent Resident (353)

231

122

18

48

281

353

Non-US Citizen (65)

35

30

31

8

26

65

* Note that we report race data in only three categories because the number of alumni in other race categories fall below our 4% reporting threshold. This reduces the number of SBSE alumni included in analyses that consider race to 412 from 418.

In addition, we conducted multinomial logistic regression analyses to test for significant interactions between combinations of demographic characteristics (e.g., gender, race, and citizenship). However, singularities in the Hessian matrix due to small sample sizes in some cells prevented valid multinomial analysis. Chi-Squared (Χ2) analyses were also attempted to examine patterns of career outcomes in isolated subsets of alumni; however, small and n = 0 cell sizes for some categories resulted in uninterpretable results. Because the patterns of findings appear to be similar for these small groups, we decided to present analyses on each demographic variable (rather than combinations of variables) to yield robust results that could be used as a basis for future investigations. Thus, the analyses presented here focus on patterns of career outcomes within each demographic group for the entire 15-year window. Logistic regression analyses were used to test whether academic characteristics were associated with Employment Sector outcomes. Significance was determined with a p value < .05.

Results

15-year career outcomes of WSU’s STEM doctoral alumni

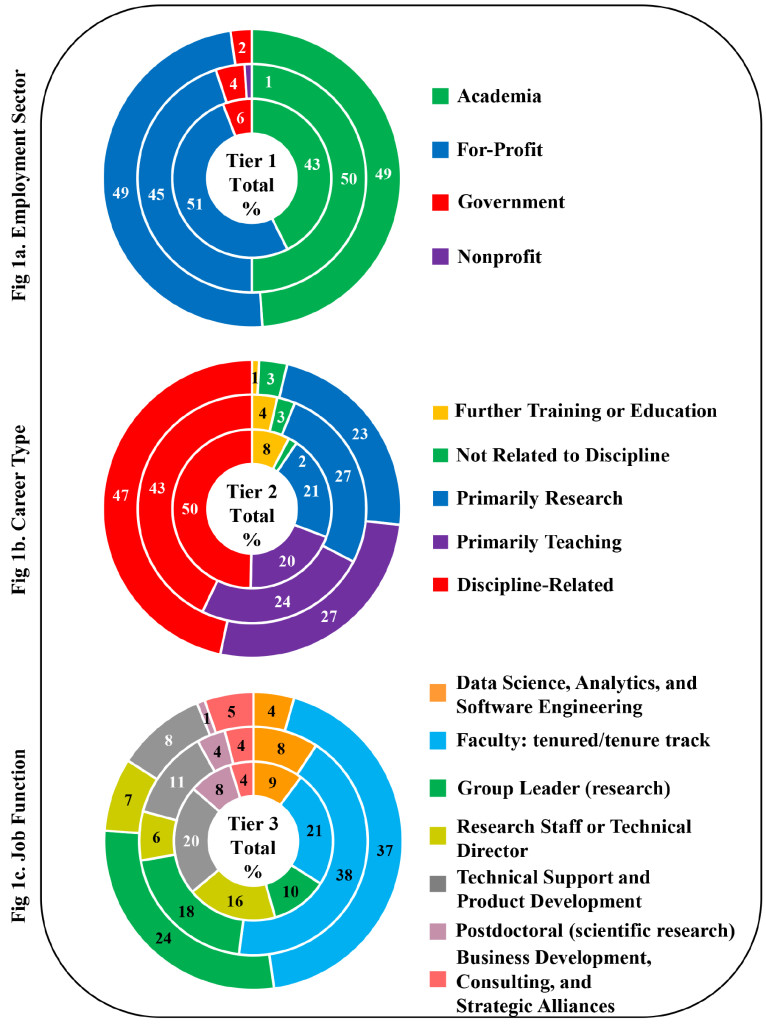
Figure 1 shows overall 15-year STEM doctoral alumni career outcomes. Data are presented by tier in three time windows that build from the center of the circle as follows: 0–5 years; 6–10 years; and 11–15 years. In our overall STEM alumni outcomes, not all employment sectors, career types and job functions were equally represented.

For employment sector (Tier 1), overall across the three time periods we found that STEM alumni were almost evenly split between careers in academia (47.2%) and the for profit sector (48.2%). Only a small percentage go on to work in government (4.2%) or nonprofit (.4%) sectors (Figure 1a).

Tier 2 (Career Type) shows that alumni engage in careers that are discipline related (46.2%), primarily research (23.8%), and primarily teaching (23.4%), with a small percent engaged in further training or education (4.2%) and others in careers not related to discipline (2.4%) (Figure 1b).

CST2018-117-MaryE.WoodUSA_Figure1

Figure 1. STEM Doctoral Alumni Career Outcomes by Tier

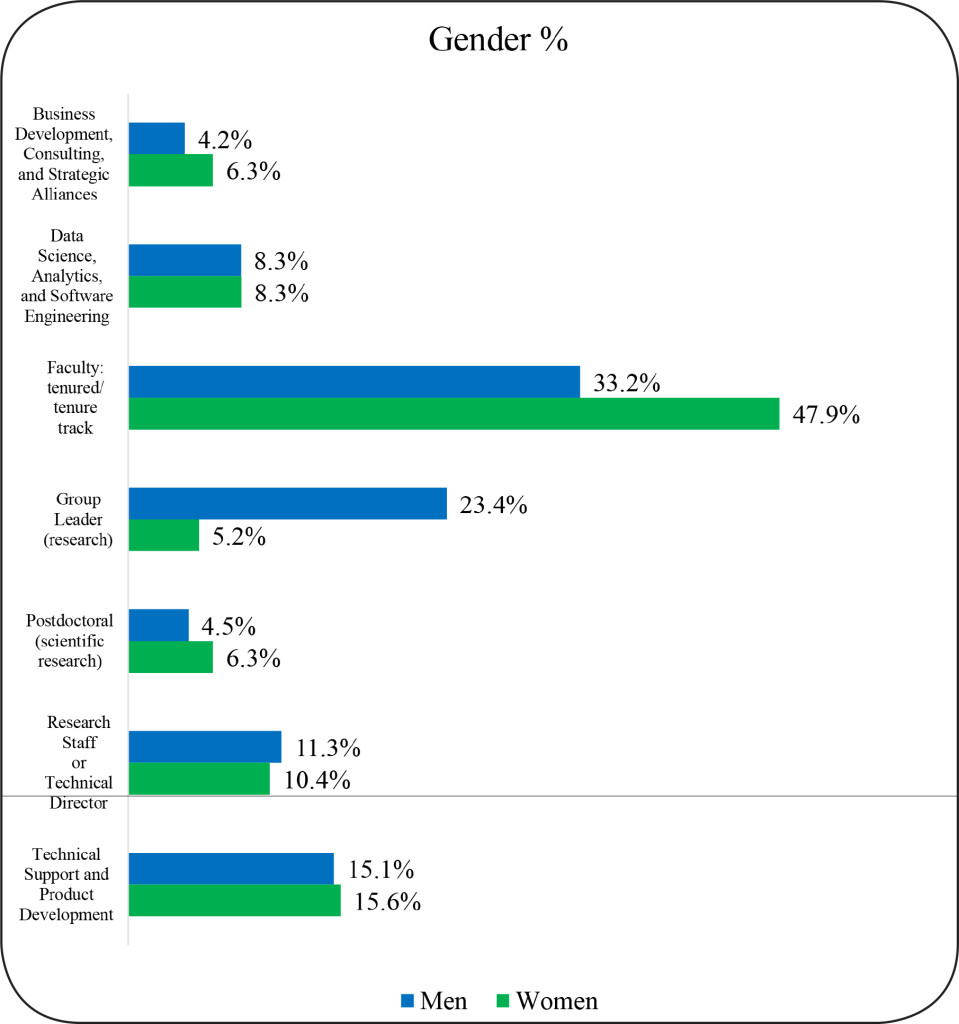
For Tier 3 we find that seven primary job functions describe the work of 87.3% of Wayne State’s STEM PhD alumni: faculty (tenured/tenure track) (31.9%), research group leader (16.9%), technical support/product development (13.3%), research staff or technical director (9.7%), and data science, analytics, and software engineering (7.3%), post-doctoral research (4.2%) business development, consulting and strategic alliances (4%) (Figure 1c). The remaining 12.7% of STEM alumni are engaged in other job functions which have fewer than 4% alumni in each.

STEM Demographic Characteristics and Employment Sector (Tier 1)

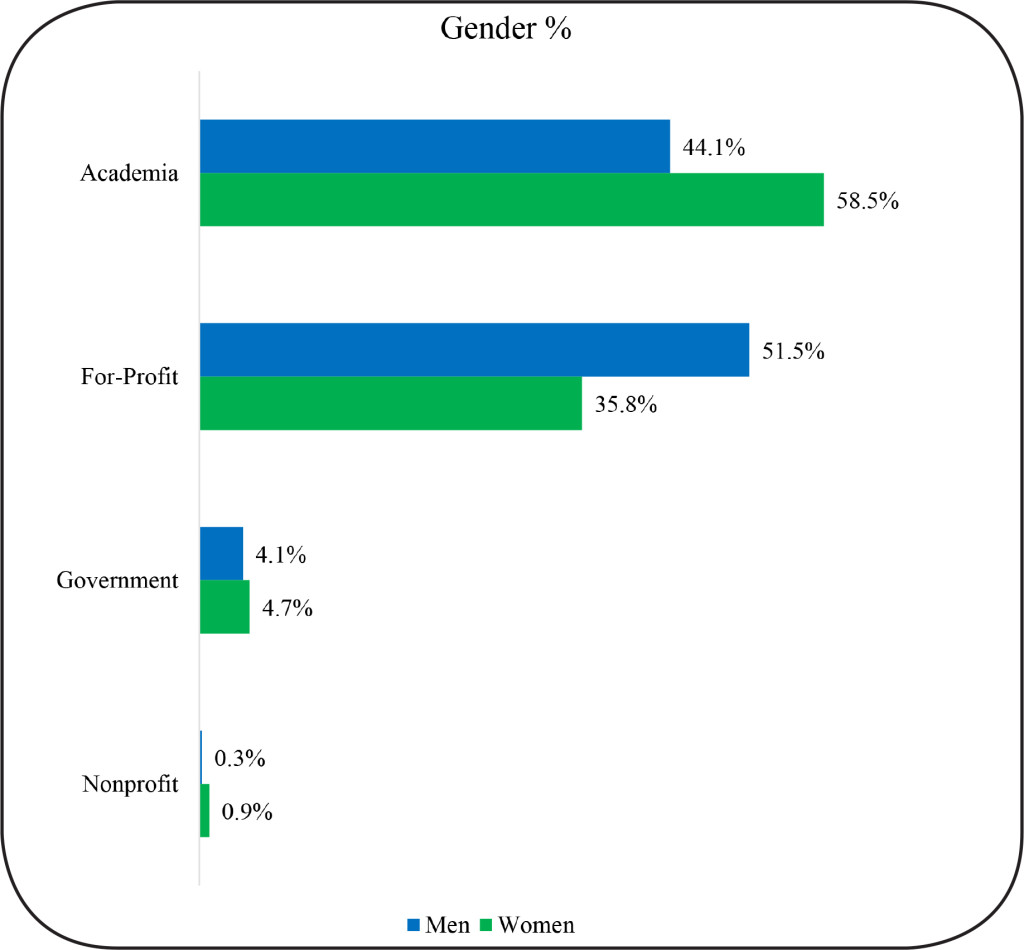
We analyzed the Tier 1-Employment Sector data as three windows of 5-years each to see if there were significant career shifts over time, or significant differences in career outcome by gender, race or U.S. citizenship status. We find that the pattern of employment sector for STEM alumni did not significantly change over time, Χ2 (6, N = 496) = 7.35, p = .29. However, there was a significant difference between men and women in terms of their sector of employment, Χ2 (3, N = 496) = 8.97, p = .03, with women more likely to hold academic jobs and men more likely to be employed in the for-profit sector, p < .05 (Figure 2).

CST2018-117-MaryE.WoodUSA_Figure2

Figure 2. Gender and Employment Sector of STEM Doctoral Alumni

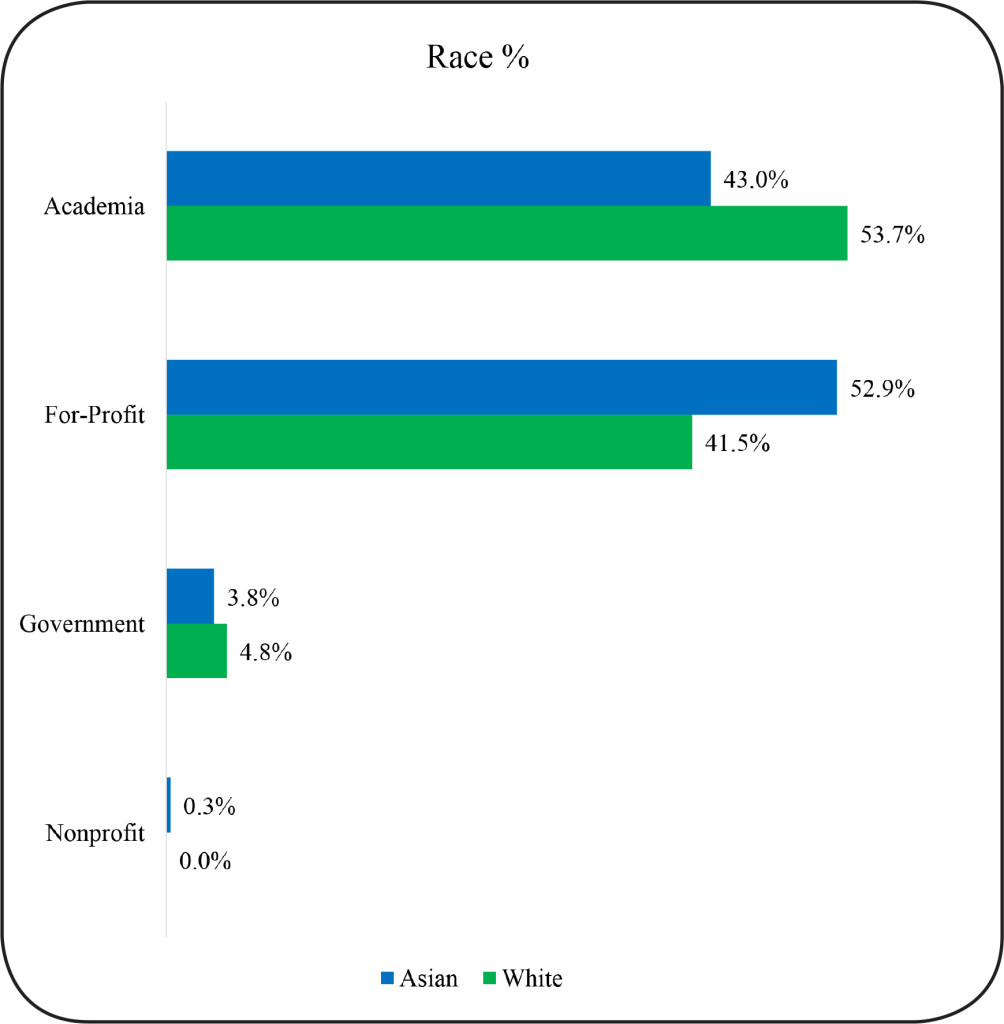
There was also a significant effect of race on employment sector Χ2 (6, N = 496) = 19.91, p = .003. A higher proportion of Asians entered the for-profit sector as compared to Whites (p < .05). (Figure 3). There were no significant differences between U.S. citizen and non-U.S. citizen alumni in the STEM fields, Χ2 (3, N = 496) = 1.86, p = .60.

CST2018-117-MaryE.WoodUSA_Figure3

Figure 3.Race and Employment Sector of STEM Doctoral Alumni

STEM Demographic Characteristics and Career Type
(Tier 2)

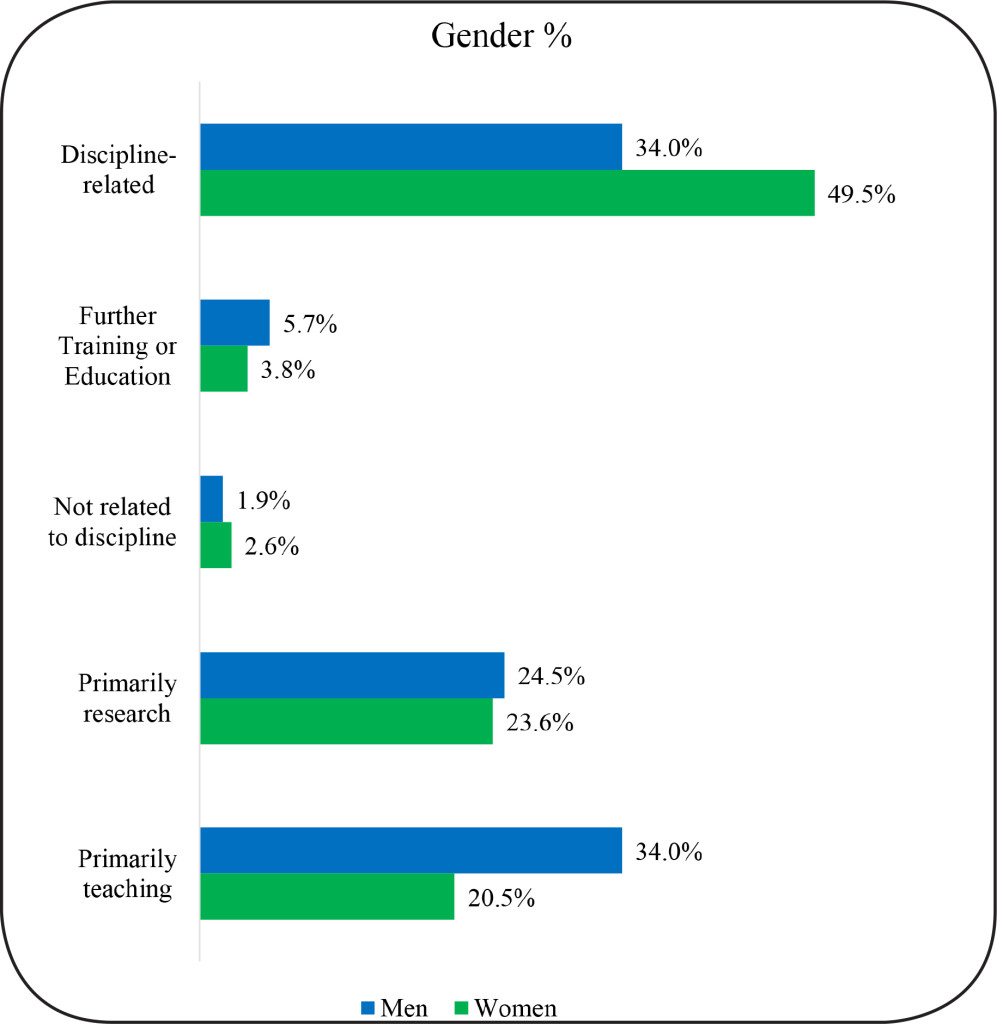
We further analyzed the Tier 2- Career Type data as three windows of 5-years each for total alumni as well as by gender, race, and U.S. citizenship status. As with Tier 1, we find that for STEM alumni, the distribution of career types did not significantly change over time, Χ2 (, N = 496) = 12.15, p = .15. However, men and women differed in their career types, Χ2 (4, N = 496) = 11.64, p = .02. Significantly more women were in primarily teaching careers (p < .05), and more men in science-related careers (p < .05). (Figure 4). Racial group distributions were similar across Career Types, Χ2 (8, N = 496) = 6.96, p = .54. Career type was not associated with citizenship status, Χ2 (4, N = 496) = 2.3, p = .68.

CST2018-117-MaryE.WoodUSA_Figure4

Figure 4. Gender and Career Type of STEM Doctoral Alumni

STEM Demographics and Job Function (Tier 3)

We also analyzed the Tier 3- Job Function data in the same manner as described for employment sector and career type. For this Tier, we found significant changes in the proportions of alumni in different job functions across the different five-year time windows, Χ2 (8, N = 392) = 37.38, p = .0001. Specifically, the proportion of alumni in faculty jobs increased significantly from window 1 (0–5 years) to 2 (5–10 years) (p < .05). We believe this shift may reflect a transition where alumni shift from postdoctoral positions or other additional training to faculty positions. Similarly, the number of alumni in group leader (research) jobs increased significantly from window 1 (0–5 years) to 3 (10–15 years) (p < .05), whereas the proportion of STEM alumni in data science/technical support and product development jobs declined from window block 1 to 3 (p < .05). There was also a significant decrease in alumni in research staff or technical director jobs from Window 1 to 2 (p < .05) (Figure 1c). Again, these shifts can be viewed as part of the expected course of career advancement of Ph.D. holders.

A significant difference was also found between women and men with regard to job function (Figure 5). The significant Chi-square for gender, Χ2 (4, N = 392) = 17.58, p = .001 was accounted for by the fact that women were more likely to hold tenured/tenure track faculty jobs and men were more highly represented in group leader jobs (p < .05). (Figure 5). There were no significant racial group differences, Χ2 (8, N = 392) = 8.47, p = .39, or citizenship group differences Χ2 (4, N = 392) = 6.29, p = .18 in job functions.

CST2018-117-MaryE.WoodUSA_Figure5

Figure 5. Job Function of STEM Doctoral Alumni by Gender

STEM Academic performance indicators and employment sector

We also examined the association of academic characteristics with the two largest STEM employment sectors: “Academia” and “For-profit.” Participation in other sectors is too small to allow for meaningful comparisons.

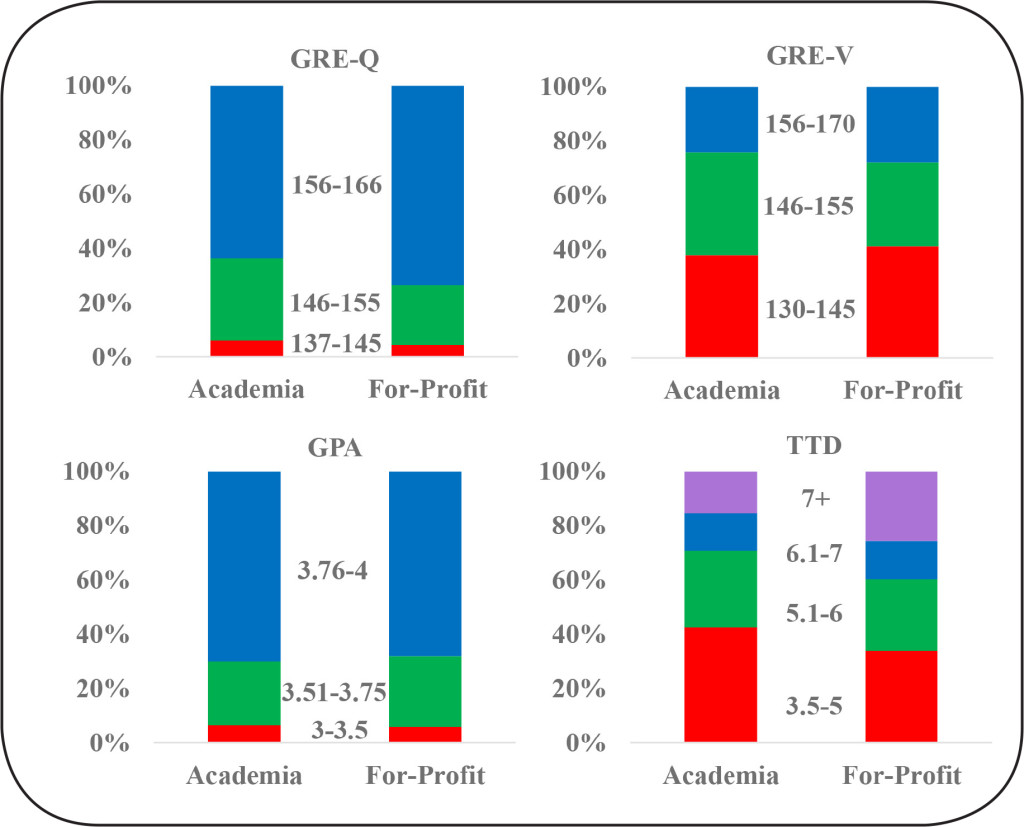
There are no statistically significant differences in most of the academic performance indicators examined between alumni who end up in careers in academia as versus the for-profit sector. There is an equivalent spread of GRE-Quantitative scores, GRE-Verbal scores and cumulative GPA of alumni between these sectors (Figure 6). However, STEM alumni who took longer to complete their degrees were more likely to enter the for-profit sector, B = .165, SE = .049, Wald (df = 1) = 11.37, p = .001. A follow-up t-test showed that alumni in the academic sector completed their degrees, on average, in 5.68 years (SD = 1.68) whereas alumni in the for-profit sector completed their degrees, on average, in 6.33 years (SD = 2.30), t (471) = 14.88, p = .001.

CST2018-117-MaryE.WoodUSA_Figure6

Figure 6. STEM Doctoral Alumni Academic Performance Indicators and Employment Sector

15-year career outcomes of WSU’s SBSE doctoral alumni

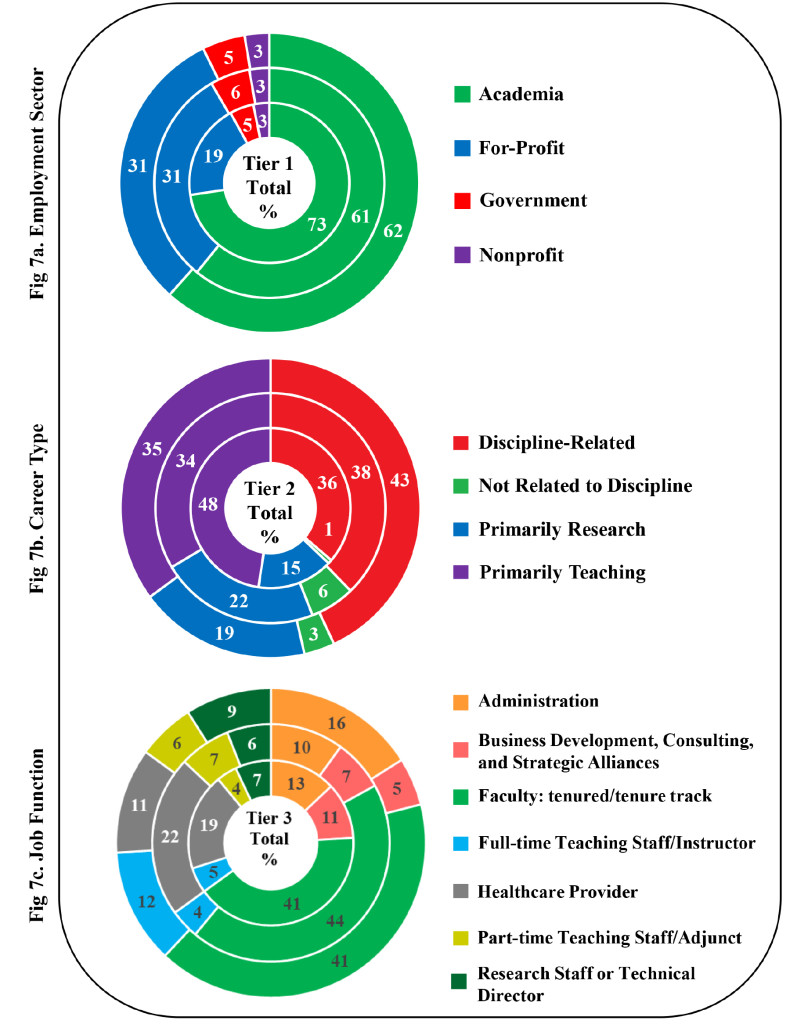
SBSE alumni outcomes show not all employment sectors, career types, and job functions are equally represented. SBSE alumni data in Tiers 1, 2 and 3 across the three time windows (0–5 years; 6–10 years; and 11–15 years) is summarized (Figure 7).

In Tier 1, we found the majority of SBSE alumni are employed in academia (64.6%) and the for-profit sector (27.5%). The remaining 8.1% work in government (5.0%) and nonprofit (2.9%) sectors (Figure 7a). This is different from STEM alumni, for whom similar percentages worked in academia and the for-profit sector. Still, over a third of SBSE alumni move on to careers outside of academia. Tier-2 (Career Type) shows that alumni engage in careers that are discipline-related (39.2%) and primarily teaching (38.3%). Approximately 18.9% engage in careers that are primarily research and a small percentage in careers not related to their Ph.D. discipline (3.6%) (Figure 7b).

For Tier-3 (Job Functions), we find that seven primary job functions describe the work of 86.1% of WSU’s SBSE’s alumni: faculty tenure/tenure track (35.9%), healthcare provider (15.1%),  administration (11.2%), business development, consulting, and strategic alliances (6.7%), research staff or technical director (6.2%), full-time teaching staff/instructor (6.0%), part-time teaching staff/adjunct (5.0%) (Figure 7c). The remaining 13.9% of SBSE alumni are engaged in job functions that have fewer than 4% alumni in each.

Demographics Characteristics and Employment Sector (Tier 1)

Approximately 92.1% of SBSE alumni are engaged in either academia or for-profit sectors. For the SBSE alumni, unlike STEM graduates, the pattern of employment sector did not significantly change over time, Χ2 (6, N = 418) = 3.96, p = .68. The percentage of SBSE alumni in academic and for-profit careers appears relatively stable across the three time windows. Note that as discussed earlier, the trajectory of each alumnus over a 15-year time period is not reported. Rather, we show aggregate alumni employment data in each time window grouped by years following graduation. For example, a student who graduated in 2006 would be represented in the 6–10 year block only.

In addition, for SBSE alumni we do not see the same gender and race differences we find for STEM alumni. In SBSE fields, men and women did not significantly differ in employment sector, Χ2 (3, N = 418) = 2.11 p = .55. Racial group distributions were similar across employment sector, Χ2 (6, N = 412) = 10.85, p = .09. Also, as with STEM alumni, employment sector was not associated with citizenship status, Χ2 (3, N = 418) = 5.59, p = .13.

Demographics Characteristics and Career Type (Tier 2)

For SBSE alumni, the majority are split between careers that primarily involve teaching and other discipline-related career types. As in the case of SBSE Tier 1 employment sector, the distribution of career types did not significantly change over time, Χ2 (6, N = 418) = 5.30, p = .51. There were no significant gender differences in career types, Χ2 (3, N = 418) = 5.82, p = .12. Racial group distributions were similar across career types, Χ2 (6, N = 412) = 8.27, p = .22. Nor was career type associated with citizenship status, Χ2 (3, N = 418) = 4.62, p = .20. To summarize, career types – whether primarily teaching, primarily research, discipline-related or not related to discipline of study– did not vary for SBSE doctoral alumni with respect to gender, race, or citizenship status.

CST2018-117-MaryE.WoodUSA_Figure7

Figure 7. SBSE Doctoral Alumni Career Outcomes by Tier

Demographics Characteristics and Job Function (Tier 3)

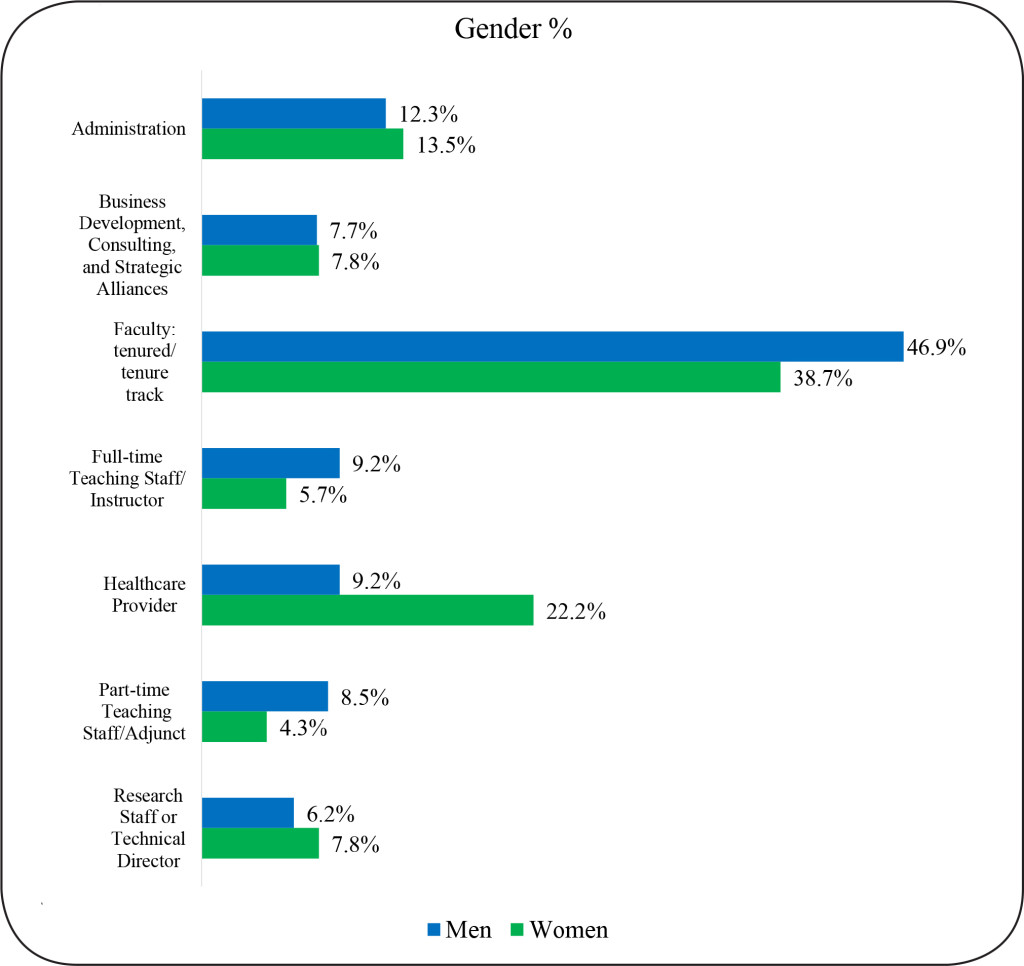
For job function, as with employment and career type, we find no statistically significant changes in the proportions of alumni in different job functions over our three time windows, Χ2 (12, N = 360) = 13.08 p = .36. However, there was a significant Chi-square for gender, Χ2 (6, N = 360) = 13.65, p = .03 in the job function category of healthcare provider. Specifically, our data show that women are more likely to work as health care providers than men. (Figure 8).

CST2018-117-MaryE.WoodUSA_Figure8

Figure 8. SBSE Doctoral Alumni Job Function by Gender

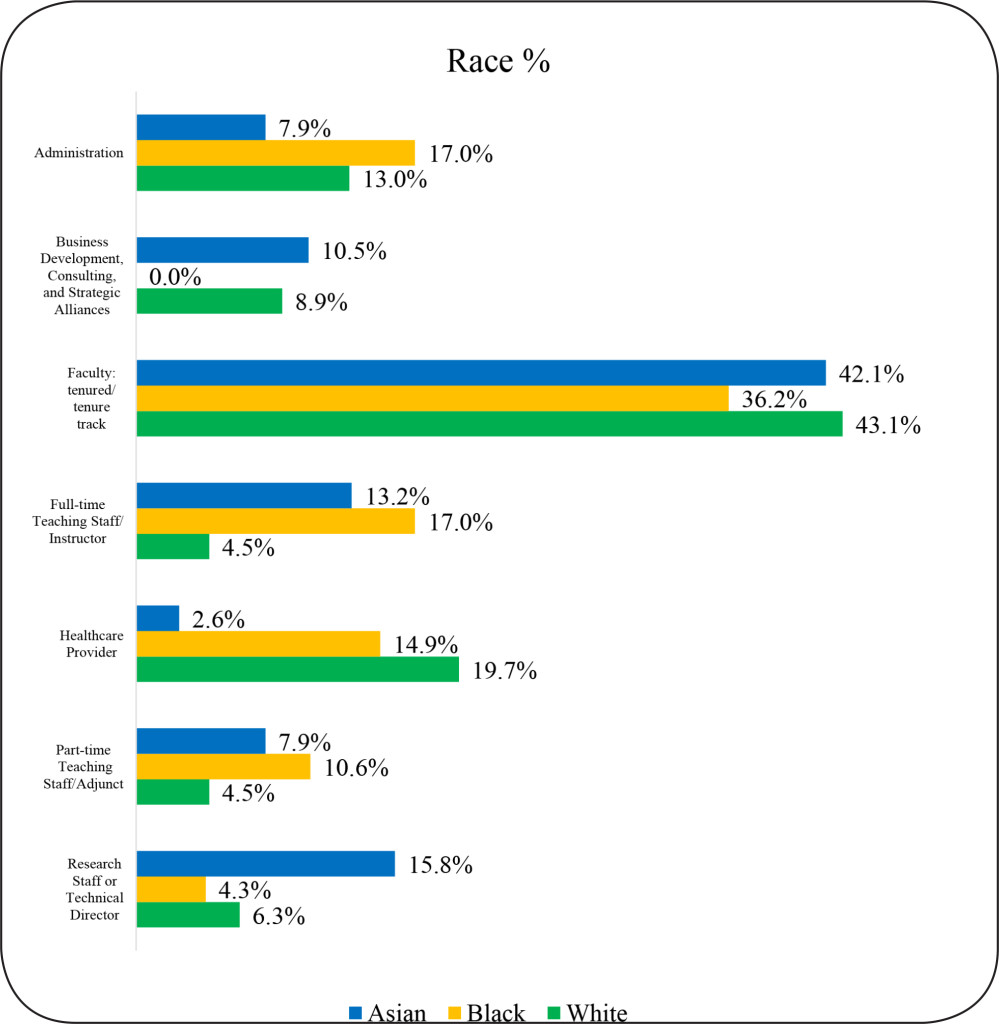
There were also some significant racial group differences in job functions, Χ2 (12, N = 354) = 31.1, p = .002 (Figure 9). White alumni were more likely than Asian alumni to work as healthcare providers. White alumni were also more likely to hold full-time teaching staff/instructor position than Black alumni. Note that Figure 9 depicts the overall percentage of alumni within the seven top job functions with respect to racial demographics. Although White alumni held 50% of the positions reported for full-time teaching staff/instructor job functions, only 4% of White alumni were represented in this category overall.  However, 17% of black alumni are represented in these job functions. There were no significant citizenship group differences in job functions, Χ2 (6, N = 360) = 8.35, p =.21

CST2018-117-MaryE.WoodUSA_Figure9

Figure 9. SBSE Doctoral Alumni Job Function by Race

SBSE Academic Performance Indicators and Employment Sector

We examined the association of academic characteristics with career outcomes in only the two largest employment sectors of “Academia” and “For-profit”, since participation in other sectors is too small to allow for meaningful comparisons.

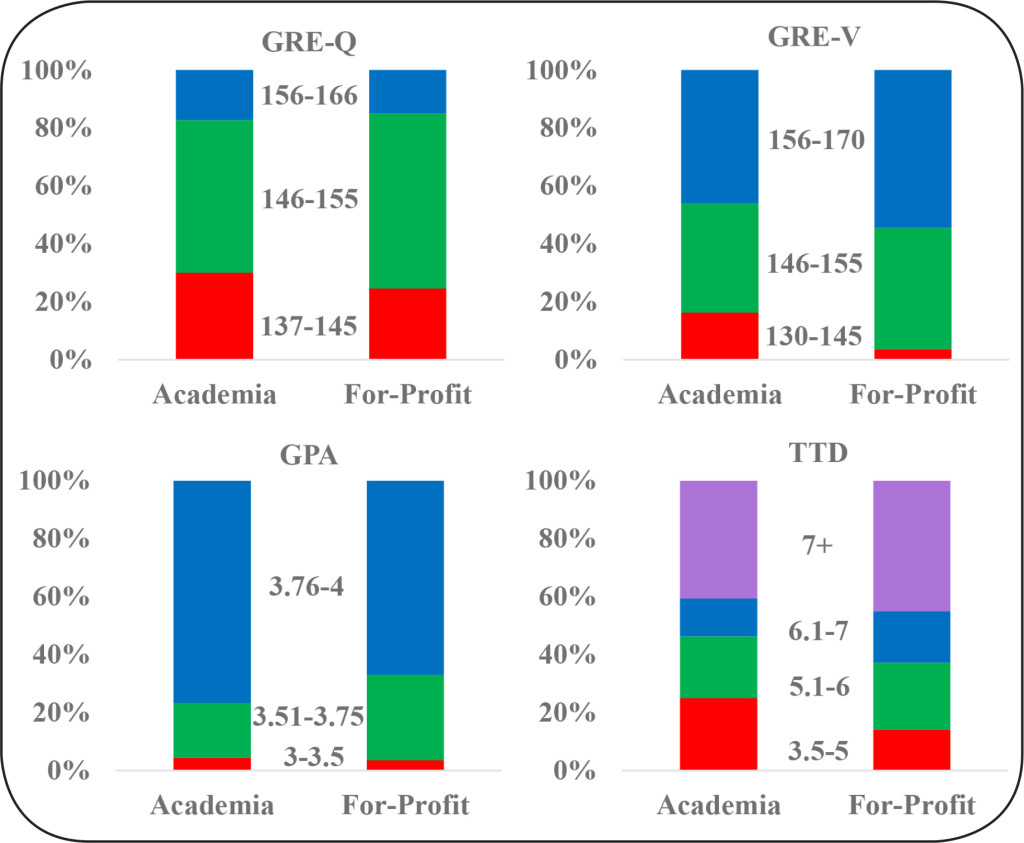
Interestingly, we found no statistically significant differences in any of the academic characteristics examined between alumni in academia and for-profit sectors. An equivalent spread of GRE-Quantitative scores, GRE-Verbal scores, cumulative GPA, and Time-to-Degree completion of alumni between these sectors is shown (Figure 10). Thus, we can conclude that these traditional performance metrics tell us little about what career path our alumni are likely to take.

CST2018-117-MaryE.WoodUSA_Figure10

Figure 10. SBSE Doctoral Alumni Academic Performance Indicators and Employment Sector

Discussion

In this paper, we have investigated the 15-year career trajectories of STEM and SBSE doctoral alumni of Wayne State University, a comprehensive research university in Detroit, Michigan. The findings of our study have implications for how higher education institutions approach training and advising for Ph.D. students.

First, our findings confirm exiting studies that show that today’s doctoral students pursue diverse career trajectories – not just tenured positions in the academy. This indicates that we should be advising doctoral students in STEM and SBSE fields about diverse career pathways they might pursue after the Ph.D. Universities should take steps to prepare doctoral students for success not just in academia, but in other areas, particularly the for-profit sector.

As suspected, a common theme throughout the data for STEM alumni was the different career paths for men and women. Our findings show that for employment sector and career type, women were more likely to work in academia in primarily teaching roles, while men were more likely to work in the for-profit sector and in science-related positions. This is further reflected in the job function outcomes in which women worked as faculty whereas men pursued positions such as group leader.

The finding that women in STEM fields were more likely to pursue careers in academia is interesting and encouraging.   Research has consistently shown that women and minorities are underrepresented in STEM [26]. This trend is reflected in our 15-year Ph.D. alumni data: in STEM fields, the sample included 76% men compared to 24% women (Table 2). The need to increase diversity in STEM fields is an issue that has been identified at both the national level and at Wayne State [27]. Recognizing these disparities, WSU has actively sought to increase the representation of women and minorities in STEM fields through programs such as the NIH BUILD (Building Infrastructure Leading to Diversity) program, Wayne Med Direct and the Postdoctoral to Faculty Transition (PFT) fellowship. WSU provides support and training to current students and early career scholars to produce a pipeline of underrepresented students for doctoral training and faculty positions in a range of disciplines [28].

As expected, the data does suggest that a majority of SBSE alumni follow more traditional pathways with alumni securing academic positions at greater levels than those in STEM disciplines.  Overwhelmingly, SBSE alumni are working in academia, in both tenured/ tenure-track positions and non-tenured roles (adjuncts or full-time instructors).  We found that White alumni are more likely to hold non-tenure track positions than Asians and Black alumni. The percentage of SBSE alumni in non-tenured roles can be viewed from a number of different perspectives. On one hand, part-time and adjunct teaching offer less job security and upward mobility than tenured/tenure-track positions. However, some PhDs, such as those embarking on a second career or preferring a part-time position, may view non-tenured positions as offering more flexibility.

In conclusion, both STEM and SBSE students will clearly benefit from early advising about diverse career pathways.  There are some statistically significant gender differences and a few differences by race, but, in general, our research demonstrates that Ph.D. students of diverse backgrounds seek a wide array of career pathways.  Citizens and non-citizens are equally likely to pursue a variety of career tracks and job functions.

Furthermore, any preconceived notions that graduate schools, graduate program or faculty advisors might hold about who might and might not succeed in the “traditional” tenure/tenure-track academic career based on academic performance metrics should be discarded. Students with higher and lower scores on traditional academic metrics used to evaluate applicants and evaluate student progress to degree show practically no difference in terms of the likelihood that alumni will pursue different types of careers.

For graduate schools, data on the career trajectories of doctorate holders should shape training and advising. For doctoral students and Ph.D. holders, transparency about diverse career pathways can help them to envision and explore career paths that best fit their interests and needs. We hope that attention to these matters will alleviate some of the stress inherent in the pursuit of a Ph.D. and contribute to higher rates of career satisfaction and well-being for doctoral alumni over the course of their careers.

Contributors: N/A

Acknowledgements: The authors wish to thank Drs. Mark Byrd, Christine Chow, Andrew Feig and Song Yan for their assistance in data collection; and Prassanna Viswanathan for data validation and visualization.

Units of Measurement: N/A

Abbreviations & Symbols: N/A

Competing interests: The authors declare that they have no competing interests.

Funding information: This work was supported by the National Institutes of Health; Grant number: DP7 0D01842; URL: nih.gov; and Wayne State University to AM. The funders had no role in study design, data collection and analysis, decision to publish, or preparation of the manuscript.

References

  1. Evans TM, Bira L, Gastelum JB, Weiss LT, Vanderford NL, et al. (2018) Evidence for a mental health crisis in graduate education. Nat Biotechnol 36: 282–284. [crossref]
  2. National Science Board Science and Engineering Indicators 2018: Table 3-16 Employed SEH doctorate recipients holding tenured and tenure-track appointments at academic institutions, by field of and years since degree: Selected years, 1993–2015.
  3. National Science Board (2018) SEH doctorates in the workforce: 1993–2013.
  4. Tilghman S, Rockey S, Degen S, Forese L, et al. (2012) Biomedical research workforce working group report.
  5. Alberts B, Kirschner MW, Tilghman S, Varmus H (2014) Rescuing US biomedical research from its systemic flaws. Proc Natl Acad Sci U S A 111: 5773–5777. [crossref]
  6. Morrison E, Rudd E, Merad M (2011) Early careers of recent US Social Science PhDs. Learning and Teaching 4: 6–29.
  7. Cyranoski D, Gilbert N, Ledford H, Nayar A, Yahia M (2011) Education: The PhD factory. Nature 472: 276–279. [crossref]
  8. Roach M, Sauermann H2,3 (2017) The declining interest in an academic career. PLoS One 12: e0184130. [crossref]
  9. Sauermann H, Roach M (2012) Science PhD career preferences: levels, changes, and advisor encouragement. PLoS One 7: e36307. [crossref]
  10. Fuhrmann CN, Halme DG, O’Sullivan PS, Lindstaedt B (2011) Improving Graduate Education to Support a Branching Career Pipeline: Recommendations Based on a Survey of Doctoral Students in the Basic Biomedical Sciences. CBE Life Sciences Education 10: 239–249.
  11. Gibbs KD, Griffin KA (2013) What do I want to be with my PhD? The roles of personal values and structural dynamics in shaping the career interests of recent biomedical science PhD graduates. CBE Life Sciences Education 12: 711–723.
  12. Council of Graduate Schools, Educational Testing Service. Pathways Through Graduate School and Into Careers.
  13. Denecke D, Kent J, McCarthy MT (2017) Articulating learning outcomes in doctoral education.
  14. Mathur A, Cano A, Kohl M, Muthunayake NS, et al. (2018) Visualization of gender, race, citizenship and academic performance in association with career outcomes of 15-year biomedical doctoral alumni at a public research university. PLoS One 13: e0197473.
  15. Blank R, Daniels RJ, Gilliland G, Gutmann A, Hawgood S, et al. (2017) A new data effort to inform career choices in biomedicine. Science 358: 1388–1389. [crossref]
  16. Xu H, Gilliam RST, Peddada SD, Buchold GM, et al. (2018) Visualizing detailed postdoctoral employment trends using a new career outcome taxonomy. Nat Biotechnol 36: 197–202.
  17. Ortega ST, Kent JD. What is a PhD? Reverse-Engineering Our Degree Programs in the Age of Evidence-Based Change. Change: The Magazine of Higher Learning 50: 30–36.
  18. Feig AL, Robinson L, Yan S, Byrd M, et al. (2016) Using Longitudinal Data on Career Outcomes to Promote Improvements and Diversity in Graduate Education. Change: The Magazine of Higher Learning 48: 42–49.
  19. Silva EA, Des Jarlais C, Lindstaedt B, Rotman E, et al. (2016) Tracking Career Outcomes for Postdoctoral Scholars: A Call to Action. PLOS Biology 14: e1002458.
  20. The Stanford University PhD Alumni Employment Project (2018) Stanford University.
  21. Vanderbilt University School of Medicine. IGP and QCB Admissions and Outcomes Data. University of North Carolina. Alumni Career Outcomes.
  22. Alumni Career Outcomes (2017) University of North Carolina.
  23. Mathur A, Brandt P, Chalkley R, Daniel L, et al. (2018) Evolution of a Functional Taxonomy of Career Pathways for Biomedical Trainees. Journal of Clinical and Translational Science 2: 63–65.
  24. McCarthy MT (2017) Promising practices in humanities PhD professional development: Lessons learned from the 2016–2017 Next Generation Humanities PhD Consortium.
  25. Mathur A, Chow CS, Feig AL, Kenaga H, et al. (2018) Exposure to multiple career pathways by biomedical doctoral students at a public research university. PLOS ONE 13: e0199720.
  26. Leshner A, Scherer L editors (2018) Graduate STEM Education for the 21st Century. Washington DC: The National Academies Press
  27. National Science Board (2018) Science and Engineering Indicators.
  28. Wayne State University (2018) Scientific Training, Workforce Development and Diversity – Key Initiatives.

Appendix S1: Three Tier Taxonomy

Tier 1: Employment Sectors

Tier 2: Career Types

Tier 3: Job Functions

Academia

Primarily Research

Administration

Government

Primarily Teaching

Business Development, Consulting, and Strategic Alliances

For-Profit

Science-related

Clinical Research Management

Nonprofit

Not-related to science

Clinical Services

Other

Further training or education

Data Science, Analytics, and Software Engineering

Entrepreneurship

Faculty: non-tenure track

Faculty: tenured/tenure track

Faculty: track unclear or not applicable

Full-time Teaching Staff/Instructor

Group Leader (research)

Healthcare Provider

Intellectual Property and Law

Part-time Teaching Staff/Adjunct

Postdoctoral Research

Regulatory Affairs

Research Staff or Technical Director

Sales and Marketing

Science Education and Outreach

Science Policy and Government Affairs

Science Writing and Communication

Technical Support and Product Development

Completing further education or training

Other

Deceased/retired

Appendix S2

CST2018-117-MaryE.WoodUSA_Figure11

CST2018-117-MaryE.WoodUSA_Figure12

CST2018-117-MaryE.WoodUSA_Figure13

CST2018-117-MaryE.WoodUSA_Figure14

CST2018-117-MaryE.WoodUSA_Figure15

CST2018-117-MaryE.WoodUSA_Figure16

CST2018-117-MaryE.WoodUSA_Figure17

CST2018-117-MaryE.WoodUSA_Figure18

CST2018-117-MaryE.WoodUSA_Figure19

CST2018-117-MaryE.WoodUSA_Figure20

CST2018-117-MaryE.WoodUSA_Figure21

CST2018-117-MaryE.WoodUSA_Figure23

CST2018-117-MaryE.WoodUSA_Figure22

CST2018-117-MaryE.WoodUSA_Figure24

CST2018-117-MaryE.WoodUSA_Figure25

CST2018-117-MaryE.WoodUSA_Figure26

CST2018-117-MaryE.WoodUSA_Figure27

Single versus Double Chest Tube Drainage after Thoracotomy for Cancer

DOI: 10.31038/CST.2018342

Abstract

Background

After pulmonary lobectomy, two chest tubes are traditionally placed: an apical tube for air evacuation and a diaphragmatic tube for fluid drainage. This study investigates whether one apical chest tube is as effective as two chest tubes after lobectomy.

Methods

Between July 2008 and November 2009, 40 consecutive patients with lung cancer underwent thoracotomy and lobectomy. The initial 20 patients had two chest tubes placed while the latter 20 patients had a single chest tube. All 40 patients had epidural catheters placed.

Results

The groups were similar in demographics, comorbidities, lobe resected, and lung pathology. Length of stay, chest tube days, and chest tube drainage were less in the single tube group; however, they did not achieve statistical significance. Similarly, post-operative airleak and residual pneumothorax after tube removal were not significantly different but were less in the single tube group. While the post-operative day to oral pain control was similar in the single and double chest tube groups, postoperative pain as assessed by the VAS pain scale was lower in the single tube group each of the first four PODs with the difference achieving significance on postoperative days 3 (3.6 ± 0.5 versus 5.9 ± 0.5) and 4 (3.2 ± 0.6 versus 5.4 ± 0.6).

Conclusion

Single apical chest tube drainage after thoracotomy for lobectomy is as effective as apical and diaphragmatic double tube drainage. Single tube drainage improves patient’s postoperative comfort and may result in less chest tube drainage, fewer chest tube days, and a shorter hospital stay.

Introduction

The classic mantra in thoracic surgery has always included the use of two chest tubes after pulmonary lobectomy. One chest tube is placed in the apex of the chest for air drainage while the other is placed along the diaphragm for fluid drainage [1]. Recently there have been reports, are randomized, substituting the double chest tube approach for a single chest tube after surgery [2–5].

The theoretical advantage of a single chest tube would be less drainage and subsequently earlier chest tube removal as well as decreased pain. Reducing post-operative pain can allow patients to ambulate earlier, which can avoid complications such as pneumonia and deep vein thrombosis. It also encourages the use of incentive spirometry and pulmonary toilet [6]. All of these advantages can lead to shorter hospital stay and decreased cost. Of course, there are potential disadvantages to using a single tube. Due to inadequate drainage of either air or fluid, there is the potential for having a residual pneumothorax or a loculated fluid collection after tube removal.

This study includes patients undergoing thoracotomy for lobectomy with mediastinal lymph node dissection who have a diagnosis of cancer. The aim of the study is to identify if single chest tube placement will result in less chest tube drainage, decreased overall pain, and subsequently shorter hospital stays.

Methods

Setting

Karmanos Cancer Institute/Detroit Medical Center is a large academic, tertiary care center affiliated with Wayne State University School of Medicine. It is located in Detroit, Michigan and has a wide referral base from southeastern Michigan.

Patients

We obtained IRB approval: HIC#035410MP4E, protocol #1003008149. In a retrospective fashion, we identified 40 consecutive patients from July 1, 2008 through November 30, 2009 who had a diagnosis of lung cancer and subsequently underwent a standard posteriolateral thoracotomy and lobectomy with mediastinal lymph node dissection by a single surgeon after IRB approval. None of these patients had preoperative chemotherapy or radiation treatment. The first 20 patients had a straight #32 French chest tube (Covidien, Mansfield, MA) as well as a curved #28 French chest tube placed after lobectomy. The second 20 patients had a single straight apical #32 French tube placed. All patients were adults. Preoperatively, all 40 patients had epidural catheters placed for post-operative pain control. These catheters remained in place for 72 hours along with a Foley catheter which was placed after the induction of anesthesia. Preoperative antibiotics were also given approximately one hour prior to skin incision.

Data Collection

Medical records including inpatient charts, electronic medical records, operative reports, laboratory data, and radiographic data and images were reviewed for all 40 patients in a retrospective manner. Data was collected on demographics, associated comorbidities, stage of lung cancer, side of tumor and pre-operative Pulmonary Function Tests (PFTs). We also collected outcome data including total chest tube output, total chest tube days, days of chest tube airleak, total hospital stay, and complications. Post-operative pain information gathered included days to oral pain control and patient reported pain based on the Visual Analogue Scale (VAS) pain scale from 1–10 as collected from a similar pool of nurses. Scores were collected every six hours prior to any bolus pain medication.

Definitions

Comorbidities were defined based on previous diagnosis by primary care physicians. Complications were defined as follows. Smoking was defined as greater than 15 pack-years with the average in our patients being 30 pack-years and the maximum 75. Prolonged airleaks were defined as airleaks lasting longer than 7 days. Residual pneumothorax was defined as a pneumothorax seen on upright chest X-ray after chest tube removal. Pneumonia was defined as either positive sputum cultures or changes on X-ray with appropriate patient symptoms and elevated WBC count. Arrhythmias were recorded when they required treatment. Chest tube management was similar in all patients. Patients were on suction until there was no evidence of airleak with cough or Valsalva. Removal was based on output of less than 200cc per day (currently we use less than 400cc per day).

Data Analysis

Data was entered into a Microsoft Excel spreadsheet for analysis. Categorical variables were compared using chi-square or Fisher’s exact test where appropriate while continuous variables were compared using the Student t-test with Bonferroni correction when using multiple comparisons. All statistical tests were 2-tailed and a p value of <0.05 was considered statistically significant.

Results

Patient demographics were identified in our 40 patients and are shown in table 1. There was a predominance of female patients (82%) and white patients (75%), though they were similar in both the single and double chest tube groups. The average age was approximately 65 in both groups with the single chest tube groups having slightly more patients greater than 70 years of age (7 vs 4). Comorbid conditions such as hypertension, diabetes mellitus, Chronic Obstructive Pulmonary Disease (COPD), Coronary Artery Disease (CAD), and a previous diagnosis of cancer were also similar in both groups. While there were slightly more smokers in the double chest tube group (16 vs 19), this was not statistically significant.

Table 1. Preoperative Characteristics.

Single tube

Double tube

p value

Age

65.4 ± 9.8

65.0 ± 10.0

NS

Sex (M:F)

3:17

3:17

NS

Resection

Upper

10

10

NS

Middle

1

1

NS

Lower

8

8

NS

Bilobe

1

1

NS

Tumor Side

NS

Right

13

14

NS

Left

7

6

NS

Associated disease (#)

COPD

3

5

NS

CAD

7

7

NS

Smoker

16

19

NS

PFT (%)

FEV1

81.7 ± 18.0

80.3 ± 16.9

NS

FVC

87.4 ± 22.1

88.4 ± 10.5

NS

DLCO

65.6 ± 12.2

68.3 ± 19.0

NS

The pre-operative stage of the cancer showed that all patients were either stage I or II while the post-operative stage was similar except that one patient in the single group and two patients in the double group were identified as stage III due to positive mediastinal nodes that were not identified on preoperative scanning. Our lymph node dissections typically yield around 10 lymph nodes. The tumors were predominantly right-sided (65% single chest tube and 70% double chest tube) and mostly in the upper followed by lower lobes. All patients had pre-operative pulmonary function test including a FEV-1, FVC, and DLCO which were similar in both groups.

Outcomes measured are shown in Table 2. Days of chest tube airleak (2.2 ± 0.7 vs. 2.9 ± 0.7), total chest tube drainage (1971 ± 170 mL vs. 2201 ± 231 mL), and total chest tube days (5.9 ± 0.5 vs. 6.9 ± 0.6) were all less in the single chest tube group versus the double chest tube group. Still, statistical significance was not achieved. Overall patient length of stay was similar (7.8 ± 0.8 vs. 7.9 ± 0.7). In terms of complications, arrhythmias, chyle leaks, and pneumonias were similar. Though prolonged airleak and residual pneumothorax after tube removal were not significantly different, they occurred less in the single versus the double tube group (1 vs. 3 and 0 vs. 2 patients, respectively).

Table 2. Comparison of postoperative characteristics, complications, and pain scores.

Variable

Single tube

Double tube

p value

Days of airleak

2.2 ± 0.7

2.9 ± 0.7

0.450

Chest tube days

5.9 ± 0.5

6.9 ± 0.6

0.238

Total chest tube drainage (mL)

1971 ± 170

2202 ± 231

0.418

Length of stay (days)

7.8 ± 0.8

7.9 ± 0.7

0.920

Prolonged airleak

1

3

0.343

Arrythmia

4

2

0.410

Chyle leak

1

0

1.000

Pneumonia

2

3

0.663

Residual airspace

0

2

0.487

Days to oral pain control

3.9 ± 0.3

4.4 ± 0.2

0.164

VAS score

POD 1

6.2 ± 0.6

7.0 ± 0.6

0.400

POD 2

5.4 ± 0.7

6.7 ± 0.4

0.112

POD 3

3.6 ± 0.5

5.9 ± 0.5

0.009

POD 4

3.2 ± 0.6

5.4 ± 0.6

0.013

Total days to oral pain control again showed a similar pattern with fewer days in the single group (3.9 ± 0.3 vs. 4.4 ± 0.2) but again, statistical significance was not achieved. We then assessed postoperative pain using the VAS pain scale. This analysis showed that on Post-Operative Day (POD) 1 and 2 there was less pain in the single group (6.2 vs. 7.0 and 5.4 vs. 6.7) that was not significant. However, on POD 3 and 4 this pattern achieved significance with the single tube group reporting less pain than the double group (3.6 vs. 5.9 and 3.2 vs. 5.4, p<0.02 for each).

Discussion

Double chest tube placement has been the standard in thoracic surgery with one tube placed anterior and apical while the other is placed posterior and basal for fluid drainage. The timing of removing these tubes has more recently been challenged. For example, an output as high has 450 mL/day has been shown to be safe for removal of chest tubes after pulmonary resections [7]. Thus, total chest tube output may not be a useful outcome measure in light of this study. Still, it would be expected that two chest tubes would have more drainage than a single chest tube. Given the high absorptive capacity of the pleura and the lack of complications after early tube removal it is likely that a single tube will suffice in this regard. In fact, continued drainage may simply add to fluid loss that may not be beneficial.

Air leak is another factor that may keep chest tubes in longer than anticipated. We used underwater suction for the first day post-operatively and then as needed based on the presence of an airleak. Suction has the theoretical advantage of promoting lung expansion. Suction via a single tube has been shown to deliver equivalent intrapleural pressure as suction through dual chest tubes [8]. However, suction or waterseal has been shown to be equivalent in terms of post-operative airleak after thoracotomy [9]. Certainly being attached to wall suction limits your ability to ambulate.

Further study has been done looking specifically at the type of tube used. In our study, we used the standard rigid 32 French chest tubes. Others have shown that using more flexible Blake (Ethicon, Somerville, NJ) tubes are equivalent in terms of patient outcome [10] and using these tubes may further increase patient comfort. Further, small tubes such as 24 or 28 French are often used. However, 32 French tubes were used in both groups so no bias was introduced.

Alex et al. first used single chest tubes and found no difference in post-operative outcomes but reported overall less pain in the single tube group [4]. It is not clear in this study if all patients underwent mediastinal lymph node dissection. Another European group showed no difference in outcomes and reported less analgesia use in the single group 2 though this group included patients with sleeve resections and chest wall resections in addition to lobectomy. Two years later it was shown that a single chest tube reduces hospital costs due to a shorter hospital stay as compared to using two chest tubes [5]. Most recently, Okur et al. compared single and double chest tubes in terms of pain scale though their group was not limited to cancer pathologies [3]. Further, this study excluded patients if the surgeon expected increased postoperative output.

Interestingly, these studies all reported their total chest tube drainage to be less than typically seen at our institution leading us to investigate our patient population. This difference could be the result of stapling devices used or a particular sealant used in the operating room. To the author’s knowledge, this is the first North American-based study that compares single versus double chest tube placement in patient undergoing thoracotomy for lobectomy and mediastinal lymph node dissection for a diagnosis of cancer. The inclusion of a lymph node dissection has the possibility of resulting in more post-operative drainage. Further, limiting our study to patients with cancer pathologies avoids the variables patients with infectious or traumatic pathologies add.

Pain has been reported as a major issue among patients with chest tubes after surgery [11]. In fact, reduced pain is one of the advantages cited by those who advocate thoracoscopic lung resection [12]. Respiratory rehabilitation with incentive spirometry and ambulation is important in any postoperative patient including those with chest surgery [6]. This can help control sputum secretion and potentially avoid respiratory complications in the early post-operative period [13]. Therefore, keeping patients comfortable is an important part to their post-thoracotomy recovery [14]. We used epidural catheters placed prior to surgery and removed early on post-operative day three. This plus the use of a single chest tube allowed patients to experience much less pain which should lead to fewer complications.

The VAS pain scale was used in this study to assess the degree of pain experienced by each patient. Of course, pain is a very subjective finding though its importance cannot be overstated. This method is one of the most common ways to assess pain in a hospital setting [15,16]. This scale ranges from 1 (no pain) to a 10 (worst pain) and patients are asked to report a number as they see fit. This is not a perfect method to assess pain since it is subjective and does not take into account the quality of the pain 7. Still, using this method we were able to show that after epidural catheter removal, pain was reported to be less in patients with one chest tube than with two after similar operations.

Single chest tube placement after pulmonary lobectomy for cancer is as effective as double tube placement in terms of chest tube days, total chest tube output, complications after surgery, and total hospital stay. Pain, however, is reported to be less intense if a single chest tube is used which could potentially result in earlier ambulation and fewer complications. While this study only incorporates twenty patients treated similarly in each arm, a larger study may show single chest tube use to be superior. Still, perceived pain is clearly less with a single chest tube. Given these data we recommend single chest tube use on all thoracotomies for cancer unless specific circumstances dictate otherwise.

Acknowledgement

Christopher Gayer did the chart review and analyzed the data.

Frank Baciewicz was the senior author and oversaw the project.

Abbreviations

CAD: Coronary Artery Disease -Disease of coronary arteries to heart resulting from arthrosclerosis

COPD: Chronic Obstructive Pulmonary Disease – Chronic disease of lungs leading to decreased function

PFT: Pulmonary Function Test – Tests done to assess pulmonary function pre-operatively

POD: Post-Operative Day – Days after operation

VAS: Visual Analogue Scale – A patient-reported pain scale from 1–10

References

  1. Khan IH, Vaughan R (1999) A national survey of thoracic surgical practice in the UK Int J Clin Pract 53: 252–256. [crossref]
  2. Gomez-Caro A, Roca MJ, Torres J (2006) Successful use of a single chest drain postlobectomy instead of two classical drains: a randomized study. Eur J Cardiothorac Surg 29: 562–566.
  3. Okur E, Baysungur V, Tezel C, Sevilgen G, Ergene G, et al. (2009) Comparison of the single or double chest tube applications after pulmonary lobectomies. Eur J Cardiothorac Surg 35: 32–35. [crossref]
  4. Alex J, Ansari J, Bahalkar P (2003) Comparison of the immediate postoperative outcome of using the conventional two drains versus a single drain after lobectomy. Ann Thorac Surg 76: 1046–1049.
  5. Pawelczyk K, Marciniak M, Kacprzak G (2007) One or two drains after lobectomy? A comparison of both methods in the immediate postoperative period. Thorac Cardiovasc Surg 55: 313–316.
  6. Ochroch EA1, Gottschalk A (2005) Impact of acute pain and its management for thoracic surgical patients. Thorac Surg Clin 15: 105–121. [crossref]
  7. Cerfolio RJ, Bryant AS (2008) Results of a prospective algorithm to remove chest tubes after pulmonary resection with high output. J Thorac Cardiovasc Surg 135: 269–273.
  8. Brunelli A, Cassivi SD, Fibla J, et al. Pleural pressure immediately after pulmonary lobectomy: single versus double chest tubes for suction. J Thorac Cardiovasc Surg; 140: 52–53.
  9. Alphonso N, Tan C, Utley M (2005) A prospective randomized controlled trial of suction versus non-suction to the under-water seal drains following lung resection. Eur J Cardiothorac Surg 27: 391–394.
  10. Icard P, Chautard J, Zhang X, Juanico M, Bichi S, et al. (2006) A single 24F Blake drain after wedge resection or lobectomy: a study on 100 consecutive cases Eur J Cardiothorac Surg 30: 649–651. [crossref]
  11. Shalli S, Saeed D, Fukamachi K, Gillinov AM, Cohn WE, et al. (2009) Chest tube selection in cardiac and thoracic surgery: a survey of chest tube-related complications and their management. J Card Surg 24: 503–509. [crossref]
  12. Nicastri DG, Wisnivesky JP, Litle VR, et al. (2008) Thoracoscopic lobectomy: report on safety, discharge independence, pain, and chemotherapy tolerance. J Thorac Cardiovasc Surg 135: 642–647.
  13. Bonde P, McManus K, McAnespie M, McGuigan J (2002) Lung surgery: identifying the subgroup at risk for sputum retention. Eur J Cardiothorac Surg 22: 18–22. [crossref]
  14. Savage C, McQuitty C, Wang D, Zwischenberger JB (2002) Postthoracotomy pain management. Chest Surg Clin N Am 12: 251–263. [crossref]
  15. Scott J, Huskisson EC (1976) Graphic representation of pain. Pain 2: 175–184. [crossref]
  16. DeLoach LJ, Higgins MS, Caplan AB, et al. (1998) The visual analog scale in the immediate postoperative period: intrasubject variability and correlation with a numeric scale. Anesth Analg 86: 102–106.

Global Healthcare Workers Migration: A Human Resource Management Concern

DOI: 10.31038/IMROJ.2018335

Abstract

The World Health Organization estimates a deficit of approximately 2.4 million physicians, nurses, and midwives along with a need for an additional 2 million pharmacists and paramedical professionals. Compounding this crisis for the most vulnerable communities is the phenomenon healthcare worker migration. Both developed and developing nations are struggling to mitigate the immense challenges resulting from the existing shortage combined with increasing demands and diminishing supplies of healthcare providers. WHO established a Global Code of practice with the aim of addressing the growing healthcare worker crisis. United Nations General Assembly passed a resolution calling on the international community to work together towards the creation of 40 million healthcare and social workers with particular focus on the expected 18 million person deficit in healthcare workers by 2030. The WHO’s Global Code of Practice on the International Recruitment of Health Personnel has provided clear benefits in mitigating this growing problem most evident with the creation of 117 national authorities and being used to establish 65 bilateral agreements with respect to health worker development and migration. The healthcare workforce shortage is an ongoing crisis with global ramifications effecting developed and developing nations alike.

Introduction

Shortages within the healthcare workforce represent a growing problem for the Americas. This problem is but a portion of a global crisis. The World Health Organization estimates a deficit of approximately 2.4 million physicians, nurses, and midwives along with a need for an additional 2 million pharmacists and paramedical professionals [1]. Both developed and developing nations are struggling to mitigate the immense challenges resulting from the existing shortage combined with increasing demands and diminishing supplies of healthcare providers [2]. Overall issues are further complicated in that healthcare workers are most sparse in regions in which they are most desperately needed, particularly impoverished, developing nations [2].

Compounding this crisis for the most vulnerable communities is the phenomenon healthcare worker migration. A prime example of this sub-Saharan Africa, which carries 24% of the world’s disease burden, while only have 3% of the global healthcare workforce to combat it, as well as merely 1% of global financial resources to fund any and all health initiatives [1]. The reasons for this migration are multifaceted and in recent history has become increasingly complex [3, 4]. Some factors which contribute to health worker migration include: active recruitment of healthcare workers to wealthy nations at the detriment to their respective home countries or countries in which they were trained, insufficient health systems, poor working conditions, lack of recognition, overwork, low wages in these developing nations [3]. All of these factors contribute to the increasingly low health worker numbers in the most vulnerable countries [3].

In response to this ongoing crisis, the WHO established the Global Code of Practice on the International Recruitment of Health Personnel in 2010. After detailing the aims of this WHO initiative and summarizing its current progress, this review will present both the successes and obstacles to this initiative; then focusing particularly on how implementation has progressed in the Americas. Concluding with an evaluation as to which targeted initiative hold promise in mitigating the disparity in the capabilities with regard to providing healthcare when comparing developed and developing nations.

Global Code of Practice on the International Recruitment of Health Personnel

In 2010, the WHO established a Global Code of Practice with the aim of addressing the growing healthcare worker crisis. The objectives of this code are as follows: to establish and promote voluntary principles and practices for the ethical international recruitment of health personnel, with respect to both source and destination; to create a reference for nations while establishing or improving the infrastructures necessary for international recruitment of health personnel; to provide guidance where appropriate with regards to the formulation and implementation of bilateral and/or multilateral; to facilitate and promote international discussion and advance cooperation related to the ethical international recruitment of health personnel as part of strengthening health systems, with a particular focus on the situation of developing countries [5]. These objectives aim to mitigate the growing health personnel crisis across the globe. The Global Code of Practice outlines several important methods for addressing this growing concern. Overall, the aim is to improve the healthcare workforce globally. Methods for doing so include increasing healthcare education, training, efficiency. The ultimate goal with regards to training and education being to have a system of generate a healthcare workforce which is self-sustaining for each individual nation, as sourcing healthcare workers from other nations inherently places strain on the healthcare system of the source country. Another important aspect is the collection of pertinent data and the establishment oversight bodies to monitor and make recommendations from information collected, and to share this information with international agencies in order to aid with overcoming issues from a more global mindset [5]. This data gathering and international cooperation is especially important for the most vulnerable communities where resources and healthcare work-forces are under the greatest strain [5].

Finally, the Global Code of Practice established in 2010 sought to develop a means of regulating healthcare worker migration in a manner as to aid the most vulnerable nations. It is important to understand that this regulation must be undertaken with respect to any nation’s obligations to its own citizenry as well as with respect to the liberties any particular healthcare worker [5]. Essentially, the goal with respect to healthcare worker migration is to permit the free migration of healthcare workers while encouraging the bolstering of vulnerable healthcare systems and allowing decreasing the limitations of free mobility of health professionals.

Current Progress with Implementation of the Global Code of Practice

Since the establishment of the Global Code of Practice, international consensus is that it has had a positive effect on addressing the health personnel crisis. A recent meeting among high profile entities working with the World Health Organization highlighted some of these factors focusing on international health worker migration [6]. The meeting affirmed that the Global Code of Practice is working to mitigate the health personnel crisis, most effectively by elucidating various problems within the current global state of health worker migration, allowing for discussion to methods of amelioration [6].

Some countries have successfully implemented strategies to drastically increase the production of new health workers. The successes can be used to develop policies in other nations as well as a possible resource of health workers for nations without the capacity for such production [6]. Other policy measures are being implemented at both the national level and with bilateral agreements to create environments with mutually beneficial health worker migration, implementation and improvements to health worker monitoring and management information systems, recruitment health workers to rural communities [6]. The potential of appropriate utilization and integration of refugee health workers and potential training of refugees as health workers.

Challenges to implementation include: differences in populations, capacity to educate new health workers, capability to train health workers with new technologies, impediments to health worker skill recognition, lack of prioritization with regard to specializing training and employment of health worker at the national level, as well as predatory practices in recruiting health workers [6]. Other factors outside a health worker migration such as increasing burden of chronic conditions, anti-globalization sentiments, and growing refugee populations [6].

Presented during the meeting was evidence demonstrating the necessity for a more refined and evidence based approach to addressing the increasing scope and complexity of international health worker migration [6]. This approach is key towards the success of Global Code of Practice being successful. The meeting closed with calling for a third round of National Reporting to the World Health Organization regarding health personnel and health worker migration [6].

With respect to the challenges still clearly evident, the successes of World Health Organization promoted practices is deserving of recognition. Since the adoption of the Global Code of Practice, the world has seen the creation of 117 national authorities dedicated to its implementation as well as the Code being used to establish 65 bilateral agreements with respect to health worker development and migration [7]. The recommendations from information gathered regarding health personnel has also resulted in recognition from the United Nations. In 2016, the United Nations General Assembly passed a resolution calling on the international community to work together towards the creation of 40 million healthcare and social workers with particular focus on the expected 18 million person deficit in healthcare workers by 2030 [8].

National Reporting on Status of Health Personnel Workforce

As outlined in the Global Code of Practice, information gathering and national reporting are integral to implementing, monitoring, and improving efforts to address the health worker shortage. Since the inception of the Code, there have been two rounds of National Reporting. Of the 194 member states 74 submitted National Reports to the World Health Organization in 2016 [7]. This represents a 32% increase in participating nations from the first round of reporting [7]. While the Pan American Health Organization demonstrated a drastic increase between the first and second round of reporting, from 4 to 9 members submitting National reports in 2013 and 2016 respectively; this still represents only 26% of the 35 members [7]. The importance of data gathering cannot be underestimated without inhibiting global and regional efforts to increase the health workforce.

Health Personnel Workforce in the Americas

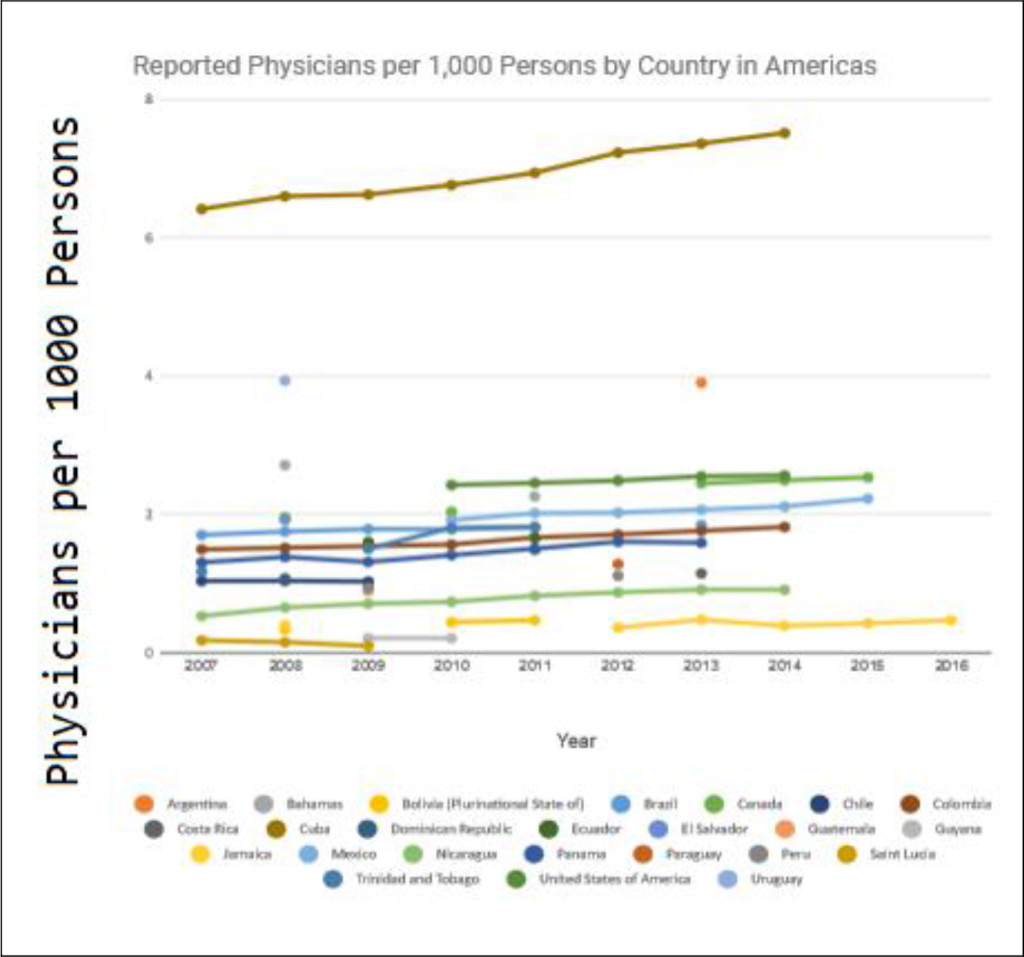
Back in 2005, experts from around the Caribbean and Latin America gather for a conference to discuss and coordinate measures to enact policies of managed migration [14]. An important reason for these efforts is to mitigate the brain drain of professionals form the regions across multiple industries and sectors [14]. Of particular importance was the retention health professionals [14]. The Pan American Health Organization has overseen successes in the implementation of the Global Code of Practice. This is exemplified by the increases in physicians per capita as depicted in Figure 1. Of all the Pan American Health Organization countries which submitted data for multiple years, the vast majority saw improvements. This indicates that monitoring these statistics provides information which can positively inform policy. It also shows which countries are not implement effective policies, which can be seen as a marker for further changes, possibly with a different approach Figure 1 [15].

IMROJ 2018-107 - Satisg Bidaisee WI_F1

Figure 1. Global Health Observatory Statistics

However, the Americas have faced a number of difficulties particularly amongst the poorer nations. To establish a holistic picture of the current state of health personnel shortages and health worker migration in the Americas analyses from three member states: the United States of America, Canada, and El Salvador will serve as examples. These three nations represent both developed and developing countries, as well as presenting health worker shortages in both socialized and privatized health systems.

United States

Prior to the creation of the World Health Organization Code of Practice, the Alliance for International Ethical Recruitment Practices was developed in the United States [9]. The Alliance Code in light of drastic increases in the number of firms actively recruiting foreign nurses. This dramatic and unregulated market created an environment which enable unfair and subversive recruitment practices which disadvantaged incoming healthcare worker migrants coming to the United States [10]. The purpose of the implementing the Alliance Code was to establish minimum standards for employers and recruiters to ensure transparent, reasonable, and ethical practices for contracting international workers in addition to setting goals of best practices respecting health worker rights to labor autonomy while mitigating the detriments encumbered by source countries’ healthcare systems [9]. While the Alliance Code is distinct from the World Health Organization Code of Practice, both share the same aspirations and goals [10]. The World Health Organization Code of Practice is a broad set of guidelines for national and international agencies, while the Alliance Code represents a more narrowed and detailed set of guidelines for a particular aspect of this issue, namely healthcare worker recruitment practices. Since the inception of the Alliance Code the following strategies have been identified as crucial for its ultimate success: a multi-stakeholder approach, realizing the potential impacts of variations in immigration policy, challenges with enforcing compliance with a voluntary set of guidelines, generating understanding of the importance of ethical practice at the level of individual recruitment employees, standardizing credential assessment and certification [10].

Canada

In contrast, Canada has a single-payer healthcare system. As such, the government has a much greater deal of control with regard to ethical recruitment practices. However, government-funded health systems face their own challenges regarding health worker shortages. Since the mid-2000’s the number of immigrating health professionals has been increasing in Canada, particularly physicians and nurses [2]. International health professionals have been vital to Canadian physician resource planning [11]. As a matter of policy, efforts to maintain these trends in order to alleviate the healthcare worker shortage persisted in spite of economic hardship during the global recession, and efforts to improve integration of international health professional are underway [2]. The major threat to continued addressing of the labor shortage in Canada is financial constraints and political climate is trending toward addressing government debts and deficits [2]. The significant and increasing numbers of health migrants to Canada suggests that the nation may be exacerbating shortages in less developed source nations, however evidence shows there is also substantial increases in health professionals trained in Canada preparing to emigrant elsewhere represents a mitigating factor in Canadian overall health worker policy [2]. While compliance with the World Health Organizations’ Code of Practice is a topic in healthcare policy discussions in Canada, current political climate indicates that efforts to address the health professional workforce within Canada, especially in underserved communities seem to be taking priority [2]. While discussions are also underway in Canada to promote the development of education system to create a self-sustaining healthcare environment, the Canadian Medical Association regards international professionals a significant component of Canadian health workforce planning [12, 13].

El Salvador

Moving from the developed countries to developing nations, El Salvador has again its own unique challenges to combatting the healthcare worker shortages. Researchers discuss the legal implications of the World Health Organization Code of Practice and how coordination between national agencies is needed to implement the guidelines [2]. Overall, the understanding with regards to El Salvador is that the Code of Practice is too broad in its scope and lacks concrete definitions which would be necessary for it to be used as a source of regulation. Recommendations propone for the Code to be technically assessed by the Ministry of Health, and for those assessments to be given to lawmakers to enact legislation as would be appropriate to best serve the people [2]. The key difference to be noted is that while El Salvador intends to use government intervention to enact these changes as in Canada, limited resources called for careful assessment prior to implementation [2]. Since El Salvador is a common source country for health workers migrating to more developed countries like Canada and the United States, there is also an emphasis on the components of the Code of Practice relating to retaining health workers with possible policy changes both encouraging health professionals to stay or creating barriers to their emigration, while maintaining respect for individual autonomy [2].

Conclusion

The healthcare workforce shortage is an ongoing crisis with global ramifications effecting developed and developing nations alike. The World Health Organization’s Global Code of Practice on the International Recruitment of Health Personnel has provided clear benefits in mitigating this growing problem most evident with the creation of 117 national authorities and being used to establish 65 bilateral agreements with respect to health worker development and migration [7]. Additionally, in 2016, the United Nations General Assembly passed a resolution calling for the creation of 40 million healthcare and social workers by 2030 [8]. It has been made clear from evidence around the world and shown here across the Americas that addressing the health professional shortage is a complex and multi-faceted endeavor. The more information we gather the better able we are to identify which particular problems are arising in particular regions. Many of the lessons learned thus far can be used to influence further policy developments at the regional, national, international level. One obvious aspect in which the Americas stand to directly benefit is by increasing participation in the next round of National reporting to the World Health Organization. Again, the Pan American Health Organization demonstrated a drastic increase between the first and second round of reporting, from 4 to 9 members submitting National reports in 2013 and 2016 respectively; this still represents only 26% of the 35 members [7]. Increasing the available data will serve both to benefit members of the Pan American Health Organization as well as nations across globe.

References

  1. WHO (2006) Health workers: a global profile. In: The World Health Report 2006 – Working together for health: World Health Organization, Geneva, Switzerland.
  2. WHO (2013) WHO policy dialogue on international health workforce mobility and recruitment challenges: technical report. Copenhagen: The WHO Regional Office for Europe.
  3. Nair M, Webster P (2013) Health professionals’ migration in emerging market economies: patterns, causes and possible solutions. Public Health 35: 157–163.
  4. Taylor AL, Dhillon IS (2011) The WHO Global Code of Practice on the International Recruitment of Health Personnel: The Evolution of Global Health Diplomacy. Global Health Governance Volume: 01
  5. WHO Global Code of Practice for International Recruitment of Health Personnel.
  6. High Level Dialogue.
  7. SDG3.c.1 Health Worker Density and Distribution Health Worker Labour Mobility.
  8. UNGeneral Assembly Resolution.
  9. Alliance for Ethical International Recruitment Practices (2008) Voluntary code of ethical conduct for the recruitment of foreign educated health professionals to the United States. Washington, DC: AEIRP.
  10. Code for ethical international recruitment practices: the CGFNS alliance case study
  11. http://rcpsc.medical.org/publicpolicy/imwc/IMG_Task%20force-poster-FINAL-ENG.pdf
  12. ACHDHR (2009) How many are enough? Redefining self-sufficiency for the health workforce, A Discussion Paper. Canadian Federal/Provincial/Territorial, Advisory Committee on Health Delivery and Human Resources, Ottawa, ON: Health Canada.
  13. CMA and CCCPR (2008) International Medical Graduates in Canada, January 16, Ottawa, ON: Canadian Medical Association and Canadian Collaborative Centre for Physician Resources.
  14. Expert group meeting on international migration and development in Latin America and the Caribbean
  15. Global Health Observatory Statistics

Cross-sectional Study Investigating Texting and Driving in Grenada, West Indies

DOI: 10.31038/IMROJ.2018334

Abstract

Objective

Conduct a cross-sectional study to gather data regarding texting while driving behaviors, identify vulnerable populations, as well as assess public opinions about receptiveness to interventions in Grenada, West Indies. This will inform efforts to curb motor vehicle accidents (MVAs) locally.

Design and Methods

An anonymous 16-item questionnaire assessing cell phone usage while driving was answered by Grenadian drivers recruited from across Grenada. The survey assessed incidence and prevalence of texting while driving, frequency of MVAs involving texting, participant risk perception, demographic data, as well as which interventions are perceived to be effective in reducing texting while driving. Drivers were approached in public car parks and roadsides by the study researchers to obtain their participation.

Results

From 191 survey responses, mean age was 37.05 ±10.038 years. 50.3% admitted to texting while driving. Statistically significant between group differences were documented with variables of gender (females comprise 59% of never texted group vs. comprising only 40% of texting while driving group, p=0.009), mean age (Never texted group39.3 years ± 11 vs. Texted while driving group 34.9 years ± 8, 0.003), and knowing anyone involved in a MVA due to texting while driving (texted while driving group 26% vs never texted group 5%, p≤0.001).

Conclusions

Younger age, male gender, and knowing other drivers who had MVA’s involving texting while driving was associated with increased incidence of person’s texting while driving. Interventions targeting the socially reinforcing effects to these groups, safer technologies, as well as legislation may mitigate texting while driving’s consequence in Grenada.

Introduction

Distracted driving (DD) is devoting a significant amount of time or effort towards a secondary task such that they cannot maintain driving performance at an acceptable level [1]. Distractions can be categorized as visual, auditory, physical, or cognitive, all which impact driver performance. Distractions can also be categorized as internal or external. While non-technological distractions exist, newer technological distractions are more cognitively demanding and time consuming [2]. Individuals using mobile phones are reported to have delayed reaction times to braking, traffic signals, impairing lane positioning, and maintaining safe vehicular distance [1]. The World Health Organization (WHO) suggests that even hands-free devices do not completely alleviate the problem, and texting dramatically increases the risk of MVA [1]. Texting while driving is hazardous in that it requires active cognition to form a message as the driver also physically manipulates the phone. One explanation proposes attention span is limited, and complex secondary tasks force the driver to divide their attention which impedes concentration on driving; while another propones some driving conditions place higher demands on the driver, so they cannot cope with both tasks [3]. A meta-analysis of 28 studies revealed that texting while driving decreased performance relating to: eye movement, stimulus detection, reaction time, maintaining speed, lane positioning, and vehicular control; compromising the safety of everyone on the roadway [4].

Cell phone use while driving is an established major risk factor for MVAs [5]. Drivers using cell phones are four times more likely to be involved in a MVA [1,6,7]. Even more striking, deficits from cell phone use are comparable to driving under the influence of alcohol. Strayer et al. found that while drinkers tended to be more aggressive on the road, cell phone users had greater delays in reaction time [2]. Other studies demonstrate cell phone use interferes with visual and steering capabilities, suggesting a compounding effect of cognitive, visual and physical demands [8].

Who Has Been Impacted?

The WHO estimates that 1.3 million deaths result from MVAs worldwide annually [1,9] According to data from the Fatality Analysis Reporting System collected between 1999–2008, the number of fatalities due to DD decreased between 1999–2005 [5]. However, the number of DD related fatalities grew rapidly by 28% thereafter, which was attributed to increased texting post 2005. Researchers used multivariate analysis to show approximately 16,000 additional fatalities can be attributed to increases in text messaging while driving from 2001 to 2007 [5]. US Department of Transportation National Highway Traffic Safety Administration reported that DD was associated with approximately 421,000 injuries in motor vehicle collisions in 2012, with evidence that smartphone use is increasingly contributing to these incidents [10]. Coinciding with this increase in MVAs due to DD is an increased prevalence of habitual engagement in DD. Participants in surveys who drove experimental routes indicated strong willingness to engage in activities which impaired attentiveness to the task of driving, particularly cell phone use [11]. In 2013, the Center of Disease Control (CDC) compiled data from the 2011 European Styles and Health Styles surveys to compare estimates of cell phone use among drivers in the US and European nations [12]. Among drivers aged 18–64, self-reported cell phone use for making calls while driving in the past 30 days was variable, ranging from 21% in the UK to 69% in the US [12]. Additionally, drivers who admitted to reading or sending text messages while driving at least once in the past 30 days was also variable, ranging from 15% in Spain to 31% in the US [12]. This suggests that among these different countries, willingness to engage in cell phone use is variable, and likely dependent on multiple factors.

Who Texts and Drives and Why?

Many explanations for the motivations behind texting while driving have been developed. Researchers speculate the motivations vary from perceived urgency of the message to the consideration of current risks by the driver [3]. Research by Lerner et al. suggests driver decisions about cell phone use are strongly correlated with the consideration of task motivations [13]. DD is weakly related to driving considerations such as current or predicted road conditions [13]. However, Lerner et al. demonstrated a strong positive correlation between age of the driver, behaviors the driver determined risky, and when they chose to engage in such behaviors, texting being a prime example of risky behavior [13]. Additionally, teen drivers (aged 15–19) were more likely to engage in cell phone use than any other age group [13]. Cell phone use showed a strong linear relationship with the perceived risk of the task [13]. Although there was a weak relationship between willingness and road type; there was a stronger influence of driving task (merging, exits, lane change) [13]. Taken together this evidence suggests a correlation with driver’s willingness to text when the risk is perceived as minimal and their age, coupled with consideration for the driving maneuver difficulty plays an important predictive role.

Cross-sectional and observational studies demonstrate impairment due to cell phone use is particularly prevalent in younger and inexperienced drivers [14–16]. Recent work reports 71.5% of drivers surveyed ages 18 to 24 reporting reading text messages in the last 30 days [17]. This is due to multiple factors such as perceived risk and familiarity with technology. Independent of reason, multiple studies demonstrates younger drivers are more likely text and drive; therefore interventions should be targeted at this demographic.

What Has Been Done About It?

Certain nations such as the UK have curbed texting and driving by banning cell phone use while operating a vehicle [18]. The UK government demands hands-free devices only while the vehicle is in motion and even while its stopped in traffic or at a red light. Additionally, penalties include monetary and incurrence of penalty points [18]. The consequence is more severe with the threat of loss of license if the driver obtained their license two years prior to the incident [18]. In the US, texting is prohibited in 46 states, DC. Puerto Rico, Guam, and the US Virgin Islands for all drivers [7]. However, no state prohibits an “all cell phone” use [7]. It is important to note that the ability to enforce these regulations have proven to be problematic due to the difficulty of apprehending someone texting while driving as compared to other risky behaviors such as speeding and driving while intoxicated [19].

What About Low And Middle-Income Countries?

Investigations in the risks and prevalence of texting while driving has been increasing in recent years. However, relatively little research has focused on the incidence of texting while driving in low and middle-income countries [9]. This is especially surprising considering that the WHO estimates that 90% of road traffic related deaths occur in low and middle-income countries [9]. There are indications that texting while driving poses a significant risk amongst non-Western drivers presented by reports from South Africa and Kuwait [20,21].

Grenada has sparse research into the growing incidence of MVAs as it relates to DD. However, from September to December 1980, data regarding causes of death was collected from the English-speaking Caribbean, which showed MVAs as the fourth leading cause of death [22]. The study revealed MVAs were more likely to involve young males, and associated risk factors were inexperienced drivers and alcohol intoxication [22]. Today concern grows texting while driving represents a novel, growing risk factor for Caribbean MVAs.

The need for data to understand motivations behind DD is necessary to implement effective prevention campaigns and strategies. Recent research from 2015 suggests that there has been an increase in the number of non-fatal crashes in Grenada [6]. However, there has also been an increase from 4.1 to 11.9 per 100,000, in the proportion of fatalities in MVAs in Grenada from 2000–2009 [6]. Researchers speculate that a possible explanation for the increase could be DD, specifically texting while driving.

To address this growing problem in Grenada, we have begun collecting data on traffic accidents and cell phone use. Obtaining this information may be useful in understanding the current social influences on driving behavior to effectively reach and deter the public from DD [2]. This data will assist the national government by informing legislation of opportunities to deter drivers from texting. It will also aid to regional police, healthcare workers, and educators with developing awareness to this public health crisis [2].

Methods

Study Design, Oversight, Participants, and Data Management

Researchers obtained ethical and research clearance from the Institutional review board at St. George’s University in Grenada, while noting a minimal risk of discomfort associated with recollection of MVAs. Additionally, participants gained exposure to risks of texting while driving and insight regarding the risks of engaging in such behavior. No compensation was provided for participants, but it was communicated the information gathered will be provided to RGPF and to potentially inform policy, regulations and legislation.

The survey was a 16 question, anonymous, self-reporting paper questionnaire assessing cell phone usage while driving taking no more than 7 minutes to complete. The survey assesses the frequency of texting while driving and the reported frequency of MVA involving texting, as well as demographic data. The survey also assesses how informed participants are to the risks of texting while driving, current legislation, as well as which interventions they believe will reduce DD behavior. There were 191 motor vehicle drivers from all parishes across Grenada from April 1 through June 30, 2017. Drivers were approached in public car parks as well as roadsides by the study researchers to obtain informed consent for their participation in a survey. The informed consent was verbally obtained from drivers and upon receipt, drivers were presented with the survey to assess their texting and driving behavior.

Survey data was compiled to MS Excel dataset which was stored on a secured computer along with MVA data extracted from RGPF records into a separate MS Excel dataset by the principal investigators to be retained indefinitely. No personal identifiers were included in either dataset to ensure participant anonymity and confidentiality. Original paper surveys are retained in a secure location for five years, after which they will be destroyed.

Results

(Table 1) displays the compiled survey data regarding texting while regarding frequency, prevalence, circumstance, as well as receptiveness to interventions or discouraging factors.

Demographic Data and Overall Characteristics

Sample size was n=191 participants. For the variable of age, 180 valid responses recorded age, ranging from 18 to 64 years of age (mean=37.05 years, std. deviation=10.038 years). Grouping the sample by gender revealed 190 valid responses with men comprising a majority (men=97, 51.1%, women=93, 48.9%). Of 191 responses, 96 (50.3%) answered “yes” to the question “Have you ever texted while driving”, with 95 (49.7%) responding “No”. From 180 valid responses to the question “Have any of the following occurred to someone you know because of texting”, 32 (17.8%) responded that a MVA had almost occurred, 28 (15.6%) responded that a motor vehicle accident had occurred, and 2 (1.1%) had been ticketed. When asked “Are you aware of any local laws pertaining to texting while driving, 75 (41.1%) of the 181 usable responses replied “Yes” while 106 (58.6) replied “No”.

Differences between Groups

Stratifying the sample by texting behavior (Never texted while driving Vs. Ever) revealed statistically significant between group differences in variables: sex, age, and having known anyone in an MVA due to texting. Females were less likely to text while driving (females comprise 59% of never texted group vs. comprising only 40% of texting while driving group, p=0.009.) Mean age of participants who reported never texting while driving was older than those who responded texting while driving behavior (39.3 years ± 11 vs. 34.9 years ± 8, p=0.003. Having known anyone in a MVA due to texting was more strongly associated with the ever texted while driving group. 26% of people who admitted to texting while driving knew someone in texting related accident vs. 5% who never texted while driving knew someone in texting related accident (p=<0.001). No significant intergroup differences were found based on the variable of awareness of current local laws pertaining to texting while driving (43% who never texted were aware of laws vs. 40% who ever texted were aware of laws, p=0.735.)

Discussion

This study examined texting as a risk factor for MVA’s, frequency of negative outcomes from texting while driving, and knowledge and perception of these risks in the location of Grenada, West Indies. Utilizing survey responses to drive descriptive data gathering allowed for examination of risk taking behavior, as well as provided an opportunity for further investigation of possible public health interventions targeted to reduce harm caused by texting and driving.

Compared to females, male drivers were more likely to respond that they did engage in texting while driving (p=0.009), a difference reflected in prior studies examining distracted driving stratified by sex [14, 15, 9, 23–25] .Comparison of the mean ages between those who had never texted while driving versus those who did text while driving revealed that those who never texted while driving were on average 4.6 years older (39.3±11 years, 34.9±8, p=0.003). This is also supported by previous research that suggests that younger drivers are disproportionately affected by DD [14, 16, 17]. Additionally, there is a statistically significant relationship (p<0.001) between those admitting to texting and driving and knowing someone who was involved in a MVA due to texting. This provides evidence that the knowledge of MVAs involving DD, is not a strong deterrent of such behavior. In future studies, investigating the type or extent of the relationship between the texter and the victim of a MVA involving texting may be useful.

Awareness of the illegality and consequences for texting while driving was similar among those who did text and those who did not text while driving (p=0.735). This speaks to larger concerns about whether legislation alone is sufficient to deter DD since such laws cannot be regularly or strictly enforced. However, social influences seem to be connected to DD, as knowing someone who was involved in a MVA due to texting correlated with texting while driving. This may be explained by perceptions of risk while DD is in part reinforced through socialization, thus perpetuating the habit [26,24]. Since young adults are among the highest risk for DD, it is plausible to target primary driver education as a forum to teach how to drive distraction free despite social bias.

Table 1. Survey Data n=191. (Questions 4 through 12 only pertain to those who answered yes to question 1).

1. Ever texted while driving?

Yes

96 (50.3%)

No

95 (49.7%)

No Response

0

2. Are you aware of any local laws pertaining to texting and driving?

Yes

75 (41.4%)

No

106 (58.6%)

No Response

10

3. Any of the following occur to someone You know because of texting?

None

118 (61.8%)

Ticket

2 (1.0%)

Almost Accident

32 (16.8%)

Accident

28 (14.7%)

No Response

11

4. How often do you text while driving?

Rarely

57 (59.4%)

Sometimes

27 (28.10%)

Most of the Time

12 (12.50%)

No Response

0

5. Do you text while the vehicle is in Motion?

Standing Still

28 (29.2%)

In Motion

16 (16.7%)

Both

52 (54.2%)

No Response

0

6. How do you text?

Read Only

21 (22.1%)

Write Only

3 (3.2%)

Both

71 (74.7%)

No Response

0

7. Circumstances you text? Emergency

 44 (47.3)

Directions

7 (7.5%)

Can’t Wait

27 (29.0%)

Boredom

2 (2.2%)

All the Above

13 (14.0%)

No Response

3

8. Do you text when with others or alone?

Alone

57 (60.6%)

With Others

2 (2.1%)

Both

35 (37.2%)

No Response

2

9. Impact on driving ability while texting?

Negative

64 (68.1%)

Not Affected

29 (30.9%)

Positive

1 (1.1%)

No Response

2

10. Emotions about texting while driving?

Guilty

24 (25.3%)

Worried

35 (36.8%)

Neutral

34 (35.8%)

Invincible

2 (2.1%)

No Response

1

11. Is it dangerous to text and drive?

Yes

91 (95.8%)

No

4 (4.2%)

No Response

1

12. Have you ever had any of the following while texting?

None

67 (72.8%)

Ticket

1 (1.1%)

Near Accident

23 (25.0%)

Accident

1 (1.1%)

No Response

4

13. Would any of the following deter you from texting while driving?

Yes

No

No Response

Make it illegal to text and drive

43 (39.1%)

67 (60.9%)

81

Different Technology

65 (59.1%)

45 (40.9%)

81

Ticketing

23 (20.9%)

87 (79.1%)

81

Getting in an accident

32 (29.1%)

78 (70.9%)

81

Nothing

6 (5.5%)

104 (94.5%)

81

Most participants who responded “yes” to have you ever texted while driving admitted they believed it is dangerous (n=91, 95.8%), and their driving ability is negatively affected (n=64, 68.1%). One explanation of this contradictory behavior is the texters believe the frequency of texting while driving correlates with risk level, and having a relatively low texting rate reduces risk of MVA. Also, the majority of ‘texters’ tend to be alone in their vehicle (n=57, 60.6%), and have never personally encountered any negative consequences such as getting into an accident (n=1, 1.1%) or being ticketed for texting while driving (n=1, 1.1%). This suggests the perceived risk to oneself and not being responsible for other passengers may play a role in motivating texting behavior.

The subjects were asked about possible interventions to curb texting while driving to reveal what measures are perceived as effective by the population in deterring this behavior. The interventions perceived most effective were “implementation of different technology” to make texting safer (n=65, 59.1%), and “make it illegal to text and drive” (n=43, 39.1%). This suggests drivers want to continue to text and drive, and but would like to do so safely if possible. However, research suggests hands-free equipment such as headsets and vocally based texting technology still impairs a driving ability [19]. Additionally, about 40% of drivers reported making it illegal to text and drive would be a good deterrent. However as previous mentioned, ‘texters’ and ‘non-texters’ were equally aware of the legal regulations regarding texting and driving and it was determined to have no significant deterrent effects. Additionally, difficulty enforcing may compromise the efficacy of such a strategy as an independent and sole solution.

Conclusion

This study profiled DD from texting in Grenada. Survey data demonstrates the behavior is disproportionately prevalent among younger age groups and males, revealing vulnerable populations. Responses suggest interventions targeting socially reinforcing effects, safer technologies, as well as legislation may mitigate texting while driving’s consequence in Grenada, West Indies. The findings and conclusions of this study will be made available to the Royal Grenadian Police Force to inform public educational initiatives regarding attitudes surrounding DD, campaigns to reduce the behavior, and law enforcement policy to curb texting while driving.

References

  1. http://www.who.int/violence_injury_prevention/publications/road_traffic/distracted_driving_en.pdf
  2. Strayer DL, Drews FA, Crouch DJ (2006) A comparison of the cell phone driver and the drunk driver. Hum Factors 48: 381–391. [crossref]
  3. Feldman, G, Greeson J, Renna M, Robbins-Monteith K (2011) Mindfulness predicts less texting while driving among young adults: Examining attention- and emotion-regulation motives as potential mediators. Personality and Individual Differences 51: 856–861.
  4. Caird JK, Johnston KA, Willness CR, Asbridge M, Steel P (2014) A meta-analysis of the effects of texting on driving. Accid Anal Prev 71: 311–318. [crossref]
  5. Wilson FA, Stimpson JP (2010) Trends in fatalities from distracted driving in the United States, 1999 to 2008. Am J Public Health 100: 2213–2219. [crossref]
  6. Bidaisee S, Macpherson C (2017) An Analysis of Motor Vehicle Accidents in Grenada during the period 2000 – 2009. Ret March 9.
  7. http://www.ghsa.org/state-laws/issues/Distracted-Drivin
  8. Owens, JM, McLaughlin SB, Sudweeks J (2011) Driver performance while text messaging using handheld and in-vehicle systems. Accid. Anal. Prev. 43: 939–947.
  9. http://www.who.int/mediacentre/factsheets/fs358/en/
  10. US Department of Transportation National Highway Traffic Safety Administration (2014) Traffic Safety Facts Research Note: Distracted Driving 2012.
  11. N L, Boyd S (2005) On-Road Study of Willingness to Engage in Distracting Tasks. Psyc EXTRA Dataset.
  12. Centers for Disease Control and Prevention (CDC) (2013) Mobile device use while driving-United States and seven European countries, 2011. MMWR Morb Mortal Wkly Rep 62: 177–182.
  13. Lerner N, Balliro G (2003a) Driver Strategies for Engaging in Distracting Tasks Using In-Vehicle Technologies: Focus Group Report. Interim Report under Contract DTNH22- 99-D-07005. Washington, DC: National Highway Traffic Safety Commission.
  14. Hosking SG, Young KL, Regan MA (2009) The effects of text messaging on young drivers. Hum Factors 51: 582–592. [crossref]
  15. Klauer SG, Guo F, Simons-Morton BG, Ouimet MC, Lee SE, et al. (2014) Distracted driving and risk of road crashes among novice and experienced drivers. N Engl J Med 370: 54–59. [crossref]
  16. Cook JL, Jones RM (2011) Texting and accessing the web while driving: Traffic citations and crashes among young adult drivers. Traffic Inj Prev 12: 545–549.
  17. Bergmark RW, Gliklich E, Guo R, Gliklich RE (2016) Texting while driving: The development and validation of the Distracted Driving Survey and risk score among young adults. Injury Epidemiology 3, 7 (Epub 2016 Mar 1).
  18. https://www.gov.uk/using-mobile-phones-when-driving-the-law
  19. Wildon Fernando A, Jim P Stimpson (2017) “American Public Health Association – Trends in Fatalities from Distracted Driving in the United States, 1999 to 2008”. Ajph.aphapublications.org. N.p. Ret. 9 Mar. 2017.
  20. http://www.gov.za/speeches/safelyhomeandvodacomjoinforceshighlightdangersdistracteddriving27 may20150000
  21. http://www.meinsurancereview.com/Magazine/ReadMagazineArticle/aid/38025/MiddleEastKuwait
  22. McGlashan ND (1982) Causes of death in ten English-speaking Caribbean countries and territories. Bull Pan Am Health Organ 16: 212–223. [crossref]
  23. Yagil Dana (1998) “Gender and Age-related Differences in Attitudes toward Traffic Laws and Traffic Violations”. Transportation Research Part F: Traffic Psychology and Behaviour 1.2: 123–135.
  24. Beck, Kenneth H, Samantha Watters (2016) “Characteristics of College Students Who Text While Driving: Do Their Perceptions of a Significant Other Influence Their Decisions?”. Transportation Research Part F: Traffic Psychology and Behaviour 37: 119–128.
  25. He, Jibo, William Choi, Jason S Mccarley, Barbara S Chaparro, Chun Wang (2015) “Texting While Driving Using Google Glassâ„¢: Promising but Not Distraction-free.” Accident Analysis & Prevention 81: 218–229.
  26. Donohew, Lewis, Richard R Clayton, William F Skinner, Susan Colon (1999) “Peer Networks and Sensation Seeking: Some Implications for Primary Socialization Theory.” Substance Use & Misuse 34.7: 1013–1023.

Low levels of HDL-cholesterol and endothelial dysfunction: a systematic review and meta-analysis

DOI: 10.31038/IMROJ.2018333

Abstract

Introduction

HDL-C is believed to retard the formation of atherosclerotic lesions by removing excess cholesterol from cells and preventing endothelial dysfunction. However, there are no systematic analyses or well-conducted meta-analyses to evaluate the relationship between very low HDL-C and endothelial dysfunction [1]. The aim of this study is to examine this association of very low HDL-C with endothelial dysfunction in different ages and sex.

Methods and analysis

The update systematic review and meta-analysis will be conducted using published studies that will be identified from electronic databases (i.e., PubMed, EMBASE, Web of Science, and Google Scholar. Studies that (1) examined the association between very low HDL-C and endothelial dysfunction, (2) had a longitudinal or prospective cohort design, (3) were conducted among in adults aged 34 to 70 years., (4) provided sufficient data for calculating ORs or relative risk with a 95% CI, (5) were published as original articles written in English or other languages, and (6) have been published until January 2018 will be included. Study selection, data collection, quality assessment and statistical syntheses will be conducted based on discussions among investigators.

Ethics and dissemination

Ethics approval was not required for this study because it was based on published studies. The results and findings of this study will be submitted and published in a scientific peer-reviewed journal.

Strengths and limitations of this study

This systematic review and meta-analysis will offer better understanding regarding the association between metabolic syndrome and endothelial dysfunction. The findings from this study will be useful for assessing of very low HDL-C and the risk factors in endothelial dysfunction, and determining approaches for prevention of endothelial dysfunction in the future.

An improved understanding of this relationship may help to inform public health endothelial dysfunction prevention strategies.

Included studies may have substantially different methodologies, which could limit our ability to draw reliable conclusions from the existing evidence base. Depending on the results, confounding factors that were not adjusted for the selected studies and low generalizability situations can be limitations.

To minimize these limitations we will evaluate the heterogeneity between the studies, perform sensitivity analysis and meta-regression.

Trial registration number: PROSPERO (CRD42018083467).

Abbreviations: CIs = Confidence Intervals, HDL = high-density lipoprotein, LDL = low-density lipoprotein, MD = mean difference, RR = risk ratio, WC = waist circumference

Key words

HDL-C, endothelial dysfunction, systematic review

Background

HDL is believed to retard the formation of atherosclerotic lesions by removing excess cholesterol from cells and preventing endothelial dysfunctionand a very low HDL-C increased risk of cardiovascular events [1].

It is in large part the results of unbalanced diet, low socioeconomic and cultural levels, stress and sedentary lifestyle. Although the literature on the very low HDL-C and the risk factors for endothelial dysfunction has been increasing, to our knowledge, a systematic review of the association between very low of HDL-C and risk of endothelial dysfunction has not yet been conducted [1–11].

This study aims to systematically access the association between a very low HDL-C and the endothelial dysfunction in adults aged 34 to 70 years; and to provide a framework to further understand these factors in order to better target prevention strategies.

Methods/Design

This systematic review of the literature will follow the Preferred Reporting Items for Systematic Reviews and Meta-Analyses (PRISMA) recommendations. The databases PubMed, Embase, Web of Science, Google Scholar, and Cochrane will be searched for articles [12]. Our search will focus on cohort, case-control and cross-sectional studies examining the association between very low HDL-C and endothelial dysfunction. The primary outcome is endothelial dysfunction. Two reviewers will independently screen articles, extract relevant data and assess the quality of the studies.

The aim of this analysis is to investigate whether there is an association between HDL-C levels and endothelial dysfunction in the adult population with cardiovascular outcomes. We plan to look at the prevalence of very low HDL-C levels in endothelial dysfunction individuals and to analyze whether low and very low HDL levels (<20; 20–30; 30–40 vs.> 40 mg/dL as ref. according to sex) in endothelial dysfunction might to be additional risk factor and predictor of CVD events, and mortality (CV-mortality, mortality and all-cause mortality) [1–2].

The study is registered with PROSPERO (CRD42018083467). This protocol conforms to the Preferred Reporting Items for Systematic Reviews and Meta-Analyses Protocols (PRISMA-P) guidelines [13–14].

Systematic review registration

This protocol is registered in the PROSPERO registry of the University of York (Reference number: CRD42018083467).

Objectives

The primary objective is to identify and summarize the association with of very low of HDL-C levels and with endothelial dysfunction risk in adults (34–70 years) in different ages and sexes.

Eligibility criteria

The PICOS strategy (population, intervention (changed to exposure for the purposes of this review of observational studies), comparator, outcome, study characteristics) was used to define the eligibility criteria for this study.

Inclusion criteria: studies will be considered if they include: endothelial dysfunction patients in the diagnosis of the low and very low HDL levels (<20; 20–30; 30–40 vs.> 40 mg/dL as ref. according to sex).

Exclusion: Reviews or abstracts from congresses/conferences, letters, editorials, case reports, interventional studies or clinical trials. We excluded studies that did not provide information on low and very low HDL levels (<20; 20–30; 30–40 vs.> 40 as ref. according to sex) in endothelial dysfunction and a control group.

Data will be extracted using a standardized template. We will use the PICOS (Population, Intervention, Comparator, Outcomes and Study design) framework, originally devised to formulate a research question, as a basis to develop data extraction criteria. As this is an aetiological study, ‘exposure’ will replace ‘intervention’ and ‘study characteristics’ will replace ‘study design’. Data items on the following five domains will be extracted:

  1. Population: characteristics of the study population (e.g., mean/median age, ethnic distribution), inclusion and exclusion criteria
  2. Exposure: definition and identification of very low HDL-C.
  3. Comparators: definition and identification of unexposed individuals, number of unexposed subjects
  4. Outcomes: definition and identification of primary (HDL-concentration of +/- endothelial dysfunction is the main exposure of interest. Patients with a diagnosis of endothelial dysfunction that present CVD outcomes, and death (CV mortality, all-cause mortality) and secondary outcomes (Biomarkers of endothelial cell dysfunction and endothelial cell activation, as well as non-invasive techniques to measure endothelial function), number of subjects with outcome
  5. Study characteristics: authors, publication year, setting/source of participants, design, methods of recruitment and sampling, period of study, length of follow-up time (if relevant), aims and objectives.

Outcomes

Primary outcomes

HDL-concentration of +/- endothelial dysfunction is the main exposure of interest. Patients with a diagnosis of endothelial dysfunction that present CVD outcomes, and death (CV mortality, all-cause mortality)

Secondary outcomes

Biomarkers of endothelial cell dysfunction, endothelial cell activation, as well as non-invasive techniques to measure endothelial function.

Study design

This is a systematic review and meta-analysis protocol of prospective cohort studies, following the PRISMA-P (Preferred Reporting Items for Systematic Reviews and Meta-Analysis protocols) guideline [14]. The systematic review and meta-analysis will be reported according to the PRISMA (Preferred Reporting Items for Systematic Reviews and Meta-Analyses) guideline [15]. The whole process of study selection is summarized in the PRISMA flow diagram (Fig. 1). This study will not involve any private patient data; ethics approval was waived (see online supplementary file 1 for PRISMA-P checklist).

Search strategy

A systematic review of the literature will be conducted. A language restriction shall not be applied to the search. If there are relevant non-English abstracts, attempts shall be made to translate them wherever possible.  The following bibliographic databases (Embase, PubMed-MEDLINE, Web of Science, Cochrane Library, and Google Scholar) will be searched for articles published until January 2018.The search strategy will be developed by LR and HRZ; we anticipate that the databases will be searched from their inception to 30 December 2018 (see online supplementary file1 for the search strategies for PubMed, EMBASE, Cochrane Library, Web of Science, Embase, Google Scholar.

IMROJ-LeonardoRover_F1

Figure 1. Flow diagram of study selection process

Our search focuses on studies examining the association between very low HDL-C diagnosis and endothelial dysfunction in adults (34–70 years) [11]. At each step of the selection process, reasons for inclusion/exclusion will be recorded in the PRISMA Flowchart [13].

Data collection

A record will be kept of all searches and search decisions to ensure reproducibility. Search results will be exported to a citation management program (EndNote ver. 7.0). Duplicates will be removed and retained separately. The resulting references will be exported separately to the two reviewers for independent review using MS Excel.

Selection of studies

Two authors (LR, FCV) will independently screen all titles and abstracts identified through the literature searches and will exclude all records clearly not meeting inclusion criteria. Disagreements will be resolved by consensus. The selection process will be pilot tested to ensure a high degree of agreement between reviewers. Full text of the remaining studies will then be retrieved. The same two authors (LR, FCV) will independently assess the papers for fulfilment of inclusion criteria. In case of differences of opinion regarding study inclusion, a third review author (GBZ) will serve as arbiter. To avoid double counting, if multiple publications based on the same cohort of participants are retrieved, only the study reporting the largest sample size will be used. The reasons for excluding papers for which the full text was retrieved will be documented.

Data extraction and management

A data extraction form will be used to collect details from the included studies. The form includes information on study design, patient population, and presence of stroke. Two review authors (LR and FCV) will independently extract the data. The data extraction form will be pilot tested on several papers to ensure consistency and that all relevant information is being captured. If necessary, a statistician will review the extraction of data to further ensure quality and reliability. Authors will be contacted for missing data.

In terms of the study results, unadjusted and fully adjusted effect estimates for the association between very low HDL-C and endothelial dysfunction will be recorded. Details of the confounders measured and adjusted for will also be noted. Results of any additional stratified analyses will also be recorded. Where possible, results from additional subgroup analyses with evidence regarding our non-primary objectives will also be recorded, for example, the association between very low HDL-C and the secondary outcomes.

Assessment of methodological quality

Two investigators (LR and FCV) will independently assess each selected study for study quality using the Newcastle-Ottawa Quality Assessment Scale (NOS) [16]. The NOS evaluates cohort studies based on eight items categorized into the following three groups: (1) selection of the study cases, (2) comparability of the population, and (3) ascertainment of whether the exposure or outcome includes any risk of bias (i.e., selection bias or bias from lost to follow-up). The NOS is scored ranging from 0 to 9, and studies with scores ≥7 are considered as high quality [16]. Discrepancy of quality assessment among the investigators will be solved by discussion and consensus among all authors.

Data synthesis and statistical analysis

We anticipate that there may be significant heterogeneity in the prevalence of very low HDL-C features of endothelial dysfunction. There are several factors that could contribute to such heterogeneity. The relative risk (RR), and odds ratio (OR) are the way the result will be expressed statistically.

These factors include the following: differences in demographic and clinical features (e.g., age, hypertension, renal disease, smoking, duration and severity of diabetes) among study cohorts; differences in definitions of HDL-C. An I2 statistic will be calculated for the studies to be included in each proposed meta-analysis (i.e. for each neuroradiology correlate of interest) with values of 25, 50, and 75% suggesting low, moderate, or high degrees of heterogeneity, respectively, which report a dichotomized (i.e., present or absent) or categorical (i.e., absent, mild, moderate, severe) shall be harmonized for meta-analysis if deemed appropriate by our statistician. Other types of rating scales shall not be included in a meta-analysis and the data based on any such data scale would be presented in narrative form.

If significant heterogeneity between studies, as determined by consultation with our statistician, prevents meaningful pooling of the data, we will limit ourselves to providing a narrative description of observed trends. Given the heterogeneity of the populations studied, assumption of a fixed effect size across populations would not be justified, thus analyses would be performed using a random effects model. Given the dichotomized (presence or absence) or categorical (severity measure) nature of our data of, meta-analysis will be performed a random effects analysis. We will also add funnel graphs, publication bias analysis and a meta-regression analysis.

If there are sufficient data to allow such analyses (in principle from as few as a single high quality study, but if possible by pooling data from multiple studies), we will perform subgroup analyses for participants with renal disease and participants with hypertension. In addition, if sufficient data are available, we shall perform subgroup analyses by age and diabetes duration. Funding sources and conflict of interest will be extracted from included studies. Statistical analysis will be performed using RevMan software.

Strategy for data synthesis

The data of interest presented as continuous (mean value and SD) will be used to perform meta-analysis to obtain the standardized mean difference (SMD) and 95% confidence interval (CI). Cocharn’s Q-statistic and I-squared test will be used to test for heterogeneity between the included studies. If a I-squared value will be greater than 50% or a p value of the Q-test will be less than 0.05, indicating maximal heterogeneity among the included studies, a random-effect model will be put into use.

Analysis of subgroups or subsets

The subgroup meta-analyses will be conduct according to the pre-specified study-level characteristics using a fixed-effects meta-analysis and if there is substantial heterogeneity, we will use the random effects model. The sources included location, sex, age, method of HDL-C assessment, the definition of endothelial dysfunction. We also will conduct sensitivity analyses to evaluate the potential sources of heterogeneity in the analyses.

Summary of Evidence

We will produce a narrative synthesis of the main results extracted from articles in full text. A summary of the included studies will provide information on the authors, study design, participants, number and age of the subjects, theoretical structure (if relevant), alcohol consumption (as primary outcome of interest), main findings, Study information. Special emphasis will be placed on the identification of very low of HDL-C and the risk of endothelial dysfunction. In the presentation of the results, we will try to separate the factors for which the evidence of causality is strong (from longitudinal studies) and factors for which the causal nature of the relationship is less secure (cross-sectional data). A graphical summary of all the data they represent will be provided and take into account the number of studies that provide evidence of a factor and the relative strength of the association presented based on study design and quality assessment. The membership level will be evaluated based on adjusted data.

Discussion

This systematic review will synthesize research evidence to establish whether the risk of developing endothelial dysfunction is relatively high in adults with very low HDL-C. Strengths and limitations will be highlighted in the identified evidence. Strength of observational data may include large sample size, high rate of follow-up and frequency of stroke more likely to be representative of the population at risk. Limitations may include the quality of data extracted which may not allow studies to be combined in a meta-analysis. This may be overcome by presenting the findings in a descriptive manner. This review will conducted in collaboration with an experienced librarian who helped appraise the search criteria, refine the keywords and MeSH terms and identify appropriate database(s). To the best of our knowledge, no reviews have been published exploring the study question; however, if a review addressing a similar question is published, it will be incorporated in this review and added in a meta-analysis if feasible.

Implications of results

This systematic review will provide an updated and quantifiable estimate of the risk of endothelial dysfunction in adults with very low HDL-C. Furthermore, the systematic search will identify where future research is required. For instance, this review may inform a prognostic study which may be useful in understanding the course and factors associated with endothelial dysfunction development.

Amendments

If it is necessary we will update this protocol in the future. We will submit the original protocol, final protocol and summary of changes as a supplement.

Ethics and dissemination

Ethical issues

No ethical approval is required because this study includes no confidential personal data or interventions with the patients.

Publication plan

The procedures of this systematic review and NAM will be conducted in accordance with the PRISMA-compliant guideline. The results of this systematic review and NAM will be submitted to a peer-reviewed journal for publication.

Authors’ information: Not applicable

Competing interests: The authors declare that they have no competing interests.

Consent for publication: Not applicable

Ethics approval and consent to participate: Not applicable

Availability of supporting data: Not applicable

Funding: Not applicable

Authors’ contributions

LR, ASRB, ALDD, ACF, NPS, PMMD, RMLS, JLO, MN, AD, PARD, FRS, GBFO, GBZ, SAH, PEOR, AJG, RMP, ACF, PMMD, TMF, NN, SA, CD, TL GT, AJCN, LMAS, ROF, PFSG, A.A, AVH, MIR, RDL and FCV conceived the study idea and devised the study methodology. LR, ASRB, ACPC and ESR participated in the design and coordination of the study. LR was primarily responsible for protocol writing and developed the search strategy. LR and FCV will screen identified literature, conduct data extraction and analyses the review findings. All authors read the drafts, provided comments and agreed on the final version of the manuscript.

Acknowledgements: Not applicable

References

  1. Ahmed ST, Rehman H, Akeroyd JM, et al. (2018) Premature Coronary Heart Disease in South Asians: Burden and Determinants. Curr Atheroscler Rep 20: 6. [crossref]
  2. Oliveira GBF, Avezum A, Roever L. Cardiovascular disease burden: evolving knowledge of risk factors in myocardial infarction and stroke through population-based research and perspectives in global prevention. Front Cardiovasc Med. 2015: 200032.
  3. Roever L, Biondi-Zoccai G, Chagas AC (2016) Non-HDL-C vs. LDL-C in Predicting the Severity of Coronary Atherosclerosis. Heart Lung Circ 25: 953–954. [crossref]
  4. Roever LS, Resende ES, Diniz AL, Penha-Silva N, Veloso FC, et al. (2016) Abdominal Obesity and Association With Atherosclerosis Risk Factors: The Uberlândia Heart Study. Medicine (Baltimore) 95: e1357. [crossref]
  5. Roever L, Resende ES, Diniz ALD, et al. Ectopic adiposopathy and association with cardiovascular disease risk factors: The Uberlândia Heart Study. Int J Cardiol. 2015; 190: 140–142.
  6. Roever L, Resende ES, Veloso FC, Diniz AL, Penha-Silva N, et al. (2015) Perirenal Fat and Association With Metabolic Risk Factors: The Uberlândia Heart Study. Medicine (Baltimore) 94: e1105. [crossref]
  7. Van Rooy MJ, Pretorius E. Metabolic syndrome, platelet activation and the development of transient ischemic attack or thromboembolic stroke.Thromb Res. 2015;135(3): 434–42.
  8. Sarrafzadegan N, Gharipour M, Sadeghi M, Nezafati P, Talaie M, et al. (2017) Metabolic Syndrome and the Risk of Ischemic Stroke. J Stroke Cerebrovasc Dis 26: 286–294.
  9. Sánchez-Iñigo L, Navarro-González D, Fernández-Montero A, Pastrana-Delgado J, Martínez JA. Risk of incident ischemic stroke according to the metabolic health and obesity states in the Vascular-Metabolic CUN cohort.Int J Stroke. 2017;12(2): 187–191.
  10. Chei CL, Yamagishi K, Tanigawa T, Kitamura A, Imano H, Kiyama M, et. al. Metabolic Syndrome and the Risk of Ischemic Heart Disease and Stroke among Middle-Aged Japanese.Hypertens Res. 2008 Oct;31(10): 1887–9.
  11. Fang X, Liu H, Zhang X, Zhang H, Qin X, Ji X. Metabolic Syndrome, Its Components, and Diabetes on 5-Year Risk of RecurrentStroke among Mild-to-Moderate Ischemic Stroke Survivors: A Multiclinic Registry Study.J Stroke Cerebrovasc Dis. 2016; 25(3): 626–34.
  12. Glasziou P, Irwig L, Bain C, Colditz G. Systematic reviews in health care: a practical guide. Cambridge: Cambridge University Press; 2001.
  13. Newcastle Ottawa Scale (The Newcastle-Ottawa Scale (NOS) for assessing the quality of nonrandomised studies in meta-analyses), available at: http://www.ohri.ca/programs/clinical_epidemiology/oxford.asp. Accessed 26 Jan 2017.
  14. Moher D, Liberati A, Tetzlaff J, Altman DG.Preferred reporting items for systematic reviews and meta-analyses: the PRISMA statement.BMJ. 2009;339.
  15. Shamseer L, Moher D, Clarke M, Ghersi D, Liberati A, Petticrew M, Shekelle P, Stewart L, PRISMA-P Group. Preferred reporting items for systematic review and meta-analysis protocols (PRISMA-P) 2015: elaboration and explanation.BMJ. 2015; 349(jan02 1): g7647.
  16. Wells GA, Shea B , O’Connell D , et al . The Newcastle-Ottawa Scale (NOS) for assessing the quality of nonrandomized studies in meta-analyses. Secondary The Newcastle-Ottawa Scale (NOS) for assessing the quality of nonrandomized studies in met analyses. http://www.ohri.ca/programs/clinical_epidemiology/oxford.asp (accessed on Dec 28, 2017)

The Past, Present, and Future of Pancreas Transplantation for Diabetes Mellitus

DOI: 10.31038/EDMJ.2018235

Introduction

Pancreas transplantation was initially developed as a means to re-establish endogenous insulin secretion responsive to normal feedback controls and has evolved over time to a form of auto-regulating total pancreatic endocrine replacement therapy that can reliably achieve a durable euglycemic state without the need for either exogenous insulin therapy or close glucose monitoring. Pancreas transplantation is performed in patients who require administration of insulin because of type 1 or, less commonly, insulin-requiring type 2 diabetes, or following total pancreatectomy for benign disease [1]. Pancreas transplantation entails a major surgical procedure and the necessity for long-term immunosuppression so it is not offered universally to all patients with insulin-requiring diabetes but is usually directed to those that will already be committed to chronic immunosuppression [most commonly for kidney transplantation secondary to end stage diabetic nephropathy) [1]. In addition, candidates with potentially life-threatening metabolic complications from diabetes such as hypoglycemia unawareness or those who are failures of exogenous insulin therapy may benefit from pancreas transplantation in the absence of a kidney transplant [2]. A successful pancreas transplant is currently the only definitive long-term treatment that restores normal glucose homeostasis in patients with complicated diabetes without the risk of either severe hypo/hyperglycemia and may prevent, stabilize, or reverse progressive diabetic complications [1–3].

The history of pancreas transplantation largely parallels advances in clinical immunosuppression and surgical techniques. As of December 2017, more than 56,000 pancreas transplants were reported to the International Pancreas Transplant Registry [IPTR) including >32,000 from the United States [US) and >24,000 from outside of the US [FIGURE 1). [3–6) Pancreas transplantation in diabetic patients is divided into 3 major categories; those performed simultaneously with a kidney [SPK) transplant, usually from a deceased donor; those performed after a successful kidney [PAK) transplant in which the kidney transplant was performed from either a living [most commonly) or deceased donor; and pancreas transplantation alone [PTA) in the complete absence of the need for a kidney transplant. The latter two [PAK and PTA) categories are usually combined together as solitary pancreas transplants because the transplant is performed in the absence of uremia. Historically, solitary [PAK and PTA) transplants have had similar albeit inferior outcomes compared to SPK transplantation. In the US, the majority [84%) of pancreas transplants are currently performed as SPK transplants whereas approximately 16% are performed as either PAK or PTA cases [FIGURE 2) [3–6].

PowerPoint Presentation

Figure 1. Total number of pancreas transplants performed in the US and outside of the US between 1966 and 2017 as reported by UNOS and the IPTR (at the time of analysis the reporting for non-US cases was not complete for the year 2017)

SPK transplantation has become a generally accepted treatment for uremic type 1 diabetes [1]. The evolution in surgical techniques, current patient management strategies, and advances in immunosuppression have resulted in excellent outcomes, even in populations previously considered high risk, such as patients older than 50 years, African-American recipients, patients with a “type 2 diabetes” phenotype, and solitary pancreas transplants recipients[1–11]. Insulin independence is sustained at 5 years in 77% of SPK and 60% of solitary pancreas transplant recipients [3–6]. For SPK transplant recipients with dual allograft function at one year, the conditional half-life of the pancreas graft currently averages 12–15 years, which is amongst the longest for extra-renal grafts
[FIGURE 3). [3–6, 12] Nearly all pancreas transplants are currently performed by one of three standardized techniques[1, 13–15]. Both technical and immunologic graft failure rates have decreased over time [3–6]. One of the most recent and exciting innovations in pancreas transplantation is the description of laparoscopic pancreas transplantation under robotic assistance [16, 17].

PowerPoint Presentation

Figure 2. Annual number of pancreas transplant procedures in diabetic patients performed by transplant category in the US; the decline in SPK transplants began in 1999 whereas the number of solitary pancreas transplants (both PAK and PTA) started decreasing after 2004.

PowerPoint Presentation

Figure 3. SPK conditional primary deceased donor pancreas graft survival for transplants performed between 1988 and 2007.

Pancreas transplantation in 2018 can be characterized by the “rule of 90s”; worldwide, 90% are SPK transplants, 90% are from conventional [young and low Body Mass Index [BMI] <30 kg/m2) donors, 90% are performed with enteric drainage, 90% have systemic venous drainage, 90% are managed with antibody induction, 90% receive initial tacrolimus or mycophenolate maintenance therapy, 90% of recipients are Caucasian, 90% have type 1 diabetes, 90% of recipients have a BMI <30 kg/m2, 90% have a panel reactive antibody level ≤20%, the 1-year graft survival rate for SPK transplants is 90%, and 5-year patient survival rates are 90% in all three recipient categories. [3–6] At the other end of the spectrum, there is the “rule of 30s”; 30% of patients are ≥ age 50 years , 30% undergo relaparotomy, 30% experience acute rejection, 30% of dual organ biopsies are discordant, 30% develop donor specific antibody, 30% remain steroid-free long-term, 30% of centers perform PTAs, 30% of centers performed more transplants in the most recent era [2010–2014) compared to the previous era [2005–2009), 30% of centers are very low volume centers [≤10 pancreas transplants in 5 years; Figure 4), 30% of SPK transplants in the US are performed by 12 large volume centers, and a 30% overall reduction in total pancreas transplants performed annually in the US occurred in the decade from 2005 to 2015 [Figure 1) [3–6].

PowerPoint Presentation

Figure 4. Box-plot analysis showing transplant center volume over time; the median center volume has decreased from 9 to 6 pancreas transplants annually and the current lower and upper quartile values are 3–12 pancreas transplants per year.

Improving Outcomes in the Setting of Fewer Transplants Being Performed

According to data from the IPTR and the United Network for Organ Sharing [UNOS), the total annual number of pancreas transplants steadily increased in the US until 2004 [peaking at 1484) but then declined annually for the next 11 consecutive years [reaching a low of 943 in 2015, which was the lowest total since 1994). Fortunately, the number of pancreas transplants has rebounded to above 1000 per year in 2016 and 2017 [Figure 1) [3–6, 18]. This trend downward has been more dramatic for solitary pancreas transplants, particularly in the PAK category [415 performed in 2004, 79 performed in 2017, Figure 2). From 2004–2015, the annual number of SPK transplants in the US declined by 20% overall whereas the annual overall decreases in PAKs and PTAs were 81% and 42%, respectively [Figure 2) [3–6, 18]. In the last decade, era analyses of national data have demonstrated that deceased donor recovery rates and additions to the waiting list have decreased while donor organ discard rates and recipient waiting times have increased. At present, pancreas transplantation is one of the few solid organ transplants in the US that is experiencing an overall decline in activity [3–6, 18]. Unexpectedly, this has occurred in spite of significant improvements in graft and patient survival outcomes, even in higher risk patients, as shown below [Table 1) – an alarming trend because the history of solid organ transplantation has been characterized by an increase in volume mirroring improved results in most circumstances [18, 19].

Table 1. Recent outcomes of primary deceased donor pancreas and pancreas/kidney transplants performed between 1998 and 2017 with a potential follow-up time of at least 6 months.

1998–02

2003–07

2008–12

2013–17

P-value

Patient Survival
[%]

SPK

1 Year

94.7

95.4

96.9

97.4

<0.0001

3 Year

90.1

91.5

94.0

95.1

5 Year

85.2

87.2

89.6

PAK

1 Year

95.3

96.3

97.1

95.7

0.13

3 Year

89.9

91.4

93.5

91.3

5 Year

82.1

85.1

88.8

PTA

1 Year

98.2

96.3

96.6

98.4

0.36

3 Year

93.1

91.6

93.6

94.9

5 Year

88.8

87.8

86.8

Graft
Function
[%]

SPK

Pancreas

1 Year

83.4

85.0

88.8

90.3

<0.0001

3 Year

76.6

78.8

82.9

84.7

5 Year

69.8

72.6

77.1

Kidney

1 Year

91.8

92.6

94.8

95.8

<0.0001

3 Year

84.5

86.2

88.8

90.8

5 Year

77.0

79.7

82.2

PAK

1 Year

78.3

78.9

84.7

85.1

<0.0001

3 Year

66.6

65.5

73.7

75.3

5 Year

57.0

56.3

67.1

PTA

1 Year

80.2

77.8

82.2

84.0

0.03

3 Year

63.4

60.0

67.8

72.2

5 Year

55.2

53.0

58.2

Coincident with the decrease in pancreas transplant activity in the US, there has been a steady increase in the number of pancreas transplants performed outside of the US such that more annual pancreas transplants are now being performed outside of the US since 2008 [3–6]. In 2017, 1002 pancreas transplants were performed in the US [including multivisceral transplants) whereas nearly 1400 pancreas transplants were performed outside of the US and reported to the IPTR [Figure 1) [3–6]. Because reporting of pancreas transplants performed in the US is mandatory and reporting of non-US cases is voluntary, the actual number of pancreas transplants performed outside of the US may be even higher. However, recent data from the Eurotransplant [a collective of all transplant centers in eight European countries) and United Kingdom [UK) transplant registries suggest that a reduction in annual pancreas transplant activity has occurred in these regions as well [20]. Between 2004 and 2016, the average annual decline in pancreas transplant rates was 2.9% in the US and 1.8% in Eurotransplant member countries. In the UK, from 2009 to 2016, a 0.5% annual decline in pancreas transplant activity occurred. The overall increase of non-US transplant numbers was due to the increased transplant activities of South American transplant centers where new pancreas transplant programs were started. Paradoxically, this decrease in annual pancreas transplant activity occurred commensurate with a burgeoning increase in incident rates for type 1 diabetes in children. Corresponding to the >30% decline in the total annual number of pancreas transplants being performed in the US in the past decade, fewer patients are being added to the waiting list, waiting times have increased, and wait list mortality for SPK transplant candidates has risen to 10% [3–6].

Only about 7 in 10,000 Type 1 and 4 in 1 million Type 2 patients with diabetes will ever receive a pancreas transplant in the US. Concurrent with the above trends, the overall number of active pancreas transplant centers are declining; only 10 centers in the US performed ≥20 pancreas transplants in 2017 and half of all centers perform <6 pancreas transplants in 2017 [Figure 4); many do not perform solitary pancreas transplants [3–6, 21]. For example, <50% of pancreas transplant centers perform PAKs and <25% actually perform PTAs in a given year. Only 12 centers in North America are certified by the American Society of Transplant Surgeons [ASTS) for pancreas transplant fellowship training [which previously required performing a minimum of 20 pancreas transplants per year). With the steady decline in volumes, many pancreas transplant programs are losing their ASTS fellowship training accreditation. Consequently, the ASTS recently lowered the annual threshold to 15 pancreas transplants per annum in order to permit centers to gain or maintain certification for fellowship training. Pancreas transplant programs comprise the vast majority of organ-specific transplant programs in the US that are most commonly cited by the UNOS Membership and Professional Standards Committee for not meeting minimum activity requirements. Low center volume is a problem in the Eurotransplant consortium as well. As a result, fewer surgeons are adequately trained in pancreas transplantation and many abdominal organ recovery surgeons are not experienced in pancreas organ recovery, which may influence pancreas procurement [18, 22]. Parenthetically, previous data have suggested that pancreas transplant outcomes are favorably influenced by increasing center volume [21].

This unintentional de-emphasis on pancreas transplantation represents a “crisis in confidence” and has the potential to threaten the existence of the procedure as a viable and effective therapeutic option. The national trend in decreasing numbers of pancreas transplants is disturbing and related to a number of factors. For example, the lack of a primary referral source from either diabetologists, endocrinologists or family medicine practitioners has hindered the growth of pancreas transplantation. Most pancreas transplant referrals are from nephrologists who refer patients with diabetes and chronic kidney disease to a transplant center for kidney rather than pancreas transplant evaluation. Ideally, a kidney transplant program with an active pancreas transplant component will identify potential candidates and appropriately offer them either SPK or PAK transplantation. However, this may not occur in programs that do not perform pancreas transplantation but would like to retain the patient for renal transplantation alone. The situation for PTA candidates is even worse as many diabetic patients actually have to circumvent the conventional diabetes care model in order to gain access to PTA.

Improvements in diabetes management, education and awareness; better insulin analogues and glucose sensors; sophisticated and more patient-friendly insulin pumps; and the promise of the artificial or bionic pancreas have all contributed to the diversion of interest away from pancreas transplantation [23]. For most patients with diabetes, the above advances are obvious improvements in therapy because they frequently result in a delay in the progression of diabetic complications. Consequently, lower rates of chronic kidney disease and delayed progression to other end-organ complications may result in fewer or later referrals for transplantation. This may be preferred for patients with diabetes that are able to avoid the need for transplantation. However, for those who might benefit from pancreas transplantation, late referral usually means that patients are older, may have a higher BMI, and may have additional co-morbidities that preclude successful pancreas transplantation. Additionally, most patients with diabetes have non-type 1 diabetes, which is generally, but incorrectly, regarded as a contraindication to pancreas transplantation.

SPK and PAK transplantation became Medicare-approved procedures on July 1st, 1999, after which time the American Diabetes Association included these treatment options within their evidence-based standards of care [24]. PTA became approved by Medicare on April 26, 2006, and despite coverage by Medicare and most primary insurers, subsequent validation by the American Diabetes Association has not occurred even though data on PTA spans several decades, thousands of transplants and chronicles steadily improving outcomes [2, 23, 24]. Because PTA is one of many treatment options available for diabetes mellitus, it stands in direct competition with conventional medical therapies and islet transplantation [23, 25, 26]. Many diabetes care professionals consider PTA to be a “radical”, aggressive, or overzealous therapy [requiring major surgery and lifelong immunosuppression) for a “benign” [yet life-shortening) disease. Other available treatment options are less invasive and, for that reason alone, more appealing to patients, diabetologists, endocrinologists, and primary care physicians. However, the long-term survival advantage in all three recipient categories of pancreas transplantation is not widely known or accepted. Even today, pancreas transplantation is often considered only as a life enhancing rather than a life-extending procedure.

For instance, the University of Wisconsin published their experience with 1000 SPK transplants with 22 year follow-up [27]. In this report, patient survival following SPK transplantation was superior to all other transplant options for type 1 diabetic patients with uremia. Patient survival following SPK transplant was even superior to uremic patients with Type 1 diabetes who underwent living donor kidney transplantation alone. This remarkable finding supports the contention that freedom from diabetes provides a survival advantage in the setting of kidney transplantation. Another study from the University of Minnesota evaluated outcomes in patients following living donor kidney transplantation who either underwent subsequent PAK transplant or were eligible for but did not undergo PAK because of financial or personal [but not medical) reasons. Patients who were ineligible for PAK because of comorbidity were excluded from analysis [28]. Although patient and kidney graft survival rates were not influenced [positively or negatively) by PAK transplant, 4-year renal function was significantly improved following PAK transplant in the setting of improved glycemic control. In a UNOS registry analysis from 1995–2010 of all adult patients registered either for an SPK or PAK transplant, the major findings were: 1. Patient survival for all transplanted patients was far superior to remaining on the waiting list; 2. Five-year patient survival was similar but 10-year patient survival was higher for SPK compared to PAK transplant recipients; 3. Receiving a PAK following either living or deceased donor kidney transplantation markedly improved long-term kidney graft survival rates compared to not receiving a pancreas graft; 4. Ten-year kidney graft survival rates were similar [61%) for recipients of either an SPK or living donor kidney alone transplants; and 5. Ten-year pancreas graft survival rates were 58.7% for SPK, 44.4% for pancreas after living donor kidney transplant, and 41.7% for pancreas after deceased donor kidney transplant [29]. However, the kidney graft survival rate was highest at 10 years [69.7%) for those surviving patients who received a living donor kidney followed by a sequential PAK transplant. Other studies have documented steadily improving outcomes following PAK transplant [29]. Based on these findings, it is logical to infer that both patient and renal graft longevity is maximized by achieving an insulin and dialysis-free state, whether this is accomplished either by an SPK transplant or a PAK transplant following [preferably) a living donor kidney transplant. Adding a pancreas to a kidney transplant [either simultaneously or sequentially) provides a survival advantage beyond kidney transplantation alone compared to all other treatments available to the uremia diabetic individual.

To further corroborate this viewpoint, recently published data have documented that since the inception of UNOS in 1987, 79, 198 life-years have been “saved” by SPK transplantation [4.6 life-years per recipient) and 14, 903 life-years by solitary pancreas transplants [2.4 life-years per recipient) in the US [30]. The perception that PTA is merely an invasive insulin replacement therapy is contrary to existing literature because this option confers a median survival time of 13.6 years compared to 8.0 years for patients who remain on the waiting list. The target patient population is also at significantly increased risk for multiple other morbidities attributed to diabetes that are not captured by data that address survival exclusively. Considering all of the data, the lack of wider application of pancreas transplantation to appropriately selected patients with complicated diabetes remains enigmatic and a missed opportunity.

It has been virtually overlooked that pancreas transplantation is now associated with an extremely low mortality rate, ranging from 3% at 1 year to 5–8% at 3 years in all 3 pancreas transplant categories [Table 1) [3–6]. At 3 years follow-up, pancreas graft survival [insulin-independence) rates are 85% for SPK transplant, 75% for PAK, and 72% for PTA recipients nationally. Following SPK transplantation, the national 3-year kidney graft survival rate is 91%. Many pancreas transplant recipients have been insulin-independent for >10 years and some for >20 years [12]. In every update of the IPTR spanning 30 years, patient and graft survival rates in all 3 categories of pancreas transplantation have continued to improve whereas early technical and immunological graft losses have continued to decline. However, the transplant community has become victimized by success; improving survival rates in all solid organ transplants have translated into higher thresholds that are implemented as metrics of acceptable performance. With fewer pancreas transplants being performed and fewer patients on the waiting list, the margin for error is much smaller and not all transplant centers remain actively involved in or committed to the practice of pancreas transplantation. Because of increased regulatory oversight, even large centers have responded by adopting a more risk adverse approach to transplantation in general and pancreas transplantation specifically. In addition, the marked decline in PAK transplants may be explained in part by overall improvements in outcomes and quality of life for patients receiving a kidney alone transplant, after which time they feel “well enough” to forego another transplant. Unfortunately, this is very shortsighted as these patients still face major issues despite a functioning kidney transplant; low quality of life and shortened lifespan because of their unchanged or even worsened diabetic state; and the potential for earlier kidney graft failure secondary to recurrent diabetic nephropathy [28, 29, 31].

Donor, Recovery and Preservation Issues

At present, pancreata are currently recovered for the intent to transplant in only 17% of deceased donors in the US [32]. Of these recovered organs, 25% are discarded so only 13% of deceased donors provide a pancreas that is actually transplanted. Some of these pancreata are sent for islet recovery, which in most cases does not result in islet transplantation. In other cases, aberrant hepatic artery anatomy or intestinal recovery may preclude pancreas recovery, although both of these conditions may be compatible with safe pancreas transplantation [22, 32]. Rates of pancreas utilization among Donor Service Areas vary from 0 to 50+% of donors. Pancreas utilization is influenced by limitations in acceptable warm and cold ischemia, which largely prevents widespread organ sharing and routine acceptance of donation after cardiocirculatory death [DCD) donors. However, recent reports have suggested that pancreas utilization in DCD donors is underutilized and a missed opportunity [32–34]. Moreover, because of logistical constraints, having a back-up patient at another center is problematic if the primary center chooses not to use the pancreas graft. In addition to donor quantity, donor quality has changed because donor age, BMI and proportion of donors who sustain brain death secondary to a cerebrovascular or cardiovascular etiology have all increased over time. The ideal pancreas donor ranges from 10–40 years of age, weighs 60–180 lbs., and sustains head trauma as a cause of brain death [32]. With the addition of cold ischemia <12 hours, these 4 core factors primarily determine the likelihood of success [and utilization) in pancreas transplantation. Having more than one of these factors outside the ideal range may have a significant detrimental effect on outcomes [35]. However, the recent surge in organ donation from young donors who sustain brain death secondary to anoxic encephalopathy following a drug overdose is rapidly becoming another source of “ideal” pancreas donors. Another viable alternative for pancreas recovery is the use of pediatric donors [below the age of 10 years or less than 30 kg in size) [36].

An additional aspect of donor pancreas under-utilization is the decline in experienced recovery teams that are able to adequately manage the donor, define and preserve the anatomy, and safely remove the pancreas intact without compromising any of the abdominal organs [22, 32]. The UNOS Pancreas Transplant Committee noted in a June 2014 Report to the Board of Directors that many pancreas discards were for reasons such as surgical error, surgical damage, and poor allograft description, with some of the discards attributed to the experience level of the recovery surgeon. The number of transplant surgeons actively involved in pancreas transplantation and donation is substantially lower than the number of kidney and/or liver transplant surgeons [18]. In addition, liver and kidney recovery usually take precedence over pancreas recovery among the abdominal organs, and the “liver” team is usually directing the recovery of abdominal organs. The lack of a “pancreas organ advocate” during the retrieval process may limit recovery and placement. In addition, having fewer patients on the waiting list may translate into greater selectivity with respect to donor organ offers. Finally, because of the constraints of cold ischemia coupled with Medicare regulations, pancreas recovery is rarely performed unless a specific recipient or receiving center has been identified preemptively.

Pancreas Allocation and Donor Risk Indices

The new Pancreas Transplant allocation policy [initiated on 10/31/2014) introduced recipient qualifying criteria for eligibility to accrue waiting time for SPK transplant, which limits the body mass index [BMI) cut-off for patients with diabetes mellitus and a C-peptide level >2.0 ng/ml. However, these new criteria are not supported by outcome or utilization data and have the potential to reduce overall pancreas transplant activity [3, 18]. Consequently, these qualifying criteria may be removed from the waiting list process. The overall decline in pancreas transplant activity is also temporally associated with the development and introduction of the Pancreas Donor Risk Index as a screening tool into clinical practice, in which multiple risk factors such as donor age, BMI, and cold ischemia time are integrated into a composite score to objectify donor assessment [37]. The Pancreas Donor Risk Index was designed using UNOS data to provide a predictive model to estimate post-transplant graft survival using pretransplant variables. While the Pancreas Donor Risk Index may accurately discriminate optimal versus marginal donor pancreas utilization at the extremes, there are insufficient data to validate its ability to stratify the average risk or suboptimal donor. Therefore, it has not been generally accepted into practice and is rarely used in making decisions about organ offers.

Surgical Techniques

Prior to the mid-1980s, a number of different techniques of exocrine drainage were investigated and many pancreas transplants were performed as segmental grafts [13–15]. During this developmental phase, exocrine drainage techniques were considered to be the “Achilles’ heel” of pancreas transplantation. From the late-1980s to 1995, the majority of pancreas transplants were performed as whole organ pancreatic grafts with systemic venous and bladder exocrine drainage [systemic-bladder technique). The advent of bladder drainage of the exocrine secretions revolutionized the safety and improved the success of pancreas transplantation. However, starting in 1995, a seismic shift from bladder to enteric exocrine drainage occurred coincident with improvements in immunosuppression, preservation techniques, diagnostic monitoring, general medical care, and the success of enteric conversion [13–15]. In the new millennium, most pancreas transplants have been performed as whole organ pancreatico-duodenal grafts with systemic venous delivery of insulin and enteric exocrine drainage [systemic-enteric technique) [1, 3, 5].

Enteric drainage usually refers to jejunal or ileal diversion of the exocrine secretions either with or without a diverting Roux limb[13–15]. Pancreas transplantation with primary enteric exocrine drainage accounted for 91% of SPK, 89% of PAK, and 89% of PTA cases in the US from 2010–2014 [3]. However, during this time, the systemic-bladder technique remained a viable option in selected cases and a preferred option at specific centers [1]. Of the cases performed with enteric drainage in the US, the proportions performed with a diverting Roux-en-y limb were 21% in SPK, 15% in PAK, and 15% in PTA cases [3, 5, 6]. To improve the physiology of pancreas transplantation, an innovative technique of portal venous delivery of insulin and enteric drainage of the exocrine secretions [portal-enteric technique) was developed in the early 1990s and refined over the past 20+ years [14, 15]. Currently, the proportions of enteric-drained cases performed with portal venous delivery of insulin are 22% in SPK, 11% in PAK, and 13% in PTA cases [3]. While the potential of the portal-enteric technique has not been fully realized, it has spawned a number of newer techniques of enteric exocrine drainage including duodenal or gastric diversion [14, 15]. A number of studies have demonstrated no major or consistent differences in outcomes for bladder-drained or enteric-drained pancreas transplants with either portal or systemic venous drainage [13–15]. The surgical complication rate also does not vary according to the type of transplant [SPK versus solitary pancreas transplantation). The incidence of duodenal segment leaks has been reported to be 5–20% in bladder-drained and 5–8% in enteric-drained pancreas transplants [13–15, 27, 38]. Increasing experience with enteric exocrine drainage is likewise associated with a decreased incidence of surgical complications. Although nearly all pancreas transplants are currently performed with one of the three above techniques, current philosophy dictates that the most appropriate technique to be performed is defined by both donor and recipient anatomy as well as the individual surgeon’s comfort level and experience.

Recipient Selection and Waiting List Considerations

The number of additions to the kidney-pancreas waiting list in the US steadily decreased from a high of 1935 in 2000 to 1228 in 2017 [5, 6]. In addition, the number of prevalent candidates [active and inactive) on either the kidney-pancreas or the pancreas waiting lists steadily decreased from 3499 in 2002 to 2518 in 2018. The number of active candidates has decreased by more than 50%, from 2776 in 2002 to 1039 in 2018. In spite of fewer patients on the active waiting list, median waiting times for kidney-pancreas transplantation have continued to increase and range from 1.2 to 4 years depending on blood type. In the past decade, the proportion of recipients who are older, African American, have a higher BMI, or are characterized as having type 2 diabetes have all increased [1, 3, 5, 6]. Recent studies have reported that pancreas transplantation can be successfully performed in selected patients with non-type 1 diabetes [7–10, 39]. In 2013, 25.7% of candidates on the waiting list were ≥ age 50 years, 19.7% were African American [11.4% were Hispanic), 19.1% had a BMI ≥ 30 kg/m2, and 8.9% were classified as having type 2 diabetes. This positive trend in successfully transplanting higher risk patients that were excluded from receiving a pancreas transplant in the past has become possible secondary to significant advances in surgical techniques, immunosuppression and post-transplant medical management strategies. Unfortunately, guidelines for liberalizing recipient criteria have not been widely promulgated or accepted by the medical and surgical communities.

Immunosuppression and Immunological Outcomes

The history of pancreas transplantation is a remarkable success story of the last 50 years that is closely linked to advances in biological and immunosuppressive drug therapies [1–3]. Progress in surgical techniques and clinical immunosuppression have led to improving results in vascularized pancreas transplantation that are attributed to reductions in technical failures and immunologic graft losses over time, respectively [1–6, 40]. The use of biologic agents for induction and “cocktails” of multiple agents with varying mechanisms of action for maintenance therapy have become the standard of immunosuppression following pancreas transplantation [1–8, 40–43]. Immunosuppressive strategies in pancreas transplantation have evolved from experience extrapolated in kidney transplantation because the majority are performed as SPK transplants. Unlike other types of solid other transplants, pancreas transplantation provides an excellent paradigm to study acute rejection because insulin-requiring diabetic patients represent a relatively homogeneous patient population who historically had a high rate of acute rejection possibly because of variable drug absorption [from impaired gastric emptying] or heightened immune responsiveness from the presumed auto-immune etiology of diabetes. In addition, adding a pancreas to a kidney allograft appears to increase the risk of acute rejection, which may be related to the inherent immunogenicity of the pancreas graft or perhaps because of increased antigen load or altered antigen presentation in the recipient. [43–46] Consequently, SPK transplantation has been associated with a higher rate of acute rejection compared to other transplanted organs whereas solitary pancreas transplantation may have even a higher rate of acute rejection secondary in part to limitations in monitoring the pancreas graft. [2, 23, 47]

At present, 90% of SPKT recipients receive antibody induction, with nearly 80% receiving a depleting antibody agent. [3–6, 43] Depleting antibody induction using a biological agent has become a cornerstone of contemporary immunosuppression in pancreas transplantation. The rationale for the evolving trend in depleting antibody induction is to provide a more potent immunosuppressive umbrella of protection for maintenance therapies that incorporate minimization strategies such as corticosteroid elimination or avoidance, calcineurin inhibitor reduction or withdrawal, or even calcineurin inhibitor monotherapy. According to International Pancreas Transplant Registry data, rabbit anti-thymocyte globulin and alemtuzumab are currently the two most commonly used antibody induction agents in SPK transplantation. One-year rates of acute rejection have steadily decreased and are currently in the 5–20% range depending on pancreas transplant category, case mix and immunosuppressive regimen. [3, 4, 6] Historically, these regimens were based primarily on efficacy in the prevention of acute rejection. However, the amount, frequency, and duration of various agents must be tailored according to individualized risk factors. Although nearly all possible combinations of maintenance immunosuppressive protocols have been used, nearly 80% of patients in the recent past have received maintenance therapy with the tacrolimus/mycophenolate combination, and 30–50% have undergone either early or delayed corticosteroid withdrawal without adverse consequences. [3–5, 40–43] The current one-year rate of immunological pancreas graft loss is 1.8% in SPK transplant recipients. [3, 4, 6] Although depleting antibody induction strategies are associated with lower rates of acute rejection compared to either no induction or non-depleting antibody induction, somewhat surprisingly no major differences in mid-term patient or graft survival rates or graft function have been noted according to method of antibody induction. As early graft survival rates have improved because of lower rates of both acute rejection and immunological graft loss, the consequences of chronic rejection have become more important. [45] Ultimately, the development of a non-nephrotoxic, non-diabetogenic, and non-gastrointestinal toxic maintenance immunosuppressive regimen is highly desirable to improve outcomes and quality of life in pancreas transplant recipients. Immunosuppressive strategies will continue to evolve to safer, less toxic, and more targeted therapies with similar or improved efficacy long-term compared to currently available regimens.

Pancreas Versus Islet Transplantation

PTA and islet transplantation are usually linked together as equivalent beta-cell replacement strategies for patients with diabetes in the absence of chronic kidney disease, both of which are then considered as investigational therapies rather than as standards of care. [24–26] Unfortunately, this characterization is not accurate and confusing to patients who might benefit from PTA. In 2000, Shapiro, et al, published their landmark paper on successful islet transplantation in seven patients using the “Edmonton” protocol. [48] Although islet transplant outcomes have continued to improve, overall graft function and durability have not matched those achieved for PTA. [2, 23, 30, 49] In fact, complete and stable long-term insulin independence is uncommon and, in current studies, is not even a primary endpoint following islet transplantation. In addition, “successful” islet transplantation frequently requires more than one donor pancreas. Unlike PTA, islet transplantation remains in a developmental phase with slightly improved success rates only reported in the new millennium in a few hundred cases. At present, islet transplantation is not approved by the Center for Medicare and Medicaid Services in the US, but is paid for by public health systems in some other countries. Similar to islet transplantation, other novel diabetes management options such as the “bionic pancreas”, immunotherapy, gene therapy and stem cell therapy remain innovative yet unrealized investigational ventures that have overshadowed enthusiasm for PTA. Moreover, none of these promising therapies have the current established successful track record of PTA but are being touted as potential “cures” for diabetes. Yet, the mere prospect of potential effectiveness with non- or less-invasive treatment options has subjugated the proven success of PTA.

Summary and Conclusion

In spite of the increasing success of pancreas transplantation, it seemingly has been relegated to a secondary or even tertiary role in the management of diabetes. Overall advances in diabetes management, education and awareness; newer insulin analogues and glucose sensors; state of the art, portable, and more patient-friendly insulin pumps; and the potential of the artificial or bionic pancreas have all contributed to the diversion of interest away from pancreas transplantation as a viable treatment option in the absence of uremia. Pancreas transplantation has been performed with a high and increasing level of success for 30 years. Consequently, it is logical to assume that the diabetes care community will not change their perception of pancreas transplant as a “last resort” form of therapy. However, in spite of recent trials and tribulations, pancreas transplantation remains an important therapeutic alternative for selected patients with hyperlabile or “complicated” diabetes who cannot be managed optimally with conventional insulin therapy. Ultimately, a more reliable source of high quality organs, less diabetogenic [and less toxic] immunosuppression, and lower surgical morbidity are needed in order to propel pancreas transplantation into the forefront of widely accepted management strategies for patients with insulin-requiring diabetes.

Because the healthcare landscape is a moving target, new and innovative ways to educate the public and medical community are needed to correct misperceptions about pancreas transplantation. In addition to conducting outreach sessions with endocrinologists and diabetologists, the pancreas transplant community needs to reach the vast number of family practice physicians who manage the majority of patients with diabetes. Regarding “promotion” of pancreas transplantation, recent data and new evidence needs to be disseminated using not only conventional publications but also social networking, medical websites, media campaigns and through re-engaging the American Diabetes Association. Ultimately, the most important factor for more widespread application of pancreas transplantation remains education, including ongoing engagement of patients with diabetes and health care professionals. Various types of media and social networks could and should function as ideal platforms for recipients of successful pancreas transplants to spread the message that complete and durable insulin-independence is an attainable goal in the majority of cases.

From a transplant community perspective, greater emphasis needs to be placed on improving pancreas recovery rates including removing financial disincentives, facilitating broader sharing with charter aircraft to minimize cold ischemia, implementing pancreas donor advocates, expanding acceptable donor criteria to include selected donation after circulatory death donors and pediatric donors, and assuring that abdominal organ recovery surgeons are experienced in pancreas recovery. In addition, liberalizing recipient selection to include older patients as well as non-type 1 diabetics with uremia and expanding indications for solitary pancreas transplantation (PAK and PTA) will increase the size of the waiting list, which ultimately drives pancreas utilization. Recent studies have suggested that even at active pancreas transplant centers, there are a number of patients who are either on the kidney waiting list or whom have received successful kidney alone transplantation who may benefit from either SPK or PAK transplantation. Having a multidisciplinary team in place to specifically evaluate uremic diabetic individuals for pancreas transplantation can facilitate the “pipeline” by effectively triaging more potential candidates, increase “internal conversions” from the kidney to the SPK transplant waiting list, and identifying patients who may benefit from PAK transplantation. [50] Rather than relying on the diabetes care and nephrology communities for access to potential pancreas transplant candidates, kidney transplant centers must become accountable for providing the opportunity for pancreas transplantation. For SPK transplant recipients with potential living donors, one might consider having the living donor donate their kidney to someone else on the kidney waiting list in exchange for priorization on the SPK waiting list. Alternatively, a more assertive approach to PAK transplantation may be warranted. In spite of recent challenges, pancreas transplantation remains an important therapeutic option for selected patients with hyperlabile or “complicated” diabetes who cannot be managed optimally with conventional insulin therapy.

Abbreviations

ASTS: American Society of Transplant Surgeons

BMI: Body Mass Index

DCD: Donation after Cardiocirculatory Death

IPTR: International Pancreas Transplant Registry

PAK: Pancreas after Kidney

PTA: Pancreas Transplant Alone

SPK: Simultaneous Pancreas-Kidney

UK: United Kingdom

UNOS: United Network for Organ Sharing

US: United States

References

  1. Gruessner RW, Gruessner AC (2013) The current state of pancreas transplantation. Nat Rev Endocrinol 9: 555–562. [crossref]
  2. Gruessner RW, Gruessner AC (2013) Pancreas transplant alone: a procedure coming of age. Diabetes Care 36: 2440–2447. [crossref]
  3. Gruessner AC, Gruessner RW (2016) Pancreas Transplantation of US and Non-US Cases from 2005 to 2014 as Reported to the United Network for Organ Sharing (UNOS) and the International Pancreas Transplant Registry (IPTR). Review of Diabetic Studies 13: 35–58.
  4. Updated International Pancreas Transplant Registry (IPTR) data, Angelika Gruessner (personal communication); United Network for Organ Sharing (UNOS).
  5. Kandaswamy R, Stock PG, Gustafson SK, Skeans MA, et al. (2018) OPTN/SRTR 2016 Annual Data Report: Pancreas. Am J Transplant 18: 114–171. [crossref]
  6. Gruessner AC, Gruessner RWG (2018) Pancreas Transplantation for Patients with Type 1 and Type 2 Diabetes Mellitus in the US – A Registry Report. Gastroenterol. Clin N Am 47: 417–441.
  7. Orlando G, Stratta RJ, Light J (2011) Pancreas transplantation for type 2 diabetes mellitus. Curr Opin Organ Transplant 16: 110–115. [crossref]
  8. Stratta RJ, Rogers J, Farney AC, et al. (2015) Pancreas transplantation in C-peptide positive patients: Does “type” of diabetes really matter? J Am Coll Surg 220: 716–727.
  9. Gruessner AC, Laftavi MR, Pankewycs O, Gruessner RWG (2017) Simultaneous Pancreas and Kidney Transplantation – Is it a Treatment Option for Patients with Type 2 Diabetes Mellitus? An Analysis of the International Pancreas Transplant Registry. Current Diabetes Reports 17: 44 (1–9).
  10. Rogers J, Farney AC, Orlando G, Iskandar SS, Doares W, et al. (2014) Pancreas transplantation: The Wake Forest experience in the new millennium. World J Diabetes 5: 951–961. [crossref]
  11. Redfield RR, Scalea JR, Odorico JS (2015) Simultaneous pancreas and kidney transplantation: current trends and future directions. Curr Opin Organ Transplant 20: 94–102.
  12. Gruessner AC, Gruessner RWG (2016) Long-term Outcome after Pancreas Transplantation – A Registry Analysis. Curr Opin Organ Transplant 21: 377–385.
  13. Boggi U, Amorese G, Marchetti P (2010) Surgical techniques for pancreas transplantation. Curr Opin Organ Transplant 15: 102–111. [crossref]
  14. Rogers J, Farney AC, Orlando G, Farooq U, Al-Shraideh Y, et al. (2014) Pancreas transplantation with portal venous drainage with an emphasis on technical aspects. Clin Transplant 28: 16–26.
  15. El Hennawy H, Stratta RJ, Smith F (2016) Exocrine Drainage in Vascularized Pancreas Transplantation in the New Millennium. World J Transplant 6 (2): 255–71. doi: 10.5500/wjt.v6.i2.255.
  16. Boggi U, Signori S, Vistoli F, et al. (2012) Laparoscopic robot-assisted pancreas transplantation: First world experience. Transplantation 93: 201–206.
  17. Cantrell LA, Oberholzer J (2018) Robotic pancreas transplantation: the state of the art. Curr Opin Organ Transplant 23: 423–427. [crossref]
  18. Stratta RJ, Gruessner AC, Odorico JS, Fridell JA, Gruessner RW (2016) Pancreas Transplantation: An Alarming Crisis in Confidence. Am J Transplant 16: 2556–2562. [crossref]
  19. Gruessner AC, Gruessner RW (2014) Declining Numbers of Pancreas Transplants but Significant Improvements in Outcome. Transplant Proc 46: 1936–1937.
  20. Kopp W, van Meel M, Putter H, Samuel U, Arbogast H, et al. (2017) Center Volume is Associated with Outcome after Pancreas Transplantation within the Eurotransplant Region. Transplantation 101: 1247–1253.
  21. Alhamad T, Malone AF, Brennan DC, Stratta RJ, Chang SH, et al. (2017) Transplant Center Volume and the Risk of Pancreas Allograft Failure. Transplantation 101: 2757–2764. [crossref]
  22. Ausania F, Drage M, Manas D, Callaghan CJ (2015) A registry analysis of damage to the deceased donor pancreas during procurement. Am J Transplant 15: 2955–2962. [crossref]
  23. Niederhaus SV (2015) Pancreas transplant alone. Curr Opin Organ Transplant 20: 115–120. [crossref]
  24. Robertson RP, Davis C, Larsen J, Stratta R, Sutherland DE (2000) ADA Position Statement: Pancreas and islet transplantation for patients with diabetes. Diabetes Care 23: 112–116.
  25. Niclauss N, Morel P, Berney T. (2014) Has the Gap Between Pancreas and Islet Transplantation Closed? Transplantation 98: 593–599.
  26. Moassesfar S, Masharani U, Frassetto LA, et al. (2016) A Comparative Analysis of the Safety, Efficacy, and Cost of Islet Versus Pancreas Transplantation in Nonuremic Patients with Type 1 Diabetes. Am J Transplant 16: 518–526.
  27. Sollinger HW, Odorico JS, Becker YT, D’Alessandro AM, Pirsch JD (2009) One thousand simultaneous pancreas-kidney transplants at a single center with 22-year follow-up. Ann Surg 250: 618–630.
  28. Kleinclauss F, Fauda M, Sutherland DER, Kleinclauss C, Gruessner RW, et al. (2009) Pancreas after living donor kidney transplants in diabetic patients: Impact on long-term kidney function. Clin Transplant 23: 437–446.
  29. Fridell JA, Niederhaus S, Curry M, Fox A: Odorico J (2018). The Survival Advantage of Pancreas after Kidney Transplantation. Am J Transplant 18: in press
  30. Rana A, Gruessner A, Agopian VG, Khalpey Z, Riaz IB, et al. (2015) Survival benefit of solid-organ transplant in the United States. JAMA Surg 150: 252–259. [crossref]
  31. Weiss AS, Smits G, Wiseman AC (2009) Twelve-Month Pancreas Graft Function Significantly Influences Survival Following Simultaneous Pancreas-Kidney Transplantation. Clin J Am Soc Nephrol 4: 988–995.
  32. Fridell J, Rogers J, Stratta RJ (2010) The pancreas allograft donor: Current status, controversies, and challenges for the future. Clin Transplantation 24: 433–449.
  33. Muthusamy AS, Mumford L, Hudson A, Fuggle SV, Friend PJ (2012) Pancreas Transplantation from Donors after Circulatory Death from the United Kingdom. Am J Transplant 12: 2150–2156.
  34. Kopp WH, Lam HD, Schaapherder AFM, et al. (2018) Pancreas Transplantation with Grafts from Donors Deceased after Circulatory Death: 5 years Single-Center Experience. Transplantation 102: 333–339.
  35. Finger EB, Radosevich DM, Dunn TB, Chinnakotla S, Sutherland DE, et al. (2013) A composite risk model for predicting technical failure in pancreas transplantation. Am J Transplant 13: 1840–1849. [crossref]
  36. Fernandez L, Turgeon NA, Odorico JS, et al. (2004) Superior Long-Term Results of Simultaneous Pancreas-Kidney Transplantation from Pediatric Donors. Am J Transplant 4: 2093–2101.
  37. Axelrod DA, Sung RS, Meyer KH, et al. (2010) Systematic Evaluation of Pancreas Allograft Quality, Outcomes, and Geographic Variation in Utilization. Am J Transplant 10: 837–845.
  38. Sutherland DE, Gruessner RW, Dunn DL, Matas AJ, Humar A, et al. (2001) Lessons learned from more than 1,000 pancreas transplants at a single institution. Ann Surg 233: 463–501. [crossref]
  39. Wiseman AC, Gralla J (2012) Simultaneous Pancreas Kidney Transplant Versus Other Kidney Transplant Options in Patients with Type 2 Diabetes. Clin J Am Soc Nephrol 7: 656–664.
  40. Odorico JS, Sollinger HW (2002) Technical and immunosuppressive advances in transplantation for insulin-dependent diabetes mellitus. World J Surg 26: 194–211.
  41. Singh RP, Stratta RJ (2008) Advances in immunosuppression for pancreas transplantation. Curr Opin Organ Transplant 13: 79–84. [crossref]
  42. Heilman RL, Mazur MJ, Reddy KS (2010) Immunosuppression in simultaneous pancreas-kidney transplantation: progress to date. Drugs 70: 793–804. [crossref]
  43. Stratta RJ, Farney AC, Rogers J, Orlando G (2014) Immunosuppression for Pancreas Transplantation with an Emphasis on Antibody Induction Strategies: Review and Perspective. Expert Rev Clin Immunol 10: 117–132.
  44. Reddy KS, Davies D, Ormond D, Tuteja S, Lucas BA, et al. (2003) Impact of acute rejection episodes on long-term graft survival following simultaneous kidney-pancreas transplantation. Am J Transplant 3: 439–444. [crossref]
  45. Humar A, Khwaja K, Ramcharan T, Asolati M, Kandaswamy R, et al. (2003) Chronic rejection: the next major challenge for pancreas transplant recipients. Transplantation 76: 918–923. [crossref]
  46. Troxell ML, Koslin DB, Norman D, et al. (2010) Pancreas allograft rejection: analysis of concurrent renal allograft biopsies and posttherapy follow-up biopsies. Transplantation 90: 75–84.
  47. Gruessner RWG, Sutherland D, Kandaswamy R, et al. (2008) Over 500 solitary pancreas transplants in nonuremic patients with brittle diabetes mellitus. Transplantation 85: 42–47.
  48. Shapiro AM, Lakey JR, Ryan EA, et al. (2000) Islet transplantation in seven patients with type 1 diabetes mellitus using a glucocorticoid-free immunosuppressive regimen. N Engl J Med 343: 230–38.
  49. Schuetz C, Anazawa T, Cross SE, Labriola L, Meier RPH, et al. (2018) β Cell Replacement Therapy: The Next 10 Years. Transplantation 102: 215–229. [crossref]
  50. Scalea JR, Sultan S, Lamos EM, Bartlett ST, Barth RN (2018) Improvement in Pancreas Transplant Evaluation and Surgical Volume Using a Multidisciplinary Approach. Am J Transplant 18: 1295–1296.

Plasma Visfatin is reduced in Subjects with the Metabolic Syndrome and Pre-Diabetes

DOI: 10.31038/EDMJ.2018234

Abstract

The adipocytokine Visfatin (VF) has been linked with visceral adiposity, insulin resistance and Metabolic Syndrome (MS), however, studies have been inconsistent regarding its relationship with these metabolic enteties. The aim of this study was to explore the relationships between plasma VF, High Molecular Weight (HMW) Adiponectin and the MS.

We measured fasting plasma VF and HMW Adiponectin in 29 males with the MS and 29 age-matched male controls. Plasma VF was significantly reduced in MS subjetcs compared to controls (98.2 ± 29.7 Vs.141.4 ± 39.1 ng/ml, respectively, P=0.04). One Way ANOVA showed that subjects with MS and pre-diabetes had extremely lower concentrations of plasma VF (60.8 ± 35.9 Vs141.4 ± 39.1 ng/ml ), for MS and controls, respectively, P < 0.009. HMW Adiponectin concentrations were similar in both groups and negatively correlated with HOMA-IR(r = -0.40, P= 0.03). Using Stepwise regression, WC was independently associated with plasma VF concentrations. There was no correlation between plasma VF and insulin sensitivty or beta cell function measured with HOMA-IR and HOMA % B, respectively.

In conclusion: Reduced plasma VF concentrations may play a role in the pathophysiology of pre-diabetes and cardiometabolic risk, however, this will require further study.

Keywords

Metabolic Syndrome, Visfatin, HMW adiponectin

Introduction

Visceral adipose tissue produces a number of adipocytokines such as adiponectin, tumour necrosis factor-alpha, and interlukin (IL)-6, which modulate insulin sensitivity and appear to play an important role in the pathogenesis of insulin resistance, diabetes, inflammation and atherosclerosis [1–3]. Visfatin (VF) is a recently discovered adipocytokine that was first described by Fukuhara and colleagues in 2005 as being exclusively secreted by visceral fat and had insulin-mimetic properties [4]. VF corresponds to a 52 kilodalton cytokine known as Pre-B- Cell Colony-Enhancing Factor or (PBEF) responsible for maturation of B cell precursors [5]. VF/PBEF has also been shown to be an enzyme that catalyses the rate-limiting step in the Nicotinamide Adenine Dinucleotide (NAD) biosynthetic pathway and is known as nicotinamide phosphoribosyltransferase or ‘Nampt’ [6]. Nampt exists in two forms: intracellularly as ‘iNampt’ and extracellularly as ‘eNampt’; the latter corresponds to VF/PBEF [7]. Administration of exogenous VF to animal models of acute myocardial infarction was shown to be cardioprotective [8]. Moreover, Revollo and colleagues showed that Nampt is essential for normal beta cell function when they demonstrated that Nampt (+/-) heterozygous mice had defects in both NAD biosynthesis and Glucose-Stimulated Insulin Secretion (GSIS) [9]. Interestingly, Nampt(+/-) heterozygous mice developed impaired glucose tolerance and the administration of NMN(the product of Nampt reaction) corrected the defects in GSIS and restored normal glucose tolerance [9]. However, in human beings, the relationship between VF/PBEF/eNampt and the metabolic syndrome (MS), insulin resistance, obesity, and cardiovasular disease has been controversal, as evidenced by the conflicting results from published work [10–12] . It is well established that higher concentartions of plasma adiponectin have been shown to be cardioprotective while reduced concentrations of plasma adiponectin have been linked to cardiovascualr disease insulin resistance, obesity and the MS [13–15]. We hypothesed that subjects with the MS, who are at increased risk of developing type 2 diabetes and cardiovascular disease, would have reduced concentrations of circulating plasma VF. We also measured HMW Adiponectin, the active form among adiponectin multimers.

Research Design, Subjects and Methods

This was a cross-sectional study. Construction workers were screened for diabetes, pre-diabetes and cardiometabolic risk factors as part of a pilot health screening programme conducted by the Construction Workers’ Health Trust (CWHT). Data including demographics, anthropometric measurments, FindRisk diabetes questionnaire, and laboratory results were prospectively entered into a central database. The study population was predominantly male (99 %). A random sample of exclusively male subjects was taken from the central database for the purpose of this study . The full details of the study can be found in the Construction Workers Health Trust screening study [16]. The study protocol was approved by the Joint Research Ethics Committee of the Federated Dublin Voluntary Hospitals and St James’ Hospital. All participants signed written informed consent.

Measurement of Biomarkers

Body weight and height were measured in participants wearing light clothing without shoes. BMI was calculated as weight in kilograms divided by height in meters square. Waist circumference was measured at the level of the umbilicus. Hip circumference was measured at the level of the anterior superior iliac spine. Blood pressure was measured in the sitting position after a 10-min rest period in the left arm. Blood samples were taken in the morning after a 12-hour overnight fast. All measurements and samples were obtained at the healthcare centres provided at construction work sites.

Laboratory Analysis

Fasting bloods were obtained after 12 hours fast and included the following: plasma glucose, lipid profile, insulin, plasma visfatin, and plasma HMW adiponectin. Plasma glucose was measured using a glucose oxidase method [bio Merieux kit/ Hitachi Modular]. Plasma total cholesterol and triglycerides were measured using enzymatic methods (Human Liquicolor kits/ Hitachi Modular). Plasma high-density lipoprotein [HDL] cholesterol and Low-Density Lipoprotein (LDL) cholesterol were measured directly with enzymatic methods (Randox direct Kits/ Hitachi Modular).

Visfatin and HMW Adiponectin Assays

VF was measured in fasting EDTA plasma samples by a specific Enzyme-Linked Immunosorbent Assay (ELISA) [linear range, 0.1–1000 ng/mL; specificity, 100% human) [17], obtained from Phoenix Pharmaceuticals Inc. (Karlsruhe, Germany). The intra-assay coefficient of variation was 5.6% and 5.8% for low and high VF concentrations, respectively. Data were expressed as absolute concentrations.

HMW Adiponectin was determined from fasting EDTA plasma sample by ELISA detection [Millipore]. For measurement of high molecular weight adiponectin plasma samples were extracted with protease treatment following manufacturer’s instructions. Sensitivity of the assay is 0.5ng/ml and the coefficients of intra-assay variations were 0.97–3.41%.

Insulin Sensitivity and Beta Cell Function

Insulin sensitivity was estimated using the homeostasis model assessment for insulin resistance index (HOMA-IR); beta cell function was assessed by HOMA-B. Both HOMA-IR and HOMA-B was quantified using a HOMA calculator as previously described [18].

Glucose Metabolism

All subjects had fasting plasma glucose as screening test and those who had impaired fasting glucose (IFG) of ≥ 5.6 mmol/l underwent a 2- hour oral glucose tolerance test (OGTT) . Subjects were further sub-classified as having impaired glucose tolerance (IGT) if the 2-hours postprandial glucose value was between 7.8 – 11.0 mmol/l or diabetes if the fasting plasma glucose value was ≥ 7.0 mmol/l and/or 2-hours postprandial glucose value ≥ 11.1 mmol/l.

Definition of the Metabolic Syndrome

The Metabolic Syndrome (MS) was defined according to the International Diabetes Federation (IDF) criteria [19] Subjects with the MS were further divided according to the results of oral glucose tolerence and fasting plasma glucose results: subjects with MS and Normal Glucose Tolerance (NGT) were referred to as (NGT-MS); subjects with MS and (IFG) as IFG-MS, and subjects with MS and IGT as (IGT-MS). We excluded subjects with previously diagnosed diabetes, as they have established cardiovascular risk and their inclusion as MS is controversial.

Statistical Analysis

The demographic characteristics of study participants are presented as mean +/- SEM. Since VF, HMW Adiponectin and the other biomarkers were not normally distributed; Mann-Whitney test was used to test the differences between subjects with the MS and controls. Spearman’s correlations were used to examine correlations between VF, HMW Adiponectin and the other biomarkers. Logarithmic transformations of the biomarkers were used in One Way ANOVA to compare the differences in VF and HMW adiponectin levels between the subgroups of the MS and the controls. Also, logarithmic transformations of the biomarkers were used in stepwise multiple regression analyses to identify the independent predictors of VF and HMW Adiponectin. All statistical analyses were performed using SPSS (SAS, Version 13). Statistical significance was set at P<0.05

Results

The baseline characteristics of the study subjects are shown in Table 1. As expected, subjects with MS had significantly higher BMI, Waist Circumference (WC), Fasting Plasma Glucose (FPG), Triglycerides (TGs) and Waist Hip Ratio (WHR). MS subjects were more insulin resistant compared to controls (Table 1). Systolic BP was marginally higher in MS subjects; LDL-cholesterol, total cholesterol and beta cell function (HOMA-B) were not different between the two groups. MS subjects had significantly higher FINDRISC score, indicating increased lifetime risk for developing type 2 diabetes [20].

Table 1. Baseline characteristics of the study subjects.

Biomarker

MS Subjects
(N=29)

Controls
(N=29)

P value

Age, Years

43.5 ± 2.0

39.1 ± 1.8

0.133

BMI, kg/m2

30.7 ± 0.8

27.2 ± 0.8

0.002

Waist Circumference(WC), cm

108 ± 2.

96 ± 2

<0.0001

Waist: Hip Ratio(WHR)

1.01 ± 0.1

0.97 ± 0.01

0.004

Systolic BP, mmHg

137 ± 2

132 ± 3

0.08

Diastolic BP, mmHg

85 ± 2

82 ± 2

0.17

Fasting plasma glucose, mmol/l

5.4 ± 0.1

4.9 ± 0.1

0.012

HDL-Cholesterol , mmol/l

1.06 ± 0.03

1.24 ± 0.1

0.005

Triglycerides, mmol/l

1.8 ± 0.1

1.1 ± 0.1

<0.0001

Total Cholestrol, mmol/l

5.13 ± 0.13

5.06 ± .016

0.56

Fasting Insulin, pmol/l

60.6 ± 4.5

51.9 ± 11

0.004

HOMA-IR

1.15 ± 0.08

0.96 ± 0.1

0.004

HOMA % B

90.1 ± 5

88.5 ± 8.2

0.29

HOMA % S

101.6 ± 8

160.9 ± 16.6

0.003

FindRisk Score

10

6

0.002

Visfatin (VF), ng/ml

98.2 ± 29.7

141.4 ± 39.1

0.041

HMW Adiponectin, ng/ml

4103 ± 610

4074 ± 434

0.36

Data presented as mean ± SEM. SEM=Standard error of the mean. P value obtained from Mann Whitney test.

Plasma Visfatin and HMW Adiponectin

Subjects with the MS had significantly reduced circulating concentrations of plasma VF compared to controls (98.2 ± 29.7 vs.141.4 ± 39.1 ng/ml, P=0.041), as shown in Table 1. One Way ANOVA showed that subjects with the MS and pre-diabetes (IFG/IGT) had significantly lower VF concentrations 60.8 ± 35.9 ng/ml when compared to controls(141 ± 39.1 ng/ml), P =0.009), and marginally lower VF concentrations when compared with subjects with the MS and normal glucose metabolism(133.2 ± 46 ng/ml), P=0.05, as shown in Figure 1. Likewise, Mean HMW adiponectin levels were similar between the two groups(4103 ± 610 ng/ml in MS subjects vs. 4074 ± 434 ng/ml in controls, P=0.36). One-Way ANOVA showed that subjects with MS and pre-diabetes had slightly lower concentrations of HMW adiponectin compared to both subjects with MS and normal glucose tolerance and controls, however, it did not reach statistical significance (Table 3).

Table 2. Spearman’s correlations between plasma VF, HMW Adiponectin and the different biomarkers in the whole group.

Biomarker

Visfatin
N=58

HMW adiponectin
N=58

Weight

r = -0.316, P=0.016

r = -0.13, P=0.43

BMI

r= -0.30, P=0.02

r = -0.05, P=0.68

WC

r= -0.33, P=0.012

r = -0.07, P=0.60

Age

r= -.26, P=0.053

r = 0.10, P=0.43

SBP

r = -0.15, P= 0.26

r = -0.09, P=0.46

DBP

r = -0.23, P=0.07

r = 0.08, P=0.53

TGs

r = – 0.08, P =0.52

r = -0.19, P= 0.15

FPG

r = -0.32, P = 0.015

r= -0.04, P=0.70

Fasting insulin

r= 0.15, P=0.28

r = 0.16, P=0.22

HOMA-IR

r = 0.15, P=0.27

r= -0.17, P=0.20

HOMA % B

r =0.09, P=0.48

r = 0.48, P=0.22

HDL-C

r = -0.10, P=0.41

r = 0.46, P=0.0001

FINDRISC score

r = -0.26, P=0.052

r =0.09, P=0.51

Table 3. One Way ANOVA. Plasma Visfatin and HMW Adiponectin levels according to metabolic syndrome status and glucose metabolism.

Biomarker

Controls

N=(29)

NGT+ MS

N=(15)

IFG/IGT+MS

(N=14)

P value

Mean plasma Visfatin, ng/ml

141.4 ± 43

133.2 ± 46

60.8 ± 35.9 ¥

Mean plasma HMW Adiponectin, ng/ml

4074.4 ± 433.6

4592.8 ± 920

3613.6 ± 812

 NS

HOMA-IR

0.96 ± 0.2

0.97 ± 0.1

1.3 ± 0.1

HOMA % S

160.9 ± 16.7

118 ± 11.7

82.8 ± 8.5

HOMA % B

88.5 ± 8

100.7 ± 7

77.8 ± 5.7

NS

One way ANOVA comparing mean Visfatin and HMW Adiponectin concentrations between the groups.
NGT+MS: Normal Glucose Tolerant Subjects with Metabolic Syndrome.
IGT+MS: Impaired Glucose Tolerant Subjects with the Metabolic Syndrome.
IFG+MS: Subjects with Metabolic Syndrome and Impaired Fasting Glucose.
¥P value < 0.009 between controls and IFG/IGT+MS.
P =0.05 between NGT+MS and IFG/IGT+MS.
NS: No Significant difference between the groups P > 0.05.
P value= 0.011 between controls and IFG/IGT+MS.
P value < 0.009 between controls and IFG/IGT+MS.

EDMJ 2018-107 - Imad Brema Saudi Arabia_F1

Figure 1. One Way ANOVA comparing mean Visfatin concentrations between the groups.

NGT MS: normal glucose tolerance metabolic syndrome; IGT: impaired glucose tolerance; IFG: impaired fasting glucose. NS: not significant. Error bars represent standard error of the mean.

Correlations between Visfatin, HMW adiponectin and other biomarkers

Spearman’s correlations between VF, HMW adiponectin and the different biomarkers are shown in Table 2.

In the whole group, VF negatively correlated with FPG ( r= -0.31, P=0.015), WC (r= -0.32, P=0.012), Weight (r=-.316, P=0.016) and BMI (r= -0.30, P=0.02), as shown in Table 2. There was a negative correlation between plasma VF and the FINDRISC score with marginal statistical significane (r=-.26, P=0.052). In MS subjects alone , VF negatively correlated with FPG, (r= -0.34 p=0.018).

VF did not correlate with fasting insulin, HOMA-IR or HOMA-B in either group.

HMW adiponectin levels positively correlated with HDL-Cholesterol (HDL-C) in MS subjects (r= 0.43, P=0.02), as well as in the whole group (r= -0.46, P <0.0001). In MS subjects alone, HMW adiponectin negatively correlated with fasting insulin(r=-0.40, P=0.037) and HOMA-IR (r=-0.40, P=0.038).

There was no significant correlation between VF and HMW adiponectin in the whole group or in each group seperately.

Multiple stepwise regression analysis showed that log WC was negatively and independently associated with VF, in a model that included log VF as the dependenet variable, and log WC, log FPG and log fasting TGs as independent variables. This model showed an R2 of 0.100 and P=0.016. β-coefficient was -3.522. WC explained 10 % of VF variance. Likewise, log HDL-C was positively and independently associated with log HMW Adiponectin in a model that included HMW Adiponetin as the depenent variable and log HOMA-IR, log HDL-C and log WC as independent variables. β-coefficient: 1.42, P=0.001. log HDL-C explained 19.7 % of the variation in log HMW adiponectin.

Discussion

In the present study, we showed that male subjects with increased cardiometabolic risk profile and insulin resistance had significantly reduced concentrations of plasma VF, which negatively correlated with FPG, WC, weight and BMI . Moreover, we showed that subjetcs with the MS and pre diabetes had very low concentrations of plasma VF not only when compared to controls, but also when compared to subjects the MS and normal glucose tolerance, although with marginal statistical significnace. In addition, we showed a non-significnat trent of a negative correlation between plasma VF and the FindRisk score, which suggests that lower concentations of plasma VF may be associated with increased lifetime risk of developing type 2 diabetes but this oservation requires further clarification in a larger study. The inverse and independant association between plasma VF and WC in the stepwise regression may indicate an indirect relationship between reduced plasma VF concentrations and the risk of developing type 2 diabetes and cardiovascular disease, however, again this requires further exploration in future studies as causality could not be assumed from our cross-sectional study. Several studies have explored the relationship between VF and the MS in the past few years with conflicting results. In agreement with our study, plasma Visfatin/Nampt levels has been shown to be reduced in patients with MS and type 2 diabetes in one study [21]. Most studies repored increased plasma VF concentration was shown to be increased in subjects with MS in two previous studies [11, 22–24]. Three more studies found no association between plasma VF and the MS [12, 25, 26]. It is worthwhile mentioning that the patient characteristics and/or the criteria for defining the MS were different in all the three studies mentioned above and this may have affected the results. The mechanisms underlying the association between low plasma VF concentrations and the MS in our study are not fully understood, however, a possible mechanism may be through the modification of the activity of the downstream target, SIRT1 which may be supported by the findings of De Kreutzenberg and colleagues, who showed that subjects with the MS and increased insulin resistance had reduced SIRT1 gene and protein expression [27]. Moreover, the same authors showed that high glucose and palmitate concentrations resulted in downregulation of Nampt (Visfatin expression, a reduction in intracellular NAD (+) levels and a reduction in SIRT1 activity in mononuclear cells from subjects with MS [27]. A more recent study by Yoshino and colleagues reported that Nampt-mediated NAD+ biosynthesis is severely compromised in both diet and age-induced models of diabetes in mice [28] . Interestingly, the authors showed that Nicotine Mononucleotide ( NMN), the product of Nampt reaction, was effective to treat the two different animal models of diabetes [28]. Moreover, Revollo and colleagues showed that Nampt is essential for normal beta cell function when they demonstrated that Nampt (+/-) heterozygous mice had defects in both NAD biosynthesis and glucose-stimulated insulin secretion (GSIS) [9]. Interestingly, Nampt (+/-) heterozygous mice developed impaired glucose tolerance and the administration of NMN (the product of Nampt reaction) corrected the defects in GSIS and restored normal glucose tolerance. In our study, we did not find any correlation between fasting plasma VF and insulin sensitivity measured by HOMA-IR, which is in agreement with several other studies which showed lack of association between Plasma VF and insulin resistance [29–31]. We found no correlation between Plasma VF and beta cell function measured by HOMA-B neither in the controls nor in subjects with the MS. The relationship between VF and beta cell function is being explored by some authors since VF is important for glucose-stimulated-insulin secretion from beta cells. One study in animals showed that VF reduced the degree of apoptosis of beta cells due to exposure of cell lines to interferon Gamma [32]. However, in human beings serum VF has been shown to increase with progressive beta cell failure in healthy males in a previous study, again adding to inconsistency of evidence regarding this molecule [33]. Several studies described significant increase in plasma VF concentrations after different types of bariatric surgery in morbidly obese subjects [34–36]. Moreover, Haider and colleagues showed that treatment with the insulin sensitizer rosiglitazone increased both plasma VF and adiponectin in HIV-positive, insulin resistant subjects [37]. However, opposite results have also been reported where plasma VF has been shown to decrease after bariatric surgery as well [38] . Therefore, it is difficult to draw any conclusions about whether is beneficial or reduced levels of plasma VF are useful or harmful, unlike the case with adiponectin, where low levels have been consistently shown to be associated with type 2 diabetes, insulin resistance, and the risk for cardiovascular disease in may studies [39–41] . We may speculate that previously described increased concentrations of plasma VF in some studies in subjects with type 2 diabetes, MS and obesity may represent a compensatory mechanism to increase GSIS and improve glucose tolerance. Another explanation for the inconsistencies in published work on VF could be due to differences in immunoassays used by different research groups, as previously reported by Korner and colleagues [42]. A Third explanation for the inconsistency in VF work may be due to the presence of two iso-forms for eNampt (monomeric and diameric forms) and it has been shown that serum monomeric eNAMPT levels were elevated in HFD-fed mouse models of diabetes, whilst eNAMPT-dimer levels were unchanged. Very interestingly, eNAMPT-monomer neutralisation in HFD-fed mice with anti-monomeric eNampt antibodies resulted in lower blood glucose levels, amelioration of impaired glucose tolerance and whole-body insulin resistance, improved pancreatic islet function, and reduced inflammation [43]. Therefore, investigators should cleary indicate in future studies what iso-form of VF/Nampt was measured . We expected to see lower concentrations of plasma HMW adiponectin in subjects with the MS however, this may be due to the small sample size, however, HMW adiponectin was negatively correlated with HOMA-IR in subjects with the MS in our study, which is in agreement with previous studies that described association of reduced HMW adiponectin isoforms with the risk of insulin resistance and type 2 diabetes. There was no correlation between VF and HMW Adiponectin in this study but a previous study described a negative correlation between plasma Adiponectin and VF in patients with Rheumatoid Arthritis [44].

We acknowledge that this study has some limitations including the small sample size, the cross-sectional design and the use of HOMA-IR and HOMA-B as crude measures for assessing of insulin sensitivity and beta cell function, respectively. Also lack of simultaneous measurement of VF and HMW Adiponectin mRNA expressions in visceral and subcutaneous fat depots and their correlation with serum levels is yet another limitation.

In conclusion, we report reduced circulating concentrations of plasma VF in subjects with the MS compared to age and gender-matched controls, with extremely low concentrations of plasma VF in subjects with the MS and pre-diabetes. The findings of this study point towards a possible relationship between reduced concentrations of plasma VF and increased cardiometabolic risk and pre-diabetes , however, it is not clear from this study whether low plasma VF concentrations acts as a mediator or a marker of cardio metabolic risk and pre-diabetes. Further mechanistic studies are needed to explore this important relationship.

Acknowledgement

We would like to thank the Construction Workers’ Health Trust and all the study volunteers for their participation in this study. Many thanks to the staff nurses in the metabolic research unit

Funding

This study was funded by the Diabetes Education and Research Fund and the CWHT.

Authors’ contribution

Imad Brema: Study design and conception, data collection, statistical analysis, manuscript writing

Hood Thabit: Data collection, manuscript writing

Shabahat Shah: Data collection, manuscript writing

Nicole Burns: Data collection, manuscript writing

Declan Gasparro: Laboratory analysis of plasma samples for glucose, lipids, insulin

Vivion Crowley: Laboratory analysis,

Angela Storka: Visfatin and HMW Adiponectin assays

Michael Wolzt: Visfatin and HMW Adiponectin assays, manuscript writing

John J Nolan: Study design, data analysis, manuscript writing.

Abbreviations

CWHT: Construction Workers’ Health Trust

GSIS: Glucose-Stimulated-Insulin Secretion

HFD: High Fat Diet

HOMA-B: Homeostasis Model Assessment for Beta Cell Function

HOMA-IR: Homeostasis Model Assessment for Insulin Resistance Index

IDF: International Diabetes Federation

IFG-MS: Impaired Fasting Glucose Subject with Metabolic Syndrome

IFG: Impaired Fasting Glucose

IGT-MS: Impaired Glucose Tolerant Subject with Metabolic Syndrome

IGT: Impaired Glucose Tolerance

IL-6: Interlukin-6

MS: Metabolic Syndrome

Nampt: Nicotinamide Phosphoribosyl transferase

NAD: Nicotinamide Adenine Dinucleotide

NGT: Normal Glucose Tolerance

NGT-MS: Normal Glucose Tolerant Subject With Metabolic Syndrome

NMN: Nicotinamide Mononucleotide

OGTT: Oral Glucose Tolerance Test

PBEF: Pre-B- Colony Enhancing Factor

Sir1: Silent Information Regulator 1

VF : Visfatin

References

  1. Kershaw EE, Flier JS (2004) Adipose tissue as an endocrine organ. J Clin Endocrinol Metab 89: 2548–2556. [crossref]
  2. Arner P (2005) Insulin resistance in type 2 diabetes — role of the adipokines. Curr Mol Med 5: 333–339. [crossref]
  3. Fantuzzi G (2005) Adipose tissue, adipokines, and inflammation. J Allergy Clin Immunol 115: 911–919. [crossref]
  4. Fukuhara A, Matsuda M, Nishizawa M, Segawa K, Tanaka M, et al. (2005) Visfatin: a protein secreted by visceral fat that mimics the effects of insulin. Science 307: 426–430. [crossref]
  5. Samal B, Sun Y, Stearns G, Xie C, Suggs S, et al. (1994) Cloning and characterization of the cDNA encoding a novel human pre-B-cell colony-enhancing factor. Mol Cell Biol 14: 1431–1437. [crossref]
  6. Revollo JR, Grimm AA, Imai S (2004) The NAD biosynthesis pathway mediated by nicotinamide phosphoribosyl transferase regulates Sir2 activity in mammalian cells. J Biol Chem 279: 50754–50763.
  7. Wang T, Zhang X, Bheda P, Revollo JR, Imai S, et al. (2006) Structure of Nampt/PBEF/visfatin, a mammalian NAD+ biosynthetic enzyme. Nat Struct Mol Biol 13: 661–662. [crossref]
  8. Lim SY, Davidson SM, Paramanathan AJ, Smith CC, Yellon DM, et al. (2008) The novel adipocytokine visfatin exerts direct cardioprotective effects. J Cell Mol Med 12: 1395–403.
  9. Revollo JR, Korner A, Mills KF, Satoh A, Wang T, et al. (2007) Nampt/PBEF/Visfatin regulates insulin secretion in beta cells as a systemic NAD biosynthetic enzyme. Cell Metab 6: 363–375.
  10. Filippatos TD, Derdemezis CS, Kiortsis DN, Tselepis AD, Elisaf MS (2007) Increased plasma levels of visfatin/pre-B cell colony-enhancing factor in obese and overweight patients with metabolic syndrome. J Endocrinol Invest 30: 323–326.
  11. Zhong M, Tan HW, Gong HP, Wang SF, Zhang Y, et al. (2008) Increased serum visfatin in patients with metabolic syndrome and carotid atherosclerosis. Clin Endocrinol (Oxf) 69: 878–884.
  12. Lin CC, Lai MM, Li TC, Li CI, Liu CS, et al. (2009) Relationship between serum retinol-binding protein 4 and visfatin and the metabolic syndrome. Diabetes Res Clin Pract 85: 24–29.
  13. Ntzouvani A, Fragopoulou E, Panagiotakos D, Pitsavos C, Antonopoulou S (2016) Reduced circulating adiponectin levels are associated with the metabolic syndrome independently of obesity, lipid indices and serum insulin levels: a cross-sectional study. Lipids Health Dis 15: 140.
  14. Wang W, Xing W, Zhang H, Ding M, Shang L, et al. (2013) Reduced high-molecular-weight adiponectin is an independent risk factor for cardiovascular lesions in hypercholesterolaemic patients. Clin Endocrinol (Oxf) 78: 539–544.
  15. Hojlund K, Frystyk J, Levin K, Flyvbjerg A, Wojtaszewski JF, et al. (2006) Reduced plasma adiponectin concentrations may contribute to impaired insulin activation of glycogen synthase in skeletal muscle of patients with type 2 diabetes. Diabetologia 49: 1283–1291.
  16. Thabit H, Burns N, Shah S, Brema I, Crowley V, et al. (2013) Prevalence and predictors of diabetes and cardiometabolic risk among construction workers in Ireland: the Construction Workers Health Trust screening study. Diab Vasc Dis Res 10: 337–345.
  17. Chen MP, Chung FM, Chang DM, Tsai JC, Huang HF, et al. (2006) Elevated plasma level of visfatin/pre-B cell colony-enhancing factor in patients with type 2 diabetes mellitus. J Clin Endocrinol Metab 91: 295–299.
  18. Levy JC, Matthews DR, Hermans MP (1998) Correct homeostasis model assessment (HOMA) evaluation uses the computer program. Diabetes Care 21: 2191–2192.
  19. Alberti KG, Zimmet P, Shaw J; IDF Epidemiology Task Force Consensus Group (2005) The metabolic syndrome–a new worldwide definition. Lancet 366: 1059–1062. [crossref]
  20. Lindström J, Tuomilehto J (2003) The diabetes risk score: a practical tool to predict type 2 diabetes risk. Diabetes Care 26: 725–731. [crossref]
  21. Schindler K, Vila G, Hoppichler F, Lechleitner M, Luger A, et al. (2012) The impact of type 2 diabetes on circulating adipokines in patients with metabolic syndrome. Obes Facts 5: 270–276. [crossref]
  22. Filippatos TD, Derdemezis CS, Gazi IF, Lagos K, Kiortsis DN, et al. (2008) Increased plasma visfatin levels in subjects with the metabolic syndrome. Eur J Clin Invest 38: 71–72. [crossref]
  23. de Luis DA, Aller R, Gonzalez Sagrado M, Conde R, Izaola O, et al. (2013) Serum visfatin levels and metabolic syndrome criteria in obese female subjects. Diabetes Metab Res Rev 29: 576–581.
  24. Kocelak P, Olszanecka-Glinianowicz M, Owczarek AJ, Krupa W, Obirek P, et al. (2015) Plasma visfatin/nicotinamide phosphoribosyltransferase (visfatin/NAMPT) concentration in elderly subjects with metabolic syndrome. Polskie Archiwum Medycyny Wewnetrznej 125: 402–413.
  25. Guducu N, Isci H, Gormus U, Yigiter AB, Dunder I. (2013) Serum visfatin levels do not increase in post-menopausal women with metabolic syndrome. J Endocrinol Invest 36: 157–161.
  26. Jialal I, Devaraj S, Kaur H, Adams-Huet B, Bremer AA (2013) Increased chemerin and decreased omentin-1 in both adipose tissue and plasma in nascent metabolic syndrome. J Clin Endocrinol Metab 98: 514–517.
  27. de Kreutzenberg SV, Ceolotto G, Papparella I, Bortoluzzi A, Semplicini A, et al. (2010) Downregulation of the longevity-associated protein sirtuin 1 in insulin resistance and metabolic syndrome: potential biochemical mechanisms. Diabetes 59: 1006–1015.
  28. Yoshino J, Mills KF, Yoon MJ, Imai S (2011) Nicotinamide mononucleotide, a key NAD(+) intermediate, treats the pathophysiology of diet- and age-induced diabetes in mice. Cell Metab 14: 528–536. [crossref]
  29. Pagano C, Pilon C, Olivieri M, Mason P, Fabris R, et al. (2006) Reduced plasma visfatin/pre-B cell colony-enhancing factor in obesity is not related to insulin resistance in humans. J Clin Endocrinol Metab. 91: 3165–3170.
  30. Brema I, Hatunic M, Finucane F, Burns N, Nolan JJ, Haider D, et al. (2008) Plasma visfatin is reduced after aerobic exercise in early onset type 2 diabetes mellitus. Diabetes, obesity & metabolism 10: 600–602.
  31. Dogru T, Sonmez A, Tasci I, Bozoglu E, Yilmaz MI, et al. (2007) Plasma visfatin levels in patients with newly diagnosed and untreated type 2 diabetes mellitus and impaired glucose tolerance. Diabetes Res Clin Pract 76: 24–29.
  32. Xiang RL, Mei M, Su YC, Li L, Wang JY, et al. (2015) Visfatin Protects Rat Pancreatic beta-cells against IFN-gamma-Induced Apoptosis through AMPK and ERK1/2 Signaling Pathways. Biomed Environ Sci 28: 169–177.
  33. Lopez-Bermejo A, Chico-Julia B, Fernandez-Balsells M, Recasens M, et al. (2006) Serum visfatin increases with progressive beta-cell deterioration. Diabetes 55: 2871–2875.
  34. Krzyzanowska K, Mittermayer F, Krugluger W, Kopp HP, Schernthaner G (2006) Increase in visfatin after weight loss induced by gastroplastic surgery. Obesity (Silver Spring) 14: 1886–1889.
  35. Garcia-Fuentes E, Garcia-Almeida JM, Garcia-Arnes J, Garcia-Serrano S, Rivas-Marin J, et al. (2007) Plasma visfatin concentrations in severely obese subjects are increased after intestinal bypass. Obesity (Silver Spring) 15: 2391–2395.
  36. Botella-Carretero JI, Luque-Ramirez M, Alvarez-Blasco F, Peromingo R, San Millan JL, et al. (2008) The increase in serum visfatin after bariatric surgery in morbidly obese women is modulated by weight loss, waist circumference, and presence or absence of diabetes before surgery. Obes Surg 18: 1000–1006.
  37. Haider DG, Schindler K, Mittermayer F, Müller M, Nowotny P, et al. (2007) Effect of rosiglitazone on visfatin and retinol-binding protein-4 plasma concentrations in HIV-positive patients. Clin Pharmacol Ther 81: 580–585. [crossref]
  38. Haider DG, Schindler K, Schaller G, Prager G, Wolzt M, et al. (2006) Increased plasma visfatin concentrations in morbidly obese subjects are reduced after gastric banding. J Clin Endocrinol Metab 91: 1578–1581.
  39. Hara K, Yamauchi T, Imai Y, Manabe I, Nagai R, et al. (2007) Reduced adiponectin level is associated with severity of coronary artery disease. Int Heart J 48: 149–153.
  40. Linscheid P, Christ-Crain M, Stoeckli R, Reusch CE, Lutz TA, et al. (2008) Increase in high molecular weight adiponectin by bariatric surgery-induced weight loss. Diabetes Obes Metab 10: 1266–1270.
  41. Otto C, Otto B, Goke B, Pfeiffer AF, Lehrke M, Vogeser M, et al. (2006) Increase in adiponectin levels during pioglitazone therapy in relation to glucose control, insulin resistance as well as ghrelin and resistin levels. J Endocrinol Invest 29: 231–236.
  42. Körner A, Garten A, Blüher M, Tauscher R, Kratzsch J, et al. (2007) Molecular characteristics of serum visfatin and differential detection by immunoassays. J Clin Endocrinol Metab 92: 4783–4791. [crossref]
  43. Kieswich J, Sayers SR, Silvestre MF, Harwood SM, Yaqoob MM, et al. (2016) Monomeric eNAMPT in the development of experimental diabetes in mice: a potential target for type 2 diabetes treatment. Diabetologia
  44. El-Hini SH, Mohamed FI, Hassan AA, Ali F, Mahmoud A, et al. (2013) Visfatin and adiponectin as novel markers for evaluation of metabolic disturbance in recently diagnosed rheumatoid arthritis patients. Rheumatol Int 33: 2283–2289.

Extracorporeal Shockwave Therapy (ESWT) and Peripheral Magnetic Stimulation (Super Inductive System) Promotes Healing of Tibial Fracture Non-Union Unresponsive to Conventional Therapy: A Case Report

DOI: 10.31038/IJOT.2018113

Introduction

Delayed and nonunion of the tibia are not uncommon in medical practice and are associated with a significant impact on patients’ quality of life and health care cost. Extracorporeal shockwave therapy (ESWT) has been shown to improve osseous healing in vitro and in vivo. In this case we are presenting the impact of ESWT in combination with peripheral pulsed magnetic stimulation (Super Inductive System) in a 60 years old male patient who suffered for 7 months with a nonunion spiral right tibial fracture during skiing. In the initial evaluation patient was walking using a tall ankle foot support (walking boot) and two maxillary crutches.

Material and Method

ESWT coupled with high intensity pulsed peripheral pulsed magnetic stimulation and post treatment mobilization. ESWT parameters consisted of frequency 20Hz, 4000 shocks per session and pressure of 4 bars, energy flux density of 0.5 J/mm2. Super Inductive System parameters consisted of frequency 5Hz,10 minutes duration per session and intensity 40% of 3 Tesla. Patient received one session per week and 8 sessions in total.

Results

Outcome measures included verbal pain rating scale (VAS: 1/10 versus Vas: 6/10), radiographing imaging improvement, obvious after first 4 sessions already (see photos) and a return to activities of daily living (ADLs) with normal gait pattern without using the ankle foot support (walking boot) and the maxillary crutches 1 month post treatment.

Discussion

This case demonstrates the successful boosting of bone regenerative healing process in management of tibia non union. The procedure is well tolerated, time-saving, lacking side effects, with potential to significantly decrease of health care costs and improvement of patient’s Quality of life.

Conclusion

A combination of ESWT and peripheral pulsed magnetic stimulation is a feasible treatment combination which seems to accelerate tibia nonunion fracture.

X-ray of Tibia1 month post treatment

IJOT2018-103-F1

References

  1. d’Agostino MC, Craig K, Tibalt E, Respizzi S (2015) Shock wave as biological therapeutic tool: From mechanical stimulation to recovery and healing, through mechanotransduction. Int J Surg 24: 147–153. [Crossref]
  2. Elster EA, Stojadinovic A, Forsberg J, Shawen S, Andersen RC, et al (2010) Extracorporeal shock wave therapy for nonunion of the tibia. J Orthop Trauma 24: 133–141 [Crossref]
  3. Naomi M. Shupak, Frank S. Prato, Alex W. Thomas (2003) Therapeutic uses of pulsed magnetic-field exposure: A review. URSI Radio Science Bulletin 307: 09–32

Long-Term Outcomes in Patients after Discontinuation of Immune Checkpoint Inhibitors

DOI: 10.31038/JCRM.2018132

Abstract

Introduction: Programmed death protein/ligand 1 (PD1/PDL1) inhibitors are approved for several advanced or metastatic malignancies with improvement in both progression free and overall survival. However, there is a paucity of data on optimal treatment duration. Both KEYNOTE-001 and KEYNOTE-006 studies showed durable antitumor activity in approximately 90% of melanoma patients after discontinuation of two-year pembrolizumab treatment, with a median follow up duration of 32 and 33.9 months respectively. To our knowledge, there has been no study that provides similar information for other types of solid cancers. Hence, we report a retrospective single institute experience of the durable response after discontinuation of PD1/PDL1 inhibitors.

Materials & Methods: Data on patients treated with immunotherapy between 2010 and 2017 were collected retrospectively. Patients with all types of cancers who achieved disease control (including stable disease, partial and complete response) and were no longer treated with the immunotherapy for any reason were included. We analyzed the outcomes of these patients after discontinuation of immunotherapy.

Results: We evaluated a total 282 patients with a variety of solid tumor types who were treated with PD1/PDL1 inhibitors; 20 patients met our criteria. Cases were divided into two groups; melanoma (total 8), and non-melanoma (total 12; 3 renal cell, 3 bladder, 1 hepatocellular, 1 colon, and 4 non-small cell lung). As of Jan 2018, 7 out of 8 (88%) in the melanoma group had disease control after a median follow-up of 9 months post-treatment, whereas 8 out of 12 (67%) in non-melanoma group had disease control after a median follow-up of 10 months. The median treatment cycle in the melanoma group was 11.5 cycles (range: 3–20) versus 11 cycles (range: 3–15) in non-melanoma group. The main reason for stopping treatment was patient preference.

Conclusion: Our study shows similar efficacy of durable response in melanoma patients after stopping immunotherapy compared to KEYNOTE studies. Despite limited sample size and short duration of follow-up, our study was the first showing sustained disease control in several non-melanoma cancers after discontinuation of approximately one-year PD1/PDL1 inhibitor treatment. Future prospective malignancy specific trials for optimal duration are warranted.

Keywords

Immunotherapy, long term outcomes, melanoma, non-melanoma

Introduction

Immune checkpoint inhibitors have transformed the field of oncology. This treatment modality has been approved for several solid tumors with improvement in both progression free and overall survival. Yet, there is a paucity of data with respect to the optimal treatment duration and availability of a biomarker to predict treatment response. Both KEYNOTE-001 and 006 studies showed that 24-month disease free survival rate from time of complete remission was 90% vs. 55% after discontinuation of two-year pembrolizumab treatment. To our knowledge, there is no study that reports similar information for other types of solid cancers. As a retrospective single-center experience, we evaluated durable antitumor activity in both melanoma and non-melanoma patients who achieved treatment response (complete, partial or stable) after discontinuation of immunotherapy for any reason.

Materials & Methods

Data on patients treated with immunotherapy from Jan 2010 to Dec 2017 were collected retrospectively. Patients with any type of cancer that achieved a treatment response (complete, partial or stable) and had completed immunotherapy for any reason were included. Patient demographic information including age, sex, primary cancer, prior therapy, total number of doses, and duration of treatment response after discontinuation of therapy and types of response (complete, partial, stable or progression) were obtained. The study approved by local Institutional Review Board (IRB) and the IRB protocol number is 43216.

Results

We evaluated a total 282 patients with a variety of stage IV solid cancers who were treated with immune checkpoint inhibitors. Of that group, 157 patients were treated with nivolumab and 125 patients were treated with pembrolizumab. In this single-center, retrospective study, 20 patients met our eligibility criteria. This cohort was divided into two groups: a melanoma group (total 8), and a non-melanoma group (total of 12; 3 renal cell, 3 bladder, 1 hepatocellular, 1 colon, and 4 non-small cell lung). Patient baseline characteristics are detailed in Table 1.

Table 1. Baseline Characteristics and Outcomes.

Case

Age

Sex

Cancer

Previous Therapy

Total # Treatments (doses)

Reason to Discontinue

Immune-related AEs

Duration of Response (mos)

Outcome

1

60

F

Melanoma

Ipi × 4

Pem × 10

Organizing pneumonia

Organizing pneumonia

28

CR

2

89

F

Melanoma

None

Pem × 17

Patient Request

None

9

CR

3

77

M

Melanoma

None

Pem × 10

Patient Request

None

2.3

CR

4

67

M

Melanoma

Interferon; BRAF

Nivo × 20

RA Exacerbation

RA Exacerbation

9.1

CR

5

90

F

Melanoma

None

Pem × 13

Patient Request

None

5

CR

6

53

F

Melanoma

BRAF

Pem × 8

RA

Hypothyroid & RA

4.6

CR

7

60

M

Melanoma

No

Niv × 8

Pancreatitis

Pancreatitis

4.8

SD

8

87

M

Melanoma

Ipi × 4

Niv × 3

Patient Request

None

16.7

CR

9

67

M

RCC

Pazopanib

Niv × 25

Patient Request

None

6

P

10

40

M

RCC

Sunitinib

Niv × 30

Patient Request

None

11.3

SD

11

74

F

RCC

Pazopanib

Niv × 20

Sjogren

Sjogren

4.2

SD

12

87

M

Bladder

Cis/Gem

Pem x11

Patient Request

None

11

SD

13

58

M

Bladder

Carbo/Gem

Pem × 13

Patient Request

None

10.6

PR

14

70

M

Bladder

Carbo/Gem

Pemx 12

HLH

HLH

12

P

15

58

M

HCC

Embolization

Nivx6

Patient Request

None

11

P

16

79

F

NSCLC

Carbo/pem

Niv x8

Hepatitis

Hepatitis

7

PR

17

78

M

NSCLC

Carbo/Gem

Nivx 18

Patient Request

None

6

P

18

76

F

NSCLC

Unknown

Niv × 24

Patient Request

None

14

SD

19

66

F

NSCLC

None

Pemx 15

Patient Request

None

22.6

CR

20

55

F

Colon

FOLFOX

Pemx9

Peripheral neuropathy

Peripheral neuropathy

8.8

PR

Ipi = ipilimumab; Pem = pembrolizumab; Niv = nivoluamb; Cis/Gem = cisplatin/gemcitabine; Carbo/Gem = carboplatin/gemcitabine; carbo/pem =carboplatin/pemetrexed; FOLFOX = Folinic acid+Fluorouracil+Oxaliplatin; mos= months; AEs = adverse responses; CR = complete response; P = progression; SD = stable disease; PR = partial response; BLE = bilateral lower extremities; RA = Rheumatic arthritis; HLH = Hemophagocytic lymphohistiocytosis.

In melanoma group, the median age was 73 years (range: 44–90), with male and female equally represented. Performance status (Eastern Cooperative Oncology Group, ECOG) for all patients was 0 to 1. Four of the 8 melanoma patients had prior therapies; two patients received four doses of adjuvant ipilimumab and two patients were treated with BRAF inhibitors. Three of the 8 patients had the BRAFV600E mutation. Five of the eight melanoma patients were treated with pembrolizumab and the remaining three patients were treated with nivolumab. The median duration of the first radiographic response was 5 months (range: 3–8). The median number of immunotherapy treatment doses was 12 (range: 3–20). The median duration of durable treatment response after discontinuation of immunotherapy was 9.7 months (range: 2–27). Four patients discontinued treatment due to immune-related adverse events: 1 developed organizing pneumonia; 2 acquired Rheumatoid arthritis; and 1 developed pancreatitis. The remaining four patients requested to stop treatment. (Tables 1, 2)

In non-melanoma group of 12 patients, three were diagnosed with renal cell cancer (RCC), three with bladder cancer, there was one hepatocellular cancer (HCC), one colon cancer, and four patients with non-small cell lung cancer (NSCLC). The median age was 67 years (range: 40–87). Eight of the twelve were male and 4 were female. Ten of 12 patients had prior therapies. Three patients were treated with tyrosine kinase inhibitors (two with pazopanib and one with sunitinib) for RCC. Three bladder cancer patients received platinum with gemcitabine. One HCC had localized therapy by embolization. Two of the 4 NSCLC had chemotherapy (1 with carboplatin/gemcitabine for squamous cell, 1 with carboplatin/pemetrexed for adenocarcinoma). One colon cancer patient was treated with FOLFOX. Three of the 8 patients were positive for the BRAFV600E mutation. Seven patients were treated with nivolumab, and four patients were treated with pembrolizumab. The median duration of the first radiographic response was 3.2 months (range: 2–5). The median number of immunotherapy treatment doses was 15 (range: 6–30). The median duration of durable treatment response after discontinuation of immunotherapy was 10.4 months (range: 4–23). Four patients discontinued treatment due to immune related adverse events: 1 developed Sjogren syndrome; 1 developed hemophagocytic lymphohistiocytosis; 1 acquired hepatitis, and 1 had peripheral neuropathy. The remaining patients requested a break from treatment. Four patients had disease progression after discontinuation of immunotherapies with the median duration of 8.7 months. (Tables 1, 2)

Table 2. Outcome Comparisons for the Melanoma and Non- Melanoma groups.

Characteristics

Melanoma

N= 8

Non-melanoma

N = 12

Median age in years (range)

73 (44–90)

67 (40–87)

Men, N (%)

4 (50%)

8(66%)

ECOG 0–1, N (%)

8 (100%)

12(100%)

Previous therapy, N (%)

4 (50%)

10 (83%)

BRAF mutant positive

3 (38%)

0

PD-L1 positive (>50%)

Unknown

0

Median duration of first radiographic response in months (range)

5 (3–8)

3.2 (2–5)

Median number of immunotherapy cycles, (range)

12 (3–20)

15 (6–30)

Median duration in months of treatment response after discontinuation of therapy, (range)

9.7 (2–27)

10.4 (4–23)

Disease response (CR, PR, stable, progression)

7 (88%) CR

1(12%) stable

3 (25%) PR

4 (33%) stable

4 (33%) progression

1 (8%) CR

Immune related side effects, N (%)

4 (50%)

4 (33%)

ECOG = Eastern Cooperative Oncology Group; CR = complete response; PR = partial response; N = number.

Seven out of 8 patients (88%) from the melanoma group had disease free progression after a median follow-up of 9 months. Eight out of 12 patients (67%) from the non-melanoma group had disease free progression after a median follow-up of 10 months.

Discussion

Immune checkpoint inhibitors have transformed oncologic therapeutics. Immunotherapy provides improved overall survival and progression free survival for several solid tumors including melanoma, NSCLC, bladder cancer and RCC. However, there is no good biomarker that predicts which patient will benefit with immunotherapy. It was thought that programmed death ligand 1 (PDL1) expression would predict a good prognostic biomarker, however, there are multiple limitations related to this new type of therapeutic [1–3]. The optimal duration for therapy is ambiguous, however the current practice is to continue immunotherapy until disease progression or intolerable adverse events (AEs) occur. Immunotherapy is associated with immune-related AEs, some that can cause toxicities of grade 3 or higher. Thus, a shorter duration of therapy could spare patients from unnecessary toxicities and health expenditures.

Most patients in our study were treated with immunotherapy as a second-line therapy. Approximately 50% of patients from the melanoma group and 33% from the non-melanoma group experienced immune-related AEs, which led to discontinued treatment. The remaining 50% (melanoma) and 67% (non-melanoma) of the patients requested a therapy break secondary to a variety of issues. A common issue was financial, related to limitations imposed by insurance companies. Another issue related to transportation difficulties, especially when bi-weekly commutes were required. Finally, some patients questioned why they would need to continue treatment if they had already achieved a complete response. The median duration of treatment in both groups was approximately one-year, and 88% of the melanoma group, 67% from non-melanoma group achieved disease control with a median follow-up of 9–10 months.

Schadendorf et al. hypothesized that the immune-related AEs could be a hint for durability in the response, secondary to activation of immune system [4]. The KEYNOTE-006 phase III trial prospectively investigated for a two-year treatment of pembrolizumab in advanced melanoma. The study demonstrated that 55% of patients on pembrolizumab had a 24-months overall survival benefit after discontinuation of the treatment [5]. Conclusions from the KEYNOTE-001 phase III trial supported those reported in the KEYNOTE-006 trial, that patients who achieved a complete response could consider a discontinuation of the treatment. In fact, 90.9% of those patients who discontinued treatment were in disease-free-remission after a median follow up of two years [6].

These two KEYNOTE studies provide convincing evidence that a two-year immunotherapy treatment period improves overall survival benefit. When compared to the KEYNOTE studies, our study provided similar efficacy in terms of a durable response in melanoma patients in the post immune-treatment period. Interestingly, our patient cohort received treatment for approximately one year. A limitation of our study is that it is a retrospective study.

Cancer cells become resistance to chemotherapy and targeted therapies. An understanding of this concept is important in the sequencing of therapeutics for our patients. Well-performed studies established that mutations develop during ontogenesis that can be driver or passenger mutations, and give rise to non-epitopes that the immune system recognizes as neo-antigens. The immune checkpoint inhibitors act on specific tumor mutant proteins to reactivate the T-cell response. Hence, cases with a high tumor mutation burden (TMB) have a high treatment response rate [7, 8]. Studies have suggested that a high TMB predicts a favorable treatment response and also durable clinical benefit. For example, a high TMB in NSCLC predicted a higher response rate 59% vs 12% in low TMB patients and longer progression free survival (14.5 months in high TMB patients vs. 4.1 months in low TMB) in patients receiving a PD-1 inhibitor [9]. For bladder cancer, a high TMB did predict a favorable response [10]. Treated tumors exposed to genotoxic chemotherapy or radiotherapy are known to have a higher mutational rate compared to the TMB at diagnosis or prior to treatment [11, 12]. Therefore, TMB is an emerging biomarker of positive response to immune checkpoint inhibitors. However, efforts should be made to develop a molecular profile of prognostic variables or predictive biomarkers to customize prognosis at the baseline, and thereby guide an optimal duration for the immunotherapy.

Conclusion

Our study showed a sustained durable response in a variety of solid tumors after discontinuation of immunotherapy with a median 9–10 months of disease free progression post-therapy after median 11 cycles of treatment. Additional prospective trials are warranted.

Declaration Statement

Ethics Approval and Consent to Participate: The study approved by local Institutional Review Board (IRB) and the IRB protocol number is 43216.

Consent for Publication: Not applicable.

Availability of Data and Material: Data sharing is not applicable to this article as no datasets were generated or analyzed during the current study.

Author Contributions: Conception and design: All authors; Administrative support: PW; Provision of materials: All authors; Collection and assembly of data: All authors; Data interpretation: All authors; Manuscript writing and final approval: All authors

Compliance with Ethical Standards: Not Applicable

Conflict of Interest: The authors declare that they have no conflict of interest.

Funding: Not Applicable

Consent for Publication: Not Applicable. The study approved by local institution review board.

Acknowledgements: The authors thank Catherine Anthony, Ph.D. and the Markey Cancer Center Research Communications Office for assistance with manuscript preparation.

References

  1. Rimm DL, Han G, Taube JM, Yi ES, Bridge JA, et al. (2017) A Prospective, Multi-institutional, Pathologist-Based Assessment of 4 Immunohistochemistry Assays for PD-L1 Expression in Non-Small Cell Lung Cancer. JAMA Oncol. 3: 1051–8.[Crossref]
  2. McLaughlin J, Han G, Schalper KA, Carvajal-Hausdorf D, Pelekanou V, et al. (2016) Quantitative Assessment of the Heterogeneity of PD-L1 Expression in Non-Small-Cell Lung Cancer. JAMA Oncol. 2: 46–54. [Crossref]
  3. Grigg C,Rizvi NA. (2016) PD-L1 biomarker testing for non-small cell lung cancer: truth or fiction? J Immunother Cancer. 4: 48.
  4. Schadendorf D, Wolchok JD, Hodi FS, Chiarion-Sileni V, Gonzalez R, et al. (2017) Efficacy and Safety Outcomes in Patients With Advanced Melanoma Who Discontinued Treatment With Nivolumab and Ipilimumab Because of Adverse Events: A Pooled Analysis of Randomized Phase II and III Trials. J Clin Oncol. 35: 3807–14. [Crossref]
  5. Schachter J, Ribas A, Long GV, Arance A, Grob JJ, et al. (2017) Pembrolizumab versus ipilimumab for advanced melanoma: final overall survival results of a multicentre, randomised, open-label phase 3 study (KEYNOTE-006). Lancet. 390: 1853–62. [Crossref]
  6. Robert C, Ribas A, Hamid O, Daud A, Wolchok JD, et al. (2017) Durable Complete Response After Discontinuation of Pembrolizumab in Patients With Metastatic Melanoma. J Clin Oncol. Jco2017756270. [Crossref]
  7. Schumacher TN,Schreiber RD. (2015) Neoantigens in cancer immunotherapy. Science. 348: 69–74.
  8. Van Allen EM, Miao D, Schilling B, Shukla SA, Blank C, et al. (2015) Genomic correlates of response to CTLA-4 blockade in metastatic melanoma. Science. 350: 207–11. [Crossref]
  9. Rizvi NA, Hellmann MD, Snyder A, Kvistborg P, Makarov V, et al. (2015) Cancer immunology. Mutational landscape determines sensitivity to PD-1 blockade in non-small cell lung cancer. Science. 348: 124–8. [Crossref]
  10. Powles T, Eder JP, Fine GD, Braiteh FS, Loriot Y, et al. (2014) MPDL3280A (anti-PD-L1) treatment leads to clinical activity in metastatic bladder cancer. Nature. 515: 558–62. [Crossref]
  11. Johnson BE, Mazor T, Hong C, Barnes M, Aihara K, et al. (2014) Mutational analysis reveals the origin and therapy-driven evolution of recurrent glioma. Science. 343: 189–93. [Crossref]
  12. Padovan-Merhar OM, Raman P, Ostrovnaya I, Kalletla K, Rubnitz KR, et al. (2016) Enrichment of Targetable Mutations in the Relapsed Neuroblastoma Genome. PLoS Genet. 12: e1006501. [Crossref]

Proseal™ LMA Insertion: Comparison of the Nasogastric Catheter Guided Technique with the Conventional Digital Technique

DOI: 10.31038/JCRM.2018131

Abstract

Several techniques have been introduced to improve the success rate and efficiency of the ProsealTM laryngeal mask airway (PLMA) placement along with decreasing complication. The aim of this study is to compare the success rate of the nasogastric catheter guided technique to the conventional digital technique.

Methods

In this randomized-controlled clinical trial, 200 patients, age between 18 and 65 years old, underwent inhalation technique anesthesia were enrolled. Participants were randomized by computer to Nasogastric catheter guided group (NG) and Digital technique group (DT). Anesthesia was induced with propofol (3 mg/kg) and fentanyl (2 mcg/kg). In DT group, the PLMA was inserted by using the index finger insertion technique. In NG group, PLMA with nasogastric catheter protruding for 5 cm from the PLMA drain tube distal aperture was inserted with the same method. Successful insertion was evaluated by the chest movement and the persistent rising of end-tidal carbon dioxide. The quality of placement was also recorded after the patient regained spontaneous breathing. Complications were evaluated at the end of the surgery and at the PACU discharge time.

Result

Patient characteristics were similar in both groups. The overall insertion success rates were similar; 89.3% in NG and 81.5% in DT group (P=0.22). There was no difference in insertion attempt (success rate in the first attempt = 86.7% and 84.0% in NG group and DT group respectively, P = 1.00). The time to the success of insertion was not significantly different; 30 seconds in NG group vs 35 seconds in DT group (P=0.185). There were no differences in the complications such as airway bleeding, sore throat, dysphagia, and hoarseness.

Conclusion

Insertion of Proseal LMA using nasogastric catheter guided technique did not provide an advantage over digital technique. The complications from both insertion techniques were also similar.

Keywords

Proseal LMA, Nasogastric catheter, Airway device

Background

Laryngeal mask airway (LMA) is an alternative airway device widely used during elective surgical procedures. ProsealTM LMA (PLMA) is another advanced form of this supraglottic airway device. PLMA may be inserted by the standard index finger or by using the introducer. Several techniques have also been introduced to improve the success rate and efficiency of the PLMA placement along with decreasing the complications [1,2] [4–8] [10].

The previous studies comparing the success rate of PLMA insertion showed that the use of suction catheter guided insertion had the higher success rate than the insertion without the guide [1,2]. Gum elastic bougie (GEB) guided insertion was not different in comparison to the metallic introducer in the point of success rate but it showed the improvement of the position of PLMA placement [3]. Using laryngoscope to direct insertion of GEB into esophagus before assisting PLMA insertion further improved the success rate significantly [4–6]. However, the mucosal trauma occurrence was higher with GEB guided insertion. Flexi-slip stylet guided insertion also showed higher success rate together with decreasing trauma complications [7]. The airway stylet; Foley airway stylet (FAST), had similar outcomes but it had the higher trauma rate compared to the metallic introducer [9]. Additionally, neuromuscular blocking agents could be used to improve the laryngeal airway insertion [11]. Advancing the guide such as the suction catheter into esophagus 10 to 15 centimeters to guide PLMA had the higher success rate as well [8–10].

Methods

This randomized controlled clinical trial was approved by the Ethics Committee of the Faculty of Medicine, Prince of Songkla University (ethical number: 59-192-08-1). Data were collected from October 2016 to October 2017. We recruited 200 patients, with the age between 18 – 65 years old, the American Society Anesthesiologists physical status I – III, who underwent inhalation technique of anesthesia. Patients who had body weight lower than 30 kilograms or heavier than 70 kilograms or body mass index more than 35 kilograms per square centimeters, history or suspicion of difficulty in airway management, the risk of aspiration, respiratory diseases and change of anesthetic technique were excluded from the study. Computerized randomization was performed to divide participants into nasogastric catheter guided technique group (NG) and Digital technique group (DT) equally. The opaque envelopes containing group assignment were opened prior to the start of the induction of anesthesia.

The patients were not given sedative agents for premedication. The patient position was supine without the pillow. After applying the standard monitoring and preoxygenation for 3 minutes with 100% oxygen, anesthesia was induced with propofol (3 mg/kg) and fentanyl (2 mcg/kg) intravenously. Additional boluses of propofol 0.5 mg/kg intravenously were given as required to achieve the adequate depth of anesthesia, apnea, and adequate jaw relaxation. The PLMA insertion was performed by the first or second-year anesthetic residents or in-training anesthetic nurses who had experience more than 5 success of LMA insertion. In DT group, the PLMA was inserted by using index finger insertion technique according to the manufacturer’s instruction manual. In NG group, PLMA with nasogastric catheter protruding for 5 cm from the PLMA drain tube distal aperture was inserted with the same method. The PLMA size 3 or 4 selection was based on anesthesiologists’ consideration. Neuromuscular blocking agents were not allowed to be used. The duration for insertion started as the opening of the patient’s mouth and ended after successful insertion proved by chest movement along with the ventilation and the persistent rising of end-tidal carbon dioxide for at least 5 waves. If unsuccessful insertion occurred, PLMA would be removed, then preoxygenation and additional propofol bolus doses were provided. PLMA insertions were allowed for only 2 attempts, after that, it was considered as failed insertion then the airway management was followed by the discretion of anesthetic staff. In both groups, the PLMA cuff was inflated with air to the pressure of 40 centimeters of water. Patient’s ventilation was assisted until regaining of the spontaneous breathing. Anesthesia was maintained with volatile anesthetic agent and 50% of oxygen in air. Five minutes later, the secondary outcomes were assessed by following; the position of the nasogastric catheter placement confirmed with the audible sound at epigastrium by 10 milliliters of air push, hypercapnia (End tidal Carbon dioxide more than 60 mmHg), hypoxia (Oxygen saturation less than 95%) and the leakage of ventilation (leakage sound through the patient’s mouth). The awake technique for PLMA removal was used at the end of anesthesia.

The complications were assessed after removal of PLMA. Any visible blood stain or blood in the early oropharyngeal secretion suction was noted. Patients were asked for the sore throat, hoarseness or dysphagia before discharging from PACU by PACU nurses who were blinded to the insertion technique.

Statistical analysis

The sample size was calculated from the difference of the success rates in the previous study [1]. The number of population required for this study was 90 patients for each group. With the 10% drop-out rate, therefore, the definite number of the population was 100 patients in each group. This estimation would give a power of 80% to detect the difference at the significance level of 0.05.

Statistical analysis was performed using R software. Continuous variables were presented as median and interquartile range (IQR) or mean. Categorical variables were presented as number of patients and percentages. Continuous variables were analyzed by Student t-test or Wilcoxon Rank Sum test. Categorical variables were analyzed by Fisher’s exact test, or Chi-square test. P value less than 0.05 was considered as statistical significance.

Result

Two hundred participants were enrolled into the study, eight patients in DT group and sixteen patients in NG group were excluded (Figure 1). Patient characteristics were not significantly different (Table 1).

JCRM 2018-111 - Wirat WasinWong Thailand_F1

Figure 1. Consort flow diagram

Table 1. Demographic data of the patients.

NG (n=84)

DT (n=92)

P-value

Age (year)*

Gender+

 – Male

 – Female

45 (32–51)

16 (19)

68 (81)

46 (35–54)

24 (26)

68 (74)

0.20

0.35

Weight (kg)*

58 (49–65)

60 (52–63)

0.56

Height (cm)*

157 (154–160)

158 (154–165)

0.41

BMI

22.8 (3.0)

22.8 (3.5)

0.89

ASA+

 – I

 – II

 – III

Mallampati score+

 – I

 – II

 – III

Proseal size

 – 3

 – 4

Performer

 – In-training anesthetic nurse

 – 1st year resident

 – 2nd year resident

20 (23.8)

64 (76.2)

0 (0)

36 (42.9)

44 (52.4)

4 (4.8)

36 (42.9)

48 (57.1)

39 (46.4)

29 (34.5)

16 (19)

22 (23.9)

68 (73.9)

2 (2.2)

48 (52.2)

42 (45.7)

3 (2.2)

32 (34.8)

60 (65.2)

51 (55.4)

29 (31.5)

12 (13)

0.60

0.38

0.35

0.40

* Data are presented as a median (IQR)
+ Data are presented as a number (%)
• Data are presented as a mean (SD)

There were no significant difference in success rates (Table 2). Success rate in NG group at first attempt was 86.7% and 13.3% in second attempt. In DT group, success rate at first attempt was 84% and 16% in second attempt. The overall success rate were 89.3% in NG group and 81.5% in DT group (P value = 0.216). By the Logistic regression analysis with the insertion success as the outcome variable, there was no significant variables (ASA status, Mallampati score, the performers, PLMA size).

Table 2. Success and quality of PLMA placement

NG
(n=84)

DT
(n=92)

P-value

Insertion success+

Insertion attempt+

 – 1

 – 2

75 (89.3)

65 (86.7)

10 (13.3)

75 (81.5)

63 (84.0)

12 (16.0)

0.22

0.82

Insertion time (second)*

30 (25–47)

35 (25–54)

0.38

Proper nasogastric catheter placement+

68 (90.7)

60 (80.0)

0.11

Hypoxemia+

2 (2.7)

3 (4.0)

1.00

Hypercapnia+

Leakage+

2 (2.7)

32 (42.7)

2 (2.7)

29 (38.7)

1.00

0.74

* Data are presented as a median (IQR)
+ Data are presented as a number (%)
• Data are presented as a mean (SD

For the success of PLMA insertion (75 cases) in both groups, there were no differences in the time to success insertion and the PLMA position. The duration of insertion were 30 seconds (IQR = 25 – 47 seconds) in NG group and 35 seconds (IQR = 25 – 54 seconds) in DT group. The nasogastric catheter placement in the proper position were not significantly different which were 68 of 75 (90.7%) patients in NG group and 60 of 75 (80%) patients in DT group. The incidences of hypoxemia, hypercapnia and air leakage were not significant difference.

The visible blood stain on PLMA or in the early suction was noted after PLMA removal. Bleeding was found similarly both in NG group (24%) and in DT group (20%) (P-value = 0.693). Sore throat was reported by 36% of patients in DT group and 26.7% of patients in NG group (P-value = 0.291). Dysphagia was the same as 4% in both groups (Table 3). Hoarseness was not significantly different between the two groups (4% and 2.7% in NG and DT groups, respectively). The symptoms of all patients improved within two days postoperatively.

Table 3. Airway complications

NG
(n=75)

DT
(n=75)

P-value

Bleeding

Sore throat

18 (24)

20 (27)

15 (20)

27 (36)

0.69

0.29

Dysphagia

Hoarseness

3 (4)

3 (4)

3 (4)

2 (3)

1.00

1.00

Data are presented as a number (%)

Discussion

The success rate of PLMA insertion by using the nasogastric catheter guiding was slightly higher, but not significantly different from the conventional digital technique. Due to the number of the patients in the NG group were withdrawn more than 10% drop-out, therefore, the sensitivity analysis was also performed and analyzed. The result still showed no significantly different in the success rates between the two groups. The numbers of insertion and the duration of PLMA placement were also similar between the two groups. The quality of PLMA position which determined by the proper position of the nasogastric catheter placement, hypercapnia, hypoxia and the leakage of ventilation also revealed the insignificant differences between the two groups. However, the rate of proper nasogastric-catheter-positioning was slightly higher in NG group.

The nasogastric catheter used as a guide for PLMA insertion in our hospital might be different from previous literatures. The nasogastric catheter from the different company might differ in the consistency of the material. Therefore, it might not be helpful to be the guide of the PLMA insertion in this study. Even though, the complications such as airway trauma were not significantly different. Five centimeters protrusion of nasogastric catheter from the distal end of PLMA drainage tube in our study was less than those in the previous reports so it could be inserted together with PLMA and the protruding nasogastric catheter would act as the guide to the proper positioning of PLMA. Unlike the previous studies, the nasogastric catheter was inserted 10 to 15 centimeters deep into the esophagus and then following by the PLMA [8,10]. With the longer length of nasogastric catheter, it was easier to be folded or kinked while passing through posterior pharyngeal wall causing the impediment of the PLMA insertion and also caused mucosal trauma and increased the time of insertion. In this study, the success rates were not different from the other reports (90%) in NG guided technique which also performed by inexperienced performers [1,2], whereas the success rate of the digital technique in this study was higher than those in the previous reports [1,2].

The experience of the anesthesiologist is another important factor for the successful insertion of PLMA. In the experienced hands, the success rate might not be different because of the ease of the LMA insertion by itself. In the other hand, the different techniques of insertion might affect the success in the learners. Thus, the first and second-year anesthetic residents and in-training anesthetic nurses were designed as the performers. However, the result showed no significant difference in the success rates between the two groups.

For the patients who failed PLMA insertion, half of them were managed by intubation with oroendotracheal tube. Three patients were successfully inserted the PLMA by anesthetic staff in the third attempt. However, it had to reduce the size 4 to size 3 of PLMA to achieve the successful PLMA insertion in three patients.

In DT group, there were some patients failed to properly advance the nasogastric catheter to the stomach. The cause probably be due to the misplacement of the tip of drainage tube of PLMA which was not properly at the esophageal opening or the minor folding of the tip of PLMA after insertion.

The Use of larygeal mask airway in an elective surgery is safe and has low incidences of the serious complications. The mild, short-lasting complications such as airway bleeding/trauma, sore throat, hoarseness are more common. The incidences of airway trauma and sore throat varied from 9 – 22% and 5.8 – 34% depending on the PLMA insertion techniques [11]. The complications of PLMA insertion in our study were not different from the previous studies [1,8,11] but the incidences were higher than those in the reports using laryngoscope and oesophageal vent to guide the PLMA insertion [4,12].

Limitation

First, fourteen patients were excluded from the study due to incomplete data. Even this did not affect to the primary outcome which tested by sensitivity analysis, but it might affect some other secondary outcomes. Secondly, the variation in the experience among the 13 anesthetic nurses and 17 anesthetic residents to perform PLMA insertion during the 1-year duration of the study. Thirdly, we did not use flexible fiberoptic laryngoscope to determine the proper position of placement. The malposition rate might be higher compared to the clinical judgement. Lastly, this study could not be blinded for the assessment of PLMA insertion.

Conclusion

Insertion of the Proseal LMA using nasogastric catheter protruding 5 cm from the drainage tube distal aperture for guiding technique did not provide an advantage over the index finger technique by the inexperienced performers. The complications from both insertion techniques were also similar.

Thai Clinical Trial Registry number: TCTR20161026001

Financial support of the work: Songklanagarind Hospital, Department of Anesthesia, Faculty of Medicine, Prince of Songkla University, Thailand

Conflict of Interest: none

Acknowledgement: none

References:

  1. Perilli V, Aceto P, Sacco T, Martella N, Cazzato MT, Sollazzi L (2014) Suction catheter guided insertion of ProSeal laryngeal mask airway: Experience by untrained physicians. Indian J Anaesth. 58(1): 25–9. [Crossref]
  2. Nagata T, Kishi Y, Tanigami H, Hiuge Y, Sonoda S, Ohashi Y, et al. (2012) Oral gastric tube-guided insertion of the ProSeal™ laryngeal mask is an easy and noninvasive method for less experienced users. J Anesth 26(4): 531–5. [Crossref]
  3. El Beheiry H, Wong J, Nair G, Chinnappa V, Arora G, Morales E, et al. (2009) Improved esophageal patency when inserting the ProSealTM laryngeal mask airway with an EschmannTM tracheal tube Introducer. Can J Anaesth 56(10): 725–32. [Crossref]
  4. Eschertzhuber S, Brimacombe J, Hohlrieder M, Stadlbauer KH, Keller C (2008) Gum Elastic Bougie-guided insertion of the ProSeal Laryngeal mask airway is superior to the digital and introducer tool techniques in patients with simulated difficult laryngoscopy using a rigid neck collar. Anesth Analg 107(4): 1253–6. [Crossref]
  5. Howath A, Brimacombe J, Keller C (2002) Gum-elastic bougie-guided insertion of the ProSeal laryngeal mask airway: a new technique. Anaesth Intensive Care 30(5): 624–7. [Crossref]
  6. Brimacombe J, Keller C. (2004) Gum elastic bougie-guided insertion of the ProSeal Laryngeal Mask Airway. Anaesth Intensive Care 32(5): 681–4. [Crossref]
  7. Chen HS, Yang SC, Chien CF, Spielberger J, Hung KC, Chung KC (2011) Insertion of the ProSealTM laryngeal mask airway is more successful with the Flexi-SlipTM stylet than with the introducer. Can J Anesth 58(7): 617–23. [Crossref]
  8. García-Aguado R, Viñoles J, Brimacombe J, Vivó M, López-Estudillo R, Ayala G (2006) Suction catheter guided insertion of the ProSealTM laryngeal mask airway is superior to the digital technique. Can J Anesth 53(4): 398–403. [Crossref]
  9. Chen MK, Hsu HT, Lu IC Shih CK, Shen YC, Tseng KY, et al. (2014) Techniques for the insertion of the proseal laryngeal mask airway: comparison of the foley airway stylet tool with the introducer tool in a prospective, randomized study. BMC Anesthesiol 14: 105. [Crossref]
  10. Gasteiger L, Brimacombe J, Perkhofer D, Kaufmann M, Keller C (2010) Comparison of guided insertion of the LMA ProSealTM vs the i-gelTM. Anaesthesia 65(9): 913–6. [Crossref]
  11. Michalek P, Donaldson W, Vobrubova E, Hakl M (2015) Complications associated with the use of supraglottic airway devices in perioperative medicine. Biomed Res Int 2015: 746560.
  12. Eschertzhuber S, Brimacombe J, Hohlrieder M, Keller C (2009) The Laryngeal Mask Airway SupremeTM – a single use laryngeal mask airway with an oesophageal vent: a randomized, cross-over study with the Laryngeal Mask Airway ProSealTM in paralysed, anesthetized patients. Anaesthesia 64(1): 79–83. [Crossref]