Abstract
Traditionally doctoral students are trained to pursue tenure-track positions in research-intensive institutions. However, a survey of 914 PhD alumni at a public research university in a diverse array of disciplines finds that students move across employment sectors over a 15-year period. This study used a three-tier taxonomy to classify both short- and long-term employment outcomes based on employment sector, career type and job sector for Science, Technology, Engineering and Mathematics (STEM) and Social and Behavioral Sciences and Education (SBSE) doctoral alumni. The study is unique in that demographic information such as race, gender and citizenship status and academic performance measures were examined to gain a deeper understanding of career trajectories. The findings indicate differing career paths based on demographic characteristics, but also finds there is no correlation between academic performance metrics such as GPA and GRE scores and job placements in academia or outside of academia. This has significant implications for doctoral training and suggests that graduate programs must prepare students for both academic and alternative careers, particularly as tenure-track positions and U.S. federal research dollars continue to shrink. This study also adds to a growing body of literature on the need for rigorous data collection, and transparency to help students make informed choices about PhD training and career pathways.
Keywords
Career outcomes, doctoral training, STEM, Social and Behavioral Sciences and Education
Introduction
Graduate study is a high-stress pursuit [1]. Some of this stress results from uncertainty about career outcomes. Academic institutions have traditionally trained and prepared doctoral students for a single career pathway: tenure-track faculty positions. However, today’s knowledge-based economy offers doctoral students rich and varied career options, and doctorate holders have the potential to contribute to a broad spectrum of the US workforce. In this paper, we use data from a 15-year survey of Ph.D. alumni from a comprehensive research university to document the diversity of career pathways pursued by PhD students in Science, Technology, Engineering and Mathematics (STEM) fields and in the Social and Behavioral Sciences and Education (SBSE). We separate our examination of STEM and SBSE alumni, as we suspect that the career paths of alumni in these broad disciplinary areas may differ. We also analyze how career outcomes change for different cohorts by age, and how they correlate with demographics and academic performance indicators. This study provides a better understanding of the career trajectories of doctoral alumni, which has significant implications for appropriate training and advising of Ph.D. students. This in turn may lead to higher rates of career satisfaction and well-being for individuals over the course of their careers. Institutional transparency about career outcomes can also encourage students to explore all available career tracks and mitigate some of the stress inherent in the pursuit of a doctoral degree.
New research shows that Ph.D. holders are increasingly migrating to non-academic sectors despite a persistent culture in academia that emphasizes the singular path to success as the professoriate at a research-intensive university. National data sources and the research literature underscore the shift away from academic careers in specific disciplines. For example, only 17.7% of PhDs (in science, engineering and heath disciplines) in 2015 had secured tenure-track positions within five years of receiving their degree. This compares to a 25.9% tenure track placement in 2006 and a 27% placement in 1993 [2]. Similarly, the National Science Foundation’s Survey of Earned Doctorates (SED) found that 50% of science, engineering and health discipline PhDs are engaged in careers outside of academia within 14 years of graduation [3]. Almost 75% of all biomedical doctoral alumni engage in careers beyond academia, including for-profit, government and non-profit sectors [4,5]. The shift is present, though perhaps less stark, in the Social and Behavioral Sciences. A study of 3000 Social Science graduates who earned their degrees in the United States between 1995 and 1999 found that 77% hoped to obtain tenure-track positions, but only 40% found such positions within a year of earning their degree [6].
The steady exodus away from careers in academia can be attributed in part to a declining number of faculty jobs [7]. It also reflects some students’ loss of interest in a lifetime career in academia as they progress through doctoral programs [8–11]. Students may reassess their opportunities for success in hyper-competitive environments, which place a premium on publications and grants. When students observe the life-work imbalances of their faculty advisers, long postdoctoral training periods, and meager salaries for academics at early stages of their careers, these factors may also contribute to student interest in alternative paths [8]. For these reasons, and because students move between employment sectors in the course of a career, it becomes incumbent upon graduate institutions to inform current and former students about a wide-range of career options [7, 10, 12–14].
The move towards transparency about PhD career outcomes has gained momentum in recent years [13, 15–17], yet, the use of divergent taxonomies prevented aggregation and identification of national trends [18–22]. A unified and replicable taxonomy for the biomedical sciences was developed in 2017 by several groups, including the National Institutes of Health Broadening Experiences in Scientific Training (NIH-BEST) grantee consortium, the Association of American Medical Colleges’ Graduate Research Education and Training (AAMC GREAT) group, and Rescuing Biomedical Research (RBR). The consortium proposed a common three-tier taxonomy to standardize PhD career outcomes classifications: Tier 1 includes five employment sectors; Tier 2 comprises five career types; and Tier 3 includes 26 job functions [23], as shown in S1 Appendix. This taxonomy is flexible enough to adapt to disciplines beyond biomedical sciences and was used to categorize the 914 alumni in this study.
In addition to improved data collection and transparency about Ph.D. career outcomes, new training models and professional development offerings are crucial to helping students make the transition to work environments and cultures outside academia [10, 12, 24, 25]. The research literature indicates that employers look for transferrable skills such as the ability to work in collaborative teams, strong communication and presentation skills, and project management experience. The literature calls on faculty mentors and the graduate training community to strongly encourage mentees to fully explore myriad career options during their graduate studies [26]. Some also suggest the use of professional nonacademic mentors and successful alumni to provide students with guidance throughout a graduate program [24].
Wayne State University (WSU) is a comprehensive research institution with an enrollment that includes 1,500 doctoral students in 75 doctoral programs. Our PhD alumni work as professors, lead research labs, own consulting firms, teach undergraduates and work in executive management in industry and government. Like other academic institutions, our training models have long been based on the assumption that students would pursue tenure-track faculty positions. To gain a granular understanding of career trajectories, the Graduate School launched the 2015 Alumni Census project to collect employment information of doctoral alumni who graduated over a 15-year window from 1999 to 2014 [18]. Analyzing longitudinal data provided us with a deeper understanding of how our alumnus navigate through the early and middle stages of their careers.
In addition to looking at career changes over time, our study also collected demographic information on doctoral alumni so that we could better understand how race, gender and citizenship status interact with career outcomes. We also examined key metrics associated with academic performance such as GRE scores, cumulative GPA and time-to-PhD degree completion. Traditionally, strong performance in these metrics was believed to be correlated with securing a tenure-track position at a research institution, while lower performers on these types of measures were perceived as accepting positions outside academia at a higher rate; jobs which have been traditionally viewed as less prestigious.
To provide a short- and long-term snapshot, we used the career of the alumnus at the time of the data collection and “binned” these data in aggregate for alumni based on number of years from graduation (0–5 years; 6–10 years; and 10–15 years post-graduation). These aggregated career outcomes data were then classified according to the unified three-tier taxonomy, and used to ask the following questions: (a) in which employment sectors, career types, and job functions are WSU’s alumni engaged; (b) is there a distinction between the types of careers pursued based on gender, race and U.S. citizenship status of alumni; and (c) is there a correlation of career outcomes with academic characteristics such as GRE scores, doctoral GPA, and time-to-PhD degree completion?
To our knowledge, this report is unique. It is the first published research to examine doctoral career paths along with the demographics and academic preparedness of alumni in STEM and SBSE. There exists an abundance of literature on STEM career outcomes; however there is less robust information on SBSE career trajectories. This study attempts to close some of those information gaps and shed light on what we anticipate are divergent pathways. Specifically, we assume that STEM alumni, particularly those in engineering, would pursue jobs in business and industry, while SBSE PhDs would follow more traditional paths securing teaching and research positions in academic settings.
Methods & Materials
Alumni Census Project
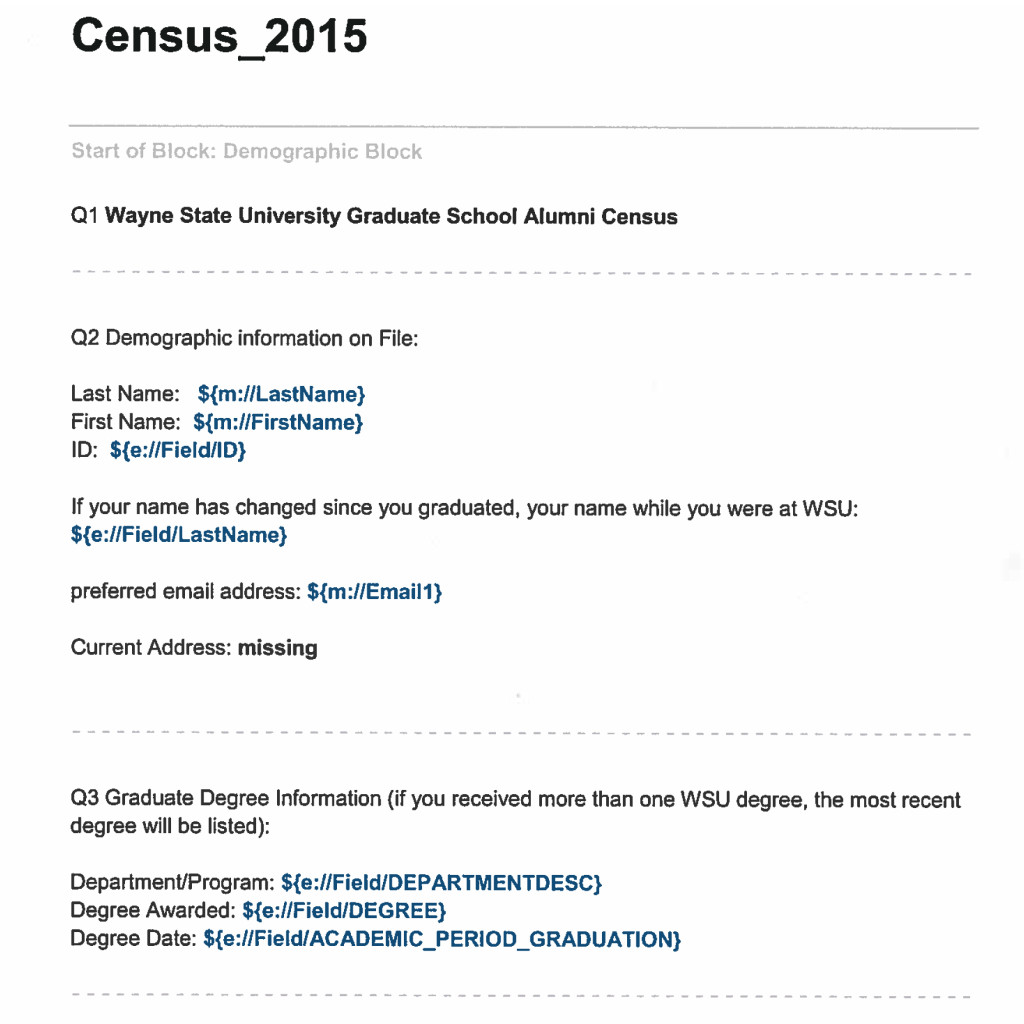
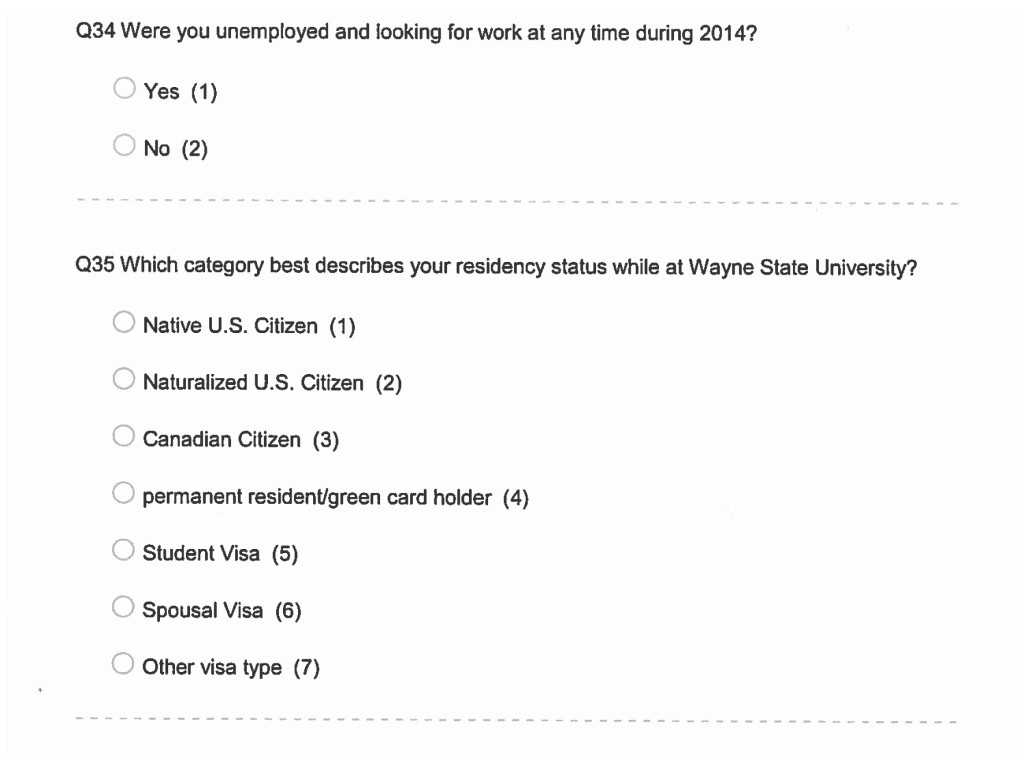
In 2015 WSU’s Graduate School launched an Alumni Census Project in which the current employment information of 496 STEM and 418 SBSE doctoral alumni who graduated from 1999–2014 were collected, as previously described [18]. The departments included in this study and the numbers of alumni surveyed in each are described in Table 1. The information gathered included a direct survey of alumni to indicate their current job placement, as well as information gathered directly from graduate programs and graduate faculty. Alumni were also asked to answer a series of questions about their career trajectories, including information on their first placement, the length of time they have been with their current employer as well as their various job titles over time to provide a rich view of their career progression. The complete survey is in S2 Appendix. Self-reported employment data were validated using alumni institutional websites, federal funding agency and publication records, Google, LinkedIn, and other professional social media sites.
Table 1a. STEM Majors
|
Departments |
College of Engineering |
College of Liberal Arts & Sciences |
Grand Total |
|
Chemical Engineer & Materials Science |
58 |
58 |
|
|
Civil & Environmental Engineering |
24 |
24 |
|
|
Computer Science |
4 |
74 |
78 |
|
Electrical & Computer Engineering |
70 |
70 |
|
|
Engineering Dean |
36 |
36 |
|
|
Industrial & Manufacturing Engineering |
53 |
53 |
|
|
Mathematics |
50 |
50 |
|
|
Mechanical Engineering |
65 |
65 |
|
|
Physics & Astronomy |
1 |
61 |
62 |
|
Grand Total |
311 |
185 |
496 |
Table 1b. SBSE Majors
|
Departments |
College of Education |
College of Liberal Arts & Sciences |
School of Business |
School of Social Work |
Grand Total |
|
Administrative & Organizational Studies |
54 |
54 |
|||
|
Anthropology |
12 |
12 |
|||
|
Business Administration |
5 |
5 |
|||
|
Economics |
38 |
38 |
|||
|
Political Science |
22 |
22 |
|||
|
Psychology |
197 |
197 |
|||
|
Social Work |
3 |
3 |
|||
|
Sociology |
34 |
34 |
|||
|
Teacher Education |
4 |
4 |
|||
|
Theoretical & Behavioral Foundations |
49 |
49 |
|||
|
Grand Total |
107 |
303 |
5 |
3 |
418 |
Ethical Approval
This project was conducted with approval from Wayne State University’s Institutional Review Board on the Use of Human Subjects, IRB#094013B3E.
Data Reporting and Visualization
All data are reported in aggregate or with identifiable information removed. Data in which a group is below 4% are not reported in order to maintain confidentiality and anonymity of the individual(s).
Demographic characteristics used in the study include gender (men and women); race (Asian, Black, White); and citizenship status (U.S. citizen/permanent resident or non-U.S. citizen). The 496 STEM alumni include 106 women (21.4%) and 390 men (78.6%); 291 Asian (58.7%), 188 White (37.9%) and 17 Black (3.4%) alumni; 119 U.S. citizens/permanent residents (24%) and 377 non-U.S. citizens (76%), as shown in Table 2a. The 418 SBSE alumni include 266 women (63.6%), 152 men (36.4%); 307 White (74.5%), 56 Black (13.6%), 49 Asian (11.9%); 353 U.S. citizens/permanent residents (84.4%), and 65 non-U.S. citizens (15.6%), as shown in Table 2b. Note that we report race data in only three categories because the number of alumni in other race categories falls below our 4% reporting threshold. This reduces the number of SBSE alumni included in analyses that consider race from 418 to 412.
Academic characteristics assessed were (a) GRE-Quantitative and GRE-Verbal scores submitted at the time of graduate admission; (b) cumulative GPA at doctoral graduation; and (c) time to doctoral degree completion. For our analysis, GRE Quantitative scores (GRE-Q) are shown in blocks of scores of 137–145, 146–155, 156–166. GRE-Verbal scores (GRE-V) are shown in blocks of scores of 130–145, 146–155, 156–170. Note that the GRE is not a requirement for admission to all programs at WSU, therefore the numbers in these analyses do not total 496 (for STEM) or 418 (for SBSE). Data are expressed as percent of alumni in each score/year range.
Cumulative GPA at time of doctoral graduation is grouped as blocks of 3.0–3.5 GPA, 3.51–3.75 GPA, 3.76–4.0 GPA; and Time-to-Degree completion (TTD) in blocks of 3.5–5.0, 5.1–6.0, 6.1–7, 7+ years. At WSU, average Time-to-Degree for STEM doctoral students is 6.1 years and 6.9 years for SBSE students.
As we examined our data, we realized that the distributions of alumni in each of the three tiers: Employment Sectors, Career Types and Job Functions, change over time. Since most of these changes were seen in 5 year windows, we have depicted all data in three 5 year windows to visualize employment shifts; i.e., Window 1 (0–5 years); Window 2 (6–10 years); and Window 3 (11–15 years) immediately following graduation. Note that in this manuscript, the trajectory of each alumnus over a 15-year time period is not reported. Rather, the overall alumni aggregate employment data are shown in each time window from years following graduation within each of the three tiers at the specific time of the survey.
Outcome analyses were performed using SPSS version 25 (IBM 2018). Chi-Squared (Χ2) analyses with follow-up z tests employing a Bonferroni correction were used to test for significantly different proportions of alumni in different Employment Sectors, Career Types, and Job Functions over time. Since time windows contained different sets of participants, between-subjects analyses were conducted. Multinomial logistic regression analyses were then conducted to test for significant interactions between time windows and demographic characteristics. Singularities in the Hessian matrix due to small sample sizes in some cells prevented valid multinomial analysis. Because of the Hessian matrix violations, Chi-Squared (Χ2) analyses were used to test for significantly different proportions of demographic groups within each tier. As with time windows, post hoc z tests with Bonferroni corrections were used to test for significant effects if the omnibus Chi-square test was significant. Differences among comparison groups were considered to be statistically significant at p < .05.
Table 2a. Gender, race, and citizenship status of 15-year STEM doctoral alumni (n = 496)
|
Women |
Men |
Asian |
Black |
White |
US citizen or Permanent Resident |
Non-US Citizen |
|
|
Total (496) |
106 |
390 |
291 |
17 |
188 |
119 |
377 |
|
Asian (291) |
51 |
240 |
291 |
– |
– |
21 |
270 |
|
Black (17) |
6 |
11 |
– |
17 |
– |
12 |
5 |
|
White (188) |
49 |
139 |
– |
– |
188 |
86 |
102 |
|
US Citizen or Permanent Resident (119) |
36 |
83 |
21 |
12 |
86 |
119 |
– |
|
Non-US Citizen (377) |
70 |
307 |
270 |
5 |
102 |
– |
377 |
Table 2b. Gender, race, and citizenship status of 15-year SBSE doctoral alumni (n =418)
|
Women |
Men |
Asian |
Black |
White |
US Citizen or Permanent Resident |
Non-US Citizen |
|
|
Total (418)* |
266 |
152 |
49 |
56 |
307 |
353 |
152 |
|
Asian (49) |
31 |
18 |
49 |
– |
– |
18 |
31 |
|
Black (56) |
35 |
21 |
– |
56 |
– |
48 |
8 |
|
White (307) |
195 |
112 |
– |
– |
307 |
281 |
26 |
|
US Citizen or Permanent Resident (353) |
231 |
122 |
18 |
48 |
281 |
353 |
– |
|
Non-US Citizen (65) |
35 |
30 |
31 |
8 |
26 |
– |
65 |
* Note that we report race data in only three categories because the number of alumni in other race categories fall below our 4% reporting threshold. This reduces the number of SBSE alumni included in analyses that consider race to 412 from 418.
In addition, we conducted multinomial logistic regression analyses to test for significant interactions between combinations of demographic characteristics (e.g., gender, race, and citizenship). However, singularities in the Hessian matrix due to small sample sizes in some cells prevented valid multinomial analysis. Chi-Squared (Χ2) analyses were also attempted to examine patterns of career outcomes in isolated subsets of alumni; however, small and n = 0 cell sizes for some categories resulted in uninterpretable results. Because the patterns of findings appear to be similar for these small groups, we decided to present analyses on each demographic variable (rather than combinations of variables) to yield robust results that could be used as a basis for future investigations. Thus, the analyses presented here focus on patterns of career outcomes within each demographic group for the entire 15-year window. Logistic regression analyses were used to test whether academic characteristics were associated with Employment Sector outcomes. Significance was determined with a p value < .05.
Results
15-year career outcomes of WSU’s STEM doctoral alumni
Figure 1 shows overall 15-year STEM doctoral alumni career outcomes. Data are presented by tier in three time windows that build from the center of the circle as follows: 0–5 years; 6–10 years; and 11–15 years. In our overall STEM alumni outcomes, not all employment sectors, career types and job functions were equally represented.
For employment sector (Tier 1), overall across the three time periods we found that STEM alumni were almost evenly split between careers in academia (47.2%) and the for profit sector (48.2%). Only a small percentage go on to work in government (4.2%) or nonprofit (.4%) sectors (Figure 1a).
Tier 2 (Career Type) shows that alumni engage in careers that are discipline related (46.2%), primarily research (23.8%), and primarily teaching (23.4%), with a small percent engaged in further training or education (4.2%) and others in careers not related to discipline (2.4%) (Figure 1b).
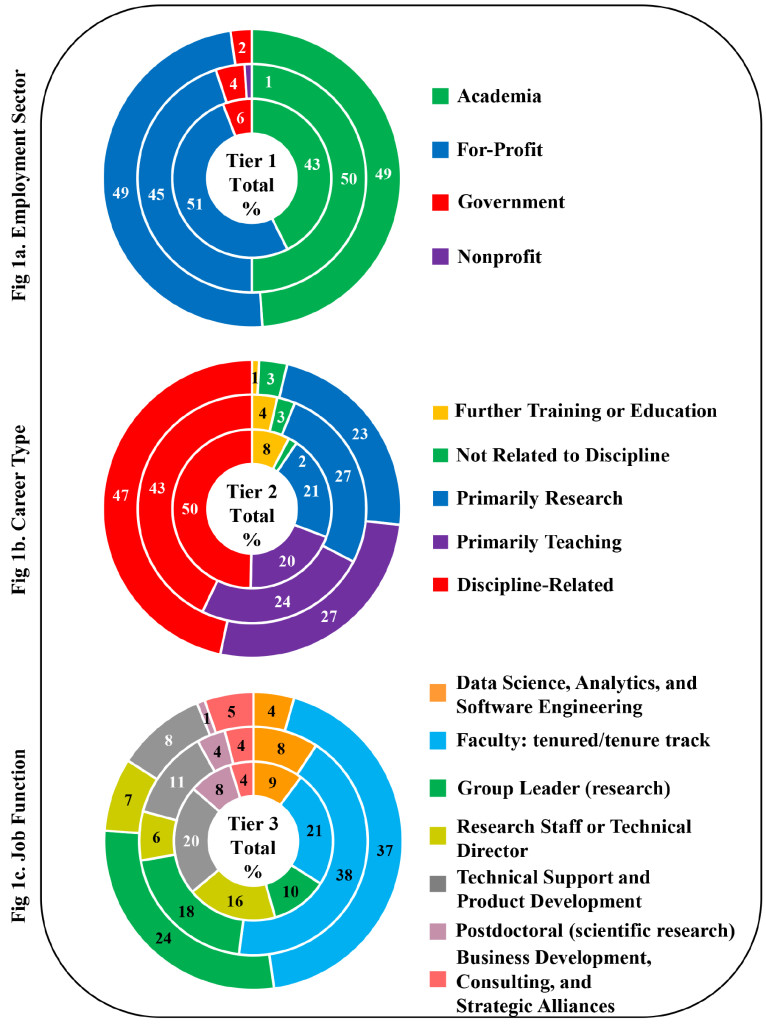
Figure 1. STEM Doctoral Alumni Career Outcomes by Tier
For Tier 3 we find that seven primary job functions describe the work of 87.3% of Wayne State’s STEM PhD alumni: faculty (tenured/tenure track) (31.9%), research group leader (16.9%), technical support/product development (13.3%), research staff or technical director (9.7%), and data science, analytics, and software engineering (7.3%), post-doctoral research (4.2%) business development, consulting and strategic alliances (4%) (Figure 1c). The remaining 12.7% of STEM alumni are engaged in other job functions which have fewer than 4% alumni in each.
STEM Demographic Characteristics and Employment Sector (Tier 1)
We analyzed the Tier 1-Employment Sector data as three windows of 5-years each to see if there were significant career shifts over time, or significant differences in career outcome by gender, race or U.S. citizenship status. We find that the pattern of employment sector for STEM alumni did not significantly change over time, Χ2 (6, N = 496) = 7.35, p = .29. However, there was a significant difference between men and women in terms of their sector of employment, Χ2 (3, N = 496) = 8.97, p = .03, with women more likely to hold academic jobs and men more likely to be employed in the for-profit sector, p < .05 (Figure 2).
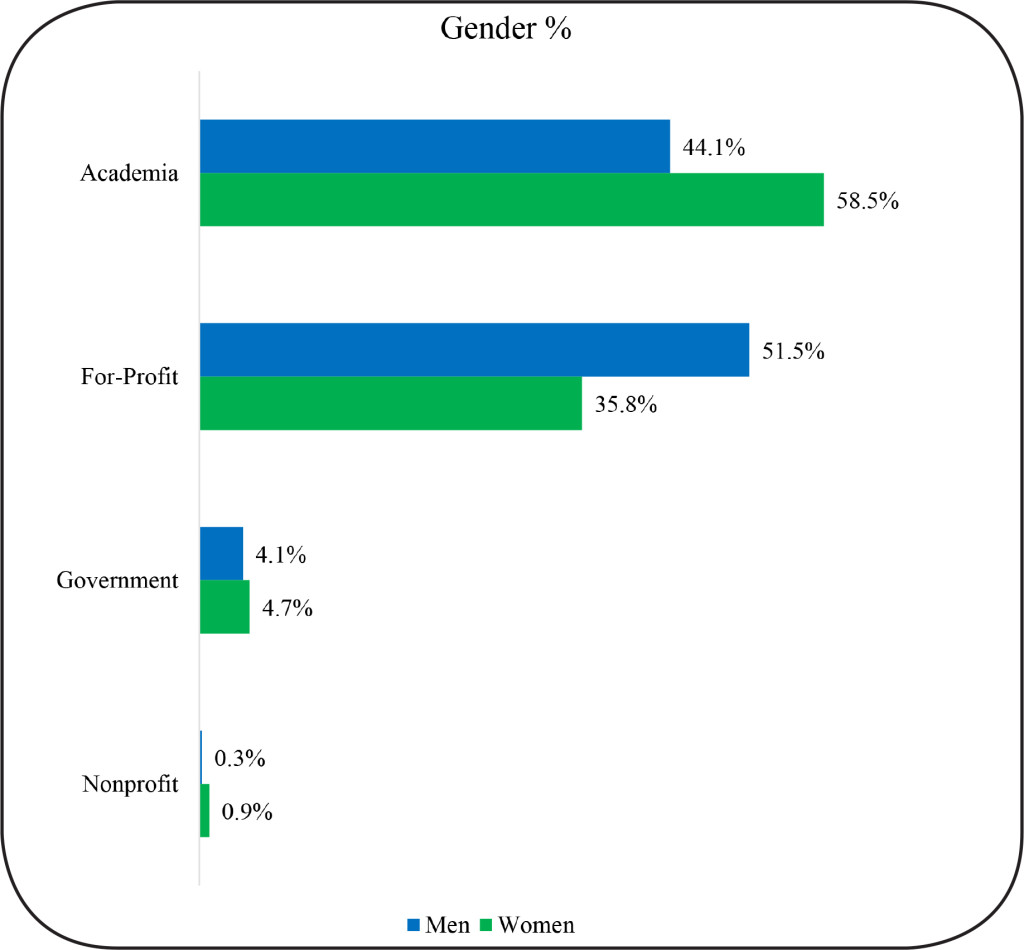
Figure 2. Gender and Employment Sector of STEM Doctoral Alumni
There was also a significant effect of race on employment sector Χ2 (6, N = 496) = 19.91, p = .003. A higher proportion of Asians entered the for-profit sector as compared to Whites (p < .05). (Figure 3). There were no significant differences between U.S. citizen and non-U.S. citizen alumni in the STEM fields, Χ2 (3, N = 496) = 1.86, p = .60.
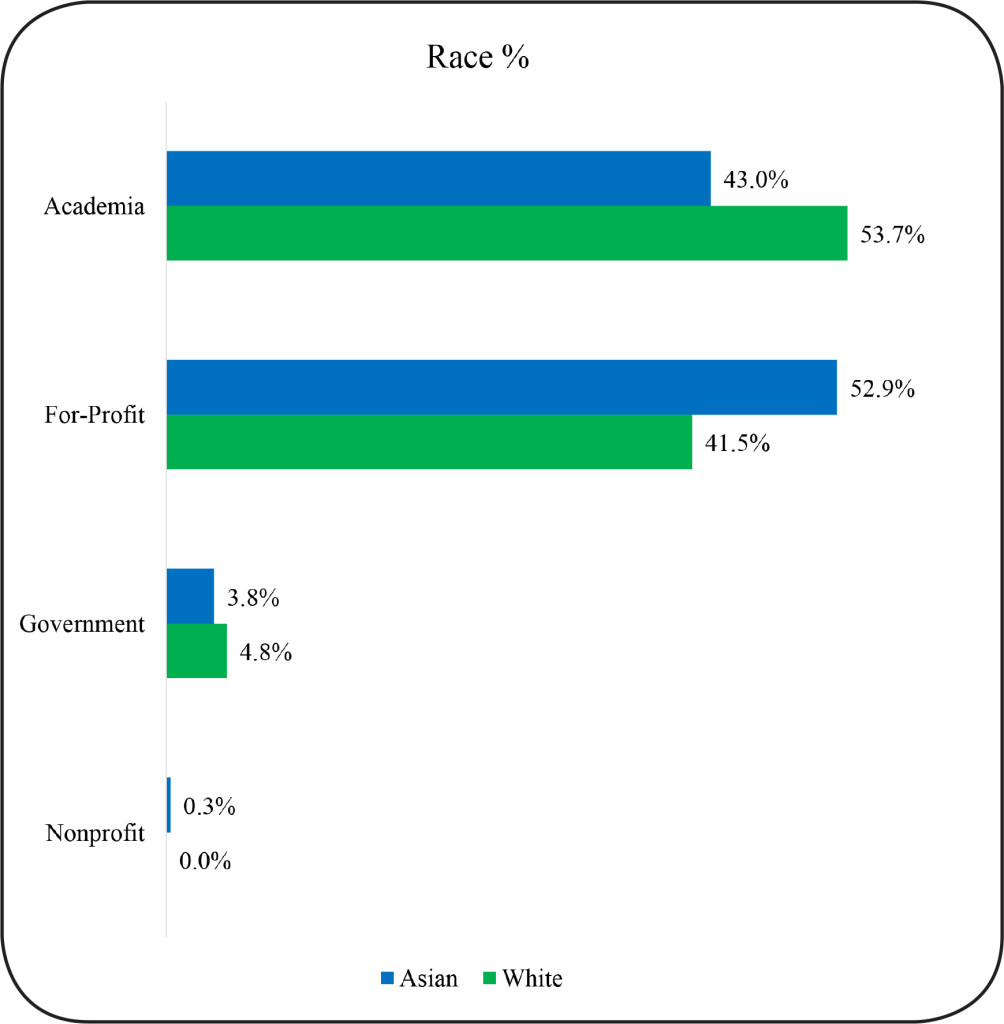
Figure 3.Race and Employment Sector of STEM Doctoral Alumni
STEM Demographic Characteristics and Career Type
(Tier 2)
We further analyzed the Tier 2- Career Type data as three windows of 5-years each for total alumni as well as by gender, race, and U.S. citizenship status. As with Tier 1, we find that for STEM alumni, the distribution of career types did not significantly change over time, Χ2 (, N = 496) = 12.15, p = .15. However, men and women differed in their career types, Χ2 (4, N = 496) = 11.64, p = .02. Significantly more women were in primarily teaching careers (p < .05), and more men in science-related careers (p < .05). (Figure 4). Racial group distributions were similar across Career Types, Χ2 (8, N = 496) = 6.96, p = .54. Career type was not associated with citizenship status, Χ2 (4, N = 496) = 2.3, p = .68.
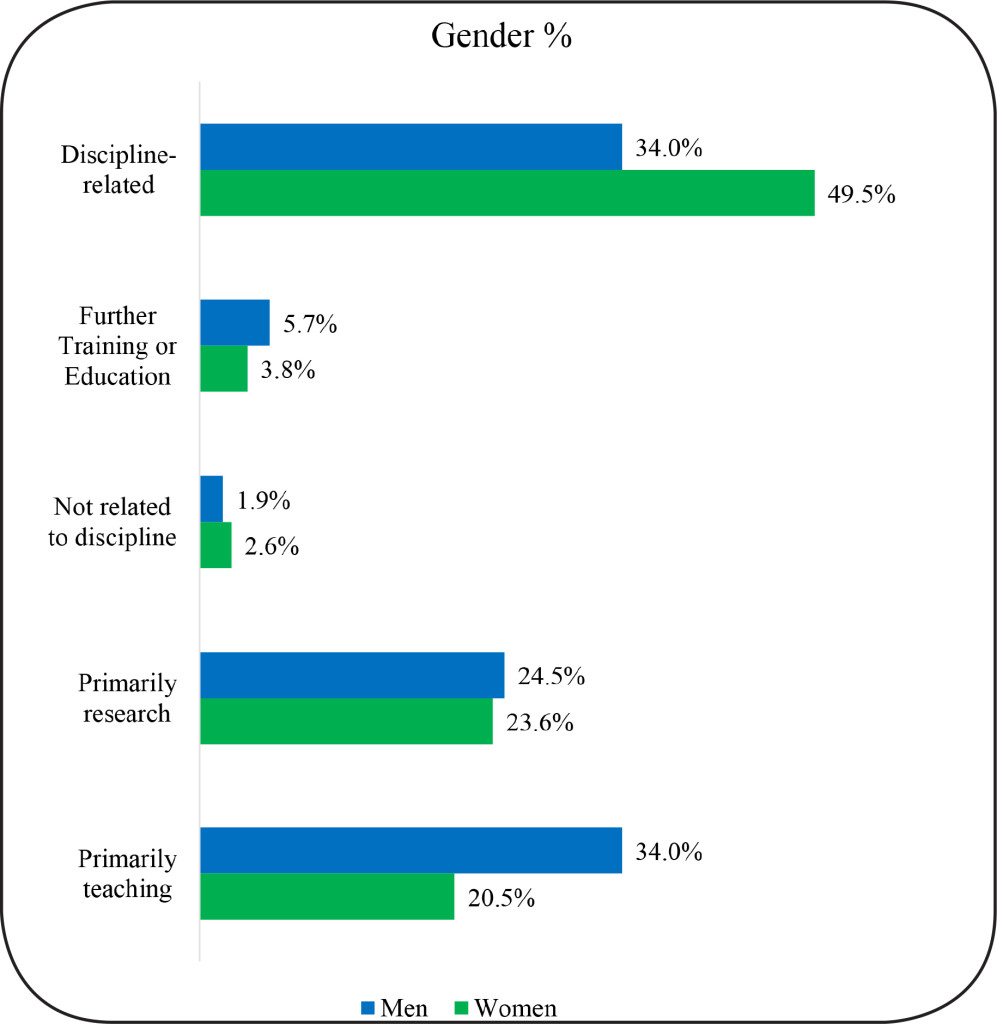
Figure 4. Gender and Career Type of STEM Doctoral Alumni
STEM Demographics and Job Function (Tier 3)
We also analyzed the Tier 3- Job Function data in the same manner as described for employment sector and career type. For this Tier, we found significant changes in the proportions of alumni in different job functions across the different five-year time windows, Χ2 (8, N = 392) = 37.38, p = .0001. Specifically, the proportion of alumni in faculty jobs increased significantly from window 1 (0–5 years) to 2 (5–10 years) (p < .05). We believe this shift may reflect a transition where alumni shift from postdoctoral positions or other additional training to faculty positions. Similarly, the number of alumni in group leader (research) jobs increased significantly from window 1 (0–5 years) to 3 (10–15 years) (p < .05), whereas the proportion of STEM alumni in data science/technical support and product development jobs declined from window block 1 to 3 (p < .05). There was also a significant decrease in alumni in research staff or technical director jobs from Window 1 to 2 (p < .05) (Figure 1c). Again, these shifts can be viewed as part of the expected course of career advancement of Ph.D. holders.
A significant difference was also found between women and men with regard to job function (Figure 5). The significant Chi-square for gender, Χ2 (4, N = 392) = 17.58, p = .001 was accounted for by the fact that women were more likely to hold tenured/tenure track faculty jobs and men were more highly represented in group leader jobs (p < .05). (Figure 5). There were no significant racial group differences, Χ2 (8, N = 392) = 8.47, p = .39, or citizenship group differences Χ2 (4, N = 392) = 6.29, p = .18 in job functions.
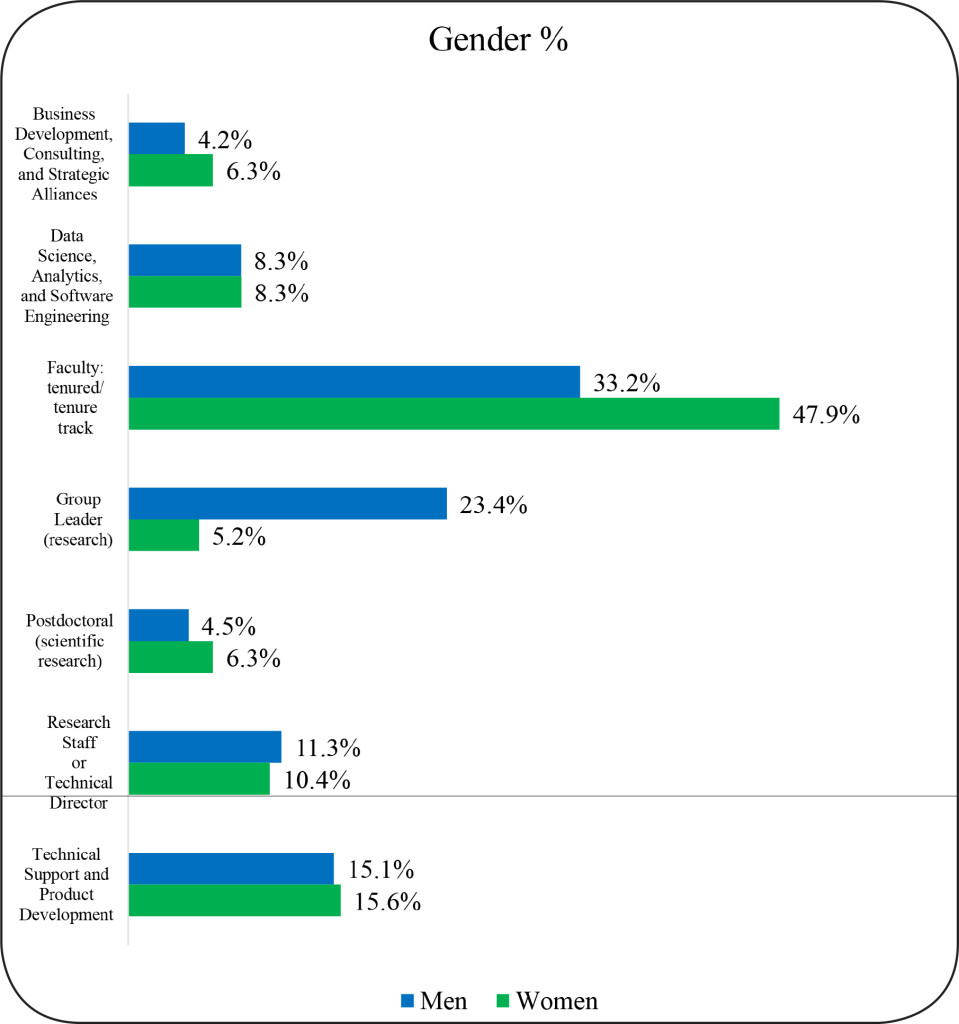
Figure 5. Job Function of STEM Doctoral Alumni by Gender
STEM Academic performance indicators and employment sector
We also examined the association of academic characteristics with the two largest STEM employment sectors: “Academia” and “For-profit.” Participation in other sectors is too small to allow for meaningful comparisons.
There are no statistically significant differences in most of the academic performance indicators examined between alumni who end up in careers in academia as versus the for-profit sector. There is an equivalent spread of GRE-Quantitative scores, GRE-Verbal scores and cumulative GPA of alumni between these sectors (Figure 6). However, STEM alumni who took longer to complete their degrees were more likely to enter the for-profit sector, B = .165, SE = .049, Wald (df = 1) = 11.37, p = .001. A follow-up t-test showed that alumni in the academic sector completed their degrees, on average, in 5.68 years (SD = 1.68) whereas alumni in the for-profit sector completed their degrees, on average, in 6.33 years (SD = 2.30), t (471) = 14.88, p = .001.
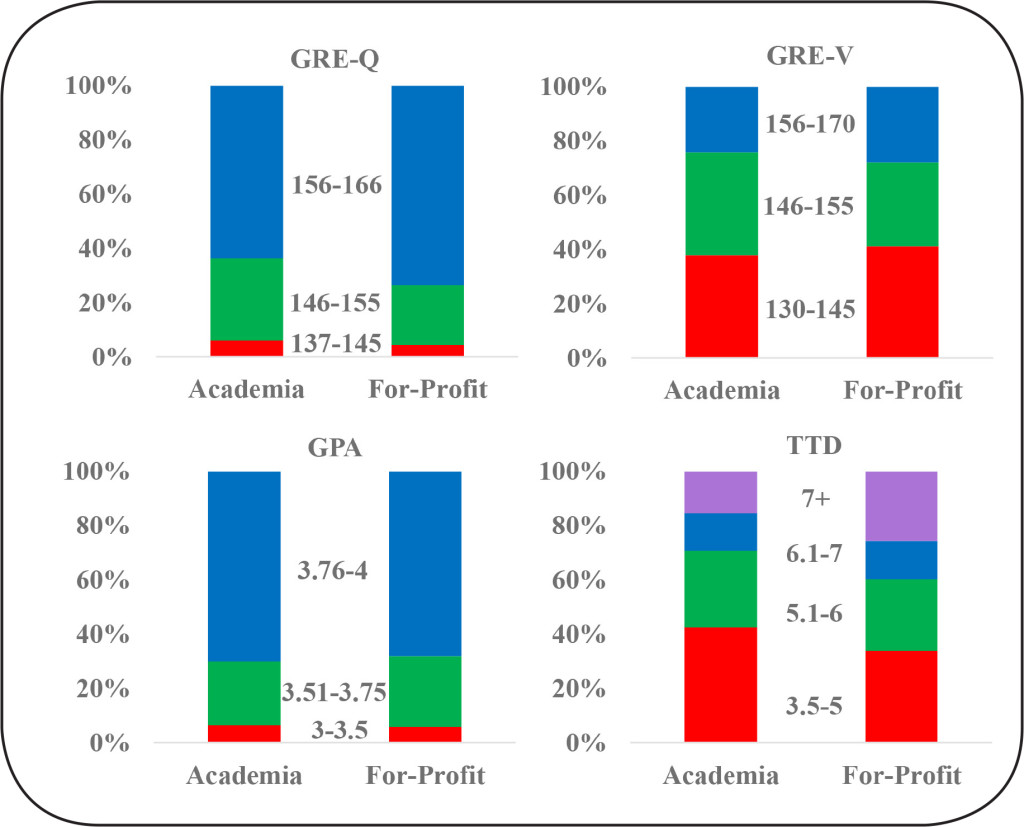
Figure 6. STEM Doctoral Alumni Academic Performance Indicators and Employment Sector
15-year career outcomes of WSU’s SBSE doctoral alumni
SBSE alumni outcomes show not all employment sectors, career types, and job functions are equally represented. SBSE alumni data in Tiers 1, 2 and 3 across the three time windows (0–5 years; 6–10 years; and 11–15 years) is summarized (Figure 7).
In Tier 1, we found the majority of SBSE alumni are employed in academia (64.6%) and the for-profit sector (27.5%). The remaining 8.1% work in government (5.0%) and nonprofit (2.9%) sectors (Figure 7a). This is different from STEM alumni, for whom similar percentages worked in academia and the for-profit sector. Still, over a third of SBSE alumni move on to careers outside of academia. Tier-2 (Career Type) shows that alumni engage in careers that are discipline-related (39.2%) and primarily teaching (38.3%). Approximately 18.9% engage in careers that are primarily research and a small percentage in careers not related to their Ph.D. discipline (3.6%) (Figure 7b).
For Tier-3 (Job Functions), we find that seven primary job functions describe the work of 86.1% of WSU’s SBSE’s alumni: faculty tenure/tenure track (35.9%), healthcare provider (15.1%), administration (11.2%), business development, consulting, and strategic alliances (6.7%), research staff or technical director (6.2%), full-time teaching staff/instructor (6.0%), part-time teaching staff/adjunct (5.0%) (Figure 7c). The remaining 13.9% of SBSE alumni are engaged in job functions that have fewer than 4% alumni in each.
Demographics Characteristics and Employment Sector (Tier 1)
Approximately 92.1% of SBSE alumni are engaged in either academia or for-profit sectors. For the SBSE alumni, unlike STEM graduates, the pattern of employment sector did not significantly change over time, Χ2 (6, N = 418) = 3.96, p = .68. The percentage of SBSE alumni in academic and for-profit careers appears relatively stable across the three time windows. Note that as discussed earlier, the trajectory of each alumnus over a 15-year time period is not reported. Rather, we show aggregate alumni employment data in each time window grouped by years following graduation. For example, a student who graduated in 2006 would be represented in the 6–10 year block only.
In addition, for SBSE alumni we do not see the same gender and race differences we find for STEM alumni. In SBSE fields, men and women did not significantly differ in employment sector, Χ2 (3, N = 418) = 2.11 p = .55. Racial group distributions were similar across employment sector, Χ2 (6, N = 412) = 10.85, p = .09. Also, as with STEM alumni, employment sector was not associated with citizenship status, Χ2 (3, N = 418) = 5.59, p = .13.
Demographics Characteristics and Career Type (Tier 2)
For SBSE alumni, the majority are split between careers that primarily involve teaching and other discipline-related career types. As in the case of SBSE Tier 1 employment sector, the distribution of career types did not significantly change over time, Χ2 (6, N = 418) = 5.30, p = .51. There were no significant gender differences in career types, Χ2 (3, N = 418) = 5.82, p = .12. Racial group distributions were similar across career types, Χ2 (6, N = 412) = 8.27, p = .22. Nor was career type associated with citizenship status, Χ2 (3, N = 418) = 4.62, p = .20. To summarize, career types – whether primarily teaching, primarily research, discipline-related or not related to discipline of study– did not vary for SBSE doctoral alumni with respect to gender, race, or citizenship status.
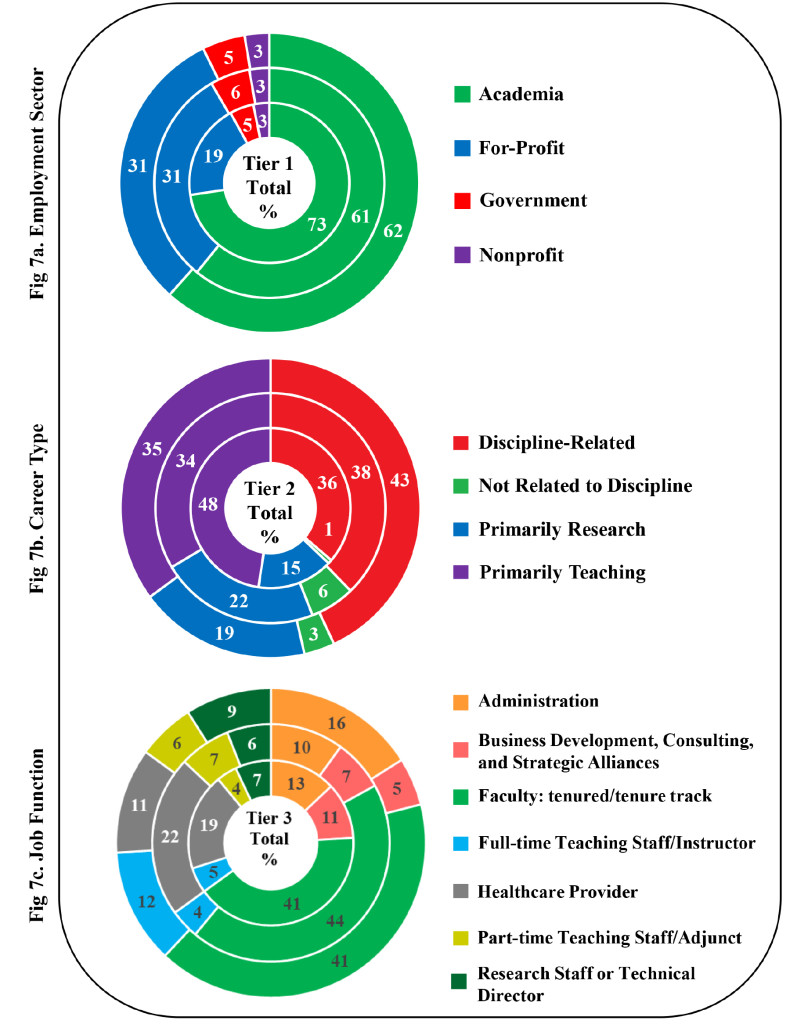
Figure 7. SBSE Doctoral Alumni Career Outcomes by Tier
Demographics Characteristics and Job Function (Tier 3)
For job function, as with employment and career type, we find no statistically significant changes in the proportions of alumni in different job functions over our three time windows, Χ2 (12, N = 360) = 13.08 p = .36. However, there was a significant Chi-square for gender, Χ2 (6, N = 360) = 13.65, p = .03 in the job function category of healthcare provider. Specifically, our data show that women are more likely to work as health care providers than men. (Figure 8).
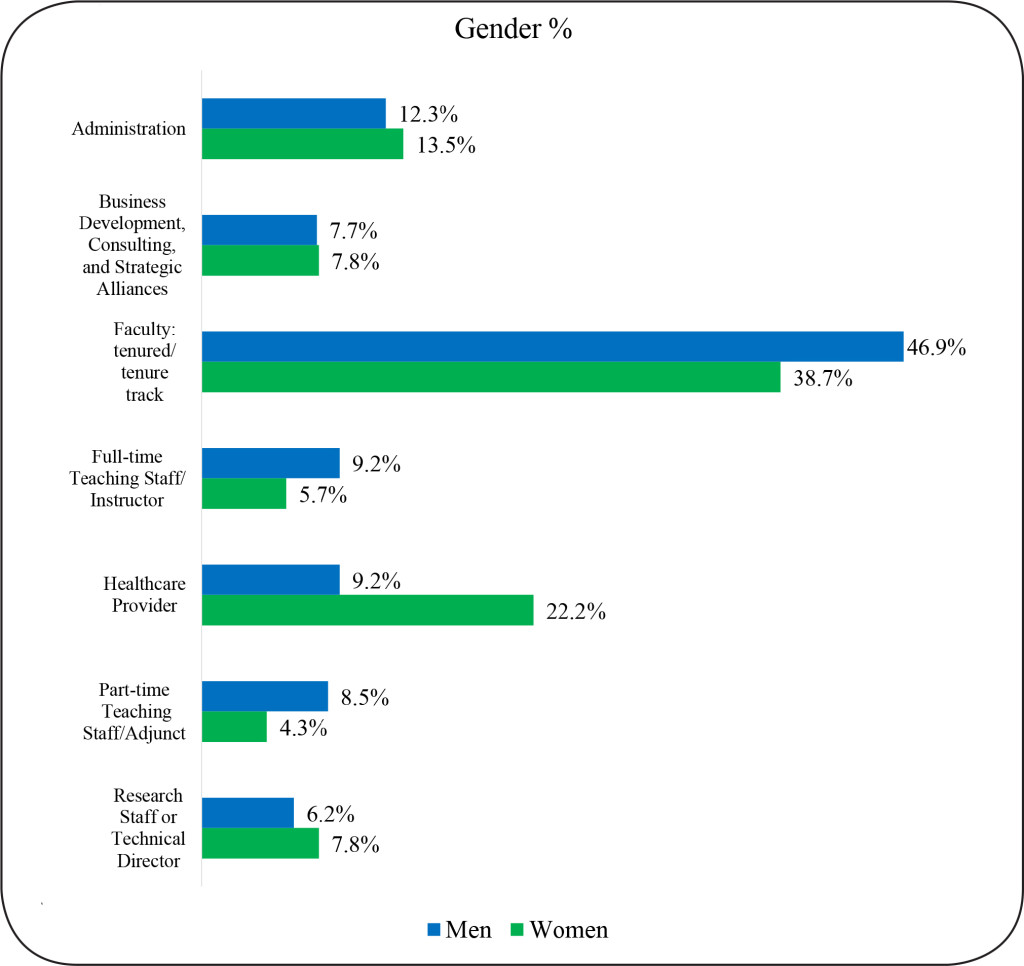
Figure 8. SBSE Doctoral Alumni Job Function by Gender
There were also some significant racial group differences in job functions, Χ2 (12, N = 354) = 31.1, p = .002 (Figure 9). White alumni were more likely than Asian alumni to work as healthcare providers. White alumni were also more likely to hold full-time teaching staff/instructor position than Black alumni. Note that Figure 9 depicts the overall percentage of alumni within the seven top job functions with respect to racial demographics. Although White alumni held 50% of the positions reported for full-time teaching staff/instructor job functions, only 4% of White alumni were represented in this category overall. However, 17% of black alumni are represented in these job functions. There were no significant citizenship group differences in job functions, Χ2 (6, N = 360) = 8.35, p =.21
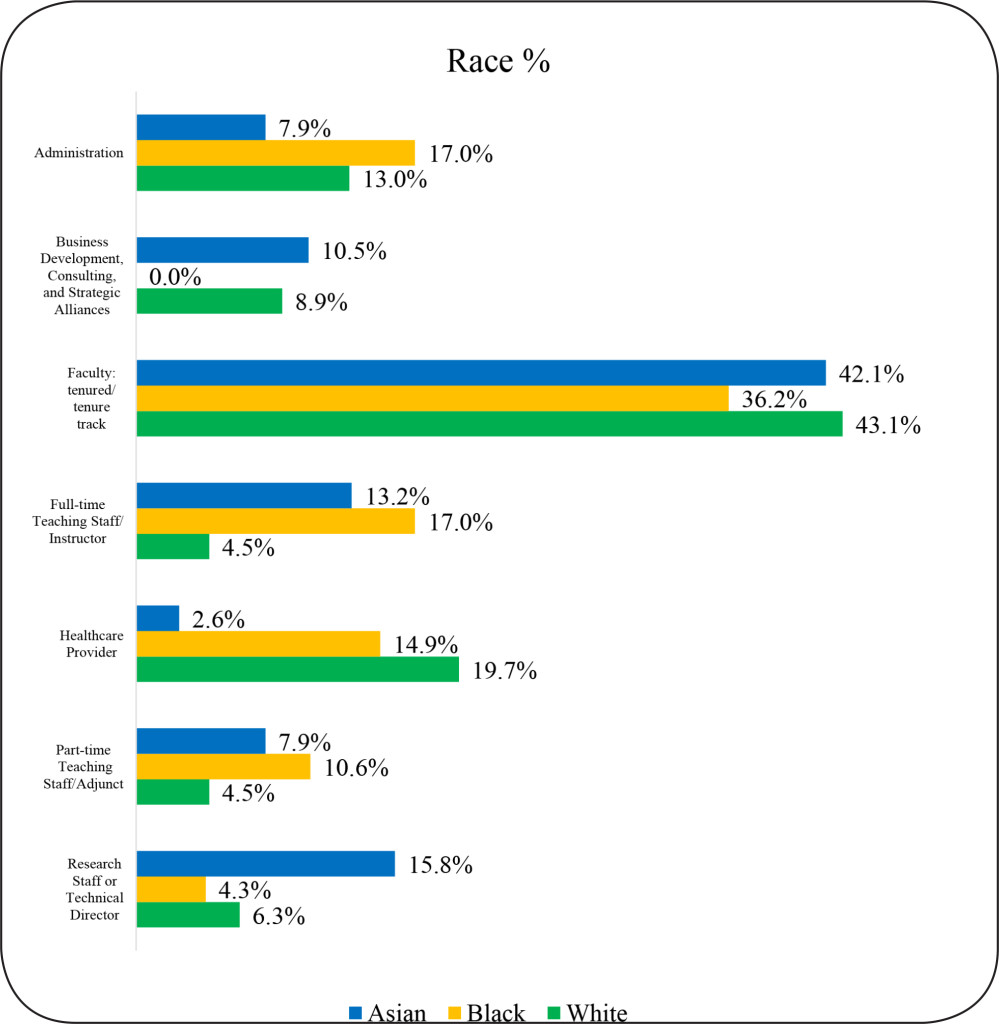
Figure 9. SBSE Doctoral Alumni Job Function by Race
SBSE Academic Performance Indicators and Employment Sector
We examined the association of academic characteristics with career outcomes in only the two largest employment sectors of “Academia” and “For-profit”, since participation in other sectors is too small to allow for meaningful comparisons.
Interestingly, we found no statistically significant differences in any of the academic characteristics examined between alumni in academia and for-profit sectors. An equivalent spread of GRE-Quantitative scores, GRE-Verbal scores, cumulative GPA, and Time-to-Degree completion of alumni between these sectors is shown (Figure 10). Thus, we can conclude that these traditional performance metrics tell us little about what career path our alumni are likely to take.
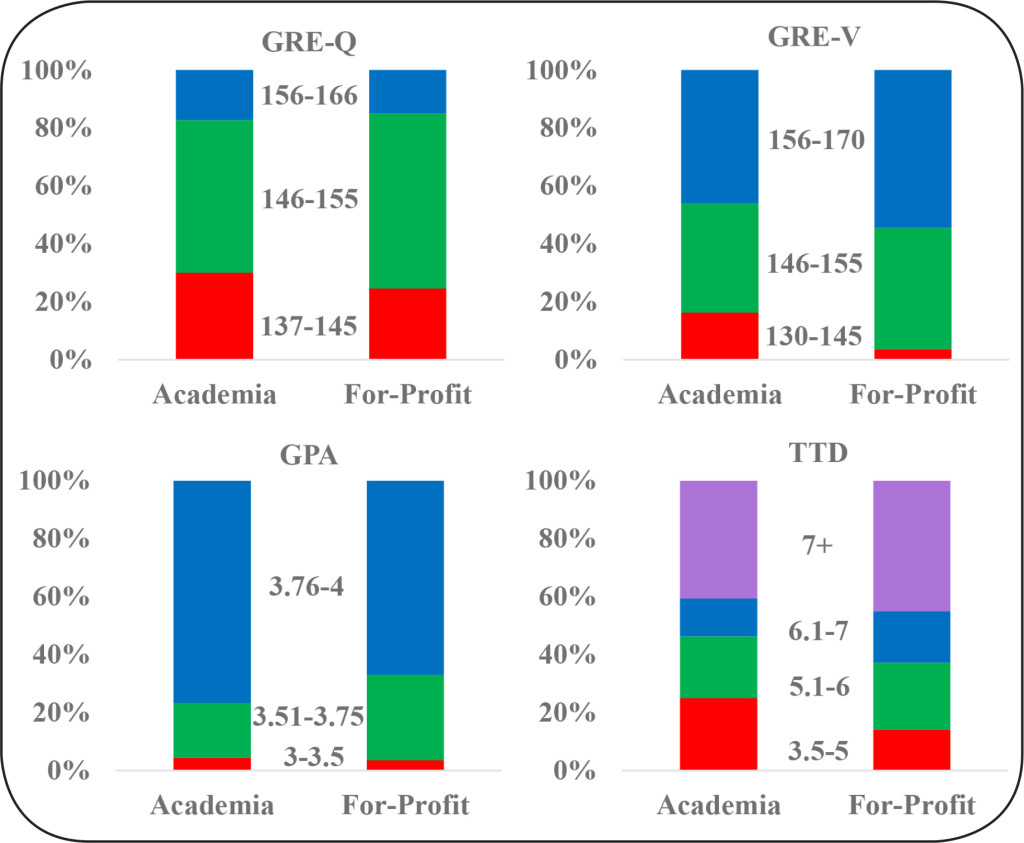
Figure 10. SBSE Doctoral Alumni Academic Performance Indicators and Employment Sector
Discussion
In this paper, we have investigated the 15-year career trajectories of STEM and SBSE doctoral alumni of Wayne State University, a comprehensive research university in Detroit, Michigan. The findings of our study have implications for how higher education institutions approach training and advising for Ph.D. students.
First, our findings confirm exiting studies that show that today’s doctoral students pursue diverse career trajectories – not just tenured positions in the academy. This indicates that we should be advising doctoral students in STEM and SBSE fields about diverse career pathways they might pursue after the Ph.D. Universities should take steps to prepare doctoral students for success not just in academia, but in other areas, particularly the for-profit sector.
As suspected, a common theme throughout the data for STEM alumni was the different career paths for men and women. Our findings show that for employment sector and career type, women were more likely to work in academia in primarily teaching roles, while men were more likely to work in the for-profit sector and in science-related positions. This is further reflected in the job function outcomes in which women worked as faculty whereas men pursued positions such as group leader.
The finding that women in STEM fields were more likely to pursue careers in academia is interesting and encouraging. Research has consistently shown that women and minorities are underrepresented in STEM [26]. This trend is reflected in our 15-year Ph.D. alumni data: in STEM fields, the sample included 76% men compared to 24% women (Table 2). The need to increase diversity in STEM fields is an issue that has been identified at both the national level and at Wayne State [27]. Recognizing these disparities, WSU has actively sought to increase the representation of women and minorities in STEM fields through programs such as the NIH BUILD (Building Infrastructure Leading to Diversity) program, Wayne Med Direct and the Postdoctoral to Faculty Transition (PFT) fellowship. WSU provides support and training to current students and early career scholars to produce a pipeline of underrepresented students for doctoral training and faculty positions in a range of disciplines [28].
As expected, the data does suggest that a majority of SBSE alumni follow more traditional pathways with alumni securing academic positions at greater levels than those in STEM disciplines. Overwhelmingly, SBSE alumni are working in academia, in both tenured/ tenure-track positions and non-tenured roles (adjuncts or full-time instructors). We found that White alumni are more likely to hold non-tenure track positions than Asians and Black alumni. The percentage of SBSE alumni in non-tenured roles can be viewed from a number of different perspectives. On one hand, part-time and adjunct teaching offer less job security and upward mobility than tenured/tenure-track positions. However, some PhDs, such as those embarking on a second career or preferring a part-time position, may view non-tenured positions as offering more flexibility.
In conclusion, both STEM and SBSE students will clearly benefit from early advising about diverse career pathways. There are some statistically significant gender differences and a few differences by race, but, in general, our research demonstrates that Ph.D. students of diverse backgrounds seek a wide array of career pathways. Citizens and non-citizens are equally likely to pursue a variety of career tracks and job functions.
Furthermore, any preconceived notions that graduate schools, graduate program or faculty advisors might hold about who might and might not succeed in the “traditional” tenure/tenure-track academic career based on academic performance metrics should be discarded. Students with higher and lower scores on traditional academic metrics used to evaluate applicants and evaluate student progress to degree show practically no difference in terms of the likelihood that alumni will pursue different types of careers.
For graduate schools, data on the career trajectories of doctorate holders should shape training and advising. For doctoral students and Ph.D. holders, transparency about diverse career pathways can help them to envision and explore career paths that best fit their interests and needs. We hope that attention to these matters will alleviate some of the stress inherent in the pursuit of a Ph.D. and contribute to higher rates of career satisfaction and well-being for doctoral alumni over the course of their careers.
Contributors: N/A
Acknowledgements: The authors wish to thank Drs. Mark Byrd, Christine Chow, Andrew Feig and Song Yan for their assistance in data collection; and Prassanna Viswanathan for data validation and visualization.
Units of Measurement: N/A
Abbreviations & Symbols: N/A
Competing interests: The authors declare that they have no competing interests.
Funding information: This work was supported by the National Institutes of Health; Grant number: DP7 0D01842; URL: nih.gov; and Wayne State University to AM. The funders had no role in study design, data collection and analysis, decision to publish, or preparation of the manuscript.
References
- Evans TM, Bira L, Gastelum JB, Weiss LT, Vanderford NL, et al. (2018) Evidence for a mental health crisis in graduate education. Nat Biotechnol 36: 282–284. [crossref]
- National Science Board Science and Engineering Indicators 2018: Table 3-16 Employed SEH doctorate recipients holding tenured and tenure-track appointments at academic institutions, by field of and years since degree: Selected years, 1993–2015.
- National Science Board (2018) SEH doctorates in the workforce: 1993–2013.
- Tilghman S, Rockey S, Degen S, Forese L, et al. (2012) Biomedical research workforce working group report.
- Alberts B, Kirschner MW, Tilghman S, Varmus H (2014) Rescuing US biomedical research from its systemic flaws. Proc Natl Acad Sci U S A 111: 5773–5777. [crossref]
- Morrison E, Rudd E, Merad M (2011) Early careers of recent US Social Science PhDs. Learning and Teaching 4: 6–29.
- Cyranoski D, Gilbert N, Ledford H, Nayar A, Yahia M (2011) Education: The PhD factory. Nature 472: 276–279. [crossref]
- Roach M, Sauermann H2,3 (2017) The declining interest in an academic career. PLoS One 12: e0184130. [crossref]
- Sauermann H, Roach M (2012) Science PhD career preferences: levels, changes, and advisor encouragement. PLoS One 7: e36307. [crossref]
- Fuhrmann CN, Halme DG, O’Sullivan PS, Lindstaedt B (2011) Improving Graduate Education to Support a Branching Career Pipeline: Recommendations Based on a Survey of Doctoral Students in the Basic Biomedical Sciences. CBE Life Sciences Education 10: 239–249.
- Gibbs KD, Griffin KA (2013) What do I want to be with my PhD? The roles of personal values and structural dynamics in shaping the career interests of recent biomedical science PhD graduates. CBE Life Sciences Education 12: 711–723.
- Council of Graduate Schools, Educational Testing Service. Pathways Through Graduate School and Into Careers.
- Denecke D, Kent J, McCarthy MT (2017) Articulating learning outcomes in doctoral education.
- Mathur A, Cano A, Kohl M, Muthunayake NS, et al. (2018) Visualization of gender, race, citizenship and academic performance in association with career outcomes of 15-year biomedical doctoral alumni at a public research university. PLoS One 13: e0197473.
- Blank R, Daniels RJ, Gilliland G, Gutmann A, Hawgood S, et al. (2017) A new data effort to inform career choices in biomedicine. Science 358: 1388–1389. [crossref]
- Xu H, Gilliam RST, Peddada SD, Buchold GM, et al. (2018) Visualizing detailed postdoctoral employment trends using a new career outcome taxonomy. Nat Biotechnol 36: 197–202.
- Ortega ST, Kent JD. What is a PhD? Reverse-Engineering Our Degree Programs in the Age of Evidence-Based Change. Change: The Magazine of Higher Learning 50: 30–36.
- Feig AL, Robinson L, Yan S, Byrd M, et al. (2016) Using Longitudinal Data on Career Outcomes to Promote Improvements and Diversity in Graduate Education. Change: The Magazine of Higher Learning 48: 42–49.
- Silva EA, Des Jarlais C, Lindstaedt B, Rotman E, et al. (2016) Tracking Career Outcomes for Postdoctoral Scholars: A Call to Action. PLOS Biology 14: e1002458.
- The Stanford University PhD Alumni Employment Project (2018) Stanford University.
- Vanderbilt University School of Medicine. IGP and QCB Admissions and Outcomes Data. University of North Carolina. Alumni Career Outcomes.
- Alumni Career Outcomes (2017) University of North Carolina.
- Mathur A, Brandt P, Chalkley R, Daniel L, et al. (2018) Evolution of a Functional Taxonomy of Career Pathways for Biomedical Trainees. Journal of Clinical and Translational Science 2: 63–65.
- McCarthy MT (2017) Promising practices in humanities PhD professional development: Lessons learned from the 2016–2017 Next Generation Humanities PhD Consortium.
- Mathur A, Chow CS, Feig AL, Kenaga H, et al. (2018) Exposure to multiple career pathways by biomedical doctoral students at a public research university. PLOS ONE 13: e0199720.
- Leshner A, Scherer L editors (2018) Graduate STEM Education for the 21st Century. Washington DC: The National Academies Press
- National Science Board (2018) Science and Engineering Indicators.
- Wayne State University (2018) Scientific Training, Workforce Development and Diversity – Key Initiatives.
Appendix S1: Three Tier Taxonomy
|
Tier 1: Employment Sectors |
Tier 2: Career Types |
Tier 3: Job Functions |
|
Academia |
Primarily Research |
Administration |
|
Government |
Primarily Teaching |
Business Development, Consulting, and Strategic Alliances |
|
For-Profit |
Science-related |
Clinical Research Management |
|
Nonprofit |
Not-related to science |
Clinical Services |
|
Other |
Further training or education |
Data Science, Analytics, and Software Engineering |
|
Entrepreneurship |
||
|
Faculty: non-tenure track |
||
|
Faculty: tenured/tenure track |
||
|
Faculty: track unclear or not applicable |
||
|
Full-time Teaching Staff/Instructor |
||
|
Group Leader (research) |
||
|
Healthcare Provider |
||
|
Intellectual Property and Law |
||
|
Part-time Teaching Staff/Adjunct |
||
|
Postdoctoral Research |
||
|
Regulatory Affairs |
||
|
Research Staff or Technical Director |
||
|
Sales and Marketing |
||
|
Science Education and Outreach |
||
|
Science Policy and Government Affairs |
||
|
Science Writing and Communication |
||
|
Technical Support and Product Development |
||
|
Completing further education or training |
||
|
Other |
||
|
Deceased/retired |
Appendix S2
