Author Archives: author

Screening for Insulin-Like/Mimetic Drugs Using Lower Eukaryotes

DOI: 10.31038/EDMJ.2019323

Abstract

It has generally been assumed that hormones and the corresponding intra- and intercellular signal transduction pathways and mechanisms have evolved exclusively during course of the evolution of vertebrate endocrine organs, implying a rather recent origin. However, there is good experimental evidence for (i) the expression of hormones and hormone-binding proteins resembling those of vertebrates in fungi and yeast, (ii) functional responses of lower eukaryotes to mammalian hormones and (iii) the existence of components of insulin-like and mimetic signaling pathways as well as their coupling to G-protein coupled receptors and metabolic pathways, such as lipolysis and endoplasmic reticulum stress, in lower eukaryotes, in particular in Neurospora crassa and Saccharomyces cerevisiae. Data will be presented that the naturally occurring or recombinant expression of insulin-like/mimetic signaling pathways in lower eukaryotic cells may be useful as model systems for future drug screening and discovery efforts.

Keywords

Diabetes; Drug Screening; Endoplasmic Reticulum Stress; Glucagon-like Peptides; G-protein-coupled Receptors; Insulin; Lipolysis, Saccharomyces cerevisiae

1. Introduction: Models for the discovery of insulin-mimetic and anti-diabetic drugs

The yeast Saccharomyces cerevisiae, as a simple and well-understood eukaryotic model organism, offers direct means to unequivocally assess processes that couple ligand binding to receptor activation, formation of transient intermediates, and downstream signaling to the molecular targets of the activated receptor. For example, events proximal to insulin-binding at the receptor can be traced to distal events to up to the terminal effector systems, such as dephosphorylation of GS or phosphorylation of ribosomal proteins. Furthermore, the interactions between multiple mutations, their suppressors, and ultimately, between the molecular participants, in total, in an insulin-activated response cascade can be readily tested in yeast. The ease of biochemical, cell biological, genetic and molecular biological manipulation has made S. cerevisiae an excellent model for the study of metabolic control in eukaryotic cells. In fact, yeast can be considered as the preferred model eukaryotic organism for the following reasons: I) Many cellular processes are conserved between yeast and higher eukaryotes, including (i) metabolic and energy-generating pathways, (ii) signal transduction pathways, (iii) protein targeting to specific subcellular locations, e.g. secretion, biogenesis of plasma membranes and mitochondria, (iv) peptide maturation, e.g. signal sequence cleavage, prohormone cleavage at Lys-Arg residues, (v) protein modification, e.g. Ser/Thr/Tyr phosphorylation, N- and O-glycosylation, acylation, attachment of GPI anchors, (vi) nuclear processes, e.g. transcription, RNA processing and polyadenylation. II) Many proteins of yeast are very close orthologs to mammalian counterparts, and their functional replacement by the latter has been shown for some yeast components (Table 1), signal transduction components such as protein kinases and phosphatases (Table 2). III) Yeast represents the best understood eukaryotic organism at the genetic level under the control of a compact and simple genome with few introns, repetitive sequences and non-coding elements. IV) Yeast is ideally suited for both classical and molecular genetic manipulation with many powerful tools introduced during the past five decades, including (i) high and low copy number plasmid vectors, (ii) strong and inducible promoters, (iii) high transformation efficiency (> 105/µg of DNA), (iv) gene replacement in one week, (v) identification and cloning of genes acting along a pathway with the methods of functional complementation, genetic suppression, synthetic lethality etc.

Table 1. Structural comparison of some signal transduction proteins/genes between mammals and yeast with regard to %identity of amino acids. As indicated some mammalian genes can restore the function of the disrupted homologous gene in Saccharomyces cerevisiae.

Mammalian Protein

Yeast Gene

% Identity

Functional Replacement
of Yeast Homolog

Cell Division Protein Kinase

CDC28

60

yes

MAP Kinases ERK1, 2

FUS3/KSS1

54

yes

JNK1

HOG1

52

yes

Protein Kinase Cγ

PKC1

50

no

Osmotic Stress Kinase p38

HOG1

52

yes

ser/thr Phosphatase PP1

PP1

81

no

p21Ras

RAS1/RAS2

50–85

yes

GTP-binding Protein Gp

CDC42

80

yes

Gsα

GPA1

40–50

yes

G1 Cyclins

CLN1, 2, 3

yes

Phospholipase Cγ2

PLC1

27–53

no

Transcription factor Egr1/2

Msn4

yes

Triglyceride Lipase ATGL

Tgl4

yes

Table 2. Some selected yeast homologs of mammalian protein kinases and phosphatases with established function in signal transduction.

Protein Kinase or Phosphatase

Yeast Homolog

AMP-Activated Protein Kinase (AMPK)

SNF1

Calcineurin B (catalytic subunit, Ca2+-dependent serine/threonine phosphatase)

CNA1, CNA2 (CMP1, CMP2)

Calcineurin B (regulatory subunit, Ca2+-dependent serine/threonine phosphatase)

CNB

Calmodulin Kinase II

CMK1, CMK2

cAMP-Dependent Protein Kinase (catalytic subunit)

TPK1 (SRA3), TPK2, TPK3

cAMP-Dependent Protein Kinase (regulatory subunit)

BCY1 (SRA1)

Cell Cycle Kinase (p34CDC2)

CDC28

Cell Division Kinase (CDK3)

CDC28

Cyclin Dependent Kinase (CDK2)

CDC28

Cytosolic Tyrosine Phosphatase (MEG2)

SEC14

Glycogen Synthase Kinase 3

MDS1

Lipopolysaccharide-activated Kinase (JNK1, c-jun amino-terminal protein kinase)

HOG1

MAP Kinase Kinase (MKK or MEK)

STE7, MKK1, MKK2, PBS2

MAP Kinase Kinase Kinase

BCK1, STE11

MAP Kinases (ERK1, ERK2)

FUS3, KSS1, MPK1 (SLT2),

p65PAK Serine/Threonine Kinase (binds Rac and CDC42)

STE20

Protein Kinase C Inhibitor

BMH1

Protein Kinase Cb1

PKC1

Serine/Threonine Phosphatase (PP2C)

PTC1

Serine/Threonine Phosphatase 2A (B-subunit)

CDC55

Tyrosine Phosphatase

PTP1, PTP2

Casein Kinase 1

HRR25, CKI1, CKI2, CKI3

Glycogen Synthesis Kinase 3β

RIM11

2. G-Protein Coupled Receptors as Targets

G-protein-coupled receptors (GPCRs) as transmembrane proteins represent components of intracellular signaling cascades which transduce information from the cell surface into the cell interior in course of agonist binding and the resulting activation of heterotrimeric G-proteins. GPCRs together with their corresponding elements of downstream signaling have been found to operate in all eukaryotes from yeast to mammals [1] and to share pronounced sequence similarities between yeast and mammals (Table 3). It has recently been recognized that in mammalian cells a complex interplay and mutual cross-talk exists between the insulin signaling cascade and the signaling pathways directed by GPCRs. It depends on the type of GPCR whether insulin action is modulated in a positive or negative fashion and thus insulin sensitivity becomes increased or diminished (i.e. insulin sensitizing or desensitizing) [2–8]. The basis of the successful screening for anti-diabetic drugs is formed by modeling of the activation of the G-protein-coupled class of human receptors in yeast. The successful coupling of human receptor activation to the mating pathway of yeast has been demonstrated [9–11] which should thereby enable the screening for both agonists and antagonists, depending on the needs. The putative targets encompass known members of the GPCR class which are assumed to be involved in the pathogenesis of T2D, among them the glucagon receptor, glucagon-like-peptide 1 receptor (GLP-1) and a variety of α- and β-adrenergic receptor subtypes, such as muscarinic acetylcholine receptors and various receptors of the brain and nervous system. Significant applications to many other therapeutic areas can be expected where GPCR members play a role.

Table 3. Some selected yeast homologs of mammalian cAMP and G-protein signaling components, acylation factors, and lipid kinases with established function in signal transduction.

Signal Transduction Component

Yeast Homolog

Adenylyl Cyclase-associated Protein (CAP)

CAP

C-Farnesyl-Cysteine Methyltransferase

STE14

Calnexin, Calreticulin

CNE1

cAMP-specific Phosphodiesterase (type 3)

PDE1, PDE2 (SRA5)

Farnesyltransferase, CAAX-specific, Peptide-binding Subunit

DPR1 (RAM1)

GDP-GTP Exchange Factor

BUD5, SCD25

GDP-GTP Exchange Factor (m-SOS, Ras-specific)

CDC25

GDP-GTP Exchange Factor (Rab-specific)

DSS4

Geranylgeranyl Transferase (Rab-specific) α-subunit

MAD2

Geranylgeranyl Transferase (Rab-specific) β–subunit

BET2

GTP-Binding Protein (p21Ras)

RAS1, RAS2

GTP-Binding Protein (Gas)

CDC70 (SCG1, GPA1, DAC1)

GTP-Binding Protein (Gb1, Gb2)

STE4

GTP-Binding Protein (Ggt)

STE18

GTP-Binding Protein, 70% identical to Rac (Gp)

CDC42

GTP-Binding Protein, Ras-related (Rab1)

YPT1

GTP-Binding Protein, Ras-related (Rab3)

SEC4, YPT1

GTP-Binding Protein, Ras-related (Rab7)

YPT7

GTP-Binding Protein, Ras-related (Rho)

Bud1 (RSR1), RHO1, RHO2, RCN1

GTPase Activating Protein (Rab6-specific)

GYP6

GTPase Activating Protein NF1 (Neurofibromatosis 1)

IRA1, IRA2

Phosphatidylinositol 3-Kinase

DRR1, TOR3, VPS34

PI-specific Phospholipase C

PLC1

Ras-associated GTPase Activating Protein

CLA2, (BUD2, ERC25)

Vav (hematopoietic-specific GDP-GTP exchange factor)

CDC24

The experimental procedure involves (i) targeted mutagenesis of the endogenous GPCR and Gα genes, (ii) covalent linkage of the human GPCR to yeast Gα by gene fusion to overcome the lack of recognition specificity between the human GPCR and the yeast Gα, and (iii) mutagenesis of the Gα domain and selection for functional coupling to ensure efficient interaction (Figure 1). The functional assays designed to enable convenient measurements and clear-cut read-outs are typically, but not exclusively, based on (i) growth arrest and morphological change to “shmoos”, (ii) auxotrophic selection, i.e. activation of the GPCR leads to expression of an essential gene which will support growth in minimal medium, (iii) color development, i.e. activation of the GPCR leads to expression of β-galactosidase, (iv) fluorescence, i.e. activation of the GPCR leads to expression of A. victoria green fluorescent protein (Figure 2).

EDMJ 2019-106 - Günter A. Müller USA_F1

Figure 1. Two different modes of activation of heterotrimeric G-proteins by receptors are feasible in yeast cells. In the unlinked physiological mode of interaction between receptor and G-protein, the activation depends on the affinity between both partners (left section). A possible “mismatch” between a mammalian receptor expressed in yeast and the endogenous G-protein may be overruled by covalent linkage to Gα to the receptor. Nevertheless, the engineered covalent hybrid receptor-G-protein signaling complex in yeast is responsive towards activation/dissociation of the endogenous Gβ/Gγ-subunits by ligand binding to the mammalian receptor “subdomain” (right section).

EDMJ 2019-106 - Günter A. Müller USA_F2

Figure 2. Engineering yeast for drug discovery requiries functional reconstitution of transmembrane signaling (1) which can be coupled to a signaling pathway regulating growth (2) or transcription of a reporter gene (e.g. ß-galactosidase) enabling a simple color assay (3).

EDMJ 2019-106 - Günter A. Müller USA_F3

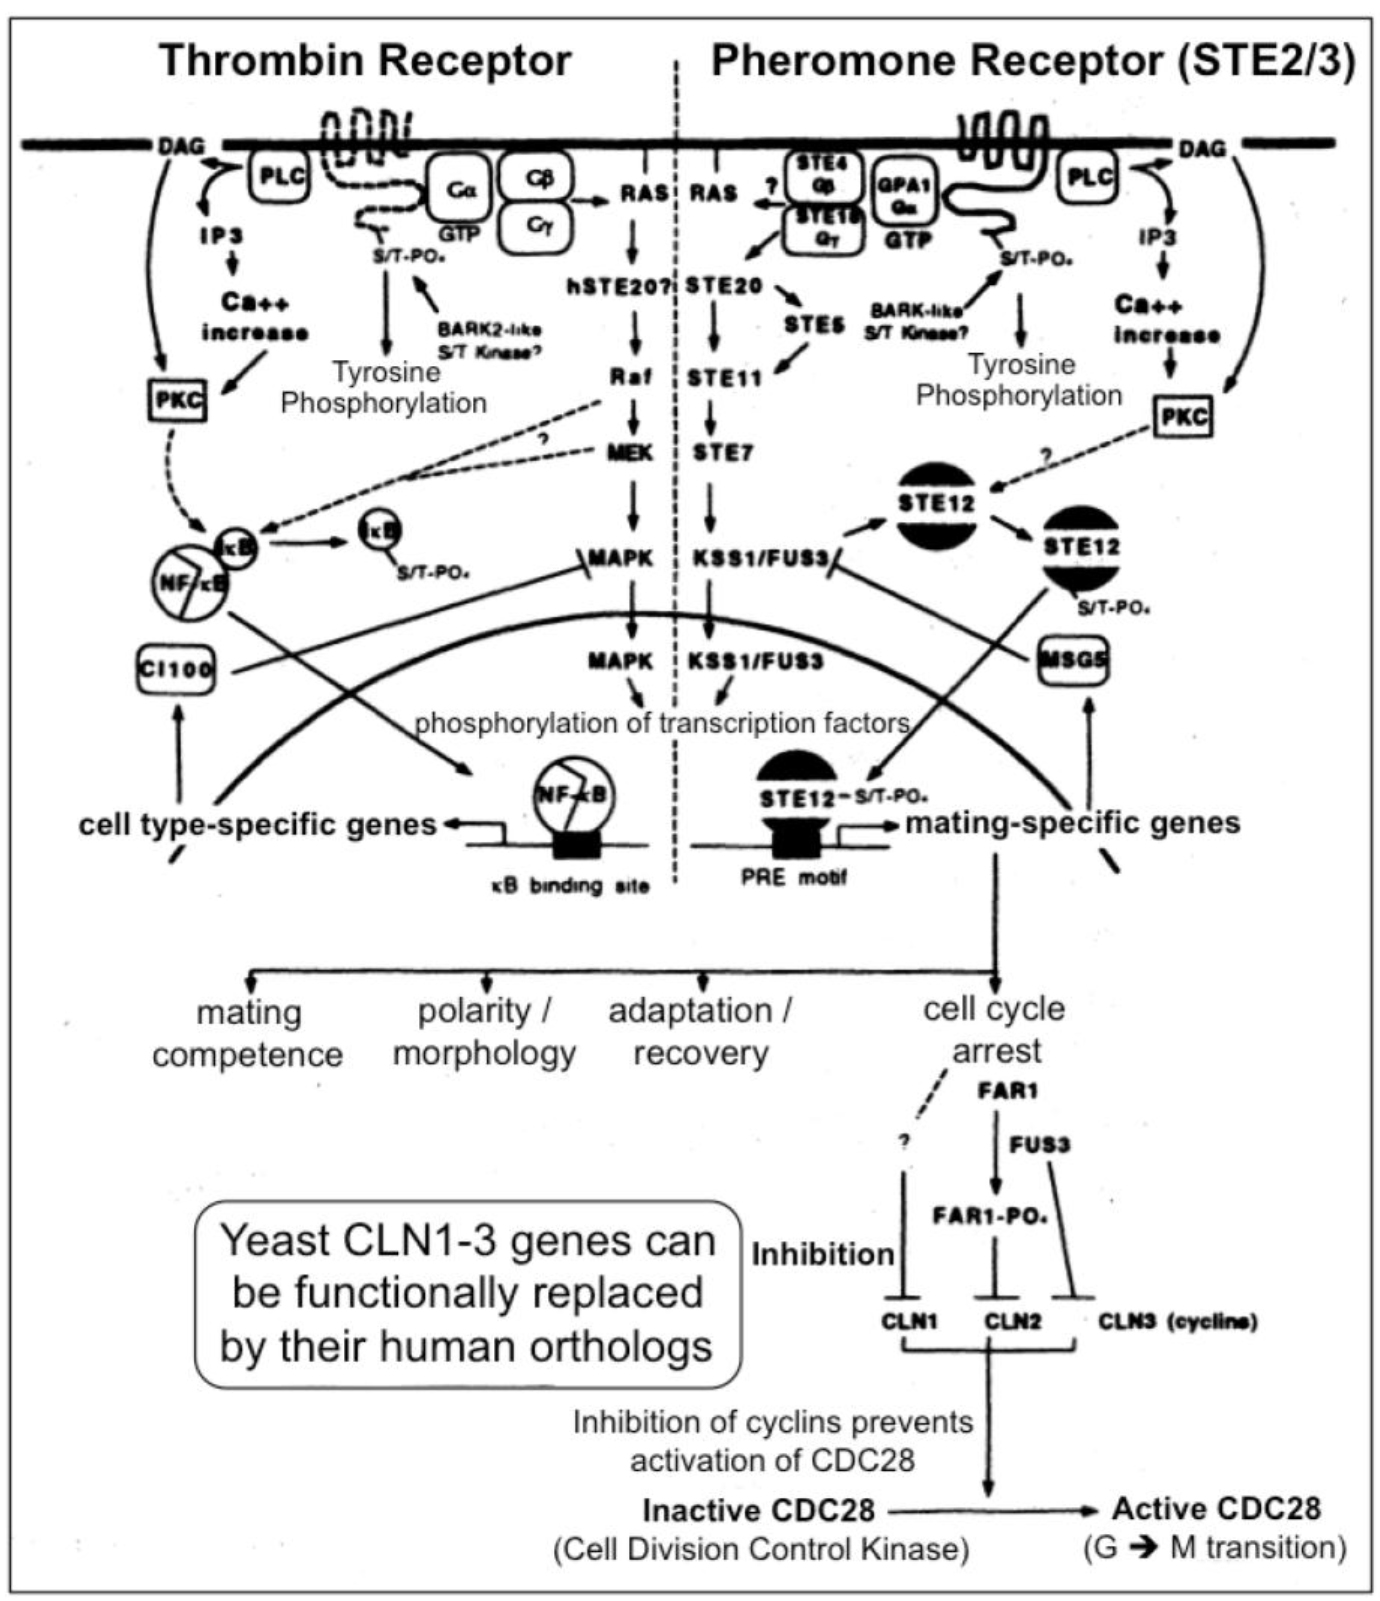
Figure 3. A multitude of orthologous components is engaged in signaling via heterotrimeric G-proteins in yeast (right section) and mammals (left section)

2.1. General Strategy

In yeast the heptahelical GPCR, Ste2, is engaged in intracellular signal transduction initiated by the α-factor pheromone (Figure 3) [12, 13]. Compatible with the evolutionarily conserved signaling function of Ste2, its expression in human HEK293 cells led to stimulation of the MAPK Erk1/2 upon incubation with α-factor [14]. Stimulation of Ste2 in yeast led to its endocytosis, ubiquitination and finally degradation, whereas in HEK293 cells, the α-factor-induced internalization of Ste2 was not accompanied by significant downregulation of the cellular amount of Ste2. The lack of expression of typical receptor tyrosine kinases, such as the insulin receptor and IGF-1 receptor, in yeast makes Ste2 a perfect target for the identification of the protein motifs which enable the regulation of GPCRs through mammalian tyrosine kinases and vice versa for the impact of GPCR expression and activation on receptor tyrosine kinase signaling, such as desensitization of the insulin receptor as the molecular mechanism for insulin resistance and T2D. For instance, in the basal state a Ste2-GFP fusion protein becomes targeted to the plasma membranes, but does not undergo endocytosis upon challenge of the yeast cells with insulin, as is typical for the GPCR ß2-adrenergic receptor in course of agonist binding [14]. The failure of insulin to control the intracellular trafficking of Ste2 enabled the construction of a model system consisting of yeast Ste2 and mammalian cells for studying the protein motifs which are responsible for the “linear” or “single-hit” GPCR receptor biology (i.e. agonist binding > receptor activation > endocytosis > ubiquitination > proteasomal degradation) induced by typical GPCR ligands, such as ß-adrenergic agonists. In higher eukaryotic cells, such as insulin target cells (liver, muscle, adipose), the resensitization and recycling of endocytosed GPCRs is typical, which raises the question about the molecular mechanisms controlling the recycling efficacy and thereby the periods of cell-surface retention. Yeast GPCRs are known to operate independent of cross-talk from/to receptor tyrosine kinases, which could influence the cell surface expression of GPCRs in mammalian cells. However, in yeast the endocytosis of GPCRs is not coupled to their rapid degradation or recycling back to the cell surface. The molecular mode of the control of GPCR trafficking by receptor tyrosine kinases, such as the insulin receptor, turned out to encompass the direct tyrosine phosphorylation of the GPCR as well as the serine/threonine phosphorylation by downstream protein kinases, such as PKB/Akt. Thus the identification of the complete panel of amino acid motifs, phosphorylation sites and downstream binding events with adaptor proteins, such as Grb2, can be achieved by the recombinant introduction of selected regions of the mammalian GPCR of interest into yeast Ste2 and subsequent assaying for the fate of this chimeric receptor in response to the corresponding agonist in animal cells. Thereby it was previously shown that the downregulation by degradation of a chimeric yeast Ste2 upon challenge with insulin is conferred by substitution of the endogenous cytoplasmic domain of Ste2 with that of the ß2-adrenergic receptor [14]. This model system will enable the screening for protein kinases, protein phosphatases and adaptor molecules which are engaged and required in the recycling/resensitization of a mammalian GPCR, such as ß2-adrenergic receptor, under the control of a mammalian tyrosine kinase, such as the insulin receptor, and vice versa, of a tyrosine kinase under the control of a GPCR. Thus, the investigation of such endocytosed Ste2 chimera may be useful for the elucidation of novel drug targets as well as insulin-mimetic and insulin-sensitizing agents for the therapy of diabetes.

2.2. GLP-1 Receptor as Target

The finding that a more pronounced insulin secretion results from the administration of glucose via the oral compared to the intraveneous route prompted the postulation of the action of so-called incretins [15]. GLP-1 is a members of the incretins which is secreted by intestinal cells in response to nutrient ingestion. GLP-1 contributes to the regulation of blood glucose predominantly via the induction of insulin release from pancreatic ß-cells [16]. GLP-1 triggers this insulin-releasing effect by binding to and activation of a typical GPCR, the GLP-1 receptor [17]. Thereby, the GLP-1 receptor plays an important role in glucose-dependent insulin release and has gained major interest as a target for the identification of novel (insulin-releasing) drugs for the therapy of T2D [18]. Interestingly, T2D is not only characterized by reduced insulin sensitivity and capacity of insulin secretion, but by decreased serum concentrations of GLP-1, in addition [19]. Strikingly, the intravenous injection of GLP-1 peptide causes potent upregulation of glucose-dependent insulin secretion and counteracts hyperglycemia in T2D patients [20]. Unfortunately, the plasma half-life of GLP-1 (7–36 amide) as the active version of GLP-1 is very short due to rapid cleavage to the inactive version GLP-1 (9–36 amide) by the serine protease dipeptidyl peptidase IV [21]. To overcome this limitation and to improve plasma half-life, a number of DPP-IV-resistant peptidic GLP-1 analogues, such as exenatide and liraglutide (Table 4), were developed which meanwhile have been introduced into the therapy of T2D [22].

In fact, these GLP-1 mimetics turned out to have important advantages in the control of T2D, such as rapid weight loss and low risk for hypoglycemic episodes, but their chronic application has been implicated with elevated risk of cancer and pancreatitis [23]. Unexpectedly, different GLP-1 mimetics sharing pronounced sequence homology exhibit considerable differences in their clinical profile [24]. This heterogeneity may be explained by the engagement of multiple isoforms of the GLP-1 receptor or, alternatively, the differential activation of the GLP-1 receptor with regard to its ability to coupling to and activate distinct G-proteins and thereby to induce distinct downsteam signaling pathways. Thus, much remains to be learnt about the biology of the GLP-1 receptor, in particular the (different) mode(s) of interaction of ligands and the resulting differential consequence(s) for the downstream responses. This inadequate and incomplete understanding of the molecular mechanisms of GLP-1 action in combination with the concerns regarding the safety of GLP-1 mimetics led to their categorization as “tier 2” of the consensus algorithm for initiation and adjustment therapy for the American Diabetes Association and European Association for the Study of Diabetes. Under this category the “less well-validated” treatments are encompassed and recommened as the last-line treatment of patients. This judgement can only be revised on the basis of a better knowledge of the differential activation and downstream signaling of the GLP-1 receptor in course of ligand binding. Corrresponding studies should facilitate the development of GLP-1 mimetic drugs with improved efficacy and safety.

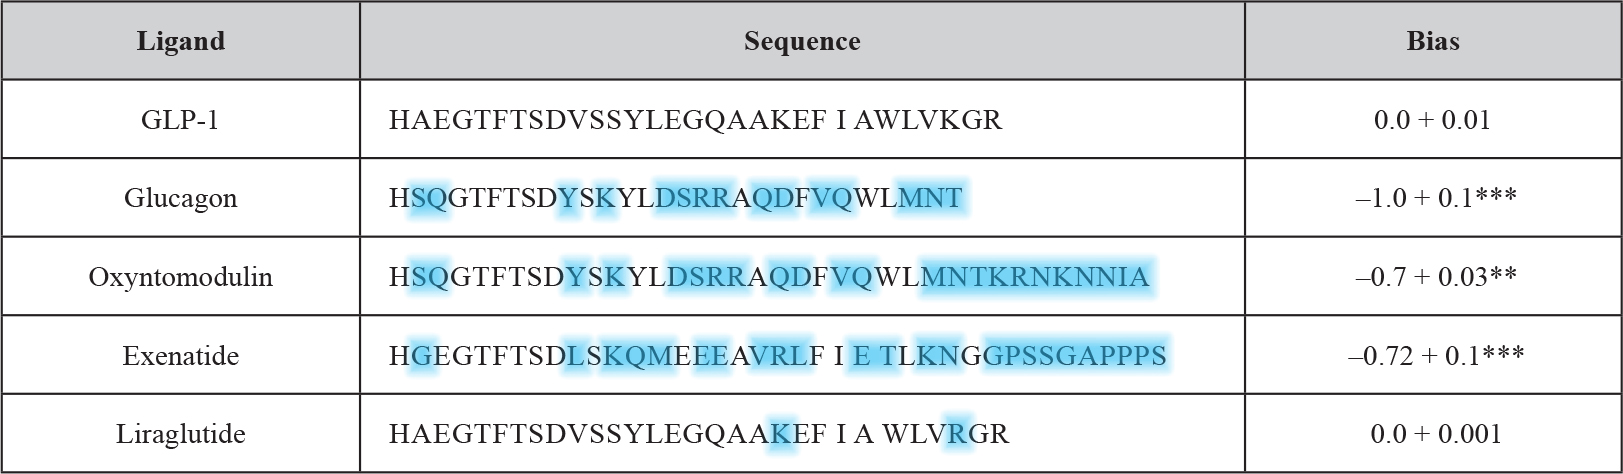
The conventional assays used so far for studying GLP-1 receptor signaling are affected by other signaling pathways which manage to cross-talk to the receptor. Recently a robust and simple yeast-based assay system has been introduced which enables the monitoring of single GPCR-G-protein couplings with the aim to decipher the impact of a defined G-protein subunit on GLP-1 receptor downstream signaling [26]. Previously established test systems for the measurement of the dissociation constants of agonists and antagonists as well as relative binding efficacy of agonists have demonstrated the robustness of signaling assays using Saccharomyces cerevisiae cells [27]. Even more importantly, since the GPCR-G-protein interaction is defined in unequivocal fashion, the putative bias of a given (expressed) GPCR or G-protein for the interaction with a certain G-protein or GPCR, respectively, and corresponding consequences for downstream signaling can be elucidated rather conveniently without confounding effects potentially caused by other GPCRs and competing G-proteins. Subsequently, this yeast signaling assay has been adapted to establish the G-protein bias profiles for a number of GLP-1 mimetics (Table 4) [28].

EDMJ 2019-106 - Günter A. Müller USA_F5

Table 4. Comparison of GLP-1 receptor peptide ligands and relative bias factors (adapted from and modified according to Weston 2014). The sequences of the various peptide ligands for the GLP-1 receptor are aligned to the natural agonist (GLP-1). Deviations in amino acid sequence from GLP-1 of the other GPCR ligands are highlighted in blue. The relative (to GLP-1) bias factor was quantitatively evaluated for each ligand as the change in log(τ/KA) ratio where a negative value indicates preference for the inhibitory Gαi chimera. Statistical significance was determined using one-way ANOVA with Bonferroni’s post-test with each data set compared with GLP-1 (**P < 0.01, ***P < 0.001). Data are mean of 5–8 independent experiments + SEM.

The use of yeast compared to other (e.g. mammalian) test systems has the benefit of providing a relatively zero background for G-protein activation which allows the identification of activation profiles at the individual level. This is of particular importance for the GLP-1 receptor since it is known that this receptor like other GPCRs is known to couple to a multitude of different G-proteins. The predominant one is the Gαs subunit which upon activation signals for the stimulation of cAMP generation. A minor one is the pertussis toxin-sensitive inhibitory Gαi [29, 30], the functional outcome of this coupling however remains to be characterized in greater detail [31]. In fact, the productive coupling of GLP-1 to Gαi was confirmed [28] with the use of the yeast chimeric Gα system [26, 32, 33]. GLP-1 as the natural peptide ligand elicited the concentration-dependent induction of the GPA1/Gα1 chimera with significantly diminished potency (EC50) and efficacy (log τ) in comparison to signaling through GPA1/Gαs. Interestingly, antagonism of the signaling event was left unaltered. These findings can be interpreted with the G-protein subunit expressed being irrelevant for the antagonist affinity and the measured alterations in agonist affinity being due to the preference for a certain G-protein, but independent of the use of the yeast assay system. Significant differences between the two systems were not measured with regard to the dissociation constant for the receptor antagonist, exendin-3. In contrast, for the therapeutically relevant GLP-1 ligands, liraglutide and exenatide, considerable but previously unrecognized differences in G-protein signaling were detected with exenatide exhibiting a pronounced bias for the Gαi pathway. Subsequently, this approach was extended to the investigation of small-molecule allosteric compounds and the closely related GPCR glucagon receptor. In conclusion, the yeast GPCR assay system allows the reliable and system-independent measurement of the pharmacological properties of putative GPCR-based drugs. The glucagon receptor as well as the GLP-1 receptor belong to the secretin (family B, class 2) GPCR family with 15 members. The peptidic ligands for those receptors typically consist of 27 to 84 amino acids.

2.3. The Use of Permeable Yeast Cells

For decades the investigation of GPCRs in yeast was not favored by the researchers since the yeast cell wall was thought to prevent their naturally occurring peptidic ligands from reaching the (periplasmic face of the outer) plasma membranes, where the ligand binding domain of the (ectopically) expressed GPCRs will be located. However, recently the ectopic expression of two corticotropin-releasing factor receptor subtypes [34, 35] as well as the functional co-expression of the calcitonin receptor-like receptor together with a variety of distinct receptor activity-modifying proteins (RAMPs) [36] has been demonstrated. In apparent conflict with the above assumption of the non-permeation of GPCR ligands across the yeast cell wall, in those cases as is true for the glucagon receptor and the GLP-1 receptor, the yeast-based assay system succeeded in the accurate reproduction of the in vitro pharmacology (e.g. relative binding affinities, G-protein coupling), albeit with absolute binding affinities typically below those measured in corresponding mammalian test systems. Nevertheless or to overcome the latter limitation permeable yeast cells have been developed.

Microbial cells have evolved an impermeable cell wall and plasma membranes that allow them to survive in the environment. Therefore the drug target may not easily accessible to compounds in high-throughput screens that use microbial cells, which in consequence are likely to miss those compounds being unable to penetrate across the cell wall and plasma membrane barriers. In addition, many microbes have very effective efflux systems that pump out compounds. These efflux systems are similar to the multidrug resistance (MDR) transporters found in tumor cells. One of the large classes of efflux systems, or transporter, is called the ATP-binding cassette transporters or ABC transporters. The ABC transporters are conserved fom bacteria to man [37]. With such drawbacks, can microbial- and yeast-based screening be effectively used for drug discovery? Genetic and molecular technology has made it possible to remove some of these barriers and make screen development and screening in unicellular lower eukaryotes a viable, inexpensive, and productive alternative to other screening systems. Among lower eukaryotes, Saccharomyces cerevisiae have been the most popular because of the genetic manipulations feasible with this organism. Since it is an eukaryote, it is often considered to be a more realistic system for screening for mammalian drug targets as compared to prokaryotes, such as E. coli. However, yeast is slower to grow than E. coli, taking 48 h to grow to adequate cell densities, while E. coli can be used within 6 to 8 h of growth. The genetic manipulations in E. coli are considerably less difficult than with yeast and E. coli are more permeable than yeast.

In fact, wild-type Saccharomyces cerevisiae is quite impermeable owing to their cell wall and plasma membranes. The cell wall is considered to be latticelike and allows most small molecules to permeate through. However, the plasma membranes are considered to be quite impermeable. Strikingly, previously it has been noted that yeast cells are actually permeable and the lack of drug effect is the result of the activity of multiple efflux systems, belonging to the family of ATP-binding cassette transporters (MDR), called PDR, that rapidly pump out compounds. The transcription factors, pdr1p and pdr3p, down-regulate the expression of hexose transporters, HXT11 and HXT9, which in turn up-regulate the expression of PDR (Figure 4). Thus deleting the hexose transporters, HXT11 or HXT9, confers pleiotropic drug resistance on yeast while overexpression of these transporters results in increased sensitivity to drugs. Furthermore, deletion of the regulators of the promoter for the ATP-binding transporters, PDR1 and PDR3, in HXT11 and HXT9 over-expressing strains, results in supersensitive yeast [38]. These mutant strains are ideal organisms for use as host strains for the development of screens. Improved cell permeability was also reported for the yeast strains with deletion of the YOR1 gene, which encodes another ATP-binding cassette transport  protein [39]. In addition to transporter mutants, mutants in the ergosterol pathway, such as in ERG6, are also more permeable to small molecules used in screening compared to wild-type strains [40]. However, the mutants in the ergosterol pathway have the disadvantage that their growth is negatively affected, and they are difficult to transform.

EDMJ 2019-106 - Günter A. Müller USA_F4

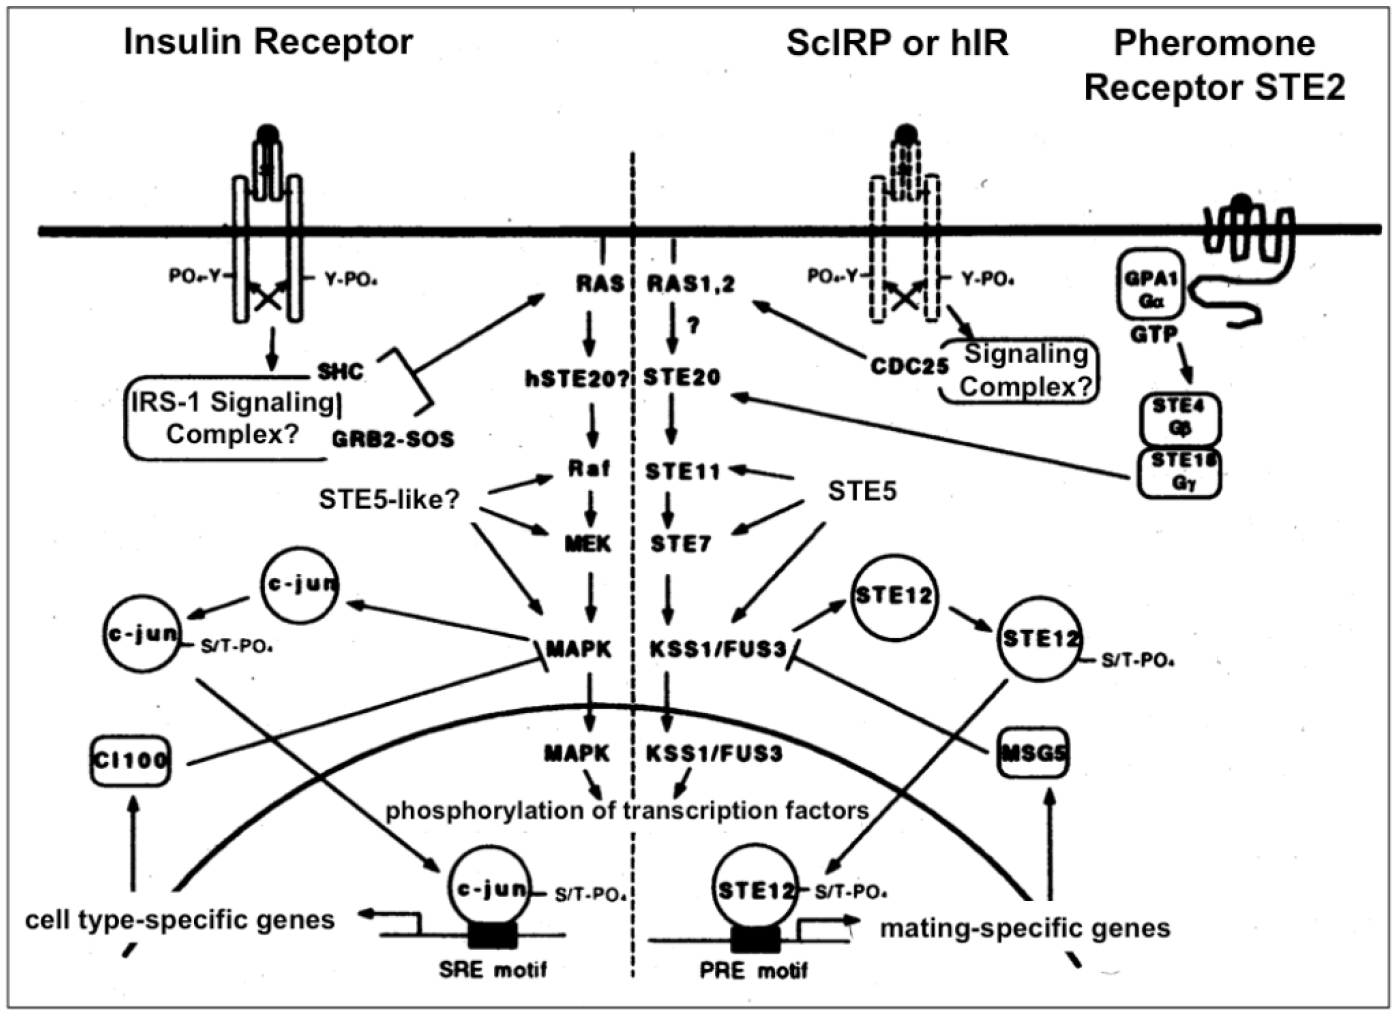
Figure 4. Insulin signal transduction may regulate the MAPK cascade in yeast (right section). Insulin signaling in insulin-responsive mammalian cells via the homologous Ras-MAPK pathway is shown for comparison (left section). In yeast coupling of the endogenous (ScIRP) or heterologously expressed human (hIR) insulin receptor to the MAPK pathway could occur via the heterotrimeric G-protein, GPA1/STE4/STE18 to STE20 (which is also used by the pheromone receptor during the mating response) or via CDC25 to Ras1/2, respectively, which may be analogous to mammalian cells where the insulin receptor transduces its signal to Ras via the GDP-GTP exchange factor SOS.

It would be useful and feasible to extend this technology for the inclusion of many GPCRs or other components, which putatively interact with the receptor in situ (e.g. regulatory proteins of G-protein signaling, RAMPs), in order to recognize any (positive or negative) effect of an interaction built up on the receptor pharmacology and the resulting (patho)physiological changes. Moreover, the relative simplicity and convenience of the ectopic expression of GPCRs in yeast would be compatible with the introduction of patient-specific mutations into GPCRs with the aim to study and to quantitatively analyze their impact on the ligand-induced signaling capability of the receptor and possibly to efficiently screen for ligand mimetics, which bypass the defect. Thereby, the yeast-based assay system could contribute to the development of personalized drugs.

3. Insulin Receptor and Signaling as Target

This approach originated during an attempt to study the molecular basis for tyrosine kinase-linked signal transduction in a cell system in which there is no detectable endogenous receptor tyrosine kinase-coupled regulatory processes, namely, the fission yeast Schizosaccharomyces pombe. Expression of selected mammalian signaling elements in such a naive system might support productive interactions between heterologous components while eliminating involvement and cross-talk with host cell tyrosine kinase-associated control systems. S. pombe has been used by others to study the function and interactions of selected mammalian signaling elements, including PKC isoforms, Src, Csk, Raf-1, Ras, PI-3’K and MAPKK. Furthermore, high level expression of the platelet-derived growth factor receptor and its substrate phospholipase Cγ (PLCγ) in S. pombe led to autophosphoryation and substrate phosphorylation at tyrosine residues. Therefore, appropriate cleavage and oligomerization of the expressed human receptor seem to be possible. Potential assays may rely on (i) modulation of growth, (ii) insulin binding, (iii) autophosphorylation of the receptor at tyrosine residues, (iv) tyrosine phosphorylation of heterogenously expressed authentic or engineered substrates, such as IRS-1 and PI3K as well as fusion proteins or fragments derived thereof, or artificial substrates, e.g. EEEY and (v) phosphorylation of yeast substrates (Figure 4). These experimental designs should demonstrate, that heterologous expression of selected signaling elements in yeast will permit the detection and analysis of functional insulin receptor activation and pave the way for further systematic and detailed molecular dissection of a wide range of interactions, central to insulin receptor kinase-coupled signal transduction processes as well as for the identification of peptidic or small peptidomimetic molecules, which manage to strengthen or disrupt those interactions.

Alternatively, the assays for human receptor activation may be based on signal transduction pathways activated by receptor tyrosine kinase activity: I. The soluble domain of the human insulin receptor can be stably expressed at the plasma membranes of Saccharomyces cerevisiae [42]. II.Tyrosine phosphorylation of some yeast proteins is increased upon incubation of intact cells or spheroblasts with human insulin [43]. This raises the possibility that the tyrosine kinase activity of the human insulin receptor may initiate signal transduction cascades leading to phosphorylation of endogenous substrates, and their human orthologs expressed in yeast. This will require (i) cloning of the yeast signaling proteins that respond to the human insulin and insulin-dependent (tyrosine/serine/threonine) phosphorylation, (ii) identification and (iii) expression of their human orthologs. III. Low levels of expression of the insulin receptor kinase domain may lead to a very modest but reproducible slowing of growth, high expression may result in stronger inhibition as has been reported previously for overexpression of the constitutively active human insulin receptor in cultured CHO cells [44]. In general, clear-cut effects of activated yeast or human receptors on downstream signaling proteins of yeast or human origin represent potential parameters of measurement for a yeast-based screening assay. Taken together, yeast and other lower eukaryotic unicellular organisms have already proven their usefulness in various aspects of pharmaceutical development and, no doubt, their impact will further increase during the next years.

4. Endoplasmic Reticulum Stress and Pancreatic ß-Cell Dysfunction as Target

Failure of insulin secretion caused by reduction in the number and functionality of pancreatic ß-cells has been considered as the hallmark of T2D for decades [45, 46]. The majority of T2D patients is characterized by overweight or obesity which in general is correlated to elevated levels of plasma free fatty acid (FFA) levels [47, 48]. Albeit being still a matter of intense debate, this hyperlipidemic state could be (causally) involved in the loss of functional ß-cells through a pathophysiological process called lipotoxicity [49]. Importantly, the operation of lipotoxic processes under conditions of overfeeding and excessive calorie uptake, as often prevalent during obesity and T2D, has also been reported for a number of non-ß-cells, such as adipocytes, myocytes, hepatocytes and brain cells, and linked to their desensitization towards insulin challenge [50–53]. The molecular mechanisms underlying the FFA-induced lipotoxicity have been investigated in vitro during the past two decades in course of direct incubation of cultured ß-cells, pancreatic islets or insulin target cells and, more recently, of yeast cells (Saccharomyces cerevisiae) [54–56]. Strikingly, despite the tremendous differences between these cell types considering their morphology, structure and physiology, they apparently display pronounced similarity with regard to their susceptibility and viability towards FFA (Table 5). This argues for conservation, at least in part, of lipotoxic mechanisms along the evolution of eukaryotes from yeast to humans. Importantly, in ß-cells, insulin target cells and yeast cells the extent of the lipotoxic effects provoked by the FFA critically depends on the number of their carbon atoms and the degree of their saturation. The data available so far are consistent with saturated (SFA) and long-chain FFA (e.g. palmitate C16:0, stearate C18:0) exerting the most adverse effects, whereas saturated and short(er)-chain ones (e.g. myristate C14:0 and below) as well as long-chain unsaturated fatty acids (UFA) equipped with one to several double bonds (e.g. palmitoleate C16:1, oleate C18:1, linoleate C18:2 and linolenate C18:3) exhibiting considerably lower harmfulness [57–59]. In addition, the concentration-dependent abrogation of the SFA-triggered lipotoxic effects, in general, and of cell death, in particular, by excess of UFA has meanwhile been amply documented [60, 61].

Most importantly, in both ß-cells and yeast cells the SFA-triggered lipotoxicity leads to the initiation of the so-called stress response in the endoplasmic reticulum (ER) or unfolded protein response (UPR)(Table 5). The ER represents the site for a number of essential physiological processes, such as Ca2+-homeostasis, (phospho)lipid biosynthesis and biogenesis of proteins, which have to be transported to intracellular organelles and the plasma membranes or secreted into the extracellular milieu. Prior to guidance into the secretory pathway the membrane and secretory protein precursors have to be correctly folded and assembled in the ER. Any imbalance between the folding capacity of the ER and its passenger protein load will ultimately cause ER stress [62]. ER stress has to be counterbalanced by the multiple strategies of the UPR, such as proteolytic degradation [63] to preserve or re-gain the structural and functional integrity of the ER despite the accumulation of misfolded polypeptides [64, 65]. It is believed that the SFA-triggered cell death is mediated through ER stress and the failure to cope with it in the presence of high concentrations of SFA, which finally will result in apoptosis.

Table 5. The effects of exposure of yeast- and ß-cells towards palmitate in comparison.

UPR pathway

Apoptosis/

Growth arrest

Misfolded proteins

Depleted ER

Ca2+ stores

Altered ER morphology

Ire1

PERK

ATF6

ß-cells

+

+

+ (?)

+

+

+

+

yeast

+

None

None

+

+

not tested

+

In higher eukaryotes, a critical pathway engaged by the UPR, which senses for unfolded membrane protein precursors, is constituted by the inositol-requiring enzyme 1 (IRE1) cascade [65], which in ß-cells seems to be upregulated in response to long-chain SFA, such as palmitate. The IRE1 cascade constitutes the only UPR pathway which is conserved from yeast to humans. In Saccharomyces cerevisiae the accumulation of misfolded proteins triggers dimer formation of Ire1p which results in upregulation of its endogenous endoribonuclease activity. In non-stressed yeast and ß-cells the ER-resident protein of the HSP70 family, Kar1p and BiP, respectively, binds to Ire1(p) for suppression of its activation. In stressed cells harboring excess of misfolded proteins in the ER Kar1p / BiP manages to dissociate from Ire1(p) and thereby enables Ire1(p) dimerization which finally leads to its autophosphorylation and activation [64]. The Ire1p endoribonuclease activity is directed against the mRNA of the transcription factor Hac1p which interacts with the promoter of UPR elements (UPREs) and controls the expression of about 5% of the genes in yeast (and is the yeast ortholog of mammalian XBP1). Importantly, in yeast upregulation of the Ire1p cascade in the presence of high concentrations of SFA was observed using a reporter gene (LACZ) assay which monitored the transcription activity of four UPREs, i.e. the amounts of active Hac1p/XBP1, as reflected in the measured ß-galactosidase activity [66]. High intracellular concentrations of SFA in yeast as well as in ß-cells, which may result either from blockade of endogenous fatty acid desaturation or from the presence of palmitate in the incubation medium, have been reported to provoke full induction of the Ire1(p) cascade. Consistent with the beneficial effects of UFA, Ire1(p) activation was diminished in concentration-dependent fashion in the presence of oleate [67].

5. Adipocyte Lipolysis as Target

The concentration of FFA in the blood of mammals which are tightly linked to their metabolic disease state, such as T2D in case of chronically elevated levels, critically depends on the efficacy of lipolysis in the various adipose tissue depots [68]. Insulin with its primarily anabolic function in the body manages to restrict lipolysis and to foster the incorporation of FFA, which are ultimately derived from the ingested nutrient lipids, into neutral triacylglycerol, which becomes stored in adipocytes, during the postprandial state. Missing suppression of adipocyte lipolysis by insulin has been considered since decades as the major physiological defect which is causative for metabolic diseases, such as T2D and obesity, through the induction of insulin resistance in peripheral tissues and dysfunction and death of ß-cells through the operation of lipotoxic mechanisms (see above) [69–71].

Triacylglycerol is lipolytically degraded to FFA and glycerol through the joint action of tri-, di- and monoacylglycerol lipases [72–75] with the most recently unraveled Adipose Triglyceride Lipase (ATGL) [76–78] exerting the major portion of the triacylglycerol hydrolase activity in adipose, muscle and liver tissues and representing the rate-limiting enzyme for lipolysis. This is manifested in the observation that up- and downregulation of ATGL expression unequivocally leads to increase and decrease, respectively, of both the basal and the cAMP-induced triacylglycerol hydrolysis [79–81]. It has been accepted for decades that the rate of lipolysis is primarily under the short-term and post-translational control of the cAMP-dependent signaling pathway through phosphorylation of the lipid droplet coat protein perilipin and the diacylglycerol lipase HSL by PKA leading to rapid stimulation of lipolysis, whereas insulin-induced blockade of cAMP-dependent signaling via Akt-dependent [82] and -independent [83] mechanisms causes inhibition of lipolysis.

In addition, insulin and other physiological anti-lipolytic stimuli, such as feeding and α-adrenergic hormones, have to elicit a long-term inhibitory effect on lipolysis which is based on the suppression of its rate-limiting enzyme, ATGL, most likely as a consequence of downregulation of ATGL expression. Recently, a novel molecular mechanism for the negative regulation of ATGL expression by insulin and nutrients has been identified, the mTORC1-dependent pathway which blocks lipolysis by reduction of ATGL transcription [84]. Interestingly, in Drosophila a similar mechanistic link between dTORC1 and the ATGL homologue Brummer lipase [79, 85] was demonstrated recently [86, 87], which even can be extended to the insulin receptor [88]. The apparent evolutionary conservation of this anti-lipolytic molecular mechanism strongly argues for its essential physiological role in eukaryotes, in general, and in humans, in particular, as well as makes it to an attractive source for targets for the therapy of metabolic diseases.

For elucidation of the molecular mode of mTORC1 action, yeast as a model organism was used based on the knowledge, that Saccharomyces cerevisiae harbors a functional ortholog of ATGL, the triglyceride lipase Tgl4p (Table 1) [80]. The putative involvement of the Tor1-dependent pathway in the expression of Tgl4 was studied by growing S. cerevisiae in the presence of the specific Tor1/mTORC1 inhibitor, rapamycin [81]. In fact, rapamycin led to a considerable and specific upregulation of the Tgl4p mRNA expression. For identification of the transcription factors engaged in Tgl4 expression, a S. cerevisiae deletion library was screened [81]. Interestingly, yeast cells lacking Msn4 were found to have increased basal levels of Tgl4 mRNA and to be almost insensitive towards the stimulatory effect of rapamycin on Tgl4 expression. The residual and very moderate positive effect of rapamycin on Tgl4 transcription in Msn4-defective yeast cells argues for the participation of factors other than Msn4 in the transcriptional control of Tgl4 expression by TOR1. Strikingly, orthologs of yeast Msn4p in mammals were reported to constitute a family of early growth response transcription factors, among them the well-known members Egr1 (Krox24), which are known to play important roles in adipocyte differentiation [89, 90] and regulation of cholesterol biosynthetic gene expression [91–93], and Egrs (Krox20) [94]. These data strongly suggest that the regulation of ATGL transcription by the mTORC1-Egr1 pathway is important for the control of lipid metabolism. Otherwise it would not have been conserved along evolution from yeast via Drosophila [86, 87] to mammals [84].

6. Use of Yeast for Drug Target Identification and Validation

Although yeast-based systems are less complicated than mammalian cell-based systems, orthologs of many mammalian proteins are found in unicellular lower eukaryotes. In addition, many other mammalian proteins that do not have sequence homology but do have functional homology can be used to complement functions in yeast. Unlike in higher eukaryotes, the functions of about half of the yeast genes are known on the basis of amino acid sequence similarity with other proteins of known function [95, 96]. This is an enormous resource that is being used for functional analysis. History has shown us that biological mechanisms revealed from the study of lower eukaryotic cells will be applicable to higher eukaryotes. In the future, knowledge of the function of yeast proteins will help in elucidating the function of many mammalian proteins. The similarity between living organisms was noted by Jacques Monod when he said “What is true for Escherichia coli is true for the elephant, except more so” [97]. In the simplest approach, functional complementation can be used to derive a screen in which the activity of the heterologous gene is essential for survival. This approach has been successful even in cases where protein homology is limited, as long as the relevant biological activity is complementary. Yeast-based systems can also be used to define interactions with other proteins. The more difficult approach is to manipulate the heterologously expressed gene to obtain a surrogate phenotype and create “designer yeast”.

6.1. Complementation of Homologous Target Proteins

Many currently used drug targets for the therapy of T2D are GPCRs, such as the glucagon and GLP-1 receptors (see above). Antagonists have been identified by ligand- displacement assays using mammalian cells or their membrane preparations. Agonists have been generally been identified by functional assays. Yeast-based systems have been adapted to identify agonists and antagonists of GPCRs. The mating factor receptor in S. cerevisiae, Ste2, is similar in structure to mammalian GPCRs. Mammalian GPCR can be used to replace Ste2, so that the GPCR can signal through the mating factor signaling pathway when activated by the GPCR agonist [98]. In order to get efficient downstream coupling with the mating factor pathway kinases, the amino-terminal domain of the Gα protein was deleted [99]. The GPCRs expressed in this manner in yeast are useful for screening for agonists. Coupling can also be obtained with the natural yeast Gα protein [100, 101].

The natural ligands of GPCRs can be large peptide ligands, such as for the GLP-1 receptor (see above). In mammalian cells, these GPCRs can be activated by these peptides as well as their derivatives. Antagonists are identified by finding compounds that can displace these peptides. Short peptides can be coexpressed with GPCRs in yeast to develop functional antagonist screens as well as for identifying ligands for orphan GPCRs [102]. Orphan GPCRs are those receptors that have been cloned by sequence homology to known GPCRs but whose function and natural ligands are not known. Peptide libraries have been expressed with secreted sequence tags that are secreted across the plasma membranes of yeast where they come into contact with the GPCRs. Using these peptide libraries, those peptides that specifically interact with and activate the receptor in an autocrine fashion can be identified.

Potassium channels are also important drug targets for the therapy of T2D, among them the ATP-dependent potassium channel (K+-ATP) constituted by pore-forming Kir and ligand-binding SUR subunits [103, 104]. Functional screens for K+ channel openers and blockers involve expensive equipment and are technically difficult to perform [105]. Therefore simpler assays for developing high-throughput screens have been appreciated. A simple functional screen was developed in S. cerevisiae using complementation of the TRK1/2 potassium transporter knockouts [106]. The inwardly rectifying potassium channel IRK1 has also been expressed in yeast to complement the Trk transporter defect. In the strain expressing the IRK1 channel, the ion channel activity correlates well with the growth phenotype and with patch clamp experiments in Xenopus oocytes expressing these channels.

The influenza M2 channel has been expressed in S. cerevisiae [105]. The influenza M2 channel is a proton channel that is expressed in infected cells. Its function is to increase the acidity of the milieu in which the virus sheds its capsid. When expressed in S. cerevisiae, the M2 proton channel increases the permeability of yeast plasma membranes to ions resulting in loss of yeast cell viability. In order to develop a screen to find influenza M2 protein inhibitors, it was expressed from a galactose-inducible promoter. The screen was designed to find compounds that permit growth and rescue the cells from the permeabilizing effects of M2 protein when the growth medium is supplemented with galactose. Channel screens designed in S. cerevisiae have been useful for high-throughput screening. However, it has to be considered that yeast is slowly growing, and expression of channels in this microbe is difficult and time-consuming.

6.2. Expression of heterologous target proteins

Screens to find ligands for steroid hormone receptors such as retinoid receptors, which constitute an important class of drug targets for T2D and cardiovascular diseases, have been designed in S. cerevisiae [107]. Steroid hormone receptors occur intracellularly and are built up from a ligand-binding domain, a dimerization domain, and a transactivation domain. When ligands induce these receptors to homo- or heterodimerize, their transactivation domain binds the specific response elements and activates specific promoters. The dimerization of the steroid hormone receptor followed by binding and transactivation of specific promoters can be studied in yeast. Homodimerization has been demonstrated using retinoic acid receptors, thyroid hormone receptors, and estrogen receptors [108, 109]. Heterodimerization with the RXR retinoid receptor can also be demonstrated [107]. In this system, the RAR retinoid acid receptors respond to a number of retinoids, but RXR responds only to the RXR-specific 9-cis isomer of retinoic acid [107]. Because all mammalian cells have many representatives of the steroid hormone receptor family expressed naturally, yeast-based systems offer cells with a “null” background activity for studying specific interactions.

Tyrosine-specific protein kinases and phosphatases are important drug targets for the therapy of T2D. Cell-free assays have been popular for this class of targets since the enzymes are easily produced by recombinant means and tyrosine-specific phosphorylation of the natural or an appropriate artifical substrate protein is simple to detect using labeled ATP. An alternative method using Schizosaccharomyces pombe has been published that will find inhibitors that are non-toxic to yeast as well as cell-permeable [110]. The prototypic tyrosine kinase, Src, was expressed under the control of the inducible promoter. Induction of Src results in cell death, and growth rescue can be used for the identification of inhibitors. To adapt the screen for identifying phosphatase inhibitors, this system was modified by co-expressing tyrosine phosphatase on a second plasmid. When the kinase and phosphatase are coexpressed, the cell survives the detrimental effects of kinase expression. Tyrosine phosphatase inhibitors can be identified in this system by looking for compounds that selectively kill the strain co-expressing the kinase and phosphatase [110].

6.3. Detection and Analysis of Protein-Protein Interaction

Proteins carry out their function in most cases by interacting with other proteins. The yeast two-hybrid system, developed by Fields and Song [111], has revolutionized the study of protein-protein interactions. In this system, the transcription factor, GAL4 from S. cerevisiae, is used to set up the assay. GAL4 has two domains, a site-specific DNA-binding domain and an acidic region that is required for transcriptional activation. The DNA-binding and activation domains can be coded by separate genes as long as they are brought together in a heterodimer to reconstitute a functional transcription factor. The system is designed so that when GAL4 binds the GAL4-binding domain on the promoter, LEU2 and/or HIS3 are expressed. Functionally competent chimeric proteins can be made that consist of the DNA-binding domain fused to one protein of an interacting pair and the activation domain fused to the second protein of the interacting pair. Interaction of the proteins that are constructed as chimeras of the activating and DNA-binding domains allow the yeast to grow in the absence of histidine and leucine, thus providing a selective advantage. The yeast two-hybrid system is widely used for identifying homo- and heterodimerizing proteins as well as to develop screens to find compounds that can block two proteins from interacting with each other [112].

The yeast two-hybrid system has been modified to measure the dissociation of interacting proteins by using the URA3 reporter [113]. Yeast cells expressing URA3 can grow in medium without uracil. When 5-fluoroorotic acid (FOA) is introduced into the medium, URA3 expressing cells take up FOA and transform it into a toxic compound. Thus the expression of the reporter gene is toxic and provides a powerful selection procedure. This FOA system is used in the “reverse two-hybrid” system, providing a selective growth advantage and a more powerful system for screening. In the “reverse two-hybrid system”, the interacting protein is expressed inducibly, and only when the interacting proteins are blocked do the cells survive. GAL4 and LexA transcription factors are most often used in the yeast two-hybrid system. In two-hybrid screens, it is useful to have two separate reporter constructs to help in sorting “hits”. Reporters such as Leu2 and LacZ can be expressed in the same cell.

The yeast two-hybrid system has been used to develop screens for ligand-receptor interactions, including peptide hormone receptors, such as the GLP-1 receptor, and the receptor tyrosine kinases, such as the insulin receptor [114–116]. Specific and reversible ligand-receptor interactions between growth hormone and growth hormone receptor, VEGF and KDR, can be studied using the yeast two-hybrid system. Ligand-dependent receptor dimerization can also be studied  using three expression plasmids in which the receptor is expressed as a fusion protein with both the DNA-binding protein as well as the activation domain. The ligand is expressed from a third plasmid. When the ligand binds the two receptors, the DNA-binding domain and activating domains are pulled together and GAL4 is activated.

The yeast two-hbrid system has been adapted to study protein-protein, protein-RNA, protein-DNA, and protein-small molecule interactions [117]. A one-hybrid system has been developed that utilizes cis-acting sequences to identify DNA-binding proteins that can initiate transcription [118]. A yeast three-hybrid was developed to study RNA-protein interactions that are especially useful for developing screens against viruses [119]. In this system, the hybrid RNA containing sites recognized by the RNA-interacting proteins links the two-hybrid proteins containing the DNA-binding and activation domains, respectively. The yeast two-hybrid system has been recently applied to find inhibitors of the N type calcium channel [120, 121]. Alternative screening techniques use mammalian cells to measure calcium channel activity with electrophysiological and spectrophotometric methods to measure calcium influx. These methods are labor intensive, difficult, and not compatible with high-throughput screening. In the yeast two-hybrid system, the interacting, regulatory portion of the α1 subunit of the channel fused to the Gal4 activation domain and the full length β3 subunit fused to the yeast Gal4 DNA-binding domain were expressed. The system could be adapted to find inhibitors of specific calcium channels by selecting the specific interacting domains.

7. Conclusions

Unicellular lower eukaryotes provide an alternate platform for high-throughput screening. Those systems are inexpensive to run and screens can be developed rapidly. Many modular systems are available that are adaptable to important classes of drug targets, such as GPCRs, single-transmembrane receptors such as growth factor tyrosine kinases and phosphatases and ion channels, which are of critical importance for the therapy of metabolic diseases, such as T2D. Functional screens are becoming necessary for developing screens for proteins whose biological functions are not yet known as well as on proteins that interact with new proteins. Because of the ease with which new targets can be explored, functional cell-based screens are becoming the preferred method for finding leads for drug discovery. Test systems based on unicellular lower eukaryotes provide simple and cost-effective means for the identification and validation of drug targets and, most importantly, for the discovery of novel drugs by functional screening.

As thousands of new potential drug targets from genomic information and protein interaction studies have meanwhile been identified, the future of screening is in using chip technology [122, 123]. Systems based on unicellular lower eukaryotes are especially suited for the delivery to microchips. Yeast is robust and is easy to handle and distribute. Thousands of yeast cells can be deposited on chips in a high-density formate. In addition, the surface charge on S. cerevisiae could be used to array the organisms into the desired formate. Currently, the limitation is the sensitivity of reading colorimetric reporters, and alternatives are being investigated. Biosensors and transducers could be used to detect thermal, immunologic, or optical changes [124, 125]. Glucose sensing amperometric systems are being used in clinical microbiology and could be developed for high-throughput screening [126]. Each of the microbial systems described can be adapted to use the reporter that is suitable for the high-density formate on chips for screening. Consequently, a yeast genetic system has been designed for the identification of small-molecule inhibitors of protein-protein interaction on the basis of nanodroplets [127].

Conflict of Interest: The author declares no conflict of interest.

References

  1. Morris AJ, Malbon CC (1999) Physiological regulation of G protein-linked signaling. Physiol Rev 79: 1373–1430. [crosref]
  2. Saad MJ, Velloso LA, Carvalho CR (1995) Angiotensin II induces tyrosine phosphorylation of insulin receptor substrate 1 and its association with phosphatidylinositol 3-kinase in rat heart. Biochem J 310: 741–744.
  3. Baltensperger K, Karoor V, Paul H, Ruoho A, Czech MP, et al. (1996) The beta-adrenergic receptor is a substrate for the insulin receptor tyrosine kinase. J Biol Chem 271: 1061–1064. [crosref]
  4. Kowalski-Chauvel A, Pradayrol L, Vaysse N, Seva C (1996) Gastrin stimulates tyrosine phosphorylation of insulin receptor substrate 1 and its association with Grb2 and the phosphatidylinositol 3-kinase. J. Biol. Chem 271: 26356–26361.
  5. Velloso LA, Folli F, Sun XJ, White MF, Saad MJ, et al. (1996) Cross-talk between the insulin and angiotensin signaling systems. Proc Natl Acad Sci U S A 93: 12490–12495. [crosref]
  6. Karoor V, Shih M. Tholanikunnel B, Malbon CC (1996) Regulating expression and function of G-protein-linked receptors. Progr Neurobiol 48: 555–568.
  7. Karoor V, Malbon CC (1998) G-protein-linked receptors as substrates for tyrosine kinases: cross-talk in signaling. Adv Pharmacol 42: 425–428. [crosref]
  8. Karoor V, Malbon CC (1996) Insulin-like growth factor receptor-1 stimulates phosphorylation of the beta2-adrenergic receptor in vivo on sites distinct from those phosphorylated in response to insulin. J. Biol. Chem 271: 29347–29352.
  9. Whiteway M, Clark KL, Leberer E, Dignard D, Thomas DY (1994) Genetic identification of residues involved in association of alpha and beta G-protein subunits. Mol Cell Biol 14: 3223–3229. [crosref]
  10. Leberer E, Thomas DY, Whiteway M (1997) Genetic identification of residues involved in association of alpha and beta G-protein subunits. Curr. Opin. Genet. Develop 7: 59–66.
  11. Leeuw T, Wu C, Schrag JD, Whiteway M, Thomas DY, Leberer E (1998) Interaction of a G-protein beta-subunit with a conserved sequence in Ste20/PAK family protein kinases. Nature 391: 191–195.
  12. Jenness DD, Burkholder AC, Hartwell LH (1983) Binding of alpha-factor pheromone to yeast a cells: chemical and genetic evidence for an alpha-factor receptor. Cell 35: 521–529.
  13. Blumer KJ, Reneke JE, Thorner J (1988) The STE2 gene product is the ligand-binding component of the alpha-factor receptor of Saccharomyces cerevisiae. J. Biol. Chem. 263: 10836–10842.
  14. Yin D, Shumay E, Wang H-Y, Malbon CC (2005) Yeast Ste2 receptors as tools for study of mammalian protein kinases and adaptors involved in receptor trafficking. J. Mol. Signal 1: 2.
  15. Mcintyre N, Holdsworth CD, Turner DS (1964) New Interpretation Of Oral Glucose Tolerance. Lancet 2: 20–21. [crosref]
  16. Baggio LL, Drucker DJ (2007) Biology of incretins: GLP-1 and GIP. Gastroenterology 132: 2131–2157. [crosref]
  17. Alexander SPH, Benson HE, Faccenda E, Pawson, AJ, Sharman JL, Spedding M, Peters JA, Harmar AJ (2013) CGTP Collaborators. The Concise Guide to PHARMACOLOGY 2013/14: G protein-coupled receptors. Br. J. Pharmacol. 170: 1459–1581.
  18. Nauck MA (2011) Incretin-based therapies for type 2 diabetes mellitus: properties, functions, and clinical implications. Am. J. Med. 2011 124: S3–S18.
  19. Quddusi S, Vahl TP, Hanson K, Prigeon RL, D‘Alessio A (2003) Differential effects of acute and extended infusions of glucagon-like peptide-1 on first- and second-phase insulin secretion in diabetic and nondiabetic humans. Diabetes Care 26: 791–798.
  20. Holst JJ, Seino Y (2009) GLP-1 receptor agonists: targeting both hyperglycaemia and disease processes in diabetes. Diabetes Res Clin Pract 85: 1–3. [crosref]
  21. Mentlein R, Gallwitz B, Schmidt WE (1993) Dipeptidyl-peptidase IV hydrolyses gastric inhibitory polypeptide, glucagon-like peptide-1(7–36)amide, peptide histidine methionine and is responsible for their degradation in human serum. Eur. J. Biochem 214: 829–835.
  22. Scott DA, Boye KS, Timlin L, Clark JF, Best JH (2013) A network meta-analysis to compare glycaemic control in patients with type 2 diabetes treated with exenatide once weekly or liraglutide once daily in comparison with insulin glargine, exenatide twice daily or placebo. Diabetes Obes. Metab 15: 213–223.
  23. Butler AE, Campbell-Thompson M, Gurlo T, Dawson DW, Atkinson M, Butler PC (2013) Marked expansion of exocrine and endocrine pancreas with incretin therapy in humans with increased exocrine pancreas dysplasia and the potential for glucagon-producing neuroendocrine tumors. Diabetes 62: 2595–2604.
  24. Pabreja K, Mohd MA, Koole C, Wootten D, Furness SGB (2014) Molecular mechanisms underlying physiological and receptor pleiotropic effects mediated by GLP-1R activation. Br. J. Pharmacol. 171: 1114–1128.
  25. Nathan DM, Buse JB, Davidson, MB, Ferrannini E, Holman RR, Sherwin R, Zinman B (2009) American Diabetes Association and European Association for Study of Diabetes, Medical management of hyperglycemia in type 2 diabetes: a consensus algorithm for the initiation and adjustment of therapy: a consensus statement of the American Diabetes Association and the European Association for the Study of Diabetes. Diabetes Care 32: 193–203.
  26. SJ Dowell, AJ Brown (2002) Yeast assays for G-protein-coupled receptors, Recept. Channels 8: 343–352.
  27. Stewart GD, Valant C, Dowell SJ, Mijaljica D, Devenish RJ, Scammells PJ, Sexton PM, Christopoulos A (2009) Determination of adenosine A1 receptor agonist and antagonist pharmacology using Saccharomyces cerevisiae: implications for ligand screening and functional selectivity. J. Pharmacol. Exp. Ther 331: 271–286.
  28. Weston C, Poyner D, Patel V, Dowell S, Ladds G (2014) Investigating G protein signalling bias at the glucagon-like peptide-1 receptor in yeast. Br J Pharmacol 171: 3651–3665.[crosref]
  29. Montrose-Rafizadeh C, Avdonin P, MJ Garant, MJ Rodgers BD, Kole S, Yang H, Levine MA, Schwindiger S, Bernier M (1999) Pancreatic glucagon-like peptide-1 receptor couples to multiple G proteins and activates mitogen-activated protein kinase pathways in Chinese hamster ovary cells. Endocrinology 140: 1132–1140.
  30. Hallbrink M, Holmqvist T, Olsson M, Ostenson CG, Efendic S, Langel U (2001) Different domains in the third intracellular loop of the GLP-1 receptor are responsible for Galpha(s) and Galpha(i)/Galpha(o) activation. Biochim. Biophys. Acta 1546: 79–86.
  31. Coopman K, Huang Y, Johnston N, Bradley SJ, Wilkinson GF, Willars GB (2010) Comparative effects of the endogenous agonist glucagon-like peptide-1 (GLP-1)-(7–36) amide and the small-molecule ago-allosteric agent ‘compound 2’ at the GLP-1 receptor. J. Pharmacol. Exper. Therapeut. 334: 795–808.
  32. Brown AJ, Dyos SL, Whiteway MS, White JH, Watson MAE, Marzioch M, Clare JJ, Cousens DJ, Paddon C, Plumpton C, Romanos MA, Dowell SJ (2000) Functional coupling of mammalian receptors to the yeast mating pathway using novel yeast/mammalian G protein a-subunit chimeras. Yeast 16: 11–22.
  33. Dowell SJ, Brown AJ (2009) Yeast assays for G protein-coupled receptors. In: G Protein-Coupled Receptors in Drug Discovery 2009, New York, Humana Press 213–229.
  34. Ladds G, Davis K, Hillhouse EW, Davey J (2003) Modified yeast cells to investigate the coupling of G protein-coupled receptors to specific G proteins. Mol Microbiol 47: 781–792. [crosref]
  35. Ladds G, Goddard A, Davey J (2005) Functional analysis of heterologous GPCR signalling pathways in yeast. Trends Biotechnol 23: 367–373. [crosref]
  36. Miret JJ, Rakhilina L, Silverman L, Oehlen B (2002) Functional expression of heteromeric calcitonin gene-related peptide and adrenomedullin receptors in yeast. J. Biol. Chem. 27: 6881–6887.
  37. Dexter D, Moye-Rowley WS, Wu AL, Golin J (1994) Mutations in the yeast PDR3, PDR4, PDR7 and PDR9 pleiotropic (multiple) drug resistance loci affect the transcript level of an ATP binding cassette transporter gene, PDR5. Genetics 136: 505–515.
  38. Nourani A, Wesolowski-Louvel M, Delaveau T, Jacq C, Delahodde A (1997) Multiple-drug-resistance phenomenon in the yeast Saccharomyces cerevisiae: involvement of two hexose transporters. Mol. Cell. Biol.17: 5453–5460.
  39. Hallstrom TC, Moye-Rowley WS (1998) Divergent transcriptional control of multidrug resistance genes in Saccharomyces cerevisiae. J. Biol. Chem. 273: 2098–2104.
  40. Prendergast JA, Singer RA, Rowley N, Rowley A, Johnston GC, Danos M, Kennedy B, Gaber RF (1995) Mutations sensitizing yeast cells to the start inhibitor nalidixic acid. Yeast 11: 357–547.
  41. Arkinstall S, Payton M, Maundrel K (1995) Activation of phospholipase C gamma in Schizosaccharomyces pombe by coexpression of receptor or nonreceptor tyrosine kinases. Mol. Cell. Biol. 15: 1431–1438.
  42. Angermayr M, Strobel G, Müller G, Bandlow W (2000) Stable plasma membrane expression of the soluble domain of the human insulin receptor in yeast. FEBS Lett 481: 8–12.
  43. Müller G, Rouveyre N, Upshon C, Bandlow W (1998) Insulin signaling in the yeast Saccharomyces cerevisiae. 3. Induction of protein phosphorylation by human insulin. Biochemistry 37: 8705–8713.
  44. Moller NPH, Moller KB, Lammers R, Kharitonenkov A, Hoppe E, Wiberg FC, Sures I, Ullrich A (1995) Selective down-regulation of the insulin receptor signal by protein-tyrosine phosphatases alpha and epsilon. J. Biol. Chem. 270: 23126–23131.
  45. Yazici D, Sezer H (2017) Insulin Resistance, Obesity and Lipotoxicity. Adv Exp Med Biol 960: 277–304. [crosref]
  46. Rice Bradley BH (2018) Dietary Fat and Risk for Type 2 Diabetes: a Review of Recent Research. Curr Nutr Rep 7: 214–226. [crosref]
  47. Sabin MA, De Hora M, Holly JM, Hunt LP, Ford AL, Williams SR, Baker JS, Retallick CJ Crowne EC, Shield JP (2007) Fasting nonesterified fatty acid profiles in childhood and their relationship with adiposity, insulin sensitivity, and lipid levels. Pediatrics 120: 1426–1433.
  48. Kusminski CM, Shetty S, Orci L, Unger RH, Scherer PE (2009) Diabetes and apoptosis: lipotoxicity. Apoptosis 14: 1484–1495. [crosref]
  49. Rahier J, Guiot Y, Goebbels RM, Sempoux C, Henquin JC (2008) Pancreatic beta-cell mass in European subjects with type 2 diabetes. Diabetes Obes Metab 10 Suppl 4: 32–42. [crosref]
  50. Lee J, Pilch PF (1994) The insulin receptor: structure, function, and signaling. Am J Physiol 266: C319–334. [crosref]
  51. Nolan CJ, Ruderman NB, Kahn SE, Pedersen O, Prentki M (2015) Insulin resistance as a physiological defense against metabolic stress: implications for the management of subsets of type 2 diabetes. Diabetes 64: 673–686.
  52. Smith U, Kahn BB (2016) Adipose tissue regulates insulin sensitivity: role of adipogenesis, de novo lipogenesis and novel lipids. J. Intern. Med. 280: 465–475.
  53. AN Onyango (2018) Cellular stresses and stress responses in the pathogenesis of insulin resistance. Oxid. Med. Cell. Longev 321714.
  54. Kahn SE, Hull RL, Utzschneider KM (2006) Mechanisms linking obesity to insulin resistance and type 2 diabetes. Nature 444: 840–846. [crosref]
  55.  Pineau L, Ferreira T (2010) Lipid-induced ER stress in yeast and β cells: parallel trails to a common fate. FEMS Yeast Res 10: 1035–1045. [crosref]
  56. Ježek P, Jaburek M, Holendová B, Plecitá-Hlavatá L (2018) Fatty acid-stimulated secretion vs. lipotoxicity. Molecules 23: 1483.
  57. Morgan NG, Dhayal S, Diakogiannaki E, Welters HJ (2008) The cytoprotective actions of long-chain mono-unsaturated fatty acids in pancreatic I-cells. Biochem. Soc. Trans. 36: 905–908.
  58. Katsoulieris E, Mabley JG, Samai M, Green IC, Chatterjee PK (2009) (alpha)-Linolenic acid protects renal cells against palmitic acid lipotoxicity via inhibition of endoplasmic reticulum stress. Eur. J. Pharmacol 623: 107–112.
  59. Pineau L, Colas J, Dupont S, Beney L, Fleurat-Lessard P, Berjeaud JM, Berges T, Ferreira T (2009) Lipid-induced ER stress: synergistic effects of sterols and saturated fatty acids. Traffic 10: 673–690.
  60. Cunha DA, Hekerman P, L Ladriere L, Bazarra-Castro A, Ortis F, et al (2008) Initiation and execution of lipotoxic ER stress in pancreatic (beta)-cells. J. Cell Sci. 121: 2308–2318.
  61. Diakogiannaki E, Welters HJ, Morgan NG (2008)Differential regulation of the endoplasmic reticulum stress response in pancreatic (beta)-cells exposed to long-chain saturated and monounsaturated fatty acids. J. Endocrinol. 197: 553–563.
  62. Almanza A, Carlesso A, Chintha, C, Creedican S, Doultsinos D, et al (2018) Endoplasmic reticulum stress signalling – from basic mechanisms to clinical applications. FEBS J. 2018, doi: 10.1111/febs.14608, [Epub ahead of print].
  63. Travers KJ, Patil CK, Wodicka L, Lockhart DJ, Weissman JS, Walter P (2000) Functional and genomic analyses reveal an essential coordination between the unfolded protein response and ER-associated degradation. Cell 101: 249–258.
  64. Zhang YZ, Kaufman RJ (2006) The unfolded protein response: a stress signaling pathway critical for health and disease. Neurology 66: S102-S109.
  65. Kincaid MM, Cooper AA (2007) ERADicate ER stress or die trying. Antioxid Redox Signal 9: 2373–2387. [crosref]
  66. Cox JS, Walter P (1996) A novel mechanism for regulating activity of a transcription factor that controls the unfolded protein response. Cell 87: 391–404.
  67. Pineau L, Bonifait L, Berjeaud J.-M, Alimardani-Theuil P, Berges T, Ferreira T (2008) A lipid-mediated quality control process in the golgi apparatus in yeast. Mol. Biol. Cell 19: 807–821.
  68. Bódis K, Roden M (2018) Energy metabolism of white adipose tissue and insulin resistance in humans. Eur. J. Clin. Invest. 2018, e13017, [Epub ahead of print].
  69. McGarry JD (1992) What if Minkowski had been ageusic? An alternative angle on diabetes. Science 258: 766–770. [crosref]
  70.  McGarry JD (2002) Banting lecture 2001: dysregulation of fatty acid metabolism in the etiology of type 2 diabetes. Diabetes 51: 7–18. [crosref]
  71.  Cerk IK, Wechselberger L, Oberer M1 (2018) Adipose Triglyceride Lipase Regulation: An Overview. Curr Protein Pept Sci 19: 221–233. [crosref]
  72. Duncan RE, Ahmadian M, Jaworski K, Sarkadi-Nagy E, Sul HS (2007) Regulation of lipolysis in adipocytes. Annu Rev Nutr 27: 79–101. [crosref]
  73. Zechner R, Kienesberger PC, Haemmerle G, Zimmermann R, Lass A (2009) Adipose triglyceride lipase and the lipolytic catabolism of cellular fat stores. J. Lipid Res. 50: 3–21.
  74. Lafontan M, Langin D (2009) Lipolysis and lipid mobilization in human adipose tissue. Prog Lipid Res 48: 275–297. [crosref]
  75. Coleman RA, Mashek DG (2011) Mammalian triacylglycerol metabolism: synthesis, lipolysis, and signaling. Chem. Rev111: 6359–6386.
  76. Jenkins CM, Mancuso DJ, Yan W, Sims HF, Gibson B, Gross RW (2004) Identification, cloning, expression, and purification of three novel human calcium-independent phospholipase A2 family members possessing triacylglycerol lipase and acylglycerol transacylase activities. J. Biol. Chem. 279: 48968–48975.
  77. Villena JA, Roy S, Sarkadi-Nagy E, Kim KH, Sul HS (2004) Desnutrin, an adipocyte gene encoding a novel patatin domain-containing protein, is induced by fasting and glucocorticoids: ectopic expression of desnutrin increases triglyceride hydrolysis. J. Biol. Chem. 279: 47066–47075.
  78. R Zimmermann R, Strauss JG, Haemmerle G, Schoiswohl G, Birner-Gruenberger R, Riederer M, Lass A, Neuberger G, Eisenhaber F, Hermetter A, Zechner R (2004) Fat mobilization in adipose tissue is promoted by adipose triglyceride lipase. Science 306: 1383–1386.
  79. Grönke S, Mildner A, Fellert S, Tennagels N, Petry S, Müller G, Jäckle H, Kühnlein RP (2005) Brummer lipase is an evolutionary conserved fat storage regulator in Drosophila. Cell Metabol 1: 323–330.
  80. Kurat CF, Natter K, Petschnigg J, Wolinski H, Scheuringer K, Scholz H, Zimmermann R, Leber R, Zechner R, Kohlwein SD (2006) Obese yeast: triglyceride lipolysis is functionally conserved from mammals to yeast. J. Biol. Chem. 281: 491–500.
  81. Chakrabarti P, Kim JY, Singh M, Shin Y-K, Kim J, Kumbrink J, Wu Y, Lee M-J, Kirsch KH, Fried SK, Kandror KV (2013) Insulin inhibits lipolysis in adipocytes via the evolutionarily conserved mTORC1-Egr1-ATGL-mediated pathway. Mol. Cell. Biol. 33: 3659–3666.
  82. Kitamura T, Kitamura Y, Kuroda S, Hino Y, Ando M, Kotani K, Konishi H, Matsuzaki H, Kikkawa U, Ogawa W, Kasuga M (1999) Insulin-induced phosphorylation and activation of cyclic nucleotide phosphodiesterase 3B by the serine-threonine Akt. Mol. Cell. Biol. 19: 6286–6296.
  83. Choi SM, Tucker DF, Gross DN, Easton RM, DiPilato LM, Dean AS, Monks BR, Birnbaum MJ (2010) Insulin regulates adipocyte lipolysis via an Akt-independent signaling pathway. Mol. Cell. Biol. 30: 5009–5020.
  84. Chakrabarti P, English T, Shi J, Smas CM, Kandror KV (2010) The mTOR complex 1 suppresses lipolysis, stimulates lipogenesis and promotes fat storage. Diabetes 59: 775–781.
  85. Grönke S, Müller G, Hirsch J, Fellert S, Andreou A, et al. (2007) Dual lipolytic control of body fat storage and mobilization in Drosophila. PLoS Biol 5: e137. [crosref]
  86. Luong N, Davies CR, Wessells RJ, Graham SM, King MT, et al. (2006) Activated FOXO-mediated insulin resistance is blocked by reduction of TOR activity. Cell Metab 4: 133–142. [crosref]
  87. Birse RT, Choi J, Reardon K, Rodriguez J, Graham S, et al. (2010) High-fat-diet-induced obesity and heart dysfunction are regulated by the TOR pathway in Drosophila. Cell Metab 12: 533–544. [crosref]
  88. Fernandez-Almonacid R, Rosen OM (1987) Structure and ligand specificity of the Drosophila melanogaster insulin receptor. Mol. Cell. Biol. 7: 2718–2727.
  89. Boyle KB, Hadaschik D, Virtue S, Cawthorn WP, Ridley SH, O‘Rahilly S, Siddle K (2009) The transcription factors Egr1 and Egr2 have opposing influences on adipocyte differentiation. Cell Death Diff. 16: 782–789.
  90. Wang W, Huang L, Huang, Y, Yin JW. Berk AJ, Friedman JM, Wang G (2009) Mediator MED23 links insulin signaling to the adipogenesis transcription cascade. Dev. Cell 16: 764–771.
  91. Brand F, Herrmann SM, Nicaud V, Evans A, Ruidavets JB, Arveiler D, Luc G, Cambien F, Soubrier F (2000) Identification of two polymorphisms in the early growth response protein-1 gene: possible association with lipid variables. J. Mol. Med. 78: 81–86.
  92. Gokey NG, Lopez-Anido C, Gillian-Daniel AL, Svaren J (2011) Early growth response 1 (egr1) regulates cholesterol biosynthetic gene expression. J. Biol. Chem 286: 29501–29510.
  93. Shen N, Yu X, Pan FY, Gao X, Xue B, Li CJ (2011) An early response transcription factor, egr-1, enhances insulin resistance in type 2 diabetes with chronic hyperinsulinism. J. Biol. Chem. 286: 14508–14515.
  94. Estruch F, Carlson M (1993) Two homologous zinc finger genes identified by multicopy suppression in a SNF1 protein kinase mutant of Saccharomyces cerevisiae. Mol. Cell. Biol. 13: 3872–3881.
  95. Goffeau A, Barrell BG, Bussey H, Davis RW, Dujon B, et al. (1996) Life with 6000 genes. Science 274: 546, 563–567. [crosref]
  96. Blattner FR, Plunkett G 3rd, Bloch CA, Perna NT, Burland V, et al. (1997) The complete genome sequence of Escherichia coli K-12. Science 277: 1453–1462. [crosref]
  97. Wolin SL (1994) From the elephant to E. coli: SRP-dependent protein targeting. Cell 77: 787–790. [crosref]
  98. King K, Dohlman HG, Thorner J, Caron MG, Lefkowitz R (1995) Control of yeast mating signal transduction by a mammalian ß2-adrenergic receptor and Gs a subunit. Science 250: 121–123.
  99. Dohlman HG, Apaniesk D, Chen Y, Song J, Nusskern D (1995) Inhibition of G-protein signaling by dominant gain-of-function mutations in Sst2p, a pheromone desensitization factor in Saccharomyces cerevisiae. Mol. Cell. Biol. 15: 3635–3643.
  100. Proce LA, Kajkowski EM, Hadcock JR, Ozenberger BA, Pausch MH (1995) Functional coupling of a mammalian somatostatin receptor to the yeast pheromone response pathway. Mol. Cell. Biol. 15: 6188–6195.
  101. Pausch MH (1997) G-protein coupled receptors in Saccharomyces cerevisiae: high throughput screening assays for drug discovery. Trends Biotechnol. 15: 487–494.
  102.  Klein C, Paul JI, Sauvé K, Schmidt MM, Arcangeli L, et al. (1998) Identification of surrogate agonists for the human FPRL-1 receptor by autocrine selection in yeast. Nat Biotechnol 16: 1334–1337. [crosref]
  103. Vedovato N, Ashcroft FM, Puljung MC (2015) The Nucleotide-Binding Sites of SUR1: A Mechanistic Model. Biophys J 109: 2452–2460. [crosref]
  104. Benarroch EE (2017) Sulfonylurea receptor-associated channels: Involvement in disease and therapeutic implications. Neurology 88: 314–321.
  105.  Hahnenberger KM, Krystal M, Esposito K, Tang W, Kurtz S (1996) Use of microphysiometry for analysis of heterologous ion channels expressed in yeast. Nat Biotechnol 14: 880–883. [crosref]
  106. Bertin B, Freissmuth M, Jockers R, Strosberg AD, Marullo S (1994) Cellular signaling by an agonist-activated receptor/Gs alpha fusion protein. Proc Natl Acad Sci U S A 91: 8827–8831. [crosref]
  107. Hall BL, Smit-McBride Z, Provalsky ML (1993) Reconstitution of retinoid X receptor function and combinatorial regulation of other nuclear hormone receptors in the yeast Saccharomyces cerevisiae. Proc. Natl. Acad. Sci. USA 90: 6929–6933.
  108. Mangelsdorf DJ, Thummel C, Beato M, Herrlich P, Schütz G, et al. (1995) The nuclear receptor superfamily: the second decade. Cell 83: 835–839. [crosref]
  109.  Chambon P (1996) A decade of molecular biology of retinoic acid receptors. FASEB J 10: 940–954. [crosref]
  110. Supert-Furga, G.; Jonasson, K.; Courtneidge, S.A. A functional screen in yeast for regulators and antagonizers of heterologous protein tyrosine kinases. Nature Biotechnol. 1996, 14, 600–604.
  111. Fields S, Song OK (1989) A novel genetic system to detect protein-protein interactions. Nature 340: 245–246.
  112.  Germino FJ, Wang ZX, Weissman SM (1993) Screening for in vivo protein-protein interactions. Proc Natl Acad Sci U S A 90: 933–937. [crosref]
  113. Vidal M, Brachmann RK, Fattaey A, Harlow E, Boeke JD (1996) Reverse two-hybrid and one-hybrid systems to detect dissociation of protein-protein and DNA-protein interactions. Proc. Natl. Acad. Sci. USA 93: 10315–10320.
  114. Ozenberger BA, Young KH (1995) Functional interaction of ligands and receptors of the hematopoietic superfamily in yeast. Mol Endocrinol 9: 1321–1329. [crosref]
  115. Kajkowski EM, Proce LA, Paush MH, Young KH, Ozenberger BA (1997) Investigation of growth hormone releasing hormone receptor structure and activity using yeast expression technologies. J. Recept. Signal Transduct. Res. 17: 293–303.
  116. Zhu J, Kahn CR (1997) Analysis of a peptide hormone-receptor interaction in the yeast two-hybrid system. Proc. Natl. Acad. Sci. USA 94: 13063–3068.
  117. Tirode F, Malaguti C, Romero F, Attar R, Camonis J, et al. (1997) A conditionally expressed third partner stabilizes or prevents the formation of a transcriptional activator in a three-hybrid system. J Biol Chem 272: 22995–22999. [crosref]
  118. SenGupta DJ, Zhang B, Kraemer B, Pochart P, Fields S, et al. (1996) A three-hybrid system to detect RNA-protein interactions in vivo. Proc Natl Acad Sci U S A 93: 8496–8501. [crosref]
  119. Lieberles S, Diver ST, Austin DJ, Schreiber SL (1997) Inducible gene expression and protein translocation using nontoxic ligands identified by a mammalian three-hybrid screen. Proc. Natl. Acad. Sci. USA 94: 7825–7830.
  120. Catterall WA (1998) Yeasty brew yields novel calcium channel inhibitor. Nat Biotechnol 16: 906. [crosref]
  121. Young K, Stephen L, Sun L, Lee E, Modi M, Hellings S, Husbands M, Ozenberger B, Franco R (1998) Identification of a calcium channel modulator using a high throughput yeast two-hybrid screen. Nature Biotechnol 16: 946–950.
  122. Leach M (1994) Discovery on a credit card? Drug Discov. Today 2: 263–254.
  123. Sedlak BJ (1997) Gene chip technology ready to impact diagnostic markers. Gen. Eng. News 17: 1, 13, 34.
  124. Chiem NH, Harrison DJ (1998) Microchip systems for immunoassay: an integrated immunoreactor with electrophoretic separation for serum theophylline. Clin. Chem. 44: 591–598.
  125.  Uhlig A, Lindner E, Teutloff C, Schnakenberg U, Hintsche R (1997) Miniaturized ion-selective chip electrode for sensor application. Anal Chem 69: 4032–4038. [crosref]
  126.  Liu CC, Neuman MR, Romankiw LT, Makovos EB (1987) Microelectronic sensors for simultaneous measurement of PO2 and pH. Adv Exp Med Biol 220: 295–298. [crosref]
  127. Huang J, Schreiber SL (1997) A yeast genetic system for selecting small molecule inhibitors of protein-protein interactions in nanodroplets. Proc. Natl. Acad. Sci. USA 94: 13396–13401.

A Polyherbal Indian System of Medicine (Ayush) Preparation for Optimization of Glycemic Control in Newly Diagnosed Type 2 Diabetes and Prediabetes; A Multicenter, Randomised, Double-Blind, Placebo- Controlled Trial

DOI: 10.31038/EDMJ.2019322

Abstract

Background: Current therapeutics do not provide optimized care in early stage type 2 diabetes and there is no established treatment for prediabetes. We did a randomised trial to assess the efficacy and safety of a popular Ayush product, Sugar Balance® (sugar balance) in patients with newly diagnosed type 2 diabetes and prediabetes.

Methods: In this multicentre, double blind placebo-controlled trial, we randomly assigned (1: 1) eligible participants, 30 years of age or older, of either gender and diagnosed with type 2 diabetes (HbA1c ≥ 6.5%) or prediabetes (FPG ≥ 5.6 mmol/L). We used computer-generated ramdomisation, stratified by type of diagnosis (prediabetes or diabetes). Active recipients were to receive 250 mg capsules containing 3 Organic certified whole herbs: Coccinia indica, Bougainvillea spectabilis and Madagascar periwinkle (sadabahar). The recommended dose was 2 capsules twice daily. The primary outcome was ≥0.5% reduction in HbA1c for type 2 diabetes subjects and an increased incidence of normalization in impaired fasting blood glucose for prediabetes subjects at 6 months after randomization. The primary analysis included all subjects who received the allocated intervention and had 1 follow up visit after randomisation. All subjects received standard life style recommendations for diet and exercise. Type 2 diabetes subjects were allowed to be on biguanides (metformin) of their choice. This trial is registered with ClinicalTrials.gov, number NCT02866539 and clinical trials registry of India, number CTRI/2016/11/007435, and is completed.

Findings:Between December 14th 2016 and 28th August 2017, 122 subjects were randomly assigned to active sugar balance (n=61) or matching placebo (n=61), of whom one subject (assigned to placebo) did not receive the allocated intervention. All follow up was completed on 16th December 2017. At 6 months type 2 diabetes subjects allocated to active arm had a mean reduction of HbA1c of -0.52% versus -0.43% among placebo arm (difference of -0.09% 95% CI -0.1705 – -0.0095). 13 (52%) versus 4 (15.4%) prediabetes subjects receiving the polyherbal achieved normalization of impaired fasting glycaemia (<100 mg/dl) (difference of 36.6% 95% CI 10.683 – 56.805). None of the study participants experienced significant hypoglycemia or significant changes in their safety clinical biochemistry parameters on therapy.

Conclusions: Sugar Balance promises to be effective and safe supplement for type 2 diabetes subjects to achieve a better optimization of HbA1c when taken along with standard dose of metformin and for prediabetes subjects to achieve their target fasting blood sugars with diet and exercise.

Keywords

Ayush, Polyherb, Organic Sugar Balance, Prediabetes, Type 2 Diabetes Mellitus

Introduction

Diabetes mellitus is a non-communicable disease of rising concern in global health. In 2017, more than 425 million people across the globe were diagnosed with diabetes and an additional 350 million with prediabetes [1]. The disease contributes to 10.7% of global deaths [2] and 33 million years lived with disability (YLD) [3]. 77% of these patients live in low- and middle-income countries and have limited access to biomedical health care [1]. India is one of the countries with largest diabetes population [4] and should explore locally available alternate Ayush based treatments to expand access to care.

A recent study suggests that if epidemiological trends continue, achieving the global target of preventing the rise in diabetes patients has a probability of <50% in most of the countries including India [5]. Prevalence of prediabetes is a major threat in India and there are no effective therapies proven for normalization of elevated fasting glucose.

High-quality, low-cost solutions adapted to the local context are critical to addressing the current crisis. Herein we examine the effectiveness of a polyherbal medication, based on the ancient Indian practice of Ayurveda, in the reduction of hyperglycemia in patients with newly diagnosed type 2 diabetes or prediabetes and at two multispecialty hospitals in India.

Holistic medicine is gaining more importance in the treatment of chronic conditions. It is trying to prevent the disease and better the quality of life and health by connecting body, mind and spirit [6]. Ayurveda encourages the practice of emphasizing harmony in the body and cleansing the body of substances that can cause disease [7].

Nevertheless, the most significant reduction in diabetes incidence has been achieved with diet and exercise [8]. Moreover, since Ayurveda-Indian ancient medical traditions- is working on human health by a combination of knowledge, practice and medicine [6].

The present study tested the effectiveness of a polyherbal medicine through a randomized double blinded placebo controlled clinical trial to determine its efficacy and safety in patients with newly diagnosed type 2 diabetes or having laboratory confirmed prediabetes.

Methods

Study Design and Participants

This was a double-blind, two-arm, multicentre placebo controlled randomized trial two sites in India; Mazumdar Shaw Medical Centre Bangalore and KRM Hospital, Lucknow. The trial was designed by Department of Clinical Research at Narayana Health, Bangalore. Ramdomisation support was offered by the Department of Biostatistics at St John’s Medical College and the statistical analysis plan was further verified by data scientists at Boston Children’s Hospital, Boston, MA. The trial participants were randomised under 2 strata based upon their diagnosis; prediabetes or diabetes.

Eligible participants both male and non-pregnant female subjects, 30 years of age or older diagnosed with prediabetes or Type II diabetes by one of four methods: fasting glycaemia >6.9 mmol/L, or a 2 hour post-prandial glycaemia >11.1mmol/L post 2 hour oral glucose tolerance test, or a glycosylated hemoglobin (HbA1c) ≥ 6.5%, or patients with an episode of classic symptoms of hyperglycaemia or hyperglycaemic crisis and a single random glycaemia of >11.1mmol/L in the last 12 months were included .

Eligible participants were excluded if they reported a history of diabetes onset more than 24 months from the date of randomization or reported treatment with any oral hypoglycemic agents (other than Metformin) or insulin, or with any history suggestive of microvascular or macrovascular disease. Additional exclusion criteria included impaired renal function defined as eGFR less than 60 ml/min/1.73m2, blood pressure fluctuations exceeding 10 mmHg on two subsequent clinic visits or known history of hypotension or bradycardia in last 6 months or taking 2 or more antihypertensive medications regularly in the last 6 weeks.

Additionally, women of childbearing age who were unable to use any form of contraception, and any participant participating in another clinical trial with an active intervention or drug or device within the last 60 days, any current or former employees of Organic India Company which manufactures the polyherbal medicine, and any subject refusing consent or unable to commit to treatment adherence were excluded.

Ethical Consideration

This study was approved by the institute ethics committee at Mazumdar Shaw Medical Center (approval number NHH/AEC_RC_2016-078(B) and at KRM Hospital, Lucknow (approval number IEC/02/19/17). The study was conducted in accordance with the International Conference on Harmonization guidelines for Good Clinical Practice (ICH E6); The Code of Federal Regulations on the Protection of Human Subjects (45 CFR Part 46); and The AYUSH Guidelines for Good Clinical Practices. Written informed consent was obtained from all the participants before entry in the study. All potential participants were given a study information sheet and were informed about the protocol procedures, the frequency of follow up and total study duration. All personnel involved in the conduct of this study completed human subject’s protection training.

Randomization and Masking

All eligible subjects were stratified into two groups by block randomization based on the diagnosis of either prediabetes or diabetes. Research personnel randomised participants via a digital randomization phone service at the coordinating center situated at the Department of Clinical Research at Narayana Health, Bangalore, India. Randomization codes were generated by an independent statistician. Packed, blinded medication with a unique number was sent to the recruiting sites. Once randomization was assigned to the treatment or control groups, site personnel received a drug code and issued blinded medications to the patient. The treatment and placebo capsules were identical and packed in identical packaging.

Procedures

The population for the study was derived from subjects referred to KRM Hospital and Research Centre in Lucknow and Mazumdar Shaw Medical Center of Narayana Health Center. Participants were screened for eligibility based on inclusion criteria at executive health checkup clinics, outpatient specialty clinics, and from existing records in the two hospitals. Additionally, caregivers accompanying subjects coming to clinic visit were also invited to participate.

The intervention is a popular polyherbal capsule Sugar Balance® (sugar balance) which is manufactured by Organic India.The active capsule contains a combination of 3 whole herbs: Coccinia indica, Bougainvillea spectabilis and Madagascar periwinkle (sadabahar) of 250 mg having organic certification (ORG/SC/1310/001378) by Control union. The batch number was VX-262 and medication series 358. All three products were as per the organic category of NPOP-Organic Standard of India (National Programme for Organic Production) and NOP-Organic Standard of US (National Organic Programme).

The placebo capsule contained only starch powder of 250 mg, the batch number VX-269 and Medication Series 468. As a standardized approach both the active and placebo products were similar looking Opaque capsules.

Participants were instructed to take two capsules twice a day at a fixed time in the day. Capsules were prescribed to be taken orally after food. There were no diet restrictions, but the subjects had to maintain a diet diary for the entire duration of the study to assist in 24-hour dietary recall. They were stratified as diabetes or prediabetes. All diabetes subjects were allowed to be on standard doses of biganides (metformin) as per clinician choice. All prediabetes subjects were not taking any standard medications for lowering blood sugar but received standard lifestyle recommendations. During the six-month study period, participants had a total of 8 clinical visits during which data were collected: baseline at 0 weeks, follow-up at 2 weeks, 4 weeks, 8 weeks, 12 weeks, 16 weeks, 20 weeks, and at 24 weeks.

All participants were given ADA-guided lifestyle advice with free nutrition counselling at each visit. During the study period, the subjects were called every month with reminders about upcoming follow-up clinic visits.

Laboratory procedures were conducted locally in National Accreditation Board for Laboratories of India (NABL) accredited laboratories for study subjects during their scheduled visits, all outcome measures were collated and sent to the data management center.

Study Endpoints

A reading of fasting glycaemia of more than 6.9 mmol/L or an HbA1c value of more than 6.5% is the primary criteria for the diagnosis of type 2 diabetes. Prediabetes is defined as fasting glycemia 5.6 to 6.9 mmol/L. The primary outcome for prediabetes was proportion of subjects achieving a target fasting glycemia of <5.6mmol/L. Safety parameters considered as any significant (2x) change in renal function and hepatic function at any of the follow up visits and at end of the study treatment period.

Statistical Analysis

The main outcome measures, HbA1c and fasting glycemia were measured at baseline, 90 days (12 weeks) and 180 days (24 weeks) after randomization. Analysis of study data was done using R software version 3.4.4. A secondary analysis was performed after stratification by diabetes status. We used a two-sample t-test and linear regression model to compare numerical variables between the intervention and control groups. A paired t-test was used to compare within-group variables. A Chi-square test was used for categorical variables. All testing was done at a significance level of alpha = 0.05.

Data scientists based in Boston children’s hospital Boston, MA, prepared the analysis plan, and validated the statistical analysis performed by statisticians of Narayana Hrudayalaya.

The analysis was simultaneously done by 2 independents data scientists from India and Boston and the final results were compared.

Data Management Process and Software Used: The data was collected via electronic data source application. Using an Apple Ipad to capture data offline. The application was designed by CliniOps, Inc based upon the data dictionary created by trial scientific expert committee. The software was validated to ensure the proper functioning of application. The application can be used both offline and online and can be accessed on the Web. Data was entered by authorized and trained clinical trial coordinators only.

All the data was collected real time during each visit on to the CliniOps Trial Application version 94.0(electronic CRF) installed on an Apple Ipad 2 offline and synchronized to a cloud server when connected to the internet.

Results

Between December 14th, 2016 and 28th August 2017, 200 subjects were screened at two hospitals in India. 122 subjects were randomised, but 1 subject withdrew consent from trial without taking any medications. 121 subjects were included in the intention to treat analysis. All follow up was completed on 16th December 2017.

The baseline characteristics were comparable between the subjects who received active versus placebo. The average age of the subjects who took active SB was 46.5 (±9.8) years, 93.3% subjects were young <65 years of age. 48.3% (29) were males, 61.6% (37) individuals were either pita-kapha or kapha-vata prakruti as per the ayurvedic phenotype classification.

Out of 60 subjects in the intervention group, 8 lost to follow up. Among them, 3 subjects were from prediabetic and 5 subjects were diabetic. Of the 61 control subjects, 8 were lost to follow up visit. Out of this, 2 subjects were prediabetic and 6 subjects were diabetic. The trial profile of study subjects is represented in figure 1.

EDMJ 2019-107 - ALBEN SIGAMANI India_F1

Figure 1. Participant flow diagram for Sugar Balance.

EDMJ 2019-107 - ALBEN SIGAMANI India_F2

Figure 2. Comparison of HbA1c (>6.5%) in diabetic group.

EDMJ 2019-107 - ALBEN SIGAMANI India_F3

Figure 3. Comparison of Fasting Blood Glucose (>=100 mg/dl) in Prediabetes Group

At 6 months type 2 diabetes subjects allocated to active arm had a mean reduction of HbA1c of -0.52% versus -0.43% among placebo arm (difference of -0.09% 95% CI -0.1705 – -0.0095). 13 (52%) versus 4 (15.4%) prediabetes subjects receiving the polyherbal achieved normalization of impaired fasting glycaemia (<100 mg/dl) (difference of 36.6% 95% CI 10.683 – 56.805).

Table 1. Characteristics of the study participants at baseline level.

Characteristics

Intervention Group

Placebo Group

P value

Age(yr)

46.53 ± 9.8

48.07 ± 9.7

0.390

Sex

Male

29 (48.3)

29 (47.5)

0.930

Female

31 (51.7)

32 (52.5)

BMI (kg/m2)

29.70 ± 4.6

29.80 ± 5.2

0.908

Diastolic Blood Pressure (mm Hg)

82.71 ± 8.5

80.71 ± 9.7

0.249

Systolic Blood Pressure (mm Hg)

135.13 ± 15.1

132.49 ± 17.8

0.381

Fasting Blood Glucose(mg/dl)

6.61 ± 1.2

6.66 ± 1.0

0.809

HbA1c (%)

6.61 ± 1.2

6.66 ± 1.0

0.809

Diagnosis

Diabetes

32 (53.3)

30 (49.2)

Pre diabetes

28 (46.7)

31 (50.8)

Family History of Diabetes

4 (6.7)

5 (8.2)

Hypertension

2 (3.3)

6 (9.8)

Metformin Usage

27 (45.0)

33 (54.1)

All the participants have Asian ethnicity.

None of the participants have used oral hypoglycemic agents and insulin.

Table 2. Comparison of the mean FBG and HbA1c before and after the intervention among the intervention and the placebo groups.

Group

Measures

Intervention Group

Placebo Group

Prediabetics

N

Mean

(SD)

P-Value*

N

Mean

(SD)

P-Value*

FBG (mg/dl) – Baseline

15

109
(6.67)

0.021

18

111.05
(6.64)

0.3

FBS (mg/dl)- 3-month visit

15

102.3
(8.67)

0.81

18

112.5
(7.06)

0.23

FBG (mg/dl) – End of Intervention

15

101.05
(6.53)

0.011

18

112.5
(9.21)

0.48

Diabetics

HbA1c (%)- Baseline

26

7.47(1.1)

0.0019

24

7.38
(0.67)

0.014

HbA1c (%)- 3 month

26

6.89(1.1)

0.74

24

7.03
(0.73)

0.79

HbA1c (%)- End of Intervention

26

6.94(1.1)

0.014

24

7.06
(0.72)

0.033

*p-value was calculated based on Paired t-test

Table 3. Fasting Blood Glucose at Day 180 for Prediabetes

End of Study Treatment Visit FPG (Prediabetes)

Group

Total

Intervention

Placebo

Count

%

Count

%

Count

%

< 100

13

52.0

4

15.4

17

33.3

> 100

12

48.0

22

84.6

34

66.7

Total

25

100.0

26

100.0

51

100.0

p = 0.008

Safety

All participants were monitored for Adverse Events (AE’s) and Serious Adverse Events (SAE’s) throughout the trial. The distribution of unsolicited AE’s who were administered the active treatment i.e. diabetic participants who were on metformin was 4(14.81%) of 27 and prediabetic was 3(12%) of 25.

The distribution of unsolicited AE’s who were administered the placebo treatment i.e. diabetic participants who were on metformin was 3(11.11%) of 27 and prediabetic was 2(7.69%) of 26. The AE’s reported are Gastrointestinal (GIT) symptoms and dizziness in the diabetic participants and weakness, joint pains and headache in the prediabetic participants in the active and placebo groups. No significant between-group differences were identified (p=1.0).

Using the Diabetes Trial and Safety of Metformin [9], as a reference for safety monitoring, we find that subjects who are diabetic and on the medication of Metformin have a similar AE’s reported i.e. Gastrointestinal (GIT) symptoms (28% in Metformin versus 16% in Placebo), Self-reported GIT problems (9.5% in Metformin compared to 1.1% in Placebo), Anaemia more common in subjects taking metformin (50 subjects) versus 38 subjects in Placebo group.

Discussion

India is home to 75 million people suffering from diabetes and an equally large percentage of those who have prediabetes [10, 11]. Our trial described in this report, used a randomised placebo controlled double blind study to analyze the effects of a polyherbal formulation in bringing about an improvement in glycemic control. Glycated hemoglobin is widely regarded as a standard for monitoring glycemic control in diabetes management. It reflects the mean plasma glucose over period of 120 days, and comprises of the level of blood sugar control in the last 25 days prior to the test. Its fasting value is reflection of the average plasma sugar in the fasting state and also the amplitude of the glycemic spikes occurring post prandial.

The trial participants diagnosed with diabetes were allowed to be on metformin which has an effect of lowering hyperglycemia through reduction of hepatic glucose production and decreased glucose absorption from the intestines. Subjects who received sugar balance along with metformin showed better glycemic control (HbA1c <0.5%) compared to those only on metformin. The polyherb did not decrease fasting glycaemia when compared to metformin alone. But among the prediabetes cohort, those who were only on sugar balance achieved their target lowering of fasting glycaemia better than the placebo.

Sugar Balance® (SB) contains 3 whole herbs, Coccinia indica, Bougainvillea spectabilis and Madagascar periwinkle or Sadabahar. Coccinia indica has long been traditionally used in Ayurveda for diabetes care and has been studied in vivo extensively for its hypoglycemic effects10. Phytoconstituents in the plant like polyprenol, steroidalsaponins, and cucurbitane-type triterpenoids are known to intercept glucose metabolism [13]. Bougainvillea spectabilis has also shown antidiabetic properties via increasing glucose-6-phosphate dehydrogenase activity and promoting glucose uptake [14]. Madagascar perinwinkle usage for diabetes comes from the traditional period though its efficacy today has been proven through phytochemical analysis and in vivo research [15]. For example, four alkaloids identified in the plant induce significantly high glucose uptake in pancreatic β-TC6 cells [16].

There is a limited clinical trial information on hypoglycemic effects of individual components of Sugar Balance formulation in Prediabetes and Diabetes patients. Furthermore, proper randomised controlled trial is lacking with all of the polyherbs in combination. Coccina Indica and D-Pinitol isolated from Bougainbellia has been tested for hypoglycemic effect in Humans [12, 17–19]. The Vinca rosea extract is known to have anti-inflammatory properties and hypoglycemic effect in animal models but hypoglycemic action is not tested in clinical trial.

According to a popular textbook published by a Clinical Pharmacologist, Dr. Narendra Singh the potential mechanism of action of Sugar Balance are delayed absorption of glucose, regulation of glucose metabolism as well as improvement in glucose tolerance test [20].

The strengths of this trial is the mimicking of current practice of treating new onset type 2 diabetes with biguanides and prediabetes with just lifestyle and diet. This randomised double-blind placebo-controlled trial, has clinical relevance by proving improvement in glycated hemoglobin among those with type 2 diabetes and increasing the proportion of achieving fasting glycemic control in 6 months. Unlike other trials that have tested the effects of a herbal preparation, this trial tested the intervention along with a standard of care regimen of metformin. The synergistic effect of combining the polyherb with metformin did not increase the risk of hypoglycemia (none reported in the trial). It is important for add-on therapies to help improve glycemic control and not increase the risk of hypoglycemia or cause significant drop in fasting blood sugar. This has been shown to improve long term benefits in diabetes and improves compliance to therapy.

Limitations of this study include the relatively short duration (24 weeks). A longer study might have provided the long-term effect of the combination. However, guidelines limit placebo-controlled trials to 6 months duration. The treatment effect was not significantly different from the placebo group in patients with type 2 diabetes. Probable cause will have been physician preference and patient preference in dose of metformin used through the trial. Also, the lower baseline parameters compared to most other trials could have mitigated the probable greater fall in HbA1c in a short period. Further studies in this population can be done for seeing efficacy in combination with other oral hypoglycemic agents and also those with moderate to poor control of diabetes.

Conclusion: In conclusion, the result of the present study suggest that Sugar Balance has a potential hypoglycemic action which increases insulin production and decreases the amount of glucose in the blood, and thus could represent a possible preventative treatment strategy for prediabetes as well as new onset type 2 diabetes patients.

Financial Disclosure:Organic India Pvt Ltd are the sponsors of the study, they have funded and contributed to all aspects of the study, and were not involved in any stage of the conduct and analysis of this study, including study design, data collection, data analysis, data interpretation, and writing of the report. All authors had full access to all the data in the study and had final responsibility for the decision to submit for publication.

Conflicting Interest: The corresponding author declares that he had full access to the data and complete control on the analysis and publication of its results. He declares having received grants from organic India to carry out this project. He or his family members do not have any financial holding with the company. Other authors except Dr Subramanian Kanan, did receive remuneration from this grant provided by Organic India. Haleh and Leva has no conflict of interest to declare.

References

  1. International Diabetes Federation IDF (2017) Diabetes Atlas, 8 edn. International Diabetes Federation: Brussels, Belgium, 2017.
  2. Sathasivampillai SV, Rajamanoharan PRS, Munday M, Heinrich M (2017) Plants used to treat diabetes in Sri Lankan Siddha Medicine – An ethnopharmacological review of historical and modern sources. J Ethnopharmacol 198: 531–599. [crossref]
  3. Vos T (2016) Global, regional, and national incidence, prevalence, and years lived with disability for 310 diseases and injuries, 1990–2015. The Lancet 1545–1602.
  4. Kaveeshwar SA, Cornwall J (2014) The current state of diabetes mellitus in India. Australas Med J 7: 45–48. [crossref]
  5. Ezzati PM (2016) Worldwide trends in diabetes since 1980: a pooled analysis of 751 population-based studies with 4•4 million participants. The Lancet 1513–1530.
  6. Frank NJ (2010) Ayurveda: A Comprehensive Guide to Traditional Indian Medicine for the West. Rowman & Littlefield Publishers.
  7. Barnes P, Bloom B, Nahin R, & National Center for Health Statistics (2008) Complementary and alternative medicine use among adults and children: United States, 2007 (National health statistics reports; no. 12). Hyattsville, MD: U.S. Dept. of Health and Human Services, Centers for Disease Control and Prevention, National Center for Health Statistics.
  8. Kessler, Wischnewsky, Michalsen, Eisenmann, & Melzer (2013) Ayurveda: Between Religion, Spirituality, and Medicine. Evid Based Complement Alternat Med 2013, 11.
  9. Bray G, Edelstein S, Grandall J, Aroda V, Franks P (2012) Long-Term Safety, Tolerability, and Weight Loss Associated With Metformin in the Diabetes Prevention Program Outcomes Study. Diabetes Care 35: 731–737.
  10. Anjana RM, Deepa M, Pradeepa R, Mahanta J, Narain K, Das HK, et al. Prevalence of diabetes and prediabetes in 15 states of India: results from the ICMR-INDIAB population-based cross-sectional study. The Lancet Diabetes & Endocrinology. 2017;5: 585. [crossref]
  11. Dasappa H, Fathima FN, Prabhakar R, Sarin S. Prevalence of diabetes and pre-diabetes and assessments of their risk factors in urban slums of Bangalore. J Family Med Prim Care. 2015;4(3): 399–404. [crossref]
  12. Azad Khan AK, Akhtar S, Mahtab H (1979) Coccinia indica in the treatment of patients with diabetes mellitus. Bangladesh Med Res Counc Bull 5: 60–66. [crossref]
  13. Kaushik U, Aeri V, Showkat RM, Ali M (2017) Cucurbitane-Type Triterpenoids from the Blood Glucose-Lowering Extracts of Coccinia indica and Momordica balsamina Fruits. Pharmacogn Mag 13: 115–121.
  14. Bhat M, Kothiwale SK, Tirmale AR, Bhargava SY, Joshi BN (2011) Antidiabetic Properties of Azardiracta indica and Bougainvillea spectabilis: In Vivo Studies in Murine Diabetes Model. Evid Based Complement Alternat Med 2011: 561625.
  15. Das S, Sharangi AB (2017) Madagascar periwinkle (Catharanthus roseus L.): Diverse medicinal and therapeutic benefits to humankind. J Pharmacogn Phytochem 6: 1695–701.
  16. Tiong SH, Looi CY, Hazni H, Arya A, Paydar M, et al. (2013) Antidiabetic and antioxidant properties of alkaloids from Catharanthus roseus (L.) G. Don. Molecules 18: 9770–9784. [crossref]
  17. Kuriyan R, Rajendran R, Bantwal G, Kurpad A V (2008) Effect of Supplementation of Coccinia cordifolia Extract on Newly Detected Diabetic Patients. Diabetes Care 31: 216–220.
  18. Kim HJ, Park KS, Lee SK, et al. (2012) Effects of Pinitol on Glycemic Control, Insulin Resistance and Adipocytokine Levels in Patients with Type 2 Diabetes Mellitus. Ann Nutr Metab 60: 1–5.
  19. Hernández-Mijares A, Bañuls C, Peris JE, et al. (2013) A single acute dose of pinitol from a naturally-occurring food ingredient decreases hyperglycaemia and circulating insulin levels in healthy subjects. Food Chem 141: 1267–72.
  20. Singh N, Gilca M (2010) Herbal medicine. Saarbrucken, Germany: Lambert Academic Pub.

Dalteparin Induced Skin Necrosis in a Patient Following Pelvic Floor Repair Surgery

DOI: 10.31038/EDMJ.2019321

Abstract

Low Molecular Weight Heparin (LMWH) is commonly used as prophylaxis in the post-op surgical patients but very few adverse effects have been reported. Skin Necrosis is a rare side-effect of Dalteparin therapy and makes up 0.28% [1] of all the reported side effects from its use. This paper focuses on the conservative management of such a case.

Introduction

Dalteparin is commonly used because of its once daily dose for venous thromboembolism prophylaxis with no adjustment required for the weight of the patient. It mainly acts by interacting with the factor Xa and IIa [2]. Skin necrosis has rarely been reported and most cases present within one month1 of its use and lesions can heal very quickly once the drug has been stopped [3].

The precise mechanism still remains unclear but multiple mechanisms of hypersensitivity have been proposed which include [4]

  • Cell mediated hypersensitivity to heparins evidenced by formation of plaques
  • Immediate hypersensitivity to heparins appear as palmoplantar pruritis after subcutaneous injections
  • Eosinophilia
  • Formation of antibodies (Heparin Platelet Factor 4 antibodies) has been linked mostly to the heparin induced thrombocytopenia and cause skin necrosis similar to coumarins.

Skin and provocation tests are contraindicated in patients who have developed skin necrosis or heparin induced thrombocytopenia [4].

Case Report

71 year old patient with a background history of Deep Vein Thrombosis, Pulmonary Embolism and previous Hystrectomy was admitted for a routine Anterior Colporraphy and Posterior Colpo-perineorraphy. As per NICE recommendation she was started on Dalteparin injection for venous thromboembolism prophylaxis 6 hours after surgery. On post-op day three, patient developed painful skin discoloration on both dalteparin injection sites and examination revealed lesions measuring 1.5x2cm and 2×2.5cm on either side of the umbilicus respectively. They were warm to touch with surrounding erythema however patient was apyrexial and systemically well. See Figure 1.

EDMJ 2019-108 - Najeeb Shah England_F1a

Figure 1a

EDMJ 2019-108 - Najeeb Shah England_F1b

Figure 1b

Blood work revealed a platelet count of 679/l thus ruling out LMWH induced thrombocytopenia and other relevant blood tests revealed; Haemoglobin 155g/l, White cell count 9.7 × 10⁹/l, International Normalized Ratio 1.0 with completely normal electrolytes. Patient was not taking any antiplatelet or any other anticoagulant at the time. Patient was treated with Loratidine 10mg OD and Ibuprofen 400mg TDS. On post-op day 4, the necrotic area started to develop a blister but the skin on the top remained intact. Patient was advised to keep them covered with sterile gauze pieces so as to prevent the rupture of the blister.

On post-op day 13, patient was reviewed again and examination showed that the lesions were settling down, the one on the right side of the umbilicus had started to reduce in size without any scarring whereas the one on the left was still dark blackish in colour but the surrounding erythema and bruising had settled. Throughout the recovery process patient remained afebrile and only needed paracetamol and ibuprofen for pain control. See Figure 2.

EDMJ 2019-108 - Najeeb Shah England_F2a

Figure 2a

EDMJ 2019-108 - Najeeb Shah England_F2b

Figure 2b

Discussion

According to the 2018 NICE guidelines any patient undergoing abdominal surgery should receive low molecular weight heparin for a minimum of 7 days if the venous thromboembolism (VTE) risk outweighs the risk of bleeding3 in conjunction with anti-embolism stockings which produce a pressure of 15-20mmHg at calf until they no longer have reduced mobility [5]. The ACOG and ACCP guidelines state that in case of moderate risk of thromboembolism chemical prophylaxis should be given until the day of discharge [6]. In case of our patient the reduction in mobility was only for the time they remained inpatient for the above mentioned elective procedure and therefore was discharged without a prescription for further LMWH therapy however was advised to keep the anti-embolism stockings on for a period of four weeks. There have been sporadically reported cases of LMWH induced skin necrosis however a life-threatening association of LMWH is Heparin Induced Thrombocytopenia (HIT) which in our case was ruled out by checking the platelet count as soon as the skin lesions were reported on post-op day three and then re-checked on day 8. The following chart was used to assess the risk of HIT (guidance from British Haematology) [7]

Points (0, 1, or 2 for each of 4 categories: maximum possible score = 8)

2

1

0

Thrombocytopenia

>50% fall and platelet nadir ≥20 × 109/l

30–50% fall or platelet nadir 10–19 × 109/l

Fall <30% or platelet nadir <10 × 109/l

Timing_* of platelet count fall or other sequelae

Clear onset between days 5 and 10; or ≤1 d (if heparin exposure within past 30 d)

Consistent with immunization but not clear (e.g. missing platelet counts) or onset of thrombocytopenia after day 10; or fall ≤1d (if heparin exposure 30–100 d ago)

Platelet count fall ≤4 d (without recent heparin exposure)

Thrombosis or other sequelae (e.g. skin lesions)

New thrombosis; skin necrosis; post-heparin bolus acute systemic reaction

Progressive or recurrent thrombosis; erythematous skin lesions; suspected thrombosis not yet proven

None

Other cause for thrombocytopenia not evident

No other cause for platelet count fall is evident

Possible other cause is evident

Definite other cause is present

The diagnosis of skin necrosis was made on clinical grounds however to confirm the findings, skin biopsy/histology is recommended [4]. In our case we did not do a biopsy nor tested for antibodies as the patient was systemically well and did not develop thrombocytopenia. The option to involve Plastic surgeons in view of possible worsening of necrosis and skin breakdown which might have required skin graft was considered. The safe alternatives to Low Molecular Weight Heparin (such as enoxaparin and dalteparin) are fondaparinux and unfractionated heparin [8] which is an ultra-LMWH and its cross-reactivity to dalteparin is rare [4].

It should be noted that our patient has had deep vein thrombosis and pulmonary embolism following a coronary angiogram in year 2000 for which she received warfarin for one year and had hysterectomy in 2012 for which she did have dalteparin injections for 10 weeks and developed similar lesions and didn’t seek any medical attention at that time as not all the injection sites developed the reaction and these were not as large and painful as the current ones. This suggests that she might have developed sensitivity to LMWH and had an exaggerated response to re-exposure.

Conclusion

Skin necrosis has an association with Heparin Induced Thrombocytopenia and should be investigated as it can be life threatening. Fondaparinux and Unfractionated Heparin can be considered for chemical thromboprophylaxis as safe alternate options in high risk cases. Prompt treatment with Non-steroidal anti-inflammatory agents together with anti-allergics and simple analgesia should be instituted. Early involvement of Dermatologists and Plastic Surgeons should be considered if tissue damage is extensive. In cases of previous skin reactions to LMWH therapy subsequent therapy with a similar agent should be avoided as the spectrum of subsequent reaction may be worse as demonstrated with our case. We do not recommend the use of Antibiotics unless there is clear clinical and biochemical evidence of superadded soft tissue infection.

References

  1. Fragmin and Skin necrosis – from FDA reports. April 2018.
  2. Nutescu EA, Burnett A, Fanikos J, Spinler S, Wittkowsky A (2016) Pharmacology of anticoagulants used in the treatment of venous thromboembolism. J Thromb Thrombolysis 41: 15–31. [Crossref]
  3. Katsourakis A, Noussios G, Kapoutsis G, Chatzitheoklitos E (2011) Low Molecular Weight Heparin-Induced Skin Necrosis: A Case Report. Case Reports in Medicine 2011:  857391
  4. Bircher AJ, Harr T, Hohenstein L, Tsakiris DA (2006) Hypersensitivity reactions to anticoagulant drugs: diagnosis and management options. Allergy 61: 12
  5. Venous thromboembolism in over 16s: reducing the risk of hospital-acquired deep vein thrombosis or pulmonary embolism. March 2018.
  6. Shaw HA, Shaw JA. Thromboembolism in Gynecologic Surgery. March 2016.
  7. Watson H, Davidson S, Keeling D. Guidelines on the diagnosis and management of heparin-induced thrombocytopenia: second edition. October 2012.
  8. Coelho J, Izadi D, Gujral S (2016) Enoxaparin Induced Skin Necrosis. Eplasty 16: 40

Effects of a New Combination of Cranberry Extracts, D-Mannose and GAGs for the Management of Uncomplicated Urinary Tract Infection

DOI: 10.31038/EDMJ.2019315

Abstract

Objective: Several studies have investigated the role of cranberry extract and D-mannose in the prevention of recurrent urinary tract infections (UTIs). The aim of this preliminary study was to test whether the use of a new dietary supplement (UROIALTM sachets) containing cranberry extracts (S&R PACs), D-mannose, hyaluronic Acid and Glucosamine Chondroitin may reduce the incidence of episodes of cystitis and improve urinary symptoms.

Methods: In this prospective comparative study, 40 women with an acute diagnosis of cystitis received a single sachet of Fosfomycin Tromethamine (3gr). The subjects were then randomly assigned to two groups: Group A: 20 women were given UROIALTM, 2 sachet per day during the first 7 days, then 1 sachet per day for two weeks; Group B: 20 women did not receive any treatment to serve as a control group.

Results: The results of the present study showed a complete remission of urinary symptoms in 37 women, a slight decrease in urinary symptoms was observed in 2 subjects, whereas 1 woman who stopped the treatment was considered a drop-out. Patients in Group A had a lower incidence of episodes of recurrent cystitis during treatment and follow-up; urine samples had significantly lower median bacterial load compared to baseline as well as a symptomatic relief was reported in treated subjects despite the control group.

DISCUSSION: Several studies have investigated and demonstrated the role of cranberry extracts in the prevention of recurrent urinary tract infections (UTIs), on different selected subpopulations and even at increased risk of UTI. Even the use of D-mannose, a natural sugar has proven to have clinical benefit, although clinical data is limited. A randomized placebo-controlled non-blinded clinical trial has shown that a daily dose of 2 g d-mannose was superior to placebo in preventing UTI. Mannose receptors are found on uroepithelial cells lining the urinary tract they constitute the protective mucopolysaccharide layer of the bladder. The mechanism of action involves binding of the mannose receptors to E. coli pili, thus preventing both adhesion to and invasion of urothelial cells. The interaction between mannose molecules and E. coli bacteria can then be washed away with urine voiding.

CONCLUSIONS: Our data indicate that the addition of GAGs (hyaluronic acid and chondroitin sulfate) to cranberry/D-Mannose containing products could represent a valid novel therapeutic approach for the treatment and/or prophylaxis of cystitis.

Keywords

Uncomplicated UTI, Cranberry, D-Mannose and GAGs

Introduction

Urinary Tract Infections (UTIs) are among the most common infectious diseases and almost exclusively caused by bacteria (1). UTIs refers to the presence of a certain number of bacteria in the urine (generally > 105/ml) and symptomatic UTIs are classified in order of severity as upper UTI, with infection in the kidney and lower UTI (cystitis) with bacteria into the bladder (1, 2). Clinically, UTIs classification comprises either uncomplicated or complicated cases, depending on the presence of structural or neurological urinary tract abnormalities (3). According to the latest data, UTIs affect nearly half of all women, and it is estimated that around 11% of women aged over 18 have an UTI each year (4–6).

Based on severity can also be classified as uncomplicated or complicated. This distinction is useful to guide the choice and duration of antimicrobial treatment. In particular, uncomplicated UTIs occur in patients with a structurally and functionally normal urinary tract. In contrast, complicated UTIs are characterized by functional or anatomical abnormalities within the urinary tract (7).

Recurrent UTIs occur more commonly in healthy women who have anatomically and functionally normal urinary tracts (8).

In uncomplicated cases, recurrent UTIs are treatable with a short-course of antibiotics, but the inappropriate use of these antimicrobial agents has been accompanied by the rapid spread of resistant bacterial strains (9). The prevalent pathogenic bacteria that cause UTIs are Gram-negative pathogens and the most frequently isolated bacterial strain is Escherichia coli, representing >80% of infections (10,11).

Bacterial cystitis (also called acute cystitis) can occur in both women and men and some people develop recurrent infections of the urinary tract (12). Three or more urinary tract infections within 12 months define the recurring UTI, as well as two or more recurrences within 6 months. The same bacterial species that caused previous infection is typically responsible for relapses. Approximately 20–30% of adult women with an initial UTI will experience a recurrence within 3–4 months.

The aim of this preliminary study was to verifying whether the use of a new dietary supplement (UROIALTM sachets) containing type-A proanthocyanidins (S&R PACs), D-mannose, hyaluronic Acid and Glucosamine Chondroitin can be of use in reducing the incidence of episodes of recurrent cystitis and the elimination of urinary symptoms.

Material and Methods

Study Design

A randomized parallel group intervention trial was designed to evaluate the prophylactic effects of a novel formulation of cranberry extracts combined with d-mannose and hydronic acid on female subjects with a history of recurrent UTIs presenting with uncomplicated cystitis. Of 42 eligible women, two were excluded because they did not meet the inclusion criteria (Fig. 1). Thus, 40 women were randomly allocated and 20 treated with Cranberry, D-Mannose, Vitamin C and Hyaluronic acid; Group A. The duration of the intervention was 12 weeks and the end of follow-up was 3 months after the start of treatment. All participants attended regular clinical appointments.

EDMJ 2019-105 - Stefano Manno Italy_F1

Figure 1. Flow diagram of enrolment, intervention allocation and data analysis.

Subjects

Eligible subjects were all adult Caucasian females affected by acute uncomplicated cystitis and all had a history of recurrent UTIs. The participants were enrolled (recruitment and treatment) between August 2017 and December 2017 and after antibiotic treatment with Fosfomycin 1 sachet (UROFOS®), were randomly assigned to the two different groups. The inclusion criteria were as follows: (1) two or more episodes of UTI in the last 12 months documented by urine culture; and (2) at least one urinary symptom and/or positive urinary nitrate test or leukocyturia. Women were ineligible if any of the following criteria were present:

(1) pregnancy or lactation; (2) abnormalities of the upper urinary tract, including the presence of urinary stones; (3) a permanent urinary catheter; (4) complete urinary incontinence; (6) stage 5 chronic kidney disease (glomerular filtration rate (GFR) < 15 ml/min). The study took place at the University of Magna Graecia (CZ), Italy.

Nutraceutical Administration

The tested compound is a commercially available as a dietary supplement marketed in Italy, UROIAL (S&R Farmaceutici S.p.A, Bastia Umbra, Perugia, Italy) containing the following ingredients per dose respectively: S&R PACs (250mg) with type-A proanthocyanidins (72 mg), d-mannose (1000 mg), chondroitin sulfate (200mg), vitamin C (120 mg) and hyaluronic acid (100mg). Patients were advised to take 2 sachets for 2 weeks and one sachet for another two weeks.

Laboratory Assessments

Urinalyses and cultures were performed using standard methods, as previously described (13). Diagnosis of UTIs was based on 105 colony-forming units (CFU) in 1 ml of urine sample. Urinary specimens were streaked for isolation on MacConkey agar and blood agar plates for bacterial separation. Positive urine culture results, Gram staining and morphology of pre-dominant colonies were defined according to the guidelines of the Clinical and Laboratory Standards Institute (CLSI).

Statistical analysis

Clinical data (bacterial count) were analysed by the non-parametric One-Way ABnova Analysis. p value < 0.05 was considered statistically significant.

Results

The study included a total of 40 women with acute cystitis and a history of recurrent cystitis episodes. All but one patient had a complete remission of urinary symptoms after antibiotic treatment with fosfomycin. A slight decrease in urinary symptoms was observed in 2 subjects, whereas 1 woman who stopped the treatment was considered a drop-out. In fact, 38 women participants completed the 12-week intervention period (flow diagram). Table 1 shows the number of symptomatic episodes and number of recurrences recorded during the observation period starting from week 4. Patients in Group A had a lower incidence of episodes of recurrent cystitis during treatment and follow-up and urine samples had a significantly lower median bacterial load compared to baseline. Group A showed a greater number of negative urine cultures compared to group B. Indeed, a higher microbial count (105 and/or >105 CFU/ml) was more frequently observed in the urine cultures of group B (Table 2). Complete symptomatic relief was reported in the majority (85%) of patients in Group A while only 10 % was reported by subjects in the untreated control group.

Table 1. Number patients with symptomatic episodes and recurrences of cystitis during follow-up (12 weeks)

Symptomatic episodes

Recurrences

4 weeks

12 weeks

4 weeks

12 weeks

Group A

1 (20)

3 (20)

0 (20)

0 (20)

Group B

5 (19)

17(19)

2(19)

3 (19)

Table 2. Positive E.coil bacterial Counts during follow-up 12 weeks.

Baseline

12 weeks

Group A

15 (20)

1 (20)*

Group B

16(19)

10 (19)

Discussion

Several studies have investigated and demonstrated the role of cranberry extracts in the prevention of recurrent Urinary Tract Infections (UTIs), on different selected subpopulations and even at increased risk of UTI (14). Cranberries contain a high content of type A pro-antho-cyanidins whose urinary metabolites interfere with the adhesiveness of uro-pathogenic bacteria to the bladder epithelium, thus preventing adherence of bacteria to the bladder lining (15, 16). They are not as effective as antibiotics and have variable intestinal absorption (17). One RCT showed that both cranberry tablets and juice were able to significantly reduce the proportion of women experiencing rUTI over the 12 months compared with placebo (18% vs. 32%) (18). A Cochrane database systematic review updated in 2012 looked at 4,473 participants (19). It showed that there was no significant reduction in the occurrence of symptomatic UTI overall or for any subgroups tested (20). These included children, the elderly, women, pregnant women, cancer patients, neuropathic bladder patients or spinal patients. The review concluded that with additional studies included the evidence for cranberry juice in preventing UTIs was less than previously thought. There were, however, three studies that showed cranberry products were equivalent to antibiotics in preventing UTIs, with less side effects. These were limited by the lack of standardization between tablets and powders and the limitations associated with lack of information about the active ingredient present in each sample. No recommendations were able to be made.

Even the use of D-mannose, a natural sugar has proven to have clinical benefit, although clinical data is limited. A randomized placebo-controlled non-blinded clinical trial has shown that a daily dose of 2 g d-mannose was superior to placebo in preventing UTI (21). Mannose receptors are found on uroepithelial cells lining the urinary tract they constitute the protective mucopolysaccharide layer of the bladder. The mechanism of action involves binding of the mannose receptors to E. coli pili, thus preventing both adhesion to and invasion of urothelial cells. The interaction between mannose molecules and E. coli bacteria can then be washed away with urine voiding (2, 21, 22).

Vitamin C can acidify urine and has been weakly associated with decreased risk of UTI (23). There is data to suggest that vitamin C can also have a bacteriostatic effect and be effective in treatment and prevention of UTI in pregnant women (24).

Moreover, recently several non-antimicrobial options for rUTIs have been introduced, such as oral or Intra-vesical instillation of glycosaminoglycans (GAGs), which are able to strengthen bladder defense mechanisms. In particular intravesical administration of these GAGs, in particular hyaluronic acid (HA) and chondroitin sulfate (CS), have proven to be successful for both interstitial and recurrent bacterial cystitis (25–27). Glycosaminoglycan (GAG) layer replenishment con be exploited for many indications, including interstitial cystitis, overactive bladder syndrome, radiation cystitis and prevention of rUTI. At present, intra-vesical therapies are reserved for only those with the most unresponsive rUTIs (26). Previous studies by our research group looked at 57 women with rUTI and randomized them to either 50 mL of combination 1.6% hyaluronic acid and 2% chondroitin or treatment with 50 mL placebo. The treatment arm significantly reduced UTI rates over the 12-week follow-up (−86.6% vs. −9.6%) (28). Thus, a management plan including a combination of a non-antimicrobial and selective antimicrobial regime should be considered, such as a novel formulation under investigation in the present study.

Conclusion

Management of UTI should be individualized and symptom-based, but tends to follow a progressive therapeutic ladder. Clinicians should remember to include alternative therapeutics for support and management that should be aimed at improving quality of life (29).

This pilot study reveals that the nutraceutical formulation containing type A PACs from Cranberry extracts, D-Mannose, Vitamin C, Hyaluronic and Chondroitin sulfate (UROIAL®) is a valid therapeutic approach in reducing the incidence of episodes of recurrent cystitis and in the elimination of urinary symptoms. Our data indicate that the addition of GAGs to cranberry/D-Mannose containing products could represent a valid novel therapeutic approach for the treatment and/or prophylaxis of cystitis.

References

  1. Foxman B. Urinary tract infection syndromes: occurrence, recurrence, bacteriology, risk factors, and disease burden. Infect Dis Clin North Am. 2014; 28: 1–13.
  2. Smelov V, Naber K, Bjerklund Johansen TE. Diagnostic Criteria in Urological Diseases do not Always Match with Findings by Extended Culture Techniques and Metagenomic Sequencing of 16S rDNA. Open Microbiol J. 2016 Feb 29; 10: 23–6. doi: 10.2174/1874285801610010023. eCollection 2016.
  3. Zacchè MM, Giarenis I.Therapies in early development for the treatment of urinary tract inflammation. Expert Opin Investig Drugs. 2016; 25(5): 531–40. Epub 2016 Mar 24. Review.
  4. Foxman B, Brown P. Epidemiology of urinary tract infections: transmission and risk factors, incidence, and costs. Infect Dis Clin North Am. 2003; 17: 227–41.3
  5. Salvatore S, Salvatore S, Cattoni E, Siesto G, Serati M, Sorice P, et al. Urinary tract infections in women. Eur J Obstet Gynecol Reprod Biol. 2011; 156: 131–6.
  6. Tandogdu Z, Wagenlehner FM. Global epidemiology of urinary tract infections. Curr Opin Infect Dis. 2016; 29: 73–9
  7. Hooton TM. Clinical practice. Uncomplicated urinary tract infection. N Engl J Med. 2012; 366: 1028–1037.
  8. Glover M, Moreira CG, Sperandio V, Zimmern P. Recurrent urinary tract infections in healthy and nonpregnant women. Urol Sci. 2014; 25: 1–8.
  9. Pallett A, Hand K. Complicated urinary tract infections: practical solutions for the treatment of multiresistant.
  10. Hooton TM, Stamm WE. Diagnosis and treatment of uncomplicated urinary tract infection. Infect Dis Clin North Am. 1997; 11: 551–81.
  11. Stamm WE, Hooton TM. Management of urinary tract infections in adults. N Engl J Med. 1993; 329: 1328–34.
  12. Fiore DC, Fox CL. FP. Urology and nephrology update: recurrent urinary tract infection. Essent. 2014 Jan; 416: 30–7.
  13. Clinical and Laboratory Standards Institute (CLSI; formerly NCCLS). Urinalysis and Collection, Transportation, and Preservation of Urine Specimens; Approved Guideline. 2nd ed. Vol. 21. No. 19. Document Eur Urol. 2011 Apr; 59(4): 645–51. doi: 10.1016/j.eururo.2010.12.039. Epub 2011 Jan 18. Erratum in: Eur Urol. 2011 Jul; 60(1): 193. GP-16A2. Wayne (PA); 2001.
  14. Wing DA, Rumney PJ, Preslicka CW, Chung JH Daily cranberry juice for the prevention of asymptomatic bacteriuria in pregnancy: a randomized, controlled pilot study. J Urol. 2008 Oct; 180(4): 1367–72
  15. Sanchez Ballester F, Ruiz Vidal V, Lo´ pez Alcina E, et al. M. Cysticleans a highly pac standardized content in the prevention of recurrent urinary tract infections: an observational, prospective cohort study. BMC Urol. 2013; 13: 28.
  16. Gupta K, Chou MY, Howell A, et al. Cranberry products inhibit adherence of p-fimbriated Escherichia coli to primary cultured bladder and vaginal epithelial cells. J Urol. 2007; 177: 2357–2360
  17. Beerepoot MA, ter Riet G, Nys S, van der Wal WM, de Borgie CA, de Reijke TM, Prins JM, Koeijers J, Verbon A, Stobberingh E, Geerlings SE. Cranberries vs antibiotics to prevent urinary tract infections: a randomized double-blind noninferiority trial in premenopausal women. Arch Intern Med. 2011 Jul 25; 171(14): 1270–8.
  18. Stothers L. A randomized trial to evaluate effectiveness and cost effectiveness of naturopathic cranberry products as prophylaxis against urinary tract infection in women. Can J Urol. 2002 Jun; 9(3): 1558–62.
  19. Jepson RG, Williams G, Craig JC. Cranberries for preventing urinary tract infections. Cochrane Database Syst Rev. 2012 Oct 17; 10: CD001321
  20. Kranjčec B, Papeš D, Altarac S. D-mannose powder for prophylaxis of recurrent urinary tract infections in women: a randomized clinical trial. World J Urol. 2014 Feb; 32(1): 79–84.
  21. Wellens A, Garofalo C, Nguyen H, Van Gerven N, Slättegård R, Hernalsteens JP, Wyns L, Oscarson S, De Greve H, Hultgren S, Bouckaert J. Intervening with urinary tract infections using anti-adhesives based on the crystal structure of the FimH-oligomannose-3 complex. PLoS One. 2008 Apr 30; 3(4): e2040. doi: 10.1371/journal.pone.0002040. Erratum in: PLoS ONE. 2008; 3(6).
  22. Martinez JJ, Hultgren SJ. Requirement of Rho-family GTPases in the invasion of Type 1-piliated uropathogenic Escherichia coli. Cell Microbiol. 2002 Jan; 4(1): 19–28.
  23. Foxman B, Chi JW. Health behavior and urinary tract infection in college-aged women. J Clin Epidemiol. 1990; 43(4): 329–37.
  24. Ochoa-Brust GJ, Fernández AR, Villanueva-Ruiz GJ, Velasco R, Trujillo-Hernández B, Vásquez C Daily intake of 100 mg ascorbic acid as urinary tract infection prophylactic agent during pregnancy. Acta Obstet Gynecol Scand. 2007; 86(7): 783–7.
  25. Nickel JC, Hanno P, Kumar K, Thomas H. Second multicenter, randomized, double-blind, parallel-group evaluation of effectiveness and safety of intravesical sodium chondroitin sulfate compared with inactive vehicle control in subjects with interstitial cystitis/bladder pain syndrome. Urology 2012; 79(6): 1220–12244.
  26. Damiano R, Cicione A. The role of sodium hyaluronate and sodium chondroitin sulphate in the management of bladder disease. Ther Adv Urol. 2011 Oct; 3(5): 223–32.
  27. Cicione A, Cantiello F, Ucciero G, Salonia A, Madeo I, Bava I, Aliberti A, Damiano R. Int J Urol. 2014 Aug; 21(8): 763–8. doi: 10.1111/iju.12430. Epub 2014 Mar 19 Restoring the glycosaminoglycans layer in recurrent cystitis: experimental and clinical foundations.
  28. Damiano R, Quarto G, Bava I, Ucciero G, De Domenico R, Palumbo MI, Autorino R.
  29. Prevention of recurrent urinary tract infections by intravesical administration of hyaluronic acid and chondroitin sulphate: a placebo-controlled randomised trial.
  30. Douglas-Moore JL, Goddard J. Current best practice in the management of cystitis and pelvic pain. Ther Adv Urol. 2017 Oct 25; 10(1): 17–22.

Effects of menopause, hormone replacement therapy and aging on the health in Asian women

DOI: 10.31038/AWHC.2019216

Abstract

The cross-sectional study examined whether menopause and hormone replacement therapy (HRT) can and how they modify the aging process in Asian women.

Methods: All women answered a questionnaire on their medical history, exercise regime, sexual functions, sleep hygiene, general well-being and menopausal and HRT status. Serum biochemical and hormones, blood pressures, handgrip strength and forced expiratory capacity were measured. Cognitive functions were monitored, and bone and body composition were evaluated using the dual energy absorptiometry (DXA).

Results: The results showed that aging affected many health compartments starting mainly in the 6th decade. Aging affects the cognitive functions, body form, physical and general well-being, metabolic and cardiovascular risk, bone health and the incidence of both general and abdominal obesity. The onset of menopause further aggravated the poor bone health, strength and higher body fat due to age alone. These ill effects in postmenopausal women not having HRT were negated by either estrogen alone or estrogen/progestin HRT. However, estrogen alone HRT was associated with significantly lower IGF1 and BP3 and higher incidence of abdominal obesity than by age alone. The combined estrogen/progestin HRT, on the other hand was associated with lower levels of HDL.

Conclusion: Aging affects most health compartments by the 5th and 6th decades. The onset of menopause further aggravated the ill effects of aging on bone health. While HRT could negate the ill effects of menopause, HRT may have other adverse effects on some aspects of women health.

Keywords

Asian women, aging, menopause, hormone replacement therapy.

Introduction

In 2014 in the USA, the CDC reported that there was about a five-year difference in life expectancy between men (76.5y) and women (81.3y) [1]. However, the primary concern today is the concept of health expectancy; that is a measure of how long a person remains healthy in his/her life cycle. Therefore, health expectancy is tied intimately to how a person ages, rather than merely a measure of the chronological aging. It is known that aging affects individuals at different rates. There are individuals who look beyond their age and conversely, others look much younger than their age. The rate of aging is dependent on many factors including the biological make up; an individual who is genetically predisposed to have some diseases such as premature aging will age much faster than his/her chronological age. The environment has a definite bearing on how a person ages – living in an environment with poor sanitation, lack of clean water and polluted air will greatly stress the body leading to a higher rate of aging. Countries have very different socioeconomic and geopolitical situations. In some countries, people who live in abject poverty will have higher rates of aging. In addition, the lifestyle that a person adopts – whether he/she gets involved in drug, alcohol abuse, or engages in excessive eating can lead to poor health and thus accelerate the aging process. Unlike men, apart from all the factors affecting aging mentioned above, the onset of menopause is a major biological event that can further impact the aging process in women.

The menopause happens around the age of 50 years when a woman stops menstruating and the ovaries stop producing, cyclically, estrogen and progesterone. Following the onset of menopause, women may experience varying degrees of biological, psychological and somatic changes ranging from hot flushes, night sweats, aches and pains, crawling or itching sensations under the skin, forgetfulness, headaches, irritability, lack of self-esteem, reduced sex drive (libido), tiredness, difficulty sleeping – wakefulness or waking hot and sweaty, urinary frequency, vaginal dryness and discomfort with sexual intercourse [2]. The Long-term health risks with menopause as a result of a decrease in female hormones may lead to thinning of the bones (osteoporosis) and an increased risk of fractures, an increase in the risk of heart attack and heart diseases, high blood pressure and stroke [3].

Since the publication of the Women’s Health Initiative [4] and the Million Women Study [5], and the reported links between combination (estrogen and progestin) HRT and cardiovascular disease and breast cancer, The National Institute for Health and Care Excellence (NICE) suggests that many women are suffering in silence because of fears about such adverse outcomes. In November 12, 2015, NICE gave guideline that tries to assuage fears about HRT and together with other studies offer a new perspective that could help women to make a more informed treatment decision based on a balanced review of the evidence [6].

While the impact of menopause and HRT on the major illnesses including cancer, coronary heart diseases and osteoporosis has been well researched, relative less is known about its impact on sexual functions, homeostasis and other lifestyle factors [7, 8]. The present study examined how menopause and HRT affect or modify the aging process in a large cohort of healthy and community living Asian women.

Subjects, materials and methods

Subjects

The Institutional Review Board of the National University Hospital of Singapore approved this study and each volunteer gave her written informed consent. The method was previously reported [9, 10]. A large cohort of 1326 women, aged between 29y and 72y, were included in the analyses.

General questionnaire

Each subject answered a self-administered and investigator-guided questionnaire. Questions asked included their medical, social, sex, exercise regime, and family history. As the primary objective of the study was to evaluate the determinants of the natural aging process, only women without a history of medical illnesses such as cancer, hypertension, thyroid dysfunction, diabetes, osteoporotic fracture, cardiovascular events, major sleep disorders, and major joint surgery were included in the study.  Subjects were not paid for their participation. The cohort of women represented the diverse spectrum of people in Singapore, ranging from those with low to high levels of education, working and non-working women (retirees), and those in various types of vocation [10]. Their profiles were typical of Singapore, which is a highly urbanized city-state with no rural population.

Age groups (AgeGps)

All women were classified into four age groups: AgeGp1 – women below age 40 y, AgeGp2 – women between ages of 41 to 50 y, AgeGp3 – women between ages 51 to 60 y and AgeGp4 – women above 60 y old.

Menopause groups (MenoGps)

In order to evaluate whether the onset of menopause and the presence of hormone replacement therapy (HRT) have a modifying effect on the aging process, all women aged between 50 – 60 y were classified into four menopause groups: MenoGp1 – all premenopausal women within this age group; MenoGp2 – postmenopausal women not on any HRT; MenoGp3 – postmenopausal women on estrogen only replacement therapy (ERT) for at least the past year (mainly on 0.625 mg Premarin (Pfizer, NY) or progynova (2 mg estradiol valerate, Schering AG, Berlin); and MenoGp4: postmenopausal women on estrogen/progestin hormone replacement therapy (E/PRT) for at least the past year (mainly Prempak C (0.625mg Conjugated estrogen and 0.15mg norgestrel, Pfizer Ltd, NY).

Biochemical and hormone measurements

An overnight 12h fasting blood sample was collected in the morning between 9.00am and 11.00am for all postmenopausal women. For premenopausal women, a blood sample was collected between Day 3 to Day 5 of their menstrual cycle. The sera were stored at -80oC until analyses. Serum levels of total cholesterol (TC) and triglycerides (TG), high-density lipoprotein-cholesterol (HDL), low-density lipoprotein cholesterol (LDL) and fasting glucose level (Glu) were measured by methods reported earlier [11]. Serum testosterone (T), dehydroepiandrosterone sulphate (DHEAS), sex hormone binding globulin (SHBG) and cortisol (Cor) were measured by established radioimmunoassay methods reported earlier [9]. Serum concentrations of insulin-like growth factor-1 (IGF1) and insulin like growth factor binding protein-3 (BP3) was measured using immunoradiometric assay kits (Diagnostic Systems Laboratories, Inc., Webster, TX) as reported earlier [12, 13]. Serum concentrations of insulin (INS) were measured in-house using the Axsym platform from Abbott. Bioavailable testosterone (BioT) was calculated using the computer formula of Vermeulen, which is available on the ISSAM website. [www.issam.ch]

Whole body DXA and bone scans

Each subject had a whole body scan using the DXA Hologic, Bedford, MA, and USA. The DXA scanner calculated the percent total body fat (PBF) automatically using the Siri formula. Total body and regional distribution in the trunk (Tk), abdomen (Abd), arms (Arm) and legs (Leg) of lean (L) and fat (F) mass, expressed in mass (g) and per cent were computed from the whole body scan. Total bone mineral content (Tbmc) and per cent mineral content (Pbmc) were also derived from the whole body scan.

Spine and hip osteoporosis and osteopenia

Each subject underwent a lumber spinal scan at the L2-L4, and a scan of the hip (representing the femoral neck, shaft, and trochanter) using DXA. The DXA scanner computed the spine bone mineral density (Sbmd, the average bone mineral density of L2-L4) and femoral neck bone mineral density (Hbmd). The T-scores for the spine and femoral neck were computed with reference to the bone mineral density (bmd) for young women established for the local population. According to the WHO guidelines, a T-score >-1.00 is normal, while T-scores <-1.00 to -2.50 denote osteopenia and T-scores of <-2.50 denote osteoporosis [14]. Hence, the following groups were identified: Spine osteopenia (SOsteopn) and spine osteoporosis (SOsteop) and hip osteopenia (HOsteopn) and hip osteoporosis (HOsteop) and were used in the analyses for incidence.

Handgrip strength (Grip)

A handgrip dynamometer (Takei Scientific Instruments, Japan) was used to test the handgrip strength as reported earlier [15]. The purpose of this test was to measure the maximum isometric strength of the hand and forearm muscles. Also, as a general rule, people with strong hands tend to be strong also elsewhere, so this test is often used as a general test of strength [16, 17]. Each subject performed the handgrip test three times and the maximum score (Grip) of the three was used for the analysis. The handgrip strength was expressed as kilogram force (Kgf).

Well-being score (WBSc), well-being symptoms (WBsym)

The well-being questionnaire contains 31 items regarding a wide variety of symptoms, such as vegetative symptoms, concentration deficit, fatigue, tiredness, dizziness, and symptoms of peripheral neuropathy. The subjects were asked to rate the frequency of occurrence of each symptom during the last 24 hours on a four-point scale with 0, denoting none and 3, frequent. This test was taken from the SPES package [18]. The individuals’ sense of well-being is dependent on many factors including sleep; levels of stress at work and at home, any circadian rhythm disruption and the presence of emotional distress. A higher score, therefore, would reflect a greater sense of being unwell. A higher number of symptoms (WBSym) add up to a higher sense of being unwell.

Forced expiration capacity test (FEC)

Subjects were asked to blow into an instrument (from Takei, Japan) to measure the forced expiratory capacity. The measurement was adjusted for gender and age of the subjects. The score was then set as a percent of the mean at the individual’s age and gender group. It is a measure of tiredness and an indication of the lung capacity at the time of testing. A lower percentage (FEC) indicates a more tired or weaker physical state.

Blood Pressures

Brachial systolic (Sys) and diastolic (Dia) blood pressures were measured by trained clinical researchers using a standardized manual sphygnomanometric method and after the participants had rested for at least 5 min. Both blood pressures were recorded as millimeter of mercury (mmHg).

Cognitive function tests

The Swedish Performance Evaluation System (SPES) was developed more than 40 years ago [18]. Two prospective tests from the SPES, the Symbol Digit for perceptual capacity and Digit Span for short-term memory were used in the study. The digit symbol and digit span tests were computer-based tests. All participants underwent a familiarization trial test before the actual scorings were recorded.

Symbol Digit – The Symbol Digit is a test of perceptual capacity, which includes matching, memory and the speed of processing. In one row, a key to this coding task is given by the pairing of symbols with randomly arranged digits, 1 to 9. The task is to key in as fast as possible the digits corresponding to the symbols presented in random order in a second row. Each set consists of nine pairs of randomly arranged symbols and digits, and a total of 10 sets are presented. Performance is evaluated as the mean reaction time in milliseconds (RT) and the number of errors (Err) for the last 54 pairs of the test. Symbol digit tests the individual’s ability to interpret and correctly match what he sees as well as the speed of his mental perception. It also involves hand-eye coordination. The two components of this test are reaction time (RT) and the number of errors (Err) [18].

Digit Span – The Digit Span is a test of the short-term visual memory capacity. In this test, a series of digits is presented on the computer screen. The digits are presented one at a time with a 1-second presentation time, and the task is to reproduce the series on the keyboard. Depending on the answer, the length of the following series is either increased or decreased. The test starts with a series of three digits and it is terminated after six incorrect answers. Performance is evaluated as the maximum string of numbers (DSpan) that the subject could remember successfully. A longer DSpan indicates a better short-term visual memory [18].

Obesity

Definitions of general (GOb) and abdominal (AbO)

Per cent total body fat (PBF) computed from the DXA-whole body scan was used to define general obesity. General obesity (GOb) was defined when the PBF is >35% for women [19]. Abdominal obesity (AbO) was defined when the per cent abdominal fat is >21.8% in women [19].

Metabolic Syndrome (MetS) Groupings

The most commonly used NCEP ATPIII definition of metabolic syndrome (MetS) was used for the purpose of the present study [20]. According to the recommendations of the NCEP ATP III [23], the 5 risk factors of MetS are:

  • High density lipoprotein cholesterol (HDL) <1.03mmol/l
  • Fasting glucose level (Glu) >5.6mmol/l
  • Systolic blood pressure/diastolic blood pressure – B/P >130/>85 mmHg
  • Triglyceride level (TG) > 1.7mmol/l
  • For the present study, the risk factor of waist circumference was replaced by a PBF of >35% for women to defined obesity.

An individual was considered to have metabolic syndrome (MetS) when she has 3 or more of the above 5 metabolic syndrome risk factors.

Indices of Insulin resistance

Besides high levels of insulin as indicative of possible insulin resistance, the Homeostasis Model Assessment (HOMA) score was established as a measure of insulin resistance. As suggested by Matthews et al, HOMA is computed by multiplying fasting insulin with fasting glucose levels and then dividing it by 22.5 [24]. A HOMA value of >2.8 computed from a single fasting blood sample correlated well with other measures of insulin resistance [21].

Surveys sleep and sexual activities

In the general questionnaire, subjects were asked to rate their duration of sleep, ease of falling asleep and their sexual functions. The scores were based on the following questions:

Sleep duration per night (SlpD)

Score

  • <4h

1

  • 4 – 6h

2

  • 6 – 8h

3

  • >8h

4

Do you have problem falling asleep? (Fallslp)

Score

  • No

1

  • Yes

2

Sexual activities

Subjects were asked, on an average,

  1. How many times they had coitus with their partner per month (CoitalF)
  2. Whether they self-masturbate (Masturbate)

    Score

    • No

    1

    • Yes

    2

  3. If they do, how many times per month (No.Times)
  4. What is your response to your coital frequency?
    1. Want more
    2. Happy with frequency
    3. Want less
  5. How is your libido?
    1. Normal
    2. Reduced
  6. Do you have pain during sex?
    1. No
    2. Yes

Statistical analyses

Statistical analyses were performed using SPSS for windows version 21.0. Basic descriptive statistics as well as comparison of means using the Multivariate analyses of the General Linear Model coupled with the Bonferroni as the Post-Hoc test for multiple means were used on continuous measurements. Comparisons were carried out among the four age and four menopausal groups and significance differences were denoted when the p value is <0.05. For non-parametric measures such as the incidence of osteopenia and osteoporosis, ease of falling asleep, number who were engaged in masturbation, the numbers who were obese, cross-tab analyses with the four age and menopausal groups were computed and the Fisher’s exact test was used for statistical analyses.

Results

The results showed that aging affected many of the major health compartments evaluated in the present study. In the cognitive perceptual capacity domain, errors (Err) in matching was significantly degraded after the 6th decade, while noticeable and significant increase in reaction time (RT) occurred after the 5th decade and was worst after the 6th decade (Table 1). Similar to RT of the perceptual capacity, short-term memory (Dspan) was significantly shorter after the 5th decade and was further and progressively poorer after the 6th decade (Table 1).

Handgrip strength was significantly lower in women in the 6th and 7th decades when compared to women in the 4th and 5th decade, and the handgrip strength in women in the 7th decade was significantly lower when compared to women in the 6th decade (Table 1). As far as the forced expiratory capacity (FEC) was concerned, women in the 7th decade had significantly lower FEC when compared to all other groups of younger women (Table 1). Likewise, women in the 7th decade experienced significantly more unwell symptoms when compared to all other groups of younger women (Table 1). In addition, the sense of well-being was significantly lower in women in the 7th decade when compared only to women in the 4th decade (Table 1).

Systolic blood pressure was significantly and progressively higher in women after the 4th decade, while diastolic blood pressure was significantly and progressively higher in women after 5th decade (Table 1).

Significantly more women in the 6th decade age groups slept less than 6 hour per night when compared to women in the 4th decade age group (Table 1). Women in the 6th and 7th decade had progressively less sex than women in the 4th and 5th decade (Table 1). On the other hand, younger women, in the 4th decade wanted to have more sex than all the older women in the 5th to 7th decade (Table 1). Significantly more women in their 4th decade were engaged in masturbation than older women in their 6th decade (Table 1). Significantly more women, in their 6th and 7th decade experienced pain in sex than younger women in their 4th and 5th decade (Table 1).

Table 1. Comparisons of various parameters among the four age groups

AGp1
n = 181

AGp2
n = 533

AGp3
n = 479

AGp4
n = 133

Age (y)

36.8 ± 0.20

48.0 ± 0.12

54.5 ± 0.12

64.4 ± 0.22

AGp1vAGp2,3,4 (<0.001, <0.001, <0.001), AGp2vAGp3,4 (<0.001, <0.001), AGp3vAGp4 (<0.001)

Err

1.72 ± 0.18

1.95 ± 0.12

2.07 ± 0.13

2.59 ± 0.29

AGp1vAGp4 (0.046)

RT (msec)

2319 ± 38

2404 ± 22

2483 ± 22

2786 ± 52

AGp1vAGp3,4 (<0.001, <0.001), AGp2vAGp4 (<0.001), AGp3vAGp4 (<0.001)

Dspan

6.91 ± 0.13

6.89 ± 0.05

6.61 ± 0.05

6.22 ± 0.10

AGp1vAGp3, 4(0.022, <0.001), AGp2vAGp3, 4(0.001, <0.001), AGp3vAGp4 (0.003)

Grip (Kgf)

25.4 ± 0.23

24.1 ± 0.37

22.5 ± 0.19

20.4 ± 0.36

AGp1vAGp3,4 (<0.001, <0.001), AGp2vAGp3,4 (<0.001, <0.001), AGp3vAGp4 (0.004)

FEC (%)

70.4 ± 1.6

66.7 ± 0.94

65.9 ± 0.95

59.5 ± 1.9

AGp1,2,3vAGp4 (<0.001,0.003, 0.010)

Sys (mmHg)

113 ± 1.0

119 ± 0.7

125 ± 0.8

131 ± 1.8

AGp1vAGp2,3,4 (<0.001, <0.001, <0.001), AGp2vAGp3,4 (<0.001, <0.001), AGp3vAGp4 (0.001)

Dia (mmHg)

74.0 ± 0.7

76.2 ± 0.4

78.7 ± 0.4

79.4 ± 1.0

AGp1vAGp3,4 (<0.001, <0.001), AGp2vAGp3,4 (<0.001,0.005)

WBSc

21.1 ± 0.7

19.9 ± 0.4

20.0 ± 0.5

17.4 ± 1.0

AGp1vAGp4 (0.013)

WBsym

17.3 ± 0.5

16.4 ± 0.3

16.2 ± 0.3

14.2 ± 0.7

AGp1,2,3vAGp4 (0.001,0.008,0.023)

CoitalF

4.74 ± 0.28

4.45 ± 0.16

3.77 ± 0.17

2.02 ± 0.26

AGp1vAgp3,4 (0.14, <0.001), AGp2vAGp3,4 (0.022, <0.001), AGp3vAGp4 (0.003)

Masturb

23/156 (9.1%)

50/448 (11.2%)

31/375 (8.3%)

6/79 (7.6%)

AGp1vAGp3 (0.030)

SlpD <6h

19/170 (11.1%)

71/511 (13.9%)

98/466 (21.0%)

23/130 (17.7%)

AGp1vAGp3 (0.015)

Want more sex

24/129 (18.6%)

36/395 (9.1%)

12/273 (4.4%)

2/48 (4.2%)

AGp1vAGp2,3,4 (0.10,0.001,0.02)

Painful sex

16/132 (12.1%)

70/393 (17.8%)

79/269 (29.4%)

13/45 (28.9%)

AGp1vAGp3,4 (0.001,0.030), AGp2vAGp3 (0.004)

Err = number of errors; RT = reaction time; Dspan = digit span; Grip = handgrip strength; FEC = forced expiratory capacity; Sys = systolic blood pressure; Dia = diastolic blood pressure; WBSc = well being score; WBsym = number of unwell symptoms; Coitalf = number of coitus per month; masturb = number/per cent of women engaged in masturbation; SlpD = number/per cent of women who slept less than 6h per night; want more sex = number/per cent of women who want more sex than currently engaged in; Painful sex = number/per cent of women who experienced pain during sex.

Aging related changes in body composition were reflected in changes in the three major elements of bone, lean and fat masses. Per cent bone mineral content (Pbmc) was significantly lower in women in the 6th and 7th decade when compared to women in the 4th and 5th decade. Furthermore, Pbmc was significantly lower in women in the 7th decade when compared to women in the 6th decade (Table 2). Per cent lean mass (PLM) and Per cent body fat (PBF) on the other hand, were significantly and progressively lower and higher, respectively, from the 4th decade onwards (Table 2). Interestingly, on an average, per cent lean mass decrease by about 4.0% over a span of 30 years, while per cent fat mass increase by about 5.4% over a span of 30 years which is close to the combine loss of 4.62% of lean and bone mass (Table 2). Regional body composition changed as a person aged. Both spine bone mineral density (Sbmd) and hip bone mineral density (Hbmd) were significantly lower, starting in women in the 6th decade and continued to be even lower in 7th decade when compared to women in the 4th and 5th decade (Table 2). Over the span of 30 years, Sbmd and Hbmd were lower by 16.2% and 13.9%, respectively, when compared to corresponding levels in women in the 4th decade (Table 2).

Table 2. Comparisons of body compositions among the four age groups

AGp1
N = 181

AGp2
N = 533

AGp3
N = 479

AGp4
N = 133

Pbmc (%)

4.49 ± 0.034

4.40 ± 0.021

4.17 ± 0.022

3.87 ± 0.040

AGp1vAGp3,4 (<0.001, <0.001), AGp2vAGp3, 4 (<0.001, <0.001), AGp3vAGp4  (<0.001)

PLM (%)

60.7 ± 0.37

59.2 ± 0.21

58.1 ± 0.22

56.7 ± 0.26

AGp1vAGp2,3,4 (0.002, <0.001, <0.001), AGp2vAGp3,4 (<0.001, <0.001), AGp3vsAGp4 (0.026)

PBF (%)

26.3 ± 0.38

27.8 ± 0.21

29.6 ± 0.22

31.7 ± 0.39

AGp1vAGp2,3,4 (0.002, <0.001, <0.001), AGp2vAGp3,4 (<0.001,0.001), AGp3vGp4 (<0.001)

Sbmd (g/cm2)

1.076 ± 0.010

1.070 ± 0.006

0.986 ± 0.007

0.902 ± 0.014

AGp1vAGp3,4 (<0.001, <0.001), AGp2vAGp3,4 (<0.001, <0.001), AGp3vAGp4 (<0.001)

Hbmd (g/cm2)

0.837 ± 0.008

0.829 ± 0.005

0.787 ± 0.005

0.721 ± 0.009

AGp1vAGp3,4 (<0.001, <0.001), AGp2vAGp3,4 (<0.001, <0.001), AGp3vAGp4  (<0.001)

PTkL (%)

37.2 ± 0.09

37.4 ± 0.05

37.5 ± 0.06

37.7 ± 0.11

AGp1vAGp3,4 (0.033, 0.004)

PAbdL (%)

18.0 ± 0.08

18.3 ± 0.05

18.6 ± 0.06

18.8 ± 0.10

AGp1vAGp2,3,4 (0.002, <0.001, <0.001), AGp2vAGp3,4 (0.019, <0.001)

PLegL (%)

28.7 ± 0.12

28.3 ± 0.07

27.9 ± 0.07

27.4 ± 0.17

AGp1vAGp2,3,4 (0.008, <0.001, <0.001), AGp2vAGp3,4 (0.003, <0.001), AGp3vAGp4 (0.007)

PAbdF (%)

17.8 ± 0.13

18.5 ± 0.08

19.0 ± 0.09

19.2 ± 0.16

AGp1vAGp2,3,4 (<0.001, <0.001, <0.001), AGp2vAGp3,4 (<0.001, <0.001)

PTkF (%)

37.7 ± 0.15

38.6 ± 0.11

39.3 ± 0.28

39.5 ± 0.19

AGp1vAGp2,3,4 (<0.001, <0.001, <0.001), AGp2vAGp3,4 (<0.001, <0.001)

PLegF (%)

29.8 ± 0.25

28.8 ± 0.16

27.9 ± 0.15

27.7 ± 0.28

AGp1vAGp2,3,4 (0.003, <0.001, <0.001), AGp2vAGp3,4  (0.001, 0.008)

Pbmc = per cent bone mineral content; PLM = per cent total lean mass; PBF = per cent body fat; Sbmd = average bone mineral density of L2-L4; Hbmd = bone mineral density of the femoral neck of the hip; PTkL = per cent trunk lean mass; PAbdL = per cent abdominal lean mass; PLegL = per cent leg lean mass; PAbdF = per cent abdominal fat mass; PTkF = per cent trunk fat mass; PlegF = per cent leg fat mass.

The incidence of spinal osteopenia and osteoporosis among Singaporean women increased progressively with age. For spinal osteopenia, the increase was from 10.5% in the 4th to 37.6% in the 6th and a high of 53.4% in the 7th decade (Table 3). For spinal osteoporosis, the increase was from 0.6% in the 4th decade to 3.8% in the 6th and to 10.5% in the 7th decade (Table 3). On the other hand, the incidence of hip osteopenia was already high (50.8%) in the 4th decade and did not increase significantly through to the 7th decade (Table 3). The incidence of osteoporosis of the hip, on the other hand, was significantly higher in the older age groups. It increased significantly from 6.1% in the 4th decade to 15.7% in the 6th and to 36.8% in the 7th decade (Table 3).

Per cent trunk lean (PTkL) showed significant increases in older women in the 7th decade when compared to younger women in the 4th decade (Table 2). Per cent abdominal lean mass (PAbdL), on the other hand, was significantly lower in younger women in the 4th decade when compared to women in all the older groups (Table 2). In addition, women in the 5th decade had significantly lower PAbdL than women in both the 6th and 7 decades (Table 2). Contrary to the per cent trunk and abdominal lean mass, the per cent leg lean mass (PLegL) was significantly lower in women in all the older age groups when compared to the younger women in the 4th decade and was progressively and significantly lower from the 4th decade through the 7th decade (Table 2). Per cent trunk and abdominal fat mass (PTkF) was significantly and progressive higher starting from the 4th decade through the 7th decade and was significantly higher in the 6th and 7th decade as compared to the 5th decade (Table 2). A similar trend was noted for per cent leg fat (PLegF), except that it was progressively lower in women in the older age groups (Table 2).

Bioavailable testosterone (BioT) tended to be lower in women in the older age groups, but only reached significantly level when comparing women in the 5th and 6th decade (Table 3). Insulin growth factor-1 (IGF1) was significantly and progressive lower from the 4th decade onwards and reaching the lowest level in women in the 7th decade, decreasing, on an average, 1% per year from the 4th decade onwards (Table 3). On the other hand, the insulin growth factor binding protein-3 (BP3) was significantly higher in women in the 6th decade when compared to women in both the 4th and 5th decade (Table 3). Insulin (INS) levels in women in the 7th decade were significantly higher than in women in the 4th decade (Table 3). The HOMA level of women in the 7th decade was significantly higher than corresponding levels in women in the 4th and 5th decade (Table 3). There were no significant changes with age noted for cortisol, testosterone and DHEAS levels.

Table 3. Comparisons of biochemical and hormone factors and incidences among the four age groups

AgeGp1
n = 181

AgeGp2
n = 533

AgeGp3
n = 479

AgeGp4
n = 133

BioT (ng/dl)

17.6 ± 0.67

18.2 ± 0.40

16.3 ± 0.40

16.1 ± 0.69

AGp2vAGp3 (0.004)

IGF1

211 ± 5.7

185 ± 3.1

172 ± 3.8

146 ± 6.2

AGp1vAGp2,3,4 (0.001, <0.001, <0.001), AGp2vAGp3,4 (0.040, <0.001), AGp3vAGp4 (0.003)

BP3

3814 ± 71

3827 ± 44

4109 ± 54

4047 ± 110

AGp1,2v3 (0.012, <0.001)

INS (mIU/l)

6.10 ± 0.24

6.58 ± 0.19

6.52 ± 0.17

7.37 ± 0.32

AGp1vAGp4 (0.024)

TC (mmol/l)

5.14 ± 0.060

5.54 ± 0.036

5.85 ± 0.044

6.11 ± 0.08

AGp1vAGp2,3,4 (<0.001, <0.001, <0.001), AGp2vAGp3,4 (<0.001, <0.001), AGp3vAGp4 (0.017)

HDL (mmol/l)

1.59 ± 0.022

1.64 ± 0.016

1.71 ± 0.019

1.66 ± 0.032

AGp1,2vAGp3 (0.001, 0.007)

LDL (mmol/l)

3.16 ± 0.58

3.43 ± 0.032

3.62 ± 0.04

3.84 ± 0.071

AGp1vAGp2,3,4 (0.001, <0.001, <0.001), AGp2vAGp3,4 (0.001, <0.001), AGp3vAGp4 (0.029)

TC/HDL

3.34 ± 0.060

3.55 ± 0.040

3.59 ± 0.045

3.89 ± 0.093

AGp1vAGp3,4 (0.014, <0.001), AGp2,3vAGp4 (0.001, 0.009)

Glu (mmol/l)

3.57 ± 0.034

4.71 ± 0.023

3.84 ± 0.024

4.91 ± 0.051

AGp1vAGp2,3,4 (0.010, <0.001, <0.001), AGp2vAGp3,4(0.001, 0.001)

HOMA

1.26 ± 0.055

1.41 ± 0.049

1.43 ± 0.040

1.67 ± 0.09

AGp1,2vAGp4 (0.002, 0.040)

GOb

10/181 (5.5%)

49/533 (9.2%)

68/479 (14.2%)

32/133 (24.1%)

AGp1vAGp3,4 (0.008, <0.001), AGp2vAGp3,4 (0.030, <0.001), AGp3vAGp4 (0.030)

AbO

1/181 (0.6%)

16/533 (3.0%)

36/479 (7.5%)

5/133 (3.8%)

AGp1,2 vAGp3 (<0.001, 0.003)

MetS

1/181 (0.6%)

11/533 (2.1%)

23/479 (4.8%)

11/133 (8.3%)

AGp1vAgp3,4 (0.008, <0.001), AGp2vAGp3,4 (0.023, 0.002)

SpOsteopn

19/181 (10.5%)

90/533 (16.9%)

180/479 (37.6%)

71/133 (53.4%)

AGp1vAGp3,4 (<0.00, <0.001), AGp2vAGp3,4 (<0.001, <0.001), AGp3vAGp4 (0.047)

SpOsteop

1/181 (0.6%)

0/533 (0%)

18/479 (3.8%)

14/133 (10.5%)

AGp1vAGp3,4 (0.033, <0.001), AGp2vAGp3,4 (<0.001, <0.001), AGp3vAGp4 (0.008)

HOsteop

11/181 (6.1%)

31/533 (5.8%)

75/479 (15.7%)

49/133 (36.8%)

AGp1vAGp3,4 (0.003, <0.001), AGp2vAGp3,4 (<0.001, <0.001), AGp3vAGp4 (<0.001)

BioT = bioavailable testosterone; IGF1 = insulin growth factor-1; BP3 = insulin growth factor binding protein-3; INS = insulin; TC = total cholesterol; HDL = high density lipoprotein cholesterol; LDL = low density lipoprotein cholesterol; TC/HDL = total cholesterol/high density lipoprotein cholesterol ratio; Glu = glucose level; HOMA = homeostasis model assessment score; GOb = number/per cent of women with general obesity; AbO = number/per cent of women with abdominal obesity; MetS = number/per cent of women with metabolic syndrome; SOsteopn = number/per cent of women with osteopenia of the spine; SOsteop = number/per cent of women with osteoporosis of the spine; HOsteop = number/per cent of women with osteoporosis of the hip

Both total cholesterol (TC) and low density lipoprotein cholesterol (LDL) were significantly and progressively higher from the 4th to the 7th decade. High density lipoprotein cholesterol (HDL), on the other hand tended to be higher in older women, but only reached significantly levels when comparing levels in women in the 6th decade with those in women in the 4th and 5th decade (Table 3). The ratio of TC/HDL increased with age and levels in women in the 6th and 7th decade were significantly higher than corresponding levels in women in the 4th and 5th decade (Table 3). Glucose (Glu) levels were significantly higher in all other older age groups when compared to those in women in the 4th decade; and levels in women in the 6th and 7th decade, were significantly higher than levels in women in the 5th decade (Table 3). No significant change with age was noted for TG levels.

The incidence of general obesity (GOb) increased with age and was significantly higher in women in the 6th and 7th decade when compared to women in the 4th and 5th decade; likewise the incidence was significantly higher in women in the 7th decade when compared to that in women in the 6th decade (Table 3). As with general obesity, the incidence of abdominal obesity (AbO) tended to be higher in older women, reaching significantly levels in women in the 6th decade when compared to corresponding levels in women in the 4th and 5th decade (Table 3).

Significantly more women in the 6th and 7th decade had metabolic syndrome (MetS) when compared to women in the 4th and 5th decade (Table 3).

Taking all women in the age range of 50 to 60 y old and categorized them into four groups of premenopausal, postmenopausal without HRT, postmenopausal with estrogen replacement therapy and postmenopausal women with combined estrogen/progestin therapy, has enabled the evaluation of whether the onset of menopause and how different HRT can influent the aging effects on various health compartments. Comparing between the premenopausal and the postmenopausal women without HRT in this age group revealed that the onset of the menopause had additional effects on top of those due to aging alone. Handgrip strength in postmenopausal women without HRT (MenoGp2) was significantly lower than corresponding levels in premenopausal women (MenoGp1) (Table 4).

Table 4. Comparisons of various parameters among the four menopausal groups

MenoGp1

N = 89

MenoGp2

N = 296

MenoGp3

N = 31

MenoGp4

N = 63

Age (y)

52.4 ± 0.19

54.8 ± 0.15

55.4 ± 0.50

55.4 ± 0.34

MenoGp1vsMenoGp2,3,4 (<0.001, <0.001, <0.001)

Grip (Kgf)

23.6 ± 0.45

22.1 ± 0.25

23.1 ± 0.67

23.1 ± 0.50

MenoGp1vMenoGp2 (0.013)

Sys (mmHg)

122 ± 1.6

124 ± 1.0

130 ± 3.5

131 ± 2.3

MenoGp1,2vMenoGp4 (0.006, 0.10)

Sbmd (g/cm2)

1.053 ± 0.017

0.960 ± 0.009

1.025 ± 0.027

0.997 ± 0.018

MenoGp1vMenoGp2 (<0.001)

Tbmc (g)

2369 ± 30

2247 ± 15

2347 ± 41

2298 ± 27

MenoGp1vMenoGp2 (<0.001)

PBF (%)

28.2 ± 0.54

29.9 ± 0.27

29.8 ± 1.00

29.6 ± 0.57

MenoGp1vMenoGp2 (0.026)

Pbmc (%)

4.30 ± 0.05

4.13 ± 0.29

4.23 ± 0.09

4.14 ± 0.05

MenoGp1vMenoGp2 (0.016)

T (ng/ml)

0.63 ± 0.09

0.66 ± 0.05

0.71 ± 0.19

1.14 ± 0.22

MenoGp1,2vMenoGp4 (0.019, 0.006)

IGF1 (ng/ml)

173 ± 7.5

177 ± 4.8

129 ± 12

169 ± 13

MenoGp2vMenoGp3 (0.013)

BP3 (ng/ml)

3996 ± 129

4285 ± 68

3540 ± 215

3719 ± 120

MenoGp2vMenoGp3,4 (0.004, 0.003)

HDL (mmol/l)

1.66 ± 0.04

1.75 ± 0.02

1.88 ± 0.07

1.57 ± 0.04

MenoGp2,3vMenoGp4 (0.012, 0.021)

AbO

3/89 (3.4%)

21/296 (7.1%)

5/31 (16.1%)

7/63 (11.1%)

MenoGp1vMenoGp3 (0.039)

SOsteopn

7/89 (7.9%)

129/296 (43.6%)

11/31 (35.5%)

23/63 (36.5%)

MenoGp1vMenoGp2 (0.0033)

MenoGp1 = premenopausal women in the age group of 50–60y; MenoGp2 = postmenopausal women without HRT; MenoGp3 = postmenopausal women on estrogen only HRT; MenoGp4 = postmenopausal women on estrogen/progestin HRT; Grip = handgrip strength; Sys = systolic blood pressure; Sbmd = bone mineral density of spine; Tbmc = total bone mineral content; Pbmc = per cent bone mineral content; PBF = per cent body fat;
T = testosterone level; IGF1 = insulin growth factor-1; BP3 = insulin growth factor binding protein-3; HDL = high density lipoprotein cholesterol; AbO = number/percent of women with abdominal obesity; SOsteopn = number/per cent of women with osteopenia of the spine.

The onset of menopause (MenoGp2) was associated with significant reduction of Sbmd, bone mineral content (Tbmc, Pbmc) when compared to premenopausal women in the same age group (Table 4). In addition the number of women who had spinal osteopenia in postmenopausal women without HRT was significantly higher than premenopausal women in the same age group (Table 4).

The per cent body fat (PBF) in postmenopausal women without HRT was significantly higher when compared to corresponding values in premenopausal women in the same age group (MenoGp1)
(Table 4).

The systolic blood pressure (Sys) and testosterone of postmenopausal women on the estrogen/progestin (E/P) combined HRT was significantly higher than premenopausal women in the same age group (Table 4). The levels of BP3 and HDL in postmenopausal women on the E/P HRT were significantly lower than postmenopausal women who were not on any HRT (Table 4).

On the other hand, postmenopausal women in the estrogen only HRT group (MenoGp3) had significantly lower IGF1 and BP3 levels than postmenopausal women not on HRT in the same age group (Table 4). More postmenopausal women on estrogen only HRT had abdominal obesity than premenopausal women in the same age group (Table 4).

Discussion

Results of the present cross-sectional study, involving a large cohort of healthy community living Asian women, showed that aging affects most health compartments and each to varying extent. The deleterious effects of aging occurred mostly after the age of 50 y old, with some occurring earlier, after 40 y. In addition, in some compartments, the magnitude of the ill effects that occurred after 40 y or 50 y did not deteriorate any further with age, while in others; the ill effects became progressively worse through to the 7th decade.

An obvious age-related effect was the change in body form, noticeably, the accumulation of body fat in the trunk, abdomen and hip that occurred as earlier as after 40 y of age. Interestingly, unlike in the trunk, hip and abdomen, lean and fat mass in the legs decreased with age, perhaps explaining the flabby looks noted in the legs many older women.

Associated with the changes in body form were biochemical changes that are indicative of increase risks of metabolic syndrome and cardiovascular diseases. The increased risks were reflected by increases in total cholesterol, LDL, TC/HDL and glucose level as well as systolic and diastolic blood pressure that started occurring in the 5th and 6th decade. Further evidence of the increase risk of metabolic syndrome was the observed increase in insulin levels and the index for insulin resistance (HOMA) that occurred in the 7th decade. These metabolic changes were associated with the increases in the incidence of metabolic syndrome in women in the 6th and 7th decade of life. In addition, there was an increase in the incidence of general obesity and abdominal obesity. The results give further credence to an earlier report that it is abdominal and not general obesity that was associated with increased risk of metabolic syndrome and cardiovascular diseases [19].

Osteoporosis is frequently referred to as the silent killer or the silent epidemic and has become a major public health problem, especially in older men and women [22]. There is abundant evidence that the incidence of osteoporosis increases with age [23], and the results of the present study supported this observation. In conjunction with the significant loss of the Sbmd and Hbmd as well total bone mineral content, the incidence of osteoporosis and osteopenia of the hip and spine showed significant increases in the 6th and 7th decade. The increased incidence of osteopenia and osteoporosis in women in the 6th and 7th decade coincided with the onset of the menopause. The depletion of the female hormone in postmenopausal women is considered a major risk factor for osteoporosis [24].

An interesting feature of the bone health among the Singaporean women was that the incidence of hip osteopenia was already very high in women in the 4th decade. Unfortunately the cohort of the present study did not include participants younger than 30 y old. Therefore, it is not known when the increase in incidence of osteopenia of the hip had occurred in this population. It is also not clear whether this is a peculiar feature of the Singapore cohort as no comparison with other populations was available. It is however not surprising that the incidence of osteopenia in Singaporean women even as young as those in their 4th decade was very high, given the rather sedentary lifestyle prevalent in Singapore, a highly urbanized City State.

Physical strength as measured by handgrip strength showed decline with age, reaching significant levels by the 6th decade and continued into the 7th decade. Expiratory capacity, a measure of the lung capacity showed significant decline only in the 7th decade.

The study also showed that sexual functions declined with age. Coital frequency showed significant decline only after the 5th decade, while the number of women who were engaged in self-masturbation decline in the 6th decade when compared to women in the 4th decade. On the other hand, the number of women who wanted to have more sex declined significantly in women in the 5th, 6th and 7th decade when compared to women in the 4th decade. Likewise, more women experienced painful sex in the 6th and 7th decade. These data support the notion that sexual functions in women decreased with age. In Singapore, decrease in sexual function may be attributed to the highly stressful lifestyle – and the present author coined the term “lifestyle impotency” to denote this form of impotency for the Singapore’s population [25].

Older women tended to sleep less when compared to younger women. Interestingly, contrary to other parameters evaluated, the sense of well-being increased and the number of unwell symptoms declined with age. In the Singapore’s context, this could possibly due to the much more stressful lifestyle that is common among younger than in older women. Singapore is known to be a highly competitive society and younger women face the challenges of establishing their career and raising young families. In contrast, older women have more established career and mature family or have already retired, hence have a less stressful lifestyle and less subjected to being unwell.

Decline in bioavailable testosterone with age was not dramatic. The decline of insulin growth factor-1 was quite dramatic, decreasing progressively from the 4th decade to 30.8% less by the 7th decade. Concurrent to the decline in IGF-1 was an increase in the insulin growth factor binding protein 3. However, the increase was noted in 6th decade. The biological significance of these changes is not known.

Despite methodological difficulties in the research in normal brain aging, cognitive change in normal aging has been well documented [26]. The present study showed that the perceptual capacity and processing speed significantly declined in the 6th and 7th decade in agreement with earlier studies [27]. On the other hand, short-term memory declined progressively from the 6th to the 7th decade, a finding in line with other forms of memory declines [28].

The present study showed that aging has ill effects on most major health compartments. Most ill effects began in the 6th decade with a few occurring in the 5th decade. Hence any modality to prevent or slow down the ill effects should be instituted earlier, preferably in the second or third decade of life. The author, in a paper on the same cohort of women and published earlier showed that having a regular physical exercise/sport as a lifestyle habit can effectively mitigate, to some extent, the ill effects of aging [29]. In this study, it was clearly shown that different physical exercise as a lifestyle habit and when engaged in sufficiently high intensity can impart beneficial effects on cognitive, bone, cardiovascular, metabolic, sexual, and general health, and muscular and hormonal functions, and thus could reverse or tamper some of the ill effects of the aging process [29]. In the light of very high incidence of osteopenia of the hip, even in women in the 4th decade, it is important to promote engagement in regular exercise in women early in life. High intensity of physical exercise was also associated with higher amount of total lean mass and lean mass in the legs of women. Physical exercise would be beneficial to mitigate the risk of sarcopenia in women as they age [30].

Comparisons between postmenopausal women and premenopausal women in the same age group have provided a means of knowing whether the onset of menopause has additional effects on the age-related impact on the various health compartments. Interestingly, only bone health was worst in postmenopausal women who were not on any HRT when compared to premenopausal women within the same age group. Spinal bmd and bone mineral content were significantly lower, and the incidence of spine osteopenia was significantly higher in this group when compared to premenopausal women within the same age group. On the other hand, the bone health of postmenopausal women either on estrogen only or the combination of estrogen/progestin was similar to that of the premenopausal women within the same age group suggesting that HRT was able to reverse the deterioration of bone health caused by the onset of the menopause. The results showed, as has been widely reported, that bone health in women deteriorate with increasing age and the loss of estrogen with the onset of menopause [30, 31]. The losses of bone mass and increase in incidence of osteopenia seen in postmenopausal women without HRT were partially attenuated in women on either estrogen alone or estrogen/progestin HRT. This observation gives further credence to the importance of estrogen in bone health in women. Although hormone therapy is beneficial for the bone health of postmenopausal women, in the light of the Women’s Health Initiative, WHI, hormone therapy was not recommended even to women with high fracture risk [4]. However, with the lapse of time, there are more recent studies that support the introduction of newer forms of hormone therapy for postmenopausal women to mitigate the high fracture risk due to osteoporosis [24, 32]. As mentioned earlier, a non-drug treatment modality is encouraging postmenopausal women to take part in physical exercise of sufficient intensity as a lifestyle habit.

Handgrip strength was significantly lower and total body fat was higher in postmenopausal women than those due to age alone. If left unchecked, the long-term prognosis may be the increased risk of metabolic syndrome and sarcopenic frailty. In addition the decline in handgrip strength and the increase in total body fat in postmenopausal women without HRT were reversed in postmenopausal women on HRT, and thus would reduce the risks associated with reduced strength and increase fat.

While the positive impact of HRT for bone health, strength and fat was evident, the different types of HRT have varying effects on other health parameters. Postmenopausal women on the estrogen/progestin HRT had significantly higher systolic blood pressure and lower levels of HDL, implying perhaps, that the combination of estrogen/progestin HRT may be associated with increased risk of cardiovascular diseases. The clinical significance of higher levels of testosterone and lower levels of BP3 in postmenopausal women on the combination HRT is unclear. Postmenopausal women on the estrogen alone HRT, on the other hand, had significantly higher incidence of abdominal obesity with its attendant increase risk of metabolic syndrome as reported earlier [19]. Another negative effect of estrogen only HRT was the significant reduction of IGF1 and BP3, the clinical significance is unclear from the present study.

In summary, aging in women has significant and deleterious effects on most of the major health compartments including the bone, metabolic, cardiovascular, cognitive, and muscular compartments, strength, physical tone and general well-being, with most of the ill effects occurring in the 5th and 6th decade of life.  The onset of menopause is associated with further deterioration of bone health, strength, and body fat. Hormone replacement therapy, whether it was estrogen only or the combination of estrogen/progestin, was able to reverse or attenuate the ill effects due to the onset of the menopause. On the other hand, estrogen only and the combination of estrogen/progestin therapy may increase the risk of metabolic syndrome and cardiovascular disease.  The one non-drug modality that can attenuate or slow down the effect of aging is the engagement of regular physical exercise at a sufficiently high intensity as a lifestyle habit.

Authors’ contributions: This study was designed, conducted and data collected while Professor Victor H H Goh was at the Department of Obstetrics and Gynaecology, National University of Singapore. Professor Goh was involved in the interpretation, drafting of the manuscript and critical revision of the paper for submission.

Acknowledgments: This study was supported, in part, by funds from the Academic Research Fund of the National University of Singapore. Professor Victor Goh’s position in the Curtin Medical School, Faculty of Health Sciences was sponsored by Curtin University. I will like to acknowledge the technical assistance from staff of the Endocrine Research and Service Laboratory of the Department of Obstetrics and Gynecology, National University of Singapore.

Declaration of interest: The author reports no declaration of interest.

References

  1. NCHS death rates and life expectancy at birth.
  2. Hoga L, Rodolpho J, Gonçalves B, et al. (2015) Women’s experience of menopause: a systematic review of qualitative evidence. JBI Database System Rev Implement Rep 13: 250–337. [crossref]
  3. Mayoclinic (2017) Menopause.
  4. Rossouw JE, Anderson GL, Prentice RL, LaCroix AZ, Kooperberg C, et al. (2002) Risks and benefits of estrogen plus progestin in healthy postmenopausal women: principal results from the Women’s Health Initiative randomized controlled trial. JAMA 288: 321–333. [crossref]
  5. Beral V (2003) Million Women Study Collaborators. Breast cancer and hormone replacement therapy in the Million Women Study. Lancet 362: 419–427.
  6. The Lancet (2015) HRT for menopause: a NICE treatment? Lancet 386: 2030. [crossref]
  7. Grodstein F, Manson JE, Colditz GA, Willett WC, Speizer FE, et al. (2000) A prospective, observational study of postmenopausal hormone therapy and primary prevention of cardiovascular disease. Ann Intern Med 133: 933–941. [crossref]
  8. Anderson GL, Chlebowski RT, Rossouw JE, Rodabough RJ, McTiernan A, et al. (2006) Prior hormone therapy and breast cancer risk in the Women’s Health Initiative randomized trial of estrogen and progestin. Maturitas 55: 103–115. [crossref]
  9. Goh VHH, Tong TYY, Mok HPP, Said B (2007) Interactions among age, adiposity, bodyweight, lifestyle factors and sex steroid hormones in healthy Singaporean Chinese men. Asian J Androl 9: 611–621. [crossref]
  10. Goh VHH, Tong TYY (2011) The moderating impact of lifestyle factors on sex steroids, sexual activities and aging in Asian men. Asian J Androl 13: 596–604. [crossref]
  11. Goh VHH, Tain CF, Tong TYY, Mok PP, Wong MT (2004) Are BMI and other anthropometric measures appropriate as indices for obesity? A study in an Asian population. J Lipid Res 45: 1892–1898. [crossref]
  12. Probst-Hensch NM, Wang H, Goh VHH, Seow A, Lee HP, et al. (2003) Determinants of Circulating Insulin-like Growth Factor I and Insulin-like Growth Factor Binding Protein 3 Concentrations in a Cohort of Singapore Men and Women. Cancer Epidemiol Biomarkers Prev 12: 739–746. [crossref]
  13. Goh VHH, Mu SC, Gao FK, Lim KS (1998) Changes in body composition and endocrine and metabolic functions in healthy elderly Chinese men following growth hormone therapy. Aging Male 1: 264–269.
  14. World Health Organization (1994) Assessment of fracture risk and its application to screening for postmenopausal osteoporosis: report of a WHO study group 843: 1–129. [crossref]
  15. Goh VH, Tong TY (2010) Association of age and physical exercise with bodyweight and body composition in Asian Chinese men. Aging Male 13: 265–274. [crossref]
  16. Kuh D, Bassey EJ, Butterworth S, Hardy R, Wadsworth MEJ, et al. (2005) Grip strength, postural control, and functional leg power in a representative cohort of British men and women: associations with physical activity, health status, and socioeconomic conditions. J Gerontol A Biol Sci Med Sci 60: 224–231. [crossref]
  17. Syddall H, Cooper C, Martin F, Briggs R, Aihie Sayer A (2003) Is grip strength a useful single marker of frailty? Age Ageing 32: 650–656. [crossref]
  18. Iregren F, Gamberale A. Kjellberg (1996) SPES: A psychological test system to diagnose environmental hazards. Neurotoxicol Teratol 18: 485–491. [crossref]
  19. Goh VHH, Hart WG (2018) Excess fat in the abdomen but not general obesity is associated with poorer metabolic and cardiovascular health in premenopausal and postmenopausal Asian women. Maturitas 107: 33–38. [crossref]
  20. Executive Summary of the Third Report of the National Cholesterol Education Program (NCEP) (2001) Expert Panel on Detection, Evaluation, and Treatment of High Blood Cholesterol in Adults (Adult Treatment Panel III). JAMA 285: 2486–2497. ][crossref]
  21. Matthews DR, Hosker JP, Rudenski AS, Naylor BA, Treacher DF, et al. (1985) Homeostasis model assessment: insulin resistance and beta-cell function from fasting plasma glucose and insulin concentrations in man. Diabetologia 28: 412–419. [crossref]
  22. Colón-Emeric CS, Saag KG (2006) Osteoporotic fractures in older adults. Best Pract Res Clin Rheumatol 20: 695–706. [crossref]
  23. Kanis JA, Cooper C, Rizzoll R, Reginster JY, et al. (2018) European guidance for the diagnosis and management of osteoporosis in postmenopausal women. Osteoporos Int. [crossref]
  24. The North American Menopausal Society (2012) The 2012 Hormone therapy Position Statement of the North American Menopausal Society. Menopause 19: 257–271. [crossref]
  25. Goh VH, Tain CF, Tong YY, Mok PP, Ng SC (2004) Sex and aging in the city: Singapore. Aging Male 7: 219–226. [crossref]
  26. Harada CN, Natelson Love MC, Triebel KL (2013) Normal cognitive aging. Clin Geriatr Med 29: 737–752. [crossref]
  27. Salthouse T (2012) Consequences of age-related cognitive declines. Annu Rev Psychol 63: 201–226. [crossref]
  28. Ronnlund M, Nyberg L, Backman L, Nilsson LG (2005) Stability, growth, and decline in adult life span development of declarative memory: cross-sectional and longitudinal data from a population-based study. Psychol Aging 20: 3–18. [crossref]
  29. Goh VHH (2018) Health benefits of physical exercise as a lifestyle habit in Asian men and women. Intl Arch Pub Health Comm Med (in press).
  30. Kanis JA, McCloskey EV (1998) Risk factors in osteoporosis. Maturitas 30: 229–233. [crossref]
  31. Sambrook P, Cooper C (2006) Osteoporosis. Lancet 367: 2010–2018. [crossref]
  32. Lobo RA, Pickar JH, Stevenson SC, Mack WJ, Hodis HN (2016) Back to the future: Hormone Replacement Therapy as a part of a prevention strategy for the women at the onset of menopause. Atherosclerosis 254: 282–290. [crossref]
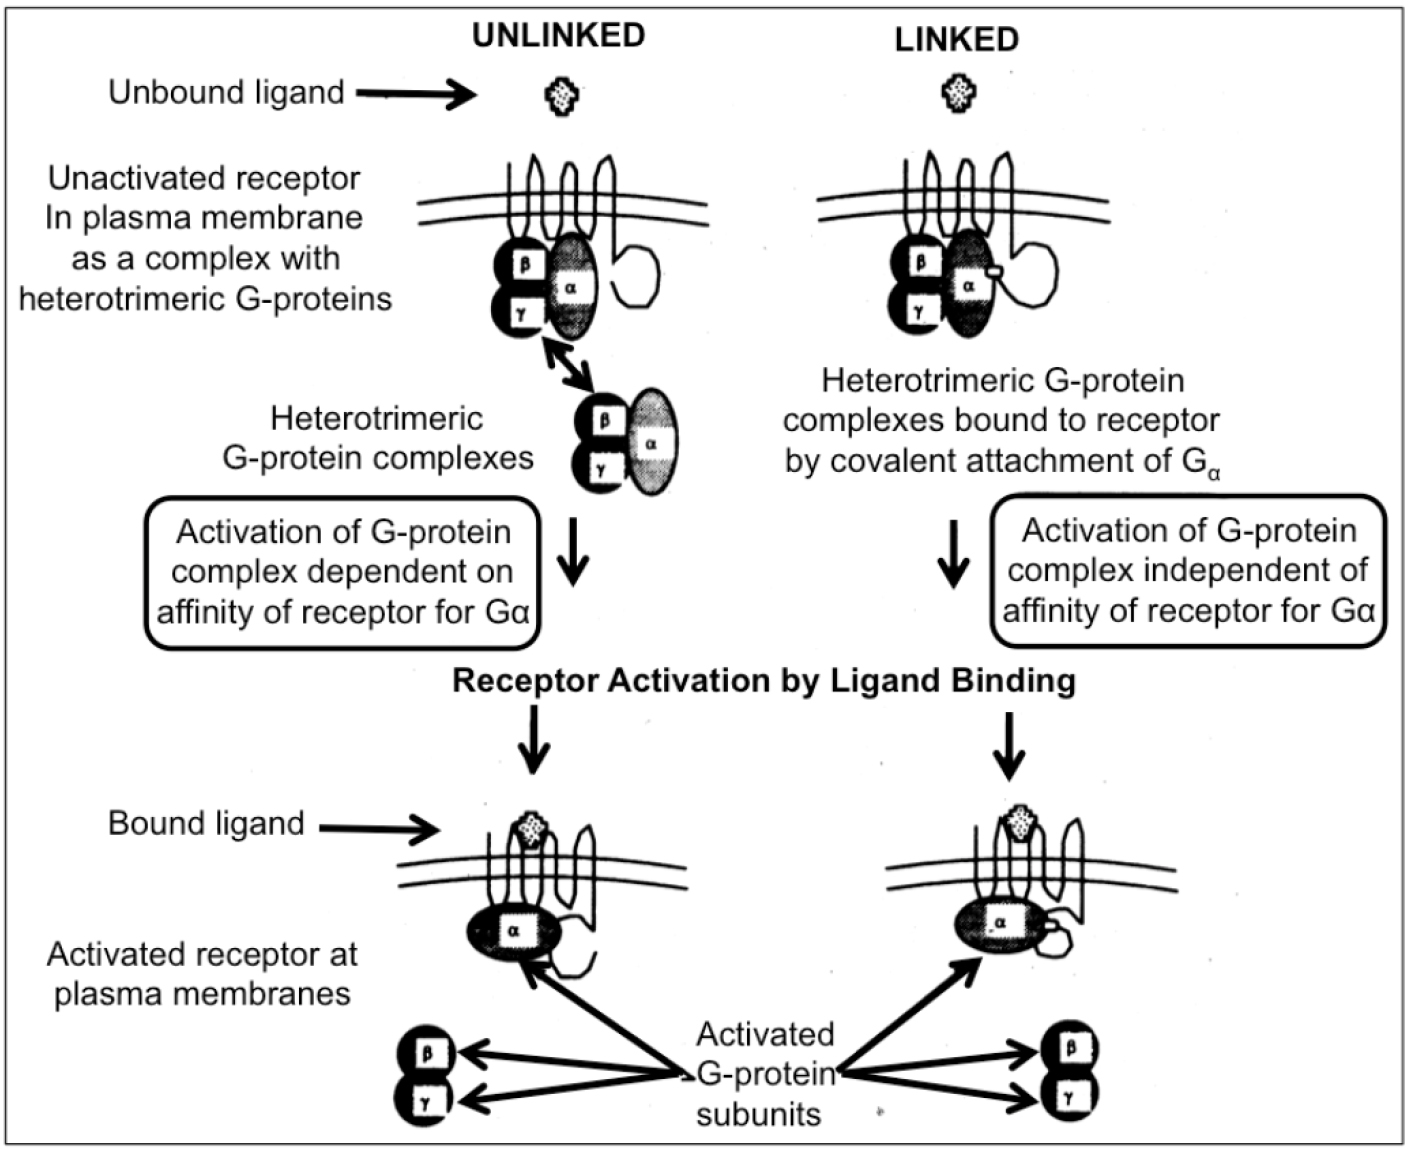
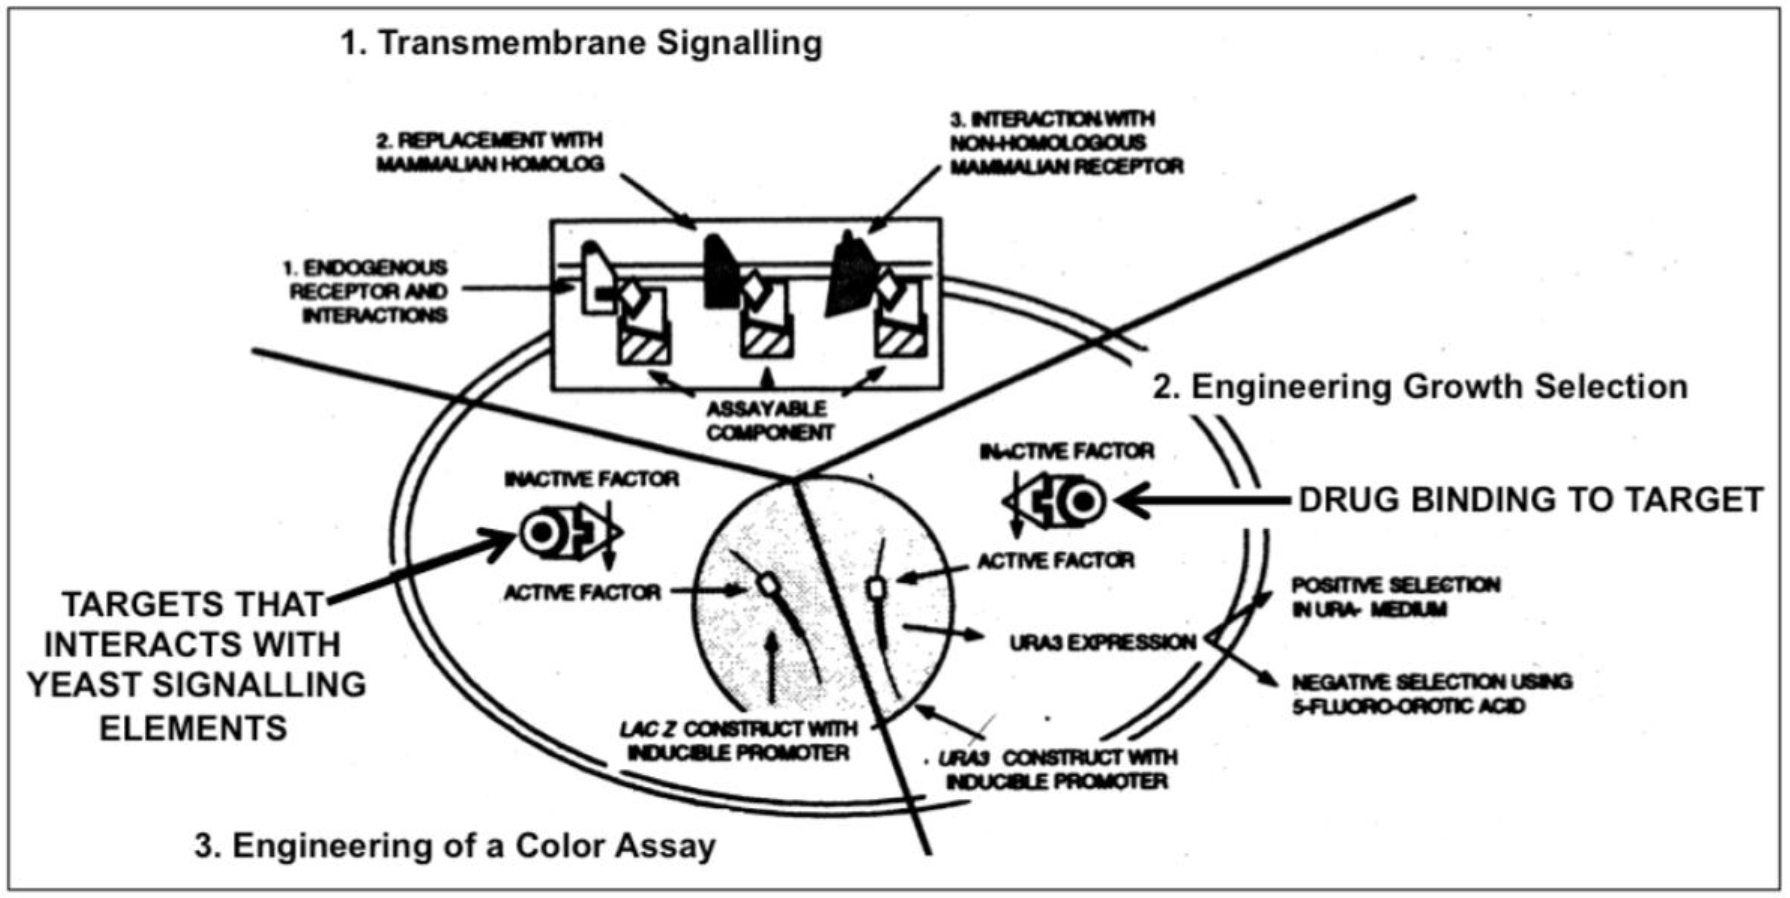
Association between Body Composition and Disease Severity in Patients with Motor Neuron Disease / Amyotrophic Lateral Sclerosis

DOI: 10.31038/ASMHS.2019311

Abstract

The change in nutritional status is observed in patients with Motor Neuron Disease, in body composition. The electrical bio impedance method (BIA) determines lean mass, fat mass and phase angle, by estimating total body water. ALSFRS-R is used to monitor the functionality and progression of the disease.

Objective: To evaluate the composition with ALSFRS-R.

Methodology: Cross-sectional study in adult patients with conclusive diagnosis of MND. For the classification of nutritional status, BMI was used, and for body composition analysis, measurements of lean mass, fat mass, total body water and phase angle. Results: patients, with 54.8% of males with median age of 61.0 years. 77.4% presented the appendicular form of the disease. The median score of ALSFRS-R was 27 points, and the average BMI was 22.6 kg / m2. The phase angle had an average of 3.9 in women, and 4.1 in men. For statistical analysis, results with a probability of type I error lower than 5% (p <0.05 and p <0.001) were considered as statistically significant. The BMI and phase angle were correlated with the scale scores.

Conclusion: Nutritional status is directly related to disease progression, and depletion of body compartments influences the functionality of patients with MND.

Keywords

amyotrophic lateral sclerosis, body composition, nutritional state, functionality

Introduction

Motor neuron disease (MND) is a progressive, degenerative hyper catabolic disease with involvement of the motor neurons of the cortex, brain stem and spinal cord [1]. Due to the symptoms and the rapid progression of the disease, depletion of nutritional status is observed. Patients present a reduction in the lean mass inherent to disease progression, and the increase in body fat may be positively associated with disease progression [2].

Electrical bio impedance is a tool used to analyze body composition, and it is classified as a gold standard for evaluation in MND [3].The interpretation of the phase angle, allows the measurement of the body changes, and was proposed as an index of malnutrition, or prognostic factor of survival in other diseases. The association of the evaluation of the body composition with the functionality of these patients may help in the treatment of the evolution of the MND / ALS [4].

Hence, the objective of this work is to evaluate the body composition and to analyze the association of the nutritional state with the functionality of patients with MND.

Methods

A cross-sectional study carried out at the Neuromuscular Disease Research Section of the Federal University of São Paulo, approved by the Ethics and Research Committee of the University, under number 0606/2016, with authorization to participate, through a signed Free and Informed Consent Form.

The study was carried out from March to July 2016. Adult patients with a defined diagnosis were included [5]. Patients who did not tolerate being in the supine position for the examination were also excluded from the study.

For the analysis of the body composition, the Bio impedance device “BIODYNAMICS MODELO 450” was used, which provides clinical data of Body Composition and Hydration, such as body fat, total body water, lean mass and phase angle with precision of +/- 0.2 %.

The Amyotrophic Lateral Sclerosis Functional Rating Scale (ALSFRS-R) was applied, analyzed in two ways: by total score, and by domains (bulbar, appendicular and respiratory).

Regarding statistical analysis, the categorical variables were described in absolute value and relative frequency, whereas the continuous variables were described through measures of central tendency, dispersion and position.

Linear correlations between the anthropometric indicators (BMI, body water, lean mass, fat mass and phase angle) and the scores obtained in the ALSFRS-R functionality scale (total score and in the domains) were plotted according to Pearson’s method. After that, linear regression analyzes, the average to verify the extent (β) of the correlation between these indicators and the scale score were performed. The analyzes were performed with the aid of the statistical package IBM SPSS version 20.0.Results with a probability of Type I error of less than 5% were considered as statistically significant.

Results

The sample consisted of 31 patients, 12 adults and 19 elderly. There was prevalence of males and in a median age of 61 years, ranging from 22 to 80 years. Body composition was evaluated without distinction of age.

More than two thirds of the patients (77.4%) presented the appendicular form of the disease, and approximately 10% of the patients presented familial origin.

The mean time from onset of symptoms to the time of evaluation was 32.4 months (8.4 – 86.4). The median ALSFRS-R score was 27.0 points (8–39). The respiratory domain had the highest median score, followed by the appendicular and bulbar domains.

Regarding weight loss, 80.6% of the patients reported weight loss from the onset of symptoms, of which 64% had a loss greater than 10% of the previous weight. The median body mass index was 22.6 kg / m2 (11.8 – 34.6 kg/m2) and approximately 45% of the patients were in the eutrophic range, according to the BMI classification.

The bio impedance method identified 30.9% of fat mass, 67.6% of lean mass and 30.4% of total body water in the studied sample. The phase angle, measured using the bio impedance method, averaged 3.9 degrees in women and 4.1 degrees in men.

Table 2 shows the correlation matrix between the anthropometric indicators and the scale score in the three different domains, in addition to the total score observed. In general, BMI and Phase Angle were the best indicators correlated with the scale scores. The BMI showed significant correlations (p <0.001), directly proportional, with the score in the bulbar and respiratory domains, in addition to the total score.

Table 1. Demographics of the study population

Subject

N

%

 Gender

Male

17

54, 8

Female

14

45, 2

Age in years

Average (min – max)

61, 0 (22 – 80)

Elderly (≥ 60 years)

18

58, 1

Disease manifestation form

Appendicular

24

 77, 4

Bulbar

7

 22, 6

Time of onset of symptoms (months)

Average(min – max)

32, 4 (8, 4 – 86, 4)

ALSFRS-R, domains – average (min – max)

Bulbar

9, 0 (0 – 12)

Appendicular

9, 0 (0 – 20)

Respiratory

10, 0 (4 – 12)

ALSFRS-R, total score – average (min – max)

Total

27 (8 – 39)

Body mass index (kg/m²) – average (min – max)

 Male

 23, 0 (17, 6 – 32, 2)

 Female

 22, 9 (11, 8 – 32, 4)

Fat mass– average (min – max)

 Male

 29, 2 (13, 7 – 43, 3)

 Female

 34, 2 (19, 2 – 55, 2)

Lean mass –average (min – max)

 Male

 70, 7 (56, 7 – 86, 3)

 Female

 60, 6 (33, 7 – 74, 3)

Total body water (L) – average (min – max)

 Male

 34, 9 (16 – 51, 4)

 Female

 27, 6 (18, 4 -35, 4)

Phase angle (º) – average (min – max)

 Male

 4, 1 (2, 8 – 6)

 Female

 3, 9 (2, 4 – 6, 3)

Table 2. Matrix of correlations between anthropometric indicators and the scores obtained on the ALSFRS-R scale.

 ALSFRS-R

 Subject

Bulbar

Appendicular

Respiratory

Total

BMI (Kg/m2)

0, 555**

0, 169

0, 370**

0, 492**

Fat mass (%)

-0, 045

-0, 129

-0, 065

-0, 141

Lean mass (%)

-0, 024

0, 171

0, 014

0, 128

Body water (L)

0, 367**

0, 174

0, 335*

0, 402**

Phase angle (°)

0, 152

0, 659***

0, 516***

0, 744***

*P<0, 10
**P<0, 05
***P<0, 001

The phase angle showed significant correlations of at least moderate intensity (p <0.05), with the scores observed in the appendicular and respiratory domains of the scale, besides the total score obtained. The total body water measure also correlated positively with the bulbar domains and the total score. On the other hand, the indicators of body fat mass and lean mass did not show a significant correlation with the scale scores.

The results of the linear regression (Figure 1) point to an average increment of 5.63 (CI 95% 3.70 – 7.55) points in the scale at each degree measured in the phase angle. However, for each liter of total body water measured, there is an average increment of 0.42 (95% CI 0.05 – 0.75) points in the scale, and for each BMI unit, an average increase of approximately 0.95 (95% CI 0.31 – 1.58) points on the scale can be inferred.

ASMHS 2019-101- Rafella Brazil_F1

Figure 1. Body composition x functionality

Discussion

The epidemiological and clinical characteristics observed in patients with MND in this study are in agreement with the evidence described in the literature [6]. Being a relatively rare disease, the sample studied is sufficient to represent changes in the body composition of patients with DNM [7]. Patients older than 60 years were considered elderly, since, according to the World Health Organization, this is the cut age for developing countries, in which Brazil fits in [8]. Variables that were not nutritional factors were used to characterize the sample, but were excluded from the analysis.

Most of the patients in this study, representing 75% of the sample, presented the appendicular form as manifestation of the disease. It can also be observed that, there was predominance of the sporadic form on the familial one, which represented approximately 10% of the patients, as described in the literature [9, 10].

Studies have observed that patients with MND often present marked weight loss from the onset of symptoms [11], and JAWAID et al. described that weight loss is a negative prognostic factor for patients with MND [12]. In this study, the majority of patients (80.6%) reported weight loss from the onset of clinical symptoms, with 64% of them presenting a marked loss greater than 10% of the previous weight. This condition can be attributed to the characteristic picture of dysphagia, decreased food intake, hyper metabolism and increased energy expenditure [13]. It was observed that, in the present study, dysphagia was present in 100% of the bulbar patients, and among the patients with appendicitis, bulbar involvement was not recurrent. However, it is suggested that the hyper catabolic state may begin before the clinical manifestation of the disease [14].

BMI can be used as a predictor of progression and survival [14]. Some studies have described an association between the change in BMI and the clinical course of the disease, and evidence that survival is better in overweight patients compared to eutrophic or low-weight patients [11, 14, 15]. Other studies have shown that changes in BMI in the first two years after diagnosis correlate significantly with survival, and with the rate of progression of motor symptoms [12]. This faces the present study, where the BMI of the evaluated patients demonstrated significant, directly proportional correlations with the full score of the functionality scale. On the other hand, authors observed that there was an increase in mortality in patients with a higher BMI (above 35), and suggest that obesity may be related to a more rapid progression of the disease with reasons not yet elucidated [13, 16].

Previous studies have observed that there is a decrease in body weight, BMI, lean mass, phase angle, and an increase in fat mass during the course of the disease, and that depletion of lean mass has a negative impact on functionality and such thing is a prognostic factor for the survival decrease [17–19]. Fat mass is associated with a better outcome of the disease [20]. Authors suggest that increased LDL / HDL cholesterol may be related to neuronal protection and increased survival [15, 18]. Regarding body water, in this present study, the measure of this variable was positively correlated with the bulbar domains and the total score of the ALSFRS-R scale. Thus, for each liter of total body water measured, there was an average increase of 0.42 (95% CI 0.05 to 0.75) in the scale.

This fact is in agreement with the literature, which attributes to hydration as one of the most sensitive factors of malnutrition, and that the phase angle can also be interpreted as an indicator of water distribution between the extra and intra-cellular compartment, and that the better the phase angle, the better the cell membrane integrity [20].

In patients with MND, there is a probable relationship between phase angle and malnutrition, since the alteration of this indicator was higher in malnourished patients than in eutrophic ones [4]. In a study involving patients with MND and phase angle, the authors showed that there was significant worsening of the phase angle in these, and the same suggests that the phase angle could be used as a severity index [3]. The literature also describes that BMI and phase angle are independently associated with survival, and do not correlate with each other. This fact was also observed in this present study.

The reference value for healthy population of the phase angle is approximately 6.5º +/- 1º for females, and 7.5º +/- 1, 1º for males [3]. In this study, the phase angle averaged 3, 9º in women, and 4, 1º in men, as those found in the literature in patients with MND, where the average phase angle for women was 3, 8º , and for men of 4, 5º [20].

Authors demonstrated that there was a decline of the ALSFRS-R scale in the first 5 years of diagnosis of the evaluated patients [21]. The same study also noted that the higher the rate of decline in ALSFRS-R, the lower the survival. Considering that the literature assigns a gravity index to the phase angle, it was observed that in this present study there was a relation between the scale of functionality and the phase angle. The phase angle presented significant correlations of at least moderate intensity with the scores observed in the appendicular and respiratory domains of the scale, in addition to the total score obtained. There is agreement of the relationship between the phase angle and the appendicular domain, considering that the caloric restriction exacerbates the motor symptoms [18]. The results of the linear regression point to an average increase of 5.63 (95% CI 3.70 – 7.55) points in the scale, to every degree measured in the phase angle. However, as it is a cross-sectional study, it was not possible to evaluate the association between phase angle, ALSFRS-R and survival.

Bio impedance is a simple and easy to apply method, but the use in clinical practice to evaluate patients with MND may present limitations and bias for some measures, since the corporal distribution of these patients may behave differently, [20] once there is a difference in the fat distribution, as well as hydration. Although bio impedance monitors body composition more fractionally, body weight assessment should be a priority, once it is from its variation and monitoring that nutritional intervention is guided, and that BMI at the time of diagnosis can be considered a factor prognosis [17]. It is essential that the care invested be interdisciplinary to ensure the optimization of the quality of life of these patients. Studies confirm that patients who receive care from a multiprofessional team tend to have better survival compared to those who are deprived of these care [9]. All things considered, monitoring of nutritional status becomes indispensable for a better course of the disease.

Final considerations

The nutritional status is directly related to disease progression, and the depletion of the body compartments influences the functionality of patients with MND. BMI is a prognostic indicator and should be used as monitoring during the course of the disease. ALSFRS-R provides data that allows monitoring the evolution of the disease in a generalized way and by domains, allowing a more sensitive and focused observation of the bulbar, motor and / or respiratory alterations resulting from the disease, guiding the professional conduct and treatment.

The evaluation of body composition provides information that aggregates in the individualization of the nutritional therapy. The phase angle is an excellent predictor of severity, and concomitant with the application of ALSFRS-R, it is possible to notice that the alteration of the body composition has a direct and negative impact on the functionality of these patients.

References

  1. Bastos AF, Orsini M, Machado D, Mello MP, Nader S (2011) Amyotrophic lateral sclerosis: one or multiple causes? Neurol Int 3: e4. [crossref]
  2. Silva LBC, Mourão LF, Silva AA, Lima NMFV, Almeida SR, et al. (2010) Effect of nutritional supplementation with milk whey proteins in amyotrophic lateral sclerosis patients. Arq Neuro-Psiquiatr 68: 263–268. [crossref]
  3. Desport JC, Preux PM, Bouteloup-Demange C, Clavelou P, Beaufrère B, et al. (2003) Validation of bioelectrical impedance analysis in patients with amyotrophic lateral sclerosis. Am J Clin Nutr 77:1179–1185. [crossref]
  4. Desport JC, Marin B, Funalot BT, Preux PM, Couratier P (2008) Phase angle is a prognostic factor for survival in amyotrophic lateral sclerosis. Amyotroph Lateral Scler 9: 273–278. [crossref]
  5. Brooks BR, Miller RG, Swash M, Munsat TL (2000) El Escorial revisited: reviserd criterial for the diagnosis of amyotroph lateral sclerosis. Amyotroph Lateral Scler Other Motor Neuron Disord 1: 293–299. [crossref]
  6. Nieves JW, Gennings C, Factor-Litvak P, Hupf J, Singleton J, et al. (2016) Association Between Dietary Intake and Function in Amyotrophic Lateral Sclerosis. JAMA Neurol 73: 1425–1432. [crossref]
  7. Chiò A, Logroscino G, Traynor BJ, Collins J, Simeone JC, et al. (2013) Global epidemiology of amyotrophic lateral sclerosis: a systematic review of the published literature. Neuroepidemiology 41:118–130. [crossref]
  8. WHO (2002) Active Ageing-A Police Framework. A Contribution of the World Health Organization to the second United Nations World Assembly on Aging. Madrid, Spain.
  9. Phukan J, Hardiman O (2009) The management of amyotrophic lateral sclerosis. J Neurol 256: 176–186. [crossref]
  10. Leigh PN, Abrahams S, Al-Chalabi A, Ampong MA, Goldstein LH, et al. (2003) The management of motor neurone disease. J Neurol Neurosurg Psychiatry 74 Suppl 4: iv32–32iv47. [crossref]
  11. Shimizu T, Nagaoka U, Nakayama Y, Kawata A, Kugimoto C, et al. (2012) Reduction rate of body mass index predicts prognosis for survival in amyotrophic lateral sclerosis: A multicenter study in Japan. Amyotroph Lateral Scler 13: 363–366. [crossref]
  12. Jawaid L, Murthy SB, Wilson AM, Qureshi SU, Amro MJ, et al. (2010) A decrease in body mass index is associated with faster progression of motor symptoms and shorter survival in ALS. Amyotroph Lateral Scler 11: 542–548. [crossref]
  13. Paganoni S, Deng J, Jaffa M, Cudkwicz ME, Wills AN (2011) Body mass index, not dyslipidemia, is an independent predictor of survival in amyotrophic lateral sclerosis. Muscle Nerve 44: 20–24. [crossref]
  14. O’reilly JE, Wang H, Weisskopf MG, Fitzgerald KC, Falcone G, et al. (2012) Premorbid body mass index and risk of amyotrophic lateral sclerosis. Amyotroph Lateral Scler Frontotemporal Degener 14: 205–211. [crossref]
  15. Dorst J, Kühnlein P, Hendrich C, Kassubek J, Sperfeld AD, et al. (2011) Patients with elevated triglyceride and cholesterol serum levels have a prolonged survival in amyotrophic lateral sclerosis. J Neurol 258: 613–617. [crossref]
  16. Reich-Slotky R, Andrews J, Cheng B, Buchsbaum R, Leyv D, et al. (2013) Body mass index (BMI) as predictor of ALSFRS-R score decline in ALS patients. Amyotroph Lateral Scler Frontotemporal Degener 14: 212–216. [crossref]
  17. Marin B, Desport JC, Kajeu P, Jesus P, Nicolaud B, et al. (2010) Alteration of nutritional status at diagnosis is a prognostic factor for survival of amyotrophic lateral sclerosis patients. J Neurol Neurosurg Psychiatry 82: 628–634. [crossref]
  18. Dupuis L, Corcia P, Fergani A, Aguilar JLG, Bonnefont-Rousselor D, et al. (2008) Dyslipidemia is a protective factor in amyotrophic lateral sclerosis. Neurology 70: 1004–1009. [crossref]
  19. Dorst J, Cypionka J, Ludolph AC (2013) High-caloric food supplements in the treatment of amyotrophic lateral sclerosis: A prospective interventional study. Amyotroph Lateral Scler Frontotemporal Degener 14: 533–536. [crossref]
  20. Roubeau V, Blasco H, Maillot F, Corcia P, Praline J (2015) Nutritional Assessment of Amyotrophic lateral sclerosis in routine practice: value of weighing and bioelectrical impedance analysis. Muscle Nerve 51: 479–484. [crossref]
  21. Gordon PH, Cheng B, Salachas F, Pradat PF, Bruneteau G, et al. (2010) Progression in ALS is not linear but is curvilinear. J Neurol 257: 1713–1717. [crossref]

Neonatal Outcomes of Macrosomic New-Borns (4,000g +) of Diabetic and Non Diabetic Mothers: A Study of 1,391 Singleton New-Borns

DOI: 10.31038/IGOJ.2019212

Abstract

Objective: To explore the association between diabetic status of the mother and subsequent pregnancy outcomes in a cohort of macrosomic births (birth weight ≥ 4000 grams).

Design: Historical cohort study of macrosomic births comparing delivery method, newborn injury, and newborn morphology between diabetic and non-diabetic women.

Setting: Centre Hospitalier Universitaire Sud-Reunion’s maternity (island of La Reunion, French overseas department, Indian Ocean)

Population: All consecutive singleton live macrosomic births delivered from 2009–2017.

Methods: Macrosomic births were identified from the hospital and the medical records of the mother and newborn were abstracted. Pregnancy outcomes (method of delivery, newborn injury, and newborn morphology) were contrasted between diabetic and non-diabetic women. Among those delivered vaginally, we compared newborn injury between groups.

Results: Newborns from diabetic mothers (cases: 206) were slightly heavier while being younger in gestational ages than controls. There were more caesarean deliveries in the diabetic group (48.8% vs 22.5%, p< 0.001). Among diabetic newborns with vaginal deliveries (ap. half of all diabetic), there were more newborn injuries (brachial plexus, clavicle fractures) in the diabetic group (OR 2.5, p = 0.01) than in controls. A logistic regression model taking into account maternal pre-pregnancy BMI and fetal BW gave an adjusted Odds Ratio for newborn injuries of 2.29 (p = 0.03) in diabetic deliveries.

Conclusion: Among macrosomic deliveries (BW ≥ 4000g), newborns from diabetic mothers have more injuries than controls. This risk remains after controlling for pre-pregnant BMI and newborn birth weight. These data confirm that diabetic-macrosomic newborns may present a different truncular obesity than non-diabetics.

Keywords

Cesarean Delivery, Overweight, Shoulder dystocia, Pre-pregnancy Adiposity,

Introduction

This historical cohort study was conducted to test the hypothesis that pregnancy outcomes of macrosomic newborns (≥ 4000g) might be different according to the diabetic status of parturients. This information may have important implications for clinical management of these pregnancies. Some authors have reported a different morphology in heavy babies according to the diabetic status of the mother. In diabetic pregnancies, as compared to non-diabetic pregnancies, repartition of fetal adiposity may be predominant in the upper part of the body (fetal truncular obesity), inducing a greater risk of shoulder dystocia in these cases [1–6]. This may be particularity so in gestational diabetes and is therefore of paramount importance in clinical management with respect to mode of delivery. The data for this investigation were obtained from the computerized perinatal data base of more than 35,000 deliveries from nine years of practice at the Centre Hospitalier Universitaire Sud-Reunion’s maternity.

Material and Methods

From January 1st, 2009, to December 31st, 2017, the hospital records of all women delivered at the Centre Hospitalier Universitaire Sud-Reunion’s maternity were abstracted in standardized fashion. All data were entered into an epidemiological perinatal data base which contained information on obstetrical risk factors, description of deliveries and neonatal outcomes. As participants in the French national health care system, all pregnant women in Reunion Island have their prenatal visits, biological and echographical examinations, and anthropological characteristics recorded in their maternity booklet. Maternal pre-pregnant body mass index (BMI) was defined as the ratio of pre-pregnancy weight in kilograms divided by height in meters squared (kg/m²).

Screening for gestational diabetes was performed by the O’Sullivan test between 24 and 28 weeks gestation (ingestion of 50g glucose, followed one hour later by a glycaemia, the cut-off value being 1.4 g/l). The diagnostic test was then the oral glucose tolerance test (OGTT, ingestion of 100g glucose, followed by measurements of glycaemia 1, 2 and 3 hours after ingestion (cut-off values respectively being 0.95 g/l, 1.8 g/l, 1.55 g/l and 1.40 g/l). Diagnosis of gestational diabetes was performed when at least 2 glycemic measurements were above the cut-off values during the OGTT.

Epidemiological data have been recorded and analysed with the software EPI-INFO 7.1.5 (2008, CDC Atlanta, OMS), EPIDATA 3.0 and EPIDATA Analysis V2.2.2.183. and statistical analysis by Stata 7.

Results

During the nine year study period, there were 35,459 singleton live births of which 1,391 (3.9%) newborns weighing 4000g or more.

Table 1 compares macrosome newborns (BW ≥ 4000g) according the diabetes status of their mothers during pregnancy. In diabetic pregnancies, 88% (182/206) were gestational diabetes while 24 presented a preexisting diabetes mellitus. Newborns from diabetic mothers were slightly heavier than controls (44g in average, p = 0.002) but with a lower gestational age at birth (38.6 weeks vs 39.7 weeks,
p < 0,001).

Table 1. Diabetic and non diabetic macrosomes (≥ 4000g). Singleton live births

Macrosomes ≥ 4000g

Diabetic mothers

N=206

(%)

Macrosomes ≥ 4000g

Non-Diabetic mothers

N=1,185

(%)

Odds Ratio


[95% CI]

p

Mean Birthweight (g)

± SD

4247 ± 235

4203 ± 187

_

0.002

Mean Gestational Age (Weeks)

± SD

38.6 ± 1.2

39.7 ± 1.2

_

<0,001

Caesarian sections

(%)

101

(49.0)

266

(22.4)

3.3

[2.4–4.5]

<0.001

Induced deliveries

70

(33.9)

307

(25.9)

1.46

[1.05–2.0]

0.02

% of induced deliveries with a C-section issue

17/70

(24.3)

86/307

(28.0)

_

NS

Abnormal fetal monitoring*

18

(8.7)

157

(13.2)

_

NS

Fluid or thick meconium staining

36

(17.4)

279

(23.5)

0.68

[0.45–1.0]

0.05

APGAR ≤ 6

15

(7.3)

41

(3.4)

2.2

[1.1–4.2]

0.01

Transfers in neonatology

11

(5.3)

44

(3.7)

_

NS

Gestational diabetes

182

0

_

_

Preexisting Diabetes

24

0

_

_

Pre-pregnancy maternal BMI, Kg/m² ± SD

30.1 ± 6,8

n= 200

26.1 ± 5.6

N= 1140

< 0.001

* Abnormal fetal monitoring: Dip2, fetal bradycardia 10 minutes minimum, flat line.

There were significantly (incidence almost doubled) more Cesarean sections in diabetics (48.8% vs 22.5%, OR 3.3, p<0.001). There were more induced deliveries in diabetics than in controls (33.8% vs 25.9%, OR 1.4, p = 0.02), but in both groups, failures of induction (leading to a C-section) were similar. There was less meconium staining in diabetics (OR 0.68, p = 0.05) and a greater incidence of Apgar 3 mn scores less than 7, (7.2% vs 3.4% OR 2.2, p = 0.01) than in controls. There were no differences in transfers of newborns to a neonatal intensive care unit (NICU) or abnormal fetal monitoring during labour.

Table 2 analyzes vaginal deliveries (N = 1,024) in both groups of macrosomes. Instrumental extractions (vacuum, forceps) and transfers of newborns to the NICU were not statistically significant in both groups. There was significantly more fetal trauma (clavicle fractures and/or brachial plexus) in diabetics (OR 2.5, p = 0.02) and Apgar 3 mn scores less than 7 (OR 3.7, P< 0.001). In non-diabetic macrosomes, two infants presented with both clavicle fractures and brachial plexus.

Table 2. Obstetrical traumatisms in vaginal deliveries. Diabetic and non-diabetic macrosomes (≥ 4000g). Singleton live births

Macrosomes ≥ 4000g

Diabetic mothers

N= 106

(%)

Macrosomes ≥ 4000g

Nondiabetic mothers

N= 918

(%)

Odds Ratio


[95% IC]

p-value

Instrumental Extractions (vacuum, forceps)

9

(8.5)

102

(11.1)

_

NS

Obstetrical Traumatisms

(Clavicles and/or brachial plexus)

11

(10.4)

40

(4.4)

2.5

[1.2–5.3]

0.01

Clavicle fractures

8

(7.5)

26

(2.8)

2.8

[1.1–6.8]

0.02#

Brachial Plexus

3

(2.8)

16

(1.7)

_

NS

APGAR ≤ 6

11

(10.4)

28

(3.1)

3.7

[1.7–8.0]

<0.001

Transfers in neonatology

4

(5.7)

14

(3.2)

NS

Pre-pregnancy maternal BMI Kg/m² ± SD.

30.0 ± 6,6

n= 105

25.8 ± 5,6

n= 885

< 0.001

* Cephalic vaginal deliveries : breeches (N= 1) and deliveries « en route » (N= 3) excluded
# Fisher exact test

Table 3 depicts the logistic regression model for fetal trauma (brachial plexus and/or clavicle fracture) in cephalic vaginal deliveries, controlling for maternal pre-pregnancy body mass index and fetal birthweight in diabetic and nondiabetic mothers. Out of 1,024 vaginal deliveries, breech presentation (N = 1) and “en route” deliveries (N = 3) were excluded. Pre-pregnancy maternal body mass index were recorded in 990 mothers (96.5%). In this cohort, the crude odds ratio for fetal trauma was slightly different than the entire cohort of 1,024 women, see Table 2 (2.37 [1.14–4.91], p = 0.02 vs 2.5 [1.2–5.3], p = 0.01, respectively).

Table 3. Logistic regression model: Obstetrical trauma (brachial plexus and/or clavicle fracture) in vaginal birth of newborns ≥ 4000g BW.
Controlling for pre-pregnancy maternal Body Mass Index (BMI) and fetal birth weight.
There were 1,024 vaginal deliveries in our cohort, of which 990 (96.5%) record of pre-pregnancy maternal BMI.

Logistic model

Odds Ratio [95% CI]

P-value

BW 4250–4499g

0.67 [0.29–1.6]

0.36

BW 4500–4749g

2.5 [0.99–6.5]

0.053

BW ≥ 4750g

6.7 [1.9–23.0]

0.002

Maternal BMI

< 18.5 kg/m²

5.4 [1.6–18.2]

0.006

Maternal BMI

25.0–29.9 kg/m²

2.48 [1.17–5.2]

0.02

Maternal BMI

30.0–34.9 kg/m²

2.56 [1.08–6.08]

0.03

Maternal BMI

≥ 35.0 kg/m²

0.58 [0.12–2.9]

0.51

Diabetic mothers

2.29 [1.05–4.98]

0.03

BW= Birthweight. 4000–4249g as reference
Maternal BMI: Pre-pregnancy Body mass index (kg/m²). 18.5–24.9 kg/m² as reference

Controlling for fetal birthweight and maternal pre-pregnancy BMI, the adjusted odds ratio in diabetic mothers for fetal trauma was similar to the crude OR: 2.29 vs 2.37, p = 0.03.

The risk for fetal trauma was predominantly in newborns over 4750g as compared with the group 4000–4250g as well as a strong tendency for newborns 4500–4750g, see Table 3. Association with maternal BMI was less specific (notably in women over 35 kg/m²).

Discussion

The Centre Hospitalier Universitaire Sud-Reunion’s maternity (European standards of care) is the only public hospital in the southern part of Reunion Island (Indian Ocean, French overseas department). It serves the whole population of the area, and with 4,300 births per year, represents 80% of all births in the South. Results of the present study suggest that knowledge of macrosomia prior to delivery may affect obstetrical management between diabetic and non-diabetic mothers with respect to the risk of shoulder dystocia and possible consequences for the newborn. In our experience, macrosomes present more obstetrical trauma in vaginal delivery, even though the incidence of Cesareans is almost double that in non-diabetic mothers (OR 3.3, p< 0.001, Table 1), as already previously described in our population [7].

Several studies have reported higher neonatal morbidity and mortality risks in macrosomes delivered to diabetics as compared to non-diabetics [8–12]. Christoffersson et al describe a perinatal mortality of 1.2% in non-diabetic patients with shoulder dystocia versus 6.4% in diabetic mothers [12]. Nesbitt et al in a study of 175,886 births of newborns weighing more than 3,500g report a 3% incidence of shoulder dystocia (6,238 patients) [13]. Again, the incidence of shoulder dystocia was higher in diabetic mothers as compared with non-diabetics and directly correlated with the degree of macrosomia, diabetes (OR = 1.7), instumental extraction (OR 1.9) and induced delivery (OR = 1.3) being independently associated with shoulder dystocia. Saleh et al also describe a higher incidence of trauma (1.9% vs 0.2%) in macrosomes from diabetic mothers [14]. In studies comparing the incidence of fetal trauma, Casey et al [15] compared 61,209 non-diabetic patients with 874 diabetics and found that, among the diabetics, there was more shoulder dystocia and a significantly higher incidence of clavicle fractures while the incidence brachial was not significantly different. For Ecker et al , in 80 newborns having a plexus brachial injury at birth, 10 were from diabetic mothers (OR 2.84, p< 0.01) [16]. Conversely, in a study by Das et al, in the USA, reported a higher incidence of trauma in macrososmes of non-diabetic mothers. Vaginal deliveries occurred in 70% of cases in non-diabetic mothers with macrosomia while it was 34% in diabetic macrosomes [17]. In a recent study of 899 mothers whose babies weighed 3,500g or more, Mansor et al argue that macrosomia is the only reliable predictor of shoulder dystocia, while in their logistic model diabetes and instrumental deliveries were independently associated with that shoulder dystocia [18]. Recently, authors from Sweden however could not find an association between diabetes and shoulder dystocia (but their definition of macrosomia was ≥ 4500g) [19]

Our results are consistent with the hypothesis that foetuses weighing more than 4000g present a different anthropometry (adiposity) in diabetic and nondiabetic mothers. In our perinatal database the variable « shoulder dystocia » is not individualized as such. That is why in this study we used indirect measures of obstetrical complications (Apgar 3mn < 7, brachial plexus and/or clavicle fractures) in women having delivered vaginally. This finding could be interpreted as primarily associated with a higher rate of maternal obesity (see Table 2) which could influence negatively the obstetrical mechanics for maternal pre-pregnancy corpulence and babies’ birthweights. Results from the logistic regression (Table 3) on the 990 macrosomic vaginal births depicted similar odds ratios adjusting for BMI and birthweight: adjusted OR = 2.29 as compared to a unadjusted OR = 2.37, (p = 0.02 crude OR, p = 0.03 aOR), with a predominant risk for babies weighing more than 4,750g, and a strong tendency for those of 4,500–4,750g .

Other authors have described that diabetes by itself may be an independent risk factor responsible for a particular fetal morphology in macrosomes [1–3,5,20]. Macrosomes from diabetic mothers present an increase of the scapular diameter and a four centimeter average difference between the shoulder width and upper biparietal diameter as compared with macrosomes from non-diabetic mothers [5]. However, measurement of the shoulder width has low predictive value for shoulder dystocia, even if it can be evaluted by MRI [6]. For ultrasonographies, based one two-dimensional ultrasound formulae, accuracy is low, particularly at advanced gestation [21,22]. Three-dimensional ultrasound could be useful to monitor soft tissues [21]. Besides these problems, adiposity is well known to be more important in diabetic macrosomes. The fat mass evaluated by absorptiometry represents 30% of the body mass in newborns from diabetic mothers while it represents 15% in non-newborns of diabetic mothers [23–24]. Nasrat et al report a significant increase of sub-cutaneous fat thickness in 51 newborns from diabetic mothers, while height or biparietal diameter are similar in both groups, suggesting a disproportionate development of these fetuses [2]. McFarland et al report an increase of the shoulder width, a decrease of the head/shoulder ratio, an increase of the adipose tissue, and larger extremities in newborns of diabetic mothers [1]. Also Acker et al explain the higher risk of shoulder dystocia in newborns of diabetic mothers by a different composition of tissues and fat repartition than in controls [9].

Conclusion

Obstetricians or midwives face the dilemma of decisions on mode of delivery for women with preexisting or gestational diabetes mellitus. In these deliveries, the risk for shoulder dystocia is well-known. Our study suggests that diabetes by itself is an independent risk factor of fetal trauma in case of macrosomia. When a macrosomia is detected in the maternity ward, diabetes is a major contributor in the obstetrical decision for the mode of delivery.

References

  1. McFarland MB, Trylovich CG, Langer O (1998) Anthropometric differences in macrosomic infants of diabetic and nondiabetic mothers. J Matern Fetal Med 7: 292–295.
  2. Nasrat H, Abalkhail B, Fageeh W, Shabat A, el Zahrany F (1997) Anthropometric measurement of newborns of gestational diabetic mothers: does it indicate disproportionate fetal growth? J Matern Fetal Med 6: 291–295.
  3. Ballard JL, Rosenn B, Khoury JC, Miodovnik M (1993) Diabetic fetal macrosomia: significance of disproportionate growth. J Pediatr 122: 115–119.
  4. Collège National des Gynécologues et Obstétriciens Français (1999) Recommandations pour la pratique clinique. Diabète gestationnel. Encycl Méd Chir (Elservier, Paris), Gynécologie/Obstétrique 5-042-C-20.
  5. Modanlou HD, Komatsu G, Dorchester W, Freeman RK, Bosu SK (1982) Large-for-gestational-age neonates:anthropometric reasons for shoulder dystocia. Obstet Gynecol 60: 417–423.
  6. Verspyck E, Goffinet F, Hellot MF, Milliez J, Marpeau L (2000) Newborn shoulder width: physiological variations and predictive value for shoulder dystocia. J Gynecol Obstet Biol Reprod (Paris) 29: 192–196.
  7. Vivet-Lefébure A, Roman H, Robillard PY, Laffitte A, Hulsey TC, et al. (2007) Obstetrical and neonatal outcomes of gestatonal diabetes mellitus at Reunion island. Gynecol Obstet Fertil 35: 530–535.
  8. Esakoff TF, Cheng YW, Sparks TN, Caughey AB (2009) The association between birthweights 4000g or greater and perinatal outcomes in patients with and without gestational diabetes mellitus. Am J Obstet Gynecol 200: 672–674.
  9. Acker DB, Sachs BP, Friedman EA (1985) Risk factors for shoulder dystocia. Obstet Gynecol 66: 762–768.
  10. Dildy GA, Clark SL (2000) Shoulder dystocia: risk identification. Clin Obstet Gynecol 43: 265–282.
  11. Rouse DJ, Owen J, Goldenberg RL, Cliver SP (1996) the effectiveness and costs of elective cesarean delivery for fetal macrosomia diagnosed by ultrasound. JAMA 276:1480–1486.
  12. Christoffersson M, Rydhstroem H (2002) Shoulder dystocia and brachial plexus injury: a population-based study. Gynecol Obstet Invest 53: 42–47.
  13. Nesbitt TS, Gilbert WM, Herrchen B (1998) Shoulder dystocia and associated risk factors with macrosomic infants born in California. Am J Obstet Gynecol 179: 476–480.
  14. Saleh A, Al-Sultan SM, Moria AM, Rafak FI, Turkistani YM, et al. (2008) Fetal macrosomia greater or equal to 4000 grams. Comparing maternal and neonatal outcomes in diabetic and nondiabetic women. Saudi Med J 29: 1463–1469.
  15. Casey BM, Lucas MJ, Mcintire DD, Leveno KJ (1997) Pregnancy outcomes in women with gestational diabetes compared with the general obstetric population. Obstet Gynecol 90: 869–873.
  16. Ecker JL, Greenberg JA, Norwitz ER, Nadel AS, Repke JT (1997) Birth weight as a predictor of brachial plexus injury. Obstet Gynecol 89: 643–647.
  17. Das S, Irigoyen M, Patterson MB, Salvador A, Schutzman DL (2009) Neonatal outcomes of macrosomic births in diabetic and non-diabetic women. Arch Dis Child Fetal Neonatal 94: 419–422.
  18. Mansor A, Arumugam K, Omar SZ (2010) Macrosomia is the only reliable predictor of shoulder dystocia in babies weighing 3.5 kg or more. Eur J Obstet Gynecol Reprod Biol 149: 44–46.
  19. Turkmen S, Johansson S, Dahmoun M (2018) Foetal Macrosomia and Foetal-Maternal Outcomes at Birth. J Pregnancy 2018: 4790136.
  20. Kamana KC , Shakya S, Zhang H (2015) Gestational diabetes mellitus and macrosomia: a literature review. Ann Nutr Metab 66: 14–20.
  21. Araujo Júnior E, Peixoto AB, Zamarian AC, Elito Júnior J, Tonni G (2017) Macrosomia. Best Pract Res Clin Obstet Gynaecol 38: 83–96.
  22. Shmueli A, Salman L, Hadar E, et al. (2019) Sonographic prediction of macrosomia in pregnancies complicated by maternal diabetes: finding the best formula. Arch Gynecol Obstet 299: 97–103.
  23. Lapillonne A, Braillon P, Claris O, Chatelain PG, Delmas PD, et al. (1997) Body composition in appropriate and in small for gestational age infants. Acta Paediatr 86: 196–200.
  24. Stotland NE, Caughey AB, Breed EM, Escobar GJ (2004) Risk factors and obstetric complications associated with macrosomia. Int J Gynaecol Obstet 87: 220–226.

Formation of Distal Bone Elements in Amputated Neonatal Mouse Forelimbs

DOI: 10.31038/IJOT.2019212

Abstract

Mammalian limbs show little regeneration potency. Mouse and human limbs regenerate only finger tips. However, some Bone Morphogenetic Proteins (BMPs) stimulate the formation of a new radius and ulna on amputated distal elements of neonatal mouse forearms. In this article, we describe the formation of more distal bone elements, carpi and metacarpi-like structures, other than the radius and ulna, after forearm amputation and BMP-7 and hedgehog agonist (Hh-Ag 1.8) treatment. However, since skin and soft connective tissues at the hand level remained in the stumps in these experiments, the small bones may be formed from these hand tissues by BMP and Hh-Ag. Thus, amputation was carried out at the proximal level of the wrist. With BMP and Hh-Ag treatment, the distal ends of the radius and ulna showed bifurcated and segmented bone structures. These results suggest the formation of distal bone elements, carpi and metacarpi, from forearm tissues.

Keywords

Mouse limb, regeneration, BMP-7, hedgehog agonist

Introduction

It is well known that mammalian limbs regenerate only finger tips. In mice, a fingertip is regenerated after amputation and the regeneration is regulated by Bone Morphogenetic Proteins (BMPs) [1, 2]. We previously reported BMP-induced bone formation in amputated forearms [3]. Furthermore, BMP induced the pattern formation of forearm bones, radius and ulna, in the forelimb of a neonatal mouse from which distal halves of the radius and ulna had been removed previously [4]. A hedgehog agonist (Hh-Ag 1.8) promoted the function of BMP [4]. In an adult mouse, BMP induced bone pattern regeneration of the tibia and fibula in an amputated shank [5]. However, the regeneration stopped at the ankle and no regeneration was observed at the foot level.

In limb regeneration of urodele amphibians, an amputated forearm forms a distal forearm and a hand, new elements. Thus, it would be valuable to try to achieve formation of distal elements in mammalian limbs for regenerative medicine.

In this paper, we describe formation of the carpus and metacarpus-like branched long bone elements on the amputated radius/ulna of forelimbs of neonatal mice and also describe the formation of many skeletal protrusions on the distal ends of the radius/ulna after amputation at the wrist level.

Methods and Materials

Limb Amputation

Forelimbs were amputated with a knife at the palm, wrist or distal forearm level. When limbs were amputated at the palm level, proximal halves of metacarpi, all carpi, and distal halves of the radius and ulna were removed with small scissors.

Implantation of a Gelatin Rod Containing BMP-7 and Hh-Ag1.8

A gelatin rod containing 100 ng BMP-7 and 200 ng Hh-Ag1.8 was implanted according to the procedure described by Ide [4]. After the operation, the wound was treated with fibrin glue and surrounded with Tegaderm film.

Alcian Blue/Alizarin Red Staining

To observe the skeletal pattern, limbs were stained with Alcian blue for cartilage and Alizarin red for bone [6]. Prior to staining, most of the skin was removed and limbs were fixed in 100% ethanol.

Staining of Sectioned Limbs

Some limbs were fixed in paraformaldehyde and frozen samples were sectioned. The sections were stained with Alcian blue and/or Elastiica van Giesen [7].

Materials

Neonatals of DDY mice (SLC, Japan) at 1 to 2 days after birth were used. Procedures for care and use of mice for this study were in compliance with standard operating procedures approved by the Institutional Animal Care and Use Committee of Tohoku University and DARPA (Defence Advanced Research Project Agency).

BMP-7 (Recombinant, Human) was obtained from R&D Systems, Inc. (Minneapolis, MN). A hedgehog agonist (Hh-Ag1.8) was obtained from Curis, Inc. (Lexington MA). Tegaderm Film Roll was obtained from 3M Healthcare.

Results

Wrist and palm bone formation on truncated radius and ulna bones

As reported previously, BMP and Hh-Ag promoted formation of the radius-ulna in the forearm of neonatal mice from which distal halves of the radius and ulna had been removed previously [4]. Furthermore, isolated small bones were observed distal to the regenerated radius and ulna (Fig. 1). When only the distal halves of the radius and ulna were removed and the epidermis and soft connective tissues at the wrist and proximal palm levels remained, four to five small long bones were formed on the distal area of the newly formed radius and ulna (Fig. 2). An enlarged view revealed the formation of these small bones on a plane. Cross sections of these newly formed small bones revealed many branched structures on the distal region of forearm bones (Fig 3). This suggests that the formation of wrist and palm bones was induced by the application of BMP-7 and Hh-Ag. However, the possibility that these bones were formed from the soft connective tissues at the wrist and palm levels remains.

IJOT 19 - 107_F1

Figure 1. Skeletal pattern formation in a BMP-treated forearm amputated at the palm level.  A: Alcian blue and Alizarin red staining of the forearm showing the levels of amputation. The green line shows the amputation level. The distal half of the hand was removed. The red line shows the level of bone amputation. Metacarpi, carpi and distal halves of the radius and ulna were removed with small scissors from the hole of the amputated hand. B: Alcian blue and Alizarin red staining of newly formed bones 14 days after amputation. Two thick bones were formed at the distal side of the stump radius and ulna. Small bones were observed at the tips of these newly formed forearm bones.

IJOT 19 - 107_F2

Figure 2. Skeletal pattern formation in a BMP-treated forearm amputated at the palm level showing carpi, metacarpi and digit-like structures. Distal halves of the radius and ulna were also removed at the same time. Alcian blue and alizarin red staining. The red line in A shows the amputation level of the radius and ulna. Long bones were formed on the distal sides of the newly formed radius and ulna-like structures. Enlarged view of the distal region in A is shown in B.

IJOT 19 - 107_F3

Figure 3. Section of branched long bones stained with Elastica van Gieson and Alcian blue. The thin line in A shows the elbow. The area surrounded by a rectangle is enlarged in B. The red arrows show branched bones.

Formation of small distal bones after arm truncation at the wrist level

The styloid process of the ulna can be observed directly under a dissection microscope on the ulna of a neonatal mouse. Thus, we truncated the arm at the proximal portion of this process. Alizarin red and Alcian blue staining of the truncated arm showed no wrist tissues in the stump (Figure 4A). After 4 days, a gelatin rod containing BMP-7 and Hh-Ag 1.4 was inserted into the space between the amputated bones and wound epidermis. After 10 days, the arms were fixed and stained with Alizarin red and Alcian blue. Four or five protrusions were observed on the top of the truncated radius and ulna (Figure 4B). Some of the protrusions were separated from the radius-ulna bone. No such protrusions were observed on the radius-ulna bone without BMP-7. Only hypertrophy of the truncated portion of the radius-ulna was observed as in the case of amputated forearm bones (Figure 4C).

IJOT 19 - 107_F4

Figure 4A. Skeletal pattern of an arm amputated at the wrist level. Amputated hand and stump forearm were fixed and stained by Alcian blue and Alizarin red to confirm that hand tissues had been removed from the forearm. B: Skeletal pattern of a BMP-treated forearm showing many protrusions (red arrows) at the distal end of the forearm. C: Skeletal pattern of a non-treated forearm. Only hypertrophy (callus) of the amputation site is observed.

Discussion

Schematics of the experiments are shown in figure 5. In experiment A, distal halves of forearm bones, radius and ulna, were removed and BMP was added in the space. New distal halves of forearm bones were formed. In experiment B, hand bones, carpi and metacarpi, were formed on the distal region of the radius-ulna. It is possible that the new bones were formed from dedifferentiated tissues of the forearms. However, they may have been formed from soft tissues of the hand since only bone tissues of the hand were removed. BMP and Hh-Ag may induce differentiation of hand soft tissues that remained after hand bone removal to hand bones.

IJOT 19 - 107_F5

Figure 5. Summary of experiments on BMP-induced skeletal pattern formation. The upper diagram shows forearm and hand tissues. Red lines show the epidermis. The yellow area shows soft connective tissues and muscles. The middle diagrams show amputation levels. Violet and black dotted lines show forearm bones removed and hand bones removed, respectively. Gelatin gels containing BMP-7 and a hedgehog agonist were implanted. The lower diagrams show formation of bone patterns. Red rectangles show newly formed bones. A: Skeletal pattern of the forearm the was formed. B: Skeletal pattern of the hand that was formed. C: Many small bones were formed on the distal region of the forearm without hand tissues.

Thus, in experiment C, all hand tissues were removed and gelatin gel containing BMP and Hh-Ag was inserted in the epidermis, radius and ulna of the forearm stump. Some small bones other than the newly formed radius and ulna were formed from the forearm tissues, suggesting that these bones were formed from forearm tissues. However, no long thin bones shown in experiment B were observed. These results suggest that the soft connective tissues and/or muscle tissues of the mouse hand have the potency to form hand bones in the presence of BMP, but these tissues of the forearm have low potency to form hand bones even in the presence of BMP. That is, the acquisition of distal positional values, which is necessary for limb regeneration, may be difficult in the present mouse limb systems.

In mouse digit tips, bone formation is known to be regulated by the intercellular matrix [8] and macrophage systems [9]. These factors seem to promote bone formation also at the forearm level. By activating these factors in the BMP systems, further bone formation in the distal direction and regeneration in mouse limbs will be possible.

Acknowledgment

I thank Profs. K. Muneoka, T. Endo and A. Sato for their support and advice. We also thank Ms. N. Sagawa for assistance in staining of sections. I also thank the members of Prof. Tamura’s laboratory for providing the laboratory.

References

  1. Han M, Yang X, Farrington JE, Muneoka K (2003) Digit regeneration is regulated by Msx1 and BMP4 in fetal mice. Development 130: 5123–5132. [crossref]
  2. Yu L, Han M, Yan M, Lee EC, Lee J, et al. (2010) BMP signaling induces digit regeneration in neonatal mice. Development 137: 551–559. [crossref]
  3. Masaki H, Ide H (2007) Regeneration potency of mouse limbs. Dev Growth Differ 49: 89–98. [crossref]
  4. Ide H (2012) Bone pattern formation in mouse limbs after amputation at the forearm level. Dev Dyn 241: 435–441. [crossref]
  5. Ling Y, Han M, Yan M, Lee J, Muneoka K (2012) BMP2 induces segment-specific skeletal regeneration from digit and limb amputation by establishing a new endochondral ossification center. Dev Biol 372: 263–273. [crossref]
  6. Parr BA, McMahon AP (1995) Dorsalizing signal Wnt-7a required for normal polarity of D-V and A-P axes of mouse limb. Nature 374: 350–353. [crossref]
  7. Miura S, Hanaoka K, Togashi S (2008) Skeletogenesis in Xenopus tropicalis; Characteristic bone development in an anuran amphibian. Bone 43: 901–909. [crossref]
  8. Seifert AW, Muneoka K (2018) The blastema and epimorphic regeneration in mammals. Dev Biol 433: 190–199. [crossref]
  9. Simkin J, Sammarco MC, Marrero L, Dawson LA, Yan M, et al. (2017) Macrophages are required to coordinate mouse digit tip regeneration. Development 144: 3907–3916. [crossref]

Disgust and Sexual Dysfunctions: Treatment Implications

DOI: 10.31038/AWHC.2019215


Despite generally high prevalence of problems in sexual functioning in both men and women, the topic of sexual dysfunctioning remains an understudied phenomenon [1]. While traditionally, research focused on finding medicinal approaches to solve sexual dysfunctions (e.g. Viagra pills in erectile disorders), research increasingly started exploring psychological factors as well (e.g. sexual arousal [2]). To further attest to the relevance of psychological factors in etiological processes in sexual dysfunctions, most current psychological views consider sexual dysfunctions as the result of negative emotional responses following erotic stimulation. According to the Dual Control model [2], sexual dysfunctions may best be understood as a disturbance in the interaction between sexual excitatory and inhibitory processes. Negative emotional experiences could interfere with sexual excitatory processes and the generation of sufficient levels of sexual arousal, and render healthy sexual functioning problematic.

One negative emotion is disgust. Disgust is one of the basic human emotions and generally defined as: “revulsion at the prospect of (oral) incorporation of an offensive object.” [3]. Interestingly, disgust has a clear association with the sexual domain [4, 5]. Firstly, the function of disgust is to shield the individual from contamination with hazardous pathogens [6], so from an evolutionary perspective, disgust may also function to protect the individual against sexually transmitted diseases or to avoid sexual intercourse with partners with a strong genetic similarities (e.g., distant family) which could endanger the health of potential offspring. Secondly, sexual stimuli such as bodily fluids or contact with genitalia qualify as universally accepted disgust stimuli [3]. Further, research shows that sexual stimuli (such as pornographic imagery) can elicit disgust in healthy individuals [7, 8]. Indeed, recent research showed that disgust appraisals are significantly increased in some patients with sexual dysfunctions [9]. In sum, these findings suggest that there is a clear association between disgust and sexual (dys)functioning.

Recently, de Jong et al. [4] postulated the Give in or Get stuck Model on the interrelationship between disgust and arousal. The model suggests that experiences of disgust interfere with the generation of sexual excitatory processes, in particular, the generation of sexual arousal. While the generation of sexual arousal promotes approach behavior to a sex-relevant stimulus, disgust is to promote avoidance behavior towards the sex-relevant stimulus.

This likely disturbs the delicate balance between sexual excitatory and inhibitory processes. As disgust is a highly negative, aversive emotions, the sex-relevant stimulus could become associated with negative associations. This could create a dysfunctional feedback loop where (even the mere prospect of) future confrontations with that stimulus could already evoke negative emotions (e.g., disgust) and hinder effective sexual functioning.

As disgust is a highly negative, aversive emotion, the sex-relevant stimulus could become associated with negative associations, thus creating a dysfunctional feedback loop where (the prospect of) future confrontations with that stimulus could already evoke negative emotions and disturb the delicate balance between sexual excitatory and inhibitory processes.

Given that disgust and arousal seem important parts of healthy sexual functioning, treatment methods which focus on enhancing emotion regulation and/or arousal management, could be valuable in helping to restore the disturbed balance between excitatory and inhibitory processes. First, emotion regulation training could be a valuable treatment method. According to James Gross [10], emotion regulation entails “the processes by which we influence which emotions we have, when we have them, and how we experience and express them”. By using cognitive strategies (e.g., cognitive re-appraisal), participants could be trained to view their emotional experience from a different perspective. This could help them assign a different meaning to the negative emotional experiences which sex-relevant stimuli may hold for them, and help re-interpret negative disgust experiences into positive experiences. For example, a patient who learns to re-interpret a mild level of disgust as something normal to experience during the confrontation with sexual stimuli, is likely to avoid that disgust (inhibitory process) will become the predominant focus of attention during the sexual process.

A second method could be the use of biofeedback approaches. Disgust is associated with a strong reflective tendency [9]. This defensive reflex involves the contraction of pelvic musculature, which could consequently hamper sexual functioning and be responsible for creating various discomforts and negative experiences around sexual functioning (e.g., pain, stress, disgust). Biofeedback could help train patients in monitoring when pelvic floor muscles become tense or relaxed. Consequently, in some patient groups where the psychological factors could prove relatively important in the etiological processes of sexual dysfunctions [4, 9], biofeedback may even function as a tool which resembles exposure in vivo in this respect, whereby gradual exposure to the phobic stimuli and the emotions which are associated with them, allow the emotional response to be significantly reduced over time with repeated training.

A third method involves mindfulness. Mindfulness is derived from ancient Eastern traditions. However, when stripped from its philosophical and religious elements, mindfulness has established itself as a valid tool to help people manage psychological stress and improve their wellbeing [11]. Mindfulness involves teaching a series of emotion regulation and attention training techniques, which serve to help the individual to become more aware of their current state of emotions and cognitions. Such heightened awareness of emotional states could help prevent that these emotions unconsciously impact our behavior. In the context of sex-relevant stimuli, mindfulness could help train the patient to become aware of their attention towards negative emotions and thoughts surrounding the sex stimulus (inhibitory processes). Attention training could help people to shift away from these negative associations to the positive aspects of the sexual process (e.g. excitatory processes). Indeed, meta-analyses already revealed that mindfulness could be an efficacious treatment for female sexual dysfunctions [12].

In conclusion, disgust seems a highly interesting candidate to involve in the treatment of sexual dysfunctions. Based on the field of emotion research, several clinical tools can already be identified to explore and alleviate emotional disturbances in the process of sexual dysfunctioning, such as emotion regulation training, biofeedback or mindfulness. Future research should focus on the effectiveness of these interventions to examine whether they can be valuable additions to existing treatment programs.

References

  1. Heiman J (2010) Sexual dysfunction: overview of prevalence, etiological factors, and treatments. The Journal of Sex Research 39: 73–78. [crossref]
  2. Bancroft J, Janssen E (2000) The dual control model of male sexual response: a theoretical approach to centrally mediated erectile dysfunction. Neuroscience and Biobehavioral Reviews 24: 571–579. [crossref]
  3. Rozin P,  Fallon AE (1987) A perspective on disgust. Psychological Review 94: 23–41. [crossref]
  4. de Jong PJ, van Overveld M, Borg C (2013) Giving in to arousal or staying stuck in disgust? Disgust-based mechanisms in sex and sexual dysfunction. Journal of Sex Research 50: 247–262. [crossref]
  5. van Overveld M (2017) What to expect from sex? Contamination and harm relevant UCS-expectancy bias in individuals with high and low sexual complaints. Archives of Psychology 1: 1–13.
  6. Matchett G, Davey GC (1991) A test of a disease-avoidance model of animal phobias. Behavior Research and Therapy 29: 91–94. [crossref]
  7. Borg C, de Jong PJ (2012) Feelings of disgust and disgust-induces avoidance weaken following induces sexual arousal in women. PLOS ONE 7: e44111. [crossref]
  8. Koukounas E, McCabe M (1997) Sexual and emotional variables influencing sexual response to erotica. Behav Res Ther 35: 221–230. [crossref]
  9. van Overveld M, de Jong PJ, Peters ML, van Lankveld J, Melles R, et al. (2013) The Sexual Disgust Questionnaire; a psychometric study and a first exploration in patients with sexual dysfunctions. Journal of Sexual Medicine 10: 396–407. [crossref]
  10. Gross JJ (1998) The emerging field of emotion regulation: an integrative review. Review of General Psychology 2: 271–299.
  11. Goyal M, Singh S, Sibinga EM, Gould NF, Rowland-Seymour A, et al. (2014) Meditation programs for psychological stress and well-being: a systematic review and meta-analysis. JAMA Internal Medicine 174: 357–368. [crossref]
  12. Stephenson KR, Kerth J (2017) Effects of mindfulness-based therapies for female sexual dysfunction: a meta-analytic review. Journal of Sex Research 54: 832–849. [crossref]

Recent Cases of Women as Human Rights Defenders in Turkey and Near East

DOI: 10.31038/AWHC.2019214

Abstract

Human rights defenders and especially those active for women’s rights are under increasing pressure and face persecution due to the international tendency to disregard human rights that is supported by a shift to trust authoritarian governments. The article draws attention to recent cases of women active as key experts in human rights and for women’s human rights and summarises risks and strategies in the relevant cases. The article is based on data received from the respective countries. Professional ethics demands a firm stance against human rights abuses, but strategies appear to be so far insufficient to adequately support and protect those women at risk because of their unwavering compliance with these principles.

Keywords

Trauma, Persecution, Gender, Human Rights, Doctors at Risk, Torture

Introduction

The atrocities committed during the Second World War have led to a general agreement on basic human rights, such as the freedom from torture, to be recognised as “non-derogable”, which means they cannot be suspended under any circumstances, including national emergencies. This has been confirmed also in basic contractual systems, such as in the EU Charter of Fundamental Rights [1], as EU members states had been exposed to some of the most extreme atrocities, and in “the International Covenant on Civil and Political Rights”[2], followed by a number of treaties and humanitarian standards by the UN and other organisations.

It is a frightening development, that human rights and respect for these standards are now openly questioned by leading politicians not only in autocratic countries  or dictatorships but also in European democracies, such as Austria, where the right wing party Minister of interrior has reportedly been summoned to the countries’  president as he proposed that the European Human Rights Convention might have to be disregarded and legal standards should „obey politics“ and not rule of law, though he later tried to play down his statements [3]  (note: In Austria most fundamental human rights are protected by the constitution and by international treaties the country has signed). Other examples are the disregard for the prohibition of torture in US Guantanamo or the treatment of asylum seekers in Australia [4], but also in some EU countries.

The implementation of the above standards needs effective strategies requires international monitoring and control or sanctioning mechanisms and institutions such as the International Criminal Courts, (who can only become active in countries who have signed the “Rome” statute), the European Court of Human Rights, the UN Committee against Torture, the UN special rapporteurs, and the High Commissioner on Human Rights. The principle of  “Universal Jurisdiction” offers the option of starting a criminal prosecution against perpetrators of fundamental violations also in third countries, where a survivor might seek protection [5].

Human Rights Defenders as health care professionals [6] as the third important group besides journalists and lawyers – in the respective countries play a crucial role in calling attention to infrictions and in supporting victims, which are with increasing frequency women.

Medical doctors have together with other groups taken a strong position in many countries, speaking up against torture or gender specific severe human rights violations such as FGM [7–9]. This is also due to the fact that professional ethics as supported by the World Medical Association and outlined in the WMA “Code of Ethics” do not only prohibits any support or participation in human rights violations [10–14], but also encourages health care professionals to speak out against such acts that do not only endanger rule of law and civil society, but also lead to long term adverse mental health consequences. Professional umbrella organisations such as the WMA and World Psychiatric Association have underlined the need of doctors especially in „dual obligation situations“ [15] when they are employed by governments to speak up even when violations are ordered by governmental institutions or their superiors, and further publications have taken up this issue in regard to Turkey [16–20]. Comments also stress the need to support such human rights defenders, due to the substantial danger resulting from such actions to the professional, but also their own lives, safety and health but also to that of their families and relatives [21]. While guidelines are strict, no sufficient mechanisms exist so far to offer adequate protection to those professionals, who follow their ethical standards. The UN have consequently confirmed the right to protection in the General Assembly Resolution A/RES/53/144 adopting the Declaration on human rights [22] that states specifically

Articles 1, 5, 6, 7, 8, 9, 11, 12 and 13 of the Declaration provide specific protections to human rights defenders, including the rights:

  • To seek the protection and realization of human rights at the national and international levels;
  • To conduct human rights work individually and in association with others;
  • To form associations and non-governmental organizations;
  • To meet or assemble peacefully;
  • To seek, obtain, receive and hold information relating to human rights;
  • To develop and discuss new human rights ideas and principles and to advocate their acceptance;
  • To submit to governmental bodies and agencies and organizations concerned with public affairs criticism and proposals for improving their functioning and to draw attention to any aspect of their work that may impede the realization of human rights;
  • To make complaints about official policies and acts relating to human rights and to have such complaints reviewed;
  • To offer and provide professionally qualified legal assistance or other advice and assistance in defence of human rights;
  • To attend public hearings, proceedings and trials in order to assess their compliance with national law and international human rights obligations;
  • To unhindered access to and communication with non-governmental and intergovernmental organizations;
  • To benefit from an effective remedy;
  • To the lawful exercise of the occupation or profession of human rights defender;
  • To effective protection under national law in reacting against or opposing, through peaceful means, acts or omissions attributable to the State that result in violations of human rights;
  • To solicit, receive and utilize resources for the purpose of protecting human rights (including the receipt of funds from abroad).

Method

In the following article we explore recent cases of women active for human rights and especially women’s human rights that are health care professionals and the international support given (or not given) in each case.

Professor Sebnem Korur Fincanci, working originally as head of department of Forensic Medicine of Istanbul University, is one of the internationally most prominent experts in the forensic assessment of gross human rights violations, such as torture. She is co-author of the joint UN/WMA standard for the interdisciplinary documentation and investigation of torture and Inhuman and Degrading Treatment (“Istanbul Protocol”) [23]. She has participated in a number of important investigations, [24] including the UN lead investigation of mass graves in Srebrenica. She has been active in the peace movement and has been a trainer in the forensic documentation of human rights violations in many countries and projects.

The Turkish Medical Association and the Human Rights Foundation of Turkey (HRFT) that has close links to the Medical Association, and is led by former chairs of the Turkish Medical Association (TMA), have been active against the again increasing use of Torture [25,26] and gross human rights violations in the country [27–29] that have been observed and criticised by many international organisations including the EU, Amnesty International, Council of Europe CPT [30]  and the UN.

Women are frequently imprisoned together with their children and exposed to torture in Turkey, and suffer from special hardships such as exposure to sexual violence and to gender based problems during detention such as harassment and hygienic conditions [31] see also CPT report 2017 [30]. Both separation from children and joint detention under inadequate conditions or torture must be seen as especially traumatic for women.

Prof. Dr. Şebnem Korur Fincancı and the leadership of the TMA were imprisoned already as part of pre-trial detention in 2016, leading to international protests by many including the Austrian Medical Association, Amnesty International [32] , Amnesties network health professionals that supports human rights defenders [33]  and the World Medical Association, whose press release stated that “the WMA President Dr. Yoshitake Yokokura condemned the arrests and the threats of physical violence and the criminal complaint that has been made against the TMA.

‘The WMA fully supports our Turkish colleagues in their public statements that war is a public health problem. The WMA has clear policy that physicians and national medical associations should alert governments to the human consequence of warfare and armed conflicts. ‘The Turkish Medical Association has a duty to support human rights and peace and we are alarmed about the latest arrests and the criminal complaint. We strongly denounce these attacks on freedom of expression, which is enshrined in article 19 of the International Covenant on Civil and Political Rights that Turkey ratified in 2003.” [34]

At that time also World Psychiatric Association who strongly supports Human Rights and the Istanbul Protocol joined with a statement [35]  underlining that:

“We strongly denounce these attacks on the  freedom of expression of  our colleagues, freedoms  that are enshrined in article 19 of  the International Covenant on Civil and Political Rights ratified by Turkey in 2003.”

Shortly after these statements by WMA, WPA and local medical associations, the leaders of TMA were released, but the trial continued and the TMA leadership were sentenced by local courts with an appeal to the regional high court pending.

According to recent published reports by the HRFT HRFT President Prof. Dr. Şebnem Korur Fincancı was recently sentenced to 2 years 6 months imprisonment on a hearing held on December 19, 2018 in Istanbul, Turkey for signing the Peace Petition “We’ll not be a party to this crime!” in January 2016, Prof. Fincancı was being tried together with 542 other academics, with charges of “propagating for a terrorist organization”, in the scope of the„ Anti-Terror “Law.  She is the recipient of numerous Human Rights prices, including the German “Hessian Peace price”.

International statements were again published by PHR (https://phr.org/news/turkish-court-sentences-dr-sebnem-korur-fincanci-to-prison-on-false-charges) and the World Medical Association (WMA) [36] who stated that:

“WMA Chair Dr. Ardis Hoven said: ‘We are shocked at what is going on in Turkey. These physicians, along with many other doctors and health care workers, are being punished for supporting a petition calling on the Turkish government to stop the violence against civilians. These are just the latest examples of the Turkish authorities completely ignoring the most basic human rights by violating the right to free speech. The WMA has repeatedly called on the Turkish Government to call a halt to the appalling harassment of physicians and academics in Turkey following the failed coup in 2016’.

The WMA statement also noted that further women doctors active for human rights are endangered:

 “Former members of TMA’s boards, including Dr. Feride Aksu Tanik, a former Secretary General of TMA and official advisor to WMA, are facing trial or sentences on the same charges of supporting terrorism. Many of them have lost their jobs, had their passports cancelled and will never be able to work in public institutions.”

Further statements included one by the respected German Peace Research Institute “Hessische Stiftung Friedens- und Konfliktforschung (HSFK)”, at Hamburg University (IFSH) with the Bonn International Center for Conversion (BICC) https://idw-online.de/de/news708359, and a statement was passed by the Polish Bar Association, underlining interdisciplinary solidarity.

Also members of other professions are in danger, as for example the lawyer and human rights activist Eren Keskin, who is according to AI threatened by 40 different court cases [37], while women organisations are closed down [37].

At present it is difficult to seek international protection for Turkish human rights defenders, both due to the restrictions of granting passports and to increasingly restrictive asylum policies of most, including EU, countries.

Discussion

Limitations: Methodologically, it is challenging to get data on the specific situation of women as human rights defenders especially in authoritarian countries and totalitarian regimes due to the risks and inability to conduct research, any substantial research would potentially endanger both researchers and research subjects. The discussion must be based on well documented individual cases brought forward by independent entities, for example medical associations and by data available on public record. It appears justified to assume, that in other totalitarian regimes, larger numbers of less well published or supported human rights defenders have been persecuted, killed or imprisoned, but due to the persecution and risk to journalists and researchers that are equally at risk no reports or data have been published and case reports must be used to identify problems and discuss and later evaluate possible intervention models. Similar cases have been reported as in Egypt, where Prof. Aida El Dawla, a pioneer on women’s human rights and the fight against torture. She continues to support defenders of women’s rights such as bloggers in spite of the risks involved, and had been imprisoned for her outspoken position.

Conclusion

Women are under special danger if they defend women and patients against war or torture and similar gross human rights violations, and need special protection. Mechanisms are so far not sufficient in offering such protection, though international solidarity is strong. The „war on terror“ appears to be increasingly at risk to be abused against human rights defenders and women must be seen as being at a special risk to face imprisonment and torture.

Governments must be held accountable as also requested by the above United Nations declaration on human rights defenders, a point that must be seen as complimentary to the obligation of professionals as underlined in the WMA Ethics manual and the UN declarations article 11[38]. Universal Jurisdiction can be seen as a contribution if local Justice has been corrupted as part of totalitarian governments with disregard for human rights [5]. For first concrete steps, asylum (international protection) and a way to leave the country should be guaranteed to human rights defenders and international umbrella organisations and Universities should take all necessary steps to support them in respect for their willingness to risk their safety and live to protect women and other vulnerable groups against human rights violations.

Acknowledgement: We are grateful to the Turkish Medical Association members who have supplied data on the above case including summaries of court documents and Austrian Medical Association and to all those who take clear positions to support human rights defenders and women’s rights.

Abbreviations: TMA: Turkish Medical Association. WMA: World Medical Association, UN- United Nations, WPA: World Psychiatric Association

Funding Information: No funding was received by the authors from any side, government or party for this article. Open access was supported by the IERM institute of the University of Vienna.

References

  1. http://www.europarl.europa.eu/charter/pdf/text_en.pdf
  2. https://www.ohchr.org/en/professionalinterest/pages/ccpr.aspx
  3. https://derstandard.at/2000097149277/Wie-Oesterreich-ohne-Menschenrechte-aussaehe,
  4. den Otter J, Wenzel T, McGrath B, Osorio AL, Drozdek B (2018) Special Situations: Places of Immigrant Detention. An Uncertain Safety: Integrative Health Care for the 21st Century Refugees. T. Wenzel, Drozdek, B. New York, Springer: 283–299.
  5. Wenzel T, Völkl- and S. Kernstock, Wittek, T.U., Baron, D. (2018). Identifying needs, vulnerabilities, and resources in refugee persons and groups An Uncertain Safety: Integrative Health Care for the 21st Century Refugees. T. Wenzel, Droszdek, B. New York, Springer: 51–99.
  6. Kletecka-Pulker M, Fischer L, Wenzel T (2018) Handlungspflicht der Gesundheitsberufe nach dem Istanbul-Protokoll. J Med Gesundheitsrecht 3: 10.
  7. Koso-thomas O (1995) Sierra Leone. Secret societies leaders are engaged in the fight against FGM. Newsl Inter Afr Comm Tradit Pract Affect Health Women Child 17: 13.
  8. Mcwest C (1995) Empowering women: interventions. Nigeria: new law to end FGM. Afr Link [crossref]
  9. No authors listed (2013) A united fight against FGM. Midwives 16: 13. [crossref]
  10. No authors listed (1975) [General agreement on ethical declarations at the WMA general assembly in Tokyo]. Lakartidningen 72: 4808–4810. [Crossref]
  11. No authors Listed (1998) [The declaration of the WMA condemning female genital mutilation (Budapest, 1993). World Medical Association]. Chirurgia (Bucur) 93: 279–280. [Crossref]
  12. No authors Listed (1998) [The World Medical Association (WMA). The WMA declaration of Helsinki 1960 with recommendations on biomedical research on human subjects (modified in 1975, 1980 and 1989)]. Chirurgia (Bucur) 93: 138–140. [Crossref]
  13. Holm S (2006) The WMA on medical ethics–some critical comments. J Med Ethics 32: 161–162. [crossref]
  14. Yudkin JS, Ziv H, Menuchin I (2010) Medical complicity in torture. Time for WMA to take action. BMJ 341: 4105. [crossref]
  15. Sheather J, Beynon R, Davies T, Abbasi K (2015) Torture and doctors’ dual obligation. BMJ 350: h589. [crossref]
  16. Cilasun U (1991) Torture and the participation of doctors. J Med Ethics 17 Suppl: 21–22. [crossref]
  17. Malmstrom C (1992) [An international symposium on torture reflected ethical problems of the host country]. Lakartidningen 89: 4222–4227. [crossref]
  18. Iacopino V (1996) Turkish physicians coerced to conceal systematic torture. Lancet 348: 1500.
  19. Iacopino V, M Heisler, S Pishevar and R H Kirschner (1996) Physician complicity in misrepresentation and omission of evidence of torture in postdetention medical examinations in Turkey. JAMA 276: 396–402.
  20. Muñoz E (1996) Patient-physician confidentiality on trial in Turkey. JAMA 276: 1375–1376. [crossref]
  21. Parsell D (1996) Doctors in Turkey face attacks. Science 273: 517. [crossref]
  22. https://www.ohchr.org/en/issues/srhrdefenders/pages/declaration.aspx
  23. Haagensen J O (2007) The role of the Istanbul-Protocol in the uphill battle for torture survivors being granted asylum in Europe and ensuring the perpetrators pay. Torture 17: 236–239.
  24. Unuvar U, H Ulas and SK Fincanci (2014) Diagnosis of torture after 32 years: assessment of three alleged torture victims during the 1980 military coup in Turkey. Forensic Sci Int 244: 42–47.
  25. Egholm ML (1988) [Amnesty International. Electric torture in Turkey]. Sygeplejersken 88: 10. [crossref]
  26. Salinsky M (1998) Torture continues in Turkey: findings of new report. Lancet 352: 1854. [crossref]
  27. Yüksel S (1989) Torture in Turkey. Lancet 2: 866. [crossref]
  28. Yuzgun A (1993) Homosexuality and police terror in Turkey. J Homosex 24: 159–169. [crossref]
  29. Can B (2016) Human Rights, Humanitarianism, and State Violence: Medical Documentation of Torture in Turkey. Med Anthropol Q 30: 342–358.
  30. https://rm.coe.int/pdf/168075ec0a
  31. Lunde I, Ortmann J (1990) Prevalence and sequelae of sexual torture. Lancet 336: 289–291. [crossref]
  32. https://www.amnesty.de/2016/6/30/tuerkei-erol-oenderoglu-und-sebnem-korur-fincanci-sind-frei
  33. http://amnesty-heilberufe.de/tag/aerzte-als-opfer
  34. https://www.wma.net/news-post/arrest-of-turkish-medical-association-leaders-condemned-by-wma/
  35. https://www.wpanet.org/uploads/Latest_News/Other_News/WPA%20Statement%20on%20TMA%20Arrests_2018.pdf
  36. https://www.wma.net/news-post/wma-expresses-shock-at-turkish-physician-leaders-prison-sentences/
  37. AI report „Weathering the storm“, 2018, see www.amnesty.at/media
  38. Article 11 makes a special reference to the responsibilities of persons exercising professions that can affect the human rights of others, and is especially relevant for police officers, lawyers, judges, etc.“, see again https://www.ohchr.org/en/issues/srhrdefenders/pages/declaration.aspx, accessed 31.1.2019