Author Archives: author

Compliance and Audit Necessary for Effective Statutes Protecting Student Athletes from TBI Related Injuries in California

DOI: 10.31038/IJOT.2019242

Abstract

Awareness of mild traumatic brain injury in sports in the United States of America has had a dramatic increase in the past several years. This article cites recent developments in its increased awareness, and some recent legal developments regarding the medical condition. This commentary recommends an additional part of legislation the authors feel to be effective in protecting the susceptible.

Illustrating the Problem of TBI

Traumatic Brain Injury (TBI) is defined as a traumatically induced structural injury and/or physiological disruption of brain function as a result of an external force that is induced by new onset of at least one of the following clinical signs. Immediately following the event: any period of loss of decreased level of consciousness, any loss of memory for events immediately before or after the injury, any alteration in mental state at the time of the injury (confusion, disorientation, slow thinking), neurological deficits (weakness, loss of balance, change in vision, paresis/paraplegia, sensory loss aphasia that may or may not be transient), and/or intracranial lesion.

Traumatic brain injury is categorized as mild, moderate or severe depending on certain criteria. A mild categorization is determined when the structural imaging is normal, the loss of consciousness is ranges between 0-30 minutes, the alteration of consciousness ranges between a moment up to 24 hours, the post traumatic amnesia is less than or equal to 1 day, and the Glascow Coma Scale is between 13-15. A moderate categorization is determined when the structural imaging is normal or abnormal, the loss of consciousness exceeds 30 minutes but last less than 24 hours, the alteration of consciousness exceeds 24 hours, the post traumatic amnesia is greater than 1 day but less than 7 days, and the Glascow Coma Scale is between 9-12. A severe categorization is determined when the structural imaging is normal or abnormal, the loss of consciousness exceeds 24hours, the alteration of consciousness is analyzed under other criteria, the post traumatic amnesia exceeds 7 days, and the Glascow Coma Scale is between 3-8 [1].

 While Eighty-five percent of medically treated traumatic brain injuries are determined to be “mild”, this designation of “mild” is dangerously misleading because there is a small but significant subpopulation in this group that has persistent and catastrophic lingering effects. Binder & colleagues (2009 & 1997) [2,3], analyzed a meta-analysis of data from eight studies of long-term (3 months to many years after injury) effects of mTBI, and reported that approximately 8% of individuals remained symptomatic chronically and 14% had work-related disability2,3.  Binder and colleagues (2009 & 1997) [2,3] discussed a prior study by Bohnen et al (1994) [4], which emphasized that though the symptoms of mTBI are nonspecific, it is likely that the severity of the symptoms is greater after mTBI than in control subjects and some patients have cognitive deficits which are apparent only in particular stressful situations [2,3].

Not only is the finding of an mTBI injury potentially catastrophic, but the enormous incidence rates making it one of the most costly conditions in the USA. The incidence rate of mTBI in America is projected to be 1.5 million – 3.8 million annually. In the wider perspective of the world, the incidence is cited to be 9.5 million – 50 million per year. While a study by Rutland-Brown et al. (2006) [5] cited that the CDC estimated a total medical cost of $16.7 billion for mild TBI in the USA, these estimates overlook those who do not seek care in hospitals or emergency departments or choose not to seek care at all [5]. More importantly, medical costs are not the only costs incurred, as work loss costs have been estimated to be $69.2 billion and the value of lost quality of life is estimate to be $137 billion. Hence, the totality of costs suffered due to TBI in the USA alone is estimated to be $221 billion annually.

Proposed Legislative Remedies to Regulate TBI in Sports

A big impetus to this increased regulation and legislation was because of unfortunate consequence consequences of a TBI suffered by Zackery Lystedt, a 13 year old football player who was permanently disabled after sustaining a concussion in 2006 and prematurely returning to the game. Zackery Lystedt was a remarkable athlete who played both offense and defense on his junior high school football team. After tackling an opponent, Zackery’s head struck the ground. Despite the blow, he was back in the game by 3rd quarter. However, Zackery collapsed on the field and was airlifted to Harborview Medical Center where he underwent emergency surgery to remove the left and right site of his skull to relive the pressure from his injured and swelling brain. Although this procedure saved his life, he experience severe brain injury, spent seven days on a ventilator and spent three months in coma before he woke up in a his new reality. It was nine months before Zackery was able to speak his first words and nearly three years before he was able to stand with assistance. Today, Zackery continues to depend on a wheelchair and spends numerous hours each week in rehabilitation.

Three years following Zackery’s injury, in May 2009, the state of Washing passed a new bill referred to as the Lystedt Law, which protects young athletes from life threatening or potentially life-long consequences that can result from prematurely returning to the game following a concussion. The Lystedt Law requires any youth showing signs of a concussion to be examined and cleared by a licensed health care provider before the young athlete is allowed the return to play. Less than five years following Washington’s passing of the law, all 50 states and the District of Colombia have adopted the majority of the core principles of the Lystedt Law, making the Lystedt Law the fastest growing public safety initiative to become law in all states [6].

With the support of key national organizations, including the NFL, CDC, USA Football, and the United States Brain Injury Alliance, the Lystedts are striving to bring the law to the US Congress and establish the return to play safeguards are federal law.

Additional Protective Legislation in California

Assembly Bill No. 2127 was signed by the governor on July 21, 2014. This added section 35179.5 to the California Education code [7]. This legislation limits the amount of full contact practices as well as specific requirements in the care of athletes suspected of having a mild TBI. For example, section 49475 [8] of the California Education Code is amended to read:

49475 (a) If a school district, charter school, or private school elects to offer an athletic program, the school district, charter school, or private school shall comply with both the following:

  1. An athlete who is suspected of sustaining a concussion or head injury in an athletic activity shall be immediately removed from the athletic activity for the remainder of the day, and shall not be permitted to return to the athletic activity until he or she is evaluated by a licensed health care provider. The athlete shall not be permitted to return to the athletic activity until he or she receives written clearance to return to the athletic activity from a licensed health care provider. If the licensed health care provider determines that the athletic sustained a concussion or a head injury, the athlete shall also complete a graduated return-to-play protocol of no less than seven days in duration under the supervision of a licensed health care provider. The California Interscholastic Federation is urged to work in consultation with the American Academy of Pediatrics and the American Medical Society for Sports Medicine to develop and adopt rules and protocols to implement this paragraph.
  2. On a yearly basis, a concussion and head injury information sheet shall be signed and returned by the athlete and the athlete’s parent or guardian before the athlete initiates practice of competition.

b. A sued in this section, “licensed health care provider” means a licensed health care provider who is trained in the management of concussions and is acting within the scope of his or her practice.

c. This section does not apply to an athlete engaging in an athletic activity during the regular school-day or as part of a physical education course required to pursuant to subdivision (d) of Section 51220.

Comment

Although it is hoped that legislation, statutes, and laws are adhered to, without enforcement, at least intermittent enforcement seems to have a positive effect of compliance with laws.

The authors of this commentary feel that for this law to be as effective as hoped and should be, an audit of compliance should be written into the legislation on a yearly or every two years.  If non-compliance is found, Draconian measures such as forfeiture of wins, loss of championships, and cancelling of future schedules should be implemented to note the seriousness of the consequences of the violations of these statutes.

References

  1. Teasdale G, Jennett B (1974) Assesment of coma and impaired consciousness: a practical scale. Lancet 2: 81–84.
  2. Binder LM, Iverson GL, Brooks BL (2009) to err is human: “abnormal” neuropsychological scores and variability are common in health adults. Arch Clin Neuropsychol 24: 31–45.
  3. Binders LM (1997) A review of mild head trauma 2: Clinical implicaitons (review) J Clin Expt Neuropsychol 19: 432–457.
  4. Bohnen N, Twijnstra A, Jolles J (1993) Persistance of postconcussional symptoms in uncomplicated, mildly head-injured patients: a prospective cohort study. Neuropsychiatry Neuropsychol Behav Neurol 6: 193–200.
  5. Rutland-Brown W, Langlosi JA, Thomas KE, et al. (2003) Incidence of Traumatic Brain Injury in the United States. J Head Trauma Rehabilitation 21: 544–548.
  6. https://www.nlelaw.com/case-results/zackery-lystedt-law
  7. https://codes.findlaw.com/ca/education-code/edc-sect-35179-5.html
  8. https://law.justia.com/codes/california/2011/edc/title-2/49470-49475/49475/

Autoantibodies in Type-2 Diabetes having Neurovascular Complications Bind to the Second Extracellular Loop of the 5-Hydroxytryptamine 2A Receptor

DOI: 10.31038/EDMJ.2019345

Introduction

Diabetes is associated with a substantially increased risk of certain neurovascular and neurodegenerative complications, e.g. stroke, dementia, Parkinson’s disease, major depressive disorder [1], through complex and poorly-defined mechanisms. We previously reported the occurrence of activating 5-HT2A receptor IgG autoantibodies in plasma or serum from older adult diabetes suffering with major depressive disorder [2], Parkinson’s disease or dementia [3]. Acute neurite retraction and accelerated mouse neuroblastoma N2a cell death induced by the autoantibodies in cell culture was partially or completely prevented by co-incubation (of IgG autoantibodies) with selective antagonists of the 5-HT2A receptor [2,3].

The second extracellular loop region of several different G-protein coupled receptors lies adjacent to the receptors’ orthosteric binding pocket [4]. In subsets of human dilated cardiomyopathy [5] or in eclampsia [6], spontaneously- occurring auto antibodies which targeted the second extracellular loop region of the beta-1-adrenergic or the angiotensin II, type 1 receptor, respectively, caused G-protein coupled receptor activation. In the present study, we tested a hypothesis that IgG autoantibodies in older adult diabetes having angiopathic and/or neurodegenerative complications cause 5-HT2A receptor activation via binding to the second extracellular loop region of the 5-HT2A receptor.

The 5-HT2A receptor is highly expressed in specific brain regions underlying cognition, perception and mood regulation [7]. It is also expressed on vascular smooth muscle cells where it plays a role in the regulation of arterial vascular tone [8]. Autoantibodies targeting 5-HT2A receptors in the central nervous system and the peripheral vasculature could serve as a biomarker for complications associated with refractory hypertension (e.g. stroke, chronic kidney disease) and/or neurodegeneration (dementia, Parkinson’s disease, retinal degeneration).

Participants and Methods

Participants

Men and women enrolled in the Diabetes or Endocrinology clinics at the Veterans Affairs New Jersey Healthcare System (VANJHCS), East Orange and Lyons NJ signed an informed consent for VANJHCS Institutional Review Board-approved study participation prior to blood drawing.

Patient subgroups

Patient 1: A 57-year-old man with morbid obesity, type 2 diabetes, stage 3 Chronic Kidney Disease (CKD) and refractory hypertension who suffered a branch retinal vein occlusion and Transient Ischemic Attack (TIA). He underwent renal biopsy which revealed hypertensive glomerulosclerosis (Fig 1).

EDMJ 2019-118 - Mark Zimering USA_F1

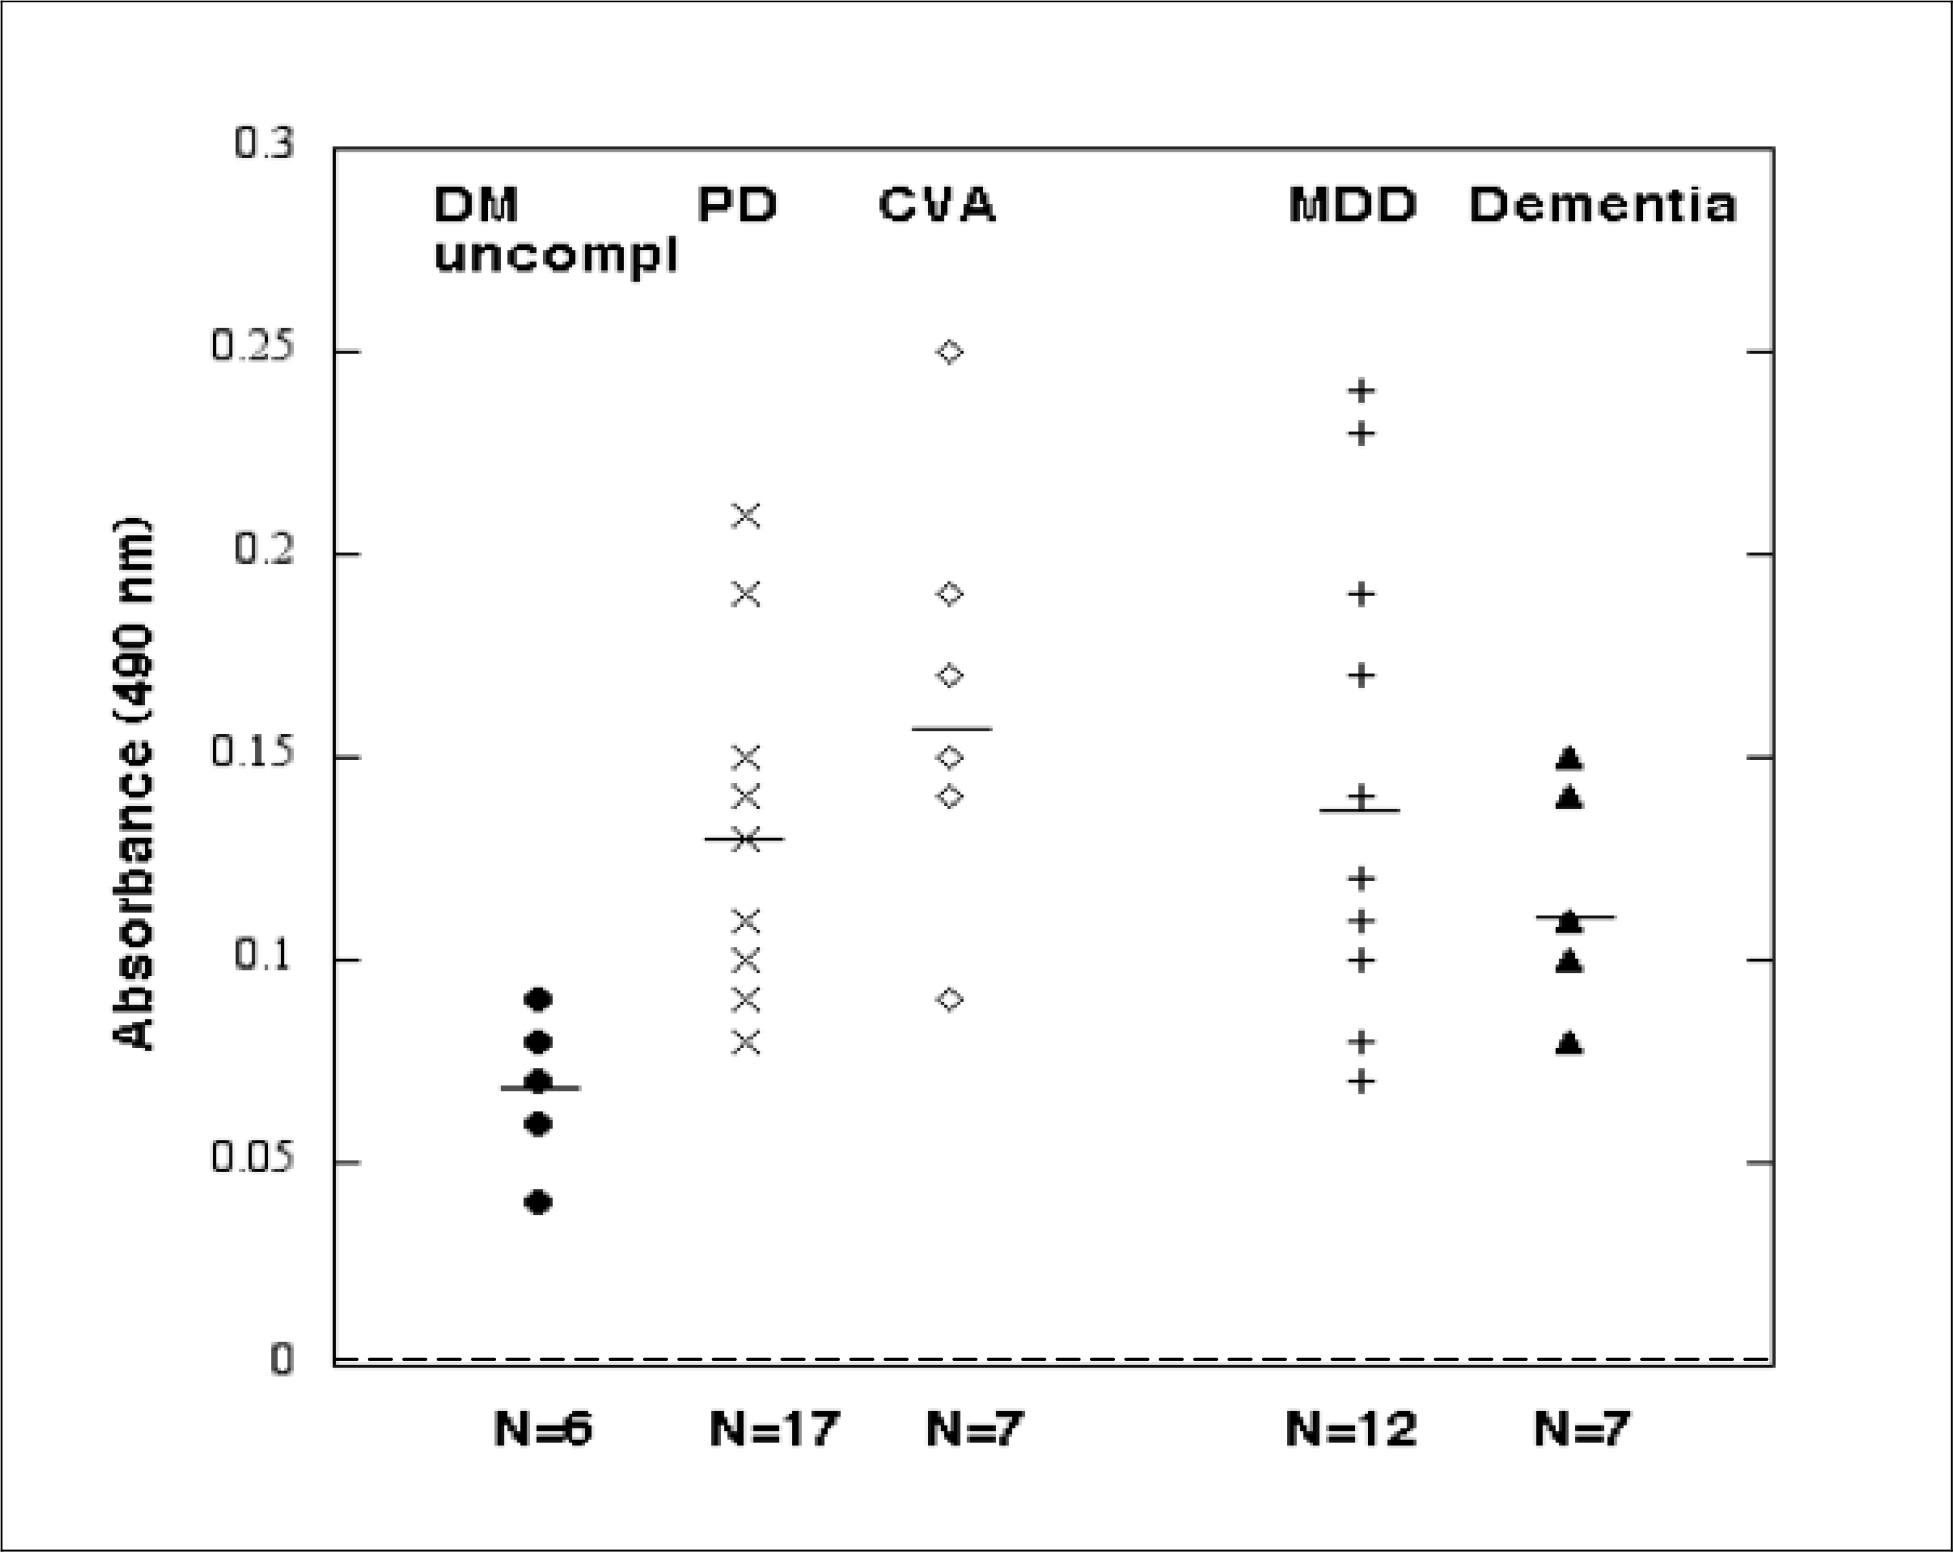
Figure 1. Enzyme linked immunosorbent assay using the synthetic peptide Q..N-18 as the solid-phase antigen. Results are arbitrary absorbance units (OD) in a one-fortieth dilution of the protein-A eluate fraction of plasma or serum from patients with uncomplicated type 2 diabetes (N=6), Parkinsons disease (PD) (N=17), cerebrovascular accident (CVA) (N=7), major depressive disorder (MDD) (N=12) or dementia (N=7). Dashed line indicates background absorbance level of 0.04 absorbance units (dotted line).

Patient 2: A 72 -year-old man with twenty-year history of type 2 diabetes, discoid lupus erythematosus, and adult onset retinitis pigmentosa who had also suffered with a central retinal artery occlusion.

Patient 3: An 81 year-old-man who suffered with autoimmune thyroid disease and juvenile-onset retinitis pigmentosa (Stargardt disease). He has a ten-year history of type 2 diabetes without microvascular complications. Family history is positive for Stargardt disease in one brother.

Blood drawing

Blood was drawn in the morning in fasted participants.

Protein-A Affinity Chromatography

Protein An affinity chromatography was carried out as previously reported [2].

Synthetic peptide synthesis

A synthetic peptide having the amino acid sequence QDDSKVFKEGSCLLADDN, hereafter referred to as Q..N-18 or peptide 1, was synthesized at Lifetein Inc.(Hillsborough, NJ) and had > 92% purity. Q…N-18 had identical amino acid sequence to the region of the human 5-HT2A receptor comprising the second extracellular loop (ECL2) (Uniprot KB- P28223 [216 – 233] 5HT2A_Human). Three shorter overlapping peptides having the following amino acid sequences: QDDSKVF (peptide 3), VFKEGSC (peptide 4), SCLLADDN (peptide 2) were synthesized at Lifetein, Inc. and had purities > 96%. The latter three peptides were used in epitope analysis of the Q..N-18 (ECL2) region targeted for binding in subsets of human neurovascular pathologies’ autoantibodies.

Enzyme Linked Immunosorbent Assay (ELISA)

Ninety-six well plates were coated with the Q..N-18 peptide in PBS at a concentration of 65 micrograms/mL for two hours at 25 degrees C. The plates were washed three times with 0.1% Triton X-100 in PBS (PBS/Triton). Next the plate was blocked with 3% BSA in PBS for 1 hour at room temperature. Following 3 washes with PBS/Triton, 0.5–10 μg/mL concentrations of the patient IgG antibody (obtained by protein an affinity chromatography of plasma or serum) or a control sample was added to wells in duplicate and incubated for 1 hour at room temperature. The plate was washed 3× in PBS/Triton. Next HRP-conjugated goat anti human IgG (Sigma, St. Louis, MO) was added to each well at a 1: 3000 final dilution. After 1 h incubation, the plate was washed 3× in PBS/Triton. Next 150μL of a substrate solution containing 0.4 mg/mL ortho-phenylenediamine (Sigma, St. Louis, MO) and H2 O2 was added to each well and the reaction was monitored for color development. After 5 minutes, the reaction was stopped by the addition of 50μL 8 M H2 SO4 and the optical density was read at 490 nm in a microtiter plate reader (Dynatech Inc). Results are expressed as basal OD490 compared to wells to which PBS alone was added.

Mouse neuroblastoma N2 cells

N2A cells were generously provided by Dr. Smith Varia and Dr. Janet Alder (Department of Neurosciences, Rutgers-Robert Wood Johnson Medical School). The cells were cultured in DMEM with 10% fetal calf serum.

N2A Acute Neurite Retraction assay

Acute neurite retraction assay was performed as previously reported [2]

N2 cell survival assay

Cell survival assays were carried out as previously reported [2]

Chemicals

All chemicals (with the exception of synthetic peptides) were from Sigma Chem. Co, Inc.

Protein determinations

Protein assays were carried out as previously reported [2]

Results

Baseline clinical characteristics in the study patients

The baseline clinical characteristics are shown in Table 1. The study cohort included 49 older adults with type 2 diabetes mellitus (T2DM) and 7 older adults without diabetes. The patients without diabetes were slightly younger on average, but did not differ significantly from the diabetic patients in their mean body mass index 31.0 vs 34.9 kg/m2 (Table 2).

Table 1. Baseline clinical characteristics in the 56 study patients

Risk factor

Mean (SD)

N

Age (years)

68.3(9.0)

56

Non-diabetes * Type 2 Diabetes49

61.8(10.8)

7

Body mass index (kg/m2)

34.9 (6.8) 49

49

Glycosylated hemoglobin(%)

8.0 (1.6)

49

Duration of diabetes (years)

15.4 (8.2)

49

*Major depressive disorder (n=2), Parkinsons’disease (n=3), Schizophrenia (n=1), Graves ophthalmopathy (n=1)

Table 2. Comparison of age and body mass index in diabetic and non-diabetic patients.

Diabetes (n=49)

No Diabetes (n=7)

P-value

Age (years) 69.0 (7.2)

61.8(10.8)

0.04

Body mass index (kg/m2) 34.9(6.8)

31.0(3.0)

0.26

Mean binding to a linear synthetic 5-HT2A receptor peptide did not differ significantly in autoantibodies from Parkinson’s disease or major depressive disorder patients with or without type 2 diabetes (Table 3). These data suggest that the ‘susceptible’ population harboring increased 5-HT2A receptor peptide autoantibodies is likely to include older persons with and without type 2 diabetes mellitus.

Table 3.Mean 5-HT2A receptor peptide binding in diabetic vs nondiabetic patients having Parkinson’s disease or major depressive disorder.

Neurodegeneration

Diabetes

No Diabetes

P-value

Parkinson’s disease

0.13(.04) [14]

0.13(.05) [3]

0.85

Major depression

0.16(.06) [10]

0.12(.04) [2]

0.32

Results are mean absorbance units AU +/ (SD); [ ] number of patients

Increased 5-HT2AR synthetic peptide binding in protein-A eluates from subsets of diabetic angiopathy and/or neurovascular complications

A one-fortieth dilution of the protein-A eluate of plasma (2–8 µg/mL IgG) was tested for binding to the linear synthetic peptide Q…N-18 having an amino acid sequence identical to that of the second extracellular loop of human 5-HT2A receptor. Mean binding level was significantly increased (P < 0.01) in subsets of diabetes having Parkinson’s disease (n=17), dementia (n=7), stroke or TIA n=7), or major depressive disorder (n=12) compared to the mean level in age-matched older adult type 2 DM without significant angiopathy (i.e. retinopathy or nephropathy) (n=6; Fig 1). It was also significantly increased in diabetes patients with a coexisting systemic autoimmunity condition (i.e. discoid lupus erythematosus (n=1), ankylosing spondylitis (n=1), Graves orbitopathy (n=2), rheumatoid arthritis (n=1)) (Table 4). Mean binding in the protein-A eluate fraction of T2DM plasma (IgG) was significantly increased in patients having significant retinopathy vs. no retinopathy, or diabetic nephropathy vs. no nephropathy (Table 5). There was no significant difference in plasma IgG autoantibody binding level in T2DM patients with or without atrial fibrillation, T2DM with or without obstructive sleep apnea or T2DM with or without co-morbid cancer (Table 5). Taken together, these data suggest associations among diabetic angiopathy, neurodegenerative disorders and certain systemic autoimmune diseases with increased level of IgG autoantibodies that binds to 5-HT2A receptor, second extracellular loop region, and linear synthetic peptide.

Table 4. Mean 5-HT2A receptor peptide binding in type 2 diabetes without angiopathy vs diabetes with a neurodegenerative disorders or a co-morbid systemic autoimmune condition^^.

Mean receptor peptide binding

N

P-value*

Diabetes without angiopathy^

0.068(.01)

6 ——

Diabetes with dementia

0.11(.02)

7 < 0.01

Diabetes with PD**

0.13 (.04)

17 <0.01

Diabetes with MDD***

0.14(.05)

12 0.02

Diabetes with CVA or TIA

0.16(.04)

7 <0.01

Diabetes with Autoimmunity

0.18(.05)

5 <0.01

Results are mean AU +/- SD; ^- without any neurodegenerative disorder; ^^-N=1 each having discoid lupus erythematosus, ankylosing spondylitis, Graves disease, celiac disease, rheumatoid arthritis; *t-test compared to group having diabetes without angiopathy. PD-Parkinson’s disease, MDD-major depressive disorder, CVA-cerebrovascular accident, TIA-transient ischemic attack. ** includes 3 patients without diabetes; ***includes 2 patients without diabetes

Table 5. Association between5-HT2AR, ECL2 receptor peptide binding and baseline diabetic micro-vascular or other complications.

Present (N)

Absent (N)

Absent (N)

Diabetic retinopathy

0.15 +0.05(16)

0.10 +0.04(27)

0.002

Diabetic nephropathy

0.13+0.04 (21)

0.1 +0.04 (21)

0.006

Diabetic painful neuropathy

0.13 + 0.05 (21)

0.1 + 0.05 (19)

0.12

Atrial fibrillation

0.13 + 0.05(19)

0.13+ 0.05(34)

0.87

Obstructive sleep apnea

0.12 + 0.05(20)

0.12 + 0.05 (28)

1.0

Cancer

0.14 + 0.05(13)

0.12 + 0.05 (36)

0.13

Results are mean AU +/- SD; Patients having co-morbid systemic autoimmune condition (n=5) were excluded except in two cases having retinal neurodegeneration.

Lack of association between IgG plasma autoantibody binding to 5-HT2A receptor peptide and patient age or diabetes duration

There was no significant association between mean IgG autoantibody binding to the 5-HT2A receptor peptide and baseline patient age, body mass index, glycosylated hemoglobin, or duration of diabetes (data not shown in Tables).

Dose-dependence and titer of diabetic protein-A eluate binding to Q..N-18

Titer and potency of IgG autoantibody binding to the Q..-N-18 linear synthetic peptide was substantially increased in subsets of diabetes suffering with recurrent stroke, diabetes with co-morbid discoid lupus erythematosus and retinitis pigmentosa, diabetes having dementia, and diabetes with Parkinson’s disease. Peak binding and titer was not elevated in representative older type 2 diabetes without neurodegeneration and without significant angiopathy (i.e. retinopathy and nephropathy), i.e. < 2-fold above background absorbance at IgG concentrations tested between 1–2 µg/mL (Table 6).

Table 6. Potency and titer of receptor peptide autoantibodies in representative patients.

Diagnosis

Titer of autoantibody

Peak Binding (AU)

Retinitis pigmentosa & Discoid lupus erythematosus

0.37 µg/mL

0.25

DM, Refractory hypertension

2 µg/mL

0.17

DM, Dementia

0.4 µg/mL

0.14

DM, Parkinson’s disease

<1 µg/mL

0.10

DM without ND

1 µg/mL

0.07

DM without angiopathy

2 ug/mL

0.06

Absorbance units= 0.04 is background level. 1 µg/mL IgG ~ 6.7 nM.

ND– neurodegenerative disorder, DM– diabetes mellitus; Titer– concentration of autoantibodies causing ~50% of maximal binding.

Correlation of receptor peptide binding with IgG neurotoxicity (neurite retraction, N2A cell loss)

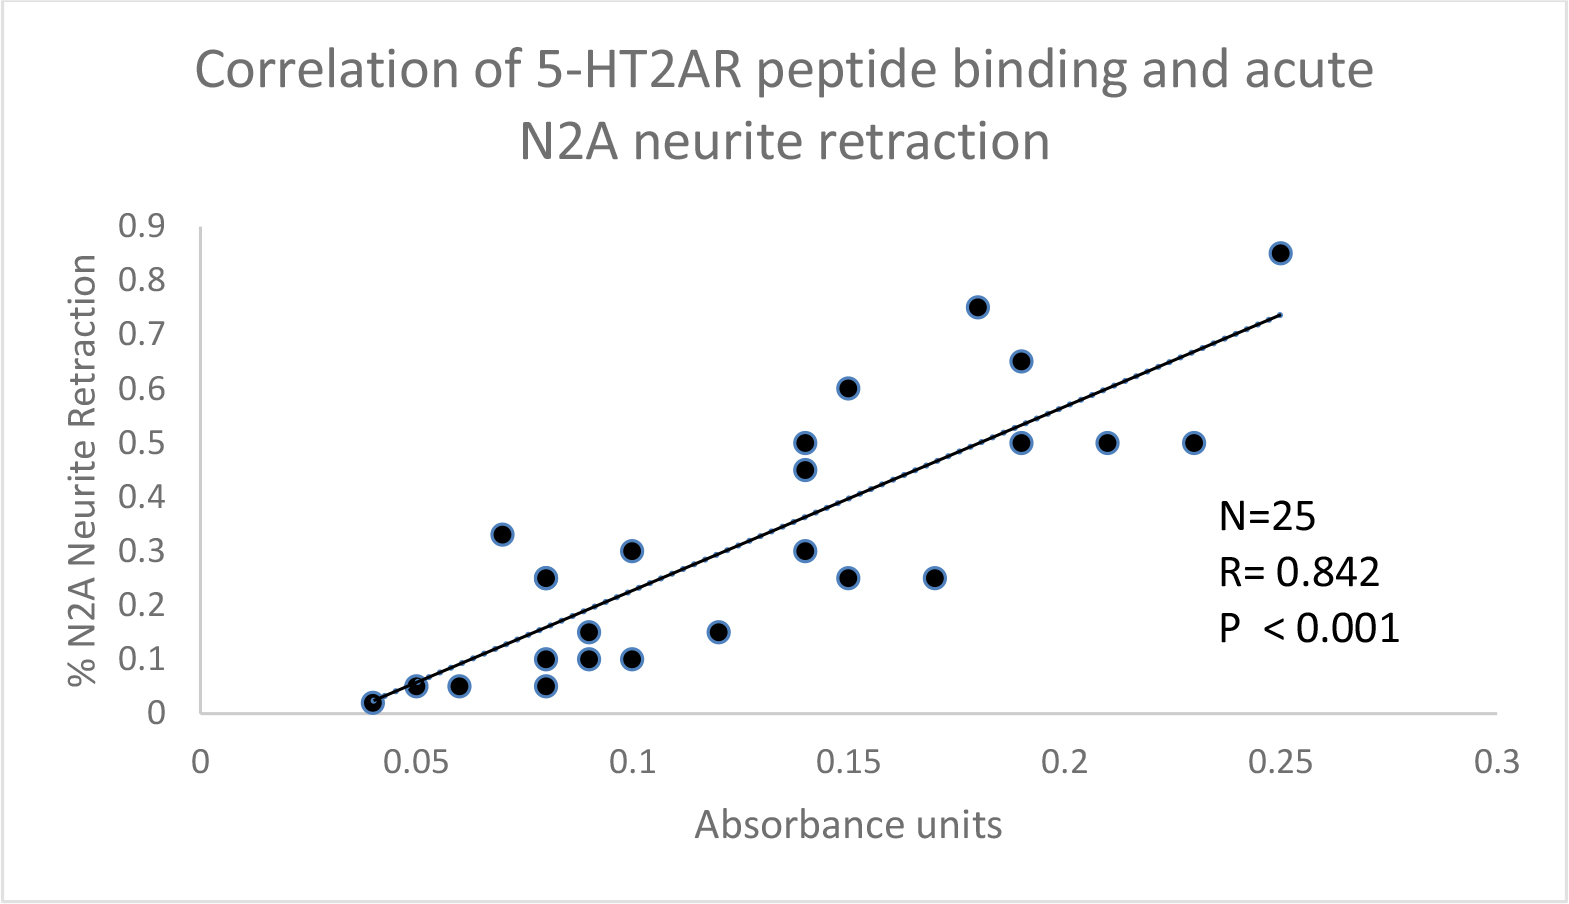
There was a significant correlation between 5-HT2A receptor synthetic peptide binding and acute N2A neurite retraction in the protein-A eluates from twenty-five patients tested (Fig 2) including representative patients from various pathologic subgroups (Table 7). High receptor peptide binding IgG was associated with significantly greater acute N2A neurite withdrawal (compared to low-binding IgG) at each of several different dilutions tested (Table 8).

EDMJ 2019-118 - Mark Zimering USA_F2

Figure 2. . Correlation between 5-HT2A receptor synthetic peptide binding and acute N2A neurite retraction in the protein-A eluates from twenty-five patients with neurovascular or neuropsychiatric complications. A 1/40th dilution of the protein-A eluate fraction was incubated with N2A cells and acute neurite retraction was determined as described in Materials and Methods. Results were correlated with binding to Q..N-18 in an ELISA using a 1/40th dilution of the protein-A eluate of serum or plasma.

EDMJ 2019-118 - Mark Zimering USA_F3

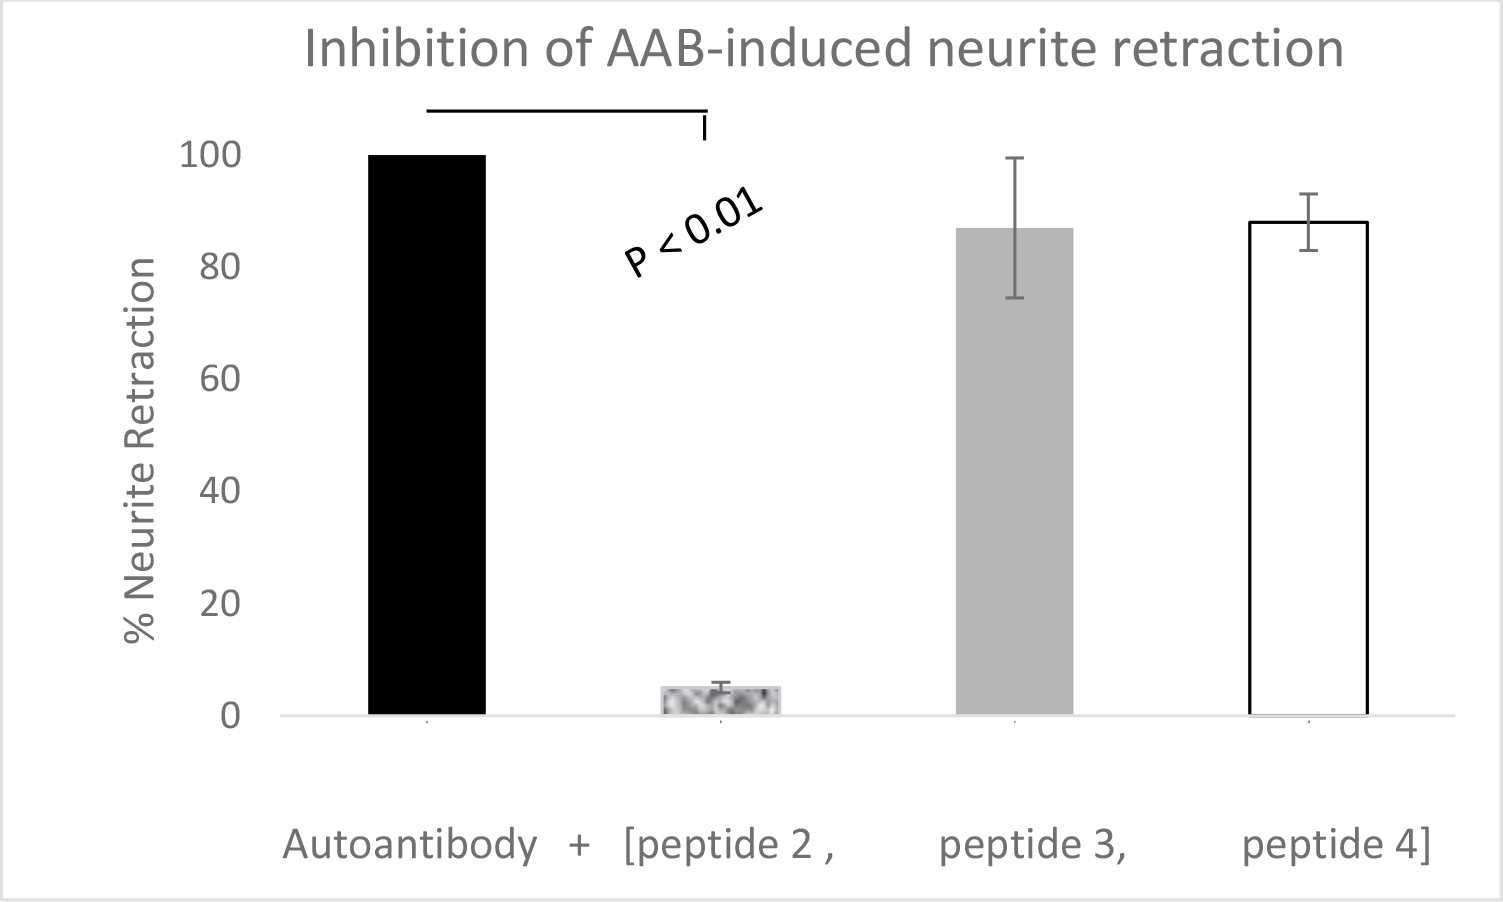
Figure 3. A 1/40th dilution of the Pt 1 refractory hypertension plasma autoantibodies(AAB) was incubated with N2A neuroblastoma cells alone (solid bar) or in the presence of a 20 µg/mL concentration of peptide 2 ((SCLLADDN), peptide 3 (QDDSKVF),or peptide 4 (VFKEGSC)(open bar). Results are (mean + SD) acute neurite retraction determined as described in Materials and Methods.

Table 7. Association between autoantibody- 5HT2ARreceptor peptide binding and autoantibody-induced acute neurite retraction by representative patient subgroup.

Diagnosis

Binding

Neurite retraction

*Diabetes without angiopathy (n=3)

.04

.06

.08

Dementia (n=2)

.15

.14

++

+++

Schizophrenia (n=4)

.08

.08

.10

.07

++

++

++

Major depressive disorder (n=2)

.14

.23

++

+++

Parkinsons Disease (n=7)

.14

.19

.10

.15

.19

.21

.09

+++

+++

++

++++

++++

+++

+

Stroke (n=2)

.18

.25

+++++

+++++

*Neurite retraction scale: % neurite shortening after 5 minutes’exposure to autoantibodies , i.e. 0–10% = (-); 11–24% (+); 25–33% (++); 34–50% (+++); 51–74% (++++); 75–85% (+++++).

Table 8. Dose-dependent, increased autoantibody-induced neurite retraction in DM having neurodegeneration or cancer vs. DM without neurodegeneration or cancer

Receptor Peptide

Autoantibody Dilution

Diagnosis

Binding (AU + SD)

1/40th

1/60th

1/100th

1/200th

PD(1),

Stroke(2),

High binders

Prostate cancer (1)

(0.21 + .03)

72+ 13 %^

44+ 6%*

33%

25%

Schizophrenia (1),

Low binders

20+ 12 %

13 +10%

NR

NR

uncompl DM (2)

(0.06 + .01)

Results are mean+ SD % neurite retraction after 5 minutes exposure to indicated dilution of autoantibodies; NR- nodetectabeneurite retraction. ^ P <0.002; * P < 0.02– compared to neurite retraction at same autoantibody dilution in low peptide binding IgG autoantibodies subgroup; AU- absorbance units, SD-standard deviation.Uncomplicated diabetes mellitus- without microvascular complications.

‘High- binding’ IgG caused significantly greaterN2a neuron loss (after 24 hours incubation) than an identical concentration of ‘low-binding’ IgG (Table 9). Taken together these data suggest that IgG autoantibody binding to the linear synthetic 5-HT2A (ECL2) receptor peptide is correlated with IgG autoantibody-induced N2A neurite retraction and accelerated N2A neuron loss.

Table 9. Association between autoantibody- receptor peptide binding and autoantibody-induced accelerated N2A neuron loss.

Low-binding (N=7)

High-binding (N=5)

P-value

Absorbance (AU)

0.08 + 0.019

0.22 + 0.04

< 0.001

% N2A cell survival

91.7 + 5.9%

66.4 + 9.1%

< 0.001

Results are mean +/- SD. Neuron survival was determined after 24 hours incubation as described in Materials and Methods.

Soluble ECL2 peptide inhibits DM autoantibody-induced N2A neurite retraction

An 18-mericlinear synthetic peptide (Q..N-18) having an identical amino acid sequence to the ECL2 of the 5-HT2A receptor dose-dependently inhibited mouse N2A neuroblastoma cell neurite retraction induced by a sixty Nano molar concentration of the protein-A eluate fraction of plasma from Patient 1 type 2 diabetes suffering with refractory hypertension, retinal vein occlusion, and transient ischemic attack (TIA). The Patient 1 refractory hypertension autoantibodies alone caused 90% neurite retraction in N2a cells (Table 10). Half-maximal inhibition of autoantibody-induced acute neurite retraction occurred at a 2 µg/mL concentration of Q..N-18, corresponding to ~ 1 µM concentration of the peptide (Table 10).

Table 10. Dose-dependent inhibition of autoantibody-induced acute N2A neurite withdrawal by co-incubation with 18-meric Q..N linear synthetic peptide Autoantibody (one sixtieth dilution) + (Q…N-18) at

Diagnosis

(0 µg/mL)

(3 µg/mL)

(5 µg/mL)

DM, refractory hypertension (N=1)

90 + 5%

25 + 7%

0 + 0%

The indicated concentration of theQ..N-18 linear synthetic 5HT2A receptor peptide was co-incubated with a 100 nM concentration of the Patient 1, diabetes (DM) refractory hypertension autoantibodies. Acute N2A neurite retraction was assessed after 5 minutes as described in Materials and Methods.

Epitope mapping of region within 5-HT2AR, ECL2 peptide targeted by autoantibodies

We next performed epitope ‘mapping’ of the region within the second extracellular loop region of 5-HT2A receptor targeted by the type 2 diabetes and neurodegenerative pathologies’ autoantibodies. Each of three short overlapping ECL2-region peptides was preincubated alone (for 5 minutes) with N2A cells prior to the addition of Patient 1, refraction hypertension IgG autoantibodies. Peptide 3or4 (at 20 µg/mL concentration) had no significant effect on Patient 1IgG autoantibody-induced neurite withdrawal. Peptide 2(20µg/mL) dose-dependently nearly completely prevented acute neurite retraction induced by the Patient 1, refractory hypertension IgG autoantibodies (Table 11).

Table 11. Identification of a short linear peptide that blocks autoantibody (IgG)-induced neurite retraction.

Treatment

Mean acute N2A neurite retraction (%)

DM, refractory hypertension IgG*

100 + 0%

Pt1 IgG + Peptide 3 (QDDSKVF)

87+ 19%

Pt1 IgG + Peptide 2(SCLLADDN)

5 + 5%*

Pt1 IgG + Peptide 4(VFKEGSC)

88 + 13%

*A one-fortieth dilution of the Pt 1 diabetic refractory hypertension IgG autoantibodies was incubated in the presence or absence of a 20 µg/mL concentration of three different short linear synthetic peptides comprising portions of the second extracellular loop of 5-HT2A receptor. Results are mean +/SD acute N2A neurite retraction after 5 minutes. Peptide 2 (20 µg/mL) was associated with 95% protection against the diabetic stroke pathologies IgG-induced neurite retraction. Peptide 3 or Peptide 4 at identical (20 µg/mL) concentration had no significant protective effect on IgG autoantibody-induced N2A neurite retraction.

Sub region-specific 5-HT2AR, ECL2 peptide protects against autoantibody neurotoxicity

A brief pre incubation with Peptide 2 (20 µg/mL) nearly completely prevented (99%) IgG-induced acute neurite withdrawal induced by a 50–100nM concentration of pathologies’ IgG autoantibodies in ten of ten patients tested (Table 12).

Table 12. Neutralization of diabetic autoantibody-induced N2A acute neurite retraction by a linear synthetic short peptide contained within the 5-HT2A receptor ECL2, i.e. Peptide 2.
Acute N2A neurite retraction in IgG autoantibodies

Pathologies Autoantibodies (N=10)

(without Peptide 2)

(with Peptide 2)

P-value

Dementia (2), PD(3), Stroke(2), Schizophrenia(3)

33% + 8%

0.25% + 0.75%

< 0.001

ECL2- second extracellular loop region of 5-HT2A receptor; PD-Parkinson’s disease

Co-incubation with peptide 2 (20 µg/mL) completely protected N2A cells from accelerated neuron loss caused by a1/100th dilution of Patient 1, refractory hypertension IgG autoantibodies (Table 13). After 16 hours’ incubation (at 37 degrees C) with Patient 1 or the IgG autoantibodies from four different patients suffering with stroke, Parkinson’s disease, dementia or major depressive disorder, peptide 2 (20 µg/mL) afforded substantial neuro protection against accelerated neuron loss (Table 14).

Table 13. Neutralization of diabetic IgG-induced accelerated N2A cell loss by Peptide 2, a short linear synthetic peptide corresponding to a portion of 5-HT2AR second extracellular loop region.

Pathology

Pt 1 IgG alone

Pt 1 IgG + Peptide 2

P-value

DM refractory HTN (n=1)

57 + 3%

100+ 4%

0.005

A 1/100th dilution of the diabetes (DM) refractory hypertension (HTN), plasma IgG autoantibodies was incubated for 16 hours in the presence or absence of a 20 µg/mL concentration of the linear synthetic peptide, Peptide 2. Results are mean +/- (SD) percent of basal N2A neuroblastoma cell survival.

Table 14. Neutralization of diabetic (IgG) autoantibody-induced accelerated N2A cell loss by Peptide 2, a short linear synthetic peptide corresponding to a portion of 5-HT2AR, ECL2.

Diagnosis(N=5)

IgG alone

IgG + Peptide 2

P-value

Stroke(2), PD(1), Dementia(1), MDD(1)

64 + 21%

94 + 11%

0.03

Results are mean +SD N2A cell survival after 16 hours incubation of the indicated diabetic pathologies IgG autoantibodies in the presence or absence of 20ug/mL Peptide 2. PD-Parkinson’disease, MDD-major depressive disorder.

In silico test of 5-HT2A receptor peptide’s binding affinity for major histocompatibility complex class II (MHC-II) molecules

We used the Immune Epitope Database (IEDB) and an improved prediction tool [9] to test whether a portion of the Peptide 2 amino acid sequence corresponds to an ‘immune epitope,’i.e. a sequence which displays significant binding affinity to one or more alleles comprising MHC class II,HLA‐DR, HLA‐DQ, or HLA‐DP molecules. The 15-meric linear peptide sequence(s) SKVFKEGSCLLADDN which includes Peptide 2 (underlined) was tested for binding to MHC class II molecules. There was no significant high affinity binding to alleles comprising the HLA‐DR or HLA‐DP loci. The core amino acid sequence, KEGSCLLAD displayed significant binding affinity (i.e. Ka217nM), to one specific HLA-DQ allele, DQA10102-DQB10602.

Discussion

Type 2 diabetes is not an autoimmune disease. Yet the present data suggest humoral immune responses to the 5-hydroxytryptamine (serotonin) 2A receptor in subsets of older adult obese type 2 diabetes suffering with diabetic macular edema, and proteinuric nephropathy. Aging, diffuse vascular injury and visceral obesity may each contribute to humoral immunity to the 5HT2A receptor. A role for chronic inflammation and hemodynamic factors is suggested by the observation of significantly increased ECL2 receptor peptide binding in subsets of patients with nephropathy and chronic kidney disease. The high prevalence of increased 5-HT2A receptor peptide binding in autoantibodies from patients suffering with Parkinson’s disease (14/17), major depression (9/12), stroke (6/7), and dementia (4/7), is unlikely to represent ‘non-specific binding’ since autoantibody binding (in the ELISA) was significantly associated with both autoantibody-induced neurite retraction and accelerated N2A cell loss. The correlation between receptor peptide binding and neurotoxicity demonstrated here suggests that neurovascular IgG autoantibody binding to the5-HT2AR second extracellular loop causes receptor activation which as previously reported was positively coupled to PLC/IP3/Ca2+ and RhoA/ROCK signaling pathway activation[2,3].

The second extracellular loop region loop lies in close proximity to the Orthosteric Binding Pocket (OBP) [4] and has a role in preventing normal constitutive receptor activation in biogenic and trace amine G-Protein Coupled Receptors (GPCRs) [10]. Neurovascular pathologies’ autoantibodies appeared to target a conserved sub region in ECL2 [10] important in promoting sustained activation of the 5HT2B and 5HT2A receptors by the hallucinogenic drug Lysergic Acid Diethylamine (LSD) [4]. In a recent study by Wacker et. al. [4], the atomic structure of LSD complexes to the 5-HT2B and -2A receptors was reported. Lysergic acid diethylamide-known to have long-lasting effects in humans-exhibited unusually long residence times at the 5-HT-2B and -2A receptors, i.e. off-reaction times of ~ 45 minutes and ~220 minutes, respectively [4]. Wacker and co-authors reported that amino acid residues 207–214 in 5-HT2BR form a ‘lid’ which blocks the opening to the orthosteric binding pocket likely accounting for LSD’s prolonged off-reaction time at the receptor [4]. Of interest, seven of the eight amino acid residues comprising the inhibitory Peptide 2 sequence SCLLADDN (underlined here) form the corresponding ‘lid’ region in the 5-HT2A receptor, including the conserved amino acid residue, leucine 229 (bolded), which is present in all three 5-HT2 (-A, -B, and -C) receptor isoforms [10] One of the striking features of the neurovascular pathologies’ autoantibodies effect in N2A cells was its long duration of action, i.e. neurite retraction was essentially irreversible after 45 minutes’ or longer observation times. Serotonin or the 5HT2A receptor agonist DOI promoted neurite retraction which peaked after (3–5 minutes) and was reversible at longer times [3]. Taken together with the structural data on the LSD bound 5-HT2R [4], these data suggest that neurovascular autoantibodies may binding at a critical region in the second extracellular loop involved in stabilizing a ‘persistently-active’ conformation of the 5HT2A receptor.

Systemic autoimmunity is associated with a wide variety of autoantibodies capable of targeting diverse auto antigens. In the present study, highest binding to the 5-HTR2AR linear synthetic peptide occurred in two patients with a systemic autoimmune condition, i.e. discoid (cutaneous) lupus erythematosus (Pt 2) or HLAB27- positive ankylosing spondylitis. Heparan Sulfate Proteoglycans (HSPG) is among a small group of overlapping auto antigens reported in both systemic lupus erythematosus [11] and ankylosing spondylitis [12]. Heparan sulfate proteoglycans are strongly anionic at physiologic pH. They are abundantly expressed in extracellular matrix and on vascular and neuronal surfaces where they have role(s) in the maintenance of tissue barriers and serve as low-affinity co-receptors for cationic ‘heparin-binding’ growth factors, e.g. basic fibroblast growth factor (FGF-2) [13]. Neurotoxic and endothelial cell inhibitory autoantibodies previously reported in subsets of diabetes complicated by painful neuropathy, nephropathy, macular edema or primary open angle glaucoma [14] displayed increased affinity for heparan sulfate proteoglycan [14] or a heparin Sepharose column [15]. Glomerular HSPG are elaborated in diabetic nephropathy [16], and may be a target of heightened humoral autoimmunity especially under conditions of chronic inflammation which prevail in chronic kidney disease.

The putative dominant epitope targeted by 5-HT2A receptor activating autoantibodies in the present study contains a di-aspartic acid motif (SCLLADDN) not present in the 5-HT2B receptor [10]. It is interesting to speculate that the negative charge(s) associated with having di-aspartic acid residues in a solvent-exposed region of the receptor may provide a basis for strong electrostatic interaction with circulating IgG pathologies autoantibodies. In a prior report, neurotoxicity in diabetic dementia and PD dementia IgG autoantibodies was enhanced eight-fold following chromatography of plasma on a dextran sulfate affinity chromatography column [2]. Dextran sulfate (Liposorber) apheresis issued to lower excessive concentrations of cationic lipoprotein particles (very low density, and low-density lipoproteins) in the circulation in patients with familial hypercholesterolemia. It is possible that neurovascular pathologies autoantibodies co-purified with cationic lipoprotein particles based on having similar cationic surface charge characteristics which may contribute to an electrostatic interaction with anionic sulfate groups.

Prostate expresses high level of HSPG [17] which acts as a co-receptor for several different fibroblast growth factors having key role(s) in stromal proliferation underlying prostate cancer progression [18]. Among nine patients in the present study who had co-morbid prostate (n=8) or bladder (n=1) cancer, the mean level of 5-HT2AR autoantibody peptide binding was 0.14 AU, i.e. 3.5-fold higher than background (0.04 AU). Eight of the nine prostate or bladder cancer patients suffered with a neurodegenerative (n=5 PD, n=1 dementia) or neuropsychiatric disorder (N=1 MDD, N=1 schizophrenia). In most of these patients, the cancer diagnosis and treatment was established prior to the onset of neurologic or neuropsychiatric disease manifestations perhaps consistent with a paraneoplastic mechanism for humoral autoimmunity to 5-HT2A receptor activating autoantibodies. In a prior report, prostate cancer autoantibodies in patients suffering with fatigue/depression were highly neurotoxic and evoked large increases inward cationic current in (whole-cell patch clamped) rat hippocampal pyramidal neurons associated with long-lasting desensitization of excitatory synaptic inputs [14]. Taken together with the present data, these findings suggest that 5-HT2A receptor found on cortical pyramidal neurons or in other brain regions may mediate glutamatergic excitatory post-synaptic actions in response to 5-HT2A receptor- activating autoantibodies [19].

A short linear synthetic peptide comprising a region of the second extracellular loop of the 5HT2A receptor, i.e. peptide 2, largely prevented autoantibody- induced neurotoxicity perhaps by competing for binding to the region of the 5-HT2R targeted by a majority of the autoantibodies tested. The peptide antagonist (SCLLADDN) retained its neuro protective effect (against autoantibody-induced N2A cell loss) even after 16 hours’ incubation time (at 37 degrees C) in the presence of 10% fetal calf serum. A hallmark property of an auto antigen’s immune dominant epitope is its ability to survive complete intracellular proteolytic processing [20]. Our in silico analysis suggests that Peptide 2 having the sequence SCLLADDN may comprise an immune dominant peptide which is specifically ‘recognized’ by the major histocompatibility complex class II molecular system through high affinity binding interaction with the specific HLA-DQ allele, DQA10102-DQB10602. Of interest, DQA10102-DQB10602 was previously reported to have conferred markedly increased susceptibility to narcolepsy-cataplexy in certain populations [21]. Narcolepsy is a putative neurodegenerative process affecting hypocretin neurons located in the lateral hypothalamus [22]. Narcolepsy incidence rates in young adults were reported to have peaked following the 2009 H1N1 influenza pandemic [23] and related H1N1 vaccination regimes [24] suggesting molecular mimicry with certain strains of influenza viruses as one possible mechanism for T-cell driven auto immunity in the unknown etiology of a subset of ‘autoimmune’ narcolepsy-cataplexy in HLA-DQ susceptible persons [25].

Highest level of 5-HT2AR, ECL2 autoantibody binding, i.e. 6.25 times above background, occurred in an older man (Patient 2) having discoid lupus erythematosus, and near blindness secondary to central retina artery occlusion and retinitis pigmentosa. It is of interest that 5-HT2AR immune reactivity was reported on the terminals of photoreceptors and bipolar cells in rabbit retina [26]. In addition, 5-HT2AR antagonists afforded protection against light-induced photoreceptor degeneration in certain susceptible genetic strains of mice [27]. Plasma autoantibodies in Patient 3, an 81 year-old-man who suffered with autoimmune thyroid disease and juvenile-onset retinitis pigmentosa (i.e. Stargardt disease), displayed significantly increased binding (2.5-fold background) in the ELISA. Taken together, these data suggest systemic autoimmunity in which humoral autoantibodies are directed against many different autoantigen epitopes might provide a humoral-mediated mechanism contributing to retinal degeneration occurring in genetically-susceptible patients. The 5-HT2AR ECL2 peptide-based ELISA might be useful in screening family members of affected patients suffering with genetic forms of retinal degeneration. More in vivo study of the antagonist peptide is needed to determine whether it might be neuro protective in an animal model of retinal degeneration.

The source(s) of 5-HT2AR autoantigen in angiopathic type 2 diabetes is not known. Obese diabetes is associated with increased inflammation and the latter is associated with higher risk of thrombosis. Since 5-HT2AR is expressed on platelets, it is possible that diabetic microangiopathy predisposes to micro thrombi formation at sites of inflammation which may cause 5HT2A receptor to be taken up and processed by macrophages and/or other professional antigen presenting cells. Monocytes have been reported to adhere to platelets at sites of inflammation via specific interactions not observed between platelets and other subtypes of white blood cells [28].

Our study was cross-sectional and included mostly older men. More longitudinal study in diverse (unselected) populations is needed to estimate the actual prevalence of 5-HT2AR- activating autoantibodies and whether a dose-response relationship may exist between the autoantibodies and one or more kind of neurodegenerative disorder.

In summary, the present data provide the first evidence that subsets of major depressive disorder, Parkinson’s disease, dementia, small vessel stroke (e.g. retinal artery occlusion), refractory hypertension, and proteinuric nephropathy (in both diabetes and obese non-diabetic older persons) harbored IgG autoantibodies which bound to a region of the second extracellular loop of the human 5HT2A receptor [4] previously implicated in causing long-lasting receptor activation.

References

  1. Hu G (2007) Type 2 Diabetes and the Risk of Parkinson’s Disease. Diabetes Care 30: 842–847.
  2. Zimering MB (2018) Circulating Neurotoxic 5-HT2A Receptor Agonist Autoantibodies in Adult Type 2 Diabetes with Parkinson’s Disease. J Endocrinol Diabetes 5.
  3. Zimering MB (2017) Diabetes Autoantibodies Mediate Neural- and Endothelial Cell- Inhibitory Effects Via 5-Hydroxytryptamine- 2 Receptor Coupled to Phospholipase C/Inositol Triphosphate/Ca2+ Pathway. J Endocrinol Diabetes 4.
  4. Wacker D, Wang S, McCorvy JD, Betz RM, Venkatakrishnan AJ, et al. (2017) Crystal Structure of an LSD-Bound Human SerotoninReceptor. Cell 168: 377–389.
  5. Holthoff HP, Zeibig S, Jahns-Boivin V, Bauer J, Lohse MJ, et al. (2012) Detection of anti-β1-AR autoantibodies in heart failure by a cell-based competition ELISA. Circ Res111: 675–684.
  6. Dechend R, Gratze P, Wallukat G, Shagdarsuren E, Plehm R, et al.( 2005) Agonistic autoantibodies to the AT1 receptor in a transgenic rat model of preeclampsia. Hypertension 45: 742–746.
  7. Xu T, Pandey SC (2000) Cellular localization of serotonin (2A) (5HT (2A)) receptors in the rat brain. Brain Res Bull 51: 499–505.

  8. Alsip NL, Harris PD, Durrani GE (1991) Multiple Serotonin Receptors on Large Arterioles in Striated Muscle. J Vasc Res 28: 537–541.
  9. Jensen KK, Andreatta M, Marcatili P, Buus S, Greenbaum JA, et al. (2018) Improved methods for predicting peptide binding affinity to MHC class II molecules Immunology 154: 394–406.
  10. Michino M, Beuming T, Donthamsetti P, et al. (2015) What Can Crystal Structures of Aminergic Receptors Tell Us about Designing Subtype-Selective Ligands? Pharmacol Rev 67: 198–213
  11. Shibata S, Sasaki T, Harpel P, Fillit H (1994) Autoantibodies to vascular heparan sulfate proteoglycan in systemic lupus erythematosus react with endothelial cells and inhibit the formation of thrombin-antithrombin III complexes. Clin Immunol Immunopathol 70: 114–123.
  12. Wright C, Sibani S, Trudgian D, Fischer R, Kessler B, et al. (2012) Detection of multiple autoantibodies in patients with ankylosing spondylitis using nucleic acid programmable protein arrays. Mol Cell Proteomics 11: 00384.
  13. Bernfield M, Sanderson RD (1990) a developmentally regulated cell surface proteoglycan that binds extracellular matrix and growth factors. Philos Trans R Soc Lond B Biol Sci 327: 171–186
  14. Zimering MB, Alder J, Pan Z, Donnelly RJ (2011) Anti-endothelial and anti-neuronal effects from auto-antibodies in subsets of adult diabetes having a cluster of microvascular complications. Diabetes Res Clin Pract 93: 95–105.
  15. Zimering MB, Anderson RJ, Moritz T, Ge L (2009) Investigators for the VADT Low plasma basic fibroblast growth factor is associated with laser photocoagulation treatment in adult type 2 diabetes mellitus from the Veterans Affairs Diabetes Trial. Metabolism 58: 393–400
  16. Makino H, Ikeda S, Haramoto T, Ota Z (1992) Heparan sulfate proteoglycans are lost in patients with diabetic nephropathy. Nephron 61: 415–421.
  17. Kosir MA, Quinn CC (1995) Sorting of heparan sulfate proteoglycan into matrix compartments of prostate adenocarcinoma cells. J Surg Res 58: 46–52.
  18. Wu X, Kan M, Wang F, Jin C, Yu C, et al. (2001) A rare premalignant prostate tumor epithelial cell syndecan-1 forms a fibroblast growth factor-binding complex with progression-promoting ectopic fibroblast growth factor receptor 1.Cancer Res 61: 5295–5302.
  19. Aghajanian GK, Marek GJ (1997) Serotonin induces excitatory postsynaptic potentials in apical dendrites of neocortical pyramidal cells. Neuropharmacology 36: 589–599.
  20. Kim A, Sadegh-Nasseri S (2015) Determinants of immunodominance for CD4 T cells. CurrOpin Immunol 34: 9–15.
  21. Mignot E, Lin L, Rogers W, Honda Y, Qiu X, Lin (2001) Complex HLA-DR and -DQ interactions confer risk of narcolepsy-cataplexy in three ethnic groups. Am J Hum Genet 68: 686–699.
  22. Nishino S, Ripley B, Overeem S, Lammers GJ, Mignot E (2000) Hypocretin (orexin) deficiency in human narcolepsy. Lancet 355: 39–40.
  23. Nohynek H, Jokinen J, Partinen M, Vaarala O, Kirjavainen T, et al. (2012) S03 adjuvanted AH1N1 vaccine associated with an abrupt increase in the incidence of childhood narcolepsy in Finland. PLoS One 7: 33536.
  24. Han F, Lin L, Warby SC, Faraco J, Li J, et al (2011) Narcolepsy onset is seasonal and increased following the 2009 H1N1 pandemic in China. Ann Neurol 70: 410–417.
  25. Black JIII, Avula R, Walker D, Silber M, KrahnL, et al. (2005) HLA DQB1*0602 positive narcoleptic subjects with cataplexy have CSF IgG reactive to rat hypothalamic protein extract. Sleep 28: 1191–1192
  26. Pootanakit K, Prior KJ, Hunter DD, Brunken WJ (1999) 5-HT2a receptors in the rabbit retina: potential presynaptic modulators. Vis Neurosci 16: 221–230.
  27. Chen Y, Okano K, Maeda T, Chauhan V, Golczak M, et al.(2012) Mechanism of all-trans-retinal toxicity with implications for stargardt disease and age-related macular degeneration. J Biol Chem 287: 5059–5069.
  28. Passacquale G, Vamadevan P, Pereira L, Hamid C, Corrigall V, et al (2011) Monocyte-platelet interaction induces a pro-inflammatory phenotype in circulating monocytes. PLoS One 6: 25595.

Schizophrenia Plasma Autoantibodies Promote ‘Biased Agonism’ at the 5-Hydroxytryptamine 2A Receptor: Neurotoxicity is Positively Modulated by Metabotropic Glutamate 2/3 Receptor Agonism

DOI: 10.31038/EDMJ.2019344

Abstract

Aims: To test whether neurite-inhibitory plasma autoantibodies in chronic schizophrenia activate Gq/11- and Gi- coupled signaling pathways downstream of 5-hydroxytryptamine 2A receptor activation; and for modulation of serotonergic signaling by the metabotropic 2/3 receptor agonist LY379268.

Methods: Plasma from five older adults with chronic schizophrenia and eight age-matched patients having another neuropsychiatric, immune or metabolic disorder was subjected to Protein-A affinity chromatography to obtain IgG autoantibodies. Mean neurite retraction (5 minutes) or cell survival (24 hours) was determined in mouse N2A neuroblastoma cells incubated with autoantibodies in the presence or absence of specific antagonists of the Gq/11/PLC/IP3R signaling pathway, Gi-coupled, beta-arrestin2-directed pathways, or LY379268.

Results: Chronic schizophrenia plasma autoantibodies- mediated dose- and time-dependent acute N2A neurite retraction was completely prevented by M100907, a selective 5-hydroxytryptamine 2A receptor antagonist. LY379268 promoted autoantibody-induced neurite retraction causing a shift-to-the-left in the dose-response curve. Antagonists of the RhoA/Rho kinase and Gq/11/PLC/IP3R signaling pathways blocked autoantibody-mediated neurite retraction. Chronic schizophrenia plasma autoantibodies mediated increased N2A cell survival which was blocked by LY379268, pertussis toxin, and antagonists of PI3-kinase- mediated survival signaling.

Conclusion: Schizophrenia plasma autoantibodies activate the 5-hydroxytryptamine 2A receptor positively coupled to Gq/11/PLC/IP3R pathway and RhoA/Rho kinase signaling activation in promoting acute N2A cell neurite retraction. Autoantibodies in a subset of patients experiencing hallucinations promoted increased N2A cell survival mediated (in part) via a pertussis-toxin sensitive, Gi-coupled, PI3-kinase-dependent mechanism. Positive modulation of 5-HT2AR-mediated neurite retraction by LY379268 suggests the autoantibodies may target (in part) the 5-HT2AR/mGlu2R heteromer.

Introduction

The serotonin 2A receptor (5-HT2AR) is highly expressed in cortical brain regions underlying normal perception [1]. The hallucinogenic drug lysergic acid diethylamine (LSD) causes long-lasting 5-HT2AR activation which is positively coupled to Gq/11- and β-arrestin-2- dependent signaling pathway activation [2]. Head twitch in mice infused with the hallucinogenic (reversible 5HT2AR agonist) 1-[2,5-dimethoxy-4-iodophenyl]- 2-aminopropane (DOI) required an additional contribution from metabotropic glutamate (mGlu)2R-mediated, Gi-coupled signaling since head twitch was not observed in DOI-treated mice harboring an mGlu2R knock-out mutation [3]. Heteromeric 5-HT2AR/mGlu2R complexes occur in the mammalian prefrontal cortex [4] and are thought to integrate serotonergic and glutamatergic signals via allosteric receptor-receptor interactions alters the balance between Gq11- and Gi-coupled signaling pathway activation [4].

Paranoid schizophrenia is a common disabling disease affecting ~1% of adults [5]. Evidence from epidemiologic studies [6] and a recent genome-wide association study [7] suggests a role for dysregulated acquired immunity in the pathophysiology of schizophrenia. A possible role for brain reactive autoantibodies was suggested by prior studies [6] including our report that plasma IgG autoantibodies in a subset of chronic schizophrenia potently suppressed neurite outgrowth and mediated strong depolarization in N2A mouse neuroblastoma cells [8]. Since major depression and Parkinson’s disease autoantibodies mediated long-lasting 5-HT2A receptor activation positively coupled to Gq/11 signaling [9,10], here we tested whether chronic paranoid schizophrenia plasma autoantibodies activate 5-HT2A receptor, Gq/11-mediated signaling leading to neurite outgrowth inhibition in N2A mouse neuroblastoma cells. A role for signaling cross-talk involving 5-HT2AR/mGlu2R heteromers was tested by comparing N2A acute neurite retraction induced by schizophrenia plasma autoantibodies in the presence or absence of the mGlu2/3R agonist LY379268. Since LY379268 was previously reported to suppress hallucinogen-induced Gi-coupled signaling at the 5HT2AR [4], we investigated biased 5-HT2AR-dependent, Gi-coupled signaling evoked by autoantibodies from subgroups of psychosis-prone vs. patients not experiencing recurrent visual or auditory hallucinations.

Participants and Methods

Participants– Outpatient men ranging in age from 47–78 years old provided informed consent for participation in the Institutional Review Board-approved study and were consecutively enrolled from the diabetes and endocrinology clinics at the Veterans Affairs New Jersey Health Care System (East Orange and Lyons, New Jersey).

Psychosis-prone patients

Patient 1: A 61- year- old man with a history of chronic paranoid schizophrenia and multiple recurrent hospitalizations for auditory hallucinations and one previous suicide attempt. The patient has type 2 diabetes mellitus of approximately eight years duration without microvascular complications.

Patient 2: A 55- year- old man with chronic paranoid schizophrenia, three previous suicides attempts, and type 2 diabetes (of five years known duration) without microvascular complications.

Patient 3: A 61-year-old man having major depressive disorder with mood-incongruent psychotic features and type 2 diabetes of fourteen years duration.

Patient 4: A 47-year-old man with chronic schizophrenia, and no history of type 2 diabetes. He had paranoid delusions without any suicide attempt.

Blood samples: Blood was drawn in the morning after an overnight fast. Plasma or serum was stored at -20 C.

Protein A affinity chromatography- Protein-A affinity was performed as previously described [10].

N2A mouse neuroblastoma cells: were cultured in Dulbecco’s modified Eagles medium (DMEM) containing 10% fetal calf serum. Cells were fed with fresh medium every 1–2 days, except for survival assays in which fresh medium was not added for up to 5 days prior to the addition of test autoantibody fractions.

Acute neurite retraction assay: % of basal neurite length in N2A cells expressing one or more proximally-located dendrite-like process was determined after interval exposure to test substances as previously reported [10].

N2A cell survival: MTT assay was performed 24 hours after incubation with test substances as previously reported [10].

Chemicals: all chemicals were obtained from Sigma, Co., Inc. (St Louis, MO), except YM-254890 (Focus Biomolecules) and LY 379268 (Tocris Bioscience).

Protein assay: protein concentration was determined using a modified bichichonic acid assay (Bio Rad. Inc.).

Statistics- Paired and unpaired T-tests were used to assess for statistically significant differences between groups or between treatments.

Results

Baseline characteristics in the study patients

The clinical characteristics in the study patients are shown in (Table 1). Patients having chronic schizophrenia did not differ significantly in their mean age, body mass index or glycosylated hemoglobin level from patients having Parkinson’s disease (n=5), dementia (n=1), or diabetic nephropathy (n=1).

Table 1. Clinical characteristics in the study participants

Diagnosis

Age (years)

HbA1c (%)

BMI (kg/m2)

Schizophrenia (n=5)

61.4 + 9.7

7.0 + 1.1

31.7 + 8.1

PD or Other (n=7)

70.6 + 5.5

7.2 + 1.4

33.1 + 6.2

Diabetes without MVD (n=2)

77.5 + 6.1

7.2+ 0.2

33.5 + 5.3

*Parkinsons disease (PD) (n=4), major depressive disorder (n=1), diabetic nephropathy (n=1), dementia (n=1). MVD- microvascular disease.

Acute N2A neurite retraction from schizophrenia plasma IgG fractions

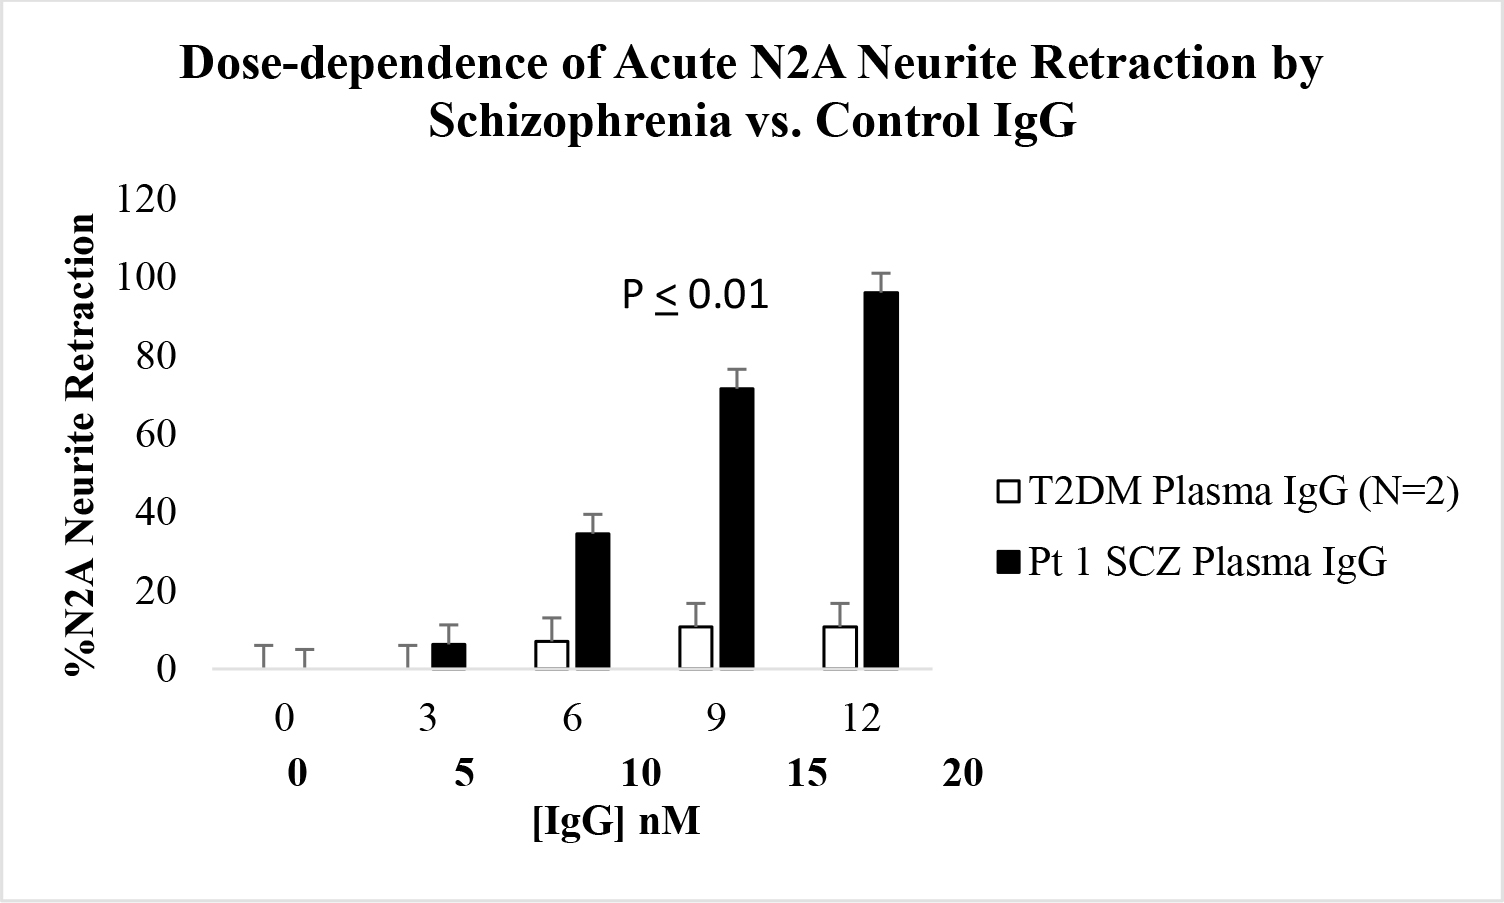
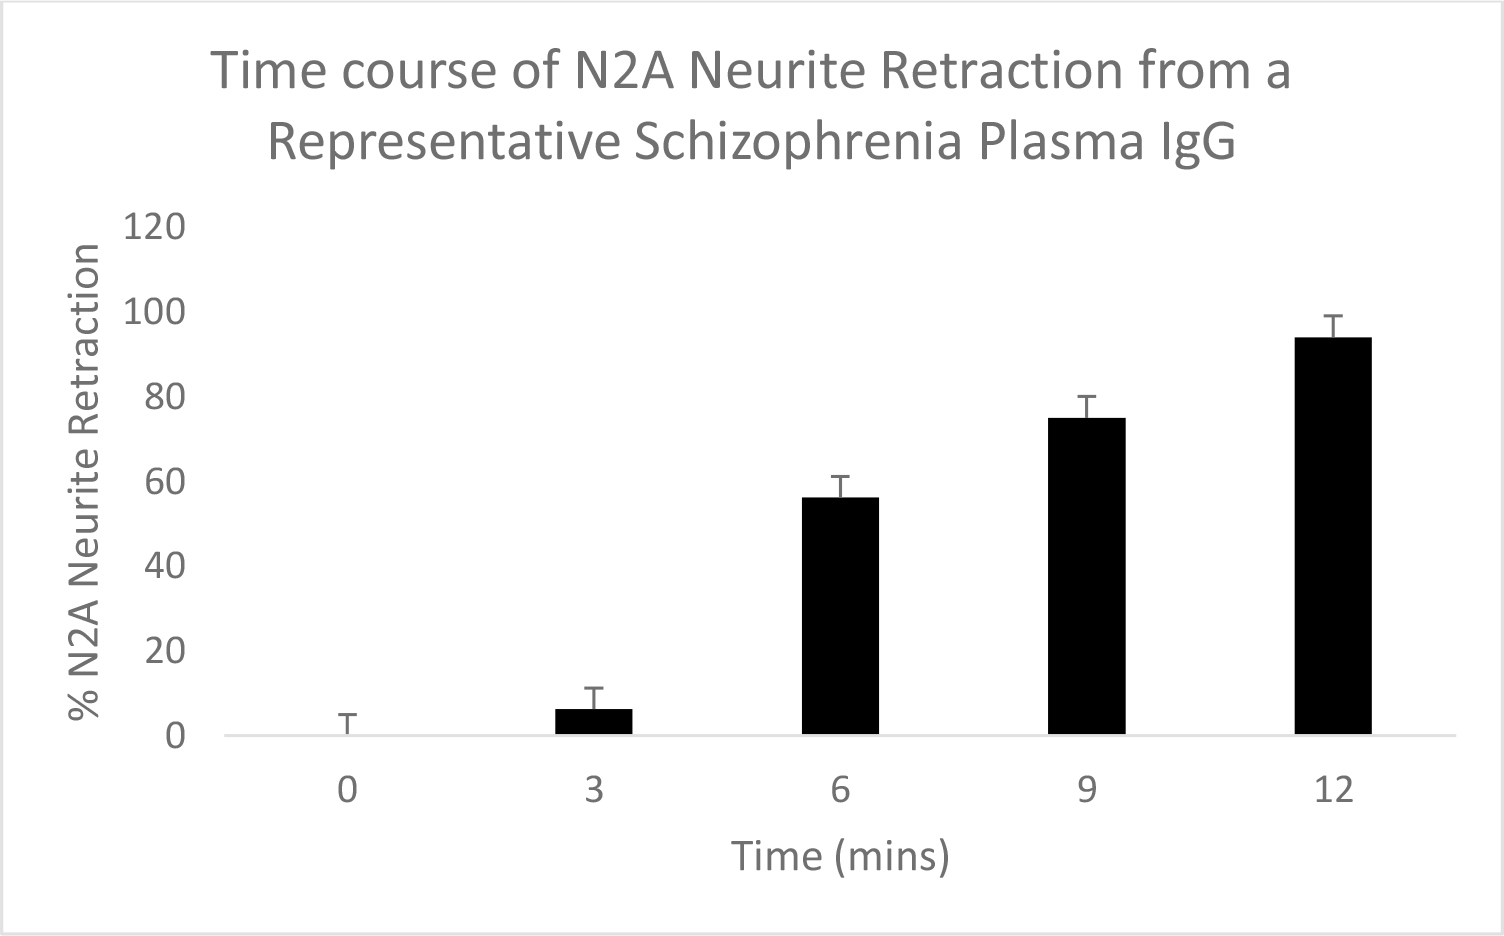
Schizophrenia plasma autoantibodies (at IgG concentrations > 10 nM) caused dose-dependent N2A neurite retraction which significantly exceeded neurite retraction in an identical concentration of IgG from two older adult type 2 diabetes patients without microvascular, neuropsychiatric or neurodegenerative complications (Figure 1A). Neurite retraction in response to potent schizophrenia plasma autoantibodies, e.g. Pt 1, was linear, irreversible and more than 50% neurite withdrawal occurred after 5 minutes’ exposure time (Figure 1B).

A

EDMJ 2019-117 - Mark Zimering USA_F1a

B

EDMJ 2019-117 - Mark Zimering USA_F1b

Figure 1. A) Dose-dependent or B) time-dependent acute neurite retraction induced by diabetic schizophrenia plasma autoantibodies (solid bars; Pt 1) or (A) by the autoantibodies from two older diabetic patients not suffering with diabetic microvascular complications or any neuropsychiatric or neurodegenerative complication (open bars). Results represent mean + SE determined as described in Materials and Methods. B) Similar results were obtained in the plasma autoantibodies from all five of five schizophrenia patients tested.

Schizophrenia (SCZ) plasma autoantibody-induced neurite retraction was completely prevented by co-incubation with a two-hundred nanomolar concentration of the selective 5HT2A receptor antagonist, M100907 (Table 2). Slightly higher concentrations (500 nM) of the 5-HT2A receptor antagonists spiperone and ketanserin afforded significant protection (~50–80%) against SCZ plasma autoantibody-induced neurite retraction (Table 2). A higher concentration (1–10 µM) of selective antagonists of the endothelin A, angiotensin type 1, alpha-1-adrenergic and 5HT2B receptors (all Gq/11-coupled GPCRs) i.e. bosentan, losartan, prazosin and SB204741, did not significantly protect (0- 28%) against schizophrenia plasma IgG-induced neurite retraction (Table 2).

Table 2. Pharmacology of schizophrenia plasma autoantibody(AutoAB)-induced neurite retraction

Antagonist%

AutoAB-induced

+ AutoAB (20 nM)

[Concentration]

Receptor

neurite retraction

M100907

200 nM

5HT2AR

0 + 0%

Spiperone

500 nM

5HT2AR

17 + 6%

Ketanserin

500 nM

5HT2AR

43 + 11%

SB204741

1 µM

5HT2BR

100 + 0%

Bosentan

10 µM

ETAR

94 + 7%

Losartan

10 µM

AT1R

72 + 8%

Prazosin

1 µM

A1AR

72 + 10%

A twenty nanomolar concentration of the Pt 1 schizophrenia protein-A eluate fraction of plasma was incubated with N2A cells in the presence or absence of the indicated concentration of each Gq/11, GPCR antagonist. Results are the mean +/- SD of two experiments

Mechanism of schizophrenia plasma IgG-induced neurite retraction

Major depressive disorder and Parkinson’s disease plasma IgG autoantibodies were previously reported to cause acute N2A neurite retraction through a mechanism involving activation of the RhoA/Rho kinase and PLC/IP3R/Ca2+ signaling pathways [9,10]. In the present study, neurite retraction induced by SCZ plasma IgG autoantibodies was completely prevented by co-incubating N2A cells with a ten micromolar concentration of the selective Rho kinase inhibitor Y27632 or a one micromolar concentration of the selective Gq11 inhibitor Y254890 (Table 3). In addition, a one micromolar concentration of the phospholipase C inhibitor U73122, and a 50 micromolar concentration of the IP3R antagonist 2-APB each significantly protected (72–83%) against SCZ IgG-induced neurite retraction (Table 3). Taken together, these data suggest that SCZ IgG induced neurite retraction likely involves activation of both RhoA/Rho kinase and Gq/11/PLC/IP3R/Ca2+ signaling pathways.

Table 3. Mechanism of acute N2A neurite retraction induced by schizophrenia plasma AutoAB

Treatment

Conc

% of AutoAB-induced neurite retraction

SCZ IgG (N=2) alone

40 nM

100 + 0%

AutoAB + Y27632 (ROCK inhibitor)

10 uM

0 + 0%

AutoAB + 2-APB (IP3R antagonist)

50 uM

17 + 1.9%

AutoAB + U73122 (PLC inhibitor)

1 uM

28 + 15%

AutoAB + YM-254890 (Gq11 inhibitor)

1 uM

0 + 0%

A forty nanomolar concentration of the Pt 1 or Pt 2 schizophrenia plasma autoantibodies (AutoAB) was incubated in the presence or absence of the indicated concentration of RhoA/Rho kinase (ROCK) inhibitor, or individual antagonists of the Gq11/PLC/IP3R signaling pathway. Results are (mean +/- SD) acute N2A neurite retraction occurring in response to Pt 1 or Pt 2 IgG autoantibodies.

Modulation of SCZ IgG-induced neurite retraction by LY379268, a potent mGlu2/3R agonist

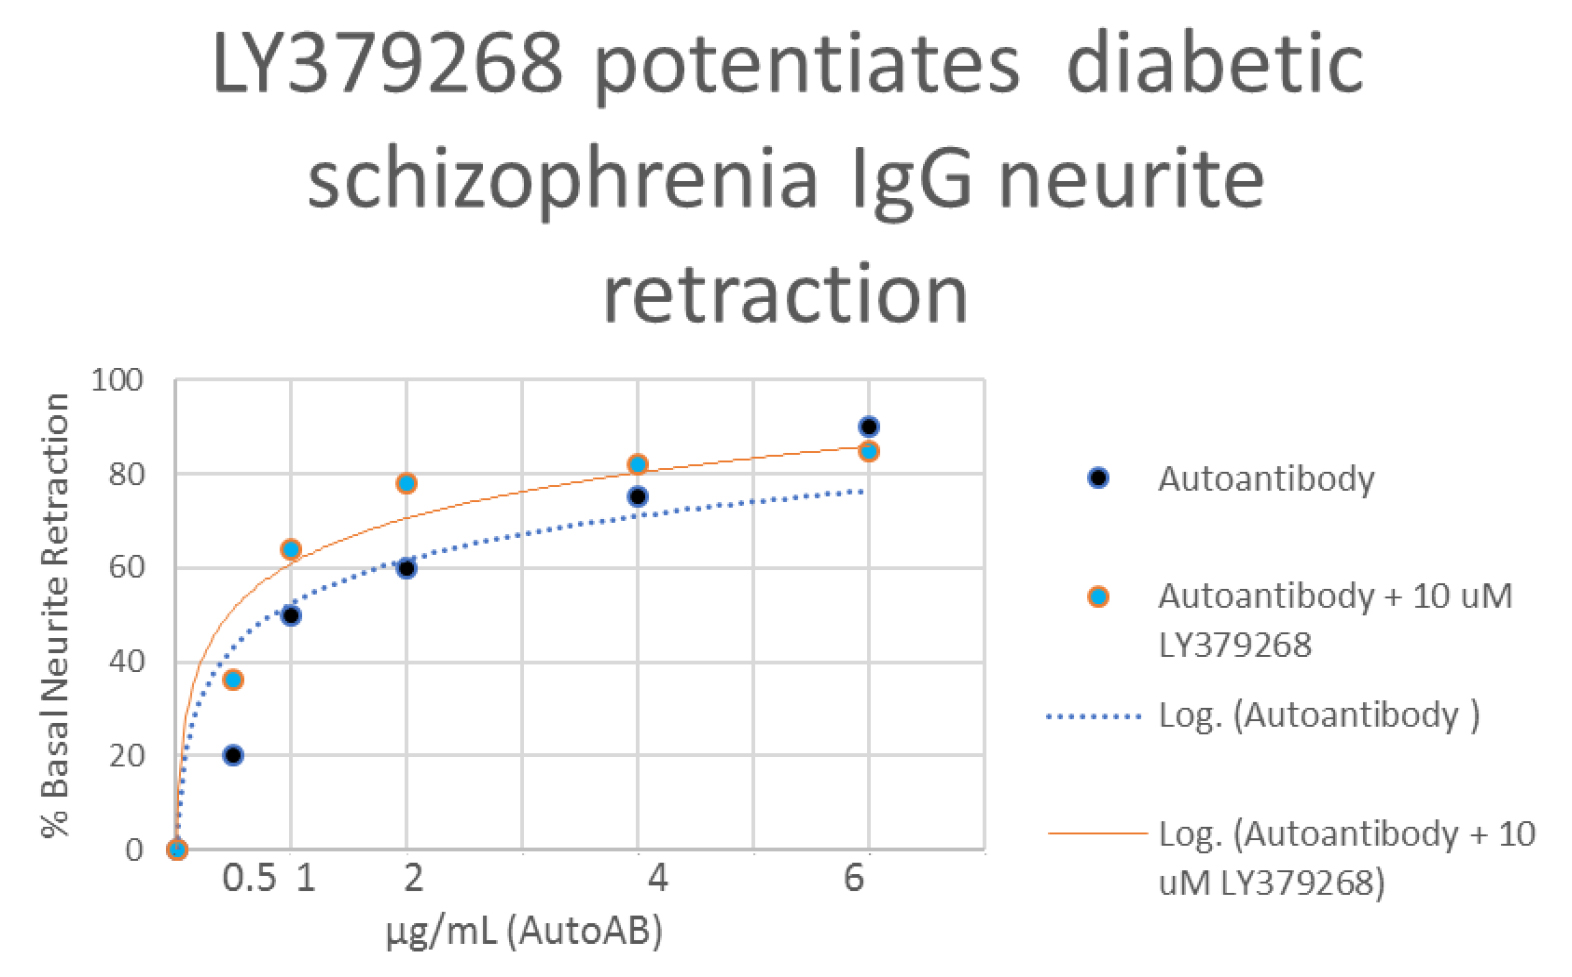
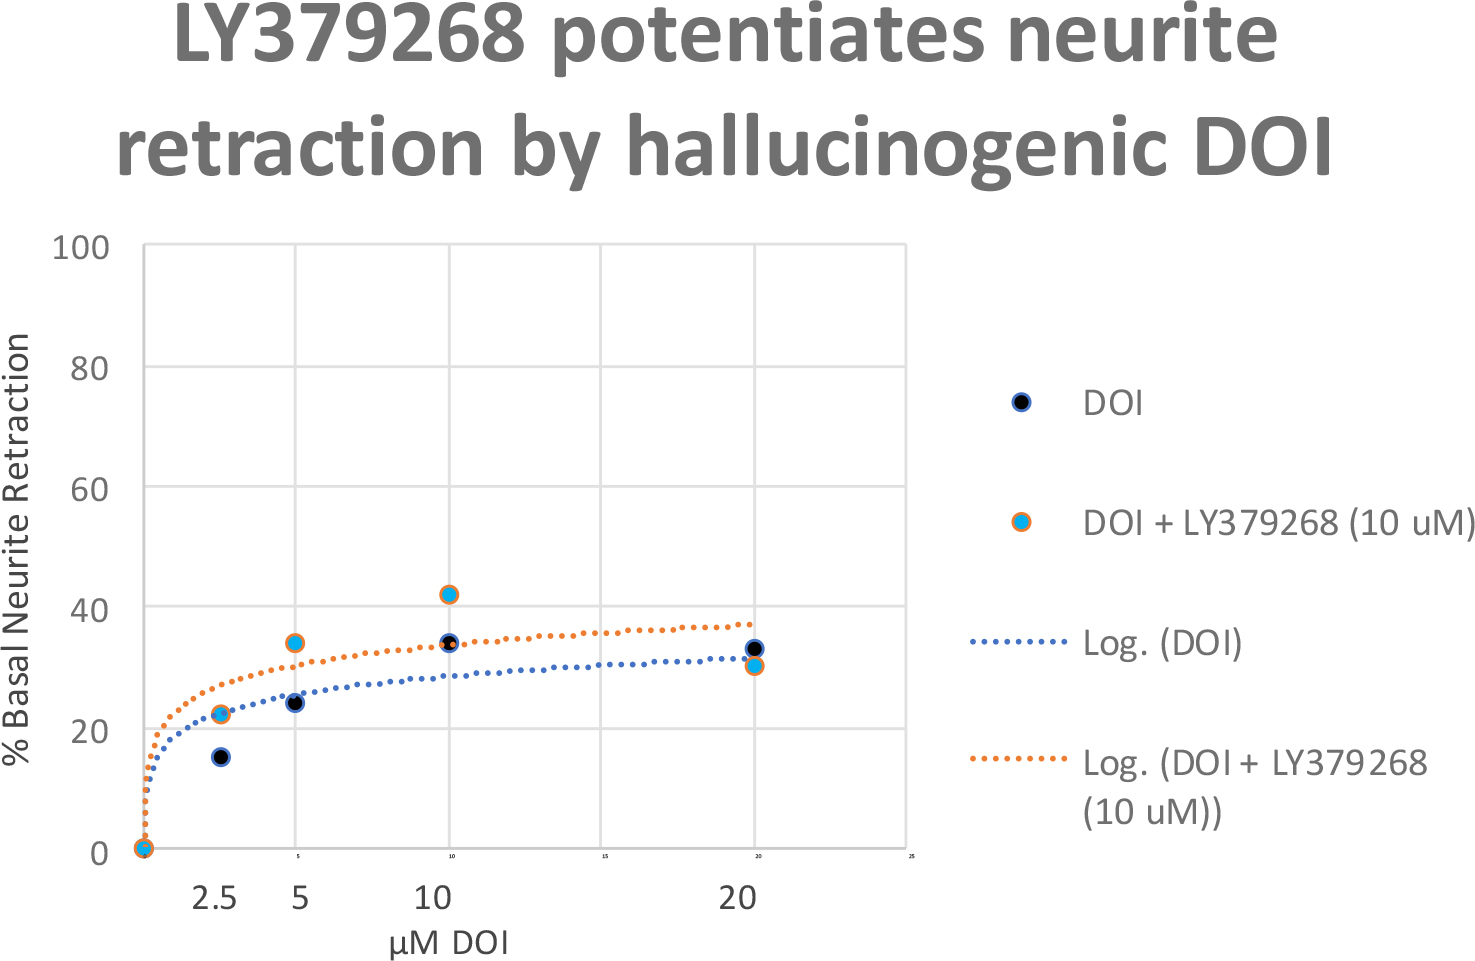
Cross-signaling between Glu2/3R and 5HT2AR was inferred from differences in IgG-induced N2A acute neurite retraction occurring in the presence or absence of the mGlu2/3R agonist LY379268, at 5–10 µM concentrations (of LY379268) which alone had no effect on neurite retraction. The mGlu2/3R agonist LY379268 was previously reported to cause positive allosteric modulation of the 5HT2AR protomer affinity at 5HT2AR/mGlu2R heteromers [4]. A one microgram per milliliter concentration (~ 7 nM) of the potent Pt 1, SCZ plasma IgG autoantibodies caused 50% inhibition of N2A neurite outgrowth (Figure 2A). Pre-incubation (for 5 minutes) followed by co-incubation of N2A cells with a 10 micromolar concentration of LY379268 caused a ‘shift to the left’ in the dose-response curve of the Pt 1 plasma IgG-induced neurite retraction: 50% inhibition of N2A neurite outgrowth occurred at substantially lower, i.e.~ 0.5 microgram per milliter concentration (3.5 nM) of Pt 1 IgG autoantibodies (Figure 2A). The “potentiating effect” of 10 µM LY379268 on neurite retraction was more pronounced at low concentrations of SCZ plasma IgG ranging from (3.5–14 nM) (Figure 2A). Presumably, at these lower concentrations a high proportion of unoccupied 5HT2A receptors are available to undergo positive allosteric modulation via mGlu2R protomer binding to LY379268. The dose-response curve for DOI-induced neurite retraction underwent a ‘shift- to-the-left’ in the presence of (10 µM) LY379268: the concentration of DOI needed to evoke 25–30% neurite inhibition decreased from 10 µM (in the absence of LY379268) to 5 uM in the presence of LY379268 (Figure 2B). A saturating concentration of the reversible 5-HT2AR agonist DOI (20 µM) caused 40% peak neurite retraction compared to 50% neurite retraction induced by an ~2000-fold lower concentration (7 nM) of potent SCZ plasma IgG autoantibodies (Figure 3).

A

EDMJ 2019-117 - Mark Zimering USA_F2a

B

EDMJ 2019-117 - Mark Zimering USA_F2b

Figure 2. A) Diabetic schizophrenia Pt plasma autoantibodies or B) the hallucinogen DOI was incubated at the indicated concentrations in the presence (orange symbol) or absence (blue symbol) a 10 micromolar concentration of LY379268 in N2A cells. Each point represents mean acute neurite retraction which varied by < 10%. A) Similar result was obtained in the diabetic schizophrenia Pt 2 plasma autoantibodies.

EDMJ 2019-117 - Mark Zimering USA_F3

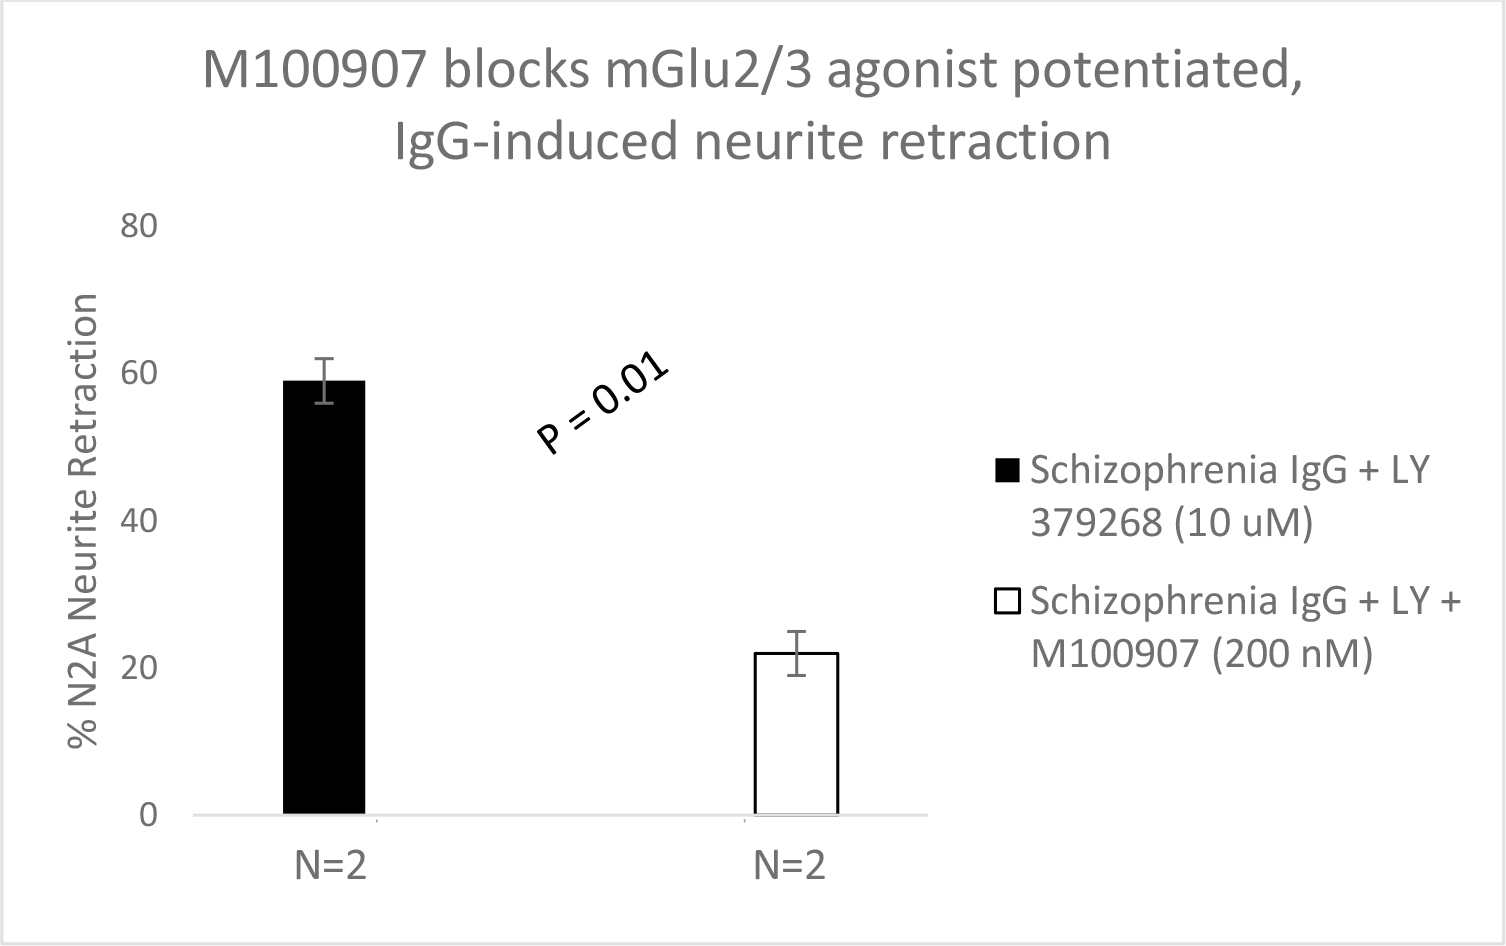
Figure 3. Schizophrenia plasma autoantibodies (Pt 1, 2) was incubated with a micromolar concentration of LY379268 alone (solid bars) or with (open bars) a two-hundred nanomolar concentration of the selective 5-HT2AR antagonist M100907 in N2A cells. Results are mean + SE as described in Materials and Methods.

LY379286-potentiated SCZ plasma IgG autoantibody-induced neurite retraction was significantly prevented by co-incubation with the highly selective 5HT2AR antagonist M100907 (500 nM) suggesting mGlu2/3R agonism enhanced neurite retraction via 5HT2AR-dependent signaling. One possibility is that an mGlu2/3R agonist increased 5HT2AR receptor affinity for SCZ plasma IgG autoantibodies via a heteromeric receptor-receptor interaction as was previously reported for mGlu2/3 agonist action at the 5HT2AR/mGlu2R complex [4].

Potentiation of 5HT2AR- mediated neurite retraction (by a 10 µM concentration of LY379268) was observed in the IgG autoantibodies from twelve patients tested including: chronic paranoid schizophrenia (n=5), Parkinson’s disease (n=5), dementia (n=1) and diabetic nephropathy (n=1). The mean level of neurite retraction (induced by an IgG concentration which alone caused~ 50% retraction) was significantly increased in the presence of 10 µM LY379268 (74 + 10% vs 52 + 7%; P < 0.001; n=12) (Table 4).

Table 4. Mean N2A neurite retraction induced by neurovascular pathologies’ AutoAB in the presence or absence of (7.5–10 µM) LY379268, a selective mGlu2/3R agonist

Pathologies (N=12)

Mean [IgG].

Pt IgG.

Pt IgG + LY379268

P-value

Schizophrenia (5), PD(4),

17 + 6 nM

52 + 7%^

74 + 10%^

< 0.001

Other (3)

^ Mean acute N2A neurite retraction (after five minutes’ incubation) in the presence of the indicated mean concentration of plasma autoantibodies (protein-A eluate fraction) with or without a 7.5–10 µM concentration of the mGlu2/3R agonist LY379268.

Other pathologies: n=1 dementia, n=1 diabetic nephropathy, n=1 major depressive disorder

Balanced Gq/11- and Gi/o-coupled signaling in response to SCZ plasma IgG autoantibodies

Second generation anti-psychotic medications, e.g. clozaril, risperodone, exhibit high affinity binding to 5-HT2AR and bias 5-HT2AR signaling in favor of Gi- coupled pathways [11]. They also bind less avidly to the dopamine 2 receptor, D2R [11]. The reversible 5-HT2AR hallucinogenic agonist DOI biases signaling in favor of Gq/11 [12]. Yet the irreversible 5-HT2AR agonist LSD, and serotonin and its psychoactive metabolites promotes a mix of Gi- and Gq/11 coupled signaling [2, 12]. Psychosis can occur in subsets of major depressive disorder and in ~50% of Parkinson’s disease patients. We next investigated whether the ability to evoke survival promotion in N2A cells might differentiate autoantibodies in a subset of psychosis-prone patients and the mechanisms underlying autoantibody-induced N2A survival promotion.

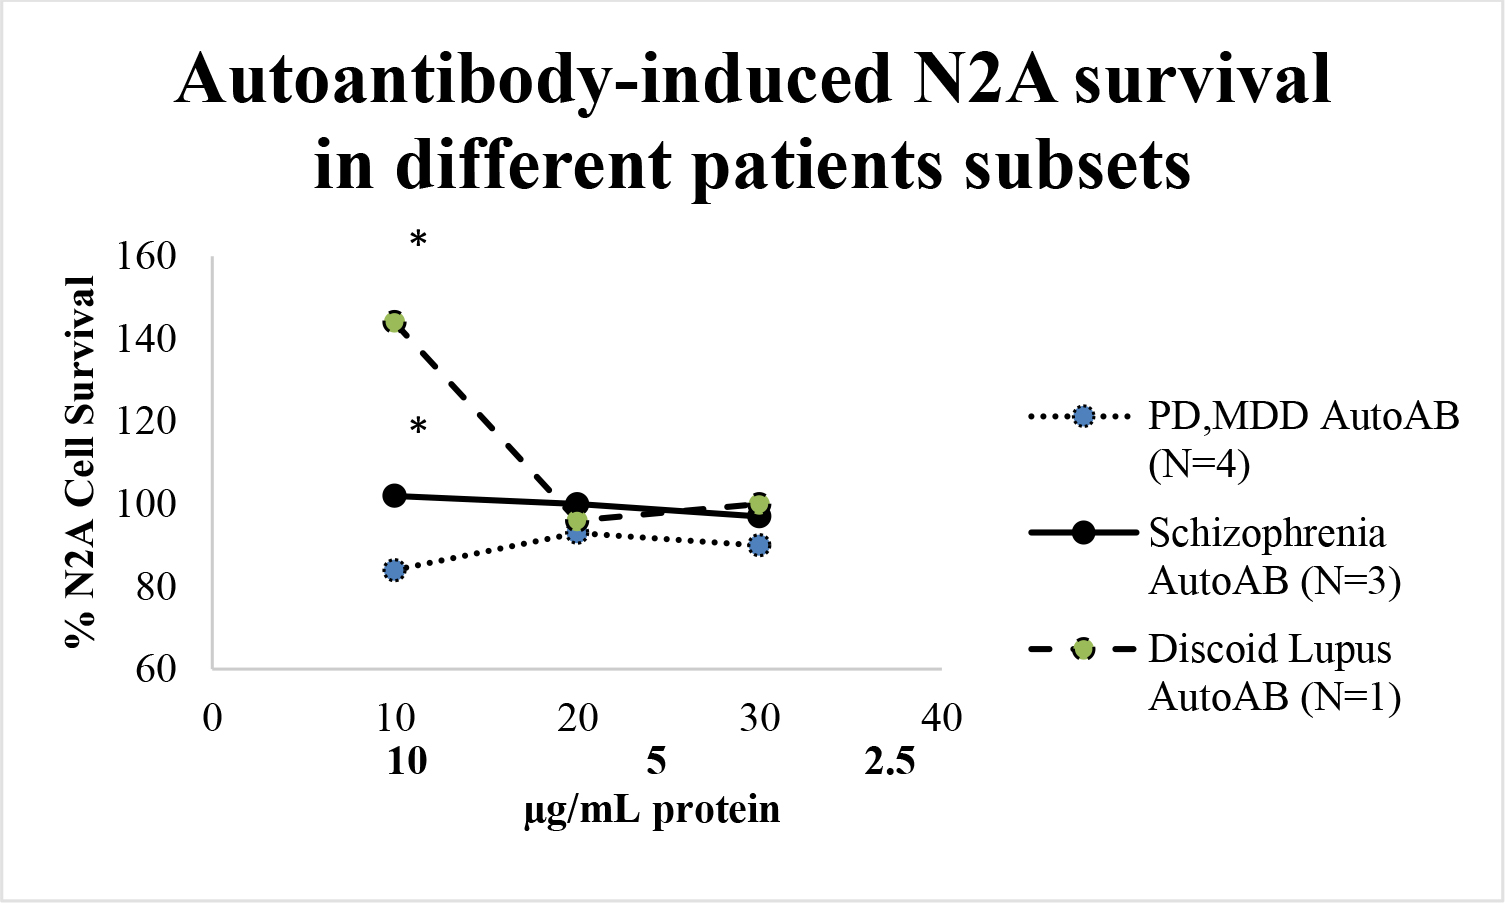
Plasma IgG autoantibodies in Patients 1, 2, 4 having chronic schizophrenia (10 µg/mL) caused dose-dependent increased N2A cell survival compared to an identical concentration of IgG autoantibodies from four patients with either MDD (n=3) or PD (n=1), only one of whom (PD) had experienced visual hallucinations (Figure 4A). The autoantibodies from a patient with the systemic autoimmune condition discoid lupus erythematosus caused significantly greater N2A growth stimulation (144% + 5% vs. 102 + 8%; P < 0.01) compared to mean growth stimulation in an identical concentration of the autoantibodies from three chronic schizophrenia patients (Figure 4A).

A

EDMJ 2019-117 - Mark Zimering USA_F4a

B

EDMJ 2019-117 - Mark Zimering USA_F4b

Figure 4. A) Plasma autoantibodies in three patients with schizophrenia (solid line) , four patients with another disorder (dotted line), or a patient with diabetes and discoid lupus (dashed line) were incubated with N2A cells at the indicated concentrations for 24 hours. Each point represents mean N2A cell survival, i.e. quadruplicate determinations which varied by < 10%.

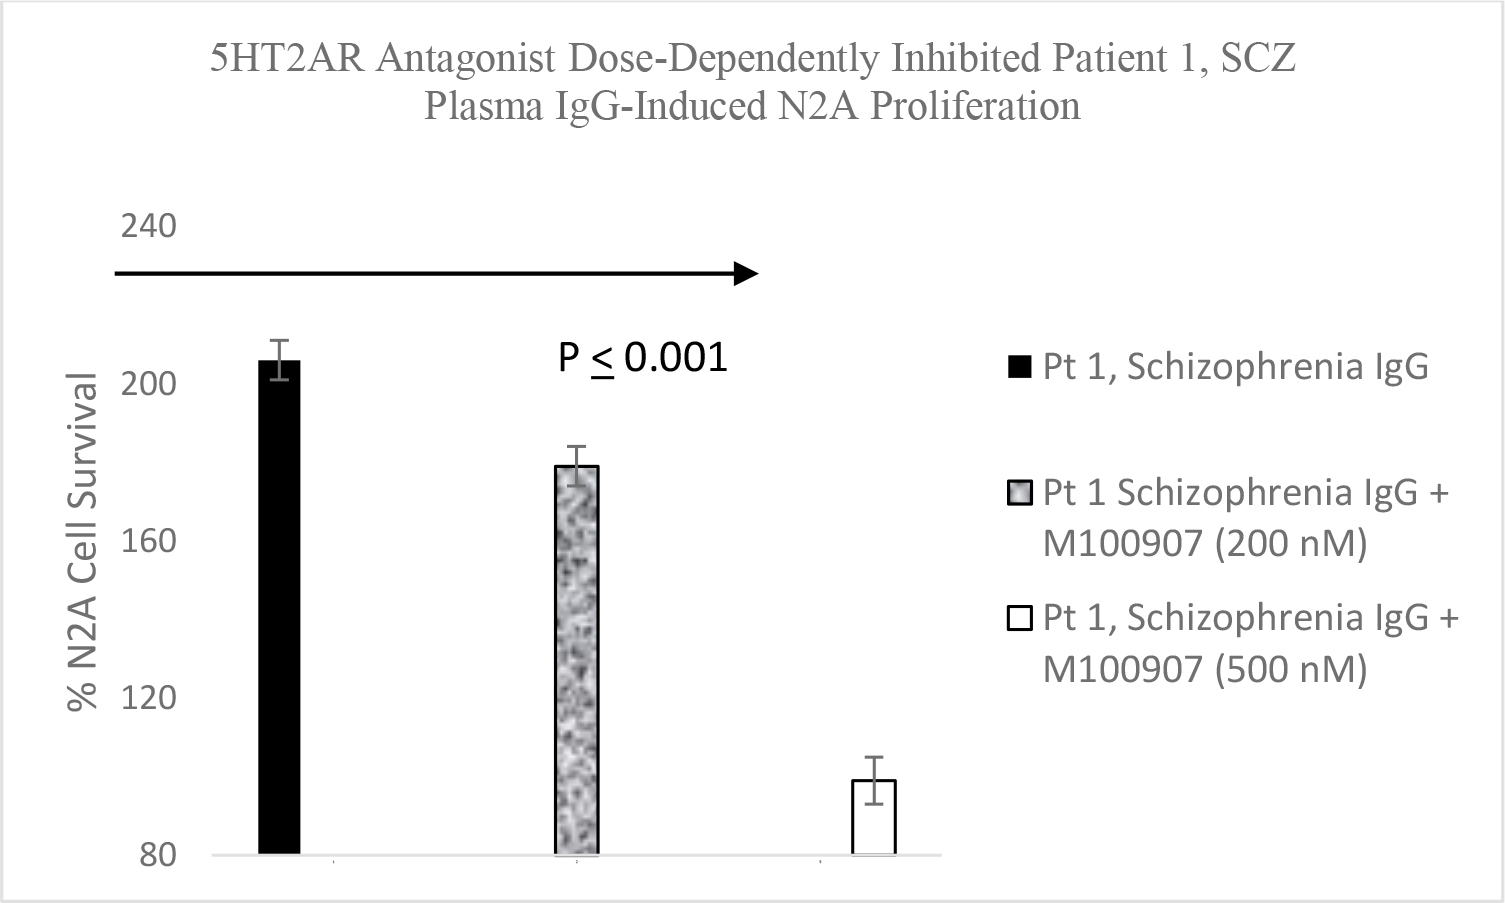
* P< 0.01 compared to solid line or dotted line B) Patient 1 diabetic schizophrenia autoantibodies (60 nM) was incubated alone (solid bars) or with a 200 nanomolar (speckled bar) or a 500 nanomolar concentration (open bar) of the selective 5-HT2AR antagonist M100907 in N2A cells for 24 hours. Results are mean + SE.

Mechanism of N2A pro-survival effect in plasma autoantibodies from psychosis-prone subset

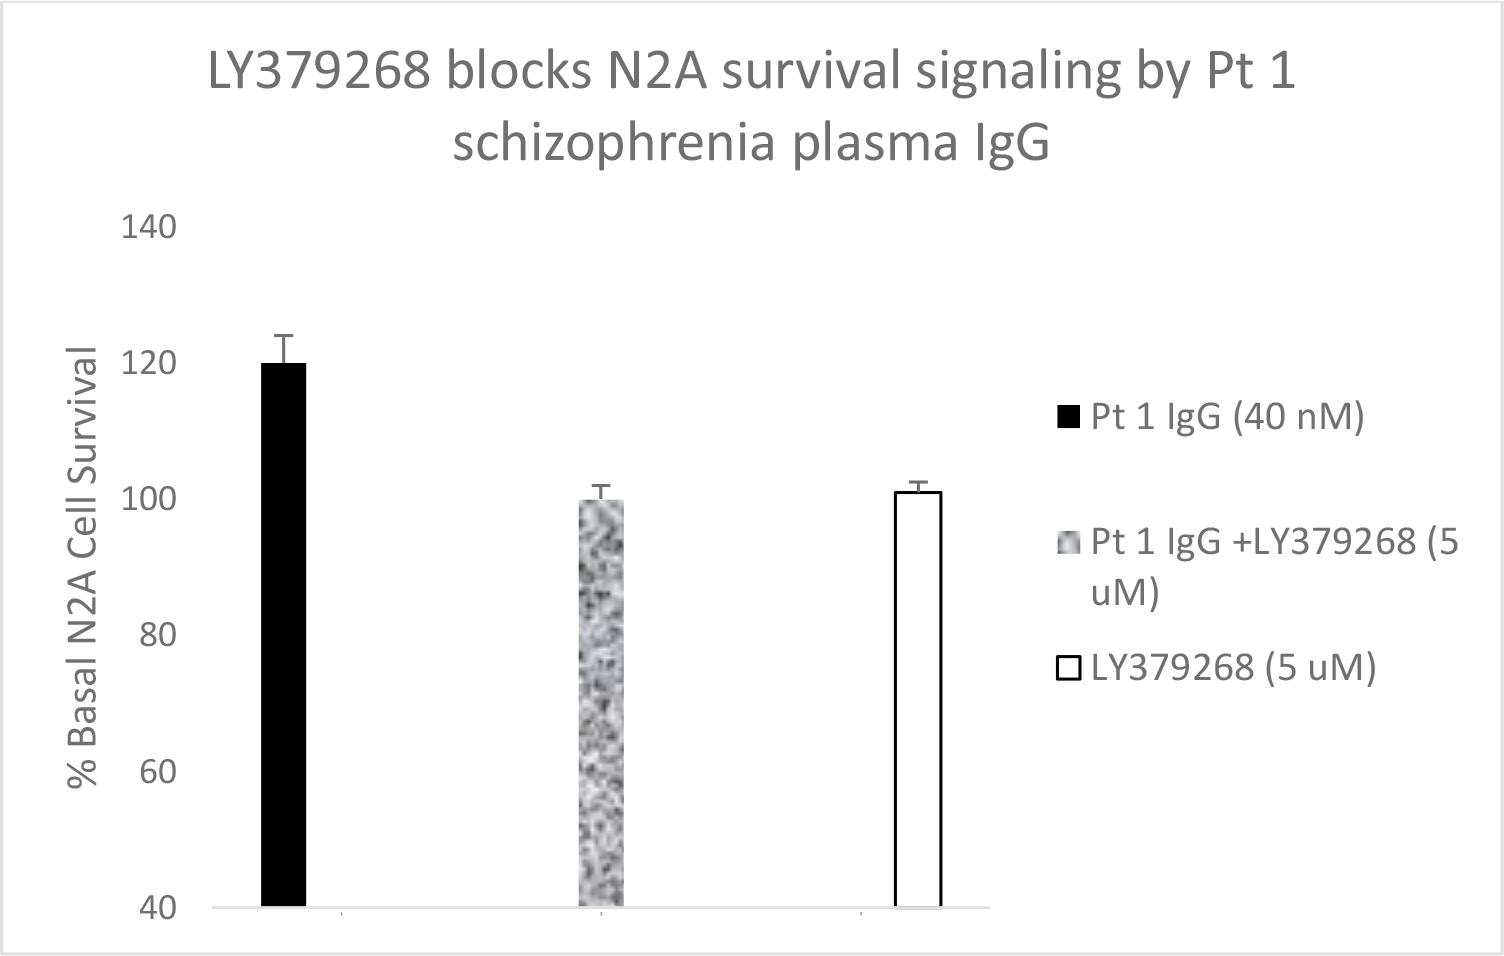
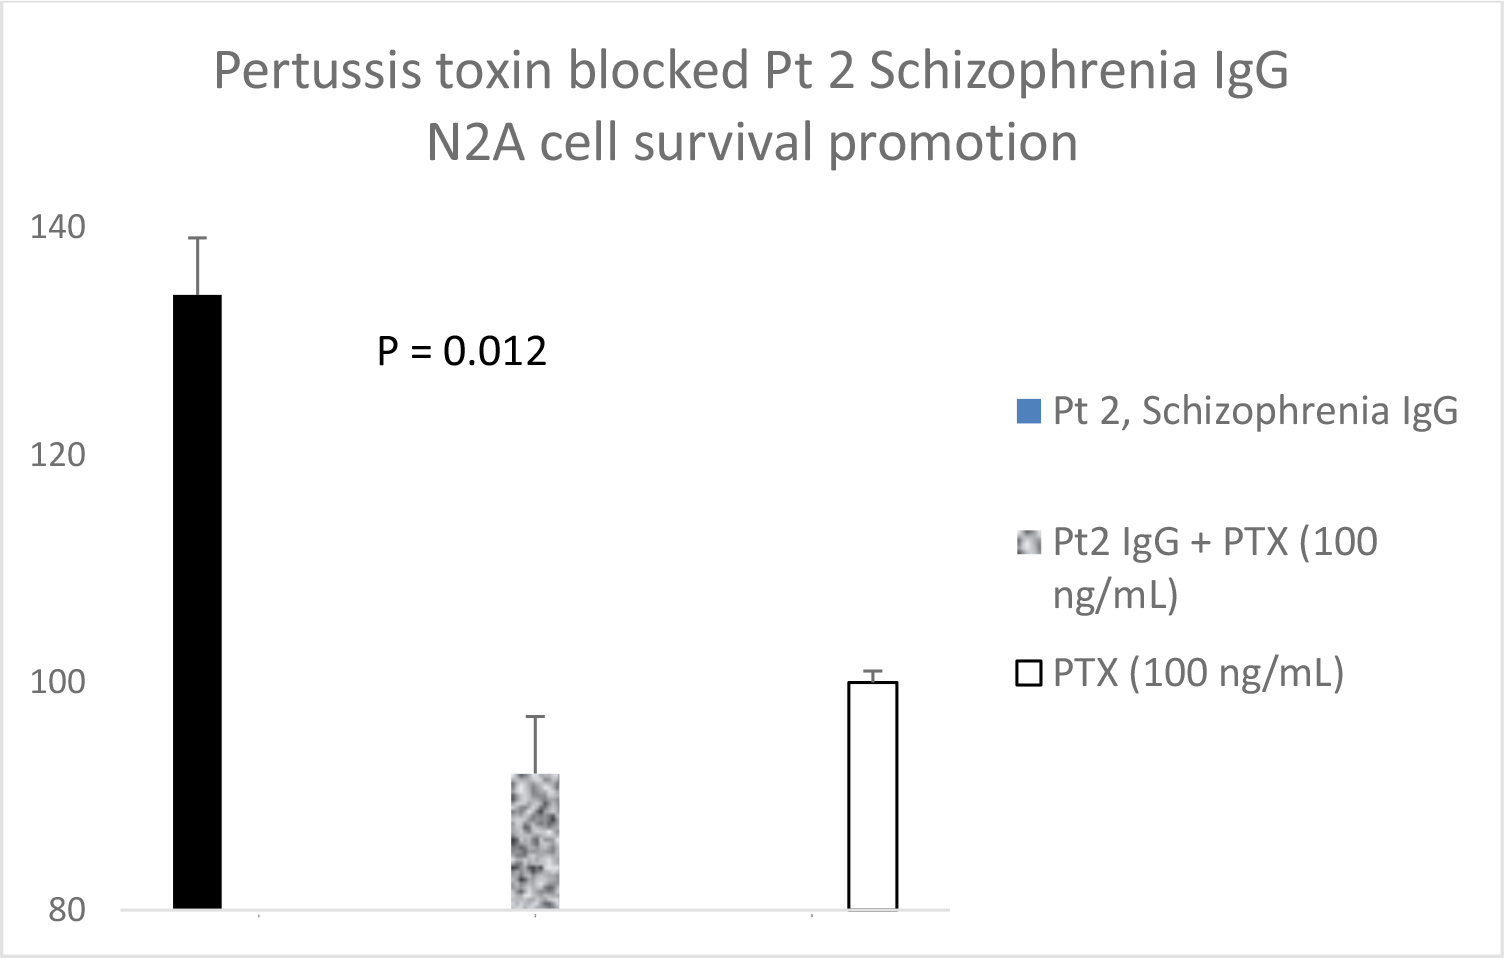
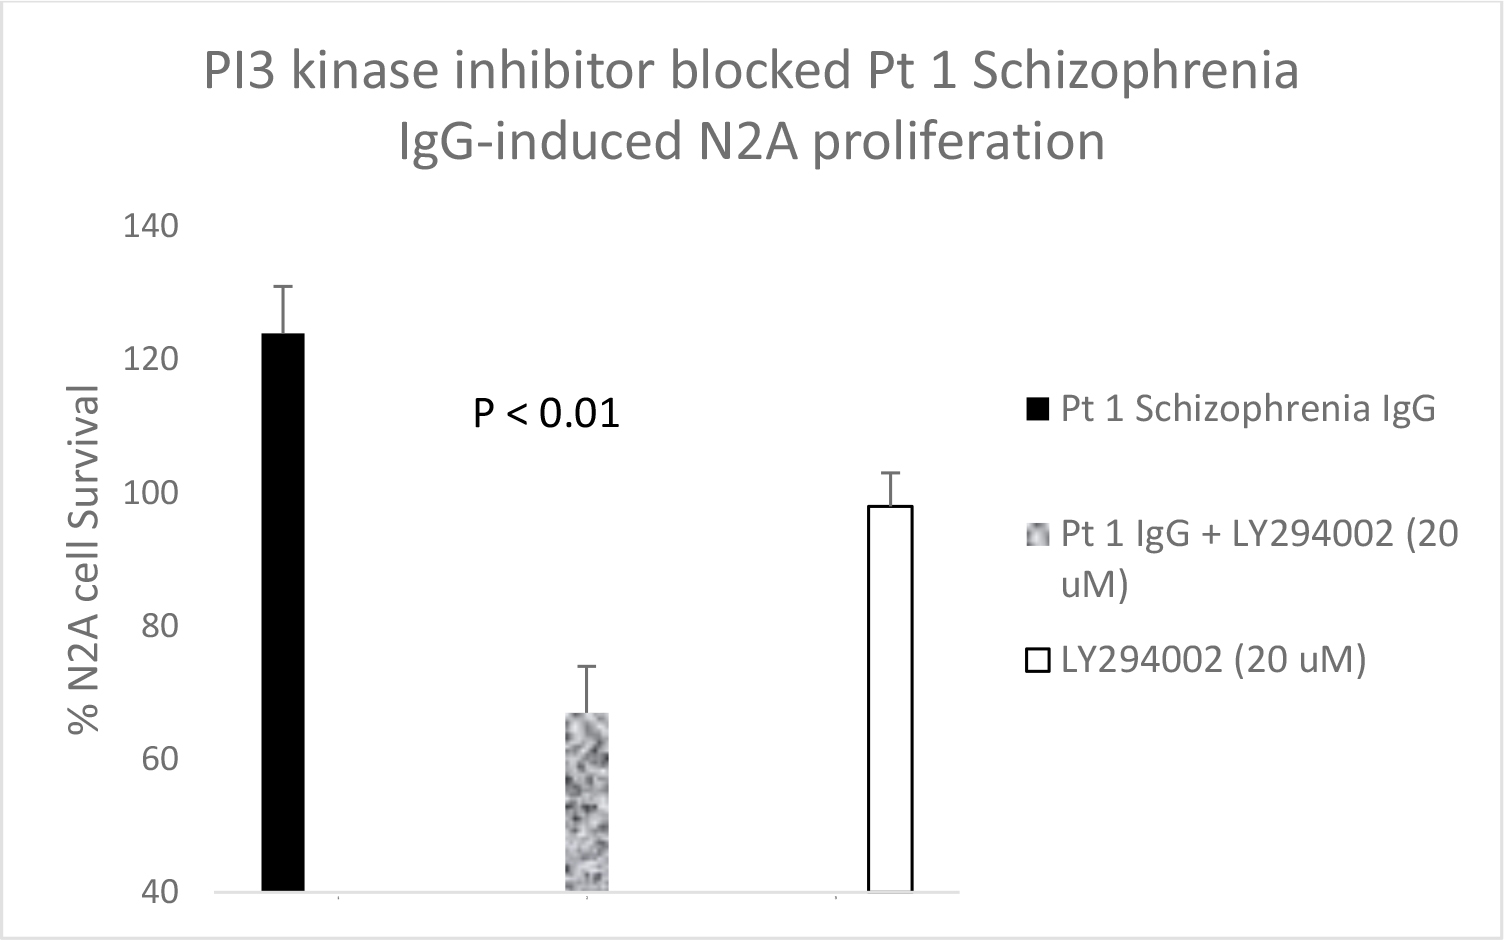
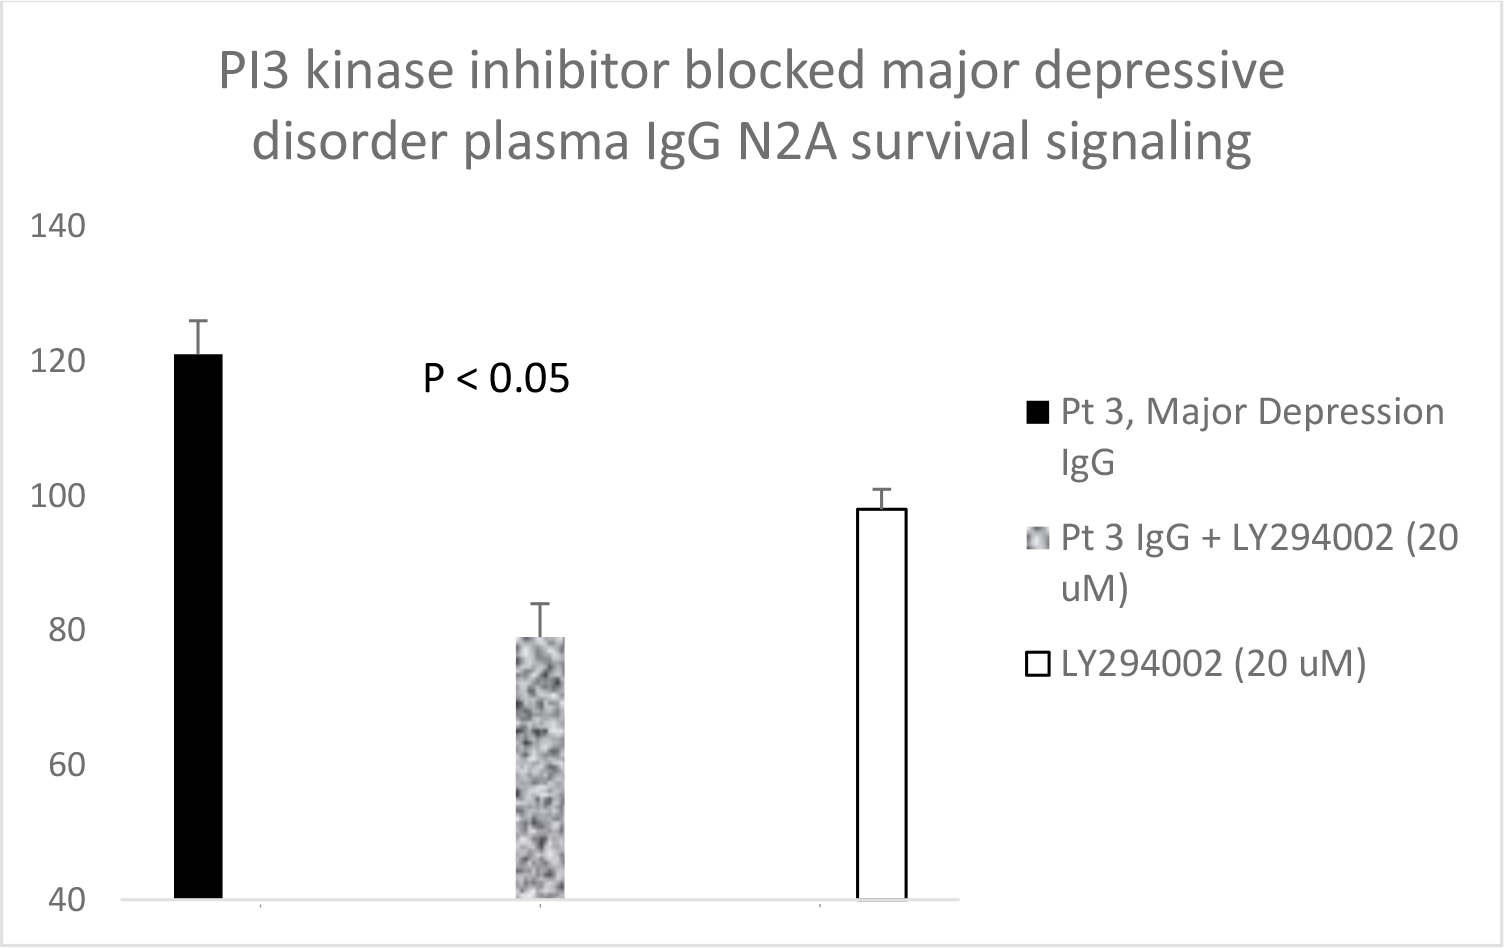
Serotonin 2A receptor activation leads to β-arrestin-2- mediated desensitization and receptor internalization. However, β-arrestin-2 can also couple with diverse signaling pathways leading to enhanced cell proliferation and/or survival promotion. The Pt 1, chronic paranoid schizophrenia IgG autoantibodies promoted increased N2A cell proliferation which was significantly blocked by 500 nM concentration of M100907 (Figure 4B) consistent with 5HT2AR-mediated proliferation signaling. LY379268 (5 µM) alone had no effect on N2A survival, but it significantly blocked the Pt 1 and Pt 2, schizophrenia autoantibody-induced pro-survival effect on N2A cells (Figure 5A). Pertussis toxin (100 ng/mL) had no effect alone on N2A cell survival, but significantly blocked the pro-survival effect of Patient 2 SCZ IgG on N2A cells (Figure 5B). Finally, the PI3- kinase inhibitor LY294002 (20 µM) significantly decreased N2A survival-promotion induced by schizophrenia Pt 1, and Pt 3 major depression with psychotic features autoantibodies (Figure 6A, B).

A

EDMJ 2019-117 - Mark Zimering USA_F5a

B

EDMJ 2019-117 - Mark Zimering USA_F5b

Figure 5. A) Patient 1 schizophrenia plasma autoantibodies (40 nM) was incubated alone (solid bar) or with (speckled bar) a 5 micromolar concentration of the mGlu2R agonist LY379268 in N2A cells for 24 hours. Similar results were obtained in the plasma autoantibodies from Pt 2 chronic schizophrenia, and a Parkinson’s disease patient who had been experiencing visual hallucinations. B) Patient 2 chronic schizophrenia plasma autoantibodies (40 nM) was incubated alone (solid bar) or with (speckled bar) a 100 ng/mL concentration of pertussis toxin (PTX) in N2A cells for 24 hours. A-B) Results are mean + SE.

A

EDMJ 2019-117 - Mark Zimering USA_F6a

B

EDMJ 2019-117 - Mark Zimering USA_F6b

Figure 6. A) Pt 1 schizophrenia plasma autoantibodies (40 nM) or B) Pt 3 major depression with psychotic features autoantibodies was incubated alone (solid bar) or in the presence (speckled bar) of a twenty micromolar concentration of the PI3-kinase inhibitor LY294002 in N2A cells for 24 hours. Results are mean + SE. Similar results were obtained with two additional schizophrenia patient plasma autoantibodies.

Possible association between psychosis and autoantibody-mediated N2A survival promotion

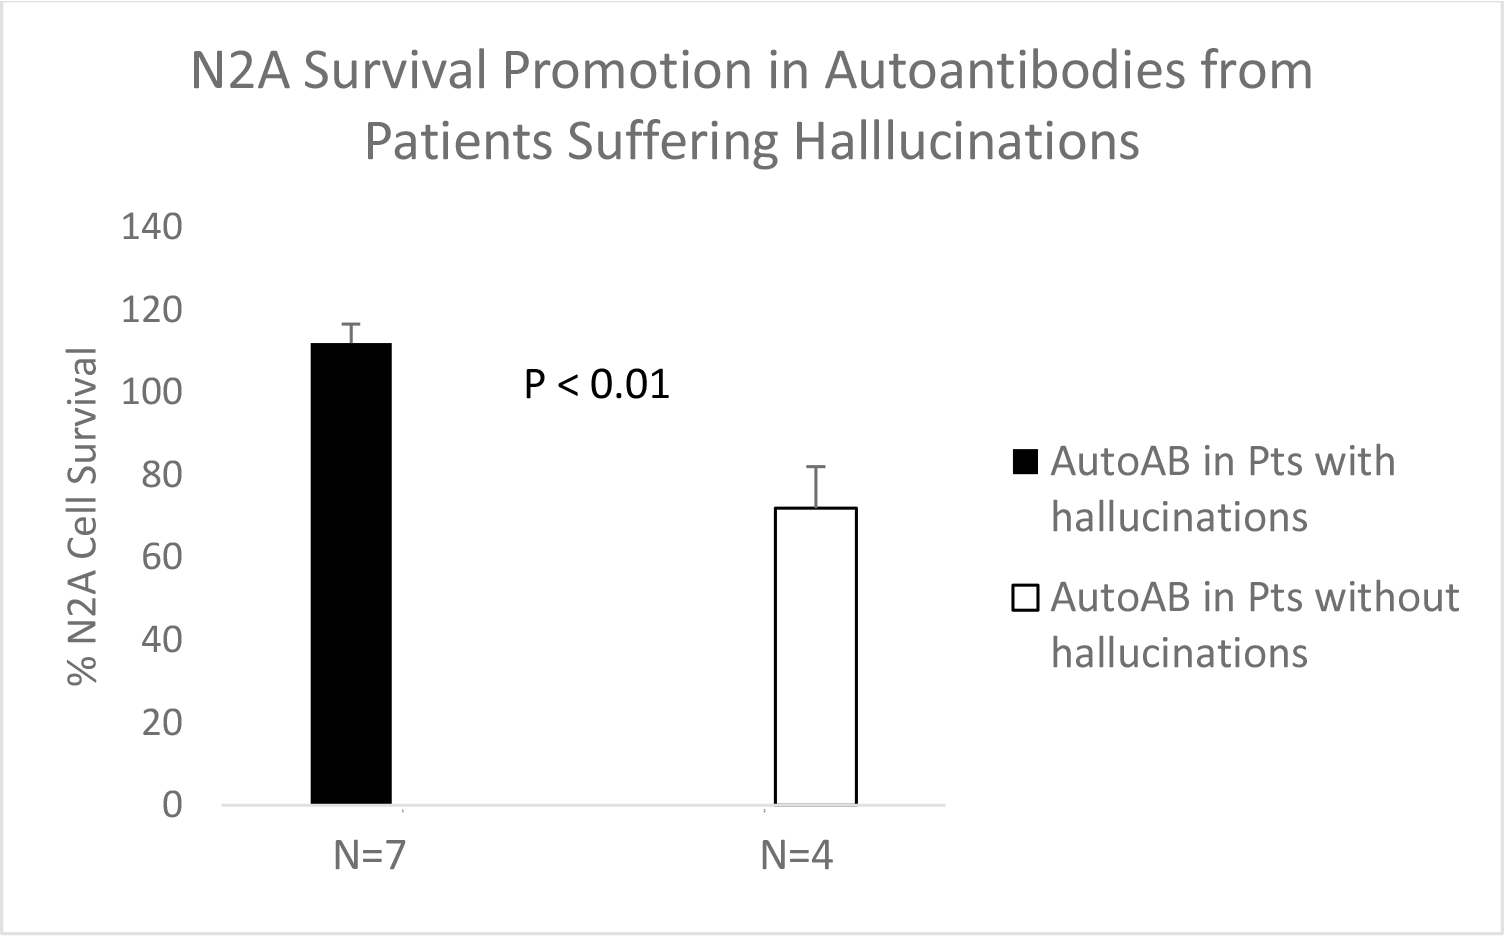
Mean N2A survival promotion in the autoantibodies from seven patients suffering with hallucinations significantly exceeded mean N2A survival in an identical concentration of the plasma autoantibodies from four patients not suffering with hallucinations (112 + 14 vs 72 + 15; P = 0.001) (Figure 7). The patient subgroups (experiencing or not experiencing hallucinations) did not differ significantly in their baseline clinical characteristics (Table 5).

EDMJ 2019-117 - Mark Zimering USA_F7

Figure 7. Mean N2A cell survival after 24 hours incubation in the presence of an identical 40 nM concentration of the plasma autoantibodies from schizophrenia (n=5), major depression (n=1), Parkinson’s disease (n=1) patients all suffering with hallucinations (n=7, solid bar) or from patients with major depression (n=3) or diabetes without hallucinations (n=4, open bar). Results are mean + SE.

Table 5. Baseline characteristics in patients suffering or not suffering hallucinations

Risk factor

Hallucinations (n=7)^

No Hallucinations (n=4)*

P-value

Age (years)

64.3 + 9.1

71.5 + 15.0

0.33

Glycosylated Hgb (%)

7.7 + 1.0

7.7 + 0.9

0.93

Diabetes duration (years)

13.3 + 6.1 (7)

8.7 + 2.6

0.30

^ Schizophrenia (n=5), Major depression (n=1), Parkinsons disease (n=1)

* Major depression (n=3), type 2 diabetes without neuropsychiatric disorder (n=1)

Discussion

Here we demonstrate (for the first time) the existence of 5-HT2AR- activating IgG autoantibodies in plasma from a subset of chronic schizophrenia patients. The autoantibodies caused potent, irreversible Gq/11-mediated neurite retraction in N2A cells by a mechanism involving activation of RhoA/ROCK and Gq11- coupled, PLC/IP3R signaling pathways. In patients suffering with severe, recurrent hallucinations and suicidal ideation, the autoantibodies also promoted N2A cell survival and/or proliferation (in part) via apparent recruitment of additional Gi-coupled, PI3-kinase-dependent survival signaling. LY379268 blocked 5HT2AR-dependent, Gi-coupled, N2A survival signaling in autoantibodies from patients suffering with hallucinations in agreement with the report of Gonzalez-Maeso et. al. [4] of similar effects of LY379268 on hallucinogen-specific induction of egr-2.

The 5-HT2A receptor mediates diverse signaling pathway activation in response to different ligands [12], a phenomenon which has been referred to as “functional selectivity” or “biased agonism.” Beta-arrestin-2- directed signaling not only plays a key role in receptor internalization and desensitization, but it acts as a scaffold to organize extracellular regulated-kinase MAPK signaling cascades [13] and components of the PI3-kinase/Src/Akt cell survival pathway [14]. The latter pathway is active in cancer cells [15] including neuroblastoma [16]. Lysergic acid diethylamine (LSD) causes long-lasting 5-HT2AR activation and biased, β-arrestin-2-directed signaling [2] providing a further link between a ‘mix’ of Gq/11-coupled and β-arrestin-2- directed signaling and psychomimetic effects associated with a subset of long-lasting 5-HT2AR agonists, i.e. schizophrenia autoantibodies.

Sensitization of autoantibody-induced neurite retraction by the mGlu2/3R agonist LY379268 is consistent with Gonzalez-Maeso et. al. [4] and suggests positive allosteric modulation of the 5HT2AR protomer affinity at functional 5HT2AR/mGlu2R complexes in N2A neuroblastoma cells as a plausible mechanism. Receptor heteromers have been reported in neuroblastoma cell, e.g. A2R/D2R [17], and both 5HT2AR [9] and mGlu2R [18] are normally expressed in mouse neuroblastoma cells. Yet in our preliminary experiments, the dopamine 2 receptor (D2R) agonist quinpirole (10 µM) did not sensitize N2A cells to schizophrenia plasma autoantibody- (n=4 different patients) or DOI-induced neurite retraction suggesting that targeting of 5-HT2AR by schizophrenia plasma autoantibodies is specific for homomers or 5-HT2AR/mGlu2R heteromers.

Targeting mGlu2R agonism as a mechanism to suppress presynaptic glutamate release (via mGlu2 autoreceptors) reduced certain psychomimetic drug effects in animals, but did not lead to overall reduction in both negative and positive symptoms in schizophrenia patients [19]. Sensitization of 5-HT2AR-mediated neurite withdrawal by an mGlu2/3 agonist demonstrated here (in vitro) suggests a possible mechanism in which mGlu2R agonism may promote a ‘negative symptom’ in schizophrenia. For example, major depression autoantibodies from patients suffering with anhedonia, a negative symptom in schizophrenia, not only caused robust Gq/11-mediated neurite retraction in N2A neuroblastoma cells [9], but also led to decreased sucrose preference, the behavioral equivalent of anhedonia, in mice following autoantibody intracerebroventicular infusion [20]. More study is needed to determine whether Gq/11-mediated neurite retraction might a useful biomarker in drug discovery aimed at reducing combined negative and positive symptoms in schizophrenia.

Excessive glutamatergic signaling in the cortex and striatum is a feature of 5-HT2AR activation which may underly (in part) delusions and hallucinations occurring in schizophrenia [21] and in a subset of Parkinson’s disease. Serotonin 2A receptor agonism promotes neuronal glutamate release [22] which in turn may enhance 5-HT2AR protomer affinity at 5HT2AR/mGlu2R heteromers in the prefrontal cortex. Since constitutive activation of Gq11-coupled GPCR signaling was reported to recruit additional Gi-coupled downstream signaling in independent GPCRs [23], we cannot rule out the possibility that some ‘cross-talk’ between 5HT2AR and mGlu2R agonism may occur (in part) via mechanisms occurring downstream of direct receptor-receptor interaction(s).

Autoantibodies in a subset of psychosis-prone individuals might possess structural characteristics which bias 5-HT2AR signaling in favor of dual Gq/11 and Gi-coupled, or β-arrestin-2-directed pathways. One possibility is circulating immune complexes which were reported to increase in patients with schizophrenia [24]. Systemic autoimmunity, characterized by a high prevalence of immune complexes, is a risk factor for schizophrenia identified in prior studies [6]. Circulating immune complexes in chronic lymphocytic leukemia (CLL) promoted increased B cell survival through activation of anti-apoptotic and pro-survival signaling pathways [25] and in a prior report, the autoantibodies in a Parkinson’s disease patient with CLL strongly promoted increased N2A proliferation [10]. Taken together, autoantibody-induced cancer cell proliferation and survival might suggest immune complexes which appear to promote biased signaling in favor of dual Gq/11-mediated and β-arrestin-2-directed pathway activation.

A limitation of our study is that it is cross-sectional. More study is needed to determine whether autoantibodies are present in acute-onset, or drug-naive schizophrenia or in other psychotic disorders. Long-standing type 2 diabetes mellitus was associated with 5-HT2AR-activating autoantibodies in patients having diffuse microvascular injury and chronic inflammation, e.g. diabetic kidney disease [9,10]. Yet type 2 diabetes per se is unlikely to have accounted for autoantibodies in the present subset of schizophrenia patients who were free of significant microvascular (i.e. renal or retinal) complications. Schizophrenia is thought to arise through complex gene-environment interactions leading to abnormal neurodevelopment. Brain-reactive antibodies occurring as a result of inflammation, infection or systemic autoimmunity is one potential environmental mechanism in schizophrenia causation [6].

In summary, chronic schizophrenia plasma IgG autoantibodies appeared to activate a Gq11/phospholipase C/inositol triphosphate receptor pathway and RhoA/Rho kinase signaling to cause acute N2A neurite retraction. Autoantibody-induced neurite retraction was positively modulated by the mGlu2/3R agonist LY379268 consistent with reported mGlu2R-driven, positive modulation of 5-HT2AR protomer affinity at 5HT2AR/mGlu2R heteromers [4] found in cortical brain regions underlying perception. Biased agonism at 5-HT2AR mediated by the hallucinogen LSD [2] or by certain autoantibodies from patients suffering delusions and halllucinations involves recruitment of Gi-coupled, PI3-kinase-dependent mechanisms (which for the autoantibodies) was associated with enhanced survival in N2A neuroblastoma cells.

Acknowledgement

We thank Dr. S. Varia and Dr. J. Alder (Dept of Neuroscience, Rutgers-RWJ Med School) for generously providing N2A mouse neuroblastoma cells. Supported in part by a grant from the Veterans Biomedical Research Institute (East Orange, NJ) to MBZ.

The authors report no multiplicity of interest affecting the objectivity of the study results. Presented (in part) at the 2019 Experimental Biology Meeting, Orlando, Florida Supported in part by a grant from the Veterans Biomedical Research Institute, East Orange, New Jersey to MBZ.

References

  1. Xu T, Pandey SC (2000) Cellular localization of serotonin(2A) (5HT(2A)) receptors in the rat brain. Brain Res Bull 51: 499–505. [crossref]
  2. Wacker D, Wang S, McCorvy JD (2017) Crystal Structure of an LSD-Bound Human Serotonin Receptor. Cell 168: 377–389
  3. Moreno JL, Holloway T, Albizu L, Sealfon SC, Gonzalez-Maeso J (2011) Metabotropic glutamate mGlu2 receptor is necessary for the pharmacological and behavioral effects induced by hallucinogenic 5-HT2A receptor agonists. Neurosci Lett 493: 76–79.
  4. González-Maeso J, Ang RL, Yuen T, Chan P, Weisstaub NV, et al. (2008) Sealfon SC Identification of a serotonin/glutamate receptor complex implicated in psychosis. Nature 452: 93–97.
  5. Huang A, Amos TB, Joshi K, Wang L, Nash A (2018) Understanding healthcare burden and treatment patterns among young adults with schizophrenia. J Med Econ 21: 1026–1035.
  6. Benros ME, Mortensen PB, Eaton WW (2012) Autoimmune diseases and infections as risk factors for schizophrenia. Ann N Y Acad Sci 1262: 56–66. [crossref]
  7. Schizophrenia Working Group of the Psychiatric Genomics Consortium (2014) Biological insights from 108 schizophrenia-associated genetic loci. Nature 511: 421–427.
  8. Zimering MB, Mirkovic N, Pandya M, Zimering JH, Behnke JA, et al. (2016) Toxic Immunoglobulin Light Chain Autoantibodies are Associated with a Cluster of Severe Complications in Older Adult Type 2 Diabetes. J Endocrinol Diab 3: 1–14.
  9. Zimering MB (2017) Diabetes Autoantibodies Mediate Neural- and Endothelial Cell- Inhibitory Effects Via 5-Hydroxytryptamine- 2 Receptor Coupled to Phospholipase C/Inositol Triphosphate/Ca2+ Pathway. J Endocrinol Diab 4: 1–10.
  10. Zimering MB (2018) Circulating Neurotoxic 5-HT2A Receptor Agonist Autoantibodies in Adult Type 2 Diabetes with Parkinson’s Disease. J Endocrinol Diabetes 5: 10.
  11. Weiner DM, Burstein ES, Nash N, Croston GE, Currier EA, et al. (2001) 5-hydroxytryptamine2A receptor inverse agonists as antipsychotics. J Pharmacol Exp Ther 299: 268–276. [crossref]
  12. Schmid CL, Raehal KM, Bohn LM (2008) Agonist-directed signaling of the serotonin 2A receptor depends on beta-arrestin-2 interactions in vivo. Proc Natl Acad Sci U S A 105: 1079–1084. [crossref]
  13. Luttrell LM, Roudabush FL, Choy EW (2001) Activation and targeting of extracellular signal-regulated kinases by beta-arrestin scaffolds. Proc Natl Acad Sci U S A 98: 2449–2454.
  14. Schmid CL, Bohn LM (2010) Serotonin, but not N-methyltryptamines, activates the serotonin 2A receptor via a ß-arrestin2/Src/Akt signaling complex in vivo. J Neurosci 30: 13513–13524.
  15. Hennessy BT, Smith DL, Ram PT, Lu Y, Mills GB (2005) Exploiting the PI3K/AKT pathway for cancer drug discovery. Nat Rev Drug Discov 4: 988–1004. [crossref]
  16. Johnsen JI, Segerström L, Orrego A, Elfman L, Henriksson M, et al. (2008) Inhibitors of mammalian target of rapamycin downregulate MYCN protein expression and inhibit neuroblastoma growth in vitro and in vivo. Oncogene 27: 2910–2922. [crossref]
  17. Johnsen JI, Segerström L, Orrego A, Elfman L, Henriksson M, et al. (2008) Inhibitors of mammalian target of rapamycin downregulate MYCN protein expression and inhibit neuroblastoma growth in vitro and in vivo. Oncogene 27: 2910–2922. [crossref]
  18. Fuxe K, Agnati LF, Jacobsen K (2003) Receptor heteromerization in adenosine A2A receptor signaling: relevance for striatal function and Parkinson’s disease. Neurology 61: 19–23.
  19. Wang J, Wang Z, Liu R (2018) Metabotropic glutamate receptor subtype 2 is a cellular receptor for rabies virus. PLoS Pathogens 14.
  20. Muguruza C, Meana JJ, Callado LF (2016) Group II Metabotropic Glutamate Receptors as Targets for Novel Antipsychotic Drugs. Front Pharmacol 7: 130.
  21. Zimering MB, Behnke JA, Thakker-Varia S, Alder J (2015) Autoantibodies in human diabetic depression inhibit adult neural progenitor cells in vitro and induce depressive-like behavior in rodents. J Endocrinol Diab 2: 11.
  22. Aghajanian GK, Marek GJ (2000) Serotonin model of schizophrenia: emerging role of glutamate mechanisms. Brain Res Brain Res Rev 31: 302–312.
  23. Ansah TA, Ferguson MC, Nayyar T (2011) The 5-HT2A receptor antagonist M100907 produces antiparkinsonian effects and decreases striatal glutamate Front Systems. Neurosci 2011.
  24. Baker RA, Casarosa P, Timmerman H (2004) Constitutively active Gq/11-coupled Receptors Enable Signaling by Co-expressed Gi/o-coupled Receptors. J Biol Chem 279: 5152–5161.
  25. Mailian KR, Boiadzhian AS, Sogoian AF, Sim RB, Manukian LA (2005) Concentration and protein composition of circulating immune complexes in the blood of patients with schizophrenia and subjects with positive familial history of disease. Zh. Nevrol. Psikhiatr. Im. S. S. Korsakova 105: 55–60
  26. Balakrishnan K, Peluso M, Fu M (2015) The phosphoinositide-3-kinase (PI3K)-delta and gamma inhibitor, IPI-145 (Duvelisib), overcomes signals from the PI3K/AKT/S6 pathway and promotes apoptosis in CLL. Leukemia 29: 1811–1822.

Production of Ulva Sp. in Multitrophic Aquaculture in Earth Ponds

DOI: 10.31038/AFS.2019111

Abstract

The cultivation of macroalgae in earth ponds could provide an optimal control on both quantity and quality of biomass. In previous studies the genus Ulva has proved to be an ideal candidate for growing in fish ponds since it withstands their considerable environmental fluctuations. This study assessed the biomass production and the SGR (specific growth rate) of green algae Ulva sp. cultivated in earth ponds facing the Ria Formosa lagoon (Southern Portugal). The growth and production performance were tested among: a) two different multitrophic systems (IMTA (fish +oyster + Ulva) and ‘Fish + Ulva’); b) four different initial densities (15 ,30, 50 e 60 g/m2); c) five production and harvest cycles (6, 7, 8, 9 e 15 days). The Specific Growth Rate (SGR) of Ulva sp. was found to be significantly different between the two multitrophic systems (p <0.05) and higher in the ‘Fish + Ulva’ system (19.3 ± 0.08% day-1) than in the IMTA system (16.7 ± 0.8% day-1). Also, there were significant differences between different densities and varied cultivating periods. Growth of Ulva sp. was dependent on both densities and time periods. The densities of 30g/m2 revealed to be the best among the four tested densities (23 ± 3.9 % day−1) whereas the optimal cultivating period was between seven and nine days (≈21 % day−1). The experiments on the production cycle indicated an optimal period of cultivation of about 8 days.

Keywords

Ulva sp.; Biomass production; Specific Growth Rate (SGR); Integrated Multitropihc Aquaculture (IMTA).

Introduction

Despite the growing demand for algae in the EU markets, its production is growing slowly with respect to the world’s largest producers [1]. Traditionally, both in Europe and in Portugal, the macroalgae industry was based mainly on the harvesting of macroalgae [1,2]. However, this technique is subject to annual fluctuations, poor product quality and raises concerns about the conservation of the marine ecosystem [1]. The cultivation of macroalgae in earth ponds and tanks could provide a better control on both quantity and quality of biomass [3–5]. The genus Ulva has proved in previous studies to be an ideal candidate to growing in fish ponds since it reaches high biomass production with high protein content [4, 6–8]. The rapid growth of Ulva is attributed to its high photosynthetic rates and high ability to uptake dissolved nitrogen [8]. Ulva withstands the considerable environmental fluctuations to which the tanks or ponds are subjected [4,9]. Additionally, the environment of the ponds is improved by this type of macroalgae which is able to balance fishpond pH level, oxygen demand and to increment chlorophyll a concentration [4,10]. There is always certain seasonality in growth capacity and biomass yield of Ulva [11]. Seasonality is especially important in the tank cultivation of Ulva in temperate zones as all factors, environmental and ecological, vary considerably [12]. Ulva has long been integrated into land based Integrated Multi-Trophic Aquacultures (IMTA) for biomass production and bioremediation [13]. Since Growing Ulva in effluent media increases its protein content (> 40%), it turned out to be a valuable feed for macroalgivores* species with high commercial value [8,13,14]. Currently the market for these algae is limited, but studies that discuss the suitability of Ulva as a biomass energy resource and its application as a raw material for nutraceuticals, biomaterials and sulphated polysaccharides (ulvan), can increase their attractiveness [13–15]. The present work focused on the feasibility of integrating a land-based production system of Ulva sp. on a semi-commercial aquaculture farm, with the objective of assessing the Specific Growth Rate (SGR) and Biomass production of Ulva sp. in multitrophic aquaculture.

Materials and Methods

Ulva sp. Production

The multitrophic aquaculture experiment was conducted at the Aquaculture Research Station in Olhão (EPPO- Estação Piloto de Piscicultura de Olhão), Portugal. Four rectangular 450 m2 x 1.5 m deep earthen ponds were used: 2 with fish, oyster and macroalgae (IMTA) and 2 without oysters (Fish + Ulva) (Figure 1). Autotrophs (phytoplankton, Ulva sp.), filter-feeding species (Crassostrea gigas) and fed organisms (Argyrosomus regius, Mugil cephalus, Diplodus sargus) are grown in the same earthen pond. Stock densities of the organisms cultivated are showed in table 1.

AFS 2019-102 - Glauco Favot USA_F1

Figure 1. Pattern of assay in EPPO earth ponds.

Table 1. Stock densities of the organisms present in the pond.

Species

Density

Argyrosomus regius

1500 (N°/pond)

Diplodus sargus

900 (N°/pond)

Mugil cephalus

550(N°/pond)

Crassostrea gigas

18000 (N°/pond)

Ulva sp.

30g/m² x 6 rafts

Growth, biomass production and best cultivation period were evaluated for the cultivated macroalgae belong to the genus Ulva (Linnaeus, 1753). The time scheduled for the several experiments is shown in Figure 2) The first experiment involved the evaluation of the best stock density for Ulva’s growth; 2) The best cultivation time to attain the highest growth (best cultivation Period) was determined next in a specific experiment where daily production of Ulva sp. was followed for 8 consecutive days (dry biomass was also measured); 3) After determining this density, the production of Ulva in the ponds was assessed by comparing the multitrophic system IMTA and Fish+Ulva.

AFS 2019-102 - Glauco Favot USA_F2

Figure 2. Time schedule of experiments ran during the study

Naturally occurring Ulva was collected in the main discharge channel and in the settling pond of EPPO (Figure 3a). After harvest, the macroalgae were washed with clean saltwater to remove most of the impurities and epibionts and drained by excess water. A portion of the harvest was weighted and individually planted in 6 rafts, each measuring 1 m2, made of horizontal nets stretched between styrofoam floaters. The individual pieces of macroalgae were attached to the net with brackets (Figure 3b and 3c).

AFS 2019-102 - Glauco Favot USA_F3

Figure 3. a) Collecting Ulva sp. from discharge channel; b) the six floating rafts; c) Ulva being fixed with brackets; d) macroalgae draining and weighing.

The stock density that permitted the highest growth of Ulva was determined in May-June 2016 in a three-weeks trial to evaluate the growth of the macroalgae (Figures 2 and 4). Specific Growth Rate (SGR) and Wet Biomass Production (WBP), was tested using four stock densities: 60, 50, 30 and 15 g/m2. Each week the growth obtained with different stock densities (60, 50 e 15 g/m2) were compared with the growth obtained with 30g/m2 that act as a control for comparison. This was done to prevent the effect of differences in environmental conditions among the three experiments. Ulva was distributed among the six rafts in the way shown in Figure 4. Since the 30g/m2 showed the best results it was decided to plant the floating structures with this density in all subsequent experiments.

AFS 2019-102 - Glauco Favot USA_F4

Figure 4. Scheme representing the density distribution in the six rafts.

To determine the cultivation time for highest growth the SGR was obtained for 5 different cultivation periods: 6, 7, 8, 9 and 15 days in June 2016. This allowed drawing a growth curve to define the cultivation time that resulted on better growth rates. To accurately determine the daily growth curve another experiment was carry out on an eight-day experiment where the macroalgae biomass was sampled daily. The experiment started on June 2016. Eight floating rafts (each of 1m2) were placed in a pond containing oysters and fishes (Figure 5). In the following eight days, a raft was chosen at random and the macroalgae removed, washed, drained and weighed. In this experiment the water temperature (°C), pH, turbidity (FNU) and dissolved oxygen (ppm and % saturation) were determined twice a day. Ulva sp. were collected, washed and weighed as in previous experiments. 30g of macroalgae was placed on each raft and 3 samples of 30g, were dried up in an oven at 60°C to obtain an average starting dry weight. Obtaining the dry weight allowed to calculate the percentage (17.7%) of dry biomass presents in the wet Ulva biomass collected as follow: (DW/WW) *100. The dry weight (DW) was determined by drying the algae at 60°C in a hoven. Dry biomass production (DBP) was calculated by the following equation:

DBP = [(DWf–DWi)/(A*t)]

where DWf = final dry weight, DWi = initial dry weight, t = days of culture and A = culture area [16].

AFS 2019-102 - Glauco Favot USA_F5

Figure 5. Eight-days experiment to determine the growth period. Each raft had 30 g/m2 of initial density. Every number represents after how many days the algae were harvested from that raft.

From June to November 2016 the production of IMTA and Fish+Ulva systems was compared. A total of 14 weekly harvests were carried out. During the experiment water temperature (°C), pH, turbidity (FNU, Formazin Nephelometric Units) and dissolved oxygen (ppm and % saturation) were measured with multiparameter probes (Hanna Instruments H9829) twice a day. The irradiance was measured using an Apogee Mark Model SP-214 pyranometer. Furthermore, monthly, samples were taken to determine the concentration of Chlorophyll a and nutrients (NH4, NO3, NO2, HPO4). The nutrients were analysed by colorimetry method (Grasshoff et al., 1983) whereas Chlorophyll a was determined by spectrophotometry according to Parsons et al. (1984).

Macroalgae harvesting was done by hand. The floating structures were gently agitated to remove deposited sediments on the surface of the macroalgae before harvest. Prior to weighing Ulva was washed with filtered salt water to remove debris and epibionts, squeeze drained and the biomass in each 1 m2 determined individually in a scale with a 1 mg accuracy (Figure 3d).

The daily wet biomass production (WBP) at each 1 m2 raft composing the floating structure was calculated and expressed in g m−2 day−1.

Specific growth rate (SGR, %) of Ulva in the rafts was calculated as:

SGR = ln (WWt–WWi)/t

where WWi is the initial wet weight and WWt is the wet weight after t = time (cultivation days).

Statistic

The normality (Shapiro-Wilk’s test) and homogeneity of variances (Bartlett’s test) within the biotic and abiotic factors were tested before applying parametric test. When these assumptions were not respected, the non – parametric test (Kruskal – Wallis) was used. Statistical test of one-way ANOVA within abiotic factors was performed to identify the possible differences between the two production systems [17]. One-way ANOVA was also used to test the Specific Growth Rate (SGR) obtained from the two different systems.

The SGR (specific growth rate) of the two systems was used for the following statistical test:

  • To determine the correlation (with Spearman variant in case of no normality-homogeneity) between physic-chemical parameters in the pond water and SGR.
  • To assess the different densities and periods of cultivation. In this case when statistical difference was found a pairwise test was done to know which groups cause the difference (‘inhomogeneity’) [17].

Values for dissolved oxygen, pH, temperature and turbidity used in the correlation analysis (see Figure 7 in Results) correspond to the daily mean of a seven days period prior to the sampling for the other parameters.

Results

Ulva sp. Production

Abiotic factors (Table 2)

Table 2. Mean ± standard deviation values of abiotic and biotic factors for the two systems (IMTA and Fish + Ulva), and level of significance (p-value) of the comparison between the two using one-way ANOVA.

System

IMTA

Fish + Ulva

p-value

Factor

Temp.(°C)

25.11±2.92

25.08±2.85

p>0.05

pH

8.47±0.19

8.43±0.17

p<0.01

D.O. (ppm)

5.92±1.03

5.67±0.98

p<0.01

Turb. (FNU)

17.91±7.20

20.59±8.44

p<0.001

Irr.a (kW m-2)

400.47±288.5

400.47±288.5

Sal. (psu)

36.08±0.85

36.04±1.76

p>0.05

NH4+(µM)

32.20±22.67

36.89±8.63

p>0.05

NO3 (µM)

7.84±5.18

6.02±1.73

p>0.05

HPO4–2 (µM)

1.02±0.02

0.93±0.33

p>0.05

NO2(µM)

1.42±1.12

1.37±0.61

p>0.05

Chla (µg/l)

1.07±0.63

0.86±0.66

p>0.05

a.Irradiance equal for both systems because the data came from meteorological station placed on the roof of EPPO building.

The temperature of the water averaged 25.11±2.92 ºC and 25.08±2.85 ºC at IMTA ponds (Fish + Oysters + Ulva) and at ponds without oysters (Fish + Ulva) respectively. During the experience, the temperature range between 30.2°C (maximum value found on IMTA ponds on July) and 15.5°C (minimum value found on Fish + Ulva ponds on November). Salinity was almost constant (≈ 36 PSU) except on the last day of October when it was raining (minimum value of 32.26 PSU). No significant difference was found between the ponds and systems respecting the temperature and salinity (p>0.05).

pH and dissolved oxygen (D.O.) in the water increased on the ponds from morning to afternoon, and this difference was more pronounced during summer (Figures 6a and 6b). Dissolved oxygen and pH presented higher mean values in the IMTA ponds (pH = 8.47±0.19; D.O.= 5.92±1.03) when compared to Fish + Ulva ponds (8.43±0.17; D.O.= 5.67±0.98) and in October when there was a peak at IMTA ponds for both parameters. Either D.O. and pH presented significant difference between the systems (p<0.01). Also for the turbidity (FNU) was statistically different among systems but in this case the higher mean corresponded to Fish + Ulva system (20.59±8.44). Mean values of nutrients and chlorophyll a are presented in Table 2. No significant differences were found between the systems for these factors. Both temperature and pH showed a positive correlation with specific growth rates (SGR), whereas a negative correlation was found between SGR and NH4+( p-values< 0.05) (Figure 7). Values for dissolved oxygen, pH, temperature and turbidity used in the correlation analysis correspond to the daily mean of a seven days period prior to the sampling for the other parameters.

AFS 2019-102 - Glauco Favot USA_F6

Figure 6. Means of daily variation of pH(a) and D.O(b) in the ponds (morning, blue lines; afternoon, red lines) during the 5 months of the experiment (systems are represented together). Vertical bars represent standard deviation.

AFS 2019-102 - Glauco Favot USA_F7

Figure 7. Correlation between biotic and abiotic parameters in the ponds. Correlations with p-value > 0.05 were considered as non-significant and leaved blank. Circles represent significant correlations: red – negative correlation, blue – positive correlation. Colour intensity and size of the circles are proportional to the significance of the correlation coefficient. (NH4+, HPO4–2, NO3, NO2 in µM: Chlorophyll a in µg/l; D.O.: dissolved oxygen in µM; Temp: temperature in °C; SGR: specific growth rate in %, Turb: turbidity in FNU).

Ulva sp. growth and biomass yield

Specific growth rate (SGR) of Ulva sp. had a mean of 19.3±0.08% at Fish + Ulva ponds and 16.7±0.8% at IMTA ponds. Kruskal-Wallis test gave a narrow significant difference between the systems (KW=3.85, p=0.049). The maximum SGR of Fish + Ulva systems was achieved on 13 September (36.51%), whereas IMTA registered the higher value on 19 July (31.33%) (Table 3).

Table 3. Specific growth rate (SGR) and daily wet biomass production (WBP) during the experiment. Kruskal-Wallis (KW) value and significance (p).

System

Min value

Mean ± SD

Max value

KW

p-value

SGR (% d-1)

IMTA

5.6

16.7±0.8

3.33

3.85

p<0.05

Fish+Ulva

3.0

19.3±0.08

36.51

WBP
(g/m2d)

Min value

Mean ± SD

Max value

KW

p-value

IMTA

0.25

12.3±9.89

44.85

5.84

p<0.05

Fish+Ulva

0.74

17.2±13.60

65.87

The mean wet biomass production (WBP) created by the two systems were statistically different (KW=5.84, p<0.05) with a maximum value found on Fish + Ulva ponds of 65.87 g m-2d-1 on 13 of September (Table 3).

Figures 8 and 9 show two clear cycles of increase and decrease for both SGR and WBP that corresponds to 6 weeks each. The first increase started in June 24 peaking in 19 July followed by a decrease until August 11 when it reached the minimum value; after this date they started increasing again until September 02. The second decrease reached the minimum value in October 20. The SGR followed the temperature fluctuation only in the last period of the experiment, whereas the ammonium variation is clearly in opposition to the biomass production (Figure 9).

AFS 2019-102 - Glauco Favot USA_F8

Figure 8. Variation of specific growth rate (SGR) (at right) of Ulva sp. along the experiment. X axis refers to day of harvesting. The green line represents the average water temperature during the 7 days of the cultivation periods (at left). Blue bars: Fish + Ulva system; Yellow bars: IMTA system; lines: standard deviation.

AFS 2019-102 - Glauco Favot USA_F9

Figure 9. Variation of Wet biomass production (WBP) (at right) of Ulva sp. along the experiment. The black dots correspond to the ammonium concentration (at left) in the tanks during the sampling day. Blue bars: Fish + Ulva system; red bars: IMTA system; lines: standard deviation

Best Cultivating Periods and Stock Densities for Improved Growth

The Figure 10 shows a polynomial trend line of 2nd order (an ascending curve) to illustrate the relationship between the five different cultivation periods and their SGR. The coefficient of determination R2= 0.9474 represents the fitting of the data to the line. The SGR between the 5 cultivating periods were found to be statistically different (KW = 25.045, p<0.001) and the pairwise test stressed that the 6 and 9 days were those that differed significantly from the other three (p=0.0018) (Table 4). The SGR of Ulva sp. of the 7–8-9 days periods were almost double of the remaining two (Figure 10). Abiotic parameters during the experiment to determine the best cultivating period are shown in Table 5.

AFS 2019-102 - Glauco Favot USA_F10

Figure 10. Growth curve using SGR recorded from 5 different cultivation periods.

Table 4. Numeric matrix containing the p-values of the t- tests calculated for each pair of cultivation period groups. In the output view, the red numbers stressed the periods are significantly different from each other (p<0.05).

Cultivation period

6 days

7 days

8 days

9 days

15 days

6 days

7 days

0.018

8 days

0.2109

1.0000

9 days

0.0018

1.0000

1.0000

15 days

1.0000

0.1127

0.7544

0.0058

Table 5. Mean values (8 days) of abiotic parameters during the experiment to determine the daily growth.

System

Temp.(°C)

pH

D.O.
(ppm)

Turb.
(FNU)

Sal.
(psu)

Morning

25.2±0.81

8.2±0.05

4.6±0.77

15.9±1.71

36.5±0.07

Afternoon

26.9±1.93

8.5±0.06

8.4±2.03

19.2±1.88

36.6±0.07

Different stock densities did show differences for SGR and for WBP (KW= 24.343, p<0.05) (Table 6). The values for 60 grams were omitted due to a measurement error during weighing. For the densities, the pairwise test showed a significant difference in biomass production between 30g/m2 and the lower value (15 g/m2) (p = 0.0004) but not with 50 g/m2 (Table 7).

Table 6. Specific growth rate (SGR) and wet biomass production (WBP) obtained with 3 different initial densities

15

30

50

SGR(%/d)

21.1 ± 4.8

23.0 ± 3.9

15.7 ± 7.6

WBP(g/m2d) *

6.9 ± 2.9

22.2 ± 12.6

17.40 ± 13.4

*Significant difference p<0.05

Table 7. Numeric matrix containing the p-values of the t- tests calculated for each pair of stock densities groups. In the output view, the red numbers stressed the biomass are significantly different from each other (p<0.01).

Densities

15g/m2

30g/m2

50g/m2

15g/m2

30g/m2

0.0004

50g/m2

0.004

0.312

Daily Growth of Ulva sp.

Daily growth rates (SGR), obtained during the 8 days experiment, are presented in Figure 11. The SGR increased linearly until the third day of cultivation (R2=0.9969) then entered a stationary phase (R2=0.0883) with values identical or slightly lower than those reached on the third day (≈ 39 %). The daily increase of dry weight (DW) followed an exponential curve (R2=0.9756) (Figure 12) until the seventh day then slow down sharply. The dry and wet biomass productions on the 8th day was 10.9 g m-2d-1 and 60.6 g m-2d-1 respectively.

AFS 2019-102 - Glauco Favot USA_F11

Figure 11. Growth curve of Ulva sp. SGR grown in eight-days experiment. Blue line represents first 3 days trend. Orange line represents the last 5 days.

AFS 2019-102 - Glauco Favot USA_F12

Figure 12. Growth curve of Ulva sp. dry biomass (DW) grown in eight-days experiment.

Discussion

EPPO pond water and their abiotic factors supported well the Ulva sp. growth. The values of specific growth rate (SGR) of both systems gave results similar to other studies (Table 8). However, the wet biomass production (WBP) and the Dry Biomass Production (DBP) recorded in this experiment were often lower than the others likely due to the use of different tank sizes, techniques or different initial density of Ulva [16,19] .

Table 8. Comparison of averages of specific growth rate(SGR), dry biomass production (DBP), Wet biomass production(WBP) cultured in different systems with different stock density (Table adapted from Ben-Ari et al., 2014 [8] and Castelar et al., 2014 [16]).

Species

System

Stocking density (kg WW m-2)

DBP
(g m-2 d-1)

SGR
(%/day)

WBP
(g m-2 d-1)

References

Ulva sp.

Earth pond

0.06–0.015

2.6

17

14.75

This study

Ulva lactuca

Tank

1–8

34.5–6

10–1

230–40

Bruhn et al., 2011 [14]

Ulva sp.

Ropes,sea

0,0005*

0.24

11.95

_

Castelar et al., 2014 [16]

Ulva sp.

Tank

 0,0005*

0.47

22.80

_

Castelar et al., 2014 [16]

Ulva clathrata

Tank

0.2–0.5

10.5

7

70

Copertino et al., 2009 [22]

Ulva lactuca

Tank

1

16.8 -56.4

_

112–376

Msuya and Neori, 2008 [18]

Ulva lactuca

Tank (continuous aeration)

0.8

47.7

13.3

318

Ben-Ari et al., 2014 [8]

Ulva lactuca

Tank (25% aeration)

0.8

26.7

8.1

178

Ben-Ari et al., 2014 [8]

The optimal cultivation period into EPPO ponds seemed to be positioned between seven to nine days since, after this time, the SGR decreased. Moreover, looking at the growth curve of Dry Weight (DW) obtained after eight days cultivations, Ulva sp. seemed to have reached the maximum of biomass around this period. This result and SGR values greater than 10% up to 15 days of cultivation suggest a production cycle of approximately 8 days.

The SGR and WBP during the experience drew a sinusoidal pattern with two spikes and two falls of values. The drop in autumn can be explained by a decrease in temperatures and a reduction of light period [20,21], in addition to a week of rain that occurred before the last collection. More complicated is explaining the drop in August. During this period was noted the presence of white spots in the Ulva thalli a phenomenon known as “ghost tissue” often indicative of an increase in sporulation. Sporulation can be caused by several factors such as elevated temperatures, irradiance, lack of nutrients and life cycle’ stage [22,23]. However, temperature and irradiance were constant from June to the end of August and the first one was within the optimum range for the species [16,24]. Even pH values (7.6<pH<8.8) were optimal for species growth, since they could be related to a high presence of dissolved bicarbonate (HCO3) in water, the main source of inorganic carbon for the seaweed [25–27]. Therefore, life cycle could explain the August decreased. A study concerning Ulva rigida conducted in the Venice lagoon reported pulses of production during the year similar to that of this study [28]. The algae could have been harvested at a specific stage of the life cycle and the procedure to weigh it and put it in the structure could have accelerated these sporulation processes [23,29]. Although the nutrients concentration of EPPO ponds was like if not greater than previous studies [11,16,20,30,31] cannot be ruled out the possibility of a shortage of nutrients, particularly of NH4+. The increasing concentration of NH4+ during the phases of decline in algal biomass (Figure 3.3b) could represent a phase of renewal of nutrients up to a re-optimal level for algae. Another hypothesis would suggest that this oscillation depicted the Ulva sp. capacity to remove this nutrient. When macroalgae biomass declined the assimilative capacity of the environment for nutrients declined in turn. However, specific studies will be required for a proper evaluation of both conclusions.

Initial different densities showed better results for 30g/m2 which led to the decision discussed in the methodology (see Material and methods). Using low initial density has been suggested as a possible optimization of growing space [16]. Nevertheless, in macroalgae culture it’s usually used an optimum initial density of 1 kg/m2 but growing macroalgae in tanks equipped with artificial aeration to ensure there is no shading among the algae [8,14].

Ulva growing in the ‘Fish + Ulva’ system revelled a better performance than in the IMTA. ‘Fish + Ulva’ system presented mean values superior for both SGR and WBP. Since environmental parameters such as temperature, salinity and irradiance were identical for both systems the cause could be attributed to interactions between the different organisms presents into the ponds. It is known that oysters remove suspended particle by filtration [32] which explains the turbidity difference between the two systems. However, they contribute to the N pool with their excretions [33] so there might be higher growth of phytoplankton with limitations in the growth of Ulva in IMTA system. Nevertheless, the presence of oysters may have also caused a variation in the bacterial community [33,34]. Since the rule of bacteria is important for the growth and the morphogenesis of some species of green algae [15,35,36] the variation in quantity and quality of their community could have affected the growth of algae.

Wet biomass values were converted to dry biomass considering that dry/wet Ulva sp. biomass is around 15 % (17.7 %in this study); *dry biomass.

The differences in oxygen concentrations and pH between early morning and afternoon stressed the ability of the primary producers, Ulva sp. included, to oxygenate the water in both systems.

Conclusion

Ulva sp. showed to grow well under conditions typical of earth-pond aquaculture. The experiments on the production cycle indicated a period of cultivation of macroalgae of about 8 days. Despite the differences found within the systems, the growing periods and the initial densities of Ulva sp., the growth values have always been satisfactory. The technique used for cultivation has proved feasible. However, it will be necessary to assess the growth of the species along the year to evaluate better it response at environmental changes. Even higher stock densities should be tested to evaluate a possible cultivation for commercial purposes.

References

  1. EUMOFA (2016) Monthly Highlights – October, (April) 23 (www.eufoma.eu).
  2. Pereira L, Correia F (2015) Macroalgas marinhas da costa portuguesa – biodiversidade, ecologia e utilizações. Edição Nota de Rodapé
  3. Cohen I, Neori A (1991) Ulva lactuca Biofilters for Marine Fishpond Effluents 1. Ammonia Uptake Kinetics and Nitrogen-Content. Botanica Marina 34: 475–482.
  4. Robertson-Andersson (2003) the cultivation of Ulva lactuca (Chlorophyta) in an integrated aquaculture system, for the production of abalone feed and the bioremediation of aquaculture effluent. MSc Dissertation, University of Cape Town, South Africa.
  5. Abreu MH, Pereira R, Yarish C, Buschmann AH, Sousa-Pinto I (2011) IMTA with Gracilaria vermiculophylla: Productivity and nutrient removal performance of the seaweed in a land-based pilot scale system. Aquaculture 312: 77–87.
  6. Floreto EAT, Hirata H, Yamasaki S, Castro SC (1994) Effects of Temperature, Light Intensity, Salinity and Source of Nitrogen on the Growth, Total Lipid and Fatty Acid Composition of Ulva pertusa Kjellman (Chlorophyta). Botanica Marina 36: 149–158.
  7. De Casabianca ML, Posada F (1998) Effect of Environmental Parameters on the Growth of Ulva rigida (Thau Lagoon, France). Botanica Marina 41:157–166.
  8. Ben-Ari T, Neori A, Ben-Ezra D, Shauli L, Odintsov V, Shpigel M (2014) Management of Ulva lactuca as a biofilter of mariculture effluents in IMTA system. Aquaculture 434: 493–498.
  9. Carballo RQ (2012) Acuicultura multitrófica integrada, una alternativa sostenible y de futuro para los cultivos marinos de Galicia.
  10. Hurd CL (2015). Seaweed Ecology and Physiology. 2nd Edition. Cambridge University Press.
  11. Macchiavello J, Bulboa C (2014) Nutrient uptake efficiency of Gracilaria chilensis and Ulva lactuca in an IMTA system with the red abalone. Haliotis rufescens Latin American Journal of Aquatic Research 42: 523–533.
  12. Israel AA, Friedlander M, Neori A (1995) Biomass Yield, Photosynthesis and Morphological Expression of Ulva lactuca. Botanica Marina 38: 297–302.
  13. Carl C, De Nys R, Paul NA (2014) The seeding and cultivation of a tropical species of filamentous Ulva for algal biomass production. PLoS ONE 9.
  14. Bruhn A, Dahl J, Nielsen HB, Nikolaisen L, Rasmussen MB, Markager S, Jensen PD (2011) Bioenergy potential of Ulva lactuca: Biomass yield, methane production and combustion. Bioresource Technology 102: 2595–2604.
  15. Grueneberg J, Engelen AH, Costa R, Wichard T (2016) Macroalgal morphogenesis induced by waterborne compounds and bacteria in coastal seawater. PLoS ONE 11.
  16. Castelar B, Reis RP, dos Santos Calheiros AC (2014) Ulva lactuca and U. flexuosa (Chlorophyta, Ulvophyceae) cultivation in Brazilian tropical waters: Recruitment, growth, and ulvan yield. Journal of Applied Phycology 26: 1989–1999.
  17. Altobelli A (2008). Laboratorio di Informatica applicata all’Ecologia per il Corso di laurea in Scienze Biologiche. Appunti introduttivi di R Laboratorio di informatica applicato all’ecologia – Dip.Biologia – Univ. TS.
  18. Msuya FE, Neori A (2008) Effect of water aeration and nutrient load level on biomass yield, N uptake and protein content of the seaweed Ulva lactuca cultured in seawater tanks. Journal of Applied Phycology 20: 1021–1031.
  19. Robertson-Andersson DV, Potgieter M, Hansen J, Bolton JJ, Troell M, et al (2008). Integrated seaweed cultivation on an abalone farm in South Africa. Journal of Applied Phycology 20: 579–595.
  20. Ogawa T, Ohki K, Kamiya M (2013) Differences of spatial distribution and seasonal succession among Ulva species (Ulvophyceae) across salinity gradients. Phycologia 52: 637–651.
  21. Amosu AO (2016) Using Ulva (Chlorophyta) for the production of biomethane and mitigation against coastal acidification.  Thesis for the degree PhD in the Department of Biodiversity and Conservation Biology, University of the Western Cape.
  22. Copertino MDS, Tormena T, Seeliger U (2009) Biofiltering efficiency, uptake and assimilation rates of Ulva clathrata (Roth) J. Agardh (Clorophyceae) cultivated in shrimp aquaculture waste water. Journal of Applied Phycology 21: 31–45.
  23. Chemodanov A, Jinjikhashvily G, Habiby O, Liberzon A, Israel A, Yakhini Z, Golberg A (2017) Net primary productivity, biofuel production and CO 2 emissions reduction potential of Ulva sp. (Chlorophyta) biomass in a coastal area of the Eastern Mediterranean. Energy Conversion and Management 148: 1497–1507.
  24. Cui J, Zhang J, Huo Y, Zhou L, Wu Q, Chen L, He P (2015) Adaptability of free-floating green tide algae in the Yellow Sea to variable temperature and light intensity. Marine Pollution Bulletin 101: 660–666.
  25. Falkowski PG, Raven JA (2007) Aquatic Photosynthesis, 2nd Edition. Princeton University Press, Princeton, NJ, USA.
  26. Raven JA (2010) Inorganic carbon acquisition by eukaryotic algae: four current questions. Photosynthesis Research 106: 123–134.
  27. Msuya FE, Kyewalyanga MS, Salum D (2006) The performance of the seaweed Ulva reticulata as a biofilter in a low-tech, low-cost, gravity generated water flow regime in Zanzibar, Tanzania. Aquaculture 254: 284–292.
  28. Sfriso AA, Sfriso A (2017) In situ biomass production of Gracilariaceae and Ulva rigida: the Venice Lagoon as a study case 60: 271–283.
  29. Pettett P (2009) Preliminary investigation into the induction of reproduction in Ulva spp. in Southeast Queensland for mass cultivation purposes University of the Sunshine Coast Submitted in partial fulfilment of the requirements for the degree of Masters in Environmenta. Tesis Maestria, University of the Sunshine Coast 2–71.
  30. Neori A, Cohen I, Gordin H (1991) Ulva lactuca biofilter for marine fishpond effluents: II. Growth rate, yield and C: N ratio. Botanica Marina 34: 389–398.
  31. Nielsen MM, Bruhn A, Rasmussen MB, Olesen B, Larsen MM, Møller HB (2012) Cultivation of Ulva lactuca with manure for simultaneous bioremediation and biomass production. Journal of Applied Phycology 24: 449–458.
  32. Buck BH, Nevejan N, Wille M, Chambers MD, Chopin T (2017) Offshore and Multi-Use Aquaculture with Extractive Species: Seaweeds and Bivalves. BT – Aquaculture Perspective of Multi-Use Sites in the Open Ocean: The Untapped Potential for Marine Resources in the Anthropocene. In B. H. Buck & R. Langan (Eds.) (pp. 23–69). Cham: Springer International Publishing.
  33. Jones, A. B., Dennison, W. C., & Preston, N. P. (2001). Integrated treatment of shrimp effluent by sedimentation, oyster filtration and macroalgal absorption: A laboratory scale study. Aquaculture 193: 155–178.
  34. Quental-ferreira H, Leão AC, Pousão-ferreira P (2012) Integrated Multitrophic Aquaculture in Earthen Ponds Conference Paper.
  35. Spoerner M, Wichard T, Bachhuber T, Stratmann J, Oertel W (2012) Growth and Thallus Morphogenesis of Ulva mutabilis (Chlorophyta) Depends on A Combination of Two Bacterial Species Excreting Regulatory Factors. Journal of Phycology 48: 1433–1447.
  36. Wichard T, Charrier B, Mineur F, Bothwell JH, De Clerck O, Coates JC (2015) The green seaweed Ulva: a model system to study morphogenesis. Front Plant Science 6.

Symptomatic Effects of Chest Physiotherapy with Increased Exhalation Technique in Outpatient Care for Infant Bronchiolitis: A Multicentre, Randomised, Controlled Study. Bronkilib 2

DOI: 10.31038/JCRM.2019242

Abstract

Objectives: The effectiveness of chest physiotherapy (CP) with increased exhalation technique (IET) to treat infants hospitalised for bronchiolitis has not to date been demonstrated. In outpatient settings, data are lacking to confirm CP’s effectiveness. The purpose of our study was to assess the impact of CP in outpatient care for infants with bronchiolitis.

Methods: We conducted a multicentre, randomized, controlled, single-blind study involving infants under 12 months treated on an outpatient basis. The primary endpoint, a decrease in the severity classification level of the infants’ respiratory difficulties, was compared between two patient groups, one with and one without CP.

A total of 82 infants were randomized; 41 were assigned to the CP group and 41 to the control group. Different blinded assessors determined the Wang Clinical Severity Score at inclusion (T0) and 30 minutes after inclusion (T1) for each group.

Results: In the group that received CP, 29 infants (70.7%) showed improvement and their severity level was modified, as compared to 4 (9.76%) in the control group (p<0.001). The mean decrease in the Wang Clinical Severity Score was: -2 (±1.32) in the group receiving physiotherapy compared to -0.22 (±0.99) in the control group (p<0.001).

Conclusions: Our study results suggest a symptomatic effect of CP with IET for short-term clinical improvement among infants with bronchiolitis in outpatient settings.

Keywords

bronchiolitis, infants, chest physiotherapy

1. Introduction

Infant bronchiolitis is a common disease that causes a large number of patients to seek outpatient medical and physiotherapy care in France. Numerous studies and international recommendations [1,2,3] have indicated that no drug is effective in care for bronchiolitis. In September 2000, a consensus conference sponsored by the French National Agency for Health Accreditation and Evaluation (ANAES) reached the same conclusion [4].

With respect to chest physiotherapy (CP), postural drainage therapy, vibration and conventional chest physiotherapy (CPT) are not considered to be effective [5, 6]. Although the ANAES has recommended the utilization of chest physiotherapy with prolonged slow expiration techniques combined with assisted coughing [4], there is little proof of its effectiveness (grade C). For this reason, the ANAES has advocated that studies be conducted in “outpatient” settings to assess CP’s degree of effectiveness.

Much more recently, a Cochrane Review publication recommended exploring the effects of CP techniques among mild to moderate non-hospitalised patients [6]. In fact, most of the studies conducted to date have focused exclusively on infants who were hospitalised for severe bronchiolitis. For this type of patient group, the effectiveness of such treatment, aiming to reduce time to recovery, has not been demonstrated [7, 8]. However, three recently conducted studies have produced new data [9, 10, 11]. Despite the inherent limitations of the methodologies used and/or the number of subjects, these studies once again raise the question of the effectiveness of CP combined with IET in outpatient settings. For this reason, we undertook to assess the symptomatic effect of CP as a component of outpatient care for infant bronchiolitis, in line with recommendations in France.

2. Materials and methods

2.1 Study design and organisation

We conducted a multicentre, randomized, controlled, single blind study comparing a group of infants receiving physiotherapy and a control group without physiotherapy. For our study, children were enrolled at four centres: two located in the Ile de France region, one located in Normandy, and one located in the Auvergne Rhône Alpes region of France. The study was conducted during an acute bronchiolitis epidemic season between 17 December 2016 and 01 February 2017.

Upon the recommendation of the ethical committee of Robert Debré University Paediatric Hospital Centre, we submitted our study to a French institutional review board, the Comité de Protection des Personnes CPP IV IDF (ID-RCB n°2016-A01553-48), which approved the study at its meeting of 22 November 2016. In addition, our clinical trial was registered with the French National Agency for Medicines and Health Products Safety (ANSM) and assigned No. ID-RCB 2016-A01553-48. Lastly, we submitted a declaration of compliance with a reference methodology to the French Data Protection Authority (CNIL), and we provided an information sheet to parents of infants taking part in the study. We obtained the oral consent and non-opposition of all the parents of children who participated in the study.

2.2 Participants

To be included in the study, infants had to be between one and 12 months old [12] and experiencing a first or second episode of bronchiolitis for which their GP had prescribed outpatient CP (the first or second session of CP for this episode). Only infants who had been assigned a Wang Clinical Severity Score ≥4 and <9 were randomised after inclusion. Exclusion criteria included infants who had been born prematurely, i.e., before 34 weeks’ gestation. Those with a history of bronchopulmonary dysplasia and serious pulmonary or cardiac disease were also excluded. In addition, infants presenting a contraindication to CP with IET (prolonged corticosteroid therapy, rickets, osteogenesis imperfecta or rib fracture) were not enrolled in the study.

2.3 Randomisation, arms

We used an on-line system (PHP/MySQL) for randomisation into blocks, centralised and stratified by centre, which we accessed using a login name and password. When authorized investigators connected to the system to enrol a patient, they checked to ensure that inclusion criteria had been met and no exclusion criteria were present.

A stratification by centre approach ensured minimal imbalance among groups within the same study centre. Finally, so as to avoid any selection bias in relation to a specific centre, we imposed an upper limit of 40 patients per centre. We used a 1: 1 allocation with set blocks of 4. Study participants were randomised to receive CP immediately (Group A) or to receive CP later (Group B, the control group). For Group A, the Wang Clinical Severity Score was measured 30 minutes after the CP session, while for Group B the Wang Score measured at 30 minutes was assessed before the CP session.

2.4 Conduct of the study

After informing the parents and obtaining their consent, the physiotherapist/investigator enrolled the infants meeting the inclusion criteria in the study (Figure 1).Wang Clinical Severity Scores were measured at inclusion (T0) and 30 minutes after inclusion (T1) by two different blinded assessors. Concerning infants participating in the study arm with CP, a procedure was set up to ensure that the assessor would not know which randomisation arm infants were assigned to. Moreover, parents were told that verbal contact with the assessors would not possible. Only the physiotherapist/investigator who enrolled the child in the study and the physiotherapist who performed the CP with IET on infants in the CP randomisation arm (obtained by entering the initials and the randomisation site) knew which arm children had been assigned to. We developed this two-step, independent Wang Clinical Severity Score evaluation procedure to avoid any observer bias while relying on the satisfactory inter-observer reproducibility of the score assessment [13, 14, 15] and its utilisation for studies involving hospitalised infants [16,17]. We followed our usual standard of care and all the infants who participated in the study received CP with IET.

JCRM 2019-117 - D Evenou_F1

Figure 1. Flow chart

2.5 Intervention

All the physiotherapists/investigators in our study received training to comply with the standardisation of professional practice requirements and to ensure the reproducibility of the techniques. Chest physiotherapy as performed during this study involves a passive technique designed to produce sufficient airflow to generate air-mucus interaction. Passive expiration is produced through manual thoracic-abdominal pressure while respecting the mechanical rotational axis shared by the costovertebral and costotransverse joints. Two clinical indicators are used to check expiratory airflow: an audible indicator (an increase in wet or productive coughing sounds) and a tactile indicator (vibrations under the hand on the thorax) [18]. These two indicators guide the physiotherapist’s movements during CP. Because the anatomy of infants’ lower respiratory tract is associated with poor pulmonary compliance, it is important to carefully control the movements with each expiration in order to obtain a continuous flow without ever causing the collapse [4] of the peripheral bronchial structure. As long as the flow is audible from the infant’s mouth and the expiratory movement can be performed, there is no collapse [18]. Under these quality and safety conditions, this technique aims to produce drainage of the secretions and to reduce the obstructive syndrome related to congestion. The techniques used within the scope of the study did not require practising deliberate movements to assist coughing.

2.6 Primary endpoint

Our primary endpoint was comparing the number of responsive patients in each group. A responsive patient was defined as an infant whose Wang Clinical Severity Score decreased between the first and second assessment [19]. For the purposes of monitoring symptoms in an outpatient setting, this is a more significant occurrence than a simple variation in score. The Wang Clinical Severity Score [13] measures the degree of breathing difficulty (Table 1). A total score of less than or equal to 3/12 is interpreted as benign bronchiolitis, from 4 to 8/12 as moderate bronchiolitis, and 9/12 or more as severe bronchiolitis [19]. The scores were determined by blinded assessors who did not know to which group the patient had been assigned during randomisation.

Table 1. Wang Score definition

Score

0

1

2

3

Respiratory rate (breaths/min)

<30

31–45

46–60

>60

Wheezing

None

Terminal expiratory or only with stethoscope

Entire expiration or audible during expiration without stethoscope

Inspiration and expiration without stethoscope

Retractions

None

Intercostal only

Trachcostcmal

Severe with nasal flaring

General condition

Normal

Irritable, lethargic, poor feeding

2.7 Secondary endpoints

Changes in the Wang Clinical Severity Score assessed at T0 and at T1 after randomisation of each group.

CP tolerance among patients in Group A, based on events reported during chest physiotherapy: discomfort, vomiting, pain, worsening of the child’s condition.

2.8 Collected data

Collected data concerned, among other information: the identification of an atopic predisposition [20, 21], the infant’s age, concomitant treatment, and data recorded by the investigator physiotherapist in the electronic case report form developed for the purpose of the study.

2.9 Statistical analyses

For qualitative variables, absolute values and percentages were used. For quantitative variables, mean and standard deviation were used. Comparisons between the two groups were made using the Chi-square test, Fischer’s exact test, Student’s t-test or the Wilcoxon and Mann-Whitney tests, depending on the type and distribution of the variables. Matched data sets before and after care were analysed using paired Student’s t-tests or McNemar’s test, depending on the type of data.

The significance level was P<0.05. STATA v13.1 software (Stata Corporation, College Station, Texas, USA) was used for statistical analyses.

3. Results

3.1 Description of the study population

During the study period, we saw 190 infants in 4 centres (Figure 2). A total of 82 infants were included in the study, 41 in the group receiving chest physiotherapy (Group A) and 41 in the control group (Group B). The patient population within each group was comparable in terms of age and gender. The mean patient age was 204.8 days (±82.4) in Group A and 218 days (±81) in Group B.

JCRM 2019-117 - D Evenou_F2

Figure 2. Study design

There were more male than female infants in Group A (61%) and in Group B (56.1%). With respect to other demographic characteristics collected at inclusion, statistical tests revealed no difference in distribution (Table 2). In addition, there was no significant difference between the two groups with respect to the amount of time (number of days) the disease evolved after the randomisation.

Table 2. Characteristics of the study population

Item

GROUP A
chest physiotherapy
N = 41

GROUP B
not chest physiotherapy
N = 41

P

Age in days

204.8 (± 82.4), 198 [55; 363]

218 (± 81), 219 [79; 364]

0.47 *

Sex (Male)

25 (61%)

23 (56.1%)

0.65 **

Family history of asthma

10 (24.4%)

16 (39%)

0.15 **

History of eczema

3 (7.3%)

5 (12.2%)

0.71 ***

No treatment

15 (36.6%)

18 (43.9%)

0.50 **

Antibiotic treatment

10 (24.4%)

7 (17.1%)

0.41 **

Bronchodilator treatment

21 (51.2%)

20 (48.8%)

0.83 **

Corticosteroid treatment

7 (17.1%)

11 (26.8%)

0.29 **

Antitussive treatment

1 (2.4%)

1 (2.4%)

1.00 ***

Delay between the symptoms and the session

7.9 (± 7.1), 6 [1; 29]

4.8 (± 3.4), 4 [1; 17]

0.01 *

0.03 ****

* Student, ** χ², *** Exact de Fisher, **** Wilcoxon-Mann-Whitney

3.2 Results

At the end of the first CP session, 29 infants (70.7%) in Group A were responsive to CP with IET as reflected in a change in the severity classification level of their condition, compared to 4 infants (9.76%) in the control group (p<0.001) (Table 3). The results of Wang Clinical Severity Score (secondary endpoint) at T0 and T1 also changed significantly between the 2 groups. In Group A, they went from 4.83 (±0.86) to 2.83 (±1.16) and in Group B they went from 4.83 (±0.99) to 4.61 (±1.18) (Table 2). The mean decrease in the score was -2 (±1.32), -2 [-5; 0] in Group A compared to -0.22 (±0.99), 0 [-3; 1] in Group B (p<0.001) (Table 2).

Table 3. Evolution of the Wang Clinical Severity Score in Group A and Group B

First assesment

Second assesment

** Student

Group A
N=41

Group B
N=41

P**

Group A
N=41

Group B
N=41

P**

Wang Respiratory Scores values

4,83 (±0,86), 5 [4; 7]

4,83 (±0,99), 5 [4; 8]

1

2,83 (±1,16), 3 [1; 6]

4,61 (±1,18), 4 [2; 8]

< 0,001

Table 4. Comparing the decrease in clinical severity scores, Group A and Group B


GROUP A
chest physiotherapy

N=41


GROUP B

N=41

0–3 (%)

4–8 (%)

9–12 (%)

0–3 (%)

4–8 (%)

9–12 (%)

P

0–3

0 (0,0)

0 (0,0)

0 (0,0)

0–3

0 (0,0)

0 (0,0)

0 (0,0)

4–8

29 (70,7%)

12 (29,3%)

0 (0,0)

4–8

4 (9,76%)

37 (90,24%)

0 (0,0)

<0,001***

9–12

0 (0,0)

0 (0,0)

0 (0,0)

9–12

0 (0,0)

0 (0,0)

0 (0,0)

3.2.1 Differences between the groups in terms of Wang Score criteria

The Wang Clinical Severity Score items that were most impacted in Group A between T0 and T1 were respiratory rate and wheezing (Table 5).

Tableau 5. Variation in items on Wang Score between T0 and T, Group A and Group B

Wang T0

Wang T1

Item

Group A T0
N=41

Group B T0
N=41

P

Group A T1
N=41

Group B T1
N=41

P

Wang Score

0,630

0,000

1

0 (0%)

0 (0%)

5 (12,2%)

0 (0%)

2

0 (0%)

0 (0%)

12 (29,3%)

2 (4,9%)

3

0 (0%)

0 (0%)

12 (29,3%)

2 (4,9%)

4

17 (41,5%)

20 (48,8%)

10 (24,4%)

17 (41,5%)

5

16 (39%)

11 (26,8%)

1 (2,4%)

12 (29,3%)

6

6 (14,6%)

8 (19,5%)

1 (2,4%)

6 (14,6%)

7

2 (4,9%)

1 (2,4%)

0 (0%)

1 (2,4%)

8

0 (0%)

1 (2,4%)

0 (0%)

1 (2,4%)

Respiratory rate (breaths/min)

0,239

0,000

0

1 (2,4%)

0 (0%)

26 (63,4%)

10 (24,4%)

1

9 (22%)

12 (29,3%)

15 (36,6%)

26 (63,4%)

2

29 (70,7%)

23 (56,1%)

0 (0%)

5 (12,2%)

3

2 (4,9%)

6 (14,6%)

0 (0%)

0 (0%)

0,128

0 (0%)

0,003

0

4 (9,8%)

1 (2,4%)

19 (46,3%)

6 (14,6%)

1

13 (31,7%)

21 (51,2%)

14 (34,2%)

16 (39%)

2

22 (53,7%)

19 (46,3%)

8 (19,5%)

19 (46,3%)

3

2 (4,9%)

0 (0%)

0 (0%)

0 (0%)

Retractions

0,054

0,005

0

5 (12,2%)

0 (0%)

18 (43,9%)

5 (12,2%)

1

16 (39%)

22 (53,7%)

14 (34,2%)

19 (46,3%)

2

20 (48,7%)

19 (46,3%)

9 (22%)

17 (41,5%)

3

0 (0%)

0 (0%)

0 (0%)

0 (0%)

General condition

1,000

0,494

0

39 (95,1%)

39 (95,1%)

41 (100%)

39 (95,1%)

3

2 (4,9%)

2 (4,9%)

0 (0%)

2 (4,9%)

3.2.2 Monitoring undesirable side effects

No undesirable side effects were reported among the infants in Group A during the study.

4. Discussion

The effects of chest physiotherapy (CP) with increase exhalation technique (IET) for respiratory difficulties had not been studied up to now using a randomised approach with a control group in an outpatient setting. Ours was thus a first study conducted within the context of real-life infant bronchiolitis primarily targeting a clinical objective (change in the severity level). While the study required the involvement of a large number of healthcare professionals, this did not limit its feasibility nor its acceptability. In fact, it was thus possible to recruit a sufficient number of infants in each group while limiting observer bias, given that the assessors were independent and were not the same as the physiotherapists providing CP. Our study population’s gender and age (under 12 months) were representative of infants with bronchiolitis as described in the literature [4,12]. This study population requires outpatient care, since we excluded from the study any infants with very severe conditions (Wang Score >9) who needed to be hospitalised.

Our findings highlight a significant change in the initial severity classification level of the infants receiving care, with the severity level decreasing between the first and the second evaluation (Table 4). The data was corroborated by changes in the Wang Clinical Severity Score (Table 3). We chose to use this score [13] as our secondary endpoint based on its inter-observer reproducibility, which is moderate according to Landis and Koch classification (Kappa=0.48) [14]. Moreover, this score has been used several times in studies to assess the effects of CP [16, 17].

Given the characteristics of the study population, the clinical improvement we observed appears to be statistically unrelated to age at the first session, the presence of an atopy or treatment with prescribed drugs, whether or not it is adhered to (Table 2). It appears to indicate that practicing CP with IET has an effect on the short-term progress of the respiratory difficulty parameters observed in bronchiolitis. If we limit ourselves to the increased exhalation technique (IET) alone, it could impact the bronchial (airway) tree hydrodynamic resistance caused by overproduction of secretions [22], one of the three causes of obstruction in bronchiolitis, along with inflammation and the possible role of bronchial hyper reactivity [23]. This could explain the observed control over the course of the disease in the short term, based on the items in the Wang Clinical Severity Score (respiratory rate, wheezing), with as a corollary, the study populations tending to move toward less severe scores.

A discussion of our findings would nevertheless not be complete without mentioning factors that study participants may have been exposed to but which were not included or evaluated as part of our study, and whose impact cannot be measured – such as, for some infants, the use of induced coughing manoeuvres that may have impacted the results. Yet the purpose of this clinical study was to assess the practice of IET alone; spontaneous coughing, which occurs naturally as part of the disease, is not sufficient alone to limit a patient’s symptoms given its weak “efficacy” [24]. A future protocol that studies an “induced cough” group independently would make it possible to detect a possible causal relationship. In another area, a potential “care provider” effect seems to be possible. Reported recently, this effect has a positive impact on the occurrence of respiratory tract infections in the medium to long term [25]. The design of our study allowed only the quantification of short-term effects, and it is unlikely that effects related to the care provider could be observed in such a short amount of time.

The data from our study did not provide an indication of the potential long-term effects of the care that was provided. To address this question, we collected data about the infants’ subsequent progress by submitting a questionnaire to their parents 7 days after the CP. According to survey respondents (n=52), 25% of the infants saw a doctor, 8% were taken to the paediatric emergency department, and one infant required hospitalisation. In addition, it is worth noting that the absence of reported undesirable side effects in the study appears to confirm the observations of two studies in the Cochrane Review [6]. The potential occurrence of undesirable side effects in the study population must also be considered. Ambulatory patients with moderate bronchiolitis are naturally less at risk than hospitalized patients, who may be younger and may present more severe forms of bronchiolitis. For these patients, it would be reasonable to carry out a benefit/risk analysis before considering this type of care. Lastly, a word about care management: Although to date there have been few arguments to justify the level of prescriptions for outpatient CR with IET in France [26], the immediate decrease in the severity of respiratory difficulty observed in our study may explain this practice, initially based on expert opinion and the observation of considerable clinical improvement [4].

5. Conclusion

Several authors have called for a randomised, controlled study of infants with bronchiolitis in an outpatient setting [8, 25]. Based on our findings, this first study contributes to changing perceptions of the value of chest physiotherapy (CP) with increase exhalation technique (IET) for this indication [25]. The observed clinical improvement, confirmed by a change in the immediate severity score, may reflect the impact on the short-term improvement of respiratory parameters of care provision based on CP with IET. This is in addition to the recognized role of the physiotherapist in monitoring the child’s condition and providing information and guidance to families [12]. Subsequent studies could usefully focus on correlating this symptomatic effect with improvements in the infants’ comfort, sleeping and feeding within the scope of a new qualitative study.

Acknowledgments

The authors would like to thank all the infants who participated in the study as well as their parents and all the physiotherapists who took part in the children’s enrolment and care.

We would also like to thank the Clinical Research Centre (CRC) of the Créteil Inter communal Hospital Centre for providing methodological support, and ACTIV (Association Clinique Thérapeutique Infantile du Val de Marne), C. Levy and S. Bechet for data management and statistical processing.

Competing interests

The authors declare that they have no competing interests

Declaration of Interest: Conflicts of interest: none.

Abbreviations

ANAES: French National Agency for Health

ANSM: French National Agency for Medicines and Health Products Safety

APHP: Paris Pubic Hospitals Group

CHU: teaching hospital

CNIL: French Data Protection Authority

CP: chest physiotherapy

CPP: Committee for the Protection of Persons (ethics committee)

CRC: centre for clinical research

idf: Ile de France Region (it includes the city of Paris and the surrounding area)

IET: increased exhalation technique

References

  1. National Institute for Health and Care Excellence NICE. Bronchiolitis in children: diagnosis and management. NICE Guideline Juin 2015
  2. Subcommittee on Diagnosis and Management of Bronchiolitis. Diagnosis and Management of Bronchiolitis. Pediatrics 2006 October 1, 2006; 118(4): 1774–93.
  3. Ralston SL, Allan S, Lieberthal H Meissner HC and al. Clinical practice guideline: the diagnosis, management, and prevention of bronchiolitis. Pediatrics 2014; 134: e1474-e1502
  4. Conférence de consensus prise en charge de la bronchiolite du nourrisson. Texte du consensus Anaes 2000.Sept 20
  5. Bohe L, Ferrero ME, Cuestas E, Polliotto L and al Indications of conventional chest physiotherapy in acute bronchiolitis. Medicina 2004; 64 (3): 198–200.
  6. Roqué I, Figuls M, Giné-Garriga M,  Granados Rugeles C and al Chest physiotherapy for acute bronchiolitis in paediatric patients between 0 and 24 months old. Cochrane Database Syst Rev.  2016 Feb 1; 2: CD004873
  7. Rochat I, Leis P, Bouchardy M, Oberli C and al. Chest physiotherapy using passive expiratory techniques does not reduce bronchiolitis severity: a randomized controlled trial. Eur J Pediatr. 2012 Mar; 171 (3): 457–62.
  8. Gajdos V, Katsahian S, Beydon N, Abadie V and al. Effectiveness of chest physiotherapy in infants hospitalized with acute bronchiolitis: a multicenter, randomized, controlled trial. PLoS Med 2010; 7(9): e1000345.
  9. Van Ginderdeuren F, Vandenplas Y, Deneyer M,Vanlaethem S and al. Effectiveness of Airway Clearance Techniques in Children Hospitalized With Acute Bronchiolitis Pediatric Pulmonology 2017; 52: 225–231
  10. Evenou D, Sebban S, Fausser C, Girard D Evaluation de l’effet de la kinésithérapie respiratoire avec augmentation du flux expiratoire dans la prise en charge de la première bronchiolite du nourrisson en ville. Kinesither Rev 2017; 17(187): 3–8,
  11. Sebban S, Pull L, Smail A, Menier I and al Influence of chest physiotherapy on the decision of hospitalization of the infant with acute bronchiolitis in a pediatric emergencies department. Kinesither Rev 2017;
  12. Verstraete M, Cros P, Gouin M, H. Oillic and al. Prise en charge de la bronchiolite aiguë du nourrisson de moins de 1 an: actualisation et consensus médical au sein des hôpitaux universitaires du Grand Ouest (HUGO). Arch Pédiatr. 2014; 21(1): 53–62. 17 (183): 3–8.
  13. Wang EE, Milner RA, Navas L, Maj H. Observer agreement for respiratory signs and oximetry in infants hospitalized with lower respiratory infections. Am Rev Respir Dis. 1992; 145: 106–9
  14. Landis J.R., Koch G.G.: The Measurement of Observer Agreement for Categorical Data, Biometrics, 1977a, 33, 159–174.
  15. Gajdos V, Beydon N, Bommenel L, Pellegrino B and al. Inter-observer agreement between physicians, nurses, and respiratory therapists for respiratory clinical evaluation in bronchiolitis. Pediatr Pulmonol.  2009 Aug; 44(8): 754–62.
  16. Postiaux G, Louis J, Labasse HC, Gerroldt J and al. Effects of an alternative chest physiotherapy regimen protocol in infants with RSV bronchiolitis. Respiratory Care 2011; 56(7): 989–94. [DOI: 10.4187/respcare.00721; PUBMED: 21352671]
  17. Gomes EL, Postiaux G, Medeiros DR, Monteiro KK and al. Chest physical therapy is effective in reducing the clinical score in bronchiolitis: randomized controlled trial [A fisioterapia respiratória é eficaz na redução de escore clínico na bronquiolite: ensaio controlado randomizado]. Revista Brasileira de Fisioterapia 2012; 16: 241–7.
  18. Jeulin JC (2014) Approche Anthropologique du développement des compétences des masseurs-kinésithérapeutes. Conception d’un environnement informatique pour l’apprentissage en masso-kinésitherapie, Doctorat en Sciences de l ’Education, université de Provence Aix Marseille, en ligne.
  19. Postiaux G, Zwaenepoel B, Louis J. Chest physical therapy in Acute viral bronchiolitis. An updated review. Resp Care 2013; 58: 1541–5.
  20. Zedan M, Gamil N, El Assmy M, Fayez E and al A Montelukast as an episodic modifier for acute viral bronchiolitis a randomized trial. Allergy Asthma Proc. 2010; 31 (2): 147–53
  21. Castro-Rodriguez JA, Wright AL, Holberg CJ, Martinez FD and al A Clinical Index to Define Risk of Asthma in Young Children with Recurrent Wheezing, American Journal of Respiratory and Critical Care Medicine, Vol. 162, No. 4 (2000), pp. 1403–1406.
  22. Mauroy B, Pelca D, Fausser C, Merckx J and al Toward the modeling of mucus draining from human lung: role of airways deformation on air-mucus interaction. Physical biology, 2011
  23. Cody Meissner H, Viral Bronchiolitis in Children. N Engl J Med 2016; 374: 62–72 January 7, 2016
  24. Ecoffey C, Hamza J, Meistelman C, Physiologie respiratoire du nourrisson. Anesthésiologie pédiatrique 1997
  25. Alexandrino AS, Santos R, Melo C, Bastos JM and al. Caregivers’ education vs rhinopharyngeal clearance in children with upper respiratory infections: impact on children’s health outcomes. Eur J Pediatr 2017; 363: 1–9.
  26. Joud P, Fetouh M, Billet D, Pierre B and al. La kinésithérapie est-elle toujours la pierre angulaire du traitement ? Arch Pédiatr 2014; 21: 228–229

Beyond the Ordinary: The Effect of Cellular Therapy on Quality of Life in Chronic Lung Disease

DOI: 10.31038/JCRM.2019241

Abstract

Chronic lung diseases like chronic obstructive pulmonary disease (COPD) and pulmonary fibrosis are progressive, life-limiting conditions that place a burden on both the patient and the healthcare system. Current treatments are aimed at improving symptoms but to date there are no treatments that can alter the natural course of disease. Innovative treatments for these diseases are needed urgently. Autologous cellular therapy shows promise for reducing chronic inflammation, modulating the immune system and promoting healing of tissue. This study is a retrospective review of quality of life scores over the year following autologous cellular therapy and shows both statistically and clinically significant improvement in patients with COPD and pulmonary fibrosis.

Keywords

COPD, pulmonary fibrosis, cellular therapy, platelet rich plasma

Introduction

Chronic lung diseases are a complex, global health problem and one of the leading causes of disability, morbidity and mortality worldwide [1]. There is increasing awareness that these diseases are multidimensional where the patient experiences not only physical symptoms but an array of psychosocial, behavioral and emotional stressors that can wax and wane between periods of exacerbations. Despite the known pulmonary and extra-pulmonary effects, patients with chronic lung disease are often marginalized by the health care system. In fact, chronic obstructive pulmonary disease (COPD) is listed in the bottom one-third of allocated funding for fiscal year 2019 by the National Institutes of Health [2condition, and disease categories based on grants, contracts, and other funding mechanisms used across the National Institutes of Health (NIH]. Despite available medications, many patients have exhausted the available pharmacologic treatment options and remain symptomatic.

Pharmacological treatments aim to improve the patient’s quality of life, manage symptoms and reduce flare-ups, though no medications have been conclusively shown to alter long-term decline in lung function [3]. Despite modern pharmacological science, chronic lung diseases remain an extreme burden, and novel treatments are needed urgently. Autologous cellular therapy, enhancing a patient’s intrinsic healing ability, is one innovative approach to treatment. This study examines the health-related quality of life outcomes of 2,813 COPD patients and 567 pulmonary fibrosis (PF) patients who underwent elective, autologous cellular therapy and shows both statistically and clinically significant improvements in post-treatment quality of life.

Background

Non-congenital lung diseases such as obstructive pulmonary disease (COPD) and pulmonary fibrosis (PF) are characterized by symptoms such as breathlessness, decreased activity tolerance and cough. Both COPD and PF are associated with chronic and irreversible airflow limitation and, in the case of PF, scarring of the lung parenchyma [4]. COPD tends to progress slowly whereas PF progresses more aggressively, with a median survival of just 3 years5lung disorders are a leading cause of morbidity and death worldwide. For many disease conditions no effective and curative treatment options are available. Cell therapies offer a novel therapeutic approach due to their inherent anti-inflammatory and anti-fibrotic properties. Mesenchymal stem/stromal cells (MSC. In the case of COPD, two main physiological processes occur: remodeling of the small airways and loss of alveolar attachments. Even in patients with mild COPD, there is detectable obstruction and airflow reduction in the peripheral airways [6]. Cigarette smoking is the most common cause of COPD though up to 30% of COPD patients have never smoked. Second-hand smoke, exposure to fumes and chemicals and air pollution have also been identified as causative agents [7].

Pulmonary fibrosis most often has no identifiable trigger [5lung disorders are a leading cause of morbidity and death worldwide. For many disease conditions no effective and curative treatment options are available. Cell therapies offer a novel therapeutic approach due to their inherent anti-inflammatory and anti-fibrotic properties. Mesenchymal stem/stromal cells (MSC]. Though some patients who develop PF are smokers, many have no attributable history of noxious exposure, contrasted with COPD patients who almost always have a history of cigarette smoking [6]. Cigarette smoke activates epithelial cells that produce inflammatory mediators, including TGF-B which promotes local fibrosis and tissue destruction. Growth factors such as VEGF, which are naturally occurring molecules able to stimulate cell growth and proliferation, are necessary for cell survival and integrity. In alveolar cells of the lungs, a reduction in VEGF has been found in smokers and patients with COPD [6]. Even after smoking cessation, a reduction in VEGF can continue, but the reason for this is not currently known6. In addition to inflammation, those with chronic lung disease experience an accelerated ageing of the lung tissue due to a defect in intrinsic anti-aging molecules. COPD shows prominent age-related features, including an increase in stem cell exhaustion, cellular senescence and a reduction in normally protective mechanisms such as cell , which allows for the methodical break-down and recycling of cellular components [8].

Cells, including those in the lungs, have a limited number of divisions in their lifetime. The ability of cells to maintain division comes from both intrinsic factors (such as telomere length) and extrinsic forces (such as oxidative stress). Once the cell’s DNA is too damaged from repeated imperfect, divisions, or the telomeres become exhausted, cells lose the potential to divide and become senescent. Because the processes of autophagy also becomes dysfunctional, senescent cells will stay metabolically active and can continue to alter their environment, releasing damaging biochemicals and pro-inflammatory mediators. At the cellular level, lungs affected by COPD and PF exhibit increased decreased cellular autophagy, increased cellular senescence, genomic instability, mitochondrial dysfunction, epigenetic changes and stem cell exhaustion [6,9].

In a young, healthy organism, cell senescence is a beneficial process that allows for the removal of potentially damaged and cancer-causing cells from the body. These damaged cells are replaced with an effective system of stem cells to re-establish cell numbers. As organisms age and chronic disease develops, the mobilization of progenitor stem cells decreases, and harmful senescent cells increase while there are no healthy replacements [9]. In addition, the normal mechanism of cell apoptosis, or the self-destruction and complete removal of non-functional cells may be further increased in COPD and PF allowing for additional dysfunctional cells to accumulate [9].

Almost all lung diseases involve some degree of inflammation and cellular dysfunction. Platelets, cells generally thought of as anucleate fragments of blood cells that regulate hemostasis, also play a crucial role in inflammation. For that reason, the role of platelets and their biology in the process of tissue repair and regeneration has been of interest in the past several years10,11. Aside from their importance in hemostasis, platelets and their secreted products function as circulating cell receptors that provide a an intricate link between immune responses and cellular repair [10]. Platelets contain an extraordinary number of biologically active growth factors that can be released with activation, including VEGF and PDGF, a growth factor which recruits immune cells. Platelets are important in vascular repair and maintaining integrity within the vast vasculature of the lungs [4]. Activated platelets release a wide range of factors that can also promote the recruitment, adherence and proliferation of stem cells, including CD-34 positive progenitor cells. CD-34-positive progenitor cells can increase vascular tissue repair by paracrine mechanisms (cell-to-cell communication where cells can influence the behavior of neighboring cells) [5lung disorders are a leading cause of morbidity and death worldwide. For many disease conditions no effective and curative treatment options are available. Cell therapies offer a novel therapeutic approach due to their inherent anti-inflammatory and anti-fibrotic properties. Mesenchymal stem/stromal cells (MSC]. Platelets can enhance the migration of adult stem cells to areas of cellular injury and can therefore be important in regenerative therapies. In addition, platelets play a role in antiapoptotic mechanisms, moving the balance from cell death to cell survival and restoration [4]. Though the exact mechanisms of tissue repair are not fully understood, there is a wide range of research showing that platelets are able to promote the release of beneficial cytokines, chemokines and growth factors and orchestrate the recruitment and activation of adult stem cells involved in healing [10].

Platelets can be isolated from whole blood and activated by a specialized centrifugation process. The process of concentrating platelets and their secreted molecules yields a product called platelet-rich plasma- platelet concentrate, or PRP-PC. The activation process releases multiple growth factors such as PGDF, VEGF, IGF-1 and HGF from the alpha granules of the platelets. For this study, the commercial preparation equipment used produces 6 times baseline platelet concentration, 3 to 5 times baseline white blood cell concentration and a reduction in red blood cells by 3 to 6 times baseline levels according to independent studies [12].

Measuring Treatment Response

Traditionally, the diagnosis of COPD has been made based on abnormal spirometry. PF can be diagnosed by computerized tomography (CT) scan, lung biopsy and pulmonary function testing that indicates abnormal diffusion of oxygen, but spirometry often appears normal. To measure the effectiveness of treatment, health care providers have used spirometry and, for COPD, measurement of the FEV1 (forced expiratory volume in 1 second). Although FEV1 decline has been correlated in studies with increased respiratory symptoms, it is only modestly associated with changes in quality of life and extrapulmonary effects of the disease [13,14COPD has both pulmonary and extrapulmonary effects, which have an impact on many aspects of physical, emotional, and mental well-being. Traditional assessment of COPD relies heavily on measuring lung function, specifically forced expiratory volume in 1 second (FEV(1]. Quality of life- the physical, emotional and social effects on the patient is not measured by spirometry. The term health-related quality of life has been defined as the ‘functional effect of an illness and its consequent therapy upon a patient, as perceived by the patient’ and therefore measurement of quality of life can only be reported reliably by the patient [13COPD has both pulmonary and extrapulmonary effects, which have an impact on many aspects of physical, emotional, and mental well-being. Traditional assessment of COPD relies heavily on measuring lung function, specifically forced expiratory volume in 1 second (FEV(1]. This study uses a self-report instrument, the Clinical COPD Questionnaire (CCQ) to evaluate the patient perspective. Health status questionnaires like the CCQ provide a comprehensive, measurable assessment of the overall patient experience of disease [13,15COPD has both pulmonary and extrapulmonary effects, which have an impact on many aspects of physical, emotional, and mental well-being. Traditional assessment of COPD relies heavily on measuring lung function, specifically forced expiratory volume in 1 second (FEV(1].

The CCQ has been widely used in a multitude of clinical settings. It is a short, ten-item tool developed in 2003 and translated into 64 different languages. It is not only useful for measuring baseline status but in measuring response to treatment [16many clinical trials now include assessments of PROs. These are formalized methods of capturing patient-centered information. Given the importance of PROs in evaluating the potential utility of an intervention for a patient with COPD, it is important that physicians are able to critically interpret (and critique]. Validation of the CCQ shows robust discriminative properties, good test-retest reliability and responsiveness. Although developed for use in COPD patients, it has also been tested and shown to be valid and reliable in other chronic lung diseases and even in patients at risk for COPD. Importantly, validation studies show that the CCQ is very sensitive for clinical changes after intervention [15]. The CCQ has three domains: the symptom domain (4 items), mental status domain (2 items) and functional status domain (4 items). Each of the ten items is ranked by the patient on a scale of 0 to 6, with 0 being not troublesome at all, to 6 being extremely troublesome. The final total score (0–60) is divided by ten to yield a final 0–6 score. In order to confirm that a change in score is clinically meaningful from baseline, Alma and associates have determined the minimum threshold of at least 0.4 points should be met [17,18].

Methods and Materials

All patients in this study underwent autologous harvest and isolation of platelet-rich plasma/platelet concentrate (PRP-PC) from peripheral blood. 120 mL of blood was collected from each patient over a period of 2 to 3 days. Each treatment day, whole blood was collected from the peripheral circulation, processed using centrifugation, and administered to the patient back through the peripheral circulation following approximately 15 minutes of centrifugation. As the cellular product (with a final yield of 8–10mL of PRP-PC) enters the peripheral vein, the natural circulatory system transports the product through the right heart and into the pulmonary circulation, where cells become trapped within the pulmonary microvasculature. Each patient was presented with informed consent prior to treatment. The treatment was very well-tolerated, and no adverse events were reported. Permission to evaluate the documented outcomes of patients treated was granted by an Institutional Review Board.

Before treatment, each patient was administered the CCQ. A copy of the CCQ is found in the illustrations. Patients were then contacted by phone by a licensed and trained research nurse at 3, 6 and 12-months post-treatment and the CCQ was re-administered and scored. To prevent confounding or bias, nurses did not have access to the previously answered CCQ. Responses to each question was recorded in an encrypted, online database for later data extraction and analysis. For this study, cases where a patient may not have answered all ten CCQ items were eliminated to prevent skewed data. Of course, over time, some subjects were lost to attrition, as evidenced by decreasing numbers of recorded patient outcomes at the 3, 6 and 12-month time points.

IBM’s Statistical Package for the Social Sciences (SPSS) was used to analyze the data points. Descriptives of the sample were run. Because of the discrete symptom, mental status and functional status domains and their importance as separate domains, total and average domain scores were also calculated and examined. Each data point was analyzed for a statistically significant change from baseline as well as a clinically significant change from baseline, indicated by a minimal clinically important difference (MCID) of 0.4 or more as per Alma, et al.

Results

The mean age of COPD-diagnosed patients was 70.8 years. 1,666 were male, 1,147 were female. The baseline CCQ among this group was 3.51 (N=2,813). At 3 months post-treatment the mean CCQ was 2.4 (N=2,008) and 1.1 improvement from baseline; at 6 months 2.42 (N=1,598) and 1.09 improvement from baseline and at 12 months 2.73 (N=754) 0.78 improvement from baseline which all far exceed the MCID of 0.4 T-tests show statistically significant improvement at all three time points from baseline with P < 0.001 for all.

For the symptom domain, COPD patients had an improvement in CCQ by 1.16 at 3 months, 1.22 at 6 months and 0.93 at 12 months post-treatment (table 1). For the mental status domain there was an improvement in CCQ by 1.55 at 3 months, 1.49 at 6 months and 1.19 at 12 months (table 2). For the functional status domain there was an improvement in CCQ by 0.83 at 3 months, 0.77 at 6 months and 0.44 at 12 months (table 3). All exceed the MCID of 0.4 or more. T-tests show statistically significant improvement at all three time points and all three domains from baseline with a p < 0.01.

Table 1. CCQ Symptom Domain Change from Baseline Among COPD Patients

JCRM 2019-115 - Melissa M. Rubio USA_f1

Table 2. CCQ Mental Status Domain Change from Baseline for COPD Patients

JCRM 2019-115 - Melissa M. Rubio USA_f2

Table 3. CCQ Functional Status Domain Change from Baseline for COPD Patients

JCRM 2019-115 - Melissa M. Rubio USA_f3

Concurrent with the MCID threshold of 0.4 or more, 75% (N=1,507) of COPD patients experienced improvement in quality of life at 3 months, 72.6% (N=1,161) experienced improvement in quality of life at 6 months and 64.1% (N=483) experienced improvement at 12 months post-treatment.

The mean age of patients with PF was 71.1 years. 389 patients were male, 178 were female. The baseline CCQ among this group was 3.34 (N=567). At 3 months, the mean CCQ was 2.53 (N=399) and a change of 0.81. At 6 months the mean CCQ was 2.69 (N=286) with a change of 0.65 and at 12 months the mean CCQ was 2.85 (N=124) with a change from baseline of 0.49. All time points exceed the MCID of 0.4. T-tests show statistically significant improvement at all three time points from baseline with a p <0.01 for all.

For the symptom domain, PF patients had an improvement in CCQ by 0.89 at 3 months, 0.77 at 6 months and 0.70 at 12 months (table 4). For the mental status domain there was an improvement in CCQ by 1.25 at 3 months, 1.07 at 6 months and 0.82 at 12 months (table 5). For the functional status domain there was an improvement in CCQ 0.52 at 3 months, 0.31 at 6 months and 0.10 at 12 months (table 6). The 6- and 12-month functional domain scores fell below the MCID of 0.4. T-tests, however, were statistically significant at for all domains at all time points with a p <0.01 for all (table 5).

Table 4. CCQ Symptom Domain Change from Baseline for PF Patients

JCRM 2019-115 - Melissa M. Rubio USA_f4

Table 5. CCQ Mental Status Domain Change from Baseline for PF Patients

JCRM 2019-115 - Melissa M. Rubio USA_f5

Concurrent with the MCID threshold of 0.4 or more, 66.2% (N=264) of PF patients experienced an improvement in quality of life at 3 months, 59.4% (N=170) experienced improvement at 6 months and 47.6% (N=59) experienced improvement at 12 months post-treatment (table 6).

Table 6. CCQ Functional Status Domain Change from Baseline for PF Patients

JCRM 2019-115 - Melissa M. Rubio USA_f6

Discussion

There is a growing body of evidence that cellular therapies have great potential influence inflammatory, immune and regenerative functions in the lung. Although there is much yet to learn about the exact mechanisms of PRP-PC activity in lung tissue, this study shows both a statistically and highly clinically meaningful improvement in quality of life for patients with COPD and PF at nearly all post-treatment time points. COPD outcomes likely exceed PF outcomes here as PF is a faster-progressing disease with a mean survival of less than 5 years, though both groups have experienced quality of life improvement.

The symptom domain, which addresses breathlessness, coughing and phlegm production, and the mental status domain, which addresses symptoms of anxiety and depression related to breathing, have responded the best among this group. The functional domain, which addresses physical limitations due to disease, also shows overall improvement though to a lesser extent. These items, which account for heavy lifting and strenuous activity, are commonly difficult for those limited by chronic lung disease.

This study is limited to observation of outcomes and does not compare treatment with the standard pharmacologic treatments or placebo. All patients in this study were asked to continue their prescribed regimen during and after our treatment but this study cannot account for changes in treatment, new medical diagnoses or other alternative therapies. In addition, all patients were required to be non-smokers at the time of treatment, but this study does not account for those who may have resumed smoking in the year following treatment which may negatively affect outcomes.

Nonetheless, the outcomes presented here were tested for both clinical and statistical significance and, at almost all data points, far exceeds those tests, demonstrating that cellular therapy is a promising option for those who suffer with chronic lung diseases.

Acknowledgments

I would like to express my gratitude to Dr. Jack Coleman, Senior Medical Director at the

Lung Health Institute, for his knowledge and expertise in the arena of regenerative medicine. I would like to thank Shawn Clymer, data analyst, for collecting the data needed for this study.

Supporting Information

Clinical COPD Questionnaire

JCRM 2019-115 - Melissa M. Rubio USA_f7

Abbreviations

CCQ

Clinical COPD Questionnaire

COPD

Chronic obstructive pulmonary disease

CT

Computerized tomography

FEV1

Forced expiratory volume in 1 second

HGF

Hepatocyte growth factor

IGF-1

Insulin-like growth factor – 1

MCID

Minimal clinically important difference

PDGF

Platelet-derived growth factor

PF

Pulmonary fibrosis

PRP

Platelet rich plasma

PRP-PC

Platelet rich plasma/platelet concentrate

TGF-B

Transforming growth factor beta

VEGF

Vascular endothelial growth factor

Competing Interests

The author declares there are no competing interests.

Funding Information

No funding was used for this study.

References

  1. Koskela J, Kilpeläinen M, Kupiainen H, et al. (2014) Co-morbidities are the key nominators of the health related quality of life in mild and moderate COPD. BMC Pulm Med. doi: 10.1186/1471-2466-14-102.[Crossref]
  2. National Institute of Health. Estimates of Funding for Various Research, Condition, and Disease CAtegories (RCDC).; 2018.
  3. Yeh GY, Horwitz R. (2017) Integrative Medicine for Respiratory Conditions: Asthma and Chronic Obstructive Pulmonary Disease. Med Clin North Am. doi: 10.1016/j.mcna.2017.04.008. [Crossref]
  4. O’Sullivan BP, Kerrigan SW. (2015) Platelets, Inflammation and Respiratory Disease. In: The Non-Thrombotic Role of Platelets in Health and Disease. doi: 10.5772/60569.
  5. Geiger S, Hirsch D, Hermann FG. (2017) Cell therapy for lung disease. Eur Respir Rev. doi: 10.1183/16000617.0044–2017. [Crossref]
  6. Barnes PJ. (2016) Inflammatory mechanisms in patients with chronic obstructive pulmonary disease. J Allergy Clin Immunol. doi: 10.1016/j.jaci.2016.05.011. [Crossref]
  7. Lõpez-Campos JL, Tan W, Soriano JB. (2016) Global burden of COPD. Respirology. doi: 10.1111/resp.12660. [Crossref]
  8. Mercado N, Ito K, Barnes PJ. (2015) Accelerated ageing of the lung in COPD: New concepts. Thorax. doi: 10.1136/thoraxjnl-2014-206084. [Crossref]
  9. Mercado N, Ito K, Barnes PJ. (2015) Accelerated ageing of the lung in COPD: new concepts. Thorax. doi: 10.1136/thoraxjnl-2014-206084. [Crossref]
  10. Crisci A, Crescenzo U De, Crisci M. (2018) Platelet-rich concentrates (L-PRF, PRP) in tissue regeneration: Control of apoptosis and interactions with regenerative cells. J Clin Mol Med. doi: 10.15761/jcmm.1000116.
  11. Weyrich AS, Zimmerman GA. (2013) Platelets in Lung Biology. Annu Rev Physiol. (75): 569–591. [Crossref]
  12. Fitzpatrick J, Bulsara MK, McCrory PR, Richardson MD, Zheng MH. (2017) Analysis of Platelet-Rich Plasma Extraction: Variations in Platelet and Blood Components Between 4 Common Commercial Kits. Orthop J Sport Med. doi: 10.1177/2325967116675272. [Crossref]
  13. Jones P, Miravitlles M, van der Molen T, Kulich K. (2012) Beyond FEV1 in COPD: A review of patient-reported outcomes and their measurement. Int J COPD. 7: 697–709. doi: 10.2147/COPD.S32675.
  14. Tantucci C, Modina D. (2012) Lung function decline in COPD. Int J Chron Obstruct Pulmon Dis. 7: 95–99. doi: 10.2147/COPD.S27480. [Crossref]
  15. Kocks JWH, Tuinenga MG, Uil SM, van den Berg JWK, Ståhl E, van der Molen T. (2006) Health status measurement in COPD: the minimal clinically important difference of the clinical COPD questionnaire. Respir Res. 7(i): 62. [Crossref]
  16. Jones PW, Rennard S, Tabberer M, Riley JH, Vahdati-Bolouri M, Barnes NC. (2016) Interpreting patient-reported outcomes from clinical trials in COPD: A discussion. Int J COPD. doi: 10.2147/COPD.S117378. [Crossref]
  17. Alma H, De Jong C, Jelusic D, et al. (2016) Health status instruments for patients with COPD in pulmonary rehabilitation: Defining a minimal clinically important difference. npj Prim Care Respir Med. 26. doi: 10.1038/npjpcrm.2016.41. [Crossref]
  18. Alma HJ, de Jong C, Jelusic D, et al. (2018) Assessing health status over time: impact of recall period and anchor question on the minimal clinically important difference of copd health status tools. Health Qual Life Outcomes. doi: 10.1186/s12955-018-0950-7. [Crossref]

Effect of N-Methyl-D-Aspartate Receptor Blockade on Anxiety-Like Behavior Induced in Rats by Postnatal Chronic Exposure to the Endocrine Disruptor Di-2 (Ethyl-Hexyl Phthalate) in Elevated plus Maze Test

DOI: 10.31038/EDMJ.2019343

Abstract

Di-2-Ethylhexyl Phthalate (DEHP) is the widely used to convey flexibility and transparency to plastic products made of polyvinyl chloride and also in the manufacture of medical devices. DEHP disrupts reproductive tract development in an antiandrogenic manner and also may induce neurobehavioral changes. In previous works, we demonstrated that chronic postnatal exposure to DEHP alters the neuroendocrine regulation of the testicular axis, modifying the hypothalamic concentration of excitatory neurotransmitters and therefore induces an anxiogenic effect. In the Elevated Plus Maze (EPM) test, dizocilpine (MK-801) induces a decrease in anxiety-related behaviors throughout NMDA receptor blockade. The objective of this work was to investigate whether the blockade of NMDA receptors of glutamate by the non-competitive antagonist MK-801 could modify the anxiety-like behavior induced by chronic postnatal exposure to DEHP (30 mg/kg body weight/day, orally from birth) in young adult male rats in the EPM test. The results show that NMDA receptor blockade by MK-801 (0.1 mg/kg body weight, i.p.) in DEHP exposed animals is able to produce a significant decrease in time spent in closed arms (TSC) and in Freezing Time (FT) as well as an increase in time spent in open arms (TSO) in the EPM test, indicating an anxiolytic effect. In conclusion, our results suggest: 1) NMDA receptor blockade by MK-801 can reverse anxiety-like behavior induced by exposure to DEHP during the early period of life. 2) The glutamatergic system is involved in the anxiogenic effect of phthalate, which is probably triggered by its known antiandrogenic action.

Keywords

DEHP; Endocrine Disruptor; Dizocilpine (MK-801); Glutamate Receptors; Anxiety like-behavior

Introduction

N-Methyl-D-Aspartate (NMDA) receptor-mediated glutamate transmission is one of the most significant mechanisms during multiple stages of brain development and has been implicated in cognitive functions and emotional responses [1]. It has been suggested that during the early neurodevelopmental period the treatment with non-competitive antagonist of NMDA receptors such as dizocilpine (MK-801), can cause long-term effects in the anatomical, neurochemical, neurophysiological and behavioral features of rodents [2,3]. Indeed, there are evidences that MK-801 has an anxiolytic potential [4–6]. During the critical period of brain maturation, MK-801 induces locomotor hyperactivity and decreases anxiety levels in adolescent rats.6 In the elevated plus maze (EPM) test a decrease was observed in anxiety-related behaviors caused in adult male mice by MK-801 in the early developmental period [7]. NMDA receptor blockade could reduce neuronal activity in pathways which lead to the release of GABA or monoamines, and which have themselves been implicated in anxiety-related processes [8].

Di-2(ethyl-hexyl phthalate) (DEHP) is an endocrine disruptor with antiandrogenic action, which is used as a plasticizer in many products, especially in medical devices and in manufacturing a wide variety of consumer products made with Polyvinyl Chloride (PVC) [9]. The brain has been determined to be at risk of DEHP exposure. Gestational and postnatal exposure to DEHP can affect neurodevelopment and lead to anomalies by disrupting normal brain development and function [10]. In previous works, we demonstrated that chronic postnatal exposure to DEHP alters the neuroendocrine regulation of the testicular axis, modifying the hypothalamic concentration of excitatory and inhibitory neurotransmitters [11,12]. DEHP could act on anxiety in different ways depending on the treatment, age, and sex of the animals [13–16]. It has been reported that postnatal exposure to DEHP can induce anxiogenic effect in pre and peripubertal male rats but not in females in the same stages of sexual maturation. Moreover, it has been proposed that the decrease in testosterone levels induced by postnatal exposure to DEHP could be one possible mechanism underlying DEHP anxiogenic-like behavior in immature male rats [17]. Recently, we have demonstrated that GABA agonists, muscimol and baclofen, can reverse DEHP neuroendocrine effects as well as its anxiogenic action in young adult male rats, supporting the notion that GABAergic system may be one of the neurotransmitter systems involved in the effects produced by DEHP exposure during early periods of neurodevelopment [18].

On these bases we hypothesized those DEHP-induced modifications in the concentration of excitatory amino acids in the brain of immature rats [11,12] could also have a modulatory role in the anxiogenic behavior induced by exposure to this endocrine disruptor during early periods of neurodevelopment. Therefore, the objective of this study was to investigate whether the blockade of NMDA receptors of glutamate by the non-competitive antagonist MK-801 could modify the anxiety-like behavior induced by chronic postnatal exposure to DEHP in young adult male rats in the elevated plus maze (EPM) test.

Materials and Method

All animal procedures were performed following the protocols of the National Institute of Health—Guide for the Care and Use of Laboratory Animals. The approval to conduct the study was granted by the Animal Care and Ethics Committee of the School of Medicine, Universidad de Buenos Aires (UBA; CICUAL).

Animals

Wistar rats used were provided by the Department of Physiology, School of Medicine, UBA, Argentina. Animals were kept under a controlled environment (temperature 22–24C; lights on from 7.00 h to 19.00 h) and they had free access to food and filtered water, until the time of killing. All animals were fed with balanced food for laboratory rodents (Cooperation, ACA-16014007, Asociación de Cooperativas Argentinas-División de Nutrición Animal). The diet contained 15% of soy, but as the food used and the quantity of food intake by control and DEHP-treated groups were similar, we assumed that all animals were exposed to equivalent levels of food-borne phytoestrogens. Moreover, the same lots of diet were provided to animals from all groups at the same time, during the course of the study, to control across groups for possible variation in the diet content. We used ultrapure-filtered water (obtained from EDS-Pack, Millipore Merck, installed in the Milli-Q water system) that was presumed to be free of phthalates and other Endocrine Disruptors (EDs). To minimize additional exposures to substances that may act as EDs, rats were housed in stainless steel cages with wood beddings and water was supplied in glass bottles.

Drugs and Doses

DEHP was purchased (1 g/ml>99% pure; Aldrich Chemical Company, Inc., Milwaukee, Wisconsin, USA) and the final solution administered to the animals was made up fresh daily by adding 200 ml of DEHP to 1 l of filtered water to reach a concentration of 0.2 mg/ml and sonicating for 30 min to ensure a permanent and homogenized solution. An oral route in DEHP administration was chosen intending to mimic best the most common route of human exposure to the ED. The estimated average DEHP dose of exposure was 30 mg/kg body weight (BW)/day, based on the daily intake of DEHP solution and the weight of the related animal. Liquid consumption was measured calculating the difference between the amount of liquid placed in the bottle every day and the remaining amount on the following day to assess the intake. It was assumed that all DEHP solution missing in the bottle had been consumed by the animals. Assessments did not contemplate possible leakage or evaporation of the solution or potential loss of DEHP activity during the 24-h period. No significant differences between the amount of liquid consumed by dams and pups receiving DEHP and those which did not receive this chemical were found. The dose was chosen based on prior studies published by us, in which we demonstrated alterations in the reproductive axis and in the behavior in immature male rats exposed to DEHP at a dose of 30 mg/kg BW/day but not in animals exposed to a lower dose (3 mg/kg BW/day) [11,12,17,18].

On the other hand, MK- 801 ([(+)-3 (2-carboxypiperazine-4-yl) propyl-1-phosphonic acid]; Research Biochemicals Inc., Natick, Mass, USA) was dissolved in saline and injected at dose of 0.1 mg/kg BW, i.p., 1 h before performing the behavioral test. MK-801 can be administered intraperitoneally because it crosses easily the blood-brain barrier. The chosen dose does not produce toxic effects [19].

Experimental Design

Pregnant dams were placed individually in metallic cages and upon delivery, pups were sexed; male pups were separated and distributed with one surrogate dam (n= eight male pups per dam). On postnatal day (PND) 1, surrogate dams with their male pups were randomly assigned into control (C) and DEHP exposure groups. Dam’s exposure to DEHP began on PND 1 and continued until weaning. On PND 21, pups of each group continued receiving the same treatment until PND 60. On this day, control and DEHP-exposed male pups were randomly assigned (n= 8 animals per group) to the following treatments: (1) W + S: controls that were given water and injected with saline; (2) DEHP + S: animals that were given DEHP and injected with saline; (3) W+ MK-801: animals that were given water and injected with MK-801; (4) DEHP + MK-801: animals that were given DEHP and injected with MK-801. After receiving the MK-801 or the vehicle, animals were submitted to the behavioral test.

EPM test

The elevated plus maze (EPM) test is a widely used behavioral assay for rodents, and it has been validated to assess the antianxiety effects of pharmacological agents and steroid hormones and to define mechanisms underlying anxiety-related behavior [20]. The EPM apparatus consists of two open arms (10 x 50 cm), alternating in right angles with two closed arms (10 x 50 x 10 cm), delimiting a central area. The maze was elevated 50 cm above the floor. Before starting the test, animals were individually placed in a rectangular plastic glass area (40 × 40 cm) for 5 min in order to habituate them to the test environment. After that, the rats were placed in the central area of the maze, facing one of the closed arms, and were allowed to explore it for 5 min. The maze’s arms were equally illuminated so that the animals did not perceive lighting differences. Behavioral tests were performed from 12: 00 h to 14: 00 h. We used 10% ethanol to clean each arm of the maze and to remove olfactory cues every time between trials. Each rat was tested only once. The animal’s behavior was videotaped and the number of entries and the time spent in both, open and closed arms, were measured by an observer. The parameters measured were: Time Spent in Open (TSO) and Closed (TSC) arms, Total number of Entries (TE) and Time of Freezing (FT). These parameters were measured following a four-paw criterion; entry into the arm of the EPM was defined as the animal placing all four paws in that particular part of the maze. It is considered that anxiety-like behavior is characterized by a decrease in TSO and an increase in TSC. On the other hand, TE provides a built-in control measure for general hyperactivity or sedation. TSO, TSC and FT were expressed in seconds.

Statistical Analysis

Results are presented as means ± SEM. The statistical analysis was based on individual offspring numbers. The surrogate dam was not used as the unit. Therefore, we did not consider the potential effects of the surrogate dam in the statistical analysis, as pups were exposed to this chemical through her milk. All data were checked for normality by the Kolmogorov–Smirnov test and then, they were analyzed using Kruskal-Wallis test (non-parametric ANOVA); posthoc Mann Whitney (Bonferroni correction) to compare unpaired groups. The statistical software used was GraphPad InStat 3 and a difference was considered statistically significant when p < 0.05.

Results

Figure 1 shows the effect of MK-801 on TSO in adult male rats exposed to DEHP from birth. Significant differences between treatments were found (K (3) =25.860, p < 0.0001). When compared with the control group, a significant decrease in TSO were observed in rats exposed to DEHP (DEHP+S vs W+S, p < 0.01) while MK-801 treatment increased this parameter (W+MK vs W+S, p <0.001). MK-801 also produced an increase in TSO with respect to DEHP-exposed group (W+MK vs DHEP+S, p < 0.001) and was able to reverse the effect of the endocrine disruptor (DEHP+MK vs DEHP+S, p<0.001). No significant differences were found between W+MK and DEHP+MK groups, p=0.7984).

EDMJ 2019-119 - Rodolfo A. Cutrera Argentina_f1

Figure 1. Effect of acute administration of MK-801 on the time spent in open arms in adult male rats exposed postnatally to DEHP. W: water; S: saline; DEHP: di-2(ethyl-hexyl phthalate; MK: MK-801. ** p<0.01 vs W+S; *** p<0.001 vs W+S; ### p<0.001 vs DEHP+S. Each value represents the mean ± SEM of eight animals per group.

As can be seen in Figure 2, there were significant differences in TSC between treatments (K (3) = 14.809, p<0.01). DEHP significantly increased the TSC compared to the control group (DEHP+S vs W+S, p < 0.05) while MK-801 produced a significant decrease (W+MK vs W+S, p < 0.05) and reversed the effect of DEHP (DEHP+MK vs DEHP+S, p<0.01).

EDMJ 2019-119 - Rodolfo A. Cutrera Argentina_f2

Figure 2. Effect of acute administration of MK-801 on the time spent in closed arms in adult male rats exposed postnatally to DEHP. W: water; S: saline; DEHP: di-2(ethyl-hexyl phthalate; MK: MK-801. * p<0.05 vs W+S; ## p<0.01 vs DEHP+S; ### p<0.001 vs DEHP+S. Each value represents the mean ± SEM of eight animals per group.

Figure 3 shows the number of total entries in both arms of the maze. Significant differences were detected between treatments (K (3) = 23.642, p<0.001). As expected, there were no significant differences in DEHP-treated animals with respect to the control group (DEHP+S vs W+S, p =0.2627). MK-801 produced a significant increase in TE (W+MK vs W+S, p < 0.001). The same effect was observed with DEHP + MK (DEHP+MK vs DEHP+S, p<0.001). No differences were found between both groups treated with MK-801 (DEHP+MK vs W+MK, p=0.2475).

EDMJ 2019-119 - Rodolfo A. Cutrera Argentina_f3

Figure 3. Effect of acute administration of MK-801 on the number of total entries in adult male rats exposed postnatally to DEHP. W: water; S: saline; DEHP: di-2(ethyl-hexyl phthalate; MK: MK-801. *** p<0.001 vs W+S; ### p<0.001 vs DEHP+S. Each value represents the mean ± SEM of eight animals per group.

Time spent in freezing behavior (Figure 4) showed significant differences between groups (K(3) = 26.042, p<0.001). There was a significant increment in DEHP-exposed rats (DEHP+S vs W+S, p<0.001) and a significant decrease in animals injected with MK-801 (W+MK vs W+S, p<0.001). In addition, MK-801 antagonized the effect of DEHP ((DEHP+MK vs DEHP+S, p<0.001).

EDMJ 2019-119 - Rodolfo A. Cutrera Argentina_f4

Figure 4. Effect of acute administration of MK-801 on freezing time in adult male rats exposed postnatally to DEHP. W: water; S: saline; DEHP: di-2(ethyl-hexyl phthalate; MK: MK-801. *** p<0.001 vs W+S; ### p<0.001 vs DEHP+S. Each value represents the mean ± SEM of eight animals per group.

Discussion

In order to investigate if the NMDA receptors of glutamate are involved in the changes in the anxiety-like behavior induced by early exposure to endocrine disruptor DEHP, we compared the performance in the Elevated plus Maze of adult male rats exposed to DEHP postnatally and treated or not with MK-801, a non-competitive antagonist of glutamate receptors. Our results showed that NMDA receptor blockade by MK-801 was able to reverse anxiety-like behavior induced by exposure to DEHP during the early period of life.

As we expected, our results showed an anxiogenic effect of DEHP, which was evidenced by a significant increase in TSC and a decrease in TSO in the EPM test. These results were consistent with the findings reported in immature rats and mice exposed perinatally to DEHP (10, 30, 50, and 200 mg/kg) [17,21] as well as in young adult male rats chronically exposed to DEHP (30 mg/kg) from birth [18].

However, the mechanism underlying the enhanced anxiety-like behavior induced by DEHP is not clear. In one way DEHP may influence anxiety-like behavior by disturbing the hypothalamic-pituitary-adrenal axis (HPA). In fact, exposure of male rats to DEHP leads to an age-dependent activation of the HPA ‘in vivo’ and of adrenocortical steroidogenesis ‘ex vivo’, showing a specific susceptibility of immature animals to this phthalate [22]. Perturbations of hormonal homeostasis of the HPA axis were found in adolescent female rats exposed to DEHP during lactation [23]. Direct and transgenerational effects of perinatal DEHP exposure on social behaviors and anxiety-like behavior in mice, as well as transgenerational effect of DEHP on corticosterone levels were reported by other authors [24,25]. Another way in which DEHP could influence anxiety is by altering the hypothalamic-pituitary-gonadal axis. It has been reported that gestational and lactational DEHP exposure is able to disrupt the neuroendocrine control of the gonadal axis during sexual maturation in rats [11,12]. The changes induced by DEHP in the hypothalamic concentration of GABA, the inhibitory neurotransmitter involved in the neuroendocrine control of the gonadal axis as well as in the development of anxiety, support the idea that the GABAergic system could participate in the behavioral effects of the DEHP [18]. Moreover, in the adulthood perinatal DEHP-exposed males displayed anxiogenic status, which correlate with a decrease in testosterone levels [7]. Given that the treatment with testosterone was able to reverse the disruptive effect of chronic postnatal exposure to DEHP on the testicular axis of rats, it was suggested that the antiandrogenic action of this chemical could be a probable mechanism underlying its anxiogenic effect [17]. In addition, Xu et al [21]. have suggested that the inhibition of the mitogen-activated protein kinase/extracellular signal-regulated kinases (MAPK/ERKs) activity, which mediates the non-genomic actions of testosterone in the brain cells, as well as the down-regulation of androgen receptors expression in hippocampus could be involved in the anxiogenic-like effect produced by perinatal DEHP exposure during puberty and even after in adult life.

In agreement with other authors [17,18], in the animals exposed to DEHP we did not detect changes in TE in both the open and closed arms. Considering that TE provides an approximate measure for the locomotor activity, these results could indicate that the increase in the anxiety-like behavior induced by DEHP was not influenced by probable changes in locomotor activity. Furthermore, we observed a significant increase in freezing time in DEHP-exposed rats. It is known that freezing response is a behavioral index of fear and that the deficit in testosterone may have a significant effect of increasing freezing response [26]. On this basis, we hypothesized that the increase in freezing time induced by DEHP could be due to the decrease in circulating blood testosterone levels previously found in immature and adult male rats exposed postnatally to this endocrine disruptor at the same dose used in the present work [17,18]. Therefore, it should be considered the possibility that the increase in freezing time by DEHP may be due to either direct or indirect alterations in the neuroendocrine gonadal and adrenal axes modulators, which play a critical role in the regulation of stress responses.

It is known that glutamate is the main excitatory neurotransmitter in the human Central Nervous System. A growing body of evidence suggests that glutamatergic neurotransmission may be involved in the biological mechanisms underlying stress response and anxiety-related disorders [27]. Glutamate mediates its effects via stimulation of ionotropic and metabotropic receptors [28]. During development in the rat the brain is highly sensitive to the effects of the glutamate ionotropic receptor NMDA modulation [29]. The non-competitive antagonists of glutamate receptors have been extensively studied for their anxiolytic action. In particular, in rodent models it has shown that MK-801, a non-competitive antagonist of NMDA receptors, may have anxiolytic like effects on the EPM test [30].

In the present work, we observed that MK-801-treated rats showed lower anxiety level in the EPM and increased spontaneous locomotor activity in comparison with the control group. In fact, consistent with the reported anxiolytic potential of MK-801[5,6,29] we observed that this NMDA receptor antagonist was able to produce a significant decrease in TSC as well as an important increase in TSO, suggesting that NMDA glutamate receptors are involved in the development of anxiety-like behavior. In addition, MK-801 treated animals showed a significant increase in TE, indicating that the locomotor activity can be induced by MK-801 [23].

When young adult male rats exposed to DEHP from birth were treated with the NMDA receptor antagonist, they showed an increase in TSO which was correlated with a decrease in TSC. The number of total entries in both arms of the labyrinth was increased, showing greater locomotor activity compared to animals treated only with DEHP. Freezing response in DEHP-exposed animals and treated with MK-801 was significantly lower than in the control and DEHP groups and showed no difference with the animals treated with MK-801 alone. These findings indicated that MK-801 was able to reverse the anxiogenic action of DEHP, leading the freezing time to values even lower than those observed in the control group.

However, it is difficult to explain the probable mechanisms that could mediate the anxiogenic effect of DEHP through an interaction with NMDA glutamate receptors. It has been reported that blockade of NMDA receptors causes a reduction of neuronal activity in pathways that lead to the release of GABA or monoamines, which themselves have been implicated in anxiety-related processes [8]. In this sense, we demonstrated the participation of the GABAergic system in the anxiety-like behavior induced by chronic postnatal exposure to DEHP in young adult male rats [17]. On the other hand, androgens modulate the structure and functions of the hippocampus related with behavior and exert profound effects on the up-regulation of NMDA receptors in hippocampus of males. DEHP markedly down-regulates the expression of androgen receptors which, in turn, are involved in the regulation of behavior mediated by the hippocampus of pubertal males. Therefore, it may be possible that chronic exposure to DEHP during critical periods of neurodevelopment is capable of inducing anxiogenic behavior in adult male rats, decreasing androgen levels and the expression of their receptors as well as interacting with NMDA glutamate receptors.

In conclusion, our results suggest: 1) NMDA receptor blockade by MK-801 can reverse anxiety-like behavior induced by exposure to DEHP during the early period of life. 2) The glutamatergic system is involved in the anxiogenic effect of phthalate, which is probably triggered by its known antiandrogenic action.

Highlights

  • Chronic postnatal exposure to DHEP induces anxiogenic effect in adult male rats
  • MK-801 reverses anxiety-like behavior induced by chronic postnatal exposure to DEHP
  • The glutamatergic system is involved in the anxiogenic effect of phthalate

Funding

The author(s) disclosed receipt of the following financial support for the research, authorship, and/or publication of this article: This work was supported by the Universidad Buenos Aires under grants UBACYT20020130100439BA (OJP) and UBACYT 20020170100151BA (RAC and SC).

References

  1. Pryce C, Mohammed A, Feldon J (2002) Environmental manipulations in rodents and primates: insights into pharmacology, biochemistry and behaviour. Pharmacol Biochem Behav 73: 1–5.
  2. Nemeth H, Varga H, Farkas T, et al. (2002) Long-term effects of neonatal MK-801 treatment on spatial learning and cortical plasticity in adult rats. Psychopharmacology 160: 1–8.
  3. Latysheva NV and Rayevsky KS (2003) Chronic neonatal N-Methyl-D-Aspartate receptor blockade induces learning deficits and transient hypoactivity in young rats. Prog Neuro- Psychopharmacol Biol Psychiatry 27: 787–794.
  4. Sharma AC and Kulkarni SK (1993) Evidence for benzodiazepine receptor interaction with MK-801 in anxiety related behaviour in rats. Indian J Exp Biol 31: 191–193.
  5. Poleszak E, Wlaz P, Wróbel A, et al. (2008) NMDA/glutamate mechanism of magnesium induced anxiolytic like behavior in mice. Pharmacol Rep 60: 655–663.
  6. Kocahan S, Akillioglu K, Binokay S, et al. (2013) the effects of N-Methyl-D-Aspartate receptor blockade during the early neurodevelopmental period on emotional behaviors and cognitive functions of adolescent Wistar rats. Neurochem Res 38: 989–96.
  7. Pınar N, Akillioglu K, Sefil F, et al. (2015) Effect of clozapine on locomotor activity and anxiety-related behavior in the neonatal mice administered MK-801. Bosn J Basic Med Sci 15: 74–9.
  8. Fraser CM, Fisher A, Cooke MJ, et al (1997) The involvement of adenosine receptors in the effect of dizocilpine on mice in the elevated plus-maze. Eur Neuropsychopharmacol 7: 267–273.
  9. Rowdhwal SS and Chen J (2018) Toxic Effects of Di-2-ethylhexyl Phthalate: An Overview. Biomed Res Int Article ID 1750368, 10.
  10. 10.Lin H, Yuan K, Li L, et al. (2015) In Utero Exposure to Diethylhexyl Phthalate Affects Rat Brain Development: A Behavioral and Genomic Approach. Int J Environ Res Public Health 12: 13696–710.
  11. Carbone S, Szwarcfarb B, Ponzo O, et al. (2010) Impact of gestational and lactational phthalate exposure on hypothalamic content of amino acid neurotransmitters and FSH secretion in peripubertal male rats. Neurotoxicology 31: 747–751.
  12. Carbone S, Samaniego YA, Cutrera R, et al. (2012) Different effects by sex on hypothalamic-pituitary axis of prepubertal offspring rats produced by in utero and lactational exposure to di-(2-ethylhexyl) phthalate (DEHP). Neurotoxicology 33: 78–84.
  13. Liang T, Ouyang J, Yi L, et al. (2013) Behavioral changes of rats after short-term exposure to di-(2-ethyl hexyl) phthalate. J South Med Univ 33: 401–405.
  14. Park S, Cheong JH, Cho SC, et al. (2015) Di-(2-Ethylhexyl) phthalate exposure is negatively correlated with trait anxiety in girls but not with trait anxiety in boys or anxiety-like behavior in male mice. J Child Neurol 30: 48–52.
  15. Quinnies KM, Doyle TJ, Kim KH, et al. (2015) Transgenerational effects of di-(2-ethylhexyl) phthalate (DEHP) on stress hormones and behavior. Endocrinology 156: 3077–3083.
  16. Wang R, Xu X, Weng H, et al. (2016) Effects of early pubertal exposure to di-(2-ethylhexyl) phthalate on social behavior of mice. Horm Behav 80: 117–124.
  17. Carbone S, Ponzo OJ, Gobetto N, et al. (2013) Antiandrogenic effect of perinatal exposure to the endocrine disruptor di-(2-ethylhexyl) phthalate increases anxiety-like behavior in male rats during sexual maturation. Horm Behav 63: 692–69.
  18. Carbone S, Ponzo OJ, Gobetto N, et al. (2018) Effect of di(2-ethylhexyl) phthalate on the neuroendocrine regulation of reproduction in adult male rats and its relationship to anxiogenic behavior: Participation of GABAergic system. Human and Experimental Toxicology 38: 25–35.
  19. Wozniak DF, Olney JW, Kettinger L et al. (1990) Behavioral effects of MK-801 in the rat. Psychopharmacology (Berl) 101: 47–56.
  20. Walfi AA and Frye ChA (2007) The use of the elevated plus maze as an assay of anxiety-related behavior in rodents. Nat Protoc 2: 323–328.
  21. Xu X, Yang Y, Wang R, et al. (2015) Perinatal exposure to di-(2-ethylhexyl) phthalate affects anxiety- and depression-like behaviors in mice. Chemosphere 124: 22–31.
  22. Supornsilchai V, Söder O, Svechnikov K (2007) Stimulation of the pituitary-adrenal axis and of adrenocortical steroidogenesis ex vivo by administration of di-2-ethylhexyl phthalate to prepubertal male rats. J Endocrinol 192: 33–9.
  23. Wang DC, Chen TJ, Lin ML, et al. (2014) Exercise prevents the increased anxiety-like behavior in lactational di-(2-ethylhexyl) phthalate-exposed female rats in late adolescence by improving the regulation of hypothalamus-pituitary-adrenal axis. Horm Behav 66: 674–84.
  24. Quinnies KM, Harris EP, Snyder RW, et al. (2017) Direct and transgenerational effects of low doses of perinatal di-(2-ethylhexyl) phthalate (DEHP) on social behaviors in mice. PLoS One 12: 0171977.
  25. Quinnies KM, Doyle TJ, Kim KH, et al. (2015) Transgenerational Effects of Di-(2-Ethylhexyl) Phthalate (DEHP) on Stress Hormones and Behavior. Endocrinology 156: 3077–83.
  26. King JA, De Oliveira WL, Patel N (2005) Deficits in testosterone facilitate enhanced fear response. Psychoneuroendocrinology 30: 333–40.
  27. Riaza Bermudo-Soriano C, Perez-Rodriguez MM, Vaquero-Lorenzo C, et al. (2012) New perspectives in glutamate and anxiety. Pharmacol Biochem Behav 100: 752–74.
  28. Kew JN, Kemp JA (2005) Ionotropic and metabotropic glutamate receptor structure and pharmacology. Psychopharmacology (Berl) 179: 4–29.
  29. Haberny KA, Paule MG, Scallet AC, et al. (2002) Ontogeny of the N-methyl-D aspartate (NMDA) receptor system and susceptibility to neurotoxicity. Toxicol Sci 68: 9–17.
  30. Kocahan S, Akillioglu K (2013) Effects of NMDA receptor blockade during the early development period on the retest performance of adult Wistar rats in the elevated plus maze. Neurochem Res 38: 1496–500.

An Extensive Research about Nano-Treatments for the Restoration and Conservation of Stone Monuments in Europe Considering Representative Lithotypes

DOI: 10.31038/NAMS.2019214

Abstract

A systematic research was developed in European countries regarding the use of nano-structured suspensions in stone monuments for their consolidation and protection. The treatments were based on nanoparticles suspended in water or alcohol, also in combination with alkoxy silanes. Five cathedrals, in different climatic contests, and one contemporary building were involved in the validation of products. The effectiveness evidenced not only a dependence on the lithotype, but also on environmental constrains. In general, the nano-particles presence enhanced the capacity of the treatments to adhere to stone grains, thus contributing to their effectiveness.

Nano-cathedral general achievements

On the European contest the development of liquid nano-treatments for deteriorated stones was carried out up to the validation in relevant environment in the framework of the H2020 NANO-CATHEDRAL project, concluded on 2018.

The aim of NANO-CATHEDRAL project was developing, on an European scale, new nano-materials, technologies and procedures for the conservation of deteriorated stones in monumental buildings and cathedrals and high value contemporary architecture, with a particular emphasis on the preservation of the originality of materials and on the development of a tailor-made approach to tackle the specific problems related to the different lithotypes. Aggregation of stone monuments representatives of different European climatic regions and different styles and lithotypes were considered.

Nano-additives and nano-structured composites were developed suitable for:

  • Surface consolidation [1-3], occurring thanks to a material that penetrating by capillarity into the micro-structure of the decayed stone, is able to strengthen it by replacing lost original mineral bridges, and partially recovering lost mechanical properties.
  • Surface protection [4-5], occurring thanks to a material that penetrating by capillarity into the micro-structure of the stone, is able to prevent the ingress of liquid water, without any change in aesthetical, optical and chemical properties of the substrate.

The preparation and selection of the nano-structured treatments was carried out with the aim of providing the best technological answer for the preservation of different types of stones found in the selected cathedrals representative of the diversity of European architectural heritage. For reaching the goal of consolidation, water-based formulations based on nano-inorganic or nano-hybrid dispersions such as nano-silica, nano-titania, nano-hydroxyapatite as well as their synergic combinations with organic (e.g. fungal hydrophobins) and inorganic compounds were considered. Stone specimens, both as aged in situ (small or micro-samples) and as obtained on purpose from the original quarries (taken as such or after accelerated aging), was tested before and after application of the consolidation and protection materials to evaluate the effectiveness of the treatment, according to relevant European standard protocols [6], current scientific literature and the development of new in situ testing procedures.

To achieve the goal of stone protection, innovative composites were developed consisting of polymers and nano-fillers; the use of hydrophobins, nano-assembled hydrophobic proteins extracted from fungi [7], was also considered. The nano-structured protective materials were designed to achieve improved soil and water-repellence. In addition, photocatalytic nano-particles were employed in order to favour the decomposition of volatile organic molecules carried by polluted atmosphere and to prevent biofilm growth. The specific requirements for consolidants and protectives are reported in Figure 1. The innovative products were applied on 6 lithotypes (Ajarte fossil limestone, Balegem sandy limestone, Obernkirchen and Schlaitdorf sandstones, St. Margarethen calcareous arenite and Apuan marble) (Figure 2), selected among the stones used in five medieval cathedrals (Vitoria-Gasteiz, Ghent, Cologne, Vienna and Pisa) and a contemporary opera theatre (Oslo Opera House). The six places are also representative of the different European climates and environments (Figure 3).

NAMS 2019-105 - Maria-Beatrice Coltelli Italy_F1

Figure 1. Characteristics of consolidants and protectives

NAMS 2019-105 - Maria-Beatrice Coltelli Italy_F2

Figure 2. Representative stones selected for the experimentation of Nano-Cathedral project

NAMS2019-105-Maria-BeatriceColtelliItaly_F3

Figure 3. Involved European towns and respective monuments

NAMS 2019-105 - Maria-Beatrice Coltelli Italy_F41

Figure 3. Above: SEM micrographs of dried powders of CCNPs from samples P9 (left) and P10 (right) with the corresponding particle size distributions (below; the red line connects the weight averaged frequency, the blue line the volume averaged frequency, from particle counts and sizing obtained through image analysis. Circles evidence “chain-like” assemblies of nano-particles.

Regarding the identification and development of nano-materials, it had the objective to make available nanomaterials formulations suitable as consolidants and protectives for each of the selected lithotypes to the laboratories for the characterization and to the cathedrals for the application (in small scale before and on site later). A list of consolidants and protectives has been preliminary identified and sent to all the monuments foundations responsible of their preservation for further validation. Then, taking into consideration the results provided by the laboratories dedicated to the testing of consolidants and protective treatments participating to the project, a selection was done. The selected products are reported in Table 1.

Table 1. Products selected for experimentations on the monument stones

Products selected for the validation in situ on specific lithotypes

Product internal code

Producer

Type

ZG 12 (SiO2 in Ethanol/Water)

NC-12C

COLOROBBIA

CONSOLIDANT

ZR110 (ZrO2 in water)

NC-29C

TECNAN

CONSOLIDANT

HFES 70 (Si Polymer matrix with TiO2 from Tecnan))

NC-25C

CHEMSPEC

CONSOLIDANT

HFES 90 (Si Polymer matrix with TiO2 from Tecnan))

NC-27CP

CHEMSPEC

CONSOLIDANT

PFA (Si Polymer matrix with TiO2 from COLOR))

NC-21P

CHEMSPEC

PROTECTIVES

photocatalytic

PFMS5 (Si Polymer matrix with TiO2 from COLOR)

NC-22P

CHEMSPEC

PROTECTIVES

photocatalytic

Antibacterial TECNAN (ZnO/Ag)

NC-32P

TECNAN

PROTECTIVES

Anti-fouling

P01_INSTM

NC-36P

INSTM

PROTECTIVES

hydrorepellent

Four consolidants were tested onto monuments based on nano-silica (ZG 12), nano-zirconia (ZR110), or nanotitania in presence of alkoxy silanes less (HFES 70) or more (HFES90) hydro repellent. They were compared with tetra theoxy silane (TEOS) as it is the most known and used consolidant. Four protectives were selected for testing onto monuments: two photocatalytic products acting against pollution to maintain clean the stones Some more nano-structured materials were also developed in the project activities. Regarding consolidants, nano-calcite was produced using a pilot reactor [8]. The preparation of water suspensions of calcite nanoparticles (CCNPs) was carried out using a pilot-scale reactor by controlled carbonation of slaked lime. A simplified design of experiment was adopted for product optimization. Calcite nanoparticles of narrow size distribution averaging about 30 nm were successfully obtained, the concentration of the interfacial agent and the size of CaO being the most critical parameters. Primary nanoparticle aggregation causing flocculation could be substantially prevented by the addition of polymeric dispersants. Copolymer-based dispersants were produced in situ by controlled heterophase polymerisation mediated by an amphiphilic macro-RAFT (reversible addition-fragmentation transfer) agent. The stabilized CCNP aqueous dispersions were then applied on carbonate and silicate substrates; Scanning Electron Microscopy (SEM) analysis of cross-sections allowed the evaluation of pore penetration, interfacial binding, and bridging (gap-filling) properties of these novel consolidants.

The effectiveness of the obtained nanocalcite suspensions as potential consolidants for deteriorated calcareous and siliceous stone substrates was investigated in preliminary experiments, in which the CCNP aqueous dispersions were applied onto model porous substrates. Stratigraphic SEM analyses have shown only partial and irregular product penetration within the porous network, but also good adhesion of the precipitated CCNPs, as shown by the effective formation of bridges efficiently connecting stone grains. Shrinkage of the consolidating film upon drying was almost negligible in the treated Au limestone and only moderate in the silicate samples. The uneven CCNP distribution throughout the porous stone network, along with local accumulation of the consolidant at the edges of the treated stone specimens, was ascribed to rapid evaporation of the treating solution; in order to overcome this problem, a more thorough investigation to define the best application protocol will be required.

It is worth pointing out that further improvements concerning both the CCNP production process and their colloidal stabilization or even encapsulation with suitably designed copolymers may further improve the elasticity and cohesivity of the nanoparticle-built bridges within the pores. The results obtained so far, while limited to the application on only two reference substrates, do not yet allow the anticipation of a significant short-term strengthening effect of the CCNPs, in particular because of the observed low penetration depth and the lack of scientific studies regarding the chemical bonding of calcite nanoparticles with either carbonate or siliceous substrates. Thus, while some reduction of the overall porosity could be achieved, proper mechanical strengthening still needs to be confirmed.

Regarding Hydrophobic treatments, semi fluorinated water born polymers, designed and prepared to induce a nanostructured internal morphology in the polymer particles, with a hydrophobic semi fluorinated core and a hydrophilic-shell rich in either nonionic oligoethyleneoxide or anionic oligo(acrylic acid) chain end segment, were characterized (P01_INSTM). The Laboratory application and validation produced an extensive and sound information on the performance of the most promising nano systems (consolidants and protective treatments) applied on the selected lithotypes. After a pre-selection of the products and the preparation of the laboratory samples, the application of the most promising nano systems as well as selected reference products and their full validation was carried out within the second period of the project.

As laboratory-produced specimens can never mimic the full range of decay phenomena found on-site, small-scale consolidation and protective treatments have been performed by experienced conservators from the project team on pilot areas of the five cathedral sites and of the Oslo Opera House (here only protective treatments).

Artificial ageing tests were carried out on stone specimens treated with selected consolidants and protective coatings. Besides, the evaluation of the durability of these treatments, conducted through artificial ageing protocols, allowed to make an experimental assessment of their response towards environmental exposure, with overall encouraging results.

All necessary information from the sites, including the results gained by the laboratory analysis of samples extracted as small scaled drill cores by in situ lithotype sampling was collected to prepare detailed operational guidelines for the preparation of sites. These guidelines should ensure a structured cleaning procedure for various stone surfaces before starting the in situ application of the products. In order to have the stone surfaces freshly prepared for application, the preparation of the trial areas was performed in timely proximity to the availability of the products determined as the final selection of testing materials. The validation of in situ treatments at each site started one month after the application process. In beforehand, to assess the performance of the selected products before the product application, a protocol of control tests was set up, including colour measurements, water absorption by contact sponge and karsten tubes, drilling resistance, microscopic and macroscopic observations and microclimatic monitoring. After application, the treatment evaluation at the trial areas was carried out according to this protocol.

To summarize the outcome of the extensive validation work is complex. An overall conclusion towards the new developed products and nano composites can be, that the nano particles in solution confer slighter improvements in the treated substrates than the micro particles; nevertheless, the acceptable results obtained during the project are in need of further research. In general, the validation results achieved after the products application on site are only partially in accordance with the validation results from the laboratory tests; moreover, application of identical products on the same lithotype but in different areas of the building, delivered results. For each lithotype the outcome must be evaluated on its own, considering the decay extension and the physical features, as well as the allocation and background parameters. HFES70 (based on nano-titania particles and TEOS) seemed the consolidant suitable for general use, as it resulted acceptable onto silicate stones but it scarcely formed bridges between stone grains, whereas nano-silica in ethanol (NC-12C) has the general defect of less penetration but is more efficient in bridges formation.

Regarding metamorphic stone consolidation, only the combination of nano-silica and TEOS consolidants achieved very good results. As for the sedimentary stones, the results vary considerably from site to site and must be assessed individually; for this type of stones the nano silica in combination with TEOS appeared to be the most suitable product in terms of cohesion, nonetheless the visual compatibility, for instance, must be improved. Apart from this product, the other combinations of TEOS with nano titania showed only good results in Ajarte. The selected protectives based on nano-titania resulted very promising, both on sedimentary and metamorphic stones. The anti-fouling product was compatible with all lithotypes where it was applied (some sedimentary stones). The innovative protective based on acrylic semi-fluorinated copolymer resulted only partially effective on the sedimentary stones.

Conclusion

The use of nano-structured liquid treatments containing nanoparticles was investigated for application in decayed stones of cultural heritage on an European scale in the framework of H2020 Nano-Cathedral project. New consolidants and protectives were produced for stone monuments and tested onto selected representative lithotypes in laboratory. Many of them were used in successive validation studies onto monuments, where their effectiveness evidenced not only a dependence on the lithotype, but also on environmental constrains. Some other nanostructured treatments were developed up to a lower readiness level, but resulted promising, such as nano-calcite nano-particles. In general, the nano-particles presence enhanced the capacity of the treatments to adhere to stone grains, thus contributing to the effectiveness of the treatments.

Acknowledgements

This research was carried out in the frame of the EU-H2020 project “Nanomaterials for conservation of European architectural heritage developed by research on characteristic lithotypes (NANO-CATHEDRAL)”, GA 646178.

References

  1. Dohene E, Price CA, Stone Conservation. (2010) An Overview of Current Research, Getty Conservation Institute, LA (USA).
  2. Mosquera M.J, de los Santos D.M, Montes A, Valdez-Castro L. (2008) New nanomaterials for consolidating stones. Langmuir, 2772–2778.
  3. Ban M, Mascha E, Weber J, Rohatsch A, Delgado Rodrigues J. (2019) Efficiency and Compatibility of Selected Alkoxysilanes on Porous Carbonate and Silicate Stones, Materials 156.
  4. Gherardi F, Goidanich, S., Toniolo, L. (2018) Improvements in marble protection by means of innovative photocatalytic nanocomposites, Progress in Organic Coatings, 13–22.
  5. Roveri M, Raneri S, Bianchi S, Gherardi F, Castelvetro V, et al. Electrokinetic Characterization of Natural Stones Coated with Nanocomposites for the Protection of Cultural Heritage, Applied Sciences, 194.
  6. CEN/TC 346WG3 Evaluation conservation works methods & products for on porous inorganic materials constituting cultural heritage.
  7. Boeuf S, Throm T, Gutt B, Strunk T, Hoffmann M, et al. (2012) Acta Biomaterialia 1037–1047.
  8. Coltelli MB, Paolucci D, Castelvetro V, Bianchi S, Mascha E, et al. (2018) Preparation of Water Suspensions of Nanocalcite for Cultural Heritage Applications, Nanomaterials 254.

Renal Mucinous Tubular and Spindle Cell Carcinoma: A Report of Two Cases and Literature Review

DOI: 10.31038/CST.2019443

Abstract

Mucinous tubular and spindle cell carcinoma (MTSCC) is a rare type of epithelial renal tumor considered as a low-grade neoplasm by the World Health Organization. Therefore, partial or radical nephrectomy may be curative whether in early stages. Less than a hundred of these tumors have been reported with gross and microscopic features, immunohistochemical profile and clinical findings. Here we report two cases of MTSCC with emphasis on the clinicopathological correlations according to postoperative findings. Both patients underwent a video-assisted resection of the kidney. No recurrence or metastasis was observed during the follow-up.

Keywords

Renal Mucinous Tubular and Spindle cell Carcinoma, Renal Cell Carcinoma, Pathology

Introduction

Mucinous tubular and spindle cell carcinoma (MTSCC) is a histological type of renal carcinoma endorsed as an entity in 2004 by the World Health Organization (WHO) [1]. It accounts for less than 1% of all kidney tumors and shows a higher prevalence in women. Until 2015, there were less than 100 cases reported in the literature [2–6]. MTSCC may be associated with monosomy 1, 4, 6, 8, 13 or 14 and trisomy 7, 11, 16 or 17. Microscopically, the neoplasm is characterized tubular growth pattern of uniform cuboidal cells with eosinophilic cytoplasm which transition to anastomosing spindle cells in a myxoid and bubbly with abundant extracellular mucin stroma [1,2,4–11]. MTSCC is a low malignant potential cancer that rarely relapses or metastasizes [5,12].

We present two cases of mucinous tubular and spindle cell carcinoma diagnosed and treated in a high complexity Brazilian hospital.

Case Presentation

Case One

A 61-year-old, previously healthy woman attended to the urology outpatient clinic due to an incidental image finding. An abdominal CT scan had shown a 2-cm nodular mass in the upper pole of the left kidney. The physical examination was normal. Laboratory studies and renal function tests showed no changes. Video-assisted left radical nephrectomy and perihilar lymphadenectomy were performed. The gross examination revealed a well-circumscribed grayish-white tumor confined to the atrophic kidney (figure 1). No renal vein invasion was detected. Microscopic examination of the mass showed low nuclear grade cells with focally vacuolated eosinophilic cytoplasm and spindle cells organized in long tubular profiles. Some clusters of foamy macrophages were present and extracellular mucin was highlighted by Alcian blue stain (figure 2). No sarcomatoid features were seen. Immunohistochemistry reactions were performed and the cells stained for CK7 and alphamethylacyl-CoA racemase (AMACR) and showed negativity for vimentin and CD10 (table 1). In conclusion, the diagnosis of a mucinous tubular and spindle cell carcinoma was stated. No metastasis was present in the lymph node submitted for evaluation. The patient has been on follow-up for 2 years and had no complaints. Imaging exams have not detected abnormalities.

CST 2019-120 - Bruno de Carvalho Brazil_f1

Figure 1. Gross appearance of MTSCC. The tumor is well-circumcribed with a homogeneous, well-circumscribed grayish-white cut surface. Notice the atrophic parenchima.

CST 2019-120 - Bruno de Carvalho Brazil_f2

Figure 2. Microscopic appearance of MTSCC.

Case Two

A 71-year-old woman was admitted in the Emergency Room. She has had moderate left flank pain that radiated to the chest and left leg over the past 6 months. On a scale of 1 to 10, the pain was 6. She also complained about dysuria. No weight-loss had been noticed. She had a long-term smoking history and had received irregular treatment for systemic arterial hypertension. On physical examination, her temperature was normal and blood pressure was 140/90 mmHg. There was pain on deep left flank palpation. An abdominal ultrasound showed a 4.7-cm nodular mass suspected of malignancy in the left kidney. A partial video-assisted nephrectomy was performed. On the specimen’s gross examination, a pushing border nodular tumor was found. It measured up to 3.8 cm in diameter and was yellowish. No renal vein invasion was detected. Microscopic examination of the tumor revealed Fuhrman grade 1 nucleus low cuboidal and spindle cells arranged in tubular or cord-like growth pattern (figure 3). Stroma was myxoid and bubbly (figure 4). No sarcomatoid features were present. Immunohistochemistry reactions were performed and the cells stained for CK7 and AMACR and vimentin (table 1). The pathological findings sustained the diagnosis of a mucinous tubular and spindle cell carcinoma. The patient has been on annual follow-up for 5 years and imaging exams have not detected signs of relapsed disease or metastasis.

CST 2019-120 - Bruno de Carvalho Brazil_f3

Figure 3. Microscopic features of MTSCC.

CST 2019-120 - Bruno de Carvalho Brazil_f4

Figure 4. Stroma microscopic findings.

Table 1. Immunophenotypic Profile of Renal Mucinous Tubular and Spindle Cell Carcinoma

VIM

CD10

CK7

HMWCK

AMACR

Case 1

+

+

+

Case 2

+

+

+

+

VIM, vimentin; HMWCK, high-molecular weight cytokeratin; AMACR, alpha-methyl CoA racemase

Discussion

We present two cases of mucinous tubular and spindle cell renal cell carcinoma affecting two elderly women. MTSCC has a wide age distribution which ranges between 13 to 82 years old and an average of 53 years old. There are a female predominance and a 1: 4 man to women ratio [4,6,13,14,15].

MTSCC is a renal epithelial neoplasm characterized by tubular formations merging with bland spindle cells and a myxoid stroma [5,16]. Proper histological classification is essential for a better understanding of this tumor which has already been characterized and distinguished from other renal cell carcinomas (RCC) through immunohistochemical and cytogenetic studies [17]. The vast majority of these renal neoplasms are low grade [13]. However, sarcomatoid differentiation implies in a deleterious prognosis and requires a closer clinical and radiological follow-up [18]. Clinically, most patients present with asymptomatic masses found accidentally by ultrasound [19]. Even though, some MTSCC can manifest as flank pain, hematuria, abdominal mass and systemic repercussions such as fever, anorexia and weight loss [4,15,18 20].

On gross examination, mostly occur as a solid mass in the renal cortex and are partially encapsulated. The cut surface is usually shiny, bulging and mucoid and shows pale, grey or homogenous tan colors [5,6,14].

Microscopic sections feature a renal epithelial neoplasm with variable components of tubular or cord-like growth architecture, spindle cell areas and extracellular basophilic mucinous stroma [6,10,13]. Necrosis, mucin-poor stroma, cellular pleomorphism, and high nuclear grade are uncommon. Hardly, MTSCC can present aggressive local growth and spread distant metastasis to liver and retroperitoneal lymph nodes [6,14,20]. Based on extracellular mucin, MTSCC splits into two categories: classic (abundant extracellular mucin stroma) and mucin-poor (little or no extracellular mucin stroma). Mucinous stroma stains blueish to Alcian blue and colloidal iron [4,14].

Immunohistochemical studies confirm that both cuboidal and spindle cells are positive for PAX2/8, epithelial membrane antigen (EMA), low molecular weight cytokeratins (CK8/18, CK19, and CK7), E-cadherin and AMACR. Vimentin and high molecular weight cytokeratin (34BE12) staining show variable expressions. CD10, CD15, and RCC marker are usually positive in other RCC variants and frequently negative in MTSCC [4–6,8,9,14,15,18]. Immunohistochemical characteristics of both cases we reported are summarized in table 1.

Classic MTSCC offers no diagnosis challenges. On the other hand, mucin-poor MTSCC is often misdiagnosed as mesenchymal neoplasms (e.g. inflammatory myofibroblastic tumor) which tend to present elongated nuclei, distinct fascicular arrangement and rarely label cytokeratins strongly. Papillary RCC is another differential diagnosis to be considered which usually has round cells, variable atypia and predominant tubulopapillary pattern and no extracellular mucin. Immunocytochemistry is usually useless [13,15,21]. Classical morphology and complete surgical excision correlate with favorable prognosis. Nevertheless, sarcomatoid features must be reported because they may indicate an aggressive course [5,6,10,15]. A close follow-up is recommended for all MTSCC [5,6].

Conclusion

In summary, we report two cases of mucinous tubular and spindle cell renal cell carcinoma. We consider MTSCC to be a low-grade carcinoma. Although the follow-up for our two cases was favorable, precaution is warned given the small number of reported MTSCC and the fact that some have metastasized. The current study also highlights that additional clinicopathological expertise with these renal tumors is necessary to comprehend their biological behavior.

Authorship

Queiroz, GA and Silva, WNT collected data, reviewed the literature, analyzed the data and wrote the manuscript; Sudo, RSL and Oliveira, TJ participated in the literature review and helped to write the manuscript; Dornelas, BC designed the project, collected data, reviewed the literature and revised the manuscript. All authors have read and approved the final manuscript.

Funding information: The authors declare that they have no funding

Units of Measurement: Measurements of length: centimeter (cm)

Abbreviations & Symbols

MTSCC: mucinous tubular and spindle cell carcinoma

WHO: World Health Organization

RCC: renal cell carcinomas

VIM: vimentin

HMWCK: high-molecular weight cytokeratin

AMACR: alpha-methyl CoA racemase

References

  1. Lopez-Beltran, Scarpelli M, Montironi R, Kirkali Z. (2006) 2004 WHO classification of the renal tumors of the adults. European urology 5: 798–805.
  2. Moch H, Cubilla A. L, Humphrey P. A, Reuter V. E, Ulbright T. M. (2016) The 2016 WHO classification of tumours of the urinary system and male genital organs. European urology 1: 37.
  3. Trabelsi A, Stita W, Yacoubi M. T, Rammeh S, Hmissa S, et al. (2008) Renal mucinous tubular and spindle cell carcinoma. Canadian Urological Association Journal 6: 635.
  4. Sun N, Fu Y, Wang Y, Tian T, An W, et al. (2013) Mucinous tubular and spindle cell carcinoma of the kidney: A case report and review of the literature. Oncology letters 3: 811–814.
  5. Zhao M, He X. L, Teng X. D. (2015). Mucinous tubular and spindle cell renal cell carcinoma: a review of clinicopathologic aspects. Diagnostic pathology 1: 168.
  6. Nathany S, Monappa V. (2019) Mucinous Tubular and Spindle Cell Carcinoma: A Review of Histopathology and Clinical and Prognostic Implications. Archives of pathology & laboratory medicine.
  7. Chen Q, Gu Y, Liu B. (2015) Clinicopathological characteristics of kidney mucinous tubular and spindle cell carcinoma. International journal of clinical and experimental pathology 1: 1007.
  8. Shen S, Ro J. Y, Tamboli P, Truong L. D, Zhai Q, et al. (2007) Mucinous tubular and spindle cell carcinoma of kidney is probably a variant of papillary renal cell carcinoma with spindle cell features. Annals of diagnostic pathology 1: 13–21.
  9. Kuroda N, Nakamura S, Miyazaki E, Hayashi Y, Taguchi, T, et al. (2003) Low-grade tubular-mucinous renal neoplasm with neuroendocrine differentiation: A histological, immunohistochemical and ultrastructural study. Pathology international 3: 201–207.
  10. Rakozy C, Schmahl G. E, Bogner S, Störkel, S. (2002) Low-grade tubular-mucinous renal neoplasms: morphologic, immunohistochemical, and genetic features. Modern Pathology 11: 1162.
  11. Marks-Jones D. A, Zynger D. L, Parwani A. V, Cai, G. (2009) Fine needle aspiration biopsy of renal mucinous tubular and spindle cell carcinoma: report of two cases. Diagnostic cytopathology 1: 51–55.
  12. Pacchioni D, Volante M, Casetta G, Sapino A, Marchiò C, et al. (2007) Myxoid renal tumor with myoepithelial differentiation mimicking a salivary gland pleomorphic adenoma: description of a case. The American journal of surgical pathology 4: 632–636.
  13. Owens C L, Argani P, Ali S. Z. (2007) Mucinous tubular and spindle cell carcinoma of the kidney: cytopathologic findings. Diagnostic cytopathology 9: 593–596.
  14. Ursani N. A, Robertson A. R, Schieman S. M, Bainbridg T, Srigley J. R. (2011) Mucinous tubular and spindle cell carcinoma of kidney without sarcomatoid change showing metastases to liver and retroperitoneal lymph node. Human pathology 3: 444–448.
  15. Du J. H, Zhang L, Liang Z. (2018) Huge mucinous tubular and spindle cell carcinoma of kidney: A rare case report and literature review. Medicine 43.
  16. Eble, J. N. (2004) World Health Organization classification of tumours. Pathology and Genetics. Tumours of the Urinary System and Male Genital Organs 10.
  17. Ferlicot S, Allory Y, Compérat E, Mege-Lechevalier F, Dimet S, et al. (2005) Mucinous tubular and spindle cell carcinoma: a report of 15 cases and a review of the literature. Virchows Archiv 6: 978–983.
  18. Simon R. A, di Sant’Agnese, P. A, Palapattu, G. S, Singer, E. A, Candelario, et al. (2007) Mucinous tubular and spindle cell carcinoma of the kidney with sarcomatoid differentiation. International journal of clinical and experimental pathology 2: 180.
  19. Eble JN and Young RH (2007) Tumors of the urinary tract. In: Diagnostic Histopathology of Tumors. Fletcher CDM (ed), 3rd edition. Churchill Livingstone, Edinburg 537.
  20. Parwani A. V, Husain A. N, Epstein J. I, Beckwith J. B, Argani, P. (2001) Low-grade myxoid renal epithelial neoplasms with distal nephron differentiation. Human pathology 5: 506–512.
  21. Fine S. W, Argani P, DeMarzo A. M, Delahunt, B, Sebo, et al. (2006) Expanding the histologic spectrum of mucinous tubular and spindle cell carcinoma of the kidney. The American journal of surgical pathology 12: 1554–1560.

Metastatic Prostate Cancer to the Renal Pelvis and Proximal Ureter: A Case Report and Review of the Literature

DOI: 10.31038/CST.2019442

Abstract

Prostate cancer metastases are commonly seen in the skeleton, lymph nodes, lungs, or liver, and are associated with a poor five-year survival rate. Renal pelvis and ureteral metastasis are exceedingly uncommon and can present with obstructive symptoms or as an asymptomatic mass on imaging. We report the case of a 60-year-old patient who was initially diagnosed with prostate adenocarcinoma and experienced eventual metastasis to the right renal pelvis and proximal ureter. Following the diagnosis, he was started on docetaxel and pembrolizumab as part of a clinical trial protocol. A high index of suspicion and thorough metastatic work-up is necessary when patients with prostate cancer present with symptoms of obstructive uropathy or new visceral disease is identified.

Key Words

Prostate Cancer, Hydronephrosis, Ureteral metastasis, Renal Pelvis Metastasis, Metastatic Prostate Cancer

Introduction

Prostate adenocarcinoma (PCa) is currently the second most common cause of cancer in men worldwide. In 2019, there were an estimated 174,650 new cases and 31,620 deaths attributed to prostate cancer in the United States [1]. Although the incidence of low-risk prostate cancer between 2007 and 2013 decreased to 37% less than that of 2004, the annual incidence of metastatic prostate cancer (mPCa) during the same period increased by 72% [2]. At diagnosis, 12% of prostate cancer cases have spread to regional lymph nodes, and 5% have distant metastases. Distant spread portends a poor prognosis, with a 5-year relative survival rate of only 29.8% [3]. Classically, prostate cancer is associated with skeletal metastases. Visceral organ involvement is most often seen in the lungs and liver, with other sites quite rare. In this light, we report the case of a patient who was diagnosed with prostate adenocarcinoma, with eventual metastasis to the right renal pelvis and proximal ureter.

Case Report

The patient is a 60-year-old African American man who was found to have an elevated prostate specific antigen (PSA) of 34.0 ng/mL during routine screening by his primary care physician in early 2009. He did not follow-up until re-screening in 2011, at which time he was found to have a PSA of 315.86. Transrectal ultrasound guided prostate biopsy at that time revealed high-risk adenocarcinoma of the prostate with a Gleason score 4 + 5 = 9 involving 40% of the submitted tissue (Figure 1). Metastatic workup consisting of bone scan showed a questionable area in the cervical spine, but follow-up magnetic resonance imaging (MRI) revealed simply degenerative disk disease in the cervical spine and no evidence of metastatic disease. He was then started on androgen deprivation therapy with leuprolide and bicalutamide with a PSA nadir of 0.63 ng/mL in April 2012. Later that year, his PSA values began to rise, but restaging scans remained negative for metastatic disease. At this time, he received external beam radiation therapy to the pelvis, prostate, and seminal vesicles to a total dose of 7920 cGy over 4 months, completing in March 2013. Despite an initial improvement, he experienced subsequent increase in his PSA, and antiandrogen withdrawal (bicalutamide) was performed at the end of 2013.

CST 2019-119 - Eric A_f1

Figure 1. Prostate needle core biopsy with prostatic adenocarcinoma, Gleason score 4+5=9, involving 40% of submitted tissue (original magnification x200)

In 2014, the patient presented to the ED with gross hematuria. Computed tomography (CT) urogram was unremarkable. On cystoscopy, the bladder mucosa showed changes consistent with radiation cystitis. At this time, his PSA was 0.78 ng/mL, where it remained stable for approximately 2 years. When it rose to a level of 7.19 ng/mL in January 2017, he was started on enzalutamide. On restaging scan in July 2017, a new right renal pelvis mass was identified, which was confirmed with a subsequent MRI of the abdomen in September. The 3.7 cm enhancing mass was seen in the right renal pelvis extending and obstructing the proximal right ureter, causing severe right hydronephrosis. A contiguous 1.6 cm nodule was also seen along the inferior aspect of the right renal pelvis (Figure 2). A nephrostomy tube was placed to relieve the hydronephrosis. Ureteroscopic biopsy of this lesion was attempted in early October 2017 but was not feasible due to stenosis of his right distal ureter, likely due to his prior external beam radiation. A right ureteral stent was placed at that time with the goal of removing his nephrostomy tube. He underwent CT guided fine needle aspiration and core biopsy of this right renal pelvis mass on 10/30/17. The biopsy showed poorly differentiated metastatic prostate adenocarcinoma (Figure 3). By immunohistochemistry, the tumor cells are positive for NKX3.1, PSA and Prostein, while negative for CK7, CK20, PAX8 and GATA3, consistent with mPCa. Following this diagnosis, he was started on docetaxel and pembrolizumab as part of a clinical trial.

CST 2019-119 - Eric A_f2

Figure 2. Transverse (A) and coronal (B) images of MRI of the abdomen revealing the right renal pelvis mass causing severe hydronephrosis of the right kidney

CST 2019-119 - Eric A_f3

Figure 3. (A) Right renal pelvis core needle biopsy showing mPCa on H&E, confirmed by NKX3.1 immuno histochemical stain (B) (original magnification x200)

Discussion

In 74,826 patients with metastatic prostate cancer from 1998 to 2010, the most common sites of spread were to the bone (84%), distant lymph nodes (10.6%), liver (10.2%), and thorax (9.1%) [4]. At a more local level, prostate cancer can also invade the seminal vesicles, bladder, and rectum, in addition to regional lymph nodes [5]. Renal pelvis and ureteral metastases are quite rare, with less than 50 such cases reported in the literature [6]. The low incidence is hypothesized to be a result of the lymphatic circulation of the ureter is segmental and drains diagonally or transversely, with no continuous longitudinal lymphatic network draining directly from the prostatic region [7]. More commonly, metastases to the ureters and renal pelvis originate from breast, gastric, or colon cancer [8].

Before the development of advanced imaging and ureteroscopic techniques, ureteral metastases were most often incidental findings on autopsies [9]. Approximately 85% of these ureteral metastases were asymptomatic at diagnosis and most of them are identified in patients with known prostate cancer [10]. In symptomatic patients, the symptoms mimic other renal pelvic and ureteral tumors, with flank pain and hematuria being the most common. The diagnosis can be made via a traditional ureteroscopic evaluation and biopsy [11]. However, this was not feasible in our patient due to ureteral stenosis. Zhang et al. reported their experience with a similar patient having a distal ureteral stricture which prevented a biopsy done via an endoscopic approach [12]. Although a nephroureterectomy was performed in that patient given the concern for urothelial carcinoma of the ureter, the final pathology revealed mPCa. This highlights the importance of establishing a pathologic diagnosis from a biopsy when there is a possibility that a ureteral lesion is of metastatic origin.

The low incidence of mPCa to the ureters and renal pelvis is hypothesized to be a result of the lymphatic circulation of the ureter, which is segmental and drains diagonally or transversely, with no continuous longitudinal lymphatic network draining directly from the prostatic region.7 One proposed mechanism for metastasis involves dissemination of malignant cells to the retroperitoneal lymph nodes near the ureter via the periureteral lymphatic pathway [13]. Yonneau et al. further added that the secondary tumor develops from the adventitia prior to invading the ureteric wall [14]. This differs from the proposed mechanism for prostate cancer metastasis to the renal parenchyma, which is attributed to the spread of tumor emboli in the arterial system to the highly vascular kidneys [5]. Singh et al. mention preceding genitourinary tract instrumentation, including urethral catheterization or cystoureteroscopy, as a risk factor for urothelial seeding [15]. Thus, in patients with pCa and clinical signs such as hydronephrosis or symptoms such as flank pain and hematuria, workup for ureteral metastases may be warranted, especially when there is a history of prior urinary tract instrumentation.

In 2004, Milbank et al. described percutaneous resection to manage symptomatic obstruction from mPCa to the renal pelvis in two patients, a technique that resulted in complete relief of symptoms and obstruction [16]. Open operative intervention is not ideal in a patient population with metastatic disease, and angioinfarction is of unlikely benefit as these lesions are not of a parenchymal origin. Chronic internal stenting or nephrostomy tube placement are viable low-risk options, but they can compromise patients quality of life [17]. While the two patients in Milbank’s report ultimately died of mPCa, percutaneous resection may be a worthwhile consideration when performed by experienced surgeons in carefully selected patients.

Despite progression to castration resistance, a subset of patients may not harbor detectable metastasis by traditional imaging techniques, and therefore are categorized as having non-metastatic castration resistant prostate cancer (M0 CRPC). This was initially the case with our patient. Similar patients with M0 CRPC are at high risk for progression to metastatic disease, as 15% to 33% develop metastasis within 2 years [18]. In 2017, the American Society of Clinical Oncology issued a provisional clinical opinion that stated patients with radiographic evidence of metastases and minimal symptoms should be offered enzalutamide or abiraterone plus prednisone after weighing potential harms, benefits, costs, and patient preferences [19]. However, newer positron emission tomography (PET) imaging-based tracers were not used in these studies, and it is possible that a subset of these men had metastases that were not detectable by the limits of conventional CT imaging and nuclear bone scan [18]. This may have been the case in our patient, who eventually developed metastasis to the renal pelvis within a year of starting enzalutamide.

Conclusions

A small portion of men with advanced prostate cancer may develop metastasis to atypical sites, such as the renal pelvis and ureter. Thus, oncologists must have a high index of suspicion when prostate cancer patients are found to have ureteral/renal pelvis masses causing hydronephrosis. Biopsy of the metastatic site should be considered if extirpative surgery, or a change in hormonal/systemic therapy, is being considered [20]. While a considerable amount of research has been devoted to the treatment of mPCa, the response of these treatments in the setting of metastatic disease to the renal pelvis and ureter is not clear.

Funding: This work is supported by a grant from the National Cancer Institute (P30CA072720).

Disclosure: EA Singer receives research support from Astellas/Medivation.

References

  1. Siegel RL, Miller KD, Jemal A (2019) Cancer statistics, CA Cancer J Clin 69: 7–34.
  2. Weiner AB, Matulewicz RS, Eggener SE, Schaeffer EM (2016) Increasing incidence of metastatic prostate cancer in the United States (2004–2013). Prostate Cancer Prostatic Dis 19: 395–397.
  3. Institute NC. (2018) Cancer stat facts: prostate cancer. Surveillance, Epidemiology, and End Results (SEER) Program Research Data (1973–2015).
  4. Gandaglia G, Abdollah F, Schiffmann J (2014) Distribution of metastatic sites in patients with prostate cancer: A population-based analysis. Prostate 74: 210–216.
  5. Khan F, Mahmalji W, Sriprasad S, Madaan S (2013) Prostate cancer with metastases to the kidney: a rare manifestation of a common disease. BMJ Case Rep.
  6. Morales I, Bassa C, Pavlovic A, Morales C (2016) Ureteral Metastasis Secondary to Prostate Cancer: A Case Report. Urol Case Rep 5: 4–5.
  7. Zhang T, Wang Q, Min J (2014) Metastasis to the proximal ureter from prostatic adenocarcinoma: A rare metastatic pattern. Can Urol Assoc J 8: E859–861.
  8. Haddad FS (1999) Metastases to the ureter. Review of the world literature, and three new case reports. J Med Liban 47: 265–271.
  9. Schneider S, Popp D, Denzinger S, Otto W (2012) A rare location of metastasis from prostate cancer: hydronephrosis associated with ureteral metastasis. Adv Urol 656023.
  10. Hulse CA, O’Neill TK. (1989) Adenocarcinoma of the prostate metastatic to the ureter with an associated ureteral stone. J Urol 142: 1312–1313.
  11. Otta RJ, Gordillo C, Fernandez I (2015) Ureteral metastasis of a prostatic adenocarcinoma. Can Urol Assoc J 9: E153–155.
  12. Zhang D, Li H, Gan W (2016) Hydronephrosis associated with ureteral metastasis of prostate cancer: A rare case report. Mol Clin Oncol 4: 597–598.
  13. Chung HS, Kim MS, Cho YH (2017) A rare presentation of metastatic prostate cancer, initially a suspect for urothelial cell carcinoma of the ureter: a case report. BMC Urol 17: 37.
  14. Yonneau L, Lebret T, Herve JM, Barre P, Lugagne PM, et al. (1999) [Isolated ureteral metastasis of prostatic adenocarcinoma. Apropos of a case]. Prog Urol 9: 118–121.
  15. Singh G, Tiong HY, Kalbit T, Liew L (2009) Urothelial metastasis in prostate adenocarcinoma. Ann Acad Med Singapore 38: 170–171.
  16. Milbank AJ, Savage SJ, Angermeier KW, Ng CS, Streem SB (2004) Metastatic cancer to the renal pelvis: a novel approach to management. Urology 64: 807–809.
  17. Farber N, Salib A, Shinder B, Modi P, Elsamra S, Singer E (2017) American College of Surgeons Evidence-Based Decisions in Surgery: Management of Malignant Upper Urinary Tract Obstruction. Committee on Surgical Palliative Care.
  18. Ritch C, Cookson M (2018) Recent trends in the management of advanced prostate cancer. F1000Res 7.
  19. Virgo KS, Basch E, Loblaw DA (2017) Second-Line Hormonal Therapy for Men With Chemotherapy-Naive, Castration-Resistant Prostate Cancer: American Society of Clinical Oncology Provisional Clinical Opinion. J Clin Oncol 35: 1952–1964.
  20. Mottet N, Bellmunt J, Bolla M (2017) EAU-ESTRO-SIOG Guidelines on Prostate Cancer. Part 1: Screening, Diagnosis, and Local Treatment with Curative Intent. Eur Urol 71: 618–629.