Author Archives: author

Towards COVID-19 Prophylaxis: An AIDS Preclinical Research Perspective

DOI: 10.31038/CST.2020525

Abstract

The success of an antiviral drug depends on its potency to neutralize the virus in vitro and its ability after administration in vivo to reach the anatomic compartments that fuel viral dissemination in the body. For instance, remdesivir, a potent SARS-CoV-2 antiviral drug based on studies in vitro, if administered orally would be poorly effective because low drug levels would reach the lungs due to its high first pass destruction in the liver. This is the reason remdesivir can only be administered intravenously, a requirement that clearly limits its use as a prophylactic agent for COVID-19, although novel formulations for its easier administration are under development. Whether an antiviral prophylaxis could further control or even stop the COVID-19 epidemic in synergy with other non-pharmacological based mitigation strategies is today unknown. Since the mid-1960s, pharmacologists have investigated the use of lipid-based nanoparticles for efficient delivery of antivirals to tissues, for example by transforming the route of administration from intravenous to oral, subcutaneous or aerosol administrations. These novel encapsulation strategies have also the potential to maintain high levels of the antiviral drugs in tissues, with reduced dose frequency compared to the non-encapsulated drug. Several lipid-based nanoparticles are today approved by the US Food and Drug Administration or being tested in clinical studies with favorable toxicity profiles.

Nonhuman primate models of coronavirus infection offer unique platforms to accelerate the search for SARS-CoV-2 antiviral prophylaxis.Paradigms, to corroborate this claim, are borrowed from nonhuman primate research studies, some of which had a profound impact on global public health in the specific setting of the AIDS pandemic. Sharing information from nonhuman primate research programs, invoking principles of scientific transparency and bioethics similar to those universally agreed for human studies, would also likely significantly help our collective fight (as the human species) against this public health emergency.

What Makes an Antiviral Potent Against SARS-CoV-2?

Remdesivir, a nucleoside analogue specific for the RNA-dependent RNA polymerase of several coronaviruses, is a potent SARS-CoV-2 antiviral drug based on studies in vitro. Its half maximal effective concentration (EC50) leans consistently towards the lowest estimates when screened, using the same assay, with other antivirals tested against several coronaviruses [1-4] hence, a relatively lower concentration of the drug is needed to cut similar levels of viral replication in vitro, compared to other antiviral drugs less successfully repurposed, so far, as medical countermeasures against COVID-19. These include the HIV-1 protease inhibitor lopinavir/ritonavir (Kaletra) and the immunosuppressive and anti-parasitic drug hydroxychloroquine [5,6].

The success of an antiviral drug in fighting a virus depends, however, not only on how potent the drug is in inhibiting the virus in vitro but also on how well the drug penetrates the anatomic compartments in which the virus mostly replicates in vivo; the lungs for COVID-19. If administered orally, for instance, remdesivir would be ineffective because low drug levels would reach the lungs due to its high first pass destruction in the liver, resulting in poor oral bioavailability. This is the reason remdesivir can only be administered intravenously to exert its viral inhibitory function, a requirement that clearly limits its use as a prophylactic agent or as a test-and-treat pharmacologic-based mitigation strategy for COVID-19.

Delivering Potent Antivirals Straight to the Lungs, without Calling a Nurse

What can be done to transform the route of administration of an antiviral or to enhance its concentration into the lungs? Since the mid-1960s, pharmacologists have investigated the use of lipid-based nanoparticles for efficient delivery of antivirals and other drugs, for example by transforming the route of administration from intravenous to oral, subcutaneous or aerosol administrations [7,8], with potentially useful ramifications in the pharmacoeconomics of developing countries [9]. These novel encapsulation strategies are capable of maintaining high levels of the antiviral drugs in tissues, with reduced dose frequency. For instance, Kaletra in its oral formulation requires daily administration due to its rapid clearance, but data produced from nonhuman primates have demonstrated that the equivalent mass of one pill of Kaletra formulated as a lipid-nanoparticle for subcutaneous administration achieves approximately 10-fold higher concentrations in lymph nodes for about one week [10]. Similarly, the lipid-nanoparticle encapsulation of tenofovir, a nucleotide analogue used to treat HIV and hepatitis B infection that has some structural and functional similarities with remdesivir, has also been shown to enhance tissue concentrations and prolong retention of its active phosphorylated moieties in nonhuman primate studies [11]. The opportunity offered by nanoparticle technologies, not only to simplify the administration of a candidate antiviral drug, but also to enhance its concentrations in tissues, is relevant in the search for SARS-CoV-2 antiviral prophylaxes, especially given the limited data we have today for the penetration in the lungs or in the upper airways of most anti-SARS-CoV-2 repurposed antivirals [12], including lopinavir/ritonavir [13] and nelfinavir (another HIV-1 protease-inhibitor with a favorable EC50 against coronaviruses [14]). It is well known that lipophilic drugs preferentially penetrate the lungs and, in fact, this formed the rationale for encapsulating certain hydrophilic drugs in liposomes to promote delivery to the pulmonary compartment [15,16]. One example is amphotericin, an antifungal drug encapsulated in nanocochleates (soy-bean organic-based lipid particles) which can be formulated as an oral drink. Pharmacodynamic animal studies have advanced to phase-II clinical trials, in which patients are being administered the oral nanocochleate antifungal formulation, which appears to offer an overall effective oral formulation associated with low toxicity after prolonged (more than one year) continuous treatment [17]. Several lipid-based nanoparticles are today approved by the US Food and Drug Administration or being tested in clinical studies with favorable toxicity profiles [18]. Indeed these nanocarriers, by affecting the biodistribution in the body of the encapsulated antiviral compound, can substantially modify toxicological properties of the formulated drug. Of note, subcutaneous and aerosol formulations of remdesivir are now under development [19].

Consistent with the ranking by in vitro potency (the EC50), clinical trials in which these drugs have been administered to COVID-19 patients have thus far shown clear evidence of therapeutic potential only for remdesivir(intravenous formulation) [5,6]. Pharmacodynamic correlates of poor clinical responses could guide efforts in the search for an optimal prophylaxis. For instance, the antiviral drug Kaletra (available in pills) has been administered to COVID-19 patients with the same dose used to treat HIV-1 infected patients; however, its potency in vitro against SARS-CoV-2 is known to be significantly weaker than against HIV-1 [20].

Lessons Learned from the History of HIV-Prophylaxis Research

A successful antiviral prevention strategy is Truvada-PrEP for HIV, a combination of two nucleo(t)side analogues, that is lighter than the combination therapies (Highly Active Anti-Retroviral Therapy, HAART) used to treat HIV-1 infected patients, with important toxicological implications. Of note, dosing and administration strategies to conceive Truvada-PrEP (tenofovir+emtricitabine) were generated primarily from two monkey studies that produced, through invasive experimental designs not implementable in humans, precious data on the minimal drug levels needed in tissues to achieve protection from viral challenges [21,22]. These molecules attack the polymerase of HIV (or of lentiviruses that possess replication capacity in monkeys similar to HIV in humans, e.g. the simian-human immunodeficiency virus, SIV/SHIV) with a mechanism similar to the one adopted by remdesivir to attack the polymerase of several coronaviruses (including SARS-CoV-2), i.e. as chain terminators by mimicking the structure of a natural nucleoside [23].

Those studies demonstrated that the administration of two pills of Truvada (two hours prior to viral exposure) followed by two consecutive pills at 24 and 48 hours post-exposure provided sufficient drug levels in the rectal mucosa tissue to cut most viral transmissions. That prophylactic regimen (later called “On-Demand”) achieved in monkeys a protection similar to that achieved through daily drug administrations. This data prompted randomized clinical trials of “On-Demand-PrEP” prophylaxis, which confirmed an efficacy similar to the one estimated with the heavier “Daily-PrEP” regimen [24] and which later received endorsement in revised HIV treatment and prevention recommendations issued by the International Antiviral Society–USA [25]. Hence the former are two examples of nonhuman primate studies that have had a profound impact on public health worldwide.

Similarly, two decades earlier, the simian-human immunodeficiency virus (SIV/SHIV)-monkey model had been used to generate the HIV Post-Exposure Prophylaxis (PEP) guidelines we are using today for both occupational and non-occupational exposure to HIV, by demonstrating the effectiveness of a cocktail of HIV drugs (a combination of antiretrovirals similar to the one administered to HIV-1 infected patients, for four consecutive weeks), in preventing viral transmission if administered within 72 hours (but the sooner the better) from viral exposure [26,27]. The length of this window of opportunity for HIV PEP was identified, again, through nonhuman primate studies, in which lentiviruses replicate with dissemination capacity and antiviral drugs distribute in tissues with kinetics, much more similar to humans than any other animal model in our hands. In general, although animal models (including nonhuman primates) are known to be poor predictors (for obvious reasons) of the efficacy of specific HIV vaccines in humans [28], the monkey models proved to be valuable resources, during the past decades, in predicting the efficacy of antiviral HIV strategies not only as prophylaxis but also in the therapeutic arena.

The lessons learned from HIV and Truvada-PrEP studies include the following: 1) an antiviral may show a weak therapeutic effect, especially if administered late in the course of the viral induced disease, yet can effectively cut most viral transmissions if administered prophylactically. This observation holds true also for COVID-19. For instance, a recent study in a coronavirus rodent model showed that another nucleoside analogue with in vitro inhibitory activity similar to remdesivir can efficiently reduce viral replication in the lungs yet may fail to prevent disease progression if administered too late [29]; and 2) the higher the drug concentration in the anatomic compartments that fuel viral dissemination in the body, the higher the efficacy of the pharmacologic prevention strategy aimed at promptly eradicating the virus from the body [30]. The latter observation built the rationale for encapsulating HIV drugs in lipid-nanoparticles in research programs developed in the past decades [31], with the dual objective of simplifying (by reducing dosing frequency) and optimizing (by enhancing drug tissue levels) the delivery of antiretroviral drugs for both HIV-1 prevention and treatment, through proof-of-concept studies in nonhuman primate models of AIDS; an important experimental step for its effective translation into human studies.

The same experimental designs can be efficiently conceived to develop medical countermeasures to COVID-19 through the SARS-CoV-2 rhesus macaque model [32], which induces a respiratory disease milder than in COVID-19 patients, but that replicates at similar levels in the lungs [33,34]. In general, although non-invasive in vivo imaging technologies have also been used to study the biodistribution of antiviral drugs (including in the upper and lower respiratory tracts of humans [35,36]), our understanding of how an antiviral prophylaxis strategy succeeds or fails in protecting people from SARS-CoV-2 infection would inherently advance (as it did for HIV prophylaxis), by designing viral challenge experiments and producing measurements directly in tissues using these animal models. Sharing information from nonhuman primate research programs on what antiviral strategies are being tested on these animal models for COVID-19 throughout the world, invoking principles of scientific transparency and bioethics similar to those universally agreed for human studies (e.g. by registering studies in public databases) [37], would also likely significantly help our collective fight (as the human species) against this public health emergency [38].

These studies could also, in principle, be efficiently designed using other nonhuman-primate coronavirus animal models [39], especially if the antiviral target is the polymerase gene, given its high level of sequence conservation through evolution [29]. To date, remdesivir is the only antiviral drug tested in nonhuman primate models of SARS-CoV-2 with published observations [39,40]. Macaques infected with either the MERS-CoV [39] or the SARS-CoV-2 [40] rapidly cleared the virus following intravenous administration of remdesivir compared to untreated controls, consistent with the successful therapeutic effect of remdesivir observed in COVID-19 patients [6]. Data from both monkey studies also predict that remdesivir could prevent SARS-CoV-2 infection in humans, if used prophylactically. Prophylactic remdesivir (intravenous) treatment had been also successfully tested in nonhuman primates models of Ebola virus [41] and Nipah virus infection [42], two RNA viruses with an RNA-dependent RNA polymerase also highly sensitive to its inhibitory activity [43]. Indeed, both the cynomolgus [44] and the rhesus macaque models [45] of SARS-CoV-2 infection are being interrogated in these weeks to test the prophylactic efficacy of hydroxychloroquine.

These studies have been run in laboratories with the highest levels of biological safety (biosafety level-3 [39,40,44,45] and biosafety level-4 [41,42]) due to the high risk these pathogens pose to research personnel, which are very expensive to build and maintain, hence not readily available in most countries [46]. The modification of an antiviral, e.g. through lipid nanoparticle technology, as anticipated above, requires preliminary testing in vitro as well as in animal models. Specifically, there is need to demonstrate that the lipid structure does not impair the inhibitory activity of the encapsulated antiviral (e.g. does not increase its EC50 against the challenge virus). In healthy uninfected animals, biodistribution studies are subsequently needed to demonstrate that the encapsulated antiviral is capable of reaching the tissues in which the virus is expected to mostly replicate in vivo, and, in the case of a nucleoside analogue (like remdesivir), that its active phosphorylated moieties are produced at sufficient concentrations in those tissues. These preliminary pharmacokinetic studies will inform on the optimal dose of the encapsulated antiviral under scrutiny and on how frequently it will need to be administered in the pharmacodynamic studies. The latter studies can demonstrate the feasibility of the modified antiviral drug to exert its inhibitory activity in an infected host, hence an important step for the translation of the nanoparticle approach to human studies.

While alternative animal models could possibly serve the pharmacodynamic study objectives, the nonhuman primate model is likely the best model to accelerate this area of research. To my knowledge, coronaviruses less pathogenic to humans [47] but still sensitive to the inhibitory activity of remdesivir [48] (and possibly to other antiviral drugs [29]) have not been tested in nonhuman primates, although serologic studies suggest that these viruses may be able to replicate well in these hosts [49]. Indeed, a 229E coronavirus experimental infection study in normal volunteers failed to demonstrate efficacy of a nucleoside analogue for prophylaxis, as previously shown in rodent models, possibly due to the differential tissue pharmacokinetics of the specific drug under scrutiny in the two evolutionarily distant hosts [50].

In other words, “non-perfect” nonhuman primate models (i.e. those in which the SARS-CoV-2 or an older cousin does not cause disease yet replicates in tissues at levels similar to humans) can still generate useful data to screen prophylactic antiviral strategies, including, for instance, lipid nanoparticle formulations of “non-perfect” antiviral drugs (i.e. a putative antiviral drug failing to demonstrate a robust therapeutic effect in patients with advanced COVID-19 or if suboptimal drug levels in the lungs are confirmed from preclinical or post-mortem studies). Had we not discovered the rhesus-macaque model of HIV infection (in which the simian immunodeficiency virus [SIV] causes a disease similar to AIDS), we likely still would have generated pharmacodynamic data using the natural hosts of SIV infection (in which SIV does not cause disease, but still replicates in the body at levels similar to HIV in humans or SIV in the non-natural nonhuman-primate hosts [51]) equally useful for their inference to HIV-(post- and pre-exposure) prophylaxis (PEP and PrEP, respectively) in humans.

Had We the Equivalent of Truvada-Prep for SARS-CoV-2, How Would We Use it to Mitigate COVID-19?

Pharmacologic-based mitigation strategies to curb epidemics have been postulated [52], but their efficacy in synergy with social distancing and face mask wearing mitigation strategies (with or without digital contact-tracing technology [53]) for an epidemic with a doubling-time and dynamic features similar to COVID-19 [54,55] is today unknown. Consensus is growing among modelers, however, that mitigation strategies interventions (which primarily act on reducing the same variable of the viral transmission dynamic models adopted in their studies, i.e. the infectivity rate) work best in keeping the number of new cases at bay (or could even stop the epidemic [53]), if administered when the pool of infected people is small, i.e. during the early steps of a viral outbreak or when the R-naught (average number of people that one infected person will pass the virus to) has been sufficiently reduced, for instance following a period of effective lock-down [53,55]. The larger the initial pool of infected people, the more aggressive the interventions aimed to promptly control an epidemic may need to be (including voluntary centralized quarantine) [56].

Efforts in this area of mathematical modeling research are critically needed to serve this and any future viral outbreak. For bioethical reasons, similarly to what happened for PEP studies in the 1990s, once the effectiveness of the first available COVID-19 prophylaxes is demonstrated, it will be difficult to estimate the relative contribution of each mitigation strategy to the curve of new cases in a given region. Epidemiological models of COVID-19 for instance predict that a 50% reduction in within-population contact rates can already have a dramatic effect in slowing the course of the epidemic [54]. Massive data sharing among countries, which will likely adopt different combinations of those strategies at different times, will be of utmost importance to produce that knowledge.

The role of an antiviral prophylaxis goes beyond its ability to substantially impact the curve of cases. The high likelihood of SARS-CoV-2 transmission among individuals living in households with infected people [57] offers an important context in which a safe antiviral drug is highly desired to protect, first of all, those at high risk of severe disease, such as the elderly with chronic health conditions, as well as those at high risk of contracting the virus through occupational exposure. This would enhance the quality of life not only for uninfected adults living in the same household but also for the COVID-19 patients who could go through the quarantine period with less fear of infecting those who gravitate around their lives; a peace of mind that carries priceless benefits to patient welfare, somewhat similar (within the limitations of the proposed parallelism) to those experienced by HIV serodiscordant couples with the advent of Truvada-PrEP.

Acknowledgements

The author thanks Katelyn W. Le, from Frederick National Laboratory for Cancer Research/Leidos Biomedical Research, for providing medical writing editorial support during the preparation of this paper.

References

  1. Wang M, Cao R, Zhang L, Yang X, Liu J, et al. (2020) Remdesivir and chloroquine effectively inhibit the recently emerged novel coronavirus (2019-nCoV) in vitro. Cell Res30: 269-271. [crossref]
  2. Martinez MA (2020) Compounds with Therapeutic Potential against Novel Respiratory 2019 Coronavirus. Antimicrob Agents Chemother64.
  3. Liu J, Cao R, Xu M, Wang X, Zhang H, et al. (2020) Hydroxychloroquine, a less toxic derivative of chloroquine, is effective in inhibiting SARS-CoV-2 infection in vitro. Cell Discov6: 16. [crossref]
  4. Sheahan TP, Sims AC, Leist SR, Schäfer A, Won J, et al. (2020) Comparative therapeutic efficacy of remdesivir and combination lopinavir, ritonavir, and interferon beta against MERS-CoV. Nat Commun11: 222. [crossref]
  5. Sanders JM, Monogue ML, Jodlowski TZ, Cutrell JB (2020) Pharmacologic Treatments for Coronavirus Disease 2019 (COVID-19): A Review. JAMA[crossref]
  6. Beigel JH, Tomashek KM, Dodd LE, Mehta AK, Zingman BS, et al. (2020) Remdesivir for the Treatment of Covid-19 – Preliminary Report. N Engl J Med. [crossref]
  7. Milovanovic M, Arsenijevic A, Milovanovic J, Kanjevac T, Arsenijevic N (2017) In: Antimicrobial Nanoarchitectonics, A. M. Grumezescu (Eds.). (Elsevier, 2017) Pg No: 383-410.
  8. Pandey R, Khuller GK (2004) Subcutaneous nanoparticle-based antitubercular chemotherapy in an experimental model. J Antimicrob Chemother54: 266-268. [crossref]
  9. Salamanca-Buentello F, Persad DL, Court EB, Martin DK, Daar AS, et al. (2005) Nanotechnology and the developing world. PLoS Med2: e97. [crossref]
  10. McConnachie LA, Kinman LM, Koehn J, Kraft JC, Lane S, et al. (2018) Long-Acting Profile of 4 Drugs in 1 Anti-HIV Nanosuspension in Nonhuman Primates for 5 Weeks After a Single Subcutaneous Injection. J Pharm Sci107: 1787-1790. [crossref]
  11. Koehn J, Iwamoto JF, Kraft JC, McConnachie LA, Collier AC, et al. (2018) Extended cell and plasma drug levels after one dose of a three-in-one nanosuspension containing lopinavir, efavirenz, and tenofovir in nonhuman primates. Aids 32: N2463-2467. [crossref]
  12. Arshad U, Pertinez H, Box H, Tatham L, Rajoli RKR, et al. (2020) Prioritization of Anti-SARS-Cov-2 Drug Repurposing Opportunities Based on Plasma and Target Site Concentrations Derived from their Established Human Pharmacokinetics. Clin Pharmacol Ther. [crossref]
  13. Twigg HL, Schnizlein-Bick CT, Weiden M, Valentine F, Wheat J, et al. (2010) Measurement of antiretroviral drugs in the lungs of HIV-infected patients. HIV Ther4: 247-251. [crossref]
  14. Yamamoto N, Yang R, Yoshinaka Y, Amari S, Nakano T, et al. (2004) HIV protease inhibitor nelfinavir inhibits replication of SARS-associated coronavirus. Biochem Biophys Res Commun318: 719-725. [crossref]
  15. Nanoformulations for the Therapy of Pulmonary Infections (2017) In: Nanostructures for Antimicrobial Therapy, Sagar Dhoble, Vinod Ghodake, Manasi Chogale, Vandana Patravale (eds.). Elsevier, 457-480.
  16. Pea F, Viale P (2006) The antimicrobial therapy puzzle: could pharmacokinetic-pharmacodynamic relationships be helpful in addressing the issue of appropriate pneumonia treatment in critically ill patients? Clin Infect Dis42: 1764-1771. [crossref]
  17. Aigner M, Lass-Florl C (2020) Encochleated Amphotericin B: Is the Oral Availability of Amphotericin B Finally Reached? J Fungi(Basel)6: 66. [crossref]
  18. Bulbake U, Doppalapudi S, Kommineni N, Khan W (2017) Liposomal Formulations in Clinical Use: An Updated Review. Pharmaceutics 9: 12. [crossref]
  19. https://www.reuters.com/article/us-health-coronavirus-gilead-sciences/gileads-next-step-on-coronavirus-inhaled-remdesivir-other-easier-to-use-versions-idUSKBN2391FP
  20. Cao B, Wang Y, Wen D, Liu W, Wang J, et al. (2020) A Trial of Lopinavir-Ritonavir in Adults Hospitalized with Severe Covid-19. N Engl J Med 382: 1787-1799. [crossref]
  21. Garcia-Lerma JG, Otten RA,Qari SH,Jackson E,Mian-er Cong, et al. (2008) Prevention of rectal SHIV transmission in macaques by daily or intermittent prophylaxis with emtricitabine and tenofovir. PLoS Med5: e28. [crossref]
  22. Garcia-Lerma JG, Mian-er Cong, Mitchell J, Youngpairoj AS, Zheng Q, et al. (2010) Intermittent prophylaxis with oral truvada protects macaques from rectal SHIV infection. Sci Transl Med2: 14ra4. [crossref]
  23. Deval J (2009) Antimicrobial strategies: inhibition of viral polymerases by 3′-hydroxyl nucleosides. Drugs 69: 151-166. [crossref]
  24. Molina JM, Capitant C, Spire B, Pialoux G, Cotte L, et al. (2015) On-Demand Preexposure Prophylaxis in Men at High Risk for HIV-1 Infection. N Engl J Med373: 2237-2246. [crossref]
  25. Saag MS, Benson CA, Gandhi RT, Hoy JF, Landovitz RJ, et al. (2018) Antiretroviral Drugs for Treatment and Prevention of HIV Infection in Adults: 2018 Recommendations of the International Antiviral Society-USA Panel. JAMA 320: 379-396. [crossref]
  26. Tsai CC, Emau P, Follis KE, Beck TW, Benveniste RE, et al. (1998) Effectiveness of postinoculation (R)-9-(2-phosphonylmethoxypropyl) adenine treatment for prevention of persistent simian immunodeficiency virus SIVmne infection depends critically on timing of initiation and duration of treatment. J Virol72: 4265-4273. [crossref]
  27. Black RJ (1997) Animal studies of prophylaxis. Am J Med102: 39-44. [crossref]
  28. Herati RS, Wherry EJ (2018) What Is the Predictive Value of Animal Models for Vaccine Efficacy in Humans? Consideration of Strategies to Improve the Value of Animal Models. Cold Spring Harb Perspect Biol10: a031583. [crossref]
  29. Sheahan TP, Sims AC, Zhou S, Graham RL, Pruijssers AJ, et al. (2020) An orally bioavailable broad-spectrum antiviral inhibits SARS-CoV-2 in human airway epithelial cell cultures and multiple coronaviruses in mice. Sci Transl Med12: eabb5883. [crossref]
  30. Patterson KB, Prince HA, Kraft E, Jenkins AJ, Shaheen NJ, et al. (2011) Penetration of tenofovir and emtricitabine in mucosal tissues: implications for prevention of HIV-1 transmission. Science translational medicine 3: 112re114-112re114. [crossref]
  31. Kraft JC, Freeling JP, Wang Z, Ho RJ (2014) Emerging research and clinical development trends of liposome and lipid nanoparticle drug delivery systems. J Pharm Sci103: 29-52. [crossref]
  32. Munster VJ, Feldmann F, Williamson BN, Doremalen NV, Pérez-Pérez L, et al. (2020) Respiratory disease in rhesus macaques inoculated with SARS-CoV-2. Nature. [crossref]
  33. Pan Y, Zhang D, Yang P, Poon LLM, Wang Q (2020) Viral load of SARS-CoV-2 in clinical samples. Lancet Infect Dis20: 411-412. [crossref]
  34. Wichmann D, Sperhake JP, Lütgehetmann M, Steurer S, Edler C, et al. (2020) Autopsy Findings and Venous Thromboembolism in Patients With COVID-19. Ann Intern Med. [crossref]
  35. Bergstrom M, Cass LM, Valind S, Westerberg G, Lundberg EL, et al. (1999) Deposition and disposition of [11C]zanamivir following administration as an intranasal spray. Evaluation with positron emission tomography. Clin Pharmacokinet1: 33-39. [crossref]
  36. Dabisch PA, Xu Z, Boydston JA, Solomon J, Bohannon JK, et al. (2017) Quantification of regional aerosol deposition patterns as a function of aerodynamic particle size in rhesus macaques using PET/CT imaging. Inhal Toxicol29: 506-515. [crossref]
  37. Zarin DA, Keselman A (2007) Registering a clinical trial in ClinicalTrials.gov. Chest 131: 909-912. [crossref]
  38. Brouillette M (2017) To Treat Primates More Humanely: Transparency Scientists look to open-data initiatives to lessen the burden of research on our closest animal relatives. Sci Am316: 14. [crossref]
  39. Wit ED, Feldmann F, Cronin J, Jordan R, Okumura A, et al. (2020) Prophylactic and therapeutic remdesivir (GS-5734) treatment in the rhesus macaque model of MERS-CoV infection. Proc Natl Acad Sci U S A117: 6771-6776. [crossref]
  40. Williamson BN, Feldmann F, Schwarz B, Meade-White K, Porter DP, et al. (2020) Clinical benefit of remdesivir in rhesus macaques infected with SARS-CoV-2. Nature. [crossref]
  41. Warren TK, Jordan R, Lo MK, Ray AS, Mackman RL, et al. (2016) Therapeutic efficacy of the small molecule GS-5734 against Ebola virus in rhesus monkeys. Nature 531: 381-385. [crossref]
  42. Lo MK, Feldmann F, Gary JM, Jordan R, Bannister R, et al. (2019) Remdesivir (GS-5734) protects African green monkeys from Nipah virus challenge. Sci Transl Med11: eaau9242. [crossref]
  43. Pardo J, Shukla AM, Chamarthi G, Gupte A (2020) The journey of remdesivir: from Ebola to COVID-19. Drugs Context9: 4-14. [crossref]
  44. https://www.researchsquare.com/article/rs-27223/v1
  45. https://www.biorxiv.org/content/10.1101/2020.06.10.145144v1
  46. Peters A (2018) The global proliferation of high-containment biological laboratories: understanding the phenomenon and its implications. Rev Sci Tech37: 857-883. [crossref]
  47. Bende M, Barrow I, Heptonstall J, Higgins PG, Al-Nakib W, et al. (1989) Changes in human nasal mucosa during experimental coronavirus common colds. Acta Otolaryngol107: 262-269. [crossref]
  48. Parang K, El-Sayed NS, Kazeminy AJ, Tiwari RK (2020) Comparative Antiviral Activity of Remdesivir and Anti-HIV Nucleoside Analogs Against Human Coronavirus 229E (HCoV-229E). Molecules 107: 262-269. [crossref]
  49. Dijkman R, Mulder HL, Rumping L, Kraaijvanger I, Deijs M, et al. (2009) Seroconversion to HCoV-NL63 in Rhesus Macaques. Viruses 1: 647-656. [crossref]
  50. Higgins PG, Barrow GI, Tyrrell DAJ, Snell NJC, Jones K, et al. (1991) A study of the efficacy of the immunomodulatory compound 7-thia-8-oxoguanosine in coronavirus 229E infections in human volunteers. Antiviral Chemistry & Chemotherapy2: 61-63.
  51. Gordon SN, Dunham RM, Engram JC, Estes J, Wang Z, et al. (2008) Short-lived infected cells support virus replication in sooty mangabeys naturally infected with simian immunodeficiency virus: implications for AIDS pathogenesis. J Virol82: 3725-3735. [crossref]
  52. Ferguson NM, Cummings DAT, Fraser C, Cajka JC, Cooley PC, et al. (2006) Strategies for mitigating an influenza pandemic. Nature 442: 448-452. [crossref]
  53. Ferretti L, Wymant C, Kendall M, Zhao L, Nurtay A, et al. (2020) Quantifying SARS-CoV-2 transmission suggests epidemic control with digital contact tracing. Science 368: eabb6936. [crossref]
  54. Wu JT, Leung K, Leung GM (2020) Nowcasting and forecasting the potential domestic and international spread of the 2019-nCoV outbreak originating in Wuhan, China: a modelling study. Lancet 395: 689-697. [crossref]
  55. Hellewell J, Abbott S, Gimma A, Bosse NI, Jarvis CI, et al. (2020) Feasibility of controlling COVID-19 outbreaks by isolation of cases and contacts. Lancet Glob Health8: e488-e496. [crossref]
  56. Pan A, Liu L, Wang C, Guo H, Hao X, et al. (2020) Association of Public Health Interventions With the Epidemiology of the COVID-19 Outbreak in Wuhan, China. JAMA323: 1-9. [crossref]
  57. Li W, Zhang B, Lu J, Liu S, Chang Z, et al. (2020) The characteristics of household transmission of COVID-19. Clin Infect Dis. [crossref]

Diabetes Mellitus at the Intersection of the COVID-19 Pandemic and the Opioid Crisis

DOI: 10.31038/EDMJ.2020432

Introduction

Boslet et al. used a secondary data analysis of the universe of drug overdoses in 1999-2016 obtained from the National Center for Health Statistics Detailed Multiple Cause of Death records to demonstrate that the number of deaths attributed to opioid-related overdoses could be 28 percent higher than first reported due to incomplete death records [1]. This discrepancy was more pronounced in several states, to include Alabama, Mississippi, Pennsylvania, Louisiana, and Indiana, where the estimated number of deaths more than doubles obscuring the scope of the opioid crisis and potentially affecting programs and funding intended to confront the epidemic [1]. Logistic regression and random forest models were performed to determine contributing causes substantially that improved predictive accuracy, while including county characteristics. Using a superior prediction model, they found that 71.8% of unclassified drug overdoses in 1999- 2016 involved opioids, and thus translating into 99 160 additional opioid-related deaths, or approximately 28% more than previously reported [1]. It is hoped a physician relies on census data as essential tools for understanding the importance of place-level characteristics on opioid mortality. Opioid mortality rates overall are higher in counties characterized by more economic disadvantage, more blue- collar and service employment, and higher opioid-prescribing rates [2]. Medical literature have reported that high rates of prescription opioid overdoses and overdoses involving both prescription and synthetic opioids cluster in more economically disadvantaged counties with larger concentrations of service industry workers [2]. Further, Monnat et al. suggest national policies to combat the opioid and larger drug crises, emphasis should be on developing locally  and regionally tailored interventions, with attention to place-based structural economic and social characteristics [2].

An appreciation as of April 2020, the United States now has 22 million unemployed, wiping out a decade of job gains. Woolhandler and Himmelstein assert with jobs and health insurance coverage disappearing as the COVID-19 pandemic rages, states that have declined to expand Medicaid should urgently reconsider [3]. Moreover, state tax revenues are plunging due to shelter in place orders and initiatives in place to have only essential workers to attend their place of business. The foreboding realization is that only the federal government can address this financial impending crisis [3]. Secondly these authors state health care coverage losses are likely to be steepest in states that have turned down the Patient Protection and Affordable Care Act’s Medicaid expansion [3]. Additionally, in expansion states, the share of persons who have lost or left a job who lacked coverage was 22.1% versus 8.3% for employed persons-a difference of 13.8 percentage points [3]. These authors acknowledge  that  although  the COVID-19 crisis demands urgent action, it also exposes the carelessness of tying health insurance to employment and the need for more thoroughgoing reform [3]. It is hoped that the issue of families who face the dual disaster of job loss and health insurance loss and who may suffer from opioid use disorder will be among the foremost issues on the legislative branch of the United States’ agenda. Haffajee et al., report opioid overdose deaths in the United  States continue to increase, reflecting a growing need to treat those with opioid use disorder [4]. Acknowledging that fading economic opportunity has been hypothesized to be an important factor associated with the United States opioid overdose crisis. Automotive assembly plant closures are culturally significant events that substantially erode local economic opportunities [5]. Moreover, Venkataramani et al. explores and investigates a community’s economy has on opioid overdose mortality. Their primary outcome was the county-level age-adjusted opioid overdose mortality rate [5]. Their secondary outcomes included the overall drug overdose mortality rate and prescription vs. illicit drug overdose mortality rates [5]. They discovered that from 1999 to 2016, automotive assembly plant closures were associated with increases in opioid overdose mortality [5]. These findings highlight the potential importance of eroding economic opportunity as a factor in the United States opioid overdose crisis [5]. Finally, Langbeer et al. concluded univariate, opioid-related morality was positively correlated with tobacco use, being non-Hispanic Caucasian individual, living in a rural area, obesity, being 65-years of age or older, and a higher rate of unemployment [6].

Gautam et al. reported that diabetes mellitus has well known costly complications but wanted to show through a retrospective model that costs of care for chronic pain treated with opioid analgesic medications would also be substantial [7]. They found that higher costs of care for opioid-treated patients appeared for all types of services and likely reflects multiple factors including morbidity from the underlying cause of pain, care and complications related to opioid use, and poorer control of diabetes as found in other investigations [7]. Schiemsky et al. reported a case of hypoglycemia caused by inappropriate stimulation of insulin secretion in a patient intoxicated with tramadol [8]. They further explain the sudden hypokalemia was caused by a massive intracellular shift of potassium in response to the hyperinsulinemia, triggered by the intravenous administration of glucose [8]. Makunts et al. analyzed over twelve million reports from United States Food and Drug Administration Adverse Event Reporting System to provide evidence of increased propensity for hypoglycemia in patients taking tramadol when compared to patients taking other opioids, serotonin-norepinephrine reuptake inhibitors, and drugs affecting (NMDAR) activity [9]. They identified that both tramadol and methadone behave similarly to tramadol and has an association with hypoglycemia [9]. These findings accentuates the need for monitoring of a patient’s blood glucose given the overlap of the opioid crisis and COVID-19 pandemic.

As people across the United States and the rest of the world contends with coronavirus disease 2019 (COVID-19), the medical community to include podiatric physicians should realize the possibility that COVID-19 infection could hit some populations with  Substance Use Disorders (SUDs) particularly hard [10]. The coronavirus that causes COVID-19 attacks the lungs and could be an especially serious threat to those patients who smoke tobacco, marijuana or who vape. People with Opioid Use Disorder (OUD)  and  methamphetamine use disorder may also be vulnerable due to those drugs’ effects on respiratory and pulmonary health [10]. Additionally,  patients with   a substance use disorder are more likely to experience homelessness or incarceration than those in the general population, and these circumstances pose unique challenges regarding transmission of the virus that causes COVID-19. All these possibilities should be a focus of active surveillance as we work to understand this emerging health threat [10].

According to Volkow those persons who are isolated and stressed as much of the population is during the COVID-19 pandemic frequently turn to substances to alleviate their negative feelings [11]. Those in substance recovery will face stresses and heightened urges to use substances and will be at greatly increased risk for relapse [11]. Further, vulnerable populations those who smoke or vape, use opioids, or have a Substance Use Disorder (SUD) may have direct challenges to respiratory health, those with SUD may be especially susceptible to infection by the virus that causes COVID-19 and associated complications [11]. Impediments to delivering care to  this population, persons with SUD who develop COVID-19 may find it harder to get healthcare [11]. Those in recovery will also be uniquely challenged by social distancing measures [11]. Lastly, a risk for severe COVID-19 and death escalates with older age but is also concentrated among those who are immunocompromised or have underlying health conditions, including diabetes, cancer, and heart and respiratory diseases [11].

Mukherjee and El-Bassel report that people with opioid and other substance use disorders are disproportionately incarcerated, and recently released prisoners are ten times more likely to become homeless [12]. During the COVID-19 pandemic coupled without adequate planning, de-carceration efforts in may move people with Opioid Use Disorder from one at risk environment to another at risk environment [12]. Upon release, the risks associated with COVID-19, as well as HIV, viral hepatitis, Tuberculosis, overdose and homelessness that often accompany incarceration must be considered [12].

It is an accepted fact that not only does COVID-19 make addiction services harder to access but people who use drugs may   be at higher risk of infection given the dangerous overlap between addiction, incarceration, and the rapid spread of infections within confined spaces. Community campaigns to get nonviolent drug offenders released during this pandemic may not be sufficient to avoid incarcerated persons from becoming infected with COVID-19. A prisoner re-entry into regular society is difficult and dangerous from a health perspective, even during normal times. As the economy collapses, shelters and food banks have been overwhelmed, with already limited resources stretched thin on all levels in many communities.

Opioids and Increase of Infections

Schwetz et al. rely on clinical evidence to assert in their commentary that the rise in Opioid Use Disorder (OUD), bolstered by injection opioid use, conveys numerous downstream consequences and is fueling a surge in infectious diseases, such as Human Immunodeficiency Virus (HIV) infection with or  without  AIDS, the viral hepatitides, infective endocarditis, pneumonia, and  skin and soft-tissue infections [13,14]. Further, Schwetz et al. note the increasing infection rates and demographic trends of bacterial and fungal infections appear to mirror trends observed with the opioid epidemic [13,15]. They cite the example of the rate of methicillin- resistant Staphylococcus aureus infections among people who inject drugs more than doubled between the years of 2011 and 2016 [16]. Additionally, they assert the growing evidence has shown that certain opioids to include both morphine and fentanyl that have putative effects on both the innate and adaptive immune systems, dependent on drug dosage and duration of delivery [13]. Finally, these authors concluded using published data that the growing trend of infectious diseases emerging across the United States in areas with high rates of opioid use has created a significant combined impact on morbidity and mortality [13].

Wiese et al, conducted a retrospective cohort study to investigate long-acting opioid use and the risk of serious infections [17]. They used multivariable Poisson regression models to calculate adjusted incidence rate ratios and 95% confidence intervals to compare the infection risk among patients using long-acting opioids with known immunosuppressive properties (morphine, fentanyl, methadone) to the infection risk among patients using long-acting opioids without known immunosuppressive properties (oxycodone, oxymorphone, tramadol) accounting for demographics, opioid dose, comorbidities and pain conditions, medication use, frailty indicators, and healthcare encounter history using exposure propensity scores [17]. Moreover, they compared users of individual long-acting opioids to long-acting morphine users that considered the prototypical immunosuppressive opioid [17]. They determined the risk of serious infections among long-acting opioid users varies by opioid type [17]. They suggest that providers should carefully consider the risk of serious infections when making pain management decisions [17]. Karagiannis et al. acknowledge that chronic opioid usage not only causes addiction behavior through the central nervous system, but also modulates the peripheral immune system [18]. Further they ask the question how do opioids impact the immune system and recognize it is still barely characterized systematically [18]. In order to understand the immune modulatory effect of opioids in an unbiased way, here they perform single-cell RNA sequencing (scRNA-seq) of peripheral blood mononuclear cells from opioid-dependent individuals and controls  to show that chronic opioid usage evokes widespread suppression   of antiviral gene program in naive monocytes, as well as in multiple immune cell types upon stimulation with the pathogen component lipopolysaccharide [18]. Furthermore, scRNA-seq reveals the same phenomenon after a short in vitro morphine treatment was discovered [18]. Their findings indicate that both acute and chronic opioid exposure may be harmful to our immune system by suppressing the antiviral gene program [18]. Lastly, their results suggest that further characterization of the immune modulatory effects of opioid is critical to ensure the safety of clinical opioids [18]. These results are of upmost importance in understanding the use of opioids in patients with diabetes mellitus during the current COVID-19 pandemic.

Diabetes Mellitus and COVID-19 Pandemic

In the United States, 34.2 million or 10.5% of the total population have diabetes mellitus [19]. Among those aged 65 years or older, a population at higher risk for death from COVID-19, 26.8% has diabetes mellitus [19]. Muniyappa and Gubbi summarize that individuals with diabetes mellitus, hypertension, and severe obesity (BMI 40 kg/m2) are more likely to be infected and are at a higher risk for complications and death from COVID-19 [20]. Given, consideration to the high prevalence of cardiovascular disease (CVD), obesity, and hypertension in patients with diabetes mellitus, according to Muniyappa and Gubbi it is unknown whether .diabetes mellitus independently contributes to the increased risk of being infective with COVID-19 [20]. However, plasma glucose levels and diabetes mellitus are independent predictors for mortality and morbidity in patients with SARS [21]. Potential mechanisms that may increase the susceptibility for COVID-19 in patients with diabetes mellitus include: 1) higher affinity cellular binding and efficient virus entry, 2) decreased viral clearance, 3) diminished T cell function, 4) increased susceptibility to hyperinflammation and cytokine storm syndrome, and 5) presence of cardiovascular disease [20]. Additionally, diabetes mellitus inhibits neutrophil chemotaxis, phagocytosis, and intracellular killing of microbes. Impairments in adaptive immunity characterized by an initial delay in the activation of Th1 cell-mediated immunity and a late hyperinflammatory response is often observed in patients with diabetes [22].

Another point explained by Hussain et al. is that the clinical spectrum of COVID-19 is heterogeneous, ranging from mild flu-like symptoms to acute respiratory distress syndrome, multiple organ failure and death [23]. Older age, diabetes and other comorbidities are reported as significant predictors of morbidity and  mortality [23]. Chronic inflammation, increased coagulation activity, immune response impairment, and potential direct pancreatic damage by SARS-CoV-2 might be among the underlying mechanisms of the association between diabetes and COVID-19 [23].

Finally, Bode et al. proposed the concept that diabetes and/or uncontrolled hyperglycemia occur frequently among hospitalized patients with COVID-19 and are associated with worse outcomes [24]. To investigate this concept they performed a retrospective observational study of laboratory-confirmed COVID-19 adults evaluated glycemic and clinical outcomes in patients with and without  diabetes  and/or  acutely  uncontrolled  hyperglycemia  who were hospitalized [24]. Among hospitalized patients with COVID-19, diabetes and/or uncontrolled hyperglycemia occurred frequently [24]. These COVID-19 patients with diabetes and/or uncontrolled hyperglycemia had a longer length of stay and markedly higher mortality than patients without diabetes or uncontrolled hyperglycemia [24]. These investigators observed  that  patients  with uncontrolled hyperglycemia had a particularly high mortality rate [24]. The physician can appreciate the potential effects of drug treatment options being used in the management of COVID-19 on glucose and lipid profiles summarized in Table 1 [25].

Table 1: Summary of the potential effects of Medications options being used in the management of COVID-19 on glucose and lipid profiles.

Medications

Mechanism of action on COVID-19

Effect on glucose profile

Effect on lipid profile

Corticosteroids

Anti-inflammatory, blocks cytokine storm

Hyperglycemia

Dyslipidemia

Lopinavir/Ritonavir

Protease inhibitors, blocks viral cellular entry

Hyperglycemia Lipodystrophy

Dyslipidemia

Darunavir/Cobicistat

Protease inhibitors, blocks viral cellular entry

Hyperglycemia Lipodystrophy

Dyslipidemia

Remdesivir

Adenosine analogue, inhibits viral replication

Increased blood glucose

Increased blood lipids

Interferons (b1)

Cytokine, stimulate innate antiviral immunity

Can lead to autoimmune b-cell damage thereby, precipitating or worsening diabetes mellitus

Dyslipidemia

Chloroquine/Hydroxychloroquine

Increases host cell endosomal pH, prevents viral entry and immunomodulator

Improves glucose profile and HbA1c in people with Type 2 Diabetes Mellitus

Improves lipid profile in people with Type 2 Diabetes Mellitus

Azithromycin

Macrolide antibiotic

Risk of dysglycemia in people with diabetes mellitus

No robust data Being an enzyme inhibitor, may prolong half-life of statins

Camostat mesilate

Protease inhibitors, blocks viral maturation and entry into cells

Found to lower blood glucose levels in insulin-treated patients with diabetes mellitus

Not known

Tocilizumab

Monoclonal antibody against IL-6, blocks cytokine storm

Improves glucose profile and reduces HbA1c in people with rheumatoid arthritis and diabetes mellitus

Alters lipid profile in people with rheumatoid arthritis

Convalescent plasma

Provides anti-SARS-CoV-2 antibodies

Not known

Not known

Strategies for Managing Chronic Pain

The COVID-19 public health crisis has strained health care systems, creating an enigma for patients, pain medicine practitioners, hospital leaders, and regulatory officials [26]. Pain management providers rely on infection control precautions form a backbone of interventional- based and some alternative medicine to include: acupuncture, hands- on therapies such as massage and manual therapy practices [26]. These precautions are even more important during a pandemic where the potential exists for viral shedding from asymptomatic patients and disease transmission [26]. The clinicians need to acknowledge that many patients who would be seen in for chronic pain issues during the COVID-19 pandemic are in higher risk groups and full consideration should be given to minimizing patients congregating in a waiting room. Specialists should familiarize themselves to the new Health Human Services and Centers for Medicare and Medicaid Services relaxations on telemedicine provide a method for new patient and established patient visits [26]. In patients on opioids who may have run out of medications because of logistical obstacles or overuse, assessment of withdrawal signs can be challenging during remote visits. These symptoms such as diarrhea, rhinorrhea, abdominal pain and chills can be garnered from patient interviews, but may be difficult to corroborate [26]. On the other hand, some physical signs indicative of opioid withdrawal, particularly if prominent, can be observed remotely such as agitation, diaphoresis, piloerection, and possibly even pupillary size [26]. Monitoring patients for an elevated heart or pulse rate, which is a classic sign of opioid withdrawal, can sometimes be done by reliable patients or their caregivers [26]. The salient point that typical symptoms of COVID-19 overlap the typical symptoms of opioid withdrawal has to be realized by the podiatric physician so that a correct diagnosis can be determined and a negative outcome can be avoided. A list of the typical symptoms of COVID-19 infection along with the presenting typical symptoms of opioid withdrawal are presented in Table 2 so a comparison can be appreciated [27,28].

Table 2: Comparison List of the Typical Symptoms of Covid-19 Infection and Opioid Withdrawal Symptoms.

Covid-19 Infection Symptoms [25]

Opioid Withdrawal Symptoms [26] Symptomsappear72hoursafterlastdose

Fever

87.90%

Fever

Dry Cough

67.70%

Chills

Fatigue

38.10%

Body Aches

Sputum Production

Diarrhea

Shortness of Breath

Insomnia

Myalgia-Arthralgia

14.80%

Muscle Pain

Sore Throat

13.90%

Nausea

Headache

13.60%

Dilated Pupils

Chills

11.40%

Nausea-Vomiting

5%

Nasal Congestion

4.80%

Diarrhea

3.70%

Source: National Institute of Drug Abuse.
Source: Report of the WHO China.
Joint Mission on Coromavirus Disease 2019.

Conclusion

First, the negative economic impact of the COVID-19 pandemic and how it exacerbates the opioid crisis in America was presented.

Then certain factors of patients with substance abuse disorders and how they are disadvantaged by excessive and prolonged isolation and social distancing is presented. The effects of opioid use and addiction as well as the pathology Diabetes Mellitus on pulmonary and immune function that effect a patient’s response COVID-19 was presented. Lastly, strategies for managing chronic pain and access to medical care were presented. It is hoped the physician can appreciate the over shadowed area at the intersection of the COVID-19 Pandemic and the Opioid Crisis.

References

  1. Boslett AJ, Denham A, Hill EL (2020) Using contributing causes of death improves prediction of opioid involvement in unclassified drug overdoses in US death records. Addiction 115: 1308-1317.
  2. Monnat SM, Peters DJ, Berg MT, Hochstetler A (2019) Using Census Data to Understand County-Level Differences in Overall Drug Mortality and Opioid-Related Mortality by Opioid Type. Am J Public Health 109: 1084-1091. [crossref]
  3. Woolhandler S, Himmelstein DU (2020) Intersecting US. Epidemics: COVID-19 and Lack of Health Insurance [published online ahead of print, 2020 Apr 7]. Ann Intern Med 173: 63-64. [crossref]
  4. Haffajee RL, Lin LA, Bohnert ASB, Goldstick JE (2019) Characteristics of US Counties with High Opioid Overdose Mortality and Low Capacity to Deliver Medications for Opioid Use Disorder. JAMA Netw Open 2: e196373. [crossref]
  5. Venkataramani AS, Bair EF, O’Brien RL, Tsai AC (2019) Association between Automotive Assembly Plant Closures and Opioid Overdose Mortality in the United States: A Difference-in-Differences Analysis. JAMA Intern Med 180: 254-262. [crossref]
  6. Langabeer  JR,  Chambers  KA,  Cardenas-Turanzas  M,  Champagne-Langabeer   T (2020) County-level factors underlying opioid mortality in the United States [published online ahead of print, 2020 Mar 18]. Subst Abus 1-7.
  7. Gautam S, Franzini L, Mikhail OI, Chan W, Turner BJ (2016) Novel Measure of Opioid Dose and Costs of Care for Diabetes Mellitus: Opioid Dose and Health Care Costs. J Pain 17: 319-327. [crossref]
  8. Schiemsky T, Vundelinckx G, Croes K, Penders J, Desmet K, et al. (2020) An unconscious man with profound drug-induced hypoglycaemia. Biochem Med (Zagreb) 30: 010802. [crossref]
  9. Makunts TUA, Atayee RS, Abagyan R (2019) Retrospective analysis reveals significant association of hypoglycemia with tramadol and methadone in contrast to other opioids. Sci Rep 9: 12490. [crossref]
  10. COVID-19: Potential Implications for Individuals with Substance Use Disorders. National Institute of Drug Abuse. Nora’s Blog Volkow N. 2020.
  11. Volkow ND (2020) Collision of the COVID-19 and Addiction Epidemics [published online ahead of print, 2020 Apr 2]. Ann Intern Med 173: 61-62. [crossref]
  12. Mukherjee TI, El-Bassel N (2020) The perfect storm: COVID-19, mass incarceration and the opioid epidemic [published online ahead of print, 2020 Jun 11]. Int J Drug Policy 102819.
  13. Schwetz TA, Calder T, Rosenthal E, Kattakuzhy S, Fauci AS (2019) Opioids, and Infectious Diseases: A Converging Public Health Crisis. J Infect Dis 220: 346-349. [crossref]
  14. Wiese AD, Griffin MR, Schaffner W, Stein CM, Greevy RA, et al. (2018) Opioid Analgesic Use and Risk for Invasive Pneumococcal Diseases: A Nested Case-Control Study. Ann Intern Med 168: 396-404. [crossref]
  15. Ronan MV, Herzig SJ (2016) Hospitalizations related to opioid abuse/dependence and associated serious infections increased sharply, 2002-12. Health Aff (Millwood) 35: 832-837. [crossref]
  16. Jackson KA, Bohm MK, Brooks JT, Asher A, Nadle J, et al. (2018) Invasive methicillin- resistant Staphylococcus aureus infections among persons who inject drugs– six sites, 2005-2016. MMWR Morb Mortal Wkly Rep 67: 625-628. [crossref]
  17. Wiese AD, Griffin MR, Schaffner W, Stein CM, Greevy RA, et al. (2019) Long-acting Opioid Use and the Risk of Serious Infections: A Retrospective Cohort Study. Clin Infect Dis 68: 1862-1869. [crossref]
  18. Karagiannis TT, Cleary JP, Gok B, et al. (2020) Single cell transcriptomics reveals opioid usage evokes widespread suppression of antiviral gene program. Nat Commun 11: 2611.
  19. Centers for Disease Control and Prevention. National Diabetes Statistics Report, 2020. Atlanta, GA: Centers for Disease Control and Prevention, US Department of Health and Human Services. 2020.
  20. Muniyappa R, Gubbi S (2020) COVID-19 pandemic, coronaviruses, and diabetes mellitus. Am J Physiol Endocrinol Metab 318: E736-E741. [crossref]
  21. Yang JK, Feng Y, Yuan MY, Yuan SY, Fu HJ, et al. (2006) Plasma glucose levels and diabetes are independent predictors for mortality and morbidity in patients with SARS. Diabet Med 23: 623-628. [crossref]
  22. Hodgson K, Morris J, Bridson T, Govan B, Rush C, et al. (2015) Immunological mechanisms contributing to the double burden of diabetes and intracellular bacterial infections. Immunology 144: 171-185. [crossref]
  23. Hussain A, Bhowmik B, do Vale Moreira NC (2020) COVID-19 and diabetes: Knowledge in progress. Diabetes Res Clin Pract 162: 108142. [crossref]
  24. Bode B, Garrett V, Messler J, Raymie McF, Jennifer C, et al. (2020) Glycemic Characteristics and Clinical Outcomes of COVID-19 Patients Hospitalized in the United States. J Diabetes Science and Technology 1-9. [crossref]
  25. Pal R, Bhadada SK (2020) COVID-19 and diabetes mellitus: An unholy interaction of two pandemics. Diabetes & Metabolic Syndrome: Clinical Research & Reviews 14: 513-517. [crossref]
  26. Cohen SP, Baber ZB, Buvanendran A, McLean BC, Chen Y, et al. (2020) Pain Management Best Practices from Multispecialty Organizations during the COVID-19 Pandemic and Public Health Crises [published online ahead of print, 2020 Apr 7]. Pain Med 21: 1331-1346. [crossref]
  27. Aylward B, Liang W (2020) The WHO-China joint mission of 25 national and international experts was held from 16-24.
  28. Drug Withdrawal Symptoms. Accessed June 28, 2020.

Prevalence of Colorectal Polyps in Patients with Chronic Hepatitis C Virus Infection in a Multi-Ethnic Hospital Population

DOI: 10.31038/AGHE.2020211

Abstract

Chronic hepatitis C virus infection has been associated with pre-cancerous colorectal lesions; however, there are limited data regarding the prevalence of Colorectal Polyps (CRP) in patients with Chronic Viral Hepatitis C (C-HCV). Accordingly, we conducted a retrospective study to explore this potential association by the review of an endoscopy database that included 1928 charts of adult patients who had undergone colonoscopies, and that revealed a higher prevalence of CRP in individuals with C-HCV, 67.1%, than in those without, 51.3%, (p= 0.001). Hyperplastic polyps comprised 56.8%, and tubular adenomata 36.5% of the polyps reported.In addition, there was a preponderance of C-HCV in subjects of Hispanic ethnicity, men, and individuals who had a history of smoking and alcohol use. The most common hepatitis C virus genotype was 1a, 62%.The prevalence of CRP in patients with C-HCV was higher than in those without; however, there was no significant association between C-HCV and adenomatous polyps, which suggests that C-HCV does not predispose to colorectal cancer.

Background

Chronic hepatitis C (C-HCV) is an important public health concern; thus, the impact of this viral infection on other comorbidities is of interest. Colorectal Polyps (CRP) are common gastrointestinal lesions but there are limited data regarding their prevalence in patients with C-HCV.

As C-HCV has been associated with malignancy [1-6], we hypothesized that CRPs would be more common in patients with C-HCV than in those without. Accordingly, the aim of this study was to explore that prevalence of CRPs, which can develop into colorectal cancer, in patients with C-HCV who had had a screening colonoscopy at H+H, Metropolitan, a community hospital that serves the multiethnic population of East Harlem.

Methods

Data from records of 1,928 patients who had a complete colonoscopy report in the database from the Division of Gastroenterology and Hepatobiliary Diseases from January 1st, 2011 to December 31st, 2015 were retrospectively reviewed. The study group was comprised of adults with C-HCV, defined as detected HCV RNA in serum, who had undergone a complete screening or diagnostic colonoscopy after a good bowel preparation confirmed during the procedure.The control group was composed of patients who underwent a screening colonoscopy and who did not have antibodies for the hepatitis C virus.

In addition, we examined some of the characteristics of the population such as ethnicity, gender, and toxic habits to explore potential associations with C-HCV. Correlations between categorical variables were analyzed by the use of Chi-square test, and t-test for continuous variables between groups. Bivariate analysis was applied to identify any links between the exposure variable and the outcome variable. A p value of < 0.05 was considered significant. Statistical analysis was performed with SPSS 24 software. This study was approved by the Biomedical Research Alliance of New York (BRANY).

Results

Among 1928 individuals with complete colonoscopies, we identified 960 patients who had been tested for hepatitis C virus infection, of whom 159 had C-HCV. Gender was the only factor that was significantly different in the C-HCV group versus the control, with the majority, 65%, being men (p<0.001) (Figure1). Fifty-three percent of the patients with C-HCV self-identified as Hispanics. In addition, 34% and 38% of the patients in the HCV infected group reported an active/former smoker status or admitted being at least a social alcohol consumer, respectively.

AGHE-2-1-203-g001

Figure 1. Complete colonoscopies among 1928 individuals.

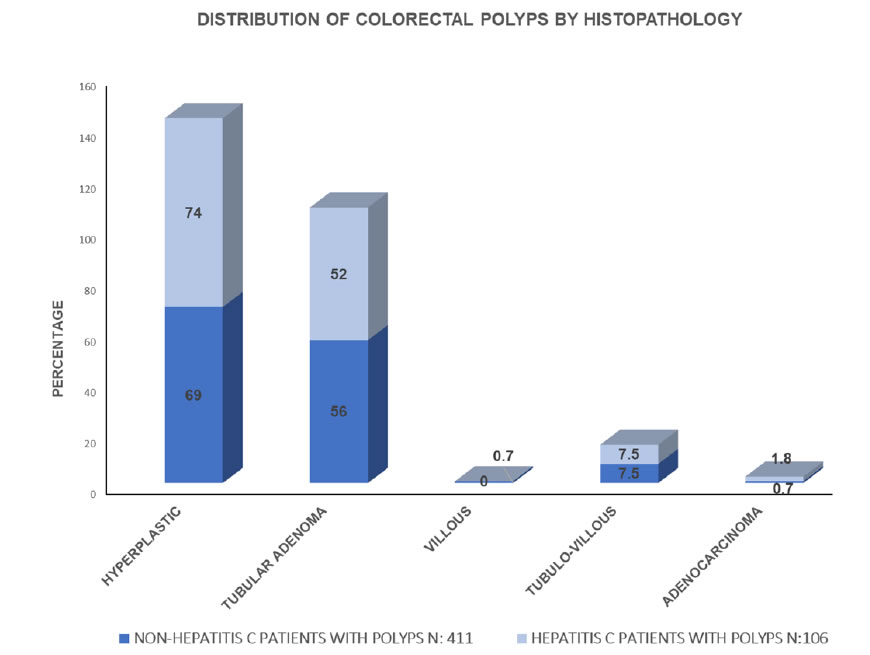
There was a higher prevalence of CRP in individuals with C-CHV, 67.1%, in comparison with those without, 51.3% (p= 0.001). Hyperplastic polyps comprised 56.8% of the polyps and tubular adenomata, 36%. Hyperplastic was the histopathologic predominant type in patients with C-HCV, 75%, and in the control group, 69%; however, this difference was statistically significant (p<0.005). Most patients with C-HCV, 62%, had genotype 1a (Figure 2). Mostpatients with C-HCV, 62%, had genotype 1a.

AGHE-2-1-203-g002

Figure 2. Distribution of colorectal polyps by histopathology.

Discussion

In this study, the prevalence of CRP in patients with C-HCV was higher than in those without.The predominant histology of the CRP was hyperplastic. There was a preponderance of C-HCV in men, in smokers, in those who used alcohol, and in subjects of Hispanic ethnicity, consistent with the ethnicity of the majority of patients attended at Metropolitan Hospital.

Colorectal cancer has been associated with C-HCV [7]; however, we excluded from this study patients with history or active colorectal cancer.CRP were more prevalent in the C-HCV group of patients with a predominance of hyperplastic histology [8-44]. Hyperplastic Polyps (HP) are included in the serrated polyp classification [45-50], which encompasses Sessile Serrated Lesions (SSL) and Traditional Serrated Adenomas (TSA).SSL and TSA have been associated with malignancy; however, none of the polyps found in this study had a serrated histology.

The HCV virus itself may stimulate cell proliferation, inflammation and apoptosis increasing the risk of polyp formation [26-29]. The hepatitis C virus has been found in colonic cells such as lymphocytes, macrophages, monocytes [6,8-15]. As polyps possibly result from a defective/enhanced repair process after a mucosal injury [26], and mutations seem to be the molecular events leading to polyp’s formation, we may speculate that the presence of viral RNA in the colonic mucosal cells may also cause some disruption in this process [51-78].

53% and 38% of the patients with C-HCV reported active or former smoker status or admitted being at least a social alcohol consumer.Cigarette smoking has been associated with an increased in progression of liver disease in patients with C-HCV [20]. In this study, data were recorded as current smokers and former smokers while the Nonsmokers (NS) were those who stated have never smoked. This group was comprised of 34% of the patients with C-HCV versus 14% in the control group, a difference that was statistically significant (p<0.001). This finding is consistent with a prior report [18,19].

The association between alcohol use disorder and C-HCV has been described [23,24]. Alcohol use was reported more frequently by the patients with C-HCV, 38% versus 20% in the control group (p< 0.001).

In summary,there was a preponderance of C-HCV, most commonly genotype 1a, among subjects of Hispanic ethnicity, men, and individuals who had a history of smoking and alcohol use.Hepatitis C virus infection is not associated with adenomatous colonic polyps, and thus, it does not predispose by itself to colorectal cancer.

References

  1. Crovatto M,Pozzato G, Zorat F,Pussini E, Nascimben F,et al. (2000) Peripheral blood neutrophils from hepatitis C virus infected patients are replication sites of the virus. Haematologica 85: 356-361. [crossref]
  2. Sansonno D,Lauletta G, Montrone M, Grandaliano G, Schena FP, et al. (2005)Hepatitis C virus RNA and core protein in kidney glomerular and tubular structures isolated with laser capture microdissection. Clin. Exp. Immunol140: 498-506. [crossref]
  3. Kurokawa M, Hidaka T, Sasaki H, Nishikata I, Morishita K, et al.(2003)Analysis of Hepatitis C Virus (HCV) RNA in the lesions of lichen planus in patients with chronic hepatitis C: detection of anti-genomic- as well as genomic-strand HCV RNAs in lichen planus lesions. J. Dermatol. Sci 32: 65-70. [crossref]
  4. Carrozzo M,Quadri R, Latorre P, Pentenero M, Paganin S,et al. (2002)Molecular evidence that the hepatitis C virus replicates in the oral mucosa. J. Hepatol 37: 364-369. [crossref]
  5. Toussirot E,Le Huédé G,Mougin C,Balblanc JC, Bettinger D,et al. (2002)Presence of hepatitis C virus RNA in the salivary glands of patients with Sjögren’s syndrome and hepatitis C virus infection. J. Rheumatol 29: 2382-2385. [crossref]
  6. Yan FM,Chen AS, Hao F, Zhao XP, Gu CH,et al. (2000)Hepatitis C virus may infect extrahepatic tissues in patients with hepatitis C. World J. Gastroenterol6: 805-811. [crossref]
  7. Fu-Hsiung S,Mekky MA, Khalil NK, Mohamed WA, El-Feky MA,et al. (2011) The association between chronic hepatitis C infection and colon cancer: a nationwide case control study. BMC Cancer 11: 495. [crossref]
  8. Hetta HF, Mekky MA, Khalil NK, Mohamed WA, El-Feky MA,et al.(2016) Extra-hepatic infection of hepatitis C virus in the colon tissue and its relationship with hepatitis C virus pathogenesis. Journal of Medical Microbiology 65: 703-712. [crossref]
  9. Castillo I, Rodríguez-Iñigo E, Bartolom_e J, de Lucas S, Ortíz-Movilla N, et al. (2005) Hepatitis C virus replicates in peripheral blood mononuclear cells of patients with occult hepatitis C virus infection. Gut 54: 682-685. [crossref]
  10. Chang TT, Young KC, Yang YJ, Lei HY, Wu HL (1996) Hepatitis C virus RNA in peripheral blood mononuclear cells: comparing acute and chronic hepatitis C virus infection. Hepatology 23: 977-981. [crossref]
  11. Manzin A, Candela M, Paolucci S, Caniglia ML, Gabrielli A, Clementi M (1994)Presence of hepatitis C virus (HCV) genomic RNA and viral replicative intermediates in bone marrow and peripheral blood mononuclear cells from HCV-infected patients. Clin Diagn Lab Immunol 1: 160-163. [crossref]
  12. Saleh MG, Tibbs CJ, Koskinas J, Pereira LM, Bomford AB, et al. (1994) Hepatic and extrahepatic hepatitis C virus replication in relation to response to interferon therapy. Hepatology 20: 1399-1404.
  13. Wang JT, Sheu JC, Lin JT, Wang TH, Chen DS (1992) Detection of replicative form of hepatitis C virus RNA in peripheral blood mononuclear cells. J Infect Dis 166: 1167-1169. [crossref]
  14. Blackard JT, Kong L, Huber AK, Tomer Y (2013) Hepatitis C virus infection of a thyroid cell line: implications for pathogenesis of hepatitis C virus and thyroiditis. Thyroid 23: 863-870. [crossref]
  15. Fletcher NF, Wilson GK, Murray J, Hu K, Lewis A, et al. (2012) Hepatitis C virus infects the endothelial cells of the bloodbrain barrier. Gastroenterology 142: 634-643. [crossref]
  16. https://furmancenter.org/neighborhoods/view/east-harlem
  17. Harrell, Trenz RC,Scherer M,Pacek LR, Latimer WW,et al. (2020) Cigarette smoking, illicit drug use, and routes of administration among heroin and cocaine users. Addict Behav 37: 678-681. [crossref]
  18. Kim RS, Weinberger AH, Chander G, Sulkowski MS, Norton B, et al. (2018) Cigarette Smoking in Persons Living with Hepatitis C: The National Health and Nutrition Examination Survey (NHANES), 1999-2014.Am J Med131: 669:675. [crossref]
  19. ChewKW, Bhattacharya D, McGinnis KA,Horwich TB, Tseng CH,etal. (2015) Short communication: coronary heart disease risk by Framingham risk score in hepatitis C and HIV/Hepatitis C-Coinfected persons.AIDS ResHumRetroviruses 31: 718-722. [crossref]
  20. HCV Guidance: Recommendations for Testing, Managing, and Treating Hepatitis C. 2014-2020 AASLD and IDSA v2020.4. www.HCVGuidance.org on May 25, 2020.
  21. Shi et al. (2010) Smoking and Pain.Pathophysiology and Clinical Implications. Anesthesiology113:977-979
  22. Weinberger AH, Platt J, EsanH,Galea S,Erlich D,et al. (2017) Cigarette smoking is associated with increased risk of substance use disorder relapse: A nationally: representative, prospective longitudinal investigation. Journal of Clinical Psychiatry 78: e152-e160. [crossref]
  23. Lieber CS. (2001) Alcohol and Hepatitis C. Alcohol Research & Health25: 245-254.
  24. Rosman AS, Waraich A, Galvin K, Casiano J, Paronetto F,et al. (1996) Alcoholism Is Associated With Hepatitis C but Not Hepatitis B in an Urban Population. Am J Gastroenterol 91: 498-505. [crossref]
  25. “Excessive Alcohol Use”. www.cdc.gov/chronicdisease. n.d. Accessed on May 25, 2020
  26. Lemon SM, McGivern DR (2012) Is Hepatitis C Virus Carcinogenic? Gastroenterology 142: 1274-1278. [crossref]
  27. Hurtado-Cordovi J, Davis-YadleyAH, Lipka S, Vardaros M, Shen H(2016) Association between chronic hepatitis C and hepatitis C/HIV co-infection and the development of colorectal adenomas. J Gastrointest Oncol 7: 609-614. [crossref]
  28. Rustagi T, Zarookian EI, Qasba O,Diez LF(2014) Chronic hepatitis C as a risk factor for colorectal adenoma. IntJ Colorectal Dis29: 75. [crossref]
  29. Mitchell JK, Midkiff BR, Israelow B, Evans MJ, Lanford RE, et al. (2017) Hepatitis C virus indirectly disrupts DNA damage-induced p53 responses by activating protein kinase R. mBio 8: e00121-17. [crossref]
  30. Hepatitis C online. HCV Epidemiology in the United States. Accessed on May 23, 2020.
  31. Butterfield MI,Bosworth HB,Meador KG,Stechuchak KM,Essock SM, et al. (2003)Gender Differences in Hepatitis C Infection and Risks Among Persons With Severe Mental Illness. Psychiatric Services 54:848-853. [crossref]
  32. Midgley L, et al. (2017) Acute hepatitis C infection in lower risk MSM: an evolving picture. British HIV Association conference, abstract O24, Liverpool.
  33. Dodge JL, Terrault NA (2014) Sexual transmission of hepatitis C: A rare event among heterosexual couples. J CoagulDisord 4: 38-39. [crossref]
  34. CF Kelley, Kraft CS,de Man TJ,Duphare C,Lee HW,et al. (2016) The rectal mucosa and condomless receptive anal intercourse in HIV-negative MSM: implications for HIV transmission and prevention 10: 996-1007. [crossref]
  35. Harawa NT,Williams JK,Ramamurthi HC,Manago C,Avina S,et al. (2008) Sexual Behavior, Sexual Identity, and Substance Abuse Among Low-Income Bisexual and Non-Gay-Identifying African American Men Who Have Sex with Men. Arch Sex Behav 37: 748-762. [crossref]
  36. Levran O, Yuferov V,Kreek MJ(2012) The genetics of the opioid system and specific drug addictions. Hum Genet131: 823-842. [crossref]
  37. Bart G, Kreek MJ, Ott J, LaForge KS, Proudnikov D, et al. (2005) Increased attributable risk related to a functional mu-opioid receptor gene polymorphism in association with alcohol dependence in central Sweden. Neuropsychopharmacology 30: 417-422.[crossref]
  38. Deb I, Chakraborty J, Gangopadhyay PK, Choudhury SR, Das S(2010) Single-nucleotide polymorphism (A118G) in exon 1 of OPRM1 gene causes alteration in downstream signaling by mu-opioid receptor and may contribute to the genetic risk for addiction. J Neurochem 112: 486-496. [crossref]
  39. Kim SG, Kim CM, Kang DH, Kim YJ, Byun WT, et al. (2004) Association of functional opioid receptor genotypes with alcohol dependence in Koreans. Alcohol Clin Exp Res 28: 986-990. [crossref]
  40. Nishizawa D, Han W, Hasegawa J, Ishida T, Numata Y, et al. (2006) Association of muopioid receptor gene polymorphism A118G with alcohol dependence in a Japanese population. Neuropsychobiology 53: 137-141. [crossref]
  41. Rommelspacher H, Smolka M, Schmidt LG, Samochowiec J, Hoehe MR(2001) Genetic analysis of the muopioid receptor in alcohol-dependent individuals. Alcohol 24: 129-135. [crossref]
  42. Spooner C, Hetherington K(2004) Social determinants of drug use. Technical Report Number 228. ISBN: 0 7334 2244 6. National Drug and Alcohol Research Centre, University of New South Wales, Sydney.
  43. Fu-Hsiung S, et al. (2011) The association between chronic hepatitis C infection and colon cancer: a nationwide case control study.BMC Cancer 11: 495.
  44. Kamiza,Su FH,Wang WC,Sung FC,Chang SN,et al. (2016) Chronic hepatitis infection is associated with extrahepatic cancer development: a nationwide population-based study in Taiwan. BMC Cancer16:861. [crossref]
  45. Singh R, Zorrón Cheng Tao Pu L, Koay D, Burt A(2016) Sessile serrated adenoma/polyps: Where are we at in 2016? World J Gastroenterol 22: 7754-7759. [crossref]
  46. Crockett SD, Nagtegaal ID (2019) Terminology, Molecular Features, Epidemiology, and Management of Serrated Colorectal Neoplasia. Gastroenterology 157: 949-966. [crossref]
  47. Ensari A, Bilezikci B, Carneiro F, Doğusoy GB,Driessen A,et al. (2012) Serrated polyps of the colon: how reproducible is their classification? Virchows Arch 461:495-504. [crossref]
  48. Rau TT, Agaimy A, Gehoff A, Geppert C, Jung K,et al. (2014) Defined morphological criteria allow reliable diagnosis of colorectal serrated polyps and predict polyp genetics. Virchows Arch464:663-672. [crossref]
  49. World Health Organization (2019) Classification of Tumors of the Digestive Tract. Lyon: IARC Press.
  50. O’Brien MJ, Yang S, Clebanoff JL, Mulcahy E,Farraye FA,et al. (2004) Hyperplastic (serrated) polyps of the colorectum: relationship of CpG island methylator phenotype and K-ras mutation to location and histologic subtype. Am J Surg Pathol28:423-434. [crossref]
  51. Kim CW, Chang K-M (2013) Hepatitis C virus: virology and life cycle. Clinical and Molecular Hepatology Review 19: 17-25. [crossref]
  52. Morimoto LM, Newcomb PA, Ulrich CM,Bostick RM,Lais CJ, et al. (2002) Risk Factors for Hyperplastic and Adenomatous Polyps: Evidence for Malignant Potential? Cancer Epidemiology, Biomarkers & Prevention 11: 1012-1018. [crossref]
  53. Russelli G, Pizzillo P, Iannolo G, Barbera F, Tuzzolino F, et al. (2017) HCV replication in gastrointestinal mucosa: Potential extra-hepatic viral reservoir and possible role in HCV infection recurrence after liver transplantation. PLoS ONE 12: e0181683. [crossref]
  54. Bare P (2009) Hepatitis C virus and peripheral blood mononuclear cell reservoirs Patricia Bare. World J Hepatol 1: 67-71. [crossref]
  55. Bare P, Massud I, Parodi C, Belmonte L, Garcia G, Nebel MC, et al. (2005) Continuous release of Hepatitis C Virus (HCV) by peripheral blood mononuclear cells and B-lymphoblastoid cell-line cultures derived from HCV-infected patients. J GenVirol 86: 1717-1727. [crossref]
  56. Caussin-Schwemling C, Schmitt C, Stoll-Keller F(2001) Study of the infection of human blood derived monocyte/macrophages with hepatitis C virus in vitro. J Med Virol 65:14-22. [crossref]
  57. Goutagny N, Fatmi A, De Ledinghen V, Penin F, Couzigou P, et al. (2003) Evidence of viral replication in circulating dendritic cells during hepatitis C virus infection. J Infect Dis 187:1951-1958. [crossref]
  58. Haruna Y, Kanda T, Honda M, Takao T, Hayashi N (2001) Detection of hepatitis C virus in the bile and bile duct epithelial cells of hepatitis C virus-infected patients. Hepatology 33: 977-980. [crossref]
  59. Januszkiewicz-Lewandowska D, Wysocki J,Pernak M, Nowicka K, Zawada M, et al. (2007) Presence of hepatitis C virus (HCV)-RNA in peripheral blood mononuclear cells in HCV serum negative patients during interferon and ribavirin therapy. Jpn J Infect Dis 60: 29-32. [crossref]
  60. Moradpour D, Penin F, Rice CM (2007) Replication of hepatitis C virus. Nat Rev Microbiol 5:453-463. [crossref]
  61. Sansonno D, Lauletta G, Montrone M, Tucci FA, Nisi L, et al. (2006) Virological analysis and phenotypic characterization of peripheral blood lymphocytes of hepatitis C virus-infected patients with and without mixed cryoglobulinaemia. Clin ExpImmunol 143:288-296. [crossref]
  62. McGivern DR, Lemon SM (2011) Virus-specific mechanisms of carcinogenesis in hepatitis C virus associated liver cancer. Oncogene 30: 1969-1983. [crossref]
  63. Otori K, Oda Y, Sugiyama K, Hasebe T,Mukai K, et al. (1997) High frequency of K-ras mutation in human colorectal hyperplastic polyps. Gut 40: 660-663. [crossref]
  64. Zahm SH, Cocco P, Blair A (1991) Tobacco smoking as a risk factor for colon polyps. Am. J. Public Health81: 846-849. [crossref]
  65. Kearney J, Giovannucci E, Rimm EB, Stampfer M, Colditz GA, et al. (1995) Diet, alcohol, and smoking and the occurrence of hyperplastic polyps of the colon and rectum (United States). Cancer Causes Control, 6: 45-56. [crossref]
  66. Martinez ME, McPherson RS, Levin B, Glober GA(1997) A case control study of dietary intake and other lifestyle risk factors for hyperplastic polyps. Gastroenterology 113: 423-429. [crossref]
  67. Gordon SC, Trudeau S, Li J,Zhou Y,Rupp LB,et al. (2019) Race, Age, and Geography Impact Hepatitis C Genotype Distribution in the United States. J Clin Gastroenterol 53: 40-50. [crossref]
  68. Iloeje UH, Yang HI, Jen CL, Su J, Wang LY, et al. (2010) Risk of pancreatic cancer in chronic hepatitis B virus infection: data from the REVEAL-HBV cohort study. Liver Int 30: 423-429. [crossref]
  69. Fwu CW, ChienYC, Nelson KE, Kirk GD, You SL, et al. (2010) Mortality after chronic hepatitis B virus infection: a linkage study involving 2 million parous women from Taiwan. J Infect Dis201:1016-1023. [crossref]
  70. Engels EA, Cho ER, Jee SH (2010) Hepatitis B virus infection and risk of non-Hodgkin lymphoma in South Korea: a cohort study. Lancet Oncol11:827-834. [crossref]
  71. Fwu CW, Chien YC, You SL, Nelson KE, Kirk GD, et al. (2011) Hepatitis B virus infection and risk of intrahepatic cholangiocarcinoma and non-Hodgkin lymphoma: a cohort study of parous women in Taiwan. HepatolBaltimMd53:1217–1225. [crossref]
  72. UlcickasYood M, Quesenberry CP, Guo D, Caldwell C, Wells K, Shan J, et al. (2007) Incidence of non-Hodgkin’s lymphoma among individuals with chronic hepatitis B virus infection. HepatolBaltim Md. 46:107-112.
  73. Amin J, Dore GJ, O’Connell DL, Bartlett M, Tracey E, et al. (2006) Cancer incidence in people with hepatitis B or C infection: a large community based linkage study. J Hepatol45:197-203. [crossref]
  74. Manos MM, Shvachko VA, Murphy RC, Arduino JM, Shire NJ(2012) Distribution of hepatitis C virus genotypes in a diverse US integrated health care population. J Med Virol 84: 1744-1750. [crossref]
  75. Xie Y, Garza G, Dong J (2016) Hepatitis C virus genotype and subtype distribution in patient specimens tested at the University of Texas Medical Branch, Galveston, Between January 2011 and November 2014. LabMed 47: 112-118. [crossref]
  76. G Hoff, MH Vatn, Larsen S. Relationship between Tobacco Smoking and Colorectal Polyps. Scandinavian Journal of Gastroenterology 22: 1987. [crossref]
  77. Narayan S, Roy D (2003) Role of APC and DNA mismatch repair genes in the development of colorectal cancers. Molecular Cancer 2: 41. [crossref]
  78. Meseeha M, Attia M (2020) Colon Polyps. In: StatPearls [Internet]. Treasure Island (FL): StatPearls Publishing. [crossref]

The Urgent Need to Optimize Gestational Weight in Overweight/Obese Women to Lower Maternal- Fetal Morbidities: A Retrospective Analysis on 59,000 Singleton Term Pregnancies

DOI: 10.31038/AWHC.2020342

Abstract

Objective: We retrospectively did a simulation applying the optimal gestational weight gain (optGWG) equation (that we have proposed in 2018) on our population, and observed if its effect on maternal/fetal morbidities in singleton term pregnancies (≥37 weeks).

Design: Retrospective observational study.

Setting: Single large tertiary maternity unit in Reunion Island, Indian Ocean, overseas French department.

Population or sample: All consecutive singleton births delivered at the Centre Hospitalier Universitaire Hospitalier Sud Reunion’s maternity. Standardized epidemiological perinatal database.

Methods: Mathematical simulation on a 19-year historical cohort (2001-2019).

Main outcome measures: Five Maternal/fetal morbidities.

Results: Beginning with overweight women, and enlarging the effect with the rise of different obesities (class I to III) and considering maternal pre- pregnancy BMI (ppBMI), individualized counselling women on their GWG (optimal gestational weight gain, optGWG) lowers significantly maternal/ fetal morbidities: in a logistic regression model among overweight/obese women, with the outcome optGWG, several morbidities have a negative coefficient as independent factors: cesarean-section, birthweight ≥ 4000 g, term preeclampsia, lowering the effect of rising maternal ppBMI per increment of 5 kg/m2 (coefficient -0.13), all p < 0.001.

We propose as a prediction to be verified in future prospective studies that a follow-up and counselling since the first prenatal visit should also lower gestational diabetes mellitus rates.

Conclusion: We may have significant health (and cost) benefits by lowering c-section rates, term preeclampsia, macrosomic babies and LGA babies  in overweight/obese women and low-birthweights babies in lean women. We  may have much to win from reducing weight gain during pregnancy in overweight/obese women. It is urgent to verify and establish in all continents the specific linear-curve of optGWG for each geographic/ethnic area.

Keywords

Pregnancy, Epidemiology, Pre-pregnancy body mass index, Gestational weight gain, Caesarean section, Obesity, Preeclampsia

Introduction

Based on a simple axiom: “what is the optimal gestational weight (optGWG) in women to achieve in term pregnancies the natural rate of 10% of SGA (small for gestational age) as well as 10% of LGA (Large for gestational age) in newborns”, we have found in our population that it is a mathematical linear equation: opGWG (kg) = -1.2 ppBMI (Kg/m2) + 42 ± 2 kg [1,2].

As a matter of fact, when we plot on a graph maternal pre- pregnancy BMI (ppBMI), and the babies’ percentiles, 10% SGA- LGA 10% is materialized by a crossing point. The fact that  this 10% corresponds to a given maternal BMI category suggests that there is a biological maternal-foetal connection. We proposed to call this crossing point the Maternal-Fetal Corpulence Symbiosis (MFCS) [1].

Also, since it is a mathematical linear equation it allows that    all single women may be considered as a single plot and that we may calculate for each woman at the beginning of pregnancy the individualized optGWG for that pregnancy. Analysing our 19-year cohort, we applied our linear equation on this study population, looking if our proposed optGWG would have changed important outcomes in our population (mathematical simulation).

The purpose of this study is, first, to collect what have been several important maternal/fetal morbidities in our term pregnancies during this 19-year clinical experience: rates of cesarean section, term preeclampsia, gestational diabetes mellitus in women, rates of SGA, LGA, macrosomia (≥ 4kg), low birthweights (< 2500g) and transfers in the neonatal department of newborns. Second, to make  a simulation of what would have happened in women with optGWG (optimal weight gain ± 2kg) and those with moderately insufficient or excessive GWG (± 3-9kg as compared with optGWG) or severely insufficient or excessive GWG (± 10kg as compared with optGWG).

Material and Methods

From January 1st, 2001, to December 31st, 2019, the hospital records of all women who gave birth at the maternity of the University South Reunion Island were abstracted in a standardized fashion. The study sample was drawn from the hospital perinatal database which prospectively records data of all mother-infant pairs since 2001. Information is collected at the time of delivery and at the infant hospital discharge and regularly audited by appropriately trained staff. This epidemiological perinatal data base contains information on obstetrical risk factors, description of delivery, and maternal and neonatal outcomes. For the purpose of this study, records have been validated and have been used anonymously. All pregnant women in Reunion Island as part of the French National Health Care System have their prenatal visits, biological and ultasonographic examinations, and anthropological characteristics recorded in a maternity booklet.

Preeclampsia, gestational hypertension and eclampsia were diagnosed according to the definition issued by the International Society for the Study of Hypertension in Pregnancy (ISSHP) relatively to the guidelines in force at the year of pregnancy. In the present study, because optimal weight gain has been described only for term pregnancies [1], we have selected only women who delivered live births at term (37-42 weeks).

Design and Study Population

The maternity department of Saint Pierre hospital is a tertiary care centre that performs about 4,300 deliveries per year, thus representing about 85% of deliveries of the Southern area of Reunion Island, and it is the only level-3 maternity (the other maternity is a private clinic). Reunion Island is a French overseas region in the Southern Indian Ocean. The entire pregnant population has access to maternity care free of charge as provided by the French healthcare system, which combines freedom of medical practice with nationwide social security. Prenatal system is based on scheduled appointments (9 prenatal visits and on average 4 ultrasounds) starting from 6 to 8 (see below) weeks of gestation.

Definition of Exposure and Outcomes

Booking BMI (ppBMI), was obtained at the first antenatal visit (average 6-8 weeks). Women are systematically weighted at their arrival in labour & delivery. In rare cases of imminent delivery (< 10%) the documented weight during the last antenatal visit prior to birth was used for calculations.

Primary Outcome

We arbitrarily created 5 categories of GWG using the published formula:

(optGWG = -1.2x +42 ppBMI -kg/m2– ± 2 kg) [1] defined in our population of Reunion island.

– Optimal GWG range: optimal GWG result PLUS or MINUS 2 kg (the formula).

– Insufficient GWG:

• Moderately insufficient: adequate GWG minus 3 to minus 9 kg.

• Severely insufficient: adequate GWG minus 10 kg and below:

– Excessive GWG:

• Moderately excessive: adequate GWG PLUS 3 to plus 9 kg.

• Severely excessive: adequate GWG PLUS 10 kg and over.

– Screening of GDM is systematically made in all pregnant women in the first trimester: until 2016 it was the O’Sullivan test (50g glucose, blood glucose level after 1 hour). The threshold for hyperglycemia being 1.4 g/l. Since 2016, this test has been replaced in all women by a fasting glycemia    in the first trimester, the threshold for positivity being 0.92 g/l. As the incidence of gestational diabetes mellitus is very high in Reunion GTT is made (between 24-28 weeks) to ALL pregnant women (even if they have a normal 1st trimester blood glucose). Those who have no GTT are only those who have a 1st trimester blood glucose over 1.26g/l, these last being considered as Type 2 diabetes.

Statistical Analysis

– Data is presented as numbers and proportions (%) for categorical variables and as mean and Standard Deviation (SD) for continuous ones. Comparisons between groups were performed by using χ;2-test; Odds Ratio (OR) with 95% Confidence Interval (CI) was also calculated. Paired t-test was used for parametric and the Mann-Whitney U test for non-parametric continuous variables. P-values <0.05 were considered statistically significant. Epidemiological data have been recorded and analysed with the software EPI-INFO 7.1.5 (2008, CDC Atlanta, OMS), EPIDATA 3.0 and EPIDATA Analysis V2.2.2.183. Denmark.

Ethnic Origin

Reunionese women comprise a melting pot of African and African intermixed populations for ap. 82% of the inhabitants (the 18% other being Europeans from mainland France): Dravidian Indian (South- India, Madras and Pondichery) and very few Chinese origin. Therefore “Reunion origin” comprises roughly African intermixed origin for approximately 75% and Dravidian Indians (South India, Tamils) for 25%. The French Constitution (and therefore laws) forbids ethnicity, religion or political opinions of the citizens on viral or scientific records. Therefore, we could not include ethnicity in any logistical model.

– To validate the independent association of maternal age and other confounding factors on term optimal gestational weight gain (optGWG) we realized a multiple regression logistic model. Variables associated with optGWG in bivariate analysis, with a p-value below 0.1 or known to be associated with the outcome in the literature were included in the model. A stepwise backward strategy was then applied to obtain the final model. The goodness of fit was assessed using the Hosmer-Lemeshow test. A p-value below 0.05 was considered significant. All analyses were performed using MedCalc software (version 12.3.0; MedCalc Software’s, Ostend, Belgium).

– Optimal gestational weight gain (YES/NO) being the outcome measure, we considered the following covariates as possible confounders in this analysis: pre-pregnancy maternal BMI by increment of 5kg/m2, gestational diabetes, caesarean section rates, term preeclampsia, birthweights over 4 kg, and newborn’s transfers in the neonatal departments. We included these variables and calculated the χ² for trend (Mantel extension), the odds ratios for each exposure level compared with the first exposure level.

Results

During the 19-year period, there were 68,047 term (37-42 weeks) singleton live births in University maternity of South-Reunion Island. We could determine gestational weight gain in 65,738 women (96.6% of women) and determine optimal GWG in 59,171 (87%) of women (requirement to have also the information on mothers’ heights to calculate the BMI).

Table 1 shows population characteristics depicts crude results in our population. Pregnancies were well followed (9 prenatal visits, 4.4 ultrasonographies in average), our population is young (27 years in average), with a high rate of women declaring living single (36%), and a high rate of obesity (≥ 30 kg/m2, 17.6%).

Table 1: Population characteristics. Term pregnancies ≥ 37 weeks gestation with known GWG end of pregnancy N=65,738 (96.6% of the entire cohort). Live births only (and total births for intrauterine fetal deaths).

Characteristics

All term pregnancies (≥37 weeks) N=65,738 (%)

Women with optimal weight gain N=12,594

Other women “reference” N=55,453

OR [95% CI] Optimal GWG vs. reference

p-value

Maternal age (SD)

27.7 ± 6.5

27.7 ± 6.5

28.0 ± 6.5

Difference 0.3 year

0.001

Parity ± sd

1.28 ± 1.5

1.24 ± 1.5

1.28 ± 1.5

0.03

Primiparity

25,297 (37.2)

4655 (37.0)

20,642 (37.2)

0.58

Women living single

24,528 (36.2)

4309 (34.3)

20,219 (36.6)

Education > 10 years

38,466 (58.1)

7310 (59.7)

31,156 (58.3)

1.06
[1.02-1.1]

0.005

Origin Reunion Island

55,700 (82.2)

10,403 (82.8)

45,297 (81.9)

NS

BMI (mean ± sd,kg/m2)

24.7 ± 5.9
N=65,738

24.4 ± 4.3
N=12,592

24.8 ± 6.3
N=53,146

Difference
0.4 kg/m²

< 0.0001

Obesity ≥ 30 kg/m²

11,547 (17.6)

1418 (11.3)

10,129 (19.1)

0.54
[0.51-0.57]

< 0.0001

BMI categories

1 ≤19 (underweight)

13,713 (20.8)

1589 (12.6)

12,124 (22.6)

0.51 [0.48-0.55]

< 0.0001

1 20-24 (normal)

26,294 (40.0)

6032 (47.9)

20,262 (38.1)

1.6 [1.53-1.66]

< 0.0001

1 25-29 overweight

14,184 (21.6)

3553 (28.2)

10,631 (20.0)

1.7 [1.58-1.73]

< 0.0001

1 30-34 (obesity I)

7017 (10.7)

1175 (9.3)

5842 (11.0)

0.87 [0.82-0.93]

< 0.0001

1 35-39 (obesity II)

3021 (4.6)

205 (1.6)

2816 (5.3)

0.31 [0.27-0.35]

< 0.0001

1 >40 (obesity III)

1509 (2.2)

38 (0.3)

1471 (2.8)

0.11 [0.08-0.15]

< 0.0001

Smoking

8205 (12.1)

1880 (11.8)

6725 (12.1)

0.96

0.25

Nb of prenatal visits

9.0 ± 2.73

9.1 ± 2.62

8.9 ± 2.74

0.001

Number of ultrasonographies

4.4 ± 1.7

4.4 ± 1.5

4.4 ± 1.7

0.99

0.93

Weight gain (kg)

12.1 ± 6.2
N=65,738

12.6 ± 5.1
N=12,592

11.9 ± 6.5
N=47,798

Difference 0.7 kg

< 0.0001

Gestational diabetes

7061 (10.8)

1371 (11.0)

6103 (11.1)

0.99

0.64

Chronic hypertension

902 (1.3)

141 (1.1)

761 (1.4)

0.81 [0.68-0.97]

0.02

Term preeclampsia

760 (1.1)

100 (0.8)

660 (1.2)

0.66 [0.54-0.82

0.001

Hospitalization

7949 (11.7)

1422 (11.3)

6527 (11.8)

0.95

0.12

C-section

9971 (14.7)

1478 (13.9)

8223 (14.8)

0.93 [0.88-0.98]

0.007

Induced delivery

14,979 (22.0)

2738 (21.7)

12241 (22.1)

0.098

0.42

Birth weight (g)

3184 ± 440

3226 ± 421

3175 ± 447

Difference 51 g

< 0.0001

Low BW <2500 g

3592 (5.3)

473 (3.8)

3119 (5.8)

0.65 [0.6-0.7]

< 0.0001

Small for gestational age

7139 (10.5)

1053 (8.4)

6086 (11.0)

0.74 [0.7-0.8]

< 0.0001

Large for gestational age

6434 (9.5)

1248 (9.9)

5186 (9.4)

1.07 [1.0-1.14]

0.05

Birthweight ≥ 4000 g

2636 (3.9)

473 (3.8)

3119 (5.6)

0.65 [0.59-0.72]

< 0.0001

Neonatal transfers

2918 (4.3)

467 (3.7)

2451 (4.4)

0.83 [0.75-0.92]

0.001

Intrauterine fetal deaths

115/68,179 (0.2)

19/12611 (0.2)

96/55,668 (0.2)

0.87

0.58

When we look at crude results of BMI categories, it is of note (second column, women with optGWG) that only women with normal BMI (20-24.9 kg/m2) reached an acceptable score of optGWG in 48% of cases. For overweight women (25-29.9 kg/m2), 28% of cases only. For underweight women < 19 kg/m2, only 12%. For obese and severe obese women, it is worse: 9% to 1%.

Comparing maternal/foetal morbidities, in these crude  results the compared Odds-ratios between “optGWG” vs. “reference” (those who did not achieve optGWG ± 2kg): C-section rate OR 0.93 [0.88- 0.98], p = 0.007, term preeclampsia OR 0.66 [0.54-0.82], p = 0.001, low birthweights < 2500g, OR 0.65 [0.6-0.7], p = 0.0001, birthweights ≥ 4000 g, OR 0.65 [0.59-0.72], p = 0.0001, neonatal transfers OR 0.83 [0.75-0.92], p = 0.001.

Tables 2-5, with known GWG and ppBMI (information on height), N = 59,171 (87% of the entire cohort) detail the GWG for non-obese women (<25kg/m2), overweight (25-29.9), obese class I (30-34.9 kg/m2) and severe obese (35 kg/m2 and over). We categorized in optGWG, moderately insufficient or excessive optGWG ± 3-9kg, severely insufficient or excessive optGWG ±10kg.

For all the tables (first column on the left) we observed in our population during this 19-year period a majority of women considered by our proposed equation as inadequate GWG:

For Table 2, non obese: 63% in categories of INSUFFICIENT GWG (18,121+4518/36,167).

Table 2: Simulation from the perspective of optimal or non-optimal GWG. Rates (%) of several maternal/foetal morbidities. Non obese women < 25 kg/m2. N=36,167.

Differences with adequate Weight gain Non-obese women

C-section rate (%)

Term preeclampsia (%)

Gestational diabetes

SGA (%)

LGA (%)

BW ≥ 4 kg (%)

Neonatal Transfers (%)

-10 kg and lower N=4518

384 (8.5)

20 (0.4)

295 (6.5)

1028 (22.8)

89 (2.0)

24 (0.5)

181 (4.0)

-3-9 kg, N=18,121

1921 (10.6)

103 (0.6)

1167 (6.4)

2161 (11.9)

1034 (5.7)

316 (1.7)

573 (3.2)

Adequate GWG ± 2 kg, N=7621

985 (12.9)

67 (0.9)

438 (5.8)

629 (8.3)

714 (9.4)

270 (3.5)

270 (3.5)

+3-9 kg. N=5187

786 (15.2)

72 (1.4)

243 (4.7)

302 (5.8)

649 (12.5)

331 (6.4)

204 (3.9)

10 kg+ N=703

125 (17.8)

24 (3.4)

46 (6.6)

41 (5.8)

133 (18.9)

81 (11.5)

31 (4.4)

Observed rates. N=36,167

4201 (11.6)

286 (0.8)

2189 (6.1)

4161 (11.5)

2619 (7.2)

1022 (2.8)

1259 (3.5)

Odds Ratios: “Adequate” vs. observed

1,12 [1.04-1.2] P=0.001

1.11 P=0.21

0.94 P=0.15

0.69 [0.63-0.75] P=0.001

1.32 [1.2-1.4] P=0,001

1.26 [1.1-1.4] P=0.001

1.01 P=0.39

For Table 3, overweight: 47% in categories of EXCESSIVE GWG (4736+1268/12,701).

Table 3: Simulation from the perspective of optimal or non-optimal GWG. Rates (%) of several maternal/foetal morbidities. Overweight women 25-29.9 kg/m2. N=12,701.

Differences with adequate Weight gain Overweight 25-29.9 kg/m2

C-section rate (%)

Term preeclampsia (%)

Gestational diabetes

SGA (%)

LGA (%)

BW ≥ 4 kg (%)

Neonatal Transfers (%)

-10 kg and lower N=267

22 (8.2)

0 (0.0)

52 (19.6)

51 (19.1)

89 (2.0)

11 (4.1)

9 (3.4)

-3-9 kg, N=2877

382 (13.3)

25 (0.9)

519 (18.2)

365 (12.7)

1034 (5.7)

186 (6.5)

91 (3.2)

Adequate GWG ± 2 kg, N=3553

522 (14.7)

22 (0.6)

577 (16.4)

294 (8.3)

714 (9.4)

377 (10.6)

145 (4.1)

+3-9 kg. N=4736

847 (17.9)

66 (1.4)

562 (12.0)

327 (6.9)

649 (12.5)

642 (13.6)

186 (3.9)

10 kg+ N=1268

288 (22.7)

33 (2.6)

120 (9.6)

78 (6.2)

133 (18.9)

245 (19.3)

61 (4.8)

Observed rates. N=12,701

2061 (16.2)

146 (1.2)

1830 (14.6)

1115 (8.8)

2619 (7.2)

1461 (11.5)

492 (3.9)

Odds Ratios: “Adequate” vs. observed

0.88 [0.79-0.98] P=0.01

0.53 [0.33-0.83] P=0.003

1.15 [1.04-1.3] P=0.003

0.93 P=0.17

0.96 P=0.24

0.91 P=0.07

0.91 P=0.28

For Table 4, Obese class I: 71% in categories of EXCESSIVE GWG (2898+1525/6232).

Table 4: Mmulation from the perspective of optimal or non-optimal GWG. Rates (%) of several maternal/foetal morbidities. Obesity class I: 30-34.9 kg/m2. N=6232.

Differences with adequate Weight gain Obese I 30-34.9 kg/m2

C-section rate (%)

Term preeclampsia (%)

Gestational diabetes

SGA (%)

LGA (%)

BW ≥ 4 kg (%)

Neonatal. Transfers (%)

-10 kg and lower N=73

11 (15.1)

0 (0.0)

18 (25.0)

11 (15.1)

2 (2.7)

1 (1.4)

5 (6.8)

-3-9 kg, N=561

85 (15.2)

4 (0.7)

152 (27.3)

70 (12.5)

39 (7.0)

14 (2.5)

21 (3.7)

Adequate GWG ± 2 kg, N=1175

198 (16.9)

9 (0.8)

279 (24.1)

111 (9.4)

136 (11.6)

53 (4.5)

48 (4.1)

+3-9 kg. N=2898

623 (21.5)

47 (1.6)

582 (20.5)

228 (7.9)

413 (14.3)

151 (5.2)

107 (3.7)

10 kg+ N=1525

364 (23.9)

43 (2.8)

223 (15.0)

109 (7.1)

293 (19.2)

150 (9.8)

72 (4.7)

Observed rates. N=6232

1281 (20.6)

103 (1.7)

1254 (20.5)

529 (8.5)

883 (14.2)

369 (5.9)

253 (4.1)

Odds Ratios: “Adequate” vs. observed

0.78 [0.66-0.92] P=0.002

0.45 [0.22-0.87] P=0.01

1.23 [1.06-1.4] P=0.002

1.12 P=0.14

0.79 [0.65-0.96] P=0.009

0.75 [0.55-1.0] P=0.03

1.0 P=0,48

For Table 5, Severe obese: 91% in categories of EXCESSIVE GWG (1300+2406/4071).

Table 5: Simulation from the perspective of optimal or non-optimal GWG. Rates (%) of several maternal/foetal morbidities. Severe Obesity ≥ 35 kg/m2. N=4071.

Differences with adequate Weight gain Obese I 30-34.9 kg/m2

C-section rate (%)

Term preeclampsia (%)

Gestational diabetes

SGA (%)

LGA (%)

BW ≥ 4 kg (%)

Neonatal. Transfers (%)

-10 kg and lower N=16

1 (6.3)

0 (0.0)

5 (33.3)

3 (18.8)

1 (6.3)

1 (6.3)

0 (0.0)

-3-9 kg, N=106

13 (12.3)

2 (1.9)

37 (35.2)

14 (13.2)

9 (8.5)

3 (2.8)

6 (5.7)

Adequate GWG ± 2 kg, N=243

43 (17.7)

2 (0.8)

77 (32.5)

19 (7.8)

21 (8.6)

5 (2.1)

4 (1.6)

+3-9 kg. N=1300

276 (21.2)

24 (1.8)

357 (28.0)

113 (8.7)

164 (12.6)

61 (4.7)

66 (5.1)

10 kg+ N=2406

655 (27.2)

76 (3.2)

608 (26.3)

144 (6.0)

492 (20.4)

229 (9.5)

139 (5.8)

Observed rates. N=4071

988 (24.3)

104 (2.6)

1084 (27.5)

293 (7.2)

687 (16.9)

299 (7.3)

215 (5.3)

Odds Ratios: “Adequate” vs. observed

0.67 [0.47-0.93] P=0.009

0.31 [0.05-1.07] P=0.07

1.27 [0.97-1.7] P=0.06

1.09 P=0.40

0.46 [0.29-0.73] P=0.001

0.46 [0.1-0.6] P=0.001

0.30 [0.1-0.74] P=0.006

In all the Tables 2 to 5 the calculated crude odds-ratios are comparisons between optGWG and the observed rate in the total population (and not with some categories of inadequate GWG). These OR may be easily calculated as much higher if compared with for example the 71% of excessive weight gain seen in obese class I (30-34.9 kg/m2) and optGWG.

Table 2 (non obese women), N = 36,167 women (61% of our population): For this “normal” population, comparisons with optimal GWG did not give important differences with actually happened during the 19 year clinical practice. It is of note that the optGWG women had 10% more C-sections (OR 1.12, p = 0.001), LGA babies (9.4% vs. 7.2) and birthweights over 4 kg (3.5% vs. 2.8%)

Table 3 (overweight women), N = 12,701 women: OptGWG women have significantly less caesarean section rate (OR 0.88, p = 0.01), less term preeclampsia (OR 0.53, p = 0.003, and a tendency to have less newborns with birthweights over 4 kg (OR 0.91, p = 0.07).

Table 4 obesity class I and Table 5 severe obese (≥ 35 kg/m2):  All crude comparisons for the chosen morbid items are statistically significant: OptGWG women had less caesarean section rate (respectively OR 0.78 and 0.67, p = 0.002), less term preeclampsia (OR 0.45, p = 0.01 and 0.31 p = 0.07), less LGA (OR 0.79 and 0.46, p = 0.001), less birthweights over 4 kg (OR 0.75, p = 0.03 and 0.46, p = 0.001) and less neonatal transfers in neonatology for severe obese (≥ 35 kg/m2): OR 0.30, p = 0.006.

It is of special note that in overweight and all obese women (Tables 3-5) incidence of GDM is higher in optGWG women than in the observed rate.

Table 6 As the effect of achieving optimal weight gain is largely concentrated in overweight and all kind of obesities, we performed our logistic model only in overweight and obese class I,II and III women (therefore the 25,731 pregnancies with pre-pregnancy BMI ≥ 25 kg/ m2). Multiple logistic regression model to validate the independent association of optimal GWG with different maternal-foetal morbidities. Controlling for all the other variables, several morbidities have a negative coefficient as independent factors: cesarean-section (coefficient -0.20, decrease of 20%), birthweight ≥ 4000 g (coefficient
– 0.38), term preeclampsia (coefficient -0.79), maternal overweight pre-pregnancy BMI (coefficient -0.13, decrease of 13% of the BMI effect per increment of 5 kg/m2 using optimal weight gain). However, adequate GWG have a positive coefficient with GDM: 0.19, increase of the risk by 19%.

Table 6: Outcome: optimal gestational weight gain in overweight/obese women (pre-pregnancy BMI ≥ 25 kg/m2, N=25,731 pregnancies). Multiple logistic regression model to validate the independent association of optimal GWG with different maternal-foetal morbidities. Controlling for all the other variables, several morbidities have a negative coefficient as independent factors: cesarean-section (coefficient -0.20, decrease of 20%), birthweight ≥ 4000 g (coefficient -0.38), term preeclampsia (coefficient -0.79), maternal overweight pre-pregnancy BMI (coefficient -0.13, decrease of 13% of the BMI effect per increment of 5 kg/m2 using optimal weight gain). However, adequate GWG have a positive coefficient with GDM: 0.19, increase of the risk by some 20%.

Multiple Logistic Regression Outcome: optimal gestational weight gain

Coefficient

Odds Ratio

95% CI

P

Cesarean section

-0.20

0.81

[0.74-0.89]

<0.0001

Birthweight ≥ 4000 g

-0.38

0.67

[0.57-0.79]

<0.0001

Pre pregnancy maternal BMI (increment of 5 kg/m2)

-0.13

0.87

[0.86-0.88]

<0.0001

Gestational diabetes mellitus

0.19

1.21

[1.11-1.31]

<0.0001

Term preeclampsia

-0.79

0.45

[0.31-0.65]

<0.0001

Transfer in neonatal department

-0.09

0.90

[0.77-1.06]

0.25

Figure 1 shows simulation based on maternal pre-pregnancy BMI by increments of 5 kg/m2 (upper case) maternal morbidities C-sections and term preeclampsia rates and (lower case) neonatal morbidities birthweight over 4 kg and transfers in neonatal department. These figures consider all the spectrum of maternal pre-pregnancy BMI from lean women to obesity class III. In dark lines, the 19 year- experience observed rates, in dash lines the calculated rates if women had achieved the optGWG (window of 4 kg specific to each woman). Visually, we can estimate the strong effect of optGWG beginning with overweight BMI and emphasized with rising BMI.
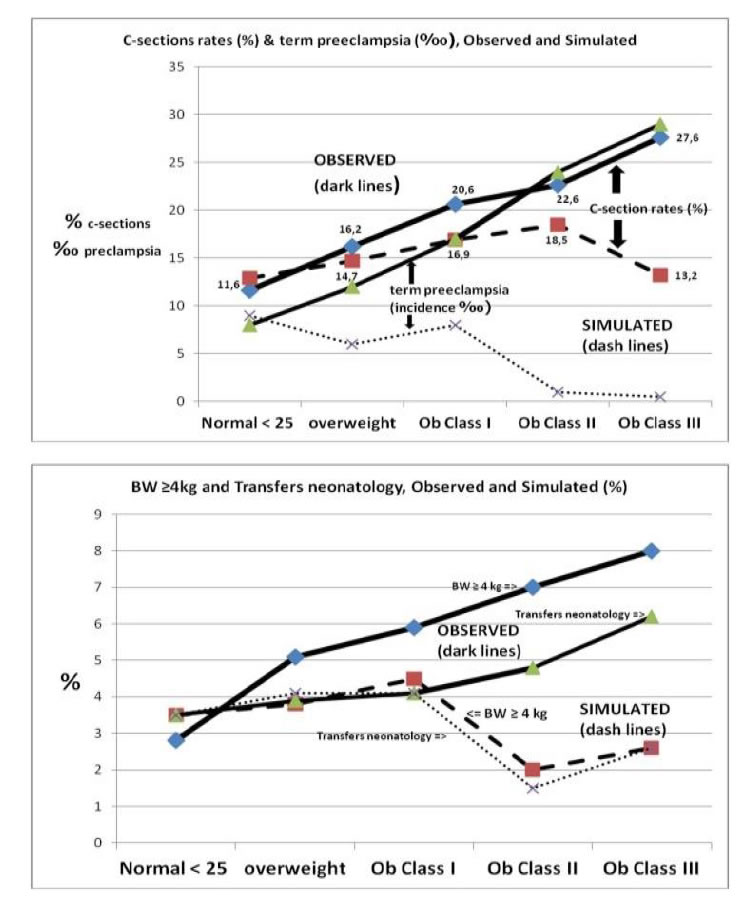
AWHC-3-3-320-g001

Figure 1.Simulation based on maternal pre-pregnancy BMI by increments of 5 kg/m2. Maternal and neonatal morbidities. Dark lines: observed rates, in dash lines the calculated rates if women had achieved the optGWG (window of 4 kg specific to each woman).

Figure 2 shows simulation of optimal or non-optimal GWG for all categories of ppBMI (lean to obese). We can visualize the effect of insufficient or excessive GWG on the outcomes LGA, macrosomic babies, SGA and C-sections rates.
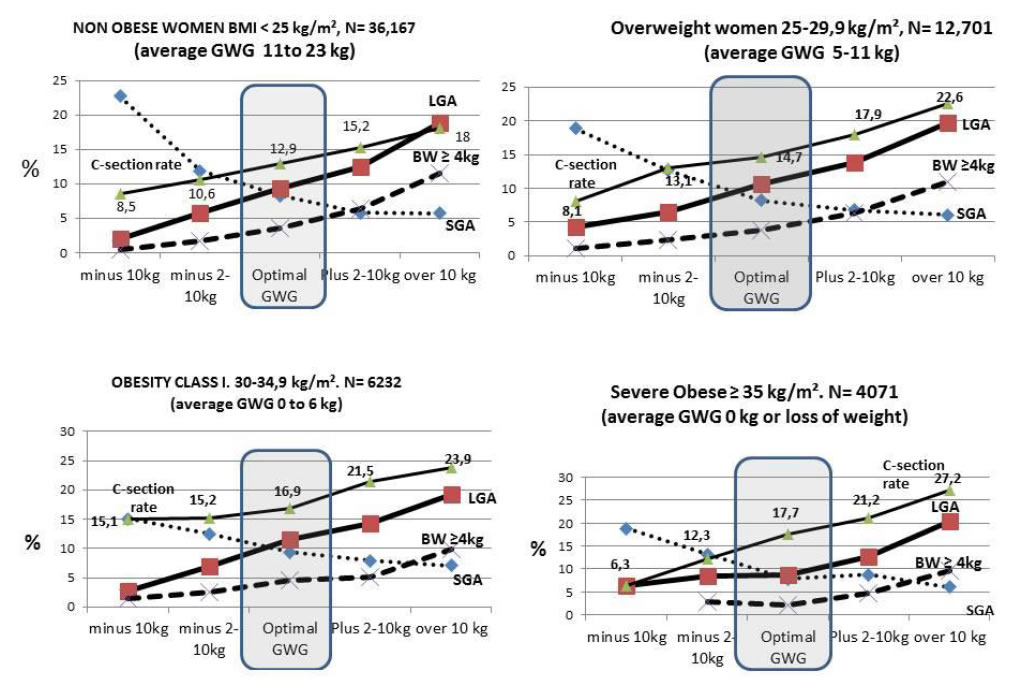
AWHC-3-3-320-g002

Figure 2. Simulation from the perspective of optimal or non-optimal GWG. Women having achieved their personal optGWG vs. moderately or severe insufficient or excessive GWG.

Not shown in the Tables and Figures: the rate of low birthweight newborns (< 2500g). In non obese women (< 25kg/m2), it is of 3.7% in optGWG vs. 5.8% in observed rates OR 0.64 [0.57-0.73], p < 0.001 women. Respectively in overweight 3.9% vs. 4.3% (NS), class I obese 4.1% vs. 3.7% (NS), in severely obese women (≥ 35 kg/m2) 3.7% vs. 3.7%.

Discussion

Our calculations on simulated maternal/fetal morbidities in our term pregnancies, (rates of cesarean section, term preeclampsia, GDM, SGA, LGA, macrosomia (≥ 4kg), low birthweights (< 2500g) and transfers in the neonatal department of newborns) demonstrate that achieving “Maternal Fetal Corpulence Symbiosis, MFCS” [1] in all women would have the potential to significantly lower important maternal/fetal morbidities, except, surprisingly and for now, the rate of GDM.

We have put an online calculator consultable on smart phone at REPERE.RE (REseau PErinatal REunion), in three languages (French, Spanish and English) [2], and any reader is invited to validate these findings in their own populations.

It is of note that achieving MFCS, our rates of SGA-LGA in all the tables and figures reproduced in this paper, we notice that the equilibrium points (optGWG) show the closest combination to the 10% SGA/LGA crossing point. First, concerning the huge debates on gestational weight gain and maternal obesity (class I-III), we will not in this paper recall all these controversies (and the numerous critics, for example, those made by our Asian colleagues [3], China, Korea, Japan, India on the current  IOM  2009  recommendations [4]) as they have been recently extensively discussed by ourselves elsewhere [1,5,6].

Second, the “gestational diabetes mellitus paradox” it is noteworthy in all the tables to find an inverse relationship between optimal GWG and the risk of gestational diabetes. Lowering the GWG seems to heighten the risk of GDM, and excessive weight gain to lower it! GDM seems to be the only significant maternal risk that is not ameliorated by achieving an optGWG. In Table 6, the logistic regression model, controlling for other risks, the coefficient for GDM is 0.19 (an increase of 19% of the risk with optimal GWG). This phenomenon has also been described by preceding authors [7-9], and in fact, it might be  an “optical” or a “perspective” bias due to our retrospective data. Li et al. [7] proposed an explanation which may be the good one: because the diagnosis of GDM occurs primarily at 26-28 weeks of gestation, treatment with diet and/or insulin plus increased physical activity may affect subsequent weight gain resulting in decreased weight gain in late pregnancy. This is emphasized in a recent paper in the United Kingdom (UPBEAT study): obese women with a positive OGTT at 27 weeks, and afterward a strong follow-up until delivery present lower weight gain than obesity considered as non-diabetic [10].

Indeed, it is because our study is retrospective, and that we mix the concept of optimal weight gain which could be theoretically known since the beginning of pregnancy with the diagnosis of GDM which is made much later: 24-28 weeks. If we did a prospective follow-up of obese pregnancies since the beginning of counselling to the woman, a moderate GWG (or even a loss of weight in severe obesities), incidence of GDM being quasi-parallel and proportional with the increase of BMI [10,11], we predict that women would reach the 24th week of gestation with lower rates of GDM diagnoses in a prospective management of such pregnancies.

Third: applicability of our linear equation for pragmatic management of future pregnancies elsewhere. The fact that the Maternal Fetal Corpulence Symbiosis (MFCS) has been achieved   as a mathematical linear equation, it implies that it is also similar elsewhere. But, we do not feel fair to state that our formula, designed in our Reunionese population, would be adapted everywhere [1,2]. MFCS is based on the 10% crossing point of SGA-LGA. Therefore, these SGA/LGA definitions are different in different ethnicities (e.g. Eastern Asians, India, Africa etc…).

Let us consider the problem of SGA: for us, in Reunion island, being SGA at term is to be approximately less than 2500g. But, in India, the physiological SGA birthweight at term is 2200g [12,13]. This may be also in line with a recent WHO study arguing that definition of low-birthweight should be different (< 2200g in Africa, < 2100g in Asia, < 2200g in Latin America) between different populations, and no more the universal below 2500g [14].

Considering the mothers, and countries like India or Japan which have a high rate of lean women [12-15]. In our formula, lean women of 18.5 kg/m2 should have an optGWG of 20 kg (instead of 12.5-18 kg, IOM 2009 recommendations), but we do not feel that counselling a great proportion of Indian or Japenese women to gain 20 kg in their pregnancies before knowing their newborns’ SGA-LGA rates is legitimate.

Considering now the problem of LGA: for example, macrosomic newborns with birthweights ≥ 4000 g, in Reunion represent 3.9% of term babies, but it is 0.5% in India, 6.9% in China, 2.0% in Niger, 2.2% in Thailand, 9.3% in Paraguay 1.3% in Philippines, Nepal, Sri-Lanka etc…[16].

Therefore and logically, an Indian, Japenese, Chinese or Swedish linear equation should then be slightly different than ours ( y = -1.2 x
+ 42). This has been recently stated by Guan et al.: “There are specific Chinese birthweight curves for neonates. Therefore, with knowledge of the 10th percentile (SGA) and the 90th percentile (LGA) of newborns, we could test the proposed ‘maternal-fetal-corpulence symbiosis’, which was recently proposed ….” [3]. It is time and urgent to verify and establish in all continents the specific MFCS linear equation, to make it accessible everywhere on smartphones for health workers and women themselves [2,17]. Knowing the specific SGA-LGA definitions of newborns in a setting or a country, allows to easily find the MFCS curve everywhere.

Forth, the problem of macrosomia (≥ 4kg). These newborns are well-known to present a 10 fold higher risk of the fearsome shoulder dystocia [16]. The limit of 4kg is considered to be the point where significant morbidities at delivery may occur [18], moreover, in the case of associated GDM [19]. Our simulation suggests that optGWG could lower very significantly the rate of macrosomia at birth: OR 0.75, p = 0.03 in class 1 obesity, OR 0.46, P = 0.001 in severely obese women (Tables 4 and 5) and, for all overweight women adjusted OR 0.67, p <0.0001, Table 6. There is a strong current ongoing consensus on obesity, GWG, and consequences for maternal-fetal health. Urgent further work is required to identify ways to assist women in achieving an optimal GWG, with further RCT to confirm that such interventions would translate in a marked reduction in maternal/fetal morbidities, especially for macrosomia.

We do not comment here on the significant decrease of term preeclampsia, with high potential consequences also in health-costs policies. It has just been recently published in a specific study [6].

We have also tested intrauterine fetal deaths (IUFD, bottom of Table 1) as a meta-analysis showed that maternal obesity increases the risk for fetal deaths (OR 1.21 [1.09-1.35]), [20]. For the entire cohort, we did not find any difference between optGWG women and controls (Table 1) [21]. Finally, our results seem in contradiction of the large number of clinical trials, meta-analyses and individual participant data meta-analyses that have robustly shown that at best, dietary   and lifestyle interventional studies have reduced GWG by 0.7kg or 3.7kg (minus the IOM recommendations for obese women 5-9 kg) and had no effect on other pregnancy and birth outcomes including GDM, PE, PIH, LGA and macrosomic infants [22-25]. We have shown previously in our population that the IOM recommendations are correct for normal weight and overweight women [1], but not for obese, moreover if splitting them in Class I to III. Beginning at class II, women should even lose weight to achieve the SGA/LGA crossing point (“maternal fetal corpulence symbiosis”, MFCS) [1]. All these studies [22-25] considered obesity as a whole (≥ 30 kg/m2), while it seems more and more evident for many scholars that obesities class I, class II, and class III are somehow very different worlds concerning maternal/fetal morbidities.

The strength of our study is the capturing of all perinatal outcomes in a population of the area (ap. 360,000 inhabitants, and  5,000  births per year. With 4,300 births per year, the university maternity represents 85% of all births in the south of the island, all receiving level 3, European standard of care. The data in this large cohort are homogeneous as they were collected in a single center (no intercenter variability) and not based on national birth registers but directly from medical records (avoiding inadequate codes). The obvious weakness is the retrospective nature of this study, especially with the above discussion on GDM, demonstrating an association and not necessarily causation but we sincerely hope that our observations will trigger proper prospective trials because the potential health care benefits are immense.

Conclusion

We can help to actively counterbalance the morbid effects of high BMIs by individualized counselling for women on their GWG and have significant health (and cost) benefits with lowering c-section, term preeclampsia, low birthweights, and macrosomia rates. We renew our prediction that it should be also beneficial for gestational diabetes mellitus, but it can be verified only with a prospective study beginning since the first prenatal visit. We may have much to win from reducing weight gain during pregnancy in overweight/obese women. It is urgent to verify and establish in all continents the specific linear-curve of optGWG of each geographical/ethnic area, to make it accessible everywhere on smartphones for health workers and women themselves [2].

Disclosure of interest: All the authors attest that no conflict of interest exists regarding this work.

Contribution to authorship: All authors participated equally to this work and writings of the manuscript.

Ethics approval: This study was conducted in accordance with French legislation. As per new French law applicable to trials involving human subjects (Jardé Act), a specific approval of an ethics committee (comité de protection des personnes- CPP) is not required for this non-interventional study based on retrospective, anonymized data of authorized collections and written patient consent is not needed. Nevertheless, the study was registered on UMIN Clinical Trials Registry (identification number is UMIN000037012).

Funding: No special funding besides the normal existence of the South-Reunion perinatal database since 2001.

References

  1. Robillard PY, Dekker G, Boukerrou M, Le Moullec N, Hulsey TC (2018) Relationship between pre-pregnancy maternal BMI and optimal weight gain in singleton pregnancies. Heliyon 4: e00615. [crossref]
  2. Gestational weight gain calculator (English version) on smart phone. REPERE. RE (Reseau Perinatal REunion).
  3. Guan P, Tang F, Sun G, Ren W (2019) Effect of maternal weight gain according to the Institute of Medicine recommendations on pregnancy outcomes in a Chinese population. J Int Med Res 47: 4397-4412. [crossref]
  4. IOM (2009) Weight gain during pregnancy: reexamining the Guidelines. Institute  of Medicine (US), National Research Council (US), Committee to Reexamine IOM Pregnancy Weight Guidelines. [crossref]
  5. Robillard PY, Dekker G, Scioscia M, Bonsante F, Iacobelli S, et al. (2019) Increased BMI has a linear association with late-onset preeclampsia: A population-based study. PLoS One 14: e0223888. [crossref]
  6. Robillard PY, Dekker GA, Boukerrou M, Boumahni B, Hulsey TC, et al. Optimizing gestational weight gain may halve the rate of late onset preeclampsia in overweight/ obese women: a retrospective analysis on 57,000 singleton pregnancies, Reunion Island. BMJ Open in Press.
  7. Li C, Liu Y, Zhang W (2015) Joint and Independent Associations of Gestational Weight Gain and Pre-Pregnancy Body Mass Index with Outcomes of Pregnancy in Chinese Women: A Retrospective Cohort Study. PLoS One 10: e0136850. [crossref]
  8. Nohr EA, Vaeth M, Baker JL, Sørensen TIa, Olsen J, et al. (2008) Combined associations of prepregnancy body mass index and gestational weight gain with the outcome of pregnancy. Am J Clin Nutr 87: 1750-1759. [crossref]
  9. Riskin-Mashiah S, Damti A, Younes G, Auslander R (2011) Pregestational body mass index, weight gain during pregnancy and maternal hyperglycemia. Gynecol Endocrinol 27: 464-467. [crossreef]
  10. Atakora L, Poston L, Hayes L, Flynn AC, White SL (2020) Influence of GDM Diagnosis and Treatment on Weight Gain, Dietary Intake and Physical Activity in Pregnant Women with Obesity: Secondary Analysis of the UPBEAT Study. Nutrients 12: E359. [crossref]
  11. Spaight C, Gross J, Horsch A, Puder JJ (2016) Gestational Diabetes Mellitus. Endocr Dev 31: 163-178.
  12. Kinare AS, Chinchwadkar MC, Natekar AS, Coyaji KJ, Wills AK, et al. (2010) Patterns of fetal growth in a rural Indian cohort and comparison with a Western European population: data from the Pune maternal nutrition study. J Ultrasound Med 29: 215-223. [crossref]
  13. Sebastian T, Yadav B, Jeyaseelan L, Vijayaselvi R, Jose R (2015) Small for gestational age births among South Indian women: temporal trend and risk factors from 1996 to 2010. BMC Pregnancy Childbirth 15: 7. [crossref]
  14. Laopaiboon M, Lumbiganon P, Rattanakanokchai S, Chaiwong W, Souza JP, et al. (2019) An outcome-based definition of low birthweight for births in low- and middle- income countries: a secondary analysis of the WHO global survey on maternal and perinatal health. BMC Pediatrics 19: 166. [crossref]
  15. Shindo R, Aoki M, Yamamoto Y, Misumi T, Miyagi E, et al. (2019) Optimal gestational weight gain for underweight pregnant women in Japan. Sci Rep 9: 18129.
  16. Koyanagi A, Zhang J, Dagvadorj A, Hirayama F, Shibuya K, et al. (2013) Macrosomia in 23 developing countries: an analysis of a multicountry, facility-based, cross- sectional survey. Lancet 381: 476-483. [crossref]
  17. Simkin P (2003) Maternal positions and pelves revisited. Birth 30: 130-132. [crossref]
  18. Graafmans WC, Richardus JH, Borsboom GJ, Bakketeig L, Langhoff-Roos J, et al. (2002) EuroNatal working group. Birth weight and perinatal mortality: a comparison of “optimal” birth weight in seven Western European countries. Epidemiology 13: 569-574. [crossref]
  19. Robillard PY, Boukerrou M, Bonsante F, Hulsey TC, Gouyon JB (2019) Neonatal outcomes of macrosomic newborns (4000g+) of diabetic and non diabetic mothers: a study of 1,391 newborns. Integr Gyn Obstet J 2: 1-4.
  20. Aune D, Saugstad OD, Henriksen T, Tonstad S (2014) Maternal body mass index and the risk of fetal death, stillbirth, and infant death: a systematic review and meta- analysis. JAMA 311: 1536-1546. [crossref]
  21. Hutcheon JA, Bodnar LM (2014) A systematic approach for establishing the range of recommended weight gain in pregnancy. Am J Clin Nutr 100: 701-707. [crossref]
  22. Rogozińska E, Zamora J, Marlin N, Betrán AP, Astrup A, et al. (2019) Gestational weight gain outside the Institute of Medicine recommendations and adverse pregnancy outcomes: analysis using individual participant data from randomised trials. BMC Pregnancy Childbirth 19: 322. [crossref]
  23. Dodd JM, Turnbull D, McPhee AJ, Deussen AR, Grivell RM, et al. (2014) Antenatal lifestyle advice for women who are overweight or obese: the LIMIT randomised trial. BMJ 348: g1285. [crossref]
  24. Dodd JM, Deussen AR, Louise J (2019) A Randomised Trial to Optimise Gestational Weight Gain and Improve Maternal and Infant Health Outcomes through Antenatal Dietary, Lifestyle and Exercise Advice: The OPTIMISE Randomised Trial. Nutrients 11: 2911. [crossref]
  25. The International Weight Management in Pregnancy (i-WIP) Collaborative Group (2017) Effect of diet and physical activity based interventions in pregnancy on gestational weight gain and pregnancy outcomes: meta-analysis of individual participant data from randomised trials. BMJ 358: j3119. [crossref]
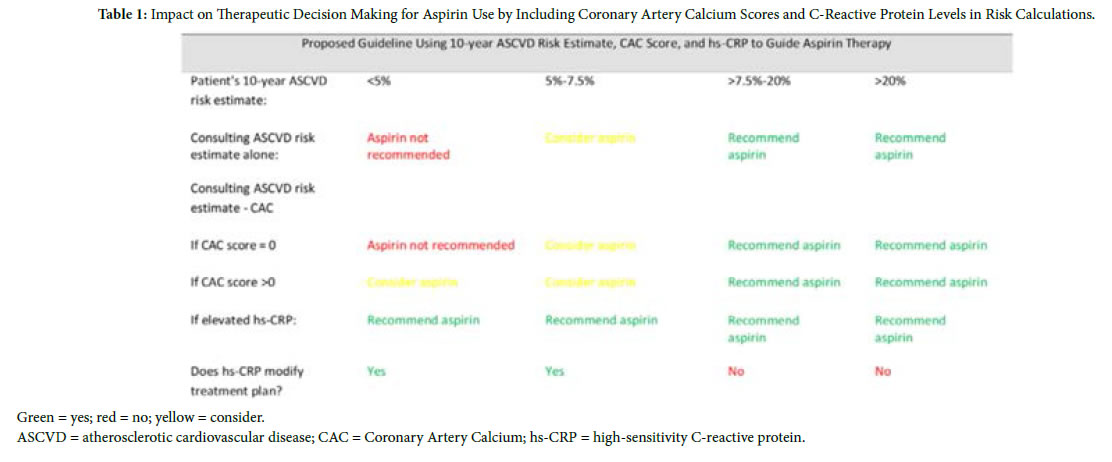
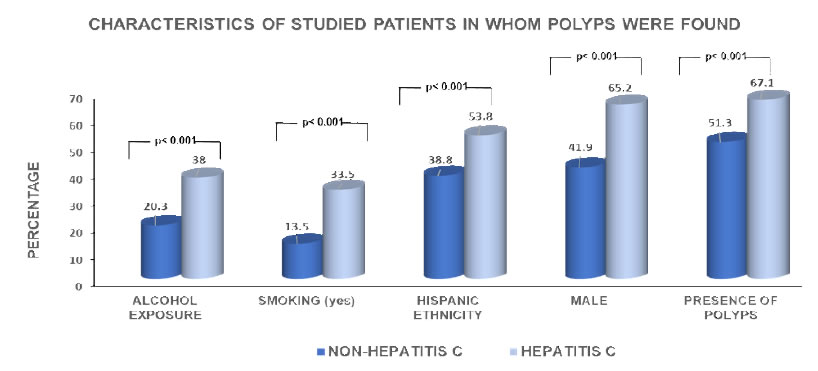
Factors Influencing the Adoption of Cocoa Agroforestry Systems in Mitigating Climate Change in Ghana: The Case of Sefwi Wiawso in Western Region

Introduction

Climate change is having great impact on agricultural productivity worldwide. Agriculture is strongly influenced by weather and climate [1,2]. Climate change and variability adversely affect environmental resources such as soil and water upon which agricultural production depends, which poses a serious threat to sustainable agricultural production [2]. In Ghana climate variability and change is expected to have an adversely effect on the agriculture sector. According to the NIC, (2009) by 2030 temperature are projected to rise by 0.5 °C. This situation would result in fewer rainy days and more extreme weather conditions like prolonged droughts. The impacts of a changing climate will have direct and indirect effects on global and domestic food systems [3,4]. Rioux [5] reported that climate change has affected yields in food crop production in many Africa countries. If the issues of climate change and variability are not addressed incomes and food security of rural households in Ghana would be undermined because there would be increased incidence of diseases and pest as well as prolonged variable rainfall patterns.

Cocoa production employs over 15 million people worldwide with over 10.5 million workers in West Africa [6]. Cocoa, in addition to cereals and other root and tuber  crops  contribute  largely  to  food security in Ghana. In Ghana cocoa production is an essential component of  rural  livelihoods  and  its  cultivation  is  considered a ‘way of life’ in many production communities [7]. The cocoa sub sector cocoa employs about 800,000 farm families spread across the cocoa growing regions of Ghana and generating about $2 billion in foreign exchange annually [8,9]. The expansion of cocoa production is replacing substantial areas of primary forest. It’s of no surprise that the total area under cocoa cultivation increased by 50,000 hectares between 2012 and 2013 and there is no indication that the rate is slowing down. According to Anim Kwapong et al. [10] the government of Ghana recognizes that climate change is already negatively affecting Ghana’s cocoa sector in myriad ways and that, it is likely to continue hampering Ghana’s environmental and socio-economic prospects in the coming decades. Cocoa agroforestry system has been identified as is an important strategy that can ameliorate climate change [11].

This system can play a dual role of mitigation and adaptation, which makes it one of the best responses to climate change. It is noted that agroforestry has multi-functional purposes which makes it one of  the most promising strategies for climate change adaptation [11,12]. The use of trees and shrubs in agricultural systems help to tackle the triple challenge of securing food security, mitigation and reducing the vulnerability and increasing the adaptability of agricultural systems to climate change [13,14]. With this view, serious attention must be given to cocoa agroforestry which is capable of reducing temperatures and enhancing the growing of cocoa thus sustaining livelihood of many households in this climate changing pattern. According to previous studies [11,13,15] agroforestry as an adaptation strategy could sustain agricultural production and enhance farmers’ ability to improve livelihoods and will minimize the impacts of climate change which include drought, variable rainfall and extreme temperatures. Agroforestry as a forest-based system plays a significant role in conserving existing carbons, thereby limiting carbon emissions and also absorbing carbons that are released into the atmosphere [16]. Nair [17] also indicated that agroforestry has received international attention as an effective strategy for carbon sequestration and greenhouse mitigation. Cocoa agroforestry can increase farmers’ resilience and position them strategically to adapt to the impacts of a changing climate. This system of cocoa production can be very useful because it generates quite substantial benefits on arable lands in diverse ways; trees in agricultural fields improve soil fertility through control of erosion, improve nitrogen content of the soil and increase organic matter of the soil [18,19]. Agroforestry can also transform degraded lands into productive agricultural lands and improves productive capacities of soils [18]. Although agroforestry is not new in Ghana, it is quite optimistic that effective adoption to climate change will contribute towards the achievement of sustainable development and to a large extent, the attainment of the Sustainable Development Goals (SDGs). Despite the immeasurable benefits of cocoa agroforestry system, adoption is not widespread and for that matter success stories are found in isolated cocoa farming areas among few adapters of cocoa agroforestry system initiatives. Aidoo and Fromm [20] report that although cocoa farmers are aware about sustainability issues, they hardly adopt sustainable production practices. It is quite not always the case that policies are implemented as they were intended and so the need to assess farmers’ perspectives on cocoa agroforestry adoption and implementation especially when climate change has become a serious constraint to cocoa production in Ghana. Traditional coping mechanisms to the impact of climate change in the Western Region of Ghana include mixed cropping, non-farm activities and traditional agroforestry practices by some individual cocoa farmers. However, non-shade cocoa production systems, bush burning, slash and burn farming methods expose the cocoa communities to further impacts of climate change. This calls for swift attention from all, especially cocoa farmers in the study communities to tackle the problem. Despite the economic, environmental and sustainable cocoa production potential via agroforestry systems, farmers have not adopted cocoa agroforestry practices entirely especially in Sefwi Wiawso District. Understanding cocoa farmers decision making processes in ensuring sustainable food supply and cocoa yield in cocoa agroforestry system is critical. Research frontiers in cocoa agroforestry systems need to be identified and better understand barriers to adoption and the development of strategies to support cocoa agroforestry that enhance food security in climate changing conditions. The objectives of this study are therefore to empirically assess the factors that affect farmers’ decision to adopt cocoa agroforestry systems and determine cocoa farmers’ perception on cocoa agroforestry as an adaptation strategy to climate change.

Methodology

The study was conducted at Sefwi Wiawso in the Western and region of Ghana. The district lies within latitudes 6º 00“and 6º 30 North and Longitudes 2º 15‟ and 2º 45 West. The District covers an area of about 2,634 square kilometers. The detailed hydrometeorological characteristics of the study area are provided in Table 1.

Table 1: Hydrometeorological characteristics of the study area.

Characteristics

Levels

Mean temperature

Maximum: 33°C Minimum: 26°C

Climate

Tropical rainforest

Average humidity

Dry season: 50-75%
Rainy season: 85-90%

Average rainfall

1500-1800 mm

Topography

Undulating

Soil condition

Loamy

Average elevation

206 m

A stratified random sampling technique was employed in the selection of the 300 cocoa farmers interviewed for the study. In the first stage, Western Region was purposively selected due to the fact that apart from being one of the highest cocoa producing regions    in Ghana, it is one of the regions which has experienced significant impact as a result of climate change. In the second stage, Sefwi Wiawso was randomly selected. In the third stage, five communities were randomly selected. In the final stage 60 cocoa farmers were randomly selected from each village. Primary data were employed in the study. The primary data consisted of qualitative data and household survey interviews. Specifically, the primary data were collected through focus group discussions (FGD), stakeholder interviews, and field observations. The household survey interviews employed both open- ended and close ended survey instruments.

To examine the factors that influence a household’s decision to participate in agroforestry a logistic regression model was employed.

The model was specified as:

ESCC-2-1-202-e001

Where: i = 1, 2, 3………., k are the observations, α= constant. β = the regression parameter to be estimated. βX= linear combination of independent variables.  Zi= the log odds of choice for the  ithobservation. Pi= the probability of observing
a specific outcome of the dependent variable (adoption). Xn = nth explanatory observation. u = the error term.

Results and Discussion

The gender composition of the cocoa farmers among revealed that 81.5 percent of the respondent are males with 19.5 percent been females. This indicates that cocoa production is a male dominated occupation in the study area. In Ghana cocoa production is considered a male job but this is not the situation at the study sites because both women and men play a critical role in the production cycle. Within the last 30 years, cocoa farmers observed some impacts of climate change in the study communities, information gather from the cocoa farmers showed that there has been varying pattern in rainfall and sunshine. With regards to drought, overwhelming 98 percent of cocoa farmers reported the occurrence of drought in the study area and linked it to climate change. The pattern of rainfall distribution has changed as reported from the study. The study reported high level of windstorm, high incidence of flooding and frequent occurrences of pests and disease on their cocoa farms in recent time. These are attributed to climate change. Frequent felling of trees, non-shade cocoa production systems, wood harvesting for charcoal and firewood and bush burning among others were mention as some course of changing climate in the farming communities. About two thirds of the farmers reported unplanned trees harvesting as a major cause for variable rainfall thus climate change. This suggest that majority of farmers are aware of some of the causes of climate change in the study area. About 58 percent of cocoa farmers are using doing the non-shade cocoa production system. This result confirms a report [21], indicating that high proportion of Ghana’s cocoa is grown in full sun at the expense of primary or secondary forest conversion. A study [22] reported that shaded tree densities, and average number of tree species per hectare vary according to cultural tradition and ethnic group, age of farms, proximity to markets, and intensity of farming, this situation is similar to that of the study area after personal interaction with the cocoa farmers. This current trend of no shade is not only common in Ghana but other cocoa growing countries like Cote d’Ivoire, Malaysia, Indonesia and Ecuador. A study [23] in Ecuador reported that half of the new cocoa plantations are now full-sun and are from high-yielding variety. A study [24] also revealed that in Sulawesi cocoa farmers are switching from long-fallow shifting cultivation of food crops to intensive full-sun cocoa. This current trend of cocoa production put the food security of these cocoa farmers in doubt with the impact of climate change.

Cocoa farmers acknowledge the benefits of adopting cocoa agroforestry system in cocoa production. Farmers indicated that cocoa agroforestry has the potential of maintaining soil moisture, improving soil fertility as well as suppressing weeds within the cocoa farm. A study by Bentley [23] on cocoa farmers in Ecuador also indicated similar characteristics. Cocoa farmers acknowledged that no shade cocoa system is agriculturally unsustainable and is becoming common in the study area. The study reported that cocoa agroforestry mimics the natural sub canopy cover of traditional cocoa tree in the forest thus good practice to mitigate climate change. The shade trees selected by the cocoa farmers need to provide products and additional income when sold. Terminalia superb, Milicia excels, Terminalia ivorensis, Cedrella odorata,Ceiba pentandra and Ceiba pentandraas are the most dominant shade tree on cocoa farms  and are retained because of their economic importance. Eighty-five percent have little knowledge about the tree rights in the community although there are existing policies and legislations in Ghana. The average knowledge of useful species in this cocoa farming communities are fading out. For example, some of the younger farmers interviewed retain shade trees on an interest in the knowledge of their parents and grandparents.

Cocoa farmers have various levels of perception on certain characteristics of cocoa agroforestry. About 54 percent of cocoa farmers strongly perceive that cocoa agroforestry improves yield of cocoa. These trees ensure a microclimate condition which enhance the yield of the cocoa and thus mitigate climate change. Other perception held by cocoa farmers for cocoa agroforestry are enhancing soil moisture, improve farm humidity and environment, protecting young cocoa trees from pest and diseases and direct sun rays (Table 2).

Table 2: Perception of cocoa farmers on cocoa agroforest in mitigating climate change.

Cocoa agroforestry ensure sustainable yield

Strongly agree

162 (54)

Agree

66 (22)

Undecided

54 (18)

Disagree

18 (6)

Cocoa agroforestry improves soil fertility

Strongly agree

195 (65)

Agree

75 (25)

Undecided
Disagree

30 (10)

Cocoa agroforestry improve farm humidity

Strongly agree

204 (68)

Agree

60 (20)

Undecided

18 (6)

Disagree

8 (24)

Cocoa agroforestry enhance rainfall

Strongly agree

225 (75)

Agree

45 (15)

Undecided

21 (7.0)

Disagree

9 (3.0)

Cocoa agroforestry serves as a wind break on farms

Strongly agree

240 (80)

Agree

45 (15)

Undecided
Disagree

15 (5)

Factors Affecting Adoption of Climate-Smart Agriculture Innovations in Isolation and in Combination

Farmers’ adaption decisions were found to be influenced by several varying factors. The factors include farming experience, agricultural land size, belonging to farmer association, access to extension services, awareness of climate change, and experience in farming.

Results from the regression are reported here to tell the factors determining of adoption of individual farmer. The base category used in the analysis was non-adoption. Table 3 report coefficients and marginal effects from MNL regression respectively. Marginal effects (Table 3) are reported and discussed here. In this instance,  the marginal effects measure the expected change in probability of   a certain choice (of a cocoa agroforestry system) being made with respect to a unit change in an explanatory variable, all in comparison to the no adoption category.

Table 3: Factors influencing farmers adaption decision.

Variable Name

Estimate

SE

Wald

p (Sig.)

Odds ratio

Agriculture land size

0.239

.139

2.944

.086*

.787

Experience in farming

0.823

.388

4.499

.034**

2.278

Member of farmer Assciation

1.037

.453

5.240

.022**

2.821

Gender

0.474

.502

.892

.345

1.607

Awareness of climate change

0.063

.054

1.378

.0240**

1.065

Age of respondent

-011

.016

.447

.504

0.989

Access to extension service

2.976

0.756

15.510

.000***

0.51

Constant

2.901

1.092

7.060

.008***

18.19

Model chi-square 53.87 p<0.000

-2 log likelihood 171.058a

Nagelkerke (R Square) .730

***Significant at 1%, **Significant at 5%, *Significant at 10%.

Results are compared to the base category of no-adoption. The results indicated that adoption of cocoa agroforestry is negatively associated with age of farmer and positively associated with agriculture land size, experience in farming, member of farmer association, gender, awareness of climate change and access to extension service. Results imply that probability of adopting cocoa agroforestry decreases with ageing of cocoa farmer possibly due to risk aversion of innovative practices like cocoa agroforestry by older cocoa farmers. The positive association of cocoa agroforestry adoption with agriculture land size imply that larger plot sizes could be more flexible to experiment with cocoa agroforestry. Also, the positive association of extension could be due to availability of information for cocoa farmers with access to it. The factors of cocoa agroforestry adoption is in agreement with studies [25,26]. Extension services are very critical for availing necessary information on cocoa agroforestry. Overall, results show the importance of cocoa agroforestry system at the farmer level in building resilience to climate variability and change as well as other productivity related challenges in cocoa farming in Ghana. Adoption of cocoa agroforestry system reduces the impacts of climate change on cocoa productivity and hence farmer incomes. The enhanced impact of adopting cocoa agroforestry systems possibly arise as a result of the micro climatic conditions that is favorable for cocoa production. Findings of the study conform to other related literature that indicates that, adoption  of new agricultural technologies needs to positively impact on productivity, income and other welfare related variables of the adaptors.

Conclusion and Recommendation

Cocoa researchers and development partners are becoming more concern with welfare of cocoa farm in Ghana by promoting cocoa agroforestry systems which is essential in a bid to improve climate resilience. Cocoa agroforestry has the potential to improve soil fertility, regulate soil temperature, control soil moisture among other benefits. The study outcomes have shown that climatic changes have occurred over the years and these have had effect on the annual cocoa yield. The study revealed that some cocoa farmers are presently ignorant about their tree ownership on their farms. It therefore recommended that agricultural extension officers should educate these farmers on tree rights. Cocoa farmers in the study areas have noticed changes   in climate conditions through their own experiences and careful observations over the year of farmers. Also, respondents reported that cocoa agroforestry systems can offer numerous environmental, social and financial benefits, and can lead to an alternative way to mitigate climate change and variability. Land size, member of farmer association, experience in farming, awareness of climate change and access to extension service are the main factors that influence cocoa farmers’ decision to adopt cocoa agroforestry system. There is the need for effective provision of extension services through farmer field school programs. Programs of this nature have the potential to change farmers’ attitudes towards adopting a technology. Access to information and credit needs to be enhanced so as to get the needed logistics for managing cocoa agroforestry systems. This would facilitate farmers’ access to information about technical issues of the systems and how it can be managed in mitigating climate change. Finally, government should support cocoa famers through subsidies and long-term loans. There is also the need for more concerted and strong collaborative effort among Ghana COCOBOD, the Ministry of Food and Agriculture and Forestry Commission so as to reach greater a policy impacts on cocoa agroforestry system.

References

  1. Parry L (2019) Climate Change and World Agriculture. Routledge Library Editions: Pollution, Climate and Change, London, 172.
  2. Gornall J, Betts R, Burke E, Clark R, Camp J, et al. (2010) Implications of climate change for agricultural productivity in the early twenty-first century. Philos. Trans R Soc B Biol Sci 5: 2973-2989. [crossref]
  3. Lake IR, Hooper L, Abdelhamid A, Bentham G, Boxall ABA, et al. (2012) Climate change and food security: Health impacts in developed countries. Environ Health Perspect 120: 1520-1526. [crossref]
  4. Edwards F, Dixon J, Friel S, Hall G, Larsen K, et al. (2011) Climate change adaptation at the intersection of food and health. Asia Pac J Public Health 23: 91-104. [crossref]
  5. Rioux J (2012) Nature & Faune 26: 63-68.
  6. De Lattre-Gasquet M, Despéraux D, Barel M (1998) ‘Prospective de la Filière du Cacao Plantation’. Recherche Développment 5: 423-434
  7. Nunoo I and Owusu V (2015) Comparative analysis on financial viability of cocoa agroforestry systems in Ghana. Environment Development and Sustainability 19.
  8. COCOBOD (2018) Ghana Cocoa Board Handbook16th ed. Jamieson’s Cambridge Faxbooks Ltd, Accra.62pp.
  9. Ministry of food and Agriculture (2017) Directorate of Agricultural Extension Services: Agricultural Extension Approaches Being Implemented in Ghana.
  10. Anim Kwapong, et al. (2005) Vulnerability and Adaptation Assessment under the Netherlands Climate Change Studies Assistance Programme Phase 2.
  11. Kuyah S, Whitney CW, Jonsson M, et al. (2019) Agroforestry delivers a win-win solution for ecosystem services in sub-Saharan Africa. A meta-analysis. Agron Sustainm Dev 39: 47.
  12. Campbell ID, Durant DG, Hunter KL, Hyatt KD (2014) Food production. In Canada in a Changing Climate: Sector Perspectives on Impacts and Adaptation 99–134
  13. Carsan S, Stroebel A, Dawson I (2014) Can agroforestry option values improve the functioning of drivers of agricultural intensification in Africa? Curr Opin Environ Sustain 6: 35-40.
  14. McCabe Colin (2013)”Agroforestry and Smallholder Farmers: Climate Change Adaptation through Sustainable Land Use” Capstone Collection.
  15. Syampungani SC (2010) The Potential of Using Agroforestry as a Win-Win Solution to Climate Change Mitigation and Adaptation and Meeting Food Security Challenges in Southern Afri. Agricultural Journal 5: 80-88.
  16. Mbow C, Smith P, Skole D, et al. (2014) Achieving mitigation and adaptation to climate change through sustainable agroforestry practices in Africa. Curr Opin Environ Sustain 6: 8-14.
  17. Nair PK (2009). J Plant Nutr Soil Sci 172: 10-23.
  18. Pinho CR, Miller PR, Alfaia SS (2012) Agroforestry and the Improvement of Soil Fertility: A View from Amazonia. Applied and Environmental Soil Science 2012: 11.
  19. Thangataa PH, Hildebrand PE (2012) Carbon stock and sequestration potential      of agroforestry systems in smallholder agroecosystems of sub-Saharan Africa: mechanisms for reducing emissions from deforestation and forest degredation (REDD+). Agric Ecosyst Environ 158: 172-183.
  20. Aidoo R, Fromm I (2015) Willingness to Adopt Certifications and Sustainable Production Methods among Small-Scale Cocoa Farmers in the Ashanti Region of Ghana. Journal of Sustainable Development 8: 33-43.
  21. UNDP (2011) Greening the sustainable cocoa supply chain in Ghana.
  22. Sonwa DJ (2004) Biomass management and diversification within cocoa agroforests in the humid forest zone of southern Cameroon. PhD thesis. Institute fur Gartenbauwissenshaft der Rheinischen FriedrichWilhelms-Universitat Bonn.
  23. Bentley JW, Boa E, Stonehouse J (2004) Neighbor trees: Shade, intercropping, and cacao in Ecuador. Human Ecology 32: 241-270.
  24. Belsky JM, Seibert S (2003) Cultivating cacao: implications of sun-grown cacao on local food security and environmental sustainability. Agric Human Values 20: 277- 285.
  25. Mazvimavi K, Twomlow S (2009) Socioeconomic and institutional factors influencing adoption of conservation farming by vulnerable households in Zimbabwe. Agric Syst 101: 20-29.
  26. Makatea C, Makateb M, Mangoc N, Sizibad S (2019) Increasing resilience of smallholder farmers to climate change through multiple adoption of proven climate-smart agriculture innovations. Lessons from Southern Africa. Journal of Environmental Management 231: 858-868.

OUABAIN – A Drug for Treatment of COVID-19

DOI: 10.31038/JCCP.2020323

Abstract

There is an enormous demand for effective medication against COVID-19. The cardiac steroid ouabain has properties qualifying it as a drug in the battle against the actual corona pandemic. Strong antiviral properties against different viruses including SARS- CoV-2 have been circumstantiated. Ouabain increases the resistance to hypoxia and exerts protecting effects in cytokine dysregulation. The application of ouabain could to be useful at any stage of COVID-19.

Keywords

Antiviral, ARS-CoV-2, COVID-19, Cytokine dysregulation, Ouabain

Introduction

SARS-CoV-2 has locked down the world. Human victims and the economic damage are tremendous. The need for effective medication in COVID-19 is immense. Ouabain is a drug extracted from the seeds of an African vine. The favorable effects of this drug in different forms of heart disease have been well known for longtime. Nowadays ouabain is used in cancer and antiviral research. In this article the antiviral properties of ouabain and its potential effects in treating COVID-19 patients are presented.

Specific Qualities of Ouabain

Strong Antiviral Properties

Ouabain, a cadiotonic steroid, is part of the cardioactive glycosides. Ouabain has strong antiviral properties. Three examples: (a) The replication of influenza A virus will be inhibited almost completely by ouabain. 24 h post-infection with influenza A the viral titers were found to be decreased by 99.1% with ouabain treatment [1]. (b) Ouabain was shown to reduce the replication rate of Ebola virus by 50% within 48 h [2]. (c) Ouabain was identified as having robust efficiency against Japanese Encephalitis Virus (JEV) infection. JEV infection was blocked by ouabain at the replication stage within 24 h. Furthermore, it was proven that ouabain significantly reduced the morbidity and mortality caused by JEV in a BALB/c mouse model [3]. The ability of ouabain to inhibit virus replication has been proven for different other viruses with a lipid envelope: Herpes simplex virus, vaccinia poxvirus, murine leukemia virus, SARS corona viruses, and others.

In the vast majority of publications these antiviral effects of ouabain are interpreted as the result of the inhibition of the sodium pump (NKA) by cardiac glycosides. This interpretation is wrong. It ignores the ouabain-research within the last decades. In the nineties ouabain was identified as an endogenous hormone. This discovery led to an intense re-examination of the drug. Till today, the existence of an endogenous ouabain produced in the adrenal cortex is still discussed controversially. In the course of the following research activities it was discovered that ouabain in nanomola concentrations stimulates the cardiac sodium pump [4]. The inhibitory effect on cardiac NKA needs millimolar concentrations. Ouabain has hormetic properties. That means a low dose leads to stimulation or beneficial effects and a high dose to inhibitory or toxic effects.

Today it is well-documented that ouabain in low concentration can activate multiple signal transduction pathways [5]. Ouabain binds to a region of the NKA which is located in caveolae on the sarcolemma. The caveolae contain signalosomes which form a vesicular signaling platform. When ouabain binds to NKA different proteins complexes are activated. They send signals to the cell, to intracellular signaling complexes, to mitochondria, and the nucleus. The activated signal cascades by ouabain induce homeostatic and  protective  effects. The signaling activities of ouabain occur without affecting the ion pumping function of the NKA [6]. The strong effects of ouabain on virus replication need a low concentration of the drug. Concentration of 20 nMol was successful in tissue cultures with influenza A and Ebola virus. In this concentration ouabain exerts a stimulating effect on the sodium pumps. Recently it was shown that ouabain suppresses coronaviral replication. The authors of this study did not restrict their view on activation or inhibition of the NKA. They looked for potential signal pathways involved in this antiviral effect. They showed that ouabain suppresses coronaviral replication via amplifying a signal cascade in the cytoplasm. Augmenting the NKA-dependent PI3K_ PDK1 axis signaling by ouabain contributed essentially to antiviral activity and replication [7].

Just published is a study from Korea which aimed to assess antiviral activity of ouabain and digoxin against SARS-CoV-2 infection [8]. The half-maximal inhibitory concentration (IC50) of ouabain and digoxin were determined at a nanomolar concentration. Virus titers of single dose treatment of ouabain and digoxin showed a >99% inhibition of SARS-CoV-2 replication. In comparison with chloroquine, ouabain and digoxin were much more effective. Notably, ouabain and digoxin significantly inhibited viral mRNA expression, copy number and viral protein expression when administered at the post-entry stage. When given at the host entry stage of the virus cycle digoxin did not show effective antiviral activity. However, ouabain treatment at the entry stage inhibited approximately 50% of viral mRNA expression and protein expression.

In research and clinics both cardiac glycosides – ouabain and digitalis derivates – are equalized with regards to their mode of action and their clinical effects. There is a need for differentiation [9]. The hydrophilic ouabain acts at the surface of the cells. The lipophilic digitalis glycosides penetrate the cell membrane and interact with complete different receptors in the cytoplasm. There are important differences in signal transduction and clinical effects between ouabain and digitalis glycosides.

Increasing the Resistance to Hypoxia

In COVID-19 lack of oxygen is crucial. In dogs, application of Ouabain increases the resistance to hypoxia [10]. Seventy years ago already the German physiologist Rein reported that on treatment with ouabain “the animal simply became resistant against oxygen deficiency for hours” [10]. Recently, it was shown that ouabain, given immediately before an anoxic period of 30 minutes, protected rat hearts as documented by an improved recovery of contractile function and a reduction of infarct size [11]. The interaction of ouabain with the Na+-K+-ATP ase activates a cellular signaling cascade involving src kinase, mitoKATP, and ROS. Via this pathway ouabain protects the outer mitochondrial membrane integrity, adenine nucleotide compartmentation, and energy transfer efficiency. By preserving the mitochondrial function ouabain boosts the resistance of the myocardium against oxygen deficiency.

Protection against Cytokine Dysregulation

Cytokine dysregulation is  a  common  feature  in  COVID-19.  A dysregulated immune response to  SARS-CoV-2  appears  to  drive mortality in this disease. A subset of COVID-19 patients is characterized by the development of a cytokine storm syndrome (CSS). Interleukin (IL)-6 levels, and tumor necrosis factor (TNF)-α levels are predictors of COVID-19 severity and in-hospital mortality. Targeting cytokine dysregulation in COVID-19 could be critical for reducing mortality.

Ouabain protects against cytokine dysregulation. It acts in different ways, (a) by interacting directly with immunocytes and (b) by stimulation of vagal activity.

(a). To illustrate the interaction of ouabain with immunocytes, the following paper will be quoted. In the study: “Modulation of Cytokine Production and Protection against Lethal Endotoxemia by the Cardiac Glycoside Ouabain” [12] human peripheral blood mononuclear cells (PBMC) were obtained from healthy volunteers. PBMC were cultured with or without ouabain in the presence or absence of lipopolysaccharide (LPS). LPS stimulates immunocytes, mainly macrophages, to generate IL-1, IL-6, TNF-α, and other substances. When PBMC were stimulated with LPS, ouabain suppressed the production of IL-6 and TNF-α. To investigate whether ouabain modulates cytokine production in vivo, the effects  of ouabain in LPS-treated mice were evaluated. Ouabain was found to protect against LPS-induced lethal toxicity in mice and decreased circulating IL-6 and TNF-α levels in vivo [12].

(b). It is becoming increasingly clear that the autonomic nervous system and the immune system demonstrate cross-talk during inflammation by means of sympathetic and parasympathetic pathways. On the parasympathetic side, a vagus nerve-mediated inflammatory reflex was recognized during the past years. The central nervous system recognizes peripheral inflammation via afferent vagus nerve signaling.  The efferent  arm of this reflex is referred to as the “cholinergic anti-inflammatory pathway”. Vagal nerve signaling to macrophages in the spleen inhibit pro- inflammatory cytokine production and attenuate peripheral innate immune response. Stimulation of the vagus  nerve prevents the damaging effects of cytokine release in experimental sepsis, endotoxemia, ischemia/reperfusion injury and other inflammatory syndromes [13-15].

Cholinergic agonists inhibit pro-inflammatory cytokines synthesis and prevent cytokine-mediated diseases [13]. Ouabain is   a strong cholinergic agonist by inducing the release of acetylcholine from the peripheral postganglionic vagal fibers. This qualifies ouabain as an agent to protect effectively against cytokine dysregulation. In  a cytokine storm syndrome, catecholamines are involved and make the cytokine dysregulation worse. Ouabain antagonizes the effects of catecholamines. It was shown that ouabain diminishes severely the nor-adrenaline content of the blood in heart insufficiency patients [16]. Low concentrations of ouabain are able to block the adrenaline release from adrenal medulla [17]. Sympathetic over activity and catecholamines enhance inflammatory injury by augmenting the production of IL-6 and other cytokines. Vagal activity and ouabain will protect against a cytokine storm.

Conclusion

Three specific features of ouabain are highlighted: Ouabain has strong antiviral capabilities against different viruses including SARS- CoV-2 in vitro. Application of Ouabain in vivo increases resistance to hypoxia and exerts protective effects against cytokine dysregulation. This all together qualifies ouabain as a valuable drug in the treatment of COVID-19.

Many COVID-19 patients have heart problems, high blood pressure, coronary artery disease or  heart  insufficiency.  Exactly  for these diseases ouabain was the leading medicine in Europe and particular in Germany for decades in the last century. Then it was marginalized by the introduction of beta blockers and ACE inhibitors in the nineties. Clinicians today regard Ouabain as contraindicated for coronary patients. The general belief is: Cardiac steroids block the sodium pump leading to calcium influx, inotropy and an augmentation of cardiac oxygen consumption which is deleterious for these patients. This reasoning neglects the hormetic character of ouabain. It ignores the multiple signaling effects activated by Ouabain. It overlooks that Ouabain in low concentration diminishes cardiac oxygen consumption [18]. In COVID-19 patients with heart problems Ouabain is particularly suitable.

In COVID-19 ouabain should be given at any stage of the disease. Symptoms plus positive testing would be the best starting point to prevent serious complications. Intensive care physicians should gain experience with ouabain in cases of a severe course of the disease. The current study from Korea [8] shows strong effects of ouabain at the host entry stage of the virus cycle. As a large number of patients are asymptomatic at the initial stage of SARS-CoV-2 infection, it could be useful to take ouabain prophylactically. This could prevent an increase in disease incidence, especially in slum areas and favelas.

Ouabain is used in Germany as an oral application – tablets and liquids – and as an intravenous injection. These medicines are natural products of the strophanthus vine. Ouabain can be synthesized chemically. Upon daily i.v.-administration of 0.5 mg ouabain to normal subjects, a steady-state plasma concentration of 0.5 ng/ml has been determined [19]. A median therapeutic dose is 0.125-0.25 mg Ouabain
i.v. twice per day. In this dosage intravenous Ouabain is safe and free of any side effects. Orally taken, the effect levels of ouabain are in the same low nanomolar range. Oral Ouabian is also effective and free of side effects. Hypokalaemia and hypercalcemia are contraindications, as well as bradycardic rhythm and conduction disorders.

My respect and much gratitude to Dr. Hauke Fürstenwerth for his extensive scientific activity on the topic of ouabain.

References

  1. Hoffmann H-H, Palese P, Shaw ML (2008) Modulation of influenza virus replication by alteration of sodium ion transport and protein kinase C activity. Antiviral Res 80: 124-134. [crossref]
  2. Garcia-Dorival I, Wu W, Dowall S, Stuart Armstrong, Olivier Touzelet, et al. (2014) Elucidation of the Ebola Virus VP24 Cellular Interactome and Disruption of Virus Biology Through Targeted Inhibition of Host-Cell Protein Function. J Proteome Res 13: 5120-5135. [crossref]
  3. Guo J, Jia X, Liu Y, Wang S, Junyuan Cao 1 2, Bo Zhang, et al. (2020) Screening  of Natural Extracts for Inhibitors against Japanese Encephalitis Virus Infection. Antimicrob Agents Chemother 64: e02373-19. [crossref]
  4. Gao J, Wymore RS, Wang Y, Glenn R. Gaudette, Irvin B. Krukenkamp, et al. (2002) Isoform-specific stimulation of cardiac Na/K pumps by nanomolar concentrations of glycosides. J Gen Physiol 119: 297-312. [crossref]
  5. Aperia A (2007) New roles for an old enzyme: Na,K-ATPase emerges as an interesting drug target. J Int Med 261: 44-52. [crossref]
  6. Zhang L, Zhang Z, Guo H, Yongli Wang (2008) Na+/K+-ATPase-mediated signal transduction and Na+/K+-ATPase regulation. Fundam Clin Pharmacol 22: 615-621. [crossref]
  7. Yang CW, Chang HY, Lee YZ, Hsing-Yu Hsu, Shiow-Ju Lee (2018) The cardenolide ouabain suppresses coronaviral replication via augmenting a Na+/K+-ATPase- dependent PI3K_PDK1 axis signaling. Toxicology and Applied Pharmacology 356: 90-97. [crossref]
  8. Cho J, Lee YJ, Kim J-H, Sang il Kim, Sung Soon Kim, et al. (2020) Antiviral activitiy of digoxin and ouabain against SARS-CoV-2 infection and its implication for COVID-19. DOI: https://doi.org/10.21203/rs.3.rs-34731/v1.
  9. Fuerstenwerth H (2011) On the Differences Between Ouabain and Digitalis Glycosides. Am J Ther 21: 35-42. [crossref]
  10. Rein H (1949) Über ein Regulationssystem Milz-Leber für den oxidativen Stoffwechsel der Körpergewebe und besonders des Herzens. Naturwissenschaften 36: 233-239, 36: 260-268, (quoted from Fuerstenwerth H (2012) Rethinking heart failure. Cardiol Res 3: 243-257.
  11. Pasdois P, Quinlan CL, Rissa A, Liliane Tariosse, Béatrice Vinassa, et al. (2007) Ouabain protects rat hearts against ischemia-reperfusion injury via pathway involving src kinase, mitoKATP, and ROS. Am J Physiol Heart Circ Physiol 292: H1470-1478. [crossref]
  12. Matsumori A, Ono K, Nishio R, Igata H, Shioi T, et al. (1997) Modulation of Cytokine Production and Protection Against Lethal Endotoxemia by the Cardiac Glycoside Ouabain. Circulation 96: 1501-1506. [crossref]
  13. Tracey KJ (2007) Physiology and immunology of the cholinergic antiinflammatory pathway. J Clin Invest 117: 289-296. [crossref]
  14. Huston JM (2012) The vagus nerve and the inflammatory reflex: wandering on a new treatment paradigm for systemic inflammation and sepsis. Surg Infect (Larchmt) 13: 187-193. [crossref]
  15. Boeckxstaens G (2013) The clinical importance of the anti-inflammatory vagovagal reflex. Handb Clin Neurol 117: 119-134. [crossref]
  16. Agostini PG Doria E, Berti M, Guazzi MD (1994) Long-term use of k-strophanthin in advanced congestive heart failure due to dilated cardiomyopathy: a double-blind crossover evaluation versus digoxin. Clin Cardiol 17: 536-554. [crossref]
  17. Gutman Y, Boonyaviroj P (1977) Mechanism of inhibition of catecholamine release from adrenal medulla by diphenylhydantoin and by low concentrations of ouabain (10(- 10)M). Naunyn Schmiedebergs Arch Pharmacol 296: 293-296. [crossref]
  18. Sroka K (2015) Ouabain: a re-evaluation. Med Welt 66: 275-280 (in German).
  19. Selden R, Smith TW, Findley W (1972) Ouabain Pharmacokinetics in Dog and Man. Circulation 45: 1176-1182. [crossref]

Mouthwash Use and Associated Factors among Saudi Adults: A Cross-sectional Study

DOI: 10.31038/JDMR.2020323

Abstract

The purpose of this study was to determine the state of mouthwash use, practice, and attitude among a cohort of adult Saudi population. A convenience sample of 999 outpatients were asked to participate in a self-administered survey on the mouthwash use, effects, attitude, and practice. While 38% of the participants reported that they never used a mouthwash, 14.4%, 28.7%, and 18.8% used a mouthwash either daily, once every few days, or less than once a month, respectively. More than half of the respondents (55.4%) trusted that the use of mouthwash does not cause any side effects and 70.5% indicated that they do not know whether using mouthwash would be considered a risk factor for oral cancer. Similarly, more than half of the respondents (50.4%) were not aware of the active ingredients in a mouthwash. 69% indicated that the use of mouthwash does not compromise the importance of toothbrushing in plaque removal. There was significant difference in the practice and frequency of mouthwash use with regards to the social status, educational level, tooth brushing and flossing frequency, presence of caries, periodontal disease, and fixed restoration among respondents (p≤0.05). There were diverse patterns of knowledge and understanding regarding the proper and safe use of mouthwash among the studied sample.

Keywords

Mouthwash, Oral hygiene, Side effects, Oral health

Introduction

Mouthwashes are medicated solutions used as a supplement oral hygiene measure. Several oral conditions may require the use of a mouthwash ranging from halitosis, gingivitis and other periodontal diseases to treatment of ulcerative and infectious lesions and oral mucositis. Its ease of use in addition to the antibacterial effectiveness made mouthwashes a valuable preventive and therapeutic practice especially for periodontal diseases. A mouthwash may be recommended as an antimicrobial, anti-inflammatory, analgesic, deodorant, or astringent agent [1-3].

Oral Diseases, specifically caries and periodontitis, are a major public health concern owing to their high prevalence, incidence, and their effects on the individual’s quality of life. The severe impact in terms of pain and suffering, impairment of function together with the high cost of treatment makes them also one of the leading health problems in most parts of the world, including Kingdom of Saudi Arabia (KSA). In 2012 the World Health Organization (WHO) estimated that, worldwide, 60-90% of school children and almost 100% adults would have dental problems [4-6].

The oral cavity harbors hundreds of microbial species that occur in both planktonic and biofilm forms. Poor oral hygiene leads to accumulation of oral bacteria and thus reducing the microbial load is considered the first step toward achieving good oral hygiene. This is usually achieved primarily through the use mechanical aids such as brushing and flossing. Studies have confirmed that the use of adjunct chemical measures such as mouthwashes has positive synergetic effect in improving the oral hygiene [7,8]. The aim of the current cross-sectional study was to investigate the state of mouthwash use, practice, and attitude among a cohort of adult Saudi population.

Materials and Methods

The present cross-sectional study was carried out in the outpatient department of King Khaled University Hospital and the Dental Hospital, King Saud University in Riyadh, KSA. A convenience sample of 999 outpatients were asked to participate in the study. A self-administered structured questionnaire was distributed to the patients to evaluate the mouthwash use, effects, attitude, and practice. The inclusion criteria were adult patients above 18 years of age with no gender predilection and able to provide responses in the questionnaire form. The questionnaire was designed by the authors and was hand delivered to the respondents. Participation was voluntary and anonymous. The questionnaire included questions about the personal and demographic data as well as questions about the use of mouthwash, general oral health and oral hygiene practice. The study was reviewed and approved by the Research Ethics Review Committee (Research project no E-17-2744). The questionnaire was pre-tested on a representative sample of 35 subjects to check for appropriateness and any required modifications. The first seven questions determined subjects’ demographic profile and included information on the gender, nationality, age, marital status, education, monthly income, and smoking status. The rest of the questions focused on type of dental care, oral hygiene practice, oral health conditions, and the use of mouthwashes.

All data were statistically analyzed using SPSS (Statistical Package for Social Science, IBM SPSS 21.0; Chicago, IL, USA). The data were subjected to a descriptive analysis and statistically represented in terms of numbers, percentages, and 95% confidence interval. Association between the parameters was done using crosstab chi-square test. Differences were considered statistically significant when the p-values were ≤ 0.05.

Results

The total number of adult subjects participating in the survey was 999 (394 males, 605 females, age range 18-65 years).Almost 75% of the respondents were college educated or higher with half of them (50.1%) reporting a private educational institute. The sample almost composed of Saudi citizens (94.4%). Demographic characteristics of the participants are shown in Table 1.

Table 1: Demographic characteristics of the study sample (n=999).

Characteristics


n

%

Gender


Male

394

(39.40)


Female

605

(60.60)

Nationality


Saudi

943

(94.40)


Non-Saudi

56

(5.60)

Age


18-25 yrs

324

(32.40)


26-35 yrs

386

(38.60)


36-45 yrs

184

(18.40)


46-55 yrs

92

(9.20)


56-65 yrs

13

(1.30)

Social Status


Single

404

(40.40)


Married

561

(56.20)


Divorced

24

(2.40)


Widow

10

(1.00)

Educational Level


Uneducated

2

(0.20)


Less than high school

49

(4.90)


High school

201

(20.10)


College

619

(62.00)


Post graduate studies

128

(12.80)

Public\Private


Public

499

(49.90)


Private

500

(50.10)

Monthly Family Income


Less than 5000 SAR

86

(8.60)


5000-10000

269

(26.90)


10000-20000

344

(34.40)


More than 20000

300

(30.00)

Smoking Status


Currently Smoking

158

(15.80)


Previous Smoker (stopped within the last 12 months)

26

(2.60)


Previous Smoker (stopped over 12 months ago)

34

(3.40)


Never Smoked

781

(78.20)

Table 2 summarizes the oral hygiene practice and attitude among the study sample. Out of the 999 respondents, 68% had visited their dentist for regular dental care in less than a year. The reason for the visit was an emergency treatment in 38.5% of the cases while 25% and 15.8% were either for non-urgent treatment or dental checkup. Approximately 56% reported brushing their teeth twice or more a day while 33%, 11% either brushed once a day or less than daily, respectively. Similarly, 16.4% reported flossing daily while 27%, 16%, 40.5% flossed either once every few days, less than once a month, or never flossed, respectively.

Table 2: Oral health practice and attitude among the study sample.


n

%

Type of regular dental care


Governmental Practice

160

(16.00)


Private Practice

585

(58.60)


None

254

(25.40)

Time since last dental check-up


Less than a year

679

(68.00)


1-2 years

198

(19.80)


2-5 years

70

(7.00)


5-10 years

29

(2.90)


Have not visited a dentist for over 10 years

23

(2.30)

Reasons for last dental visit


Emergency treatment needed for teeth or gums

385

(38.50)


Non-urgent treatment for teeth or gums

251

(25.10)


Dental Check-up

158

(15.80)


Can’t remember

61

(6.10)


Other

144

(14.40)

Tooth brushing frequency


Twice or more a day

558

(55.90)


Once a day

329

(32.90)


Less than daily

108

(10.80)


Never

4

(0.40)

Flossing Frequency


Daily

164

(16.40)


Once every few days

271

(27.10)


Less than once a month

159

(15.90)


Never

405

(40.50)

Table 3 presents the general and oral health of the respondents. Almost half of the sample indicated good general and oral health, more than 70% being dentulous with more than 20 teeth. Caries was reported in 36%, periodontal diseases in 20.7%, oral ulcers in 4.8%, staining in 8.7%, halitosis in 21%, and infections or abscesses in 5.6% of the sample.About half of the respondents (49%) reported having a restoration or prosthetic appliances either removable, fixed, or implants.

Table 3: General and oral health characteristics of the study sample.

General Health


n

%


Excellent

421

(42.10)


Good

481

(48.10)


Fair

82

(8.20)


Poor

15

(1.50)

Dental Health


Excellent

224

(22.40)


Good

527

(52.80)


Fair

196

(19.60)


Poor

52

(5.20)

Current number of natural teeth


Fewer than 10

44

(4.40)


Between 10 and 19

255

(25.50)


20 or more

700

(70.10)

Do you currently suffer of any of these conditions?


Caries


Yes

361

(36.10)


No

525

(52.60)


Do not know

113

(11.30)

Periodontal Disease


Yes

207

(20.70)


No

681

(68.20)


Do not know

111

(11.10)

Oral Ulcer


Yes

48

(4.80)


No

846

(84.70)


Do not know

105

(10.50)

Stains


Yes

87

(8.70)


No

815

(81.60)


Do not know

97

(9.70)

Halitosis


Yes

210

(21.00)


No

677

(67.80)


Do not know

112

(11.20)

Infections (Abscess)


Yes

56

(5.60)


No

857

(85.80)


Do not know

86

(8.60)

Do you currently have any of the following?


Bridges


Yes

269

(26.90)


No

670

(67.10)


Do not know

60

(6.00)

Implants


Yes

149

(14.90)


No

783

(78.40)


Do not know

67

(6.70)

Dentures


Yes

77

(7.70)


No

848

(84.90)


Do not know

74

(7.40)

Table 4 presents the responses regarding mouthwash use, knowledge, and practice. While 38% of the participants reported that they never used a mouthwash, 14.4%, 28.7%, and 18.8% used a mouthwash either daily, once every few days, or less than once a month respectively. More than half of the respondents (55.4%) trusted that the use of mouthwash does not cause any side effects and 70.5% indicated that they do not know whether using mouthwash would be considered a risk factor for oral cancer. Similarly, more than half of the respondents (50.4%) were not aware of the active ingredients in a mouthwash. 69% indicated that the use of mouthwash does not compromise the importance of toothbrushing in plaque removal.

Table 4: Mouthwash use and practice among the study sample.

How often do you rinse with a mouthwash


n

%


Daily

144

(14.40)


Once every few days

287

(28.70)


Less than once a month

188

(18.80)


Never

380

(38.00)

Does the use of mouthwashes have any side effects


Yes

106

(10.60)


No

553

(55.40)


Do not know

340

(34.00)

Is the use of mouthwashes a risk factor for oral cancer


Yes

24

(2.40)


No

271

(27.10)


Do not know

704

(70.50)

Are you aware of the different active ingredients found in the mouthwashes


Yes

121

(12.10)


No

375

(37.50)


Do not know

503

(50.40)

Does the use of mouthwashes reduce the importance of toothbrushing in plaque removal


Yes

67

(6.70)


No

690

(69.10)


Do not know

242

(24.20)

There was significant difference in the practice and frequency of mouthwash use with regards to the social status, educational level, the reason for last dental visit, tooth brushing and flossing frequency, caries, periodontal disease, and the presence of fixed restoration among respondents (Tables 5 and 6).

Table 5: Association of mouthwash use and practice with the demographics, socioeconomic and educational status, and smoking among the studied sample.

Characteristics

Total

Responses

P-value

Daily

Once every few days

Less than once a month

Never

Count (%)

95% CI

Count (%)

95% CI

Count (%)

95% CI

Count (%)

95% CI

Sex

0.083


Male

394

49 (12.40)

(9.54-16.07)

102 (25.90)

(21.81-30.43)

84 (21.30)

(17.56-25.63)

159 (40.40)

(35.63-45.27)


Female

605

95 (15.70)

(13.02-18.81)

185 (30.60)

(27.04-34.36)

104 (17.20)

(14.39-20.40)

221 (36.50)

(32.79-40.44)


Age


0.415

18-25 yrs

324

48 (14.80)

(11.36-19.09)

98 (30.20)

(25.50-35.46)

55 (17.00)

(13.28-21.45)

123 (38.00)

(32.85-43.36)


26-35 yrs

386

57 (14.80)

(11.58-18.66)

116 (30.10)

(25.69-34.80)

79 (20.50)

(16.75-24.78)

134 (34.70)

(30.14-39.60)


36-45 yrs

184

28 (15.20)

(10.75-21.12)

45 (24.50)

(18.81-31.15)

32 (17.40)

(12.60-23.52)

79 (42.90)

(35.99-50.15)


46-55 yrs

92

11 (12.00)

(6.81-20.16)

26 (28.30)

(20.07-38.19)

17 (18.50)

(11.87-27.62)

38 (41.30)

(31.79-51.51)


56-65 yrs

11

0 (0.00)

(0.00-25.88)

2 (18.20)

(5.14-47.70)

5 (45.50)

(21.27-71.99)

4 (36.40)

(15.16-64.62)


> 65 yrs

2

0 (0.00)

(0.00-65.76)

0 (0.00)

(0.00-65.76)

0 (0.00)

(0.00-65.76)

2 (100.00)

(34.24-100.0)


Social Status

0.012


Single

404

60 (14.90)

(11.71-18.65)

125 (30.90)

(26.63-35.61)

67 (16.60)

(13.27-20.52)

152 (37.60)

(33.03-42.44)


Married

561

73 (13.00)

(10.48-16.05)

150 (26.70)

(23.24-30.55)

117 (20.90)

(17.70-24.41)

221 (39.40)

(35.43-43.49)


Divorced

24

7 (29.20)

(14.92-49.17)

11 (45.80)

(27.89-64.92)

2 (8.30)

(2.31-25.84)

4 (16.70)

(6.68-35.86)


Widow

10

4 (40.00)

(16.82-68.73)

1 (10.00)

(1.79-40.41)

2 (20.00)

(5.67-50.98)

3 (30.00)

(10.78-60.32)


Educational Level

0.023


Uneducated

2

0 (0.00)

(0.00-65.76)

1 (50.00)

(9.45-90.55)

0 (0.00)

(0.00-65.76)

1 (50.00)

(9.45-90.55)


Less than high school

49

9 (18.40)

(9.98-31.36)

10 (20.40)

(11.48-33.64)

7 (14.30)

(7.10-26.67)

23 (46.90)

(33.70-60.62)


High school

201

35 (17.40)

(12.79-23.25)

43 (21.40)

(16.29-27.57)

32 (15.90)

(11.51-21.61)

91 (45.30)

(38.54-52.18)


College

619

88 (14.20)

(11.69-17.19)

190 (30.70)

(27.19-34.43)

115 (18.60)

(15.71-21.83)

226 (36.50)

(32.81-40.38)


Post graduate studies

128

12 (9.40)

(5.45-15.68)

43 (33.60)

(25.99-42.14)

34 (26.60)

(19.67-34.81)

39 (30.50)

(23.16-38.92)


Monthly Family Income

0.879


Less than 5000 SAR

86

16 (18.60)

(11.79-28.10)

20 (23.30)

(15.59-33.21)

16 (18.60)

(11.79-28.10)

34 (39.50)

(29.86-50.10)


5000-10000

269

37 (13.80)

(10.14-18.38)

76 (28.30)

(23.21-33.91)

49 (18.20)

(14.07-23.27)

107 (39.80)

(34.11-45.73)


10000-20000

344

43 (12.50)

(9.41-16.41)

103 (29.90)

(25.34-34.98)

66 (19.20)

(15.38-23.68)

132 (38.40)

(33.39-43.61)


More than 20000

300

48 (16.00)

(12.29-20.57)

88 (29.30)

(24.47-34.72)

57 (19.00)

(14.96-23.82)

107 (35.70)

(30.46-41.24)


Smoking Status

0.770


Currently Smoking

158

26 (16.50)

(11.49-23.02)

47 (29.70)

(23.17-37.29)

24 (15.20)

(10.43-21.61)

61 (38.60)

(31.37-46.39)


Previous Smoker (stopped within the last 12 months)

26

4 (15.40)

(6.15-33.53)

5 (19.20)

(8.51-37.88)

8 (30.80)

(16.50-49.99)

9 (34.60)

(19.42-53.78)


Previous Smoker (stopped over 12 months ago)

34

3 (8.80)

(3.04-22.96)

10 (29.40)

(16.83-46.17)

8 (23.50)

(12.44-40.00)

13 (38.20)

(23.90-54.96)


Never Smoked

781

111 (14.20)

(11.94-16.83)

225 (28.80)

(25.74-32.08)

148 (19.00)

(16.36-21.85)

297 (38.00)

(34.69-41.49)


Table 6: Association of mouthwash use and practice with the oral health and oral hygiene practices among the studied sample.

Characteristics

Total

Responses

P-value

Daily

Once every few days

Less than once a month

Never

Count (%)

95% CI

Count (%)

95% CI

Count (%)

95% CI

Count (%)

95% CI

Reasons for last dental visit

0.025

Emergency treatment needed for teeth or gums

385

49 (12.70)

(9.76-16.43)

111 (28.80)

(24.53-33.55)

76 (19.70)

(16.07-24.01)

149 (38.70)

(33.97-43.65)


Non-urgent treatment for teeth or gums

251

38 (15.10)

(11.23-20.10)

81 (32.30)

(26.79-38.28)

44 (17.50)

(13.33-22.71)

88 (35.10)

(29.42-41.15)


Dental Check-up

158

23 (14.60)

(9.90-20.90)

46 (29.10)

(22.59-36.62)

31 (19.60)

(14.18-26.50)

58 (36.70)

(29.59-44.46)


Can’t remember

61

11 (18.00)

(10.38-29.47)

9 (14.80)

(7.96-25.72)

4 (6.60)

(2.58-15.69)

37 (60.70)

(48.12-71.94)


Other

144

23 (16.00)

(10.88-22.83)

40 (27.80)

(21.11-35.60)

33 (22.90)

(16.81-30.44)

48 (33.30)

(26.15-41.37)


Flossing Frequency

0.001

Daily

164

50 (30.50)

(23.96-37.92)

52 (31.70)

(25.08-39.18)

16 (9.80)

(6.10-15.26)

46 (28.00)

(21.74-35.37)


Once every few days

271

81 (29.90)

(24.75-35.59)

100 (36.90)

(31.38-42.79)

47 (17.30)

(13.30-22.30)

43 (15.90)

(12.00-20.69)


Less than once a month

159

59 (37.10)

(29.99-44.84)

42 (26.40)

(20.18-33.77)

42 (26.40)

(20.18-33.77)

16 (10.10)

(6.29-15.72)


Never

405

190 (46.90)

(42.10-51.78)

93 (23.00)

(19.13-27.30)

83 (20.50)

(16.84-24.69)

39 (9.60)

(7.12-12.89)


Tooth brushing frequency

0.001

Twice or more a day

558

167 (29.90)

(26.28-33.86)

174 (31.20)

(27.48-35.14)

103 (18.50)

(15.46-21.89)

114 (20.40)

(17.29-23.97)


Once a day

329

154 (46.80)

(41.49-52.21)

93 (28.30)

(23.68-33.37)

58 (17.60)

(13.89-22.11)

24 (7.30)

(4.95-10.62)


Less than daily

108

57 (52.80)

(43.43-61.94)

18 (16.70)

(10.81-24.82)

27 (25.00)

(17.79-33.93)

6 (5.60)

(2.57-11.60)


Never

4

2 (50.00)

(15.00-85.00)

2 (50.00)

(15.00-85.00)

0 (0.00)

(0.00-48.99)

0 (0.00)

(0.00-48.99)


Caries

0.001

Yes

361

147 (40.70)

(35.78-45.86)

93 (25.80)

(21.52-30.51)

68 (18.80)

(15.14-23.19)

53 (14.70)

(11.40-18.70)


No

525

176 (33.50)

(29.61-37.66)

169 (32.20)

(28.34-36.30)

95 (18.10)

(15.04-21.62)

85 (16.20)

(13.29-19.58)


Do not know

113

57 (50.40)

(41.36-59.49)

25 (22.10)

(15.46-30.62)

25 (22.10)

(15.46-30.62)

6 (5.30)

(2.46-11.10)


Periodontal Disease

0.001

Yes

207

58 (28.00)

(22.35-34.50)

73 (35.30)

(29.08-41.99)

37 (17.90)

(13.25-23.66)

39 (18.80)

(14.10-24.72)


No

681

272 (39.90)

(36.33-43.67)

196 (28.80)

(25.51-32.29)

117 (17.20)

(14.53-20.20)

96 (14.10)

(11.69-16.92)


Do not know

111

50 (45.00)

(36.11-54.32)

18 (16.20)

(10.51-24.19)

34 (30.60)

(22.82-39.73)

9 (8.10)

(4.33-14.70)


Oral Ulcer

0.336

Yes

48

8 (16.70)

(8.70-29.58)

13 (27.10)

(16.56-40.99)

5 (10.40)

(4.53-22.17)

22 (45.80)

(32.57-59.71)


No

846

121 (14.30)

(12.10-16.82)

252 (29.80)

(26.81-32.96)

159 (18.80)

(16.30-21.56)

314 (37.10)

(33.93-40.43)


Do not know

105

15 (14.30)

(8.86-22.24)

22 (21.00)

(14.26-29.69)

24 (22.90)

(15.87-31.76)

44 (41.90)

(32.91-51.46)


Stains

0.709

Yes

87

13 (14.90)

(8.94-23.90)

26 (29.90)

(21.29-40.19)

14 (16.10)

(9.83-25.21)

34 (39.10)

(29.50-49.59)


No

815

118 (14.50)

(12.23-17.06)

239 (29.30)

(26.31-32.55)

150 (18.40)

(15.89-21.21)

308 (37.80)

(34.53-41.17)


Do not know

97

13 (13.40)

(8.00-21.59)

22 (22.70)

(15.48-31.96)

24 (24.70)

(17.23-34.18)

38 (39.20)

(30.06-49.13)


Smell

0.188

Yes

210

34 (16.20)

(11.82-21.77)

54 (25.70)

(20.27-32.02)

44 (21.00)

(15.99-26.95)

78 (37.10)

(30.89-43.85)


No

677

100 (14.80)

(12.30-17.64)

205 (30.30)

(26.94-33.84)

116 (17.10)

(14.48-20.15)

256 (37.80)

(34.24-41.52)


Do not know

112

10 (8.90)

(4.92-15.66)

28 (25.00)

(17.90-33.76)

28 (25.00)

(17.90-33.76)

46 (41.10)

(32.40-50.33)


Infections (Abscess)

0.448

Yes

56

8 (14.30)

(7.42-25.74)

20 (35.70)

(24.45-48.80)

8 (14.30)

(7.42-25.74)

20 (35.70)

(24.45-48.80)


No

857

126 (14.70)

(12.49-17.23)

249 (29.10)

(26.11-32.18)

161 (18.80)

(16.32-21.54)

321 (37.50)

(34.28-40.75)


Do not know

86

10 (11.60)

(6.44-20.10)

18 (20.90)

(13.67-30.68)

19 (22.10)

(14.62-31.94)

39 (45.30)

(35.25-55.84)


Others

0.495

Yes

112

17 (15.20)

(9.70-22.97)

33 (29.50)

(21.81-38.47)

20 (17.90)

(11.87-25.98)

42 (37.50)

(29.09-46.74)


No

733

109 (14.90)

(12.48-17.63)

216 (29.50)

(26.28-32.87)

141 (19.20)

(16.55-22.25)

267 (36.40)

(33.03-39.98)


Do not know

154

18 (11.70)

(7.52-17.72)

38 (24.70)

(18.54-32.05)

27 (17.50)

(12.34-24.30)

71 (46.10)

(38.42-53.97)


Bridges

0.037

Yes

269

96 (35.70)

(30.20-41.58)

73 (27.10)

(22.18-32.75)

55 (20.40)

(16.06-25.67)

45 (16.70)

(12.74-21.65)


No

670

257 (38.40)

(34.75-42.10)

207 (30.90)

(27.52-34.50)

117 (17.50)

(14.77-20.52)

89 (13.30)

(10.92-16.06)


Do not know

60

27 (45.00)

(33.09-57.51)

7 (11.70)

(5.77-22.18)

16 (26.70)

(17.14-39.01)

10 (16.70)

(9.32-28.04)


Implants

0.171

Yes

149

26 (17.40)

(12.20-24.34)

51 (34.20)

(27.09-42.16)

22 (14.80)

(9.96-21.35)

50 (33.60)

(26.48-41.47)


No

783

105 (13.40)

(11.20-15.98)

223 (28.50)

(25.43-31.74)

151 (19.30)

(16.67-22.19)

304 (38.80)

(35.48-42.29)


Do not know

67

13 (19.40)

(11.70-30.42)

13 (19.40)

(11.70-30.42)

15 (22.40)

(14.07-33.71)

26 (38.80)

(28.05-50.78)


Removable

0.762

Yes

77

15 (19.50)

(12.18-29.68)

18 (23.40)

(15.33-33.96)

15 (19.50)

(12.18-29.68)

29 (37.70)

(27.67-48.82)


No

848

117 (13.80)

(11.64-16.29)

250 (29.50)

(26.51-32.64)

157 (18.50)

(16.04-21.26)

324 (38.20)

(35.00-41.53)


Do not know

74

12 (16.20)

(9.53-26.24)

19 (25.70)

(17.10-36.66)

16 (21.60)

(13.77-32.27)

27 (36.50)

(26.44-47.87)


Discussion

Changing food habits along with the fast-paced modern lifestyle resulted in sharp rise of cavities and dental problems extensively. To combatthese problems,adoption of oral hygiene practices that are easy to use and effective such as the use of mouthwashes seem to be a practical solution especially when mechanical aids are not sufficient to maintain optimum oral health. Studies have suggested that in combination with brushing, using an antimicrobial mouthwash could be more effective than flossing when it comes to preventing gingivitis. Some clinicians suggest that this is particularly important since at any given time, more than 50% of the public has gingivitis, and many with gingivitis may not even know they have it. Antimicrobial mouthwash help eliminate plaque-causing bacteria that brushing and flossing miss [9-12].

Generally,mouthwashes are classified into preventive, cosmetic, and therapeutic. Chemotherapeutic mouthwashes usually contain active ingredients that reduce inflammation. They also function as remineralizing agents, antimicrobial, astringent, analgesic, buffering, deodorizing to neutralize odor, or oxygenating cleansing action. Cosmetic mouthwashes can be used as fresheners or to reduce staining when it is superficial in unattached biofilm [13,14].

The results of the current study indicated that, among the studied sample, mouthwash use was significantly associated with the frequency of tooth brushing and flossing. Patients who regularly brush their teeth and use a dental floss were keener to ensure sufficient oral hygiene by also using a mouthwash. Lang et al., [15] reported that the use of antimicrobial mouthwash for 30 seconds once a day as an adjunct to daily tooth brushing reduced gingivitis and caries incidence within six months. Other reports suggested that although using mouthwashes as antimicrobial agents have a good potential in controlling gingivitis, their regular use can cause significant adverse effects like teeth staining and drug resistance [16]. This highlight the importance of evaluating the risk/benefits of recommending a mouthwash by the dental practitioner and that the advice should be tailored and modified case by case.

In regard to the association of mouthwash use and the demographic factors, only social and educational status showed significant association with the frequency of the mouthwash use among the study sample. Contrary to the expectation, mouthwash use was not significantly different in relation to other important demographic criteria such as gender, age or even the smoking status. It is always predictable that oral hygiene practices are more significant in females who are potentially more attentive to appearance. It was also assumed that smokers would necessarily report more mouthwash use than nonsmokers. However, this could be related to the small sample size in the current study that is also should only hardly be considered representative to the whole community as the respondents were all recruited from only two outpatients’ clinics.

The results of the present study also indicated that more than 89% of the respondents who used mouthwash either did not know or declined the fact that mouthwash use may have any side effects. Similarly, 97% indicated that they do not believe mouthwash use can present a risk factor for development of oral cancer. In addition, almost 88% of the respondents did not know the active ingredient of a mouthwash. Whether the patient is aware of or not, clinicians need to make careful recommendation on mouthwashes based on several factors that include most importantly the efficacy and safety of the mouthwash. The selection of the right mouthwash recommendation majorly depends on the patients’ oral condition as well as the ability to perform good oral hygiene practice especially brushing and flossing. Active ingredient is another factor to consider since some precautions need to be considered. For example, xerostomia could be worsened by the drying effect of an alcohol containing mouthwash.

The results showed significant difference in the frequency of mouthwash use when patients reported existing caries and periodontal diseases which indicate that the presence of chronic oral health conditions would encourage patients to seek additional oral hygiene means such as using mouthwashes. These results were in line with those reported by other investigators [3, 17,18]. The presence of fixed restoration such as dental bridges also seemed to be a trigger to use mouthwash, most probably because those patients are traditionally advised on the importance of maintaining excellent oral hygiene and then using mouthwash could be recommended to facilitate cleaning the areas that are inaccessible to tooth brushing and flossing.

In conclusion, mouthwashes are formulated for a variety of oral benefits including mouth freshening, prevention of caries, biofilm control, and control of odor. Several factors must be considered when making a mouthwash recommendation including whether the patient is currently able to control biofilm through other methods and whether they may consider rinsing a substitute for another mechanical procedures such as brushing and flossing. It is important that target populations receive oral health advice that are tailored to meet their individual needs. These messages may need to be adapted and the influence on these target groups have to be taken into account. It is thus very important to understand the behavior, knowledge, and attitude of any community group toward the oral hygiene practices including mouthwash use. A targeted and tailored health education advice on the proper oral hygiene practice is a significant, cost-effective strategy to reduce the burden of oral disease and maintain oral health and quality of life.

Acknowledgement

The authors would like to thank the College of Dentistry Research Centre and Deanship of Scientific Research at King Saud University, Saudi Arabia, for funding this research project.

References

  1. Eley BM (1999) Periodontology: Antibacterial agents in the control of supragingival plaque. Br Dent J 186: 286-296. [crossref]
  2. Moran JM (2008) Home-use oral hygiene products: Mouthrinses. Periodontol 2000. 48:42-53. [crossref]
  3. Macfarlane TV, Kawecki MM, Cunningham C, Bovarid I, Morgan R et al. (2011) Mouthwash use in general population: Results from adult dental health survey in Grampian, Scotland. J Oral Maxillofac Res. 1: 2. [crossref]
  4. Petersen PE (2003) The World Oral Health Report 2003: Continuous improvement of oral health in the 21st century – The approach of the WHO Global Oral Health Programme. Community Dent Oral Epidemiol 1:3-23. [crossref]
  5. WHO (2012) Media Centre-Oral Health. World Health Organization. April, 2012.
  6. Haerian-Ardakani A, Rezaei M, Talebi-Ardakani M, Valian NK, Amid R et al. (2015) Comparison of antimicrobial effects of three different mouthwashes. Iranian Journal of Public Health 44: 997-1003. [crossref]
  7. CharlesCH, Mostler KM, Bartels LL, Mankodi SM (2004) Comparative antiplaque and antigingivitis effectiveness of a chlorhexidine and an essential oil mouthrinse: 6-month clinical trial. J Clin Periodontol 31: 878-884. [crossref]
  8. Berger D, Rakhamimova A, Pollack A, Loewy Z (2018) Oral biofilms: Development, control, and analysis. High Throughput 7: 24. [crossref]
  9. Loe H (2000) Oral hygiene in the prevention of caries and periodontal disease. International Dental Journal 50: 129-139. [crossref]
  10. Bauroth K, Charles CH, Mankodi SM, Simmons K, Zhao Q et al. (2003) The efficacy of an essential oil antiseptic mouthrinse vs. dental floss in controlling interproximal gingivitis: a comparative study. The Journal of the American Dental Association 134: 359-365. [crossref]
  11. Barnett ML (2006) The rationale for the daily use of an antimicrobial mouthrinse. The Journal of the American Dental Association 137: 16-21. [crossref]
  12. Van Der Weijden, F, Slot DE (2011) Oral hygiene in the prevention of periodontal diseases: the evidence. Periodontology 2000 55: 104-123. [crossref]
  13. Tuzun B, Firatli S, Tüzün Y, Firatli E, Wolf R (2001) Oral therapeutics and oral cosmetics. Clinics Dermatol 19: 449-51. [crossref]
  14. Vranic E, Lacevic A, Mehmedagic A, Uzunovic A (2004) Formulation ingredients for toothpastes and mouthwashes. BJBMS 4: 51. [crossref]
  15. Lang NP, Hotz P, Graf H, Geering AH, Saxer UP et al. (1982) Effects of supervised chlorhexidine mothrinses in children. A longitudinal clinical trial. J Periodontal Res 17:101–11. [crossref]
  16. Jothika M, Vanajassun PP, Someshwar B (2015) Effectiveness of probiotic, chlorhexidine and fluoride mouthwash against Streptococcus mutans – Randomized, single-blind, in vivo study. J Int Soc Prev Community Dent 5: 44-48. [crossref]
  17. Farah CS, Mclntosh L, McCullough MJ (2009) Mouthwashes. Aust Prescr 32: 162-164.
  18. Huskinson W, Lloyd H (2009) Oral health in hospitalized patients: assessment and hygiene. Nursing Standard 23: 43-47. [crossref]

Thoughts on COVID-19

DOI: 10.31038/JNNC.2020313

Introduction

Despite calls by leading medical authorities and organizations  to base policy on science and to trust the experts, statements made by physicians, academic epidemiologists, computer modelers, and the CDC and WHO have been inconsistent and confusing during  the coronavirus pandemic. What follows are some thoughts and impressions about the pandemic based on what I have seen in the media. I am commenting only on professionals, and my focus is on the United States.

Death Rates

Much of the time the death rates stated by individual physicians and health care organizations have been much higher than reality because they are stated as deaths per positive coronavirus test. This has resulted in estimated death rates as high as 13%. These high death rates are an artifact of the number of individuals tested. The death rates should be calculated based on the test-confirmed COVID-19 deaths in the population as a whole. If we assume that 20% of the population has contracted the coronavirus and there are 330,000,00 million people in the United States, this would mean that there are 66,000,000 people who have contracted the coronavirus. If there have been 115,000 COVID-19 deaths, this result in a death rate of 0.17% per infected person, which is almost the same as the death rate for the flu provided by the CDC. If we assume that only 5% of people  in the United States have contracted the coronavirus, then the death rate is 0.7% per infected person. This seems to be the realistic range for the death rate for coronavirus infection based on information available to date – 0.1% to 0.7%. As the number of infected individuals and deaths increases, the death rate may fluctuate a little but should remain in this range. No matter what percentage of the population has been infected to date, the death rate in the entire population so far is 115,000/330,000,000 = 0.03% or 3 in 10,000.

Computer Models

Computer models of the pandemic have been generated by leading epidemiologists at major universities. Early in the pandemic some of these models were predicting 2,000,000 COVID-19 deaths in the United States. In late April, 2020 one model predicted 200,000 deaths in the United States in June alone if lockdown was lifted. If we assume that there will be 200,000 COVID-19 deaths in the United States during the first wave in 2020, then these estimates are 10 times the actual numbers.

The Importance of Testing

Experts have stated that insufficient testing is a bad thing because we don’t know the actual number of infected individuals in the country as a whole or in different regions and cities. This is an epidemiological problem that could be solved with basic sampling procedures requiring a finite and affordable number of tests. We have random sampling of the general population all the time conducted  by a variety of organizations. This is a basic failure of medical and public health organizations. It does not instill confidence in medical authorities. Concerns about upward trends in cases post-lockdown rarely take into account the increased amount of testing, and rarely explain to the public that the increase in cases could be at least in part an artifact of increased testing.

Comparison to The Flu

For both the flu and COVID-19 there are serious and basic problems with how deaths are counted. For both, cases can be counted as virally caused deaths without any testing having been done, or if someone dies from other causes but happens to be coronavirus- positive at the time. This further increases the uncertainty about what is going on, and undermines confidence in authorities and experts.

Facemasks

In a period of a few months we went from the Surgeon General stating adamantly that facemasks need not be worn by the general public to mandatory facemasks in some states and counties, with    no intervening new science. These polar opposite recommendations were backed by federal government health agencies and medical organizations, with no intervening new science. As of June, 2020, the CDC was recommending that asymptomatic people wear masks in public and the WHO was recommending against that.

It is agreed that the coronavirus is about 0.1 micron in size. It is hard to find the pore size of regular surgical masks online but the numbers vary from 50 microns to 500 microns. It is clear that surgical masks will provide  no barrier to individual viruses. The same is true for viruses    in aerosols. The only possible protection conferred by facemasks is for viruses contained in larger droplets. Why then are medical authorities recommending or even mandating facemasks? The most common rationale is to protect the public from transmission by asymptomatic carriers who might sneeze or cough in public. However, a person with coronavirus in his or her system who is coughing or sneezing is not an asymptomatic carrier. In any case, how often do asymptomatic people cough or sneeze in public, with or without a pandemic? It is widely stated by medical authorities that facemasks do not protect an individual from others: the purpose is to protect others from infection by asymptomatic carriers. For instance, the CDC states that, “The cloth face cover is meant to protect other people in case you are infected” (https://www.cdc.gov/coronavirus/2019-ncov/prevent-getting-sick/prevention.html).

This makes no sense, and is illogical and self-contradictory. If wearing a facemask won’t protect me from you, how is it supposed to protect you from me? If persons A and B are both infectious asymptomatic carriers and both are wearing facemasks, the CDC is saying that person A (you) will not be protected but person B will be protected from you. This is a weak motivational message because it hinges on altruism rather than self-protection and it is illogical and unscientific. Mandating facemasks to reduce coronavirus transmission by asymptomatic carriers in public is unlikely to be effective and it could at most have a small effect. For example, in a recent study of coronavirus infection rates in fifteen states and D.C. for 21 days after mandating of public facemasks the infection rate declined by 0.9%- 2.0% in each five-day increment compared to the five days before the mandate [1]. The time period sampled was March 31 to May 22, 2020, during which time the curve was flattening in most of the country. If we assume that the overall infection rate in the general population was 5% then the decline was a maximum of (.05 x .02 = .001) 0.1% of the population as a whole, and only a portion of that reduction could be attributed to facemasks since many other uncontrolled variables were operating at the same time. There is no stronger evidence concerning the effectiveness of facemasks in the real world. Arguments that masks do no harm do not take into account the burden of hundreds of millions of masks per day on landfills and the environment.

Hydroxychloroquine

Hydroxychloroquine has oscillated from being a major tool against the coronavirus to being a medication that is contraindicated outside research settings within a few months. The contraindication is due to a combination of lack of efficacy and cardiac side effects and risk of death. Both poles of this oscillation have been endorsed by medical authorities and medical and public health institutions in the absence of adequate controlled trials.

Remdesivir

Like hydroxychloroquine, remdesivir has been hailed as a major tool against the coronavirus, in the absence of definitive controlled data. Preliminary data indicate that the drug reduces time in hospital from an average of 15 days to 11 days. There are no data showing an effect on mortality or on long-term morbidity. The cost of this drug has been significantly reduced to about $3000.00 for a 5-day course in the US, but it cannot be used at all in populations without access to modern hospitals and IV equipment. The point is not that remdesivir is useless or should be abandoned – the point is that it has been over- endorsed by US medical authorities and experts.

Respirators

A recent study tabulated  5700  COVID-19  patients  admitted  to hospitals in New York [2]. The paper reported that 97.2% of COVID-19 patients over 65 years of age placed on respirators in New York died. The point is not that respirators are useless, but that their importance and effectiveness have been over-endorsed by medical authorities and organizations. The most effective tools, so far, appear to have been basic public health measures like social distancing and self-quarantines. To do a truly scientific analysis of the clinical cost- benefit of respirators for COVID-19 patients, we will need follow-up data on morbidity caused by the respirators, which seems to be severe in some cases.

Sweden

Sweden has been denigrated by US medical authorities for having exposed its citizens to an increased risk of illness and death by not imposing a lockdown. What are the data? If we round off the current numbers, Sweden has a population of 10,000,000 and has had 3,000 COVID-19 deaths. This is a death rate of 0.0003. The United States has a population of 330,000,000 and has had 115,000 COVID-19 deaths. This is a death rate of 0.0003. The data actually show that lockdown has no effect on the death rate. As recently as mid-June, Sweden was denigrated for its high number of cases due to insufficient lockdown but its death rate from COVID-19 was 0.03% of the population compared to 0.01% in Germany, 0.02% in the United States and 0.05% in Italy. Sweden is the closest thing we have to a control group, imperfect as it is. Yet, US medical authorities will conclude with certainty, in the absence of any rigorous control group, that lockdown saved many lives. In social psychology this is called an attribution error.

Vaccinations and Herd Immunity

My children and I are all fully vaccinated against childhood infectious diseases. I remember the polio epidemic. The smallpox vaccine has been a major public health success. I am not an anti- vaxxer to the slightest degree. But our medical authorities are placing too much hope and emphasis on the development of a coronavirus vaccine. It is worth trying, but so  far  no  effective  vaccine  has been developed against any coronavirus and flu vaccines vary in effectiveness for a given flu season’s primary strain from 9% to 60% according to the CDC, with an average of 40% over decades. The odds that we are going to solve the COVID-19 threat through vaccines are low. One of the main arguments in favor of developing a coronavirus vaccine is to generate herd immunity. This has worked for measles, for which there is a herd immunity above 95% in the United States due to vaccines. According to the CDC, we have tens of thousands of flu deaths in the United States per year even though we have had flu vaccines for years. The flu vaccine provides immunity at a rate far below the threshold for meaningful herd immunity, which is usually said to be about 70%. The evidence to date suggests that a coronavirus vaccine will not confer useful herd immunity. The herd immunity argument in favor of a coronavirus vaccine is not logical or based on science. It is a false hope.

One of the arguments mounted in favor of a coronavirus vaccine by medical authorities and institutions has been that the virus itself may not confer immunity on everyone infected, and if it does the immunity may not last. The argument is that vaccines are required both to protect individuals and to generate herd immunity. This is illogical. If the virus does not confer adequate long-lasting immunity, why would we expect the vaccine to do so? We already know that the CDC recommendation is to get a flu vaccine annually because it does not confer long-lasting immunity. The herd immunity argument is another example of statements made by medical authorities that are not based on logic and science. All of these concerns about the effectiveness of a coronavirus vaccine are compounded by recent reports that the virus has already mutated, and the mutated variant is now the primary strain.

Discussion

The purpose of this commentary is to describe the conflicting, inaccurate and unscientific statements made by medical authorities and medical and public health organizations. These statements cannot be defended by saying that the pandemic situation is fluid
– which it is – because the statements are inconsistent with each other, with basic logic and with the available science. Authorities have been contributing to public confusion by making contradictory and unscientific statements about the coronavirus, COVID-19, epidemiology, and the risk-benefit of various actions and inactions while advocating that policy be based on science and data. This cannot help the public or policy makers, and is likely to undermine the public’s faith in science and medicine. An over-arching problem is that we still don’t know the basic epidemiology of the pandemic, which we could have learned from random testing of the general population. Numbers reported in the media and statements by the CDC and health authorities vary widely in terms of the total number of individuals infected, the number of hospitalizations per infected person, the death rates per infected person and other pieces of basic information. We still lack any controlled studies of the effectiveness of facemasks at reducing infection and death rates in the real world, even though such studies would be easy to conduct. It is very hard to know what is actually going on, given that statements by medical authorities are variable, inconsistent and not based on adequate science. When the CDC and the WHO make opposite statements about the need for asymptomatic individuals to wear facemasks in public, both cannot be right. Although the WHO statement below refers to influenza viruses and the CDC statement to COVID-19, the protective effects of facemasks are the same for both since the viruses are all far smaller than the pore size of masks and cloth coverings worn by the public.

WHO

“No recommendation can be made at this time for mask use in the community by asymptomatic persons, including those at high risk for complications, to prevent exposure to influenza viruses.”

https://www.cdc.gov/flu/professionals/infectioncontrol/maskguidance.htm

CDC

“While people who are sick or know that they have COVID-19 should isolate at home, COVID-19 can be spread by people who do not have symptoms and do not know that they are infected. That’s why it’s important for everyone to practice social distancing (staying at least 6 feet away from other people) and wear cloth face coverings in public settings. Cloth face coverings provide an extra layer to help prevent the respiratory droplets from traveling in the air and onto other people.”

References

  1. Lyu W, Wehby GL (2020) Community use of face masks and COVID-19: Evidence from a natural experiment of state mandates in the US. Health Affairs: doi. org/10.1377/hlthaff.2020.00828.
  2. Richardson S, Hirsch JS, Narasimhan M, Crawford M, McGinn T, et al. (2020) Presenting characteristics, comorbidities, and outcomes among 5700 patients hospitalized with COVID-19 in the New York City area. JAMA 323: 2052-2059. [crossref]

COVID-19 and Oncological Health Workers: Psychological Reactions and Interventions

DOI: 10.31038/CST.2020524

Review Article

Stress of Working in Oncology

Oncology is a medicine area of high psychic investment. Working with cancer patients is a source of human and professional satisfaction but can involve high emotional costs [1,2]. High levels of burnout and compassion fatigue are reported by about 32% of oncologists [3,4] this percentage rises to 70% among people under 40 years [5]. High levels are also found among nursing staff with marked levels of emotional exhaustion [6]. Repeated exposure to suffering and loss, to the side effects and/or the failure of treatments to the end of life stages, to feeling overwhelmed by work, are among the causes of chronic distress that medical staff accumulate in clinical practice. Care of cancer can result  in emotional distress and exhaustion, loss of empathy, and demotivation from work [7]. Of no less importance is the “difficult” communications that are estimated at around 20,000 in the career of an oncologist [8].

Prevalence of COVID-19 and Risk of Infection

It is well known in the history of infectious diseases that health workers are those who pay a high cost. On the one hand testifies to the tendency of healthcare personnel to take risks for patient care, on the other highlights how often they are confronted with epidemics without adequate safety systems [9]. COVID-19 has been the most catastrophic pandemic after the 1918 H1N1, known as the “Spanish flu”. The Italian data of April 23, 2020, by the Istituto Superiore di Sanità (ISS) [10], show that 11% of the symptomatic infected people are health workers, with a median age of 48 (vs 62 years, total case median age), 69% women, with a lethality rate of 0.4%. The increased exposure of health personnel is also confirmed by the data of the Italian National Institute for Accident Insurance at Work  (INAIL)  [10]. The Health and Social Care sector (hospitals, nursing and rest homes, etc.) reports 72.8% of cases. Of the 28,381 SARS-CoV-2 occupational infections reported between the end of February and April 21, 2020, 71.1% are women. The median age of 48, 45.7% are health technicians (nurses, physiotherapists), 18.9% socio-health workers, 14.2% doctors, 6.2% social workers, 4.6% unqualified staff related to health services and education. The territorial analysis shows a distribution of complaints of 52.8% in the North-West (Lombardy 35.1%), 26.0% in the North-East (Emilia Romagna 10.1%), 12.7% in the Centre (Tuscany 5.5%), 6.0% in the South (Puglia 2.6%), 2.5% in the Islands (Sardinia 1.3%). The monitoring also detects 98 reports of accidents with a fatal outcome following COVID-19 (about 40% of the total deaths at work reported to INAIL in the period under review), median age 59 years, 79.6% are men. The territorial analysis shows a distribution with 54.1% of deaths in the North-West (Lombardy 36.7%), 13.3% in the North-East (Emilia Romagna 9.2%), 10.2% in the Centre (Marche 4.1%), 20.4% in the South (Campania 9.2%) and 2.0% in the Islands (Sicily 2.0%). The category of health technicians (nurses, physiotherapists) is the most affected (15%), followed by doctors, social and health workers, and social workers (all three professional categories, 13%).

The data on the place of exposure of the contagion (sample n = 5000) in the period 1-23 April 2020, show as most at risk the Healthcare Residences (RSAs), then the Communities for Invalids and Retirement Homes (44.1%), family (24.7%), hospitals and clinics (10.8%), workplace (4.2%) [11]. The Italian data are consistent with the Chinese and North American ones which identify a category at risk of contracting COVID-19 in healthcare personnel, with percentages of 3.8% of the total cases in China and 19.0% in the USA. A higher prevalence of women, younger individuals, and a lower lethality, probably due to the higher number of swabs carried out, are the characteristics that differentiate health workers from the total sample of subjects who contracted the virus [12,13].

Challenges Posed by COVID-19 to Healthcare Workers in Oncology in the Phase of Strong Epidemic Spread

Our country and the National Health System (NHS) were not prepared for this pandemic unlike others like China and South Korea who had faced other flu epidemics such as SARS and MERS. Italy had never found itself having to implement such an impressive health response plan. In phase I, while many hospitals were transformed into intervention hospitals or HUBs for COVID-19, the staff who worked with cancer patients faced professional  and  personal  problems.  The scarcity of adequate Personal Protective Equipment (PPE), the uncertainty regarding the mode of transmission  of  the  virus  and the related protective behaviours, the consequences of the delay in recognizing some positive  patients,  the  responsibility  of  patients at risk for age and immune conditions, the first contagions among colleagues with consequent worry and workload, the fear of infecting their family members, the lack of swabs and reagents constituted the initial scenario. In an “unexplored terrain” where little was known about the virus and even less about possible therapies, the oncological health workers participated together with the others in the trauma and mourning, powerless witnesses of the surge of infections, the wave of deaths, the collapse of the Intensive care, patient transfers to other contexts.

Working in oncology they should have been used to considering death in the background, but this was “another” disease. The high rate of contagion among health professionals [14], the median 10 days from diagnosis to death, the lethality rate reported as preliminary data by the National Institute of Statistics-ISTAT [15] showed an increase in deaths equal to or greater than 20% compared to the average figure for the same period in the years 2015-2019, which made COVID-19 a different phenomenon. Health workers were personally touched by the fear of contagion, by the death of colleagues, patients, and loved ones, feeling exposed, mortal, and fragile [16,17]. “Am I part of the cure or am I part of the disease?” a doctor asks himself, stressing the conflict between a sense of responsibility for one’s job and that of one’s family [18]. The fear of “taking the virus home” is not unfounded if we think that 41% of COVID-19 cases in Wuhan resulted from hospital- related transmission [19] and that Italian data show how the exposure to the virus occurred in 24.7% of cases in the family environment. [10] A fear that can trigger primitive reactions of social stigma in an insidious way. This explains the paradox described in other epidemics whereby what are called “heroes” for the value attributed to their work [20] may be feared by some as potential “greasers” capable of bringing the virus into their condominiums or homes [21].

Due to the risk of moral  injury,  that  particular  phenomenon that occurs when you know that “you should do something but you cannot do it” with a consequent sense of guilt, betrayal, and anger [22] is likely that oncological health workers have not been as exposed as the colleagues who worked in the front line or in the triage forced  for lack of oxygen, fans or beds to give priority to some categories  of patients and not to others. However, more nuanced feelings of “moral disorientation” have emerged related to both the fact that “the questions of Medical Oncology for  the  correct  approach  in the management of COVID-19 are multiple and unresolved”, [23] and to the “transgression”  of evidence-based reference paradigms,  in the absence of consolidated scientific evidence on the effects of COVID-19 on patients and cancer therapies, and the “distraction effect “consequent to the NHS focus on the pandemic [24-26]. In any case, the oncologist had to face the daily task of “balancing the value of cancer treatment with competing risks during a time of declining resources” with ethical and logistical challenges to clinical standards and humanism [23].

Impact of COVID-19 on the Mental Health of Operators and Family Members

We do not yet have prevalence data on peritraumatic distress from COVID in cancer healthcare professionals although data on a general population sample show that a third of people experienced symptoms of mild/moderate and severe peritraumatic distress [27].

That health workers can report mental health problems, personal and professional emotional pressure during epidemics and pandemics, even to a greater extent than that found in the general population, which is a phenomenon described in the literature on SARS, MERS and H1N1 and confirmed by recent studies on COVID-19. The prevalence of psychological and psychopathological disorders can vary according to the pandemic phase, with higher peaks in the initial periods [28] when the initial impact can cause a higher distress response. A single-center study on 5062 COVID hospital workers in Wuhan highlights distress (29.8%), depression (13.5%), and anxiety disorders (24.1%). The variables associated with psychic suffering were gender, years of seniority, the presence of chronic illness, and the history of mental disorders, having positive or suspicious family members, and evaluating the Hospital Institution as a tutelary and supportive [29]. Another study of 1257 health worker (60.8%, nurses and 39.2% doctors) in hospitals in China (60.5% in Wuhan and 39.5% outside Wuhan), of which 41.5% front line operators, reported depressive symptoms (50.4%), anxiety (44.6%), insomnia (34.0%) and distress (71.5%). Being nurses, women, working on the front line, in Wuhan Hospitals was associated with higher levels in all measured mental health dimensions. Healthcare professionals directly involved in the diagnosis and treatment of COVID-19 patients have a high risk of depressive symptoms, anxiety, insomnia, and distress [30].

An Italian study carried out between 27 and 31 March 2020 on 1379 health workers from 20 Italian regions, using an avalanche sampling technique, highlights symptoms of post-traumatic stress (49.4%), symptoms of severe depression (24.7%), anxiety (19.8%), insomnia (8.3%) and high distress (21.9%). Female gender and young age are risk factors for all study outcomes; having been personally exposed to the infection is a risk factor for depression, working in the front line is positively related to symptoms of post-traumatic stress, having a dead colleague, hospitalized or in quarantine was significantly associated with high levels of insomnia, depression and perceived stress, finally being nurses or social and health workers is a risk factor for severe insomnia [31].

Since being in hospital could favor the possibility of being infected it is legitimate to hypothesize the concern of family members considering the risks involved in the work of their relatives. Little has been studied in the psychological suffering of family members of health workers in epidemics. A recent survey [32] carried out from 10 to 20 February 2020 on 822 family members of health workers who worked in 5 hospitals in Ningbo, China, showed high levels of distress with  a prevalence of anxiety disorders (33.7%) and depressive symptoms (29.4 %). Significant differences were associated with characteristics of the health care professional’s work such as availability of adequate PPE, the number of hours worked, contacts with positive or suspect patients and personal characteristics of the family member, such as the number of hours focused on COVID. Parents and children, compared to their spouses, were at greater risk of distress. These data require attention for correct allocation of resources for dedicated interventions, as required by the Guidelines for interventions on the psychological crisis for the pneumonia epidemic due to new coronavirus infection. The Chinese National Health Commission treats family members of healthcare professionals as the 3rd priority group.

What Resources and What Interventions?

A first consideration regards the timeliness with which researchers from around the world reacted to the challenges posed by an unknown virus, the cause of a pandemic that has positioned itself in a few months among the main causes of death in different countries [33]. This reaction united the scientific community and witnessed the production and sharing of a large number of articles in peer-reviewed journals and sources such as bioRxiv and medRxiv, with a speed of publication unthinkable in normal times. Over 40,000 searches have been collected under the aegis of COVID-19 Open research Dataset (CORD-19) and uploaded to a site of the Allen Institute for Artificial Intelligence to allow data scientists and artificial intelligence experts to consult them [34]. Healthcare institutions in the USA [35] have set up a register of cancer patients for faster and wider sharing of data, as well as research groups and scientific associations from the oncology area in Italy.

All this has made it possible to identify new research paths and a better understanding of the phenomena in their evolution. And above all, it offers the knowledge bases to political and health authorities to develop and implement support actions for a category widely exposed to distress such as that of health workers. Peritraumatic distress is known to be associated with an increased likelihood of developing Post Traumatic Stress Disorder (DPTS) and other psychological symptoms in the years following natural disasters. A recent study highlighted that “to have received psychological support” was a variable associated with lower distress scores [27]. A first answer, at the level of available resources, is the psychoeducational material disclosed in the form of videos or informative material, produced by national and international Organizations and Agencies (e.g. CSTS, ISS, National Comprehensive Cancer Network – NCCN), which aims to support the well-being of healthcare professionals during the coronavirus epidemic or other epidemics [36,37].

In distress prevention programs one must not forget the importance of the role of the team leader and the type of leadership, of how they will be able to guide their collaborators in moments of uncertainty towards necessary changes, support them in the needs of reassurance, recognize their feelings of anxiety and condolence and encourage them in the development of group cohesion [38]. Cohesion is a powerful factor in the dynamics of a team, described as that particular “climate” that is perceived by observing a group at work, that “team spirit” characterized by a propensity for mutual support, even hard confrontation between members but always on a constructive and loyal group membership background. The “team spirit” is not easy to build from nothing in times of crisis and strong work pressure, therefore it would be desirable that the institutions in times of stability provided for the formation of leaders capable of proactively promoting a community of colleagues based on the value of the mutual support, particularly in critical areas such as oncology [39]. Other resources concern the activation by the health structures of remote psychological interventions dedicated to operators in the oncological area such as telephone helplines. The helplines operate with the first level of intervention which consists of accepting the motivation of the call and understanding its meaning. As a rule, a psychological triage follows to collect information in a short time on the nature and severity of the problem presented, on the resources available to deal with it. In some cases, a single contact that takes on counseling characteristics or a brief intervention on the crisis may be sufficient. However, in the presence of persistent symptoms, marked family difficulties, in work or in social life, with the risk of complications and/or suicide and/or evidence of major psychopathological disorders, a structured second- level intervention is carried out with a referral to a psychotherapist or psychiatrist [40,41].

Further resources for healthcare professionals  are  represented by the defusing and debriefing interventions developed in the field  of emergency psychology, are used in psycho-oncology in highly stressful critical situations that suddenly impact on the usual routine of the work team, imply the perception of a threat on a physical and/or emotional level, upset the feeling of control and interfere with the usual coping skills of individuals. Defusing can be defined as an immediate psychological first aid technique, of “sharing and emotional reworking related to a traumatic event” [42]. The Debriefing intervention for Stress from Critical Accidents is a more structured intervention to be carried out in the 48/76 hours following a critical event, in any case no later than two months from it. If indicated, it can also be offered remotely [43].

Communication and Relationship Challenges in the Care of Cancer Patients

In phase I, with a strong epidemic spread, the members of the cancer team found themselves managing new relationship situations with patients and their families, following the abrupt reorganization of care. Clinical experience and scientific publications have proposed new topics that may constitute communication challenges: the management of patients’ feelings of anxiety, abandonment or ambivalence towards the Hospital, which is seen as a safe base but also as a reservoir of infection; the communication of positivity for COVID-19 to a metastatic patient hospitalized for cancer treatment or to a patient who has recently received a cancer diagnosis; the communication to the relatives of the transfer to the COVID-19 ward or of intensive care of their relative; being intermediaries of highly emotional communications, telephone or video calls at the patient’s bed; answering difficult questions and finally adapting to new ways of telematic assistance.

During a pandemic emergency, personal protective equipment and social distancing can modify, limit, and alter the use of non- verbal communication and require an “enhancement” of the role of verbal communication in the patient’s medical relationship to convey truthful information and reassurance on the reasons of the multiple changes in procedures, giving support in critical phases of the care path and in the absence of support from family members, answering difficult questions and, last but not least, of importance for having conversations on end-of-life issues (such as the discussion on the Advance Care Planning and Decisions about Do-Not-Resuscitate Order also in a proactive version adapted to COVID-19). The importance was stressed in addressing Advance Care Planning during COVID-19 and of prioritize discussions about goals of care at the onset of serious acute illness [44]. Not a simple task in a country like Italy where half of the patients with metastatic cancer are unaware of the prognosis [45] and where the Early Treatment Provisions (DAT) are rarely discussed in clinical practice [46].

It is known how communication skills can be perfected through Evidence-Based training and which are associated with less burnout in the care staff, with greater satisfaction with the care received and positively with other outcome measures in patients [47,48]. The psycho-oncologist can provide, in an emergency, healthcare professionals with targeted counseling on the psychological aspects of critical communication steps. Health workers with training in communication skills are facilitated and adapt the skills acquired to new communication challenges. Untrained operators  can benefit from toolkits with behavioral indication  of what   it would be better to say or do in difficult relationship situations of COVID-19 [49]. Taking care of  communication and  relationships  is not secondary for health workers because, when everything is over, the perception of having been important reference and support figures for other bewildered and frightened human beings will have a comforting and protective effect on one’s own and their mental health [50].

Abbreviations

COVID-19: Coronavirus Disease 2019

CSTS: Center for the Study of Traumatic Stress

DAT: Disposizioni Anticipate di Trattamento

INAIL: Istituto Nazionale Assicurazione Infortuni sul Lavoro

ISS: Istituto Superiore di Sanità

ISTAT: Istituto Nazionale di Statistica

NCCN: National Comprehensive Cancer Network

RSA: Residenza Sanitaria Assistenziale

SARS-CoV-2: Severe Acute Respiratory Syndrome – Coronavirus-2 or Coronavirus Disease 2019

SIPO: Società Italiana di Psico-Oncologia.

Keywords

COVID-19, Health workers, Psychological reactions, Health policy, Oncologists, Cancer, Crisis interventions

References

  1. Poppito S, Tait GR (2014) Migliorare la formazione medica sulle dimensioni esistenziali del cancro avanzato In: Biondi M, Costantini A, Wise TN (eds.) Psiconcologia. Milano: Raffaelllo Cortina 219-52.
  2. Shanafelt TD, Gradishar WJ, Kosty M, Satele D, Helen Chew, Leora Horn, et al. (2014) Burnout and career satisfaction among US oncologists. J Clin Oncol 32: 678-86. [crossref]
  3. Kleiner S, Wallace JE (2017) Oncologist burnout and compassion fatigue: investigating time pressure at work as a predictor and the mediating role of work- family conflict. BMC Health Services Research 17: 639. [crossref]
  4. Yates M, Samuel V (2019) Burnout in oncologists and associated factors: A systematic literature review and meta-analysis. Eur J Cancer Care 28: e13094 [crossref]
  5. Banerjee S, Califano R, Corral J, de Azambuja E, L De Mattos-Arruda, et al. (2017) Professional burnout in European young oncologists: results of the European Society for Medical Oncology (ESMO) Young Oncologists Committee Burnout Survey. Ann Oncol 28: 1590-1596. [crossref]
  6. Ortega-Campos E, Vargas-Román K, Velando-Soriano A, Suleiman-Martos N, Guillermo A Cañadas-de la Fuente, et al. (2020) Compassion Fatigue, Compassion Satisfaction, and Burnout in Oncology Nurses: A Systematic Review and Meta- Analysis. Sustainability 12: 72.
  7. Biondi M, Costantini A, Grassi L (2009) Manuale pratico di Psico-oncologia. Roma: Il Pensiero Scientifico Editore 273-288.
  8. Fallowfield L, Lipkin M, Hall A (1998) Teaching senior oncologist communication skills: results from phase 1 of a comprehensive longitudinal program in the United Kingdom. J Clin Oncol 16: 1961-1968. [crossref]
  9. Jones DS (2020) History in a crisis-Lessons for COVID-19. N Engl J Med 382: 1681- 1683.
  10. ISS Epicenter coronavirus extended report April 23, 2020 https://www.epicentro.iss. it/coronavirus/
  11. INAIL (2020) I primi dati sulle denunce da Covid-19. Consulenza statistico attuariale. https://www.quotidianosanita.it/allegati/allegato1115237
  12. Zunyou W, McGoonan JM (2020) Characteristic of and important lessons from the coronavirus disease 2019 (COVID-19) outbreak in China. Summary of a report of 72.314 cases from the Chinese Center for Disease Control and prevention. JAMA 323: 1239-1242. [crossref]
  13. CDCP – Characteristics of health care personnel with COVID-19 United States February 12- April 9 (2020) MMWR Morb Mortal Wkly Rep 69: 477-481. [crossref]
  14. ISS Epicenter coronavirus extended report https://www.epicentro.iss.it/coronavirus/ pdf/rapporto-covid-19-22-2020.pdf
  15. ISTAT Preliminary data National Institute of Statistics, March 01 – April 04, 2020. https://www.ilsole24ore.com/radiocor/nRC_17.04.2020_12.04_27018409
  16. Pietrantonio F, Garassino M (2020) Caring for cancer patients with cancer during the COVID-19 outbreak in Italy. JAMA Oncol 10. [crossref]
  17. Shah UA (2020) Cancer and Coronavirus Disease 2019 (COVID-19)- Facing the “C Words”. JAMA Oncology doi:10.1001/jamaoncol.2020.1848.
  18. Rose C (2020) Am I part of the cure or am I part of the disease? Keeping coronavirus out when a doctor comes. N Engl J Med 382: 1684-1685. [crossref]
  19. Wang D, Hu B, Chang H, Zhu F, Xing Liu, et al. (2020) Clinical characteristics of 138 hospitalized patients with 2019 novel coronavirus-infected pneumonia in Wuhan, China. JAMA 323: 1061-1069. [crossref]
  20. Bauchner H, Easley TJ (2020) Health care heroes of the covid-19 pandemic. JAMA. [crossref]
  21. Wester M, Giesecke J (2019) Ebola and healthcare worker stigma. Scand J Public Health 47: 99-104. [crossref]
  22. Greenberg N (2020) Managing mental health challenges faced by healthcare workers during covid-19 pandemic. BMJ 368:m1211. [crossref]
  23. Trapani A, Marra A, Curigliano G (2020) The experience on COVID-19 and cancer from an oncology hub institution in Milan Lombardy Region EJC 132: 199-206. https://doi.org/10.1016/j.ejca.2020.04.017
  24. Cortiula F, Pettke A, Bartoletti M, Puglisi F, Helleday T (2020) Managing COVID-19 in the oncology clinic and avoiding the distraction effect. Annals Oncol 31: 553-555. [crossref]
  25. Lewis MA (2020) Between Scylla and Charybdis – Oncologic Decision Making in the time of Covid19. N Engl J Med 382: 2285-2287. [crossref]
  26. Schrag D, Hersham DL, Bash E (2020) Oncology practice during the COVID-19 pandemic. JAMA 323: 2005-2006.
  27. Costantini A, Mazzotti E (2020) Italian validation of COVID-19 Peritraumatic Distress Index and preliminary data in a sample of general population. Riv Psichiatr 55: 145-151. [crossref]
  28. Lijung K, Yi L, Shaohua H, Chen M, Yang C, et al. (2020) The mental health of medical workers in Wuhan, China dealing with the 2019 novel coronavirus. Lancet Psychiatry 7: e14. [crossref]
  29. Zhu Z, Xu S, Wang H, Liu Z, Jianhong Wu, et al. COVID-19 in Wuhan: Immediate Psychological Impact on 5062 Health Workers. Medrexiv. doi: https://doi.org/10.11 01/2020.02.20.20025338
  30. Lai J, Ma S, Wang Y, Cai Z, Jianbo Hu, et al. (2020) Factors Associated with Mental Health Outcomes Among Health Care Workers Exposed to Coronavirus Disease 2019. JAMA Network Open 3: e203976. [crossref]
  31. Rossi R, Socci V, Pacitti F, Di Lorenzo G, Antinisca Di Marco, et al. (2020) Mental health outcomes among frontline and second-line health care workers during the Coronavirus Disease 2019 (COVID-19) pandemic in Italy. JAMA Network Open 3: e2010185. [crossref]
  32. Ying Y, King F, Zhu B, Yunxin Ji, Zhongze Lou, et al. (2019) Mental health status among family members of mental health care workers in Ningbo, China during the Coronavirus disease 2019 (COVID-19) outbreak: a cross-sectional study. Medrxiv.
  33. Katz J, Sanger-Katz, Quealy K (2020) Could coronavirus cause as many deaths as cancer in the US? Putting estimates in context. New York Times.
  34. COVID-19 Open Research Data set. https://www.semanticscholar.org/cord19
  35. The COVID-19 and Cancer Consortium. Accessed April 27, 2020. https://ccc19.org/
  36. Center for the Study of Traumatic Stress (CSTS). Sostenere il benessere del personale sanitario durante l’epidemia di coronavirus e di altre malattie infettive. https://www.cstsonline.org/assets/media/documents/CSTS_FS_ITL_Sustaining_Well_Being_ Healthcare_Personnel_during_Coronavirus.pdf
  37. NCCN Self-Care and Stress Management During the COVID-19 Crisis: Toolkit for Oncology Health Care Professionals. https://www.nccn.org/covid-19/pdf/Distress-Management-Clinician-COVID-19.
  38. CSTS – Grief Leadership During COVID-19 https://www.cstsonline.org/assets/ media/documents/CSTS_FS_Grief_Leadership_During_COVID19.pdf
  39. Hlubocky FJ, Back AL, Shanafelt TD (2016) Addressing Burnout in Oncology: Why Cancer Care Clinicians Are At Risk, What Individuals Can Do, and How Organizations Can Respond. Am Soc Clin Oncol Educ Book 35: 271-279. [crossref]
  40. SIPO-COVID-19 HELP LINE https://covid19.siponazionale.it.
  41. ISS. COVID-19: gestione dello stress tra gli operatori sanitari https://www.epicentro. iss.it/coronavirus/sars-cov-2-gestione-stress-operatori
  42. Meichenbaum D (1995) A clinical handbook/practical therapist manual for assessing and treating adults with post-traumatic stress disorder (PTSD). Institute Press.
  43. Roberts AR, Yeager KR (2012) Gli interventi sulla crisi. Italia: Springer-Verlag.
  44. Curtis JR, Kross EK, Stapleton RD (2020) The Importance of Addressing Advance Care Planning and Decisions About Do-Not-Resuscitate Orders During Novel Coronavirus 2019 (COVID-19). JAMA 323: 1771-1772. [crossref]
  45. Costantini A, Grassi L, Picardi A, Brunetti S, Rosangela Caruso, et al. (2015) Awareness of cancer, satisfaction with care, emotional distress, and adjustment to illness: an Italian multicenter study. Psycho-Oncology 24: 1088-1096.
  46. VIDAS (2019) Ricerca sulla percezione della popolazione italiana in merito al testamento biologico. https://www.vidas.it/biotestamento-una-ricerca-nazionale/
  47. Baile W (2015) Giving bad news. The Oncologist 20: 852-853. [crossref]
  48. Stovall MC (2015) Oncology communication skills training: bringing science to the art of delivering bad news. J Adv Pract Oncol 6: 162-166. [crossref]
  49. Back A, Tulsky JA, Arnold RM (2020) Communication Skills in the age of COVID-19. Ann Intern Med 172: 759-760. [crossref]
  50. Baile WF, Costantini A (2014) Comunicare con i pazienti oncologici e con i loro familiari. In: Biondi M, Costantini A, Wise TN (eds.). Psiconcologia. Milano: Raffaello Cortina 219-252.

Optimizing Patient Specific Medication Cassette Accuracy

DOI: 10.31038/JCRM.2020334

Abstract

Due to fluctuation in clinical status, multiple medication changes may be implemented throughout a pediatric intensive care admission.An audit revealed multiple discrepancies between the active medication administration record (MAR) and patient specific medications stored on the unit.These discrepancies could have potentially led to medication administration errors. An operational definition of ‘accuracy of compliance’ and target was established by a working group.Utilizing “Plan Do Study Act” methodology, initiatives were implemented until the target of 95% accuracy was achieved & sustained. The most common reasons for inaccuracy were expired medications, discontinued medications, and incorrect patients’ medications in the cassette.The most effective intervention was implementing medication cassette reconciliation with the MAR at shift change between primary clinical nurses.

Keywords

Patient specific medications, Cassette, Process improvement

Introduction

Sidra Medicine is a tertiary care academic hospital with a 24-bed Pediatric Cardiac Intensive Care Unit (PCICU).This critically-ill cohort is diverse in age (neonates with cardiac morbidity up to 18 years of age) and complexity, resulting in the need for multiple patient specific medications to be prepared and stored in patient specific cassettes.Due to fluctuation in clinical status, multiple medication changes may be implemented throughout an ICU admission.

An audit in August 2019 revealed multiple discrepancies between the active medication administration record (MAR) and patient specific medications.These discrepancies could have potentially led to medication administration errors.

Objectives

The primary objective of this quality improvement initiative was to improve the accuracy of patient specific medication cassettes in the PCICU from 87% to 95%.The secondary objective was to investigate if any medication errors reported in the event reporting system (Datix®) were linked to inaccurate contents in the medication cassettes.

Methods

Stakeholders from medical, nursing, allied health, and clinical operations were engaged; causes & potential solutions discussed, and an action plan was developed.An operational definition of ‘accuracy of compliance’ established as each patient to have their specific medication cassette contain the exact list of medications on the active MAR.A target of 95% was chosen based on working group consensus and alignment with other hospital medication-related metrics.Utilizing “Plan Do Study Act” (PDSA) methodology, initiatives were implemented until the target of 95% accuracy was achieved & sustained.

Initiatives included:

• September 2019: Clinical nurse leaders (CNLs) provided informal education to clinical nurses on the audit results and the importance of regularly checking the medication cassettes.

• October 2019:CNLs reminded clinical nurses at morning huddle prior to shift handover to review their medication cassettes against the MAR.

• November 2019: Implemented medication cassette reconciliation with the MAR at shift change between the outgoing and incoming primary clinical nurses.

• The event reporting system, Datix®, was retroactively reviewed monthly after initiatives were implemented to identify any medication-related errors.

Results

Process improvement initiatives implemented increased the accuracy of the patient specific medication cassettes from an average of 87% to 99% by the end of November 2019.Compliance above 95% has been sustained from November to date.When Datix® records were reviewed retroactively, none related to inaccurate medication cassette contents were reported.A run-chart with corresponding PDSA cycles is outlined in Figure 1.

JCRM-3-3-310-g001

Figure 1. Outline of run-chart with corresponding PDSA cycles.

Discussion and Conclusion

The accuracy of medications in each patient specific cassette improved from an average of 87% to 99% after three PDSA cycles.The most common reasons for inaccuracy in descending order were expired medications, discontinued medications, and incorrect patients’ medications in the cassette.Education and reinforcement of checking the cassettes at daily morning huddle had a modest impact on improving the metric.The most effective intervention was implementing medication cassette reconciliation with the MAR at shift change between primary clinical nurses.The impact of the interventions on medication errors reported in Datix® could not be assessed due to low reporting rate.

Competing Interests

The authors have no competing interests to declare.

Funding

No funding was received for this initiative or manuscript.