Abstract
Wediscusse theoverconfidence medical publications place on p value determinations. Commonly used statistical methods donot establish truth or causation.Determination of the P value is considered to bethe least helpful in assessing the uncertainty of a scientific statement. We suggest the confidence placed on p value determination as currently used in scientific literature reporting is not justified.
Keywords
H0 = Null hypothesis, H1 = Alternative hypothesis, NHST = Null hypothesis statistical testing
Introduction
About 300,000 biomedical articles are published per year in the US and Europe alone [1]. The vast majority of scientific medical communications, spoken or in print, commonly use unsupported language with certainty and statements of causation. The findings, once determined to be “statistically significant” by p value determination, are presented and treated as absolute truth.This publication argues that, for numerous reasons, these convictions are misleading.
Method
Experimental biomedical sciences normally formulate an inductive statement, gather particular observations or measurements and subsequently hypothesize an explanation of the resulting data. Deductive statements proceed from an axiom (a true rule),attempting to explain particularities derived from that rule, and thus arrive at a necessarily valid conclusion, thusmaking the premise and conclusion complete. There is no accepted set of rules that would assure correct, valid induction and therefore this type of statement cannot be certain. For that reason.The validity of inductive statements has been disputed since antiquity (for example SextusEmpiricus) and the discussion gained particular impetus in the 18th century due to publications by David Hume.What he coined as “the problem of induction” [2] is addressed in experimental sciences by statistics.This is helpful in gauging, but not dismissing, the uncertainty because statistics by itself cannot establish truth nor determine causation [3]. It is in this vein that p value, so often considered the detector of objective truth or causation, can in fact establish neither.Then, what is actually determined by the use of the p value? The most often utilized statistical paradigm in biomedical research is the falsification of null hypothesis through the utility of p value (Null hypothesis statistical testing, NHST).In fact, recent analysis of top scientific journals shows that reliance on p values increased by a factor of 14 from 1990 to 2017 [4,5].
This paradigm calls for two hypotheses: The Null hypothesis (H0) admits the property that would falsify a theory or claims that observations are the result of random effect. Its counterpart, Alternative Hypothesis (H1), admits that observations are the result of a non-random cause.Whether one or the other is admitted depends on the p value [6]. With the assumption that H0 is true, p value is an arbitrarily set probability of getting the observed or more extreme results when the experiment is repeated an infinite number of times [7]. Since the p value is based upon the assumption that the null hypothesis is true, it is not a statement of probability of H0.P value indexes incompatibility of data and H0 in a sense that it is a probability of obtaining a particular test statistics value when the Null hypothesis is true.Once that probability is shown to be below the set cutoff point, H0 is rejected and H1 is admitted [6]. Therefore p value works like a binary switch between assumed random and non-random cause. In order to illustrate the utility of p value we performed an experiment in which 20 tosses of a coin resulted in 17 tails. We may suspect that the coin was somehow altered to preferentially show tails after each toss. In order to confirm or dispel the suspicion one has to have a theoretical model of the process which in this case is the distribution of all possible outcomes of 20 tosses of a “fair coin”.Each toss can result in only two possible outcomes, heads or tails with a probability 0.5, thus constituting a discrete variable.Additionally, each toss and each series oftosses can be considered independent of the others.Taken together such outcomes form binomial distribution1 , of which the probability density function is illustrated below (Figure. 1).
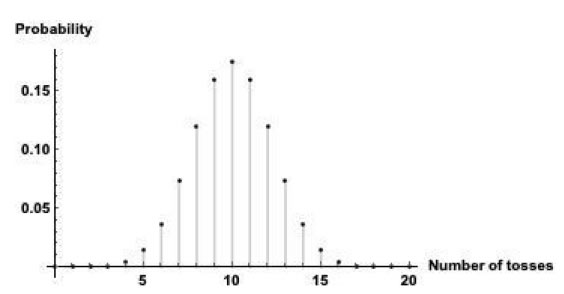
Figure 1. Probability density function of binomial distribution, in this case the possible outcomes from 20 tosses of a coin.The Y axis represents probability.The model is a mathematical representation of our understanding of reality and doesn’t constitute the reality which in this case is the concrete result of the experiment: 17 tails out of 20 tosses of a coin.
H1 hypothesis claims that the coin is altered while H0 claims the opposite.The most commonly used value for p in hypothesis testing is 0.05. According to the paradigm all outcomes with probability less than that cutoff point allow us to dismiss H0 (fair coin) and to admit H1 (altered coin), as indicated by the model.In this case, and according to the definition, p value represented by cumulative probability of obtaining 17, 18, 19, and 20 tails equals 0.0013. While the paradigm suggests at this point the conclusion that the coin is altered (i.e., confirms hypothesis H1), we in fact still have two possibilities: 1. the coin is altered, and 2. the coin is “fair”, and a rare event happened.P value doesn’t help to decide between these two alternatives.Instead, it determines the probability of data not observed in the original experiment, but rather that predicted by the model with the assumption that H0 is true.Another way of looking at it is that p value is a probability of obtaining a particular result of calculated test statistic but it doesn’t cast light on either the Null or on the Alternative hypotheses. Since the procedure only allows to reject H0 it leaves us without any indication how well the data fit H1 and does not force us to explain why we chose this particular H1 and not one of credible alternatives. The deductive logical structure modus ponens has the form: if r then s; r; therefore s.The statement: “if rain then wet pavement; rain; therefore wet pavement” is true providing that pavement is not covered by a roof. If we obscure r and observe wet pavement we can form the hypothesis regarding the cause.The mechanics of NHST will allow to reject H0 (dry pavement) but will fail to help affirming the cause of wet pavement (rain, melting snow, flood, etc.). Thus the statement: “if wet pavement then rain” is false because rain is only one of many possible causes of wet pavement.The difficult to grasp and elusive meaning of the hypothesis testing paradigm lends itself to many misconceptions regarding the meaning of p value and to multiple inferential errors and is summarized by S. Goodman [7]. In the case of our coin tossing experiment the truth about the coin may be easier to ascertain if we repeat the original experiment and, probably more importantly, if we perform different experiments [8].
The logical problem of inverted conditional
The aim of experimental investigations is to establish the probability of hypothesis in light of data. This is symbolically noted as
Pr (H|D)
Let’s assume that an observation is made that leads to a hypothesis tying hip fracture and advanced age to increased mortality.Further, let’s assume that statistical analysis determined that the patient’s age is a significant factor at p=0.04. Is there justification of inductive statement that ties together hip fracture, patient’s age and probability of death? Based on the definition of p value it is possible to state that for p<0.05 the data are not likely if H0 is assumed to be true, and conversely for p> 0.05 the data are likely if H0 is assumed to be true.In either case the probability refers to data rather than the hypothesis. Instead of
Pr(H0 | D), i.e. probability of survival in light of fall (D)
the answer offered by the hypothesis testing refers to
Pr(D|H0), i.e. probability of fall (D) in light of survival (H0)
We see that the hypothesis testing using H1 and H0 leads to an inverted conditional.It tells us in this case that among many different causes of death, fall has some probability.
The following examples illustrate that reverse conditionals are not equivalent2 .The probability of hyperkalemia in the course of ketoacidosis, Pr (hyperkalemia | ketoacidosis), is high, it happens very often. On the other hand, Pr (ketoacidosis | hyperkalemia) assess the probability of ketoacidosis when hyperkalemia is present. The probability is low because there are many other reasons for hyperkalemia. Similarly, probability of pregnancy being a woman, Pr (pregnancy | woman) is about 0.02 assuming the average woman is pregnant about 2% of her life with 2 children; but Pr(woman | pregnancy) is 1 because men don’t get pregnant.More generally:the probability of obtaining a particular test statistic value (p value) given the null hypothesis is not the same as the probability of the null hypothesis given that a particular test statistic value was obtained.An interesting logical analysis of a statement made by R. Fisher regarding p value was made by W. Briggs [9]. He cites Fisher: “Belief in null hypothesis as an accurate representation of the population sampled is confronted by a logical disjunction: Either the null is false, or the p-value has attained by chance an exceptionally low value”.Briggs re-writes that statement maintaining its logical structure: “Either the null is false and we see a small p-value, or the null is true and we see a small p-value. In other words, either the null is true or it is false and we see a small p-value.Since “Either the null is true or it is false” is a tautology, and therefore necessarily true, we are left with, “We see a small p-value”. The p-value casts no light on the truth or falsity of the null.
![]()
The problem of irreproducibilityIf the discussed above method to gauge uncertainty of a hypothesis is dubious, then the question arises: how does it contribute to the reproducibility problem? The argument has been advanced that most published results in medical research may be false [10]. It has been further estimated that in some areas of biomedical research 75-90% of reported results are wrong [11]. Obviously the reasons for such estimation are much wider than deceiving analytical methodsand include a wide variety of factors termed together as a reproducibility problem [12-14]. Important for systematic analysis of the problem, it carefully defines components of the term “reproducibility”, distinguishing methods of reproducibility, results reproducibility, and inferential reproducibility [15]. The colloquium organized by Proceedings of National Academy of Sciences in March 2017 resulted in the whole series of articles published in vol 115 (11) discussing many responsible reasons revolving around methodological, cultural and policy aspects of that subject.
Discussion
To illustrate the problems discussed here, consider the study regarding the choice of anesthesia mode for joint replacement surgery [16]. In a retrospective study the authors analyzed 382,236 records of patients who underwent hip or knee arthroplasty comparing the impact of anesthesia type on 30 day mortality.They determined that when neuroaxial anesthesia was used, mortality was significantly lower.The reported p value was <0.001 and the relative difference of mortality in neuroaxial anesthesia group was lower by 0.08%.The finding is treated as an objective truth and in ensuing discussion the authors calculate lives possibly saved if all cases were performed under neuroaxial anesthesia.Aside from criticism of the article [17], it should be pointed out that the number of potentially saved lives is exactly what is worth proving but was not proved.The authors formulated a compelling hypothesis but demonstrating truth concerning this issue would require a prospective randomized study.The objections towards the unwarranted role ascribed to p value were succinctly summarized by American Statistical Association in its statement published in 2016 [18]. The erroneous conviction that the positive results of a study represent reality, as determined by p value, combined with a host of other methodological problems leads to a growing pool of conflicting or irreproducible reports (see PNAS Colloquium [19]) and when implemented on a wider, societal, scale may have serious adverse consequences [20].
Conclusion
Overconfidence in sciences arises from unwarranted conviction of the correctness of one’s findings.There is a widespread belief that results of a study reporting really low p value are iron clad truths while results supported by p=0.06 are not true.We argued here that this is not the case, that inductive statements, though necessary for development of knowledge, carry a varying degree of uncertainty.Statistical analysis helps to quantify it, but in itself cannot have a role of a proof.The dichotomous decision point offered by p value is imprecise at best and doesn’t help to resolve the ambiguity of an inductive statement.
References
- Soteriades ES, Falagas ME (2005) Comparison of amount of biomedical research originating from European Union and the United States. BMJ331: 192-194. [Crossref]
- Henderson L (2019) The problem of induction. In: Zalta EN (eds.). The Stanford Encyclopedia of Philosophy. Stanford. Metaphysics Research Lab, Stanford University.
- Hitchcock C (2018) Probabilistic causation. In: The Stanford Encyclopedia of Philosophy. Stanford. Metaphysics Reseaarch Lab, Stanford University.
- Chavalarias D, Wallach JD, Ho Ti Ling A, Ioannidis JPA (2016) Evolution of reporting p values in the biomedical literature 1990-2015. JAMA11: 1141-1148. [Crossref]
- Cristea IA, Ioannides JPA (2018) P values in display items are ubiquitous and almost always significant: a survey of top science journals. Plos one13:e0197440. [Crossref]
- Zar JH (1984) One sample hypothesis. In: Biostatistical analysis. Edition 2. Engelwoods Cliffs, USA: Prentice-Hall, 97-120.
- Goodman S (2008) A dirty dozen: twelve p-value misconceptions. SemHemat45: 135-140. [Crossref]
- Weisstein EW (2019) Binomial distribution. MathWorld – a Wolfram Web Resource. Available at: http://mathworld.wolfram.com/BinomialDistribution.html
- Briggs WM (2017) The substitute for p value. J Am Stat Assoc112:897-898.
- Ioannidis JPA (2005) Why most published research findings are false. PLoS Med 2: e124. Available: https://journals.plos.org/plosmedicine/article?id=10.1371/journal.pmed.0020124
- Begley CG, Ioannidis JPA (2015) Reproducibility in science. Improving the standard for basic and preclinical research.Circ Res116:116-126. [Crossref]
- Ioannidis JPA (2005) Contradicted and initially stronger effects in highly cited clinical research.JAMA249:218-228. [Crossref]
- Baker M (2016) Is there a reproducibility crisis? Nature Neurosci533: 452-454.
- Stupple A, Singerman D, Celi LA (2019) The reproducibility crisis in the age of digital medicine. NPJ Digit Med 2:2. [Crossref]
- Goodman SV, Fanelli D, Ioannidis JPA (2019) What does research reproducibility mean? SciTransl Med 8: 341. [Crossref]
- Memtsoudis SG, Sun X, Chiu Y-L, OttokarStundner, Spencer S Liu, et al. (2013) Perioperative comparative effectiveness of anesthetic technique in orthopedic patients.Anesthesiology118: 1046-1058. [Crossref]
- Raw RM, Todd MM, Hindman BJ (2014) The overpowered mega-study is a new class of study needing a new way of being reviewed.Anesthesiology120: 245-246. [Crossref]
- Wasserstein RL, Lazar NA (2016) The ASA statement statistical significance and p-values.Am Stat70: 129-133.
- Allison DB, Shiffrin RM, Stodden V (2018) Reproducibility of research: issued and proposed remedies. PNAS115: 2561-2562.
- Ziliak ST, McCloskey DN (2014) The cult of statistical significance.How the standard error costs us jobs, justice, and lives.Series: Economics, cognition, and society In: Kuran T. Ann Arbor (eds.). The University of Michigan.