Author Archives: author

Incobotulinumtoxin Diluted in Zinc Gluconate Solution for Facial Wrinkles: Randomized Clinical Trial

DOI: 10.31038/JCRM.2021414

Abstract

Background: We describe the results of the application of Incobotulinumtoxin A reconstituted in a solution composed of zinc gluconate 0.02% and we evaluated whether the presence of zinc would increase or not the duration of treatment.

Methods: The sample consisted of 48 female participants, over 50 years old, with no history of chronic gastrointestinal disease or diabetes, and who had not undergone treatment with botulinum toxin less than 6 months ago. All patients answered the questionnaire with socio-demographic and health questions in which the patient’s perception of her quality of life was assessed through validated WHOQOL-Bref questionnaire before and after application.

Results: The results obtained showed that there is no relationship between race, alcoholism, smoking and use of sunscreen with the effect of the toxin in the two study groups. Concerning the variables age and amount of weekly zinc intake, the result of the Manny-Whitney test indicated that there is no significant difference between the groups, p-value>0.05. All patients were evaluated with the frontalis muscle at rest and in movement. In the group of patients who received solubilized incobotulinumtoxine A in sodium chloride, within 14 weeks of application there was a 66% reduction in the effects in patients with frontal wrinkles at rest. In the group of patients who received incobotuliniumtoxin A solubilized in zinc gluconate, within 14 weeks of application, there was a 100% reduction in effects in patients with frontal wrinkles at rest.

Conclusions: The data identified that the patients’ lifestyle habits do not influence the final result of the procedure, and that the duration of the effect is not linked to the dilution of the product with a substance different from the classic dilution with physiological saline solution.

Keywords

Zinc, Botulinum toxins type A, Facial muscles, Efficiency, Side effects, Adverse drug-related reactions, Record of clinical trial: ISRCTN27486491

Introduction

Botulinumtoxin type A is a zinc-dependent endoprotease that acts on vulnerable cells to separate the polypeptides, which are essential for the cation. When the exogenous Zinc (Zn2+) cation is added to the toxin that was removed by soluble chelators, the molecule coats the cation and recovers the activity of catalytic and neuromuscular block. Exogenous Zn2+ can restore activity of the toxin, either when the toxin is free in solution outside the cell or when internalized in cytosol [1]. Because they are zinc-dependent proteases, the question arose whether the intracellular zinc concentration could influence the action of the toxin [2].

Materials and Methods

This is a prospective, double-blind study. The sample size was composed of 48 individuals and was calculated by use of the G-Power program to verify the association between variables. For this purpose, an effect of 0.5 was used, a test power of 80% and a confidence level of 95%. The sample was composed of female participants, over 50 years of age, without a history of chronic gastrointestinal disease or diabetes, and who had not undergone treatment with botulinum toxin less than 6 months ago. Every patient answered the questionnaire with socio-demographic and health questions, in which the patient’s perception of her quality of life was assessed through the validated WHOQOL-bref11 questionnaire before and after application. The study assessed the effectiveness and duration of the effect of botulinumtoxin type A (Incobotulinium) reconstituted in a 0.02% zinc gluconate solution versus dilution in 0.9% saline. The participants were photographed in similar lighting conditions before treatment in weeks 0, 2, 4 and 14 after the procedure.

Discussion

The results obtained showed that there is no relationship between race, alcoholism, smoking and use of sunscreen with the effect of the toxin in the two study groups. Concerning the variables age and amount of weekly zinc intake, the result of the Manny-Whitney test showed that there is no significant difference between the groups, p-value> 0.05. Before checking the duration of the relaxing effect of the frontalis muscle in the application of botulinum toxin solubilized with 0.9% sodium chloride and with zinc gluconate 0.02%, the individualized views of patients and the examining physician regarding the degree of front line wrinkles [3] that each participant presented before the treatment. The result indicated that there was agreement between the patients and the doctor, that is, when the participant looked at herself in the mirror and compared it to the scale of the lines the doctor also found similar results. Another study [4] which also used the same scale of front lines to check the duration of three types of botulinum toxin type A in 180 patients (incobotulinumtoxin A, onabotulinumtoxin A, and abobotulinumtoxin A) considered only the opinion of subjects and did not compare the doctor’s point of view. The beginning of the treatment was defined as the fourteenth day (or second week) after execution of the application, since the effect of botulinum toxin, according to the literature [5] is complete in two weeks, enough time for the observer and patient to find a decrease in frontal muscle activity compared to photographs of two weeks before treatment. The calculation also included the twenty-eighth day and finally the ninety-eighth day (or 14th weeks) after application. All patients were assessed with the frontalis muscle at rest and in motion. In the group of patients who received incobotulinumtoxin A solubilized in sodium chloride, within 14 weeks of application there was a 66% reduction of effects in patients with frontal wrinkles at rest. On the other hand, the patients who were asked to move the frontal muscle (movement) there was a reduction of 75% of the desired effect within 98 days of application. Moving wrinkles seem to tend to return to the initial moment earlier compared to the resting wrinkles. The results of this study are consistent with previous6 research that demonstrated that intramuscular treatment with botulinum toxin type improves the appearance of lines at rest and overall skin quality. One possible explanation for this effect is that muscle weakness eliminates the fold the repetitive fold of the skin and relieves chronic stress applied to overlapping skin, which causes elastin and collagen to be strengthened in these places over time [6]. In the group of patients who received incobotuliniumtoxin A solubilized in gluconate zinc, after 14 weeks of application there was a 100% reduction in the effects on patients with frontal wrinkles at rest. The patients who were asked to move the frontalis muscle there was also a 75% reduction in the effect within 98 days of application, corroborating with a study [7] that compared two presentations of Botulinum Toxin Type A (onabotulinium toxin A and incobotulinium toxin A). There are many myths that involve how to handle the botulinum toxin, many doctors use it only if they are reconstituted on the day of application, however, a study [8] confirmed that Botulinum Toxin Type A is an extremely stable molecule, and vigorous stirring does not impair its potency, even after 6 weeks of dilution. The results of the present study also showed that individuals who consume more zinc-rich foods, regardless of whether they were treated with incobotulinumtoxin A diluted in chloride sodium or zinc gluconate, had no more lasting effect. This variant was not evaluated by the author who described the oral use of zinc to increase the duration of effects of botulinum toxin [2]. This study evaluated whether some factors such as alcoholism, smoking, use of sunscreen and race could influence the results, considering the frontal wrinkles at rest and movement. It is known that wrinkles are also associated with aging, hormonal status, smoking and illness complications [9] and that there is a link between perioral wrinkles and smoking and that smoking is a risk factor for premature skin aging. Studies have proposed that cigarette exposure increases matrix-1 and 3 metalloproteinase activity and decreases the production of pro-collagen in the skin, possibly due to the production of free radicals induced by tobacco [10,11]. However, this study has not demonstrated therapeutic success or shorter duration in current smoking patients who received botulinum toxin applications with both dilutions.

Conclusions

The data identified that the duration of the effect of incobotulinumtoxin A diluted with Zinc gluconate was not superior to dilution with 0.9% sodium chloride. However, the study demonstrated that in patients who drink alcohol and who used botulinum toxin diluted in zinc gluconate 0.02% there seems to be a better efficiency. Another finding was that the habit of not using sunscreen does not influence the effect of Botulinum Toxin duration. Patients with low or high phototypes have the same duration of effect as botulinum toxin.

Acknowledgments

We thank all patients who participated in this study.

Financial Disclosure

None to declare.

Conflict of Interest

All cited authors declare that they have no conflict of interest to disclose.

Informed Consent

All participants agreed to the survey and signed a free and informed consent form.

Author Contributions

Leonardo Bianquini wrote the manuscript; Denise Cantarelli approved the final version; Paula Dellacqua collected data for review; Lúcia Pimassoni did a statistical analysis.

Data Availability

The data supporting the findings of this study are available from the corresponding author upon reasonable request.

References

  1. SIMPSON LL, et al. (2001) The role of zinc binding in the biological activity of botulinum toxin. J Biol Chem 20(29): 27034-41. [crossref]
  2. KOSHY JC, et al. (2012) Effect of dietary zinc and phytase supplementation on botulinum toxin treatments. Journal of Drugs in Dermatology 11(4): 507-512. [crossref]
  3. MERZ AESTHETICS. (2016) Upper face, Disponível. Acesso em:
  4. RAPPL T, et al. (2013) Onset and duration of effect of incobotulinumtoxinA, onabotulinumtoxinA, and abobotulinumtoxinA in the treatment of glabellar frown lines: a randomized, double-blind study. Clinical, Cosmetic and Investigational Dermatology 24(6): 211-9. [crossref]
  5. CHEN JJ; DASHTIPOUR, K. Mar. (2013) Abo-, inco-, ona-, and rima-botulinum toxins in clinical therapy: a primer. Pharmacotherapy 33(3): 304-18. [crossref]
  6. CARRUTHERS, A. Sep. (2016) Repeated OnabotulinumtoxinA treatment of glabellar lines at rest over three treatment cycles. Dermatol Surg 42(9): 1094-101. [crossref]
  7. INUI K (2012) Toxic and nontoxic components of botulinum neurotoxin complex are evolved from a common ancestral zinc protein. Biochem Biophys Res Commun 419(3): 500-4. [crossref]
  8. SHOME D, et al. (2010) Botulinum toxin A: is it really that fragile a molecule? Dermatologic Surgery 36(4): 2106-2110. [crossref]
  9. MANRÍQUEZ JJ, et al. (2014) Wrinkles. BMJ Clin Evid. [crossref]
  10. CHIEN AL, et al. (2016) Perioral wrinkles are associated with female gender, aging, and smoking: development of a gender-specific photonumeric scale. Journal of the American Academy of Dermatology, 74(5): 924-930. [crossref]
  11. Development of the World Health Organization WHOQOL-BREF quality of life assessment. The WHOQOL Group. Psychol Med 1998 28(3): 551-8. [crossref]

Travelers’ Diarrhea in the Era of COVID-19

DOI: 10.31038/JCRM.2021413

Abstract

The COVID 19 pandemic started as a cluster of unexplained pneumonia in Wuhan, China and till now more than 111 million cases have been reported. Due to stringent public health measures, including lockdown strategies, the international travels were tremendously reduced. Hopes rise for end of pandemic as Corona virus vaccinations proved to have high efficacy and the true real-world effectiveness is estimated to be very good. International travels will probably start and the many safety issues should be remembered and emphasized for all travelers and any destination. The most predictable and avoidable travel related illness is infectious diarrhea that may be reduced by simple measures as are hand hygiene, food and water safety and less by antibiotic use or other pharmacologic options.

Keywords

Traveler’s diarrhea, Guidelines, Antibiotics

The COVID-19 pandemic forced tourism to shift from the global to an idyllic local pattern within country’s borders but the Coronavirus vaccination strategies applied all over the world bring the expectation for less travel restrictions.

Travelers’ diarrhea (TD) was the most predictable travel-related illness with rates (30-70%) depending on destination, season, adventurous eating or sexual practices and resulting in unpleasant holiday, hospitalization and eventually prolonged recovery mainly in immunosuppresed patients [1-3].

The etiology is dominated by bacteria (80%-90%), less by viruses and protozoa. Guidelines are published in the Yellow Book by CDC, the International Society of Travel Medicine, providing relevant data, clinical evidence and consensus statements [2,3]. Diarrhea often occurs abruptly and is accompanied by abdominal cramping, fever, nausea, or vomiting. The previous severity definitions based on the number of unformed stools per day were revised by using the relevant criteria of functional impact. This therapeutic approach depending on severity, safety and the effectiveness of treatment classifies TD in: mild (acute diarrhea that is tolerable, is not distressing, and does not interfere with planned activities), moderate (acute diarrhea that is distressing or interferes with planned activities) and severe (acute diarrhea that is incapacitating or completely prevents planned activities). Acute severe diarrhea also includes dysentery (grossly bloody stools) and persistent diarrhea (lasting>2 weeks) [3].

The main exposures, epidemiological entities and etiologies are expressed as:

  • Foodborne outbreaks associated with many food items [noroviruses, nontyphoidal Salmonella, Clostridium perfringens, Bacillus cereus, Staphylococcus aureus, Campylobacter spp, coli pathotypes (enteroaggregative, enterotoxigenic, enteroinvasive), Listeria, Shigella, Yersinia, Cyclospora cayetanensis, Cryptosporidium spp, hepatitis A virus],
  • Waterborne (drinking or swimming) – Campylobacter, Cryptosporidium, Giardia, Shigella, Salmonella, STEC, Plesiomonas shigelloides,
  • Travel to resource-challenged countries – coli (enteroaggregative, enterotoxigenic, enteroinvasive), Shigella, Typhi and nontyphoidal Salmonella, Campylobacter, Vibrio cholerae, Entamoeba histolytica, Giardia, Blastocystis, Cyclospora, Cystoisospora, Cryptosporidium) [3,4].

Any traveler should be advised about the probable exposures, food, water safety and hygiene, and informed about individual and other population consequences related to the travel (dissemination of antimicrobial resistance), the self assessment of disease severity and treatment [3,5].

High-risk destinations (TD incidence >20%) include Africa (exception of South Africa), South and Central America, South and Southeast Asia, Mexico, Haiti, and the Dominican Republic, intermediate-risk destinations (TD incidence 8 to < 20%) include Southern and Eastern Europe, Central and East Asia (including China and Russia), the Middle East (including Israel), South Africa, and Caribbean Islands and low-risk destinations (TD incidence < 8%) include North America, Northern and Western Europe, Australia, New Zealand, Singapore, and Japan [1,6]. Foodborne outbreaks may occur in well developed countries affecting local population and travelers as it happened in Spain in 2019, Listeria monocytogenes was linked to the consumption of domestically produced chilled pork roast from a single manufacturer in the municipality of Sevilla [7].

The incubation period is short for viruses and bacteria (6-72 hours) and much longer for intestinal parasites (1-3 weeks). Untreated bacterial diarrhea usually lasts 3-7 days, viral diarrhea 2-3 days and parasitic enteritis lasts a couple of weeks. Usually, the microbiologic testing is not necessary except for persistent or severe diarrhea in returning travelers (strong recommendation, low/very low level of evidence). Molecular testing may confirm frequent or rare etiologies when needed [2-4]. Klem et al. found that the most frequent long term complication is postinfectious irritable bowel syndrome, 41.9% after enteritis caused by parasites and protozoa, and 13.8% after bacterial infection [8].

There were many studies and meta-analyses upon prophylaxis and treatment options in TD with the conclusion that antibiotics are not to be considered routinely in mild and moderate acute diarrhea [2,3]. No vaccines are available for common enteric pathogens causing TD, except for cholera and typhoid fever. Live attenuated cholera vaccines are recommended to adults, as a single dose given orally with a good efficacy (90% at 10 days and 80% at 3 months). The vaccines are not recommended to immunosuppressed patients, except for asplenic patients or those having chronic kidney disease. The commonly used typhoid fever vaccine is an inactivated Vi capsular polysaccharide vaccine given intramuscularly, in children ≥ 2 years and adults with an efficacy of 50-80%, the booster dose can be given after 2 years after primary vaccination. Both vaccines are recommended only for travelers to high risk regions, unconventional itineraries and housing (Table 1) [2].

Table 1: Treatment options in TD diarrhea [2,3].

Treatment

Grade Practice Recommendation/Level of Evidence

Acute mild diarrhea 1. Oral rehydration (sealed beverages).

2. Antibiotics are not recommended.

3. Self treatment may be considered with Loperamide* or bismuth subsalicylate (BSS)**.

2, 3. Strong recommendation, moderate level of evidence
Acute moderate diarrhea 1. Oral rehydration [sealed beverages, oral rehydration solution (ORS) if dehydration is severe].

2. Loperamide may be considered for use as monotherapy or adjunctive therapy.

3. Antibiotics may be used: azithromycin, fluoroquinolones, rifaximin.

2. Strong recommendation, high level of evidence.

3. Weak recommendation, moderate level of evidence.

Acute severe diarrhea 1. Oral or parenteral rehydration.

2. Antibiotics should be used.

3. Azithromycin is preferred.

4. Fluoroquinolones or rifaximin may be used.

2. Strong recommendation, high level of evidence.

3. Strong recommendation, moderate level of evidence.

4. Weak recommendation, moderate level of evidence.

*Loperamide, 4 mg (2 mg/tb), as soon as possible then 2 mg after each lost stool, maximum 12 mg/day. Not recommended for children <12 years, in febrile or bloody diarrhea [9].
**BSS 524 mg (262 mg/tb) every 30 minutes to 1 hour as needed (maximum of 8 doses/24 hours). Not recommended for children <12 years, pregnant women, travelers taking aspirine or methotrexate [10,11].

Antibiotics in TD

  • Azithromycin may be used to treat moderate TD and should be used in severe TD as a single dose regimen (1,000 mg) or two doses of 500 mg 12 hours apart (better tolerated) or 500 mg/day for 3 days (if no resolution in 24 hours). It is the preferred regimen for invasive and febrile diarrhea and in regions where there are suspected or demonstrated fluoroquinolone resistant coli pathotypes and Campylobacter. Can be given to pregnant women and children.
  • Fluoroquinolones (orally) may be used in moderate noninvasive TD and less in severe TD (weak recommendation, moderate level of evidence). There is some evidence about the emergence of antimicrobial resistance and the risk of dysbiosis beyond the well-known musculoskeletal adverse events that makes the benefit/risk ratio doubtful. Levofloxacin may be used as a single dose of 500 mg or in a 3 day course, ciprofloxacin 750 mg as a single dose or 500 mg in a 3 day course and ofloxacin 400 mg as a single dose or in a 3 day course. The 3 day course is considered when symptoms persist > 24 hours [3,4].
  • Rifaximin may be used in non-invasive moderate and severe TD (weak recommendation, moderate level of evidence). Rifaximin is not recommended in invasive TD (Campylobacter, Salmonella, Shigella, invasive coli). Since it is a non-absorbable oral antibiotic, the safety profile is excellent. In TD rifaximin is given as 200 mg three times daily for three days [9-12].

Antibiotic regimens may be combined with loperamide because the anti-motility action is the fastest then completed by the curative antibiotic treatment and there are no more adverse effects with the combined strategy [3,9]. Doxycycline might be recommended for malaria prophylaxis and was associated with lower TD risk, suggesting bacterial enteropathogen susceptibility similar to previous observations and additional benefit in infection prevention [13].

Some studies showed higher rates of extended-spectrum β-lactamase producing Enterobacteriaceae (ESBL-E) if combined therapy (loperamide and antibiotic) was used in TD [3,14]. Arcilla et al. found that the most important predictors for the acquisition of ESBL-E during international travel were: antibiotic use during travel (adjusted odds ratio 2.69, 95% CI 1.79-4.05), persistent TD after return (2.31, 1.42-3.76), and pre-existing chronic bowel disease (2.10, 1.13-3.90) [5]. Ghandi et al. evaluated the patterns of empiric antibiotic self-treatment in international travelers from US using 31 Global TravEpiNet (GTEN) sites (Centers for Disease Control and Prevention sponsored consortium of clinics that provide pretravel health consultations). Between 2009 and 2018 the rate of antibiotic prescription declined steadily from >75%, mainly for fluoroquinolones showing that doctors and travelers are less prone to antibiotic treatment or prevention [15].

TD Prevention

Beyond hand hygiene, sanitation and food safety recommendations, antimicrobial prophylaxis is not routinely considered in international travelers (strong recommendation, low/very low level of evidence) being prescribed only for travelers at high risk of health-related complications of TD (strong recommendation, low/very low level of evidence). The most commonly recommended antibiotic is rifaximin which has an excellent safety profile [3,4,12].

BSS (two tabs 4 times a day) may be used for prophylaxis and can reduce the incidence of travelers’ diarrhea by almost half, though it should be avoided in children and pregnant women due salicylate side effects (strong recommendation, high level of evidence) [3,10,11]. Regarding probiotics and prebiotics there is insufficient evidence to recommend their use as preventive or treatment measure in TD. A recent systematic Cochrane review found that probiotics may not affect the duration of diarrhea [16].

Foodborne and waterborne infections, may be severe in immunocompromised people. Travelers with liver disease should avoid direct exposure to salt water that may expose them to Vibrio spp., and all immunocompromised hosts should avoid raw seafood. Drug interactions should be evaluated before considering antibiotic prophylaxis or self treatment. Fluoroquinolones and rifaximin have significant interactions with antiviral HIV treatment. Macrolides may have significant interactions with antiviral HIV medication and transplant-related immunosuppressive drugs. Fluoroquinolones and azithromycin in combination with calcineurin inhibitors and mTor inhibitors (tacrolimus, cyclosporine, sirolimus, everolimus) may cause prolonged QT interval [2].

With or without COVID-19 vaccine passports, probably more and more people will travel all over the world in the next years needing protection for the most frequent unpleasant event during the travel, TD. Somehow, a blessing in disguise, the COVID-19 pandemic imposed the highest hygiene rules and probably lower rates of infectious diarrhea in international travelers will be observed.

Author Contributions

Concept and writing of the manuscript (A.R.). The author approved the final version of the manuscript.

Funding

No external financial support was received.

Conflict of Interest

Nothing to declare for the author.

References

  1. Steffen R, Hill DR, DuPont HL (2015) Traveler’s diarrhea: a clinical review. JAMA 313(1):71-80. [crossref]
  2. Centers for Disease Control and Prevention. CDC Yellow Book 2020: Health Information for International Travel. New York: Oxford University Press.
  3. Riddle MS, Connor BA, Beeching NJ, DuPont HL, Hamer DH, et al. (2017) Guidelines for the prevention and treatment of travelers’ diarrhea: a graded expert panel report. J Travel Med 24(suppl_1):S57-S74. [crossref]
  4. Shane AL, Mody RK, Crump JA, et al. (2017) Infectious Diseases Society of America Clinical Practice Guidelines for the Diagnosis and Management of Infectious Diarrhea. Clin Infect Dis 65(12):1963-1973. [crossref]
  5. Arcilla MS, van Hattem JM, Haverkate MR, Bootsma MCJ, van Genderen PJJ, et al. (2017) Import and spread of extended-spectrum β-lactamase-producing Enterobacteriaceae by international travellers (COMBAT study): a prospective, multicentre cohort study. Lancet Infect Dis 17(1):78-85. [crossref]
  6. LaRocque R, Harris J.B. Travelers’ diarrhea: Microbiology, epidemiology, and prevention.
  7. European Centre for Disease Prevention and Control, European Food Safety Authority, 2019. Multi-country outbreak of Listeria monocytogenes sequence type 6 infections linked to ready-to-eat meat products – 25 November 2019.
  8. Klem F, Wadhwa A, Prokop LJ, Sundt WJ, Farrugia G, et al. (2017) Prevalence, Risk Factors, and Outcomes of Irritable Bowel Syndrome After Infectious Enteritis: A Systematic Review and Meta-analysis. Gastroenterology 152:1042–1054. [crossref]
  9. Dunn N., Chika N. Okafor. Travelers Diarrhea. [crossref]
  10. Brum JM, Gibb RD, Ramsey DL, Balan G, Yacyshyn BR (2020) Systematic Review and Meta-Analyses Assessment of the Clinical Efficacy of Bismuth Subsalicylate for Prevention and Treatment of Infectious Diarrhea. Dig Dis Sci, [crossref]
  11. Budisak P, Abbas M (2020) Bismuth Subsalicylate. StatPearls Publishing, [crossref]
  12. Robertson KD, Nagalli S (2020) Rifaximin. StatPearls Publishing, [crossref]
  13. Lago K, Telu K, Tribble D, Ganesan A, Kunz A, et al. (2020) For The Infectious Disease Clinical Research Program TravMil Study Group. Doxycycline Malaria Prophylaxis Impact on Risk of Travelers’ Diarrhea among International Travelers. Am J Trop Med Hyg 103(5):1864-1870. [crossref]
  14. Kantele A, Mero S, Kirveskari J, Lääveri T (2016) Increased Risk for ESBL-Producing Bacteria from Co-administration of Loperamide and Antimicrobial Drugs for Travelers’ Diarrhea. Emerg Infect Dis 22(1):117-120. [crossref]
  15. Gandhi AR, Rao SR, Chen LH, Nelson MD, Ryan ET, et al. (2020) Prescribing Patterns of Antibiotics for the Self-Treatment of Travelers’ Diarrhea in Global TravEpiNet, 2009–2018, Open Forum Infectious Diseases, [crossref]
  16. Collinson S, Deans A, Padua-Zamora A, Gregorio GV, Li C, et al. (2020) Probiotics for treating acute infectious diarrhoea. Cochrane Database of Systematic Reviews, Art. No.: CD003048. [crossref]

Water Intake Before Bed Decreases the Morning Platelet Activity in At-Risk Patients

DOI: 10.31038/JCCP.2021411

Abstract

Background: Platelet activity is a major risk factor for developing thrombosis and cardiovascular and cerebrovascular complications, with almost half of these occurring in the morning.

The aim of our study was to assess the effect of potable water intake on platelet activity in the morning.

Method: Using a VerifyNow system, we evaluated the laboratory parameters and morning platelet activity in a group of (n = 85) outpatients on follow-up in a clinic of internal medicine. All enrolled patients were asked to drink 400 mL of water every evening before bed, with the laboratory investigations repeated the next morning.

Results: In a subgroup of patients with a higher baseline degree of platelet activity, intake of 0.4 liters of water before bed led to a statistically significant (p=0.0002) decrease in platelet activity.

Conclusion: Our data suggest that, in patients at increased risk of cardiovascular and cerebrovascular complications, water intake before bed will decrease platelet aggregation in the morning.

Introduction

Water is an essential component of the human body. Regular water intake has a beneficial impact on the functioning of individual blood cell types [1,2]. The impact of water intake on cell function has not been conclusively determined yet. Platelet activity plays a key role in the development of cardiovascular and cerebrovascular complications potentially progressing to thrombotic events [3,4]. The mortality rates of patients with increased thromboxane levels are 3.5 times higher compared with those with lower thromboxane levels, with an association between the rates of thrombotic events, platelet activity and thromboxane levels documented by a number of studies [5-7]. Platelet activity can be determined by a variety of techniques, one of them being use of the VerifyNow system (ITC, Edison, NJ, USA) [7,8].

Aim of the Study

Our study was designed to show that determine whether or not intake of 400 mL of water before bed has an effect of platelet activity in the morning.

Method

The study was a project conducted from April to August 2018 in a Prague-based clinic of internal medicine. The study protocol was reviewed and approved by the Ethics Committee of the Second Faculty of Medicine in Prague, Charles University, Prague, Czech Republic.

Patients

Of the originally enrolled 100 volunteers, 15 were excluded from the study based on the results of their baseline assessment, making the final number of study participants 85 (51 men, 34 women. Those included had their platelet activity assessed in the morning after an overnight fast using a VerifyNow system and blood drawn for blood count, blood coagulation parameters and for blood biochemistry and first morning urine specimen assessment. The participants were asked to drink the evening before 400 mL of water before bed. The next morning, they presented for a follow-up examination with all the procedures repeated.

The study participants were outpatients ages 33 to 87 years (mean age of 61 ± 14 years) who were on follow-up in a Prague-based clinic of internal medicine. The exclusion criteria were antiplatelet or anticoagulation therapy, a malignancy, hematologic, liver or kidney disease, and/or current laboratory signs of dehydration. Also ineligible for the study were patients with a history of diarrhea and signs of dehydration or disorders of water intake or those with acute infection. Hydration status was determined by measuring specific urine gravity in the patients´ first morning sample. Patient characteristics are shown in Tables 1-6.

Table 1: Anthropometric characteristics of the study group.

Anthropometric characteristics of the study group (n=85)
Age (years)

62 ± 13

Women, n (%)

34 (40)

Body weight (kg)

84.7 ± 19

Height (cm)

174 ± 9.4

BMI (body mass index) (kg/m2)

27.9 ± 5.4

BSA (body surface area) (m2)

1.99 ± 0.24

Table 2: Hematologic parameters of the study group.

Erythrocyte sedimentation rate (mm/h)

27 ± 20

Leukocytes (× 109/L)

6.5 ± 1.9

Hemoglobin (g/L)

141.2 ± 18.2

Hematocrit (L/L)

0.43 ± 0.05

Thrombocytes (× 109/L)

234.8 ± 73.5

Mean platelet volume (fL)

11.07 ± 0.95

Table 3: Biochemical characteristics of the study group.

Creatinine (µmol/L)

74.63 ± 19.34

Urea (mmol/L)

5.5 ± 1.97

Calcium (µmol/L)

2.37 ± 0.09

Phosphorus (mmol/L)

0.96 ± 0.18

Zinc (µmol/L)

18.65 ± 3.21

Magnesium (mmol/L)

0.88 ± 0.17

Sodium (mmol/L)

139.93 ± 2.15

Potassium (mmol/L)

4.18 ± 0.44

Chlorine (mmol/L)

104.46 ± 2.94

AST (aspartate transaminase) (µkat/L)

0.44 ± 0.18

ALT (alanine transaminase) (µkat/L)

0.53 ± 0.38

GGT (gamma-glutamyl transferase) (µkat/L)

0.63 ± 0.58

Albumin (g/L)

41.43 ± 3.105

Total protein (g/L)

70.36 ± 4.23

Specific urine gravity (kg/m3)

1017.2 ± 7.1

Table 4: Values of biological markers as potential risk factors of atherosclerosis.

CRP (mg/L)

3.1 ± 3.8

Glucose (mmol/L)

5.7 ± 1.6

Cholesterol (mmol/L)

4.9 ± 1.2

TG (mmol/L)

1.4 ± 1.0

HDL-cholesterol (mmol/L)

1.3 ± 0.3

LDL-cholesterol (mmol/L)

3.1 ± 0.9

CRP – C-reactive protein; TG – triglycerides; HDL – high-density lipoprotein; LDL – low-density lipoprotein.

Table 5: Characteristics of the study group in terms of comorbidities.

Comorbidities

Incidence, n=85 (100%)

Hypertension

65 (76.5%)

Diabetes mellitus

10 (11.8%)

Dyslipidemia

46 (54.1%)

Vitamin D deficiency

13 (15.3%)

History of peptic ulcer disease

7 (8.2%)

Table 6: Comparison of individual quartiles.

Quartile number

Q1

Q2+Q3

Q4

Number of patients

21

43

21

VerifyNow assay (units)

417.8 ± 42.4

563.4 ± 41.4

642 ± 14.0

Mean platelet volume (fL)

10.9 ± 1.0

11.1 ± 11.2

11.0

BMI (kg/m2)

29.8 ± 5.9

27.5 ± 5.5

26.4 ± 3.9

Platelets (× 109/L)

224.7±75.1

228.4 ± 70.3

260.7 ± 64.4

Fibrinogen

2.9 ± 0.7

3.0 ± 0.5

3.0 ± 0.7

Urea (mmol/L)

5.8 ± 1.8

5.5 ± 1.7

5.3 ± 2.7

Glucose (mmol/L)

5.7 ± 1.2

5.7 ± 1.5

5.6 ± 2.2

Water intake (L)/body weight (kg)

0.007 ± 0.002

0.008 ± 0.005

0.01 ± 0.006

ΔTBX (units)

-59.6 ± 96.2

-11.8 ± 85.1

46.7 ± 63.5

ΔTBX (%)

-15.3 ± 26.1

-2.4 ± 15.5

7.3 ± 10.0

ΔTBX – difference in VerifyNow results before and after measurement.

VerifyNow System

Platelet activity was assessed using the VerifyNow system (ITC, Edison, NJ, USA). The results of the test indicate the amount of thromboxane B2-(TBX) mediated activation of GP IIb/IIIa receptors involved in platelet aggregation. It is a turbidometric-based optical detection system utilizing a single-use cartridge with microbeads and fibrinogen-coated thrombocyte agonists to measure platelet-induced aggregation. The assay determines the capacity of activated platelets to bind to fibrinogen expressed as the ratio of platelets aggregated on fibrinogen-coated microbeads to the number of activated GPIIb/IIIa receptors. The intensity of the detected optical signal is proportionate to thromboxane (platelet) activity. The manufacturer´s specification for the coefficient of variation is ≤ 10%. Generally, it is a readily available assay with a closed system [9]. The assay, performed within 5 minutes of blood sampling, is employed in cardiac surgery to predict the risk of postoperative bleeding [7].

Statistical Analysis

The results are presented as means ± standard deviation with quantitative data and as percentage with qualitative data. For statistical analysis of data, the two-sample T-test, Mann-Whitney non-parametric test, analysis of variance (ANOVA) and the χ2 test in frequency tables were used. With values that do not have Gaussian distribution, logarithmic transformation was used.

Results

Division of the enrolled volunteers by their baseline values assigned 21 patients to the first quartile (Q1) with VerifyNow assay units below 471, 43 patients to the intermediate quartiles (Q2+Q3) with 472–619 units, and 21 patients to the fourth quartile (Q4) with 620 units and over.

No statistically significant differences between the quartiles were noted in leukocyte count, erythrocyte sedimentation rate, mean platelet volume (MPV), fibrinogen levels, urea, glycemia, and water intake.

Compared with the Q4 group, patients in Q1 had a significantly higher BMI (p=0.03).

Compared with the Q4 group, Q1 patients had a significantly lower platelet count (p=0.03) and their water intake to kg body weight was significantly lower (p=0.047). Platelet activity in the morning after drinking 400 mL of water the night before was significantly lower in Q4 patients compared with the Q1 group. The difference between platelet activity values (ΔTBX) was significantly greater in Q4 patients compared with the Q1 group both in absolute figures (p=0.0002) and percentage (p=0.001). This finding suggests that, in patients with high baseline platelet activity, drinking of 400 mL of water before bed does affect platelet activity.

Discussion

As the main component of the human body, water plays a critical role in almost all life processes. Potable water is absorbed from the gastrointestinal tract within 5 minutes of intake and becomes detectable in blood cells. Assuming an average consumption of 2 liters of water per day and the biological half-life of water in a healthy individual of 10 days, 99% of water in the body gets completely exchanged within some 50 days [10]. The scientific literature addressing the effects of alcoholic drinks, of tea and coffee as the most popular beverages, and of sugar-sweetened beverages on individual organ systems drinks is more abundant compared with that examining the effect of water intake [11-18].

Potable water is generally considered the best liquid for body hydration and maintenance of water homeostasis in a healthy population [19-21]. Regular consumption of sufficient amounts of drinking water has been conclusively shown to play a major role in the prevention of malignancies [urinary bladder cancer, colorectal cancer), urinary tract infection, nephrolithiasis, obesity, constipation, migraine, bronchial asthma, skin disorders and depression [22-27]. Earlier studies showed that intake of 300 ml of potable water after a 12-hour fast had a significant impact on the biochemical parameters of blood, i.e., total protein, urea, bilirubin, total cholesterol, triglycerides, uric acid, aspartate transaminase (AST), gamma-glutamyl transferase (GGT) and lactate dehydrogenase [28].

A prospective study enrolling 20,000 patient with coronary heart disease investigated the importance of regular daily consumption of more than 1 liters of water. The male arm of the study showed an almost 54% reduction in cardiovascular mortality without a significant effect in the female arm with only a 13% decrease in cardiovascular mortality [29]. Water intake has multiple effects on the body and affects the proper functioning of cellular elements, coagulation factors, hydration, viscosity and other hemodynamic parameters as well as the incidence of cardiovascular complications [1,2,30].

Regular water intake exerts a beneficial effect of hormonal activity while reducing the levels of hs-CRP as a marker of inflammation and a risk factor for cardiovascular disease [1,31]. Likewise, regular consumption of 2 liters of water has an effect on the erythrocytes, the cell components of blood, significantly raising mean hemoglobin concentrations (MCH), mean corpuscular hemoglobin concentration (MCHC) while significantly decreasing mean platelet volume and, indirectly, also blood coagulation and hemodynamic parameters [1]. Adequate hydration is crucial for hemoglobin synthesis, transformation of deoxygenated hemoglobin to its oxidized form and its allosteric conformation [2,30].

Thrombocytes play a key role in platelet aggregation and pathophysiology of thrombotic complications. Platelet size (mean platelet volume, MPV) is an independent risk factor for cardiovascular disease [28,32-35]. Patients with a higher MPV who had had a myocardial infarction or myocardial revascularization have a poorer prognosis or are at increased risk of stent restenosis. The mechanism and causal relationship between MPV and increased incidence of thrombotic complications experienced by coronary heart disease patients have not been clearly established to date [32]. Likewise, we have been unable to demonstrate a correlation with MPV and platelet activity. Results of meta-analyses document a higher incidence of cardiovascular events in the period around morning awakening. The risk is 40% higher for myocardial infarction, 29% for sudden cardiac death, and 49% for stroke [36]. The morning incidence of cardiovascular and cerebrovascular events is affected by several factors including sympathetic system activity, increased blood pressure and heart rate, cardiac output, peripheral resistance and platelet aggregation [37].

A correlation between high thromboxane levels and incidence of cardiovascular and cerebrovascular events has been reported by several studies [5-7]. Our data have demonstrated the impact of consumption of 400 mL of water before bed on the morning platelet activity in a subgroup of patients with enhanced platelet activity and, hence, increased thromboxane levels. The implication is that intake of 400 mL of water before bed in at-risk patients will significantly reduce platelet activity as a major risk factor for thrombotic complications. Similar results were reported by Maehashi suggesting that water intake before bed will attenuate morning platelet activity [38].

Study Limitations

A major limitation of our study is the relatively small number of participants. Further studies are definitely warranted to obtain conclusive evidence of the clinical importance of regular water intake on the incidence of cardiovascular and cerebrovascular events and/or patient prognosis.

Conclusion

Intake of water and its impact on the individual functions of the components of blood and organ system, hemostasis and blood coagulation parameters is a most intricate and intertwined process. Physiological functions associated with water metabolism are capable of making up for single changes in relatively small amounts of fluids without critically affecting their function. Regarding the incidence of cardiovascular and cerebrovascular events in at-risk patients, intake of 400 mL of water before bed significantly reduces platelet activity. Our data suggest that regular consumption of water by at-risk patients may help reduce the risk of cardiovascular and cerebrovascular events in the morning hours. However, this hypothesis needs to be supported and/or confirmed by further studies.

Referenes

  1. HK Kim, SH Kim, JK Ryu (2017) Changes in the Blood Components Caused by Water Intake. Korean J Clin Lab Sci 49: 227-232.
  2. Colombo MF, Rau DC, Parsegian VA (1992) Protein solvation in allosteric regulation: a water effect on hemoglobin. Science 256: 655-659. [crossref]
  3. Roth GA, Huffman MD, Moran AE, Feigin V, Mensah GA, et al. (2015) Global and regional patterns in cardiovascular mortality from 1990 to 2013. Circulation 132:1667- 1678. [crossref]
  4. Oksak GA, Golovanova IA (2017) Contribution of mortality from cardiovascular disease to overall mortality. Wiad Lek 70: 449-455. [crossref]
  5. Eikelboom JW, Hirsh J, Weitz JI, Johnston M, Yi Q, et al. (2002) Aspirin-resistant thromboxane biosynthesis and the risk of myocardial infarction, stroke, or cardiovascular death in patients at high risk for cardiovascular events. Circulation 105: 1650-1655. [crossref]
  6. Patrono C, Ciabattoni G, Pugliese F, Pierucci A, Blair IA, et al. (1986) Estimated rate of thromboxane secretion into the circulation of normal humans. J Clin Invest 83: 590-594. [crossref]
  7. Renda G, De Caterina R (2012) Measurements of thromboxane production and their clinical significance in coronary heart disease. Thromb Haemost 108: 6-8. [crossref]
  8. Paniccia R, Priora R, Liotta AA, Abbate R (2015) Platelet function tests: a comparative review. Vasc Health Risk Manag 11: 133-148. [crossref]
  9. Smith JW, Steinhubl SR, Lincoff AM, J C Coleman, T T Lee, et al. (1999) Rapid platelet-function assay: an automated and quantitative cartridge-based method. Circulation 99: 620-625. [crossref]
  10. Peronnet F, Mignault D, du SP, Vergne S, Le BL, et al. (2012) Pharmacokinetic analysis of absorption, distribution and disappearance of ingested water labeled with D(2)O in humans. Eur J Appl Physiol 112: 2213-2222. [crossref]
  11. Imamura F, O’Connor L, Ye Z, Mursu J, Hayashino Y, et al. (2016) Consumption of sugar sweetened beverages, artificially sweetened beverages, and fruit juice and incidence of type 2 diabetes: systematic review, meta-analysis, and estimation of population attributable fraction. Br J Sports Med 50: 496-504. [crossref]
  12. Jayalath VH, de Souza RJ, Ha V, Mirrahimi A, Blanco-Mejia S, et al. (2015) Sugar-sweetened beverage consumption and incident hypertension: a systematic review and meta-analysis of prospective cohorts. Am J Clin Nutr 102: 914-921. [crossref]
  13. Tang J, Zheng JS, Fang L, Jin Y, Cai W, et al. (2015) Tea consumption and mortality of all cancers, CVD and all causes: a meta-analysis of eighteen prospective cohort studies. Br J Nutr 114: 673-683. [crossref]
  14. Crippa A, Discacciati A, Larsson SC, Wolk A, Orsini N (2014) Coffee consumption and mortality from all causes, cardiovascular disease, and cancer: a dose-response meta-analysis. Am J Epidemiol 180: 763-775. [crossref]
  15. Zhang X, Albanes D, Beeson WL, van den Brandt PA, Buring JE, et al. (2010) Risk of colon cancer and coffee, tea, and sugar-sweetened soft drink intake: pooled analysis of prospective cohort studies. J Natl Cancer Inst 102: 771-783. [crossref]
  16. Huxley R, Lee CM, Barzi F, Timmermeister L, Czernichow S, et al. (2009) Coffee, decaffeinated coffee, and tea consumption in relation to incident type 2 diabetes mellitus: a systematic review with meta-analysis. Arch Intern Med 169: 2053-2063. [crossref]
  17. Wu JN, Ho SC, Zhou C, Ling WH, Chen WQ, et al. (2009) Coffee consumption and risk of coronary heart diseases: a meta-analysis of 21 prospective cohort studies. Int J Cardiol 137: 216-225. [crossref]
  18. Ashima KK, Graubard B (2017) A prospective study of water intake and subsequent risk of all-cause mortality in a national cohort. Am J Clin Nutr 105: 212-220. [crossref]
  19. Food and Nutrition Board (2004) Panel on Dietary Reference Intakes for Electrolytes and Water. Dietary Reference Intakes for water, potassium, sodium, chloride, and sulfate. Washington (DC): National Academy Press.
  20. EFSA Panel on Dietetic Products, Nutrition, and Allergies (NDA) (2010) Scientific opinion on Dietary Reference Values for water. EFSA J 8: 1459.
  21. Valtin H (2002) “Drink at least eight glasses of water a day.” Really? Is there scientific evidence for “8 x 8”? Am J Physiol Regul Integr Comp Physiol 283: R993-1004. [crossref]
  22. Lappalainen R, Mennen L, van Weert L, and Mykkanen H (1993) Drinking water with a meal: a simple method of coping with feelings of hunger, satiety and desire to eat. Eur J Clin Nutr 47: 815-819. [crossref]
  23. Rolls BJ, Bell EA, and Thorwart ML (1999) Water incorporated into a food but not served with a food decreases energy intake in lean women. Am J Clin Nutr 70: 448-455. [crossref]
  24. Rolls BJ, Castellanos VH, Halford JC, Kilara A, Panyam D, et al. (1998) Volume of food consumed affects satiety in men. Am J Clin Nutr 67: 1170-1177. [crossref]
  25. Stookey JD (2001) Energy density, energy intake and weight status in a large free-living sample of Chinese adults: exploring the underlying roles of fat, protein, carbohydrate, fiber and water intakes. Eur J Clin Nutr 55: 349-359. [crossref]
  26. Anti M, Pignataro G, Armuzzi A, Valenti A, Iascone E, et al. (1998) Water supplementation enhances the effect of high-fiber diet on stool frequency and laxative consumption in adult patients with functional constipation. Hepatogastroenterology 45: 727-732. [crossref]
  27. McCord H (2001) Are you drinking too much water? Prevention 53: 62-63.
  28. Benozzi SF, Unger G, Campion A, Pennacchiotti LG (2018) Fasting conditions: Influence of water intake on clinical chemistry analytes. Biochem Med (Zagreb) 28: 010702. [crossref]
  29. Chan J, Knutsen SF, Blix GG, Lee JW, and Fraser GE (2002) Water, other fluids, and fatal coronary heart disease. The Adventist Health Study. Am J Epidemiol 155: 827-833. [crossref]
  30. Bulone D, San Biagio PL, Palma-Vittorelli MB, Palma MU (1993) The role of water in hemoglobin function and stability. Science 259: 1335-1336. [crossref]
  31. Soriano-Guillén L, Hernández-García B, Pita J, Domínguez-Garrido N, Del Río-Camacho G, et al. (2008) High-sensitivity C-reactive protein is a good marker of cardiovascular risk in obese children and adolescents. Eur J Endocrinol 159: R1-4. [crossref]
  32. Chu SG, Becker RC, Berger PB, Bhatt DL, Eikelboom JW, et al. (2010) Mean platelet volume as a predictor of cardiovascular risk: a systematic review and meta-analysis. J Thromb Haemost 8: 148-56. [crossref]
  33. Burr ML, Holliday RM, Fehily AM, Whitehead P (1992) Haematological prognostic indices after myocardial infarction: evidence from the diet and reinfarction trial (DART) Eur Heart J 13:166-170. [crossref]
  34. Martin JF, Bath PM, Burr ML (1991) Influence of platelet size on outcome after myocardial infarction. Lancet 338: 1409-1411. [crossref]
  35. Cattela F, Healy D, Lawson JA, Fitzgerald GA (1986) 11-Dehydrothromboxane B2 a quantitative index of thromboxane A2 formation in the human circulation. PNAS 83: 5861-5865.
  36. Elliot WJ (2001) Cyclic and circadian variations in cardiovascular events. Am J Hypertens 14: 291S-295S. [crossref]
  37. Weber AM, Fodera MS (2004) Circadian Variations in Cardiovascular Disease: Chronotherapeutic Approaches to the Management of Hypertension. Rev Cardiovasc Med 5: 148-155. [crossref]
  38. Maehashi N, Sano H, Iwata S, Rin K, Ito Y (1996) Effect of a Water Intake on the Morning Surge of Platelet Activity. 276A ABSTRACTS-Poster JACC February 1996.

Clinical and Microbiological Outcomes of Er:YAG Laser Used as an Adjunct in Non-Surgical Periodontal Therapy: A Randomized Clinical Trial

DOI: 10.31038/JCRM.2021412

Abstract

Introduction: Er:YAG laser has the potential to reach areas of the periodontal pocket that are not accessible with traditional scaling and root planing (SRP). However the clinical and microbiological additional benefits of Er:YAG lasers as an adjunct to conventional SRP are not well documented.

Objective: Evaluate the efficacy of Er:YAG laser as an adjunct in non-surgical periodontal therapy (NSPT).

Materials and methods: A prospective randomized, controlled, split mouth single blinded clinical trial was performed on eleven participants diagnosed with moderate to severe periodontitis with probing depths (PD) ≥ 5 mm. One quadrant received SRP with ultrasonic and hand instrumentation only, while in the other quadrant Er:YAG was used in addition to SRP. Clinical data were collected at baseline, 6 weeks and 3 months following SRP+/-Er:YAG. Microbial samples were collected, analyzed numerically, and cultured for a panel of periodontal pathogens at baseline and 3 months.

Results: In sites with 5 mm probing depths or more, the SRP group had an initial mean PD of 5.9 ± 1.1 mm which decreased to 4.5 ± 1.7 mm at 6 weeks and remained the same at 3 months. The SRP+Er:YAG group had an initial mean PD of 6.0 ± 1.4 mm that decreased to 4.6 ± 2.0 mm and to 4.6 ± 1.8 mm at 6 weeks and 3 months respectively. The SRP group had an initial mean BOP of 92.7% which decreased to mean of 64.6% and 61.5% at the 6 weeks and 3 months respectively. The SRP+Er:YAG group had an initial mean BOP of 80.9%. BOP decreased to 58.4% and 43.8% at 6 weeks and 3 months respectively. There were no statistically significant differences between the SRP and SRP+Er:YAG group in clinical parameters and bacterial counts. There was an overall decrease in the percentage of the subgingival cultivable microflora at 3 months in both groups. There were no statistically significant differences between the SRP and SRP+Er:YAG group with respect to clinical changes, bacterial counts, and cultivability profiles.

Conclusion: Within the study limitations, the use of Er:YAG laser when used as an adjunct to SRP conferred no additional clinical and microbial benefits.

Introduction

Er:YAG (erbium-doped yttrium aluminum garnet) laser is one of the most frequently used lasers in non-surgical and surgical periodontal therapy. Er:YAG lasers emit infrared light at 2940 nm which is highly absorbed by water molecules, resulting in instant vaporization. Er:YAG laser light is well absorbed by all biological tissues with high water content and it can be used for soft tissue ablation and bacterial killing [1]. Er:YAG laser light is also absorbed by hydroxyapatite, thus making it suitable for ablation and calculus removal [2]. These properties are advantageous in periodontal therapy where removal of plaque and calculus is traditionally done by scaling and root planing (SRP).

Er:YAG is a suitable choice for effective calculus removal. Its wavelength and the use of water spray surface coolant effectively remove smear layers, calculus, and necrotic cementum from root surfaces without inducing tissue damage. The use of Er:YAG laser has demonstrated better wound healing, decreased swelling and scarring, less pain and better patient tolerance compared to conventional non- surgical and surgical methods [3].

Several other studies have shown improved periodontal clinical parameters after laser therapy. Schwarz et al. showed that laser therapy resulted in significant reduction in bleeding on probing and gains in clinical attachment levels compared to scaling and root planning alone. The clinical attachment gain in the laser group was maintained for more than 2 years [4]. Ando et al. concluded from an in vitro study that the Er:YAG laser has bactericidal effect at low energy levels [5] and Ishikawa et al. reported that Er:YAG laser may provide an antimicrobial advantage compared to conventional mechanical periodontal therapy [1]. The laser degrades and removes bacterial endotoxins without producing a smear layer [1]. However, a recent review of the literature was inconclusive regarding the clinical effects and microbiological outcomes of Er:YAG lasers when used as an adjunct to conventional scaling and root planing [3].

While scaling and root planing results in significant reduction of tissue inflammation [6], several studies have demonstrated that there is a limitation in the efficacy of curettes during scaling and root planing in periodontal pockets that are 5 mm or more [7,8]. Thus, there is clearly a need for developing effective methods of plaque and calculus removal in deep pockets and hard-to access locations. In addition, the evaluation of Er-YAG laser as an adjunct to SRP is needed, as the two treatments are not mutually exclusive.

The purpose of this study was to evaluate the efficacy of Er:YAG laser as an adjunct to scaling and root planing in non-surgical periodontal therapy on probing depth, clinical attachment levels, gingival bleeding and microbial colonization patterns.

Materials and Methods

Enrollment of Participants

This prospective randomized, controlled, split mouth single blinded clinical trial was conducted at Tufts University School of Dental Medicine (TUSDM). The protocol was approved by the Tufts University Medical Center Institutional Review Board (IRB #12321). Participants were patients enrolled for treatment in the Post-graduate Periodontology Clinic at TUSDM.

Potential participants were informed about the study and provided with ample time to ask any questions on study participation. Patients who decided to participate then provided informed. A copy of the informed consent form (ICF) was given to the participant. Demographic information was collected and a medical history was obtained.

Inclusion Criteria

To qualify for the study, each subject had to have all single rooted permanent maxillary and mandibular teeth from the central incisors to the second premolars, a recent diagnosis of moderate to severe chronic periodontitis [8] and a full mouth and vertical bite-wing series of diagnostic radiographs exposed at TUSDM within 6 months preceding entry of the study.

Exclusion Criteria

Participants who did not speak or write English were excluded from the study. Participants who had received mechanical debridement or any other professional periodontal therapy within 6 months prior to entering the study, who presented with significant chronic oral soft tissue pathologies, who presented with fixed or removable appliances partial dentures, who were current smokers, who ordinarily required prophylactic antibiotics prior to dental procedures, or who had taken systemic antibiotic medications within the previous 6 were excluded from the study.

Participants with uncontrolled chronic systemic conditions or diseases such as diabetes mellitus (HbA1C>7%), with immunological disorders, with known drug allergies or known adverse effects following the use of oral hygiene products, and who might be pregnant or lactating were excluded from the study.

Also, teeth with Miller grade III mobility or teeth with hopeless prognosis [9] indicated for extraction were excluded from the study.

Clinical Measurements

Using radiographs and the results of a complete periodontal examination, the diagnosis of generalized moderate to severe chronic periodontitis was confirmed, The examiner (I.K.) was previously calibrated to >90% accuracy in repeat probing depth measurements using the UNC probe [10]. Clinical measurements were taken at baseline and at 6 weeks and 3 months post treatment. The examiner was blind to all treatment assignments.

Two quadrants in each subject with single rooted teeth that demonstrated periodontal probings ≥ 5 mm were selected for the trial. A computer-generated randomization list was used to determine which quadrant would receive scaling and root planing only and which quadrant would receive SRP supplemented with the Er:YAG laser therapy.

Microbial Sampling and Transport

Before treatment, baseline microbial samples were obtained on single rooted, non-furcated teeth with 5-9 mm probing depths and bleeding on probing. The deepest two sites in each quadrant were chosen for microbial sampling giving a total of 4 microbial samples per participant. These same sites would be sampled again for microbial analysis post- treatment at the scheduled 3 month follow-up visit.

After air drying and isolation with cotton rolls and careful removal of supra-gingival plaque, one sterile, absorbent paper point, (Johnson & Johnson, East Windsor, NJ), was advanced into each of the selected periodontal sites for 10 seconds [11]. After removal, the two paper points per quadrant were pooled together in a glass vial of 2.0 mL anaerobically prepared viability medium Gothenburg anaerobic (VMGA) III transport medium [10]. Subgingival samples were then transported within 24 hours for microbial analysis to the Oral Microbiology Testing Service (OMTS) Laboratory located at the Temple University Kornberg School of dentistry. All laboratory microbiologic procedures were performed by OMTS personnel who were unaware of the participants’ overall health status, clinical diagnosis, and site specific conditions or that participants were part of a clinical trial [10].

Putative periodontal pathogens examined for in this study include Aggregatibacter actinomycetemcomitans, Porphyromonas gingivalis, Tannerella forsythia, Prevotella intermedia/nigrescens, Parvimonas micra, Fusobacterium nucleatum, Campylobacter rectus, Streptococcus constellatus, Streptococcus intermedius, Staphylococcus aureus, Enterococcus faecalis, Gram-negative enteric rods/pseudomonads, and Candida species [10]. The specimen vials were heated to 35°C [10,12]. The plaque samples were dispersed from the paper points using a vortex mixer for 45 seconds in Möller’s viability medium Gothenburg I anaerobic dispersion solution comprised of pre-reduced, anaerobically sterilized 0.25% tryptose, 0.25% thiotone E peptone, and 0.5% sodium chloride. The same medium was used to create a 10-fold dilutions of the bacterial suspensions [10]. Then, 0.1 mL dilution aliquots were spread with a sterile bent-glass rod onto non- selective enriched Brucella blood agar (EBBA) primary isolation plates [10]. EBBA was comprised of 4.3% Brucella agar supplemented with 0.3% bacto-agar, 5% defibrinated sheep blood, 0.2% hemolyzed sheep red blood cells, 0.0005% hemin, and 0.00005% menadione. EBBA plates were incubated at 35°C for 7 days in an anaerobic chamber containing 85% N2, 10% H2, and 5% CO2, EBBA plates were used to determine the composition of predominant cultivable microbial species using established OMTS methods [10,11].

Total anaerobic viable counts were made on non-selective EBBA primary isolation plates. Porphyromonas gingivalis, Tannerella forsythia, Prevotella intermedia/nigrescens, Parvimonas micra, Fusobacterium nucleatum, Campylobacter rectus, Streptococcus constellatus, Streptococcus intermedius, Staphylococcus aureus, Enterococcus faecalis were distinguished on EBBA using established microbial identification OMTS protocols [10]. Aggregatibacter actinomycetemcomitans, Gram-negative enteric rods, pseudomonads, and Candida species were quantitated on selective trypticase soy-bacitracin-vancomycin (TSBV) agar plates that were incubated at 35°C for 3 days in air plus 5% CO2 [10]. The proportional recovery of each test species was ascertained for each individual by calculating the percentage of positive test species colony forming units relative to total subgingival anaerobic viable counts as determined on non- selective EBBA primary isolation plates [10].

Treatment

Scaling and root planing was performed with an ultrasonic scaler (Varios 360 LUX Model: NE149) and hand scalers and Gracey curettes under local anesthesia using 2% lidocaine + 1:100 000 epinephrine.

Er:YAG laser treatment was delivered with AdvErL Evo Er:YAG Laser for Dentistry (Morita Model: MEY-1-A), with PS600TS tip using the manufacturer’s recommended settings (70 mJ, 25 pulses per second, PPS). The laser tip was inserted into the periodontal pockets measured prior treatment with PD ≥ 5 mm and was moved repeatedly in an apico-coronal direction without touching the root for 10 seconds.

Participants were given a prescription of 0.12% chlorhexidine (Peridex) mouthwash to use for 6 weeks after treatment. One operator (A.A) performed all scaling and root planing and Er:YAG laser treatments.

Statistical Analysis

Descriptive statistics (means and standard deviations for continuous items, counts and percentages of categorical items) were calculated.

Differences in probing depth reduction or attachment gain between laser treatment and control groups were analyzed with a nested mixed effects linear regression model. Normality of the data was assessed graphically. Statistical significance between the two groups’ gingival bleeding index was determined with a generalized estimating equation model. Differences in microbial load was investigated with the Wilcoxon signed-rank test. P-values less than 0.05 were considered statistically significant. The software Stata 13.1 (StataCorp LLC, College Station, TX) was used for the analysis.

Results

Seventeen study volunteers were screened and 11 participants (6 males and 5 females) were enrolled in this prospective, randomized single-blinded clinical trial. All 11 study participants complied fully with all study procedures and follow-up visits. The mean age of the study population was 48 ± 16 years. Table 1 shows the demographic background of the study population.

Table 1: Demographics of the study population.

Parameters

 
Age (years, mean ± SD)

48 ± 16

Gender n (%)
·         Male

6 (54.6%)

·         Female

5 (45.5%)

Race n (%)
·         Native Americans

3 (27.2%)

·         Asian

3 (27.2%)

·         Black/African American

2 (18.18%)

·         White/Non- Hispanic

3 (27.2%)

Total

11

Clinical parameters (PD, CAL and BOP) were improved after treatment in both the SRP and SRP+Er:YAG laser group (Table 2). However, there were no significant differences between the SRP and the SRP + Er:YAG groups at 3 months (P = 0.08).

Table 2: Mean probing depths (PD, mm) , clinical attachment levels (CAL, mm), and bleeding on probing (BOP, %) of sites with baseline probing depth of ≥ 5 mm in SRP only (Control) and SRP + Er:YAG (Test) groups at baseline, 6 weeks and 3 months for all study participants.

Time

Baseline 6 Weeks

3 Months


SRP Only (Mean ± SD)

SRP + Er:YAG laser (Mean ± SD) SRP Only (Mean ± SD) SRP + Er:YAG laser (Mean ± SD) SRP Only (Mean ± SD)

SRP + Er:YAG laser (Mean ± SD)

Mean PD

5.9 ± 1.1

6.0 ± 1.4 4.5 ± 1.7 4.6 ± 2.0 4.7 ± 1.6

4.6 ± 1.8

Mean CAL

6.2 ± 1.3

6.3 ± 1.5 4.9 ± 2.5 5.0 ± 2.4 5.3 ± 2.3

5.0 ± 2.2

Mean BOP

92.7%

80.9% 64.6% 58.4% 61.5%

43.8%

SD=Standard deviation.

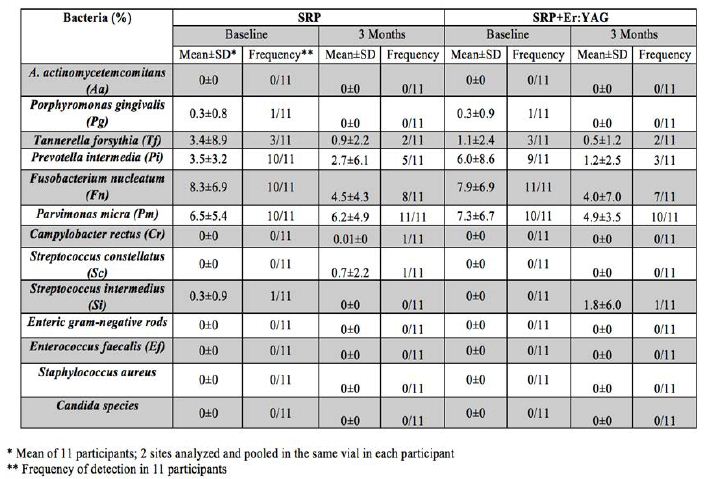
Microbiological data was expressed as percentage of the cultivable microflora before and 3 months after SRP or SRP+Er:YAG treatment. A. actinomycetemcomitans, Enteric gram negative rods, E. faecalis, S. aureus and Candida species were not detected in any participant at baseline or at the 3 months follow up visit in either the test and control groups in all participants. Porphyromonas gingivalis was detected in one participant only in both treatment groups (Table 3). When comparing baseline and 3 months data, there was an overall reduction in the percentage of cultivable microflora for Porphyromonas gingivalis, Tannerella forsythia, Prevotella intermedia, Fusobacterium nucleatum and Parvimonas micra in both SRP and SRP+Er:YAG laser groups. There was a slight increase in Campylobacter rectus and Streptococcus constellatus in the SRP group and in Streptococcus intermedius in the SRP+Er:YAG laser group from baseline to 3 months follow up in one participant only. However no statistically significant differences in percentage of the cultivable microflora were found when comparing SRP and SRP-Er:YAG lase treated groups. Since the data is not normally distributed, the Wilcoxon signed-rank test was used. There was no statistically significant difference in the change in any bacteria between baseline and 3 months follow up (P > 0.05) (Table 4).

Table 3: Comparison between the mean percentage in the cultivable microflora between baseline and 3 months for the SRP and SRP+Er:YAG groups.

table 3

Table 4: Comparison between the difference in the mean of the cultivable microflora between baseline and 3 months for the SRP and SRP+Er:YAG groups.

Bacteria/Time

SRP*

(mean ± SD)

(Median/IQR)

SRP + Er:YAG *

(mean ± SD)

(Median/IQR)

P value

A. actinomycetemcomitans (Aa)

Not detected

Not detected

Porphyromonas gingivalis (Pg)

0.2 ± 0.8

0/0

0.2 ± 0.9

0/0

0.32

Tannerella forsythia (Tf)

2.4 ± 9.6

0/2.1

0.6 ± 2.6

0/0.7

0.42

Prevotella intermedia (Pi)

0.7 ± 6.4

2/5.4

4.7 ± 7.9

2/10

0.33

Fusobacterium nucleatum (Fn)

3.8 ± 8.2

4.2/6.5

3.9 ± 9.8

3/9

0.32

Parvimonas micra (Pm)

0.3 ± 8.4

-0.9/11.7

2.4 ± 6.3

0.1/8.3

0.53

Campylobacter rectus (Cr)

-0.009 ± 0.03**

0/0

0.00 ± 0.00

0/0

0.32

Streptococcus constellatus (Sc)

-0.66 ± 2.2**

0/0

0.00 ± 0.00

0/0

0.32

Streptococcus intermedius (Si)

0.3 ± 0.9

0/0

-1.8 ± 6.03**

0/0

0.16

Enteric gram negative rods

Not detected

Not detected

Enterococcus faecalis (Ef)

Not detected

Not detected

Staphylococcus aureus

Not detected

Not detected

Candida species

Not detected

Not detected

SD=Standard deviation IQR: Inter-quartile range.
*Difference between baseline and 3 months data from 11 participants.
**Negative value indicates an increase from baseline to 3 months.

Discussion

The current literature is equivocal regarding the efficacy of Er:YAG laser as part of non-surgical periodontal therapy. The present prospective randomized single-blinded clinical trial was designed to better understand the efficacy of Er:YAG laser therapy on clinical periodontal parameters as well as microbial recolonization patterns in patients diagnosed with chronic moderate to severe chronic periodontitis.

Er:YAG laser in combination with SRP and ultrasonic instrumentation effectively reduced PD by 1.4 mm from baseline to 3 months in sites with PD ≥ 5 mm. This is comparable to results in a literature review by Cobb, who reported an average PD reduction of 1.29 mm in 4-6 mm sites [13]. However, we did not find statistically significant differences between SRP and SRP+Er:YAG treated pockets after 6 weeks and 3 months. Periodontal inflammation as measured by BOP also decreased in both of our treatment groups at 6 weeks and 3 months; however there was no significant difference between the SRP and SRP+Er:YAG groups. These observations are in line with previous studies [14-19].

Differences in the outcomes of published clinical trials on the effect of Er:YAG laser may be attributable to the various treatments the control groups have received: no treatment, SRP alone, ultrasonic scaling alone or a combination of SRP and ultrasonic; and whether the laser was used alone or in combination with other treatment modalities. A number of studies tested Er:YAG laser against SRP alone, and found no significant Er:YAG laser effect in terms of PD reduction at 3, 6 or 12 months [14-18]. On the other hand, Schwarz et al. [4] reported superior outcomes with Er:YAG laser alone compared to SRP in a randomized controlled split mouth clinical trial. Recently, Zhou et al. found statistically significant effect of Er:YAG laser when compared to SRP alone, albeit the effect was judged clinically minimally important by the authors [20]. Compared to ultrasonic debridement alone, adjunct application of Er:YAG laser induced significant PD reduction 12 months after treatment [19].

In comparison, our approach was to use the common standard of care (SRP combined with ultrasonic scaling) as control, and add Er:YAG laser as an adjunct. Findings presented here indicate that Er:YAG laser does not confer additional benefits in terms of pocket reduction or elimination of inflammation when used in combination with SRP and ultrasonic scaling. An important factor to be considered when comparing studies is various laser energy and pulse settings. In our study we applied 70 mJ at 25 Hz, following manufacturer’s recommendations. Other investigations employed different laser sources and different pulse settings: Schwarz et al. used 160 mJ at 10 Hz [4] and Zhou et al. used 50-100 mJ at 15-30 Hz [20].

We found an overall decrease of the subgingival microbial load at 3 months compared to baseline but that decrease was not significant. This is consistent with other in literature where the total number of the subgingival microbiota was reduced after therapy but the gram-negative species returned to baseline 3 – 6 months post therapy [21,22]. The literature is inconsistent when microbial outcomes were measured. Some studies have shown that there was no significant difference in terms of microbial outcomes between the SRP only group and SRP+Er:YAG laser groups [14,18,19]. One study found significantly greater reduction in A. actinomycetemcomitans, Porphyromonas gingivalis, Prevotella nigrescens and Tannerella forsythia at 6 and 12 months in the SRP + Er:YAG laser group [16]. In that study, patients were enrolled in a rigorous plaque-control program prior to laser treatment.

One of the limitations of our present study is that bacterial samples were collected only after 3 months. By that time the microbial load may have returned to its pre-treatment baseline [21]. Also, using bacterial cultures only enables us to detect live bacteria. Utilizing more sensitive approaches in the microbial analysis might have enabled us to detect more cultivable microflora. It cannot be excluded that the split mouth design might have resulted in translocation of bacteria between the test and control quadrants that influenced the clinical and microbial results. Increasing the sample size might have permitted us to detect treatment effects that did not reach statistical significance. Also, longer follow up periods could have added to our knowledge on the long-term efficacy of laser therapy.

Contradictory data in the literature may be due to heterogeneity in study design such as the different methods used for bacterial sampling and detection, the time it took for samples to be analyzed after they were obtained, different equipment and settings, the method and efficacy of SRP, the uneven root surface topography, the thickness of the subgingival biofilm and the timing and duration of laser therapy. It appears that both the laser type and settings impact the outcomes achieved in different studies. Further studies are needed to establish appropriate settings and the use of water coolant for periodontal nonsurgical therapy with the laser as monotherapy or as an adjunct to SRP [24-26].

Although patient-centered outcomes were not measured in this study, several participants reported less post-treatment sensitivity on the Er:YAG laser treated side. This coincides with studies that have shown significant reduction in dentin hypersensitivity following Er:YAG application [27,28]. Likewise, bleeding during instrumentation appeared to be less on the Er:YAG laser treated sites, suggestive of Er:YAG laser’s hemostatic properties, which may lead to improved post-operative patient experience, particularly in those taking anticoagulants [2]. It is worth noting that none of the participants reported adverse outcomes. Thus, for future considerations, an evaluation of the post-treatment experience by the participants may add value to the results.

Conclusion

Scaling and root planing with or without Er:YAG laser treatment reduced periodontal inflammation as measured by probing depth reduction, gain in clinical attachment and decreased bleeding on probing. Within the limitations of this study, the use of Er:YAG laser as an adjunctive therapy to scaling and root planing in patients diagnosed with moderate to severe chronic periodontitis did not provide clinical and microbial benefit over a combination of ultrasonic and hand instrumentation.

Acknowledgements

Thomas Rams, DDS, MHS, PhD, Professor – Director of Oral Microbiology Testing Service Laboratory, Department of Periodontology and Oral Implantology, Kornberg School of Dentistry.

Conflict of Interest

The authors declare that they have no conflict of interests in this study.

References

  1. Ishikawa I, A. Aoki, Takasaki AA (2004) Potential applications of Erbium:YAG laser in periodontics. J Periodontal Res 39(4): 275-85. [crossref]
  2. Aoki A, et al. (2004) Lasers in nonsurgical periodontal therapy. Periodontol 2000, 36: 59-97. [crossref]
  3. Cobb CM (2006) Lasers in periodontics: a review of the literature. J Periodontol 77(4): 545-64. [crossref]
  4. Schwarz F, et al. (2001) Periodontal treatment with an Er: YAG laser compared to scaling and root planing. A controlled clinical study. J Periodontol 72(3): 361-7. [crossref]
  5. Ando Y, et al. (1996) Bactericidal effect of erbium YAG laser on periodontopathic bacteria. Lasers Surg Med 19(2): 190-200. [crossref]
  6. Caton J, et al. (1989) Effects of personal oral hygiene and subgingival scaling on bleeding interdental gingiva. J Periodontol 60(2): 84-90. [crossref]
  7. Waerhaug J (1978) Healing of the dento-epithelial junction following subgingival plaque control. I. As observed in human biopsy material. J Periodontol 49(1): 1-8. [crossref]
  8. American Academy of Periodontology Task Force Report on the Update to the 1999 Classification of Periodontal Diseases and Conditions (2015) J Periodontol 86(7): 835-8. [crossref]
  9. McGuire MK (1991) Prognosis versus actual outcome: a long-term survey of 100 treated periodontal patients under maintenance care. J Periodontol 62(1): 51-8. [crossref]
  10. Polson AM, et al. (1997) Multi-center comparative evaluation of subgingivally delivered sanguinarine and doxycycline in the treatment of periodontitis. I. Study design, procedures, and management. J Periodontol 68(2): 110-8. [crossref]
  11. Rams TE, Degener JE, van Winkelhoff AJ (2014) Antibiotic resistance in human chronic periodontitis microbiota. J Periodontol 85(1): 160-9. [crossref]
  12. Rams TE, Listgarten MA, Slots J (1996) Utility of 5 major putative periodontal pathogens and selected clinical parameters to predict periodontal breakdown in patients on maintenance care. J Clin Periodontol 23(4): 346-54. [crossref]
  13. Cobb CM, McCawley TK, Killoy WJ (1992) A preliminary study on the effects of the Nd:YAG laser on root surfaces and subgingival microflora in vivo. J Periodontol 63(8): 701-7. [crossref]
  14. Yilmaz S, et al. (2013) Evaluation of the clinical and antimicrobial effects of the Er:YAG laser or topical gaseous ozone as adjuncts to initial periodontal therapy. Photomed Laser Surg 31(6): 293-8. [crossref]
  15. Lopes BM, et al. (2010) Clinical and microbiologic follow-up evaluations after non-surgical periodontal treatment with erbium:YAG laser and scaling and root planing. J Periodontol 81(5): 682-91. [crossref]
  16. Rotundo R, et al. (2010) Lack of adjunctive benefit of Er:YAG laser in non-surgical periodontal treatment: a randomized split-mouth clinical trial. J Clin Periodontol 37(6): 526-33. [crossref]
  17. Badran Z, et al. (2012) Clinical outcomes after nonsurgical periodontal therapy with an Er:YAG laser device: a randomized controlled pilot study. Photomed Laser Surg 30(7): 347-53. [crossref]
  18. Yilmaz S, et al. (2012) Er:YAG laser versus systemic metronidazole as an adjunct to nonsurgical periodontal therapy: a clinical and microbiological study. Photomed Laser Surg 30(6): 325-30. [crossref]
  19. Sanz-Sanchez I, et al. (2015) Microbiological effects and recolonization patterns after adjunctive subgingival debridement with Er:YAG laser. Clin Oral Investig
  20. Zhou X, et al. (2019) Efficacy of Er:YAG laser on periodontitis as an adjunctive non-surgical treatment: A split-mouth randomized controlled study. J Clin Periodontol 46(5): 539-547. [crossref]
  21. Haffajee AD, et al. (1997) Clinical and microbiological features of subjects with adult periodontitis who responded poorly to scaling and root planing. J Clin Periodontol 24(10): 767-76. [crossref]
  22. Slots J, et al. (1979) Periodontal therapy in humans. I. Microbiological and clinical effects of a single course of periodontal scaling and root planing, and of adjunctive tetracycline therapy. J Periodontol 50(10): 495-509. [crossref]
  23. Schwarz F, et al. (2003) Clinical evaluation of an Er:YAG laser combined with scaling and root planing for non-surgical periodontal treatment. A controlled, prospective clinical study. J Clin Periodontol 30(1): 26-34. [crossref]
  24. Mousques T, Listgarten MA, Phillips RW (1980) Effect of scaling and root planing on the composition of the human subgingival microbial flora. J Periodontal Res 15(2): 144-51. [crossref]
  25. Magnusson I, et al. (1984) Recolonization of a subgingival microbiota following scaling in deep pockets. J Clin Periodontol 11(3): 193-207. [crossref]
  26. Schwarz F, et al. (2003) In vivo and in vitro effects of an Er:YAG laser, a GaAlAs diode laser, and scaling and root planing on periodontally diseased root surfaces: a comparative histologic study. Lasers Surg Med 32(5): 359-66. [crossref]
  27. Schwarz F, et al. (2002) Desensitizing effects of an Er:YAG laser on hypersensitive dentine. J Clin Periodontol 29(3): 211-5. [crossref]
  28. Ehlers V (2012) Clinical comparison of gluma and Er:YAG laser treatment of cervically exposed hypersensitive dentin. Am J Dent 25(3): 131-5 [crossref]

A Comparative Study on Effect of Low Dose Ketamine versus Dexamethasone on Intraoperative Nausea and Vomiting during Cesarean Section under Spinal Anesthesia

DOI: 10.31038/JCRM.2021411

Abstract

Background and objectives: Intra Operative Nausea and Vomiting (IONV), is distressing for patients, obstetricians, anesthetists; and may increase the risk of visceral injury during surgery by involuntary uncontrolled abdominal movements. In this study, we aimed to compare the antiemetic efficacy of low dose Ketamine versus Dexamethasone to decrease the incidence of IONV during Cesarean Section (C/S) under spinal anesthesia.

Materials and methods: This study was performed on 135 full term parturient women, aged between 18 and 40 years; candidate for cesarean section under spinal anesthesia at operation room. The parturient were allocated randomly to three groups using randomized blocking method. Group I (n = 45) received 8 mg Dexamethasone with total syringe volume of 5 ml, while group II (n = 45) received 20 mg Ketamine with total syringe volume of 5ml, and control group III (n = 45) received 5 ml normal saline. During the intraoperative period, the number of nausea, retching and vomiting episodes were recorded by an anesthetist who was blinded to the drug administered to the patient. Intraoperative hypotension and Bradycardia were recorded. The patient was also requested to report the symptoms of nausea, vomiting and shivering that may occur at the intervals. Vomiting was managed by Metoclopramide 10 mg slowly IV. A standardized surgical technique was used in all cesarean sections. Finally the statistical analysis was done using Statistical Package for Social Science version 21 program (SPSS21).

Results: This study, performed on 135 parturient women divided into three groups with 45 members in each one (first group received Dexamethasone, second and third groups were Ketamine and Placebo receivers in respect). Average age was 30.35 ± 5.94 years in Dexamethasone group, 29.97 ± 6.18 years in Ketamine group, and 29.6 ± 6.03 in control group(P = 0.840). In this study there was statistically insignificant increase in the rate of successful prevention of IONV (P = 0.062) and shivering (P = 0.550) using preoperative Ketamine and Dexamethasone. But there was statistically significant decrease in the rate of IONV in Ketamine group when compared to Dexamethasone group. The studied groups were comparable as regard to mean arterial blood pressure and heart rate, there was no statistically significant difference between groups during the study period. Also intraoperatively, there was no statistically significant difference in hypotensive episodes (P = 0.885), total Ephedrine administered (the average amount in those who suffered hypotension and received Ephedrine) (P = 0.623), and bradycardia (P = 0.146) between the studied groups. There was statistically significant decrease in the incidence of bradycardia in Ketamine group when compared to Dexamethasone group.

Conclusion: This study showed that there was no statistically significant decrease difference between groups receiving Dexamethasone and low dose Ketamine compared to control group during the operation period regarding the decrease rate of nausea and vomiting, hypotension and shivering.

Introduction

Minor side effects such as nausea and vomiting have been seen in more than 66% of cases [1-3]. Sudden contractions of Diaphragm during labor, which is unpleasant for patients can occur due to manipulation and abdominal traction. IONV (Intra Operative Nausea and Vomiting) is distressing for patients, obstetricians, anesthetists; and may increase the risk of visceral injury during surgery by involuntary uncontrolled abdominal movements [4-6]. Many factors may contribute to this high rate of IONV on the patients undergoing abdominal surgery under regional anesthesia: psychological changes due to anxiety, sympathetic block and the resultant hypotension secondary to spinal anesthesia, probably are the most important factors. Hypotension can induce the emetic symptoms by leading to cerebral hypo perfusion [7-9]. In addition, the chance of nausea and vomiting during labor is supposedly increased due to hormonal changes and increased internal pressure of uterus [10]. Considering the Causes of nausea and vomiting and its side effects; improvement of these conditions can have a significant effect on maternal treatment at the time of cesarean section. Prevention of hypotension or prescription of some kind of effective drugs is therefore important for the prevention of IONV. Dexamethasone, Ondansetron, ketamine, Pethidine and tramadol are some of the several drugs which are being used for prevention and treatment of the mentioned unwanted event [4,11-18]. Numerous studies have shown the effect of Dexamethasone in reducing nausea and vomiting [2,4,11]. It is assumed that Ketamine induced rising of blood pressure can reduce the incidence of spinal induced hypotension and consequently reduce nausea and vomiting [7,17,19]. In this study, we aimed to compare the efficacy of low dose ketamine versus Dexamethasone on IONV during C/S under spinal anesthesia.

Patients and Methods

This study is a type of randomized controlled, prospective, double blind clinical trial. The statistical population of the present study were patients referred to Alevi Educational and Medical Center of Ardabil city of Iran, with an indication for cesarean section during the year 2018. This study was performed on 135 ASA I–II female patients, between 18 and 40 years of age undergoing a planned C/S under spinal anesthesia and included three groups: Dexamethasone group, ketamine group and Placebo group, which were the recipients of sole normal saline. Sample volume is based on volume calculation sample for RCT studies with significance level of 0.05% and power of 80%; considering 60% = P1 in Placebo group and 28% = P2 in Dexamethasone group, 38 patients were counted for each group. In the same way, the sample volume is based on the volume calculation sample for RCT studies with significance level of 0.05 and power of 80%; and in terms of P1 = 60% in placebo group and P3 = 22% In the low dose ketamine group, 27 people for each group was calculated. And in terms of 20% possible loss, 7 people were added to Dexamethasone group and 18 patients were added to low dose ketamine group; thus 45 patients were enrolled in the present study to receive each drug for prevention of intraoperative nausea and vomiting.

After obtaining approval from the clinical research ethics committee of medical university with the code: IR.arums.rec.1396.230 and IRCT number: 20150808023559N18, all participants provided a written informed consent. 135 Patients were randomly divided into three groups using simple sampling method and block method (AABBCC) as follow: Ketamine group (including 45 patients receiving 20 mg Ketamine with total syringe volume of 5 ml), Dexamethasone group (including 45 patients receiving 8 mg Dexamethasone with total syringe volume of 5 ml) and control group (including 45 patients who received 5 ml of normal saline). All 3 syringes were similar in terms of color (content of all 3 syringes were colorless) and volume (all 3 syringes contained 5 ml of liquid substance). All three drugs were separately in syringes with specific codes of A,B,C on them. The three syringes were given by the second anesthetist to the anesthetist who was unaware of the content of the syringe and would administer it in a double-blind fashion before surgical incision and after spinal anesthesia. We excluded patients with, preeclampsia, eclampsia, psychiatric disorder, gastrointestinal disease, drug allergies, infection, diabetes, glaucoma, epileptic patients, and those on antiemetic agent in the last 24 hs. All parturient received 1000 ml Ringer solution IV over 30 min through 18 or 20 G IV lines before spinal anesthesia. Patients evaluated with standard monitoring including electrocardiogram, noninvasive arterial blood pressure measurement and pulse oximetry. Spinal anesthesia performed using a 25-gauge spinal needle in sitting position, through the L3-4, or L4-5 interspace.2.5 ml of 0.5% heavy Marcaine (Marcaine Spinal Heavy Ampule 0.5%, Astrazeneca) was administered to the subarachnoid space. Parturient were moved to supine position with operation bed turned 20 degree left lateral tilt to decrease the Aortocaval compression caused by the uterus and reducing hypotension after spinal anesthesia. The parturient were allocated randomly to three groups, ketamine group (n = 45) received 20 mg Ketamine with total syringe volume of 5 ml, Dexamethasone group (n = 45) received 8 mg Dexamethasone diluted in 5 ml normal saline and control group (n = 45) received 5 ml normal saline. the three syringes were given by the second anesthetist to the anesthetist who was unaware of the content of the syringe and would administer it in a double-blind fashion slowly IV over1 min before surgical incision. Face mask oxygenation used to all patients at a rate of 5 L/min, the level of sensory blockage was evaluated before the surgical incision. We excluded Patients with insufficient level of analgesia who were in need of general anesthesia. Estimated fluid deficits and maintenance requirements were replaced with Ringer’s solution IV, Intraoperative hypotension (MABP less than 20% of the basal reading) was managed by increasing the infusion rate of Ringer solution with injecting increments of 10 mg Ephedrine IV and if hypotension persisted another bolus Ephedrine was given. Bradycardia (HR < 50 beat/min) managed by Atropine (0.5 mg). After delivery of the baby, routine use of 10 units Oxytocin IV plus 20 units slow infusion if necessary were given to all parturient to enhance uterine contraction. We recorded the incidence of hypotension and increments of Ephedrine. During the intraoperative period, nausea, retching and vomiting episodes were recorded by an anesthetist who was blinded to the type of drug administered to the patient, questioning the patient in frequent intervals about the emetic symptoms. The patient was also requested to report any symptoms that may occur. Vomiting was managed by Metoclopramide 10 mg slowly IV, and IV analgesic (Fentanyl 50 microgram) was injected and the amount was recorded if required after delivery of the baby. A standardized surgical technique was used in all cesarean sections by Pfannenstiel incision. Nausea and Vomiting, evaluated through the following scoring table: Score 1: No nausea and vomiting, score 2: Only nausea, score 3: one to two episodes of nausea and vomiting, score4: Nausea and vomiting more than twice. Patients’ shivering score was evaluated according to the following shivering table: score0: No shivering observed, score 1: goose pumps and bristling, score 2: shivering localized to the group of body muscles, score 3: shivering in different bunches of body muscles score 4: shivering involves movements of the entire body.

The statistical analysis was done using SPSS program (statistical package for social science) version 21, Anova, Chi Square and Fisher Tests. All the tests were considered meaningful at the level of 0.05. All information and the answers were confidential.

Results

This study performed on 135 parturient women divided into three groups with 45 members in each one (first group received Dexamethasone, second and third groups were Ketamine and Placebo receivers in respect). There was no statistically significant differences in age between the three groups (P = 0.840). In the analysis of educational background, it was observed that 29 patients in Dexamethasone group (64.4%), 29 patients in ketamine group (64.4%) and 26 patients in control group (57.8%) were undergraduate. Anthropometric findings were observed and there was no significant difference in BMI among Dexamethasone, Ketamine and control groups (P = 0.246). ASA evaluated in 6 levels and it was observed that the majority of the patients in three groups were at I-ASA level (P = 0.165). All pregnancies were full term. None of the patients in the three groups had history of previous cardiac disease. None of them had history of cigarette smoking. Anesthetic level was adequate in all patients and sensory block was at T4 level. There was statistically insignificant increase in the rate of successful prevention of IONV in Ketamine group when compared to Dexamethasone group (P = 0.062). The studied groups were comparable as regard to systolic blood pressure, diastolic blood pressure, mean arterial blood pressure and heart rate, there was no statistically significant difference between groups at different spectrum of time during the study period (before surgical incision up to 75 minutes after operation). After analyzing the data in all three groups using Repeat measurement test regarding Systolic blood pressure there was significant difference between three groups. There were significant differences regarding diastolic blood pressure, mean arterial blood pressure and heart rate in each group during the different periods of time throughout the operation. The highest rate of bradycardia occurred in Dexamethasone group with 6 patients (13.3%) (P = 0.146). After two-by-two analyzing of the data in the study groups, it was observed that the incidence of bradycardia in Ketamine group was significantly lower than Dexamethasone group (P = 0.049). while there was no significant differences between Ketamine group compared with control group (P = 0.091), and Dexamethasone group compared with control group (P = 0.748).

Intraoperative hypotension was evaluated in three groups (MABP less than 20% of basic level) and the group with the most hypotensive cases was Dexamethasone group with 28 cases (62/2%); there were 26 patients (57/8%) in each of Ketamine and placebo groups. Analysis of results showed that this finding is not statistically significant.

Regarding shivering, it was observed that shivering occurred in 1 patient at Dexamethasone group with grade 1(2/2%) and 2patients in control group (1 patient in grade 1 and 1 patient in grade 2) (4/4%) and none of the patients in Ketamine group had shivering in three groups statistically was insignificant (P = 0.550).

The need for Ephedrine administration was analyzed and observed that in 32 patients of Dexamethasone group (71/1%), 31 patients of ketamine group (68/9%) and 32 patients of Control group (71/1%) single dose of Ephedrine was administered which was statistically insignificant.

There were no significant differences between three groups regarding the amount of received Ephedrine.

The average amount of received Ephedrine in Dexamethasone group was calculated 6.13 ± 16.22 mg, it was 18 ± 12/17 mg in ketamine group and 18/22 ± 48/12 mg in Control group (P = 0.623).

There was statistically significant increase in the rate of successful prevention of only nausea in Ketamine group when compared to Dexamethasone group (P = 0/023). The incidence of IONV was statistically insignificant when compared Ketamine group versus control group (P = 0/180) and Dexamethasone group versus control group (P = 0/335).

Regarding shivering, it was observed that there was single case of shivering with grade 1(2/2%) and 2 patients with grade 4(4/4%) in Dexamethasone group, and 1 patient with grade 1 and 1 patient with grade 2 in control group whereas no patient with shivering had been recorded in Ketamine group. There were statistically insignificant differences among three groups considering shivering (P = 0/550).

Discussion

In this study, 135 patients were divided in to three groups with 45 members in each (First group was recipient of Dexamethasone, second group was recipients of low dose Ketamine and the third group was placebo).

In the study performed by Ahmed Hassanein and Eissa Mahmoud [19] in Egypt in 2014 on 135 patients candidate for cesarean section, Aiming to determine the effects of low dose Ketamine versus Dexamethasone on intraoperative nausea and vomiting during C/S; The incidence of nausea and vomiting in Dexamethasone group (28/8%) and Ketamine group (22/2 %) (51/1%) were significantly lower than the control group.

But in the present study there was statistically insignificant difference in low dose ketamine group and dexamethasone group compared to the control group in terms of nausea and vomiting in the study performed by Kalani et al. [20] on 120 patients aiming the Effect of Ondansetron and Dexamethasone on nausea and Vomiting under Spinal Anesthesia, it was reported that in the 1st and 5th minutes after surgery, the incidence of nausea and vomiting, was 0% in ondansetron group and 10/2%, 13/3% respectively in Dexamethasone group, and it was observed that incidence of nausea and vomiting in ondansetron group was significantly lower.

In another study by Shalu et al. [21] titled “the Efficacy of Intravenous Dexamethasone in Prolonging the Duration of Spinal Anesthesia in Elective Cesarean Section” performed on 60 patients; Patients were divided into two groups.

The first group received Dexamethasone and the second group received Normal saline. It was observed that there were no statistically significant differences between the two groups in terms of nausea and vomiting which was identical to the findings of the present study.

In the study performed by Behdad et al. [22] on “Effects of Intravenous Ketamine during Spinal Anesthesia” in 60 Pregnant Women Undergoing Cesarean Section in 2013, the first group received 30 mg Ketamine with 1 mg Midazolam and the second group received Midazolam alone.

The statistical differences in nausea and vomiting in the first group Compared to the second group, was significantly high.

In the study performed by Modir et al. [23] under the title of “Prophylactic efficacy of Dexamethasone, Ketamine and Dexmedetomidine against intra- and postoperative nausea and vomiting under spinal anesthesia on 140 Pregnant woman undergoing cesarean section”; Patients were divided into 4 groups.

First group received normal saline, 2nd group received Dexamethasone, the 3rd group received Ketamine and the 4th group received Dexmedetomidine.

It was observed that all three drugs regarding nausea and vomiting are significantly effective compared to the control group and the incidence of nausea and vomiting is significantly less in Dexmedetomidine group compared to others.

In the present study the incidence of hypotension was insignificant in different groups (P = 0/885) while in the study of Hassanein et al. [19] there was no difference in Ephedrine administration (the average amount in those who suffered hypotension and received ephedrine), between Ketamine and dexamethasone groups, while the control group showed a significant high dose of total Ephedrine administration when compared to Ketamine and Dexamethasone groups (8 ± 3.2 versus 4.5 ± 2.1 in Ketamine group, and 5.3 ± 2 in Dexamethasone group), and a significant high rate of hypotensive episodes when compared to ketamine group (84.4% versus 64%).

In the study of Shalu et al. [21] heart rate, systolic blood pressure, diastolic blood pressure and arterial oxygen saturation in the Dexamethasone group had no significant difference with the control group; Which is in line with the results of our study. In the study of Kalani et al. [20] there were no significant differences between groups in mentioned items.

In Behdad et al. [22] study it was observed that Ketamine failed to make any significant changes to patients’ vital signs. In Modir et al. [23] the lowest heart rate (in normal range) and blood pressure was in Dexmedetomidine group and showed a significant difference compared to other three groups. But in our study, heart rate hadn’t any significant difference between Ketamine group and Dexamethasone group. In the study of Solhpour et al. [24] with the title of “ Comparison of prophylactic use of Meperidine, Meperidine plus Dexamethasone, and Ketamine plus Midazolam in preventing of shivering during spinal anesthesia” None of the four groups of this study showed any statistically significant difference in vital signs. Reviewing these studies, it was observed that Ketamine and Dexamethasone can’t make any significant changes in vital signs in a single dose and the majority of studies showed that vital signs were relatively more stable with these two drugs compared to the control group. In current study there wasn’t any significant difference regarding shivering among three groups. while in the study of Solhpour et al. [24] administration of combined Dexamethasone with Meperidine, could reduce the incidence of shivering. There was no significant differences among the four groups in nausea and vomiting. It also showed that Ketamin can reduce the incidence of nausea and vomiting while Dexamethasone can’t. The current study is in line with this finding.

Conclusion

This study showed that nausea and vomiting and bradycardia significantly decreased in low dose Ketamine group compared to Dexamethasone group while there weren’t any differences in hypotension and shivering between the two groups. There was no statistically significant difference between groups receiving Dexamethasone and low dose Ketamine compared to control group during the operation period regarding the decrease rate of nausea and vomiting, hypotension and shivering.

Acknowledgements

This article is derived from my final PhD thesis Which has been submitted to research deputy of Ardabil University of Medical Science and translated by me for the Journal of Clinical Research and Medicine. I would like to express my gratitude to my parents and my sisters who gave me the needed emotional support to persevere through what seemed like a totally overwhelming and never ending task.

References

  1. Balki M, Carvalho JC (2005) Intraoperative nausea and vomiting during cesarean section under regional Int J Obstet Anesth 14(3): 230-241. [crossref]
  2. Rodseth RN, Gopalan PD, Cassimjee  HM,  Goga  S  (2010)  Reduced  incidence of postoperative nausea and vomiting in black South Africans and its utility for a modified risk scoring Anesth Analg 110(6): 1591-1594. [crossref]
  3. Griffiths JD, Gyte GML, Paranjothy S, Brown HC, Broughton HK, et al. (2012) Interventions for preventing nausea and vomiting in women undergoing regional anaesthesia for caesarean section. Cochrane Database Syst Rev 9: CD007579. [crossref]
  4. Voigt M, Fröhlich CW, Hüttel C (2013) Prophylaxis of intra- and postoperative nausea and vomiting in patients during cesarean section in spinal Med Sci Monit 19: 993-1000. [crossref]
  5. Ngan Kee WD, Khaw KS, Ng FF (2004) Comparison of phenylephrine infusion regimens for maintaining maternal blood pressure during spinal anesthesia for caesarean Br J Anaesth 92(4): 469-74. [crossref]
  6. Cunningham FG, leveno KJ, Bloom SL (2010) Williams obstetrics and Gynecology 2010. 23th ed USA: McGraw-Hill, pp: 544-77.
  7. Miller RD, Cohen NH, Eriksson LI, Fleisher LA, WienerKronish JP, Young Miller’s Anesthesia.8th ed. USA. Churchill Livingstone. 2015.
  8. Apfel CC, Roewer N (2003) Risk assessment of postoperative nausea and Int Anesthesiol Clin 41: 13-32. [crossref]
  9. Morgan EJ, Mikhail MS, Murray J (2006) Nonvolatile anesthetic agents, clinical anesthesiology. 4th , vol 1. Lange Medical Books/McGraw-Hill.
  10. Rasooli S, Moslemi F, Khaki A (2014) Effect of subhypnotic doses of propofol and midazolam for nausea and vomiting during spinal anesthesia for cesarean section. Anesthesiol Pain Med 4(4): e19384. [crossref]
  11. Kalani N, Zabetian H, Sanie MS, Deylami M, Radmehr M, et (2017) The Effect of Ondansetron and Dexamethasone on Nausea and Vomiting under Spinal Anesthesia. World Journal of Plastic Surgery 6(1): 88-93.
  12. Pecora FST, Malbouisson LM, Torres MLA  (2009)  Supplemental  oxygen  and the incidence of perioperative nausea and vomiting in cesarean sections under subarachnoid Rev Bras Anestesiol 59: 558-569. [crossref]
  13. Habib AS, Itchon-Ramos N, Phillips-Bute BG, Gan TJ (2006) Transcutaneous acupoint electrical stimulation with the Relief Band for the prevention of nausea and vomiting during and after cesarean delivery under spinal anesthesia. Anesth Analg 102: 581-584. [crossref]
  14. Rowbotham DJ (2005) Recent advances in the nonpharmacological management of postoperative nausea and Br J Anaesth 95: 77-81. [crossref]
  15. Demirhan A, Tekelioglu YU, Akkaya A, Ozlu T, Yildiz I, et al. (2013) Antiemetic effects of dexamethasone and ondansetron combination during cesarean sections under spinal African Health Sciences 13(2): 475-482. [crossref]
  16. Voigt M, Fröhlich CW, Hüttel C, Kranke P, Mennen J, et al. (2013) Prophylaxis of intra- and postoperative nausea and vomiting in patients during cesarean section in spinal anesthesia. Medical Science Monitor: International Medical Journal of Experimental and Clinical Research 19: 993-1000. [crossref]
  17. Rahmanian M, Leysi M, Hemmati AA, Mirmohammadkhani M (2015) The Effect of Low-Dose Intravenous Ketamine on Postoperative Pain Following Cesarean Section with Spinal Anesthesia: A Randomized Clinical Oman Medical Journal 30(1): 11-16. [crossref]
  18. Behdad S, Hajiesmaeili MR, Abbasi HR, Ayatollahi V, Khadiv Z, et al. (2013) Analgesic Effects of Intravenous Ketamine during Spinal Anesthesia in Pregnant Women Undergone Caesarean Section; A Randomized Clinical Anesthesiology and Pain Medicine 3(2): 230-233. [crossref]
  19. Hassanein A, Mahmoud E (2015) Effect of low dose ketamine versus dexamethasone on intraoperative nausea and vomiting during cesarean section under spinal anesthesia. Egyptian Journal of Anaesthesia 31: 59-63.
  20. Kalani N, Zabetian H, Sanie MS, Deylami M, Radmehr M, et (2017) The Effect of Ondansetron and Dexamethasone on Nausea and Vomiting under Spinal Anesthesia. World J Plast Surg 6(1): 88-93. [crossref]
  21. Shalu PS, Ghodki PS (2017) To Study the Efficacy of Intravenous Dexamethasone in Prolonging the Duration of Spinal Anesthesia in Elective Cesarean Section. Anesth Essays Res 11(2): 321-325. [crossref]
  22. Behdad S, Hajiesmaeili MR, Abbasi HR, Ayatollahi V, Khadiv Z, et al. (2013) Analgesic Effects of Intravenous Ketamine during Spinal Anesthesia in Pregnant Women Undergone Caesarean Section; A Randomized Clinical Anesth Pain Med 3(2): 230-3. [crossref]
  23. Modir H, Moshiri E, Kamali A, Shokrpour M, Shams N (2019) Prophylatic efficacy of dexamethasone, ketamine and dexmedetomidine against intra- and postoperative nausea and vomiting under spinal Formos J Surg 52: 17-23.
  24. Solhpour A, Jafari A, Hashemi M, Hosseini B, Razavi S, et (2016) A comparison of prophylactic use of meperidine, meperidine plus dexamethasone, and ketamine plus midazolam for preventing of shivering during spinal anesthesia: a randomized, double-blind, placebo-controlled study. J Clin Anesth 34: 128-35. [crossref]

Pestivirus Infection Does Not Affect Prevalence of Brucella melitensis and Encephalitozoon cuniculi in Small Ruminants of the State of Nuevo Leon, Mexico

DOI: 10.31038/IJVB.2021512

Abstract

Background: Members of the Pestivirus genus cause diseases associated with immunosuppression in cattle, which are involved in important economic losses. Similarly, Brucella melitensis is an intracellular bacterium of goats and sheep, whose infection significantly impacts on livestock production, whereas, Encephalitozoon cuniculi is an intracellular parasite of small ruminants, causing a subclinical disease, which worsens if they are immunosuppressed. In the present study, susceptibility to B. melitensis and E. cuniculi in small ruminants infected with Pestivirus was investigated.

Methods: Two hundred goat serological samples were obtained in production units proportionally distributed in 4 rural development districts (RDD) in the state of Nuevo León, Mexico. For the serological identification of Pestivirus, B. melitensis, and E. cuniculi, ELISA, Rose Bengal test, and carbon immunoassay methods were respectively used.

Results: Twenty five animals selected from each RDD were positive for Pestivirus. In addition, B. melitensis and E. cuniculi seroprevalence was 96% and 97.5%, respectively, regardless of Pestivirus infection.

Conclusion: Pestivirus does not influence animals susceptibility to B. melitensis and E. cuniculi infection. In addition, B. melitensis and E. cuniculi prevalence in the state of Nuevo Leon, Mexico was demonstrated.

Keywords

Small ruminants, Seroprevalence, Antibodies, Pestivirus, Brucella melitensis, Bovine viral diarrhea, Encephalitozoon cuniculi, Microsporidia

Introduction

Members of the Pestivirus genus of the Flaviviridae family are the causative agents of bovine viral diarrhea, border disease, and classic swine fever [1]. These are some of the most common ailments associated with immunosuppression of cattle, which increases secondary and opportunistic infections [2]. Infected animals show marked temporary immunosuppression resulting from leukocytes viral infection [3]. In these cells, viruses replicate, leading to genetic changes that eventually cause their adaptation and interspecies interaction. Pestivirus infections persist and disseminate within domestic and wild artiodactyls, causing significant economic losses [4].

These viruses cross placenta during pregnancy, inducing embryo death and abortions, reproductive disorders such as fetal mummification, stillbirths, congenital disabilities, and malformations [5]. By colonizing the fetus during early gestational development, viruses cause persistent infection, characterized by immunological tolerance [6]. However, the disease is often subclinical and is only revealed by the presence of specific antibodies [7]. However, if the infection occurs in the first third of pregnancy before the immune system develops, the fetus will become persistently infected and produce a high viral load without developing an immune response [8]. Such animals (infected with non-cytopathic viruses) are weak and more prone to infections of the digestive and respiratory tract. If these animals are infected with another cytopathic type-strain, they develop a disease called mucosal disease with 100% mortality [9].

Pestiviruses have a worldwide distribution, whose prevalence varies among countries and regions, becoming an essential factor in virus transmission between animal species. In Mexico, there is a 33.6% prevalence of Pestivirus in cattle [10], whereas globally its prevalence ranges from 2% to 25% [11]. However, studies on goats or sheep in Mexico have not been developed to date. Some control programs against Pestiviruses are based on the application of biosecurity measures in livestock, which involve early evaluation of the herd searching for signs of infection, implementation of a vaccination system where the disease is present, determination and elimination of persistently infected animals [12], and periodic monitoring of the herds [8]. Control and eradication models depend on the prevalence and control laws of each country and region.

In addition, Encephalitozoon cuniculi is an opportunistic and obligated intracellular parasite, known to be a pathogen to different species, including small ruminants [13]. Generally, the infection is subclinical, however, in immunosuppressed animals, it is common to find nephritis, non-suppurative encephalitis, and vasculitis, among other affections [14]. The transmission of this intracellular agent is by ingestion or inhalation of the spores in urine or feces.

On the other hand, Brucella melitensis is a Gram-negative intracellular bacterium, endemic of sheep and goats, which is highly contagious to humans. Brucella affects the mammary gland, uterus, and testicles, causing abortions in pregnant females, and orchitis in males [15]. This disease causes an economic impact on livestock production, especially in the countries in which ovine and caprine production is essential [16].

In the present study, prevalence of B. melitensis and E. cuniculi in goats and sheep of Northeast Mexico, infected with Pestivirus was investigated.

Methods

Study Area and Animals Source

This study was developed with serum samples from 200 small ruminants (goats) proportionally distributed in the rural development districts (RDD) Anahuac, Apodaca, Montemorelos, and Galeana of the state of Nuevo Leon, Mexico. Animal serum samples were evaluated for the presence of B. melitensis and E. cuniculi antibodies by the Rose Bengal test and the carbon immunoassay (CIA) method respectively.

Detection of Antibodies against Pestivirus

A competitive ELISA (INgezim BVD Compac, Ingenasa, Madrid, Spain) was used to detect Pestivirus specific antibodies against NS2-3 antigen (p80/p125 inactivated viral antigens) in goats and sheep. Sensitivity and specificity of the test are 95% and 92.0%, respectively, according to the manufacturer.

Detection of Antibodies to B. melitensis

The hemagglutination Rose Bengal test was used to detect B. melitensis antibodies in serum [17]. Antigen stained with Rose Bengal was used and buffered at a low pH; 25 μl of serum samples were placed in a plate, along with 25 μl of antigen. Mixture was then stirred for approximately 4 minutes until hemagglutination was observed; if there was no evidence of agglutination, it was considered as unfavorable.

Detection of antibodies to E. cuniculi

CIA method was performed according to manufacturer’s instructions (Medicago, Uppsala, Sweden). It consists of using E. cuniculi complete spores (killed by heat) suspended with carbon contained in the kit, and exposing them to serum samples; presence of antibodies will be visualized as agglutination under optical microscopy at 40X [18].

Results

As shown in Figure 1a, 50.5% ± 0.6% of animals from RDDs were positive for Pestivirus, whereas seroprevalence for B. melitensis and E. cuniculi was 97% ± 2.5% and 96.5% ± 1.9%, respectively. In Pestivirus-free animals, B. melitensis and E. cuniculi seroprevalence was 96% ± 5.65% and 97% ± 3.8% respectively (Figure 1b).

fig 1

Figure 1: Seroprevalence of Pestivirus, B. melitensis, and E. cuniculi in RDD goats positive (a) and negative (b) for Pestivirus infection.

Discussion

Pestivirus infection causes immunosuppression, affecting IFN-γ and IL-2 production, phagocytosis and elimination of microorganisms, lymphocytes, and MHC regulation, which may reactivate some microorganisms already present or allow other opportunists to impair the infection [8,9,20].

The aim of the present study was to evaluate the role of Pestivirus infection on B. melitensis and E. cuniculi prevalence, potentially impairing the development of disease in small ruminants. We expected that those individuals infected with Pestivirus would be more susceptible to infection by Brucella and Encephalitozoon. However, there was no difference on the prevalence of these microorganisms in control animals not infected with Pestivirus. This can be explained by not considering additional environmental or management factors such as malnutrition and hygiene conditions in pens.

B. melitensis and E. cuniculi co-infection was present in goats of the state of Nuevo Leon, Mexico, with a combined seroprevalence of animals infected and not infected with Pestivirus of about 97%, which is very high, compared with that of other states such as Veracruz (18.18% seroprevalence) [21], and with results from other countries, including Nigeria (9.6% seroprevalence) [22] and Colombia (1.2 % seroprevalence) [23]. The high prevalence of E. cuniculi should be taken into consideration, since this disease is not endemic of Nuevo Leon or even Mexico. There are no studies reporting seroprevalence or cases of this microorganism in small ruminants. However, presence of microsporidia in ruminants has been reported [24]; Juránková et al. [24] showed no significant difference between Enterocytozoon bieneusi prevalence of 17.5% and 13.33% in bovine herds positive and negative for Pestivirus respectively. Despite there are no reports to date about co-infections with E. cuniculi, these data indicated the potential of microsporidia to use ruminants as hosts [25].

The first report of specific antibodies against E. cuniculi in ruminants showed that were 43.6% seropositivity of Slovakia cows [26], in which immunohistochemical tests showed the presence of spores, suggestive of E. cuniculi in the placenta, brain, liver, myocardium, kidneys, and lungs of aborted fetuses. These findings are compatible with those observed in fetuses aborted by microorganisms of the Brucella genus, although they corresponded to E. cuniculi. This is one of the main reasons why the family Brucella was considered within the organisms to study in this investigation [26,27].

Pestivirus infection can maintain an immunosuppression status in animals because of the decrease in CD4 + and CD8 + lymphocytes in peripheral blood, as observed in HIV infections [20]. Other reports of Pestivirus-induced immunosuppression, resulted in the presence of opportunistic pathogens such as Neospora caninum, Mycoplasma bovis, and Salmonella typhimurium in ruminants [28,29].

Conclusion

We have demonstrated that Pestivirus infection is not a predisposing factor to acquire other opportunist intracellular microorganisms, since B. melitensis and E. cuniculi were prevalent in small ruminants in the absence of the virus. In addition, a significant prevalence of 97% for B. melitensis was observed, whereas E. cuniculi seroprevalence was 96.5% in goats of the state of Nuevo Leon, Mexico, that were infected with Pestivirus. Similarly, in Pestivirus-free animals, prevalence of B. melitensis and E. cuniculi was 96% and 97% respectively. Furthermore, we believe this is the first report on E. cuniculi seroprevalence in small ruminants in Mexico.

References

  1. Isken O, Langerwisch U, Schonherr R, Lamp B, Schroder K, et al. (2014) Functional characterization of bovine viral diarrhea virus nonstructural protein 5a by reverse genetic analysis and live cell imaging. J Virol 88: 82-98. [crossref]
  2. Otachel-Hawranek J (2004) Reproductive losses in dairy cattle infected with BVD-MD virus – A field study. Bull Vet Inst Pulawy 48: 355-359.
  3. Brewoo JN, Haase CJ, Sharp P, Schultz RD (2007) Leukocyte profile of cattle persistently infected with bovine viral diarrhea virus. Vet Immunol Immunopathol 115: 369-374. [crossref]
  4. Tao J, Liao J, Wang Y, Zhang X, Wang J, Zhu G (2013) Bovine viral diarrhea virus (BVDV) infections in pigs. Vet Microbiol 165: 185-189. [crossref]
  5. Ross CE, Dubovi EJ, Donis RO (1986) Herd problem of abortions and malformed calves attributed to bovine viral diarrhea. J Am Vet Med Assoc 188: 618-619. [crossref]
  6. Peterhans E, Jungi TW, Schweizer M (2003) BVDV and innate immunity. Biologicals 31: 107-112. [crossref]
  7. Letellier C, Kerkhofs P, Wellemans G, Vanopdenbosch E (1999) Detection and genotyping of bovine diarrhea virus by reverse transcription-polymerase chain amplification of the 5’ untranslated region. Vet Microbiol 64: 155-167. [crossref]
  8. Lanyon SR, Hill FI, Reichel MP, Brownlie J (2014) Bovine viral diarrhoea : Pathogenesis and diagnosis. Vet J 199: 201-209. [crossref]
  9. Rajput MK, Darweesh MF, Park K, Braun LJ, Mwangi W, et al. (2014) The effect of bovine viral diarrhea virus (BVDV) strains on bovine monocyte-derived dendritic cells (Mo-DC) phenotype and capacity to produce BVDV. Virol J 11: 1-15. [crossref]
  10. Sánchez-Castilleja YM, Rodríguez Diego JG, Pedroso M, Cuello S (2012) Simultaneidad serológica de Neospora caninum con Brucella abortus y los virus de la rinotraqueítis infecciosa bovina y diarrea viral bovina en bovinos pertenecientes al Estado de Hidalgo, México. Rev Salud Anim 34: 95-100.
  11. Bachofen C, Bollinger B, Peterhans E, Stalder H, Schweizer M (2013) Diagnostic gap in Bovine viral diarrhea virus serology during the periparturient period in cattle. J Vet Diagn Invest 25: 655-661. [crossref]
  12. Dias NL, Fonseca Júnior AA, Oliveira AM, Sales ÉB, Alves BRC, et al. (2014) Validation of a real time PCR for classical swine fever diagnosis. Vet Med Int 2014: 171235-171239. [crossref]
  13. Morsy EA, Salem HM, Khattab MS, Hamza DA, Abuowarda MM (2020) Encephalitozoon cuniculi infection in farmed rabbits in Egypt. Acta Vet Scand 62: 1-11.
  14. Webster JD, Miller MA, Vemulapalli R (2008) Encephalitozoon cuniculi-associated placentitis and perinatal death in an alpaca (Lama pacos). Vet Pathol 45: 255-258. [crossref]
  15. Ganter M (2015) Zoonotic risks from small ruminants. Vet Microbiol 181: 53-65. [crossref]
  16. Juste RA, Leginagoikoa I, Villoria M, Minguijon E, Elguezabal N, et al. (2013) Control of brucellosis and of respiratory Small Ruminant Lentivirus infection in small ruminants in the Basque country, Spain. Small Rumin Res 110:115-119.
  17. Ismael AB, Swelum AAA, Mostafa SAH, Alhumiany ARA (2016) Latex agglutination using the periplasmic proteins antigen of Brucella melitensis is a successful, rapid, and specific serodiagnostic test for ovine brucellosis. Int J Immunopathol Pharmacol 29: 480-487. [crossref]
  18. Boot R, Hansen AK, Hansen CK, Nozari N, Thuis HC (2000) Comparison of assays for antibodies to Encephalitozoon cuniculi in rabbits. Lab Anim 34: 281-289. [crossref]
  19. Ridpath J (2010) The contribution of infections with bovine viral diarrhea viruses to bovine respiratory disease. Vet Clin Food Anim Pract 26: 335-348. [crossref]
  20. Chase CC, Thakur N, Darweesh MF, Morarie-Kane SE, Rajput MK (2015) Immune response to bovine viral diarrhea virus—looking at newly defined targets. Anim Health Res Rev 16: 4-14. [crossref]
  21. Román-Ramírez DL, Martínez-Herrera DI, Villagómez-Cortés JA, Peniche-Cardeña AEDeJ, Morales-Álvarez F, et al. (2017) Epidemiología de la brucelosis caprina en la Zona Centro del Estado de Veracruz. Gac Med Mex 153: 26-30.
  22. Olufemi OT, Dantala DB, Shinggu PA, Dike UA, Otolorin GR, et al. (2018) Seroprevalence of brucellosis and associated risk factors among indigenous breeds of goats in Wukari, Taraba State, Nigeria. J Pathog 2018: 1-5. [crossref]
  23. Tique V, Daza E, Álvarez J, Mattar S (2010) Seroprevalence of Brucella abortus and ocurrence of Brucella melitensis in goats and sheep of Cesar and Sucre. Rev UDCA actual divulg cient 13: 133-139.
  24. Juránková J, Kamler M, Kovařčík K, Koudela B (2013) Enterocytozoon bieneusi in bovine viral diarrhea virus (BVDV) infected and noninfected cattle herds. Res Vet Sci 94:100-104. [crossref]
  25. Kašičková D, Sak B, Kváč M, Ditrich O (2007) Detection of Encephalitozoon cuniculi in a new host – Cockateel (Nymphicus hollandicus) using molecular methods. Parasitol Res 101: 1685-1688. [crossref]
  26. Halánová M, Letková V, MacÁk V, Štefkovič M, Halán M (1999) The first finding of antibodies to Encephalitozoon cuniculi in cows in Slovakia. Vet Parasitol 82: 167-171. [crossref]
  27. Ocholi RA, Kwaga JKP, Ajogi I, Bale JOO (2005) Abortion due to Brucella abortus in sheep in Nigeria. Rev Sci Tech.; 24: 973-979. [crossref]
  28. Arcangioli MA, Duet A, Meyer G, Dernburg A, Bézille P, et al. (2008) The role of Mycoplasma bovis in bovine respiratory disease outbreaks in veal calf feedlots. Vet J 177: 89-93. [crossref]
  29. Duong MC, Alenius S, Huong LTT, Björkman C (2008) Prevalence of Neospora caninum and bovine viral diarrhoea virus in dairy cows in Southern Vietnam. Vet J 175: 390-394. [crossref]

Commentary: Postoperative Pain Management Strategies in Hip Arthroscopy

DOI: 10.31038/IJAS.2021211

Abstract

Hip arthroscopy is a rapidly growing field due to its significant diagnostic and therapeutic value in treating a variety of hip disorders. Due to the lack of standardized protocol for pain management in these patients, adequate control of postoperative pain continues to be challenging. Several techniques have been employed to find a regimen that is effective at reducing postoperative pain, narcotic consumption and cost to the patient and healthcare system. The purpose of this article is to provide a review of important conclusions from the previous paper “Postoperative Pain Management Strategies in Hip Arthroscopy” and report on possible implications of the article.

Recent literature supports the use of a multi-modal approach to managing postoperative pain in patients undergoing hip arthroscopy. When a pre-and postoperative analgesic regimen is used in combination with peripheral nerve block or intraoperative anesthetic injection, patients experience less pain and postoperative narcotic consumption. Postoperative pain scores and opioid consumption are similar between the different techniques. However, postoperative complications are less in those receiving Intra-Articular (IA) injection or Local Anesthetic Infiltration (LAI) compared to peripheral nerve blocks.

Recent studies suggest that intraoperative techniques such as IA injection or LAI used in conjunction with a pre-and postoperative analgesic regimen may be the safest and most effective multi-modal strategy for reducing postoperative pain in these patients. In addition, omitting the use of peripheral nerve block may lead to decreased anesthesia procedural fees and operating room turnover time, resulting in decreased cost to the patient and increased efficiency of the facility.

Introduction

Hip arthroscopy is gaining popularity among orthopedic surgeons due to its significant diagnostic and therapeutic value in the management of common hip disorders such as Femoroacetabular Impingement (FAI), labral pathology, loose body, snapping hip, septic arthritis, synovial disorders and gluteus tendon tears. Despite the recent increased prevalence of hip arthroscopy to treat hip pathology, postoperative pain management in these patients continues to be challenging for orthopedic surgeons. Unfortunately, there is a lack of standardized protocols for postoperative pain management in hip arthroscopy, likely due to the paucity of comparative high-quality studies exploring the efficacy of different techniques.

The purpose of Postoperative Pain Management Strategies in Hip Arthroscopy [1] was to provide an up to date comprehensive review of current literature regarding postoperative pain management techniques in patients undergoing hip arthroscopy. In addition, it provides a source that orthopedic surgeons can reference to determine which hip arthroscopy pain management technique, or combination thereof, is best for their practice and patients. The purpose of this commentary is to provide a rapid review of the most important conclusions of Postoperative Pain Management Strategies in Hip Arthroscopy [1] and report on possible implications of the article.

Important Conclusions

Several recent studies have proven the effectiveness of oral medications such as acetaminophen, gabapentin and cyclobenzaprine for management of pain in patients undergoing major orthopedic surgery [2-4]. However, these drugs have not been extensively studied in patients undergoing hip arthroscopy. In contrast, Celecoxib has been extensively studied in hip arthroscopy and has proven to be an efficacious oral analgesic and nonsteroidal anti-inflammatory (NSAID) due to its high oral bioavailability, rapid absorption, and selective cyclooxygenase (COX)-2 inhibition [5]. In two randomized controlled trials, preoperative celecoxib resulted in significantly lower Visual Analogue Scale (VAS) pain scores at 1, 12 and 24 hours postoperatively compared to placebo [5,6]. In addition, patients receiving celecoxib also spent less time in the Post-Anesthesia Care Unit (PACU) compared to placebo [5,6].

There has been growing interest surrounding the use of peripheral nerve blocks such as Lumbar Plexus Block (LPB), Femoral Nerve Block (FNB) and Fascia Iliaca Block (FIB) in the management of postoperative pain in patients undergoing hip arthroscopy. Patients undergoing LPB had statistically, but not clinically significant lower VAS pain scores in the PACU compared to those with general anesthesia only, or placebo [7,8]. However, patients receiving LPB required less postoperative narcotics, anti-emetics and ketorolac than the control group [7]. Patients who receive FNB tend to require less intraoperative and postoperative narcotics compared to those who receive general anesthesia alone or placebo [9,10]. Patient reported pain scores were lower in patients receiving FNB compared to general anesthesia alone, however time in PACU was higher in those receiving FNB [10]. Importantly, patient satisfaction was higher and time to discharge was lower in patients receiving FNB compared to those who received IV morphine for pain [11]. Patients who received FIB during hip arthroscopy had fairly good overall pain scores in PACU (3.85/10) [12].

Although peripheral nerve blocks are effective at reducing postoperative pain, they are not without complication. Peripheral nerve blocks have the potential for intravascular injection, iatrogenic nerve injury, postoperative falls, infection, hematoma and rebound pain after discharge [13-15]. In addition, peripheral nerve blocks require specialized equipment and an anesthesiologist to perform them, resulting in increased cost to the patient and hospital.

When compared to FNB, local anesthetic Intra-articular (IA) injections have proven to be just as effective. Child et al. [14] reported no significant difference in patient reported pain scores at 1, 3 and 6 weeks postoperatively compared to FNB. Importantly, the occurrence of postoperative falls in the IA injection group was significantly lower (5 vs 19, p <0.001). There was also a lower rate of postoperative peripheral neuritis in the IA injection group compared to the FNB group (2 vs 26 p < 0.001). Therefore, IA injection with local anesthetic provides a valuable alternative to FNB for postoperative pain control, due to significantly less complications associated with the procedure and similar pain scores as FNB. In patients who received preoperative celecoxib with acetaminophen plus IA injection with morphine and clonidine, there was a significant reduction in postoperative narcotic consumption in PACU compared to patients who received oral analgesics only. However, pain scores were similar between the two groups and there was no significant difference in time to discharge [16]. Therefore, an IA injection with clonidine and morphine may reduce complications associated with postoperative opioid consumption such as respiratory depression and dependency, while providing adequate analgesia to patients undergoing hip arthroscopy.

Recently, Local Anesthetic Infiltration (LAI) has become popular among orthopedic surgeons as an efficacious alternative to more expensive procedures such as peripheral nerve blocks. In a study conducted by Philippi et al. [17], patients who received intraoperative LAI requested fewer rescue postoperative femoral nerve blocks compared to the non-LAI group. However, there was no significant difference in opioid consumption in PACU between the groups (p=0.740) [17]. When compared to FIB, patients who received LAI had clinically significant less pain following surgery. In addition, average morphine consumption was twice as low in the LAI group, resulting in less nausea and vomiting compared to the FIB group within 24 hours postoperatively [18]. Interestingly, when LAI was compared with IA injection, patients who received LAI required significantly more rescue medication compared to IA injection group (2.33 mg vs 0.57 mg, p = 0.036). However, VAS pain scores were not statistically different between groups at 1 and 2 hours postoperatively [19]. Therefore, LAI is an effective procedure that offers similar pain management outcomes as peripheral nerve blocks, without the risk of intravascular injection, iatrogenic nerve injury, postoperative falls and higher cost to the patient and hospital. Additionally, LAI is performed intraoperatively by the surgeon, without the need for ultrasound guidance which could decrease operating room turnover time.

Implications

The findings in recent literature support the use of a multi-modal approach to managing postoperative pain in patients undergoing hip arthroscopy. When a multi-modal approach consisting of a pre-and postoperative analgesic regimen combined with peripheral nerve block or intraoperative anesthetic injection is employed, patients experience less pain and postoperative narcotic consumption. Postoperative pain scores and opioid consumption are similar between the different techniques. However, postoperative complications are less in those receiving IA injection or LAI compared to peripheral nerve blocks. In addition, peripheral nerve blocks have the potential for intravascular injection, iatrogenic nerve injury, and require highly trained anesthesiologists resulting in higher costs associated with the procedure. IA injection and LAI are quick procedures performed intraoperatively by the orthopedic surgeon. Use of these intraoperative techniques could increase efficiency of the operating room and decrease cost to the patient and hospital by decreasing turnover time and avoiding anesthesia procedural fees. Therefore, a multi-modal approach consisting of a pre-and post-operative analgesic regimen in combination with IA injection or LAI may be the optimal strategy to manage postoperative pain and increase cost effectiveness of hip arthroscopy.

Conflict of Interest

Collin LaPorte, Michael Rahl declare no conflicts of interest. Olufemi Ayeni is part of a speaker’s bureau for Conmed, outside of the submitted work. Travis Menge reports consulting fees from Smith & Nephew, and research support/grants from Stryker, DJO, and Smith & Nephew, outside of the submitted work.

References

  1. LaPorte C, Rahl MD, Ayeni OR, Menge TJ (2019) Postoperative Pain Management Strategies in Hip Arthroscopy. Current Reviews in Musculoskeletal Medicine 12: 479-485. [crossref]
  2. Schug SA, Sidebotham DA, McGuinnety M, Thomas J, Fox L (1998) Acetaminophen as an Adjunct to Morphine by PatientControlled Analgesia in the Management of Acute Postoperative Pain. Anesthesia & Analgesia 87: 368-372. [crossref]
  3. Han C, Li X, Jiang H, Ma JX, Ma XL (2016) The use of gabapentin in the management of postoperative pain after total hip arthroplasty: a meta-analysis of randomised controlled trials. Journal of Orthopaedic Surgery and Research 11: 79. [crossref]
  4. Witenko C, Moorman-Li R, Motycka C, Duane K, Hincapie-Castillo J, et al. (2014) Considerations for the appropriate use of skeletal muscle relaxants for the management of acute low back pain. P & T: a peer-reviewed. Journal for Formulary Management 39: 427-435. [crossref]
  5. Kahlenberg CA, Patel RM, Knesek M, Tjong VK, Sonn K, et al. (2017) Efficacy of Celecoxib for Early Postoperative Pain Management in Hip Arthroscopy: A Prospective Randomized Placebo-Controlled Study. Arthroscopy: The Journal of Arthroscopic and Related Surgery 1180-1185. [crossref]
  6. Zhang Z, Zhang Z, Zhu W, et al. (2014) Efficacy of celecoxib for pain management after arthroscopic surgery of hip: a prospective randomized placebo-controlled study. European Journal of Orthopaedic Surgery & Traumatology 24: 919-923.
  7. Schroeder KM, Donnelly MJ, Anderson BM, Ford MP, Keene JS (2013) The Analgesic Impact of Preoperative Lumbar Plexus Blocks for Hip Arthroscopy. A Retrospective Review. HIP International 23: 93-98. [crossref]
  8. YaDeau JT, Tedore T, Goytizolo EA, et al. (2012) Lumbar plexus blockade reduces pain after hip arthroscopy: a prospective randomized controlled trial. Anesthesia and Analgesia 115: 968-972.
  9. Dold AP, Murnaghan L, Xing J, et al. (2014) Preoperative Femoral Nerve Block in Hip Arthroscopic Surgery: A Retrospective Review of 108 Consecutive Cases. The American Journal of Sports Medicine 144-149.
  10. Xing JG, Abdallah FW, Brull R, Oldfield S, Dold A, et al. (2015) Preoperative Femoral Nerve Block for Hip Arthroscopy: A Randomized, Triple Masked Controlled Trial. The American Journal of Sports Medicine 43: 2680-2687. [crossref]
  11. Ward JP, Albert DB, Altman R, et al. (2012) Are Femoral Nerve Blocks Effective for Early Postoperative Pain Management after Hip Arthroscopy? Arthroscopy: The Journal of Arthroscopic and Related Surgery 28: 1064-1069.
  12. Purcell RL, Nappo KE, Griffin DW, McCabe M, Anderson T, et al. (2018) Fascia iliaca blockade with the addition of liposomal bupivacaine vs. plain bupivacaine for perioperative pain management following hip arthroscopy. Knee Surgery Sports Traumatology Arthroscopy 26: 2536-2541. [crossref]
  13. Stein BE, Srikumaran U, Tan EW, Freehill MT, Wilckens JH (2012) Lower-Extremity Peripheral Nerve Blocks in the Perioperative Pain Management of Orthopaedic Patients. J Bone Joint Surg Am 94: e167. [crossref]
  14. Childs S, Pyne S, Nandra K, et al. (2017) The Effect of Intra-articular Cocktail versus Femoral Nerve Block for Patients Undergoing Hip Arthroscopy. Arthroscopy 33: 2170-2176.
  15. Louw A, Diener I, Butler DS, Puentedura EJ (2013) Preoperative Education Addressing Postoperative Pain in Total Joint Arthroplasty: Review of Content and Educational Delivery Physiother Theory Pract 29: 175-194. [crossref]
  16. Cogan CJ, Knesek M, Tjong VK, et al. (2016) Assessment of Intraoperative Intra-articular Morphine and Clonidine Injection in the Acute Postoperative Period After Hip Arthroscopy. Orthopaedic Journal of Sports Medicine 4: 2325967116631335.
  17. Philippi MT, Kahn TL, Adeyemi TF, Nair R, Kahlenberg C, et al. (2018) Extracapsular local infiltration analgesia in hip arthroscopy: a retrospective study. Journal of Hip Preservation Surgery 5: 60-65. [crossref]
  18. Garner M, MSc, Alsheemeri Z, MRCS, Sardesai, et al. (2016) A Prospective Randomized Controlled Trial Comparing the Efficacy of Fascia Iliaca Compartment Block Versus Local Anesthetic Infiltration After Hip Arthroscopic Surgery. Arthroscopy: The Journal of Arthroscopic and Related Surgery 33: 125-132.
  19. Baker JF, McGuire CM, Byrne DP, Hunter K, Eustace N, et al. (2011) Analgesic control after hip arthroscopy: a randomised, double-blinded trial comparing portal with intra-articular infiltration of bupivacaine. Hip international: the journal of Clinical and Experimental Research on Hip Pathology and Therapy 21: 373-377. [crossref]

Retrospective Google Trends Analysis to Evaluate Possible COVID-19 Outbreak Onset in Italy

DOI: 10.31038/PEP.2021212

Abstract

Background: Due to the delayed communication by Chinese authorities and International bodies, it is difficult to settle when COVID-19 pandemic has started. Italy has been the first country outside Asia to experience the spreading of SARS-CoV-2 among general population, but it is possible that some patients had already developed the infection, before the first Italian official case was confirmed at the end of February.

Methods: We have performed a specific analysis from 1st August 2019 to 29th February 2020 on Google Trends, which is a publicly available tool that compares the volume of Internet searches concerning specific queries in different areas and periods. The analysis was retrospectively extended up to 5-years in order to study the seasonality of Google Trends’ search volumes in relation to potential COVID-19 symptoms.

Results: Our analyses concerning researchers on the Internet support the evidence that the outbreak onset in Italy could be set some weeks before the first confirmed case, maybe before flights closure between Italy and China imposed at the end of January 2020.

Conclusions: Internet-acquired data might represent a preliminary real-time surveillance and alert tool for healthcare systems to plan the most appropriate responses in case of health emergency such as COVID-19 pandemic.

Keywords

COVID-19; Symptoms; Internet; Web; Searches; Google trends

Introduction

The huge amount of searches run through Google creates trends data that can be analyzed by a specific function named “Google Trends” (GT), a publicly available tool that compares the volume of Internet searches concerning specific queries in different areas and periods [1]. Individuals affected by any clinical condition frequently use search engines, such as Google, to look for terms related to their diseases, possible causes and symptoms [2]. In this view, Google Trends can provide indirect approximations of the burden and symptoms of several diseases, so that they have been used for preliminary epidemiological surveillance purposes [2]. Google Trends can integrate and lead up to traditional surveillance systems in early stage detection of seasonal or annual outbreaks of infectious (i.e. influenza, scarlet fever, HIV) and non-infectious (i.e. cancer, epilepsy) diseases, presenting specific search patterns in different parts of the world [2].

Google Trends had positively been associated with the disease prevalence in many COVID-19 studies [3]. Accordingly, researchers hypothesized that this kind of “digital epidemiology” could come up with valuable insights into the spread of viral infections. We have specifically applied this methodology to evaluate the onset of COVID-19 outbreak in Italy, the first country in Europe to experience the spreading of coronavirus SARS-COV2. Italy was also the first country to impose a nationwide lockdown since Wuhan outbreak (February, 2020). Several clinical and epidemiological studies have been presented on the prevalence of COVID-19, but it is possible that some patients had already developed the infection although it was not specifically diagnosed before the first official case, confirmed in Italy at the end of Febraury [4]. Overall, the coronavirus activity has been associated with specific seasonal patterns in relation to other viral diseases such as influenza [3]. The aim of this work was to predict, through Google Trends, the amount of searches referring to COVID-19 related symptoms in Italian population that can be inferred from Internet-based searching before the first COVID-19 confirmed case in an Italian native patient.

Materials and Methods

We have used the publicly available tool “Google Trends” to determine the amount of searches concerning COVID-19 related symptoms from March 2015 to August 2020 performed by Italian users of Google engine. Search queries were ranged simultaneously into three blocks (most common, less common and severe) as listed by WHO [5]. The search was performed in Italian language to take into account only data belonging to people living in Italy. The first block was related to ‘most common symptoms’ and included: fever (in Italian: ’febbre’), tiredness (in italian: ’spossatezza’), and dry cough (in italian: ’tossesecca’). The second block concerned ‘less common symptoms’ corresponding to: rash(in italian: ’eruzione cutanea’), taste (in italian: ’gusto’), headache (in italian: ’mal di testa’), sore throat (in italian: ’mal di gola’), smell (in italian: ’olfatto’). The third block concerning ‘severe symptoms’ included: loss of voice (in italian: ‘afasia’), chest pain (in italian: ’dolore al petto’), muscles pain (in italian: ’dolori muscolari’), shortness of breath (in italian: ’fiatocorto’) [5,6].

Google Trends tool uses a fraction of searches for a specific term (‘keyword’ or ‘search term’) and automatically standardizes the data for the total number of searches gradually presenting them as comparative search volumes (ranging from 0 to 100), in order to compare variations of different search terms across time series and queries (topics in which the word was searched) [2]. Search volumes about COVID-19 symptoms were extracted from July 2015 to August 2020. The selection of the retrospective 5-years did not represent a random selection as it is bound by the extraction limits of the GT tool. Indeed, trends for periods equal or less than 5 years, are collected by days. This method allows for greater evidence than the monthly-based analysis. Scores, recorded per each day, are based on the absolute search volume for each term and day, being related to the absolute search volume on Google on the same day. Subsequently, GT was adjusted for the annual rate variation (provided by Italian Institute for Statistics, ISTAT) for the age groups showing the highest probability to use Internet (14-74 years old). Thus, for statistical purposes, the terms were aggregated by mean estimator to assess researches concerning COVID-19 ‘most common’, ‘less common’, and ‘severe’ symptoms performed by Italian Internet users.

The study includes three statistical analyses:

  1. Main Analysis: the primary objective was to assess the amount of searches referring to COVID-19 related symptoms that can be present in Italian population before the first COVID-19 officially confirmed case in Italy;
  2. Exploratory analysis: the objective was to assess the peak of terms related to COVID-19 symptoms during the pandemic period;
  3. Adherence analysis: the objective was to assess the extent to which the Internet user’s research behavior corresponded to Google trends queries related to the COVID-19 symptoms.

Main Analysis

As main analysis, an interrupted time series analysis (ITS) was used to examine the effect of coronavirus on Google searches for terms describing symptoms potentially related to COVID-19. Google Trends data were seasonally adjusted and analyzed by using auto-regressive integrated moving average (ARIMA) modelling. The implementation of the exposition was very clear with a ban on searches of symptoms terms throughout Italy across six months from August 2019 (estimated time when the virus was circulating yet) to February 2020 (the month before the first COVID-19 confirmed case in Italy, which actually occurred at the end of February) . As “control group”, we used Internet-based searches that presented the same characteristics of the exposures during continuous period (from March 2015 to July 2019), in order to evaluate the trend changes to the breaking point (F-value test). A model stratified by calendar months was adopted to control seasonality effects. The method includes a bootstrap model by default, which runs 250 replications of the main model with randomly drawn samples. A trimmed mean F-value (10 percent removed) is reported and a boot strapped p-value was derived from it. As exploratory analysis, a generalized linear models (GLM) was adapted to assess the trend peaks of epidemics.

Exploratory Analysis

The exploratory analysis was performed to study the seasonality of Google Trends’ search volume in Italy about potential COVID-19 from August 2019 to August 2020, and evaluate possible differences in relative search volumes for ‘most common’, ‘less common’ and ‘severe’ symptoms across different months, adjusted by years and during the last year since the pandemic. According to the date of the first infected with COVID-19 in Wuhan, the month of December 2019 was considered as reference month. The results were presented as rate ratio and 95% confidence intervals (CIs). Finally, cycle plots were built to show the GLM results and their monthly trends. The vertical positions of the inserted subseries plots indicate the average searches per month. The subseries plot was made up considering monthly trends fit of the y-variable (response variable) and its confidence band; the horizontal axis shows the mean y-value over the considered time interval.

Adherence Analysis

An adherence score, stratified by symptoms’ type, was provided to describe the degree to which Internet users correctly searched terms matching the study topic. The score was computed as the total of the queries that met the study objective on the total of the queries for each type of symptoms (ex: researches related to the ‘superenalotto’ topic are considered not adhering to the objective of the study).

SAS and R studio software have been used for data processing and statistical analyses. Results have been considered statistically significant if p<0.05.

Results

The results are presented in three sub-sections (Most common symptoms, Less common symptoms, Serious symptoms). Then the main analysis and the exploratory analysis are described for each category of symptoms:

Most Common Symptoms

The ‘most common’ symptoms had a positive and significant variation in the exposure group (Internet users’ searches from 1st August 2019 to 29th February 2020) than the control group (p<0.001; F-value=1.69). The Google Trends plot of key terms from February 2018 to April 2019 versus search volumes from February 2019 to April 2020 showed how the interest was considerably higher during the COVID-19 pandemic compared to the peak of previous annual flu outbreak (Figure 2A).

The exploratory analysis (under α=0.05)–performed using as reference the month of December, 2019 adjusted by year–showed a significant increased probability from 2019 to 2020 concerning the search volumes in January 2020 (p=0.018;OR=1.67; CI=1.09-2.55), February 2020 (p=0.003;OR=1.91; CI=1.26-2.91), March 2020 (p=0.002; OR=1.96, CI=1.29-2.99), June 2020 (p=0.007; OR=1.78; CI=1.68-2.71) and July 2020(p=0.008; OR=1.75; CI=1.15-2.67), and confirmed the peak between the end of February 2020 and the beginning of March 2020 (Figure 1A).

Less Common Symptoms

The ‘less common’ symptoms showed a positive and significant variation in the exposure group (users research from 1st August 2019 to 29th February 2020) than the control group (p<0.001; F-value=1.63). The Google Trends plot of key terms from February 2018 to April 2019 versus search volumes from February 2019 to April 2020 showed how the interest was considerably higher during the COVID-19 pandemic compared to the peak of previous year flu outbreak (Figure 2B).

The exploratory analysis (under α=0.05)-performed using as reference the month of December 2019 adjusted by year-showed a significant decreasing probability from 2019 to 2020 concerning the search volumes in January 2020(p=0.005; OR=0.62; CI=0.39-1.00), April 2020 (p=0.034; OR=0.60; CI=0.37-0.96), May 2020 (p=<0.001; OR=0.38; CI=0.22-0.65), June 2020 (p=<0.001; OR=0.32, CI=0.19-0.56) and July 2020 (p=<0.001; OR=0.34; CI=0.19-0.58) and reported the peak between the end of February and the beginning of March 2020 (Figure 1B).

Severe Symptoms

The ‘severe’ symptoms showed a positive and significant variation in the exposure group (Internet users’ searches from August 2019 to February2 020) than the control group (p<0.001; F-value=0.54). The Google Trends plot of key terms from February 2018 to April 2019 versus search volumes from February 2019 to April 2020 showed how the interest was considerably higher during the COVID-19 pandemic compared to the peak of previous year flu outbreak (Figure 2C).

The exploratory analysis (under α=0.05) performed using as reference month December 2019adjusted by year, showed a significant increased probability from 2019 to 2020 concerning the search volumes in February (p=0.048; OR=1.34; CI=1.00-1.78), March 2020(p=<0.001; OR=1.82, CI=1.31-1.54) and April 2020 (p=0.018; OR=1.42; CI=1.06-1.91) and reported the peak between the end of February 2020 and the beginning of March 2020 (Figure 1C).

fig 1

Figure 1: Cycle plot by monthly average GT search for Most common symptoms (A), Less common symptoms (B) and Serious symptoms (C). *Subseries shows the spline fit of search terms in each month.

fig 2

Figure 2: Interrupted time series of GT search for Most common symptoms (A), Less common symptoms (B) and Serious symptoms (C).

Discussion

In the last decade, growing evidence has been made available that Google Trends analyses may be a reliable tool for providing estimates of awareness about many diseases and treatments, which are parallel to real-world epidemiology of diseases and drug use data. This study is the first analysis concerning web search behaviours related to the coronavirus outbreak, both in quantitative and qualitative terms, aimed at assessing the time of COVID-19 onset in Italy. Additional objective of the study was to evaluate and possibly validate the epidemiological reliability of Google Trends in different non-clinical settings, for less common, most common and severe symptoms attributable to COVID-19.

Our findings confirmed how the virus may have been spreading in Italy some weeks before the first Italian native case was officially detected. Indeed, the GT symptom terms potentially related to COVID-19 (based on 250 bootstrap simulations) increased significantly in the exposure group (searches performed from 1st August 2019 to 29th February 2020) compared to the control group (users’ trends of the 5-year time series). Moreover, Google Trends for ‘less common’ ‘and ‘most common’ symptoms presented higher significant association (F-value=1.68 and 1.63, respectively) than severe symptoms (F-value=0.58) considering the exposures as reference group (August 2019 to February 2020). The reasons of these differences could be explained by the fact that ‘common’ terms (such as ‘less’ and ‘most’) considered in this analysis represent a kind of basic noisy as they are very similar to flu-like symptoms than terms used in searches concerning severe ones (such as loss of voice, chest pain, muscles pain and shortness of breath). It is also possible that the virus was initially carried by one or more people with negligible symptoms (mostly related to ‘most common’ and ‘less common’ GT term symptoms) some weeks before the outbreak.

The exploratory analysis of the results reinforces the thesis that the virus could be present in Italy several weeks before the lockdown (March 5th 2020): the ‘less common’ symptoms are more significant in the month of December 2019 than March 2020, which appears to be the peak of the pandemic (Figure 1). As highlighted in other studies [7,8], the ‘less common’ symptoms, such as loss of taste and loss of smell, are the most frequent clinical symptoms (about 90% of cases) in COVID-19 patients. Very recently, a young football player living nearby Lodi (the city where the first official Italian native case was coming from) has been proposed as the possible first documented case, as he showed SARS-COV-2 antibodies (identified on subsequent serum analyses) and severe COVID-related symptoms requiring admission to Intensive Care Unit at the beginning of February 2020, namely three weeks before the hospital admission of the first official Italian native case.

Furthermore, the temporal distribution of web-data seems consistent with the clinical trend of the pandemic: relative search volumes for ‘less common’ (Figure 2A), ‘most common’ (Figure 2B) and ‘severe’ symptoms (Figure 2C) in the period 2019-2020 were positively associated and presented a similar monthly sinusoidal pattern as previously shown in clinical studies evaluating the COVID-19 spread in Italy [9]. This was in line with the trend of hospitalizations in Italy recorded in the same months [9]. Also the spreading of the coronavirus by number of infections in the months of June, July and August 2020 is estimated to be higher than December 2019 (Figure 1B).

Nevertheless, our study has some limitations: the main one is that search volumes of Google Trends are frequently found to be increased in case of conditions with large media coverage or, at least, during periods characterized by a higher burden of disease, so that they are gaining attractivity in surveillance studies on several epidemiologically relevant diseases [10]. This is the case, for example, of coronavirus symptoms, which were the focus of large media coverage in the last months. Another limitation could be that search trends might be produced by people other than patients with COVID-19, who are nevertheless interested about this topic. Furthermore, available data are clearly limited to Google users, and are related to the possibility to use a computer with Internet access, as well as by computer literacy and skills. Therefore, a non-representative sampling bias might have occurred due to different factors, such as age, disability, income or preferred search engine [11]. To overcome this problem, the adherence analysis confirms the consistency between the terms analyzed in the study and the topics related to Covid-19. Google Trends queries related to the terms analyzed during the exposure period were highly adherent to the objective of the study (Table 1: ‘most common’ score=91.9; ‘less common’ score=82.4; ‘severe’ score=91.9). Despite this, in some cases, search biases may be found such as in the case of fever, sore throat, headache, loss of smell or taste and loss of voice (Table 1).

Table 1: Adherence scores of Google trends queries by types and terms related to COVID-19 symptoms during the exposure period (August 2019 to February 2020).

Type

Term Query* Query Rate StudyObjective Adherence Score
Most Common

Fever

Influenza 2020 sintomi

High Yes

91,9%

Influenza 2020 durata

High Yes
Codici superenalotto la febbre del sabato sera High

No

Influenza senz afebbre 2020

High Yes
Dopo quanto tempo fa effetto la tachipirina High

Yes

Tiredness

spossatezza cause

60%

Yes

Drycough

Selentus sciroppo tosse secca

High Yes

Sedativo tossesecca

130%

Yes

Tossesecca e grassa

90% Yes
Aereosoltossesecca 70%

Yes

Sciroppo per tossesecca

60%

Yes

Less Common

Rashon skin

Eruzionecutanea o rash High

Yes

82,4%

Taste

Perditaolfatto e gusto 100%

Yes

Hedache

Mal di testa elodie

High No
Mal di testa pre ciclo High

Yes

Mal di testa tutti i giorni 160%

Yes

Tachipirina 1000

130% Yes
Svegliarsi con il mal di testa 130%

Yes

Sore throat

Nenuco mal di gola

High No
Okitask High

Yes

Rimedio naturale mal di gola

180%

Yes

Rimedi naturali per il mal di gola

110% Yes
Mal di gola e raffreddore 100%

Yes

Smell

Smell

100% Yes
Olfatto 86%

Yes

Smelltraduzione 19%

No

Perditaolfatto

8% Yes
Olfattocane 5%

Yes

Severe

Lossofspeach

Afasiasinonimo

High

No

91,9%
Afaisa primaria progressiva 200%

Yes

Afasia motoria

180%

Yes

Chestpain

Dolore in mezzo al petto

130% Yes
Dolere al petto cause 60%

Yes

Dolore petto e schiena

40%

Yes

Muscules pain

Tachipirina dolori muscolari 70%

Yes

Shortnessofbreath

Fiato corto cause

100% Yes
Fiato corto e tosse 83%

Yes

Fiato corto cuore 65%

Yes

Conclusions

This study provides additional evidence for seasonality of COVID-19 by using Google Trends. In light of our results, we have proposed a method for the right use of Google Trends to predict the pandemic’s trend. This method can serve as a baseline standard to ensure methodological understanding and reproducibility for researchers who choose to use the tool in the future for other countries or regions. In fact, a future approach could be to compare the results between countries or regions and investigate possible correlations with environmental conditions [11]. Internet-acquired data might represent a preliminary real-time surveillance tool and an alert for the care systems to plan the most appropriate resources in specific periods in case of health emergency such as epidemics or pandemics [2]. However, our results support the evidence that the beginning of the outbreak in Italy were probably seeded weeks before the first detection and possibly before the first COVID-19 patient detected and also before the flights closure between Italy and China were suspended at the end of January 2020. As a future perspective, COVID-19 related to Google Trends might be validated with external clinical data sets.

Author Contributions

Conceptualization, A.F. and P.P.; methodology, A.F.; software, A.F.; validation, P.A., P.P. and M.C.; formal analysis, A.F.; investigation, A.F.; resources, A.M.; data curation, P.P.; writing—original draft preparation, A.F and P.P.; writing—review and editing, G.I.; visualization, P.A.; supervision, A.M.; project administration, A.M.; All authors have read and agreed to the published version of the manuscript.

Funding

This research received no external funding.

Conflicts of Interest

The authors declare no conflict of interest.

References

  1. Nuti SV, Wayda B, Ranasinghe I (2014) The use of Google Trends in health care research: a systematic review. PLoS ONE, e109583. [crossref]
  2. Freyer Dugas A, Jalalpour M, Gel Y (2013) Influenza Forecasting With Google Flu Trends. PLoS ONE, [crossref]
  3. Walker A, Hopkins C, Surda P (2020) Use of Google Trends to investigate loss-of-smell-related searches during the COVID-19 outbreak2020. Int Forum Allergy Rhinol 839-847. [crossref]
  4. Porcheddu R, Rubino S (2020) Similarity in Case Fatality Rates (CFR) of COVID-19/SARS-COV-2 in Italy and China. J Infect Dev Ctries 125-128. [crossref]
  5. Guo Y, Yan Y (2020) The Origin, Transmission and Clinical Therapies on Coronavirus Disease 2019 (COVID-19) Outbreak – An Update on the Status. Mil Med Res [crossref]
  6. Ciaffi J, Meliconi R (2020) Google trends and COVID-19 in Italy: could we brace for impact?. Intern Emerg Med 1-5.
  7. Lopez J, Cummins S (2018) The use of controls in interrupted time series studies of public health interventions. Int J Epidemiol 2082-2093. [crossref]
  8. Lee Y, Min P (2020) Prevalence and Duration of Acute Loss of Smell or Taste in COVID-19 Patients. J Korean Med Sci, e174. [crossref]
  9. Distante C, Piscitelli P, Miani A (2020) Covid-19 Outbreak Progression in Italian Regions: Approaching the Peak by the End of March in Northern Italy and First Week of April in Southern Italy. Int J Environ Res Public Health [crossref]
  10. Nuti , S.V, Wayda B, Ranasinghe I (2013) The Use of Google Trends in Health Care Research: A Systematic Review. PLoS ONE, e109583. [crossref]
  11. Setti L, Passarini F (2020) Searching for SARS-COV-2 on Particulate Matter: A Possible Early Indicator of COVID-19 Epidemic Recurrence. Int J Environ Res Public Health 2986. [crossref]

Effects of a Symbiotic on the Quality of Life of Elderly Patients with Breast Cancer: a Randomized Controlled Pilot Trial

DOI: 10.31038/CST.2021613

Abstract

Background: A number of studies have confirmed the beneficial effects of prebiotics and probiotics on several physical and psychological health outcomes. The present study aims to evaluate the feasibility, tolerance and preliminary results of a symbiotic, composed by oryzalose and lactobacillis plantarum on sleep quality and psycho-physical stress in a group of elderly patients affected by hormonal dependent breast cancer.

Methods: A total of 40 patients with hystologically proven breast cancer were randomly assigned to group A (intervention) or group B (placebo). Pittsburgh Sleep Quality Index (PSQI), Short Form Health Survey (SF-36) and HADS (Hospital Anxiety and Depression Scale) were submitted to all participants, provided an informed consent, at the enrolment and 6 months later.

Results: After treatment, the group A showed the highest SF-36 physical functioning and vitality score (P=0,01), the lowest bodily pain score (P=0,01) compared to the placebo control group. Group A achieved a significant improvement in the quality of life for all SF-36 domains. Moreover, the intake of symbiotic led to a significant improvement of several PSQI subscales (sleep quality, sleep disturbances, daytime dysfunction). There was a non-significant increased rate of participants classified as good sleepers. Decreased levels of anxiety and depression were observed in group A, but the difference was not significant.

Conclusion: According to our results, a combination of oryzalose and a probiotic could significantly improve both physical and psychological outcomes in a population of elderly breast cancer patients, with excellent safety profiles and optimal compliance.

Keywords

Quality of life, Psychological distress, Cancer, Microbiome, Oncobiotic

Introduction

The human microbiota is gaining more and more attention in the pathogenesis and management of several cancers, including breast cancer, within a new frame of science defined oncobiotic. As regards breast cancer, microbiome seems to be relevant for at least five reasons: the impact of dysbiosis on immune competence [1], systemic inflammation [2], hormonal milieu through the so called “estrobolome” [3-5], the emotional balance (psychobiotic) [6] and breast tissue microbial composition [7]. In fact, several studies have shown that breast tissue has a distinct microbiome with particular species enriched, and somewhat related to the gut bacteria through a gut-breast axis [8-9]. The question remains whether the microbiome plays a causal role in breast carcinogenesis or is an epiphenomenon; accordingly, probiotic treatment may be protective against the incidence of cancer and at least some of cancer related side effects [10]. The microbiome can also interfere with pharmacodynamics and efficacy of some anticancer treatment protocols, including chemotherapy and immunotherapy [11-14]. In addition, achieving benefits in terms of QoL has become increasingly important in cancer treatment, with the traditional endpoint of survival deemed insufficient as the only treatment outcome [15]. Immune dysfunction leading to inflammation is the underlying mechanism that affects the patient physically and emotionally, which also has an indirect impact on social functioning [16]. Inflammation is a hall-mark of cancer as it is associated with the microenvironment of almost all tumor sites [17]. Persistent and localized inflammation can lead to the leaking of pro-inflammatory cytokines into circulation and trigger a systemic inflammatory cascade [18]. There is a consistent relationship between increasing systemic inflammation and worsening of all QoL parameters, such as global health, physical and social functioning, fatigue, pain [19]. Increased inflammation in the central nervous system also triggers behavioural co-morbidities, including depression, anxiety, fatigue, cognitive disturbances, and neuropathic pain. In the present study, we aim to study the feasibility and tolerance of a symbiotic supplement (Superbran) composed by a prebiotic molecule (Oryzalose, a polysaccharide derived from enzymatically treated rice bran with an extract of the shiitake mushrooms), in association with Lactobacillum Plantarum, a probiotic with proven efficacy in activating the cytokine TRAIL (Tumor Necrosis Factor-Related Apoptosis Inducing Ligand), gamma-amino butyric acid (GABA) and anthocyanin in a population of elderly breast cancer patients. The secondary endpoint of this pilot randomized controlled trial is to evaluate the effects of this supplement on quality of sleep and quality of life of a sample of elderly breast cancer patients, compared to placebo. The health-related quality of life (QoL) of cancer patients includes the subjective perception of symptoms, as well as physical, emotional, social and cognitive functions, and the side effects of hormonal treatments [20].

Materials and Methods

This is a parallel, randomized, double-blind and placebo-controlled trial carried out at Fondazione Policlinico Universitario A. Gemelli IRCCS, Center for Integrative Oncology, in Rome and at International Institute of Psychoneuroendocrineimmunology (PNEI) in Milan. A total of forty (40) non-metastatic female patients, over the age of 65 (median age: 71 years, range 65-83), with histologically proven hormone-sensitive breast cancer (ER+ and/or PR+), undergoing adjuvant hormonal therapy (aromatase inhibitors) were recruited from May 2018 to December 2019. Only three (3) of total 40 patients did not finish the study due to previous comorbidities. Twenty (20) patients were randomly assigned to the intervention group (A) and twenty (20) to the placebo group (B), matched by age and performance status. Informed consent was obtained from all the patients. The eligibility criteria were as follows: histologically proven hormonal responsive breast cancer, no ongoing corticosteroids therapy due to their immunosuppressive effects, and no concomitant treatment with other immunomodulating agents, such as interferons, interleukins and monoclonal antibodies. In both arms, supplement and placebo, supplied by PneiPharma (Milan, Italy), were administered orally in a three times/day dose for six months. At the enrolment, patients were asked to collect venous blood at 0 (baseline) and 6 months later, in the morning after an overnight fast. In each blood sample, we counted lymphocytes, monocytes and some lymphocyte subpopulations, including TH lymphocytes (CD4), cytotoxic T lymphocytes (CD8), T reg (CD4+CD25+), NK cells (CD16+CD56). Data were reported as mean ± SE, and statistically analyzed by the Chiquare test, the Student’s test, and the coefficient of correlation, as appropriate. Moreover, we measured patients’ symptoms of depression and anxiety using the Hospital Anxiety and Depression Scale (HADS), including 14 items rated on a 4-point Likert-type scale (higher scores indicate more severe symptoms). The PSQI (Pittsburgh Sleep Quality Index Malay Version) is a standardized, self-administered questionnaire that evaluates retrospective sleep quality and disturbances within the past month. It includes 19 items forming seven subscales: (1) sleep quality (1 item), (2) sleep latency (2 items), (3) sleep duration (1 item), (4) sleep efficiency (3 items), (5) sleep disturbance (9 items), (6) sleep medication (1 item), and (7) daily dysfunction (2 items). The PSQI was evaluated following the original scoring system. Each component has a score ranging from 0 to 3. The scores of seven components will be added up to get a total PSQI score ranging from 0 to 21. Respondents with an overall score above 5 are classified as ‘poor sleepers’, while those with a score of 5 or below are classified as ‘good sleepers’. The SF-36 (Short Form Survery) measures 8 QOL domains which are dichotomized in physical (functioning, physical role limitations, pain, general health) and mental health (vitality, social functioning, emotional role limitations and emotional/mental health) [21]. Item scores were converted to a scale of 0–100 points; the domain scores were derived by averaging individual items within the subscale; and physical and mental health composite scores were derived by averaging the four component domains of each one. Higher values are indicative of better QOL.

All the questionnaires were administered at 0 (baseline), 3 and 6 months in all the participants.

Results

The patients both in the intervention and in the placebo group tolerated well the treatment, did not report any remarkable side effect and only three drop out was recorded. The clinical characteristics of the evaluable patients are reported in Table 1. A clear relief from asthenia was achieved by patients enrolled in the intervention group (83%).

Table 1: Subjects’ characteristics.

GROUP A

GROUP B (PLACEBO)

Age, Years, Mean (SD)

70 (65-78)

73 (67-83)

Height (m)

1.57

1.61

Weight (kg)

70,64

73,86

Improvements in QOL (SF-36) scores were reported at 3 and 6 months (Table 2), particularly in physical functioning, role limitations and pain, while the components of mental health QOL that improved more significantly were vitality and social functioning. Tables 3 and 4 report the results of groups A and B, respectively, for each domain of the SF-36.

Table 2: The SF-36 score of the 2 groups at baseline, at 3 and 6 months.

GROUP A

GROUP B

P*

SF-36 (WEEK 0)

50.3 ± 11.24

49.6 ± 9.3

 0.001

SF-36 (WEEK 12)

53.3 ± 7.03

46.5 ± 11.24

 0.001

SF-36 (WEEK 24)

55.4 ± 8.1

47.69 ± 10.8

 0.001

Table 3: SF-36 domains in group A.

SF-36

0 month 3 month

6 months

Physical functioning

40.0 [20.0; 60.0]

47.5 [43.0; 65.0]*

52.5 [45.0; 61.0]*

Physical role

25.0 [00.0; 50.0]

30.5 [02.0; 120.0]*

37.5 [00.0; 100.0]

Bodily pain

31.0 [22.0; 41.0]

38.5 [38.0; 42.0]*

41.5 [41.0; 50.0]*

General health

48.5 [22.0; 77.0]

50.0 [42.0; 72.0

52.0 [43.0; 62.0]

Vitality

27.5 [15.0; 40.0]

35.0 [30.0; 40.0]*

45.0 [40.0; 60.0]*

Social function

50.0 [25.0; 75.0]

53.5 [50.0; 65.0]

55.5 [50.0; 75.0]

Emotional role

33.3 [00.0; 66.7]

33.3 [00.0; 100.0]

33.3 [00.0; 100.0]

Mental health

60.0 [28.0; 76.0]

66.0 [48.0; 78.0]*

72.0 [55.0; 80.0]*

*Statistically significant (p=0.001).

Table 4: SF-36 domains in group B.

SF36

0 month 3 months

6 months

Physical functioning

38.0 [20.0; 60.0]

40.5 [43.0; 65.0]

40.5 [45.0; 61.0]

Physical role

27.0 [00.0; 50.0]

30.5 [02.0; 120.0]

31.5 [00.0; 100.0]

Bodily pain

29.0 [22.0; 41.0]

30.5 [38.0; 42.0]

33.5 [41.0; 50.0]

General health

50.5 [22.0; 77.0]

52.0 [42.0; 72.0]

52.0 [43.0; 62.0]

Vitality

30.5 [15.0; 40.0]

33.0 [30.0; 40.0]

34.0 [40.0; 60.0]

Social function

47.0 [25.0; 75.0]

47.5 [50.0; 65.0]

46.5 [50.0; 75.0]

Emotional role

31.3 [00.0; 66.7]

33.3 [00.0; 100.0]

32.3 [00.0; 100.0]

Mental health

58.0 [28.0; 76.0]

60.0 [48.0; 78.0]

61.0 [55.0; 80.0]

There were no significant differences between group A and group B in mean HADS-A or HADS-D scores at baseline or during follow-up. However, after three months of follow-up there was a trend towards a reduction in the mean HADS–A score in group A compared to group B, resulting in a significant difference in mean change: -0.9 (-1.8, – 0.01) in group A versus 0.5 (-0.4 to 1.4) in group B, p = 0.02. Moreover, after 6 months of follow-up the HADS-D scores remained stable in group A, but tended to increase in group B, resulting in a significant difference in the variation of score mean during this period: 0.05 (-0.8,0.9) in group A versus 1.0 (0.3 – 1.8) in group B (p = 0.03) (Table 5). Significant improvements were also observed in the PSQI score of the both study groups but in group A the difference was statistically significant (p= 0.002) (Figure 1).

Table 5: Mean HADS score in the 2 groups before and after oryzalose.

GROUP A

GROUP B

HADS-A (WEEK 0)

6.5 (5.46 to 7.4)

6.0 (6.7 to 7.5)

HADS-D (WEEK 0)

6.1 (5.4 to 6.7)

6.0 (5.5 to 6.5)

HADS-A (WEEK 12)

6.3 (5.8 to 6.8)

6.2 (6.8 to 7.6)

HADS-D (WEEK 12)

5.9 (5.3 to 6.5)

6.0 (5.8 to 6.8)

HADS-A (WEEK 24)

6.0 (5.5 to 6.5)

6.3 (6.7 to 7.3)

HADS-D (WEEK 24)

5.7 (5.3 to 6.4)

6.2 (5.6 to 6.6)

fig 1

Figure 1: Mean PSQI score in the 2 groups.

Discussion

Rice bran oryzalose exerts immunomodulating effects, which include upregulation of natural killer (NK) cell activity, increase of phagocytic cell functions, modulation of cytokines production and promotion of T and B lymphocyte proliferation [22]. The remaining components that are resistant to digestion serve as prebiotics for the gut microbiota, which induces anti-inflammatory and immunomodulatory effects and influence behavioral changes across the gut-brain axis. Among the large number of natural agents derived from plants and employed in the integrative management of cancer patients, oryzalose is extremely promising, due to its effectiveness in improving the clinical status of patients [23-26]. QoL improvements (sleep, appetite, digestion, physical activity, anxiety and pain), as well as reduced adverse effects during cancer therapy, have been reported in several studies [27-35]. Supplementating with oryzalose (400 mg/die) for three months also significantly enhanced the QoL scores of healthy elderly adults in a randomized controlled trial [36]. Clinical research on the effects of oryzalose in cancer patients is still in its early stage [37-39], and most of the trials have several limitations, unclear risks of bias, non-validated QoL measurements [40,41]. Furthermore, none of these trials attempted to rule out the impact of placebo in QoL results. The gut microbiota is achieving increasing attention as a powerful regulator of quality of life, sleep and psychological outcomes in cancer patients; moreover, microbiome composition may be modulated by diet, exercise, behaviours, xenobiotics and probiotics [42-46]. Among the most studied and widely used probiotics, Lactobacillus plantarum is an excellent candidate for supplementation, due to its resistance to many classes of antibiotics and anti-inflammatory properties [47]. In this study, we aimed at assessing the effect of the prebiotic oryzalose in association with the probiotic Lactobacillum Plantarum in the management of cancer-related side effects and quality of life of breast cancer patients undergoing hormonal therapy. Several limitations of our study require consideration. First, we carried out this study in only two academic cancer center, in a sample of patients with limited racial and ethnic diversity; therefore, our findings cannot be generalized to other more heterogeneous populations. In addition, the short-term follow-up of the enrolled patients could be considered as another limitation of the study. On of the major strenghs of the study is the advanced age of the population enrolled (over 65), who are usually excluded from clinical trials, despite being the most affected by the disease, due to the complexity of clinical issues [48]. Despite this, our drop out rate and participants compliance to the protocol were excellent, showing high profiles of safety for the compound under investigation. The results of this feasibility trial will inform the planning of a larger clinical trial for definitive conclusions.

Conclusion

This study showed an excellent compliance to the protocol of treatment and, as preliminary results, improved quality of life in terms of physical functioning, pain, vitality and psychological well-being in elderly breast cancer patients in the treatment arm compared to placebo. Further similar studies with longer follow-up periods in breast cancer patients are warranted in order to explore the impact of symbiotics and other modulators of patients’ microbiome on cancer-related symptoms and quality of life, even in elderly populations due to the high adherence and safety profile of the prebiotic and probiotic treatment.

Conflict of Interest

The authors declare they have no competing interests.

References

  1. Britti MS, Roselli M, Finamore A, Merendino N, Mengheri E (2006) Regulation of immune response at intestinal and peripheral sites by probiotics. Biologia 61: 735-740.
  2. Francescone R, Hou V, Grivennikov, SI (2014) Microbiome, Infammation, and Cancer. Cancer J 20: 181-189. [crossref]
  3. Kwa M, Plottel CS, Blaser MJ, Adams S (2016) The Intestinal Microbiome and Estrogen Receptor-Positive Female Breast Cancer. J Natl Cancer Inst [crossref]
  4. Guo M, Liu T, Li P, Wang T, Zeng C, et al. (2019) Association Between Metabolic Syndrome and Breast Cancer Risk: An Updated Meta-Analysis of Follow-Up Studies. Front Oncol [crossref]
  5. Baker JM, Al-Nakkash L, Herbst-Kralovetz MM (2017) Estrogen-gut microbiome axis: Physiological and clinical implications. Maturitas 103: 45-53. [crossref]
  6. Valles-Colomer M, Falony G, Darzi Y, Tigchelaar EF, Wang J, et al. (2019) The neuroactive potential of the human gut microbiota in quality of life and depression. Nat Microbiol 4: 623-632. [crossref]
  7. Costantini L., Magno S., Albanese D, Claudio Donati, Romina Molinari, et al. (2018) Characterization of human breast tissue microbiota from core needle biopsies through the analysis of multi hypervariable 16S-rRNA gene regions. Scientifica Reports
  8. Katherine MH , James AF, Larry JF, Ursel MES, Daniel LB, et al. (2011) Characterization of the diversity and temporal stability of bacterial communities in human milk. PLos One [crossref]
  9. Raul CR, Carmen C, Kirsi L, Seppo S, Erika Isolauri, et al. (2012) The human milk microbiome changes over lactation and is shaped by maternal weight and mode of delivery. J. Clin. Nutr 96: 544-551. [crossref]
  10. Bhatt AP, Redinbo MR, Bultman SJ (2017) Te role of the microbiome in cancer development and therapy: Microbiome and Cancer. CA Cancer J. Clin 67: 326-344. [crossref]
  11. Gopalakrishnan V, Spencer CN, Nezi L, Reuben A, Andrews MC, et al. (2018) Gut microbiome modulates response to anti-PD-1 immunotherapy in melanoma patients. Science 359: 97-103. [crossref]
  12. Routy B, Le Chatelier E, Derosa L, Duong CPM, Alou MT, et al. (2018) Gut microbiome influences efficacy of PD-1-based immunotherapy against epithelial tumors. Science 359: 91-97. [crossref]
  13. Roy S, Trinchieri G (2017) Microbiota: a key orchestrator of cancer therapy. Nat Rev Cancer 17: 271-285. [crossref]
  14. McQuade JL, Daniel CR, Helmink BA, Wargo JA (2019) Modulating the microbiome to improve therapeutic response in cancer. Lancet Oncol
  15. Lissoni P, Messina G, Lissoni A, Franco R (2017) The psychoneuroendocrine-immunotherapy of cancer: Historical evolution and clinical results. J Res Med Sci [crossref]
  16. Lissoni P, Rovelli F (2012) Principles of psychoneuroendocrinoimmunotherapy of cancer.Immunotherapy 4:77-86. [crossref]
  17. Messina G, Lissoni P, Bartolacelli E, Magotti L, Clerici M, et al. (2010)Relationship between psychoncology and psychoneuroendocrinoimmunology (PNEI): enhanced T-regulatory lymphocyte activity in cancer patients with self-punishement, evaluated by Rorschach test. In Vivo, 24: 75-78. [crossref]
  18. McSorley ST, Dolan RD, Roxburgh CSD, McMillan DC, et al. (2017) How and why systemic inflammation worsens quality of life in patients with advanced cancer. Expert Rev Qual. Life Cancer Care 2: 167-175.
  19. Laird BJA, McMillan DC, Fayers P, Fearon K, Kaasa S, et al. (2013) The systemic inflammatory response and its relationship to pain and other symptoms in advanced cancer. Oncol 18: 1050-1055. [crossref]
  20. Liang OS, Pak SC, Micalos PS, Emily Schupfer , Rob Zielinski, et al. (2020) Rice brain arabinoxylan compound and quality of life of cancer patients: study protocol for a randomized pilot feasibility trial. Contemporary Clinical Trials Communications [crossref]
  21. Hays RD, Sherbourne CD, Mazel RM. (1993) The RAND 36-Item Health Survey 1.0. Health Econ 2: 217-227. [crossref]
  22. Mantovani A, Allavena P, Sica A, Balkwill F (2008) Cancer-related inflammation. Nature 454: 436-444.
  23. Hajtò T, Horvath l, Baranyai L, Kuzma M, Perjesi P (2016) Can the EGFR inhibitors increase the immunomodulatory effects of standardized plant extracts (mistletoe lectin and arabinoxylan) with clinical benefit? Case report of a patient with lung adenocarcinoma. Clin Case Rep Rev 2: 456-459.
  24. Meshitsuka KA (2013) case of stage IV hepatocellular carcinoma treated by KM900. Biobran and psychotherapy has presented significant good results. Pers Med Universe (Japanese Ed.) 1: 46-48.
  25. Elsaid AF, Fahmi RM, Shaheen M, Ghoneum M (2020) The enhancing effects of Biobran/ MGN – 3, an arabinoxylan rice bran, on healthy old adults’ health-related quality of life: a randomized, double-blind, placebo-controlled clinical trial. Life Res 29: 357-367. [crossref]
  26. Masood AI, Sheikh R, Anwer RA (2013) “BIOBRAN MGN-3”; Effect of reducing side effects of chemotherapy in breast cancer patients. Prof Med J 20: 13-16.
  27. Colotta F, Allavena P, Sica A, Garlanda C, Mantovani A (2009) Cancer-related inflammation, the seventh hallmark of cancer: links to genetic instability. Carcinogenesis 30: 1073-1081. [crossref]
  28. McAllister SS, Weinberg RA (2014) The tumour-induced systemic environment as a critical regulator of cancer progression and metastasis. Cell Biol 16: 717 -727. [crossref]
  29. Jaffer, R. G. Wade, T. (2010) Gourlay. Cytokines in the systemic inflammatory response syndrome: a review. HSR Proc. Intensive Care Cardiovasc. Anesth 2: 161 -175.
  30. Santos JC, Pyter LM (2018) Neuroimmunology of behavioral comorbidities associated with cancer and cancer treatments. Immunol 9. [crossref]
  31. Ghoneum M, Agrawal S (2011) Activation of human monocyte-derived dendritic cells in vitro by the biological response modifier arabinoxylan rice bran (MGN-3/Biobran). Int J Immunopathol Pharmacol 24: 941-948. [crossref]
  32. Ghoneum M, Gollapudi S (2003) Modified arabinoxylan rice bran (MGN – 3/ Biobran) sensitizes human T cell leukemia cells to death receptor (CD95)-induced apoptosis. Lett 201: 41-49. [crossref]
  33. Pérez Martínez A, Valentín J, Fernández J, Hernández-Jiménez E, López-Collazo E, et al. (2015) Arabinoxylan rice bran (MGN – 3/ Biobran) enhances natural killer cell-mediated cytotoxicity against neuroblastoma in vitro and in vivo. Cytotherapy 17: 601 -612. [crossref]
  34. Ghoneum M (2016) From bench to bedside: the growing use of arabinoxylan rice bran (MGN – 3/ Biobran) in cancer immunotherapy. Austin Immunol
  35. Mendis M, Leclerc E (2016) Simsek. Arabinoxylans, gut microbiota and immunity. Carbohydr Polym 139: 159 -166. [crossref]
  36. Ooi SL, McMullen SL, Golombick T, Pak SC (2018) Evidence-based review of BioBran/MGN-3 arabinoxylan compound as a complementary therapy for conventional cancer treatment. Canc. Ther 17: 165 -178. [crossref]
  37. Kawai T (2004) One case of a patient with umbilical metastasis of recurrent cancer (Sister Mary Joseph’s Nodule, SMJN) who has survived for a long time under immunomodulatory supplement therapy. Clin Pharmacol Ther 14: 281-288.
  38. Kaketani (2014) A case where an immunomodulatory food was effective in conservative therapy for progressive terminal pancreatic cancer. Pharmacol. Ther 14: 273-279.
  39. Okamura Y (2004) The clinical significance of modified arabinoxylan from rice bran (BioBran/ MGN – 3) in immunotherapy for cancer. Clin Pharmacol Ther 14: 289-294. [crossref]
  40. Markus J, Miller A, Smith M (2006) Orengo. Metastatic hemangiopericytoma of the skin treated with wide local excision and MGN – 3. Dermatol Surg 32: 145-147. [crossref]
  41. Hajto T, Baranyai L, Kirsch A, Kuzma M, Perjési P (2015) Can a synergistic activation of pattern recognition receptors by plant immunomodulators enhance the effect of oncologic therapy? Case report of a patient with uterus and ovary sarcoma , Case Rep. Rev 1: 235 -238.
  42. Adlercreutz H (1990) Western diet and Western diseases: Some hormonal and biochemical mechanisms and associations. Scand. J. Clin. Lab. Investig. Suppl 201: 3-23. [crossref]
  43. Keku TO, Dulal S, Deveaux A, Jovov B, Han X (2015) The gastrointestinal microbiota and colorectal cancer. Am J Physiol Gastrointest Liver Physiol [crossref]
  44. Turnbaugh PJ, Hamady M, Yatsunenko T, Cantarel BL, Duncan A, et al. (2009) A core gut microbiome in obese and lean twins. Nature 457: 480-484. [crossref]
  45. Mikó E, Kovács T, Sebő É, Tóth J, Csonka T, et al. (2019) Microbiome-Microbial Metabolome-Cancer Cell Interactions in Breast Cancer-Familiar, but Unexplored. Cells [crossref]
  46. Parida S, Sharma D (2019) The Microbiome-Estrogen Connection and Breast Cancer Risk. Cells [crossref]
  47. Petrovics, Szigeti G, Hamvas S, Máté A, Betlehem J, Hegyi G (2016) Controlled pilot study for cancer patients suffering from chronic fatigue syndrome due to chemotherapy treated with BioBran (MGN-3- Arabinoxylane) and targeted radiofrequency heat therapy. Eur J Integr Med 8: 29-35.
  48. Sedrak M, Freedman R, Cohen H, Muss H, et al. (2020) Older adult participation in cancer clinical trials: a systematic review of barriers and interventions. Ca Cancer J Clin 71.

Hypoadrenocorticism in a Kitten

DOI: 10.31038/IJVB.2021511

Abstract

This case describes how a 7-month-old, female, intact kitten was diagnosed with hypoadrenocorticism and fully recovered after treatment with fludrocortisone acetate. The cat showed signs of weight loss, severe weakness, and anorexia. Clinical findings included severe dehydration, lethargy, and moderate hypothermia. Blood examinations showed severe azotemia, hypernatremia, hypochloremia and hyperkalemia. Hypoadrenocorticism was diagnosed on the basis of low cortisol concentration during hospitalization. The cat had a full recovery after being treated with on daily dosage of fludrocortisone acetate and prednisolone; and is still well after one year. We believe this is the first case describing hypoadrenocorticism in a kitten younger than 12 months. This case demonstrates the success of fludrocortisone acetate as the treatment, using the level of cortisol concentration as an index; and that evaluating the cortisol concentration is a good method to monitor the change of hypoadrenocortism; and that hypoadrenocorticism could be reversed with a good treatment.

Keywords

Cortisol, Feline, Fludrocortisone acetate, Hypoadrenocorticism, Kitten

Introduction

Hypoadrenocorticism, also known as Addison’s disease (AD), is a severe or total deficiency of cortisone. AD is well-described in dogs. Its estimated prevalence is 0.3% to 1.1% [1] and is generally diagnosed at the age between 3 months and 14 years [2,3]. Confirmation of the AD diagnosis is often by ACTH stimulating test and its reading of the cortisol levels in blood [2,4-6]. However, testing the basal plasma cortisol level could be an easier, more reliable and less costly method than ACTH stimulating test [7]. AD is rarely reported in cats. Up to date, approximate 40 cases have been reported [8-18]. In cats, primary AD is less likely to be found, even rarer in cats younger than 12 months. The majority of patients are shorthair domestic cats [8,11,13]; and the onset age is between 1.5 to 14 years old (median 5 years old) [13]. There is no clear evidence showed the morbidity with sex, age and breeding in cats [5]. Some case reports showed that a few factors, such as corticosteroid or/and megestrol acetate withdrawal, neoplastic infiltration, immune-mediated problem, and trauma could contribute to primary or secondary AD [8,14,15,19].

Basically, an excellent outcome of AD can be achieved by using medicines, with a post-diagnosis life expectancy of up to 70 months [20]. There are two protocols to treat AD, using either the combination of methyprednisolone and DOCP or the combination of fludrocortisone acetate and prednisone/prednisolone [2,5,13]. Reports stated a consecutive treatment by using the second protocol can keep the cats alive over than one year without clinical signs [12,13,16,18]. The case aims to describe an AD occurred in a very young kitten and the good outcome after diagnosis and treatment as, based on the authors’ knowledge, no report has described AD in a kitten age under 1 year old.

Case Description

A 7 months old, female intact, and mixed breed shorthair cat was referred to a small animal clinic with a body weight of 1.6 kg and a body condition score of 3/9. The owner said the kitten showed progressive lethargy, unwilling to move, intermittent vomiting and diarrhea 3 weeks ago. The cat had no record of using exogenous steroid or mestrol acetate. After performing the physical examination (Day 0), the patient also showed clinical signs of progressive weight loss, hypothermia (36.5°C), anorexia, 10%-12% dehydration, and mucous membranes were pale and dry. Thoracic auscultation, abdomen palpation and neurological examination, blood pressure, heart rate, and respiratory rate were within normal range. The FIV/FeLV/FCoV (Speed Trio, Virbac) and the feline distemper kit (FPV Ag Test Kit, Bionote Anigen) displayed negative results.

Serum biochemistry revealed electrolyte abnormalities, severe azotaemia, and dehydration (Tables 1 and 2). Urinalysis showed isosthenuria (specific gravity 1.011), and mild proteinuria (1+). Abdominal radiography and ultrasonography returned no specific finding. Based on above findings, taking account of especially the values of electrolytes, this case could be either acute kidney injury (AKI) or AD.

On Day 0, the initial treatments included intravenous (IV) fluid therapy. The cat received 100 mL of 0.9% normal saline subcutaneously and 0.9% normal saline was administered at 120 mL/kg/day to correct the dehydration. Two mL of 10% calcium-gluconate IV and 1 IU of regular insulin SC were administered as a cardioprotective agents because of the severe hyperkalemia. To avoid hypoglycemia, 1 mL of 10% glucose was injected by IV slowly. 200 mg lanthanum carbonate was given twice daily PO for hyperphosphatemia. Eight hours later, the potassium concentration had become normal. After another injection of 1 mL of 10% glucose, the patient’s appetite, spirit started to improve at midnight, and its body temperature gradually returned to 38.4°C. On Day 1, the potassium concentration increased again. The order was the same as Day 0. On Day 2, the potassium and Inorganic phosphate returned to the normal range so cardioprotective agents and lanthanum carbonate were stopped. The kitten presented polyuria/polydipsia. The haematological results showed mild anemia. The BUN was slightly higher and the electrolytes (sodium and chloride) were slightly lower. The other biochemical values were normal. At this point, the kitten had been rescued from emergency situation.

Consequently, IV fluid was changed to 60 mL of 0.9% saline subcutaneous once daily, On Day 3, the owner asked the kitten to be discharged. We prescribed the same treatment as Day 2. One week later, on Day 10, the patient’s condition worsened again and was re-hospitalized. It showed anorexia, lethargy, and severe dehydration. Based on the previous data, we considered the possibility of a rare disease, Addisonian crisis. Haematological and biochemical findings showed mild non-regenerative anemia, severe azotemia, and electrolytes abnormal (Tables 1 and 2). The cat was administered 0.9% normal saline at 120 mL/kg/day and dosed 0.02 mg/kg fludrocortisone acetate and 0.5 mg/kg prednisolone oral once daily as mineralocorticoid and glucocorticoid supplements. On Day 15, the value of cortisol concentration (1.1 ug/dL) became lower than the reference value. On Day 26, the value of cortisol concentration came up to the normal range (2.7 ug/dL) so we decided to tapered and then stopped the oral drugs. On Day 332, the patient was spayed and its cortisol concentration was normal (2.7 ug/dL) (Table 3). The cat has been very well since its discharged a year ago.

Table 1: Serial monitoring of hematological parameters in the kitten.

Parameter

unit Day 0 Day 2 Day 8 Day15 Day21 Day 213

RI

RBC

M/μL

9.98 7.26 7.82 5.58 5.68

6.54-12.20

HCT

%

36.1 27.0 29.2 21.0 23.5 25.6

30.3-52.3

HGB

g/dL

13.3 11.4 10.3 7.6 7.7 8.8

9.8-16.2

MCV

fL

36.2 37.2 37.3 37.6 41.4 41.0

35.9-53.1

MCH

pg

13.3 15.7 13.2 13.6 13.6 14.1

11.8-17.3

MCHC

g/dL

36.8 42.2 35.3 36.2 32.8 34.4

28.1-35.8

RDW

%

29.0 24.9 29.9 25.5 33.8 22.4

15.0-27.0

RETIC

K/μL

3.0 2.9 25.8 4.5 67.6 5.6
RETIC-HGB

pg

15.7 14.8

3.0-50.0

WBC

K/μL

12.02 17.01 11.70 11.20 8.46 10.48

2.87-17.02

NEU

K/μL

9.65 12.49 10.16 7.38 4.92 5.34

1.48-10.29

LYM

K/μL

1.98 3.38 0.92 3.03 2.26 3.14

0.92-6.88

MONO

K/μL

0.31 0.29 0.54 0.33 0.70 0.25

0.05-0.57

EOS

K/μL

0.01 0.27 0.00 0.35 0.44 1.67

0.17-1.57

BASO

K/μL

0.07 0.58 0.08 0.11 0.14 0.08

0.01-0.26

PLT

K/μL

574 272 813 285 994 275

151-600

MPV

fL

18.2 17.8 16.7 16.9 16.2 17.6

11.4-21.6

RBC: Red Blood Cell; HCT: Haematocrit; HGB: Hemoglobin; MCV: Mean Cell Volume; MCH: Mean Cell Hemoglobin; MCHC: Mean Corpuscular Hemoglobin Concentration; RDW: Red Cell Distribution Width; RETIC: Reticulocyte; RETIC-HGB: Reticulocyte Hemoglobin; WBC: White Blood Cell; NEU: Neutrophil; LYM: Lymphocyte; MONO: Monocyte; EOS: Eosinophil; BASO: Basophil; PLT: Platelet; MPV: Mean Platelet Volume.

Table 2: Serial monitoring of the serum biochemistry in the kitten.

parameter

Unit initial 8 h Day 1 Day 2 Day 3 Day 10 Day 13 Day 17 Day 21 Day 22 Day 23 Day 24 Day 25 Day 26 Day 213

RI

Glucose

mg/dL

227 44 141 156 161 148 116 74-159
Total protein

g/dL

10.3 8.1 10.2 7.2 7.9 7.2 7.5 6.7 7.5 7.2

5.7-8.9

Albumin

g/dL

4.1 3.8 4.5 3.4 3.2

2.2-4.0

BUN

mg/dL

>130 62 40 110 42 37 42 30 28 26 31 41

16-36

Creatinine

mg/dL

Over 1.9 1.7 Over 1.5 1.5 2.5 1.9 1.9 2.2 1.9 3.3

0.8-2.4

ALT

U/L

13 80 22 25

12-130

ALP

U/L

17 25 18

14-111

Inorganic phosphorus

mg/dL

14.0 6.3 5.4 >16.1 6.0 5.4 6.8

3.1-7.5

Calcium

mg/dL

10.9 10.0

7.8-11.3

Potassium

mmol/L

8.1 4.7 7.1 4.4 4.3 7.5 4.3 3.5 4.4 4.1 4.4 4.1 4.0 5.3 4.7

3.5-5.8

Sodium

mmol/L

133 140 143 148 146 132 160 160 153 154 156 154 155 162 158

150-165

Sodium

/potassium

16 30 20 34 34 18 37 45 35 38 35 37 39 31 34
Chlorine

mmol/L

98 106 108 109 111 100 123 120 117 117 119 119 116 118 127

112-129

BUN: Blood Urea Nitrogen; ALT: Alanine Aminotransferase; ALKP: Alkaline Phosphatase.

Table 3: Serial monitoring of the serum cortisol concentration.

parameter

unit Day 15 Day 26 Day 332 RI
cortisol μg/dL 1.1 2.7 2.7

1.7-4.2

Discussion

We believe this is the first report case of AD in an intact kitten younger than 1 years old. A report stated that the disease all occurred in neutered adults cats over than 1 years old and the mean age was 5.8±3.7 and the range was between 1.5 and 14 [13]. Some researchers have stated that this disease can occur in 1 years old, neutered cats [10], in 3-6 years old cats [12,16,18] and in cats older than 8 years old [14,15,21,22]. Our study advances the knowledge that AD can occur in an intact kitten younger than 1 year old.

Whether to stop fludrocortisone acetate after the clinical signs have disappeared has been a controversial issue. Some researchers believe treatment of AD is lifelong because it cannot be reversed [2,12,16,18,23]. A report mentioned that a cat suffered from AD again after the treatment was changed from twice daily to once daily [12]. In fact, the decision of prescribing a consecutive treatment is based on how good the clinical signs and electrolyte are [2,18,23]. One case pointed out the cortisol concentration became to normal 40 days after the AD treatment by using prednisolone was stopped [21]. We believe to use fludrocortisone acetate could achieve the same result as the last case based on the change of the basal cortisol concentration in our case during the treatment. After Day 26, the cortisol concentration and other biochemical values have been normal. Treatment on the kitten stopped after Day 26. On Day 332, the cortisol concentration was still normal, indicating that the kitten had recovered from Addisonian crisis. The mechanism behind the kitten’s recovery from AD is unknown.

In conclusion, this is the first case which describes AD in a kitten younger than 12 months old. Secondly, the case shows that evaluating the values of cortisol concentration is a good method to monitor the change of AD. Thirdly, fludrocortisone acetate is also a good method to treat AD. And finally, AD could be reversed after a good treatment.

Acknowledgement

We thank Dr. Pingchih Teng for his kindly suggestions during we wrote this report.

References

  1. Bellumori TP, Famula TR, Bannasch DL, Belanger JM, Oberbauer AM (2013) Prevalence of inherited disorders among mixed-breed and purebred dogs: 27,254 cases (1995–2010). Journal of the American Veterinary Medical Association 242: 1549-1555. [crossref]
  2. Greco DS (2007) Hypoadrenocorticism in small animals. Clinical Techniques in Small Animal Practice 22: 32-35. [crossref]
  3. Peterson ME, Kintzer PP, Kass PH (1996) Pretreatment clinical and laboratory findings in dogs with hypoadrenocorticism: 225 cases (1979-1993). Journal-American Veterinary Medical Association 208: 85-91. [crossref]
  4. Boag AM, Catchpole B (2014) A review of the genetics of hypoadrenocorticism. Topics in Companion Animal Medicine 29: 96-101. [crossref]
  5. Duesberg C, Peterson ME (1997) Adrenal disorders in cats. Veterinary Clinics of North America: Small Animal Practice 27: 321-347. [crossref]
  6. Van Lanen K, Sande A (2014) Canine hypoadrenocorticism: pathogenesis, diagnosis, and treatment. Topics in Companion Animal Medicine 29: 88-95. [crossref]
  7. Lennon EM, Boyle TE, Hutchins RG, Friedenthal A, Correa MT et al. (2007) Use of basal serum or plasma cortisol concentrations to rule out a diagnosis of hypoadrenocorticism in dogs: 123 cases (2000–2005). Journal of the American Veterinary Medical Association 231: 413-416. [crossref]
  8. Berger SL, Reed JR (1993) Traumatically induced hypoadrenocorticism in a cat. Journal of the American Animal Hospital Association 29: 337-339.
  9. Brain PH (1997) Trauma-induced hypoadrenocorticism in a cat. Australian Veterinary Practitioner 27: 178-181.
  10. Hock CE (2011) Atypical hypoadrenocorticism in a Birman cat. The Canadian Veterinary Journal 52: 893-896. [crossref]
  11. Johnessee JS, Peterson ME, Gilbertson SR (1983) Primary hypoadrenocorticism in a cat. Journal of the American Veterinary Medical Association 183: 881-882.
  12. Kasabalis D, Bodina E, Saridomichelakis MN (2012) Severe hypoglycaemia in a cat with primary hypoadrenocorticism. Journal of Feline Medicine and Surgery 14: 755-758. [crossref]
  13. Peterson ME, Greco DS, Orth DN (1989) Primary hypoadrenocorticism in ten cats. Journal of Veterinary Internal Medicine 3: 55-58. [crossref]
  14. Romine JF, Kozicki AR, Elie MS (2016) Primary adrenal lymphoma causing hypoaldosteronism in a cat. Journal of Feline Medicine and Surgery Open Reports 2: 2055116916684409. [crossref]
  15. Rudinsky AJ, Clark ES, Russell DS, Gilor C (2015) Adrenal insufficiency secondary to lymphocytic panhypophysitis in a cat. Australian veterinary journal 93: 327-331. [crossref]
  16. Sicken J, Neiger R (2013) Addisonian crisis and severe acidosis in a cat: a case of feline hypoadrenocorticism. Journal of Feline Medicine and Surgery 15: 941-944. [crossref]
  17. Tasker S, MacKay AD, Sparkes AH (1999) A case of feline primary hypoadrenocorticism. Journal of Feline Medicine and Surgery 1: 257-260. [crossref]
  18. Woolcock AD, Ward C (2015) Successful treatment of a cat with primary hypoadrenocorticism and severe hyponatremia with desoxycorticosterone pivalate (DOCP). The Canadian Veterinary Journal 56: 1158-1160. [crossref]
  19. Chastain CB, Graham CL, Nichols CE (1981) Adrenocortical suppression in cats given megestrol acetate. American Journal of Veterinary Research 42: 2029-2035. [crossref]
  20. Myers N C, Bruyette DS (1994) Feline adrenocortical diseases: II. Hypoadrenocorticism. In Seminars in Veterinary Medicine and Surgery (Small Animal) 9:144-147. [crossref]
  21. Smith SA, Freeman LC, Bagladi-Swanson M (2002) Hypercalcemia due to iatrogenic secondary hypoadrenocorticism and diabetes mellitus in a cat. Journal of the American Animal Hospital Association 38: 41-44. [crossref]
  22. Stonehewer J, Tasker S (2001) Hypoadrenocorticism in a cat. Journal of Small Animal Practice 42: 186-190. [crossref]
  23. Meeking S (2007) Treatment of acute adrenal insufficiency. Clinical Techniques in Small Animal Practice 22: 36-39.