DOI: 10.31038/PEP.2021212
Abstract
Background: Due to the delayed communication by Chinese authorities and International bodies, it is difficult to settle when COVID-19 pandemic has started. Italy has been the first country outside Asia to experience the spreading of SARS-CoV-2 among general population, but it is possible that some patients had already developed the infection, before the first Italian official case was confirmed at the end of February.
Methods: We have performed a specific analysis from 1st August 2019 to 29th February 2020 on Google Trends, which is a publicly available tool that compares the volume of Internet searches concerning specific queries in different areas and periods. The analysis was retrospectively extended up to 5-years in order to study the seasonality of Google Trends’ search volumes in relation to potential COVID-19 symptoms.
Results: Our analyses concerning researchers on the Internet support the evidence that the outbreak onset in Italy could be set some weeks before the first confirmed case, maybe before flights closure between Italy and China imposed at the end of January 2020.
Conclusions: Internet-acquired data might represent a preliminary real-time surveillance and alert tool for healthcare systems to plan the most appropriate responses in case of health emergency such as COVID-19 pandemic.
Keywords
COVID-19; Symptoms; Internet; Web; Searches; Google trends
Introduction
The huge amount of searches run through Google creates trends data that can be analyzed by a specific function named “Google Trends” (GT), a publicly available tool that compares the volume of Internet searches concerning specific queries in different areas and periods [1]. Individuals affected by any clinical condition frequently use search engines, such as Google, to look for terms related to their diseases, possible causes and symptoms [2]. In this view, Google Trends can provide indirect approximations of the burden and symptoms of several diseases, so that they have been used for preliminary epidemiological surveillance purposes [2]. Google Trends can integrate and lead up to traditional surveillance systems in early stage detection of seasonal or annual outbreaks of infectious (i.e. influenza, scarlet fever, HIV) and non-infectious (i.e. cancer, epilepsy) diseases, presenting specific search patterns in different parts of the world [2].
Google Trends had positively been associated with the disease prevalence in many COVID-19 studies [3]. Accordingly, researchers hypothesized that this kind of “digital epidemiology” could come up with valuable insights into the spread of viral infections. We have specifically applied this methodology to evaluate the onset of COVID-19 outbreak in Italy, the first country in Europe to experience the spreading of coronavirus SARS-COV2. Italy was also the first country to impose a nationwide lockdown since Wuhan outbreak (February, 2020). Several clinical and epidemiological studies have been presented on the prevalence of COVID-19, but it is possible that some patients had already developed the infection although it was not specifically diagnosed before the first official case, confirmed in Italy at the end of Febraury [4]. Overall, the coronavirus activity has been associated with specific seasonal patterns in relation to other viral diseases such as influenza [3]. The aim of this work was to predict, through Google Trends, the amount of searches referring to COVID-19 related symptoms in Italian population that can be inferred from Internet-based searching before the first COVID-19 confirmed case in an Italian native patient.
Materials and Methods
We have used the publicly available tool “Google Trends” to determine the amount of searches concerning COVID-19 related symptoms from March 2015 to August 2020 performed by Italian users of Google engine. Search queries were ranged simultaneously into three blocks (most common, less common and severe) as listed by WHO [5]. The search was performed in Italian language to take into account only data belonging to people living in Italy. The first block was related to ‘most common symptoms’ and included: fever (in Italian: ’febbre’), tiredness (in italian: ’spossatezza’), and dry cough (in italian: ’tossesecca’). The second block concerned ‘less common symptoms’ corresponding to: rash(in italian: ’eruzione cutanea’), taste (in italian: ’gusto’), headache (in italian: ’mal di testa’), sore throat (in italian: ’mal di gola’), smell (in italian: ’olfatto’). The third block concerning ‘severe symptoms’ included: loss of voice (in italian: ‘afasia’), chest pain (in italian: ’dolore al petto’), muscles pain (in italian: ’dolori muscolari’), shortness of breath (in italian: ’fiatocorto’) [5,6].
Google Trends tool uses a fraction of searches for a specific term (‘keyword’ or ‘search term’) and automatically standardizes the data for the total number of searches gradually presenting them as comparative search volumes (ranging from 0 to 100), in order to compare variations of different search terms across time series and queries (topics in which the word was searched) [2]. Search volumes about COVID-19 symptoms were extracted from July 2015 to August 2020. The selection of the retrospective 5-years did not represent a random selection as it is bound by the extraction limits of the GT tool. Indeed, trends for periods equal or less than 5 years, are collected by days. This method allows for greater evidence than the monthly-based analysis. Scores, recorded per each day, are based on the absolute search volume for each term and day, being related to the absolute search volume on Google on the same day. Subsequently, GT was adjusted for the annual rate variation (provided by Italian Institute for Statistics, ISTAT) for the age groups showing the highest probability to use Internet (14-74 years old). Thus, for statistical purposes, the terms were aggregated by mean estimator to assess researches concerning COVID-19 ‘most common’, ‘less common’, and ‘severe’ symptoms performed by Italian Internet users.
The study includes three statistical analyses:
- Main Analysis: the primary objective was to assess the amount of searches referring to COVID-19 related symptoms that can be present in Italian population before the first COVID-19 officially confirmed case in Italy;
- Exploratory analysis: the objective was to assess the peak of terms related to COVID-19 symptoms during the pandemic period;
- Adherence analysis: the objective was to assess the extent to which the Internet user’s research behavior corresponded to Google trends queries related to the COVID-19 symptoms.
Main Analysis
As main analysis, an interrupted time series analysis (ITS) was used to examine the effect of coronavirus on Google searches for terms describing symptoms potentially related to COVID-19. Google Trends data were seasonally adjusted and analyzed by using auto-regressive integrated moving average (ARIMA) modelling. The implementation of the exposition was very clear with a ban on searches of symptoms terms throughout Italy across six months from August 2019 (estimated time when the virus was circulating yet) to February 2020 (the month before the first COVID-19 confirmed case in Italy, which actually occurred at the end of February) . As “control group”, we used Internet-based searches that presented the same characteristics of the exposures during continuous period (from March 2015 to July 2019), in order to evaluate the trend changes to the breaking point (F-value test). A model stratified by calendar months was adopted to control seasonality effects. The method includes a bootstrap model by default, which runs 250 replications of the main model with randomly drawn samples. A trimmed mean F-value (10 percent removed) is reported and a boot strapped p-value was derived from it. As exploratory analysis, a generalized linear models (GLM) was adapted to assess the trend peaks of epidemics.
Exploratory Analysis
The exploratory analysis was performed to study the seasonality of Google Trends’ search volume in Italy about potential COVID-19 from August 2019 to August 2020, and evaluate possible differences in relative search volumes for ‘most common’, ‘less common’ and ‘severe’ symptoms across different months, adjusted by years and during the last year since the pandemic. According to the date of the first infected with COVID-19 in Wuhan, the month of December 2019 was considered as reference month. The results were presented as rate ratio and 95% confidence intervals (CIs). Finally, cycle plots were built to show the GLM results and their monthly trends. The vertical positions of the inserted subseries plots indicate the average searches per month. The subseries plot was made up considering monthly trends fit of the y-variable (response variable) and its confidence band; the horizontal axis shows the mean y-value over the considered time interval.
Adherence Analysis
An adherence score, stratified by symptoms’ type, was provided to describe the degree to which Internet users correctly searched terms matching the study topic. The score was computed as the total of the queries that met the study objective on the total of the queries for each type of symptoms (ex: researches related to the ‘superenalotto’ topic are considered not adhering to the objective of the study).
SAS and R studio software have been used for data processing and statistical analyses. Results have been considered statistically significant if p<0.05.
Results
The results are presented in three sub-sections (Most common symptoms, Less common symptoms, Serious symptoms). Then the main analysis and the exploratory analysis are described for each category of symptoms:
Most Common Symptoms
The ‘most common’ symptoms had a positive and significant variation in the exposure group (Internet users’ searches from 1st August 2019 to 29th February 2020) than the control group (p<0.001; F-value=1.69). The Google Trends plot of key terms from February 2018 to April 2019 versus search volumes from February 2019 to April 2020 showed how the interest was considerably higher during the COVID-19 pandemic compared to the peak of previous annual flu outbreak (Figure 2A).
The exploratory analysis (under α=0.05)–performed using as reference the month of December, 2019 adjusted by year–showed a significant increased probability from 2019 to 2020 concerning the search volumes in January 2020 (p=0.018;OR=1.67; CI=1.09-2.55), February 2020 (p=0.003;OR=1.91; CI=1.26-2.91), March 2020 (p=0.002; OR=1.96, CI=1.29-2.99), June 2020 (p=0.007; OR=1.78; CI=1.68-2.71) and July 2020(p=0.008; OR=1.75; CI=1.15-2.67), and confirmed the peak between the end of February 2020 and the beginning of March 2020 (Figure 1A).
Less Common Symptoms
The ‘less common’ symptoms showed a positive and significant variation in the exposure group (users research from 1st August 2019 to 29th February 2020) than the control group (p<0.001; F-value=1.63). The Google Trends plot of key terms from February 2018 to April 2019 versus search volumes from February 2019 to April 2020 showed how the interest was considerably higher during the COVID-19 pandemic compared to the peak of previous year flu outbreak (Figure 2B).
The exploratory analysis (under α=0.05)-performed using as reference the month of December 2019 adjusted by year-showed a significant decreasing probability from 2019 to 2020 concerning the search volumes in January 2020(p=0.005; OR=0.62; CI=0.39-1.00), April 2020 (p=0.034; OR=0.60; CI=0.37-0.96), May 2020 (p=<0.001; OR=0.38; CI=0.22-0.65), June 2020 (p=<0.001; OR=0.32, CI=0.19-0.56) and July 2020 (p=<0.001; OR=0.34; CI=0.19-0.58) and reported the peak between the end of February and the beginning of March 2020 (Figure 1B).
Severe Symptoms
The ‘severe’ symptoms showed a positive and significant variation in the exposure group (Internet users’ searches from August 2019 to February2 020) than the control group (p<0.001; F-value=0.54). The Google Trends plot of key terms from February 2018 to April 2019 versus search volumes from February 2019 to April 2020 showed how the interest was considerably higher during the COVID-19 pandemic compared to the peak of previous year flu outbreak (Figure 2C).
The exploratory analysis (under α=0.05) performed using as reference month December 2019adjusted by year, showed a significant increased probability from 2019 to 2020 concerning the search volumes in February (p=0.048; OR=1.34; CI=1.00-1.78), March 2020(p=<0.001; OR=1.82, CI=1.31-1.54) and April 2020 (p=0.018; OR=1.42; CI=1.06-1.91) and reported the peak between the end of February 2020 and the beginning of March 2020 (Figure 1C).
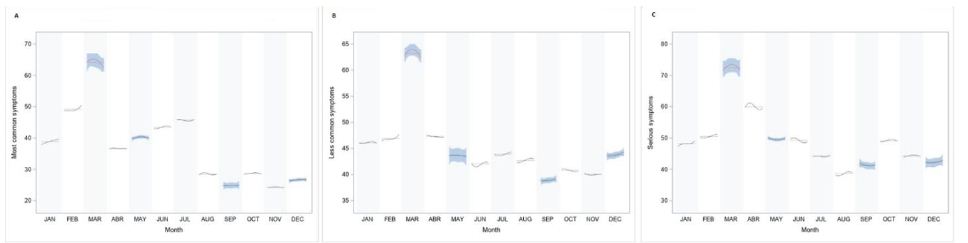
Figure 1: Cycle plot by monthly average GT search for Most common symptoms (A), Less common symptoms (B) and Serious symptoms (C). *Subseries shows the spline fit of search terms in each month.
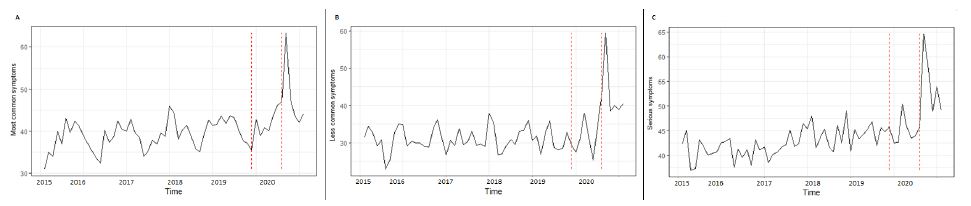
Figure 2: Interrupted time series of GT search for Most common symptoms (A), Less common symptoms (B) and Serious symptoms (C).
Discussion
In the last decade, growing evidence has been made available that Google Trends analyses may be a reliable tool for providing estimates of awareness about many diseases and treatments, which are parallel to real-world epidemiology of diseases and drug use data. This study is the first analysis concerning web search behaviours related to the coronavirus outbreak, both in quantitative and qualitative terms, aimed at assessing the time of COVID-19 onset in Italy. Additional objective of the study was to evaluate and possibly validate the epidemiological reliability of Google Trends in different non-clinical settings, for less common, most common and severe symptoms attributable to COVID-19.
Our findings confirmed how the virus may have been spreading in Italy some weeks before the first Italian native case was officially detected. Indeed, the GT symptom terms potentially related to COVID-19 (based on 250 bootstrap simulations) increased significantly in the exposure group (searches performed from 1st August 2019 to 29th February 2020) compared to the control group (users’ trends of the 5-year time series). Moreover, Google Trends for ‘less common’ ‘and ‘most common’ symptoms presented higher significant association (F-value=1.68 and 1.63, respectively) than severe symptoms (F-value=0.58) considering the exposures as reference group (August 2019 to February 2020). The reasons of these differences could be explained by the fact that ‘common’ terms (such as ‘less’ and ‘most’) considered in this analysis represent a kind of basic noisy as they are very similar to flu-like symptoms than terms used in searches concerning severe ones (such as loss of voice, chest pain, muscles pain and shortness of breath). It is also possible that the virus was initially carried by one or more people with negligible symptoms (mostly related to ‘most common’ and ‘less common’ GT term symptoms) some weeks before the outbreak.
The exploratory analysis of the results reinforces the thesis that the virus could be present in Italy several weeks before the lockdown (March 5th 2020): the ‘less common’ symptoms are more significant in the month of December 2019 than March 2020, which appears to be the peak of the pandemic (Figure 1). As highlighted in other studies [7,8], the ‘less common’ symptoms, such as loss of taste and loss of smell, are the most frequent clinical symptoms (about 90% of cases) in COVID-19 patients. Very recently, a young football player living nearby Lodi (the city where the first official Italian native case was coming from) has been proposed as the possible first documented case, as he showed SARS-COV-2 antibodies (identified on subsequent serum analyses) and severe COVID-related symptoms requiring admission to Intensive Care Unit at the beginning of February 2020, namely three weeks before the hospital admission of the first official Italian native case.
Furthermore, the temporal distribution of web-data seems consistent with the clinical trend of the pandemic: relative search volumes for ‘less common’ (Figure 2A), ‘most common’ (Figure 2B) and ‘severe’ symptoms (Figure 2C) in the period 2019-2020 were positively associated and presented a similar monthly sinusoidal pattern as previously shown in clinical studies evaluating the COVID-19 spread in Italy [9]. This was in line with the trend of hospitalizations in Italy recorded in the same months [9]. Also the spreading of the coronavirus by number of infections in the months of June, July and August 2020 is estimated to be higher than December 2019 (Figure 1B).
Nevertheless, our study has some limitations: the main one is that search volumes of Google Trends are frequently found to be increased in case of conditions with large media coverage or, at least, during periods characterized by a higher burden of disease, so that they are gaining attractivity in surveillance studies on several epidemiologically relevant diseases [10]. This is the case, for example, of coronavirus symptoms, which were the focus of large media coverage in the last months. Another limitation could be that search trends might be produced by people other than patients with COVID-19, who are nevertheless interested about this topic. Furthermore, available data are clearly limited to Google users, and are related to the possibility to use a computer with Internet access, as well as by computer literacy and skills. Therefore, a non-representative sampling bias might have occurred due to different factors, such as age, disability, income or preferred search engine [11]. To overcome this problem, the adherence analysis confirms the consistency between the terms analyzed in the study and the topics related to Covid-19. Google Trends queries related to the terms analyzed during the exposure period were highly adherent to the objective of the study (Table 1: ‘most common’ score=91.9; ‘less common’ score=82.4; ‘severe’ score=91.9). Despite this, in some cases, search biases may be found such as in the case of fever, sore throat, headache, loss of smell or taste and loss of voice (Table 1).
Table 1: Adherence scores of Google trends queries by types and terms related to COVID-19 symptoms during the exposure period (August 2019 to February 2020).
|
Type |
Term | Query* | Query Rate | StudyObjective | Adherence Score |
| Most Common |
Fever |
Influenza 2020 sintomi |
High | Yes |
91,9% |
|
Influenza 2020 durata |
High | Yes | |||
| Codici superenalotto la febbre del sabato sera | High |
No |
|||
|
Influenza senz afebbre 2020 |
High | Yes | |||
| Dopo quanto tempo fa effetto la tachipirina | High |
Yes |
|||
|
Tiredness |
spossatezza cause |
60% |
Yes |
||
|
Drycough |
Selentus sciroppo tosse secca |
High | Yes | ||
|
Sedativo tossesecca |
130% |
Yes |
|||
|
Tossesecca e grassa |
90% | Yes | |||
| Aereosoltossesecca | 70% |
Yes |
|||
|
Sciroppo per tossesecca |
60% |
Yes |
|||
|
Less Common |
Rashon skin |
Eruzionecutanea o rash | High |
Yes |
82,4% |
|
Taste |
Perditaolfatto e gusto | 100% |
Yes |
||
|
Hedache |
Mal di testa elodie |
High | No | ||
| Mal di testa pre ciclo | High |
Yes |
|||
| Mal di testa tutti i giorni | 160% |
Yes |
|||
|
Tachipirina 1000 |
130% | Yes | |||
| Svegliarsi con il mal di testa | 130% |
Yes |
|||
|
Sore throat |
Nenuco mal di gola |
High | No | ||
| Okitask | High |
Yes |
|||
|
Rimedio naturale mal di gola |
180% |
Yes |
|||
|
Rimedi naturali per il mal di gola |
110% | Yes | |||
| Mal di gola e raffreddore | 100% |
Yes |
|||
|
Smell |
Smell |
100% | Yes | ||
| Olfatto | 86% |
Yes |
|||
| Smelltraduzione | 19% |
No |
|||
|
Perditaolfatto |
8% | Yes | |||
| Olfattocane | 5% |
Yes |
|||
|
Severe |
Lossofspeach |
Afasiasinonimo |
High |
No |
91,9% |
| Afaisa primaria progressiva | 200% |
Yes |
|||
|
Afasia motoria |
180% |
Yes |
|||
|
Chestpain |
Dolore in mezzo al petto |
130% | Yes | ||
| Dolere al petto cause | 60% |
Yes |
|||
|
Dolore petto e schiena |
40% |
Yes |
|||
|
Muscules pain |
Tachipirina dolori muscolari | 70% |
Yes |
||
|
Shortnessofbreath |
Fiato corto cause |
100% | Yes | ||
| Fiato corto e tosse | 83% |
Yes |
|||
| Fiato corto cuore | 65% |
Yes |
Conclusions
This study provides additional evidence for seasonality of COVID-19 by using Google Trends. In light of our results, we have proposed a method for the right use of Google Trends to predict the pandemic’s trend. This method can serve as a baseline standard to ensure methodological understanding and reproducibility for researchers who choose to use the tool in the future for other countries or regions. In fact, a future approach could be to compare the results between countries or regions and investigate possible correlations with environmental conditions [11]. Internet-acquired data might represent a preliminary real-time surveillance tool and an alert for the care systems to plan the most appropriate resources in specific periods in case of health emergency such as epidemics or pandemics [2]. However, our results support the evidence that the beginning of the outbreak in Italy were probably seeded weeks before the first detection and possibly before the first COVID-19 patient detected and also before the flights closure between Italy and China were suspended at the end of January 2020. As a future perspective, COVID-19 related to Google Trends might be validated with external clinical data sets.
Author Contributions
Conceptualization, A.F. and P.P.; methodology, A.F.; software, A.F.; validation, P.A., P.P. and M.C.; formal analysis, A.F.; investigation, A.F.; resources, A.M.; data curation, P.P.; writing—original draft preparation, A.F and P.P.; writing—review and editing, G.I.; visualization, P.A.; supervision, A.M.; project administration, A.M.; All authors have read and agreed to the published version of the manuscript.
Funding
This research received no external funding.
Conflicts of Interest
The authors declare no conflict of interest.
References
- Nuti SV, Wayda B, Ranasinghe I (2014) The use of Google Trends in health care research: a systematic review. PLoS ONE, e109583. [crossref]
- Freyer Dugas A, Jalalpour M, Gel Y (2013) Influenza Forecasting With Google Flu Trends. PLoS ONE, [crossref]
- Walker A, Hopkins C, Surda P (2020) Use of Google Trends to investigate loss-of-smell-related searches during the COVID-19 outbreak2020. Int Forum Allergy Rhinol 839-847. [crossref]
- Porcheddu R, Rubino S (2020) Similarity in Case Fatality Rates (CFR) of COVID-19/SARS-COV-2 in Italy and China. J Infect Dev Ctries 125-128. [crossref]
- Guo Y, Yan Y (2020) The Origin, Transmission and Clinical Therapies on Coronavirus Disease 2019 (COVID-19) Outbreak – An Update on the Status. Mil Med Res [crossref]
- Ciaffi J, Meliconi R (2020) Google trends and COVID-19 in Italy: could we brace for impact?. Intern Emerg Med 1-5.
- Lopez J, Cummins S (2018) The use of controls in interrupted time series studies of public health interventions. Int J Epidemiol 2082-2093. [crossref]
- Lee Y, Min P (2020) Prevalence and Duration of Acute Loss of Smell or Taste in COVID-19 Patients. J Korean Med Sci, e174. [crossref]
- Distante C, Piscitelli P, Miani A (2020) Covid-19 Outbreak Progression in Italian Regions: Approaching the Peak by the End of March in Northern Italy and First Week of April in Southern Italy. Int J Environ Res Public Health [crossref]
- Nuti , S.V, Wayda B, Ranasinghe I (2013) The Use of Google Trends in Health Care Research: A Systematic Review. PLoS ONE, e109583. [crossref]
- Setti L, Passarini F (2020) Searching for SARS-COV-2 on Particulate Matter: A Possible Early Indicator of COVID-19 Epidemic Recurrence. Int J Environ Res Public Health 2986. [crossref]