Abstract
Background: Knee osteoarthritis (KOA) is a leading cause of disability in older adults, with impaired walking ability significantly affecting independence and quality of life. Maintaining mobility is therefore a key therapeutic goal, particularly in patients awaiting total knee arthroplasty or managed conservatively. However, responses to standard non-invasive rehabilitation are often heterogeneous, highlighting the need for adjunctive therapeutic strategies.
Methods: Forty patients with KOA were recruited and randomly assigned to either a control group receiving standard rehabilitation or an experimental group receiving standard rehabilitation supplemented with double-coil repetitive peripheral magnetic stimulation (rPMS). Pain intensity, functional mobility outcomes, and knee range of motion were evaluated.
Results: Significant between-group differences in favor of the experimental group were observed for pain intensity, Timed Up and Go (TUG), and stair climb test (SCT) (p < 0.05), with the largest effect seen in pain reduction. Improvements in other outcomes consistently favored the experimental group. Responder analysis showed higher rates of clinically meaningful improvement in the experimental group.
Conclusions: This pilot study suggests that double-coil rPMS may contribute to pain reduction and improved mobility in patients with knee osteoarthritis, particularly in short-duration functional performance. Future studies should confirm these findings in larger populations and further investigate the comparative effectiveness of double-coil and single-coil rPMS approaches.
Keywords
Repetitive peripheral magnetic stimulation, Knee osteoarthritis, Total knee arthroplasty
Introduction
Osteoarthritis (OA) is a leading cause of disability in older adults, and its prevalence is expected to increase further due to population aging and rising obesity rates. The knee is the most commonly affected joint, followed by the hand and hip [1]. In addition to age and body weight, other important risk factors for knee osteoarthritis (KOA) include a history of joint injury and high bone mineral density [2]. Interestingly, unlike hip OA, the prevalence of KOA in women is strongly associated with postmenopausal age, particularly between 50 and 75 years [2]. The condition is characterized by chronic pain, reduced joint function, and progressive limitations in activities of daily living [1,2].
Impaired walking ability is one of the most clinically relevant consequences of KOA and has been associated with reduced quality of life and functional capacity compared to healthy individuals [3]. Maintaining mobility is therefore a key therapeutic goal, particularly in patients awaiting total knee arthroplasty or those managed conservatively in earlier stages of the disease. In older adults especially, the ability to walk with reduced pain and sufficient functional capacity is essential for preserving autonomy and preventing further physical decline [4].
Exercise-based, non-invasive rehabilitation is recommended as a core component of KOA management and has been shown to improve pain and function [5]. However, responses to rehabilitation are often heterogeneous, with considerable variability in outcomes and overall effects typically ranging from small to moderate [6,7]. This variability may reflect the presence of distinct patient subgroups and insufficient targeting of interventions, suggesting that current approaches may not fully address the complexity of knee joint dysfunction [8]. Additionally, treatment adherence can be limited by pain and related factors such as fear of movement, which may reduce patients’ ability to fully engage in exercise programs and contribute to inconsistent treatment effects [9-11]. These limitations highlight the need for adjunctive therapeutic strategies that are less dependent on active patient participation.
Repetitive peripheral magnetic stimulation (rPMS) is an emerging neuromodulatory technique that has been widely used in the management of spasticity and functional impairment in neurological conditions. However, its application in musculoskeletal disorders, including KOA, remains insufficiently explored [12,13]. Recently, a novel double-coil configuration with an adjustable angle between coils has been introduced, allowing improved adaptation to the treatment area, particularly in large joints such as the knee [14]. Mathematical simulations suggest that this configuration may deliver 45–121% greater energy to deep ligament tissue layers (3–8 cm) and up to 20% greater total magnetic energy in knee cartilage compared to a single-coil setup [14,15]. Preliminary clinical studies have indicated a potential benefit of double-coil rPMS in both upper and lower limb conditions, including KOA, with reported improvements in pain, functional disability, range of motion, and mobility [16,17].
However, to date, no randomized controlled trial has evaluated the effectiveness of this novel double-coil rPMS approach in combination with standard rehabilitation in patients with KOA, particularly with respect to both pain and functional mobility outcomes. Therefore, the aim of this pilot randomized controlled trial was to evaluate the feasibility and preliminary effectiveness of combining double-coil rPMS therapy with standard rehabilitation compared to standard rehabilitation alone in patients with KOA, with a focus on pain intensity and functional mobility.
Materials and Methods
Study Design
This study was designed as a randomized controlled trial conducted at the Rehamil Clinic (Milovice, Czech Republic) between March 2025 and February 2026. The study was carried out in accordance with the Declaration of Helsinki. All participants were informed about the study procedures and provided written informed consent prior to inclusion.
Participants
Participants were recruited from patients undergoing conservative treatment for KOA at the Rehamil Clinic. Eligible individuals were those diagnosed with KOA of Kellgren–Lawrence (KL) grades II–IV. No upper age limit was applied. To ensure sufficient functional capacity, only patients with at least 90° of active knee flexion and the ability to ambulate independently without assistive devices were included. The presence of osteoarthritis in other joints was allowed provided it was clinically stable and did not limit participation. Participants were required to be at least one month after intra-articular knee injection and at least six months after knee arthroscopy. Throughout the study, they were instructed to maintain their usual level of physical activity and stable analgesic medication; any changes in medication were recorded.
Exclusion criteria included pregnancy and the presence of implanted metallic or electronic devices (e.g., pacemakers, neurostimulators, or defibrillators). Additional exclusions comprised a history of seizures, active malignancy, systemic infection, or skin lesions in the treatment area. Patients with severe cardiovascular, pulmonary, or renal conditions, febrile illness, or other neurological or musculoskeletal disorders affecting lower limb function were also excluded.
Participants were randomly assigned to the control or experimental group using a computer-generated randomization algorithm. Group allocation and treatment scheduling were managed by the therapist responsible for delivering rPMS therapy, who was aware of group assignment. Therapists providing standard rehabilitation were not informed about group allocation. Outcome assessors were not involved in the randomization process.
Intervention
All participants underwent a standardized rehabilitation program consisting of 12 physiotherapy sessions. Each session lasted approximately 60 minutes and included exercise therapy (muscle strengthening and stretching), manual therapy (joint mobilization), and transcutaneous electrical nerve stimulation (TENS).
In addition to standard rehabilitation, participants in the experimental group received rPMS using a double-coil system (BTL SIS DUO, BTL Industries, Ltd., Prague, Czech Republic). Each rPMS session had a total duration of approximately 30 minutes, including preparation and positioning, with the active stimulation phase lasting approximately 13 minutes. The rehabilitation protocol was otherwise identical in both groups.
rPMS was applied with the patient in a supine position. The applicator was positioned around the knee joint with the coils placed medially and laterally, forming an approximately 90° angle to ensure coverage of the target area. A predefined treatment protocol intended for chronic musculoskeletal pain was used. Stimulation was delivered using a combination of modulation patterns with frequencies ranging approximately between 5 and 50 Hz, aiming to achieve both analgesic and neuromuscular effects. The intervention consisted of sequential phases including gradual intensity adjustment, pain-modulating stimulation, and phases supporting local circulation, followed by a gradual reduction in intensity at the end of the session. Stimulation intensity was individually adjusted based on patient tolerance and modified as needed during treatment.
Outcome Measures
Outcome measures were assessed at baseline and at a follow-up visit scheduled within 3 to 7 days after completion of the intervention.
Pain intensity was evaluated using the visual analogue scale (VAS; 0–10), where lower values indicate less pain [18]. Functional performance was assessed using the 30-second chair stand test (30SCHR; number of repetitions), Timed Up and Go test (TUG; seconds), and the stair climb test (SCT; seconds), with higher values indicating better performance for 30SCHR and lower values indicating better performance for TUG and SCT [19-21]. Walking performance was evaluated using the 40-meter walk test (40MWT; seconds) and the 6-minute walk test (6MWT; meters). For the 40MWT, shorter time indicates better performance, while for the 6MWT, longer distance reflects better walking capacity [22,23]. Knee range of motion (ROM; degrees) was assessed using standard goniometric measurement, with higher values indicating greater joint mobility. All assessments were performed under standardized conditions by the same examiner.
Changes between baseline and post-treatment values were analyzed for all outcomes. In addition to absolute changes, percentage changes were calculated to describe the magnitude of improvement across participants.
In addition to statistical significance, clinical relevance was evaluated using responder analysis based on minimal clinically important difference (MCID) thresholds, derived from available literature for the KOA population. The following MCID thresholds were applied: VAS ≥ 2-point reduction; 30SCHR ≥ 3 repetitions increase; 40MWT ≥ 8 s reduction; 6MWT ≥ 72 m increase; TUG ≥ 1 s reduction; SCT ≥ 2 s reduction; ROM ≥ 5° increase [22,24-28].
Sample Size and Statistical Analysis
Due to the pilot nature of the study, no a priori sample size calculation was performed. The sample size was determined pragmatically based on the capacity of the clinical setting and was considered sufficient to provide preliminary estimates of treatment effects.
Data processing, visualization, and statistical analyses were performed using R software (version 4.5.2). The distribution of all variables was assessed using normality testing. Variables with a normal distribution are presented as mean ± standard deviation (SD), while non-normally distributed variables are reported as median and interquartile range (IQR).
Within-group comparisons were performed using paired t-tests for normally distributed data and the Wilcoxon signed-rank test for non-normally distributed data. Between-group differences were analyzed using analysis of covariance (ANCOVA), with post-treatment values as the dependent variable, group as the independent factor, and baseline values included as covariates. Adjusted mean differences between groups, 95% confidence intervals (CI), and corresponding p-values were calculated.
In addition to statistical significance, clinical relevance was assessed using responder analysis based on MCID thresholds. For each outcome, the proportion of responders was compared between groups, and odds ratios (OR) with 95% confidence intervals were calculated using Fisher’s exact test. All tests were two-sided, and a p-value < 0.05 was considered statistically significant.
Results
A total of 40 patients were enrolled and evenly allocated to the control and experimental groups. Two participants, one in each group, did not complete the full treatment protocol due to discontinuation during the intervention period and were not included in the final outcome analysis. Baseline characteristics of both groups are presented in Table 1. The intervention was well tolerated, and no adverse events or other reasons for treatment discontinuation were reported. The complete patient flow, including recruitment, allocation, and analysis, is shown in Figure 1.
Table 1: Baseline characteristics of participants.
|
Variables |
Control group (n=20) |
Experimental group (n=20) |
|
Age |
63.35 ± 7.08 | 60.3 ± 8.68 |
| Female sex, n (%) | 15 (75%) |
14 (70%) |
|
BMI |
28.85 ± 4.72 | 27.49 ± 6.26 |
| KL grade, mean ± SD | 2.55 ± 0.54 |
2.52 ± 0.64 |
BMI: Body Mass Index; KL grade: Kellgren–Lawrence Grade; SD: Standard Deviation.
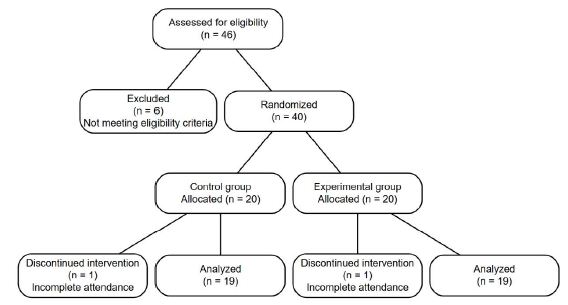
Figure 1: Flow diagram of participant recruitment, allocation and analysis.
Within-group analysis demonstrated significant improvements across all outcome measures in the experimental group. In contrast, in the control group, changes in VAS and 30SCHR did not reach statistical significance. The magnitude of improvement, including percentage changes, consistently favored the experimental group across all outcomes (Tables 2 and 3). The largest treatment effect was observed for pain intensity. Changes in pain intensity over the study period are illustrated in Figure 2. Although the experimental group presented with higher baseline VAS values, it achieved markedly lower post-treatment scores compared to the control group.
Table 2: Within-group changes in clinical outcomes of experimental group.
|
|
Experimental group (n=19) | ||||
| Outcome | Baseline | Post-treatment | Δ | Δ% |
p-value |
|
VAS |
4.53 ± 2.32 | 1.84 ± 1.38 | -2.68 ± 1.83 | -53% ± 28% | <0.001 |
| 30SCHR | 11.37 ± 3.04 | 14.37 ± 3.04 | 3.00 ± 2.45 | 31% ± 27% |
<0.001 |
|
40MWT (s) |
40.40 ± 10.54 | 33.09 ± 6.34 | -7.31 ± 5.51 | -16% ± 11% | <0.001 |
| TUG (s) | 7.05 ± 2.34 | 5.09 ± 1.60 | -1.96 ± 1.57 | -26% ± 18% |
<0.001 |
|
6MWT (m) |
343.96 ± 94.61 | 426.77 ± 96.58 | 82.81 ± 51.60 | 27% ± 18% | <0.001 |
| SCT (s) | 12.37 ± 5.55 | 8.91 ± 2.73 | -3.47 ± 3.30 | -24% ± 15% |
<0.001 |
|
ROM (°) |
125.00 (7.50) | 130.00 (7.50) | 5.00 (8.50) | 4% (7%) |
<0.001 |
Values are presented as mean ± standard deviation, except for ROM, which is reported as median (interquartile range). Δ represents the absolute change between baseline and post-treatment values, and Δ% represents the percentage change relative to baseline. Negative values indicate improvement for VAS, 40MWT, TUG, and SCT, while positive values indicate improvement for 30SCHR, 6MWT, and ROM. Within-group differences were assessed utilizing paired t-tests, with the exception of ROM, which was evaluated using the Wilcoxon signed-rank test. VAS: Visual Analogue Scale; 30SCHR: 30-Second Chair Stand Test; 40MWT: 40-Meter Walk Test; TUG: Timed Up and Go; 6MWT: 6-Minute Walk Test; SCT: Stair Climb Test; ROM: Range of Motion.
Table 3: Within-group changes in clinical outcomes of control group.
|
|
Control group (n=19) | ||||
| Outcome | Baseline | Post-treatment | Δ | Δ% |
p-value |
|
VAS |
3.05 ± 1.84 | 2.68 ± 2.08 | -0.37 ± 2.24 | 14% ± 133% | 0.483 |
| 30SCHR | 13.63 ± 3.64 | 14.79 ± 3.81 | 1.16 ± 2.75 | 10% ± 19% |
0.08 |
|
40MWT (s) |
37.32 ± 9.19 | 33.20 ± 8.88 | -4.12 ± 4.74 | -10% ± 12% | <0.001 |
| TUG (s) | 6.53 ± 2.02 | 5.62 ± 1.77 | -0.90 ± 1.35 | -13% ± 18% |
0.009 |
|
6MWT (m) |
386.66 ± 112.41 | 448.90 ± 101.66 | 62.25 ± 51.69 | 18% ± 16% | <0.001 |
| SCT (s) | 10.23 ± 4.38 | 8.76 ± 3.59 | -1.47 ± 1.46 | -13% ± 11% |
<0.001 |
|
ROM (°) |
125.00 (10.00) | 130.00 (5.00) | 0.00 (5.00) | 0% (4%) |
0.006 |
Values are presented as mean ± standard deviation, except for ROM, which is reported as median (interquartile range). Δ represents the absolute change between baseline and post-treatment values, and Δ% represents the percentage change relative to baseline. Negative values indicate improvement for VAS, 40MWT, TUG, and SCT, while positive values indicate improvement for 30SCHR, 6MWT, and ROM. Within-group differences were assessed utilizing paired t-tests, with the exception of ROM, which was evaluated using the Wilcoxon signed-rank test. VAS: Visual Analogue Scale; 30SCHR: 30-Second Chair Stand Test; 40MWT: 40-Meter Walk Test; TUG: Timed Up and Go; 6MWT: 6-Minute Walk Test; SCT: Stair Climb Test; ROM: Range of : Motion.
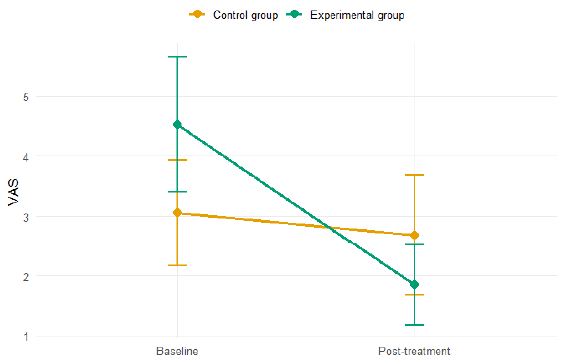
Figure 2: Changes in pain intensity (VAS) over time in the control and experimental groups. Values represent mean ± 95% confidence interval at baseline and post-treatment.
These between-group differences were confirmed by ANCOVA, which demonstrated statistically significant effects in favor of the experimental group for VAS, TUG, and SCT (Table 4). The forest plot (Figure 3) further illustrates that adjusted between-group effects consistently favored the experimental group across all outcomes, although not all reached statistical significance. This pattern was supported by responder analysis, which showed higher MCID responder rates in the experimental group across all outcomes. Statistically significant differences were observed for VAS and 40MWT (Table 5). Individual changes in pain intensity are presented in Figure 4.
Table 4: Between-group comparison of outcomes (ANCOVA).
|
Outcome |
Control mean | Experimental mean | Difference (95% CI)* | p-value |
| VAS | 2.96 | 1.56 | 1.40 (0.28 to 2.52) |
0.016 |
|
30SCHR |
14.0 | 15.2 | -1.22 (-2.95 to 0.50) | 0.159 |
| 40MWT (s) | 34.2 | 32.1 | 2.17 (-0.51 to 4.86) |
0.109 |
|
TUG (s) |
5.77 | 4.94 | 0.83 (0.08 to 1.59) | 0.032 |
| 6MWT (m) | 431 | 445.0 | -13.4 (-46.56 to 19.80) |
0.418 |
|
SCT |
9.37 | 8.29 | 1.08 (0.13 to 2.04) | 0.028 |
| ROM (°) | 127.0 | 129.0 | -2.41 (-5.85 to 1.04) |
0.165 |
Adjusted means were estimated using analysis of covariance (ANCOVA) with baseline values included as a covariate. Differences are presented as control minus experimental group. Positive values indicate better outcomes in the experimental group for VAS, TUG, 40MWT, and SCT, whereas negative values indicate better outcomes for 30SCHR, 6MWT, and ROM. CI denotes 95% confidence interval. VAS: Visual Analogue Scale; 30SCHR: 30-Second Chair Stand Test; 40MWT: 40-Meter Walk Test; TUG: Timed Up and Go; 6MWT: 6-Minute Walk Test; SCT: Stair Climb Test; ROM: Range of Motion.
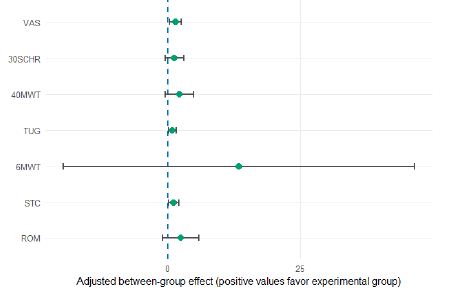
Figure 3: Adjusted between-group differences in clinical outcomes. Points represent adjusted mean differences estimated using ANCOVA, and horizontal lines indicate 95% confidence intervals. Positive values favor the experimental group. VAS: Visual Analogue Scale; 30SCHR: 30-Second Chair Stand Test; 40MWT: 40-Meter Walk Test; TUG: Timed Up and Go; 6MWT: 6-Minute Walk Test; SCT: Stair Climb Test ROM: Range of Motion.
Table 5: Proportion of patients achieving clinically meaningful improvement (MCID).
|
Outcome |
Control, n (%) | Experimental, n (%) | Odds ratio (95% CI) | p-value |
| VAS | 4/19 (21.1%) | 14/19 (73.7%) | 9.72 (1.93 to 62.58) |
0.003 |
|
30SCHR |
6/19 (31.6%) | 10/19 (52.6%) | 2.35 (0.54 to 11.20) | 0.325 |
| 40MWT | 2/19 (10.5%) | 10/19 (52.6%) | 8.86 (1.44 to 100.00) |
0.013 |
|
6MWT |
7/19 (36.8%) | 13/19 (68.4%) | 3.58 (0.81 to 17.70) | 0.103 |
| TUG | 9/19 (47.4%) | 13/19 (68.4%) | 2.35 (0.54 to 11.20) |
0.325 |
|
SCT |
6/19 (31.6%) | 12/19 (63.2%) | 3.58 (0.81 to 17.70) | 0.103 |
| ROM | 9/19 (47.4%) | 13/19 (68.4%) | 2.35 (0.54 to 11.20) |
0.325 |
Responders were defined as patients achieving a clinically meaningful improvement based on predefined minimal clinically important difference (MCID) thresholds. The following thresholds were used: VAS ≥ 2-point reduction; 30SCHR ≥ 3 repetitions increase; 40MWT ≥ 8 s reduction; 6MWT ≥ 72 m increase; TUG ≥ 1 s reduction; SCT ≥ 2 s reduction; ROM ≥ 5° increase. Odds ratios (OR) and 95% confidence intervals (CI) were calculated using Fisher’s exact test. VAS: Visual Analogue Scale; 30SCHR: 30-Second Chair Stand Test; 40MWT: 40-Meter Walk Test; TUG: Timed Up and Go; 6MWT: 6-Minute Walk Test; SCT: Stair Climb Test; ROM: Range of Motion.
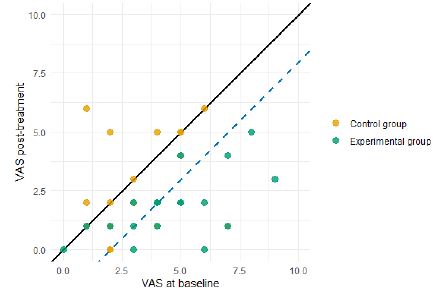
Figure 4: Individual changes in pain intensity (VAS) in the control and experimental groups. Each point represents one patient plotted according to baseline and post-treatment values. The solid diagonal line indicates no change (y=x), while the dashed line represents the threshold for clinically meaningful improvement (≥2-point reduction in VAS). Points below the dashed line indicate patients achieving clinically meaningful pain reduction.
Discussion
This pilot randomized controlled trial demonstrated the added value of double-coil rPMS as an adjunct to standard rehabilitation in patients with KOA. The combined intervention resulted in the greatest effect in pain reduction compared to standard rehabilitation alone. Statistically significant between-group differences were also observed for functional outcomes, specifically the TUG and the SCT.
Overall, treatment outcomes consistently favored the experimental group across all measured parameters, both in terms of percentage improvement and MCID responder rates. Patients receiving the combined intervention appeared to benefit across multiple domains, with the most pronounced differences observed in pain intensity and functional mobility, particularly in TUG, SCT, and 40MWT. These findings suggest that the addition of rPMS may enhance pain modulation and improve short-duration functional performance, which are likely more sensitive to changes in neuromuscular activation and reduced pain-related inhibition during movement. This is consistent with previous evidence showing that neuromuscular stimulation preferentially improves muscle activation and short-term functional tests such as the TUG, while having less consistent effects on longer-duration performance measures such as the 6MWT [29-32].
Although the available evidence on rPMS in the treatment of KOA remains limited, the findings of the only existing study evaluating double-coil rPMS are consistent with the results of the present study. Bednar et al. reported comparable percentage improvements in pain and range of motion, reaching approximately 50% and 4%, respectively, which closely aligns with the outcomes observed in this trial [17]. A greater improvement in TUG was observed in the present study (26% vs. 16%), which may be explained by the addition of a standardized rehabilitation protocol, potentially enabling greater functional gains. In contrast, Bednar et al. investigated the effect of double-coil rPMS as a standalone intervention. Direct comparison of MCID outcomes is limited due to differences in threshold definitions. However, a similar trend toward higher responder rates, approaching 70%, was observed in both studies. To date, no other studies have evaluated this specific intervention in patients with KOA, limiting the possibility of broader comparison [17].
The limited number of randomized controlled trials investigating rPMS in patients with KOA may be partly explained by the technical limitations of conventional single-coil systems, which have been predominantly used to date. These systems primarily target superficial tissues, typically within a depth of approximately 3 cm, and may therefore be less effective for deeper joint structures such as the knee. The recently introduced double-coil design allows for partial overlap of the generated magnetic fields when appropriately positioned, potentially enabling higher stimulation intensities at greater depths (approximately 3–8 cm). To date, this concept has been supported mainly by experimental simulations and preliminary clinical studies. Direct clinical comparison between single-coil and double-coil approaches in patients with KOA remains lacking, and further research is needed to clarify the potential advantages of this technology.
Several limitations of this study should be acknowledged. First, the pilot design and relatively small sample size limit the generalizability of the findings and increase the risk of overestimating treatment effects. In addition, no a priori sample size calculation was performed, and the sample size was determined pragmatically based on the capacity of the clinical setting. Second, this was a single-center study, which may further limit the external validity of the results. The follow-up period was restricted to the immediate post-treatment assessment, and therefore no conclusions can be drawn regarding the long-term sustainability of the observed effects. Third, blinding was not fully implemented, as the therapist responsible for delivering rPMS was aware of group allocation. Although therapists providing standard rehabilitation were not informed, the potential for performance bias cannot be excluded.
Despite its pilot nature, this study provides preliminary evidence supporting the potential clinical value of double-coil rPMS in the treatment of KOA. Future research should confirm these findings in larger populations and investigate the comparative effectiveness of double-coil and single-coil rPMS approaches.
Conclusions
This pilot study suggests that double-coil rPMS may contribute to pain reduction and improved mobility in patients with knee osteoarthritis, particularly in short-duration functional performance. Supporting mobility in this population is essential for maintaining independence in daily activities and may help prevent further physical and psychological decline, especially during the period preceding total knee arthroplasty. Future studies should confirm these findings in larger populations and further investigate the comparative effectiveness of double-coil and single-coil rPMS approaches.
References
- Hunter DJ, Bierma-Zeinstra S (2019) Osteoarthritis Lancet.
- Duong V, Abdel Shaheed C, Ferreira ML, Narayan SW, Venkatesha V, Hunter DJ, Zhu J, Atukorala I, Kobayashi S, Goh SL, Briggs AM, Cross M, Espinosa-Morales R, Fu K, Guillemin F, Keefe F, Stefan Lohmander L, March L, Milne GJ, Mei Y, et al. (2025) Risk factors for the development of knee osteoarthritis across the lifespan: A systematic review and meta-analysis. Osteoarthritis and Cartilage. [crossref]
- Pavel RMS, Purza AL, Tit DM, Radu AF, Iovanovici DC, Vasileva D, Uivaraseanu B, Bungau G, Nistor-Cseppento CD (2025) Functional Burden and Quality of Life in Hip and Knee Osteoarthritis: A Cross-Sectional Study. Medicina. [crossref]
- Shafrin J, Sullivan J, Goldman DP, Gill TM (2017) The association between observed mobility and quality of life in the near elderly. PLoS One. [crossref]
- Sánchez J, Álvarez-Barbosa F, Rodríguez M, Ramos-Munell J (2025) Physical exercise to manage pain in patients with knee osteoarthritis: a systematic review. Archivos de Medicina del Deporte
- Quicke JG, Runhaar J, Windt D, Healey E, Foster NE, Holden M (2020) Moderators of the effects of exercise for hip and knee osteoarthritis: a systematic review of subgroup analyses from randomised controlled trials. Osteoarthritis and Cartilage. [crossref]
- Yazdi F, Salajegheh A, Yahyaabadi F, Salajegheh P (2025) The Impact of Strength/ Resistance Training on Related Outcomes of Patients with Knee Osteoarthritis: A Systematic Review and Meta-Analysis Study. Galen Medical Journal. [crossref]
- Holden MA, Hattle M, Runhaar J, Riley RD, Healey EL, Quicke J, van der Windt DA, Dziedzic K, van Middelkoop M, Burke D, Corp N, Legha A, Bierma-Zeinstra S, Foster NE, STEER OA Patient Advisory Group, OA Trial Bank Exercise Collaborative (2023) Moderators of the effect of therapeutic exercise for knee and hip osteoarthritis: a systematic review and individual participant data meta-analysis. The Lancet Rheumatology. [crossref]
- Jinks C, Moore A, Holden M, Foster N (2016) Identifying barriers and facilitators to exercise and physical activity in older adults with knee pain: Findings from the BEEP trial longitudinal qualitative study. Osteoarthritis and Cartilage
- Hinman R, Jones S, Nelligan R, Campbell P, Hall M, Foster N, Russell T, Bennell K (2023) Absence of Improvement With Exercise in Some Patients With Knee Osteoarthritis: A Qualitative Study of Responders and Arthritis Care & Research. [crossref]
- Bennell K, Nelligan R, Schwartz S, Kasza J, Kimp A, Crofts S, Hinman R (2020) Behavior Change Text Messages for Home Exercise Adherence in Knee Osteoarthritis: Randomized Trial. Journal of Medical Internet Research. [crossref]
- Sakai K, Yasufuku Y, Kamo T, Ota E, Momosaki R (2019) Repetitive peripheral magnetic stimulation for impairment and disability in people after stroke. The Cochrane Database of Systematic Reviews. [crossref]
- Fawaz SI, Izumi SI, Zaki AS, et (2023) Repetitive peripheral magnetic stimulation for improving upper limb function in post-stroke hemiparesis. Egypt Rheumatol Rehabil
- Vrbová B, Malá J, Barna M (2025) Comparison of single- and double-coil rPMS configurations in physiotherapy: Perception and field distribution in commonly treated J Orthop Sports Med
- Vrbová B, Malá J (2026) Single versus double-coil repetitive peripheral magnetic stimulation targeting knee cartilage and ligaments: A finite element analysis. J Clin Diagn Res
- Modica V, Sciarrone G, Barna M (2026) A Novel Double-Coil rPMS Approach for Treating Joint Disorders of the Upper and Lower Extremities: A Pilot Open Journal of Therapy and Rehabilitation. [crossref]
- Bednár R, Flašková M, Fejková N (2026) A Pilot Study Investigating Clinical and Functional Outcomes of Novel Double-Coil rPMS in Knee Osteoarthritis. Biomedicines. [crossref]
- Price DD, McGrath PA, Rafii A, Buckingham B (1983) The validation of visual analogue scales as ratio scale measures for chronic and experimental pain. Pain. [crossref]
- Jones CJ, Rikli RE, Beam WC (1999) A 30-s Chair-Stand Test as a Measure of Lower Body Strength in Community-Residing Older Adults. Research Quarterly for Exercise and Sport. [crossref]
- Podsiadlo D, Richardson S (1991) The Timed “Up & Go”: A Test of Basic Functional Mobility for Frail Elderly J Am Geriatr Soc. [crossref]
- Sharma S, Wilson R, Pryymachenko Y, Pathak A, Chua J, Gwynne-Jones D, Bennell KL, Metcalf B, Hinman RS, Hunt MA, Lim BW, Abbott JH (2023) Reliability, Validity, Responsiveness, and Minimum Important Change of the Stair Climb Test in Adults with Hip and Knee Arthritis Care Res. [crossref]
- Ramalho RB, Chaves TC, Terluin B, Selistre LFA (2025) Minimal Important Changes of Common Outcome Measures of Physical Function in Individuals With Knee Osteoarthritis: A Prospective Clinical Archives of Physical Medicine and Rehabilitation. [crossref]
- Wang TJ, Belza B, Thompson FE, Whitney JD, Bennett K (2007) Effects of Aquatic Exercise on Flexibility, Strength and Aerobic Fitness in Adults with Osteoarthritis of the Hip or J Adv Nurs. [crossref]
- Franceschini M, Boffa A, Pignotti E, Andriolo L, Zaffagnini S, Filardo G (2023) The Minimal Clinically Important Difference Changes Greatly Based on the Different Calculation The American Journal of Sports Medicine. [crossref]
- King L, Waugh E, Woodhouse L, Hawker G, Jones A (2020) What change in six-minute walk test indicates a clinically meaningful improvement in mobility to patients with knee osteoarthritis after total knee arthroplasty? Osteoarthritis and Cartilage. [crossref]
- Alghadir A, Anwer S, Brismée JM (2015) The reliability and minimal detectable change of Timed Up and Go test in individuals with grade 1-3 knee BMC Musculoskeletal Disorders. [crossref]
- Pajaniaye JB, Cheret EP, Langvad CH, Holm PM, Skou ST, Larsen JB, Mechkenburg I (2026) Knee osteoarthritis and minimal important change for the nine-step stair climb Danish Medical Journal. [crossref]
- Wright AA, Cook CE, Baxter GD, Dockerty JD, Abbott JH (2011) A comparison of methodological approaches to defining clinically important improvement of performance measures in hip osteoarthritis. J Orthop Sports Phys Ther. [crossref]
- Peng L, Wang K, Zeng Y, Wu Y, Si H, Shen B (2021) Effect of Neuromuscular Electrical Stimulation After Total Knee Arthroplasty: A Systematic Review and Meta-Analysis of Randomized Controlled Frontiers in Medicine. [crossref]
- Kourek C, Kanellopoulos M, Raidou V, Antonopoulos M, Karatzanos E, Patsaki I, Dimopoulos S (2024) Safety and effectiveness of neuromuscular electrical stimulation in cardiac surgery: A systematic review. World Journal of Cardiology. [crossref]
- Capin J, Bade M, Jennings J, Snyder-Mackler L, Stevens-Lapsley J (2022) Total Knee Arthroplasty Assessments Should Include Strength and Performance-Based Functional Tests to Complement Range-of-Motion and Patient-Reported Outcome Physical Therapy. [crossref]
- Nussbaum E, Houghton P, Anthony J, Rennie S, Shay B, Hoens A (2017) Neuromuscular Electrical Stimulation for Treatment of Muscle Impairment: Critical Review and Recommendations for Clinical Physiotherapy Canada. [crossref]