Author Archives: author

Commentary on Radiation Induced Skin Fibrosis (RISF): Opportunity for Angiotensin II-Dependent Intervention

DOI: 10.31038/PSYJ.2024642

The publication “Radiation Induced Skin Fibrosis (RISF): Opportunity for Angiotensin II-Dependent Intervention” presents a compelling examination of an emerging therapeutic target for mitigating the adverse effects of radiation therapy. Radiation-induced skin fibrosis is a debilitating condition that manifests as thickened and scarred skin following radiation treatment, often significantly complicating the quality of life for cancer patients status post radiation. We propose a novel dual intervention strategy involving the simultaneous modulation of angiotensin II (Ang II) and reactive oxygen species (ROS) pathways, offering a fresh perspective on how to address this challenging side effect. The study meticulously reviews the pathophysiology of RISF, highlighting how radiation triggers a cascade of fibrotic responses. We elucidate the role of Ang II and ROS activation, for their involvement in various fibrotic processes, in exacerbating skin fibrosis. We argue that the dual role of Ang II and elevated ROS in promoting fibrosis makes it a promising target for therapeutic intervention. This insight is significant, given the current lack of effective treatments for RISF that directly address its underlying mechanisms. We believe that one of the strengths of the publication is its integration of detailed mechanisms pathways with preclinical data and clinical observations. In this manner, we effectively link experimental findings with clinical outcomes, underscoring how Ang II antagonists and ROS inhibition could potentially alter the course of RISF. By referencing both animal models and human studies, the paper builds a robust case for the proposed intervention. This comprehensive approach with detailed figures and a supplemental summary table not only supports the feasibility of targeting both Ang II and ROS but also provides a foundation for potential future clinical trials.

Although the concept of dual targeting Ang II and ROS is innovative, we believe that further publications addressing additional potential limitations and considerations would be valuable. For example, dose range finding studies and the safety of long-term Ang II inhibition in the context of RISF have yet to be fully established. Additionally, we think that further research into personalized approaches, considering the variability in individual responses to radiation and drug interventions, would be beneficial. “Moreover, future considerations into the broader implications of the proposed dual treatment approach would provide additional guidance. Integrating Ang II inhibitors and targeted antioxidant therapy into standard care protocols for patients undergoing radiation therapy could have significant impacts on treatment strategies and patient management. Additional commentary could explore how these approaches might be incorporated into existing treatment regimens and what additional research would be necessary to facilitate such integration.

In conclusion, “Radiation Induced Skin Fibrosis (RISF): Opportunity for Angiotensin II-Dependent Intervention” represents a significant step forward in the quest to improve the management of RISF. By focusing on a dual approach to targeting Ang II and ROS pathways, we offer a promising new avenue for therapeutic development. Future research might address the highlighted potential limitations and further validate the proposed intervention’s clinical benefits. Overall, we believe this publication is a valuable contribution to the field and could pave the way for more effective treatments for patients suffering from radiation-induced fibrosis in general.

Berberine and Type II Diabetes: A Mini Review

DOI: 10.31038/EDMJ.2024831

Abstract

Berberine is a bioactive compound with a broad spectrum of pharmacological activities. Berberine has gained significant attention for its ability to manage Type 2 Diabetes Mellitus. It significantly reduces fasting blood glucose levels, glycated hemoglobin HbA1c, and postprandial blood glucose levels in patients with T2DM, with efficacy comparable to that of metformin. It exerts its antidiabetic effects via activation of AMP-activated protein kinase, improvement of Insulin Sensitivity, reduction of Intestinal Glucose Absorption and modulation of gut microbia, anti-inflammatory and antioxidant effects.

Keywords

Berberine, Type 2 Diabetes Mellitus, Glucose, Anti-inflammatory effects, Antioxidant effects

Introduction

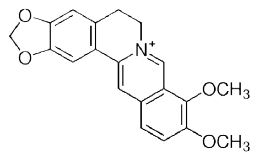
Berberine is a bioactive compound found in several plants, including Berberis species (e.g., Berberis vulgaris or barberry) (Figure 1). It is traditionally used in Chinese and Ayurvedic medicine for its antimicrobial, anti-inflammatory, and antidiabetic properties. Recent research has concentrated as a therapeutic agent for Type II Diabetes Mellitus (T2DM) due to its ability to modulate glucose and lipid metabolism [1-6].

fig 1

Figure 1: Berberine molecule

Berberine is renowned for its broad spectrum of pharmacological activities, including:

Antimicrobial activity: Berberine is effective against microorganisms, bacteria, viruses, fungi and protozoa. It can fight bacterial infections, especially those caused by Staphylococcus aureus and Escherichia coli [7-10].

Anti-inflammatory effects: Berberine works by lowering the induced oxidative stress by inhibiting the production of pro- inflammatory cytokines (TNF-α, IL-6). Oxidative stress represents a disturbance in the balance between the production of reactive oxygen species (Reactive Oxygen Species) and the ability of a biological system to inactivate these toxic molecules and fix the injury they cause. Reactive oxygen species harm all cell elements, as well as proteins, lipids, and DNA. The main antioxidant shields accessible to the cell are: Superoxide dismutase (SOD), Catalase and Glutathione peroxidase. Arthritis and inflammatory bowel disease are two examples of diseases that benefit from berberine administration. Modification of gut microbiota composition appears to be involved in gastrointestinal health [2,14].

Cardiovascular beneflts: Berberine acts by lessening blood pressure, cholesterol levels and at the same time improving endothelial function.

Anticancer potential: Research has shown that berberine possesses anticancer properties. It can initialize apoptosis (programmed cell death) in cancer cells, arrest cell proliferation, and subdue tumor growth in different types of cancer [4,13,17]. Some of the mechanisms with which Berberine inhibits cancer metastasis are shown in Figure 2.

fig 2

Figure 2: Some of the mechanisms with which Berberine inhibits cancer metastasis.

Effects of Berberine on Diabetes

Berberine BBR has gained significant attention for its ability to manage Type 2 Diabetes Mellitus (T2DM). Clinical studies have shown that berberine significantly reduces fasting blood glucose levels, glycated hemoglobin HbA1c, and postprandial blood glucose levels in patients with T2DM, with efficacy comparable to that of metformin. Berberine not only lowers glucose levels but also improves lipid profiles by reducing triglycerides TG, LDL-cholesterol, and total cholesterol, making it a valuable treatment option for patients with both T2DM and dyslipidemia. In a study including thirty-six adults with T2DM, who took berberine or metformin 0.5 g, 3 times a day) in a 3-month trial, there was the same significant decrease in glucose, HbA1c, TG both with berberine and metformin [14]. Ninety-seven T2DM patients with T2DM were treated orally with BBR, 1 g/d for 2 months and it was found increased insulin sensitivity and decrease in glucose, HbA1c, TG [15].

In a double-blind randomized controlled placebo trial, eighty-four patients with T2DM were divided in 2 groups (42 each) and each group received Berberine capsules 500 mg or placebo twice daily for 4 weeks. In the BBR group, a statistically significant decrease in glucose levels was observed before and after the meal, while the decrease in LDL, TG, VLDL was not statistically significant [9,18]. Administration of BBR with plant polyphenols to T2DM patients for 90 days significantly reduced glycated hemoglobin, insulin, homeostatic model assessment of insulin resistance, total and low-density lipoprotein cholesterol, and triglycerides [3]. In a double-blind study including patients with Non-alcoholic steatohepatitis (a liver problem frequently associates with diabetes), BBR administration 1000 mg twice a day, caused a significant decrease in liver fat content and a significant decrease in glycemic and lipid indices in the group of patients with T2DM [5].

Mechanisms of Action

Berberine exerts its antidiabetic effects through several mechanisms:

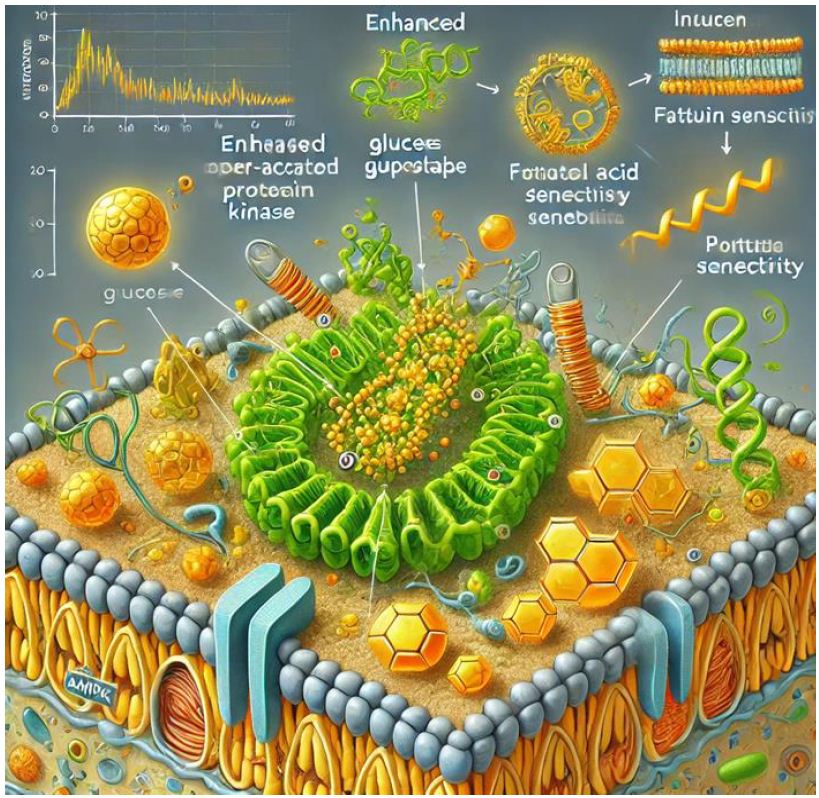
  1. Activation of AMPK Pathway: One of the most critical mechanisms of berberine is the activation of AMP-activated protein kinase (AMPK), a crucial enzyme that regulates energy homeostasis in cells. Activation of AMPK leads to increased glucose uptake in peripheral tissues, enhanced fatty acid oxidation, and decreased lipid synthesis (Figure 3). This results in improved insulin sensitivity and reduced blood glucose levels. AMPK activation by berberine also inhibits hepatic gluconeogenesis (the production of glucose by the liver) and promotes glycolysis (the breakdown of glucose for energy), contributing to its antidiabetic effects [15,19].
  2. Improvement of Insulin Sensitivity: Berberine improves insulin sensitivity by reducing insulin resistance, a hallmark of T2DM. It does this by modulating key insulin signaling pathways, which helps in lowering fasting blood glucose levels and glycated hemoglobin (HbA1c) (Figure 4) (Yin et al,2008).
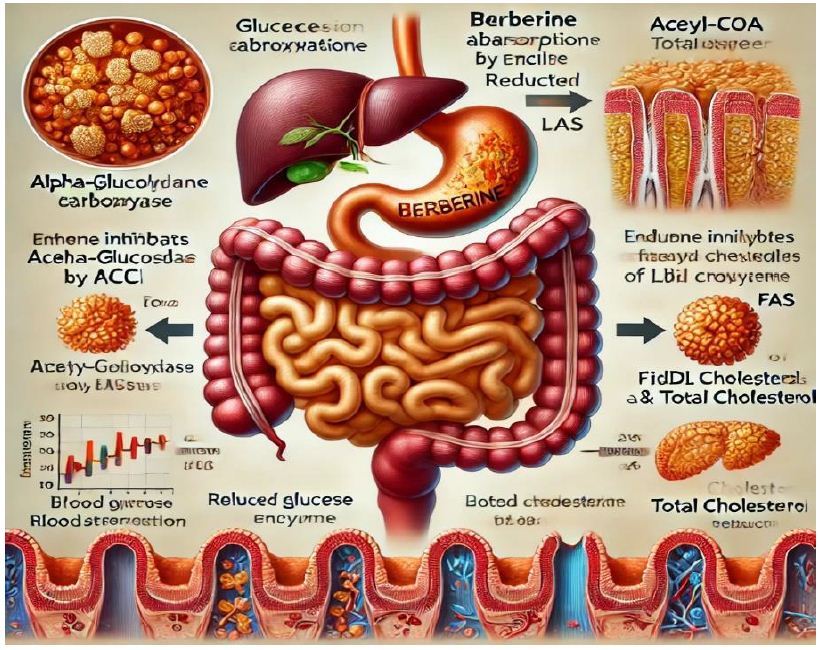
  3. Reduction of Intestinal Glucose Absorption: Berberine is an inhibitor of α-glucosidase, an enzyme responsible for the breakdown of glycogen in lysosomes. Binding to M6P receptors on the cell surface has been shown to occur via carbohydrate groups on the enzyme molecule, after which it is internalized and transported to lysosomes, where it undergoes proteolytic cleavage leading to increased enzyme activity for glycogen degradation [7]. It also inhibits acetyl- CoA carboxylase ACC and fatty acid synthase FAS inducing the activity of enzymes that promote lipolysis (Figure 5). This regulation results in lower levels of triglycerides, low-density lipoprotein (LDL) cholesterol, and total cholesterol, making berberine effective in managing dyslipidemia [1].
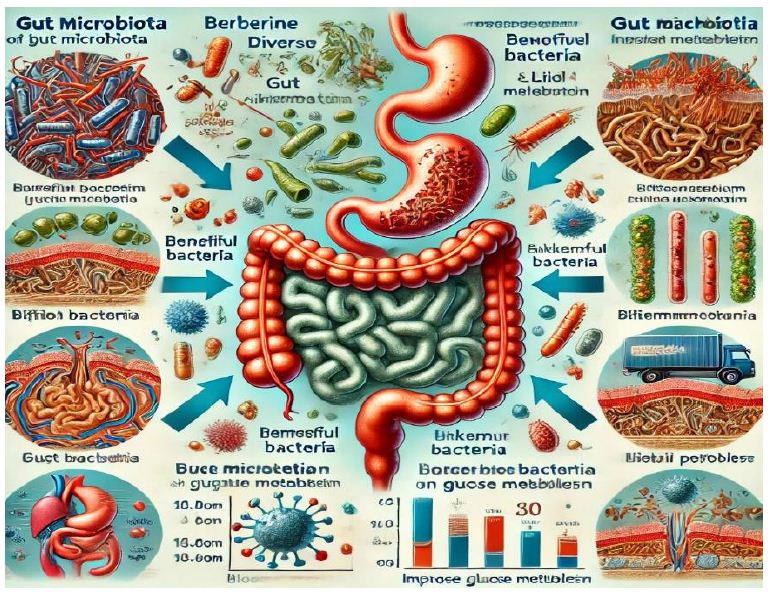
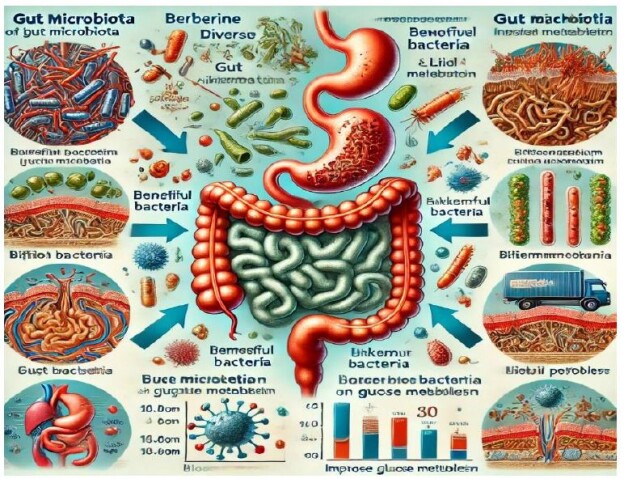
  4. Modulation of Gut Microbiota: The action of berberine includes its effect on the composition of the intestinal microflora (Figure 6). Increases bacteria such as Bifidobacterium, Akkermansia involved in glucose and lipid metabolism. It also reduces the population of bacteria involved in metabolic disorders and inflammatory reactions [16]. The changes in the intestinal microflora contribute to the antidiabetic and anti- obesity effect of the molecule.
  5. Anti-inflammatory and Antioxidant Effects: Chronic low- grade inflammation and oxidative stress are implicated in the pathogenesis of T2DM [8,11,12]. Berberine exhibits anti-inflammatory and antioxidant properties, which contribute to its protective effects against T2DM and its complications [2].

fig 3

Figure 3: Berberine activates AMPK and effects on cellular metabolism. At the center, depict AMPK as a large protein complex with labels, showing it being activated by Berberine molecules attaching to it. Berberine molecules can be represented as small, yellow compounds binding to the AMPK complex.

fig 4

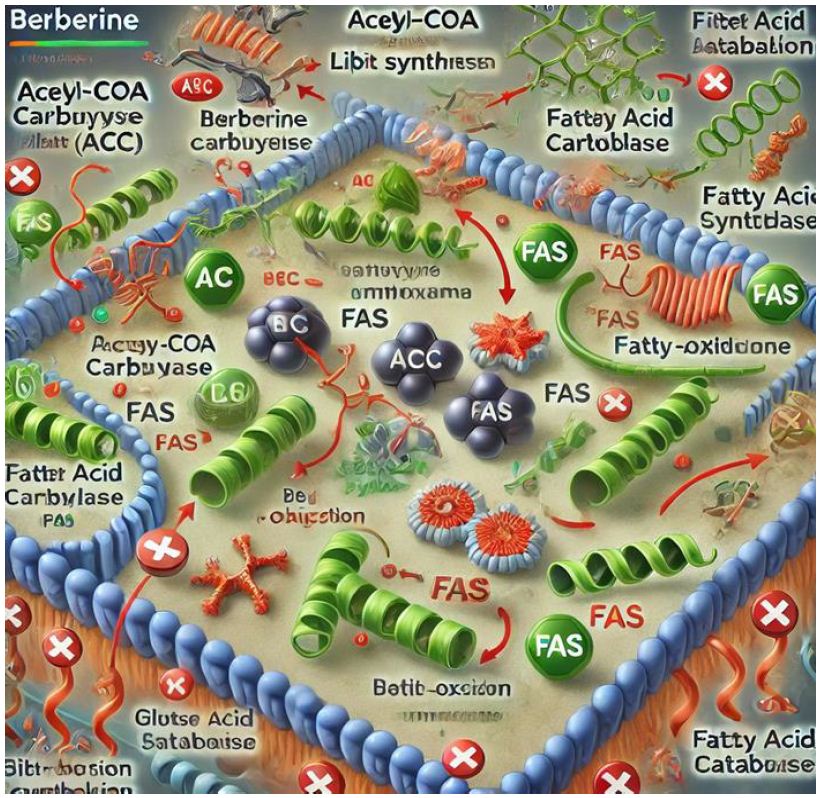
Figure 4: Berberine regulates glucose and lipid metabolism by inhibiting enzymes involved in lipid synthesis and enhancing those promoting lipid catabolism.

fig 5

Figure 5: How Berberine promotes lipolysis

fig 6

Figure 6: Modulation of gut microbiota by berberine

Safety of Berberine

While metformin is a prescription medication, used as a standard treatment for type 2 diabetes, Berberine is available as a dietary supplement and is often used by individuals seeking natural alternatives or adjuncts to conventional treatments. It is generally well-tolerated, with gastrointestinal discomfort being the most commonly reported side effect. Its safety profile compares favorably with standard antidiabetic drugs, making it a promising alternative or complementary therapy.

Conclusions and Perspectives

Berberine exerts its pharmacological effects through multiple mechanisms, including AMPK activation, modulation of glucose and lipid metabolism, inhibition of glucose absorption, alteration of gut microbiota, and anti-inflammatory actions. These diverse mechanisms make berberine a promising therapeutic agent for managing Type 2 Diabetes Mellitus, cardiovascular diseases, and other metabolic disorders. Additionally, more methods or techniques should be developed to improve the bioavailability and antidiabetic activity of berberine. More clinical trials should be carried out to confirm effects of berberine on Diabetes and metabolic disorders.

Funding Statement

This research was not funded

Conflicts of Interest

The authors declare no conflict of interest.

References

  1. Brusq JM, Ancellin N, Grondin P, Guillard R, Martin S, Saintillan Y, Issandou M, et al. (2006) Inhibition of lipid synthesis through activation of AMP kinase: an additional mechanism for the hypolipidemic effects of berberine. Journal of Lipid Research 47(6): 1281-1288. [crossref]
  2. Chang W, Chen L, Hatch GM, Zhang Y (2015) Berberine as a therapy for type 2 diabetes and its complications: From mechanism of action to clinical studies. Biochemical Pharmacology 87(1): 42-52. [crossref]
  3. Di Pierro F, Villanova N, Agostini F, Marzocchi R, Soverini V, Marchesini G (2012) Pilot study on the additive effects of berberine and oral type 2 diabetes agents for patients with suboptimal glycemic control. Diabetes Metab Syndr Obes 5: 213-217 [crossref]
  4. Fu T, Coulter S, Yoshihara E, Oh TG, Fang S, Cayabyab F, Zhu QY, Zhang T, Leblanc M, Liu SH (2019) FXR regulates intestinal cancer stem cell proliferation. Cell. [crossref]
  5. Harrison SA, Gunn N, Neff GW, Kohli A, Liu L, Flyer A, Goldkind L, Di Bisceglie AM (2021) A phase 2 proof of concept, randomised controlled trial of berberine ursodeoxycholate in patients with presumed non-alcoholic steatohepatitis and type 2 Nat Commun 12,5503. [crossref]
  6. Imenshahidi M, Hosseinzadeh H (2019) Berberine and barberry (Berberis vulgaris): A clinical Phytother Res 33: 504-523. [crossref]
  7. Lee YS, Kim WS, Kim KH, Yoon MJ, Cho HJ, Shen Y, Kim J B (2006) Berberine, a natural plant product, activates AMP-activated protein kinase with beneficial metabolic effects in diabetic and insulin-resistant Diabetes 55(8): 2256-2264. [crossref]
  8. Lourenço A, Freitas C, Timóteo M, Soares M, Figueiredo J, Osório N, Valado A, Trapali M, Pereira T, Caseiro A (2024) Laboratory Assessment of the Effects of AGA@4life Multidisciplinary Intervention on the Inflammatory Profile, MMPs, and TIMPs in a Geriatric Population. Healthcare 12(5): 509. [crossref]
  9. Rashidi H, Namjoyan F, Mehraban Z, Zakerkish M, Ghaderian SB, Latifi S (2018) The Effects of Active Ingredients of Barberry Root (Berberine) on Glycemic Control and Insulin Resistance in Type 2 Diabetic Patients. Jundishapur J Nat Pharm Prod 13: e64180.
  10. Tan J, Wang J, Yang C, Zhu C, Guo G, Tang J, Shen H (2019) Antimicrobial characteristics of berberine against prosthetic joint infection-related Staphylococcus aureus of different multi-locus sequence types. BMC Complement Altern Med 19,218. [crossref]
  11. Trapali M (2021) Oxidic degradation of lipids in patients with type II Diabetes. Review Clinical Pharmacology and Pharmacokinetics. 35(2): 75-77.
  12. Trapali M (2022) Antioxidant Activity in Patients with Type II Diabetes. Review Clinical Pharmacology and Pharmacokinetics. 36(1): 6.
  13. Wang Y, Liu Y, Du X, Ma H, Yao J (2020) The anti-cancer mechanisms of berberine: A Cancer Manag Res. 12,695-702. [crossref]
  14. Yin J, Xing H, Ye J (2008) Efficacy of berberine in patients with type 2 diabetes Metabolism 57(5): 712-717. [crossref]
  15. Zhang H, Wei J, Xue R, Wu JD, Zhao W, Wang Z Zeng Q (2010) Berberine lowers blood glucose in type 2 diabetes mellitus patients through increasing insulin receptor Metabolism 59(2): 285-292. [crossref]
  16. Zhang X, Zhao Y, Xu J, Feng Q, Chen W, Wei H, Zhang Y (2012) Modulation of gut microbiota by berberine and metformin during the treatment of high-fat diet- induced obesity in rats. Scientific Reports 5: 14405. [crossref]
  17. Zhang C, Sheng J, Li G, Zhao L, Wang Y, Yang W, Yao X, Sun L, Zhang Z, Cui R (2019) Effects of berberine and its derivatives on cancer: A systems pharmacology Front Pharmacol 10,1461. [crossref]
  18. Zhang Y, Gu Y, Ren H, Wang S, Zhong H, Zhao X, Ma J, Gu X, Xue Y, Huang S (2020) Gut microbiome-related effects of berberine and probiotics on type 2 diabetes (the PREMOTE study) Nat Commun. 11: 5015. [crossref]
  19. Zhou L, Wang X (2014) Berberine has beneficial effects on glucose-lipid metabolism and associated diseases by activating AMP-activated protein kinase. Clinical and Experimental Pharmacology and Physiology 41(6): 398-405.

Lonsdaleite, Diamond, and Graphite in a Lamprophyre: Minette from East-Thuringia/Germany

DOI: 10.31038/GEMS.2024652

Abstract

We present a microscopical and Raman spectroscopical study of a minette sample from East-Thuringia/Germany. This sample contains needle-like graphite with micro-diamond crystals and his changed carbon products. Besides diamonds in larger graphite needles, there are also whisker-like needles of lonsdaleite and diamonds in quard and orthoclase, which are later inserted into the minette rock by supercritical fluids or melts. That means we have a two-stage process at the formation of the minette.

Keywords

Minette, Raman spectroscopy, Lonsdaleite, Diamond, Graphite, Depth of origin, Supercritical fluid

Introduction

Vein-like lamprophyres are here decimeter-to-meter thick intrusions, which can be assigned as deep-reaching faults that permeate the earth’s mantle and the crust. The origin of the lamprophyric magma is still discussed because all information about it is based on geochemical studies [1]. In this short contribution, we will show that careful mineralogical studies can contribute to this question. We forswear to a thorough description of this magmatic rock because of its extensive literature, for example, Beuge and Kramer (1977) [2-6].

Sample Material

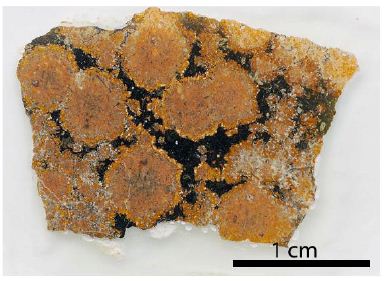
The minette sample 2210 is from a 50 cm thick vein in a small quarry at Highway F 92, about 1 km northwards from Cunsdorf. A petrographic characteristic of the orbicular minette rock is in Beuge and Kramer (1977) [2] Figure 1 inside – together with a mineralogical description and chemical composition. The reddish brown ocelli are composed predominantly of alkali feldspar, quartz, actinolite, and chlorite. The black interstice is composed of femic phenocrysts of biotite, amphibole, and pyroxene. During the study of a lamprophyre sample (sample 2210; see Kramer 1988) [1], a thick section of minette from E-Thuringia (Cunsdorf, Meltheuer Mulde in the immediate vicinity of the Bergaer Sattel, near Elsterberg), we found, as a surprise, many crystals of diamond-graphite intergrowths. Figure 1 shows the studied sample. Further minerals found with Raman spectroscopy, often containing carbon, are anatase, calcite, orthoclase, and quartz. Apatite is present in two different generations: an early magmatic type as phenocrysts and a late apatite in the form of larger lamellas. The chemical composition (main and trace elements) of the studied minette sample (sample No. 2210) is in Kramer (1988) [1] and Beuge and Kramer (1977) [2] here represented by samples 3 and 4. Beuge and Kramer (1977) [2] found in the orbicular minette rock from Cunsdorf near Elsterberg 5600 ppb Hg. Kramer and Just (1995) [7] also present REE and other trace elements (Ba, F, Bi, Hg, Cr, Ni, Th, U).

fig 1

Figure 1: Petrologic thick section (about 500 µm thick) of the orbicular minette sample from Cunsdorf near Elsterberg.

Methodology: Microscopy and Raman Spectroscopy

We use Raman spectroscopy here to characterize the diamond crystals in the minette, which show high-pressure and high- temperature origin. For the study of the minette sample, we use the Raman spectrometer EnSpectr R532 combined with the Olympus BX43 microscope both for transmitted and reflected light and equipped with a rotating stage and polarizers (for parallel and perpendicular positions). Note here that the incident laser light is always polarized – in our case, N – S [8]. Generally, we used an Olympus long-distance 100x objective lens for the studies. As references, we applied a water-clear diamond crystal from Brazil (1331.63 ± 0.60 cm-1 and a semiconductor-grade silicon single-crystal (520.70 ± 0.15 cm-1). For this study, we generally used laser energies of ≤ 30 mW on the sample to minimize the heating by the laser light for the studies.

Results

Diamonds – lonsdaleite – Graphite

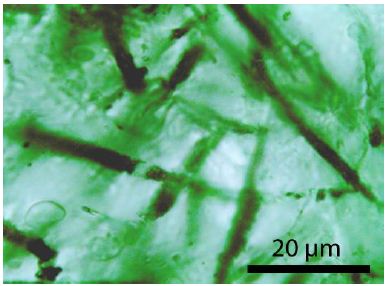
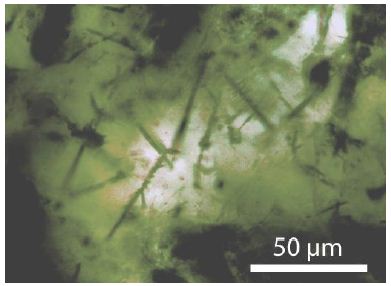
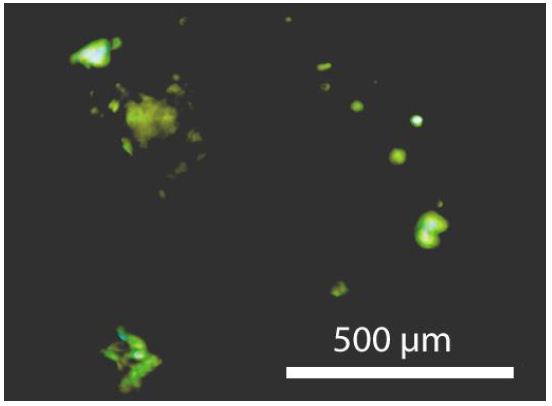
The minette sample contains many black needles. Some are whisker-like. They are mainly composed of carbon with remnants of diamond, according to Raman spectroscopy (Figure 2).

fig 2

Figure 2: Needels of carbon in the quartz matrix. The quartz matrix contains many remnsants of cristobalite, often also shaped as light needles.

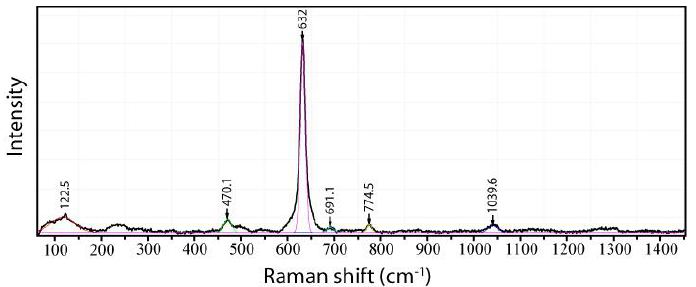
Figure 3 shows such a Raman spectrum of diamonds in graphite- like needles in the minette quartz. This quartz also contains remnants of cristobalite.

fig 3

Figure 3: Raman spectrum of diamond in a thick graphite needle (see Figurs 2) in the orbicular minette sample from Cunsdorf near Elsterberg.

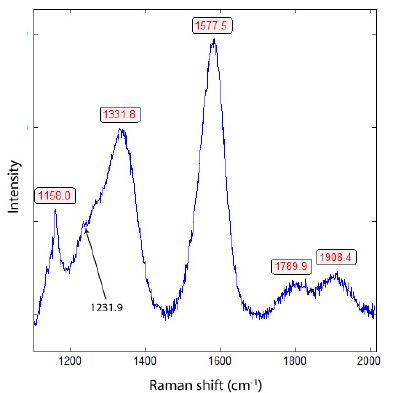
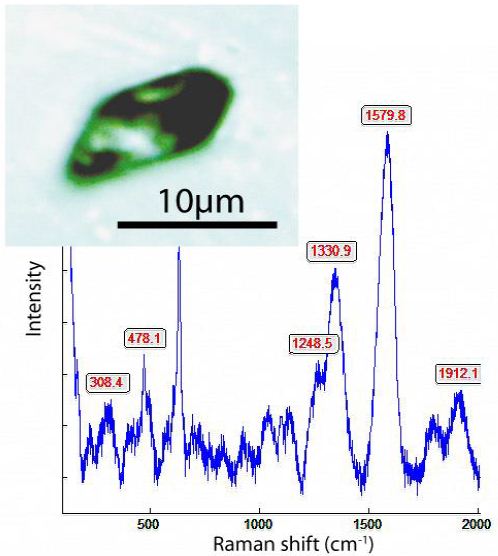
Ten different crystals of micro-diamonds give a mean of 1332.9 ± 10.2 cm-1 and a Full Width at Half Maximum (FWHM) of 71.6 ± 28.8 cm-1. A typical Raman spectrum is shown in Figure 4. However, a large proportion of the thick needles give diamond un-typical Raman spectra: 1355 ± 5.7 cm-1 with FWHM = 67.2 ± 9.8 cm-1 (17 different crystals). According to Zaitsev (2001) [9], this carbon is disordered or nanocrystalline defective graphite or amorphous diamond-like carbon. According to our ideas, diamonds are the precursor of this carbon.

fig 4

Figure 4: Raman spectrum of a small black needle in quartz and orthoclase in the orbicular minette sample from Cunsdorf near Elsterberg. In the quartz are many anatase inclusions.

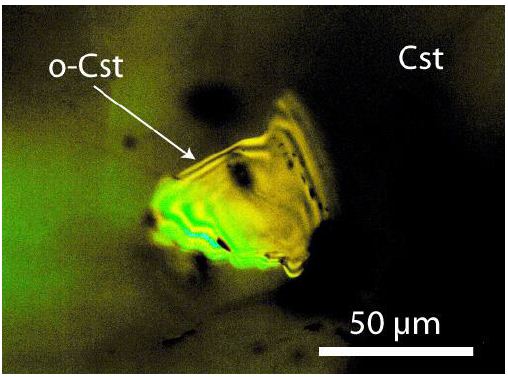
Besides the thick needles (Figure 2), here, mostly with diamond microcrystals, there are also significant thinner, whisker-like needles (Figure 5), mainly in quartz and orthoclase, which give distinct lower values of the Raman band. Besides the needles, there are also more or less isometric and statistic-distributed graphite grains (with about ~10 to 20 µm diameter). The Raman spectra of these grains show nondiamond carbon phases (see further above).

fig 5

Figure 5: Whisker-like lonsdaleite crystals in quartz-cristobalite-high tridymite of the minette sample from Cunsdorf near Elsterberg.

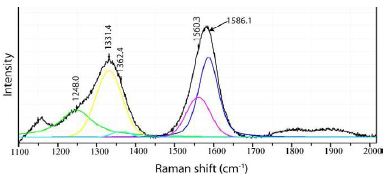
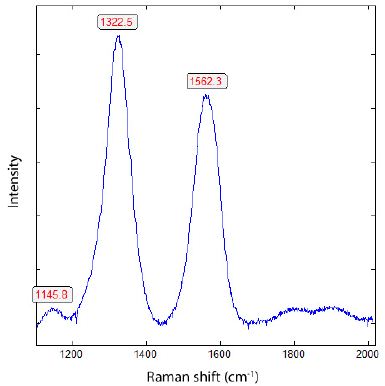
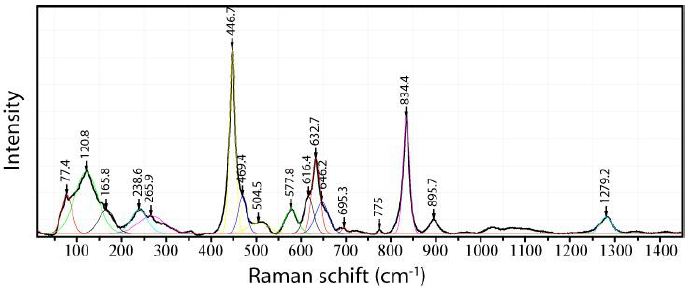
From the Raman measurement, we obtained for the whisker-like needles of lonsdaleite in quartz and orthoclase of the minette a mean for 15 different needles of 1323.5 ± 2.4 cm-1 an FWHM = 75.6 ± 10.9. Only a tiny number have diamond-like band positions: 1333.2 ± 3.1 cm-1 (n = 7). The astonishing is that the needles do not bend. Figure 6 shows a typical Raman spectrum of a lonsdaleite-like diamond from the minette sample. The carbon G-band is always present at around 1562 cm-1. In the case of the diamond, this G-band has significantly shifted to higher values than the lonsdaleite-like diamond: 1577 – 1586 cm-1.

fig 6

Figure 6: Raman spectrum of lonsdaleite-like diamond in orthoclase and quartz of the minette sample from Cunsdorf/E-Thuringa, Germany.

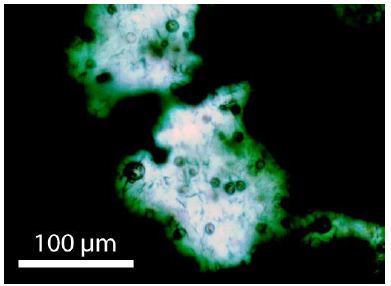
The minette sample contains relatively large amounts of quartz. Besides lonsdaleite-diamond-graphite needles, some such quartz grains include slight spheric inclusions of anatase [TiO2] (Figure 7). The formation of such small globules in quartz is considered a mystery alone. According to our studies, starting with Thomas et al. (2022) [10], spherical minerals, like the anatase here, are a solid hint to their speedy transport via supercritical fluids or melts.

fig 7

Figure 7: Many globules of anatase in minette quartz from Cunsdorf/E-Thuringa, Germany.

Anatase

Anatase is widespread as perfect crystals in the minette rock. An exception is the anatase globules (Figure 7) in irregular, tubular quartz aggregates. Obviously, there are two different age generations. The spheric anatase crystals, included in quartz, are introduced into the rock via supercritical phases. The interstitial quartz between the lonsdaleite whisker is partially composed of high-tridymite (extreme high 150 cm-1 Raman band) and cristobalite, which indicates a high temperature of about 1470°C [11,12].

Interpretation and Discussion

As a rule, lamprophyres seldom contain melt inclusions for the estimation of formation temperatures. Only for a kersantite in the Kirchberger granite (sample 296/85), Thomas (1989) [13] has determined a temperature of 1175°C from homogenization measurement on melt inclusion in apatite using a microscope heating stage. After the correlation of the bulk composition and the temperature (Thomas 1990) [14], the formation temperature of the lamprophyres should be1170 ± 37°C and corresponds very well with the measured data. If we take a temperature of 1200°C, it results in a minimum pressure of about 4.5 GPa (diamond-graphite equilibrium), which corresponds to a depth of about 150 km or more. Most diamonds in the typical minette rock show a transformation of diamond into carbon. Only the diamonds in orthoclase and quartz are well preserved. Therefore, we assume that the quartz and orthoclase are later added into the minette rock (see the globules of anatase), maybe by contamination of supercritical fluids/melts. So, the formation of the minette rock is at least a two-step process. Supercritical fluids use partially the same ascent ways. Up to now, the highest pressure determined is 12-15 GPa (Thomas 2024) [15,16], corresponding to a depth of about 560 km. We think that the same depth is conceivable for the origin of lamprophyres. Maybe supercritical fluids or melts use the same paths as lamprophyres, which are obviously their predecessors. Conceivable is also an interaction of both mantle related magmatic phases (supercritical fluid/melt and lamprophyre magma).

Acknowledgment

The studied minette sample 2210 from Cunsdorf near Elsterberg/ E-Thuringa is from Kramer. We dedicate this short contribution to Dr. Wolfgang Kramer for his 85 birthday in August 2024.

References

  1. Kramer W (1988) Magmengenetische Aspecte der Lithosphärenentwicklung. Akademie-Verlag Berlin. Pg: 136.
  2. Beuge P, Kramer W (1977) Lamprphyre Ostthüringens und ihre anomalen Quecksilbergehalte im Ergebnis endogener uns exogener Anreicherungsprozesse. Schriftenreihe geol Wiss. 8: 79-99.
  3. Pfeifer L, Kurze M, Mathe G (1981) Einführung in die Petrologie. Akademieverlag Berlin. Pg: 632.
  4. Reinisch, R (1904) Petrographisches Praktikum. Gebrüder Borntraeger, Berlin Part II, Pg: 180.
  5. Wahlstrom EE (1955) Petrographic John Wiley & Sons. Pg: 408.
  6. Von Wolff F (1951) Gesteinskunde – die Eruptivgesteine. RA Lang Verlag Pössneck. Pg:265.
  7. Kramer W, Just G (1995) Seltene Elemente in the spätvariszischen mafischen Ganggesteinen und Effusiva im Bereich der Uranlagerstätten des Westerzgebirges und Ostthüringens. Z geol Wiss. 23: 561-572.
  8. Tuschel D (2012) Raman crystallography, in theory and and Spectroscopy. 27: 2-6.
  9. Zaitsev AM (2001) Optical Properties of diamond – A Data Handbook. Springer. Pg:502.
  10. Thomas R, Davidson P, Rericha A, Recknagel U (2022) Water-rich coesite in prismatine-granulite from Waldheim/Saxony. Veröffentlichungen Museum für Naturkunde Chemnitz. 45: 5-44.
  11. Frondel C (1962) The System of Mineralogy, III Silica Wiley and Sons. Pg: 334.
  12. Kanzaki M (2019) Raman spectra of tridymite modifications: MC, MX-1, and PO-Journal of Mineralogical and Petrological Sciences. 114: 214-218.
  13. Thomas R (1989) Investigations of melt inclusion and their application to the solution of various problems of deposit geology and Dissertation B, Mining Academy Freiberg. Pg: 131.
  14. Thomas R (1990) Abschätzung der Bildungstemperatur magmatischer Z geol Wiss Berlin. 18: 5-15.
  15. Thomas R (2024) Rhomboedric cassiterite as inclusions in tetragonal cassiterite from Slavkovský les – North Geol Earth Mar Sci 6: 1-6.
  16. Thomas R, Davidson P, Rericha A, Recknagel U (2023) Ultrahigh-pressure mineral inclusions in a crustal granite: Evidence for a novel transcrustal transport mechanism. Geosciences 13: 1-13.

Psychological Impact of Breast Cancer Diagnosis and Treatment

DOI: 10.31038/AWHC.2024734


Breast cancer diagnosis and treatments are often associated with significant psychological distress impacting psychosocial adjustment to the disease process and health outcomes. This distress has been linked to poorer physical and mental health during treatment. The diagnosis of breast cancer can be profoundly distressing, creating enormous stress for patients who must navigate treatment choices, undergo testing, understand prognoses, manage treatments and side effects, and face uncertain futures. This process can also lead to or exacerbate existing psychological symptoms, such as anxiety and depression, and significantly impact psychological health and well-being, including quality of life and treatment compliance. Common psychological symptoms in breast cancer patients include anxiety, depression, impaired cognitive function, pain, sleep disturbances, sexual dysfunction, and fatigue. These symptoms can trigger fear of death or recurrence, altered body image, and diminished well-being. Psychological distress is particularly high at transition points in treatment, such as diagnosis, awaiting treatment, during and post-treatment, at follow-up visits, recurrence, and treatment failure [1,2].

Patients diagnosed with breast cancer often face multiple modalities of treatment, and the type of cancer treatment impacts psychological symptoms. Surgical procedures, radiotherapy, and chemotherapy are associated with significant psychological dysfunction. Anxiety, depression, and other psychological symptoms are prevalent and can persist long after treatment completion of these treatments.

The link between psychological and physical health in breast cancer patients is well-documented. Anxiety and depression can manifest as physical symptoms, impacting overall health outcomes. Addressing psychological symptoms can improve treatment adherence and quality of life, as well as reduce mortality rates in patients with depressive symptoms. Thus, screening for psychological distress and symptoms is crucial to comprehensive care for breast cancer patients. Screening and assessing psychological stressors are crucial for planning appropriate treatment approaches. Tools like the Distress Thermometer and Problem List, Hospital Anxiety and Depression Scale (HADS), and other standardized psychological assessments help identify and address psychological symptoms. The Institute of Medicine and the National Comprehensive Cancer Network emphasize the importance of distress screening as part of standard oncology care [3-5].

Research shows variability in psychological symptoms among breast cancer patients, influenced by factors like socioeconomic status, social support, and cultural background. Adjustment disorders, anxiety, depression, cognitive impairment, sleep disturbances, body image disturbances, sexual dysfunction, and post-traumatic stress are common psychological issues in this population.

Effective psychotherapeutic interventions for breast cancer patients include psycho-education, cognitive-behavioral therapy (CBT), mindfulness-based therapy, supportive-expressive therapy, meaning-centered psychotherapy, and acceptance and commitment therapy (ACT). These interventions address various psychological symptoms and improve coping skills, quality of life, and overall well-being. Research on psychosocial interventions in diverse populations is limited. Tailored, culturally informed assessments and treatments are necessary to address unique stressors faced by underrepresented groups, such as Black women, who experience higher mortality rates and distinct psychosocial challenges. Psychotropic medications play a crucial role in treating psychiatric symptoms in breast cancer patients. Medications must be carefully selected to avoid drug interactions with cancer treatments, such as tamoxifen.

Breast cancer diagnosis and treatment are associated with significant psychological distress, impacting overall health outcomes and quality of life. Routine assessment and targeted psychotherapeutic interventions are essential for managing psychological symptoms in breast cancer patients. Tailored treatments, including psychotropic medications and culturally informed approaches, can improve patient well-being, quality of life, and treatment adherence.

References

  1. Dinapoli L, Colloca G, Di Capua B, Valentini V (2021) Psychological aspects to consider in breast cancer diagnosis and treatment. Current Oncology Reports 23(3). [crossref]
  2. Chiriac VF, Baban A, Dumitrascu DL (2018) Psychological stress and breast cancer incidence: a systematic review. Clujul Med 91(1). [crossref]
  3. Zigmond AS, Snaith RP (1983) The Hospital Anxiety and Depression Scale. Acta Psychiatrica Scandinavica 67(6). [crossref]
  4. National Comprehensive Cancer Network (2012) Clinical Practice Guidelines in Oncology (NCCN Guidelines) Distress Management.
  5. Institute of Medicine (2008) Cancer Care for the Whole Patient: Meeting Psychosocial Health Needs.

Paternal Knowledge about Neonatal Danger Signs and Associated Factors in Bishoftu Town, Central Ethiopia, 2022: Community-based Cross-Sectional Study

DOI: 10.31038/AWHC.2024733

Abstract

Background: More than 8 in 10 neonatal deaths result from illnesses that are curable and preventable. In countries like Ethiopia, more frequently, male partners or spouses make the health care decision. Due to the majority of women entering the workforce, fathers now have the burden of raising their children, which has altered the traditional role of the father. Therefore, it is crucial to find out the paternal knowledge of neonatal danger signs.

Methods: A community-based cross-sectional study was conducted in Bishoftu city among 621 fathers from April 1 to 27, 2022. Participants were recruited using simple random sampling techniques and 610 completed the questionnaire. Data were collected through face-to-face interviews and entered into Epi-data version 3.1 and analyzed using SPSS version 26. Binary logistic regression was used for the analysis.

Results: The results of this study showed that fathers with good knowledge were found to be 44.3% (95% CI 40-48). The chances of having good knowledge were positively associated with urban residents (AOR=2.99, 95% CI 1.86-4.8), respondents whose wives had a history of operative delivery (AOR=2.95, 95 % CI 1.81-4.81), who accompanied their wives during the ANC visit (AOR=2.29, 95% CI 1.56 to 3.37), who had 3 or more children (AOR=3.86, 95% CI 2.19-6.8) and who obtained information from healthcare providers (AOR=2.34, 95% CI 1.58-3.45).

Conclusions: In this study, fathers’ knowledge of neonatal danger signs was found to be low. Therefore, all concerned bodies should strengthen the provision of health education on neonatal danger signs for mothers’ husbands.

Keywords

Father, Neonatal danger signs, Knowledge, Bishoftu town, Ethiopia

Introduction

The 28-day time following birth is known as the neonatal period, and it can be further divided into three categories: very early (birth to less than 24 hours), early (birth to <7 days), and late neonatal periods (7 days to <28 days). This period is the most dangerous time for a child’s survival with the highest risk of death during the first hour of the period. Neonatal danger signs are common manifestations related to a potentially serious problem that can be recognized by nonclinical individuals, such as the mother and other family members [1-3] and are used in the integrated management of neonatal and child illness (IMNCI) by professionals for recognizing infants who need medical treatment [1-4].

Approximately, 5.0 million children died before turning five, with 2.4 million of those deaths occurring in newborns. With one million newborn deaths in 2020, sub-Saharan Africa was responsible for 43% of all newborn deaths worldwide. After a gradual decline from 39 to 29 between 2005 and 2016, the neonatal death rate in Ethiopia increased to 30 per 1,000 live births in 2019. If current trends continue, more than 60 countries, 70% of which are in sub-Saharan Africa, will miss the SDG target for neonatal mortality, which is set at 12 deaths per 1,000 live births [5,6].

This alarmingly high death toll, most of which occurred at home where few mothers and families recognize the early warning signs of a newborn’s illness, serves as a stark reminder of the urgent need to end preventable deaths of children and young people. A study carried out in sub-Saharan African countries found that half of children under five years of age died at home and that this was associated with poor recognition of illness and care-seeking. Further research also revealed that one of the common reasons for delays in receiving appropriate care for serious newborn complications is a lack of understanding of the problem or danger signs by mothers, families, and other newborn caregiver [5-10].

Early identification of neonatal danger indicators by caregivers and prompt and appropriate referral have been the main strategies used to reduce neonatal mortality [4,11]. Young infants are more likely to show subtle disease symptoms, which are only noticeable to closest caregivers who are aware of the signs to look for. Therefore, the risk of neonatal death is reduced when caregivers are aware of the warning signs of newborn disease and act in their infant’s best interests by seeking medical attention [12].

Studies conducted in many different countries revealed that fathers or husbands’ knowledge of neonatal risk indicators was deficient. A study carried out in Kathmandu, Nepal, revealed that in 28.2% of cases, fathers’ awareness of newborn risk indicators was low, in 63.1% of cases, it was moderate, and in 8.7% of cases, it was high. According to a study conducted in Bungoma County, Kenya, 50% of fathers were aware of at least one neonatal danger sign. Ethiopian reports indicate that 40.7% of fathers knew three or more neonatal danger signs [13- 15]. Furthermore, only 34% of women delivered in Ethiopia seek PNC checks, and more than half of births take place outside of medical facilities [6]. Given the high proportion of home births and the lower utilization of PNC service, it is critical to investigate and improve parents’ awareness of the warning signs of newborn disease.

Paternal knowledge about neonatal danger signs has been influenced by several factors such as urban residence, source of information, the wife of respondent having a history of instrumental birth, accompanying the wife during ANC visits, income and educational level [14,15].

Although mothers are more involved in taking care of their children, fathers contribute significantly to the parenting of their new borns. In today’s society, a lot of women are in the labor force, which has changed the role of father, making them more engaged in the responsibilities of child rearing [16,17]. In developing countries like Ethiopia, health care decisions for women and children are made more often by their husbands/partners without women’s involvement; also, fathers are considered the “final decision makers” even when their partners are included in discussions [18-22]. Improving fathers’ awareness of important issues such as danger signs, is crucial, if they are the final decision makers for neonatal health [14]. So this research aims to assess paternal knowledge about neonatal danger signs and associated factors in the town of Bishoftu.

Methods

Study Setting, Design and Period

A community-based cross-sectional study design was employed to conduct this study in Bishoftu town between April 1 and 27, 2022. Bishoftu is one of the town administrations in the Oromia region of Ethiopia, located47 kilometers east of Addis Abeba. The town administration is made up of fourteen kebeles, five of which are rural and nine of which are urban. There were two public hospitals, five health centers, two private hospitals, and ten private clinics in the town that offered the people living in the catchment area a variety of medical services, from basic curative and preventive to advanced services. According to the Bishoftu town health office report of 2022, the town had a total population of 234,970 and 48,972 total numbers of households [23].

Source and Study Population

Source Population

All husbands with children less than 6 months of age in Bishoftu town.

Study Population

Husbands with children less than 6 months of age in randomly selected kebeles of Bishoftu town.

Eligibility Criteria

This study included all husbands who had children under six months of age and had lived in the Bishoftu town for at least six months.

Sample Size Determination

The sample size was determined using the estimated prevalence of good knowledge of neonatal danger signs among husbands of mothers who gave birth in the past six months from an earlier study done in Gurage zone using a single population proportion formula. Where, Zα/2 = 1.96, the margin of error = 0.05, p = proportion of husbands who have good knowledge of the neonatal danger signs, which was 40.7%, and q = 1-p.

formula

After accounting for the design effects of 1.5 and 10% non- response rates, the minimum sample size needed for this study was determined to be 621 [15].

Sampling Technique and Procedure

A multistage sampling method was used to draw the final sample size. The town of Bishoftu has 9 urban and 5 rural kebeles. Of these rural and urban kebeles (taking 35% of the total urban and rural kebeles), 3 urban and 2 rural kebeles was selected using simple random sampling technique (lottery method). From the rural kebeles, Kurkura and Kajima were selected, and from the urban kebeles, kebele 1, 7, and 9 were selected.

Households with fathers with children less than 6 months of age within the selected kebeles were listed from the family folder of the health extension workers. The total sample size was proportionally allocated to the selected kebeles based on the number of households with father who has children under 6 months of age in their respective kebeles. Then the final sample which was 621 was selected by a simple random sampling technique (using a computer generated list of random numbers) from a list of households with fathers with babies less than 6 months of age within selected kebeles which was extracted from the family folder of the health extension workers.

Study Variables

Dependent Variable

Paternal knowledge about neonatal danger signs.

Independent Variables

The independent variables include Socio-demographic factors (age of the father, age of the recent child, father level of education, wife level of education, father occupation, wife occupation, residence, religion, type of family and monthly household income), Obstetrical factors of the wives of the respondents (number of babies, place of birth of the last baby born, mode of delivery, wife ANC visit, accompanied by the husband during the antenatal care (ANC) visit and postnatal care (PNC), history of the last born baby sick, decision maker to seek care, history of child death ) and Information-related factors (source of information about neonatal danger signs).

Operational Deflnition and Measurements

Neonatal Danger Signs. signs that indicate abnormal health conditions and that occur during the first 28 days of life and includes difficulty breathing, fast breathing, lethargy or weakness, unconsciousness, convulsion, fever, coldness of the baby or hypothermia, umbilical Redness or discharge from the umbilicus, poor feeding or unable to suckle, Yellow palms/soles/eyes, Eye draining/pus/redness, and diarrhea [24-26].

Knowledge. Husbands’ level of awareness or mindfulness about neonatal danger signs. Consequently, fathers who were able to mention at least three neonatal danger signs among the 12 neonatal danger signs without prompt were regarded to have good knowledge. Fathers who mention two or less neonatal danger signs among the 12 neonatal danger signs without prompt were considered to have poor knowledge about neonatal danger signs [25,26].

Data Collection Tools and Techniques

A validated semi-structured questionnaire was used to gather the data. The questionnaire was prepared in English after reviewing pertinent literature. The questionnaire was translated into Afan Oromo and Amharic, then back-translated into English by professional translators to ensure consistency. To promote understanding, the questionnaire was given in both Amharic and Afan Oromo depending on the participants’ preferred language [14,15,24-30].

Data were collected by seven bilingual, trained data collectors, who were holders of bachelor’s degree in nursing under the guidance of health extension workers, through a face-to-face interview using a semi-structured questionnaire during home visits. Three experienced supervisors supervised the data collection process. The data was collected whenever the fathers were available, including on weekends and lunch time. Repeat visits were made when study households were found to be closed or when respondents were unavailable.

Data Quality Control

To ensure the quality of the data, a well-designed data collection instrument was constructed and pretested before the actual survey in a comparable setting in the town of Adama, involving 5% of the estimated sample size, following which the appropriate revisions and modifications were made accordingly. Data collectors and supervisors received two days of training on the instrument. The principal investigator reviewed the collected data daily to verify its completeness and consistency. The supervisors and the principal investigator were informed of the problems encountered during the data collection period for immediate action. Discussions were made with the interviewers to reduce errors made during the interview and to take timely corrective actions.

Data Processing and Analysis

The gathered data were manually checked and reviewed for completeness and consistency and then entered into Epi-Data V.3.1 and exported to SPSS V.26 for analysis. Cross tabulation was performed for the exploration of the data, to clean the missing values and to determine the expected count per cell. Bivariate and multivariable logistic regression models were used to investigate relationships between dependent and independent variables. Variables with a p-value < 0.2 in the bivariate analysis were considered candidates for inclusion in the multivariable logistic regression analysis.

Multicollinearity was checked to see the linear correlation among the independent variables by using variance inflation factor (VIF) and tolerance which was 4.33 and 0.25 respectively. The data was also assessed for potential confounding and interaction factor. The fitness of the model was tested using the Hosmer-Lemeshow goodness-of-fit test model, the value being 0.955. In the multivariable logistic regression analysis, variables with a p-value below 0.05 were considered to have a statistically significant relationship with the outcome variable. The adjusted odds ratio (AOR) at a 95% confidence interval (CI) was used to indicate the degree to which the independent variables explained the outcome variable. Descriptive statistics were employed to determine the frequency of different variables. The data were then presented using simple frequencies, tables, and figures.

Results

Socio-demographic Characteristics of the Respondents

A total of 610 respondents were included in the study, with a response rate of 98.2%. The mean age of the respondents was 34.35 years (SD ±6.509) and ranged from 22 to 49 years. Nearly two-thirds of the respondents (64.8%) had completed secondary school and 247(40.5%) of the study participants were government employees. More than half of the respondents (57.4%) were urban residents and 326(53.6%) were followers of the orthodox religion. More than half of the respondents (53.3%) had a female child (Table 1).

Table 1: Socio-demographic characteristics of husbands of mothers who gave birth in the last 6 months in Bishoftu town, Ethiopia, 2022 (n=610)

Variables

Category Frequency

Percentage (%)

Age of father

20-24

44

7.2

25-29

132

21.6

30-34

124

20.3

≥35

310

50.8

Age of the child in days 0-28

81

13.3

>28

529

86.7

Religion

Protestant

148

24.3

Orthodox

326

53.4

Catholic

34

5.6

Muslim

69

11.3

Wakefeta

33

5.4

Father’s level of education No formal education

43

7.0

Primary education

172

28.2

Secondary and above

395

64.8

Father’s occupation

Government employee

247

40.5

Private employee

149

24.4

Self-employed & daily labourer

139

22.8

Farmer

75

12.3

Mother’s level of education No formal education

52

8.5

Primary education

167

27.4

Secondary and above

391

64.1

Mother’s occupation

Government employee

83

13.6

Private employee

109

17.9

Self-employed & daily labourer

158

25.9

Farmer

15

2.5

Housewife

245

40.2

Family type Nuclear

480

78.7

Joint

130

21.3

Monthly household income <=4950

298

48.9

>4950

312

51.1

Obstetrics-related Characteristics of the Wives of the Respondents

Almost three-fourths of the wives of the respondents (72.1%) had a parity of greater than or equal to two, while the rest were primiparous. More than half of the wives of the respondents (56.9%) had delivered in the hospital. Almost all of the wives (97.4%) had attended ANC follow-up, and 292(47.9%) respondents had accompanied their wives during the visit.

Of those who accompanied their wife during ANC visits, 168(57.5%) have accompanied one time and only 3(1%) have accompanied 4 times. Four hundred fourty-nine (73.6%) respondents had visited their wives at the health facility postnatal care unit after they gave birth and 191(31.3%) of the respondents had accompanied their wives during discharge from the postnatal care unit and among them only 82(42.9%) of the respondents received postnatal discharge counseling on neonatal danger signs (Table 2).

Table 2: Obstetric characteristics of respondents’ wives who gave birth in the last 6 months in Bishoftu town, Ethiopia, 2022 (n=610).

Variables

Category Frequency

Percentage (%)

Number of babies

1-2

348

57.05

>=3

262

42.95

Place of birth of the last baby born

Health center

263 43.1

Hospital

347

56.9

Mode of delivery

SVD

435

71.3
Instrumental

109

17.9

CS

66

10.8

Accompany wife during PNC discharge Yes

191

31.3

No

419

68.7

History of last baby sick

Yes

189

31

No

421

69

Place of seeking care (n=189)

Health center

83

43.9

Hospital

104

55

Traditional healers

2

1.1

Decision-maker to seek care (n=189)

Husband

75

39.7

Wife

29

15.34

Wife’s relative

4

2.1

Husband and wife

81

42.86

Wife attends ANC

Yes

594

97.4

No

16

2.6

Frequency of ANC (n=594)

One times

6

1

Two times

15

2.52

Three times

152

25.6

Four times and above

421

70.88

Accompanied by the husband during a visit Yes

292

47.9

No

318

52.1

History of child death

Yes

5

0.8

No

605

99.2

Time to reach the nearest health facility <30 minutes

355

58.2

Notes: CS: Cesarean section; SVD: Spontaneous vaginal delivery; ANC: antenatal care

Paternal Knowledge about Neonatal Danger Signs

In general, 44.3% (95% CI 40-48) of the fathers had good knowledge about neonatal danger signs. Of the total of the respondents, 379 (62.1%) mentioned fever and 30(4.9%) mentioned jaundice or yellowish discoloration of palms / soles. Vomiting was also a commonly recognized danger sign by 358(58.9%) respondents in this study (Figure 1).
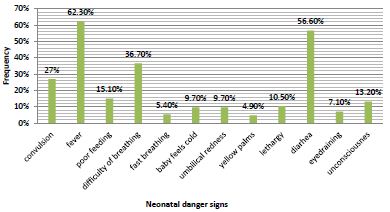
fig 1

Figure 1: Percentages of fathers who mentioned each neonatal danger signs in Bishoftu town, Ethiopia, 2022 (n=610).

Source of Information on Neonatal Danger Signs

The source of information on neonatal danger signs for more than half 343(56.2%) of the respondents were health professionals, while others received the information from the media, friends, and relatives.

Factors Associated with Paternal Knowledge of Neonatal Danger Signs

In the bi-variable logistic regression analysis factors such as father’s age, father’s level of education, residence, accompanying the wife during the ANC visit, mode of delivery, having at least three children and health professionals as a source of information showed a significant association with paternal knowledge of neonatal danger signs and then included in the multivariable analysis. In the multivariable logistic regression analysis, place of residence, accompanying the wife during the ANC visit, modes of delivery, having three or more children, and health professionals as a source of information were independently associated with paternal knowledge about neonatal danger signs in multivariable logistic regression analysis.

Compared to respondents who live in rural areas, those living in urban areas were 2.9 times more likely to have a good knowledge about neonatal danger signs (AOR= 2.99, 95% CI 1.86 to 4.81). Participants whose wives had a history of operative delivery were 2.9 times more likely to have a good knowledge of neonatal danger signs than those whose wives had a spontaneous vaginal delivery (AOR=2.95, 95 % CI 1.81 to 4.81).

Husbands who accompanied their wives during the ANC visit were 2.3 times more likely to have a good knowledge of neonatal danger signs than their counterparts (AOR=2.29, 95% CI 1.56 to 3.37). Those who had three or more children were 3.8 times more likely to have a good knowledge of neonatal danger signs than those with two or fewer children (AOR=3.86, 95% CI 2.19 to 6.8). Fathers who obtained information from healthcare professionals were 2.3 times more likely to have a good knowledge of neonatal danger signs than those who received information from other sources (AOR=2.34, 95% CI 1.58 to 3.45) (Table 3).

Table 3: Regression analysis of Factors affecting Paternal knowledge about neonatal danger signs in Bishoftu town, Ethiopia 2022 (n=610).

Variable

Category Knowledgeable Not knowledgeable COR (95% CI)

AOR (95% CI)

20-24

13 (29.5%)

31 (70.5%) 1 1

25-29

31 (24.5%) 101 (76.5%) 0.73 (0.34-1.57)

0.67 (0.28-1.59)

Father’s age 30-34

59 (47.6%)

65 (52.4%) 2.16 (1.04-4.52)

1.12 (0.48-2.63)

≥35

167 (53.9%)

143 (46.1%) 2.79 (1.40-5.53)

1.52 (0.65-3.59)

No formal

10 (23.3%)

33 (76.7%) 1

1

education
Father’s level of education Primary

37 (21.5%)

135 (78.5%) 0.9 (0.41-2.00)

0.43 (0.18-1.04)

Secondary and above

223 (56.5%)

172 (43.5%) 4.28 (2.05-8.92)

1.92 (0.82-4.48)

Rural

74 (28.5%)

186 (71.5%) 1

1

Residence Urban

196 (56%)

154 (44%) 3.19 (2.27-4.50)

2.99 (1.86- 4.8)*

Number of children <=2

129 (37.1%)

219 (62.9%) 1

1

>=3

141 (53.8%)

121 (46.2%) 1.98 (1.43-2.74)

3.86 (2.19- 6.8)*

Mode of delivery Normal SVD

181 (41.6%)

254 (58.3%) 1

1

Operative delivery

89 (50.9%)

86 (49.1%) 1.45 (1.02-2.07)

2.95 (1.81- 4.81)*

Accompanying wife during ANC visit No

102 (32.1%)

216 (67.9%) 1

1

Yes

168 (57.5%)

124 (42.5%) 2.87 (2.06-3.99)

2.29 (1.57- 3.37)*

HCP as a source of information No

90 (33.7%)

177 (66.3%) 1

1

Yes

180 (52.5%)

163 (47.5%) 2.17 (1.56-3.02)

2.34 (1.58- 3.5)*

Notes: *Significant at p<0.001; ANC: Antenatal Care; AOR: Adjusted OR; COR: Crude Odd Ratio; SVD: Spontaneous Vaginal Delivery; HCP: Health Care Provider.

Discussion

This study was carried out in Bishoftu town to assess paternal knowledge of neonatal danger signs and pinpoint associated factors for it. According to this study, 44.3% of fathers had good knowledge about neonatal danger signs. This finding is consistent with the finding from Gurage zone, Ethiopia (40.7%). However, this finding was lower than the findings in Bungoma County; Kenya(50%), and Kathmandu; Nepal (71.8%). The possible reason for this variation could be variations in participants’ socio-demographic characteristics and availability and accessibility of health services infrastructures, sampling techniques, methods used to assess knowledge and study settings [13-15].

The discrepancy of this study from the study conducted in Kenya could be due to the difference in the sampling technique and the cut point of the measurements, the former study respondents were recruited through the convenience sampling method from those accompanying their female partners to healthcare clinics, 75.6% of the respondents had completed secondary school or higher, and those who mentioned at least one neonatal danger sign were considered to have good knowledge, while in this study, respondents were included from the selected household with fathers in the community, 64.8% of the respondents had completed secondary school or higher, and those who mentioned 3 neonatal danger signs were considered to have good knowledge. In the study conducted in Nepal, the Non-probability purposive sampling technique was used to select fathers who had newborn babies up to 7 days admitted to the Maternity Ward and Birthing Center, and the Likert scale was used to measure their level of knowledge, as a result, this led to the observed difference.

Husbands who lived in urban residences, who accompanied their wives during ANC visits, and whose wives delivered babies through operative delivery were more likely to have good knowledge of neonatal danger signs. Furthermore, fathers who have three or more children and those who received the information from health professionals were significantly associated with having good knowledge.

In the current study, fathers who live in urban areas were more likely to have a good knowledge of neonatal danger signs compared to those who live in rural areas which is supported by the study conducted in Gurage zone and Chencha District [15]. This is due to the fact that most rural residents have lower access to and use certain health information sources and infrastructures relative to urban residents, including care providers, doctors, blogs, magazines, and mass media, which enable them to acquire information related to health. They also had lower use of search engines for health information and lower access to healthcare services [31,32].

Fathers whose wives had a history of operative delivery were more likely to have good knowledge compared to those whose wives had a spontaneous vaginal delivery. This is similar to the study done in Gurage zone. Due to an increasing number of days of stays in the health facility for operative delivery, the husband may have a high chance of contact with healthcare providers; thus, this allows one to seek and acquire knowledge about his newborn.Fathers who accompanied their wives during ANC visits were more likely to have good knowledge about neonatal danger signs than their counterparts. This is supported by the study conducted in Gurage zone.This may be because fathers may receive counseling from health professionals about pregnancy and newborn illnesses during accompanying ANC visits.Respondents who had three or more children were more likely to have good knowledge compared to those with no more than two children. This result is in line with a study conducted in Gurage zone. The Chance of Husbands’ exposure to different child problems increases, thus increasing their awareness about danger signs manifested by their children. Also, there is an increased likelihood of access to health institutions and postnatal services with community health workers, which can increase husbands’ interactions with healthcare professionals, providing them with more opportunities to gain knowledge about their infants’ health [15].

This study indicated that fathers who acquired information from healthcare providers were more likely to have good knowledge about neonatal danger signs than those who acquired information from other sources. This result is supported by studies done in the Gurage zone and in the town of wolkite. This could be related to the commitment of healthcare providers to provide appropriate information on newborn health issues in a memorable way compared to other sources and learners, who can concentrate better on the information given by healthcare professionals [15,33].

Level of education was not associated with the father’s level of knowledge about neonatal danger signs. This is similar with the study done in Chencha District [31] but inconsistent with the study conducted in Gurage and in the town of wolkite. The reason for this discrepancy could be due to the fact that health extension workers and other health care professionals provide health information or counseling related to neonatal health problems, regardless of the educational status of the father [15,33].

Strengths and Limitations of the Study

This community-based study was crucial to investigate factors that could predict paternal knowledge by reaching out to those who cannot access health facilities for various reasons.

However, due to the nature of the cross-sectional study design that assesses exposure and outcome at the same time, the results might not indicate reverse causality. This study is not free of recall bias because all fathers were interviewed about the content of their child who was older than 28 days of age. There is limited literature for reference.

Conclusion

In this study, the magnitude of paternal knowledge about neonatal danger signs is found to be 44.3%. Living in an urban area, having wives who have had previous operative deliveries, accompanying wives to appointments at the ANC, having three or more children and having healthcare providers as a source of information were the factors that contributed significantly to paternal knowledge of neonatal danger signs.

It is important that the stakeholders come up with specific educational and sensitization programs that can help reduce the knowledge gap of fathers who live in rural areas and with a strategy to increase husband participation in accessing maternal and child health services.

Abbreviations and Acronyms

ANC: Antenatal Care; AOR: Adjusted Odd Ratio; CI: Confidence Interval; COR: Crude Odd Ratio; HCP: Health Care Provider; IMNCI: Integrated Management of Neonatal and Child Illness; PNC: Postnatal Care; SVD: Spontaneous Vaginal Delivery; SDG: Sustainable Development Goal; VIF: Variance inflation ratio.

Acknowledgement

The authors wish to express their gratitude to the Arba Minch University School of Nursing and the Bishoftu Town Health Office for providing us the needed assistance. The authors also would like to thank the data collectors and supervisors who participated in this study.

Declarations

Ethics Approval and Consent to Participate

The studies involving human participants were reviewed and approved by the institutional research review board of the Arba Minch University School of Medicine and Health Sciences with the approval number AMU-IRB-19/2022. A formal letter from Arba Minch University was sent to the offices concerned and the Kebele Health extension workers. Permission letters were received from the Oromia Regional Health Bureau. All study participants were informed about the purpose of the study and their right to refuse to participate, and written and informed consent was obtained before the interview. The respondents were informed that the information obtained will be kept confidential and will not cause them any harm. This study was carried out in accordance with the principles of the Declaration of Helsinki. During data collection, possible COVID-19 prevention measures were implemented.

Competing Interests

The authors declare that they have no competing interests.

Funding

This study received financial support from Arba Minch University College of Medicine and Health Sciences.

Data availability Statement

Data will be made available on request.

Author Contributions

B.T.O and H.I.G. conceived the study, participated in its design and coordination, initiated the research, carried out the statistical analysis, interpreted the results, and wrote the final manuscript, critically reviewing it. N.D.M., E.N.W., and M.G.W. participated in the study’s design, guided the statistical analysis, and critically reviewed the manuscript. F.H.H., S.S.A., and H.Z.A. were involved in principal supervision, participated in the study’s design and coordination, edited the manuscript, Cover Letter and critically reviewed the manuscript. B.T.O. has main responsibility for the final content, and makes the decision to publish. The authors have read and approved the final manuscript.

References

  1. Robert Kliegman, editor. Nelson 19th.
  2. Lucia Hug DS. Levels & Trends in Child Mortality(2019) – Report 2019 [Internet]. Available from: https://www.unicef.org/media/60561/file/UN-IGME-child- mortality-report-2019.pdf
  3. Jhpiego (2004)Monitoring birth preparedness and complication readiness: tools and indicators for maternal and newborn 1–338. Available from: http://pdf.usaid. gov/pdf_docs/PNADA619.pdf
  4. Basaleem, Amin.(2011) Integrated Management of Childhood Illness in Lahej, Yemen: A qualitative analysis from the perspective of health providers East Mediterr Heal J.17(2) [crossref].
  5. Kantorova V, Kariuki S (2021)Levels & Trends in child mortality.
  6. Ethiopian Public Health Institute. Ethiopia Mini Demographic and Health Survey. EPHI AND ICF. 2019.
  7. Assefa N, Lakew Y, Belay B, Kedir H, Zelalem D, Baraki N, et al. (2016)Neonatal mortality and causes of death in Kersa Health and Demographic Surveillance System (Kersa HDSS), Ethiopia, 2008–2013 Matern Heal Neonatol Perinatol .2(7) Available from: http://dx.doi.org/10.1186/s40748-016-0035-8
  8. Nigatu SG, Worku AG, Dadi (2015)Level of mother’s knowledge about neonatal danger signs and associated factors in North West of Ethiopia: A community based study. BMC Res Notes.8(309)
  9. Price J, Lee J, Willcox M, Harnden A.(2019) Place of death, care-seeking and care pathway progression in the final illnesses of children under five years of age in sub- Saharan Africa: A systematic review J Glob Health9(2) [crossref]
  10. Syed U, Khadka N, Khan A, Wall S.(2008) Care-seeking practices in South Asia: Using formative research to design program interventions to save newborn lives. J Perinatol: S9–13. [crossref]
  11. Bhutta ZA, Darmstadt GL, Hasan BS, Haws RA (2005)Community-based interventions for improving perinatal and neonatal health outcomes in developing countries: A review of the evidence. Pediatrics.115(2) [crossref].
  12. Tiwari G, Thakur AK.(2018) Health care seeking behavior for common childhood illnesses in Birendranagar nepal.17(3) Available from: http://dx.doi.org/10.1371/ pone.0264676
  13. Dangol R, Koirala R (2020)Awareness of Fathers Regarding Newborn Danger Signs: Evidence from a Tertiary Level Hospital of Kathmandu, Open J Nurs 10(2).
  14. Roney E, Morgan C (2021)Men’s and women’s knowledge of danger signs relevant to postnatal and neonatal careseeking: A cross sectional study from Bungoma County, PLoS One Available from: http://dx.doi.org/10.1371/journal.pone.0251543
  15. Solomon shitu hai Greenspan JA, Chebet JJ, Mpembeni R, Mosha I, Mpunga M, Winch PJ, et (2019)Men’s roles in care seeking for maternal and newborn health: A qualitative study applying the three delays model to male involvement in Morogoro Region, Tanzania. BMC Pregnancy Childbirth. 19(293)
  16. Yogman M, Garfield CF (2016)Fathers’ roles in the care and development of their children: Pediatrics. 138(1) [crossref]
  17. RM, R. S (2013)A study on father’s knowledge and attitude towards their role in child care in selected areas of Mangalore with a view to develop an informational booklet. J Heal Allied Sci NU. 03(02)
  18. Greenspan JA, Chebet JJ, Mpembeni R, Mosha I, Mpunga M, Winch PJ, et (2019) Men’s roles in care seeking for maternal and newborn health: A qualitative study applying the three delays model to male involvement in Morogoro Region, Tanzania. BMC Pregnancy Childbirth.19(1)
  19. Osamor P, Grady C. (2018)Factors associated with women’s health care decision- making autonomy: Empirical evidence from Nigeria J Biosoc Sci.50(1)[crossref]
  20. Nigatu D, Gebremariam A, Abera M, Setegn T, Deribe (2014) Factors associated with women’s autonomy regarding maternal and child health care utilization in Bale Zone: A community based cross-sectional study BMC Womens Health. 2014(1)
  21. Asabu MD, Altaseb DK.(2021) The trends of women’s autonomy in health care decision making and associated factors in Ethiopia: evidence from 2005, 2011 and 2016 DHS BMC Womens Health . 21(1) Available from: https://doi.org/10.1186/ s12905-021-01517-9
  22. Ridgwell A, Flintan F.(2007)Gender and Pastoralism, Livelihood and income generation in Ethiopia. V(2)
  23. Bishoftu town health office report of 2022.
  24. World Health Organization (WHO)(2013) WHO recommendations on postnatal care of the mother and newborn. Geneva: World Health Organization. 1–72 p.
  25. Kibaru EG, Otara AM (2016)Knowledge of neonatal danger signs among mothers attending well baby clinic in Nakuru Central District, Kenya: cross sectional descriptive study. BMC Res Notes.9(1)
  26. Kebede AA, Cherkos EA, Taye EB (2020)Mother ’ s Knowledge of Neonatal Danger Signs and Health-Seeking Practices and Associated Factors in Debretabor, Northwest Ethiopia : A Community-Based Cross-Sectional Study.Research and Reports in Neonatology.v( 2020);
  27. Ismail SA, McCullough A, Guo S, Sharkey A, Harma S, Rutter P (2019)Gender- related differences in care-seeking behaviour for newborns: A systematic review of the evidence in South Asia. BMJ Glob Heal. 4(3) [crossref]
  28. Assessment of Mothers Level of Knowledge About Neonatal Danger Signs and Its Associated Factors in St Paul’s Hospital Millenium Medical College Addis Ababa Ethiopia (2020)J Med Physiol Biophys.vol 67,Available from: https://pdfs. org/6467/5493dfd2ebb451cb0e591d0a5632579f23a9.pdf
  29. Dida G.(2020) Knowledge and attitude of postnatal mothers on essential newborn care practices at Marsabit county referral Available from: http://erepository. uonbi.ac.ke/handle/11295/154065
  30. Oscar Shea, Kiersten J.(2004) the DHS wealth index.
  31. Mersha A, Assefa N, Teji K, Bante A, Shibiru (2017) Mother ’ s Level of Knowledge on Neonatal Danger Signs and Its Predictors in Chencha District , Southern Ethiopia.6(5) Available from: https://www.researchgate.net/publication/320796153_ Mother’s_Level_of_Knowledge_on_Neonatal_Danger_Signs_and_Its_Predictors_ in_Chencha_District_Southern_Ethiopia
  32. Schofield E, Li Y, Kiviniemi MT (2020)Differences in Rural and Urban Health Information Access and UseJ Rural Health.35(3) .[crossref].
  33. Town W, Zone G (2017) Mother’s knowledge and Practice about Neonatal Danger Signs and Associated Keywords 1-7.
Canine Babesiosis in Austria in the 21st Century – A Review of Cases

DOI: 10.31038/IJVB.2024814


Babesia canis is a piroplasmid species that affects domestic dogs and can lead to a variety of clinical signs, ranging from mild and transient febrile illness to life-threatening inflammatory conditions [1]. Due to its close connection with its vector, the ornate tick Dermacentor reticulatus, its distribution was previously considered to be limited to the focal distribution of this tick species around the palearctic [2]. However, D. reticulatus is now considered to be spreading throughout Europe [3-8]. Therefore, a spread of B. canis is expected and with it an increase of cases. However, canine babesiosis is not a notifiable disease and so there are no official records of infections diagnosed. From a clinical point of view, the time for the highest risk of infection is difficult to predict. Austria has long been described as endemic für B. canis, but the frequency of cases in different parts of the country has not been analyzed. Based on data from two animal clinics in eastern Austria, the frequency of cases over 20 years and the origin of the dogs were evaluated. An increase in cases over time could not be detected. This might be due to the rather short time period evaluated (20 years) or the seasonal and annual fluctuation of cases; the mean of the three lowest numbers of cases per year was 7, the mean of the three highest numbers was 53 cases, and most cases were recorded in April and October, although year-round transmission, confirming a corresponding activity of D. reticulatus [6] was observed. Other factors that could contribute to this are an increased effective tick prevention in Austrian dogs in general, and changing awareness of canine babesiosis among practitioners or owners. Corresponding to this rather stable rate of infections diagnosed each year, a constant and repeated import of B. canis-positive dogs from endemic areas seemed to “renew” the pool of positive animals presented to the clinics. Interestingly, imported cases were restricted to eastern Austria, while presumed autochthonous cases were reported mainly, but not exclusively, from this part of the country. A confounder for these results are the locations of the two reporting clinics in eastern Austria. However, a primary focus on eastern (and southern) Austria is supported by earlier works based on questionnaires provided by veterinary practitioners [7].

From this work, several conclusions can be drawn:

  1. it seems difficult to predict a spread of canis based on data for D. reticulatus alone (although data on vector presence are highly valuable to estimate the risk of pathogen establishment after introduction).
  2. more data are required to define risk areas for canis both at the regional and the international level, due to the movement of dogs within a country and across borders;
  3. the unrestricted movement of dogs over long distances must be monitored to control the introduction of pathogens into formerly non-endemic countries and the spread of pathogens in new areas;
  4. the former recommendation to focus on tick control in spring and autumn must be revised, since several hard ticks, including reticulatus, show year-round activity and this is reflected by year-round diagnosis of B. canis;
  5. the awareness for canis as a canine pathogen must be extended to practitioners and owners in locations where the parasite and its vector are not (yet) well known due to low or absent endemicity.

References

  1. Beletić A, Janjić F, Radaković M, Spariosu K, Francuski Andrić J, Chandrashekar R, Tyrrell P, Radonjić V, Balint B, Ajtić J, Kovačević Filipović M, et (2021) Systemic inflammatory response syndrome in dogs naturally infected with Babesia canis: Association with the parasite load and host factors. Veterinary Parasitology 291: 109366. [crossref]
  2. Hornok S (2018) Dermacentor reticulatus (Fabricius 1794) In: Estrada-Peña A, Mihalca AD, Petney TN (eds.) Ticks of Europe and North America. A Guide to Species Identification. Springer, Stuttgart. pp 287-291.
  3. Földvári G, Široký P, Szekeres S, Majoros G, Sprong H (2016) Dermacentor reticulatus: a vector on the Parasites & Vectors 9(1): 314. [crossref]
  4. Daněk O, Hrazdilová K, Kozderková D, Jirků D, Modrý D (2022) The distribution of Dermacentor reticulatus in the Czech Republic re-assessed: citizen science approach to understanding the current distribution of the Babesia canis Parasites & Vectors 15(1): 132. [crossref]
  5. Brugger K, Rubel F (2023) Tick maps on the virtual globe: First results using the example of Dermacentor reticulatus. Ticks and Tick Borne Diseases 14(2): 102102. [crossref]
  6. Probst J, Springer A, Topp AK, Bröker M, Williams H, Dautel H, Kahl O, Strube C (2023) Winter activity of questing ticks (Ixodes ricinus and Dermacentor reticulatus) in Germany – evidence from quasi-natural tick plots, field studies and a tick submission Ticks and Tick Borne Diseases 14(6): 102225. [crossref]
  7. Halos L, Lebert I, Abrial D, Danlois F, Garzik K, Rodes D, Schillmeier M, Ducrot C, Guillot J (2014) Questionnaire-based survey on the distribution and incidence of canine babesiosis in countries of Western Europe. Parasite 21: 13 [crossref]
  8. Drehmann M, Springer A, Lindau A, Fachet K, Mai S, Thoma D, Schneider CR, Chitimia- Dobler L, Bröker M, Dobler G, Mackenstedt U, Strube C (2020) The Spatial distribution of Dermacentor ticks (Ixodidae) in Germany-evidence of a continuing spread of Dermacentor reticulatus. Frontiers in Veterinary Science 25(7): 578220. [crossref]

Seroconversion in Gilts Vaccinated with a Two-shot M. hyopneumoniae Vaccine at the End of Rearing Period – Case Report

DOI: 10.31038/IJVB.2024813

Abstract

Mycoplasma hyopneumoniae, the etiology of enzootic pneumonia, is a chronic respiratory disease with a worldwide distribution. Prevention is performed through vaccination of suckling piglets, while newly introduced gilts are often boostered prior to arrival at the sow farm. The present case describes a study in a gilt rearing farm where gilts, boostered with a two-shot M. hyopneumoniae vaccine at 18-22 weeks of age after their early vaccination at 3 days of age, were serologically positive after the second vaccination. To elucidate if the seroconversion was due to booster vaccination or circulating M. hyopneumoniae infection, a comparative trial was designed. Following the second vaccination at 22 weeks of age, serological titers of gilts in the Vaccine group were increasing and all gilts became serologically positive, without any TBS detection of circulating M. hyopneumoniae. Therefore, it can be concluded that administration of a booster vaccination for M. hyopneumoniae to rearing gilts, already vaccinated in early life with a one-shot M. hyopneumoniae vaccine, induced an increase in both serological titers and the percentage of M. hyopneumoniae positive animals at the end of the rearing period.

Keywords

Mycoplasma hyopneumoniae, Seroconversion, TBS, Booster vaccination, Gilts

Abbreviations: DOI: Duration of Immunity; ELISA: Enzyme- Linked Immunosorbent Assay; IAV-S: Influenza A Virus – Swine; M. hyo: Mycoplasma hyopneumoniae; mPCR: Multiplex PCR; PCMV: Porcine Cyto Megalo Virus; PCV-2: Porcine Circo Virus – type 2; PRCV: Porcine Respiratory Corona Virus; PRRSV: Porcine Reproductive and Respiratory Syndrome Virus; S/P: Serum to Positive; SEM: Standard Error of the Mean; TBS: Trachea-bronchial Swab; USA: United States of America

Introduction

Mycoplasma hyopneumoniae (M. hyopneumoniae) is a chronic respiratory pathogen with a worldwide distribution. Enzootic pneumonia, the disease caused by M. hyopneumoniae, is considered to affect up to 70% of the swine herds in most pig producing countries. The disease is associated with high economic losses due to reduced performance, increased treatment costs and supplementary costs related to preventive vaccination [3]. To prevent spread from gilts and sows to piglets during the suckling period, intensive vaccination programs have been implemented to increase the acquired immunity to M. hyopneumoniae in the sow herd. The present case describes a study in a gilt rearing farm vaccinating the newborn gilts with a one-shot M. hyopneumoniae vaccine at day 3 of age (Stellamune One, Elanco AH) followed by a booster vaccination during the second part of the rearing period using a two-shot M. hyopneumoniae vaccine (Stellamune Mycoplasma, Elanco AH) at 18 and 22 weeks of age. Following the booster vaccination, increased serological titers are observed that might interfere with the M. hyopneumoniae serological monitoring performed at the end of the rearing period, just prior to or at gilt delivery to the multiplier sow farm location. Besides booster vaccination to M. hyopneumoniae, potential M. hyopneumoniae circulation at the end of the rearing period might also have an impact on the serological response to M. hyopneumoniae. Therefore, a comparative trial was conducted in a gilt-rearing system to determine if the serological response to M. hyopneumoniae was due to the booster vaccination on itself or the potential M. hyopneumoniae infection circulating within the gilts.

Aim of the Study

The study objective was to determine the cause of potential occurrence of seroconversion to M. hyopneumoniae following a double booster vaccination for M. hyopneumoniae with a two-shot vaccine at the age of 18 and 22 weeks.

Materials and Methods

Gilts from the same farm of origin were placed in two different rearing compartments for the comparative trial. The gilts were followed up throughout the entire rearing period through blood serum sampling and collection of trachea-bronchial swab (TBS) samples [7] combined with mPCR at 18-22-26 and 29 weeks of age. The blood samples were analyzed using the IDEXX ELISA Mhyo Ab kit for the presence of antibodies to M. hyopneumoniae. Results were reported as S/P ratios and were categorized into positive (S/P > 0.40) or negative (S/P ≤ 0.40) for further statistical analysis. The TBS samples were analyzed using a mPCR detecting multiple respiratory pathogens including M. hyopneumoniae as previously described [9]. Other respiratory pathogens examined were Porcine Reproductive and Respiratory Syndrome Virus (PRRSV), Influenza A Virus – Swine (IAV-S), Porcine Circo Virus – type 2 (PCV-2), Porcine Cyto Megalo Virus (PCMV), Porcine Respiratory Corona Virus (PRCV), and Mycoplasma hyorhinis. Results were reported as positive or negative for the presence of M. hyopneumoniae genetic material in the samples. The rearing gilts in the Control group remained exceptionally unvaccinated at 18 and 22 weeks of age to evaluate the serological kinetics at the end of the rearing period without a booster vaccination for M. hyopneumoniae. The rearing gilts in the Vaccine group received their standard booster vaccination at 18 and 22 weeks of age and were treated orally with tiamulin for 7 days after their second vaccination to omit potential spread of M. hyopneumoniae that might interfere with seroconversion to M. hyopneumoniae. During each visit related to the collection of the different samples, clinical observation towards the presence of signs of respiratory disease were performed and documented. All information on vaccination, sampling and antimicrobial treatment is given in Table 1.

Table 1: Overview of all interventions related to vaccination, blood and treacheobronchial swab (TBS) sampling, and antimicrobial treatment in the rearing gilts of the unvaccinated Control group and the vaccinated Vaccine group.

Group

Control

Vaccine

Week

Vacc* Blood TBS** Ab*** Vacc* Blood TBS**

Ab***

18

X X X X X
22 X X X X X

7 d

26

X X X X
29 X X X X

*Vacc, vaccination with an M. hyopneumoniae two-shot vaccine (Stellamune Mycoplasma; Elanco AH).
**TBS, trachea-bronchial swab sampling.
***Ab, antimicrobial treatment with tiamulin for 7 d following the 2nd vaccine administration.

Results

Serological Results

The S/P ratio of the gilts in the Control group was 0.39 ± 0.07 (18 wks; minimum 0.28, maximum 1.05) and significantly increased (< 0.05) to 0.54 ± 0.08 (22 wks; minimum 0.34, maximum 1.17) and a maximum of 0.68 ± 0.09 (26 wks; minimum 0.40, maximum 1.26; < 0.01). In the Vaccine group, the S/P ratio of the gilts was 0.20 ± 0.05 (18 wks; minimum 0.00, maximum 0.75) and significantly increased (P < 0.001) to 1.34 (22 wks; minimum 0.77, maximum 2.07) and a maximum of 1.41 (26 wks; minimum 0.92, maximum 1.30) (Figure1).

fig 1

Figure 1: Serological results (expressed S/P ratio ± SEM) of M. hyopneumoniae IDEXX ELISA at 18-22-26 and 29 weeks of age in rearing gilts in the unvaccinated Control (orange) and double vaccinated Vaccine (blue) group. The dashed red line is the ELISA S/P cut-off value of 0.40 between negative and positive serological results.

The percentage of serologically positive gilts (S/P > 0.40) in the Control group was 30% (18 wks) and reached a maximum at 26 wks (80%). The percentage remained at this level during the entire further study period. In the Vaccine group, the percentage of serologically positive gilts was 20% (18 wks) and reached its maximum (100%) at 22 wks. The percentage remained at this level during the entire further study period (Figure 2).

fig 2

Figure 2: Serological results (expressed S/P ratio ± SEM) of M. hyopneumoniae IDEXX ELISA at 18-22-26 and 29 weeks of age in rearing gilts in the unvaccinated Control (orange) and double vaccinated Vaccine (blue) group.

Trachea-bronchial Swab Results

The TBS swabs were all negative for M. hyopneumoniae at 18- 22-26 and 29 weeks of age in both study groups, indicating that no circulating M. hyopneumoniae infection was present in the Control nor in the Vaccine group. The only other pathogen that could be detected was Porcine Cyto Megalo Virus (PCMV) at 22 weeks in the gilts of the Vaccine group and at 26 weeks in the gilts of the Control group.

Clinical Observation Results

Overall, no clinical signs of respiratory disease could be observed upon the different visits related to the collection of the samples in the comparative study.

Discussion

To date, very limited data are available regarding the effect of a late booster vaccination for M. hyopneumoniae, since most M. hyopneumoniae vaccines are administered early in life during the suckling period of the piglets (3 days to 3 weeks of age). Early vaccination has been shown to mount a sufficient immunity to protect the piglets during their productive life until slaughter [4] showing a convalescent serological immune response in response to a late infection at 77 to 105 days of age. Another study [6] demonstrated that early vaccination at 1 week of age combined with a late M. hyopneumoniae challenge at 25 weeks of age could reduce the lung lesions related to M. hyopneumoniae. Another study where early vaccinated pigs were exposed to a concurrent natural infection including M. hyopneumoniae, Influenza Virus A – Swine (IAV-S) and PRRSV at 25 weeks of age confirmed less lung lesions and better performance in the early vaccinated group [1].

A recent study comparing an early one-shot M. hyopneumoniae vaccination with an additional administration at 112 days or two additional administrations at 112 and 157 days, respectively, demonstrated a major seroconversion to M. hyopneumoniae at 194 days of age in the triple vaccinated group [10]. In contrast, in the current study, we applied a combination of a one-shot vaccination at 3 days of age with a two-shot vaccination at 18 and 22 weeks of age.

Most commercial vaccine product SPC’s indicate a duration of immunity (DOI) of 22-26 weeks after vaccination. Therefore, in the case of rearing gilts that are raised to go beyond the regular 6 months of age at slaughter, there is the need to boost immunity to M. hyopneumoniae at the end of their rearing period. This is necessary to protect the gilts from a new infection with M. hyopneumoniae and to omit massive excretion of M. hyopneumoniae from infected gilts to suckling piglets during their first lactation.

For this purpose, schedules have been developed under USA conditions to infect gilts with M. hyopneumoniae between 80 and 100 days of age to mount sufficient immunity at young age and decrease the risk of M. hyopneumoniae excretion during the first lactation [5]. However, active infection of gilts with M. hyopneumoniae through intratracheal inoculation, fogging or other means is not widely accepted or performed under European conditions [2].

Therefore, vaccination is the preferred method to extend and increase protection of the rearing gilts into their reproductive life on the sow farm. However, in some cases, when performing a serological evaluation of gilts upon arrival at the multiplier sow farm location, M. hyopneumoniae serologically positive titers are observed in these gilts, although they originated from an M. hyopneumoniae negative nucleus sow herd. To elucidate if booster vaccination for M. hyopneumoniae could affect the serological profile of rearing gilts, a comparative study was performed on two groups of rearing gilts in an M. hyopneumoniae negative nucleus herd. From the obtained results, booster vaccination significantly increased both the average S/P ratio to M. hyopneumoniae and the percentage of M. hyopneumoniae serologically positive animals in the vaccinated group, while no concurrent M. hyopneumoniae infection was present as shown by the M. hyopneumoniae negative mPCR TBS samples.

Conclusions

Administration of a booster vaccination for M. hyopneumoniae to rearing gilts, already vaccinated in early life with a one-shot M. hyopneumoniae vaccine, induced an increase in both serological titers and the percentage of M. hyopneumoniae positive animals at the end of the rearing period. This increase, without M. hyopneumoniae circulation in the respiratory tract, might under field circumstances give the impression of M. hyopneumoniae infection due to the high serological titers. However, the optimal technique to demonstrate active M. hyopneumoniae remains the collection of TBS samples in clinically diseased, coughing animals as previously shown [7,8].

Conflict of Interest

No conflict of interest to be reported by any of the authors.

Acknowledgements

The authors acknowledge the support of the farm staff in the follow-up of both study groups under field conditions and their assistance during sampling.

References

  1. Del Pozo Sacristán R, Sierens A, Marchioro SB, Vangroenweghe F, Jourquin J, Labarque J, Haesebrouck F, Maes D (2013). Efficacy of early Mycoplasma hyopneumoniae vaccination against mixed respiratory disease in older fattening Vet. Rec. [crossref]
  2. Garza-Moreno L, Segalés J, Pieters M, Romagosa A, Sibila M. 2018. Acclimation strategies in gilts to control Mycoplasma hyopneumoniae infection. Microbiol. 219, 23-29. [crossref]
  3. Maes D, Segalés J, Meyns T, Sibila M, Pieters M, Haesebrouck F (2008). Review: Control of Mycoplasma hyopneumoniae infections in Vet. Microbiol. 126, 297-309. [crossref]
  4. Martelli P, Terreni M, Guazezetti S, Cavirani S. 2006. Antibody response to Mycoplasma hyopneumoniae infection in vaccinated pigs with or without maternal antibodies induced by sow J. Vet. Med. B 53, 229-233. [crossref]
  5. Pieters M, Fano E. 2016. Mycoplasma hyopneumoniae management in Vet. Rec.[crossref]
  6. Reynolds SC, St Aubin LB, Sabbadini LG, Kula J, Vogelaar J, Runnels P, Peters 2009. Reduced lung lesions in pigs challenged 25 weeks after the administration of a single dose of Mycoplasma hyopneumoniae vaccine at approximately 1 week of age. Vet. J. [crossref]
  7. Vangroenweghe F. 2018. Early detection of Mycoplasma hyopneumoniae in pigs under field conditions. Ph.D. thesis. Ghent University, Faculty of Bioscience Engineering.
  8. Vangroenweghe F. 2020. Early detection of Mycoplasma hyopneumoniae in pigs under field conditions using trachea-bronchial swab Integr. J. Vet. Biosci. 4, 1-7.
  9. Vangroenweghe F, Thas O. 2021. Seasonal variation in prevalence of Mycoplasma hyopneumoniae and other respiratory pathogens in peri-weaned, post-weaned, and fattening pigs in Belgian and Dutch pig herds using a tracheobronchial swab sampling technique and their associations with local weather Pathogens. [crossref]
  10. Visscher K, Thuring V, Steenaert M, Jansen R. 2022. Repetitive MycoFlex® vaccination results in antibody seroconversion. Proceedings of 26th International Pig Veterinary Society, Rio de Janeiro, Brazil. 21-24 June 2022. p. 490.

Rhomboedric Cassiterite as Inclusions in Tetragonal Cassiterite from Slavkovský les – North Bohemia (Czech Republic)

DOI: 10.31038/GEMS.2024651

Abstract

In this contribution, we show the existence of the orthorhombic high-pressure CaCl2-type cassiterite included as inclusions in rutile-type cassiterite from Slavkovský les. The proof of the existence of orthorhombic CaCl2-type cassiterite demands a pressure of 12 -15 GPa or more for the formation, corresponding to a deep of about 560 km. Furthermore, the transport from that deep to the crust level must be speedy to prevent the high-pressure phases from destruction at lower temperatures and pressures.

Keywords

CaCl2-type to rutile-type cassiterite, Raman spectroscopy, Phase transitions, Supercritical fluid, Fast transport from the mantle to crust

Introduction

Besides the meaning of cassiterite as an essential ore mineral, Sn oxide has received a lot of attention (see Balakrishnan et al. (2022) [1] as popular gas sensors, and according to Gupta et al. (2013) as solar cells, optoelectronic devices, oxidation catalyst, etc. Cassiterite crystallizes in nature generally in the tetrahedral class in the space group P42/mnm (rutile type). There are also different polymorphs in nature and different polytypes synthetically produced by experimental research. Balakrishnan et al. (2022) – [1] have investigated the structure stability and properties of 20 SnO2 polymorphs. The most common phase transition of the rutile-type cassiterite under pressure is the transformation into the orthorhombic (Pnnm) CaCl2-type cassiterite (Gupta et al. 2013) – [2] because both structures are closely related. In nature, of course, the transformation happens in the reverse direction:

CaCl2-type cassiterite → rutile-type cassiterite      (1)

The transformation pressure is around 12 GPa [3].

The complete sequence of phase transitions, determined with x-ray techniques, is, according to the same authors [3], from high to low pressure (space groups in brackets):

ZrO2-type (Pbca) → PdF2-type (P42/mnm) → CaCl2-type (Pnnm)→ rutile-type (P42/mnm         (2)

The transformation pressures are 50, 20, and 12 GPa, respectively.

Here, we will present a second natural example of the transformation of the high-pressure CaCl2-type cassiterite into low- pressure tetragonal cassiterite [4]. The remnants of high-pressure cassiterite in more crustal low-pressure cassiterite require fast transport from mantle depths to a more crustal regime, probably by supercritical fluids/melts to prevent the complete transition from CaCl2-type into the rutile type cassiterite. The motivation for the present study is to show that besides the found high-pressure non-ore minerals (diamond, lonsdaleite, graphite, moissanite, high-pressure beryl, stishovite, coesite, cristobalite-X-1 [4-6] also ore minerals like cassiterite can store information of the complex pressure history.

Sample Material

In the Sn–W mineralization from the Slavkovský les, there are three principal mineralization types: (1) disseminated-type mineralization, (2) ore pockets, and (3) quartz veins. The disseminated mineralization has a typical content of 0.2–0.3 [%(g/g)] Sn. The ore pockets are rounded or even deformed irregular bodies tens of centimeters in size, with a very high proportion of cassiterite. The studied samples come from type 2 (pockets) and are old samples from the State Mineral Collection (Niederlage) of the Mining Academy Freiberg. The studied cassiterite crystals have a diameter of about 2 cm. Most both-side polished thick sections (about 500 µm thick) of such cassiterite show under the crossed Nicols different amounts of birefringent grains (often rounded) of orthorhombic cassiterite crystals. Some are very small as they are glowing grains like a starry sky (Figure 1a). Counting of such about 1-2 µm-large orthorhombic crystals gives 4 x 10⁶ inclusions per cubic centimeter. Larger crystals are from about 55 x 45 µm to 300 x 170 µm large (Figures 2 and 3). The thermometric data of the used samples from the Slavkovský les are in Thomas (1982) [7]: Sn-6, Sn-28, Sn-30, Sn-44, and Sn-45. All five samples contain orthorhombic cassiterite inclusions in rutile-type cassiterite as host.

FIG 1a

Figure 1a: Tetragonal rutile-type cassiterite (black) with remnants of CaCl2-type (o-Cst) cassiterite inclusions (bright) distributed through the whole crystal under crossed Nicols.

fig 2

Figure 2: Single orthorhombic (o-Cst) cassiterite crystal in tetragonal cassiterite from Slavkovský les.

fig 3

Figure 3: Tetragonal rutile-type cassiterite (black) from Slavkovský les with topaz (Toz) and CaCl2-type (o-Cst) cassiterite inclusions under crossed Nicols. The topaz crystal contains a small o-Cst crystal in the center.

Some cassiterite crystals (e.g., Sn-49 contain tiny diamond crystals with the characteristic Raman band at 1330.9 cm-1 (Figure 1b) deep in the volume (not at or near the surface) – see Thomas et al. 2023 [8]. Graphite (Raman band at 1580 cm-1) is oft present (here in diamond) in the cassiterite from the Variscan tin deposits of the Erzgebirge/ Krušné hory and Slavkovský les, demonstrating more reducing conditions in the early stage.

In the form of larger crystals (10 to 300 µm), the orthorhombic cassiterite (CaCl2-type) is under the microscope and crossed Nicols good to see in the tetragonal rutile-type cassiterite matrix.

fig 1b

Figure 1b: Raman spectrum of diamond in rutile-type cassiterite (Sn-49) from Slavkovský les. The inserted photomicrography shows an about 12 µm long diamond (+ graphite) crystal in that cassiterite.

Microscopy and Raman Spectroscopy: Methodology

For the study of the cassiterite samples and their paragenetic main minerals, we use the Zeiss JENALAB pol as well as the Raman spectrometer EnSpectr R532 combined with the Olympus BX43 microscope both for transmitted and reflected light and equipped with a rotating stage and polarizers (for parallel and perpendicular positions). Note here that the incident laser light is always polarized – in our case, N – S [9]. Generally, we used an Olympus long- distance LMPLFL100x objective lens for the principal studies. For the identification of different minerals, we used the RRUFF and the Hurai et al. Raman mineral databases [10,11]. As references, we applied a water-clear diamond crystal from Brazil (1331.63 ± 0.60 cm-1 and a semiconductor-grade silicon single-crystal (520.70 ± 0.15 cm-1). For this study, we generally used laser energies of ≤ 30 mW on the sample for overview studies and 0.15 mW (1000 s counting time) to prevent heating for exact measurements of the peak positions.

Results

A typical Raman spectrum of orthorhombic cassiterite in the cassiterite host (rutile-type cassiterite) from Slavkovský les is shown in Figure 4.

fig 4

Figure 4: Raman spectrum of an orthorhombic cassiterite inclusion in tetrahedral cassiterite from Slavkovský les. Laser power: 29 mW on the sample.

For comparison, Figure 5 shows a typical Raman spectrum of the rutile-type cassiterite host, which clearly has lesser Raman active bands.

fig 5

Figure 5: Tetragonal cassiterite (host) beside the orthorhombic cassiterite from Slavkovský les (see Figure 4). Laser power: 29 mW on the sample.

The difference between orthorhombic and tetragonal cassiterite is demonstrated in Figures 4 and 5. In Table 1 are the measured Raman bands of the orthorhombic cassiterite shown (Figure 4).

According to Girão et al. (2018) [3], the intensity of some Raman bands of the CaCl2 -type cassiterite increases significantly with pressure. From Table 1, we see that the 447 cm-1 band is the strongest Raman band in the studied CaCl2-type cassiterite.

Table 1: Measured Raman bands of the orthorhombic cassiterite from Slavkovský les (sample Sn-6).

Raman band (cm-1)

FWHM
(cm-1)
Intensity (rel.) Critical Raman bands (cm-1) Number of measurements

Raman mode

120.8

48.4 35.4 117.8 ± 13.5 56 Ag
165.8 32.4 10.9

238.6

21.1 5.3
265.9 86.5 9.5

446.7

18.1 100 444.8 ± 2.6 56 Eg
469.4 17.6 21.3 470.0 ± 3.9 43

Eg

504.4

41.6 7.1
577.8 26.5

13.9

616.4

18.3 10.8
632.7 11.4

23.8

637.6

49.3 19.3
775.0 8.4

2.2

834.4

18.5 63.5 834.8 ± 0.7 53 B1g
895.7 24.9

7.6

1279.3

34.8

8.9

FWHM: Full Width at Half Maximum.

Interpretation

Helwig et al. (2003) [12] present in Figure 7 the pressure dependence of Raman frequencies through the rutile to CaCl2– type cassiterite transition. Here, Figure 6 shows a similar, simplified relationship constructed from data from Hellwig et al. (2003) and Girão (2018) [12,13].

The exact position of the lines in Figure 6 depends on different conditions: temperature [14], crystal size (single crystals or nanoparticles), the disorder in SnO2 [13], pressure media, as well as the laser energy on the sample. Because the structure changes in nature from the CaCl2 to the rutile phase is a second-order transition (see Gupta et al. 2012), this transition is accompanied by minimal volume changes, by which the determination of the precise transition pressure is challenging. In addition, the cooling history in nature has undoubtedly had a significant influence (Table 2).

fig 6

Figure 6: Schematic pressure (P) dependence of the Raman shift (cm-1) through the rutile- to CaCl2-type cassiterite transition. The dashed perpendicular line marks the phase transition (according to Hellwig et al. (2003) [12] and Girão (2018) [13]). The Raman modes are from Hellwig et al. (2003) [12], and the non-marked lines are from Girão (2018) [13].

Table 2: Peak position at ambient pressure and their pressure dependencies according to Hellwig et al. (2003) [12], Girão (2018) [13], and Girão et al. (2018) [3].

Rutile-type cassiterite

CaCl2-type cassiterite Authors
Mode a b Mode a b  


Hellwig at al. (2003) [12]

Eg

474.7 3.21 B2g, B3g 483.0 2.5
A1g 636.3 4.9 Ag 667.0

2.67

B2g

777.3 5.37 B1g 807.5 3.25
B1g* 122.5 Ag* 100.0

B2g

774 4.0  


Girão (2018)

[13]

A1g 633 4.6

S1

575 2.1
S2 515

1.1

Ag

434 2.5
Eg 475 3.3 B2g, B3g


Girão et al. (2018) [3]

A1g

634 4.8 Ag ~690 2.4
B2g 775 5.3 B1g ~820

3.0


For the pressure P (in GPa), the following general equation is valid: P=(ω – a)/b, with ω the corresponding Raman position at pressure. The value ω is the measured Raman band. For B1g* and Ag*, are the following equations for the pressure (in GPa) valid:

B1g: P(GPa)=18.454 – 0.0408 * ω – 0.000877 * ω2 (from 0 to 15 GPa).

Ag: P(GPa)=16.614 – 0.0515 * ω + 0.000686 * ω2 (from 15 to 30 GPa).

The weak and broad bands S1 and S2 correspond, according to Dieguez et al. (2001) [14], to the nanoparticle size.

In Figure 6, the red (Eg) and purple lines are corresponding lines generated maybe by different temperatures (see Diéguez et al. 2001) [14] because both bands merge at low laser power on the sample. According to Gupta et al. (2013) [2], there are significant discrepancies between the phase transitions of the rutile-type cassiterite and CaCl2– type cassiterite, depending on the used methods: 11.8 GPa from x-ray diffraction, 14.2 GPa from Raman spectroscopy, and 14.6 GPa from Brillouin spectroscopy.

From our Raman measurements, we obtain from the four typical Raman bands the following values (n – number of determinations):

Mode Ag 117.8 ± 13.5 cm-1 (n=56): P=20.1 GPa [12].

Mode Ag 444.8 ± 2.6 cm-1 (n=56): P=4.3 GPa [3].

Mode Ag 438.4 ± 3.1cm-1 (n=10 at 0.15 mW): P=21.3 GPa [2]

Mode Eg 470,0 ± 3.9 cm-1 (n=43): P=14.4 GPa [3]

Mode B1g 834.8 ± 0.7 cm-1 (n=53): P=23.4 GPa [2].

Mode B1g 829.1 ± 1.2 cm-1 (n=10 at 0.15 mW): 17.5 ± 0.2 GPa (according to Gupta et al. 2012 [2].

A pressure of 16.8 ± 6.3 GPa results from 228 determinations, which demonstrates that the inclusions in rutile-type cassiterite with strong birefringence under crossed Nicols are CaCl2-type cassiterite. The lower pressure for the 445 cm-1 band (4.3 GPa, n=56) can traced back to a faster transformation from the CaCl2-type to the rutile-type cassiterite. Independent of the present state (remnants), the whole cassiterite was a primary CaCl2-type cassiterite, as proved by the high number of “star-like” distributions of micrometer-large CaCl2-crystals.

Discussion

The study of cassiterite samples from Slavkovský les in North Bohemia (Czech Republic) shows, in analogy to cassiterite from the Sauberg mine near Ehrenfriedersdorf/Saxonian Erzgebirge [4,5], clearly that some large cassiterite crystals contain remnants of CaCl2– type cassiterite formed at pressures of about 15 GPa. This pressure corresponds to a depth of about 560 km (if the experimental data can be applied to nature). Together with the proof of mantle minerals (diamond, lonsdaleite, moissanite, and others) in the upper crust (Greifenstein granite, Sauberg mine near Ehrenfriedersdorf, Annaberg granite, Sadisdorf, Zinnwald) the evidence of CaCl2-type cassiterite in the Slavkovský les and Ehrenfriedersdorf tin mineralization give further solid hints to the direct interaction between deep mantle and crust via supercritical fluids/melts. The longstanding idea of Štemprok (see Figure 13 in Štemprok and Seifert, 2011 [15-17] added with ± vertical vein-like paths of supercritical fluids) is that significant amounts of tin of the Variscan Erzgebirge/Krušné hory and Slavkovský les come directly via supercritical fluids from the mantle region (mantle-derived fluids) find now new food for the mind. Furthermore, we have here the first confirmed case of pressure information from the untypical high-pressure CaCl2-type cassiterite. Up to now, most information comes from mineral inclusions in diamonds.

Acknowledgment

For the cassiterite samples from the Erzgebirge/Krušné hory, I am grateful to Professor Ludwig Baumann (1929-2008) from the Mining Academy Freiberg. The author thanks Prof. Miroslav Štemprok (1933- 2023) for many inspiring discussions during numerous field trips, meetings, and invited presentations in Prague.

References

  1. Balakrishnan K, Veerapandy V, Fjellvåg H, Vajeeston P (2022) First-principles exploration into the physical and chemical properties of certain newly identified SnO2 ACS Omega 7: 10382-10393. [crossref]
  2. Gupta SD, Gupta SK, Jha PK, Ovsyuk NN (2013) A first principles lattice dynamics and Raman spectra of the ferroelastic rutile to CaCl2 phase transition in SnO2 at high Raman J. Raman Spectroscopy 44: 926-933.
  3. Girão HT, Hermet P, Masenelli B, Haines J, Mélinon P, Machon D (2018) Pressure induced sublattice disordering in SnO2: Invasive selective percolation. Physical Review Letters 120: 265702-1 – 265702-6.
  4. Thomas R (2024) The CaCl2-to-rutile phase transition in SnO2 from high to low pressure in Geology, Earth and Marine Sciences 6: 1-4.
  5. Thomas R (2023) Unusual cassiterite mineralization, related to the Variscan tin mineralization of the Ehrenfriedersdorf deposit, Germany. Aspects in Mining & Mineral Science 11: 1233-1236.
  6. Thomas R, Davidson P, Rericha A, Recknagel U (2022) Discovery of stishovite in the prismatine-bearing granulite from Waldheim, Germany: A possible role of supercritical fluids of ultrahigh-pressure origin. Geosciences 12: 1-13.
  7. Thomas R (1982) Ergebnisse der thermobarogeochemischen Untersuchungen an Flüssigkeitseinschlüssen in Mineralen der postmagmatischen Zinn-Wolfram- Mineralization des Erzgebirges. Freiberger Forschungshefte C370, Pg: 85.
  8. Thomas R, Davidson P, Rericha A, Recknagel U (2023) Ultrahigh-pressure mineral inclusions in a crustal granite: Evidence for a novel transcrustal transport mechanism. Geosciences 13: 1-13.
  9. Tuschel D (2012) Raman crystallography, in theory and in Spectroscopy 27: 2-6.
  10. Lafuente B, Downs, RT, Yang H, Stone N (2015) The power of database: the RRUFF project. In: Armbruster T, Danisi RM (eds). Highlights in mineralogical Berlin, 1-30.
  11. Hurai V, Huraiova M, Slobodnik M, Thomas R (2015) Geofluids – Developments in Microthermometry, Spectroscopy, Thermodynamics, and Stable Isotopes. Elsevier Pg: 489.
  12. Hellwig H, Goncharov AF, Gregoryanz E, Mao H, Hemley RJ (2003) Brillouin and Raman spectroscopy of the ferroelastic rutile-to CaCl2 transition in SnO2 at high Physical Review B 67: 174110-1174110-7.
  13. Girão HT (2018) Pressure-induced disorder in bulk and nanometric SnO2. Material Chemistry, Theses, Université de Lyon, Pg: 139.
  14. Diéguez A, Romano-Rodriguz A, Vilà A, Morante JR (2001) The complete Raman spectrum of nanometric SnO2 Journal of Applied Physics 90: 1550-1557.
  15. Štemprok M, Seifert T (2011) An overview of the association between lamprophyric intrusions and rare-metal mineralization. Mineralogia 42: 121-162.
  16. Štastný M, René M (2014) Argillization of topaz-bearing granites in the Hub Stock, Horni Slavkov-Krasno Sn-W ore district (Bohemian Massif, Czech Republic). Acta Geomater 11: 255-267.
  17. Thomas R, Trinkler M (2024) Monocrystalline lonsdaleite in REE-rich fluorite from Sadisdorf and Zinnwald/E-Erzgebirge, Geology, Earth and Marine Sciences 6(5), 1-6.

Ultrasonic-Assisted Extraction of Phytochemicals Such As L-Tryptophan, Serotonin, and Melatonin from Tomatoes

DOI: 10.31038/NRFSJ.2024721

Abstract

Large amounts of byproducts are generated by the food processing industries in the 21st century including bioactive compounds such as polysaccharides, polyphenols, carotenoids, and dietary fiber. Due to a lack of sustainable extraction techniques, these processing wastes are regarded as having negligible value in comparison to processed fruit or vegetables. Conventional extraction has limitations in terms of time, energy, and solvent usage. In comparison with conventional methods of extraction, ultrasonic-assisted extraction can extract bioactive components in a short period, at low temperatures, and with less energy and solvent, as well as maintaining the functionality of the components. However, UAE-related variables such as frequency, power, duty cycle, temperature, time, solvent type, and liquid-solid ratio must be understood and optimized for each byproduct. This article provides the mechanism, concept, and factors that influence bioactive compound extraction, with a focus on tomatoes.

Keywords

Bioactive, Phytochemical, Nutraceutical

Introduction

With growing demand, the production as well as consumption of fruits and vegetables has increased by huge manifolds as their losses in the form of waste (upto 60%) and by-products according to the Food and Agriculture Organization (FAO) which demands an increasing awareness among the growing population [1]. The bioactive components for the development of functional food products are lost due to the unavailability of extraction techniques [2]. The viewpoint towards fruit and vegetable by-products has changed due to the increasing demand for natural bioactive compounds namely pectin and antioxidants having huge potential in terms of nutritional and therapeutic value [3].

The development of nutraceutical products involves the extraction of bioactive components as a primary step. Depending on the type of compounds to be extracted several extraction methods are available such as solvent extraction, mechanical expelling, supercritical extraction, and microwave extraction. These methods’ limitations include the need for an aqueous phase in microwave-assisted extraction, high capital requirements for supercritical fluid extraction, low yields in mechanical expelling, and the need for additional solvent in solvent extraction [4]. UAE offers advantages over these techniques, including lower energy and time requirements, low-temperature extraction, and preservation of extract quality.

In UAE by increasing mass transport, the ultrasonic waves disrupt the plant tissue through physical forces created during acoustic cavitations and facilitate the rapid release of extractable components from the solvent [1].

With the use of ultrasound technology, it is possible to successfully extract various plant matrices, including whole plants and their byproducts, of aromatic compounds, polysaccharides, carotenoids, and polyphenols. The variables linked to the UAE, including power, frequency, duty cycle, temperature, time, type of solvent, and liquid-solid ratio, must be accurately managed to get the best extraction. Many studies have looked at how these factors affect the extraction of bioactive chemicals from fruit and vegetable by-products, both separately and in combination [5-7].

UAE is the method of extracting target compounds from various plant matrices using ultrasonic energy and solve [8]. The human hearing range is 20 Hz to 20 kHz, however, the mechanical waves known as ultrasounds have frequencies (>20 kHz) that are higher. These waves, which can move through a solid, liquid, or gaseous media, are composed of a series of cycles of compression and rarefaction that cause molecules to move and get dislodged from their original places.

When a sound wave is strong enough to cause rarefaction, the molecules are pulled apart by the strong attraction between them, resulting in cavitation bubbles. These bubbles form during coalescence, burst during the compression phase, and produce an intense local environment and hot area. Up to 5000 K of temperature and 1000 atmospheres of pressure rise are possible. These hot spots quicken the nearby metabolic reactions [7,9-11].

The primary sources of serotonin (5-hydroxytryptamine), an indoleamine monoamine neurotransmitter, are animal blood platelets, serotonergic neurons in the central nervous system (CNS), and enterochromaffin cells in the gastrointestinal tract (GI tract). The pineal gland of the brain produces melatonin (5-methoxy-N-acetyltryptamine), also known as the “hormone of darkness” [12]. It is an indole hormone that regulates several bodily processes. Melatonin secretion starts three months after birth; before that, it is mostly obtained from the mother’s or cow’s milk. In addition to being a potent antioxidant, it also strengthens immunity, increases resistance to illness and infection, inhibits certain types of cancer, and improves neurological conditions. Tryptophan is an important amino acid that is the precursor of both melatonin and serotonin in the mammalian brain. First, 5-hydroxytryptophan (5-HTP), the direct nutritional precursor of the neurotransmitter serotonin 5-hydroxytryptamine (5-HT), is produced from L-tryptophan in the pineal gland. Melatonin is produced in the pineal gland by methylating and acetylating serotonin [13].

Some of the best sources of tryptophan are the seeds of pumpkins and squash (576 mg/100 g). Tryptophan-rich foods include brown rice, whole oats, wheat bran, and wheat germ. One of the best foods for high serotonin content is butternut (398 μg/g tissue). Plantains, apricots, cherries, peaches, and Chinese plums have also been found to have significant levels of serotonin [14-18]. Following its discovery in edible plants, melatonin has been detected in a wide variety of plants and plant parts, including the rind of tart cherries, tomato fruit grape skin, sunflower, mustard, and walnut seed roots. Its concentrations typically range from picograms to nanograms per gram of tissue. The first common tree nut about which melatonin has been researched from a nutritional standpoint is the walnut [13].

Additionally, serotonin plays a role in the hypothalamic regulation of pituitary secretion, specifically in the control of prolactin, growth hormone, and adrenocorticotropin (ACTH) secretion. Additionally, a direct synaptic connection has been shown between serotonergic terminals and neurons in the paraventricular nucleus of the hypothalamus that contain corticotropin-releasing hormone (CRH). To control development patterns, mating behavior, and specific motions like migration, metabolism, and other physiological processes, melatonin governs the circannual cycle. Light-induced melatonin production is regulated and considered an endogenous synchronizer of the circadian cycle. Because the peak generation of endogenous melatonin occurs simultaneously with the nightly drop in body temperature, it affects sleep in animals through thermoregulatory function [12]. Numerous calcium-dependent cellular processes are regulated by melatonin, which binds to Ca2+-calmodulin in cells. Recurrent depression during the short photoperiod is the hallmark of winter-type seasonal affective disorder (SAD), and photoperiodic variation is directly linked to the condition’s summertime remission.

Materials and Methods

Materials

The study involved selecting fresh tomatoes (Solanum lycopersicum) that were free of cuts and exterior deterioration from Jadavpur, Kolkata, West Bengal Supermarket. Specialty chemicals were obtained from M/s Sigma-Aldrich, Munich, Germany. These included acetonitrile (99.9% pure, HPLC grade), acetic acid (99.8% pure), and methanol (HPLC grade). AR-grade chemicals were all that were employed in the investigation.

Methods

Extraction of SER-MEL from Tomatoes Employing UAE

Little changes were made to the procedure described by Chakraborty and Bhattacharjee (2019) [18] for the extraction of SER, MEL, and the precursor molecule L-TRP from irradiation tomatoes. Figure 1 illustrates the whole process. As shown in Table 1, the initial trials were carried out by adjusting several parameters, including the solvent composition, sample solvent ratio, extraction time, extraction amplitude, and addition of anhydrous sodium sulfate (Na2SO4).

FIG 1

Figure 1: Extraction of L-TRP, SER and MEL from tomatoes by UAE

Table 1: Factors for extraction of phytochemicals

No. of runs

Extraction time (mins) % amplitude (nm) Solvent composition Sample solvent ratio Na2SO4 addition Yield of biomolecules from tomatoes (µg/g of dry weight)
L-TRP SER

MEL

1

30

100

Ethanol

1:1

Not added

27.76a

21.49b

Not detected
2

10

70

Ethanol

1:1

Not added

48.68a

9.34b

0.3b

3

10

70

Ethanol and water

1:3

Not added

0.14a

0.34b

0.2b

4

10

70

Ethanol

1:3

Added post centrifugation

0.64a

1.67d

0.19c

5

10

20

Ethanol

1:3

Added prior to sonication

17.22a

5.06b

1.74c

6

10

70

Ethanol

1:3

Added prior to sonication

5.63a

3.70g

1.03c

7

10

100

Ethanol

1:3

Added prior to sonication

0.42a

1.85b

0.09c

Using UAE, the phytochemicals L-TRP, SER, and MEL were extracted from tomatoes, and many parameters were adjusted, including batch size and the continuous way of establishing vibration length. 5 g of the material washomogenized after being crushed and ground (T 50 digital Ultra-turrax_, M/s Ika, and Staufen, Germany). Amber-colored beakers were used throughout the entire extraction process.

A titanium probe with a 3 mm tip diameter, 80 mm length, and a sonication capacity of 5–200 ml sample was used to treat the homogenized sample to UAE using a probe sonicator (Labsonic M, M/s Sartorius, Melsungen, Germany). The probe had a maximum power of 100 W and a maximum frequency of 30 kHz. To allow real sound wave incursion without contacting the vial’s surface, the extraction procedure was carried out while keeping a distance of 1 cm from the probe’s tip. The extraction vials were placed in an ice bath with a temperature controlled between 4 and 8°C [18].

The extracted materials were centrifuged at 4°C for 15 minutes at 4000 rpm. The obtained supernatants were subjected to solvent evaporation at 50°C for 10 minutes and 25± 5°C under vacuum using a rotary vacuum evaporator. For the contents of SER, MEL, and L-TRP, the extracts were kept in screw-capped glass vials with an amber color at -20°C.

Quantification and Purification of L-TRP, SER, and MEL in the UAE by High Performance Liquid Chromatography (HPLC)

The extracts underwent purification using a 0.22 μm membrane filter, and the simultaneous quantification of L-TRP, SER, and MEL was performed using the high-performance liquid chromatography-photo diode array (HPLC-PDA) analytical technique.

According to the procedure, the phytochemicals were tracked using a PDA detector and a D2 light at 280 nm [19-23]. Based on the standard retention time of L-TRP, SER, and MEL Sigma standards, where 20 μl of the produced standard or extract (UAE extract) was injected and run, the peaks of these biomolecules were found. The HPLC method’s parameters, including the mobile phase composition, operating mode, and flow rate, were tested in multiple preliminary runs. The condition that produced the maximum yield of the standards for SER, MEL, and L-TRP was selected as the optimal one.

The HPLC was operated in gradient elution method with acetic acid and methanol (both HPLC grade) in mobile phase in a flow rate of 1 ml/min which showed distinct peaks of SER, MEL, and L-TRP at their respective elution time.

Statistical Analyses

The mean ± SD of three separate experimental runs has been used to express the yield of L-TRP, SER, and MEL. The mean ± SD of three values is also used to describe the results. One-way analysis of variance (ANOVA) was used to do the statistical analysis of the data. Duncan’s multiple-range test was used to identify significant changes in means. The tests were verified to be significant using a p-value of B 0.05. STATISTICA 8.0 software (Statsoft, Oklahoma, USA) was utilized in this study to test the outcomes of the experiments.

Results and Discussion

The three main component concentrations varied in the extracts examined by HPLC-PDA at various solvent ratios. The optimal conditions were selected based on which extracts with the highest yield of the three components were deemed to be the best. A few data from our experiment and a bar graph based on the outcomes of the preliminary trials are shown in Figure 2 below. The antioxidants in the preliminary trail exhibited their maximum yield when the amplitude was 20 nm. By employing ethanol as the solvent and adding Na2SO4 before sonication, the antioxidants, namely L-TRP, SER, and MEL, demonstrated a good synergistic co-existence, as evidenced by the SE value of 1.08, which is greater than unity. The refined extracts were kept at -20°C in the dark in screw-capped bottles with an amber color. The co-extraction of additional antioxidants from tomatoes resulted in the observation of multiple additional peaks in the HPLC profile.

FIG 2

Figure 2: Highest concentration of antioxidants in the fifth run

Conclusion

Using ethanol as the solvent and adding Na2SO4 before sonication (5th run), the trials showed that the best yields of SER, MEL, and L-TRP were obtained at low ultrasonication amplitudes. The extract can be further used for production of nutraceutical food product such as tomato soup with enhanced contents of the three phytochemicals. The same can be used for production of medicinal supplements such as nasal sprays, ointments as they are naturally obtained antioxidants.

References

  1. Kshitiz Kumar Shivmurti Srivastav, Vijay Singh Sharanagat (2020) Ultrasound assisted extraction (UAE) of bioactive compounds from fruit and vegetable processing by-products: A review.
  2. Sagar NA, Pareek S, Sharma S, Yahia EM, Lobo MG (2018) Fruit and vegetable waste: Bioactive compounds, their extraction, and possible utilization. Compr Rev Food Sci Food Saf 17: 512-531. [crossref]
  3. Kosseva MR Academic Press (2013) Functional food and nutraceuticals derived from food industry wastes. Food Industry Wastes 103-120.
  4. Samaram S, Mirhosseini H, Tan CP, Ghazali HM, Bordbar S, Serjouie A (2015) Optimisation of ultrasound-assisted extraction of oil from papaya seed by response surface methodology: Oil recovery, radical scavenging antioxidant activity, and oxidation stability. Food Chem 172: 7-17. [crossref]
  5. Vilkhu K, Mawson R, Simons L, Bates D (2008) Applications and opportunities for ultrasound assisted extraction in the food industry – a review. Innovative Food Sci Emerg Technol 9: 161-169.
  6. Chemat F, Rombaut N, Meullemiestre A, Turk M, Perino S, et al. (2017) Review of green food processing techniques. Preservation, transformation, and extraction. Innov Food Sci Emerg Technol 41: 357-377.
  7. Roselló-Soto E, Galanakis CM, Brnčić M, Orlien V, Trujillo FJ, et al. (2015) Clean recovery of antioxidant compounds from plant foods, by-products and algae assisted by ultrasounds processing. Modeling approaches to optimize processing conditions. Trends Food Sci Technol 42: 134-149.
  8. Freitas de Oliveira C, Giordani D, Lutckemier R, Gurak PD, Cladera-Olivera F, Ferreira Marczak LD (2016) Extraction of pectin from passion fruit peel assisted by ultrasound. LWT – Food Sci Technol 71: 110-115.
  9. Chemat F, Rombaut N, Sicaire AG, Meullemiestre A, Fabiano-Tixier AS, et al. (2017) Ultrasound assisted extraction of food and natural products. Mechanisms, techniques, combinations, protocols and applications. A review. UltrasonicsSonochem 34: 540-560.
  10. Šic Žlabur J, Voca S, Dobricevic N, Brncic M, Dujmic F, et al. (2015) Optimization of ultrasound assisted extraction of functional ingredients from Stevia rebaudiana Bertoni leaves. Int Agrophys 29: 231-237.
  11. Zinoviadou KG, Galanakis CM, Brnčić M, Grimi N, Boussetta N, et al. (2015) Fruit juice sonication: Implications on food safety and physicochemical and nutritional properties. Food Res Int 77: 743-752.
  12. Utiger RD (1992) Melatonin: The hormone of darkness. New England Journal of Medicine 327: 1377-1379. [crossref]
  13. Bhattacharjee P, Ghosh PK, Vernekar M, Singhal RS (2016) Role of Dietary Serotonin and Melatonin in Human Nutrition; In: Serotonin and Melatonin: Their Functional Role in Plants, Food, Phytomedicine, and Human Health, GA Ravishankar & A Ramakrishna (Eds.), CRC Press-Taylor & Francis Group, United States 317-333.
  14. Bhattacharjee P, Chakraborty S (2018) Neurotransmitters in Edible Plants Implications in Human Health.
  15. García-Moreno C, Rivas-Gonzalo JC, Pena-Egido MJ, Mariné-Font A (1983) Improved method for determination and identification of serotonin in foods. Journal of Association of Official Analytical Chemists 66: 115-117. [crossref]
  16. Garrido M, Paredes SD, Cubero J, et al. (2010) Jerte Valley cherry-enriched diets improve nocturnal rest and increase 6-sulfatoxy melatonin and total antioxidant capacity in the urine of middle-aged and elderlyhumans. Journals of Gerontology Series A: Biological Sciences and Medical Sciences 65: 909-914.
  17. Gónzalez-Flores D, Velardo B, Garrido M, et al. (2011) Ingestion of Japanese plums (Prunus salicina Lindl Crimson Globe) increases the urinary 6-sulfatoxy melatonin and total antioxidant capacity levels in young, middle-aged and elderly humans: Nutritional and functional characterization of their content. Journal of Food and Nutrition Research 50: 229-236.
  18. Chakraborty S, Bhattacharjee P (2020) Ultrasonication-assisted extraction of phytomelatonin-rich, erucic acid-lean nutraceutical supplement from mustard seeds: an antioxidant synergy in the extract by reductionism. J Food Sci Technol 57: 1278-1289. [crossref]
  19. Huang X, Mazza G (2011) Simultaneous analysis of serotonin, melatonin, piceid and resveratrol in fruits using liquid chromatography tandem mass spectrometry. Journal of Chromatography A 1218: 3890-3899. [crossref]
  20. Eh A, Teoh SG (2012) Novel modified ultrasonication technique for extraction of lycopene from tomatoes. Journal of ultrasonics sonochemistry 19: 151-159. [crossref]
  21. Marti R, Brondo ML, Lahoz I, Campillo C, Cebolla-Cornejo J, et al. (2018) Polyphenol and L-ascorbic acid content in tomato as influenced by high lycopene genotypes and organic farming at different environments. Journal of food chemistry 239: 148-156. [crossref]
  22. Ramakrishna A, Giridhar P, Ravishankar GA (2011) Phytoserotonin: A review. Plant Signaling and Behavior 6: 800-809. [crossref]
  23. Ranganna S (2000) Handbook of analysis and quality control for fruit and vegetable products, 3rd edn. Tata and McGraw-Hill, New Delhi.

Exploring the Potential of Exosomal miRNA as Prognostic Biomarkers in Glioma

DOI: 10.31038/CST.2024932

Abstract

Gliomas are aggressive brain tumors characterized by high morbidity and mortality. Recent advances in the field of exosome biology have opened new avenues for non-invasive diagnostics and therapeutic strategies in glioma management. Exosomes, small extracellular vesicles found in body fluids, carry a diverse array of molecular contents, including microRNAs (miRNAs), which reflect the biological state of their cells of origin. This review explores the potential of exosomes as liquid biopsies and the role of exosomal miRNAs in glioma progression, tumor recurrence, and drug resistance. We summarize current knowledge on how exosomal miRNAs can serve as biomarkers for early detection, prognosis, and real-time monitoring of gliomas. Exosomal miRNAs such as miR-21, miR-221/222, and miR-10b are highlighted for their association with tumor aggressiveness and poor patient outcomes. The mechanisms by which these miRNAs contribute to glioma growth, angiogenesis, metastasis, and therapeutic resistance are examined, underscoring their importance in tumor biology. Additionally, we discuss the challenges in exosome isolation and miRNA detection, emphasizing the need for standardized protocols and advanced analytical techniques. The review also addresses the potential of integrating exosomal miRNA analysis with other biomarkers and imaging methods to provide a comprehensive approach to glioma management. In conclusion, the application of exosomal miRNAs as liquid biopsies holds great promise for improving glioma diagnosis, monitoring disease progression, and guiding personalized treatment strategies. Further research and clinical validation are essential to fully realize the potential of exosomal miRNAs in transforming glioma care.

Keywords

Exosomes; microRNAs; glioma recurrence; liquid biopsy; non-invasive prognostics; real-time monitoring

Introduction

Gliomas are a diverse group of tumors originating in the glial cells of the brain and spinal cord. These tumors are classified based on the type of glial cells involved, their genetic characteristics, and their grade of malignancy [1]. The primary types of gliomas include glioblastomas, astrocytomas, oligodendrogliomas, and ependymomas. They have the third-highest cancer-related mortality and morbidity rates worldwide [2]. Despite aggressive treatment involving surgery, radiation, and chemotherapy, the majority of gliomas are nearly universally fatal within 5 to 7 years [3].

Advances in genomic and molecular profiling have led to the identification of distinct molecular markers such as IDH1/2, EGFR, p53, BRAF, TERT promoter mutations, 1p/19q co-deletion and MGMT promoter methylation as diagnostic, prognostic and therapeutic indicators in glioma management [4]. However, tumor recurrence in glioma is a major hurdle in the effective management of the disease. Tumor recurrence in glioma is significantly influenced by several factors. Surgical resection often cannot remove all tumor cells, particularly those infiltrating the surrounding brain tissue, leaving residual cells that can proliferate and cause recurrence [5]. Furthermore, glioma cells can develop resistance to therapies such as chemotherapy and radiation due to genetic mutations, epigenetic changes, or adaptive responses to treatment [6]. Additionally, a subpopulation of glioma cells with stem-like properties, known as cancer stem cells, can survive initial treatments and drive tumor regrowth [7]. These cancer stem cells are often more resistant to conventional therapies, further complicating the management of glioma recurrence.

Post-operative evaluation for disease burden is primarily conducted through MRI or other radiological investigations. However, these imaging techniques often fail to accurately correlate with the actual neoplastic disease burden, inadequately addressing the micro-infiltrative disease beyond the borders depicted radiologically [8]. Furthermore, MRI interpretation post-treatment can be challenging due to inflammation and necrosis caused by radiation, chemotherapy, or immunotherapy. Treatment-related inflammation, known as “pseudo-progression,” frequently results in false positives, complicating clinical interpretation [9]. Furthermore, reliable biomarkers for early detection of recurrence are lacking, making it hard to monitor disease progression effectively [10]. Invasive and serial tumor biopsies for histological analyses are not only impractical and dangerous but also ineffective in providing adequate information about the tumor due to its heterogeneous nature. This highlights the need for non-invasive procedures capable of detecting unique features that precisely reflect tumor status, enabling continual assessment of patients to monitor disease progression and supervise therapeutic response.

In this review, we summarized the recent understanding of exosomes as liquid biopsies and the role of different exosomal miRNAs in glioma progression, tumor recurrence, and drug resistance. We discussed how exosomes can serve as liquid biopsies, providing valuable molecular and genetic information that reflects the current state of the tumor. Further we highlighted the multifaceted role of exosomal miRNAs in glioma, emphasizing their potential as biomarkers for diagnosis, prognosis, and therapeutic targets.

Exosomes as Liquid Biopsy in Glioma

Exosomes, small extracellular vesicles secreted by cells, have emerged as a promising tool for liquid biopsy in glioma [11]. These vesicles carry a variety of biomolecules, including [12]. Cancer cells actively produce, release, and utilize exosomes to promote tumor growth and progression. These tumor-derived exosomes carry molecular and genetic information that can alter the phenotypic and functional attributes of recipient cells [13]. By transferring oncogenic proteins, RNAs, and other bioactive molecules, exosomes can reprogram recipient cells into active contributors to various processes crucial for tumor development [14]. For instance, they can enhance angiogenesis, which is the formation of new blood vessels to supply the growing tumor with nutrients and oxygen [15]. They can also promote thrombosis, creating a pro-coagulant environment that facilitates tumor cell survival and dissemination [16]. Moreover, exosomes contribute to immunosuppression by modulating the immune response, helping the tumor evade detection and destruction by the body’s immune system [17].

In the context of brain tumors, exosomes have a unique advantage. The blood-brain barrier (BBB) is a selective barrier that typically prevents most molecules from entering or exiting the central nervous system (CNS). However, exosomes can cross the BBB, making them detectable in body fluids such as blood and cerebrospinal fluid [18]. This ability is particularly significant for brain cancer management because it allows for the non-invasive monitoring of tumor dynamics. The inability of brain tumor cells to exit the CNS combined with exosomes’ capacity to cross the BBB and carry tumor-specific information into the systemic circulation underscores their potential as powerful biomarkers. This capability facilitates the early detection of brain tumors, monitoring of disease progression, and assessment of treatment response, making exosomes a valuable tool for liquid biopsy in the management of glioma.

Exosomal MicroRNAs in Glioma

Exosomes are rich in various RNA molecules such as mRNA, long non-coding RNAs (IncRNAs), circular RNAs (circRNAs) and miRNAs, with miRNAs being the most prevalent [19]. MicroRNAs (miRNAs) are a class of small, non-coding RNA molecules, typically about 22 nucleotides in length, that play a crucial role in regulating gene expression [20]. They function primarily by binding to complementary sequences on target messenger RNA (mRNA) transcripts, usually resulting in gene silencing through translational repression or mRNA degradation [21]. This regulatory function is crucial in numerous biological processes and disease states, including cancer [22].

According to the Exocarta database, which catalogs molecules identified in exosomes, 2,838 miRNAs have been detected in exosomes from various biological sources [23]. Among the thousands of miRNAs identified in exosomes, approximately 26 have been closely associated with gliomas [24]. These miRNAs are involved in various aspects of glioma biology, including tumor growth, invasion, angiogenesis, and immune evasion. Their presence in exosomes allows them to influence the tumor microenvironment and facilitate intercellular communication within the brain [25].

The miRNA content in exosomes is notably higher than in their source cells, suggesting a selective enrichment process [26]. Studies have shown that miRNAs are preferentially incorporated into exosomes before other RNA molecules, resulting in their elevated expression levels in exosomes compared to the originating cells [27]. This selective sorting of miRNAs into exosomes is critical for intercellular communication within the tumor microenvironment and plays a vital role in glioma biology [28]. The ease of access, abundance, and stability of exosomal miRNAs in biofluids make them ideal biomarkers for gliomas, offering significant potential for non-invasive disease monitoring.

Several miRNAs have been identified as significant prognostic biomarkers in glioma. Among them, miR-21 is extensively studied and typically overexpressed in high-grade gliomas, correlating with poor prognosis, increased tumor aggressiveness, resistance to apoptosis, and enhanced invasion capabilities [29]. High levels of miR-21 are associated with shorter overall survival and disease-free survival. Similarly, the miR-221/222 cluster is upregulated in glioblastomas, promoting cell proliferation and inhibiting apoptosis by targeting tumor suppressor genes like p27 and p57, resulting in poor clinical outcomes and reduced patient survival [30]. miR-10b, significantly overexpressed in gliomas, is crucial for tumor invasion and metastasis, with high levels indicating poor prognosis and shorter survival times [31]. The miR-181 family, including miR-181a and miR-181b, is often downregulated in gliomas, with lower expression levels linked to poorer prognosis. These miRNAs regulate glioma cell proliferation, apoptosis, and differentiation [32]. miR-124, typically downregulated and acting as a tumor suppressor, is associated with advanced tumor grade and poor prognosis; its restoration inhibits glioma cell proliferation and induces apoptosis [33]. Lastly, miR-196a, overexpressed in gliomas, promotes cell proliferation, migration, and invasion, with high levels linked to shorter overall survival, highlighting its value as a prognostic marker [34].

Clinical Application of Exosomal MiRNA as Prognostic Biomarkers

Given the unique biological characteristics of exosomes, their collection from patient body fluids combined with the detection of related miRNAs offers significant promise in glioma management. The miRNAs contained within exosomes can reflect the molecular landscape of their cells of origin, providing a non-invasive means to gain insights into the tumor’s genetic and proteomic profile [35].

By analyzing exosomal miRNAs from body fluids such as blood, cerebrospinal fluid, or urine, clinicians can obtain valuable information about the current state of the glioma. Bioinformatics analysis and processing of this miRNA data can help identify specific miRNA signatures associated with treatment response, disease progression, and recurrence [36].

Systematic collection of exosomes from body fluids enables continuous, non-invasive monitoring of tumors, eliminating the need for invasive procedures like biopsies. This facilitates real-time assessment of treatment efficacy and early detection of changes in tumor behavior. By tracking changes in exosomal miRNA profiles, clinicians can evaluate the effectiveness of therapeutic interventions. A decrease in specific oncogenic miRNAs or an increase in tumor-suppressive miRNAs may indicate a positive response to treatment. Additionally, certain miRNA signatures in exosomes can serve as prognostic biomarkers, aiding in predicting patient survival and the likelihood of tumor recurrence. For example, elevated levels of specific miRNAs associated with aggressive tumor behavior can signal a higher risk of recurrence.

Thus the integration of exosome-based miRNA analysis with advanced bioinformatics holds great potential for improving the management of glioma patients. This innovative approach can enhance our ability to evaluate treatment effects, predict survival outcomes, and identify early signs of tumor recurrence, ultimately leading to more effective and personalized therapeutic strategies.

Opportunities and Challenges

Standardizing and improving the methods for isolating and purifying exosomes from body fluids is essential to ensure consistency and reliability. Establishing standardized protocols for exosome handling, storage, and analysis will ensure reproducibility across different laboratories. It is also crucial to address the inherent heterogeneity of exosomes, which can vary greatly between patients and even within the same patient over time. Enhancing the sensitivity and specificity of detection techniques to accurately measure miRNAs within exosomes is vital. Conducting large-scale clinical studies is necessary to validate the prognostic utility of exosomal miRNAs in glioma. Additionally, gaining a deeper understanding of the biological functions and mechanisms of exosomal miRNAs in glioma progression and treatment response is imperative.

Conclusion and Future Perspectives

Exosomal miRNAs present a promising frontier in glioma diagnosis, prognosis, and treatment. Advancing non-invasive diagnostic methods using exosomal miRNAs can minimize the need for surgical biopsies, significantly improving patient comfort and outcomes. Utilizing these miRNA profiles for early detection of glioma recurrence holds the potential for timely interventions, thereby enhancing patient survival rates. Personalized treatment plans based on unique exosomal miRNA signatures can tailor therapies to individual patient needs, ensuring more effective and targeted treatment strategies. Routine profiling of exosomal miRNAs allows for real-time monitoring of disease progression and treatment response, providing continuous and up-to-date information on the patient’s condition.

Combining exosomal miRNA analysis with other biomarkers and imaging techniques can offer a more comprehensive approach to glioma management, integrating various data sources for a holistic understanding of the disease. Predictive models incorporating exosomal miRNA data can forecast disease recurrence, guiding follow-up care and improving long-term outcomes. Finally, leveraging bioinformatics and machine learning to analyze complex exosomal miRNA data will uncover new insights into glioma biology and treatment, driving the field forward and opening new avenues for research and clinical application. These advancements collectively highlight the transformative potential of exosomal miRNAs in the comprehensive management of glioma, paving the way for more precise, personalized, and effective cancer care.

Author Contributions

SSB conceived the idea, wrote and edited the manuscript. MKP and VKV provided guidance throughout the preparation of this manuscript. RCD reviewed and made significant revisions to the manuscript. All authors contributed to the articles and approved the submitted version.

Conflict of Interest

Authors declare there is no conflict of interest to declare.

References

  1. Lapointe S, Perry A, Butowski NA (2018) Primary brain tumors in adults. Lancet 392: 432-436. [crossref]
  2. Smith HL, Wadhwani N, Horbinski C (2022) Major features of the 2021 WHO classification of CNS tumors. Neurotherapeutics 19: 1691-1704. [crossref]
  3. Kamiya-Matsuoka C, Gilbert MR (2015) Treating recurrent glioblastoma: an update. CNS Oncology 4: 91-104. [crossref]
  4. Verdugo E, Puerto I, Medina MA (2022) An update on the molecular biology of glioblastoma, with clinical implications and progress in its treatment. Cancer Communications 42: 1083-1111. [crossref]
  5. Putavet DA, de Keizer PLJ (2021) Residual disease in glioma recurrence: A dangerous liaison with senescence. Cancers (Basel) 13: 1560. [crossref]
  6. Ou A, Yung WKA, Majd N (2021) Molecular mechanisms of treatment resistance in glioblastoma. International Journal of Molecular Sciences 22: 351. [crossref]
  7. Xie XP, Laks DR, Sun D, Ganbold M, Wang Z, Pedraza AM, et al. (2022) Quiescent human glioblastoma cancer stem cells drive tumor initiation, expansion and recurrence following chemotherapy. Developmental Cell 57: 32-46. [crossref]
  8. Walker AJ, Ruzevick J, Malayeri AA, Rigamonti D, Lim M, Redmond KJ, et al. (2014) Post-radiation imaging changes in the CNS: How can we differentiate between treatment effect and disease progression? Future Oncology 10: 1277-1297. [crossref]
  9. Young JS, Al-Adli N, Scotford K, Cha S, Berger MS (2023) Pseudoprogression versus true progression in glioblastoma: what neurosurgeons need to know. Journal of Neurosurgery 139: 748-759. [crossref]
  10. Kan LK, Drummond K, Hunn M, Williams D, O’Brien TJ, Monif M (2022) Potential biomarkers and challenges in glioma diagnosis, therapy and prognosis. BMJ Neurology Open 2: e000069. [crossref]
  11. Skouras P, Markouli M, Kalamatianos T, Stranjalis G, Korkolopoulou P, Piperi C (2023) Advances in liquid biopsy analysis for glioma diagnosis. Biomedicines 11: 2371. [crossref]
  12. Yokoi A, Ochiya T (2021) Exosomes and extracellular vesicles: Rethinking the essential values in cancer biology. Seminars in Cancer Biology 74: 79-91. [crossref]
  13. Whiteside TL (2016) Tumor-derived exosomes and their role in cancer progression. Advanced Clinical Chemistry 74: 103-141. [crossref]
  14. Yang E, Wang X, Gong Z, Yu M, Wu H, Zhang D (2020) Exosome-mediated metabolic reprogramming: the emerging role in tumor microenvironment remodeling and its influence on cancer progression. Signal Transduction and Targeted Therapy 5: 242. [crossref]
  15. Ribeiro MF, Zhu H, Millard RW, Fan GC (2013) Exosomes function in pro and anti-angiogenesis. Current Angiogenes 2: 54-59. [crossref]
  16. Wortzel I, Dror S, Kenific CM, Lyden D (2019) Exosome-mediated metastasis: communication from a distance. Developmental Cell 49: 347-360. [crossref]
  17. Olejarz W, Dominiak A, Żołnierzak, Kubiak-Tomaszewska G, Lorenc T (2020) Tumor-derived exosomes in immunosuppression and immunotherapy. Journal of Immunology Research 2020: 6272498. [crossref]
  18. Ramoz-Zaldivar HM, Polakovicova I, Salas-Huenuleo E, Corvalan AH, Kogan MJ, Yefi CP et al. (2022) Extracellular vesicles through the blood-brain barrier: a review. Fluids and Barriers of the CNS 19: 60. [crossref]
  19. Dai J, Su Y, Zhong S, Cong L, Liu B, Yang J, et al. (2020) Exosomes: key plays in cancer and potential therapeutic strategy. Signal Transduction and Targeted Therapy 5: 145.
  20. O’Brien J, Hayder H, Zayed Y, Peng C (2018) Overview of microRNA biogenesis, mechanisms of actions and circulation. Frontiers in Endocrinology 9: 402. [crossref]
  21. Ying SY, Chang DC, Lin SL (2008) The microRNA (miRNA): Overview of the RNA genes that modulate gene function. Molecular Biotechnology 38: 257-268. [crossref]
  22. Suzuki HI (2023) Roles of microRNAs in disease biology. Journal of JMA 6: 104-113.
  23. Keerthikumar S, Chisanga D, Ariyaratne D, Al Saffar H, Anand S, Zhao K, et al. (2015) Exocarta: A web-based compendium of exosomal cargo. Journal of Molecular Biology 428: 688-692. [crossref]
  24. Aili Y, Maimaitiming N, Mahemuti Y, Qin H, Wang Y, Wang Z (2021) Frontiers in Oncology 11: 686369.
  25. Beyer S, Fleming J, Meng W, Singh R, Haque SJ, Chakravarti A (2017) The role of miRNAs in angiogenesis, invasion and metabolism and their therapeutic implications in gliomas. Cancers (Basel) 9: 85. [crossref]
  26. Zhang D, Lee H, Zhu Z, Minhas JK, Jin Y (2017) Enrichment of selective miRNAs in exosomes and delivery of exosomal miRNAs in vitro and in vivo. American Journal of Physiology Lung Cellular and Molecular Physiology 312: L110-L121. [crossref]
  27. Janas T, Janas MM, Sapan K, Janas T (2015) Mechanisms of RNA loading into exosomes. FEBS Letters 589: 1391-1398. [crossref]
  28. Nail HM, Chiu CC, Leung CH, Ahmed MMM, Wang HMD (2023) Exosomal miRNA-mediated intercellular communications and immunomodulatory effects in tumor microenvironments. Journal of Biomedical Science 30: 69. [crossref]
  29. Aloizou AM, Pateraki G, Siokas V, Mentis AFA, Liampas I, Gazopoulos G, et al. (2020) The role of miRNA-21 in gliomas: Hope for a novel therapeutic intervention. Toxicology Reports 7: 1514-1530. [crossref]
  30. Quintavalle C, Garofalo M, Romano G, Zanca C, Laboni M, De Caro MDB, et al. (2011) MiR-221/222 overexpression in human glioblastoma increases invasiveness by targeting the protein phosphate PTP. Oncogene 31: 858-868. [crossref]
  31. Makowska M, Smolarz B, Romanowicz H (2023) MicroRNAs (miRNAs) in glioblastoma multiforme (GBM) -Recent literature review. International Journal of Molecular Sciences 24: 3521. [crossref]
  32. Xu CH, Xiao LM, Zeng EM, Chen LK, Zheng SY, Li DH, Liu Y (2019) MicroRNA-181 inhibits the proliferation, drug sensitivity and invasion of human glioma cells by targeting selenoprotein K (SELK) American Journal of Translational Research 11: 6632-6640. [crossref]
  33. Cai S, Shi CJ, Lu JX, Wang YP, Yuan T, Wang XP (2021) MiR-124-3p inhibits the viability and motility of glioblastoma multiforme by targeting RhoG. International Journal of Molecular Medicine 47: 69. [crossref]
  34. Qu S, Qiu O, Huang J, Liu J, Wang H (2021) Upregulation of hsa-miR-196a-5p is associated with MIR196A2 methylation and affects the malignant biological behaviors of glioma. Genomics 113: 1001-1010. [crossref]
  35. Jafari A, Karimabadi K, Rahimi A, Rostaminasab G, Khazaei M, Rezakhani L, et al. (2023) The emerging role of exosomal miRNAs as biomarkers for early cancer detection: A comprehensive literature review. Technology in Cancer Research and Treatment 22: 15330338231205999. [crossref]
  36. Otoukesh B, Abbasi M, Gorgani HL, Farahini H, Moghtadaei M, Boddouhi B, et al. (2020) MicroRNAs signatures, bioinformatics analysis of miRNAs, miRNA mimics and antagonists and miRNA therapeutics in osteosarcoma. Cancer Cell International 20: 254. [crossref]