DOI: 10.31038/IJNM.2024542
Abstract
Objective: This study aims to comprehensively understand the actual application of fertility decision support tools in the cancer patient population and their impact on reproductive outcomes. By introducing eight assessment concepts, including acceptability, adoption, appropriateness, feasibility, fidelity, cost, penetration, and sustainability, the tool is comprehensively evaluated. Ultimately, this study aims to provide more comprehensive fertility decision support for cancer patients, offering valuable insights for future research and clinical practice in this domain.
Methods: In August 2023, a comprehensive search was conducted across a total of 14 databases, including MEDLINE, CINAHL, PubMed, PsycINFO, Embase, Scopus, Web of Science, AMED, Cochrane, Google Scholar, CNKI, WanFang Data, VIP, and Sinomed. The included literature underwent methodological quality and bias risk assessment using a mixed-methods appraisal tool.
Results: A total of 11 studies were included for analysis, comprising 5 randomized controlled trials (RCTs), 3 non-randomized controlled studies (N-RCTs), 2 mixed-methods studies, and 1 quantitative cross-sectional study. The findings indicate that research on fertility decision support tools primarily focused on aspects such as fertility-related knowledge, decisional conflict, post-decision regret, satisfaction with information acquisition, the patient’s willingness for reproduction, and the characteristics of the decision support tool. Newly identified themes encompassed decision preparedness, family involvement, informed consent, social support, health literacy, and quality of life. Among the 11 studies included, there was a greater emphasis on the aspects of acceptability, adoption, appropriateness, and feasibility. Other aspects received no attention, including fidelity, cost, penetration, and sustainability.
Conclusion: This study delves into the potential impacts on reproductive outcomes when cancer patients utilize fertility decision-support tools. Through a systematic literature review, new fertility-related themes were identified under the umbrella of fertility decision support tools. However, further research is warranted to comprehensively assess the clinical application of these tools, thereby elucidating their advantages and ultimately enhancing the quality of decision-making for patients facing fertility-related issues.
Keywords
Cancer, Fertility, Decision support, Fertility preservation, Fertility decision-aid tools, Clinical application, Systematic review
Introduction
Fertility is crucial for the continuation of human life, and early adulthood is traditionally regarded as the prime time for individuals to have their own biological children. However, among cancer survivors, reproductive function is often compromised or interrupted due to the destructive nature of cancer itself or the reproductive toxic effects of cancer treatments, particularly in adolescents and young adults (15-39 years old) [1]. With the continuous advancement of comprehensive treatments such as surgery, chemotherapy, radiation therapy, and hormonal therapy, the survival rates of young patients have significantly improved. However, these treatments have both short-term and long-term adverse effects on patients’ fertility, especially in terms of ovarian damage [2]. Studies have shown that, compared to the general population, this gonadal injury may lead to a higher incidence of premature ovarian insufficiency and azoospermia, resulting in early menopause or infertility [3]. With the steady improvement of five-year survival rates among cancer patients [4], over 85% of adolescent and young adult (AYA) cancer survivors express a strong desire for fertility and aspire to become biological parents [5]. Following treatment completion, fertility becomes a focal point of concern for patients, their families, and healthcare providers [6-9]. A comprehensive systematic review concluded that the majority (66%-100%) of cancer patients express a desire to understand the impact of treatment on their fertility [10]. Among young patients without children or with plans for future parenthood, this need and emphasis are even more pronounced, with the proportion of patients seeking relevant information ranging from 0% to 85% [11]. Many guidelines have provided recommendations regarding fertility concerns in patients. International guidelines emphasize that oncologists should inform patients about the potential for treatment-induced infertility and, when necessary, refer them to reproductive medicine specialists before formulating a cancer treatment plan [12]. Clinical practice guidelines from the American Society of Clinical Oncology suggest that healthcare professionals should engage in early discussions with female cancer patients who wish to preserve fertility before treatment in order to offer them more options [13]. Despite an increase in the proportion of fertility counseling initiated by oncologists, less than half of cancer patients are satisfied with the fertility counseling they receive, and the rate of referrals to fertility specialists remains low [14,15]. When receiving reproductive counseling, most patients express an urgent need for more timely, standardized, and written information to address their unmet specific informational needs [16]. However, approximately half of patients (43%-62%) still perceive the information they receive as inadequate and insufficient to meet their needs [17]. A cross-sectional study indicated that less than 10% of adolescent and young adult (AYA) cancer patients received fertility preservation services [18]. In clinical practice, cancer patients face numerous factors that influence their fertility choices. Firstly, they may lack sufficient fertility knowledge [19,20], and their awareness of fertility preservation methods may also be relatively low [21]. Furthermore, there is a severe deficiency in supportive information services related to fertility [22], compounded by the complexity of available fertility preservation options [23], making patients consider many intricate factors in their decision-making. Consequently, the choice of treatment regimen and timing limitations [24], as well as communication issues between patients and healthcare professionals [25], add to the decision-making challenges. Additionally, a range of ethical, legal, and ethical issues need to be considered [26-28]. It should be noted that not all fertility preservation options are suitable for every patient. Depending on factors such as the patient’s age, family status, cancer type, treatment modality, prognosis, and the timing before treatment initiation, some options may be more suitable than others when it comes to preserving fertility. Hence, patients face significant stress and conflicts in making fertility decisions. If patients do not receive comprehensive information about all fertility preservation options or lack support during the decision-making process, the difficulties in decision-making are exacerbated [17,29,30]. Simultaneously, oncology healthcare providers have also reported insufficient knowledge about fertility preservation methods and establishing connections [31,32]. To address these issues, decision support interventions have been developed for both patients and healthcare providers [33,34], aiming to enhance understanding of fertility preservation methods and reduce conflicts in the decision-making process for cancer patients [35].
Decision Aid Tools (PtDAs) are evidence-based tools that assist users in making preference-sensitive decisions by providing information specific to a particular health condition. They emphasize the benefits, risks, probabilities, and uncertainties associated with different choices related to a health condition, allowing patients to clarify their values and consider each option according to their personal preferences before making an informed decision [36]. To address decision-making regarding fertility preservation in female cancer patients, relevant guidelines recommend that healthcare professionals offer decision aids to women considering fertility preservation [12]. Numerous PtDAs for fertility preservation have been developed, and they have demonstrated positive initial application outcomes. These tools significantly enhance patients’ understanding of fertility preservation, reduce decisional conflict, and achieve high overall patient satisfaction. Over 115 randomized controlled trials have indicated that patient decision aids improve decisional conflict by increasing knowledge, fostering realistic expectations, building self-efficacy, and enhancing decision involvement [37]. A previous systematic review has indicated that patient decision aid tools (PtDAs) may play a crucial role in providing information and guiding decisions in this context. Wang et al. (2018) [35] conducted a systematic literature review on cancer patient decision aids to assess their effectiveness in supporting decisions related to fertility preservation. The results showed that decision aids enhanced awareness of fertility preservation, alleviated decisional conflict, and garnered high satisfaction ratings. As research continues to advance, an increasing number of relevant primary studies have emerged. However, in the routine assessment of such studies for clinical application, we have yet to observe systematic, comprehensive, and integrated research outcomes. The purpose of this study is to gain a deeper understanding of the specific impacts of decision-aid tools on reproductive outcomes and to comprehensively and systematically evaluate the actual effects of these tools in cancer patients. Additionally, we aim to identify potential new influencing factors and key determinants of reproductive decision-making that have not been previously mentioned in similar studies. Ultimately, we will utilize the concepts of acceptability, adoption, appropriateness, feasibility,fidelity, cost, penetration, and sustainability to conduct a comprehensive, multidimensional assessment of the application of decision aids, thereby providing a more comprehensive set of research results.
Materials and Methods
Data Sources and Study Selection
The systematic review followed the guidelines of the Preferred Reporting Items for Systematic Reviews and Meta-Analysis 2020 guidelines [38]. Inclusion Criteria: 1) fertility decision support tools as an intervention affecting reproductive outcomes in cancer patients; 2) patient involvement must be present in the development, assessment, implementation, and evaluation phases of fertility decision support tools; 3) in cases where multiple reports exist for the same study, the most recent research was included. If the same data was reported with different emphases, the study was still included; 4) forms of intervention included, but were not limited to, printed materials (such as pamphlets), online resources (such as websites), computer-based tools, or video-based resources; 5) both English and Chinese language literature were considered. Exclusion Criteria: 1) Literature reviews, books, unpublished articles, commentaries, protocols, conference abstracts, and research plans; 2) Literature meeting inclusion criteria but with data that could not be extracted.
Search Strategy
The literature search was conducted in August 2023, encompassing a total of 14 databases, including MEDLINE, CINAHL, PubMed, PsycINFO, Embase, Scopus, Web of Science, AMED, Cochrane, Google Scholar, CNKI, WanFang Data, VIP, and Sinomed. Duplicate articles were screened using EndnoteX 9.3.3. Two researchers conducted a joint review, browsing through the titles and abstracts of the literature before proceeding with full-text readings. In the event of any discrepancies, a third expert was consulted for adjudication.2.3 | Data extraction, quality assessment and synthesis
Data Extraction, Quality Assessment and Synthesis
Data extraction was carried out by two scholars. In the event of any discrepancies, a third party was consulted for resolution. The extracted information included general details and specific research outcomes. General details encompassed authorship, country of origin, study type, research phase, participant demographics, sample size source, research methodology, and data collection time points. Specific research outcomes included the type of decision aid tool, primary research objectives, measurement tools, and study results. Data related to implementation outcomes, as described by Proctor et al. (2011) [39], were extracted based on eight conceptually distinct implementation outcomes, which encompassed acceptability, adoption, appropriateness, feasibility, fidelity, implementation cost, penetration, and sustainability. It was deemed necessary to track and evaluate these cited references to ensure the report’s completeness. The included studies underwent quality and risk bias assessments using the Mixed Methods Appraisal Tool (MMAT). Each study was subjected to data synthesis based on two screening questions and five assessment criteria. In cases of score discrepancies, reviewers engaged in discussions until consensus was reached. This review strategy has been registered and is available on PROSPERO (ID: CRD42023452239).
Results
Study Selection
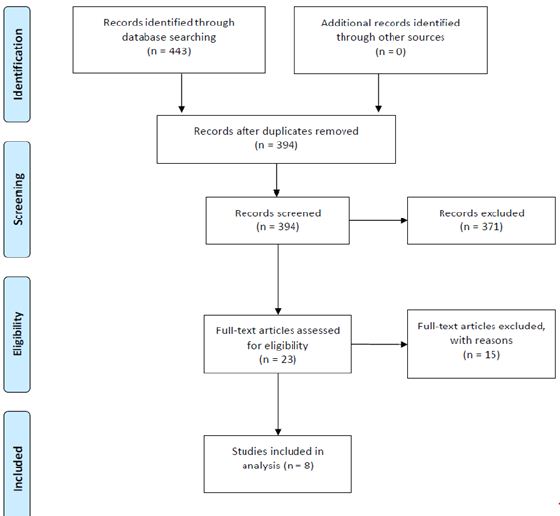
We employed a systematic literature search strategy, covering multiple databases and yielding a total of 2660 potentially relevant articles. These included MEDLINE (347 articles), CINAHL (172 articles), PubMed (422 articles), PsycINFO (23 articles), Embase (698 articles), Scopus (85 articles), Web of Science (618 articles), AMED (1 article), Cochrane (71 articles), Google Scholar (17 articles), CNKI (20 articles), WanFang Data (176 articles), VIP (2 articles), and Sinomed (8 articles). Subsequently, we utilized Endnote X9.3.3 software to screen and remove all duplicate records, resulting in the exclusion of repeated literature. Following this, a meticulous initial screening of titles and abstracts was conducted for 1619 articles. At this stage, we ultimately selected 123 articles for full-text reading. Two researchers independently reviewed the literature to ensure its content aligned with the research theme and type. During the process of full-text reading, a total of 112 articles were excluded. The reasons for exclusion included irrelevance to the research theme, unavailability of the full text, inconsistency in study type, and inclusion of research plans and conference abstracts, among others. During the process of including literature, any discrepancies were adjudicated by a third expert to ensure the rigor and accuracy of the research. Ultimately, we included 11 articles that met the objectives and requirements of our study. The specific search strategy can be found in the PRISMA flow diagram.
Study Quality
We conducted quality assessments for each included publication using the Mixed Methods Appraisal Tool (MMAT) standard. MMAT assesses the quality of qualitative or quantitative studies, with scores ranging from 25% (meeting one criterion) to 100% (meeting all criteria). In this study, the overall quality of the included research was relatively high. Specifically, seven studies achieved a quality score of 100%, while the remaining studies scored 80%. The lower scores were primarily attributed to poor reporting of methods in RCT studies, particularly in the aspects of randomization and allocation concealment.
Study Characteristics
Table 1 and Table 2 summarize the general characteristics and specific content of the included studies. The 11 selected articles span the years from 2012 to 2022 and were conducted in various countries or regions, including one from the United Kingdom [40], two from China [41,42], two from Australia [34,43], three from Switzerland [14,44,45], one from Germany [46], and two from the Netherlands [47,48]. These studies encompass a diverse range of types, consisting of five randomized controlled trials (RCTs) [14,42-44,47], three non-randomized controlled studies (N-RCTs) [45,46,48], two mixed-method studies [40,41], and one quantitative cross-sectional study [34]. The primary phases of the studies predominantly focus on the implementation of effects, with a total of 10 articles addressing this aspect [14,34,40-42,44-48], followed by tool development (2 articles) [41,45], feasibility (2 articles) [40,47], and acceptability (1 article) [43]. In total, 1300 subjects were involved in these studies, covering various types of cancer with a primary focus on breast cancer.
Table 1: General characteristics of 17 trials of patient decision-aids for cancer patient.
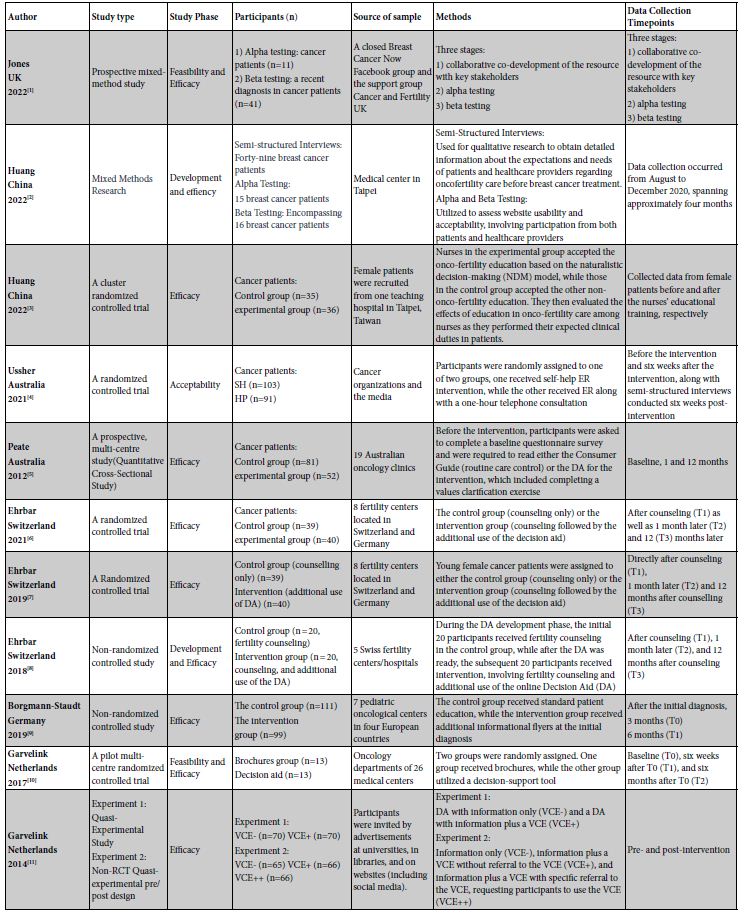
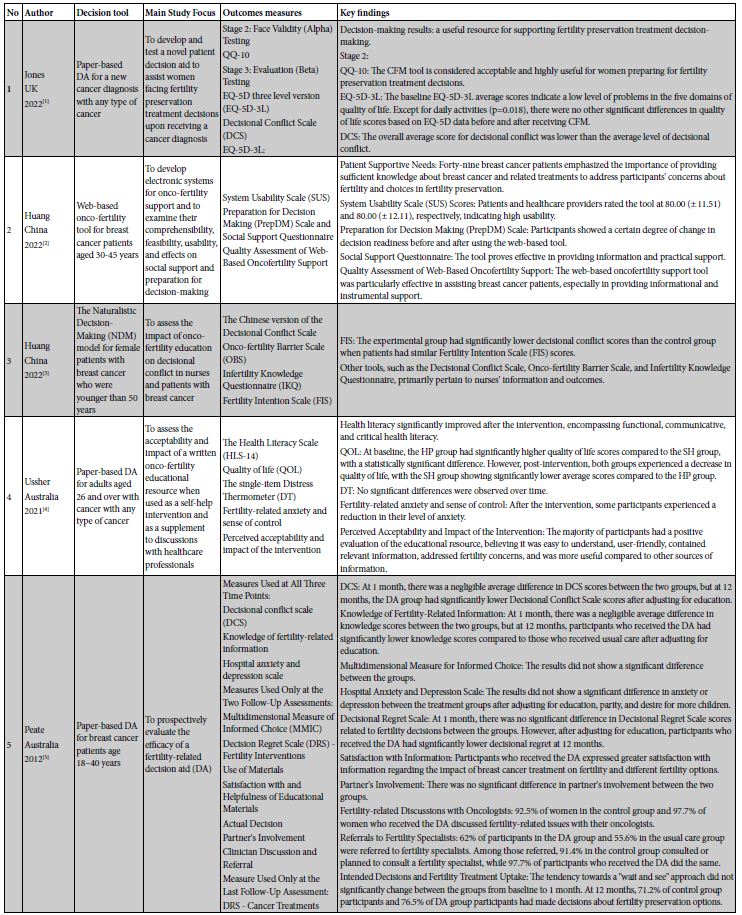
Table 2: Overview of Included Decision Aids, Treatment Coverage, Outcome Measures, and Key Findings.
Decision‐Aid Characteristics
Decision aid tools were incorporated in the studies in various formats: four studies utilized paper-based tools [34,40,43,46], three studies employed online-based tools [14,45,48], three studies were based on web platforms [41,44,47], and one study did not specify the type of decision aid tool used [42].
Effect of Decision‐Aids on Decisional Outcomes
Fertility-related Knowledge
Six studies investigated the impact of fertility decision support systems on patients’ fertility-related knowledge. This includes two randomized controlled trials (RCTs) [44,47], two non-randomized controlled trials [45,46], one cross-sectional study [34], and one quasi-experimental study [48]. These studies employed researcher-developed questionnaires for measurement. In these studies, Peate et al.’s research [34] found no significant difference in knowledge scores between the intervention and control groups at one month, but at 12 months, the DA group had lower knowledge scores compared to the routine care group. Ehrbar et al.’s study [45] indicated that after fertility preservation knowledge counseling (T1), there was no significant difference in knowledge between the two groups. However, in the aspect of “egg freezing,” the intervention group showed significantly higher knowledge and confidence. Conversely, a recent study [44] discovered no significant difference in patients’ knowledge about existing fertility preservation methods between the two groups. On the other hand, Borgmann-Staudt et al.’s study [46] demonstrated that in terms of impaired fertility and preservation knowledge, patients in the intervention group had higher average knowledge scores than the control group at both 3 months post-diagnosis (T0) and 6 months post-diagnosis (T1), but these differences were not significant at both time points. Garvelink et al.’s study [47] found significant differences in knowledge between baseline and 6 weeks post-baseline (T1), as well as between baseline and 6 months post-baseline (T2). However, there were no significant knowledge differences between the intervention group and the control group. Additionally, Garvelink et al.’s study [48] pointed out that different types of decision support tools did not significantly affect the time spent using the tool and the number of pages viewed. However, regardless of the type of tool used, they significantly elevated the level of knowledge, resulting in an 81% relative increase. Furthermore, there was a positive correlation between the time spent using the tool and the level of knowledge.
Decision Conflict
Among the 7 studies evaluating the impact of fertility decision support tools on decision conflict, the study designs included 3 randomized controlled trials (RCTs) [14,42,47], 1 non-randomized controlled trial [45], 1 mixed-methods study [40], 1 quasi-experimental study [48], and 1 cross-sectional study [34]. These studies employed the Decisional Conflict Scale for assessment. Jones et al.’s study [40] showed that that the level of decision conflict in the control group was generally below the average level. Huang et al. [42] assessed the impact of oncology fertility education for breast cancer nurses and patients on decision-conflict. The results indicated that, with similar scores on the Fertility Intention Scale (FIS) among patients, the experimental group had significantly lower decision conflict scores than the control group. Peate et al. [34] used the Decisional Conflict Scale for decision conflict measurement and found that participants receiving the DA experienced a significantly greater reduction in decision conflict over 12 months compared to participants receiving standard care. At 1 month, the average difference in DCS between the two groups was negligible, but at 12 months, the DA group had lower Decisional Conflict Scale scores than the routine care group. Additionally, Ehrbar et al.’s study in 2019 [14] found that participants who had already made a decision about fertility preservation after consultation (T1) had significantly lower decision conflict scores. The intervention group had significantly lower decision conflict scores compared to the control group. At 1 month after consultation (T2), the intervention group also had significantly lower decision conflict scores in total and on both sub-scales compared to the control group. However, 12 months after consultation (T3), the decision conflict difference between the two groups was no longer significant. Furthermore, Ehrbar et al.’s 2018 study [45] found that the intervention group had slightly higher overall decision conflict scores than the control group, but these differences were not significant. In another study, Garvelink et al.’s results [47] showed that women who received the booklet scored significantly lower on the “effective decision” sub-scale compared to women who received the decision aid (DA). Finally, Garvelink et al.’s study [48] found that women who used the values clarification exercise had a significantly different tool use time compared to those who did not use it, but there was no difference compared to those who were unable to use the exercise. Women who used the exercise performed better in decision conflict, value clarification, decision support, and informed decision.
Decision Regret
In the included literature, a total of four studies addressed decision regret, including three randomized controlled trials (RCTs) [14,44,47] and one cross-sectional study [34]. These studies all employed the Decisional Regret Scale (DRS) for measurement. The study by Peate et al. [34] observed that at one month, there were no significant differences in DRS scores regarding fertility-related decisions between groups. However, at twelve months, after adjusting for educational levels, participants who received Decision Aid (DA) exhibited significantly lower levels of decision regret. On the other hand, findings from the studies by Ehrbar et al. in 2019 and 2021 [14,44] indicated that patients in both intervention and control groups reported overall low levels of decision regret, with the intervention group consistently lower than the control group. However, these differences did not reach statistical significance. It is noteworthy that at one month post-consultation (T2), no significant correlation was found between decision conflict and decision regret. However, at twelve months post-consultation (T3), a strong correlation emerged. Contrastingly, the study by Garvelink et al. [47] found no statistically significant differences in anticipated regret between measurement time points or between groups. It is worth noting that both groups exhibited a slight trend of increased regret between baseline assessments after six weeks (T1) and six months (T2), although this increase was not significant.
Information Satisfaction
Incorporated into the research are three studies that delve into information satisfaction. These include one randomized controlled study [14], one non-randomized controlled study [45], and one cross-sectional study [34]. The assessment tools utilized in these studies were custom-designed questionnaires by the researchers. Peate et al.’s study [34] found that participants who underwent decision aid (DA) were more satisfied with information regarding the impact of breast cancer treatment on fertility and different fertility options. Ehrbar et al.’s 2018 research [45] demonstrated that decision support tools were considered helpful in the decision-making process, with the majority of participants expressing willingness to recommend them to other women. Their 2019 study likewise affirmed [14] that DA participants reported higher satisfaction levels and perceived the use of DAs as beneficial.
Fertility Intentions
In addressing the influence of decision support tools on fertility intentions, we included a total of three randomized controlled trials [14,42,44]. One study utilized the Fertility Intentions Scale (FIS) for measurement [42], while the remaining two employed patient-designed questionnaires. Huang et al.’s study assessed changes in patients’ fertility intentions using the FIS scale after employing decision support tools. The results revealed that, with similar scores on the Fertility Intentions Scale (FIS), the experimental group exhibited significantly lower decisional conflict scores compared to the control group. This indicates the effectiveness of decision-support tools in reducing decisional conflict. Ehrbar et al.’s study [14] found a notably higher positive attitude towards fertility preservation compared to a negative attitude, with no significant differences between the two groups. Additionally, attitudes and willingness to undergo fertility preservation remained stable over time, demonstrating consistency and stability in patients’ attitudes towards fertility preservation. Furthermore, Ehrbar et al.’s 2021 research [44] arrived at similar conclusions. They observed significantly higher positive attitudes in both groups compared to negative attitudes. The control and intervention groups showed comparable scores in positive attitudes, negative attitudes, and willingness to utilize fertility preservation methods. Participants’ attitudes and intentions towards fertility preservation remained stable from post-consultation (T1) to 12 months post-consultation (T3), indicating that the impact of decision support tools on fertility attitudes and intentions remains consistent over a period of time.
Characteristics of Decision Support Tools
In the evaluation of fertility decision support tools, we included a total of four studies, comprising two randomized controlled trials [43, 44] and two mixed-method studies [40,41]. Jones et al. [40] assessed the utility of the decision tool using the QQ-10 scale and ultimately concluded that the CFM tool is acceptable and highly beneficial for women making decisions regarding fertility preservation treatment. Additionally, Huang et al. [41] developed an electronic system for tumor fertility protection and examined its comprehensibility, feasibility, and usability. The study found high usability ratings from both patients and healthcare providers. Furthermore, the social support questionnaire assessment indicated effectiveness of the tool in providing information and practical support, particularly for breast cancer patients. Ussher et al. [43] evaluated the perceived acceptability and impact of the intervention. The results showed that the majority of participants gave positive feedback on the educational resources, considering them easy to understand, user-friendly, containing relevant information, and addressing fertility concerns more effectively than other sources of information. Moreover, Ehrbar et al.’s [44] study reached similar conclusions. They found significantly higher positive attitudes in both groups compared to negative attitudes. The control and intervention groups showed comparable scores in positive attitudes, negative attitudes, and willingness to use fertility preservation methods. Participants’ attitudes and intentions towards fertility preservation remained stable from post-consultation (T1) to 12 months post-consultation (T3), with no significant changes observed.
Others
Fertility decision support tools play a positive role in decision readiness [40,41], family involvement [34,46], informed consent [34,48], social support [41], and health literacy [43], providing robust support and guidance for patients facing decisions about fertility preservation treatment. However, we encountered different results in terms of quality of life. Within the context of fertility decision-making, we observed relatively limited coverage of various aspects under this theme. Nevertheless, despite the relatively small number of studies involved, we were able to identify some intriguing patterns and draw some conclusions based on existing data. Therefore, we conducted a comprehensive review based on logical grouping, highlighting the following key themes: decision readiness, family involvement, informed consent, social support, health literacy, and quality of life. First and foremost, decision readiness emerged as a crucial topic. Research indicates that decision support tools play a positive role in enhancing patients’ level of decision readiness. By employing these tools, patients gain a more comprehensive understanding of information related to fertility preservation treatment, providing a solid foundation for their decision-making process. Jones et al.’s study [40] found that fertility decision support tools were considered acceptable and highly beneficial for women preparing to make decisions about fertility preservation treatment. Additionally, Huang et al.’s 2022 study [41] emphasized the importance of providing ample knowledge about breast cancer and related treatments, addressing participants’ concerns about fertility and fertility preservation choices. Furthermore, family involvement and support also play an indispensable role in the decision-making process. Studies suggest that the active participation of partners or family members can alleviate patient anxiety and have a positive impact on decision outcomes. Obtaining support from family members during the decision-making process provides patients with additional confidence and peace of mind, enabling them to make decisions that align with their own wishes. Borgmann-Staudt et al.’s study also confirmed that specially designed educational materials about fertility preservation improved the knowledge and autonomy of both patients and parents [46]. However, Peate et al.’s study found no significant difference in partner involvement between the two groups [34]. Additionally, having a comprehensive understanding of relevant information is crucial for making informed decisions. By thoroughly comprehending various pieces of information during the decision-making process, patients can better grasp the implications and consequences of various choices, allowing them to make fertility preservation decisions that align with their individual circumstances. Garvelink et al.’s study also emphasized the importance of information, with women using value clarification exercises performing better in decision conflict, value clarification, decision support, and informed decision-making [48]. The effectiveness of social support networks also plays a crucial role in the decision-making process. When facing decisions about fertility preservation treatment, receiving assistance from social support networks helps patients better understand and address various issues, providing strong support for the decision-making process. Huang et al.’s study found that providing ample knowledge about breast cancer and related treatments was crucial for participants in making decisions about fertility and fertility protection [41]. Lastly, having good health literacy is an essential component of the decision-making process. It helps patients better understand and participate in the decision-making process, enhancing their capacity for making informed health decisions. The study found that after the intervention, patients’ health literacy significantly improved, including functional, interactive, and critical health literacy [43]. It’s worth noting that in the included studies, intervention had different expected outcomes on participants’ quality of life, with no change or varying degrees of decline observed. Jones et al. [40] assessed the quality of life of women facing decisions about preserving fertility after receiving a cancer diagnosis using the EQ-5D-3L scale. The baseline EQ-5D-3L average scores indicated lower levels of problems in five quality of life domains. Apart from daily activities (p = 0.018), there were no other significant differences in quality of life scores based on EQ-5D data before and after receiving CFM. Ussher et al.’s study noted that at the baseline stage, the Health Promotion (HP) group, through self-intervention with educational resources, had significantly higher quality of life scores than the Standard Health (SH) group, showing a statistical difference. However, after the intervention, both groups experienced a decline in quality of life, with the SH group’s average quality of life score significantly lower than that of the HP group.
Implementation Results
Among the studies included, at least seven provided data on implementation results (see Table 3 Additional file 6). A total of five studies discussed acceptability [14,34,40,43,45], three discussed adoption [14,41,45], one discussed appropriateness [43], and two discussed feasibility [41,47]. Other aspects were not addressed, including fidelity, cost, penetration, and sustainability. The measurement method primarily involved surveying patients. In terms of acceptability, our main focus was focused on the perspectives of patients, healthcare providers, or other stakeholders to determine whether there was widespread acceptance and satisfaction. In the five included studies, researchers assessed participants’ satisfaction with fertility decision support tools through self-made questionnaires [14,34,40,43,45]. In terms of adoption, the attention was on the extent of implementation strategy dissemination across different organizations or regions. In the three studies included, one study measured this through the System Usability Scale (SUS) Scores questionnaire [41], and all three results indicated willingness to propagate and use this tool [14,41,45]. Appropriateness considered contextual factors, such as patient characteristics and healthcare environments, to assess the suitability of the strategy. Only one study measured results in this aspect, showing that clinical healthcare providers had confidence in recommending the tool’s use to patients [43]. Feasibility focused on resource feasibility and implementation feasibility assessments, including potential obstacles and challenges. Two studies addressed this theme, and the research results both showed that the tool is feasible and effective, with potential for further validation through large-scale studies in the future [41,47].
Discussion
In this study, we conducted a systematic review of the impact of fertility decision support on fertility outcomes in cancer patients. The outcome indicators primarily covered fertility knowledge, decisional conflict, decision regret, information satisfaction, fertility intentions, and tool characteristics. Additionally, we discovered a range of new research findings, including the effects on patient decision-making preparedness, family involvement, patient informedness, social support, patient health literacy, and quality of life. Upon comprehensively analyzing the application of decision support tools in clinical practice, we observed that the majority of studies primarily focused on assessing the acceptability, adoption, appropriateness, and feasibility of the tools. The fertility decision support system has shown a certain impact on patients’ knowledge related to fertility preservation. However, this impact is influenced by multiple factors and requires continuous optimization and improvement in practice. Additionally, specific support for fertility preservation and its long-term effects need further research and attention. From the research results, there is considerable heterogeneity, and the impact on fertility knowledge is time-dependent, yielding different results at different times. Peate et al.’s study [34] found that the fertility decision support system did not have a significant impact on knowledge scores in the short term, but in the long term, the DA group’s knowledge scores were significantly lower than than those of the standard care group. Future research should pay more attention to and optimize the long-term effects of fertility decision support systems. Furthermore, Garvelink et al.’s study [48] indicates that different types of decision-support tools do not significantly affect the time spent using the tool or the number of pages viewed. However, regardless of the type of tool used, they significantly increase knowledge levels, with a relative increase of 81%. This underscores that the design of decision support tools may be more important than specific types, as their primary function is to enhance patients’ knowledge levels.
Decision conflict is an issue that cancer patients need to pay attention to when facing the decision of fertility preservation. Decision support tools can reduce the level of decision conflict in patients to some extent. However, there are certain differences in results under different research conditions, so the application of decision support tools needs to be considered comprehensively according to specific situations in practice. At the same time, long-term tracking and evaluation are also necessary to understand the persistence and stability of the decision. Huang et al.’s study shows that after receiving cancer fertility education, the decision conflict scores of the experimental group were significantly lower than those of the control group, indicating that an improved education level can make patients more clear about their choices when making decisions [42]. The results of Peate et al.’s study present an interesting trend. In the short term, the difference in decision conflict between the two groups is not significant [34]. However, with long-term observation, patients receiving decision support were significantly lower than those receiving routine care, indicating that fertility decision support tools play a positive role in the long-term decision-making process. On the other hand, Ehrbar et al.’s study also found that after consultation, participants who had already made the decision to preserve fertility had significantly lower decision conflict scores, and the decision conflict scores of the intervention group were also significantly lower than those of the control group. However, after long-term follow-up, the difference in decision conflict between the two groups was no longer significant, which may be because the stability of the decision gradually tended to be consistent over time. The analysis of multiple studies shows that the overall level of decision conflict is relatively low, indicating that fertility decision support tools can provide effective support, reducing the contradictions and confusion in the decision-making process. Decision regret is a complex and multidimensional psychological state in the process of fertility preservation treatment decision-making. Different research results may be influenced by various factors, including individual characteristics, education level, and the timing of using decision support tools. In future research, it may be considered to further explore these influencing factors in order to provide more targeted decision support and intervention measures to alleviate the potential decision-regret emotions that patients may face. Decision support tools have achieved significant effectiveness in providing fertility-related information, enabling patients to have a clearer understanding of reproductive knowledge. The discussion of information satisfaction in the study focuses on evaluating the effectiveness of decision support tools in helping patients obtain fertility-related information and the satisfaction of patients with this information. At the same time, patients’ satisfaction with the use of decision support tools is also high, and they are willing to recommend them to other women. This provides strong support for the further promotion and application of decision support tools. Peate et al.’s research results show that participants who received decision support were more satisfied with information regarding the impact of breast cancer treatment on fertility and different reproductive choices [34]. This indicates that decision support tools play a positive role in providing information, enabling patients to have a more comprehensive understanding of reproductive knowledge. The multiple studies by Ehrbar et al. [14,45] also indicate that patients participating in decision support are satisfied with the use of the tool and believe that it has a positive impact on their decision-making process. However, it is worth noting that there are certain differences in results under different research conditions, so the application of decision support tools needs to be comprehensively considered according to specific situations in practice to ensure that patients can obtain the maximum level of information satisfaction. The decision support tool has achieved positive results in influencing the willingness for fertility preservation, reducing the patients’ decision conflict, and maintaining a positive attitude towards fertility preservation. This provides strong support for the application of decision support tools in clinical practice. It also reminds us that in the design and implementation of decision support tools, it is important to provide patients with comprehensive and clear information about fertility preservation to better assist them in making decisions that align with their own intentions. The results of Huang et al.’s study [42] indicate that the experimental group had significantly lower decision conflict scores compared to the control group. This suggests that the decision support tool has achieved significant effectiveness in reducing patients’ decision conflict. It is evident that the decision support tool provides patients with more comprehensive and clear information about fertility preservation, enabling them to have a clearer understanding of their choices. Additionally, the studies by Ehrbar et al. in 2019 and 2021 [14,44] show that participants’ attitudes towards fertility preservation were significantly more positive than negative, and this attitude remained stable over time. This indicates that patients’ attitudes towards fertility preservation are relatively stable and consistent. The decision support tool did not change the patients’ attitudes but rather provided additional information based on their existing attitudes.
The decision support tool has demonstrated significant effectiveness in providing fertility preservation information and support, offering strong assistance for patients to make decisions in line with their own preferences. This underscores the importance of considering patients’ needs and providing easily understandable, user-friendly, and comprehensive information when designing and implementing decision support tools, in order to better assist patients in their decision-making process. The study by Jones et al. [40], which utilized the QQ-10 to assess the usability of the CFM tool, yielded results indicating that the tool is acceptable and highly useful for women preparing to make decisions about fertility preservation treatment. This indicates the tool’s effectiveness in providing information and support. Additionally, the electronic system for tumor fertility protection developed by Huang et al. [41] received positive evaluations in terms of comprehensibility, feasibility, and usability. Both patients and healthcare providers considered it highly usable. Furthermore, the tool demonstrated effectiveness in providing information and practical support, particularly for breast cancer patients. In the research on fertility preservation decision support tools, we have made intriguing new findings that play a positive role in decision preparedness, family involvement, informed consent, social support, health literacy, and quality of life. Firstly, decision preparedness has been confirmed as a crucial issue. Decision support tools actively contribute to enhancing patients’ level of decision preparedness. By utilizing these tools, patients can gain a more comprehensive understanding of information related to fertility preservation treatment, providing a solid foundation for decision-making. Particularly, in the study by Jones et al. [40], fertility preservation decision support tools were deemed acceptable and highly useful for women preparing to make decisions about fertility preservation treatment. Secondly, family involvement and support play an indispensable role in the decision-making process. The active participation of partners or family members can alleviate patient anxiety, positively influence decision outcomes, and garnering support from family members can provide patients with added confidence and reassurance, enabling them to make decisions that align with their preferences more resolutely. Furthermore, having a thorough understanding of relevant information is crucial for making informed decisions. By comprehensively understanding various pieces of information during the decision-making process, patients can better grasp the impacts and consequences of various choices, thereby making fertility preservation selections that align with their individual circumstances. The effectiveness of a social support network also plays a vital role in the decision-making process. Receiving assistance from a social support network can help patients better comprehend and address various issues, providing robust support for decision-making. Finally, having good health literacy is an essential component of the decision-making process. It aids patients in better understanding and participating in the decision-making process, elevating their capacity for making health-related decisions. The research found that after intervention, patients’ health literacy significantly improved, including functional, interactive, and critical health literacy [43]. Regarding quality of life, the reasons behind changes in quality of life after fertility preservation decision support will also need to be further explored in the future. In summary, though research on these aspects is relatively limited, we have uncovered numerous intriguing patterns and conclusions from existing data. Decision preparedness, family involvement, informed consent, social support, health literacy, and quality of life are all crucial topics worthy of attention in the fertility preservation treatment decision-making process. The positive impacts of these aspects provide robust support and guidance for patients when facing decisions about fertility preservation treatment, further promoting the rationality and personalization of medical decisions. These new findings offer valuable references for future research and clinical practice.
Clinical Limitations
While we have made comprehensive efforts to discuss the application of fertility preservation decision support tools in clinical settings in this study, it is important to acknowledge that there are still some limitations in certain aspects. Firstly, in terms of factors such as credibility, cost, penetration, and sustainability, there may be insufficient data or the ability to provide a comprehensive summary in the current research. However, we can propose some potential improvement suggestions from the perspective of future research and practice. It is recommended to consider tool reliability as a crucial assessment criterion in future studies and explore how to ensure the stability and credibility of the tool in practice. Additionally, from the standpoint of technological progress and development trends, discussing how to reduce the cost of the tool to promote its widespread clinical application is worthwhile. Furthermore, strengthening the promotion and training of this tool is also an important initiative to increase its prevalence in clinical practice. It is essential to think about how to ensure the tool remains effective in long-term use, such as through regular updates and enhancements. For other aspects of the discussion, it should be noted that not all possible scenarios have been covered in the current research. In future studies, further exploration of these aspects will be necessary to gain a comprehensive understanding of the effectiveness of fertility preservation decision-support tools in clinical practice. Despite our best efforts to address these limitations in this study, it is crucial to exercise caution when generalizing these results to other contexts.
The limitations of this study include the potential for significant bias and contradictory results due to inconsistent assessment criteria in the measurement methods employed. This limitation could impact the accurate understanding and assessment of the psychological state in the decision-making process regarding fertility preservation treatments. Furthermore, factors such as sample selection and study design may introduce selection bias and extrapolation constraints, thereby restricting the generalizability and applicability of the study’s findings to a certain extent. Therefore, the inconsistency in measurement methods within the study may lead to contradictions among research outcomes. This underscores the need for future research to carefully and meticulously select appropriate measurement tools while taking into full consideration various potential influencing factors in order to enhance the reliability and robustness of research results. This study, based on existing data and our inclusion methodology, has made every effort to ensure comprehensiveness. However, given the breadth of the research field and the nature of database searches, we acknowledge the possibility that some studies, especially those conducted under specific conditions, may not have been included. Nevertheless, we believe that this does not diminish the uniqueness and importance of our study. Given the current limitations of this research, we encourage future researchers to continue exploring this field. We believe that such efforts will contribute to enriching and refining the knowledge base in this area, providing more comprehensive and effective support for future clinical practices.
Clinical Implications
Firstly, through a comprehensive analysis of the latest research findings, we can provide clinical practitioners with an up-to-date and authoritative body of scientific evidence to support the development and application of fertility decision-making tools. Secondly, it can facilitate patient involvement in decision-making. Fertility decisions are highly personalized and sensitive topics, making patient involvement crucial. By furnishing patients with scientific foundations, we empower them with more agency and confidence, enabling active participation in the decision-making process. This not only ensures that patients feel heard but also enhances their trust in treatment options, thereby improving the overall efficacy of the treatment process. Additionally, we can assist patients in better comprehending the various influencing factors of fertility decisions through information and education, enabling them to make more informed choices. Lastly, our research provides practical guidance and decision support. Clinical healthcare providers can tailor the most appropriate fertility decision plans for each patient based on this scientific evidence, thus maximizing patients’ fertility aspirations. Simultaneously, patients can, with this evidence, participate more confidently in the treatment process, thereby collectively achieving the most desirable treatment objectives.
Conclusion
The primary objective of this study is to explore the tangible impact of fertility preservation decision aid tools (PtDAs) among cancer patients. Through a comprehensive assessment encompassing various aspects such as fertility-related knowledge, decision conflicts, post-decision regret, information satisfaction, fertility intentions, and tool characteristics, this research furnishes robust evidence for a deeper understanding of the practical implications of PtDAs within the cancer patient population. It offers valuable insights for clinical nursing practices, potentially serving as a valuable complement to current fertility care practices. Beyond clinical counseling, this research aims to ensure the fulfillment of the demand for high-quality information and support.
Declarations
Ethical Approval and Consent to Participate
Not applicable
Funding
No funding
Availability of Data and Materials
Data sharing not applicable to this article as no datasets were generated or analysed during the current study.
References
- Ussher JM, Perz J (2018) Threat of biographical disruption: the gendered construction and experience of infertility following cancer for women and men. BMC Cancer. 18.
- Qiu J, Tang L, Li P, Liu G, Rong X (2023) Psychological and reproductive decision-making experiences of young women after breast cancer diagnosis: a qualitative study. Supportive care in cancer: official journal of the Multinational Association of Supportive Care in Cancer. 31.
- Kim J, Mersereau JE, Su HI, Whitcomb BW, Malcarne VL, et al. (2016) Young female cancer survivors’ use of fertility care after completing cancer treatment. Support Care Cancer. 24: 3191-3199.
- Sung H, Ferlay J, Siegel RL, Laversanne M, Soerjomataram I, et al. (2021) Global Cancer Statistics 2020: GLOBOCAN Estimates of Incidence and Mortality Worldwide for 36 Cancers in 185 Countries. CA Cancer J Clin, 71: 209-249.
- Korte E, Schilling R, Balcerek M, Byrne J, Dirksen U, et al. (2020) Fertility-Related Wishes and Concerns of Adolescent Cancer Patients and Their Parents. J Adolesc Young Adult Oncol. 9: 55-62.
- Ellis SJ, Wakefield CE, McLoone JK, Robertson EG, Cohn RJ (2016) Fertility concerns among child and adolescent cancer survivors and their parents: A qualitative analysis. JOURNAL OF PSYCHOSOCIAL ONCOLOGY. 34: 347-362.
- Klosky JL, Simmons JL, Russell KM, Foster RH, Sabbatini GM, et al. (2015) Fertility as a priority among at-risk adolescent males newly diagnosed with cancer and their parents. Support Care Cancer, 23(2): 333-341.
- Nahata L, Morgan TL, Ferrante AC, Caltabellotta NM, Yeager ND, et al. (2019) Congruence of Reproductive Goals and Fertility-Related Attitudes of Adolescent and Young Adult Males and Their Parents After Cancer Treatment. J Adolesc Young Adult Oncol. 8: 335-341.
- Stein DM, Victorson DE, Choy JT, Waimey KE, Pearman TP, et al (2014) Fertility Preservation Preferences and Perspectives Among Adult Male Survivors of Pediatric Cancer and Their Parents. J Adolesc Young Adult Oncol. 3: 75-82.
- Goossens J, Delbaere I, Van Lancker A, Beeckman D, Verhaeghe S, et al. (2014) Cancer patients’ and professional caregivers’ needs, preferences and factors associated with receiving and providing fertility-related information: a mixed-methods systematic review. Int J Nurs Stud 51: 300-319.
- Peate M, Meiser B, Hickey M, Friedlander M (2009) The fertility-related concerns, needs and preferences of younger women with breast cancer: A systematic review. Breast Cancer Research and Treatment. 116: 215-223.
- Anderson RA, Amant F, Braat D, D’Angelo A (2020) Chuva de Sousa Lopes SM, Demeestere I, Dwek S, Frith L, Lambertini M, Maslin C et al: ESHRE guideline: female fertility preservation. Hum Reprod Open.
- Oktay K, Harvey BE, Partridge AH, Quinn GP, Reinecke J, et al. (2018) Fertility Preservation in Patients With Cancer: ASCO Clinical Practice Guideline Update. J Clin Oncol. 36: 1994-2001.
- Ehrbar V, Urech C, Rochlitz C, Zanetti Dällenbach R, Moffat R, et al. (2019) Randomized controlled trial on the effect of an online decision aid for young female cancer patients regarding fertility preservation. Human reproduction (Oxford, England). 34: 1726-1734.
- Harada M, Osuga Y (2019) Fertility preservation for female cancer patients. Int J Clin Oncol. 24: 28-33.
- Deshpande NA, Braun IM, Meyer FL (2015) Impact of fertility preservation counseling and treatment on psychological outcomes among women with cancer: A systematic review. Cancer 121: 3938-3947.
- Benedict C, Thom B, D NF, Diotallevi D, E MP, et al. (2016) Young adult female cancer survivors’ unmet information needs and reproductive concerns contribute to decisional conflict regarding posttreatment fertility preservation. Cancer. 122: 2101-2109.
- Yee S (2016) Factors associated with the receipt of fertility preservation services along the decision-making pathway in young Canadian female cancer patients. J Assist Reprod Genet 33: 265-280.
- Urech C, Ehrbar V, Boivin J, Müller M, Alder J, et al. (2018) Knowledge about and attitude towards fertility preservation in young female cancer patients: a cross-sectional online survey. Hum Fertil (Camb). 21: 45-51.
- Mahey R, Kandpal S, Gupta M, Vanamail P, Bhatla N, et al. (2020) Knowledge and awareness about fertility preservation among female patients with cancer: a cross-sectional study. Obstet Gynecol Sci. 63: 480-489.
- Phelippeau J, Cazalis CG, Koskas M (2019) Ovarian protection and fertility preservation in women with cancer: A French national registry analysis between and 2014. J Gynecol Obstet Hum Reprod. 48: 705-710.
- Villarreal-Garza C, Martinez-Cannon BA, Barragan-Carrillo R, Bargallo-Rocha JE, Platas A, et al. (2021) Physicians’ Attitudes, Knowledge, and Perceived Barriers toward Fertility Preservation in Young Breast Cancer Patients in a Developing Country. Rev Invest Clin 73: 347-353.
- Findeklee S, Radosa JC, Takacs Z, Hamza A, Sima R, et al. (2019) Fertility preservation in female cancer patients: current knowledge and future perspectives. Minerva Ginecol. 71: 298-305.
- Flink DM, Sheeder J, Kondapalli LA (2017) A Review of the Oncology Patient’s Challenges for Utilizing Fertility Preservation Services. J Adolesc Young Adult Oncol. 6: 31-44.
- Goossens J, Delbaere I, Beeckman D, Verhaeghe S, Van Hecke A (2015) Communication difficulties and the experience of loneliness in patients with cancer dealing with fertility issues: a qualitative study. Oncol Nurs Forum. 42: 34-43.
- Jones G, Hughes J, Mahmoodi N, Smith E, Skull J, et al. (2017) What factors hinder the decision-making process for women with cancer and contemplating fertility preservation treatment?. Hum Reprod Update, 23: 433-457.
- Levine JM, Kelvin JF, Quinn GP, Gracia CR (2015) Infertility in reproductive-age female cancer survivors. Cancer. 121: 1532-1539.
- Zaami S, Stark M, Signore F, Gullo G, Marinelli E (2022) Fertility preservation in female cancer sufferers: (only) a moral obligation?. Eur J Contracept Reprod Health Care. 27: 335-340.
- Bastings L, Baysal Ö, Beerendonk CCM, IntHout J, Traas MAF, et al. (2014) Deciding about fertility preservation after specialist counselling. Human reproduction (Oxford, England). 29: 1721-1729.
- Mersereau JE, Goodman LR, Deal AM, Gorman JR, Whitcomb BW,et al. (2013) To preserve or not to preserve: how difficult is the decision about fertility preservation? Cancer. 119: 4044-4050.
- King L, Quinn GP, Vadaparampil ST, Gwede CK, Miree CA, et al. (2008) Oncology nurses’ perceptions of barriers to discussion of fertility preservation with patients with cancer. Clin J Oncol Nurs 12: 467-476.
- Quinn GP, Vadaparampil ST, Gwede CK, Miree C, King LM, et al. (2007) Discussion of fertility preservation with newly diagnosed patients: oncologists’ views. J Cancer Surviv. 1: 146-155.
- Anazodo A, Laws P, Logan S, Saunders C, Travaglia J, et al (2019,) How can we improve oncofertility care for patients? A systematic scoping review of current international practice and models of care. Hum Reprod Update 25: 159-179.
- Peate M, Meiser B, Cheah BC, Saunders C, Butow P, et al. (2012) Making hard choices easier: a prospective, multicentre study to assess the efficacy of a fertility-related decision aid in young women with early-stage breast cancer. British journal of cancer. 106: 1053-1061.
- Wang Y, Anazodo A, Logan S (2019) Systematic review of fertility preservation patient decision aids for cancer patients. Psycho-oncology. 28: 459-467.
- Giles K (2015) Decision aids for people facing health treatment or screening decisions. Int J Evid Based Healthc. 13: 112-113.
- Stacey D, Légaré F, Lewis K, Barry MJ, Bennett CL, et al. (2017) Decision aids for people facing health treatment or screening decisions. Cochrane Database Syst Rev. 4.
- Page MJ, McKenzie JE, Bossuyt PM, Boutron I, Hoffmann TC, et al. (2021) The PRISMA 2020 statement: an updated guideline for reporting systematic reviews. BMJ.
- Proctor E, Silmere H, Raghavan R, Hovmand P, Aarons G, et al. (2011) Outcomes for implementation research: conceptual distinctions, measurement challenges, and research agenda. Adm Policy Ment Health. 38: 65-76.
- Jones GL, Moss RH, Darby F, Mahmoodi N, Phillips B, et al. (2022) Cancer, Fertility and Me: Developing and Testing a Novel Fertility Preservation Patient Decision Aid to Support Women at Risk of Losing Their Fertility Because of Cancer Treatment. Frontiers in oncology. 12.
- Huang S-M, Tseng L-M, Yang M-J, Chang A, Lien P-J, et al. (2022) Developing a web-based oncofertility tool for reproductive-age women with breast cancer based on social support framework. Supportive care in cancer: official journal of the Multinational Association of Supportive Care in Cancer. 30: 6195-6204.
- Huang S-M, Tseng L-M, Lien P-J (2022) Effects of naturalistic decision-making model-based oncofertility care education for nurses and patients with breast cancer: a cluster randomized controlled trial. Supportive care in cancer: official journal of the Multinational Association of Supportive Care in Cancer. 30: 8313-8322.
- Ussher JM, Perz J, Hawkey AJ (2021) A randomized controlled evaluation of an educational resource to address fertility concerns after cancer. Psycho‐Oncology, 30: 1442-1448.
- Ehrbar V, Germeyer A, Nawroth F, Dangel A, Findeklee S, et al. (2021) Long-term effectiveness of an online decision aid for female cancer patients regarding fertility preservation: Knowledge, attitude, and decisional regret. Acta obstetricia et gynecologica Scandinavica. 100: 1132-1139.
- Ehrbar V, Urech C, Rochlitz C, Dällenbach RZ, Moffat R, et al. (2018) Fertility Preservation in Young Female Cancer Patients: Development and Pilot Testing of an Online Decision Aid. Journal of adolescent and young adult oncology. 7: 30-36.
- Borgmann-Staudt A, Kunstreich M, Schilling R, Balcerek M, Dirksen U, et al. (2019) Fertility knowledge and associated empowerment following an educational intervention for adolescent cancer patients. PSYCHO-ONCOLOGY. 28: 2218-2225.
- Garvelink MM, Ter Kuile MM, Louwé LA, Hilders CGJM, Stiggelbout AM (2017) Feasibility and effects of a decision aid about fertility preservation. Human fertility (Cambridge, England). 20: 104-112.
- Garvelink MM, ter Kuile MM, Stiggelbout AM, de Vries M (2014) Values clarification in a decision aid about fertility preservation: does it add to information provision?. BMC MEDICAL INFORMATICS AND DECISION MAKING. 14.