Abstract
The REE-rich fluorites in quartz of the topaz-albite granite from Zinnwald/Erzgebirge are often related to nanodiamonds and graphite. Together, the solvus curves (water content of melt inclusions in granite quartz versus temperature) and the Lorentzian element distribution (F, Rb, Cs) prove the input of supercritical fluids and their influences on the element redistribution in the granite. Together with the impact of supercritical fluids, the crystallization history of the topaz-albite granite from Zinnwald is very complex.
Keywords
Topas-albite-granite, REE-rich fluorites, Fluocerite and tveitite trends, Nanodiamonds, Graphite, Raman spectroscopy
Introduction
During the study of melt and fluid inclusions in quartz and topaz from the Zinnwald granite [1] we often found in granite quartz spherical crystals of REE-rich fluorites beside other, for “normal” granites untypical mineral phases: magmatic fluorite, cryolite, elpasolite, and rubidian leucite with the empiric formula (K0.64Rb0.22,Na0.13Cs0.01)(Al0.96Fe0.03)Si2O6, and boromuscovite. According to melt inclusion results, the fluorine concentration in the melt of the evolved granite phases increases to 5.64 ± 0.19%(g/g). It was also essential that for this granite, we could construct from the analytically determined water concentration of different melt inclusion a pseudobinary XH2O vs. T plot of re-homogenized type-A and type B-melt inclusion with a solvus crest at 720°C and 28.6%(g/g) H2O (Figure 10 in there). That was a natural granite system’s first pseudobinary solvus curve [1]. In the meantime, we have seen that such pseudobinary solvus curves are mostly connected with the extreme enrichment of some elements. For the case of Zinnwald, we found Lorentzian curves for F, Rb, and Cs [2]. Such curves are strong proof of the participation of supercritical fluids. However, around 2005, nobody had any idea about the role of supercritical fluids in granite formation and mineralization. Using the small example of REE-rich fluorite globules in quartz, we will show that supercritical fluids play an essential part in granite formation and re-crystallization.
Methods
Primary for the first identification of the REE-rich fluorites, we used a Dilor XY Laser Raman Triple 800 mm spectrometer equipped with an Olympus optical microscope. The spectra were collected with a Peltier-cooled CCD detector using a laser wavelength of 488 nm. For recent studies, we used for all microscopic and Raman spectrometric studies a petrographic polarization microscope with a rotating stage coupled with the RamMics R532 Raman spectrometer working in the spectral range of 0-4000 cm-1 using a 50 mW single mode 532nm laser. Details are in Thomas et al., 2022a and 2022b [2]. For the Raman spectroscopic routine measurements, we used the Olympus long-distance LMPLN100x as a 100x objective. We carefully cleaned the samples to prevent diamond contamination due to the preparation. For the Raman determination, we used only 30 or more µm deep crystals from the sample surface [3]. One nanodiamond sample (Figure 5) is on the surface. However, the Raman lines are characteristic of nanodiamonds, not contaminated diamonds [3]. To determine the composition of the minerals in question, we used the microprobes CAMECA SX 50 and SX100. Details are in Franz et al. (1996) [4-7]
Sample
The samples (TH212) are on both sides, about 500 µm thick polished granite sections (Figure 1). The used sample is a topaz-albite granite collected as a boulder about 1.3 km from Fuchshübel, about 1.3 km northeast of Zinnwald in the East-Erzgebirge. A concise description was given by Thomas et al. (2005) [1]. The quartz contains tiny, mostly spherical colorless crystals of REE-rich fluorite. Other typical and untypical minerals are graphite-whiskers, F-rich needle-like topaz crystals, and orthorhombic cassiterite with graphite and nanodiamond inclusions. Thomas (2023) [8], as well as fluorite, cryolite, elpasolite, rubidian leucite, and boromuscovite (all in quartz). For comparison, we used an emerald-green REE-bearing fluorite from the Sachsenhöhe near Zinnwald [9]. Note that the very smooth surface of the small diamond spheres at the sample surface causes these grains to fall out easily during preparation (polishing).
Another relatively REE-rich fluorite (No. Z 9054) was an emerald-green piece as big as your fist from the Sachsenhöhe near Zinnwald [9]. This sample served to calibrate the ICP-AES and microprobe SX50 instruments of the GFZ in the nineties. The sample contains 0.27% Y and 0.30% REE. Another REE-rich fluorite is from Ehrenfriedersdorf sample Sn70 with a maximum of 0.90% Y and 1.08% REE.
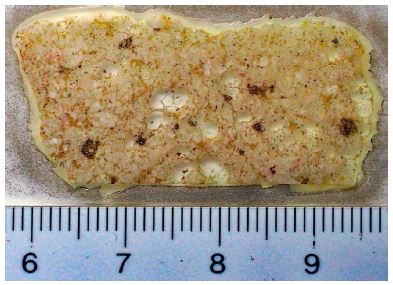
Figure 1: Thick section ZW-TH212-I (500 µm thick and on both sides polished). Scale is in centimeters. The colorless parts are quartz with REE-rich fluorite globules.
Results
The REE-rich fluorite globules in the Zinnwald granite quartz have diameters of around 20 µm (up to 70 mm) and are only present in the larger quartz crystals of the granite (Figure 1). Figure 2 shows the form of the typical REE-rich fluorites and Figure 3 a typical Raman spectrum.
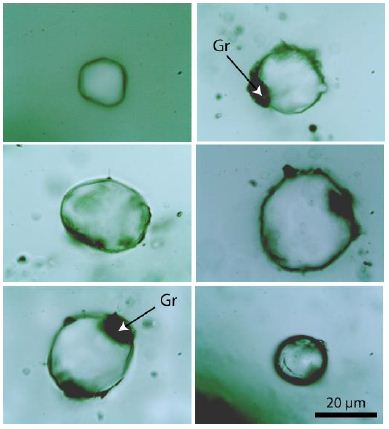
Figure 2: Typical REE-rich spherical fluorite crystals in Zinnwald quartz. The scale (below right) is valid for all examples in the Figure. Gr: Graphite and nanodiamonds in graphite.
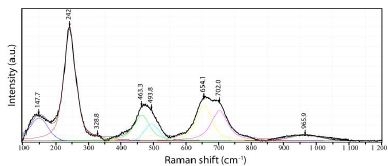
Figure 3: Typical Raman spectrum of REE-rich fluorite in granite quartz from Zinnwald. Note that the characteristic strong Raman band at 321 cm-1 for REE-free fluorite is missing or has been shifted to 242 cm-1.
The interpretation of REE-rich fluorite Raman spectra is difficult. There are too many variables (Y vs. sum of REE. Only two passable correlations exist between the sum of REE (in at%) and the Raman band position at about 650 cm-1 and the fluorine content, respectively. The position of the second broad Raman band (between 400 and 550 cm-1) correlated roughly with the Y concentration. More work is, however, necessary, primarily because this Raman band is a double band. Often, these fluorite globules contain remnants of nanodiamond-bearing graphite inside, or the graphite forms small rims around the crystals. Besides the spherical REE-rich fluorites, there are also graphite globules (Figure 4a) up to 40 µm in diameter. Smaller graphite spheres with remnants of diamonds are rarer (Figure 4b) to see. The spherical form of the REE-rich fluorites in quartz, nanodiamond, and graphite indicate clearly that these crystals are unambiguous foreign crystals in the granite quartz.
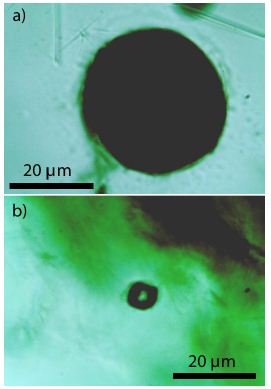
Figure 4: Spherical graphite crystal a) with nanodiamonds in Zinnwald quartz. b) graphitized diamond in the same quartz (about 30 µm deep). The Raman band of the diamond is 1320.2 cm-1 with a FWHM of 56.7 cm-1. FWHM: Full Width at Half Maximum.
Besides the REE-rich fluorite globules, fluorite with larger graphite aggregates is also present (Figure 5). Also, this graphite aggregate contains nanodiamonds. The presence of fluorite-cryolite-topaz aggregates (see Thomas et al., 2005 [1]; Figure 1c in it) in the quartz of this peraluminous granite rock clearly shows a second peralkaline history. Additionally, the nanodiamonds, combined with the solvus and some Lorentzian-distributed elements [10], prove the input of supercritical fluids from the deeper mantle region. In this short contribution, we will only concentrate on the REE-rich fluorites. Table 1 shows the results of the microprobe analyses on the REE-rich fluorites. The abbreviation of the REEs in Table 1 is Ln (the sum of the REE). It is a selection of data obtained in more than 15 years. They show, however, the characteristic properties of these fluorites. Primarily, the author thinks the REE-rich fluorites are a tveitite-like mineral. However, tveitite-(Y) [symplified as Ca14Y5F43] is hexagonal. The lattice parameters using the TEM technique (unpublished data by R. Wirth, GFZ Potsdam and Wirth, 2004) [11] determined for a, b, and c identical values of 5.46 Å, also a cubic mineral. The density is 4.0 g/cm3. Also, birefringence is missing. In contrast to simple fluorites, the REE-rich ones show in no case the typical 321 cm-1 Raman line for pure fluorites. Figure 6 shows a REE-rich fluorite crystal like a twinning. On the right side, there are tiny, very REE-rich microcrystals (no monazite or xenotime!). The Raman spectrum is similar; however, there are also more significant Raman band differences.
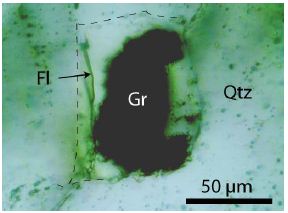
Figure 5: Fluorite (Fl) with graphite in Zinnwald granite quartz. The Raman band for fluorite is at 321.7 cm-1, for diamond at 1327.2 cm-1, and for graphite at 1345.3 cm-1 (D1), 1576.2 cm-1 (G), and 1602.4 cm-1 (D2) with the FWHM values of 9.7, 44.9, 71.2, 73.7, 38.8, respectively.
Table 1: Chemical composition (in % (g/g) of REE-rich fluorites from Zinnwald (reduced number)
|
Component |
ZW-1 | ZW-2 | ZW-3 | ZW-4 | ZW-5 | ZW-6 | ZW-7 | ZW-8 | ZW-9 | ZW-10 |
ZW-11 |
| Na |
0.24 |
0.23 | 0.23 | 0.23 | 0.31 | 0.24 | 0.12 | 0.00 | 0.00 | 0.16 | 0.14 |
|
Ca |
36.99 | 36.75 | 36.77 | 36.97 | 35.45 | 36.86 | 32.75 | 45.97 | 39.21 | 26.97 |
22.26 |
| Y |
4.43 |
4.47 | 4.44 | 4.48 | 4.84 | 4.57 | 2.43 | 5.28 | 0.86 | 3.09 | 2.81 |
| La |
1.59 |
1.65 | 1.65 | 1.65 | 1.78 | 1.67 | 5.10 | 1.79 | 5.12 | 5.99 |
5.89 |
| Ce |
4.67 |
4.76 | 4.63 | 4.64 | 5.13 | 4.60 | 13.83 | 5.06 | 13.45 | 16.20 | 15.97 |
|
Pr |
0.62 | 0.66 | 0.60 | 0.55 | 0.87 | 0.58 | 1.50 | 0.65 | 1.65 | 1.76 |
1.74 |
| Nd |
1.75 |
2.03 | 2.08 | 2.19 | 2.56 | 2.10 | 4.92 | 2.26 | 4.35 | 5.74 | 5.69 |
|
Sm |
0.57 | 0.58 | 0.60 | 0.56 | 0.61 | 0.55 | 1.05 | 0.61 | 1.45 | 1.22 |
1.22 |
| Eu |
0.00 |
0.00 | 0.00 | 0.00 | 0.00 | 0.00 | 0.00 | 0.01 | 0.00 | 0.00 |
0.00 |
| Gd |
0.91 |
0.94 | 0.97 | 0.91 | 0.92 | 0.90 | 0.77 | 0.99 | 0.53 | 0.89 | 0.89 |
|
Tb |
0.14 |
0.12 | 0.13 | 0.16 | 0.00 | 0.10 | 0.17 | 0.14 | 0.02 | 0.20 | 0.00 |
|
Dy |
0.84 |
0.88 | 0.92 | 0.91 | 1.03 | 0.91 | 0.60 | 0.95 | 0.34 | 0.68 | 0.69 |
| Ho |
0.24 |
0.15 | 0.22 | 0.19 | 0.00 | 0.19 | 0.05 | 0.21 | 0.05 | 0.05 | 0.05 |
|
Er |
0.66 |
0.84 | 0.75 | 0.84 | 0.00 | 0.71 | 0.25 | 0.81 | 0.16 | 0.28 | 0.29 |
|
Tm |
0.00 |
0.00 | 0.00 | 0.00 | 0.00 | 0.00 | 0.00 | 0.13 | 0.00 | 0.00 | 0.00 |
|
Yb |
0.94 |
0.93 | 0.95 | 0.93 | 0.00 | 0.96 | 0.47 | 1.00 | 0.07 | 0.54 | 0.55 |
|
Lu |
0.13 |
0.15 | 0.16 | 0.15 | 0.00 | 0.14 | 0.10 | 0.16 | 0.02 | 0.12 | 0.12 |
|
F |
45.66 |
44.28 | 44.90 | 44.66 | 46.49 | 44.93 | 36.12 | 33.99 | 32.72 | 36.12 | 41.72 |
|
Total |
100.4 |
99.42 | 100.0 | 100.0 | 99.99 | 100.0 | 100.2 | 100.0 | 100.0 | 100.01 |
100.0 |
| Formula coefficients calculated based on one cation | |||||||||||
| Na |
0.010 |
0.010 | 0.010 | 0.010 | 0.140 | 0.010 | 0.005 | 0.000 | 0.000 | 0.010 | 0.006 |
|
Ca |
0.919 |
0.917 | 0.917 | 0.922 | 0.885 | 0.920 | 0.814 | 1.147 | 0.978 | 0.67 | 0.56 |
|
Y |
0.050 |
0.500 | 0.050 | 0.050 | 0.054 | 0.051 | 0.027 | 0.059 | 0.010 | 0.03 | 0.032 |
| La |
0.011 |
0.012 | 0.012 | 0.012 | 0.013 | 0.012 | 0.037 | 0.013 | 0.037 | 0.04 | 0.042 |
| Ce |
0.033 |
0.034 | 0.033 | 0.033 | 0.037 | 0.033 | 0.098 | 0.036 | 0.096 | 0.12 | 0.114 |
|
Pr |
0.004 |
0.005 | 0.004 | 0.004 | 0.006 | 0.004 | 0.011 | 0.005 | 0.012 | 0.01 | 0.012 |
|
Nd |
0.012 |
0.014 | 0.014 | 0.015 | 0.018 | 0.015 | 0.034 | 0,016 | 0.030 | 0.04 | 0.039 |
|
Sm |
0.004 |
0.004 | 0.004 | 0.004 | 0.004 | 0.004 | 0.007 | 0.004 | 0.010 | 0.01 | 0.008 |
|
Eu |
0.000 |
0.000 | 0.000 | 0.000 | 0.000 | 0.000 | 0.000 | 0.000 | 0.000 | 0.00 | 0.000 |
|
Gd |
0.006 |
0.006 | 0.006 | 0.006 | 0.006 | 0.006 | 0.005 | 0.006 | 0.003 | 0.01 | 0.006 |
|
Tb |
0.001 |
0.001 | 0.001 | 0.001 | 0.000 | 0.001 | 0.001 | 0.001 | 0.000 | 0.00 | 0.000 |
| Dy |
0.005 |
0.005 | 0.006 | 0.006 | 0.006 | 0.006 | 0.004 | 0.006 | 0.002 | 0.00 | 0.004 |
|
Ho |
0.001 |
0.001 | 0.001 | 0.001 | 0.000 | 0.001 | 0.000 | 0.001 | 0.000 | 0.00 | 0.000 |
|
Er |
0.004 |
0.005 | 0.004 | 0.005 | 0.000 | 0.004 | 0.001 | 0.005 | 0.001 | 0.00 | 0.002 |
|
Tm |
0.000 |
0.000 | 0.000 | 0.000 | 0.000 | 0.000 | 0.000 | 0.001 | 0.000 | 0.00 | 0.000 |
| Yb |
0.005 |
0.005 | 0.005 | 0.005 | 0.000 | 0.006 | 0.003 | 0.006 | 0.000 | 0.00 | 0.003 |
|
Lu |
0.001 |
0.001 | 0.001 | 0.001 | 0.000 | 0.001 | 0.001 | 0.001 | 0.000 | 0.00 | 0.001 |
|
F |
2.394 |
2.331 | 2.363 | 2.351 | 2.447 | 2.365 | 1.894 | 1.789 | 1.722 | 1.90 | 2.196 |
|
SLn |
0.087 |
0.093 | 0.09 | 0.090 | 0.090 | 0.090 | 0.202 | 0.191 | 0.191 | 0.23 | 0.23 |
|
S(Y+Ln) |
0.137 |
0.098 | 0.14 | 0.140 | 0.144 | 0.140 | 0.229 | 0.201 | 0.201 | 0.26 |
0.26 |
Ln: Measured Lanthanides
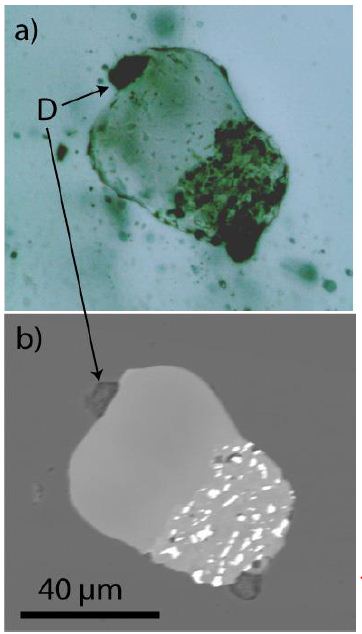
Figure 6: REE-rich fluorite – a) optical microphotography and b) electron microprobe BSE image. D – diamond and graphite. The left lower part in b) shows the immiscibility of heavy-REE-rich fluorites. In Figure 6a, black points in the right part of the crystal are not graphite, which is seen in the BSE image (Figure 6b).
The nanodiamond (D) at the left upper corner has the main band at 1332.8 cm-1 with a FWHM = 47.9 cm-1, and the graphite bands are positioned at 1363.1, 1571.4 1602.3 cm-1 with the FWHM of 40.5, 44.0, and 40.2 cm-1 respectively.
Figure 7 shows Y + Ln versus Ln (values in at%) with the zero point for pure water-clear synthetic fluorite (not shown in the table). The circles are the data from Table 1 plus unpublished data [1], and the triangles represent the data for REE-rich fluorites and tveitite-(Y) from Pekov et al., 2009 [12]. There are two trends: the dashed blue line [12] corresponds to the tveitite-(Y) trend, and the dashed black line corresponds to the fluocerite trend for the REE-rich Zinnwald fluorites.
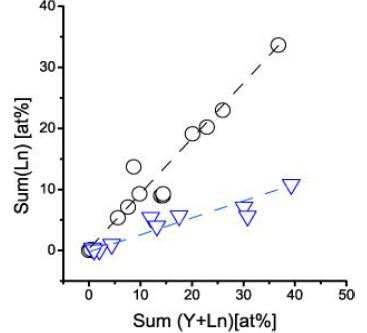
Figure 7: (Y + Ln) versus Ln (all in at%) of REE-rich fluorites. Ln = sum of the REE, (Y + Ln) = sum of Y + REE’s. The black circles (Zinnwald) and the dashed black line correspond to the fluocerite trend (this work), and the blue triangles and dashed blue line equal the tveitite trend, according to Pekov et al. (2009) [12].
The simultaneous crystallization of xenotime-(Y) and monazite-(Y) together with the REE-rich fluorite prevents the crystallization of the fluocerite [12] standing at the end of the trend (fluocerite trend of Figure 7). That is also true for other REE-rich fluorite in the region and around Ehrenfriedersdorf. The emerald-green fluorite (Z 9054) from the Sachsenhöhe near Zinnwald contains 0.29% (g/g) Y and 0.31% (g/g) REE, and the fluorite from Ehrenfriedersdorf (sample Sn70) has 0.60% (g/g) Y and 1.22% (g/g) REE’s. Compared with this, the REE-rich Zinnwald fluorite contains up to 5.3% (g/g) Y and 33.1% (g/g) REE’s. The high REE content of the fluorite here is the result of the supercritical fluids in the Zinnwald region being deleted in phosphorus [12]. Figure 8 shows the chondrite standardized REE distribution of the two different fluorites from Zinnwald (ZW) and the Sachsenhöhe near Zinnwald [13].
By the simultaneous crystallization of more significant amounts of monazite-(Y) and xenotime-(Y) in the case of the fluorite from the Sachsenhöhe, is the concentration of all REE significantly lower than in the REE-rich fluorites from Zinnwald.
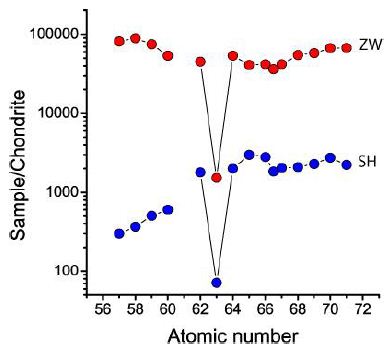
Figure 8: Chontrite standardized REE concentration in fluorites from Zinnwald (ZW) and the Sachsenhöhe (SH). The REE concentration in fluorite is in ppm. Y is at the position between dysprosium and holmium inserted there as the result of the stereochemistry behavior of yttrium [14].
Discussion
The topaz-zinnwaldite-albite granite from Zinnwald has obviously a very complex history [1]. Besides melt inclusions representing the crystallization of the topaz-zinnwaldite-albite granite, extreme water-rich melt inclusions are present (Table 3 in Thomas et al., 2005) [1], showing a more pegmatite-like state. At this time, the author also found REE-rich fluorite globules in quartz, for which no explanation could given. Later, we also found Lorentzian distributed elements (F, Rb, Cs) [10]. Now, during this study, the proven mantel indications (nanodiamond and graphite globules) tell us a further story – input of supercritical fluids coming from mantle deeps. These supercritical fluids are obviously very fluorine-rich, forming the REE-rich fluorite, and for a peraluminous granite, untypical minerals like cryolite, elpasolite, and rubidian leucite. The REE distribution patterns (Figure 8, ZW) differ clearly from the typical REE distribution patterns of hydrothermal and remobilized fluorites [14-16]. In a more hydrothermal later state, the minerals cryolite, cryolithionite, elpasolite, and native sulfur are daughter minerals in fluid inclusions in hydrothermal quartz crystals. Up to now, we could prove that supercritical fluids are active in the whole Erzgebirge, Slavkovsky les, the Saxon Granulite, Lusatian Granodiorites and quartz veins, Königshain Granite Massifs.
Acknowledgment
Thanks to Dr. V. Grunewald (ZGI Berlin) for the fluorite sample Z 9054. For microprobe analyses, we thank D. Rhede, H.-J. Förster, and Ona Appelt (all GFZ) for their help in the very past.
References
- Thomas R, Förster HJ, Rickers K, Webster JD (2005) Formation of extremely F-rich hydrous melt fractions and hydrothermal fluids during differentiation of highly evolved tin-granite magmas: a melt/fluid-inclusion study. Contrib Mineral Petrol 148: 582-601.
- Thomas R, Davidson P, Rericha A, Voznyak DK (2022) Water-rich melt inclusions as “frozen” samples of the supercritical state in granites and pegmatites reveal extreme element enrichment resulting under non-equilibrium conditions. Min J(Ukraine) 44: 3-15.
- Thomas R, Davidson P, Rericha A, Recknagel U (2023) Ultrahigh-pressure mineral inclusions in a crustal granite: Evidence for a novel transcrustal transport mechanism. Geosciences 94: 1-13.
- Franz G, Andrehs G, Rhede D (1996) Crystal chemistry of monazite and xenotime from Saxothuringian-Moldanubian metapelites, NE Bavaria, Germany. Eur J mineral 8: 1097-1118.
- Seifert W, Thomas R, Rhede D, Förster HJ (2010) Origin of coexisting wüstite, Mg-Fe and REE phosphate minerals in graphite-bearing fluorapatite from the Rumburk granite. Eur J Mineral 22: 495-507.
- Breiter K, Förster HJ (2021) Compositional variability of monazite.cheralite-huttonite solid solution, Xenotime, and Uraninite in geochemically distinct granites with special emphasis to the strongly fractionated peraluminous Li-F-P-rich Podlesi granite system (Erzgebirge/Krušné Hory Mts., Central Europe. Minerals 127: 1-21.
- Thomas R, Davidson P, Rhede D, Leh M (2009) The miarolitic pegmatites from the Königshain: a contribution to understanding the genesis of pegmatites. Contribution to Mineralogy and Petrology 139: 394-401.
- Thomas R (2023) Unusual cassiterite mineralization, related to the Variscan tin-mineralization of the Ehrenfriedersdorf deposit, Germany. Aspects in Mining & Mineral Science 11: 1233-1236.
- Thomas R (1978) Thermobarometrische und kryometrische Untersuchungen an Fluorit- und Quarzproben aus einem Brekzienkörper der Sachsenhöhe bei Bärenstein/Osterzgebirge. Unpublished report for the ZGI Berlin, HV 623/75,1-14.
- Thomas R, Davidson P, Appel K (2019) The enhanced element enrichment in the supercritical states of granite-pegmatite systems. Acta Geochim 38: 335-349.
- Wirth R (2004) Focused ion beam (FIB): a novel technology for advance applications ofmicro- and nanoanalysis in geosciences and applied mineralogy. Eur J Mineral 16: 863-876.
- Pekov IV, Chukanov NV, Kononkova NN, Yakubovich OV, Massa W, et al. (2009) Tveitite-(Y) and REE-enriched fluorite from amazonite pegmatites of the western Keivy, Kola Peninsula, Russia: Genetic crystal chemistry of natural Ca, REE-fluorides. Geology of Ore Deposits 51: 595-607.
- Thomas R (1994) Fluid evolution in relation to the emplacement of the Variscan granites in the Erzgebirge region: A review of the melt and fluid inclusion evidence. Metallogeny of collisional Orogens. International Association of the Genesis of Ore Deposits (IAGOD), eds: By Seltmann, R., Kämpf, H., Möller, P., 70-81
- Bommer H (1941) Über die Einordnung des Yttriums in die Reihe der Lanthaniden. Zeitschrift für anorganische und allgemeine Chemie 248: 397-401.
- Möller P (1989) REE(Y), Nb, and Ta enrichment in pegmatites and carbonatite-alkalic rock complexes. In: Lanthanides, Tantalum and Niobium. Eds: by P. Möller, P. Černy, and Saupé, 380: 103-144
- Thomas R, Davidson P (2016) Origin of miarolitic pegmatites in the Königshain granite/Lusatia. Lithos 260: 225-241 and ESM.