DOI: 10.31038/AWHC.2024744
Abstract
Ischemic stroke (IS) is a global functional disorder, its root causes and mechanisms are still unknown. Recent research focuses on the link between gut microbes and IS. Our biometric analysis of 1015 articles (2000-2023) shows key research trends, hotspots like fecal macrobiotic transplantation, and highlights research gaps, providing insights for future IS studies.
Keywords
Ischemic stroke, Intestinal flora, Cite space, Bibliometric analysis
Ischemic stroke (Ischemic Stroke, IS) is a disorder in blood circulation in the brain, causing ischemic necrosis or softening of localized brain tissue caused by ischemia and hypoxia, which leads to the functional defect of the nervous system. Stroke is the second leading cause of death in the world. It has the characteristics of high incidence, high disability rate, high mortality and high recurrence rate. Although a lot of research has been done, the cause of IS is still unclear. Studies have shown that intestinal flora plays an important role in the occurrence and development of IS. The structure of human intestinal flora is complex and plays an important role in central nervous system, endocrine system, immune system and other systems. The ‘flora-gut-brain axis’, as an information exchange network connecting the central and intestinal flora, plays a key role in the occurrence and development of IS. Imbalance of intestinal flora or abnormal metabolism can lead to neuroinflammatory and degenerative lesions, which is an important link in the occurrence and development of IS. So the study of the relationship between intestinal flora and the occurrence and development of IS may provide new ideas for the prevention and treatment of IS. Recently, the relationship between IS and gut microbiota has attracted more and more attention. Scholars have carried out a lot of research on it, but there is no comprehensive and systematic research on it. Therefore, it is necessary to conduct a comprehensive and in-depth study of the research status through visualization methods, and to explore its future development trends and hotspots in depth [1-4].
Bibliometrics takes the worldwide literature pattern and characteristics of literature as the main research objects, and uses the mathematical and statistical methods to analyze the distribution mode, quantitative relationship and variation law of literature information, so as to explore the structure, characteristics and rules of a specific field. Bibliometrics can not only make quantitative statistical analysis of papers in a specific field, but also accurately reflect the most representative papers. Furthermore, the results of bibliometric analysis can show a large amount of data in the form of knowledge maps, so that researchers can conduct a comprehensive analysis of the development of a discipline and can intuitively understand it. Therefore, this topic intends to use the method of bibliometrics to statistically analyze the literature related to IS and intestinal flora from the whole world, and use Citespace6.1.R6 software to visualize the statistical results, so as to summarize the current research progress and hot spots related to IS and intestinal flora, so as to help researchers better understand the research status and hot spots in this field, and put forward corresponding research strategies, so as to further develop IS and intestinal flora. The mechanism of action and the development of corresponding targeted drugs lay the foundation [5,6].
Methods and Materials Data Source and Search Strategy
A bibliometric literature search was conducted on the core collection database of Web of Science (WoS) from January 1, 2000 to July 31, 2023. The retrieval formula is set as follows: TS=(gastrointestinal microbiomes OR microbiome, gastrointestinal OR gut microbiome OR gut microbiomes OR microbiome, gut OR gut microbiota OR gut microbiotas OR microbiota, gut OR gastrointestinal flora OR flora, gastrointestinal OR gut flora OR flora, gut OR gastrointestinal microbiota OR gastrointestinal microbiotas OR microbiota, gastrointestinal OR gastrointestinal microbial community OR gastrointestinal microbial communities OR microbial community, gastrointestinal OR gastrointestinal microflora OR microflora, gastrointestinal OR gastric microbiome OR microbiome, gastric OR gastric microbiomes OR intestinal microbiome OR intestinal microbiomes OR microbiome, intestinal OR intestinal microbiota OR intestinal microbiotas OR intestinal microflora OR microflora, intestinal OR intestinal flora OR flora, intestinal OR enteric bacteria OR bacteria, enteric) AND TS= (cerebral arterial thrombosis OR cerebral infarction OR cerebral ischemia OR Ischemic cerebral infarction OR Ischemic stroke).
Inclusion and Exclusion Criteria
After screening the titles and abstracts, the studies related to IS and intestinal flora were selected. Only articles and comments are included. Other file types, such as letters, comments and meeting summaries are excluded. In addition, the publishing language is limited to English. Finally, 1015 records are determined for final analysis [7].
Analysis Method
CiteSpace is a visualization software for bibliometric analysis developed by Professor Chen Chaomei (University of Drakesell, USA). We used CiteSpace 6.1.R3 to analyze the final record. The main parameter settings are as follows: time slice (2000-2023), number of years per slice (1 year), selection criteria (g-index, k=25) and pruning (pathfinder and pruning the merged network). Other parameters are set according to the CiteSpace manual for different situations. The VOSviewer software is a useful tool for constructing and visualizing a bibliometric network. It was developed by the Science Center in 2007 at the University of Leiden (Netherlands) for technical research. Free to download (https://www.vosviewer.com/)). In the VOS viewer software, each node represents different parameters, such as countries/ regions, journals, institutions, keywords, etc. The size of the node is determined by the weight of the parameter, such as the number of publications, the number of references or the frequency of occurrence. The higher the weight, the larger the node [8]. Nodes and lines are colored by the cluster they belong to. Lines between nodes represent links. Link strength is evaluated by the total link strength index (TLS), which is the sum of all link strength and can be extended to reflect the link strength between institutions [9]. Additional information such as Journal Impact Factor (IF) and Journal Citation Report (JCR) was obtained directly from the Web of Science website on July 31, 2023. Analyze annual publications with Microsoft Office Excel 2019.
Interpretation of Main Parameters of Visual Map
Clustering view and burst detection: Clustering view is performed on the generated graph, and each cluster is annotated by referring to the title, keyword, and subject word in the reference summary. The role of burst detection is to detect a large change in the number of citations in a certain period of time. Therefore, it can be used to find the drop or rise of keywords [10].
Double graph overlap: Double graph overlap is a new method to display the distribution and citation trajectory of articles in various disciplines. As a result, there are original journal on the left side and cited journals on the right side. The curve is the citation line, which completely shows the context of the citation [11].
Result
Publications and Citation Analysis
It can be seen from Figure 1 that the annual number of publications and citations in the WoSCC database showed an overall upward trend from 2000 to 2023. Before 2015, the research on IS and intestinal flora was relatively slow, with no more than 80 annual publications. After 2015, the annual number of publications and citations increased gradually, and the number of publications increased step by step.
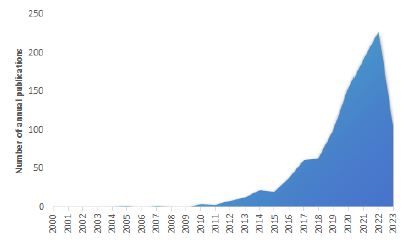
Figure 1: Number of papers published from 2000 to 2023
Country/Region Analysis
The top 10 countries/regions in the WoSCC database on IS and intestinal flora are shown in Table 1. The top three countries in this field were the United States, China and Canada, accounting for about 47.63% of the total number of publications. Among them, the United States (24.60%) is the country with the most published papers, followed by China (17.49%) and Canada (5.53%). The United States has the highest total citations and H-index, while Sweden has the highest average citations per article.
Table 1: Top 10 countries/regions that published publications
|
Rank
|
Countries/Regions |
Article counts |
Percentage (n/1772) |
Total citations |
Average citations per article |
H-index |
TLS |
| 1 |
USA
|
436 |
24.60% |
39,735 |
90.93 |
81 |
360
|
|
2
|
China
|
310 |
17.49% |
15,658 |
50.51 |
38 |
138 |
| 3 |
Canada
|
98 |
5.53% |
8,478 |
86.51 |
33 |
165
|
|
4
|
England
|
70 |
3.95% |
15,364 |
219.49 |
30 |
204 |
| 5 |
Germany
|
67 |
3.78% |
13,702 |
204.51 |
32 |
154
|
|
6
|
Australia
|
49 |
2.77% |
13,117 |
267.69 |
24 |
73 |
| 7 |
Japan
|
49 |
2.77% |
12,476 |
254.61 |
19 |
29
|
|
8
|
Italy
|
45 |
2.54% |
12,532 |
278.49 |
19 |
93 |
| 9 |
Netherlands
|
34 |
1.92% |
7,924 |
233.06 |
24 |
129
|
|
10
|
Sweden
|
34 |
1.92% |
11,913 |
350.38 |
19 |
136
|
Figure 2 is the map of international cooperation between countries/ regions, in which the thicker the line between the two countries, the closer the cooperation. As shown in the figure, countries such as the United States, China and Canada have closer ties with other countries. Figure 3 is the country’s citation network visualization map. Countries with total link strength (TLS) over 200 are USA (TLS=360) and England (TLS=204), indicating that these two countries are more influential internationally. In general, USA, China and Canada are the main international contributors to the study of ischemic stroke and intestinal flora, with the largest number of publications and high quality of papers.
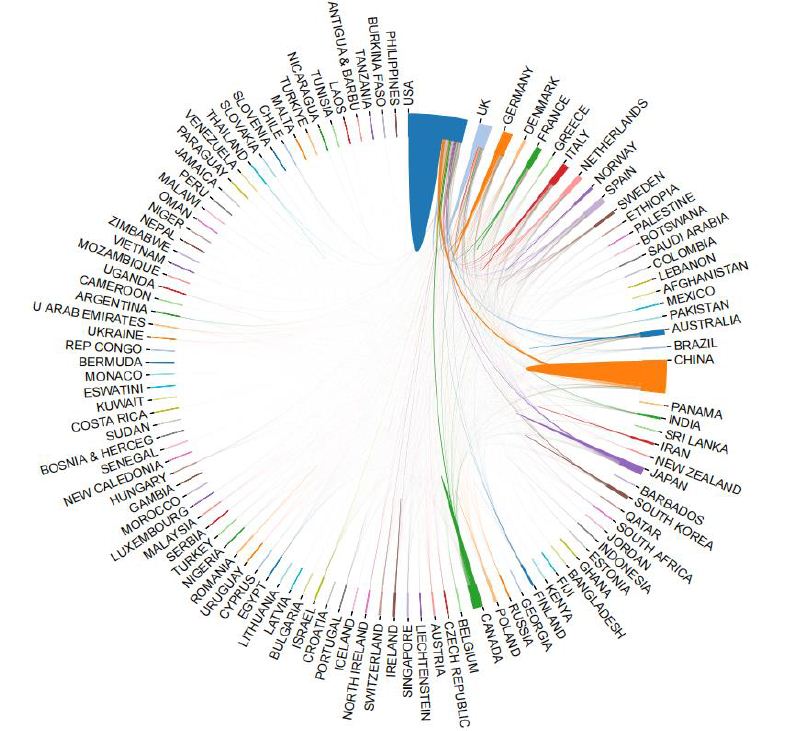
Figure 2: International cooperation map between countries/regions
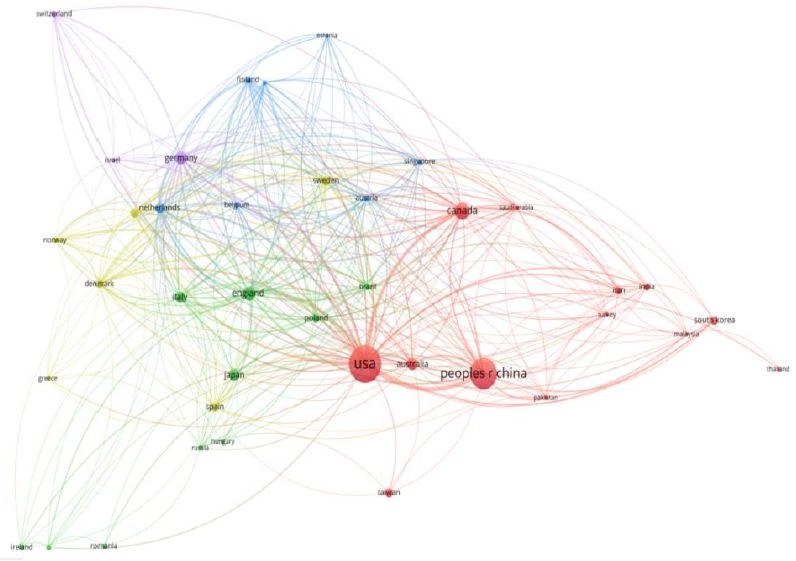
Figure 3: Citation network visualization of countries
Mechanism Analysis
Table 2 shows the top 10 institutions published in the number of articles which are the most active institutions in the field of IS and intestinal flora research are mainly from. China and USA have the largest number of published papers, and the top three institutions are Southern Medical University, University of California, SanDiego and Harvard Medical School. Harvard Medical School in the United States has the highest number of citations and H-index.
Table 2: The top 10 institutions in the number of articles published
|
Rank
|
Institutions |
Countries/Regions |
Article counts |
Total citations |
Average citations per article |
H-index |
TLS |
Centrality |
| 1 |
Southern Medical University
|
China |
36 |
5,162 |
125.9 |
17 |
13 |
0.03
|
|
2
|
University of California, SanDiego
|
USA |
26 |
12,196 |
381.13 |
18 |
111 |
0.02 |
| 3 |
Harvard Medical School
|
USA |
25 |
14860 |
215.36 |
31 |
56 |
0.03
|
|
4
|
China Medical University
|
China |
24 |
4,056 |
162.24 |
11 |
38 |
0.01 |
| 5 |
University of Texas Health Science Center at Houston
|
USA |
23 |
5036 |
162.45 |
18 |
49 |
0.01
|
|
6
|
Cleveland Clinic Foundation
|
USA |
22 |
12,582 |
419.4 |
19 |
59 |
0.14 |
| 7 |
Baylor College of Medicine
|
USA |
21 |
5,870 |
183.44 |
20 |
39 |
0.07
|
|
8
|
University of Toronto
|
Canada |
19 |
6187 |
247.68 |
16 |
48 |
0.02 |
| 9 |
Albert Einstein College of Medicine
|
USA |
18 |
4,066 |
193.62 |
19 |
93 |
0.15
|
|
10
|
Western University
|
Canada |
18 |
3,987 |
199.35 |
18 |
11 |
0.01
|
Figure 4 is an institutional network collaboration map created using CiteSpace. Each node in the map represents a different institution. The darker the color of the node, the later the active year. Albert Einstein College of Medicine had the highest centrality (0.15), followed by Cleveland Clinic Foundation (0.14). When the centrality value is greater than or equal to 0.1, it indicates that the node is the key node of the network graph. It can be seen that these three universities play an important role in institutional cooperation. There are 789 links and 135 nodes, forming a cluster of 10 different colors. The top three institutions with the highest TLS were University of California, San Diego (TLS=111), Albert Einstein College of Medicine (TLS=93) and Cleveland Clinic Foundation (TLS=59).
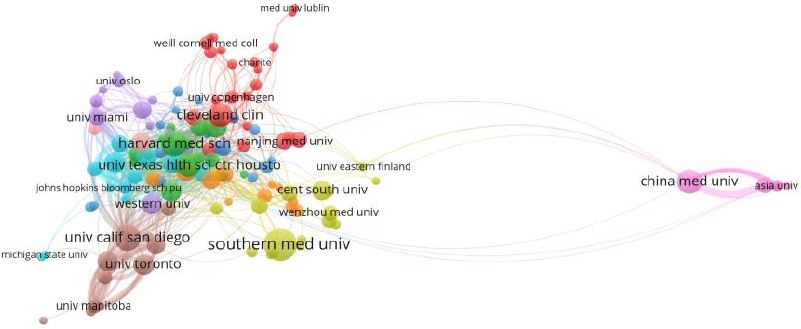
Figure 4: The institution’s citation network visualization map
Analysis of Funding Agencies
The top 10 funding agencies that support IS and intestinal flora research were listed in Table 3. The top three funding agencies were the United States Department of Health and Human Services (313), National Institutes of Health (312) and National Institute of Neurological Disorders and Stroke (199). The top three funding agencies supported the field far more than any other agency. In terms of countries/regions, the United States has the most funded publications, followed by China and Canada.
Table 3: Top 10 funding agencies
|
Rank
|
Funding Agencies |
Number of Publications |
Countries/Regions |
| 1 |
United States Department of Health and Human Services
|
313 |
USA
|
|
2
|
National Institutes of Health
|
312 |
USA |
| 3 |
National Institute of Neurological Disorders and Stroke
|
199 |
USA
|
|
4
|
National natural science foundation of China
|
165 |
China |
| 5 |
National Heart, Lung, and Blood Institute
|
48 |
USA
|
|
6
|
Heart and Stroke Foundation of Canada
|
40 |
Canada |
| 7 |
National Institute on Aging
|
38 |
USA
|
|
8
|
anadian Institutes of Health Research
|
36 |
Canada |
| 9 |
National Institute of Diabetes, Digestive and Kidney Disease
|
35 |
USA
|
|
10
|
UK Research and Innovation
|
28 |
USA
|
Authors Analysis
The top 10 authors published 153 articles(15.07%) about IS and intestinal flora, as shown in Table 4. Among the top 10 authors, Li L, Hazen SL and Tang WHW are the most cited. The two authors with the largest number of publications are Hazen SL and Spence JD.
Table 4: Top 10 authors in research field
|
Rank
|
Author |
Count |
Representative article in this field |
Institutions |
H-index |
Total citations |
TLS
|
|
1
|
Hazen, Stanley L |
19
|
Intestinal microbiota metabolism of L-carnitine, a nutrient in red meatpromotes atherosclerosis |
Nature Medicine |
16
|
7540 |
88
|
|
2
|
Wang, Zeneng |
15
|
Intestinal microbiota metabolism of L-carnitine, a nutrient in red meat, promotes atherosclerosis |
Nature Medicine |
12
|
7179 |
71
|
|
3
|
Yin, Jla |
13
|
Dysbiosis of Gut Microbiota With Reduced Trimethylamine-N-Oxide Level in Patients With Large- Artery Atherosclerotic Stroke or Transient Ischemic Attack |
Journal Of The American Heart Association |
10
|
862 |
63
|
|
4
|
Tang, W H Wilson |
11
|
Intestinal microbiota metabolism of L-carnitine, a nutrient in red meat, promotes atherosclerosis. |
Nature Medicine |
11
|
7016 |
61
|
|
5
|
He, Yan |
11
|
Dysbiosis of Gut Microbiota With Reduced Trimethylamine-N-Oxide Level in Patients With Large- Artery Atherosclerotic Stroke or Transient Ischemic Attack |
Journal Of The American Heart Association |
10
|
871 |
60
|
|
6
|
Wang, Huidi |
10
|
Guidelines for the use and interpretation of assays for monitoring autophagy (3rd edition) |
Autophagy |
9
|
3930 |
57
|
|
7
|
Wu, Qiheng |
9
|
Stroke Dysbiosis Index (SDI) in Gut Microbiome Are Associated With Brain Injury and Prognosis of Stroke |
Frontiers in Neurology |
8
|
396 |
55
|
|
8
|
Li, Lin |
8
|
Guidelines for the use and interpretation of assays for monitoring autophagy (3rd edition) |
Autophagy |
10
|
8340 |
54
|
|
9
|
Zhou, Hongwei |
8
|
Dysbiosis of Gut Microbiota With Reduced Trimethylamine-N-Oxide Level in Patients With Large- Artery Atherosclerotic Stroke or Transient Ischemic Attack |
Journal Of The American Heart Association |
11
|
867 |
53
|
|
10
|
Gao,Xuxuan |
7
|
Stroke Dysbiosis Index (SDI) in Gut Microbiome Are Associated With Brain Injury and Prognosis of Stroke |
Frontiers in Neurology |
8
|
488 |
52
|
Figure 5 is an author co-citation network diagram that has been cited at least 20 times. It contains a total of 14 nodes, 84 links and 2 clusters. The top three authors with the highest TLS are Hazen, Stanley l (TLS=88), Wang, Zeneng (TLS=71) and Yin, Jia (TLS=63). The co-author citation analysis visualization map contains a total of 10,879 nodes, 10,879 links and 8 clusters. The nodes in the graph represent the author, but the difference between the two is that the link between the nodes depends on the collaboration between the authors. The top three authors with the highest TLS were Hazen SL (TLS=970), Spence JD (TLS=369) and Wang Y (TLS=21729). They are at the center of a cooperative relationship. In general, the nodes of the network diagram are scattered, indicating that the cooperation between the authors in this field is not close.
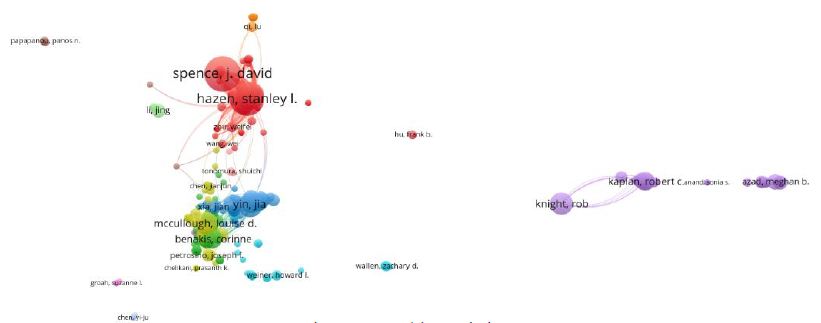
Figure 5: Author co-citation network diagram with at least 20 citations
Journal Analysis
Table 5 lists the top 10 journals published from 2000 to 2023, most of which are from the United States. Frontiers in Neurology had the largest number of publications, followed by Scientific Reports and International Journal of Molecular Sciences. Stroke had the highest impact factor (IF=8.3). According to Journal Citation Reports (JCR) 2023, the impact factors of the top 10 journals ranged from 3.4 in Frontiers in Neurology to 8.3 in Stroke.
Table 5: Top 10 journals from 2000 to 2023
|
Rank
|
Journal title |
Countries/Regions |
Article Counts |
Percentage (N/1015) |
IF (2023) |
Quartile in category |
H-index |
TLS
|
|
1
|
Frontiers in Neurology |
USA |
22
|
2.17% |
3.4 |
Q2 |
22 |
163
|
|
2
|
Scientific Reports |
England |
22
|
2.17% |
4.6 |
Q2 |
33 |
62
|
|
3
|
International Journal of Molecular Sciences |
USA |
21
|
2.07% |
5.4 |
Q2 |
19 |
63
|
|
4
|
Frontiers in Immunology |
Switzerland |
20
|
1.97% |
7.3 |
Q1 |
25 |
175
|
|
5
|
Stroke |
USA |
19
|
1.87% |
8.3 |
Q1 |
19 |
178
|
|
6
|
Nutrients |
Australia |
19
|
1.87% |
5.9 |
Q1 |
10 |
42
|
|
7
|
Frontiers in Cellular and Infection Microbiology |
Switzerland |
17
|
1.67% |
5.7 |
Q2 |
19 |
134
|
|
8
|
Frontiers in Neuroscience |
Switzerland |
15
|
1.48% |
4.3 |
Q2 |
13 |
108
|
|
9
|
PLOS ONE |
USA |
14
|
1.38% |
3.7 |
Q2 |
10 |
66
|
|
10
|
Journal Of Cerebral Blood Flow And Metabolism |
England |
13
|
1.28% |
6.3 |
Q1 |
20 |
107
|
Figure 6 shows the visualization of journal co-citation analysis. The top three journals with the highest TLS are Stroke (TLS=187), frontiers in immunology (TLS=175) and frontiers in immunology (TLS=163). Figure 7 shows the double-mapping overlay map of all academic journals. The left side of the map represents the citation journals, the right side of the map represents the cited journals, and the color line represents the citation relationship between the citation journals and the cited journals. The whole map can show the complete citation process. The number of papers published in the journal determines the length of the longitudinal axis of the ellipse, and the number of authors determines the length of the transverse axis. The orange citation path indicates that Molecular/ Biology/Immunology research is frequently cited in Molecular/ Biology/Genetics journals. The green path indicates that research on Medicine/Medical/Clinical is often cited by Medicine/Medical/ Genetics journals.
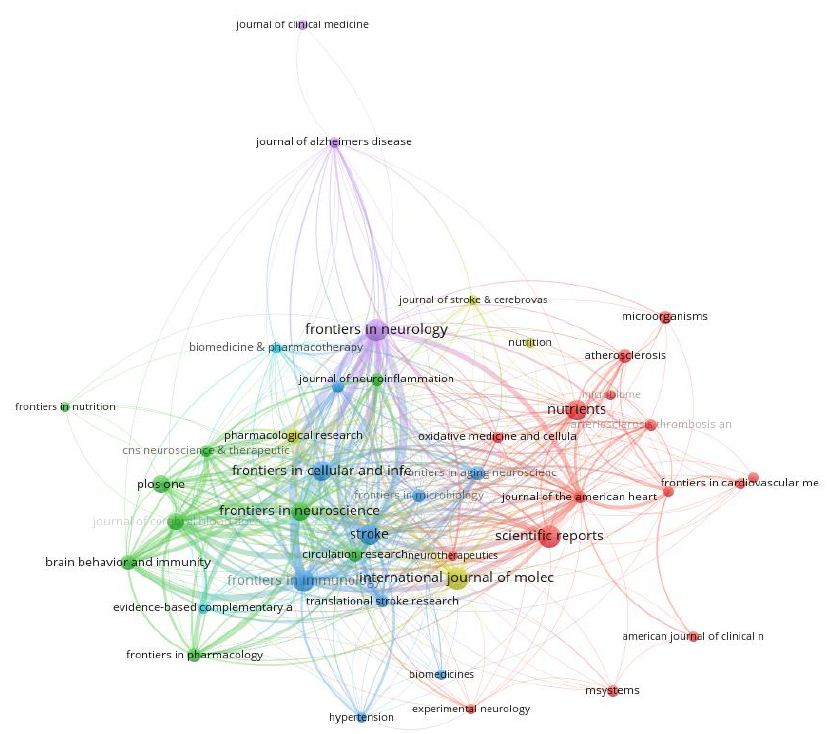
Figure 6: The visualization of journal co-citation analysis
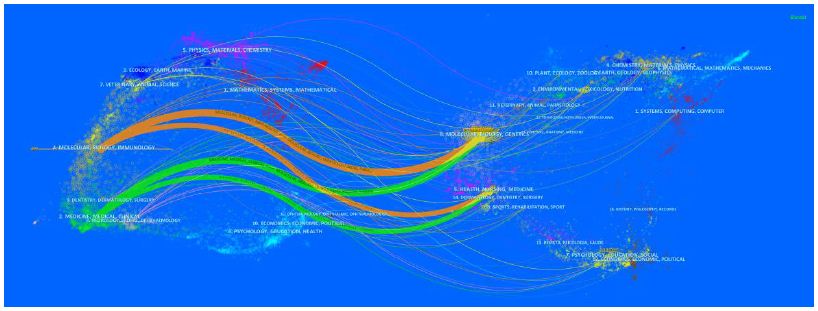
Figure 7: The double mapping overlay of all academic journals
Analysis References
Figure 8 shows the co-citation network visualization of the literature generated by VOS viewer, and lists the top 10 most cited articles related to IS and intestinal flora research in Table 6. There are 11300 links and 172 nodes, forming four clusters of different colors. In these clusters, the total link strength with other cited references was calculated. The highest TLS was an article published by Benakis C et al. in 2016 (TLS=2976), followed by articles published by Singh V et al. (TLS=2959, 2016), Yin J et al. (TLS=2695, 2015), Wang Zn et al. (TLS=2100, 2011). Three of these 10 articles were published in nat med. The most frequently cited article in this field was an article published by Benakis C [12] on the effect of symbiotic microbiota on the outcome of ischemic stroke by regulating intestinal T cells.
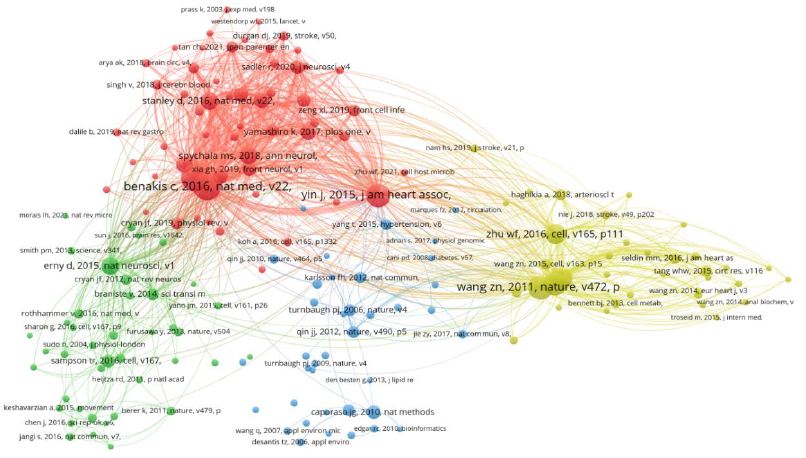
Figure 8: Visualization diagram of literature co-citation network
Table 6: Top 10 most cited articles
|
Rank
|
Title |
Total citations |
First author |
Publication Year |
Journal |
TLS
|
|
1
|
Commensal microbiota affects ischemic stroke outcome by regulating intestinal gamma delta T cells |
186
|
Benakis C |
2016
|
Nature Medicine |
2976
|
|
2
|
Microbiota Dysbiosis Controls the Neuroinflammatory Response after Stroke |
184
|
Singh V |
2016
|
JNeurosci |
2959
|
|
3
|
Prognostic value of choline and betaine depends on intestinal microbiota-generated metabolite trimethylamine-N-oxide |
158
|
Wang zn |
2011
|
nature |
2100
|
|
4
|
Dysbiosis of Gut Microbiota With Reduced Trimethylamine-N-Oxide Level in Patients With Large-Artery Atherosclerotic Stroke or Transient Ischemic Attack |
153
|
Yin j |
2015
|
Journal of the American Heart Association |
2695
|
|
5
|
Intestinal Microbial Metabolism of Phosphatidylcholine and Cardiovascular Risk |
145
|
Tang whw |
2013
|
New England Journal of Medicine |
1973
|
|
6
|
Intestinal microbiota metabolism of L-carnitine, a nutrient in red meat, promotes atherosclerosis |
140
|
Koeth ra |
2013
|
Nature Medicine |
1849
|
|
7
|
Gut Microbial Metabolite TMAO Enhances Platelet Hyperreactivity and Thrombosis Risk |
119
|
Zhu WF |
2016
|
Cell |
1868
|
|
8
|
Translocation and dissemination of commensal bacteria in post-stroke infection |
101
|
Stanley d |
2016
|
Nature Medicine |
1794
|
|
9
|
Host microbiota constantly control maturation and function of microglia in the CNS |
100
|
Erny d |
2015
|
Nature Neuroscience |
1743
|
|
10
|
Age-related changes in the gut microbiota influence systemic inflammation and stroke outcome |
96
|
Spychala ms |
2018
|
Annals Of Neurology |
1759
|
We also observe from Figure 9 that the top 20 references with the strongest outbreak were cited in the study of IS and intestinal flora. The articles with the strongest explosive power are: Koeth RA [13] published in 2013: Intestinal microbiota metabolism of L-carnitine, a nutrient in red meat, promotes atherosclerosis.
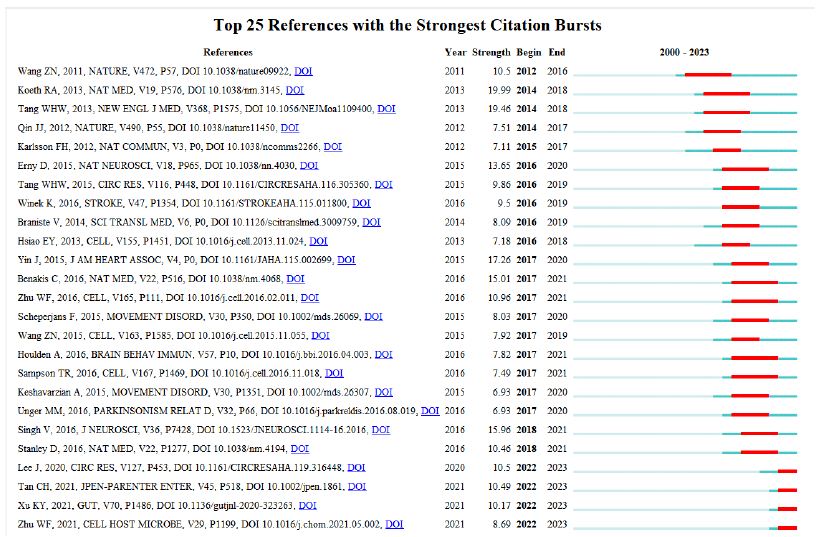
Figure 9: Top 20 references with the strongest outbreak
Keywords Analysis
Keyword Co-occurrence Analysis
In bibliometrics, keywords are a very important part. Keyword co-occurrence analysis can reveal changing research topics and development trends. The density visualization map generated by co-occurrence of keywords more than 10 times is shown in Figure 10. The more frequent the keywords appear, the darker the color. In addition to the ‘ischemic stroke’ and ‘intestinal flora’ contained in the search terms, a total of 545 keywords appeared as nodes. Table 7 shows that the most common keywords are ‘risk’, ‘disease’, ‘inflammation’ and ‘chain fatty acid’.
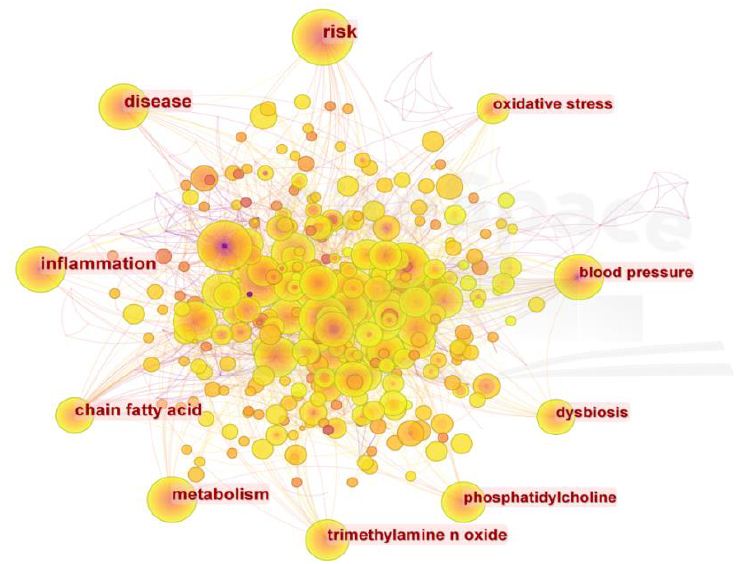
Figure 10: Keyword visualization of co-occurrence of keywords more than 10 times
Table 7: Top 20 keywords of
|
Rank
|
Keyword |
Counts |
Rank |
Keyword |
Counts
|
|
1
|
risk |
116
|
11
|
traditional chinese medicine |
45
|
|
2
|
disease |
99
|
12
|
atherosclerosis |
42
|
|
3
|
inflammation |
95
|
13
|
central nervous system |
39
|
|
4
|
chain fatty acid |
82
|
14
|
multiple sclerosis |
31
|
|
5
|
metabolism |
78
|
15
|
fecal microbiota transplantation |
21
|
|
6
|
trimethylamine n oxide |
62
|
16
|
bile acid |
17
|
|
7
|
phosphatidylcholine |
54
|
17
|
blood brain barrier |
14
|
|
8
|
dysbiosis |
50
|
18
|
microglia |
13
|
|
9
|
blood pressure |
47
|
19
|
microbiota-gut-brain axi |
12
|
|
10
|
oxidative stress |
47
|
20
|
ketogenic diet |
11
|
Keyword Cluster Analysis
Cluster analysis is carried out on the basis of keyword co- occurrence graph. The more nodes the cluster contains, the smaller the cluster number is. The two indexes of module value (Q value) and average contour value (S value) are used as the evidence to judge the clustering effect of the graph. Q value > 0.3 indicates that the clustering structure is significant ; clustering average contour value S value > 0.5, clustering is generally considered to be reasonable. In this study, the LLR model was used to cluster the keywords, Q value=0.5205, S value=0.6911. It can be considered that the clustering results are within a reasonable range, as shown in Figure 11.
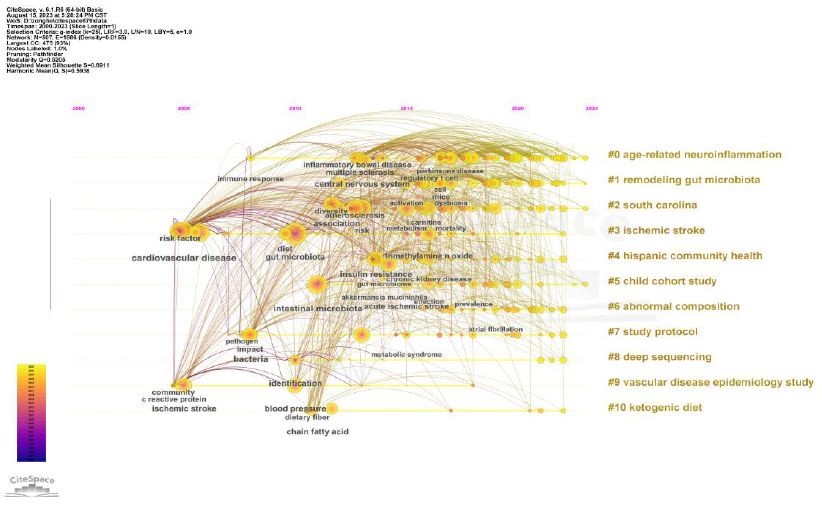
Figure 11: Keyword cluster visualization
Keyword Burst Analysis
This study lists the top 13 burst keywords, see Figure 12. The most intense burst keywords are ‘coronary heart disease’ (intensity=6.14), followed by ‘mediterranean diet’ (intensity=5.29) and ‘myocardial infarction’ (intensity=5.03). ‘Coronary heart disease’ is the earliest emerging keyword, and the emerging keywords from 2022 to 2023 are ‘fecal microbiota transplantation’, ‘immune’ and ‘cerebral ischemia’ The map shows that there are three keywords that are still in the current stage of the ongoing process.
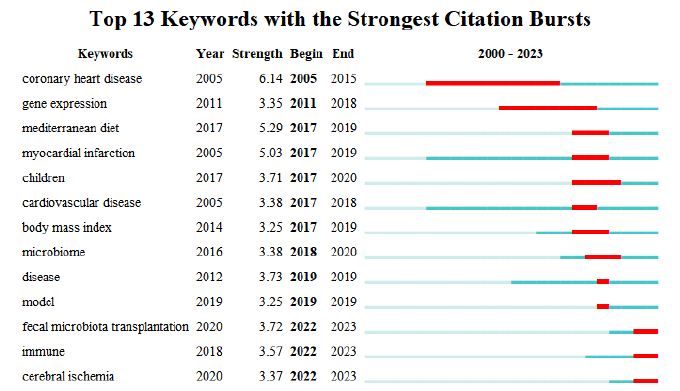
Figure 12: Studies the top 13 keywords with the strongest citation burst
Discussion
Global Research Trends of Ischemic Stroke and Intestinal Flora
This study conducted a bibliometric analysis of IS and intestinal flora. The number of citations showed a continuous but unstable growth trend year by year. These results show that from the overall trend of the number of papers published in this field, more and more scholars pay attention to the role of pathogenesis in this field, especially in recent years, the number of papers published has increased significantly. Therefore, it can be inferred that in recent years, people’s understanding of this field has become more mature, relevant basic research has become more and more, and the prevention and control of this field has become a hot spot and trend all over the world.
In terms of countries/regions, the United States is the dominant contributor to the number of published articles (436), followed by China (310) and Canada (98), while the United States is far ahead of other countries in the number of citations (39735), which can be said to be in a dominant position in this field. In terms of authoritative institutions, the top 10 institutions are composed of 9 American institutions and 1 Chinese institution. According to international cooperation, the University of California System in the United States has relatively close cooperation with other institutions. Although a wide range of cooperation has been established between countries and institutions, future research involving IS and intestinal flora should focus on international cooperation and carry out multi-center, large- sample studies.
Scientific research and innovation need a lot of financial, human and material support. The United States Department Of Health Human Services is the funding agency that funds the most research projects in this field, so the support of funding agencies is one of the reasons why the United States has achieved a high academic status in this field. At the same time, it is of great significance to prove the research on IS and intestinal flora. Because more and more institutions invest a lot of money to conduct in-depth research and explore their deep cognition and prevention, there will be greater financial support to encourage high-level institutions to contribute to scientific research.
According to the survey of author information, it can be found that Hazen SL has the highest H index. In terms of authoritative journals, Frontiers in Neurology (22 articles), Scientific Reports (22 articles), and International Journal of Molecular Sciences (21 articles) contribute the most to the number of published papers. Among the top 10 journals, Q2 accounted for 60% and Q1 accounted for 40%, indicating that the quality of research on IS and intestinal flora still needs to be strengthened. PLOS ONE had the most citations (1000) and the highest average number of citations (71.43 times). The highest H index value appears in Frontiers in Neurology. In addition, four of the top 10 journals have IF values of 3-5 (Frontiers in Neurology, Scientific Reports, Frontiers in Neuroscience and PLOS ONE). The IF values of 4 journals were 5-7 (International Journal of Molecular Sciences, Nutrients, Frontiers in Cellular and Infection Microbiology, Journal Of Cerebral Blood Flow And Metabolism), and the IF values of 2 journals were 7-8 (Frontiers in Immunology, Stroke).
Research Hotspots and Frontiers of IS and Intestinal Flora
Keyword analysis can reflect the core and research points of a literature. On the basis of in-depth analysis of keyword co-occurrence, it can quickly determine the research hotspots and development trends in a field. Through the visual clustering analysis of keywords, combined with color clustering diagram and emergent graph, the current research hotspots and frontiers are analyzed [14]. From the results, it can be seen that in the occurrence and development of IS, the imbalance of intestinal flora mediated by short-chain fatty acids, trimethylamine nitrogen oxide, brain-gut axis, immunity and neuroinflammation play a key role in the occurrence and development of IS. Fecal microbiota transplantation technology is also a research hotspot in this field. We will analyze it from the perspectives of short- chain fatty acids, trimethylamine nitrogen oxide, brain-gut axis, ketogenic diet, fecal microbiota transplantation, and natural products. The analysis results are summarized as follows:
The Effect of Short Chain Fatty Acids (SCFAs) on IS
SCFAs are the ‘protectors’ of the occurrence and development of stroke. The mechanism of action is to regulate microglia, neurotrophic factors, blood-brain barrier (BBB), neuro inflammation and neuronal apoptosis [15]. SCFAs mainly cross the cell membrane in a pH- dependent manner, and are transported across the cell membrane mediated by hydrogen-coupled or sodium-coupled monocarboxylic acid transporters, which can cause apoptosis by regulating the NF- kappa B signaling pathway, thus playing a protective role in brain injury. Under physiological conditions, SCFAs, the main metabolites of intestinal flora, can affect the expression of B-cell lymphoma-2, BH3 interacting domain death agonist, Fas cell surface death receptor, Necdin and Vascular endothelial growth factor A related to neurogenesis, proliferation and apoptosis, and promote the growth of human neural progenitor cells and the differentiation of embryonic stem cells into neurons [16]. In addition, the regulation of SCFAs on brain function may be related to its regulation of neurotransmitters and NF-κB signaling pathway. Studies have confirmed that SCFAs can enter the blood-brain barrier through blood flow and act directly on the blood-brain barrier [17]. Studies have shown that sodium butyrate can not only inhibit histone deacetylase, but also increase the expression of TrkB receptor in the injured hemisphere and the phosphorylation of transcription factor cyclic adenosine monophosphate effector element binding protein, and promote the occurrence of ipsilateral hemisphere neurons through BDNF-TrkB signaling pathway, increase synaptic plasticity, and ultimately improve the neurological function of neonatal hypoxic-ischemic rats [18].
The Effect of Trimethylamine Nitrogen Oxide (TMAO) on IS
TMAO is a gut-derived microbial metabolite. When the body ingests choline, it decomposes the C-N bond in the product to form trimethylamine (TMA). TMA enters the liver through the liver and intestinal circulation system, and generates TMAO under the oxidation of flavin monooxygenase. TMAO can cause thrombosis, platelet aggregation, vascular endothelial injury, lipid metabolism, inflammation and other diseases, and the increase of TMAO concentration can lead to severe cerebrovascular disease. In addition, for patients with diabetes, first stroke and peripheral arterial disease, the risk of long-term death also has a significant correlation. TMAO may affect the recovery of neurological function after cerebral ischemia by promoting astrocyte activation and glial scar formation. In addition, there is also a certain relationship between TMAO content and stroke recurrence. Recent studies have found that the concentration of TMAO increased significantly within 72 hours after cerebral ischemia, which is an important risk factor for recurrent vascular events 3 months after cerebral ischemia-reperfusion. Although the current study has confirmed the change of TMAO level after stroke, the change of TMAO before stroke can not be determined, and the long-term effect of TMAO on stroke patients still needs further observation [19-21].
The Effect of Gut-Brain Axis on IS
Studies have found that there is a two-way communication and interaction between the intestine and the brain. The intestinal flora can exchange information with the brain through neural pathways, neurotransmitter endocrine pathways, immune pathways, cellular metabolites, and host metabolic pathways, that is, the‘gut-brain axis’ [22]. After ischemic brain injury, GBA in the brain transmits signals to the intestine, leading to intestinal inflammation, decreased intestinal motility, mucosal barrier destruction, increased permeability, and intestinal flora translocation. Studies have found that the diversity of intestinal flora is reduced, the proportion of Bacteroidetes and Firmicutes is changed, and the abundance of beneficial bacteria such as Lactobacillus and Bifidobacterium is reduced, which may further aggravate brain injury [23]. The gut-brain axis affects the immune function of the body by regulating the number of regulatory T cells and IL-17+γδT cells, leading to the occurrence of cerebral ischemia. The ‘gut-brain axis’ caused by IS can promote the migration of T lymphocytes from the intestine to the brain, increase the secretion of γδT cells and IL-17 in the brain, decrease the secretion of Treg cells and IL-10, cause systemic and central nervous system inflammation, and aggravate brain nerve injury [24,25].
Effects of Ketogenic Diet on IS
Ketogenic diet is mainly composed of low carbon, high fat and suitable protein. It has a good therapeutic effect on nervous system diseases, especially intractable epilepsy, neurodegenerative diseases, mental and psychological diseases and so on [26]. As an important source of energy, ketone bodies can be fully utilized in neurons, glial cells and other tissues, so they have been widely used in neurological diseases [27]. In addition, ketogenic diet can also affect the intestinal immune function by regulating the intestinal microbial community, thus affecting the inflammatory response of brain tissue. It has been found that ketogenic diet can significantly change the intestinal microorganisms of rats, reduce the abundance and α diversity of intestinal microorganisms in rats, and significantly increase the content of Akkermansia-muciniphila and Parabacteroides in rats. Studies have shown that ketogenic diet and β-hydroxybutyrate (BHB) have protective effects on cerebral ischemia [28,29]
Fecal Bacteria Transplantation Technology and Its Effect on IS
In recent years, with the emergence of fecal bacterial transplantation and the concept of intestinal microecology, there has been a new understanding of the interaction between flora and human body. The micro-ecological system of the human body consists of four systems: oral cavity, skin, urinary system and gastrointestinal tract. Among these four systems, the number and structure of microorganisms colonized in the intestinal microecosystem are the most complex, and they have the greatest impact on the human body. The first application of modern western medicine fecal bacteria transplantation technology originated from the University of Colorado School of Medicine in the United States. In 1958, it was first used in 4 patients with pseudomembranous colitis and successfully cured. Wang used fecal bacterial transplantation technology to confirm that different genders of intestinal flora are related to the outcome of cerebral infarction in animal models of cerebral infarction. It was also found that giving female intestinal flora could significantly improve the survival rate of mice, reduce the infarct area, improve behavioral performance, promote the secretion of beneficial metabolites, and reduce the inflammatory response. In contrast, the protective effect of male intestinal flora on mice was weaker. Studies have confirmed that fecal microbiota transplantation can significantly improve the structure of intestinal flora in patients with CI, reduce the number of pathogenic bacteria, increase the number of probiotics, reduce nerve injury, reduce cerebral edema, and reduce the volume of cerebral infarction [30-34].
Effect of Natural Products on Intestinal Flora in the Treatment of Ischemic Stroke
Traditional Chinese medicine(TCM) has attracted much attention in the field of regulating intestinal microecology and repairing intestinal barrier due to its mild bacteriostatic effect, repair effect and not easy to cause human drug resistance. TCM can enhance the immunity of the body, resist the invasion of foreign bacteria, and also adjust the level of pro-inflammatory and anti-inflammatory factors in the body, so as to achieve the purpose of inhibiting intestinal inflammation [35-37]. What’s more, TCM can regulate the number and secretory function of intestinal mucosal epithelial cells, provide a suitable growth environment for specific flora, and inhibit other flora, thereby affecting the secretion and layer components of mucus by improving the microcirculation of the intestinal mucosa, repairing the integrity of the intestinal mucosa, reducing the permeability of the intestinal mucosa to maintain the mechanical barrier function. Increasing the number of dominant microorganisms and maintaining the balance between them and the host are important ways to repair the biological barrier [38,39]. Studies have shown that the compatibility of Puerariae Lobatae Radix and Chuanxiong Rhizoma can improve the increase of intestinal mucosal permeability, brain-gut barrier injury and has a good therapeutic effect on brain injury caused by cerebral ischemia. It has also been reported that the compatibility of astragalus and saffiower can protect the integrity of the blood-brain barrier and reduce cerebral ischemic injury by regulating intestinal microecology, activating bile acid receptors, maintaining bile acid homeostasis, and reducing inflammatory reactions in the brain [40].
TCM has good intestinal mucosal barrier and intestinal microecological recovery function. However, some TCM can also cause certain damage to the intestine while achieving curative effect. It has been proved that soyasaponins can reduce intestinal mucosal folds, promote the proliferation and apoptosis of intestinal epithelial cells, increase the permeability of intestinal mucosa, break the cell connection, and damage the antioxidant function of intestinal mucosa, thus causing intestinal mucosal damage. In addition, the diameter of the active ingredients, original drugs and compound of TCM prepared by nanotechnology is not more than 100 nm. The research of nano-Chinese medicine involves a variety of techniques such as nano-carriers and solid dispersion systems. This method can not only realize the nanometer grinding of the drug, but also make the effective components or the effective components of the drug nano- treatment to have a new effect. It is expected to achieve a breakthrough in the treatment of IS [41-44].
Marine natural products have a multi-target agent effect and can synergistically regulate a variety of intestinal and intestinal-related diseases. Studies had confirmed the therapeutic effect of carotenoids, polysaccharides, phytosterols, terpenes, phenols, alkaloids and other active ingredients on neurodegenerative diseases, and explored its mechanism of action. Natural substances in the ocean can reduce the relative content of harmful transgenes, increase beneficial transgenes, and regulate inflammatory mediators, apoptosis, and oxidative stress in the intestine [46]. Because the intestine and the brain interact with each other, regulating the signal transduction pathway in the intestine can make it play a neuroprotective role in the brain. It was found that astaxanthin could inhibit the expression of MyD88, TLR4 and p-p65, and up-regulate the expression of p65. Astaxanthin has the function of simultaneously regulating the two organs of intestine and brain. It is speculated that it may be an ideal candidate for regulating intestinal- brain axial neuroprotection [45-48].
Limitation
We conducted a visual analysis on the WoSCC database and found that: (1) The data we collected is limited to the data between July 2000 and 2023, and the real data will change according to the update of the database. (2) Because the existing bibliometrics software can not identify the author’s initials, so in the author analysis of the article, there may be some incorrect results; (3) Because the search scope of this paper is limited to the SCI-E index database of WOS, the documents that are not included in the SCI-E index database are not included in the analysis scope of this paper. However, the research results of this project will help us better understand the mechanism of IS and intestinal flora, and provide new ideas and methods for further exploration of this issue in the future.
Conclusion
Based on the WoSCC database, this study conducted a bibliometric analysis of 1015 studies published from 2000 to 2023 on the relationship between intestinal flora and the incidence of IS. The results showed that the number of publications on the relationship between intestinal flora and IS in the past literature showed an increasing trend year by year. Globally, China and the United States are the leading countries in this field, and they are also the countries with the most cooperation and exchanges. Southern Medical University is the research institution that has the greatest impact on research results. Hazen and Stanley L are the authors with high publications in this field. Frontiers in Neurology may be the most popular journal in this field. At present, most of the published articles on the study of IS and intestinal flora are cited from internationally influential journals. Short-chain fatty acids, trimethylamine nitrogen oxide, brain-gut axis, ketogenic diet, and fecal microbiota transplantation are the hotspots and frontiers in the study of intestinal flora and IS. Further study on the relationship between intestinal flora and IS will promote the treatment of IS.
Acknowledgments
This study was supported by Guangxi University of Chinese Medicine (NO.2021QN010), Projects to improve the basic scientific research capacity of young and middle-aged people (NO.2022KY0301) and Guangxi first-class discipline Clinical basis of Traditional Chinese Medicine (TCM) (NO.2019XK060).
References
- Campbell, B Khatri, Stroke. (2020) Lancet 396: 129-142.
- Chen, Y Zhou, J Wang, L (2021) Role and Mechanism of Gut Microbiota in Human Front Cell Infect Microbiol 11: 625913. [crossref]
- Agirman, G Yu, B Hsiao, E.Y. (2021) Signaling inflammation across the gut-brain axis. Science 374(6571). [crossref]
- Silva, D.C.T Singh, V Mohamud, Y.A Wang, J Schultz, M.A, et al. (2022) Post- ischemic protein restriction induces sustained neuroprotection, neurological recovery, brain remodeling, and gut microbiota rebalancing. Brain Behav Immun 100: 134-144. [crossref]
- Ma, W Yang, Y.B Xie, T.T Xu, Y Liu, N, et al. (2022) Cerebral Small Vessel Disease: A Bibliometric J Mol Neurosci 72(11). [crossref]
- Xiu, R Sun, Q Li, B Wang, Y (2023) Mapping Research Trends and Hotspots in the Link between Alzheimer’s Disease and Gut Microbes over the Past Decade: A Bibliometric Analysis. Nutrients 15. [crossref]
- Wu, W Ouyang, Y Zheng, P Xu, X He, C, et al. (2022) Research trends on the relationship between gut microbiota and colorectal cancer: A bibliometric analysis. Front Cell Infect Microbiol 12:1027448. [crossref]
- Yuan, X Chang, C Chen, X Li, K (2021) Emerging trends and focus of human gastrointestinal microbiome research from 2010-2021: a visualized study. J Transl Med 19(1). [crossref]
- Pei, Z Chen, S Ding, L Liu, J Cui, X, et (2022) Current perspectives and trend of nanomedicine in cancer: A review and bibliometric analysis. J Control Release 352: 211-241. [crossref]
- Xu, D Wang, Y.L Wang, K.T Wang, Y Dong, X.R, et al. (2021) A Scientometrics Analysis and Visualization of Depressive Disorder. Curr Neuropharmacol 19(6). [crossref]
- Ma, D Yang, B Guan, B Song, L Liu, Q, et al. (2021) A Bibliometric Analysis of Pyroptosis From 2001 to 2021. Front Immunol 12: 731933. [crossref]
- Benakis, C Brea, D Caballero, S Faraco, G Moore, J, et al. (2016) Commensal microbiota affects ischemic stroke outcome by regulating intestinal γδ T cells. Nat Med 22(5). [crossref]
- Koeth, A Wang, Z Levison, B.S Buffa, J.A Org, E, et al. (2013) Intestinal microbiota metabolism of L-carnitine, a nutrient in red meat, promotes atherosclerosis. Nat Med 19(5). [crossref]
- Wang, J Maniruzzaman, M (2022) A global bibliometric and visualized analysis of bacteria-mediated cancer therapy. Drug Discov Today 27(10). [crossref]
- Tu, R Xia, J (2024) Stroke and Vascular Cognitive Impairment: The Role of Intestinal Microbiota Metabolite CNS Neurol Disord Drug Targets 23(1)
- Lee, J D’Aigle, J Atadja, L Quaicoe, V Honarpisheh, P, et (2020) Gut Microbiota- Derived Short-Chain Fatty Acids Promote Poststroke Recovery in Aged Mice. Circ Res 127(4). [crossref]
- Ahmed, H Leyrolle, Q Koistinen, V Karkkainen, O Laye, S, et (2022) Microbiota- derived metabolites as drivers of gut-brain communication. Gut Microbes 14(1). [crossref]
- Zhou, Z Xu, N Matei, N McBride, D.W Ding, Y, et al. (2021) Sodium butyrate attenuated neuronal apoptosis via GPR41/Gbetagamma/PI3K/Akt pathway after MCAO in J Cereb Blood Flow Metab 41(2). [crossref]
- Zhu, W Romano, A Li, L Buffa, J.A Sangwan, N, et al. (2021) Gut microbes impact stroke severity via the trimethylamine N-oxide pathway.Cell Host Microbe 29(7). [crossref]
- Zhao, F Wei, D.N Tang, Y. (2021) Gut Microbiota Regulate Astrocytic Functions in the Brain: Possible Therapeutic Consequences. Curr Neuropharmacol 19(8). [crossref]
- Chidambaram, B Rathipriya, A.G Mahalakshmi, A.M Sharma, S Hediyal, T.A, et al. (2022) The Influence of Gut Dysbiosis in the Pathogenesis and Management of Ischemic Stroke. Cells 11(7). [crossref]
- Xu, K Gao, X Xia, G Chen, M Zeng, N, et (2021) Rapid gut dysbiosis induced by stroke exacerbates brain infarction in turn. Gut 70(8).
- Ma, J Xie, H Yuan, C Shen, J Chen, J, et al. (2023) The gut microbial signatures of patients with lacunar cerebral infarction, Nutr Neurosci 27(6). [crossref]
- Feng, Y Zhang, D Zhao, Y Duan, T Sun, H, et (2022) Effect of intestinal microbiota transplantation on cerebral ischemia reperfusion injury in aged mice via inhibition of IL-17. Neurogastroenterol Motil 34(7). [crossref]
- Papotto, H Yilmaz, B Silva-Santos, B (2021) Crosstalk between gammadelta T cells and the microbiota. Nat Microbiol 6(9). [crossref]
- Dynka, D Kowalcze, K Paziewska, A (2022) The Role of Ketogenic Diet in the Treatment of Neurological Diseases. Nutrients 14(23). [crossref]
- Olson, A Iniguez, A.J Yang, G.E Fang, P Pronovost, G.N, et al. (2021) Alterations in the gut microbiota contribute to cognitive impairment induced by the ketogenic diet and hypoxia. Cell Host Microbe 29(9). [crossref]
- Koppel, J Pei, D Wilkins, H.M Weidling, I.W Wang, X, et al. (2021) A ketogenic diet differentially affects neuron and astrocyte transcription. J Neurochem 157(6). [crossref]
- Har-Even, M Rubovitch, V Ratliff, W.A Richmond-Hacham, B Citron, B.A, et al. (2021) Pick, G. Ketogenic Diet as a potential treatment for traumatic brain injury in mice. Sci Rep 11(1). [crossref]
- Fujimoto, K Kimura, Y Allegretti, J.R Yamamoto, M Zhang, Y.Z, et al. (2021) Functional Restoration of Bacteriomes and Viromes by Fecal Microbiota Gastroenterology 160(6). [crossref]
- Mohajeri, H Brummer, R Rastall, R.A Weersma, R.K Harmsen, H, et al. (2018) The role of the microbiome for human health: from basic science to clinical applications. Eur J Nutr 57: 1-14. [crossref]
- Eiseman, BSilen, WBascom,G.SKauvar,A.J (1958) Fecal enema as an adjunct in the treatment of pseudomembranous enterocolitis. Surgery 44(5). [crossref]
- Wang, J Zhong, Y Zhu, H Mahgoub, O.K Jian, Z et.al (2022) Different gender- derived gut microbiota influence stroke outcomes by mitigating inflammation. J Neuroinflammation 19(1). [crossref]
- Chen, R Xu, Y Wu, P Zhou, H Lasanajak, Y, et al. (2019) Transplantation of fecal microbiota rich in short chain fatty acids and butyric acid treat cerebral ischemic stroke by regulating gut Pharmacol Res 148: 104403. [crossref]
- Li, X Wu, D Niu, J Sun, Y Wang, Q, et (2021) Intestinal Flora: A Pivotal Role in Investigation of Traditional Chinese Medicine. Am J Chin Med 49(2). [crossref]
- Zhang, Y Tian, J.X Lian, F.M Li, M Liu, W.K, et al. (2021) Therapeutic mechanisms of traditional Chinese medicine to improve metabolic diseases via the gut microbiota. Biomed Pharmacother 133: 110857. [crossref]
- Feng, W Ao, H Peng, C Yan, (2019) Gut microbiota, a new frontier to understand traditional Chinese medicines. Pharmacol Res 142: 176-191. [crossref]
- Che, Q Luo, T Shi, J He, Y Xu, L (2022) Mechanisms by Which Traditional Chinese Medicines Influence the Intestinal Flora and Intestinal Barrier. Front Cell Infect Microbiol 12: 863779. [crossref]
- Yang, S Hao, S Wang, Q Lou, Y Jia, L Chen, D (2022) The interactions between traditional Chinese medicine and gut microbiota: Global research status and trends. Front Cell Infect Microbiol 12: [crossref]
- Chen, R Wu, P Cai, Z Fang, Y Zhou, H, et al. (2019) Puerariae Lobatae Radix with chuanxiong Rhizoma for treatment of cerebral ischemic stroke by remodeling gut microbiota to regulate the brain-gut barriers. J Nutr Biochem 65: 101-114. [crossref]
- Gu, M Pan, S Li, Q Qi, Z Deng, W Bai, N ((2021) Protective effects of glutamine against soy saponins-induced enteritis, tight junction disruption, oxidative damage and autophagy in the intestine of Scophthalmus maximus Fish Shellfish Immunol 114: 49-57. [crossref]
- Li, T Wang, P Guo, W Huang, X Tian, X, et al(2019) Natural Berberine-Based Chinese Herb Medicine Assembled Nanostructures with Modified Antibacterial ACS Nano 13(6)
- Zhang, Y.L Wang, Y.L Yan, K Deng, Q.Q Li, F.Z, et al. (2023) Nanostructures in Chinese herbal medicines (CHMs) for potential therapy. Nanoscale Horiz 8(8). [crossref]
- Wei, D Yang, H Zhang, Y Zhang, X Wang, J, et (2022) Nano-traditional Chinese medicine: a promising strategy and its recent advances. J Mater Chem 10(6). [crossref]
- Leclerc, M Dudonne, S Calon, F (2021) Can Natural Products Exert Neuroprotection without Crossing the Blood-Brain Barrier? Int J Mol Sci 22(7). [crossref]
- Fakhri, S Yarmohammadi, A Yarmohammadi, M Farzaei, H Echeverria, J. (2021) Marine Natural Products: Promising Candidates in the Modulation of Gut-Brain Axis towards Neuroprotection. Mar Drugs 19(3). [crossref]
- Chen, Y Zhao, S Jiao, D Yao, B Yang, S, et (2021) Astaxanthin Alleviates Ochratoxin A-Induced Cecum Injury and Inflammation in Mice by Regulating the Diversity of Cecal Microbiota and TLR4/MyD88/NF-kappaB Signaling Pathway. Oxid Med Cell Longev 2021, 8894491. [crossref]
- Liu, F Smith, A.D Solano-Aguilar, G Wang, T Pham, Q, et al. (2020) Mechanistic insights into the attenuation of intestinal inflammation and modulation of the gut microbiome by krill oil using in vitro and in vivo models. Microbiome 8(1). [crossref]