Abstract
The coastal natural ecosystem is the world’s most sensitive, threatened, and populated environmental system. Economic valuation of coastal ecosystems helps identify this complexity and justify conservation efforts that could divert the local attention of people for sustainable coastal management. The abundance of the quality of the coastal ecosystem affects the marine biological process, both primary and secondary production requirements that support the needs of humans. However, there are no prices for environmental resources to be valued and undervalued, as there is no price to appreciate the actual monetary value. Since the importance of coastal resources is undermined due to their undervaluation, valuation can help develop our knowledge of the true value of ecosystems. However, the Sri Lankan conservation planning process still needs to consider determining the economic value of coastal ecosystem conservation. Therefore, this study aims to estimate the monetary value of protecting coastal areas in Sri Lanka using the willingness to pay (WTP) approach. Further, it identifies attributes and measurable variables that reflect the economic value of conserved coastal areas by evaluating public preference over possible cases. The selected case study is the Mirissa coast from the southern coastal belt, enticing high tourism attractions. The Choice Experiment (CE) method determines the study’s primary objective. First, a questionnaire survey was used to collect data under a random sampling method with a sample size of around 250 using a face-to-face interview method. Then, researchers analyzed the data by using the Conditional Logit Model (CLM). According to the results, public preferences ranked three variables at the top: “All known coral reef conservation, WTP SLR500, and creating more opportunities for locals.” In addition, all the parameter variables used in the study were significant at α <0.01 level. Finally, the study has generated vital information about the values placed on different ranges of conservation of coastal resources and the tradeoffs by respondents.
Keywords
Coastal ecosystem, Conservation, Local economy, Tradeoff, Economic valuation
Introduction
Sri Lanka is rich with a valuable coastal belt of 1585 km, encircling the country with uncountable coastal natural resources. Generally, the coastal areas are low-lying landscapes with different geographical features like estuaries and lagoons. The total area of 126989 hectares (ha) includes 6,083 ha of mangroves, 68,000 ha of corals, and 15,576 ha of bays, dunes, and coastal marshes. The country’s coastal environment is beautiful and consists of rich biodiversity and different kinds of natural resources [1]. The main occupation of the coastal area is the tourism industry, as highly demanding leisure destinations are available around Sri Lanka. Coastal tourism empowers economic benefits to both local and national economies. Moreover, 80% of tourism infrastructure is based in coastal areas [2]. The increment of the coastal human population, poor environmental planning, and lack of consideration of social and ecological issues have manipulated the degradation of the coastal environment. Inland development has been related closely to the maritime activities of the country. Hence, coastal ecosystems are the most populated landscape threatened in Sri Lanka, like the situation worldwide. All people living in coastal areas would most likely be affected by the conservation or conversion of the land for development [3]. Open access areas such as coastal zones are continuously exploited for economic purposes, instigating the extinction of valuable species. The need to manage coastal problems came into practice in the 1920s; however, the effort in the field appeared sometime later. Coastal erosion problems are mainly due to the need for a better understanding of conservation values, ensuing vast destruction in the Sri Lankan coastline [4]. The relevant authorities need more capacity and efficiency in managing and maintaining the coastal resources. Moreover, public participation is significant in overcoming the situation as they are directly involved in the coastal natural resource conservation program. Thus, general users are more responsible for conservational coastal natural resource programs.
Moreover, this will be a good start for conserving and managing resources and saving for the future. Countries are practicing the willingness to pay (WTP) approach to determine user satisfaction with natural resources based on their happiness and perception of future conservation and management. However, only a few economic valuation studies on coastal resources in the Sri Lankan context are found in the literature review. Investigating stakeholder preferences spatially for conservation and development in unprotected wetland areas was conducted using the WTP and Analytical Hierarchy Process (AHP) techniques in Sri Lanka [5]. Economic valuation on coastal ecosystems will be a significant advantage for cost-effective designations to manage sustainable ecosystems. Some studies focus on the coastal belt of Sri Lanka and its valuable natural resources. However, most studies have been carried out to address the impacts of coastal pollution, coastal conservation, and coastal area management. There are even studies related to coastal protection in the literature. However, studies on the total economic value (TEV) of the welfare of” ‘use’ and ‘non-use’ values and conservation of coastal areas are minimal [3]. The research of this paper focuses on two main aspects. First, to identify attributes and measurable variables that reflect the economic value of conserved coastal areas. Second, to estimate the monetary value of conserving coastal regions of Sri Lanka using CE.
Materials and Methods
Coastal Management Methods
The country’s coastal management was initiated in the 1920s, focusing on engineering solutions for coastal erosion. In 1963, a comprehensive approach was required to manage coastal resources. Due to that, the Colombo Commission established a coastal protection unit. Under the Ministry of Fisheries, the Coast Conservation Division was established in 1978 and upgraded in 1984 as a department. The Coastal Conservation Act No. 57 of 1981 was enacted in 1981 and came into operation in 1983. The main legal document that frames the coastal zone activities is the Coast Conservation Act of 1981 and its 1988 amendment. Since 1930, the theme of social justification for projects has evolved. For example, the Flood Control Act of 1936 mentioned federal participation in controlling the flood hazard if the benefits of these projects exceeded the estimated costs. Managing coastal resources is essential to planning and developing a sustainable economy. Only a few advanced types of research were carried out in the Sri Lankan context to estimate coastal area management and conservation to achieve sustainable development. However, numerous types of research are available worldwide that analyze the public perception and apply it to coastline conservation. Many countries that own coastal resources are making decisions to conserve coastal areas against development activities. However, some small groups engage in activities that affect the coastal areas. Coastal protection methods such as conservation can ensure human health, protection, and improvements of renewable resources such as fisheries [6], mangroves, and coral reefs. As an island country, Sri Lanka also practices coastal conservation and preservation strategies to a certain extent. The environmental movement of the late 1960s talked about pollution control and highlighted the role of WTP for this purpose.
Environmental Valuation
Researchers believe there is an unpredictable value for unassessed coastal habitats due to the need for more prices in natural resources. However, using the WTP approach, it is possible to value it using the concept of maximum utility. Economists use environmental valuation techniques to appreciate natural resources and resource services as market and non-market goods. The term “value” is a precise term used to express the idea that a consumer’s highest price is WTP to obtain a good/service. Simply, it is about how much the user values the good/service. This value varies from person to person and good to good. Supply and demand concepts in Economics help estimate the WTP to obtain goods/services. Regarding the coastal context, the term valuing differs due to their interests. According to ecologists, the salt marsh value will be the significance of the marsh as a reproductive good/service to certain kinds of fish species. However, only some users look at that from this view. The economic value measures the maximum amount an individual is WTP for a good/service. The welfare measurement is expressed formally with the concept of WTP. Further, suppose a value loss occurs in a degraded environment of pollution. In that case, that lost amount is the maximum amount an individual is willing to accept (WTA) to compensate for pollution. In economic valuation, one can identify characteristics like money used as a unit of account. This value is relative because it measures tradeoffs of goods/services that have a value if people directly or indirectly value them. Otherwise, there is no value, and when determining values for the whole society, value aggregates from individual values [4].
Random Utility Theory
Utility theory, the random utility theory, and the theory of value are the main relevant theories for valuing coastal ecosystems. The basic meaning of the word “utility” can be assumed as satisfaction. In general, people make decisions based on their satisfaction. The four types of economic utilities are form, place, time, and possession. This theory says people choose WTP based on income, wealth, status, and mindset [7]. Random utility theory is used to derive behavioral models which must be obtained from the choice dimension. The rational behavior of humans and maximization of the utility relative to personal choice is the primary assumption when considering the approach to this theory. For example, there is a tendency of human behavior that, in most cases, each choice uses available alternatives [8]. The theory of value describes that desire and utility are not the only things when making decisions. Attributes or the characteristics of the good/service matter. Several approaches to this concept examine why, how, and to what extent people value things [7]. The CE method used in this research is a method that asks individuals to prefer their alternative among several available options to appreciate the natural resources.
The Choice Experiment Method
CE method is an application of the theory of value combined with random utility theory. This method estimates attributes’ economic values by measuring people’s WTP to achieve improvements or changes suggested by each option (attribute) [10]. Several methods for estimating CE parameters, such as Logit and Probit, were identified. The Multinomial Logit Model (MLM) is widely used for three or more choice categories in a problem and the respondents’ socio-economic characteristics. The Conditional Logit Model (CLM) is also a suitable method that extends the MLM. Moreover, the CLM is the most appropriate method when choosing the alternatives considered in the modeling process. Hence, the CLM procedure is used as the modeling method for this research. The choice among selected alternatives is a function of the other options in this research. The characteristics of respondents who are making a choice [11] are less likely essential to achieve the objectives of this research. This procedure estimates the Maximum Likelihood by “running” Cox regression” of SPSS.
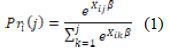
According to the above equation, CLM estimates that an individual i chooses alternative j as a function of the attributes varying for the alternatives and unknown parameters [12]. Therefore, in CLM, Xij is used as a vector of attributes site j and individual i, with the probability that individual i chooses alternative j.
Choice Questionnaire Survey
Southern coastal areas of Sri Lanka have the highest tourism attraction; consequently, the Mirissa coastline is the location for the survey. This area is one of the coastal areas with the highest mean coral cover of 23.97%. The other most significant feature of the area is that the highest live coral is available in the same area, which should be conserved and protected. Southern coastal belts, including Mirissa, Weligama, Polhena, Hikkaduwa, and Rumassala, show high BOD levels (average=3.98mg). When considering the protection of the ecosystem, the case study area is worthy as it has evidence of the threat of human activities. Destructive fishing activities are mainly high within the region, threatening the coastal area’s natural resources. However, the high tourist arrival rate is on record during the year. Therefore, this study focuses on Mirissa’s natural coastal resources to preserve the ecosystem. Attribute selection of the study mainly focused on what is relevant to the respondent group and the policy context of respondents. Furthermore, selecting attributes wants to occur from end-user perspectives, which means the population of interest is the decision-makers [13]. Further, the selection of attributes uses three steps. First, it identified essential attributes that reveal the good or service. Second, it determined a suitable framework for the attributes and finally identified levels for each attribute (Table 1).
Table 1: Selected attributes and the levels
|
Attributes |
Level 1 (Status quo) | Level 2 | Level 3 |
|
Environmental strategy to protect coral reefs |
Identified coral reef conservation | All known coral reef conservation |
All known and unknown coral reef conservation |
| Local economy enhancement | Benefits captured by well-established businesses | Encourage small-scale local businesses which reflect the Sri Lankan culture |
Creating more opportunities for locals to establish with high-income generations |
|
Management and preservation payment |
No payment
SLR0 |
SLR500 |
SLR1000 |
Levels and attributes were from the information collected in the literature and discussions with experts, stakeholders, practitioners, and university professionals. The following are the basic descriptions of each attribute and level.
First, the attribute selected considers the environmental strategy to protect coral reefs. Corals can be identified as susceptible living species adapting to changes in marine ecosystems. The corals are especially vulnerable to physical damage like pressure on ornamental fishing, deep-sea fishing, trawling for fishing, Moxy nets, and iron rods. The rapid growth of calcareous Halimeda sp. and Caulerpa sp. has been identified as a leading primary threat to the area’s corals [14]. At the status quo (current stage), steps are used to develop the conservation of the identified coral reefs, but the threat continues to grow. Therefore, level 2 uses level 1 plus the preservation of all known coral reefs and level 3, which is the level 2 + conservation of all unknown coral reefs’ environment for the future. The second attribute is the enhancement of the local economy in the area. It developed the Southern coastal line by expanding the tourism industry. Further, the contribution of the fishery industry was a substantial income generation source for the area. On the contrary, modern fishery practices and tourism threaten natural coastal ecosystems. The benefits of these activities are primarily obtained by well-established businessmen, leaving poor local people aside. This attribute encourages micro, small, and medium entrepreneurs (MSMEs) to boost their rural economies. This development will be a strategy for attracting local tourism and fisheries to promote the conservation of natural resources. Thus, levels 1 and 2 create more opportunities for locals to establish higher income generation potential and promote coastal protection.
Management and preservation payment is the third attribute used in the choice set. Competition for limited resources has intensified with human population growth in coastal regions and the diversion of coastal areas, including wetlands, for economic activities experienced globally [15]. The coastal areas are open access spaces, and free accessibility to public common spaces and resources makes excessive exploitations. To estimate the damage, there are no market prices for many characteristics in coastal natural areas. This study will evaluate the economic value of the coastal natural ecosystem based on the general public’s perception, including all stakeholders. These hypothetical payments are no payment, SLR0 (status quo), SLR500, and SLR1000. An experimental design can identify attributes and all levels as a choice set in the choice experiment study. For example, considering three attributes and three levels makes the total combination of 33 = 27; however, it is difficult to show all 27 combinations in a questionnaire. Therefore, 27 combinations have been reduced to 9 using the orthogonal procedure for convenience in field data collection. An orthogonal design stores the information in a data file. However, this active dataset is optional before running to generate an orthogonal design procedure. However, this procedure allows the researcher to create an active dataset that generates variable names, variable labels, and value labels from the options shown in the dialog boxes. The researcher can replace or save the orthogonal design as a separate data file if an active dataset is available. Thus, the initial step of a choice experiment creates the combinations of attributes and levels presented as product profiles to the subjects in the field. Moreover, even a few attributes and a few levels for each attribute will lead to an unmanageable number of potential product profiles. As such, the researcher needs to generate a representative subset known as an orthogonal array.
Respondents in the field choose 1 out of 9 shown to them. However, the probability can be estimated for all 27 combinations in the modeling stage. It is better to use fractional factorial design than complete factorial design in deriving alternatives of choice set due to its complexity. A full factorial design consists of combinations of all attributes and their levels. When combinations become too large, fractional factorial design will usually be used. This procedure is known as a total design sample that allows for estimating all the effects of interest. The fractional factorial design can be orthogonal, indicating no correlation between attribute levels [16]. Orthogonality estimates the correlation between two attributes. If it is 0 or less, then that is called orthogonal. An orthogonal plan then selects random pairing alternatives. After finalizing the other options, it can develop scenarios, create a choice card, and use it in the CE method. The questionnaire develops under crucial sectors, and the introduction consists of what, why, how, and who does this investigation. The questionnaire to gather ‘individual’ preferences consists of questions about public perception of coastal ecosystem conservation. Choice cards experiment with examples to introduce the task clearly to the respondents. A clear presentation is essential in the field to get complete answers. Socio-economic and demographic data interpretation and validation require data such as age, gender, household income, and education level of respondents.
Sample Selection
Simple random samples are a commonly applied sampling technique in CE studies [17]. This study mainly uses convenient sampling, replicating the simple random sampling method. The sample includes all users/visitors of the coastal natural areas within the selected case study area. With a 90% (1.65) confidence level, we set the n=250 sample. This sample only considers people between the ages of 18 and 65. The questionnaire survey was a face-to-face interview since it secured a higher rate of responses. When creating the choice card, all coded data consists of 0 or 1. All other data were entered as continuous data or as 0 or 1. The output combines the information about attributes levels chosen, not chosen, and the respondent’s socio-demographic data. In choice selection, level 1 (status quo) was constant as a base for other choice selections.
Results
Socio-Economic Characteristics
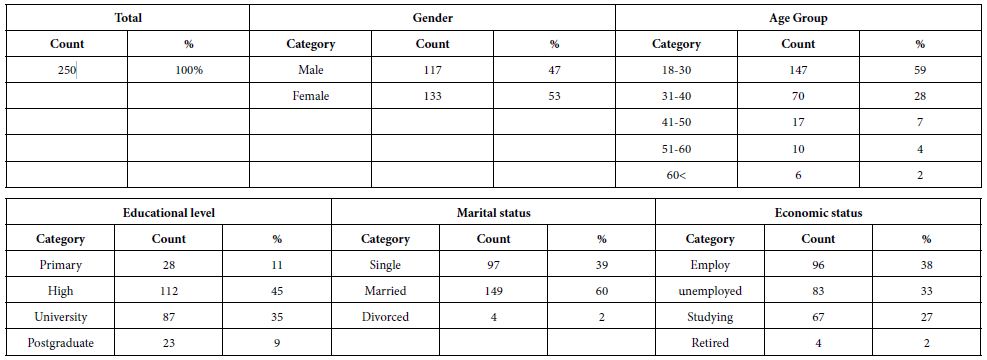
The socio-economic characteristics of the respondents are presented in Table 2. The gender balance is almost equal in the sample, with the highest percentage of the younger and active generation aged 18-40. The educational category of the highly educated group, “high to postgraduate qualification,” consists of 45%. Sixty percent of the sample in the group are married. At the same time, unemployed people are about 33%.
Table 2: Socio-economic characteristics of the respondents
Estimation of Conditional Logit Model
We used the choice experiment procedure to estimate the economic value by ‘individuals’ preferences over a set of attributes. Respondents compared nine choice alternatives differing in terms of levels and attributes. CE results are generated from the survey using a choice card analyzed by CLM, and this sub-section presents the results of CE. In addition, the importance of the selected attributes is explored using Cox regression of continuous-time survival data in SPSS software. This procedure uses the partial likelihood method in SPSS, which helps match the choice CLM to the data set. The Likelihood ratio, Score, and Wald tests use Chi-squares (χ2) analysis to estimate the model parameter. As shown in Table 3, χ2 data for Likelihood ratio, Score, and Wald statistics indicate that the model is highly significant. The model test value for each test is 0.0001, smaller than 1% (α = 0.01), i.e., 0.0001<0.01; thus, all three tests confirm that the model is significant at α = 0.01 probability level. These results demonstrate a powerful interrelationship between the attributes and the Choice. The likelihood ratio test (Chi-square) rejects the null hypothesis of no relationship between attributes and the Choice at the significant level of α = 0.01.
Table 3: Model test statistics (global H0: β = 0)
|
Test |
χ2 |
DF |
Pr>χ2 |
| Likelihood ratio |
233.697 |
6 |
0.0001 |
| Score |
388.343 |
6 |
0.0001 |
|
Wald |
388.343 |
6 |
0.0001 |
Estimating the parameter values of the maximum likelihood is vital in modeling choices. Table 4 shows parameter values for identified attributes and levels are statistically significant at α = 0.01 level as 0.000<0.01. For the entire model, the significant value, α < 0.01, indicates that the whole model is perfectly significant at a 1% level. The estimated model parameters for variables displaying zero coefficients indicate the status quo level (reference level). Coefficients for the other six levels have recorded values relative to the three references described above.
Table 4: Maximum likelihood estimation analysis for all respondents
|
Parameter Variable |
Estimate |
S.E. |
χ2 |
Pr>χ2 |
| Environmental strategy to protect coral reefs | ||||
| L3-All known and unknown coral reefs conservation (AKUCC) |
2.162 |
0.29 |
53.20 |
0.000 |
| L2-All known coral reef conservation (AKCC) |
2.956 |
0.31 |
92.93 |
0.000 |
| L1-Identified coral reefs conservation (Status quo) |
0 |
. | ||
| Local economy enhancement | ||||
| L3-Creating more opportunities for locals to establish with high-income generations |
3.675 |
0.42 |
76.32 |
0.000 |
| L2-Encourage small-scale local businesses which reflect the Sri Lankan culture |
3.379 |
0.44 |
59.40 |
0.000 |
| L1-Benefits capturing by well-established businesses (Status quo) |
0 |
|||
| Management and preservation payment | ||||
| L3-SLR1000 |
1.595 |
0.25 |
41.06 |
0.000 |
| L2-SLR500 |
2.147 |
0.27 |
62.64 |
0.000 |
| L1-SLR0 (Status quo), No payment currently |
0 |
|||
Factors Affecting Conservation and Economic Activities
The first attribute tested is “environmental strategy to protect coral reefs.” The estimated coefficient of the first attribute, L1, is zero, as this is the status quo or reference level. It represents the current status of the resource. The part-worth utility (estimated coefficient) for “all known coral reef conservation” (AKCC) L2 is +2.956, which shows as the highest coefficient. “All known and unknown coral reef conservation” (AKUCC), L3 is +2.162, which indicates the second-highest part-worth utility component. The study area is highly known for coral reef-based tourism and is widely used for research. The unknown coral area may be a fantasy for the general public, hence a low preference for unexplored reef areas. Both L1 and L2 variables in attribute one are significant at α = 0.01, (1%) level, as Pr > χ2 value 0.000<0.01. The following attribute tested in this model was “local economy enhancement.” Benefits captured by well-established businesses (L1) is the current situation (status quo) in coral reef areas, which is structured zero. The part-worth utility for the variable (L2) “encourage small scale local businesses which reflect the Sri Lankan culture” is +3.379, while the part-worth utility (L3) is +3.675. Accordingly, L2 prefers over status quo (L1), while L3 prefers L1 and L2. Creating more opportunities for locals to establish with high-income generations from coral reefs is preferred over L2 and L1, which means L3 becomes the preferable level of the second attribute. This preference reveals the sustainable development of coral reefs by encouraging conservation and uplifting the local economy through the first two attributes. Further, all the variables in attribute two are significant at α = 0.01 (1%) as 0.00<0.01; parameter values tested under this attribute are highly significant. The third attribute tested under the model is “WTP” (Management and preservation payment). This WTP value contributes monthly from people towards the management and conservation cost for the coastal resources. The status quo remains the “SLR 0” (No payment). The SLR500 (L1) is highly favorable +2.147 over the status quo (No payment) and SLR1000. The estimated parameter for SLR1000 is +1.595, which is less favorable for SLR1000. Two parameters, L1 and L2, tested under this attribute, are also perfectly significant as Pr > χ2 values. Both are significant at α = 0.01 or 1% level. Thus, all the selected attributes considered to obtain the maximum utility from the conservation, management, and preservation of coastal natural resources are estimated to be crucial in the choices preferred by people.
‘Users’ Perception of Conservation and Economic Enhancement
Users’ perceptions of conservation and economic enhancement in coastal areas can be used to validate CE results. According to average public perception, more conserved coastal areas strongly agree with all the factors. The following have recorded more than 50% responses for the “strongly agree” category among the perceptions. They enjoy many things, including natural beauty, feeling fresh sea air, waves, and sunshine cures. Further, people felt relaxed (mind and body), gathered with friends/family, escaped the stress/pressure of work, and enhanced the local economy. However, more than 30% of the share agreed on category responses of enjoying fresh sea air and waves and sunshine cures, exercise, and leisure walks. Gathering with friends/family, being alone, and making seafood safer have also been recorded. Exercise, leisure walks, and meeting new people are neutral to more than 30% of respondents, and other categories are less than 30%. The importance of improving selected features in the case study area is displayed in Figure 1. On average, the public has a more significant percentage of enhancing the features chosen in the case study area under “significant” categories. Except for the increase of neighborhood property value near 40% of responses, all other responses have more than 40% of public responses. The most critical features under the category of “extremely important” were saving the natural resources for the future, reducing the pollution of the natural environment, and protecting the flora and fauna species in the coastal area.
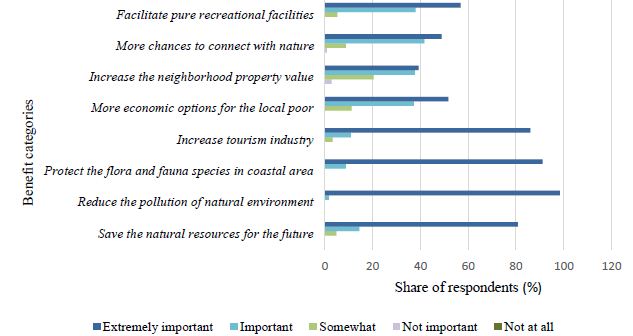
Figure 1: Public perceptions of ranking the conservation of coastal areas
The data regarding the “problems faced by people in coastal areas relative to the case study area” might provide essential facts in the future management of these areas. The categories of strongly disagree and disagree responses are less than 5% and 15%, respectively, for all problems suggested in this study. More than 50% of the respondents strongly agree with the existing problem of improper garbage disposal. Further, more than 25% of respondents strongly agree with inadequate parking areas, unclean environment, and poor sanitary facilities. More than 25% agree with deficient parking areas, messy environment safety issues (nearly 60% responses), insufficient clean facilities (more than 40%), and improper garbage disposal. Responses have recorded the neutral category (more than 20%) for all mentioned problems in the case study area, except improper garbage disposal (less than 10%) (Figure 2).
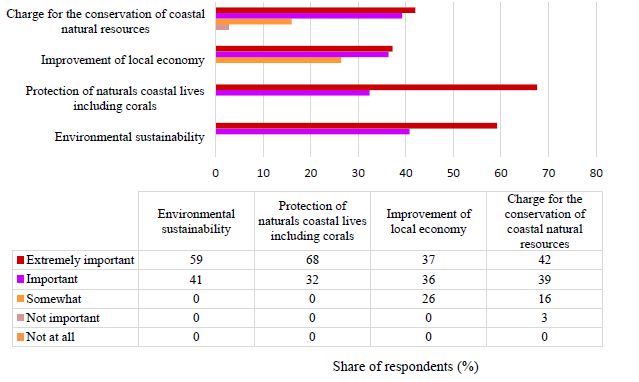
Figure 2: Public perception of selected attributes
Public perception related to selected attributes in coastal conservation is displayed in Figure 2. Environmental sustainability and protection of natural coastal lives, including corals, have recorded the highest percentage of responses under significant sections and no answers for categories of somewhat, not significant, or not at all. These facts validate the CE results. For example, the “environmental sustainability and protection of natural coastal lives” has the highest percentage of ‘respondents’ share. Further, their parameter used in CE under (“AKCC” and “AKUCC”) have estimated the highest coefficients respectively, +2.956, which has the highest recorded coefficient, and +2.162 as the second-highest part-worth utility. Further, improvement of the local economy has a share of responses of 37% of the sample. Regarding conserving coastal natural resources, 42% of respondents share the “extremely important” category. Environmental sustainability was rated “extremely important” by 59%, while “protecting natural coastal life, including corals,” was rated 68%. More than a 30% share of responses to all the factors for the “important” type.s Only 3% of responses have been recorded as not crucial for the attribute charge for conserving coastal natural resources/WTP. In comparison, 42% agreed with choosing extremely important, and 39% agreed with choosing “important” categories. This result ratifies the CE results.
Probability for Conservation and Local Economy Enhancement
A probability test can be defined as the level of marginal significance within a statistical test representing the probability of the occurrence of a given event. The parameters shown in Table 4 are used to estimate the probability associated with the nine alternatives of the study. The ranking of the variables suggests that the best three preferences are AKCC with 22.1% preference, WTP500 with 19.7% preference, and creating more opportunities for locals (CMOFL) with 18.8% preference, respectively. However, the results show the importance of each variable based on respondent preference when considering 27 individual variables (Figure 3).
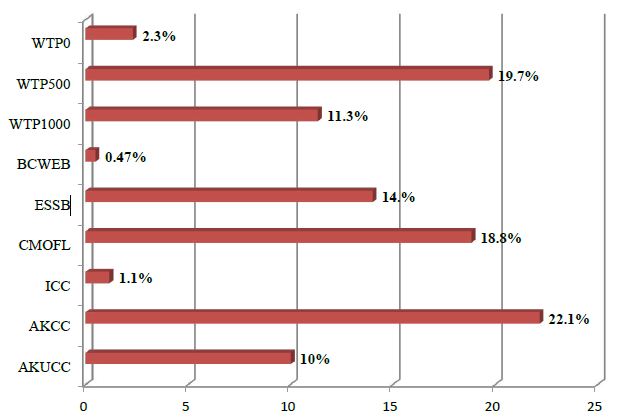
Figure 3: Probability associated with each variable
Discussion
Southern coral reefs have been facing high degradation issues, and human activities have accelerated it drastically. The area has a high demand for coastal recreational and other uses from local and foreign tourists and natural hazards (MMDE, 2016). Local people should determine the conservation of coastal areas for future generations or covert for local area enhancement. In a democratic society, it can be decided by quantifying public preferences. In Figure 1, more than 80% of people identified these areas as extremely important in a) reducing pollution, b) protecting flora and fauna, c) increasing tourism, and d) saving natural resources for the future. This result is a clear signal for coastal area conservation and local area enhancement through ecotourism. The perception reported in Figure 2 also confirmed a similar trend. The preservation of all known corals (AKCC) with the highest probability value of 22.1% in Figure 3 indicates that stakeholders’ highest preference is conservation. Among the Southern coastal areas, Mirissa has the highest tourism attraction. It is one of the coastal areas with the highest mean coral cover of 23.97% [18]. The most significant feature is that the highest live coral is available in the same area, which should be protected at any cost. This result should be an essential aspect of future management and policymaking on coastal conservation. Furthermore, these results can be replicated elsewhere in estimating the monetary value of preserving coastal resources that deliver the best public utility using benefit transfer methods. The significant result of this research is not only about the natural capital in the case study area but also provides public utility in terms of economic value. For example, these results further describe complementary human-made capital like “local economy enhancement” related activities that can create additional economic outputs for the area. This study has represented the importance of conserving coastal natural resources and some identifiable essential policy implications.
First, selected attributes of CE, the results will enhance the ‘users’ experiences with estimated monetary value (WTP) for each alternative combination (Table 4). The identified range of alternatives and levels of choices, some potential options can create more economic benefits for the area by maximizing public welfare. For example, there are fewer alternative services/facilities in the current situation. However, they can enhance and contribute to the quality of public life in the coastal areas in many ways. These include creating more business opportunities for locals, encouraging small-scale local businesses, and environmental strategies, including coral conservation, to have high tourism attractions. CE results have recorded that all the alternatives combined with those services/facilities are significant. Further, investment options under the attributes of “local economy enhancement” and “environmental strategy to protect coral reefs” will improve the economic benefits by enhancing the quality of livelihood. Local financial improvement will automatically enhance participation in economic activities in the investment as mentioned earlier options. Secondly, the investment in conserving coastal public open spaces in terms of “environmental strategy to protect coral reefs” and related activities can add value to the cultural ecosystem services-based benefits. As the results revealed, the most preferred variables estimated by the model are AKCC (all-known coral conservation) and CMOFL (creating more opportunities for locals) with a WTP of SLR500. Choosing this alternative over the other 24 variables, even having SLR0 WTP (No payment), is a remarkable finding deeply considered in policy implications. The third aspect is policy implications derived from this research and concentrating on using public funds to conserve coastal resources. General preference for an attribute can be identified as helpful information on how funds should be invested with more advantages. The study results have shown that the public has agreed with WTP over the status quo scenario. The second most preferred variable that resulted from the model is the WTP of SLR500. The results of the public attitude examination reveal that the public has agreed with the “charge for the conservation of coastal natural resources.” Further, the results highlighted some problems the public faces in the existing situation and the fewer chances to experience what the public is looking for from coastal public open spaces. This fact proves why the public rejects the current condition of the selected area as a case study compared to the other alternatives shown in the choice card with price package (WTP).
Results reveal that “environmental strategy to protect coral reef” related activities will firstly append economic value to coastal conservation. The first recorded probability among the 27 variables is AKCC (all known coral conservation). Furthermore, the second is the WTP of SLR500, and the third is CMOFL (creating more opportunities for locals). Finally, this research has indicated vital information regarding the values of a range of conservation of coastal resources by users. For example, suppose the responsible parties of coastal public open spaces give considerable attention to valued public opinions and choices and interpret the results. In that case, how responsible parties can manage practical resource allocation decisions will be clear. Further, this research has confirmed the effectiveness of using the choice experiment method used in the study to reveal public preferences. Thus, CE can be a convenient tool to uncover public perception since it can provide in-depth information on ‘individual’ preferences. Future studies can be done with a larger respondent sample or specific visitor group to further explore this research’s findings.
Author Contributions
“Conceptualization, I.A., and P.W.; methodology, P.W.; software, P.W., and I.A.; validation, I.A., P.W., and P.B.; data; I.A.; formal analysis, I.A, and P.W.; investigation, P.W.; resources, I.A.; writing—original draft preparation, I.A., P.W.; writing—review and editing, P.W. and P.B.; visualization, I.A.; supervision, P.B., and P.W. All authors have read and agreed to the published version of the manuscript” Please turn to the CRediT taxonomy for the term explanation. Authorship must be limited to those who have contributed substantially to the work reported.
Funding
This research received no external funding.
Institutional Review Board Statement
Not applicable.
Informed Consent Statement
Not applicable.
Data Availability Statement
Sample data are available upon request.
Acknowledgments
None
Conflicts of Interest
The authors declare no conflict of interest
References
- Seneviratne C (2005) Coastal Zone Management in Sri Lanka: Current Issues and Management Strategies.
- White AT, Virginia B, Gunathilake T (1997) Using Integrated Coastal Management and Economics to conserve coastal tourism resources in Sri Lanka. Ambio 26: 335-344.
- Wattage P, Mardle S (2007) Total economic value of wetland conservation in Sri Lanka identifying use and non-use values. Wetlands Ecology and Management 16: 359-369.
- Lipton DW, Wellman K, Shleifer IC, Weiher RF (1995) Economic Valuation of Natural Resources: A Handbook for Coastal Resource Policymakers. Maryland: s.n.
- Wattage P, Simon M (2005) Stakeholder preferences towards conservation versus development for a wetland in Sri Lanka. Journal of Environmental Management 77: 122-132. [crossref]
- Lowry K, Wickramarathna H (1988) Coastal Area Management in Sri Lanka. Ocean Yearbook Online 7: 263-293.
- Navrud S, Kirsten GB (2007) Consumers’ preferences for green and brown electricity: a choice modeling approach. Revue d’économie politique 117: 795-811.
- Cassetta E, Random Utility Theory. In: Springer Optimization and Its Applications (volume 29) sl. sn. Pg: . 89-167.Christie M, et al., (2005) Valuing the diversity of biodiversity. Ecological economics, 2009, 4 October, 58(2), Pg: 304-317.
- Remoundou K, Phoebe K, Areti K, Paulo A. Nunes c, Michalis S, et al., (2009) valuation of natural marine ecosystems: an economic perspective. Environmental Science & Policy 12: 1040-1051.
- Hanley N, Wright RE, Adamowicz V (1998) Using Choice Experiments to Value the Environment. Environmental and Resource Economics, 11: 413-428.
- Wattage P, Glenn H, Mardle S, Van Rensburg T, Grehan A, et al. (2011) Economic value of conserving deep-sea corals in Irish waters: A choice experiment study on Marine Protected Areas. Fisheries Research 107: 59-67.
- McFadden D (1974) Conditional logit analysis of qualitative choice behavior. In: Zarembka, P. (Ed.), Frontier in Econometrics., Academic Press, Pg: 105-142.
- Cleland J, McCartney A (2010) Putting the Spotlight on Attribute Definition: Divergence Between Experts and the Public, l Environmental Economics Research Hub.
- Ministry of Mahaweli Development and Environment (2016) S. L., International Research Symposium Proceedings. Colombo-Sri Lanka: Sri Lanka Next-“A Blue-Green Era”, Conference and Exhibition, Pg: 88-89.
- Wattage P (2011) Valuation of ecosystem services in coastal ecosystems: Asian and European perspectives. Environment for Development, Ecosystem Services Economics, (ESE), Working Paper Series,, Paper N° 8, Division of Environmental Policy Implementation, The United Nations Environment Program.
- Hoyos D (2010) The state of the art of environmental valuation with discrete choice experiments. Ecological economics 69: 1595-1603.
- Louviere JJ, Hensher DA, Swait JD (2000) Stated choice methods: analysis and applications. s.l., Cambridge University Press.
- Anon (2019) Master plan on coast conservation & tourism development within the coastal zone from Negombo to Mirissa in Sri Lanka, s.l.: Environment, Coast Conservation, and Coastal Resource Management Department Ministry of Mahaweli Development.