Author Archives: author

Diagnosis and monitoring of Alzheimer Disease with saliva biomarker BACE1 and Preliminary study on prevention of AD with mesenchymal stem cells and their secretome

DOI: 10.31038/ASMHS.2018221

Abstract

Alzheimer’s disease (AD) is characterized by the slow decline of cognition and functional abilities over time. The diagnosis for probable and possible AD relies principally on clinical criteria. The confirmation of the disease is made post-mortem by identifying extracellular senile plaques and intraneuronal fibrillary tangles in the brains of subjects with clinically defined dementia. However, the field critically lacks validated AD specific peripheral biomarkers to support the diagnosis in living patients or for early detection of patients at risk before symptoms appear. BACE1 (Beta site amyloid precursor protein cleaving enzyme 1) cleaves Amyloid Precursor Protein (APP) at two beta sites and represents a key target enzyme in the monitoring and possible treatment of AD. The secretome of adipose derived mesenchymal stem cells contain amyloid beta degrading Neprilysin and ubiquitin carboxyl-terminal hydrolase L1 (UCH-L1), both known factors in influencing Alzheimer Disease.

In our preliminary study, we evaluated the usefulness of salivary BACE1 to determine risk to develop AD in clinically normal patients and the influence of the secretome of MSCs on BACE1 levels in saliva. A preliminary in house laboratory grading system for BACE1 content in saliva was established with high levels of salivary BACE1 present in older patients and putatively at risk to develop AD. Salivary BACE1 levels were significantly reduced in patients receiving intramuscular adipose tissue derived mesenchymal stem cell secretome.

BACE1 seems to be a useful biomarker to help diagnose AD and to monitor disease progression, and remarkable regression, when treated with stem cell secretome.

Keywords

Biomarkers, Alzheimer Disease, Mesenchymal stem cells, amyloid beta, amyloid precursor protein, amyloid plaques, BACE1, neprilysin, micro RNA, UHC-L1, disease monitoring, saliva

Introduction

Alzheimer’s disease (AD) is characterized by the slow decline of cognition and functional abilities over time. The diagnosis for probable and possible AD relies principally on clinical criteria and neuropsychological tests defined by the National Institute of Neurological Disorders and Stroke (NINDS) and the Alzheimer’s disease and Related Disorders Association (ADRDA) [1], mostly by assessment through a Mini-Mental State Examination MMSE. The confirmation of the disease is made post-mortem by identifying extracellular senile plaques and intraneuronal fibrillary tangles in the brains of subjects with clinically defined dementia. However, the field critically lacks validated AD specific peripheral biomarkers to support the diagnosis in living patients or for early detection of patients at risk before symptoms appear. Some investigators studied structural Magnetic Resonance Imaging [2] as means for in vivo confirmation, whereas others concentrate on liquid biomarkers, such as plasma amyloid beta (Aβ)-40 and 42, albeit with mixed results [3].

AD is the most common form of dementia and is pathologically characterized by amyloid plaques, neurofibrillary tangles and loss of synapses in the brain. Neurofibrillary tangles consist of hyperphosphorylated tau protein while fibrils of the amyloid beta-peptide (Ab) aggregate into amyloid plaques [4]. Smaller, oligomeric species of Ab have proven to be neurotoxic and cause synaptic dysfunction [5]. Ab is a proteolytic product of the amyloid precursor protein (APP) which is sequentially cleaved in an amyloidogenic pathway by beta- and gamma-secretases [4]. Beta- secretase cleaves APP close to the membrane, releasing a soluble APP beta-fragment (sAPPb). The remaining C-terminal fragment (APP-CTFb) can then be cleaved by gamma-secretase at different sites yielding Ab-peptides of varying length, Ab40 being the most common, while Ab42 is more toxic and prone to aggregate. If APP is cleaved in a non-amyloidogenic pathway by alpha-secretase instead of beta-secretase, a non-toxic P3 fragment will be formed after the gamma-secretase cleavage.

Beta-site APP-cleaving enzyme 1 (BACE1), the beta-secretase in vivo, has been identified as a 501- amino acid residue single transmembrane aspartyl protease [6]. BACE1 cleaves APP at two beta sites and produces the C-terminal fragments (CTF) C99 and C89 [7]. C99 is subsequently cleaved by presenilin (PS)-dependent gamma-secretase complex to release Ab fragments. BACE1 therefore represents a key target enzyme in the monitoring and possible treatment of AD. However, over the last decade, it has become clear that BACE1 proteolytically cleaves a number of substrates in addition to APP. When experimenting with total knock out BACE1 mice, the extreme reduction or total absence of BACE1 led to neurological dysfunctions [8]. Protocols using mesenchymal stem cells and/or their cell-free secretions (secretome) did not show these disadvantages, as, although many active ingredients are present and have shown to be beneficial, the concentration of these ingredients, the diverse mode of actions (i.e. anti-inflammatory molecules, content of alpha secretase neprilysin (NEP), antioxidants and ubiquitin carboxyl-terminal hydrolase L1) and long term but temporary cellular activation via microRNA prevent drastic changes. That being said, the content of amyloid beta degrading NEP and ubiquitin carboxyl-terminal hydrolase L1 (UCH-L1) in the secretome of mesenchymal stem cells (MSCs), have been investigated in some detail in preclinical in vitro and in vivo studies [9]. Also, on the production side of the secretome, both ingredients can be augmented through GMP compatible manufacturing processes. UCH-L1 accelerates BACE1 degradation and affects APP processing and Ab production [10].

In our preliminary study, we evaluated a) the usefulness of salivary BACE1 to determine risk to develop AD in clinically normal patients and b) the influence of the secretome of MSCs on BACE1 levels in saliva.

Methods and Material

MSCs and secretome

Mesenchymal stem cells were isolated from subcutaneous adipose tissue which had been harvested by mini liposuction under local anaesthesia from two healthy patients, undergoing this process for unrelated reasons. After digestion with collagenase, stem cells were isolated in culture flasks using a proprietary animal free stem cell attachment media. Cultivation of stem cells was done using a proprietary animal free stem cell growth media with minimal expansion after 1 passage to 3 million cells. Cells were identified by microscopy and with help of a CD marker panel (Abcam). Secretome was produced from these 3 million cells and analyzed for content in cytokines, neprilysin, micro and messenger RNA.

Salivary samples

Salivary samples of 8 Patients were taken first thing in the morning, at lunchtime and evening before eating and drinking. Sample size was approximately 1 ml. 200 ul were mixed with same amount of protease inhibitor (Protease Inhibitor Cocktail, Sigma Aldrich, Switzerland). Samples with and without protease inhibition were either frozen immediately or left for 48 and 72 hours at room temperature before freezing them as well at minus 20 degrees Celsius before analysing.

Salivary samples of the 2 Patients receiving intramuscular injection of secretome 4 times every two to four weeks were taken one week after last injection in the morning before breaking fast and frozen without addition of protease inhibitor.

Saliva samples were not centrifuged or otherwise processed.

ELISA

Human Beta site APP cleaving enzyme 1 sandwich ELISA kit (Sun Long Biotech, China) was used. 10 ul salivary samples and diluted salivary samples (1: 1 with protease inhibitor) were processed according to standard procedure, measured at 450 OD and BACE 1 concentration in pg/ml calculated with the help of the standard curve.

Patients

Patients were all healthy with no clinical signs of Alzheimer disease. Young patients were not showing any signs of mental deficiencies but some of the older Patients were self-assessed as having problems with concentration and memory. There were no family incidences of Alzheimer Disease.

MMSE

A German version of the mini-mental state examination was performed.

Results

Mini-Mental State Examination

MMSE was normal in all patients. However, two patients had self-assessed problems with concentration and memory, which the MMSE did not pick up.

Saliva samples

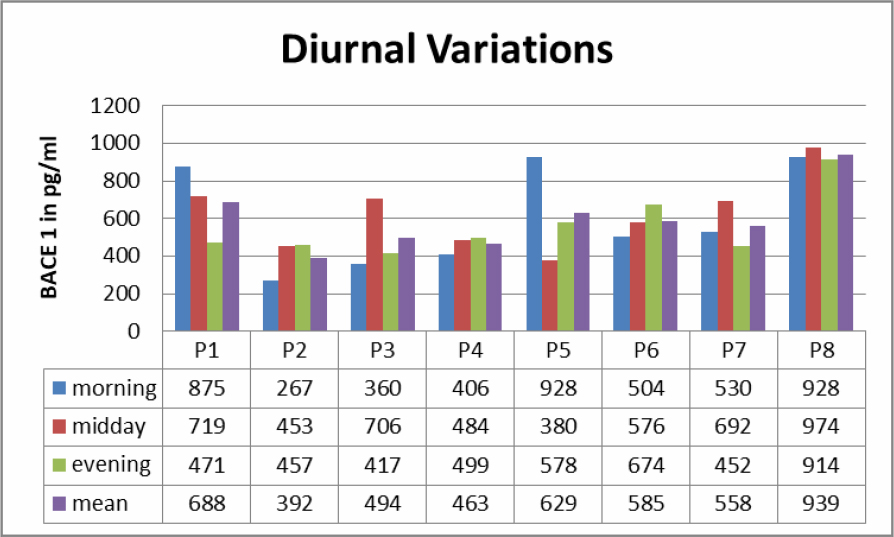
Saliva samples from morning, midday and evenings were analyzed (Table 1). In all samples BACE1 could be detected. There was no clear diurnal variation, but clear differences in samples in 7 out of 8 Patients regarding the time of sampling. Levels of BACE 1 varied from 267 pg/ml to 939 pg/ml.

Table 1. Diurnal variations to BACE 1 levels in saliva.

ASMHS-2018-103-StevenKellnerUK_F1

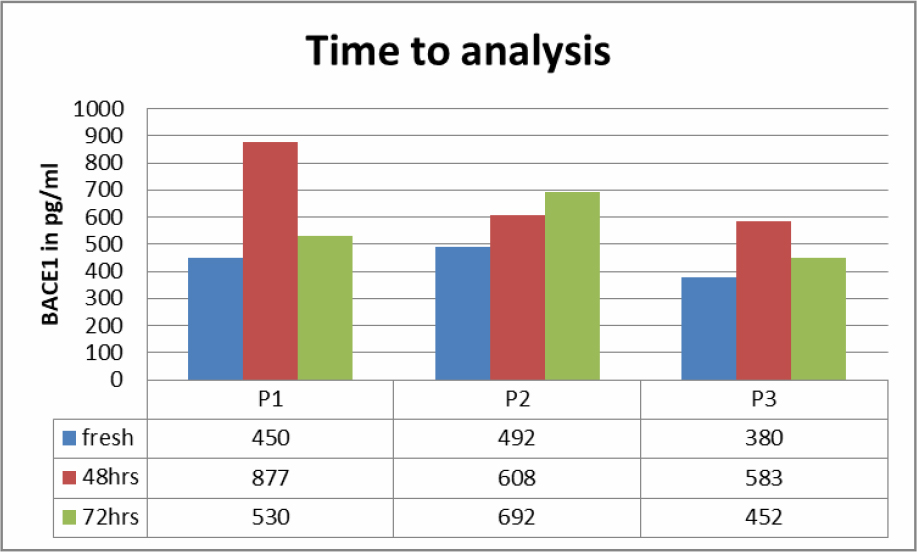
Saliva samples of three Patients were studies to see if BACE1 content at room temperature would change over 72 hours (Table 2). Fresh samples had a lower content of BACE1 then when measured after 48 respectively 72 hours.

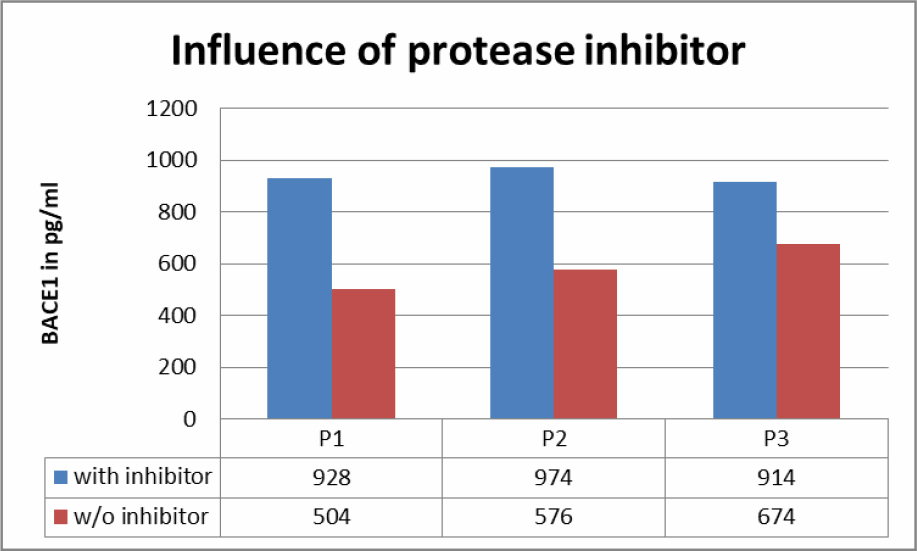
Fresh saliva samples were compared with samples stabilized with protease inhibitors (Table 3). Results showed a big difference between the two groups.

Table 2. BACE1 values in saliva according to time spent before analysis.

ASMHS-2018-103-StevenKellnerUK_F2

Table 3. Influence of protease inhibitor on BACE1 content in saliva samples.

ASMHS-2018-103-StevenKellnerUK_F3

ELISA

ELISA tests were straight forward; however the small sample size of 10 ul and the viscosity of saliva made it difficult to accurately and consistently dose the wells.

Patients

Our 8 patients were aged between 18 years of age and 62 years of age. The upper limit was meant to prevent including non-diagnosed early stages AD patients. There were 3 male and 5 female Patients. 2 patients, both female, were suspected to have a certain degree of memory problems without any influence on their MMSE.

Stem cell treatment

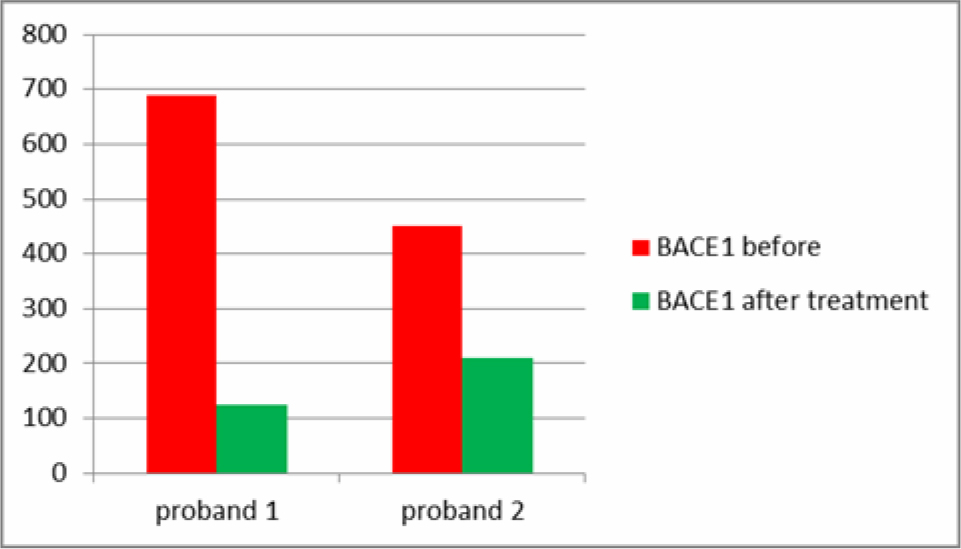
2 Patients had, unrelated to this study, treatments with the secretome of adipose derived MSCs. One female Patient was classified as at risk for AD with a higher than usual level of salivary BACE1 and beginning memory and concentration problems, the male Patient was within limits. Both showed a reduction in salivary BACE1 after treatment (Table 4). Sampling at different time during the day revealed big variations but were not consistent. It was felt that salivary samples before breakfast would reveal the most accurate values and also the highest values.

Table 4. Differences in salivary BACE1 after injections with secretome from MSCs.

ASMHS-2018-103-StevenKellnerUK_F4

Discussion

Saliva samples are easily obtained, but variation in the amount of saliva is well known, with AD patients having more saliva production then normal controls. Theoretically, the total amount of saliva production and a weight factor would be needed for accuracy. Practically, although asked to be diligent, patients had quite a few variations in the time of sampling, making this in AD patients a difficult task. Time of delay between sampling and processing the samples revealed remarkable differences. The initial idea was that BACE1 would decline with passing hours before processing, which was not proven to be true. All the tested samples showed an increase of BACE1 values in the ELISA during the delay, however not linearly. This could be due to BACE1 not being freely suspended in saliva. Studies on animals have shown that within the brain, BACE1 is enriched in synaptic vesicles [11]. Protease inhibition resulted consistently in higher levels of BACE1 being preserved in saliva. As with all tests, saliva sampling should follow a concise and practical protocol, allowing comparison within the same laboratory and patient setting. We established a protocol consisting of fasting saliva sampling before breakfast, with saliva allowed to pool in the anterior part of the mouth behind the front teeth with the mouth held open for 30 to 60 seconds. Saliva was removed with flexible plastic non sterile plastic pipettes and transferred to 1.5 ml plastic sample vials and stored on ice immediately. Vials with the saliva sample then should be frozen within 1 hour. No anti-protease was added, as early saliva samples could not be pipetted accurately due to foaming.

All salivary samples tested revealed content of BACE 1 biomarker. Content of BACE1 varied considerably during daytime and with self-sampling by the patients. In a separate study, this variability could be lessened by our sampling protocol and by doing the sampling by a nurse or technician. Contrary to blood as biomarker, saliva reacts quite closely to changes in CNS. BACE1 is certainly implicated in the AD process and thus our results with elevated BACE1 saliva levels associated with AD (separate, not published to date) and with beginning cognitive impairment in our group of patients confirm the value of saliva as biomarker as well as the connection between elevated BACE1 levels in saliva with cognitive impairment and AD. This will have to be confirmed with a bigger number of patients, but is in itself logical and plausible. Other researchers [3] have found that BACE1 levels in blood platelets are lowered (sic!) in AD patients, which does just not seem logical.

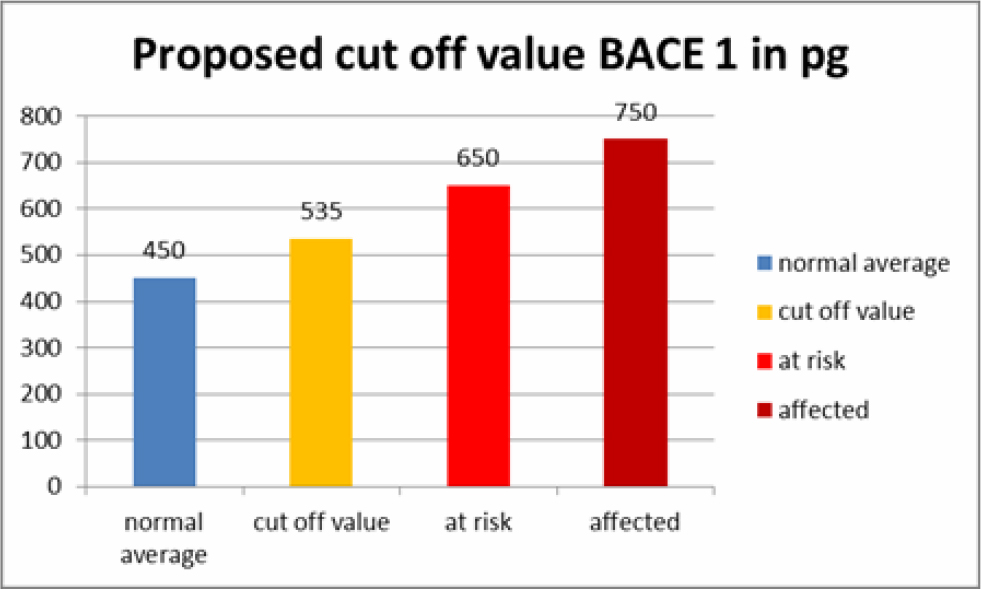
Based on these test we have set a cut off value for BACE1 saliva content in AD patients, patients at risk and normal patients (Table 5). These values should be considered laboratory specific and should be validated freshly when used in another setting. We also believe that we can predict AD or at least a higher risk to develop AD at a very early time, giving hope to prevent further accumulation of amyloid aggregates and even clear existing amyloid aggregates with stem cell therapy.

Table 5. Proposed Cut-off values for BACE1 saliva values.

ASMHS-2018-103-StevenKellnerUK_F5

Two of our patients had stem cell secretome treatments before and after saliva sampling. The secretome is a patented, cell free product generated from the active ingredients which stem cells secrete as cell to cell communication or as a result of being stressed by various degrees of hypoxia or by preconditioning of the stem cell media before the production of the secretome. The secretome can thus be adapted to different diseases, as we have shown in other studies, i.e. beneficial for cartilage regeneration or with more content of neuroregenerative substances. One of the patients was in the group of at risk patients to develop AD and one patient had normal saliva values of BACE1. They both received intramuscular secretome 4 times at intervals of 2-4 weeks. Salivary BACE1 levels sank dramatically in both patients (Table 4). This confirms the treatment potential of AD with the secretome, although it is not clear which of the ingredients play a major role in this. As a total BACE1 knockout in rodents also lead to neurological dysfunction [8], a total block of BACE1 does not seem beneficial. However, the significant lowering of BACE1 over a long period of time would at least prevent new formation of amyloid beta aggregates and give to body a chance to clear aggregated proteins via the ubiquitin protease system. UCH-L1 in the secretome not only inhibits neuritic plaque formation, but also accelerates degradation of BACE1, regulates APP and is a major component of the ubiquitin protease system [12, 13].

It is still early days, and we are expanding our stem cell preventative treatments to the treatment of clinically manifest cognitive impairment and Alzheimer disease. In a better world, prevention of diseases, be it under the heading of anti-ageing or anti-morbidity, would be the preferred method of choice. It will be interesting to see, if the regenerative capacity of mesenchymal stem cells and their secretome will be sufficient to treat AD patients in advanced stages as well. The saliva biomarker BACE1 will give us a tool to monitor disease progression or regression, before clinical signs become evident.

References

  1. McKhann GM, Knopman DS, Chertkow H, Hyman BT, Jack CR Jr, et al. (2011) The diagnosis of dementia due to Alzheimer’s disease: recommendations from the National Institute on Aging-Alzheimer’s Association workgroups on diagnostic guidelines for Alzheimer’s disease. Alzheimers Dement 7: 263-269. [Crossref]
  2. Zhou Y, Tan C, Wen D, Sun H, Han W, et al. (2016) The Biomarkers for Identifying Preclinical Alzheimer‘s Disease via Structural and Functional Magnetic. Front Aging Neurosci 8: 92. [Crossref]
  3. Koyama A, Okereke OI, Yang T, Blacker D, Selkoe DJ, et al. (2012) Plasma Amyloid-beta as a Predictor of Dementia and Cognitive Decline: A Systematic Review and Meta-analysis. Arch Neurol 69: 824–31. [Crossref]
  4. Selkoe DJ (2011) Alzheimer’s Disease. Cold Spring Harb Perspect Biol 3: a004457. [Crossref]
  5. Bayer TA, Wirths O (2010) Intracellular accumulation of amyloidBeta – a predictor for synaptic dysfunction and neuron loss in Alzheimer’s disease. Front Aging Neurosci 2: 8. [Crossref]
  6. Roberds SL, Anderson J, Basi G, Bienkowski MJ, Branstetter DG, et al. (2001) BACE knockout mice are healthy despite lacking the primary beta-secretase activity in brain: implications for Alzheimer’s disease therapeutics. Hum Mol Genet 10: 1317–1324. [Crossref]
  7. Sun X, He G, Song W (2006) BACE2, as a novel APP thetasecretase, is not responsible for the pathogenesis of Alzheimer’s disease in Down syndrome. FASEB J 20: 1369–1376. [Crossref]
  8. Munro KM, Nash A, Pigoni M, Lichtenthaler SF, Gunnersen JM (2016) Functions of the Alzheimer’s Disease Protease BACE1 at the Synapse in the Central Nervous System. J Mol Neurosci 60: 305–315. [Crossref]
  9. Devi L, Ohnu M (2015) A combination Alzheimer’s therapy targeting BACE1 and Neprilysin in 5XFAD transgenic mice. Mol Brain 8: 19. [Crossref]
  10. Zhang M, Deng Y, Luo Y, Zhang S, Zou H, et al. (2012) Control of BACE1 degradation and APP processing by ubiquitin carboxyl-terminal hydrolase L1. J Neurochem 120: 1129–1138. [Crossref]
  11. Lundgren JL, Ahmed S, Schedin-Weiss S, Gouras GK, Winblad B et al. (2015) ADAM10 and BACE1 are localized to synaptic vesicles. J Neurochem 135: 606–615. [Crossref]
  12. Tramutola A, Di Domenico F, Barone E, Perluigi M, Butterfield DA (2016) It is all about Ubiquitin: Role of altered Ubiquitin-Proteasome System and UCHL1 in Alzheimer Disease. Oxid Med Cell Longev. [Crossref]
  13. Gong B, Radulovic M, Figueiredo-Pereira ME, Cardozo C (2016) The Ubiquitin-Proteasome System: Potential Therapeutic Targets for Alzheimer Disease and Spinal Cord Injury. Front Mol Neurosci 9: 4. [Crossref]

Retrospective Study of 133 Canadian Hidradenitis Suppurativa Patients and Literature Review

DOI: 10.31038/IMROJ.2018321

Abstract

Introduction: Hidradenitis Suppurativa (HS) is a chronic inflammatory condition involving a recalcitrant course with a significant impact on quality of life. Biologics are gaining popularity as a treatment for HS management. Intralesional corticosteroid injections have been useful in treating localized inflammatory dermatoses including HS.

Methods and results: The medical charts of a community dermatology practice were reviewed for patients diagnosed with HS from January 1, 2006 to July 1, 2015. Information collected included the patients’ demographics, clinical characteristics, comorbidities, and treatments prior to and post dermatologic consultation. A total of 133 patients were identified. A female to male ratio of 3.75:1, mean age of onset of 27.0 + 12.6 years, and mean delay of diagnosis of 6.7 + 8.0 years was determined. Of these patients, 42.9% were Hurley stage I, 49.6% were Hurley stage II, and 7.5% were Hurley stage III. Tobacco exposure accounted for 49.6% of patients.  The most common HS treatments included topical antibiotics (66.9%) and systemic antibiotics (54.9%), followed by intralesional steroids (36.8%), spironolactone (18.0%), oral isotretinoin (7.5%), oral contraceptives (6.8%), and biologics (6.0%).

Conclusions: The HS prevalence and treatment application in a dermatologic practice were closely related to existing literature. Biologics are a suitable alternative for patients with moderate-to-severe HS, alone or with comorbidities. Intralesional steroids are an effective option in the treatment of localized disease in acute flares, either as monotherapy or adjuvant therapy due to their anti-inflammatory effect. Controlled randomized clinical studies are required to achieve more definitive results.

Keywords

Hidradenitis suppurativa, Hurley Stage, comorbidities, delay in diagnosis, adalimumab, intralesional corticosteroid injections

Introduction

Hidradenitis Suppurativa (HS) is a chronic, recurrent, inflammatory disease characterized by lesions affecting apocrine gland bearing skin. Patients with HS often present with comedones, inflammatory and non-inflammatory nodules, and abscesses, which can result in sinus tract formation and scarring [1]. The Hurley’s classification describes disease severity; stage I involves the abscess formation; stage II involves tract and scar tissue formation, with recurrent abscesses and single or multiple separated lesions; and stage III involves interconnected tracts and abscesses throughout an entire anatomical locations [1, 2]. HS pathogenesis remains unclear. One theory describes HS as an immune mediated disease caused by an abnormal pilosebaceous-apocrine unit, followed by follicular occlusion, perifollicular cyst formation, and finally indigenous microorganism trapping that ruptures into the dermis [3, 4]. Genetics and lifestyle are also thought to play a role in HS development and management [2-4].

Although relatively unknown among the general public, HS has an estimated prevalence ranging from 0.05-4% of the population [2, 5]. Numerous studies have demonstrated that HS has a negative impact on quality of life and sexual health when compared to other chronic skin conditions [6-8]. The location, severity, and pain associated with the disease makes patients uncomfortable and embarrassed. Despite the debilitating nature of HS, there is currently no cure and the treatment goal is to control symptoms and inflammatory manifestations. Management plans typically involve both drug intervention and lifestyle changes. In this literature and retrospective chart review, the real-world prevalence of HS characteristics and application of treatments in a dermatologic practice were described, highlighting the early use of biologics and intralesional corticosteroid injections.

Methods

There were 133 medical charts identified from a community dermatology practice in Ontario, Canada during the period of January 1, 2006 to July 1, 2015. Patients diagnosed with HS that had undergone at least one dermatologic assessment were included in the study. Information collected included patient demographics, age at onset and diagnosis, type and location of lesions, Hurley Stage, treatments prior to and following dermatologic consultation, current status, and follow-up length.

Results

Patient characteristics

Clinical characteristics of the 133-patient population are shown in Table 1. The mean age of HS onset was 27.0 + 12.6 years (range 9-62 years) and the mean delay in diagnosis was 6.7 + 8.0 years (maximum 30 years). There were 3.75 times more females than males, as 105 (78.9%) patients were female and 28 (21.1%) were male. A family history of HS was specified by only 8 (6.0%) patients. Tobacco use, including current 53 (39.8%) and former 13 (9.8%), was declared by 66 (49.6%) patients. Several comorbidities were also reported by some of our patients, as 38 (28.6%) had obesity, 15 (11.3%) diabetes mellitus, 7 (5.3%) inflammatory bowel disease (IBD), 6 (4.5%) psoriasis, 3 (2.3%) polycystic ovary syndrome (PCOS), and 3 (2.3%) spondyloarthritis.

Table 1. Characteristics and comorbidities of HS patient population.

Clinical Characteristics

n

%

Total Patients

133

Age of onset, mean + SD, y

27.0 ± 12.6

Delay of diagnosis, mean + SD, y

6.7 ± 8.0

Males

28

21.1

Females

105

78.9

Family history

8

6.0

Tobacco exposure (Previous or current)

66

49.6

Comorbidities

Obesity

38

28.6

Diabetes

15

11.3

IBD

7

5.3

Psoriasis

6

4.5

PCOS

3

2.3

Spondyloarthritis

3

2.3

Hurley stages

Hurley stage I

57

42.9

Hurley stage II

66

49.6

Hurley stage III

10

7.5

Anatomical location

Inguinal

88

66.2

Axilla

81

60.9

Lower abdomen and pubis region

34

25.6

Inframammary and intermammary

29

21.8

Thighs

24

18

Anogenital

19

14.3

Buttocks

17

12.8

Neck and scalp

4

3.0

IBD = Inflammatory Bowel Disease
PCOS = Polycystic Ovary Syndrome

Hurley stage I and II were predominant, accounting for 57 (42.9%) and 66 (49.6%) patients, respectively. Hurley Stage III was present in 10 (7.5%) patients. In terms of anatomic location, 88 (66.2%) patients had HS in the inguinal area, 81 (60.9%) axilla, 34 (25.6%) lower abdomen and pubic region, 29 (21.8%) inframammary and intermammary region, 24 (18%) thighs, 19 (14.3%) anogenital region, 17 (12.8%) buttocks, and 4 (3.0%) neck and scalp.

Treatments prior to and following dermatologic consultation

Patients used various therapies prior to and following dermatologic consultation, as shown in Table 2. Prior to dermatologic consultation, systematic antibiotics were the most common form of HS treatment accounting for 63 (47.4%) patients, followed by topical antibiotics for 33 (24.8%) patients, incision and drainage (I&D) for 24 (18.0%), surgery referral for 15 (11.3%), oral contraceptives (OCP) for 11 (8.3%), spironolactone for 5 (3.8%), oral isotretinoin for 5 (3.8%), intralesional corticosteroid (ILC) injections for 3 (2.3%), biologics for 1 (0.8%), and laser for 1 (0.8%). There was no finasteride treatment before dermatologic consultation.

Table 2. Treatments used for HS patients prior to and following dermatologist consultation.

Treatment

Pre-Consultation,

After Consultation,

n

 n

Topical antibiotics

33 (24.8%)

89 (66.9%)

Systemic Antibiotics

63 (47.4%)

73 (54.9%)

ILC

3 (2.3%)

49 (36.8%)

Spironolactone (Female only)

5 (3.8%)

24 (18.0%)

Oral isotretinoin

5 (3.8%)

10 (7.5%)

OCP (Female only)

11 (8.3%)

9 (6.8%)

Biologics

 1 (0.8%)

8 (6.0%)

Surgery referral

15 (11.3%)

8 (6.0%)

Finasteride

0

2 (1.5%)

Laser

1 (0.8%)

1 (0.8%)

I&D

24 (18.0%)

0

ILC = Intralesional Corticosteroid injections
OCP = Oral Contraceptives
I&D = Incision and Drainage

There was a shift in prescribed medications following dermatologic consultation. Topical antibiotics were prescribed to 89 (66.9%) patients and systemic antibiotics to 73 (54.9%) patients. ILC injections were administered to 49 (36.8%) patients. In addition, spironolactone use increased to 24 (18.0%) patients after dermatologic consultation, oral isotretinoin to 10 (7.5%), biologics to 8 (6.0%), finasteride to 1 (0.8%), and laser therapy use remained at 1 (0.8%) patient. OCP was used by 9 (6.8%) patients, I&D was not performed after dermatologic consultation, and 8 (6.0%) patients were referred for surgery.

Biologics

Of the 8 patients who received biologics, 5 (62.5%) patients used adalimumab, 5 (62.5%) used infliximab, and 2 (25.0%) used etanercept, as shown in Table 3. The mean months of follow up was 24.2 + 27.9 months (ongoing maximum of 73 months). Six (75.0%) patients continue ongoing biologic treatment. In addition, 6 (75%) patients receiving biologics also received ILC injections. Etanercept, prescribed for psoriasis in some patients, reduced the psoriasis symptoms but had no response for HS. Of the 5 patients who received infliximab, 4 showed HS improvement. Overall, 1 stopped infliximab due to pruritus, 1 stopped due to urticarial lesions and dyspnea, and 1 switched biologics to better manage their psoriasis and reported worsened HS while off infliximab. Of the 5 patients who received adalimumab, 4 showed HS improvement and 1 stopped due to a self-limited leg edema.

Table 3. Patients with biologic or intralesional corticosteroid injection therapy.

Therapy

n

%

Biologics

Total Patients

8

Adalimumab

5

62.5

Infliximab

5

62.5

Etanercept

2

25

Follow up in months, mean, + SD

24.2 + 27.9

Treatment ongoing

6

75

Intralesional Corticosteroid Injections (ILC)

Total patients

49

Total Injections

165

Concentration of ILC injections

2.5 mg/ml

8

12.1

3.3 mg/ml

23

34.8

5 mg/ml

29

43.9

10 mg/ml

6

9.1

Visits for ILC injections

< 2

32

65.3

3-4

9

18.4

> 5

8

16.3

Follow up in months, mean, ± SD

10.3 ± 17.6

Intralesional corticosteroid injections

Forty-nine (36.8%) patients received ILC and a total of 165 injections were administered, as shown in Table 3. The most common ILC concentration was 5 mg/mL, which was received by 29 (43.9%) patients, followed by 3.3 mg/ml by 23 (34.8%), 2.5 mg/ml by 8 (12.1%), and 10 mg/ml by 6 (9.1%) patients. There were 25 (51%) patients that received ILC injections at a single visit, 16 (32.7%) at 2 to 4 visits, and 8 (16.3%) patients at 5 or more visits. The mean months of follow up after the first ILC injection was 10.3 months + 17.6 months (ongoing maximum of 73 months).

Discussion

Patient characteristics

Age of onset and delay in diagnosis: Although HS has been reported in children, the disease typically develops after puberty [2]. Consistent with recent literature, the mean age of onset in this study was 27.0 + 12.6 years (range 9 – 62 years). Others have reported an average onset age between 20 and 24 years, with an estimation that 2.0% of HS patients develop the disease before 11 years of age [9, 10]. Early-onset HS patients have been found to have a significantly higher family history of the disease [10].

The diagnostic delay associated with HS is a well-known problem [11]. The mean delay of diagnosis in this study of 6.7 + 8.0 years (maximum of 30 years) is consistent with reports of typical HS diagnostic delays ranging from 5 to 14 years [12]. Similarly, a study with 517 HS patients from 24 different countries found a global mean delay in diagnosis of 7.2 + 8.7 years (maximum of 41 years) [11].

Female prevalence: HS is known for having a higher prevalence in females than males [2]. There was a 3.75:1 female-to-male ratio in this study. Ratios are typically reported as approximately 3.1, with some variance [2, 13, 14].  Ratios have been recorded from as low as 2:1 to as high as 5:1 in patient populations [15]. Determining prevalence can be challenging because there is a delay in diagnosis and not all HS patients seek treatment.

Family history, tobacco use and comorbidities: HS is believed to have a genetic component. Although only 8 (6.0%) of our patients self-reported a family history of HS, the nature of this retrospective study and awareness of the disease may have affected this frequency. HS family history was not routinely captured in clinic encounters. A study using questionnaires specifically inquiring about the family history of HS patients found that 38% of the participants had at least one family member affected by HS [16]. Other studies have found that approximately one-third of their patient population had a HS family history, supporting the claim that family histories are associated with earlier disease onset, longer duration, and more extensive disease [13, 17]. In addition, there has been evidence linking autosomal dominance to some HS cases [18, 19]. HS has been linked to chromosome 1p21.1-1q25.3 and γ-secretase complex mutations in some cases where the HS patients had concurrent severe acne and perifolliculitis capitis abscedens et suffodiens (dissecting cellulitis of the scalp) [20].

Although the connection between tobacco smoking and HS is not completely understood, smoking is thought to trigger disease onset and increase disease severity [2]. Similar to current literature, 66 (49.6%) patients in this study were self-proclaimed current or ex-smokers. Other studies have found higher rates of tobacco smoking patients in the range of 66-71% current and 8-15% ex-smokers [17, 21-23]. Despite the large frequency of HS patients that continue to smoke, studies have shown that smoking cessation contributed to increased incidences of self-reported HS remission [24, 25]. Patients should be reminded of the association between smoking and exacerbation of the disease.

In our study, we identified obesity, diabetes mellitus, IBD, psoriasis, PCOS, and spondyloarthritis as comorbidities in some of our patients, which has been also reported in a large retrospective study of 2292 patients [26]. HS typically associates with many concomitant and secondary diseases, contributing to disease severity [26-28].

Hurley stages and anatomical locations: The Hurley stage severity and anatomical locations of the HS lesions in this patient population were consistent with current literature for this disease [13, 17, 18, 22, 29]. The inguinal and axilla regions are the most commonly reported HS locations. Our results were similar to a large Dutch population, where 45.5% of patients had Hurley stage I, 41.5% had Hurley stage II and 13.0% had Hurley stage III [18]. Other studies have reported populations from 24.1-68.2% Hurley stage I, 27.6-53.7% Hurley stage II and 2.2%-22.2% Hurley stage III [13, 22, 29].

Treatment

HS treatment can be difficult because management must be individualized per the disease location and severity. When developing a treatment plan, the dermatologist assessed availability and accessibility of appropriate medications for each patient.  Medical treatments aim to decrease bacterial load, reduce follicular occlusion, decrease immune responses, alter hormonal balance, improve wound healing, reduce pain, and improve patient quality of life. Due to the chronic and uncontrollable nature of the disease, HS treatment goals aim to provide stability and comfort. The dermatologist initiated several treatments not previously provided by primary care, such as spironolactone, isotretinoin, ILC, and biologics. Other treatments prescribed by both primary and specialist care included topical and systemic antibiotics, OCP, surgery referrals, finasteride, I&D, and laser therapy.

Topical and systemic antibiotics: Topical and systemic antibiotics were the most commonly prescribed therapy in this study. Antibiotics, used for their anti-inflammatory effect, are often a first-line therapy for HS [2, 30]. Systemic antibiotics, in short courses, were the most commonly prescribed pre-consultation treatment. Topical antibiotics were most commonly prescribed following dermatologic consultation, which is not surprising given that topical clindamycin is a recommended evidence-based first-line therapy [30].

Hormonal therapy: Spironolactone, finasteride, and oral contraceptives: With anti-androgen activity, spironolactone, finasteride, and OCP are typically used for female patients if they are not responding to conventional therapy or have a history of hormonal imbalance. Spironolactone was a common prescription after dermatologic consultation. Finasteride was not used prior to dermatologic consultation but it was used after consultation. OCP was used more often by primary care prior to dermatologic consultation, however; it is not captured if this was prescribed for the purposes of controlling HS or for birth control.

Although research with anti-androgens is limited, spironolactone has been used successfully in several case series [31-33]. In particular, 17 of 20 patients in a recent case series found spironolactone to be effective [32]. Spironolactone has potential as first-line therapy for women with mild-to-moderate HS [32].

Finasteride is not a first-choice treatment due to the side effect profile. To date, finasteride use has been documented for both male and female HS patients, including adolescents [34]. Outcomes with finasteride have been overall favourable as concomitant therapy with antibiotics or surgery [2, 34].

Oral isotretinoin: Oral isotretinoin use increased after dermatologic consultation. This option was favoured when patients had concomitant acne also requiring treatment. Literature results with oral isotretinoin, however, have been mixed. A literature review of 174 patients from 7 studies concluded that there was significant improvement in 18%, moderate improvement in 17% and no response in 64% of the patients included [35]. Patients that benefited from the immunomodulatory effects of isotretinoin had mild HS [35].

Surgical approaches: Surgical referrals were less common in this patient population after dermatologic consultation because a medical approach was preferred for HS. Typical surgical procedures for severe HS, including deroofing, skin-tissue-saving excision with electrosurgical peeling, and wide excision, can lead to relatively high patient satisfaction [36, 37]. Surgical success is limited by accessibility to surgeons who are willing to operate on this population, who are often smokers that may have wound healing issues.

Although I&D was the third most common modality pre-consultation, it was not a preferred treatment approach at this dermatology clinic. I&D is typically used in the emergency room as a method to alleviate acute symptoms. While I&D provides temporary relief by decompressing and emptying nodules, the lesion typically reoccurs overtime [38].

Laser therapy: Laser therapy was used by few patients in this study. Laser and light-based therapies aim to reduce HS flares by decreasing the number of hair follicles, sebaceous glands, and bacteria in HS-affected regions, as well as by debulking chronic problematic lesions [39].  This therapy is also limited by accessibility in many regions, including ours.

Biologic agents: Biologics have been successful in treating inflammatory diseases for many years. Several literature reviews advocate biologic use for HS, though formal placebo controlled studies are limited [40, 41]. Eight (6.0%) patients in this study used biologics for HS therapy. Since this chart review was completed soon after adalimumab was approved for HS, most biologic use was off-label at the time. This resulted in difficulty securing reimbursement coverage by most insurance companies and was therefore prescribed mainly for associated comorbidities (psoriasis, IBD). Since then, adalimumab has been approved by Health Canada, Food and Drug Administration, and the European Medicines Agency for the treatment of adults with moderate-to-severe HS and is used more commonly in our clinic but not captured in this chart review.

Although biologics were prescribed mainly to treat comorbidities, they were successful in treating HS inflammatory symptoms. The mean time of follow up, 24.2 + 27.9 months (ongoing maximum of 73 months), for the patients using biologics, showed continuity of treatment over time. At the 2015 cutoff, 6 (75%) of 8 patients had ongoing biologic treatment. Many of the patients, 6 (75%), who were on a biologic agent were also receiving ILC injections as an adjunctive therapy.

There is a lack of good evidence supporting the use of etanercept for HS management and the 2 cases in this study were prescribed etanercept for psoriasis. While these patients showed good response to etanercept for psoriasis, there was no HS response. Although an initial etanercept open-label study showed promising results [42], following studies have not been able to reproduce the results [43, 44]. Currently, etanercept is not recognized as a suitable biologic for HS management [2, 40, 41]. Adalimumab and infliximab have been more thoroughly studied with promising results.

While taking infliximab for psoriasis, 4 (80%) reported HS improvement, however; some patients in this series stopped taking infliximab due to adverse events of pruritus, urticarial lesions, and dyspnea. The HS symptoms did worsen once the patients discontinued infliximab. One single-center randomized trial (N=38) showed improvement over 8 weeks in subjects receiving infliximab over placebo in the HS severity index. Although the primary end-point did not reach statistical significance, there was clinical and statistical significance of multiple secondary end-points [45]. Although our sample size was small, recent studies have shown that while both infliximab and adalimumab are effective at treating moderate-to-severe HS, adalimumab may be more tolerable [46, 47].

 Adalimumab was well tolerated and effective in our patient population, as 4 (80%) patients reported good responses and continued on treatment. Only 1 patient stopped treatment due to a self-limited leg edema. The best evidence supporting adalimumab use for HS comes from the PIONEER I and PIONEER II trials, which showed a significantly greater clinically meaningful improvement with weekly adalimumab (40 mg) compared to placebo [48]. Since the time of this review, additional biologics beyond the anti-TNF class are being explored for HS treatment including those targeting IL-1beta (anakinra) [49], IL-17 (secukinumab) [50, 51], and IL-12/23 (ustekinumab) [52, 53].

Intralesional corticosteroid injections: Although not a common form of treatment pre-dermatologic-consultation, ILC was the third most used form of therapy in our series, accounting for 49 (36.8%) patients. Injections were typically administered as concomitant therapy in localized inflammatory lesions. ILC injections are practical, simple, cost-effective, and readily available in dermatology clinics. Many reviews have advocated their use [2, 40, 54-56]. ILC injections, utilized as both monotherapy and adjunctive therapy, work effectively for localized lesions and acute flares. Specifically, ILC can cause rapid reduction of single recalcitrant inflammatory nodules typically within days [2, 57]. Complications, like superinfection, are rare and side-effects with the recommended treatment dosage are uncommon [54, 55].

Earlier studies have demonstrated intralesional triamcinolone as an effective treatment for acne cysts [58, 59]. ILC was used in one study to control existing lesions in one of four HS patients [31]. A case series made the observation that all 11 of their patients with concurrent HS and pyoderma gangrenosum had at least partial success with intralesional triamcinolone injections during the course of their treatment [60]. A more recent case series assessed the outcomes using ILC in 36 HS patients and found that the injections were successful in reducing pain after 1 day and inflammation after 7 days [57]. Despite this, the amount of clinical data based on the use of ILC for HS is currently lacking. Controlled studies would further support using ILC for HS.

Conclusions

This retrospective study determined the HS characteristics and treatments in a real-world Canadian dermatology practice. Epidemiology findings, similar to previous literature reports, were established. Topical and systemic antibiotics were common HS treatments in this study population. The dermatologist initiated several treatments such as ILC, spironolactone, biologics, and isotretinoin. Biologics are a feasible alternative for patients with moderate-to-severe HS, alone or with comorbidities. ILC is a suitable and easily available option for acute HS therapy. Biologics as primary therapy, and ILC as adjuvant therapy, achieved positive responses for HS management in the moderate-to-severe patient population. Additional studies are required to evaluate the impact of biologics and intralesional injections for HS management in controlled clinical trials.

References

  1. Hurley HJ (1989) “Axillary Hyperhidrosis, Apocrine Bromhidrosis, Hidradenitis Suppurativa, and Familial Benign Pemphigus: Surgical approach” In: Roenigk RK, Roenigk HH (eds), Dermatologic Surgery, New York: Dekker pp. 729–739.
  2. Deckers IE, Prens EP (2016) An Update on Medical Treatment Options for Hidradenitis Suppurativa. Drugs 76: 215–229. [Crossref]
  3. Prens E, Deckers I (2015) Pathophysiology of hidradenitis suppurativa: an update. J Am Acad Dermatol 73(5)S8–11.
  4. Hoffman LK (2017) Pathophysiology of hidradenitis suppurativa. Semin Cutan Med Surg 36(2): 47–54.
  5. Lachaine J (2016) The prevalence and incidence of hidradenitis suppurativa in canada: results from a population-based survey. Value Health 19(3): 123.
  6. Alavi A (2015) Quality-of-life impairment in patients with hidradenitis suppurativa: a Canadian study. Am J Clin Dermatol 16(1): 61–65.
  7. Kouris A (2016) Quality of life and psychosocial implications in patients with hidradenitis suppurativa. Dermatol 232(6): 687–691.
  8. Janse IC (2017) Sexual health and quality of life are impaired in hidradenitis suppurativa: a multicentre cross-sectional study. Br J Dermatol (176)1042–1047.
  9. Deckers IE, van der Zee HH, Boer J, Prens EP (2015) Correlation of early-onset hidradenitis suppurativa with stronger genetic susceptibility and more widespread involvement. J Am Acad Dermatol 72: 485–488. [Crossref]
  10. Palmer RA, Keefe M (2001) Early-onset hidradenitis suppurativa. Clin Exp Dermatol 26: 501–503. [Crossref]
  11. Saunte DM (2015) Diagnostic delay in hidradenitis suppurativa is a global problem. Br J Dermatol 173(6): 1546–1549.
  12. Jemec GB, Kimball AB (2015) Hidradenitis suppurativa: Epidemiology and scope of the problem. J Am Acad Dermatol 73(5): S4–S7.
  13. Canoui-Poitrine F (2009) Characteristics of a series of 302 French patients with hidradenitis suppurativa, with an analysis of factors associated with disease severity. J Am Acad Dermatol (61): 51–57.
  14. Vlassova N, Kuhn D, Okoye GA (2015) Hidradenitis suppurativa disproportionately affects African Americans: a single-center retrospective analysis. Acta Derm Venereol 95: 990–991. [Crossref]
  15. Davis SA (2015) Hidradenitis suppurativa management in the united states: an analysis of the national ambulatory medical care survey and market scan medicaid databases. Skin Appendage Disord (2): 65–73.
  16. Von der Werth JM, Williams HC (2000) The natural history of hidradenitis suppurativa. J Eur Acad Dermatol Venereol 14(5): 389–392.
  17. Schrader AM, Deckers IE, van der Zee HH, Boer J, Prens EP (2014) Hidradenitis suppurativa: a retrospective study of 846 Dutch patients to identify factors associated with disease severity. J Am Acad Dermatol 71: 460–467. [Crossref]
  18. Fitzsimmons JS, Guilbert PR, Fitzsimmons EM (1985) Evidence of genetic factors in hidradenitis suppurativa. Br J Dermatol 113: 1–8. [Crossref]
  19. Von Der Werth JM, Williams HC, Raeburn JA (2000) The clinical genetics of hidradenitis suppurativa revisited. Br J Dermatol 142: 947–953. [Crossref]
  20. Wang B, Yang W, Wen W, Sun J, Su B, et al. (2010) Gamma-secretase gene mutations in familial acne inversa. Science 330: 1065. [Crossref]
  21. Sartorius K, Emtestam L, Jemec GB, Lapins J (2009) Objective scoring of hidradenitis suppurativa reflecting the role of tobacco smoking and obesity. Br J Dermatol 161: 831–839. [Crossref]
  22. Vazquez BG (2013) Incidence of hidradenitis suppurativa and associated factors: a population-based study of Olmsted County, Minnesota. J Invest Dermatol 133: 97–103.
  23. Bettoli V, Naldi L, Cazzaniga S, Zauli S, et al. (2016) Overweight, diabetes and disease duration influence clinical severity in hidradenitis suppurativa-acne inversa: evidence from the national Italian registry. Br J Dermatol 174: 195–197. [Crossref]
  24. Kromann CB (2014) Risk factors, clinical course and long-term prognosis in hidradenitis suppurativa: a cross-sectional study. Br J Dermatol 171(4): 819–824.
  25. Dessinioti (2017) A retrospective institutional study of the association of smoking with the severity of hidradenitis suppurativa. J Dermatol Sci in press.
  26. Shlyankevich J, Chen AJ, Kim GE, Kimball AB (2014) Hidradenitis suppurativa is a systemic disease with substantial comorbidity burden: a chart-verified case-control analysis. J Am Acad Dermatol 71: 1144–1150. [Crossref]
  27. Shavit E (2015) Psychiatric comorbidities in 3207 patients with hidradenitis suppurativa. J Eur Acad Dermatol Venereol 29(2): 371–376.
  28. Porter ML, Kimball AB (2017) Comorbidities of hidradenitis suppurativa. Semin Cutan Med Surg 36(2): 55–57.
  29. Matusiak L (2009) Increased serum tumour necrosis factor-a in hidradenitis suppurativa patients: is there a basis for treatment with anti-tumour necrosis factor-a agents? Acta dermato-venereologica 89(6): 601–603.
  30. Gulliver W, Zouboulis CC, Prens E, Jemec GB, Tzellos T (2016) Evidence-based approach to the treatment of hidradenitis suppurativa/acne inversa, based on the European guidelines for hidradenitis suppurativa. Reviews in Endocrine and Metabolic Disorders 17(3): 343–351.
  31. Kraft JN, Searles GE (2007) Hidradenitis suppurativa in 64 female patients: retrospective study comparing oral antibiotics and antiandrogen therapy. J Cutan Med Surg 11(4): 125–131.
  32. Lee A, Fischer G (2015) A case series of 20 women with hidradenitis suppurativa treated with spironolactone. Australas J Dermatol 56(3): 192–196.
  33. Riis PT (2016) The role of androgens and estrogens in hidradenitis suppurativa–a systematic review. Acta dermatovenerol Croat 4(4): 239.
  34. Khandalavala BN, Do MV (2016) Finasteride in hidradenitis suppurativa: a “male” therapy for a predominantly “female” disease. J Clin Aesthet Dermatol 9(6): 44.
  35. Blok JL, van Hattem S, Jonkman MF, Horváth B (2013) Systemic therapy with immunosuppressive agents and retinoids in hidradenitis suppurativa: a systematic review. Br J Dermatol 168: 243–252. [Crossref]
  36. Janse I (2016) Surgical procedures in hidradenitis suppurativa. Dermatol Clin 34(1): 97–109.
  37. Blok JL (2015) Surgery under general anaesthesia in severe hidradenitis suppurativa: a study of 363 primary operations in 113 patients. J Eur Acad Dermatol Venereol 29(8): 1590–1597.
  38. Danby FW (2015) New and traditional surgical approaches to hidradenitis suppurativa. J Am Acad Dermatol 73(5) S62–5.
  39. Hamzavi IH (2015) Laser and light-based treatment options for hidradenitis suppurativa. J Am Acad Dermatol 73(5): S78–81.
  40. Lee RA, Eisen DB (2015) Treatment of hidradenitis suppurativa with biologic medications. J Am Acad Dermatol 73: S82–88. [Crossref]
  41. Barlev D (2015) Hidradenitis suppurativa: a review with a focus on treatment data. Skin Therapy Lett 20(4): 1–8.
  42. Giamarellos-Bourboulis EJ, Pelekanou E, Antonopoulou A, Petropoulou H, Baziaka F, et al. (2008) An open-label phase II study of the safety and efficacy of etanercept for the therapy of hidradenitis suppurativa. Br J Dermatol 158: 567–572. [Crossref]
  43. Lee RA (2009) A prospective clinical trial of open-label etanercept for the treatment of hidradenitis suppurativa. J Am Acad Dermatol 60: 565–73.
  44. Adams DR, Yankura JA, Fogelberg AC, Anderson BE (2010) Treatment of hidradenitis suppurativa with etanercept injection. Arch Dermatol 146: 501–504. [Crossref]
  45. Grant A, Gonzalez T, Montgomery MO, Cardenas V, Kerdel FA (2010) Infliximab therapy for patients with moderate to severe hidradenitis suppurativa: a randomized, double-blind, placebo-controlled crossover trial. J Am Acad Dermatol 62: 205–217. [Crossref]
  46. Napolitano M (2017) Hidradenitis suppurativa: from pathogenesis to diagnosis and treatment. Clin Cosmet Investig Dermatol 10: 105.
  47. Shuja F, Chan CS, Rosen T (2010) Biologic drugs for the treatment of hidradenitis suppurativa: an evidence-based review. Dermatologic clinics 28(3): 511–24.
  48. Kimball AB, Okun MM, Williams DA, Gottlieb AB, Papp KA, et al. (2016) Two Phase 3 Trials of Adalimumab for Hidradenitis Suppurativa. N Engl J Med 375: 422–434. [Crossref]
  49. Tzanetakou V, Kanni T, Giatrakou S (2015) Safety and efficacy of anakinra in severe hidradenitis suppurativa: a randomized clinical trial. JAMA Dermatol 1–9. [epub]
  50. Matusiak L, Szczech J, Bieniek A, Nowicka-Suszko D, Szepietowski JC (2017) Increased interleukin (IL)-17 serum levels in patients with hidradenitis suppurativa: Implications for treatment with anti-IL-17 agents. Journal of the American Academy of Dermatology 76(4): 670–675.
  51. Thorlacius L, Theut Riis P, Jemec GB (2018) Severe hidradenitis suppurativa responding to treatment with secukinumab: a case report. British Journal of Dermatology.
  52. Gulliver WP, Jemec GB, Baker KA (2012) Experience with ustekinumab for the treatment of moderate to severe hidradenitis suppurativa. Journal of the European Academy of Dermatology and Venereology 26(7): 911–914.
  53. Blok JL, Li K, Brodmerkel C, Horvátovich P, Jonkman MF, Horváth B (2016) Ustekinumab in hidradenitis suppurativa: clinical results and a search for potential biomarkers in serum. British Journal of Dermatology 174(4): 839–846.
  54. Alikhan A, Lynch PJ, Eisen DB (2009) Hidradenitis suppurativa: a comprehensive review. J Am Acad Dermatol 60(4): 539–561.
  55. Zouboulis CC (2015) European S1 guideline for the treatment of hidradenitis suppurativa/acne inversa. J Eur Acad Dermatol Venereol 29(4): 619–644.
  56. Wang SC (2015) Hidradenitis Suppurativa: A Frequently Missed Diagnosis, Part 2: Treatment Options. Adv Skin Wound Care 28(8): 372–380.
  57. Riis PT (2016) Intralesional triamcinolone for flares of hidradenitis suppurativa (HS): A case series. J Am Acad Dermatol 75(6): 1151–1155.
  58. Levine RM, Rasmussen JE (1983) Intralesional corticosteroids in the treatment of nodulocystic acne. Arch Dermatol 119: 480–481. [Crossref]
  59. Jansen T (2000) Disfiguring draining sinus tracts in a female acne patient. Pediatr Dermatol 17(2): 123–125.
  60. Hsiao JL, Antaya RJ, Berger T, Maurer T, Shinkai K, et al. (2010) Hidradenitis suppurativa and concomitant pyoderma gangrenosum: a case series and literature review. Arch Dermatol 146: 1265–1270. [Crossref]

Addition of Chitin Nanoparticles improves Polylactic Acid Film Properties

DOI: 10.31038/NAMS.2018121

Abstract

Biodegradable plastics have caught a lot of attention for their potential to contribute to a more sustainable society. However, mechanical and barrier properties need to be improved to allow for applicability in e.g. food packaging. In the current paper, a composite film material consisting of chitin nanoparticles that can be produced at low cost from e.g. crustacean shells, and polylactic acid is presented.

A novel method was used to make nano-chitin in ethanol suspensions, which prevents polylactic acid hydrolysis during fabrication. With increasing concentration of nano-chitin particles, the film tensile strength and UV-blocking improved. Furthermore, the nanoparticles improved maximum heat tolerance, without altering the processing temperature. All these aspects contribute positively to the development of novel biodegradable packaging materials, and further it is expected that customers’ willingness to pay outweighs costs related to production for which only proven technology is needed, which brings this novel packaging concept a step closer to application.

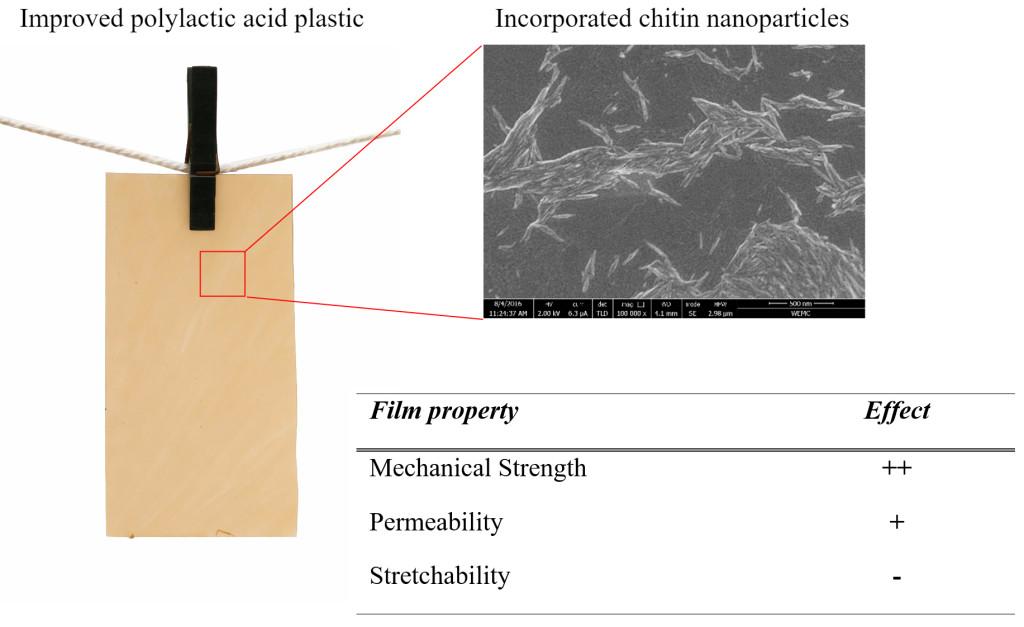
Graphical Abstract

NAMS 2018-102 - Layla Broers Netherlands_F0

Highlights

  • Chitin nanoparticles can effectively be manufactured in ethanol
  • Nano-chitin suspensions in ethanol can be used to make composite polylactic acid (PLA) films.
  • Addition of chitin nanoparticles to PLA improves film tensile strength and Young’s modulus.
  • Addition of chitin nanoparticles to PLA improves UV-blocking.
  • Market prospects of PLA composites with chitin nanoparticles look promising.

Key words

Biodegradable plastic, chitin, nanocomposite, polylactic acid, mechanical properties, extrusion.

Introduction

For 2020, it is expected that almost one trillion food and drink packages will be thrown away in Europe alone; the growth rate being three percent on a yearly basis [1]. Most of these packages are made from plastics based on fossil fuels. Since these sources are finite, and the production and waste created by these packages have a large environmental impact, an alternative is needed to secure an economically and environmentally sustainable future.

Plastics that are both biobased and biodegradable provide a promising alternative. These plastics require less or no fossil fuels and their production leads to less greenhouse gas emissions than their petrol-based counterparts [2]. Moreover, biodegradable plastics can fully degrade in several weeks to a few years, compared to a period lasting up to ten centuries for regular plastics. For example, polylactic acid (PLA) is found to decompose within 3 weeks under the right conditions [3]. Additionally, bioplastics can be industrially composted with other biodegradable waste, such as food and garden waste, whilst petrol-based polymers are domestic waste and commonly end up in landfills or incineration ovens [4]. However, the properties of bioplastic packaging materials are not as good as those of their petrol-based counterparts: mechanical properties, thermal stability and barrier properties need to be further improved [5].

One way to meet this challenge is through the use of biodegradable nanoparticles, which are known to be effective structure elements decreasing the gas and water permeability [5] and altering the mechanical properties [6]. Ideally these nanoparticles can be made at low cost; therefore, we considered only proven technology for the investigations presented here. The component of choice for nanoparticle production is chitin, a biodegradable, non-toxic, hydrophobic compound that is the second most abundant polysaccharide in the world [7,8]. It is found in arthropod exoskeletons such as shrimp shells, and fungal cell walls, and it is estimated that one billion tons of chitin are naturally synthesized yearly [9]. Chitin nanoparticles can be formed by acid treatment which causes partial deacetylation, exposing amino moieties. Protonation in the acidic environment provides a positive charge to these moieties, stabilizing the colloidal suspension due to repulsive forces [10]. Part of the world chitin production is readily available, e.g. as waste from shrimp production of which the regular disposal is costly [11].

Research has shown that nano-sized chitin can improve barrier properties when embedded in a polymer matrix [12,13]. This is especially useful for food packaging applications, since barrier properties are related to the shelf life of food, which in turn is linked to a potential decrease of the amount of food that is wasted (currently ~135 kg per capita per year) [14]. In this respect, the effect on reduction of food waste may surpass the effect on plastic waste considerably, thereby also contributing to a sustainable society.

Polylactic acid is currently recognized as the most promising biobased and biodegradable polymer for food packaging applications [3,15,16], although mechanical and barrier properties are still sub- optimal. To improve this, Herrera et al [17] incorporated chitin nanoparticles into PLA, although we expect that the results that were obtained were less favourable due to hydrolysis of PLA at high temperatures [18]. In the current paper, this is circumvented by using ethanol in a novel preparation method for chitin nanoparticles. These particles were incorporated in PLA films produced through compression moulding, and further characterised amongst others for their mechanical and barrier properties, and compared to industrial standards. Lastly the economic feasibility of the new composite is evaluated, and the opportunities for large scale production are touched upon.

Materials & methods

Materials

Practical grade chitin powder (Sigma-Aldrich) was used for synthesis of chitin nanoparticles. For the composites the fabricated nanoparticles, PLA (PLA LX175, Corbion) and the plasticizer GTA (Sigma- Aldrich) were used at the concentrations mentioned in the respective sections.

Preparation of nanoparticles

To obtain chitin nanoparticles (nChit), the method by Revol and Marchessault [19] was adapted to enable a larger yield (typically around 10%) and obtain a suspension in ethanol. The chitin powder was hydrolysed in hydrochloric acid (3 M) using 1 gram per ml HCl, at 100 °C for 90 minutes. The mixture was cooled on ice and then put through several centrifugal steps. Each step consisted of a 5- minute centrifugation (Sorvall RC6+ centrifuge) at 8000 rpm, after which the supernatant was discarded. The tubes were refilled with demi-water and the pellet was resuspended. This procedure was repeated until the supernatant became cloudy at pH 1.8-2.0. At this point the tubes were not decanted but centrifuged again for 25 minutes at 12.000 rpm. The pellet was then oven-dried (Memmert UM100) at 100 °C, and re-suspended in ethanol.

After another 25-minute spin at 12.000 rpm, the five-minute centrifugation steps were repeated, now using ethanol instead of demi-water, until supernatant appeared cloudy. [Please note that freeze-drying of nChit/H2O suspensions was effective in terms of the removal of water, but the particles could not be re-dispersed in ethanol. Decreasing the moisture-content during the nChit production process by oven-drying appeared most efficient and time-saving.] This supernatant was collected (‘wash I’), as well as the supernatant from the following spin (‘wash II’), while the pellet was discarded. Wash I and wash II were concentrated using a rotary evaporator (Heidolph, 175 mbar, 45 °C); the actual concentration was determined by dry weight measurement of 1 mL nchit/EtOH suspension after oven-drying (Memmert UM100) at 100 °C for 2-4 hours.

The average moisture content of the nChit-suspension was measured by Karl Fischer titration (Mettler Toledo DL38) and determined to be 3.5%.

Preparation of PLA-composites

Nano-chitin (0.5-3 wt%) was mixed with PLA containing 20 wt% glycerol triacetate (plasticizer) using a rheocord kneader (Haake Polylab, Rheomix 3000p) at 180 °C, 50 rounds per minute, for 10 minutes. The resulting mass was pressed into films of about 1 mm thick using a Hot Press (PHI, Los Angeles, USA), at 190 °C and 15000 Pa. Equal distribution of nChit in the films was assessed using Scanning Electron Microscopy (SEM) (FEI, Magellan 400). Before mechanical and permeability testing, the films were conditioned at 20 °C, 55% relative humidity for 5-7 days.

Larger scale composite production was carried out with an extruder (Leistritz ZSE 18 HP-400, Extrusiontechnik GmbH Nurnberg, Germany). Using a plunger pump (Leistritz LSB17, 2016), the nChit in ethanol mixed with GTA was fed to the extruder simultaneously with PLA. Some of the ethanol left the extruder through a vent, or escaped at the backside, but these flows did not contain any nChit, so this did not affect the final product. The extruded strands were cooled in a water bath, pelletized and dried (Gerco DMT 96C, Gerco-Apparatenbau GmbH & Co, Sassenberg Germany) for about 60 hours (48 °C) and pressed into films by compression moulding.

The films were conditioned at 20 °C, and 55% relative humidity for approximately 24 hours before mechanical and optical tests were performed.

Particle characterisation

Dynamic light scattering

The size of chitin nanoparticles (nChit) in ethanol was characterized by dynamic light scattering. The following optical properties were used: refractive indices of 1.560 (chitin) and 1.360 (ethanol) and an absorption index of 0.01 was used (Mastersizer 2000, Malvern Instruments Ltd. v3.50, Malvern, Worcestershire, UK).

Scanning Electron Microscopy

Images of the dried nanoparticle suspension and various PLA nChit composite surfaces were made by Scanning Electron Microscopy (SEM; FEI-Magellan 400, 2.0 kV, 6.3 pA, 4.1 mm working distance) to investigate nanoparticles and their distribution in the plastics. The nChit suspension was dried at 40 °C for 30 minutes, and all other samples were dried under vacuum for at least 48 hours prior to imaging. Samples were sputter coated with tungsten (~15 nm, Leica EM SCD 500) to avoid charging.

Atomic Force Microscopy

This technique (Bruker Multimode 8-HR, NanoScope Analysis software) was used for 3D-imaging of a dried nChit suspension on silica wafers from which the length and diameter of individual chitin nanoparticles could be deduced.

FTIR

Fourier transform infrared spectroscopy (FTIR) (Thermo Scientific, Nicolet iN10 MX Infrared Imaging Microscope) was used to ensure chitin structure was not altered due to the nanoparticle preparation process. Crude chitin powder was compared to dried nano-chitin.

Film characterisation

Optical properties

CIELAB analysis (ASTM E308, Elrepho 2000 datacolor) was performed at three different positions in each sample to assess colour values of the films. Transparency and UV-blocking properties of the films were measured in duplicate by UV/VIS (Beckman Coulter DU720) spectrometry at 200-700 nm.

Mechanical properties

Standard tensile tests (19 °C, 44% relative humidity: ASTM D638) were performed 5-fold using a universal testing machine (Zwick/Roell G80L30, 10 kN cell load, grip distance 80 mm, gauge length 40 mm, speed 200 mm/min). Samples were cut using a bone shaped press mould, and their tensile strength (TS, in MPa), Young’s Modulus (YM, in GPa) and Elongation at break (EAB, in %) were determined. Mean values and standard deviation were corrected for differences in thickness, and compared using ANOVA and Dunnett two-sided t-test assuming equal variance (a=0.05).

Barrier properties

Water vapour transmission (ASTM E96, 21 days at 20 °C, 55% RH) was measured in duplicate with kneader-prepared films. Using silicone sealant, 1.4 mm thick films were fixed in test cells (85 mm diameter) filled with water, leaving a layer of air between the water and the film. Weight loss was measured at least three times a week for 21 days. The water vapour transfer rate, WVTR (g • mm • m-2 • day-1) determined using [17]:

WVTR = (ml) / A (1-RH)

Where m is the weight loss in g/day; l is the thickness of the film in mm; A is the film area in m2; and

RH is the relative humidity outside the cup. Data was analysed using a one-sided t-test assuming equal variances (a = 0.05).

Thermal properties

Thermal behaviour was studied by differential scanning calorimetry (DSC) (ASTM D3418, PerkinElmer DSC 8000). From this test, the melting point (Tm, in °C) of the plastics was calculated.

Antimicrobial properties

Antimicrobial properties of plastic films were tested using an agar diffusion method adapted from Rhim [20] and Fernandez-Saiz [21]. PLA discs (15 mm diameter) were sterilized by submerging in 70% ethanol, and dried in a closed sterilized petri dish. These discs were placed on Brain Heart Infusion (BHI) agar (Becton & Dickinson (BD) BBL BHI, Agar Bacteriological, LP0011, Oxoid) (pH 7.4) streaked with either Escherichia coli W1605 (Gram negative) or Bacillus subtilis (Gram positive), and tested in triplicate. As controls a plate without sample and a plate with dried, agglomerated nChit flakes were used. The plates were incubated at 35 °C for 24 hours, and antimicrobial activity was determined from the inhibition zone diameter.

Biodegradation

To determine whether nChit influences biodegradation of PLA, films (120 × 135 × 1 mm) were buried in a home compost heap (125 × 75 × 75 mm) at a garden site in The Netherlands (latitude 52° 7’ 15” N, longitude 4° 39’ 6” E, altitude -1.5 m). The compost consisted of organic home and garden waste, such as leaves, branches, and vegetable waste. Films were placed vertically in the middle of the compost, with sufficient spacing (10 cm) between samples. Samples consisted of a film with 2 wt% nano-chitin, a film with 2 wt% crude chitin powder, and a control (PLA + 20 wt% GTA). Samples remained in compost for 12 weeks, in the period from October 22 to January 15. Mean outside temperatures dropped from 9.7 °C in October to 3.6 °C in January. Total precipitation ranged from 0.4 mm in October,
75.3 mm in November, to 13.8 mm in December and 48.8 mm in January. Average atmospheric pressure was 1015 mbar, and ambient humidity was approximately 85%. Excavated samples were tissue cleaned, and dried for 8 hours at room temperature prior to weighing.

Results and discussion

Morphology and structure

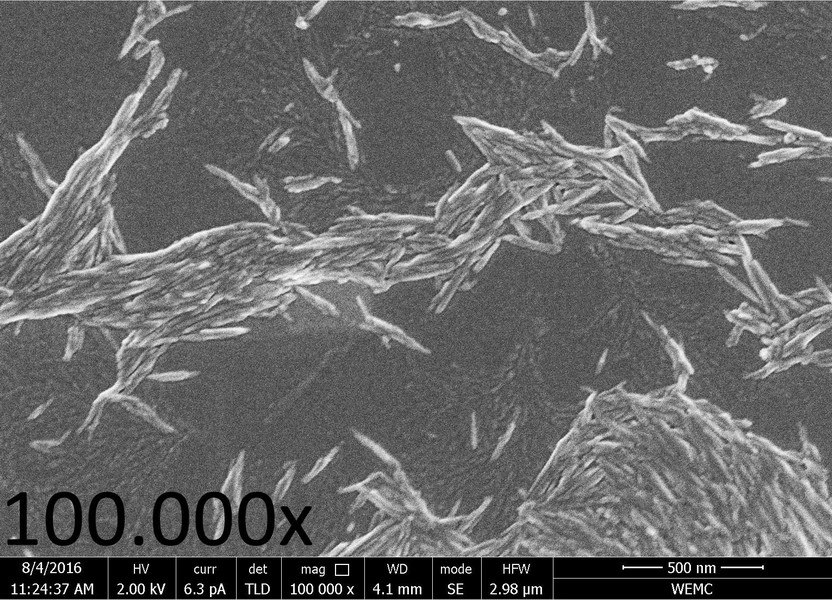
SEM and AFM imaging revealed the rod-shaped morphology (fibres or ‘whiskers’) of nChit (Fig. 1). The average length was 150-200 nm, the diameter is 10-20 nm, as measured by AFM [10].

NAMS 2018-102 - Layla Broers Netherlands_F1

Figure 1. SEM-image (100.000x magnification, working distance 4.1 mm) of nano-chitin particles, that arranged in typical whiskers.

The mixing method used was of great influence on the homogeneity of the films. In kneader prepared films, homogeneity was only found at 0.5% nano-particles while the use of extrusion in combination with compression moulding consistently yielded uniform films (see figure 7 for some impressions). FTIR analysis (details not shown), revealed that the chemical structure of PLA remained intact after processing, indicating that preparation and process conditions used were suitable.

Optical transparency and visual appearance

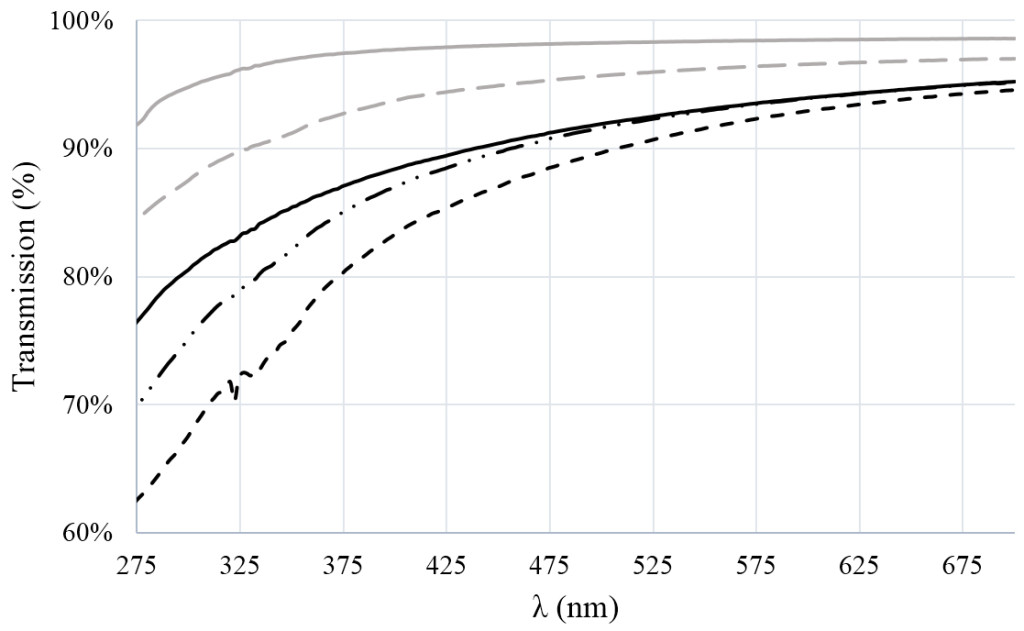
For PLA films, the CIELAB-measurements showed increased transmission at higher wavelength, and this behaviour was also found for films with nano-chitin, albeit at slightly lower values. The effect became stronger when GTA was added, and increased with increasing number of nanoparticles (see figure 2). The biggest effect was found for yellow and magenta transmission, which also lowers transparency of the films, that appear more brown, and opaque.

NAMS 2018-102 - Layla Broers Netherlands_F2

Figure 2. Transmission (%) in the UV-spectrum of films of 1 mm thickness. Lines indicate (from top to bottom): PLA (solid grey line), PLA + 1% nano-chitin (dashed grey line), PLA + GTA (solid black line), PLA + GTA + 1% nano-chitin (dot-dashed black line), and PLA + GTA + 3% nano-chitin (dashed black line).

Hydrolysis of chitin (N-acetyl-D-glucosamine; see nano-chitin preparation section) results in a high yield of glucosamine products [22], that are believed to be responsible for the colour change through Maillard reactions, similarly as observed in other work for glucosamine-derived products [23][24]. It is good to mention that the brown colour is hardly visible in thin (<0.1mm) films, but it does distinguish the films presented here from low density polyethylene, which show near complete transmission of UV [25]. The UV-blocking effect was also not found for crude chitin powder composites (results not shown). This indicates that through the choice of nano-chitin, e.g. food packaging could be supplied with an intrinsic protective effect that is expected to reduce photochemical processes such as photo-oxidation [26]. However, this is only relevant if the mechanical properties can meet the requirements of food packaging, as discussed next.

Mechanical properties

Tensile strength

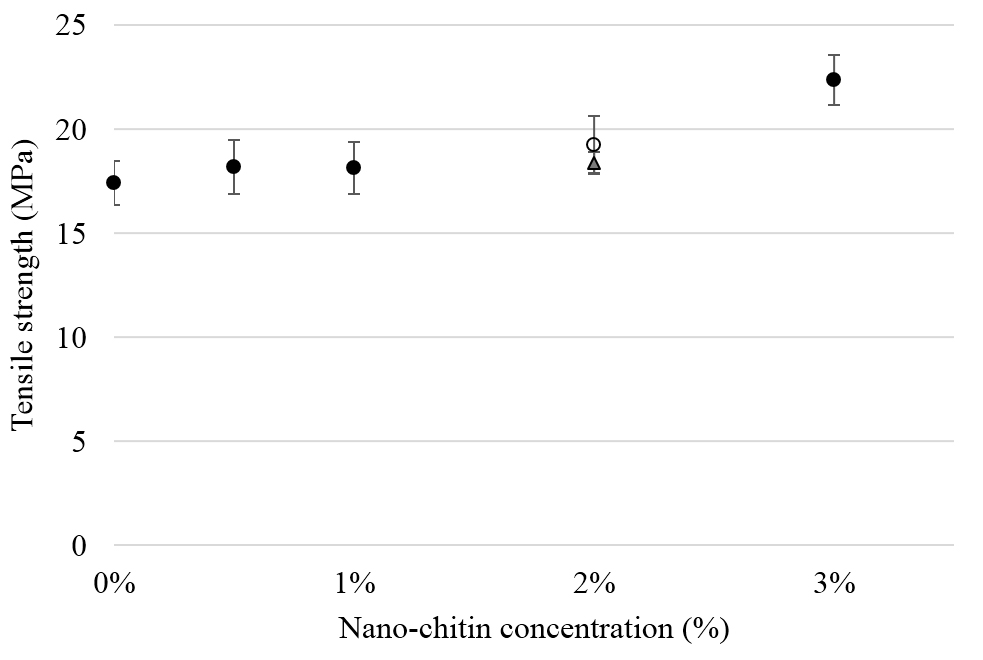
The tensile strength of PLA was not negatively affected by addition of nChit (Fig. 3); at 3% nChit there was even a significant increase compared to PLA without nChit (+4.9 MPa (±1.05), p<0.05). For most films, no necking behaviour was observed, indicating homogeneity at the scale of a few hundred nm3 [27].

NAMS 2018-102 - Layla Broers Netherlands_F3

Figure 3. Tensile strength (MPa) of PLA composites for various nano-chitin concentrations. Solid dots indicate the composites prepared using the kneader, the open dot indicates the composite made using the extruder. Triangular marker indicates film with 2% crude chitin powder. Values are averaged for five independent sample measurements.

Elongation at break

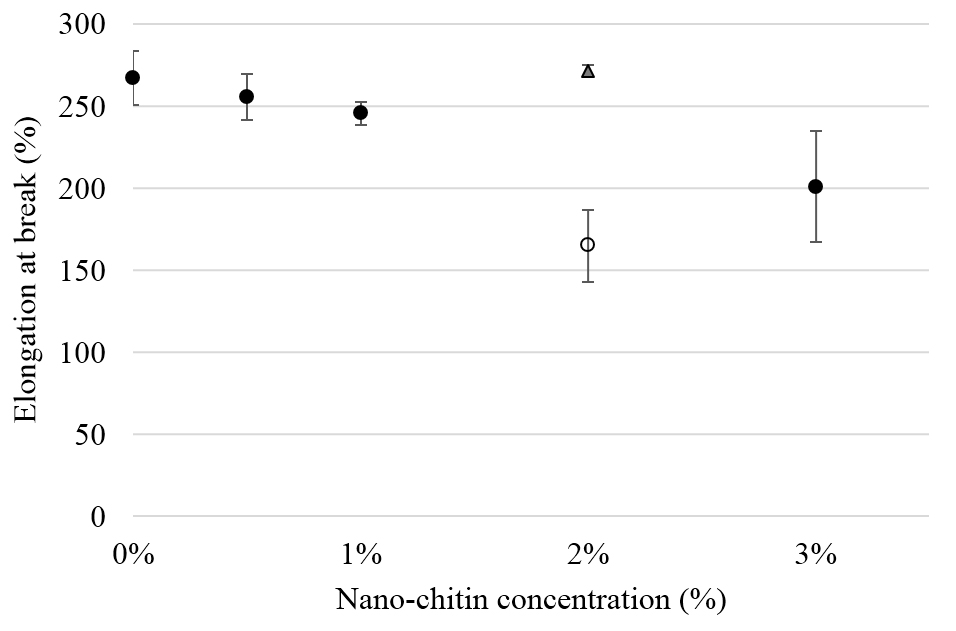
In figure 4, the elongation at break is shown for various nChit concentrations. For the films produced with the kneader, the difference was not significant but the 2% nChit composite manufactured by extrusion was less deformable ~40% (p<0.05); while a 2% crude chitin PLA composite had the same elongation at break as the PLA films. This may be caused by a difference in dispersion of the nanoparticles in the PLA [28]. Nonetheless, a decrease in EAB upon addition of nanoparticles has been frequently reported [28-30] and the results found in our study are still within the range of what otherwise has been reported in literature [17].

NAMS 2018-102 - Layla Broers Netherlands_F4

Figure 4. Elongation at break (%) of PLA composites with various nChit concentrations. Solid dots indicate the composites prepared using the kneader, the open dot indicates the composite made using the extruder. Triangular marker indicates film with 2% crude chitin powder. Values are averaged for five independent sample measurements.

We previously observed that in the 2% film produced by extrusion, the nanoparticles are much more homogenously distributed, and this is corroborated by the fact that no necking occurred during the tensile test, which is typical for films homogeneously mixed at a scale of a few hundred nm3 [31]. Possibly, the nanoparticles induce stress concentration points, causing crazes that ultimately result in break at the interface between PLA matrix and nanoparticles [32]. In films with crude chitin powder, in which the number of particles is much lower, behaviour similar to PLA was found.

Young’s Modulus

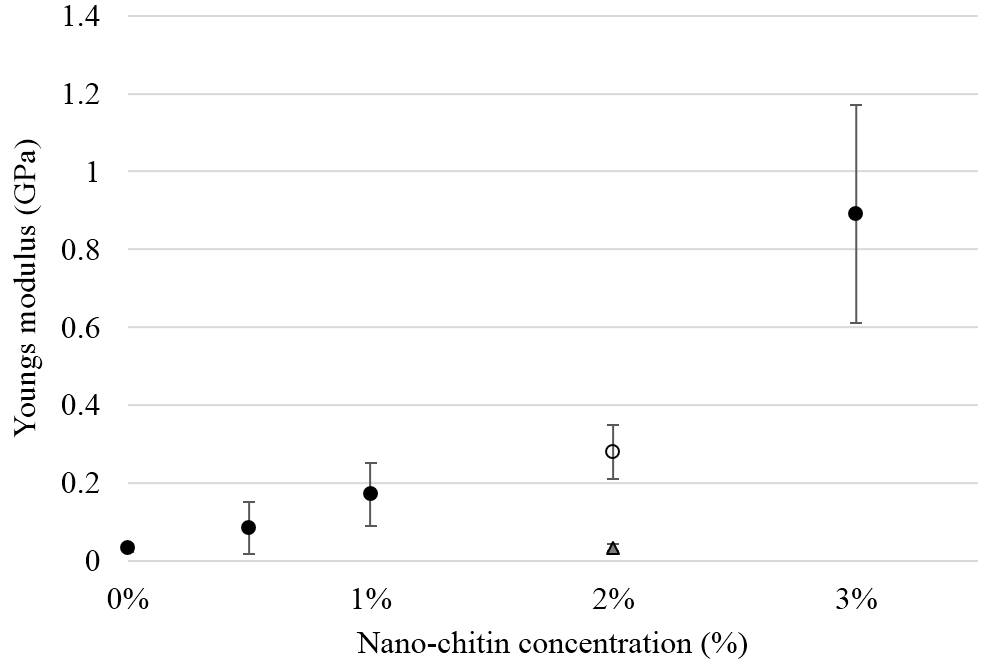
Since the Young’s Modulus (YM), increased with increasing nChit concentration (Fig. 5), it can be concluded that a more rigid PLA composite is formed. Compared to LDPE, the industrial standard, of which the average YM is 0.24 GPa [33], the nano-chitin composites compare well, with the 3% composite even exceeding LDPE considerably (average YM 0.89 ± 0.28 GPa, p<0.05).

NAMS 2018-102 - Layla Broers Netherlands_F5

Figure 5. Young’s Modulus as function of nano-chitin concentration. Solid dots indicate the composites prepared using the kneader, the open dot indicates the composite made using the extruder. Triangular marker indicates film with 2% crude chitin powder. Values are averaged for five independent sample measurements.

Barrier properties

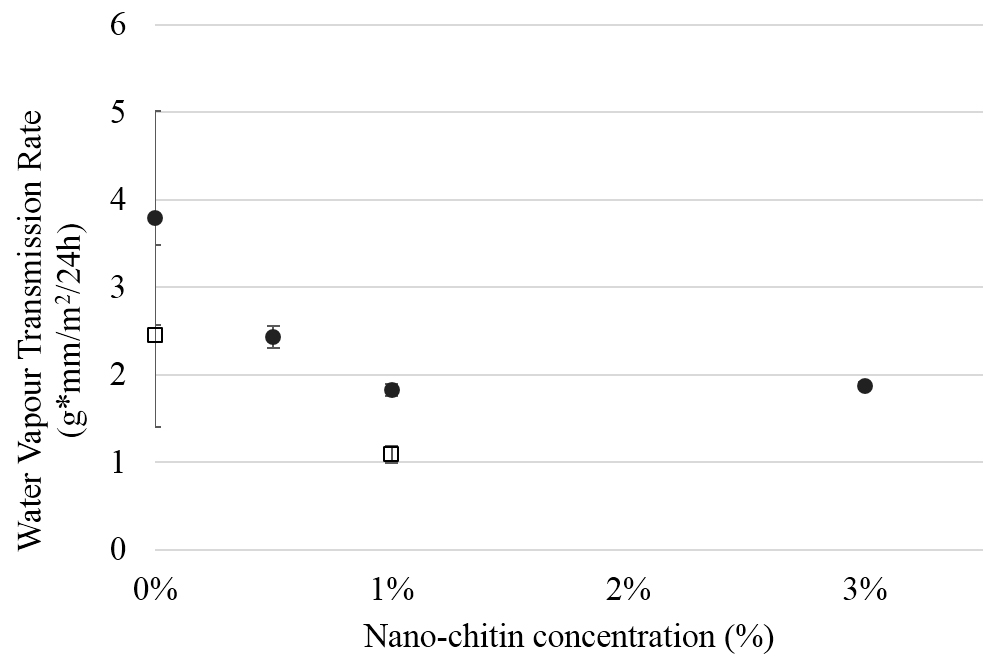
The Water Vapour Transmission Rate (WVTR) was assessed over a period of three weeks and seems to show a slight decrease with increasing nanoparticle concentration (Fig. 6). In literature, this is connected to tortuous pathway theory, predicting a greater effective water vapour diffusion length with nanoparticle incorporation [34, 35], although it should be kept in mind that the amounts of particles used are very low, and that other effects may have played a role.

NAMS 2018-102 - Layla Broers Netherlands_F6

Figure 6. Water vapour transmission rate measured at 20.0 °C, and 45 % relative humidity, for films -with different nano- chitin concentration. The solid dots indicate samples containing PLA and 20%plasticizer. The open squares indicate samples without plasticizer.

The films prepared at low nChit concentration (0.5 wt%), had significantly higher water vapour transmission rate compared to films containing 1 or 3% nChit (p<0.05). Research carried out elsewhere, found no significant effect on WVTR upon 1% nChit addition to PLA [17], hence the results presented in the current paper are favourable. We were aware of the negative effects connected to PLA hydrolysis, and adjusted the fabrication method to bypass these effects.

Thermal properties

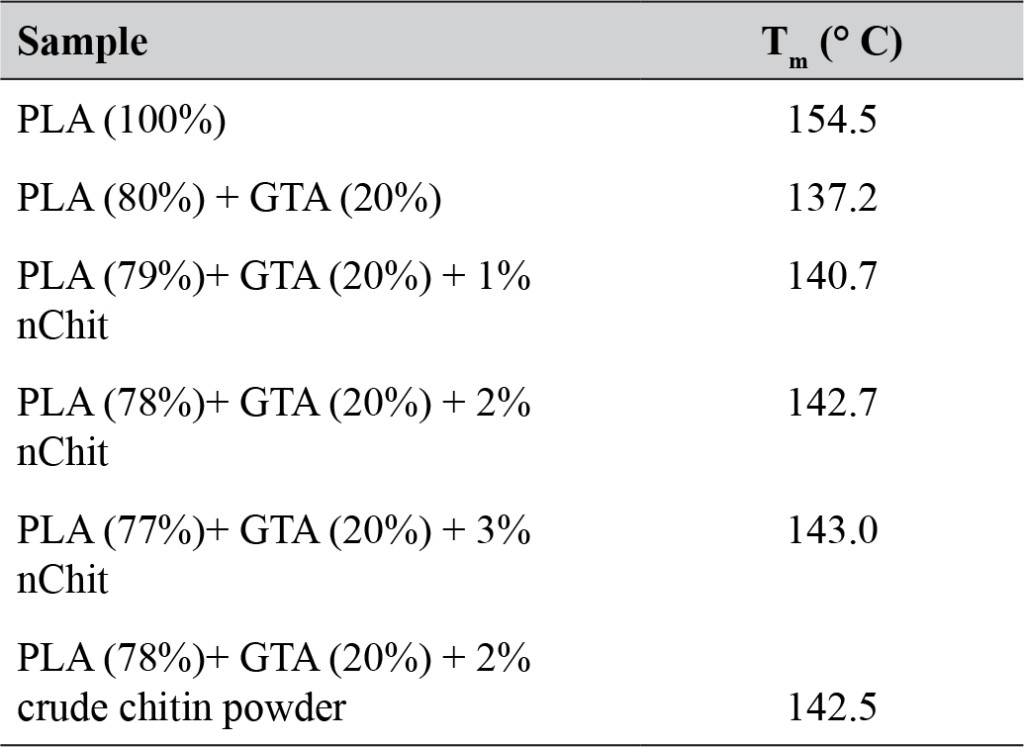
The melting temperature (Tm) of the films decreased with addition of GTA, but increased slightly upon addition of nChit (Table 1).

Table 1. Melting temperature (Tm) of PLA films with added glycerin triacetate (GTA) and different percentages of chitin nanoparticles (nChit) or crude chitin powder.

NAMS 2018-102 - Layla Broers Netherlands_T1

Antimicrobial test

All kneader-prepared films in addition to a dried nChit flakes were subjected to a 24-hour agar diffusion test to assess antimicrobial activity. No inhibition zones were observed with any of the samples, which is in contrast to findings by others, who found a bacteriostatic effect of nano-chitin on Gram-negative bacteria [36] and a fungistatic effect on Aspergillus niger [37,38]. Most probably, the nano-chitin has very low mobility and solubility [39], and as diffusion is a prerequisite for antimicrobial effects this most probably did not occur, which in turn is positive news in regard to film integrity, and for application in food in which packaging material diffusion is mostly not appreciated.

Biodegradability

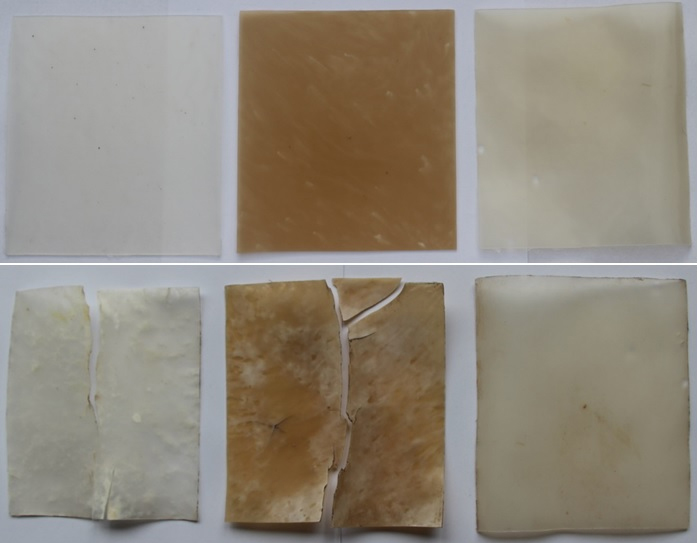
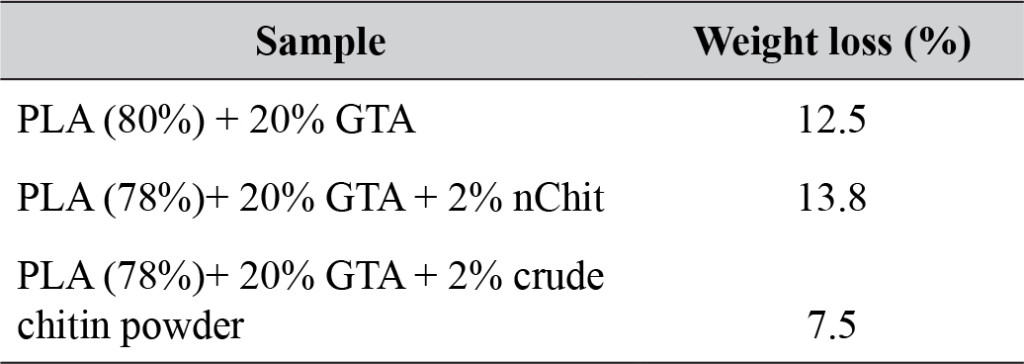
After 12 weeks in a compost heap, the plastic films showed weight reduction, discoloration, and breakage (Fig. 7, Table 2). The control (PLA+GTA), nChit composite and crude chitin powder composite showed 12.5%, 13.8% and 7.5% weight reduction respectively. In addition, the nChit film showed more discolouration and breakage compared to the other films, of which the crude chitin film showed highest integrity.

The exact mechanisms by which nanoparticles affect polymer biodegradation are poorly understood [39]. Fortunati et al (2014) [40] found an inhibiting effect of cellulose nanocrystals on PLA degradation, which was explained by increased crystallinity and decreased water diffusion. Calcium alginate composites with chitin nanowhiskers have shown accelerated biodegradation under in vitro conditions [41], which was attributed to the catalysing effect of hydroxyl groups [42], in which chitin is rich. It is clear these effects are of great relevance for practical application of nano-composite materials, and will decide the overall sustainability of the approach, which is part of follow-up research.

NAMS 2018-102 - Layla Broers Netherlands_F7

Figure 7. PLA films before and after 3 months in a compost heap. From left to right: PLA+GTA, PLA+GTA+2% nano-chitin, PLA+GTA+2% crude chitin powder.

Table 2. Weight loss of PLA films incorporated with 2 wt% (nano)chitin after 12 weeks of composting.

NAMS 2018-102 - Layla Broers Netherlands_T2

Economic and technical feasibility

From the previous sections, it is clear that PLA with chitin nanoparticles has promising properties, and the fact that we explored only proven technologies brings technical production closer. Whether this also holds for economic feasibility is to a large extent decided by consumer perception, which is discussed next, including a short outlook on technical feasibility.

Nowadays, conventional plastics are cheap due to the relatively low oil price, that is still recovering from a 10-year low of 27.96 dollars per barrel in February 2016 [43]. PLA producers find it difficult to compete against conventional plastic producers, as the costs of producing PLA are substantially higher. Nevertheless, the global demand for bioplastics packaging is expected to grow to over 2 million tons by 2020, with a compound annual growth rate of ~ 25% [1]. This growth can be explained by increased consumers’ awareness of the negative environmental impact of petrol-based plastics.

In the composite materials presented here, also nano-particles are present, and consumer’s attitude towards the application of nanotechnology in the food industry is somewhat ambiguous. According to Giles et al. (2015) [44] consumers find agri-food related nanotechnology acceptable when clear benefits could be identified and perceived benefits would outweigh perceived risks. Furthermore, they concluded that consumers are more likely to accept nanotechnology when it is used for food packaging compared to integration in food products. The additional production costs need to be covered by consumers’ willingness to pay more for biobased and biodegradable food packaging compared to petroleum-based packaging. This willingness has been confirmed in several studies and even reached 86% in Swedish consumers[45-47].

While production costs of PLA are higher, disposal costs are lower, since PLA can be industrially composted for around €45 per ton [48]. Common methods to process post-consumer petrol-based plastics waste are much more expensive; recycling does not take place because the costs transcend those of making new plastics [49]. Furthermore, costs of incineration and landfills reach and transcend €100 per ton due to taxes in Western and Northern Europe [48], whereas for Southern and Eastern Europe this is between zero and €60 [50]. This makes Western and Northern Europe a great market for biodegradable composites, where the quality of waste management is already high.

Regarding technical feasibility of the process, some comments need to be made. Although a considerable amount of ethanol is used in the process, this has been verified to be recyclable. Furthermore, high pressure homogenization can be considered since it has shown effective in obtaining chitin nanoparticles [51], and could even be more effective than the techniques used here. For both nanoparticle synthesis as well as film preparation, the necessary equipment such as stirring tank reactors, decanting centrifuges and extruders is proven technology on an industrial level [52], but compression moulding is not. Instead, film blowing can be used, which is even expected to better align the chitin whiskers within the PLA matrix, therewith positively affecting the permeability characteristics.

Conclusions

The nanocomposite biodegradable plastics presented in this paper mostly compare favourably to PLA-films without nano-chitin (table 3). The novel production method based on ethanol prevents PLA hydrolysis, which has greatly contributed to the positive effects that were found. In principle, the approach can technically be carried out at larger scale, and consumer perception seems to be boosting the bioplastics market which helps tackling socio-environmental challenges.

Table 3. Summary ofproperties of PLA films with GTA and nChit compared to PLA films with GTA. + + : consistent improvement with increasing nChit concentration, +: general improvement, ±: no significant change, -: general decline.

NAMS 2018-102 - Layla Broers Netherlands_T3

Authorship

Layla Broers, Sjoerd van Dongen, Veerle de Goederen, Marijn Ton, and Joep Spaen all contributed to the conception and design of the study. The first three authors contributed in data collection, interpretation, and analysis. The first four authors contributed in writing of the article. The last three mentioned authors contributed significantly in article revision. All authors approved the final version of the article.

Acknowledgements

The authors like to thank: Guus Frissen, Herman de Beukelaer, Sharon Chu, Jos Sewalt and Maurice Strubel who helped out during the practical work in the laboratories of FBR and the FPE group, and Frans Kappen, who assisted us in the Innovation Plant. Mieke Kleijn and Jacqueline Donkers, who helped us with AFM and SEM measurements. Philippe Puylaert, who provided material to perform antimicrobial tests. Peter de Goederen, who provided space and materials for biodegradation tests. Corbion for providing the polylactic acid.

This research was financially supported by the Netherlands Organisation for Scientific Research (NWO), through a Top Sector Chemistry Student Competition 2016 grant (700.001.516.56.11). There were no conflicts of interest.

List of abbreviations

Materials

nChit      Nano-chitin

GTA        Glycerol triacetate (plasticizer)

PLA         Polylactic acid

Tests

AMT       Anti-Microbial Test

EAB        Elongation at Break

TS           Tensile Strength

WVTR    Water Vapor Transmission Rate

YM          Young’s Modulus

Competing interests: The authors declare that they have no competing interests.

Funding information: This research was financially supported by the Netherlands Organisation for Scientific Research (NWO), through a Top Sector Chemistry Student Competition 2016 grant (700.001.516.56.11). There were no conflicts of interest and no involvement in the study design, data collection, analysis and interpretation, writing of the report, or in the decision to submit the paper for publication.

References

  1. Smithers Pira (2015) The Future of Bioplastics for Packaging to 2020.
  2. Weiss M, Haufe J, Carus M, et al. (2012) A Review of the Environmental Impacts of Biobased Materials. J Ind Ecol 16: S169–81.
  3. Madhavan Nampoothiri K, Nair NR, John RP (2010) An overview of the recent developments in polylactide (PLA) research. Bioresour Technol 101: 8493–8501. [crossref]
  4. Webb HK, Arnott J, Crawford RJ, et al. (2013) Plastic degradation and its environmental implications with special reference to poly(ethylene terephthalate). Polymers (Basel) 5: 1–18.
  5. Reddy MM, Vivekanandhan S, Misra M, et al. (2013) Biobased plastics and bionanocomposites: Current status and future opportunities. Prog Polym Sci 38: 1653–89.
  6. Tjong SC. Structural and mechanical properties of polymer nanocomposites. Mater Sci Eng 15.
  7. Muzzarelli R, Jeuniaux C, Gooday GW (1986) Chitin in Nature and Technology. New York Springer US.
  8. Dutta PK, Duta J, Tripathi VS. Chitin and Chitosan: Chemistry, properties and applications. J Sci Ind Res (India) 63: 20–31.
  9. Singh DK, Ray AR (2000) Biomedical Applications of Chitin, Chitosan, and Their Derivatives. J Macromol Sci Part C Polym Rev 40: 69–83.
  10. Marchessault RH, Morehead FF, Walter NM (1959) Liquid Crystal Systems from Fibrillar Polysaccharides. Nature 184: 632–3.
  11. Yan N, Chen X (2015) Sustainability: Don’t waste seafood waste. Nature 524: 155–157. [crossref]
  12. Cordeiro de Azeredo HM, Mattoso LHC, Mchugh TH (2011) Nanocomposites in Food Packaging – A Review. In: Advances in Diverse Industrial Applications of Nanocomposites. InTech 57–78.
  13. Mincea M, Negrulescu A, Ostafe V (2012) Preparation, modification, and applications of Chitin Nanowhiskers: A Review. Rev Adv Mater Sci 30: 225–42.
  14. Stenmark A, Jensen C, Quested T (2016) IVL-report C 186: Estimates of European food waste levels. Stockholm
  15. Mukherjee T, Kao N (2011) PLA Based Biopolymer Reinforced with Natural Fibre: A Review. J Polym Environ 19: 714–25.
  16. Wahit MU, Akos NI, Laftah WA (2012) Influence of natural fibers on the mechanical properties and biodegradation of poly(lactic acid) and poly(å-caprolactone) composites: A review. Polym Compos 33: 1045–53.
  17. Herrera N, Roch H, Salaberria AM, et al. (2016) Functionalized blown films of plasticized polylactic acid/chitin nanocomposite: Preparation and characterization. Mater Des 92: 846–52.
  18. Itävaara M, Karjomaa S, Selin JF (2002) Biodegradation of polylactide in aerobic and anaerobic thermophilic conditions. Chemosphere 46: 879–885. [crossref]
  19. Revol JF, Marchessault RH (1993) In vitro chiral nematic ordering of chitin crystallites. Int J Biol Macromol 15: 329–335. [crossref]
  20. Rhim JW, Hong SI, Park HM, Ng PK (2006) Preparation and characterization of chitosan-based nanocomposite films with antimicrobial activity. J Agric Food Chem 54: 5814–5822. [crossref]
  21. Fernandez-Saiz P, Ocio MJ, Lagaron JM (2010) Antibacterial chitosan-based blends with ethylene– vinyl alcohol copolymer. Carbohydr Polym 80: 874–84.
  22. Lv YM, Laborda P, Huang K, et al. (2017) Highly efficient and selective biocatalytic production of glucosamine from chitin. Green Chem 19: 527–35.
  23. Oyaizu M (1986) Studies on Products of Browning Reaction Antioxidative Activities of Products of Browning Reaction Prepared from Glucosamine. Japanese J Nutr Diet 44: 307–15.
  24. Xavier M (2006) Standardization of Optimum Conditions for the Production of Glucosamine Hydrochloride from Chitin.
  25. Auras R, Harte B, Selke S (2004) An overview of polylactides as packaging materials. Macromol Biosci 4: 835-864. [crossref]
  26. Tian F, Decker EA, Goddard JM (2013) Controlling lipid oxidation of food by active packaging technologies. Food Funct 4: 669–680. [crossref]
  27. Murariu M, Da Silva Ferreira A, Alexandre M, et al. (2008) Polylactide (PLA) designed with desired end-use properties: 1. PLA compositions with low molecular weight ester-like plasticizers and related performances. Polym Adv Technol
  28. Fortunati E, Armentano I, Zhou Q, et al. (2012) Microstructure and nonisothermal cold crystallization of PLA composites based on silver nanoparticles and nanocrystalline cellulose. Polym Degrad Stab 97: 2027–36.
  29. Armentano I, Bitinis N, Fortunati E, et al. (2013) Multifunctional nanostructured PLA materials for packaging and tissue engineering. Prog Polym Sci 38: 1720–47.
  30.  El-Hadi AM (2017) Increase the elongation at break of poly (lactic acid) composites for use in food packaging films. Sci Rep 7: 46767. [crossref]
  31. Nair KG, Dufresne A (2010) Crab Shell Chitin Whisker Reinforced Natural Rubber Nanocomposites.
  32. Ebadi-Dehaghani H, Khonakdar HA, Barikani M, et al. (2015) Experimental and theoretical analyses of mechanical properties of PP/PLA/clay nanocomposites. Compos Part B Eng 69: 133–44
  33. MatWeb L (2016) Overview of materials for Low Density Polyethylene (LDPE), Film Grade. MatWeb Mater. Prop. Data.
  34. Peelman N, Ragaert P, De Meulenaer B, et al. (2013) Application of bioplastics for food packaging. Trends Food Sci Technol 32: 128–41.
  35. Duncan T V (2011) Applications of nanotechnology in food packaging and food safety: Barrier materials, antimicrobials and sensors. J Colloid Interface Sci 363: 1–24.
  36. Benhabiles MS, Salah R, Lounici H, et al. (2012) Antibacterial activity of chitin, chitosan and its oligomers prepared from shrimp shell waste. Food Hydrocoll 29: 48–56.
  37. Herrera N, Roch H, Salaberria AM, et al. (2015) Functionalized blown films of plasticized polylactic acid/chitin nanocomposite: Preparation and characterization. Mater Des 92: 846–52.
  38. Salaberria AM, Diaz RH, Labidi J, et al. (2014) Role of chitin nanocrystals and nanofibers on physical, mechanical and functional properties in thermoplastic starch films. Food Hydrocoll 2015;46: 93–102. doi: 10.1016/j.foodhyd.2014.12.016
  39. Souza VGL, Fernando AL (2016) Nanoparticles in food packaging: Biodegradability and potential migration to food—A review. Food Packag Shelf Life 8: 63–70.
  40. Fortunati E, Luzi F, Puglia D, et al. (2014) Investigation of thermo-mechanical, chemical and degradative properties of PLA-limonene films reinforced with cellulose nanocrystals extracted from Phormium tenax leaves. Eur Polym J 56: 77–91.
  41. Watthanaphanit A, Supaphol P, Tamura H, et al. (2008) Fabrication, structure, and properties of chitin whisker-reinforced alginate nanocomposite fibers. J Appl Polym Sci.
  42. Ray SS, Yamada K, Okamoto M, et al. (2003) New polylactide-layered silicate nanocomposites. 2. Concurrent improvements of material properties, biodegradability and melt rheology. Polymer (Guildf) 44: 857–66.
  43. UK Exchange Rates (2017) Crude Oil Price History.
  44. Giles EL, Kuznesof S, Clark B, et al. (2015) Consumer acceptance of and willingness to pay for food nanotechnology: a systematic review. J Nanoparticle Res 17: 467.
  45. Koutsimanis G, Getter K, Behe B, et al. (2012) Influences of packaging attributes on consumer purchase decisions for fresh produce. Appetite 59: 270–80.
  46. Lindh H, Olsson A, Williams H (2016) Consumer Perceptions of Food Packaging: Contributing to or Counteracting Environmentally Sustainable Development? Packag Technol Sci 29: 3–23.
  47. Rokka J, Uusitalo L (2008) Preference for green packaging in consumer product choices – Do consumers care? Int J Consum Stud 32: 516–25.
  48. Hogg D, Favoino E, Nielsen N, et al. (2002) Economic Analysis of Options for Managing Biodegradable Municipal Waste – Final Report. Bristol.
  49. PlasTech (2016) Current prices of polymers in Central Europe by method Plastixx. PlasticPortal.eu.
  50. FhG-IBP (Fraunhofer-Gesellschaft zur Förderung der angewandten Forschung e.V).(2014) D 2.2 Waste Profiling.
  51. Salaberria AM, Fernandes SCM, Diaz RH, et al. (2015) Processing of á-chitin nanofibers by dynamic high pressure homogenization: Characterization and antifungal activity against A. niger. Carbohydr Polym 116: 286–91.
  52. Deeslie WD, Cheryan M (1981) A CSTR-hollow fiber system for continuous hydrolysis of proteins. Performance and kinetics. Biotechnol Bioeng 23: 2257–71.

Relationship between Breast, Formula and Combination Feeding on Childhood in Italy

DOI: 10.31038/EDMJ.2018222

Abstract

To investigate the relationship between breastfeeding, formula and combination feeding on weight childhood. The feeding group assignment was based as reported by medical records. Infant feeding was defined using three variables: breastfeeding duration, time until formula was introduced and infant weight. Number of Observations was equal to 294 (n=154 girls and n=140 boys). The data were analyzed using the ANOVA procedure. Results were considered significant at P< .01. The trend of the weight according to the feed type in the first 12 months of age between the data reported by the WHO and those collected. In addition, up to 4 months of life, to the growth curves appear similar to those reported by the WHO. In the first four months, about the girls and the boys, fed with milk formula grow equally. Differences are evident when subjects are fed at the breast. With breastfeeding, the differences between boys and girl are even more evident. The girls confirm the increased tendency to obesity than boy especially when breastfed. The results obtained different types of power supply could affect the tendency to overweight more in females than in males. The novelty of this study is focused on investigation about the relationship between breastfeeding, formula and combination feeding on weight in Italian childhood.

Keywords:

breast; formula; childhood

Introduction

Breast milk provides an optimal source of nutrition for infants [1,2]. Many organizations, including the World Health Organization (WHO), recommend that healthy term infants be exclusively breastfed for the first 6 months of life [1,3,4]. This is, in part, because breast milk is easily digested and strengthens the infant’s immune function [3,5,6]. Exclusive breastfeeding may also be modestly protective against excessive early infant gain and later obesity, whereas formula feeding may increase the risk of obesity in childhood [7]. Several biological mechanisms have been postulated to explain the potential differences between breastfed and formula fed infants — including postnatal effects of the intrauterine environment, the putative malleable metabolic environment in early infancy, and the permeability of the infant gut [8]. Another important benefit is the potential role of breastfeeding in preventing childhood obesity.

Melissa et al., [9] reported that breastfeeding, in the absence of formula feeding, appears to have a protective effect on childhood obesity. While combination feeding confers less benefit than exclusive breastfeeding, it is more desirable than formula feeding alone.

The findings underscore a need to support strategies and social policies that promote exclusive and longer breastfeeding duration as part of comprehensive strategies to prevent excess body weight and to reduce the burden of chronic diseases in the long term.

Potential biological explanations of the breastfeed obesity association have centered on differences in the nutritional composition of human milk versus formula, focusing in particular on the comparisons of human milk and formula in terms of protein and fatty acid composition [8]. For example, differences in the ratio of omega 3 and omega 6 fatty acids between human milk and formula have been associated with adipose tissue growth in infants [10] and insulin response in animal models [11]. A causal role for milk composition in promoting or protecting against obesity beyond infancy, however, has yet to be established [12].

Both maternal and infant behaviors differ based on whether an infant was fed from the breast [direct breastfeeding] or bottle-fed human milk and/or formula. It was suggested that direct breastfeeding supports the development of appetite regulation given its inherent dependence on infant-centered feeding behaviors by the mother [13]. This process relies heavily on the infant’s response to satiation rather than on visual cues, as a breastfeeding mother does not know how much milk is being offered, how much the infant is taking in and also knows little about the rate with which their infant is drinking. Thus, direct breastfeeding requires the mother to focus on infant cues to gauge the child’s interest in feeding (e.g. increased alertness to caregiver, moving head towards caregiver) and satiety (e.g. reduced sucking, drowsiness, relaxed state, arms close to the body). In contrast, bottle-feeding, involving either human milk or formula, provides explicit visual information about infant intake to the caregiver based on the amount of milk or formula remaining in the bottle.

Controlling feeding practices in infancy have an impact on children’s weight at 2 years. The use of restrictive child feeding practices during infancy predicts lower child weight at age 2 years, which may reinforce mothers’ use of this strategy in the longer term despite its potential association with disinhibition and greater child weight in later childhood [14].

Fisher et al., [15] found that prolonged breast-feeding throughout the first year of life was associated with higher toddler energy intake at age 18 months, and that this relationship was mediated by breast-feeding mothers reporting that they were less over-controlling when feeding their infants (i.e. pressuring to eat and restricting food less). Moreover, this relationship was found to be independent of the potentially confounding variables of maternal education, child gender and weight. Over controlling feeding techniques such as pressuring the child to eat or restricting child intake of foods are associated with greater feeding problems; pressure to eat is associated with reduced food preference, whilst restriction (generally of fat laden foods) is conversely linked with greater intake of the restricted foods [15]. Presumably, the impact of breast-feeding, mediated by maternal control, upon toddler energy intake, is accounted for by fewer aversive feeding interactions and less child refusal of food, but no data are available to explore this potential explanation.

This study aim to investigate the relationship between breastfeeding, formula and combination feeding on weight childhood.

Methods

This study employed a retrospective cohort design. Infant feeding group assignment was based as reported by medical records. Child growth data were assessed via medical records.

Infant feeding was defined using three variables:

  1. Breastfeeding duration;
  2. Time until formula was introduced.
  3. Infant weight

Have been taken consider two modes of infant feeding:

  • Breast
  • Formula

Infant feeding was then categorized by examining the response to both variables. Exclusive breastfeeding, defined by the WHO as no other food or drink except breast milk for the first 6 months of life, could not be determined in this study because of the lack of information around introduction to solids. Many of the children were both breastfed and formula fed, thus, a combination variable—representing breastfeeding together with formula feeding—was derived. Only formula fed was considered for mothers who breastfed for a 1 week or never. Standing height was measured, without shoes, to the nearest 0.1 cm and body weight to the nearest 0.1 kilogram on calibrated digital scales.

Descriptive statistics were used to characterize the population by weight status. In univariate regression we evaluated the association between breastfeeding duration and weight status as well as the association between the combination feeding variable and weight status. Odds ratios were calculated separately for normal weight versus overweight/obese, normal weight versus obese and normal weight versus overweight. ANOVA was carried out to evaluate significant differences between the two feedings (breast vs formula). The Pearson’s correlation was used to evaluate the relationship among parameters. The data were analyzed using the General Linear Models procedure of Ref. [16].

Results and Discussion

Table 1 presents a description of the sample.

Table 1. Number of observations (n) of type of feeding, all genres, ranges of observation age.

Feeding

Number of observation (n)

%

Breast

109

37.1

Formula

185

62.9

Genres

294

Girl

154

52.4

Boy

140

47.6

Range of observation age

294

1 – 3 months

88

29.9

4 – 6 months

52

17.7

10 – 12 months

36

12.2

Over 12 months

118

40.1

An examination of table 1 clearly shows that 32% of the samples analyzed was fed with formula, 18% was fed at the breast, while about 3% had a mixed feeding. Children fed with formula or with mixed feeding were weaning with other milk at the age of four months, while those fed breast were weaning at the age of six months.

In Table 2 we report the correlation matrix among the type of feed and weight of infants.

Table 2. Correlation matrix among the type of feeding and weight of infants.

Feeding

Weight

Feeding

Pearson Corr.

1

-0.222 (**)

Sig.

.

.007

Weight

Pearson Corr.

-0.222(**)

Sig.

.007

** Correlation is significant at the 0.01 level.

Table 2 shows that were the negative correlation between types of feeding and weigh of infants.

Jing Yan et al., [17] reported a protective effect of breastfeeding for childhood obesity, and prolonged breastfeeding is directly related to a decreasing risk of obesity. In particularly, children being breastfed for ≥7 are significantly less likely to be obese in later childhood.

Figure 1 shows the trend of the weight according to the feed type in the first 23 months of age between the data reported by the WHO and those collected in the present study (Figure 1).

Figure 1 shows that up to 4 months of life, leaving aside the type of power supply, to the growth curves appear similar to those reported by the WHO. Then the difference becomes increasingly apparent with increasing age. This difference can be justified by the fact that in Italy, probably, it are anticipated, often, the age of weaning age resulting in greater weight gain.

EDMJ2018-102-FiorellaSarubbiItaly_f1

Figure 1. Trend of the weight according to the breast feed type in the first 23 months of age between the data reported by WHO and those collected in the present study.

In Figure 2 we reported the increase in weight in function of age by the different types of feeding.

EDMJ2018-102-FiorellaSarubbiItaly_f2

Figure 2. Mean weight curves according to feeding status in function of age (until 12 months).

There were no significant differences between different feeding. In the first 4 months, the increase in weight appears to be faster in those who are breastfed with formula than those fed to the breast. This trend disappears in the following months.

In Figure 3 reported the trend of the weight according to the feed with formula in the first 12 months of age according to the gender.

EDMJ2018-102-FiorellaSarubbiItaly_f3

Figure 3. Trend of the weight according to the feed with formula in the first 12 months of age according to the gender.

Figure 3 shows that the trend of grow was equally in the boy and girl. The boy shows that an increased weight in every control. This difference can be justified by the different metabolism begins to diversify between boy and girl.

Figure 4 shows the trend of the weight according to the feed with formula in the first 12 months of age according to the gender.

EDMJ2018-102-FiorellaSarubbiItaly_f4

Figure 4. Trend of the weight according to the feed with breast in the first 12 months of age according to the gender.

The figures shows, also, that while in boy the increased weight trend is linear, both with breast than with the milk formula, in girl, feeding with the formula, appears more swinging in the first months of life. This trend does not take statistical significance, so it can be considered random.

From the figures we can see that those who were breastfed show an increase in more weight than those fed with formula. Also the trend is not very linear. The increase in weight is linear in individuals breastfed than those fed with formula, almost overlapping in the final part of the graph. If we compare Figure 3 and 4, in the first 4 months of age, we can see that the girl confirm the increased tendency to overweight than boy especially when formula.

We can conclude that the results obtained different types of power supply could affect the tendency to overweight more in girl than in boy. It is also clear that such tendency toward also depends on other cofactors which may act by increasing and / or decreasing this risk.

Implications

There are several studies aimed to investigate the relationship between breastfeeding duration, combination feeding on overweight and obesity in children. Other papers reported that excessive protein intake in the first two years of infants’ life — potentially through baby formula — could be contributing to childhood obesity. The novelty of this study is focused on investigation about the relationship between breastfeeding, formula and combination feeding on weight in Italian childhood. Differently to other works found in literature, this study has pointed its attention on the different trend of the increase in children’s weight according to the sex.

Acknowledgements

We are grateful to Mr. Giuseppe Grazioli for his technical support.

References

  1. World Health Organization (2011) Media Centre Statement 15 January 2011. Exclusive breastfeeding for six months best for babies everywhere http://www.who.int/mediacentre/news/statements/ 2011/breastfeeding_20110115/en/
  2. Twells L, Newhook LA, Ludlow V (2012) Can breastfeeding reduce the risk of childhood obesity? In S. A. Yuca (Ed.), Childhood Obesity pp. 53–78.
  3. Health Canada, Canadian Paediatric Society, Dietitians of Canada, Breastfeeding Committee for Canada (2012) Nutrition for healthy term infants: Recommendations from birth to six months. Food and Nutrition. Retrieved from Health Canada website: http: //www.hc-sc.gc.ca/fn-an/nutrition/infant-nourisson/recom/index-eng,php#a5.
  4. Kramer MS, Kakuma R (2012) Optimal duration of exclusive breastfeeding. Cochrane Database System Review (8): CD003517.
  5. Duijts L, Jaddoe VWV, Hofman A, Moll HA (2010) Prolonged and exclusive breastfeeding reduces the risk of infectious diseases in infancy. Pediatrics 126(1): 18–25.
  6. Heinig MJ (2001) Host defense benefits of breastfeeding for the infant: Effect of breastfeeding duration and exclusivity. Pediatric Clinics of North America 48(1): 105–123.
  7. Li R, Fein S, Grummer-Strawn LM (2010) Do infants fed from bottles lack self-regulation of milk intake compared with directly breastfed infants? Pediatrics 125(6): 1386–1393.
  8. Young BE, Johnson SL, Krebs NF (2012) Biological determinants linking infant weight gain and child obesity: Current knowledge and future directions. Advantes Nutrition 3(5): 675–686.
  9. Rossiter MD, Colapinto CK, Khan MKA, McIsaac JLD, Williams PL, et al. (2015) Breast, Formula and Combination Feeding in Relation Childhood Obesity in Nova Scotia, Canada Matern Child Health J 19: 2048–2056.
  10. Horta BL, Bahl R, Martines JC, Victoria CG (2007) Evidence on the long-term effect of breastfeeding: Systematic reviews and meta-analyses. Retrieved from World Health Organization website: http: //www.who.int/child_adolescent_health/documents/9241595230/en/index.html
  11. Owen CG, Martin RM, Whincup PM, Davey-Smith G, Gillman MW, Cook DG (2005) The effect of breastfeeding on mean body mass index throughout life: Quantitative review of published and unpublished odservational evidence. The American Journal of Clinical Nutrition 82(6): 1298–1307.
  12. Stolzer JM (2011) Breastfeeding and obesity: A meta-analysis. Open Journal of Preventive Medicine 1: 88–93.
  13. Monasta L, Batty GD, Cattaneo A, Lutje V, Ronfani L, et al. (2010) Early-life determinants of overweight and obesity: a review of systematic reviews. Obes Rev 11: 695–708. [Crossref]
  14. Farrow CV, Blissett J (2008) Controlling feeding practices: cause or consequence of early child weight? Pediatrics 121: e164-169. [Crossref]
  15. Fisher JO, Birch LL, Smiciklas-Wright H, Picciano MF (2000) Breast-feeding through the first year predicts maternal control in feeding and subsequent toddler energy intakes. Journal of the American Dietetic Association 100: 641–646.
  16. SPSS 12.0 Package software (2003)
  17. Jing Yan, Lin Liu, Yun Zhu, Guowei Huang, Peizhong Peter Wang (2014) The association between breastfeeding and childhood obesity: a meta-analysis. BMC Public Health 14: 1267–1277.

Targeting of the Wnt/β-Catenin Pathway in Chronic Lymphocytic Leukaemia may adversely affect CTLA-4 expression and function

DOI: 10.31038/IMROJ.2018311

Abstract

In chronic lymphocytic leukemia, overexpression of CTLA-4 may be associated with a good outcome, whereas the Wnt/β-catenin-regulated transcription factor LEF1 is a pro-survival factor and is markedly overexpressed compared to normal B cells. In this study, peripheral blood B cells from 20 patients with CLL were purified and a strong correlation between gene expression levels of CTLA-4 and LEF-1 was found. This suggests that CTLA-4 expression in CLL may be a target of Wnt/β-catenin signalling.

Keywords:

CLL; CTLA-4; Wnt/β-catenin pathway; LEF1; CD38

Highlights

Percentage surface expression of CD38 and CTLA-4 and gene expression levels of CTLA-4, CCND1, LEF1 and STAT3 were measured in 20 patients with chronic lymphocytic leukemic. A strong positive correlation was found between gene expression levels of CTLA-4 and LEF-1.

Targeting of the Wnt/β-catenin pathway in CLL may result in unwanted effects on CTLA-4 expression and function.

Introduction

Chronic lymphocytic leukemia (CLL) is a clonal proliferation of mature CD5+ CD19+ CD23+ B lymphocytes, characterized by progressive accumulation of leukemic cells in peripheral blood, bone marrow and lymphoid tissues. Cytotoxic T-lymphocyte-associated antigen 4 (CTLA-4, CD152) is a member of the CD28 receptor family and is mainly expressed on CD4+ T-cells. In CLL, overexpression of the CTLA-4 gene is associated with lower CD38-expression and, therefore, perhaps a better outcome [1]. CLL cells also exhibit aberrantly active Wnt signaling and Wnt/β-catenin-regulated transcription factor lymphoid enhancer binding factor-1 (LEF1) has been shown to be a pro-survival factor in CLL [2]. In this study, we wished to further investigate the relationship between CD38 and CTLA-4 in CLL and their potential relationship with transcription factors LEF1, signal transducer and activator of transcription 3 (STAT3) and cyclin D1. In purified peripheral blood B cells from 20 patients with CLL, a strong positive correlation between gene expression levels of CTLA-4 and LEF1 was found, suggesting that CTLA-4 expression in CLL may well be a target of Wnt/β-catenin signalling.

Material and methods

After ethical approval and signed written consent, 20 patients with CLL (9 previously treated, 11 untreated) donated peripheral blood for this study. No patient had active therapy for CLL in the 3 months prior to blood donation. All patients had FISH analysis performed. CD19+ B lymphocytes were isolated using a magnetic bead separation technique (Invitrogen-Dynabeads). The percentage surface expression of CD38 and CTLA-4 was measured by flow cytometry. Total RNA was isolated from the B cells by the RNeasy Mini Kit (QIAGEN). Gene expression levels of CTLA-4, cyclin D1 (CCND1), LEF1 and STAT3 were measured using RT-PCR (ABI 7500 Fast-Applied Biosystems). GAPDH was used as a reference gene. Statistical analyses of data were performed using Spearman rank correlation and Mann-Whitney U tests. Differences of P < 0.05 were considered statistically significant.

Results

Median (range) CD19+ B cell purity was 93.8 (84.8-98.5) %, with CD19+ B cell purity > 90% in 19/20 cases. Median (interquartile range) percentage surface expression of CD38 and CTLA-4 was 8.36 (26.45) % and 43.32 (50.22) % respectively. Median (range, interquartile range) ∆CT gene expression levels of CCND1, CTLA-4, LEF1 and STAT3 were 11.89 (1.81), 4.79 (2.35), 4.82 (0.89) and 9.12 (0.75) respectively. Gene expression of LEF1 showed significant positive correlations with gene expression levels of CTLA-4 (rs=0.572, p=0.008), CCND1 (rs=0.61, p=0.004) and STAT3 (rs=0.587, p=0.006). There was also a significant positive correlation between gene expression of CCND1 and of STAT3 (rs =0.486, p=0.03). No significant correlations were found between percentage surface expression of CTLA-4 and gene expression levels of either CTLA-4 or of LEF1. Although we found a negative correlation between percentage surface expression of CTLA-4 and CD38, this was not statistically significant. Comparing untreated and previously treated patients or comparing patients with poor risk cytogenetics (17p or 11q deletions: n = 6) to those without, there was no significant difference in gene expression levels of CTLA-4, CCND1, LEF1 and STAT3 or in surface expression of CTLA-4 and CD38.

Discussion

The Wnt signalling pathway has been shown to be activated in CLL cells and uncontrolled Wnt/β-catenin signalling contributes to defective apoptosis in CLL [3]. Importantly, Wnt pathway activation leads to upregulation of β-catenin and subsequently LEF1 activation, which is markedly overexpressed in CLL compared to normal B cells [4] and appears to play an essential role in the leukaemogenesis of CLL [2]. Furthermore, cyclin D1, a downstream target of LEF-1, is overexpressed in CLL. Targeting of LEF-1 has been shown to induce apoptosis in CLL cells both in vitro and in vivo [5].

In CLL, CTLA-4 expression is higher on the leukemic cells that on their normal B cell counterparts. A recent study has shown that CTLA-4 inhibits the proliferation/survival of CLL cells via regulation of the expression/activation of STAT1, NFATC2, Fos, Myc and Bcl-2 [6] and CTLA-4 blockade induces pro-survival signals in leukemic cells from CLL patients exhibiting high CTLA-4 expression [7]. However, CTLA-4 expression was also found to be the most highly induced gene following treatment with recombinant Wnt-3a in melanoma cell lines and CTLA-4 expression appeared to be directly regulated by the Wnt/β-catenin pathway as the β-catenin responsiveness of CTLA-4 promoter region required a T-cell factor-1/LEF-1 consensus site [8]. In our study, CTLA-4 and LEF-1 gene expression levels were strongly correlated, suggesting that CTLA-4 expression in CLL may well also be a direct target of Wnt/β-catenin signalling. Although the relationship between CTLA-4 and the Wnt/β-catenin pathway in CLL requires further study, the findings of this study suggest that targeting of the Wnt/β-catenin pathway in CLL may result in unwanted effects on CTLA-4 expression and function.

This research did not receive any specific grant from funding agencies in the public, commercial, or not-for-profit sectors.

Conflicts of interest: none

References

  1. Joshi AD, Hegde GV, Dickinson JD (2007) ATM, CTLA4, MNDA and HEM1 in high versus low CD38 expressing B-cell chronic lymphocytic leukemia. Clin Cancer Res 13: 5295–5304. [Crossref]
  2. Gutierrez Jr A, Tschumper RC, Wu X (2010) LEF-1 is a prosurvival factor in chronic lymphocytic leukemia and is expressed in the preleukemic state of monoclonal B-cell lymphocytosis. Blood 116: 2975–2983. [Crossref]
  3. Lu D, Zhao Y, Tawatao R (2004) Activation of the Wnt signaling pathway in chronic lymphocytic leukemia. Proc Natl Acad Sci USA. 101: 3118–3123. [Crossref]
  4. Gandhirajan RK, Poll-Wolbeck SJ, Gehrke I, Kreuzer KA (2010) Wnt/β-catenin/LEF-1 signaling in chronic lymphocytic leukemia (CLL): a target for current and potential therapeutic options. Curr Cancer Drug Targets 10: 716–727. [Crossref]
  5. Gandhirajan RK, Staib PA, Minke K (2010) Small molecule inhibitors of Wnt/β-carenin/Lef-1 signaling induces apoptosis in chronic lymphocytic leukemia cells in vitro and in vivo. Neoplasia 12: 326–335. [Crossref]
  6. Mittal AK, Chaturvedi NK, Rohlfsen RA (2013) Role of CTLA4 in the proliferation and survival of chronic lymphocytic leukemia. PLoS ONE 8: e70352. [Crossref]
  7. Ciszak L, Frydecka I, Wolowiec D, Szteblich A, Kosmaczewska A (2016) Patients with chronic lymphocytic leukemia (CLL) differ in the pattern of CTLA-4 expression on CLL cells: the possible implications for immunotherapy with CTLA-4 blocking antibody. Tumour Biol 37: 4143–4157. [Crossref]
  8. Shah KV, Chien AJ, Yee C, Moon RT (2008) CTLA-4 is a direct target of Wnt/β-catenin signaling and is expressed in human melanoma tumors. J Invest Dermatol 128: 2870–2879. [Crossref]

Has the Insulin Therapy Solved all Problems of Diabetes and its Complications?

DOI: 10.31038/EDMJ.2018221

Perspective

The recent case history of GREGORY and BASU [1] – summarized in the title of the paper – has shown that nearly 100 years after the discovery of insulin and its introduction in the therapy are not solved all problems of diabetic complications. Immediately life- threating are ketoacidotic coma and hyperosmolar hyperglycemic nonketotic coma.

Unfortunately, their “historical” development is marked by inattentiveness to important observations: already in 1886 has been reported coma in diabetic patients without “acetone or acetoacetic acid” in the urine [2]. Later, 1913, when it was already possible to measure concentration of hydrogen ion H+ in the blood (= blood-pH), this fact has been confirmed [3]: among 11 comatose diabetic patients only 3 had acidosis (= low blood-pH). With other words, hyperosmolar hyperglycemic nonketotic coma has been reported already at the end of the 19 century and was the cause of majority of deaths in coma, however, it has been “ accepted “ only 1957 [4].

With the acceptance of its existence has aroused the problem how to explain the existence of two consequences of insulin deficiency. A very simple explanantion has been found: hyperosmolar hyperglycemic nonketotic coma is caused by decreased concentration of plasmatic insulin, ketoacidotic coma by absolute insulin deficiency. The Nobel prize 1977 to Rosalyn S. YALOW for developent of new methods of biochemical analysis that make it possible to measure insulin concenration in human plasma has denitively made clear that insulin does not participate in the pathogenesis of diabetic ketoacidosis: already in 1981 has been published the monograph „Diabetic coma: ketoacidotic and hyperosmolar“ [5]. There, on p 67 is the Figure 6.3 with names of 12 autors who have reported sufficient amounts of plasmatic insulin in patients with diabetic ketoacidosis. And absolute deficiency of plasmatic insulin has been reported in patients with coma in hyperosmolar hyperglycemic nonketotic state, eg [6].

Administration of insulin is a reliable prevention of of the hyperosmolar hyperglycemic nonketotic coma; today, it occurs seldom and insulin is also part of its successful treatment. Between 1990 an 2010 yearly 2000 – 3000 patients died in USA in diabetic ketoacidotic coma [7]. Thus, it remains to explain the cause of death in ketoacidotic coma, accompanied always with vey low blood-pH. 3 papers have shown and confirmed that low blood-pH is the cause of decreased level of consciousness and coma, and not only a harmless accompanying phenomenon [8-10]. This is the result of increased concentration of 36 organic acids [11], including also extreme acidosis without acetoacetic and beta-hydroxybutyric acids [12]. The glycolytic enzyme phosphofructokinase is pH-dependent, as its activity is decreasing with decreasing pH. Therefore, with decreasing blod-pH is decreased also the utilisation of glucose in brain cells. Increase and normalisation of the low blood-pH after infusions of alkalising solutions (such as sodium bicarbonate) is life-saving in comatose patients with diabetic ketoacidosis – zero lethality hs been reported with such treatment, e g [13].

The patient of GREGORY and BASU [1] is a further stone in the ineffectiveness of insulin therapy in diabetic ketoacidosis.

References

  1. Gregory J, Basu S (2017) Diabetic ketoacidosis, hypeuricemia, and encephalopathy intractable to regular-dose insulin. Journal of Pediatric Endocrinology and Metabolism 30: 1317–1320. [Crossref]
  2. Dreschfeld J (1886) The Bradshaw Lecture on Diabetic Coma. British Medical Journal 2: 358–363. [Crossref]
  3. Rolly F (1913) Das Wesen und die Behandlung des Coma diabeticum. Medizinische Klinik15: 568–572
  4. Sament S, Schwartz MB (1957) Severe diabetic stupor without ketosis. South African Medical Journal 31: 833–834. [Crossref]
  5. Schade DS, Eaton RP, Alberti KGMM, Johnston DG (1981) Diabetic coma: ketoacidotic and hyperosmolar. University of New Mexico Press, Albuquerque, NM.
  6. Vinik A, Seftel LT, Joffe BD (1975) Metabolic findings in hyperosmolar nonketotic diabetic stupor. Lancet 2: 45–46. [Crossref]
  7. Gregg EW, Li Y, Wang J, Burrows NR, Ali MN, et al. (2014) Changes in diabetes – related complications in the United States 1990-2010. New England Journal of Medicine 370: 1514–1523. [Crossref]
  8. Rosival V (1987) The influence of blood hydrogen ion concenration on the level of consciousness in diabetic ketoacidosis. Annals of Clinical Research 19: 23–25. [Crossref]
  9. Edge JA, Roy Y, Bergomi A, Murphy NP, Ford-Adams ME, et al. (2006) Conscious kevel in children with diabetic ketoacidosis is related to severity of acidosis and not to blood glucose concentration. Pediatric Diabetes 7: 11–15. [Crossref]
  10. Nyenwe EA, Khan EA, Razavi AE,Wan JY, Kitabchi AE (2010) Acidosis: The Prime Determinant of Depressed Sensorium in Diabetic Ketoacidosis. Diabetes Care 33: 1837–1839. [Crossref]
  11. Niwa T (1995) Mass spectrometry in diabetes mellitus. Clinica Chimica Acta 141–2: 190–220. [Crossref]
  12. Vernon DD, Postellon DC (1986) Nonketotic hyperosmolal diabetic coma in a
    child: management with low-dose insulin infusion and intracranial pressure monitoring. Pediatrics 77: 770–772.
  13. Umpierrez GE, Kelly JP, Navarreete JE, Casals MM, Kitabchi AE (1997) Hyperglycemic crises in urban blacks. Archives of Internal Medicine 157: 669–675. [Crossref]

Dynamics of Changes in Concentration of Inflammatory and Destructive Biomarkers at Various Stages of Atherosclerotic Plaque Development

DOI: 10.31038/JCCP.2018112

Abstract

Goal of research

To examine factors and mechanisms of occurrence and progression of atherosclerotic focus and determine key among them in development of atherosclerotic unstable plaque.

Materials and methods

Research included 130 men with coronary atherosclerosis to whom during surgery was performed endarterectomy from coronary artery/arteries. Every substance after endarterectomy was divided into fragments for histological and biochemical examination. Through enzyme-linked immunoassay with the use of standard set (ELISAs) in samples homogenates were identified levels of TNF-α, IL-1- β, IL-1- РА, IL-2, IL-6, IL-8, hsCRP, TIMP-1, MMP-9, ММP-3, ММP-1, ММP-7, MCP-1, EMAP-II. Statistic processing of the results was made with the use of software program SPSS for Windows.

Results

As atherosclerotic focus develops to the stage of stable plaque activity of TIMP-1 decreases in it and increase levels of ММP-7, ММP-1, ММP-9 that reflexes intense destruction processes of connective-tissue matrix in unstable plaque, in its fibrous cover. Inflammatory activity in unstable plaque manifest in increased IL-6, IL-8 and CRP levels. There are also highest levels of MCP-1and EMAP-II in them.

At the stage of stable plaque manifestations of destructive activity in the form of increased MMP-3 levels and reduced concentration of TIMP-1 statistically significantly depend on inflammatory oxidative changes, whose key factors are increased TNF-α levels and reduced IL-1-RA levels.

Conclusion

During process of atherosclerotic focus development to the stage of unstable plaque acute inflammatory process activity and tissue damage reactions increase in it, activate processes of connective-tissue matrix and plaque fibrous cover destruction that leads to its thinning, excision, bursting/breakage.

As atherosclerotic focus develops at the stage of stable plaque and at the stage of unstable plaque manifestations of destructive activity significantly depend on inflammatory oxidative changes various at every stage.

Key words

coronary atherosclerosis, atherosclerotic plaque, metalloproteinase, inflammatory marker

Introduction

Contemporary views on unstable atherosclerotic plaque formation key mechanisms are controversial. Inflammatory and destructive process plays important role in unstable atherosclerotic plaque development. [1-3]. Many cytokines such as TNF-α, IL-1, IL-2, IL-3, IL-6, IL-8, CXCL8, IL-10, IL-12, IL-18, IFN-γ are to be found in vessels with risk of atherosclerosis. In hyperlipidemia macrophages produce TNF-α, IL-1, IL-6, IL-12 and IL-18 and also anti-inflammatory cytokines IL-10 and TGF-β. Besides anti-inflammatory cytokines and chemoattractants macrophages produce matrix metalloproteinases (MMP) that cause degradation of extracellular matrix. [4]. Among them MMP-1, MMP-13 collagenases break down fibrillar collagen types I and III, MMP-2, MMP-9 gelatinises and MMP-3 stromelysin break down adhesion molecules, nonfibrillar forms of collagen and proteoglycans. Tissue inhibitor of metalloproteinases type 1 (TIMP-1) inhibits MMP-1, MMP-3, MMP-9 and in connection with active catalytic core blocks its activity forming non-covalent complexes. (for instance, complex TIMP-1/ MMP-3) [5,6].

To date investigation results of the inflammatory and destructive, oxidative, endothelial dysfunctional processes activity in dynamics of atherosclerotic focus stage development up to unstable plaque are not numerous, so that studies are relevant in this area. Some questions concerning destabilization of plaque mechanisms, characteristics of correlations between many factors, inducing this process remain unclear. That implies difficulties in elaboration of effective preventive and therapeutic approaches to stabilization of atherosclerotic focuses.

Materials and methods

Research included men aged 49 to 79 with verified coronary atherosclerosis, stable effort angina functional class II-III (without acute coronary syndrome) that were admitted to E.N. Meshalkin Novosibirsk Research Institute of Circulation Pathology Ministry of Healthcare of Russia, Novosibirsk  for coronary bypass surgery. Exclusion criteria were myocardial infarction not older than 6 month, acute inflammatory diseases, acute exacerbation of chronic diseases, active hepatic disorders, chronic renal diseases and oncology diseases. Every patient filled out Informed consent form for taking part in research. During surgery in 130 patients was performed endarterectomy from coronary artery/arteries for intraoperative indications. Every substance after endarterectomy containing intima-media complex from coronary arteries was both transversally and longitudinally symmetrically divided into 3-5 fragments. As the result was obtained 415 samples for histological and biochemical examination.

Histological analysis of collected intima-media samples from coronary arteries was performed after macroscopic samples description (prevalence of plaque, degree of artery opening stenosis formation, hemorrhaging in the structures of plaque, calcification focuses and thrombi) and after standard hematoxylin-eosin and van Gieson’s staining.

From 415 samples 32 cases were identified as intact intima tissue, 41 as lipid spot/streak, 72 as stable immature atheromatosis plaque, 105 as stable atheromatosis plaque with fibrosis/calcinosis, 165 as unstable atheromatosis plaque with tendency to ulceration and rupture. Unstable plaques were identified by this criteria: damaged plaque with fibrous cover less than 65 μm in thickness, infiltrated with macrophages and T cells (lymphocytes) (more than 25 cells per high power field 0,3 mm) with large lipidic nucleus (>40%)

Through enzyme-linked immunoassay with the use of standard set (ELISAs) in samples homogenates were identified levels of TNF-α (Biosource), IL-1- β and IL-1- РА (Biosource), IL-2, IL-6, IL-8 (Cytimmune), hsCRP (Biomerica), TIMP-1(Biosource), MMP-9 (RD), ММP-3 (Biosource), ММP-1 (RayBiotech), ММP-7 (BCM Diagnostics panel), chemoattractants MCP-1 (BenderMedSystems), EMAP-II (Biosource). Control serums, sourced with ELISAs panels, with high and low level of test indexes were used as control.

Statistic processing of the results was made with the use of software program SPSS for Windows. For every index were calculated straight average (М), standard deviation (σ), standard error of the mean (m), median (Ме), highest and lowest value in relation to distribution type. Significance of differences between mean values was estimated with the use of Student t-test (for attributes with Gaussian distribution model) or Mann-Whitney U test. Correlation relationships were estimated with the use of Spearman’s criteria. Multiple comparisons between groups were made though analysis of variance (One-Way-ANOVA) with the use of Dunnett’s test for multiple comparisons. Associative links were estimated within the system of linear regression analysis, multivariate regression analysis in GLM. Statistical significance criteria was p <0,05.

Results and discussion

For appraisal of inflammatory activity in homogenates of samples in various stages of atherosclerotic focuses development were investigated levels of some proinflammatory cytokines, CRP and chemoattractants. (Table 1).

The lowest level of IL-1-RA was noticed in stable immature and fibrous atherosclerotic plaques (Table 2), lower than in intact intima tissue and lipid spots. Level of IL-1-RA in unstable plaques was no different than in intact intima tissue and lipid spots and was even 1,6 times higher than in immature stable atherosclerotic plaques. Whereas IL-1-RA is the competitive antagonist of IL-1 in interacting process with specific receptor to IL-1, obtained results attest that there are no increased levels of IL-1 in unstable plaques. And over against this results reflect increased levels of IL-1 in the earlier stage of atheroma development – immature stable atherosclerotic plaque stage.

While analyzing the TNF-α levels was also noticed that there were stable plaques, where levels of test item were different. Level of TNF-α in immature stable and fibrotic plaques was more than 2 times higher in comparison with intact intima tissue, lipid spots and unstable plaques. Considering that withdrawal of biomaterial was performed in men without ACS it is possible to suggest that activity of IL-1 and TNF-α is increased and plays one of key roles in development of atherosclerotic focus at the stage of stable plaque (immature or fibrotic) by inducing proliferation of T- cells, smooth muscle cells and expression of adhesion molecules [7, 8], but isn’t dominant at the stage of unstable plaque.

Examination of proinflammatory cytokines IL-2, IL-6 and IL-8 showed predominance of activity in unstable plaques. Although IL-2 level found out only upward trend, no significant contrast was identified, IL-6 and IL-8 levels were considerably higher in unstable plaques. Consequently IL-6 (inductor of acute phase reaction of inflammatory response and tissue damage [9]) level in unstable plaques were 2,7 times higher than in fibrous plaques and 4 times higher than in intact tissue, lipid spots, stable immature plaques. In unstable plaques IL-8 level also proved to be highest, higher than in intact tissue, lipid spots, stable immature (in 7,8; 6,5 and 5,2 times respectively) and fibrous (1,7 times) plaques. Beyond that IL-6 and IL-8 levels were higher in stable and fibrous plaques in comparison with intact intima, lipid spots and stable immature plaques. IL-1 and TNF-α are known to stimulate secretion of IL-8 by macrophages and endothelial cells therefore it can be assumed that this is predominance of activity of IL-1 and TNF-α at earlier stages of atherosclerotic focus development that potentiate subsequent increase of IL-8 secretion and is evident at the stage of unstable plaque.

Table 1. Proinflammatory cytokines and chemoattractants concentration in atherosclerotic focuses at various stages of atherosclerotic plaque development (M±σ)

CSRJ2018-102-StriukovaRussia_t1

Footnote: *- In comparison with atheromatosis plaque with fibrosis/calcinosis (р<0,05); # – In comparison with stable plaque (р<0,05); ^ – In comparison with unstable plaque (р<0,05)

Table 2. Matrix metalloproteinases concentration in atherosclerotic focuses at various stages of atherosclerotic plaque development (M±σ)

CSRJ2018-102-StriukovaRussia_t2

Footnote: *- In comparison with atheromatosis plaque with fibrosis/calcinosis (р<0,05); # – In comparison with stable plaque (р<0,05); ^ – In comparison with unstable plaque (р<0,05)

MCP-1 expressed by macrophages in response to affecting by such cytokines as TNF-α, IL-1-beta and IL-6 is monocyte and T-cell specific chemoattractant. [10,11]. The study on content of MCP-1 at different stages of atherosclerotic focus development showed its gradual increase from intact intima tissue to unstable plaque. In unstable plaques MCP-1 levels were highest, higher than in intact intima, lipid spots and stable immature plaques (in 1,9 times). MCP-1 levels in stable fibrous plaques have been also higher in comparison with intact intima, lipid spots and stable immature plaques.

Endothelial-Monocyte Activating Polypeptide II (EMAP-II) released by macrophages and T-cells is proinflammatory cytokine and chemoattractant that induces formation of procoagulaitive tissue factor at the surface of endotheliocytes, neutrophil activation, apoptosis, inhibition of arteria wall intima/media neovascularization. The study on content of EMAP-II showed its gradual increase as atherosclerotic focus develops and largest predominance in unstable plaques (in 3.9 times higher than in intact intima; in 2,2 times higher than in lipid spots; in 1,5 times higher than in stable immature plaques and in 1,4 times higher than in fibrous plaques). It should be noted that EMAP-II level was also higher in stable immature and fibrous plaques in comparison with intact intima and lipid spots.

The study on content of C-reactive protein levels at different stages of atherosclerotic focus development demonstrated its gradual increase from intact intima tissue to unstable plaque. In unstable plaques samples C-reactive protein levels were higher than in samples of intact tissue, lipid spots and stable immature plaques in 4,1; 2,5 and 2,3 times respectively. C-reactive protein levels in fibrous calcareous plaques samples were also higher in comparison with samples of intact intima tissue, lipid spots and stable immature plaques in 3,2; 2,0 and 1,8 times respectively. Therefore results obtained demonstrated inflammatory activity in unstable plaques manifested in increased levels of IL-6, IL-8 and CRP. Also MCP-1and EMAP-II levels turned out highest in unstable plaques.

Furthermore we examined variations in metalloproteinases and its inhibitor levels as markers of destructive process activity at various stages of gradual atherosclerotic focus development to the stage of unstable plaque.

TIMP-1 levels in stable immature and fibrous plaques and in unstable plaques were lower than in intact intima and lipid spots (in 1,7 times). However there was no significant difference between stable and unstable plaques. TIMP-1 is ММP-1, ММP-3, ММP-9 inhibitor. Connecting with active catalytic center of MMP TIMP-1 block their activity forming non-covalent complexes (for example, TIMP-1/ММP-3 complex). [12,13]. TIMP-1 activity in its turn can be inhibited by increased level of IL-8 [14,13], that conform to results obtained on IL-8 levels in plaques.

Reduced concentration of TIMP-1 in formed atherosclerotic plaques (stable and unstable) demonstrates the greater potential opportunity of destructive MMP enzymatic activity in them. However expected results were not received relating to MMP-3. MMP-3 level (stromelysin destructing elastin, proteoglycans, fibronectin etc. [13]) turned out higher only in stable immature plaques, at that in comparison both with intact intima and  unstable plaques (in 2,4 times) that demonstrate that there was no increased activity of MMP-3 in unstable plaques even with reduced activity of  TIMP-1 in them.

The study on content of MMP-7 (matrilysin destructing proteoglycans,  fibronectin, laminin, versican etc. [15,13]), that besides intrinsic activity is activator of pro-MMP-9  and  MMP-9 itself ( gelatinase hydrolyzing collagen of basal membranes [12,13]), contrariwise revealed their evident increase in unstable plaques rather than anywhere else in comparison with intact intima, lipid spots and stable immature plaques (in 1,4 and 1.6 times relatively).

During study on MMP-1, destructing collagen fibers was revealed its rise in 1,9 times (р<0,05) in unstable atherosclerotic focuses in comparison with stable and in 2,7 times in comparison with intact intima tissue.

Therefore as atherosclerotic focus develops to the stage of unstable plaque levels of inflammatory cytokines IL-6 and IL-8, chemoattractants MCP-1 and EMAP-II increase in it. That points to intensification of acute inflammatory process activity and reactions of tissue damage in unstable plaques that is accompanied by increased chemotaxis of monocytes, neutrophils and T-cells. As atherosclerotic focus develops to the stage of unstable plaque activity of TIMP-1 decrease in it and increase levels of ММP-7, ММP-1and ММP-9. That reflects intense destruction processes of connective-tissue matrix in unstable plaque, in its fibrous cover that leads to its thinning, excision bursting/breakage.

Carried out correlation analysis revealed significant linkage between test item of destructive changes and inflammatory oxidative changes in atherosclerotic focuses.

Therefore here are shown significant correlations for MMP-9 levels not only with levels of TIMP-1, MMP-3, MCP-1 (p<0,01), but also with levels of IL-1-PA (p<0,01), TNF-α (p<0,05), IL-6, IL-8 (p<0,01) and CRP (p<0,01). Was revealed significant average correlation dependence between MMP-3 level and TNF-α (p<0,01). Significant negative correlation was shown for TIMP-1 with such parameters of activity as TNF-α, IL-6 (p<0,05), IL-8 (p<0,01) and direct correlation with IL-1-RA level (p<0,01). Were revealed significant direct correlation dependences between lipid peroxidation output levels and MMP-9 (p<0,01), MMP-3 (p<0,05) and negative correlation with TIMP-1(p<0,01). As expected were revealed correlation dependences between CRP levels and cytokines TNF-α, IL-6 (p<0,05) and IL-8 (p<0,01) in atherosclerotic focuses.

Certainty of dependences between destructive changes activity (matrix MMP levels and its tissue inhibitor) and inflammatory oxidative processes in atherosclerotic plaques was estimated through regression and multivariant GLM model (General Linear Model) analysis. Destructive activity indexes were included in model in the capacity of dependant variables while spectrum of the investigated inflammatory oxidative indexes in the capacity of independent variables (explanatory variables). Was revealed statistically significant dependence MMP-9 level on IL-6, IL-8 and IL-18 levels (standardized rate В=0,343; 0,329 and 0,372 relatively, p<0,05) corresponding to characteristics of revealed inflammatory oxidative changes in unstable plaques. Was shown dependence MMP-3 levels on TNF-α levels (В=0,517, p<0,001) corresponding to characteristics of revealed inflammatory oxidative changes in stable plaques. Were also revealed dependences TIMP-1 level on IL-1-RA levels (В=0,677, p<0,01), that corroborate characteristics of revealed inflammatory oxidative changes in stable plaques.

Therefore as atherosclerotic focus develops at the stage of stable plaque manifestations of destructive activity in the form of increased MMP-3 levels and reduced concentration of TIMP-1 revealed statistically significantly dependence on inflammatory oxidative changes, which key factors are increased TNF-α levels and reduced IL-1-RA levels. Further as atherosclerotic focus develops to the stage of unstable plaque manifestations of destructive activity in the form of increased MMP-7, MMP-1, MMP-9 levels depend on inflammatory changes which key factors are increased IL-6, IL-8, MCP-1 and EMAP-II levels.

Conclusion

During process of atherosclerotic focus stage development to the stage of unstable plaque inflammatory cytokines and chemoattractants increase in it that reflects intensification of acute inflammatory process activity, tissue damage reactions in unstable plaque. As atherosclerotic focus develops to the stage of unstable plaque activity of matrix metalloproteinases inhibitor decreases and significantly increase levels of destructive enzymes that reflects activation of destruction processes of connective-tissue matrix in unstable plaque , fibrous cover of the plaque that leads to its thinning, excision bursting/breakage.

As atherosclerotic focus develops at the stage of stable plaque and at the stage of unstable plaque manifestations of destructive activity significantly depend on inflammatory oxidative changes various at every stage.

Conflict of interest: None declared.

Acknowledgements: The study was supported by Federal Agency for scientific organizations program for support the bio resource collections.

References

  1. Sakakura K, Nakano M, Otsuka F, Ladich E, Kolodgie FD, et al. (2013) Pathophysiology of atherosclerosis plaque progression. Heart Lung Circ 22: 399–411. [crossref]
  2. Libby P, Okamoto Y, Rocha VZ, Folco E (2010) Inflammation in atherosclerosis: transition from theory to practice. Circ J 74: 213–220. [crossref]
  3. Moreno PR (2010) Vulnerable plaque: definition, diagnosis, and treatment. Cardiol Clin 28: 1–30. [crossref]
  4. Pigarevsky PV, Snegova V, Maltseva SV, Davydova NG (2015) T-cells and macrophages in unstable atherosclerotic affects in human. Cytokines and inflammation Journal.
  5. Ries C (2014) Cytokine functions of TIMP-1. Cell Mol Life Sci 71: 659–672. [crossref]
  6.  Ambrose JA, Srikanth S (2010) Vulnerable plaques and patients: improving prediction of future coronary events. Am J Med 123: 10–16.
  7. Hansson GK, Libby P, Tabas I (2015) Inflammation and plaque vulnerability. Journal of internal medicine 5: 483–493.
  8. Wohlschlaeger J, et al. (2015) Coronary atherosclerosis and progression to unstable plaques: Histomorphological and molecular aspects. Herz 6: 837–844.
  9. Hartman J, Frishman WH (2014) Inflammation and atherosclerosis: a review of the role of interleukin-6 in the development of atherosclerosis and the potential for targeted drug therapy. Cardiology in review 3: 147–151.
  10. Schiopu A. et al. (2016) Associations Between Macrophage Colony-Stimulating Factor and Monocyte Chemotactic Protein 1 in Plasma and First-Time Coronary Events: A Nested Case–Control Study. Journal of the American Heart Association e002851.
  11. Zernecke A, Weber C (2014) Chemokines in Atherosclerosis. Arteriosclerosis, thrombosis, and vascular 4: 742–750.
  12. Wang M, et al. (2015) Matrix metalloproteinases promote arterial remodeling in aging, hypertension, and atherosclerosis. Hypertension 4: 698–703.
  13. Newby AC (2016) Metalloproteinase production from macrophages–a perfect storm leading to atherosclerotic plaque rupture and myocardial infarction. Experimental physiology 1: 1327–1337.
  14. Silvello D. et al. (2014) Serum levels and polymorphisms of matrix metalloproteinases (MMPs) in carotid artery atherosclerosis: higher MMP-9 levels are associated with plaque vulnerability. Biomarkers 19: 49–55.

The Effect of Norepinephrine and Caffeic Acid on Cytokines and Nitric Oxide Production by Granulocytes is Age-Dependent

DOI: 10.31038/ASMHS.2018212

Abstract

There is a large increase in the number of elderly people in modern societies. This demographic phenomenon has been paralleled by an epidemic of chronic diseases and inflammatory process usually associated with advanced age. In this work we seek to fill a gap that still exists in the process of immunoregulation “old guy’ looking to narrow the knowledge regarding their correlation with the immune system and the nervous system. The Nitric Oxide (NO) and Interleukins productions were studied in healthy subjects in age ranging from 20 to 80 years divided in three age groups: (20-39), (40-59) and (60-80) years. NO production was quantified in a Griess reaction. The results were expressed through the nitrite concentration calculated by linear regression using a standard curve obtained from a solution of sodium nitrite and 1mM RPMI. Interleukins 8, 10 and 4 (IL-8, IL-10 and IL-4) productions were measured by sandwich ELISA. Ours results demonstrated that Norepinephrine (NoAD) can no longer modulate the inflammatory cytokine profile and that there is a significant decay of the contribution of Caffeic Acid (CA) as an antioxidant and / or anti-inflammatory age-related. Thus, our results showed a lack of NoAD and CA modulation in human granulocyte in ageing dependent process.

Keywords

Aging, Granulocytes, Caffeic acid, Nitric oxide, Cytokines

Significance Statement

In view of the population aging, it is necessary to seek alternatives to improve the quality of life, as well as ways to ameliorate the diseases and pathologies associated with the increase of chronic inflammation and the drop in adaptive immunity inherent in the elderly. Thus, this work introduces the study on the modulating effect of caffeic acid and noradrenaline on the synthesis of nitric oxide and interleukins in human granular cells in different age groups. Following a widely accepted concept that peripheral cells may be a “window” within the central nervous system, correlating it simply to the immune system.

Introduction

Senescence is the natural ageing process, which progressively compromises physical and cognitive. According to World Health Organization (WHO), the elderly begins between 60 and 65 years. However, this is an old established for research purposes, since the aging process depends on three main factors classes: biological, psychological and social factors [1].

Ageing is a complex phenomenon that is still not completely understood. Age-related pathologies generally rise with approximately exponential kinetics beginning at approximately the mid-point of the species-specific life span (e.g., 50–60 years of age for humans) [2,3].

Progressive deterioration of innate and adaptive immune functions, a status termed ‘immunosenescence’, is associated with the higher frequency and severity of diseases in the elderly, such as chronic infections, cancer and autoimmune disorders. Age-related immunosenescence can be characterized by a decrease in adaptive immunity and increase in low-grade chronic inflammation, also referred to as ‘inflammaging’ [4]. Another significant aspect is the marked increase in oxidative stress generated during the aging process [5].

Studies by according to Chaves et al. demonstrated, in granulocytes, increased reactive oxygen species (ROS) after 40 years and nitrogen (RNS) from the age of 50. Concomitant with this increase, was observed a significant decrease in antioxidant power, suggesting an imbalance in cellular metabolic aging [6-8].

Currently, it is known that many stimuli from the central nervous system are capable of modulating an immune response. The hypothalamic-pituitary-adrenal (HPA)-is one of those responsible for several of the links between these two systems. This communication is bidirectional because cytokine activates neuronal axis and neurotransmitters may be produced by cells from immune system. Endorphins, thyrotropin, prostaglandins, growth hormone, and catecholamines are also part of this type of neuroimmunoendocrine response [9].

Norepinephrine (NoAD) is produced in response to physiological stress trigger and a broad spectrum of biochemical and physiological alterations including modulation of immunity [10]. It is believed that Caffeic acid (CA) able to prevent the neuroinflammation-induced acute, probably the long term neurodegenerative changes and attenuates lipopolysaccharide-induced sickness behaviour and neuroinflammation in mice [11].

 It has also been suggested that cytokines have a pivotal role in ageing. Studies by according to Minciullo et al. [12] demonstrated that morbidity and mortality is associated with high level of IL-1, IL-6,TNF- an IFN-Y in older people . The authors suggest that longevity depends on the balance between pro and anti-inflammatoy cytokines. Several therapeutic approaches have been suggested to modulate both inflammation and oxidative stress. Among them, caffeic acid (3,4-dihydroxycinnamic acid) is considered a compound with anti-inflamatory and antioxidant properties. CA is believed to be able to prevent the neuroinflammation-induced acute and probably the long term neurodegenerative changes [13].

Catecholamines (CAs), including Norepinephrine (NoAD), is produced are the first hormones in response to physiological stress trigger and a broad spectrum of biochemical and physiological alterations including hyperglycemia and modulation of immunity [10] The Norepinephrine, major sympathetic neurotransmitters, modulates the immune system through interaction with adrenergic receptors G protein-coupled (α1, α2, β1, β2, β3). Thus, the occupation of these receptors stimulates or inhibits adenylate cyclase, which will influence the role of cytokines [14,15].

Herein, we investigate in the present paper we study the effect of NoAD and CA in inducing the production of Nitric Oxide, IL-8, IL-4 and IL-10 in human granulocytes from different age range.

Results

NoAD and CA lose the ability to modulate the production of NO during aging process

Our results (Figure 1-panel A) showed that in the age group from 20-39 years showed a significant increase in the production of NO by granulocytes, when they were incubated with NoAD or CA, compared to the control group (RPMI + granulocytes) (p<0.05). The values expressed as millimolar (mM) were 11,51 for NoAD and 14,66 for CA in comparison with 5,87 for control group.

For group from 40-59 only CA was able to induce the increase in secretion of NO by granulocytes. (Figure 1-panel B). Both NoAD and CA were not able to activate the production of NO in granulocytes from age group of 60-80 years (Figure 1-panel C).

ASMHS2018-101-RaquelCunhaLaraBrazil_F1

Figure 1. Norepinephrine and Caffeic Acid lose the ability to modulate the production of Nitric oxide during aging process. The values represent the mean ± S.E. Nitric Oxide (NO) production was expressed as mM. G = granulocyte, NoAD = Norepinephrine, CA = Caffeic Acid. *Significant (p<0,05) when compared with control (G) by ANOVA and Tukey post-test.

Effect of NoAD and CA on the production of IL-8: pro-inflammatory profile

Our results in the age group 20-39 years showed a significant difference (p<0.05) in IL8 production by granulocytes when they were stimulated by CA compared to the control group (RPMI + granulocytes) (p<0.05). The IL-8 production decreased 88%. But NoAD activates the secretion of proinflammatory cytokine (IL-8) in 32% (Table 1, 2).

Table 1. Effect of Norepinephrine and Caffeic Acid on the production of IL-8 (pro- inflammatory profile) and IL-4 and IL-10 (anti-inflammatory profile)

Protocols

20-39 years

IL-8 (pg/ml)

IL-4 (pg/ml)

IL-10 (pg/ml)

G

991 ± 89

172 ± 19

178 ± 16

G+NoAD

1.313 ± 120 *

 289 ± 20 *

169 ± 10

G+CA

 120 ± 95 **

 163 ± 17

164 ± 18

40-59 years

IL-8 (pg/ml)

IL-4 (pg/ml)

IL-10 (pg/ml)

G

193 ± 14

159 ± 12

117 ± 14

G+NoAD

246 ± 17*

165 ± 14

107 ± 9

G+CA

132 ± 11*

153 ± 16

 65 ± 4 *

60-80 years

IL-8 (pg/ml)

IL-4 (pg/ml)

IL-10 (pg/ml)

G

75 ± 3

113 ± 10

94 ± 5

G+NoAD

75 ± 4

130 ± 12

84 ± 4

G+CA

 58 ± 2*

104 ± 5

 64 ± 3 *

The values represent the mean ± S.E. Interleukin production was expressed as pg/ml. G = granulocyte, NoAD = Norepinephrine , Ac = Caffeic Acid. (*) and (**) was Significant (p<0.05) and (p<0.01) respectively, when compared with control (G) by ANOVA and Tukey post-test

Table 2. Demographic characteristics of the studied groups.

Subjects

30 Male

30 Female

Parameters

Values (mean ± S.D.)

Values (mean ± S.D.)

Age groups (years)

20-39

32.3 ± 6

ns

29.8 ± 5

40-59

52.1 ± 4

ns

50.2 ± 5

60-80

76,3 ±7

ns

66.9 ± 6

MEDIUM

53,6 ± 6

ns

48.9 ± 5

Body Mass Index (kg/m2)

20-39

22.4 ± 2

ns

21.8 ± 3

40-59

28.8 ± 3

ns

27.5 ± 3

60-80

24.4 ± 3

ns

28.5 ± 4

MEDIUM

25.2 ± 3

ns

25.9 ± 3

Glycohemoglobin (GHb%)

20-39

4.0 ± 0,1

ns

3.9 ± 0,3

40-59

5.4 ± 0,3

ns

5.5 ± 0,3

60-80

5.5 ± 0,4

ns

5.6 ± 0,2

MEDIUM

4.9 ± 0,3

ns

5.0 ± 0,3

Triglycerides (mg/dL)

20-39

102.4 ± 38

ns

101.8 ± 29

40-59

130.0 ± 57

ns

127.7 ± 43

60-80

164.3 ± 20

ns

153.5 ± 23

MEDIUM

132.2 ± 38

ns

127.7 ± 32

Serum creatinine (mg/dL)

20-39

0.979 ± 0,161

ns

0.821 ± 0,161

40-59

0.921 ± 0,152

ns

0.800 ± 0,152

60-80

0.994 ± 0,176

ns

0.900 ± 0,170

MEDIUM

0.965 ± 0,163

ns

0.840 ± 0,161

ns= non-significant by the Mann-Whitney test.

Body Mass index: Normal range= 18,5 – 24,99kg/m2 (World Health Organization, 2000)

Glycohemoglobin: Normal value ≤ 5,7% (American Diabetes Association, 2011)

Triglycerides: Normal range< 150mg/dL (American Heart Association, 2009)

Serum creatinine: Normal range: 0,5-1,5 mg/dL for males and 0,6 – 1,2 mg/dL for females (NCCLS, 2000)

Our results in the age group 40-59 years showed difference (p<0.05) in the production of IL-8 by granulocytes when they were stimulated by NoAD (increase of 27%) or CA decrease of 31%) (Table 1).
In the age group of 60-80 years found no significant difference (p>0.05) was observed for the production of IL-8 when granulocytes were incubated with NoAD. But, CA inhibited IL-8 secretion 22% (p<0.05) in relation the control group.

Effect of NoAD and CA on the production of IL-4 and IL-10: anti-inflammatory profiles

Our results in the age group from 20-39 years, NoAD induced an IL-4’s secretion (68%) by granulocytes in relation to the control group (RPMI + granulocytes) (p<0.05). CA was not effective on IL-4’s secretion. The secretion of IL-10 by granulocytes showed no significant difference (p>0.05) when that cells were stimulated by NoAD or CA (Table 1).

Our results showed age group from 40 to 80 years showed that IL-4 production by granulocytes stimulated by in the presence of NoAD or CA was not affected (p>0.05) (Table 1). Similar results were observed the production of for IL-10 was not significant (p>0.05) granulocytes were incubated with NoAD (Table 2). In the contrast, we observed a significant decrease in IL-10’s secretion by granulocytes (p<0.05) incubated with CA (44% and 32%) in the age group from 40-59 and 60-80 years respectively.

Inhibitory effect of CA on the action of NoAD: process aging dependent?

Our findings clearly show a decrease of CA action on stimulatory effect of NoAD on NO production by human granulocytes during the aging process. We observed in the group from 20-39 years (49% activation), 40-59 years (34% inhibition) and 60-80 years (38% inhibition) effect of CA on NoAD in human granulocytes (Figure 2).

When evaluating the profile of interleukin pro and anti-inflammatory found that a decrease in the running action of CA on the stimulatory action of NoAD in the production of IL-8 by human granulocytes during aging 91% (20-39 years) 54% (40-59 years) and 16% (60-80 years) (Figure 3 and panel A). Evaluating the anti-inflammatory interleukins also found the same profile. IL-4 ranges of 20-39 years (22%), 40-59 years (17%) and 60-80 years (3%) inhibition (Figure 3 and panel B). Our findings with IL-10 showed range of 20-39 years (16% activation), 40-59 years (18% inhibition) and 60-80 years (16% inhibition) effect of CA on NoAD in human granulocytes. (Figure 3 and panel C).

ASMHS2018-101-RaquelCunhaLaraBrazil_F2

Figure 2. Lack modulating effect of Caffeic Acid on the action of Norepinephrine in Nitric Oxide production: process aging dependent. The values represent the mean ± S.E. Nitric Oxide (NO) production was expressed as mM*Significant (p<0,05) when compared with control (G) by ANOVA and Tukey post-test.

ASMHS2018-101-RaquelCunhaLaraBrazil_F3

Figure 3. Lack modulating effect of Caffeic Acid on the action of Norepinephrine in Interleukins production: process aging dependent. *Significant (p<0,05) when compared with control (G) by ANOVA and Tukey post-test.

Discussion

The immune system undergoes profound transformations with age, and response patterns to immunological challenges are therefore highly age dependent. Changes that occur in humans after the age of 50 years have received particular attention because of their clinical impact. Such changes have been globally called ‘immunosenescence’. The most widely appreciated consequence of advanced age is diminished effectiveness of the immune system. However, immunosenescence is multifaceted and also includes an enhanced susceptibility to autoimmunity that is conceptually difficult to reconcile with the impaired responsiveness of the adaptive immune system as well as constitutive low-grade inflammation that may contribute to a plethora of degenerative diseases, including cardiovascular disease, neurodegenerative syndromes and age-specific ailments such as frailty [16].

In this context, the immune system has many properties of great importance for survival. The various stimuli captured by the brain during different situations can act beneficial or detrimental on the immune system, triggering a series of reactions with important consequences. Among these stimuli stress deserves [17].

NO is a key signaling molecule in the cardiovascular, immune and central nervous systems (CNS), and crucial steps in the regulation of NO bioavailability in health and disease are well characterized [18]. The generation of NO by neutrophils is involved in its antimicrobial function. This molecule has been identified as a modulator of various signaling cascades that regulate various functions such as adhesion, chemotaxis, phagocytosis, and respiratory burst, modulation of apoptosis and generation of free radicals [19]. Furthermore, NO has a complex physiological role in the CNS and regulating neuroendocrine functions. It has a substantial capacity to affect dopaminergic, serotonergic and noradrenergic neurotransmission [20].
Studies demonstrated that CA modulates endothelial NO production in a dose-dependent manner. In experimental model, kidney ischemia-reperfusion injury, CA in which this compound significantly reduced tubular cell apoptosis and granulocyte infiltration [21]. Our results (Figure 1-panel A) demonstrate that CA is able to activates NO releasing from granulocytes in 20-39 age group.

We also found that there was a significant increase (p<0.05) in the production of NO in the age group from 20-39 years when granulocytes were incubated with NoAD (Figure 1-panel A). Gadek-Michalska and Bugagiski have reported that NoAD increases the in vitro synthesis of NO in the medial basal hypothalamus through α 1-adrenergic receptors [20].

CA increased NO releasing by granulocytes in 20-39 and 40-59 ages groups in similar manner (Figure 1-panel B). CA was able to increase NO levels, thus demonstrating its continuing role as a cell protector, mainly neuroprotective in this age group.

However, when we analyze the in the presence of effect of NoAD verified that this was not significantly (p>0.05), the production of NO was not significantly found in younger individuals (Figure 2-Panels A and B). Here we try to identify some things that may be guiding this failure: 1- failure of the regulatory mechanisms of the HPA axis, 2- a possible inefficiency in awareness receptor α 1-adrenergic stimulation, 3- a deficiency in the NoAD on NO synthase (the enzyme responsible for the synthesis NO).
In the Age group from 60-80 years showed that NoAD and CA were not able to change (p>0.05) the production of NO (Figure 1-panel C). These results may signal that during the aging process there is a reduction of the sympathetic response that may be justified mainly by the decrease in sensitization of adrenergic receptors α 1- adrenergic. It is suggested that changes in the production of NO leads to activation of iNOS (induced NO synthase) generating a pro-inflammatory response that may be one of the factors that contribute to aging and neurodegenerative diseases [22].

Neuroendocrine hormones are considered to play major roles in the regulation of homeostasis under stressful environments. Catecholamines (CAs) including NoAD are the first hormones in response to physiological stress trigger a broad spectrum of biochemical and physiological alterations including hyperglycemia and modulation of immunity. Researchers by Zhang, et al. demonstrated the inhibited immune responses and resistance against bacterial infection were observed in both Litopenaeus vannamei and M. rosenbergii received NoAD by injection [11]. These results illustrate the importance of the sympathetic nervous system in modulating immunological pathological and non-pathological conditions.

Our results showed aged group from 20-39 years increased (p<0.05) the production of IL-8 (proinflammatory cytokine) when granulocytes were stimulated with NoAD (Table 1). When evaluating the production of anti-inflammatory cytokines we observed an increased (p<0.05) the production of IL-4 but not IL-10 (Table 1). These results show that at this age the IL-4 is who participates in these anti-inflammatory mechanisms and that really CAs may modulate the inflammatory profile in young individuals which realize a balance between cytokines pro and anti-inflammatory. These results demonstrate possibly efficient communication between the immune system and the regulation of the HPA axis by neurohormones such as NoAD to maintain balance pro and anti-inflammatory.

Oxidative stress can increase cytokine production via several different mechanisms. Therefore, during the inflammatory process, oxidizing molecules increase the production of interleukins (IL-8 and IL-6) and TNF-alpha in response to inflammatory stimuli and cytokines increase the production of oxidants setting up a vicious cycle [23,24]. In addition to antioxidant defense acts directly or indirectly protecting the body from attacks of cytokines and oxidizing. It is believed that the antioxidants protect indirectly by reducing the activation of signaling pathways, preventing therefore the stimulation of cytokine oxidants [25].

Our results showed that CA significantly decreased (p<0.05), the production of IL-8 in the age group of 20-39 years (Table 1). However we did not observe significant results (p>0.05), when evaluating the production of IL-4 and IL-10. These results showed that CA can act as a potent anti-inflammatory phenolic acid as this could reduce by more than 90% the production of IL-8 in young individuals (Table 1).

Assessing the age group of 40-59 years found that NoAD increased (p<0.05), the production of IL-8 but did not change (p>0.05) the production of both IL-4 and IL-10 (Table 1). The results for CA have shown that this did not affect the production of IL-4, but decreases the production of IL-8 and IL-10 (Table 1).

Aged 60-80 years found that NoAD did not change (p>0.05) the production of IL-8 and neither of the cytokines (p>0.05), IL-4 and IL-10 (Table 1). The results for CA have shown that this did not affect the production of IL-4 but decreases the production of IL-8 and IL-10, as seen in the age group 40-59 years (Table 1).

Our results are reinforce previous results Chaves et. al. on deficiency of IL-10 during the aging process. Moreover, this reduced production of IL-8 by CA may be related to antioxidant mechanisms that are deficient in aging and which is a potent anti-oxidant contribute to the reduction of the framework [6,7].Thus, our results showed here a profile change where we find a framework favoring the balance pro-inflammatory and oxidative signs of senescence, which is characterized as a chronic inflammatory process and stress.

Aging results in a progressive decrease and general functions of the body, decreasing the ability to react to adaptive changes, and maintain homeostasis. Evidences show that the immune system can initiate state oxidative and inflammatory uncontrolled factors which are linked to the aging process and affect all cells of the body but especially neuroimmunoendocrine system cells [26]. Another aspect is that the antioxidant systems may exert a neuroprotective role by protecting the nervous tissue degeneration caused by ischemia or as a result of chronic neurodegenerative diseases [27]. Endogenous antioxidant defenses can be both non-enzymatic (uric acid, glutathione, bilirubin, thiols, albumin, vitamins and phenols) and enzymatic (superoxide dismutases, glutathione peroxidase and catalase) [28]. The levels of glutathione and these antioxidant enzymes are much lower in the CNS as compared to erythrocytes and peripheral tissues [29,30].

Next context to evaluate the modulating effect of CA on the action of NoAD in the production of NO found that aged group from 20-39 years there is an upregulation (increased production of nitric oxide) which can configure the protective action of NO in this age group (Figure 2). However, when we analyzed the age groups from 40-80 years found an inhibition (p<0.05) NO production when CA was incubated with NoAD compared with the age group from 20-39 years (Figure 2). This table denotes a loss of antioxidant CA in these age groups which can cause systemic and nervous damage.

In evaluating the modulating action the CA on NoAD aged group from 20-39 years found that it is able to increase the production of cytokines both pro and anti-inflammatory setting a balance between these systems (Figure 3 – panels A, B and C). When we evaluated the age group from 40-59 years observed a significant decrease (p<0.05) the production of IL-8 and IL-10 and one did not change (p>0.05) the production of IL-4 when compared to age group from 20-39 years (Figure 3-panels A, B and C). In the age group 60-80 years observed a decrease (p<0.05) marked production of both interleukins pro (IL-8) as anti-inflammatory (IL-4 and IL-10) (Figure 3-panels A, B and C). In establishing this framework we realized that NoAD can no longer modulate the inflammatory cytokine profile and that there is a significant decay of the contribution of CA as an antioxidant and / or anti-inflammatory.

Therefore, our findings aid in the elucidation of important metabolic points that are part of neuroimmunoendocrine regulation. The aging reflects the sum of many changes that occur in humans during life. The association between age and decreased function of the immune system increases susceptibility to several neurodegenerative diseases. Within this context our work raised several questions in which demonstrated that there is need for further study the molecular mechanisms that are involved in neuroimmunoendocrine systems especially with regard to the adrenergic pathway because it proved to be important in maintaining homeostasis between the immune endocrine and nervous systems.

Experimental Procedure

Reagents

The concentrations of Interleukin 8 (IL-8), Interleukin 4 (IL-4), and Interleukin 10 (IL-10) were measured by sandwich ELISA using kit supplied by Assay Designs (Ann Arbor, MI, USA).

Subjects

The Ethical Committees of Federal University of Minas Gerais (UFMG) approved this study (CAAE 0663.0.203.000-11). A detailed medical history, physical examination and laboratory data for each subject were recorded four weeks before entering the study. Appropriate informed consent was obtained from each participant. According to the Senior protocol for the study of immune function in the elderly, [31], 45 people were excluded from a total of 105 because they showed conditions which were not suitable for the admission criteria (i.e. smokers, infections, inflammation, malignancy, lymphoproliferative disorders, arteriosclerosis, cardiac insufficiency, hypertension, dementia, pregnancy, alcoholism and drug abuse) and/or were taking known drugs that directly influence the immune function. Subjects were divided into three age groups with 10 males and 10 females in each, aiming equality in the number of subjects from each group, and selected by authors ENM and MTGC (Reference Center of Age – Professor Caio Benjamin Dias from Hospital das Clínicas-UFMG). These subjects live in Belo Horizonte, Brazil. The demographic characteristics of the population are shown in Table 2.

Cell separation

The granulocytes were purified from 10 ml of heparinized venous blood from subjects distributed into tree age groups: 20-39 years, 40-59 years and 60-80 years. The cells were isolated by Ficoll-Hypaque gradient according to Bicalho et al. [32] with slight modifications. Briefly, the neutrophils were separated through the centrifugation of cells over two gradients with density of 1.08 and 1.13 in order to obtain, simultaneously, the separation of mononuclear cells and granulocytes, respectively. The purity of the preparation of granulocytes was 95-100%. The viability of each sample was always greater than 98% as determined by the Trypan Blue exclusion test.

Dose-response curve

A dose-response curve was obtained by adding increasing concentrations of NoAD(10-12 M, 10-11 M, 10-10 M, 10-9 M, 10-8 M, 10-7 M) and CA (13 μM, 32 μM, 80 μM, 200 μM, 500 μM, 1250 μM). The best concentration of NoAD was (10-9 M) and CA (500 μM), which reflected a lower cell death (5% and 7% respectively) and a greater biological effect.

Nitric Oxide (NO) production-Griess reaction

The quantification of nitric oxide was carried out by measuring nitrite second studies by Griess [33]. 100 μL granulocytes were incubated in the presence or absence of NoAD (10-9 M) and CA (500 μM). In all experiments the final volume was adjusted to 300μl with RPMI pH 7.4. Granulocytes were maintained in cell culture plates of 24 wells, incubated at 37° C and 5% CO2 for 16 h. After these 16 hours, the granulocytes were centrifuged at 2500 rpm for 15 minutes. The supernatant was collected and used for determination of nitrite. The pellet was resuspended in 200μl of RPMI pH 7.4 and immediately subjected to cell viability analysis. For measurement of nitrite, 100 μL of supernatant was used, which were placed in 96-well plates. To the supernatant was added 100 μL of a solution Griess, which is formed sulfanilamide 1% in 2.5% phosphoric acid and 0.1% naphthylethylenediamine in 2.5% phosphoric acid in a 1: 1 ratio. The contents of the plate were analyzed by ELISA reader at 540 nm. The nitrite concentration was calculated by linear regression using a standard curve obtained from a solution of sodium nitrite and 1mM RPMI.

Determination of IL-8, IL-4 and IL-10 in the supernatant of Granulocytes

Aliquots (3 mL) of the suspension of granulocytes (1 x 10⁶ cells/100 µL RPMI-1640 medium) were incubated in the presence or absence of NoAD or CA under 5% CO2 for 16 hours at 37oC. Following incubation, the cells were centrifuged and the supernatant, collected. The concentrations of IL-8, IL-4 and IL-10 were measured by sandwich ELISA using kit supplied by Assay Designs (Ann Arbor, MI, USA) according to supplier instructions. The levels of cytokine were determined using standard curves for IL-8, IL-4 and IL-10, respectively.

Statistical analysis

All results were analyzed by ANOVA and Tukey post-test using GraphPad Prism version 5.00 for windows (San Diego, CA). p<0.05 was considered to indicate statistical significance.

Conflict of interest: The authors confirm that this article content has no conflict of interest.

Acknowledgements: The authors thank Gláucia A.A. Carvalho for excellent technical assistance. FAPEMIG CNPq and IVC Health- testes em saúde humana LTDA supported this paper.

References

  1. Pereira A, Freitas C, Mendonça C, Marçal F, Souza J, et al. (2004) Aging, stress and society: a psychoneuroendocrine view. Science and Cognition 1: 34–53.
  2. Vitale G, Salviole S, Franceschi C (2013) Oxidative stress and the ageing endocrine system, Nature Rev Endocrinol 9: 228–240. [crossref]
  3. Campisi J (2013) Aging, Cellular Senescence, and Cancer. Annu Rev Physiol 75: 685–705. [crossref]
  4. Hoffmann J, Spyridopoulos I (2015) Senescent cytotoxic T cells in acute myocardial infarction: innocent bystanders or the horsemen of apocalypse? Cell Mol Immunol 12: 510–512. [crossref]
  5. Harman D (1981) The aging process. Medical Science Proc Natl Sci US 78: 7124–7128. [crossref]
  6. Chaves MM, Costa DC, Oliveira BF, Rocha MI , Nogueira-Machado JA (2009) Role PKA and p38 MAPK on ROS production in neutrophil age-related: Lack of IL-10 effect in older subjects. Mech Ageing Dev 130: 588–591. [crossref]
  7. Chaves MM, Rocha-Vieira E, Lima e Silva R, Machado-Nogueira JA (1998) Host defenses in aged: evaluation of the balance between oxidizing species generation and reducing power in phagocyting human granulocytes. Mech Ageing Dev 104: 103–109.
  8. Chaves MM, Rocha-Vieira E, Reis AP, Lima e Silva R, Gerzstein NC, et al. (2000) Increase of reative oxygen (ROS) and nitrogen (RNS) species generated by phagocyting granulocytes related to aged. Mech Ageing Dev 119: 1–18.
  9. Alves GJ, Palermo J (2007) Neuroimmunomodulation: the cross-talk between the nervous and immune system. Rev Brasil Psiquiatr 29.
  10. Chang CC, Tsai WL, Jiang JR, Cheng W (2015) The acute modulation of norepinephrine on immune responses and genes expressions via adrenergic receptors in the giant freshwater prawn, Macrobrachium rosenbergii. Fish Shellfish Immunol 46: 459–467. [crossref]
  11. Zhang M, Zhou J, Wang L, Li B, Guo J, et al. (2014) Caffeic Acid Reduces Cutaneous Tumor Necrosis Factor Alpha (TNF α),IL-6 and IL-1β Levels and Ameliorates Skin Edema in Acute and Chronic Model of Cutaneous Inflammation in Mice. Biol Pharm Bull 37: 347–354. [crossref]
  12. Minciullo PL, Catalano A, Mandraffino G, Casciaro M, Crucitti A, et al. (2015) Inflammaging and Anti-Inflammaging: The Role of Cytokines in Extreme Longevity. Arch Immunol Ther Exp (Warsz) 64: 111–126. [crossref]
  13. Mallik SB, Mudgal J, Nampoothiri M, Hall S, Dukie SA, et al. (2016) Caffeic acid attenuates lipopolysaccharide-induced sickness behaviour and neuroinflammation in mice. Neurosci Lett 632: 218–223. [crossref]
  14. Tracey KJ (2009) Reflex control of immunity. Nat Rev Immunol 9: 418–428. [crossref]
  15. Szelényi J, Vizi ES (2007) The catecholamine cytokine balance: interaction between the brain and the immune system. Ann N Y Acad Sci 1113: 311–324. [crossref]
  16. Goronzy JJ, Weyand CM (2013) Understanding immunosenescence to improve responses to vaccines. Nat Immunol 14: 428–436. [crossref]
  17. Bauer ME (2005) Stress, glucocorticoids and ageing of the immune system stress. Stress 8: 69–83. [crossref]
  18. Lundberg JO, Gladwin MT, Weitzberg E (2015) Strategies to increase nitric oxide signalling in cardiovascular disease. Nat Rev Drug Discov 14: 623–641. [crossref]
  19. Kobayashi SD, Deleo FR (2009) Role of neutrophils in innate immunity: a systems biology-level approach. Wiley Interdiscip Rev Syst Biol Med 1: 309–331. [crossref]
  20. Gadek-Michalska KA, Bugajski G (2008) Nitric oxide in the adrenergic-and crh-induced activation of hypothalamic-pituitary-adrenal axis. J Physiol Pharmacol 59: 365–378. [crossref]
  21. Migliori M, Cantaluppi V, Mannari C, Bertelli AA, Medica D, et al. (2015) Caffeic Acid, a Phenol Found in White Wine, modulates Endothelial Nitric Oxide Production and Protects from Oxidative Stress-Associated. Endothelial Cell Injury. PLoS One 10. [crossref]
  22. Navarro A, Boveris A (2008) Mitochondrial nitric oxide synthase mitochondrial brain dysfunction in aging and mitochondrial-targed antioxidants. Adv Drug Deliv Rev 60: 1534–1544. [crossref]
  23. Elmarakby AA, Sullivan JC (2012) Relationship between Oxidative Stress and Inflammatory Cytokines in Diabetic Nephropathy. Cardiovasc Ther 30: 49–59. [crossref]
  24. Bianca VD, Dusi S, Bianchini E (1999) Beta- amyloide activates the o-2 forming NADPHoxidase in microglia, monocytes,neutrophils. A possible inflammatory mechanism of neuronal damage in Alzheimer’s disease. J Biol Chem 274: 15493–15499. [crossref]
  25. Grimble RF (1994) Nutritional antioxidants and the modulation of inflammation: theory and practice. New Horiz 2: 175–185. [crossref]
  26. De La Fuente M, Miquel J (2009) An update the oxidation-inflammation theory of aging: the involvement of the immune system in oxi-inflamm-aging. Curr Pharm Des 15: 3003–3026. [crossref]
  27. Rafii MS, Aisen PS (2009) Recent developments in Alzheimer’s disease therapeutics. BMC Med 7: 7. [crossref]
  28. Fusco D, Colloca G, Lo Monaco MR, Cesar M (2007) Effects of antioxidant supplementation on the aging process, Clin Interv Aging 2: 377–387. [crossref]
  29. Floyd RA , Hensley K (2002) Oxidative stress in brain aging. Implications for therapeutics of neurodegenerative diseases. Neurobiol Aging 23: 795–807. [crossref]
  30. Chalimoniuk M, Jagsz S, Sadowska-Krepa E, Chrapusta SJ, Klapcinska B, et al. (2015) Diversity of endurance training effects on antioxidant defenses and Oxidative damage in different brain regions of adolescent male rats. J Physiol Pharmacol 66: 539–547. [crossref]
  31. Ligthrt GJ, Corberand JX, Fournier C, Galanaud P, Hijmans IN, et al. (1984) Admission criteria for immunogerontological studies in man the senieur protocol. Mech Ageing Dev 28: 47–55. [crossref]
  32. Bicalho HMS, Gontijo MC, Nogueira-Machado JA (1981) A simple techinique for simultaneous human leockocytes separation. J Immunol 40: 115-116.
  33. Griess P (1864) One a new of bodies in which nitrogen is substituted for hydrogen. Philos Trans R Soc Lond 154: 667–723.

Osteosarcoma of Eighth Rib: A Case Report

DOI: 10.31038/CST.2018313

Abstract

In children and adolescents, primary osteosarcoma is one of the most common malignant bone tumors. It principally affects the long bones, especially in the distal femur, proximal tibia and proximal humerus. Osteosarcoma rarely arises from flat bone, and as in this patient’s case, osteosarcoma of the rib is very infrequent.  To the best of our knowledge, this is the first reported case of rib osteosarcoma in our country. Here we report a case of conventional rib osteosarcoma presenting as chest pain and mass that successfully had complete pathologic response with clear margins after four cycles of neoadjuvant therapy.

Introduction

Osteosarcomas principally originate in the metaphysis of the long bones. Approximately 10% of osteosarcomas originate in the flat bones, with the pelvis being the main site. Roughly 1 – 2% of osteosarcoma occur in the thoracic bones inclusive of the ribs, sternum, and clavicle [1].  The prevalence of osteosarcoma is in the second decade of life with another spike in older individuals after radiation or Paget’s disease [2]. Osteosarcoma of the rib have been reported in older children ranging from 7 to 13 years of age [3].  Diagnosis of osteosarcoma of the rib is a challenge for most physicians since the commonest presentation is pain and a palpable chest wall mass. The lesion is usually observed on a chest radiograph as a soft tissue mass. Limiting factors for its diagnosis is the difficulty visualizing typical periosteal reaction, rib destruction and calcifications within the mass in a chest radiograph compared to the site of the tumour if it were in a long bone. We present rare location of an osteosarcoma which posed a diagnostic challenge to both the pathologist and the physician in a young male.

Case Report

This is a case of an 18 year old Filipino male, apparently well until two months before consult, noted intermittent right upper quadrant pain. He later palpated a pea sized firm, movable, non-tender mass at the right upper quadrant area. Neither medications nor consult done until two months later noted gradual progression of the mass. It was approximately 3 x 3 cm in size with intermittent pain and occasional dyspnea. Consult done to a local hospital where chest radiograph was done revealing right pleural effusion. Underwent chest thoracostomy tube insertion was cytology negative for malignancy. Chest Computed tomography (Figure 1) done June 2016 revealed lobulated heterogenously enhancing mass lesion in antero-inferior aspect of right hemithorax measuring 5.3x 5.4 x 5.01 cm. Right paratracheal subcentimeter lymph nodes. Abdominal CT scan was unremarkable. Patient underwent excision biopsy of the mass at eighth rib revealed conventional osteosarcoma, osteoblastic type high grade
(Figures 2 and 3). Tumor size of 3.5 cm, no definite vascular invasion with tumor invasion into extra-osseous soft tissues and present in inked tissue edges. Diaphragmatic tumor was also noted to be high grade osteosarcoma.

CST2018-102-AmabelleTrinaGeronaPhilippines_F1

Figure 1. lobulated heterogeneously-enhancing mass lesion in the antero-inferior aspect of the right hemithorax measuring 5.3 × 5.4 × 5.01 cm   in cranio-caudad, transverse and antero-posterior diameters. Mass cannot be separated from the expanded and lytic change anterior aspect of the right 8th rib with associated overlying soft tissue swelling and indentation into the superior-anterior margin of right hepatic lobe

CST2018-102-AmabelleTrinaGeronaPhilippines_F2

Figure 2. Low power field magnification

CST2018-102-AmabelleTrinaGeronaPhilippines_F3

Figure 3. High power field magnification several highly atypical spindle cells producing tumor osteoid. The cells have enlarged, hyperchromatic nuclei with prominent nucleoli. Brisk mitotic activity is seen.

He was referred to a Medical Oncologist where he underwent four sessions of neoadjauvant chemotherapy from June 23-August 29, 2016 with Doxorubucin (25mg/m2) and Cisplatin (50mg/m2) days 1-3 every 21 days. He tolerated the therapy well, no adverse events. Re-evaluation scans done September 27, 2016 showed Interval resolution of right sided pleural effusion. Right 7th anterior rib is surgically absent with stable post interventional change in right serratus anterior muscle. He was then referred to Thoracic Surgeon for surgery. Pre-operative pulmonary function test was unremarkable. He underwent video-assisted thoracic surgery, right converted to thoracostomy with chest wall reconstruction using bone cement for four hours and 26 minutes. Post-operative findings were dense pleural adhesions from apex down to diaphragm, no gross tumor noted along chest wall, diaphragm and pleura. Resection extended one rib above and one rib below (6th and 8th ribs). Specimen was sent to histopathology laboratory with later findings of fibrosis, haemorrhage and negative for tumor of pleural nodule and right lateral chest wall (Figures 4, 5 & 6).  No residual tumor and negative lines of resection for the 6th and 8th ribs.

CST2018-102-AmabelleTrinaGeronaPhilippines_F4

Figure 4. Pleural Nodule, Right, Lateral Chest Wall, Diaphragm: Fibrosis, Old haemorrhage. No tumor present

CST2018-102-AmabelleTrinaGeronaPhilippines_F5

Figure 5. Ribs 6-8th, chest wall resection: No residual tumor, fibrosis, granulation tissue

CST2018-102-AmabelleTrinaGeronaPhilippines_F6

Figure 6. Pleural Nodule, Diaphragm, Right, Parietal Pleura: fibrosis and granulation tissue formation. Negative for tumor

Surveillance studies done on the 3rd, 6th and 9th month post-surgery were unremarkable. Chest CT scan (Figure 7) done did not show discrete enhancing mass in the anterolateral chest wall to suggest tumor recurrence and enlarged lymph nodes. Latest CT scan done July 21, 2017. Patient is back to school with no symptoms.

CST2018-102-AmabelleTrinaGeronaPhilippines_F7

Figure 7. Surveillance chest CT scan: The RIGHT antero-lateral 6th to 8th ribs are surgically absent. No pulmonary mass or nodule.

Discussion

Chest computerized tomography examination is useful for identification and characterisation of the mass. Invasion to deeper structures like the muscles, pleura and lungs can also be accurately assessed with the aid of a CT scan as compared to plain radiograph. CT would be a more cost effective modality for evaluating the tumour since a magnetic resonance imaging (MRI) may not offer any additional information.3  Therefore, accurate diagnosis is an essential component in survival of these patients. Histopathological diagnosis is imperative in instituting a definite therapy. The classic feature of a ramifying osteoid matrix laid down by the neoplastic cells clinches the diagnosis and enables one to exclude all the other possible differentials.

Conventional osteosarcomas are the most aggressive osseous neoplasms. The overall prognosis of osteosarcoma in flat bones remains poor because of the difficulty of complete excision. The guidelines for management and the prognosis and survival rates in rib primary OS is not clear due to the small number of cases studied. However, there is documentation of better survival in patients who have had a complete resection of their tumor at the time of surgery [4]. A local wide excision with removal of the involved ribs and subsequent reconstruction using a mesh followed by adjuvant chemotherapy and radiotherapy may improve survival in these patients. Although osteosarcoma of flat bones is rarely associated with metastasis, it is still advised to include a CT scan of the thorax, chest x-rays, and bone scans as part of the diagnostic tool in order to look for metastasis.

The treatment of osteosarcoma generally consists of local excision with a wide margin [5]. It still remains to be unresolved exactly what size of margin is optimal. Palliative chemotherapy or radiotherapy may also be considered for those who undergo a palliative surgery since >80% of patients, local recurrence appears in the absence of a wide resection.

Conclusion

This case highlights the importance of including the diagnosis of osteosarcoma, although rare, as a differential diagnosis of primary malignant neoplasm of the rib. Point tenderness in the young also warrants further investigation for it may just be the sole manifestation of a treatable case as morbid as malignancy.

References

  1. Mirra JM, Gold RH, Picci P (1989) Osseous tumors of intramedullary origin. In: Mirra JM, editor. Bone Tumors: Clinical, Radiological, and Pathological Correlations. Philadelphia: Lea and Febiger; 143–438.
  2. Burt M,  Fulton M, Wessner-Dunlap S, Karpeh M, Huvos AG, et al. (1992) Primary bony and cartilaginous sarcomas of chest wall: results of therapy. Ann Thorac Surg 54: 226–232. [crossref]
  3. Deitch J,  Crawford AH, Choudhury S (2003) Osteogenic sarcoma of the rib: a case presentation and literature review. Spine (Phila Pa 1976) 28: E74–77. [crossref]
  4. Xu, J. and Yao, Q. and Hou, Y. and Xu, M. and Liu, S. and Yang, L. and Zhang, L. and Xu, H (2013) MiR-223/Ect2/p21 signaling regulates osteosarcoma cell cycle progression and proliferation. Biomedicine and Pharmacotherapy. 67: 381–386
  5. Funovics PT, Bucher F, Toma CD, Kotz RI, Dominkus M (2011) Treatment and outcome of parosteal osteosarcoma: biological versus endoprosthetic reconstruction. J Surg Oncol 103:782–9.

Cushing’s Disease (Micro-Adenoma) Associated with Sudden Blindness in a Dog

DOI: 10.31038/CST.2018312

Abstract

An overlap clinical and biochemical can occur between dogs with sudden acquired retinal degeneration syndrome (SARDS) and those with blindness by hyperadrenocorticism (HAC). A 13-year-old, cross-breed female dog showing recent signs of polyphagia, swollen abdomen and sudden blindness was examined. The flat electroretinography was consistent with bilateral retinal damage. The biochemical tests for the diagnosis of HAC were inconclusive when the blindness was established. However, HAC was confirmed two months after through the urine cortisol: creatinine ratio (UCCR: 69.4 × 10⁻⁶, RV: <10), plasmatic cortisol 1-hour post-ACTH (21.7 µg/dl, RV: <17) and 8-hour post-low dose dexamethasone suppression test (LDDST: 2.9 µg/dL, RV: <1.5). A basophilic microadenoma of the adenohypophysis (2.3 x 1.3 mm) with immunopositivity for ACTH was identified by histopathology. The final diagnosis was pituitary-dependent hyperadrenocorticism (PDH). This report, demonstrates through histopathology the association between a corticotropinoma and the sudden blindness by retinal damage in a dog with Cushing’s syndrome. In addition, it highlights the importance of timely use of the various hormonal tests for the correct diagnosis of HAC.

Keywords

ACTH, electroretinography, hyperadrenocorticism, pituitary, SARDS

Introduction

Sudden blindness with normal ophthalmoscopy and absence of electroretinography (ERG) response may be seen in dogs with PDH, but also with SARDS [1-4]. Likewise, dogs with SARDS may display systemic signs of HAC such as polyphagia (PF), polyuria (PU), polydipsia (PD), weight gain and biochemical changes (e.g., increase in serum alkaline phosphatase [SAP], total cholesterol [TChol]) in more than 80% of cases [3,4]. In the light of these arguments, there is a clear clinical and biochemical overlap between these two entities where blindness is irreversible [4]. In PDH cases, non-treatment may lead to the onset of numerous comorbidities (e.g., diabetes mellitus, hypertension, dyslipidemia) that can dramatically decrease survival [3, 5]. The confirmation or exclusion of its diagnosis is therefore essential.

This case offers the first histopathological evidence of the connection between a functional corticotropinoma (micro-adenoma) and sudden blindness caused by retinopathy.

Case report

A 13-year-old, cross-breed, neutered female dog weighing 12.5 Kg was referred for evaluation for sudden blindness. Additionally, it suffered from PF (two weeks before blindness), muscle atrophy in limbs, swollen abdomen and excessive panting (Figure 1). Negative response to threat test, slightly mydriatic pupils, photomotor reflex negative response, normal fundus with intraocular normotension and a flat ERG were consistent with retinal injury (Figure 2). Increased SAP (450 UI/ml, RV: < 250), TChol (250 mg/dl, RV: < 220) and decreased urine density (1022, RV: > 1030) were the only changes in the biochemistry and the hemogram (Table 1). Slightly increased UCCR with plasmatic cortisol suppression 8 hours post LDDST and normal adrenal glands in the ultrasonography ruled out HAC on the first examination (Table 1).

Table 1. Biochemical diagnosis and follow-up of Cushing disease

Parameter

Day

Reference

1

60

120*

 Values

Adrenal axis evaluation

UCCRa/b

13.7

69.4

42.3

<10

Coa

5.2

1.0-4.5

Co4h-LDDSTa

<1.0

<1.5

Co8h-LDDSTa

1.4

2.9

< 1.5

Co1h-ACTHa

21.7

<17

pACTHa

48

5-60

SAPb

450

498

309

<250

BAW

6.8

7.7

9.1

< 7.4

Metabolic profile

TCholb

250

322

221

< 220

Tgb

77

173

102

< 120

Gb

73

96

89

< 125

SP/DP

145/90

160/95

150/80

<150/<90

W

12.4

13.6

13.0

UPC

0.2

0.7

0.3

< 0.3

UCCR: urine cortisol/creatinine ratio (x10-6); Co: plasma cortisol (µg/dl); Co4h-LDDST: Co at 4 hours post LDDST; Co8h-LDDST: Co at 8 hours post LDDST; Co1h-ACTH: Co at 1 hours post ACTH; pACTH: plasma adrenocorticotropic hormone (pg/ml); SAP: seric alkaline phosphatase (UI/l); BAW: bilateral adrenal width (mm); TChol: total colesterol (mg/dl); Tg: triglycerides (mg/dl); G: glucose (mg/dl); SP/DP: systolic and diastolic pressure (mmHg); W: weight (Kg); UPC: urinary protein creatinine; a: chemiluminescence; b: spectrophotometry; *: under treatment with Cabergoline and ketoconazole (0.07 mg/Kg PO q72h and 10 mg/kg PO q24h, respectively).

Two months later, in view of the development of PU, PD, compounded with weight gain, a second examination on the adrenal axis was performed, and the plasmatic cortisol 1-hour post-ACTH and 8-hour post-LDDST was found to be consistent with HAC (Table 1). Plasmatic ACTH (pACTH: 48 pg/ml, RV: 5-60) was found to be improperly high vis-a-vis the UCCR (69.4×10⁻⁶, RV: <10). Unlike the findings of the first examination, an increase in triglycerides (Tg), systolic pressure, diastolic pressure and the urine protein: creatinine ratio became evident (Table 1).

Based on the previous findings, PDH was deduced and cabergoline was then administered as treatment (0.07mg/Kg PO q72h) [6] and Ketoconazol (10 mg/kg PO q12h, tolerated dose) [3]. The biochemical and clinical follow-up performed two months later revealed a reduction of clinical signs (PU, PD and PF), the normalization of TChol, Tg, blood pressure, and a reduction of SAP and UCCR (Table 1). Likewise, hyperplasia of both adrenal glands was observed in the ultrasonography. Shortly afterwards, an accidental fall, favored by the blindness, resulted in a hip fractured that precipitated the humanitarian euthanasia of the animal. The owners authorized a transsphenoidal extraction of the pituitary and both adrenal glands by celiotomy. The extracted pituitary showed normal appearance and a whitish nodule on its outer edge (Figure 3), and both adrenal glands evidenced a size increase.

 Normal adenohypophysis, in histological sections stained with hematoxylin-eosin (HE), consisted of a chain of globose-polyhedric cells arranged on a delicate fibrovascular stroma (Figure 4). In the periphery of the adenohypophysis, a proliferation of polyhedral cells organized in three to four rows of dense trabeculae of delicate fibrovascular stroma was found, which presented low pleomorphism, broad basophilic cytoplasm and a nucleus rounded with an evident nucleolus (Figure 5). These cells were organized in a larger, well-circumscribed, unencapsulated lobe, corresponding to an adenoma (2.34 x 1.3 mm) (Figure 6). The cells that make up the adenoma demonstrated intense positive cytoplasmic staining with the anti-ACTH antibody (mouse monoclonal, sc-52.980, Santa Cruz Biotechnology, Santa Cruz, CA, USA [1: 400 in PBS]) (Figure 7). Hiperplasia of the fascicular and reticular zones was found in both adrenal glands (Figure 8).

CST2018-101-VictorCastillo_F1

Figure 1. External aspect, bitch with pituitary-dependent hyperadrenocorticism and sudden blindness.

Figure 2. Electroretinography record showing flat waves in both eyes.

CST2018-101-VictorCastillo_F2

Figures 3-7. Pituitary, dog.

Figure 3. Macroscopic aspect of the pituitary and micro adenoma (arrows) after being fixed in 10% formaldehyde. n: neurohypophysis. a: adenohypophysis.

Figure 4. Microphotography normal adenohypophysis. A chain of globose-polyhedral cells, arranged in a delicate fibrovascular stroma. Hematoxylin-Eosin (H-E).

Figure 5. Microphotography basophilic adenoma composed of polyhedric cells with ample basophilic cytoplasm, arranged in thick trabeculae. H-E.

Figure 6. Microphotography pituitary with a basophilic adenoma of 2.3 x 1.3-mm (arrows) in adenohypophysis (a). ih: intermediate hypophysis. n: neurohypophysis. H-E.

Figure 7. Microphotography corticotropinoma cells with intense positive cytoplasmic staining with anti-ACTH antibody. Immunohistochemistry, Avidin-Biotin-peroxidase complex.

Figure 8. Microphotography adrenal cortex, diffuse hyperplasia fascicular zone (fz) and reticular zone (rz) with normal glomerular zone (gz). m: adrenal medulla (H-E).

Discussion

In this case, the sudden blindness, the absence of structural damage in both eyes, the integrity of optic chiasma (necropsy), the abolished ERG, the presence of systemic clinical signs (PF, PU, PD, weight gain) and the changes in biochemistry (SAP and TChol) were findings consistent with PDH, but also with SARDS [1,7]. The confirmation of PDH two months later the first evaluation using the same endocrine tests (LDDST and UCCR) was a peculiar finding. This fact highlights the advisability of performing a second endocrine evaluation in dogs with HAC signs and sudden blindness with inconcluse tests diagnostic, where a stimulation test should also be performed with ACTH [7], prior to reaching to any incorrect diagnosis of SARDS.

Images of the pitutary gland through computed tomography or magnetic resonance were no realizated; but the pituitary origin was deduced in view of plasma ACTH levels in connection with the increased UCCR and the absence of neoplastic injury to the adrenal glands. Additionally, it must be noted that even when using the CT and the MRI, pituitary tumors may not be detected in 28% to 37% of dogs with PDH [8,9]. Subsequently in the histopathology was confirmed the corticotropinoma. The basophilic staining characteristics obtained with the hematoxylin-eosin in the adenoma were compatible with the thyrotropic, gonadotropic or corticotropic cells, but the only cells ones of these that are immunopositive to anti-ACTH antibody are the corticotropic [10,11].

Like the blind dogs with PDH reported by Blatter [1], hypertriglyceridemia and hypercholesterolemia were found in this bitch in the second biochemical evaluation, but not at time of the onset of blindness. Other metabolic alterations mentioned in the retinopathy of dogs with Cushing’s disease are the increase in concentration of insulin, interleukin 6, and decrease in nitric oxide and adiponectin [2]; all of these except for insulinemia are not routinely used in the daily clinic, so their contribution to the development of blindness in this case could not be proven.

A limitation of this report is the retinal histopathological examination that could not be done due to conditions established by the owners in light of the need to extract both eyes.

Although the mechanism by which HAC induces sudden blindness in the dog is not well clarified, it is important to emphasize that its correct diagnosis and management of various comorbidities is fundamental to improve the survival of those dogs.

Finally, in dogs with sudden blindness, hypertension and dyslipidemia but with inconclusive diagnostic tests for HAC, it is recommended to carry out a timely medical and pharmacological management of each of the comorbidities, as well as a subsequent reevaluation of the adrenal axis.

References

  1. Cabrera Blatter MF, Del Prado B, Gallelli MF, D´Anna E, et al. (2012) Blindness in dogs with pituitary dependent hyperadrenocorticism: relationship with glucose, cortisol and triglyceride concentration and with ophthalmic blood flow. Res Vet Sci 387–392.
  2. Cabrera Blatter MF, Del Prado B, Miceli DD, Gomez N, et al. (2012) Interleukin-6 and insulin incrase and nitric oxide and adiponectin decrease in blind dogs with pituitary-dependent hyperadrenocorticism. Res Vet Sci 1195–1202.
  3. Feldman EC. Canine Hyperadrenocorticism (2015) In: Feldman EC, Nelson RW, Reusch CE, Scott-Moncrieff JCR, Behrend E. Canine & Feline Endocrinology, 4th ed. St. Louise, Missouri, USA: Elsevier, 377–451.
  4. Komáromy AM, Abrams KL, Heckenlively JR, Lundy SK, et al. (2016) Sudden acquired retinal degeneration syndrome (SARDS)–a review and proposed strategies toward a better understanding of pathogenesis, early diagnosis, and therapy. Vet Ophthalmol 19 : 319–31.
  5. Miceli DD, Pignataro OP, Castillo VA (2017) Concurrent hyperadrenocorticism and diabetes mellitus in dogs. Res Vet Sci 115: 425–431. [crossref]
  6. Castillo VA, Gómez NV, Lalia JC, Cabrera Blatter MF, García JD (2008) Cushing’s disease in dogs: cabergoline treatment. Res Vet Sci 85: 26–34. [crossref]
  7. Carter RT, Oliver JW, Stepien RL, Bentley E (2009) Elevations in sex hormones in dogs with sudden acquired retinal degeneration syndrome (SARDS). J Am Anim Hosp Assoc 45 : 207–14.
  8. Wood FD, Pollard RE, Uerling, Feldman EC (2007) Diagnostic imaging findings and endocrine test results in dogs with pituitary- dependent hyperadrenocorticism that did or did not have neurologic abnormalities: 157 cases (1989–2005). J Am Vet Med Assoc 231: 1081–1085.
  9. Auriemma E, Barthez PY, Van der Vlugt-Meijer RH, Voorhout G (2006) Computed tomography and low-field magnetic resonance imaging of the pituitary gland in dogs with pituitary-dependent hyperadrenocorticism: 11 cases (2001–2003). J Am Vet Med Assoc 235: 409–414.
  10. Jaime MN, López FIA, Cabrera GP (2003) Patología de los adenomas hipofisarios. Rev Esp Patol 36: 357–372.
  11. Thomas JR, Gröne A (2016) Pituitary glands. In: Jubb KBF, Kennedy PC, Palmer NC. Pathology of domestic animals, 6th ed. St. Louise, Missouri, USA: Elsevier 276–290.