Author Archives: author

Validity of Lithuanian Version of the Child Perceptions Questionnaire Among Adolescents up to the Ages of 18

DOI: 10.31038/JCRM.2018113

Abstract

Background: The Child Perceptions Questionnaire (CPQ) is the most commonly used measure of Oral Health-Related Quality of Life (OHRQoL) and its validity and reliability have been tested among children/adolescents aged 11 to 14 years in many languages and populations. This innovative study was aimed to validate the CPQ among adolescents aged 15 to 18 in the population survey of orthodontic anomalies in Lithuania.

Methods: Representative samples of adolescents aged 11–14 years (N=307), 15–16 years (N=721) and 17–18 years (N=563) were selected from public schools of Lithuania. The CPQ including four domains, namely oral symptoms (OS), functional limitations (FL), emotional well-being (EWB), and social well-being (SWB), was used to measure OHRQoL. A self-reported malocclusion and orthodontic examinations were used to assess malocclusion.

Results: The distributions of individual items and sum scores of the CPQ and its domains did not differ significantly between 11–14, 15–16 and 17–18 age groups of adolescents. Across all age groups, Cronbach’s alpha for the total CPQ was approximately equal to 0.90 indicating good internal consistency reliability; the total CPQ and all domains significantly correlated with oral health, oral well-being and global life satisfaction. Discriminant validity analysis revealed that adolescents with severe malocclusion suffered a greater impact on their emotional and social well-being than those without malocclusion, however, this relationship was more engaging in group of adolescents aged 15–18 than in 11–14-year-olds. A moderate agreement between child and parental reports was found for OS and FL domains.

Conclusions: The Lithuanian version of the CPQ for measuring OHRQoL among adolescents aged 15 to 18 years seems to be as valid and reliable as for adolescents aged 11 to 14 years.

Keywords

Oral health-related quality of life, Child Perceptions Questionnaire, validity, reliability, orthodontics, adolescents, Lithuania

Introduction

Oral health-related quality of life (OHRQoL) is a holistic concept which determines the subjective functional and psycho-social impacts of oral disease on overall well-being.[1–3] Measuring OHRQoL provides essential information when making clinical decisions for individuals and helping public health actions and policies to uncover the needs of the society in prevention and treatment of oral disorders.[3–5] Hence, OHRQoL has been widely studied over the past two decades and many tools have been developed, but mostly for adults.[6, 7]

Recently, increasing attention has been also paid to OHRQoL in children and adolescents. The OHRQoL instruments designed to assess the impact of oral conditions on the daily lives of children and adolescents have been developed ranging from measurement of patient-reported oral functional and psychosocial problems to subjective well-being relating to oral health. Systematic reviews [8, 9] identified at least three validated instruments to measure OHRQoL in children and adolescents: Child Oral Impact of Daily Performances index,[10] Child Oral Health Impact Profile,[11] and Child Perceptions Questionnaire.[12]

The most commonly used OHRQoL questionnaire is the Child Perceptions Questionnaire (CPQ). It was developed by Jokovic et al. [12] as the CPQ11–14 for children aged from 11 to 14 and was originally validated in children with caries, malocclusion and craniofacial anomalies.[12] In terms of cognitive development, age specific versions of this tool have been produced.[13] The CPQ does also have an analogous Parental CPQ which can be used as a proxy to Child CPQ.[14] The original item pool of the CPQ consists of 37 items, but the authors have also determined the psychometric properties of its shortened forms.[15] All variations of the CPQ evaluate the frequency of oral and orofacial impacts on children OHRQoL at symptomatic, functional, emotional and social levels whereas other questionnaires focus on severity of oral impacts. To date, the CPQ has been translated, validated and adapted to suit a number of languages and socio-cultural contexts demonstrating its applicability and perfect psychometric properties on numerous clinical and epidemiological occasions.[16–22]

OHRQoL research among children and adolescent in Lithuania is still nascent and no measures have been validated to date. Given the positive CPQ properties and its high applicability for both clinical assessments and large-scale population studies we have chosen this instrument for measure of OHRQoL in our research. It was also considered that the original long form (37 items) of this instrument is more sensitive to changes in oral conditions rather than its short forms,[15] hence, the original questionnaire was taken in focus. As it is well known that every time as the measurement scale is used in a new context or with a different population group, it is necessary to test its psychometric properties.[23] Therefore, our recent study, like most other similar studies, has been focused on adaptation and validation of the CPQ11–14 in Lithuanian adolescents aged 11–14 years. A detailed examination of psychometric characteristics including factorial analysis of the Lithuanian version of CPQ with a modified item of the oral pain showed that the instrument is valid to be used in further studies for measuring OHRQoL among 11–14-year-old adolescents in Lithuania (Kavaliauskienė A, Šidlauskas A, Zaborskis A., 2018. Manuscript under review).

This study is a part of a large research project aimed to examine extend of orthodontic anomalies and OHRQoL among children and adolescents aged from 11 to 18 years in Lithuania. Hence, there was a problem to choose an appropriate instrument to measure OHRQoL among adolescents up to the ages of 18. We hypothesized that the association between severity of oral disorders and OHRQoL in older adolescent samples (e.g. in 15–16- or 17–18-year-olds) is possibly more evident than in sample of adolescent aged 11–14 years. Therefore, the CPQ instrument to measure OHRQoL among older adolescents could be as much valid as it was valid for adolescents aged 11–14 years. Only a few relevant studies were conducted among adolescents over the age of 14 but none in population older than 16 years of age [24–27].

As a consequence, the aim of the present study was to validate the CPQ among adolescents aged from 15 to 18 in the population survey of orthodontic anomalies in Lithuania.

Methods and Material

The study followed a cross-sectional design and was a part of a larger research project aimed to examine OHRQoL among children and adolescents in Lithuania. It was conformed to the principles outlined in the Declaration of Helsinki. Ethical approval for the study was granted by the Kaunas Regional Biomedical Research Ethics Committee (reference number BE-2–27) and was in line with local practice for school survey distribution. Written informed consent for child’s participation in the study was sought from both parents prior to his/her participation in the research.

Target population was adolescents aged 11–18 years. The sample being studied was made up of students from 26 randomly selected public schools using random cluster (school, class) sampling and included approximately 2000 students. School authorities were contacted by researchers and informed about all aspects of the study. Parents were then asked to provide permission for their child to participate in the study.

Data was collected using both questionnaires and dental examinations. The self-completed questionnaires for students were administrated in school classrooms before dental examination by the classroom teaching staff to ensure a familiar and consistent environment. Confidentiality and anonymity of respondents was ensured. A total of 1591 students (80% of initial sample and 94% of those who had parents’ permission) presented correctly completed questionnaires. Those parents who gave consents were also asked to complete a self-report questionnaire about child’s oral health and well-being. The number of correctly completed parents’ questionnaires was 1365 (67% of invited parents).

The orthodontic examination was a part of the dental examination. It was carried out in randomly selected 20 of 26 schools. Students’ examination was performed according to the methodology of oral status evaluation recommended by the WHO under standardized conditions in the school’s medical offices using portable equipment for dental examination [28]. The orthodontic examination of all students was undertaken by one orthodontist (A.K.) who was trained and tested in reliability of accessing orthodontic status (U.K. Cardiff University School of Dentistry, 2012) and her assistant.

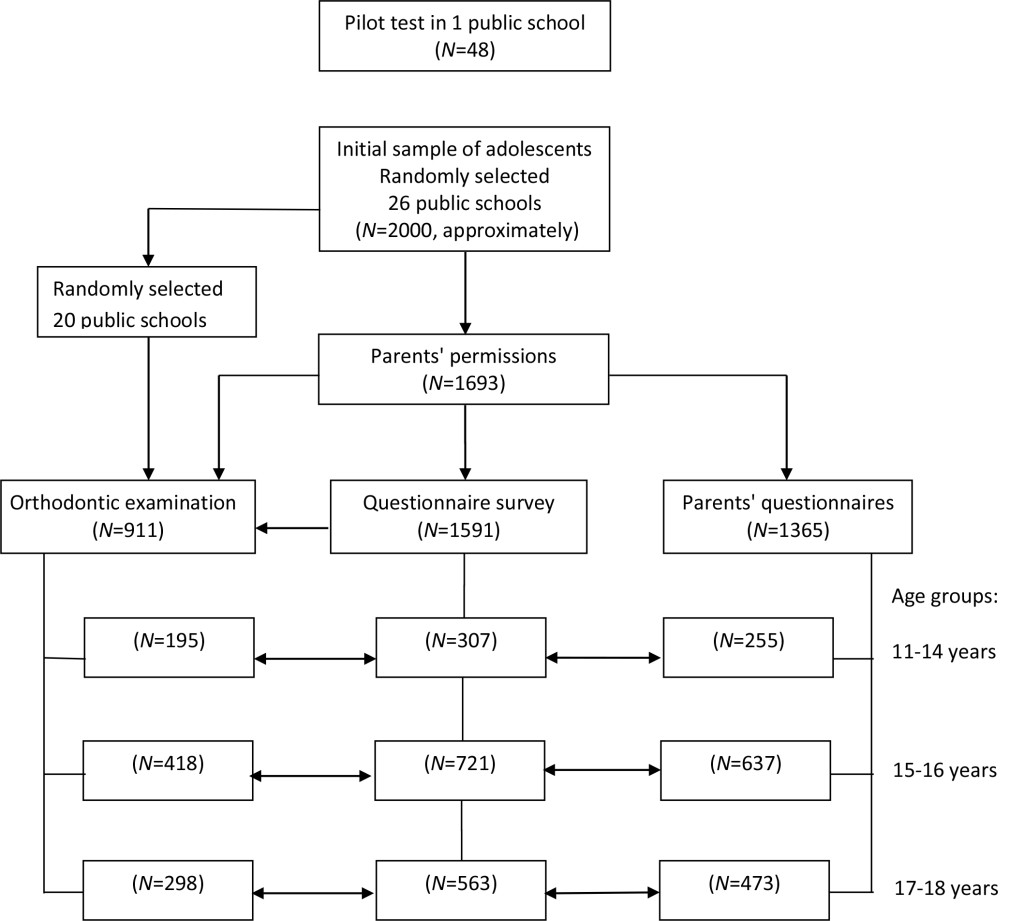
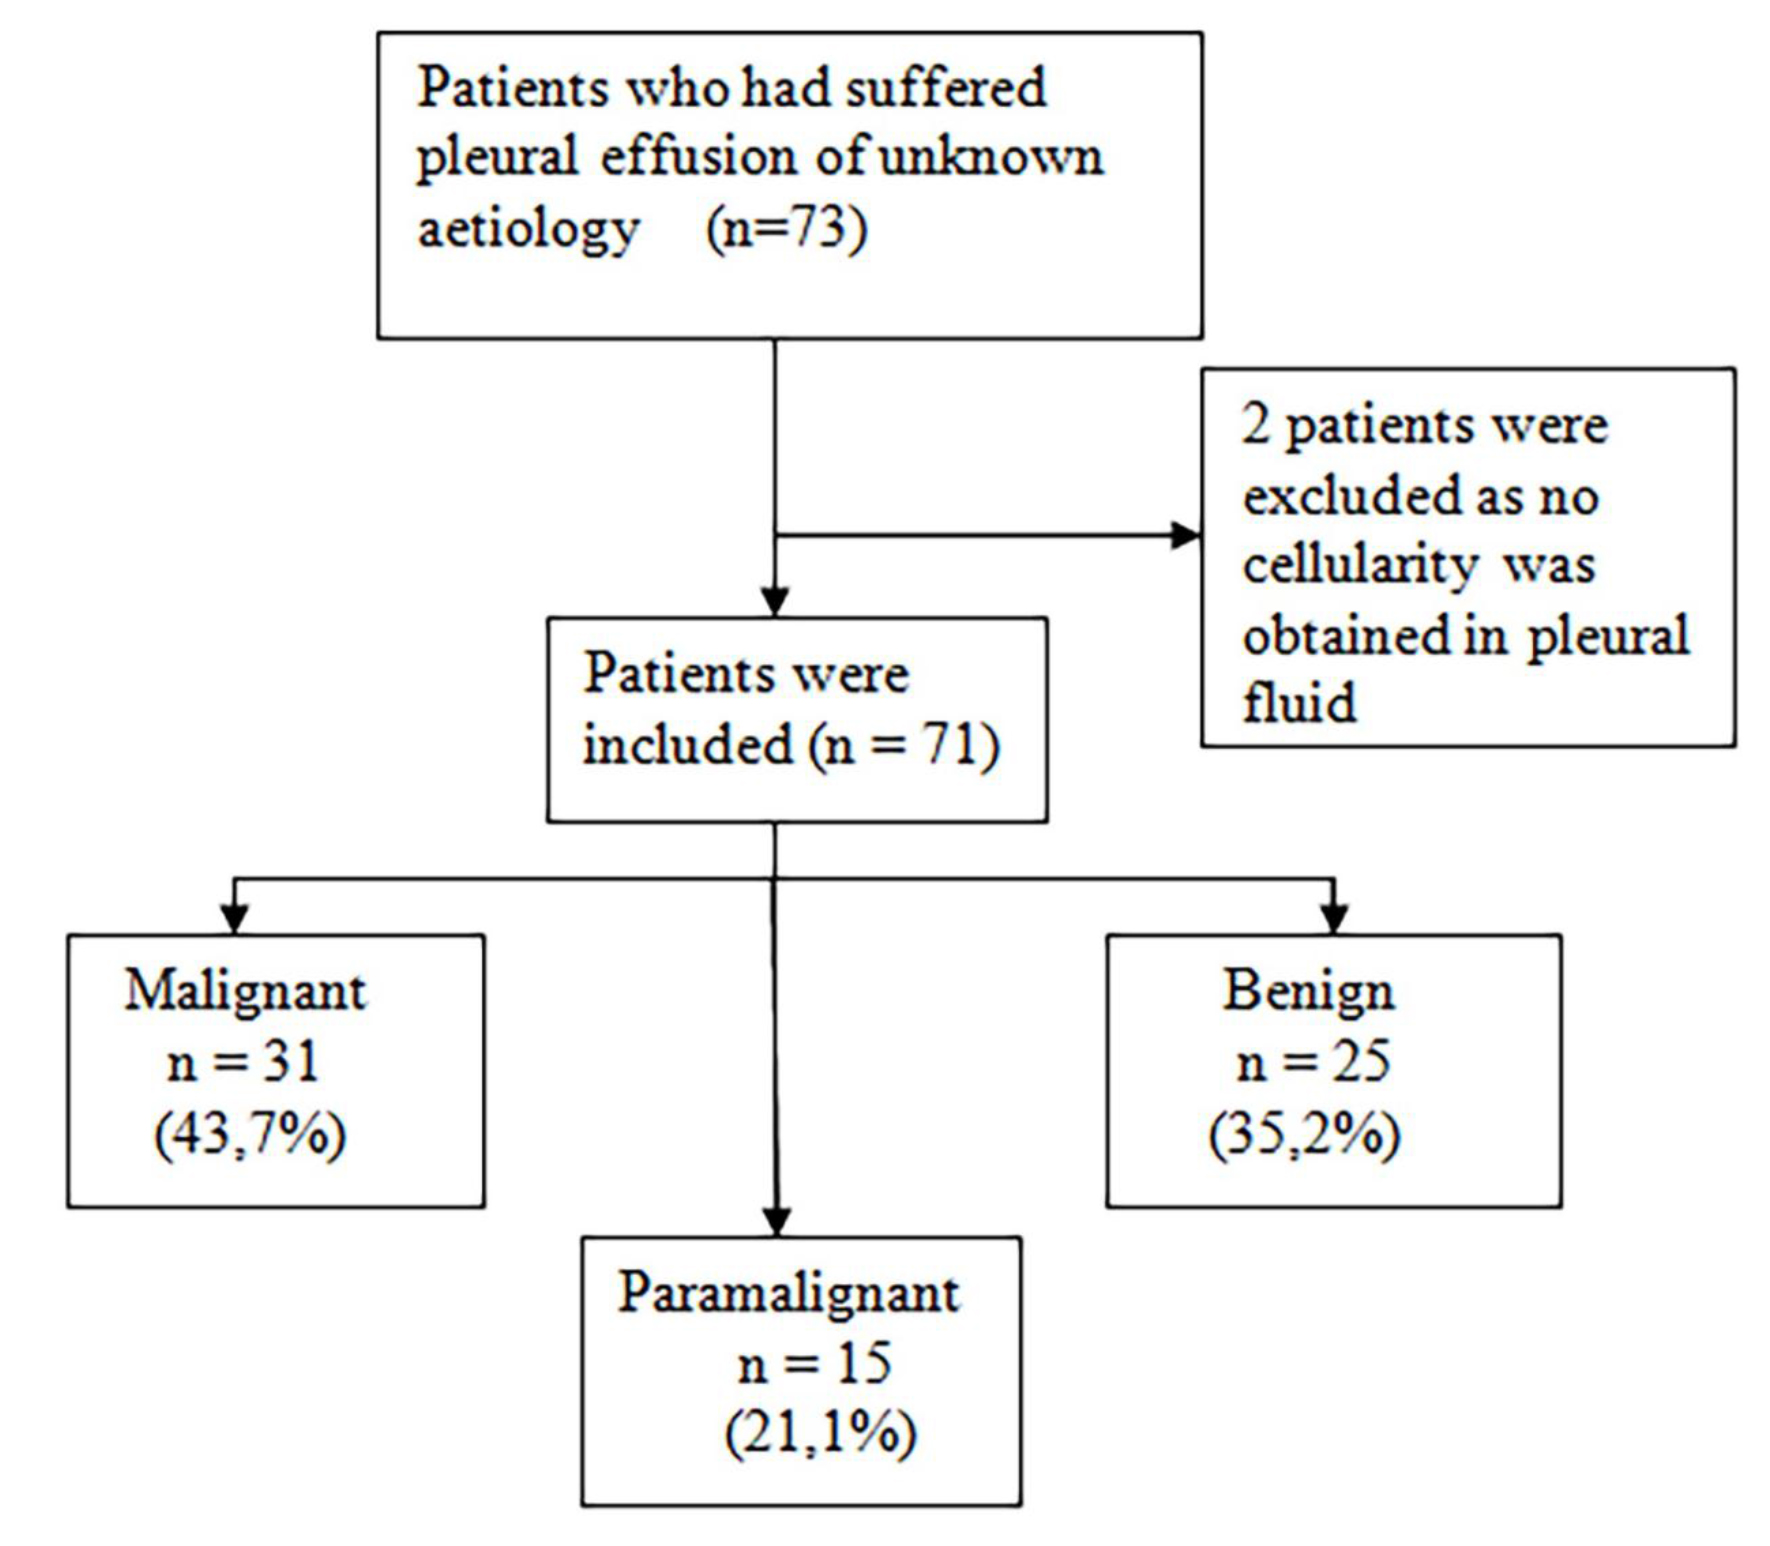
In the end, 911 students participated both in the questionnaire and dental surveys, and 1365 parents provided their completed questionnaires to students who participated in the questionnaire survey. The size of studied sample was adequate to the minimum calculated as necessary (N=969). Figure 1 presents flow diagram of data collection and also illustrates the sample structure by age of adolescents.

JCRM2018-105-ZaborskisItaly_F1

Figure 1. Flow-diagram of the data collection process and distribution of participants in three age groups.

Before the main study, a pilot test was carried out with a sample (N=48) of students in one school. It confirmed the feasibility of the methodology with only minor modification of questionnaire wording and confirmed the organization of data collection procedures.

The originally created self-reported questionnaires for students and parents consisted of items assessing oral health and OHRQoL as well as demographic and social aspects of adolescent health.

The Lithuanian version of the of CPQ11–14, cross-culturally adapted and validated for Lithuanian adolescents aged 11–14 years (Kavaliauskienė A, Šidlauskas A, Zaborskis A., 2018. Manuscript under review), was employed to evaluate the impact of oral conditions on the quality of life of adolescents of all ages. This questionnaire, as originally proposed by Jokovic et al.,[12] was a 37-item scale consisting of four health domains (subscales), namely oral symptoms (OS, 6 items), functional limitations (FL, 9 items), emotional well-being (EWB, 9 items), and social well-being (SWB, 13 items). The items of the OS and FL domains were also included into the parents’ questionnaire in order to test their agreement with their child’s report on his oral health troubles (the domains EWB and SWB were not included into the parents’ questionnaire as parents may not know so well the feelings of their children). The items are scored on a 5-point Likert scale ranging from 0 (“never”) to 4 (“every day or almost every day”). In the analysis, the scores for each item were added together to obtain a sum scores of each sub-scale as well as the total CPQ scale. Then, the sum scores were standardized to a percentage score scale of 0 – 100% by dividing the sum score by the maximum score and multiplying by 100. Note that higher sum/percentage scores refer to worse OHRQoL.

The students were also asked to rate their oral health and the extent to which it affected their well-being. For each of these dimensions five sub-items were worded in the following way: “How would you describe health status of the following oral parts: – teeth; – lips; – gum; – oral mucosa; – jaws or joints?” and “Over the last three months, how much your overall life was affected by the conditions of the following oral parts: – teeth; – lips; – gum; – oral mucosa; – jaws or joints?” The responses were scored in the following way: with regard to an oral health rating: 0=excellent, 1=very good, 2=good, 3=fair and 4=poor; with regard to well-being: 0=not at all, 1=very little, 2=somewhat, 3=a lot and 4=very much. The final score computed the maximal score on all the sub-items of each dimension.

The global life satisfaction, or well-being, of adolescents was rated using the measurement technique from the Health Behaviour in School-aged Children (HBSC) study [28]. Children were asked to take a look at the drawn ladder, with steps numbered from zero (“0”) at the bottom to ten (“10”) at the top, with the instruction to suppose the top of the ladder represented the best possible life, and the bottom of the ladder represented the worst possible life. Then they were asked to indicate the step of the ladder at which they would place their lives at present. Thus, the response was scored from 0 to 10.

In the questionnaires, the respondents were asked to rate their malocclusion experience by answering to the question, whether they had ever noticed that their teeth were irregularly grew/situated or they had malocclusion. The answer categories were: 1-yes, I noticed just myself; 2-yes, this was confirmed by dentist; 3- no, I don’t have such disorders. In analyses, the first two categories were combined, thus, two sub-groups of respondents , correspondingly ‘not healthy’ and ‘healthy’, were selected.

During the orthodontic examination, the Index of Orthodontic Treatment Need (IOTN) and the Index of Complexity, Outcome and Need (ICON) were recorded according to the methodology by Richmond (2008).[30] The IOTN measure categorizes the severity of malocclusion based on the relative effect of the various deviant occlusal traits on the longevity of the dentition. The five grades were outlined. Grade 1 recorded small deviations from normal and was categorized as ‘no need of orthodontic treatment’. The deviant occlusal anomalies become more severe in Grades 2, 3 and 4, while grade 5 represented the most severe malocclusion (e.g., impacted teeth, large overjet greater than 9 mm, defects of cleft lip and palate) and was categorized as ‘very great need of orthodontic treatment’. Grade 4 and 5 were regarded as clinical need for treatment. The another indicator of malocclusion, ICON, is based on five components, which are incorporated into calculation of the ICON value by a following regression equation: ICON = (Aesthetic assessment ×7) + (Upper arch crowding/Upper spacing × 5) + (Crossbite × 5) + (Incisor open bite/Incisor overbite ×4) + (Bucal segment antero-posterior ×3). An ICON value of > 43 corresponds to severe malocclusion with a fundamental treatment need [30].

The statistical analysis was performed using the Complex Samples module of the SPSS statistical package (version 21; IBM SPSS Inc., Chicago, IL, 2012) which adjust for the complex cluster-stratified sampling method (schools, classes).[31] All reported p values were from two-sided statistical tests and p values ≤ 0.05 were considered statistically significant.

Missing data of the CPQ items was replaced with the personal mean if a health domain had not more than half blank items, otherwise the record was excluded from analysis. The distributions of the sum score of the CPQ and its domains were examined and found not to be normally distributed. Therefore, median and Interquartile Range (IQR) were used to describe these distributions and to test the null hypothesis that there is no difference in the CPQ scores between the malocclusion and non-malocclusion groups. Due to the same reasons, binary associations between variables were evaluated with non-parametric Spearman correlation coefficient.

A set of test was used for examination of psychometric properties of the CPQ.[32–34] The Cronbach’s alpha was used as measure of internal consistency reliability of the total instrument and its domains. Their values ≥ 0.70 were considered acceptable.[33, 34] Furthermore, other tests of internal reliability (inter-item and item-total correlations) were also investigated. Construct validity of the instrument was tested using Spearman correlation coefficient to assess the association between the scores of total scale as well as its domains and the respondents’ rating of their oral health, oral health related well-being, and global life satisfaction. Discriminant validity was tested by comparing the medians of scores between groups defined by malocclusion traits.

Test-retest reliability test of the instrument was not employed. Instead of this, we assessed agreement between children’s and their parents’ answers to the same questions of the OS and FL domains. The association between child and parental sum scores was assessed by Spearman correlation coefficient, and agreement between two groups of raters was evaluated by the Intra-class Correlation Coefficient (ICC) using two way mixed consistency method and the quadratic weighted kappa.[34] The quadratic weighted kappa was used due to high range of sum scores.

Results

In this study, the sample consisted of 1591 adolescents recruited in the questionnaire survey, among which 911 adolescents were examined by an orthodontist. Participants were divided into three groups by age: 11–14 years (N=307), 15–16 years (N=721) and 17–18 years (N=563) (see Figure 1). In this paper, we looked into the validity of the CPQ scale among adolescents 15–16- and 17–18-year-old, so these groups were more numerous than the reference group of 11–14-year-olds. A total of 927 (58.3%) individuals in the sample were female. The respondents represented both the urban area (68.5%) and rural area (31.5%).

The response rate to the items of the CPQ varied by domains and age groups from 97.1% to 100% with the highest rate (2.9%) of blanks in responses to the items of the SWB domain among 11–14-year-old adolescents. All unanswered questions were restored according to the accepted rules of methods.

The impacts, that is the items scored from 1 (‘1 or 2 times’) to 4 (‘every day or almost every day’), were reported most frequently in the OS domain (“Pain in teeth, lips, jaws or mouth” – 68.8%; “Food stuck in or between teeth” – 62.0%; “Bleeding gums” – 53.6%; “Bad breath” – 45.2%) and in the EWB domain (“Worried that he/she is not as good looking as others” – 38.3%; “Worried that he/she is not as healthy as others” – 28.8%). Comparing three age groups, there were insignificant differences in prevalence of answers to separate items.

Descriptive statistics of the total CPQ and its domains are presented in Table 1. Sum scores were found to be highly skewed and not to be normally distributed in all the health domains with a very noticeable floor effect, especially in the SWB domain. Out of the theoretical range of 0–100% of relative scores, their mean (except OS domain) and median did not exceed 20%. The distributions of individual items and sum scores of the CPQ and its domains did not differ significantly between adolescents of different age groups. In all age groups, the female adolescents than the male tended to report higher scores of the CPQ (poorer OHRQoL). The significant gender difference was observed for the EWB domain (in all age groups) and for the FL domain (in 17–18-year-olds) (data not presented).

Table 1. Summary statistics of the Child Perceptions Questionnaire and its domains, by age groups

Age group

CPQ

Domain

Relative scores

p

Mean

(95% CI)

Skewness

Median

(IQR)

11–14

CPQ

9.7

(8.6–10.9)

1.78

6.3

(2.7–13.5)

0.509

(N=307)

Domain OS

20.9

(19.0–22.7)

1.23

16.7

(11.1–27.8)

0.206

Domain FL

7.7

(6.4–9.1)

2.10

3.7

(0–11.1)

0.895

Domain EWB

12.6

(10.4–14.7)

2.66

7.4

(0–18.5)

0.129

Domain SWB

4.0

(2.9–5.1)

4.54

0

(0–2.6)

0.330

15–16

CPQ

9.1

(8.5–9.8)

1.86

6.3

(2.7–12.6)

(N=721)

Domain OS

21.6

(20.4–22.8)

1.02

16.7

(11.1–33.3)

Domain FL

7.1

(6.3–7.9)

2.32

3.7

(0–11.1)

Domain EWB

11.2

(9.9–12.5)

2.52

3.7

(0–14.8)

Domain SWB

3.3

(2.7–3.9)

4.74

0

(0–2.6)

17–18

CPQ

9.3

(8.5–10.1)

2.04

6.3

(2.7–12.6)

(N=563)

Domain OS

23.1

(21.7–24.6)

0.81

22.2

(11.1–33.3)

Domain FL

6.9

(5.8–7.6)

2.64

3.7

(0–7.4)

Domain EWB

11.9

(10.4–13.4)

2.18

3.7

(0–14.8)

Domain SWB

2.9

(2.3–3.5)

4.21

0

(0–2.56)

CPQ: Child Perceptions Questionnaire, OS: Oral Symptoms, FL: Functional Limitations, EWB: Emotional Well-Being, SWB: Social Well-Being, CI: Confidence Interval, IQR: Range from 1th to 3rd quartile, p: test to compare medians across age groups.

Assessments of internal consistency reliability of the CPQ and individual domains are displayed in Table 2. Cronbach’s alpha for the total CPQ was approximately equal to 0.90 in all three age groups indicating good internal consistency reliability. Despite the adolescent age, the lowest values of Cronbach’s alpha were observed in the OS and FL domains being acceptable value of internal consistency reliability. For the domains EWB and SWB, the coefficient ranged from 0.82 to 0.88, indicating good internal consistency reliability in all three age groups. There was a large range of inter-item correlation and inter-total correlation in all domains, but no noticeable difference in these figures was seen comparing age groups of respondents.

Table 2. Internal consistency of the Child Perceptions Questionnaire and its domains, by age groups

Age group

CPQ/Domain

IIR range

ITR range

Cronbach’s alpha

11–14

CPQ

–0.04–0.83

0.17–0.59

0.90

(N=307)

Domain OS

0.01–0.50

0.22–0.55

0.66

Domain FL

0.05–0.56

0.30–0.47

0.72

Domain EWB

0.01–0.76

0.18–0.67

0.82

Domain SWB

–0.01–0.83

0.34–0.63

0.87

15–16

CPQ

–0.05–0.78

0.14–0.70

0.90

(N=721)

Domain OS

0.16–0.73

0.32–0.69

0.73

Domain FL

0.00–0.57

0.12–0.56

0.71

Domain EWB

0.17–0.73

0.40–0.80

0.88

Domain SWB

0.02–0.78

0.29–0.71

0.86

17–18

CPQ

0.01–0.76

0.20–0.63

0.91

(N=563)

Domain OS

0.18–0.74

0.28–0.70

0.71

Domain FL

0.02–0.51

0.22–0.54

0.71

Domain EWB

0.05–0.72

0.17–0.78

0.85

Domain SWB

0.07–0.76

0.41–0.67

0.86

CPQ: Child Perceptions Questionnaire, OS: Oral Symptoms, FL: Functional Limitations, EWB: Emotional Well-Being, SWB: Social Well-Being, IIR: Inter-Item Correlation, ITR: Item-Total Correlation.

Table 3 displays the correlation between the CPQ sum scores and overall ratings of oral health and well-being, as well as with global life satisfaction indicating construct validity of the instrument. Across all age groups, total CPQ and all domains were found to be significantly (p<0.01) and positively correlated with oral health and oral well-being. The correlations between the global life satisfaction and the domains were significant too (a negative correlation value indicates that higher life satisfaction is related to lower rating of oral problems).

Table 3. Spearman correlation of the Child Perceptions Questionnaire and its domains with rating of oral health, oral well-being and global life satisfaction, by age groups

Age group

CPQ/Domain

Oral

health

Oral

well-being

Global

life satisfaction

11–14

CPQ

0.36**

0.49**

–0.33**

(N=307)

Domain OS

0.33**

0.48**

–0.26**

Domain FL

0.24**

0.36**

–0.17**

Domain EWB

0.31**

0.38**

–0.32**

Domain SWB

0.18**

0.28**

–0.17**

15–16

CPQ

0.46**

0.52**

–0.33**

(N=721)

Domain OS

0.36**

0.49**

–0.23**

Domain FL

0.33**

0.41**

–0.21**

Domain EWB

0.37**

0.39**

–0.29**

Domain SWB

0.26**

0.29**

–0.23**

17–18

CPQ

0.49**

0.58**

–0.27**

(N=563)

Domain OS

0.44**

0.58**

–0.22**

Domain FL

0.28**

0.47**

–0.15**

Domain EWB

0.42**

0.42**

–0.23**

Domain SWB

0.28**

0.34**

–0.17**

CPQ: Child Perceptions Questionnaire, OS: Oral Symptoms, FL: Functional Limitations, EWB: Emotional Well-Being, SWB: Social Well-Being, ** p < 0.01.

Discriminant validity of the instrument was tested assessing CPQ scores in regard to the orthodontic treatment need (Table 4). Malocclusion traits were recorded in the orthodontic examination and were self-reported in the questionnaire survey. According to the ICON>43 criterion, the need for orthodontic treatment was established in 31.6%, 28.0% and 26.1% (p>0.05) of adolescents aged 11–14, 15–16 and 17–18 years respectively, and, according to the IOTN>3 criterion, the need for orthodontic treatment was established in 29.2%, 33.0% and 36.6% (p=0.049) of adolescents by corresponding age groups. Subjectively orthodontic anomalies (but not necessarily to be treated) were reported by 55.6%, 56.8% and 57.7% (p>0.05) of adolescents in corresponding age groups. Across age groups, there was seen a variation in the gradient of overall CPQ and domain sum scores by malocclusion traits. Adolescents with severe malocclusion (ICON>43 or IOTN>3) suffered a greater impact on their emotional and social well-being than those without malocclusion, however, this relationship was more engaging in groups of adolescents aged 15–16 years and 17–18 years than in 11–14-year-olds. Adolescents who subjectively reported malocclusion in comparison with their ‘healthy’ counterparts indicated significantly greater scores for all domains in the 15–16 age group and for the OS, EWB and SWB domains in the 17–18 age group, while only for the single EWB domain in 11–14 age group.

Table 4. Discriminant validity of the Child Perceptions Questionnaire and its domains for clinically recorded and self-reported malocclusion, by age groups

Age group

Dental health

malocclusion

N

Median (IQR) of relative scores

CPQ

Domain OS

Domain FL

Domain EWB

Domain SWB

11–14

Records from orthodontic examination:

ICON≤43

121

5.4 (2.7–12.4)

16.7 (11.1–27.8)

3.7 (0–7.4)

3.7 (0–16.7)

0 (0–2.6)

ICON>43

56

6.3 (3.2–33.3)

16.7 (11.1–27.8)

3.7 (0–7.4)

7.4 (0–18.5)

0 (0–2.6)

p

0.245

0.872

0.946

0.307

0.753

IOTN≤3

138

5.4 (2.7–11.7)

16.7 (11.1–27.8)

0 (0–9.3)

3.7 (0–14.8)

0 (0–2.6)

IOTN>4

57

6.3 (2.7–11.9)

16.7 (11.1–27.8)

3.7 (0–7.4)

7.4 (0–18.5)

0 (0–2.6)

p

0.738

0.375

0.461

0.046

0.931

Self-reported malocclusion:

‘healthy’

136

5.4 (2.7–9.9)

16.7 (5.6–27.8)

3.7 (0–10.2)

3.7 (0–11.1)

0 (0–2.6)

‘not healthy’

170

8.1 (5.6–27.8)

22.2 (11.1–33.3)

3.7 (0–14.8)

9.3 (0–22.2)

0 (0–5.1)

p

<0.001

0.009

0.119

<0.001

0.076

15–16

Records from orthodontic examination:

ICON≤43

293

5.4 (2.7–12.6)

16.7 (11.1–27.8)

3.7 (0–11.1)

3.7 (0–14.8)

0 (0–2.6)

ICON>43

114

8.1 (3.6–16.2)

22.2 (11.1–33.3)

3.7 (0–14.8)

7.4 (0–19.4)

2.6 (0–5.1)

p

0.011

0.240

0.290

0.082

0.013

IOTN≤3

280

5.4 (2.7–13.5)

16.7 (11.1–27.8)

3.7 (0–11.1)

3.7 (0–14.8)

0 (0–2.6)

IOTN>4

138

6.3 (2.7–13.7)

19.4 (11.1–33.3)

3.7 (0–11.1)

7.4 (3.7–34.3)

2.6 (0–5.1)

p

0.463

0.250

0.720

0.038

0.039

Self-reported malocclusion:

‘healthy’

311

4.5 (1.8–9.0)

16.7 (5.6–27.8)

3.7 (0–7.4)

0 (0–7.4)

0 (0–2.6)

‘not healthy’

409

7.2 (3.6–15.3)

22.2 (11.1–33.3)

3.7 (0–11.1)

7.4 (0–18.5)

2.6 (0–5.1)

p

< 0.001

< 0.001

0.048

< 0.001

0.001

17–18

Records from orthodontic examination:

ICON≤43

210

6.3 (2.7–10.8)

16.7 (11.1–33.3)

3.7 (0–8.3)

3.7 (0–11.1)

0 (0–2.6)

ICON>43

74

9.0 (5.2–18.5)

22.2 (11.1–38.9)

3.7 (0–11.1)

14.8 (3.7–34.3)

2.6 (0–5.1)

p

0.018

0.499

0.910

< 0.001

0.045

IOTN≤3

189

6.3 (2.7–10.8)

16.7 (11.1–27.8)

3.7 (0–7.4)

3.7 (0–11.1)

0 (0–2.6)

IOTN>4

109

9.0 (5.4–17.1)

22.2 (11.1–38.9)

3.7 (0–11.1)

11.1 (0–25.9)

2.6 (0–5.1)

p

0.030

0.095

0.260

<0.001

0.024

Self-reported malocclusion:

‘healthy’

237

4.5 (1.8–9.9)

16.7 (8.3–27.8)

0 (0–7.4)

0 (0–7.4)

0 (0–0)

‘not healthy’

323

8.1 (3.6–14.4)

22.2 (11.1–38.9)

3.7 (0–11.1)

7.4 (0–22.2)

2.6 (0–2.6)

p

< 0.001

0.011

0.096

< 0.001

0.007

CPQ: Child Perceptions Questionnaire, OS: Oral Symptoms, FL: Functional Limitations, EWB: Emotional Well-Being, SWB: Social Well-Being, IQR: Range from 1th to 3rd quartile, p: Test to compare medians across groups (significant values are in bold).

It was possible to compare records of 1365 parents with records of their children who independently each from other assessed items of the OS and FL domains of child OHRQoL (Table 5). Across all age groups of adolescents, positive significant correlations between parental and children assessments were observed for sum scores of both domains whereas these correlations were evaluated as a moderate level. The moderate values of kappa and ICC also confirmed agreement between child and parental reports. These results suggest on reliability of two subscales of the CPQ in respect of repeatability by two different raters.

Table 5. Agreement between child and parental reports about oral symptoms and functional limitations

Age groups

Domain

Number of compared pairs

Spearman correlation coefficient

Quadratic weighted kappa

Intraclass correlation coefficient

(95% CI)

11–14

Domain OS

255

0.42**

0.40**

0.56 (0.43–0.65)

Domain FL

255

0.31**

0.33**

0.43 (0.27–0.55)

15–16

Domain OS

630

0.32**

0.32**

0.53 (0.46–0.60)

Domain FL

637

0.34**

0.40**

0.58 (0.51–0.64)

17–18

Domain OS

469

0.39**

0.32**

0.56 (0.47–0.63)

Domain FL

473

0.34**

0.38**

0.56 (0.47–0.63)

OS: Oral Symptoms, FL: Functional Limitations, CI: Confidence Interval, ** p<0.01.

Discussion

This innovative study was aimed to validate the CPQ among adolescents aged from 15 to 18 in the population survey of orthodontic anomalies in Lithuania. As a reference age group was chosen a group of adolescents aged 11–14 years. The main findings of our study showed that the CPQ instrument is valid to adolescents aged 15–18 years as well as it is valid for adolescents aged 11–14 years.

According to the literature review, most of the OHRQoL studies has focused on 11–14-year-old adolescents rather on older teens. This fact is not surprising because OHRQoL is often the key motive for seeking orthodontic treatment and can considered the measurement for orthodontic treatment need and outcome.[35–37] It also relates to the fact that children of this age group make up the majority of orthodontic patients. During this age period, the whole body, including the jaws, develops intensively. So the orthodontic anomalies that has arisen in this age period can be successfully corrected, even it is assumed that it is not possible to complete a full course of orthodontic treatment before the premolars and second permanent molars have erupted at dental age 12 or 13 years.[38] Therefore, it increasingly recognized that more and more teenagers and young adults are seeking correction of their malocclusion, if this could not be done in early adolescence. Thus, orthodontists should be aware that such patients might expect orthodontic treatment to provide not only improved oral functioning and health but also enhancement of aesthetics, self-esteem and social life.[39]

More recently, a number of tools to measure OHRQoL has been developed and used in assessing an association between severity of malocclusion and patients’ perception of their oral health status. The standard CPQ11–14 was developed to measure the OHRQoL among adolescents between the ages of 11 and 14 years in Canada [12] and soon validated in many languages and cultures, including such as China,[40] India,[16] Korea,[21] Saudi Arabia,[22] and others. The questionnaire was also adapted to Lithuanian adolescents (Kavaliauskienė A, Šidlauskas A, Zaborskis A., 2018. Manuscript under review). After examination its psychometric properties, the Lithuanian version of CPQ11–14 showed good internal consistency, discriminant validity and acceptable agreement between children and parental responses to the same items. However, there are few studies in which the well-known CPQ would be used to measure OHRQoL in adolescents over the age of 14 years.[24–27] So we felt the lack of an instrument suitable for measuring OHRQoL throughout all adolescence period as the investigation of orthodontic anomalies among adolescents of Lithuania was targeted to the population aged from 11 to 18 years.

Adolescence is marked as a transitional period of rapid developmental changes and often perceived as a time of changing trajectories and health across the life course.[29, 41] It is reasonable that adolescents of the older stage are very different from those of the younger age stage. Older teen like young adults are capable of abstract thinking, reasoning about the past events and relating them with good or bad consequences in health.[41] Based on this assumption, we hypothesised that the CPQ instrument to measure OHRQoL among 15–18-year-old adolescents could be as much valid as it was valid for adolescents aged 11–14 years. The hypothesis was confirmed by all tests traditionally employed in questionnaire validation procedures.

Initially, it was found that the distribution of CPQ sum scores and its ratio between males and females did not differ significantly across age groups of adolescents. This may suggest that the impact of malocclusion over all adolescence does not decrease as age increases. However, our study was limited to adolescents up to 18 years, while other studies among adolescents and young adults demonstrated a negative association between age and impact on quality of life due to malocclusion.[42] Exploring gender differences, regardless of age, girls were found to be more emotionally concerned with their teeth aesthetic or, alternatively, boys may be less self-conscious about their appearance. Similar findings were reported by Peres et al.[43] who found females adolescents having greater dissatisfaction with their dental appearance (Peres et al., 2008) but in the other studies the gender difference was not established significant.[44]

Next, a good internal consistency reliability of the total CPQ with Cronbach’s alpha equal to 0.90 was established in both 15–16 and 17–18 age groups and was as high as in the 11–14 age group presented in our study or reported by other authors.[12] Despite the adolescent age, the alpha coefficient for the EBW and SWB domains was also greater than 0.80. Similarly to the other CPQ validation studies,[16,17] the lowest values of Cronbach’s alpha were observed for the OS and FL domains. Many methodologists[33, 34] recommend a minimum alpha coefficient between 0.65 and 0.8 (or higher in many cases), thus the obtained values that varied from 0.66 to 0.73 could be considered acceptable for these domains in all age groups.

The correlation coefficients in the construct validity analysis were significant in all age groups. So construct validity of the questionnaire in survey of older adolescents was in any case as high as that found among the youngest adolescents. Compared with other studies,[17, 20] which considered the CPQ valid for the population being assessed, the correlations between the respondents’ global rating of oral health and well-being and the CPQ sum scores outlined in our study were higher in many cases. The construct validity of the questionnaire for all age groups was also confirmed by the significant relationship between CPQ of sum scores and the adolescent’s global life satisfaction that is an essential dimension of young people well-being.[45] The relationship indicated that adolescents, regardless of their age, were more likely to report lower global life satisfaction when they felt any oral health-related complaints.

A discriminant validity of the CPQ was examined comparing the distribution of the CPQ scores between groups of adolescents with regard to their subjectively perceived and objectively measured orthodontic status. We found that malocclusion experience has a negative impact on the adolescents’ perceptions but its strength (difference in the CPQ distribution) differed by the method of definition of severity of malocclusion and the age of adolescents. Adolescents who reported malocclusion complaints themselves (were ‘not healthy’ in respect to orthodontic status) were more likely to provide greater perceptions of oral health-related problems than adolescents with clinically defined need for orthodontic treatment. This finding shows that a malocclusion can be perceived differently by the affected person, and a person’s degree of awareness of their malocclusion might not be related to its severity.[42] The findings of the study also suggest that young adolescents when evaluating their malocclusion by orthodontist mainly suffer emotional problems, as their OHRQoL might not be related so much with severity of malocclusion. Previous studies examining the impact of malocclusion on children (young adolescents) oral health-related perceptions have been also equivocal. Systematic reviews of literature on this issue reported studies that claimed evidence for a clear inverse association of malocclusion with OHRQoL.[46–48] At the same time, they reported studies with no clear relationship indicating that the strength of the association differed depending on the age of studied sample and cultural environment. In part, our findings confirmed this suggestion indicating that in older adolescents clinically defined need for orthodontic treatment may have a significant effect on perceived OHRQoL in more domains. Therefore, in respect of discriminant validity, the CPQ had no disadvantages both in the younger and older adolescents groups.

Finally, test-retest reliability of the CPQ instrument was not assessed due to organizational and logical reasons. With regard to organizational reasons, a retest appeared problematic as organizing another dental examination session at all of the schools participating in our study would have a complex endeavour. With the respect to logical reasons, a retest of the same students was replaced with an alternative analysis that included comparison of children’s and their parents’ answers to the same questions of the OS and FL sub-scales. Such comparison was not performed for the EWB and SWB sub-scales, because some parents may have limited knowledge about their children’s OHRQoL, particularly the impact on social and emotional well-being.[49]. As in other similar studies in this field,[49–51] findings of the present study confirmed an agreement between child and parental reports suggesting on reliability of the PCQ in respect of its repeatability by two different raters.

As an advantage of this study may be the fact that data were collected in cross-sectional population survey of representative adolescents’sample but not within sample of patients attending dental treatment as in several studies.[12, 24,52] The adolescents completed their questionnaires at school anonymously without any influence of their parents’ and dentist’s opinion, thus, adolescents could express their own feelings towards their QoL. That was an important condition comparing children’s and their parent responses, as well as their perceptions and orthodontic measures. This is the first study on OHRQoL among adolescents ever to be carried in Lithuania.

In terms of the limitations of our study, we conducted oral examination with respect to orthodontic disorders without assessing of dental cariousness and periodontal conditions that would have a considerable impact on OHRQoL in adolescence.[53–55] The sample was not also homogenous with respect to previously conducted orthodontic treatment. So, the possible confounding effects of these conditions on the participants’ OHRQoL were not considered in the analysis. Another limitation of the research is that we worked on the “long form” (37 items) of the original CPQ11–14 together with other scales, including such as eating behaviour and self esteem. Our experience from the HBSC study [29] showed that an increase of number of items in the questionnaire may affect respondent’s accuracy providing inaccurate answers, which may, consequently, reduce reliability of the tested scale. Finally, test-retest reliability of the CPQ instrument was replaced with an alternative analysis that included comparison of children’s and their parents’ responses to the same questions of the OS and FL domains. This approach is not free from limitations, especially in relation to its accuracy because children and parents may not share the same views about illness and health.[56]

Conclusions

The Lithuanian version of the CPQ showed good internal consistency and construct and discriminant validity in all age groups of adolescents, consequently, it seems to be a valid instrument for measuring OHRQoL among adolescents aged 15 to 18 years as well as among adolescent aged 11 to 14 years.

Acknowledgements: The authors would like to thank all reviewers for their thoughtful comments in the manuscript. A gratitude is also expressed to the schoolchildren and their parents for their participation in this study as well as to the teachers for their help during fieldwork.

Competing interests: The authors declare that they have no competing interests.

Funding: This study was funded by the Lithuanian University of Health Sciences.

Abbreviations

CI

Confidence Interval

CPQ

Child Perceptions Questionnaire

DHC

Dental Health Component

EWB

Emotional Well-being

FL

Functional Limitations

HBSC

Health Behaviours in School-aged Children

ICC

Intraclass Correlation Coefficient

ICON

Index of Complexity Outcome and Need

IIR

Inter-Item Correlation

IOTN

Index of Orthodontic Treatment Need

IQR

Interquartile Range

ITR

Item-Total Correlation

OHRQoL

Oral Health-Related Quality of Life

OS

Oral Symptoms

SD

Standard Deviation

SWB

Social Well-being

References

  1. Inglehart MR, Bagramian RA (2002) (Eds.) Oral health-related quality of life. Chicago: Quintessence Publishing Co Inc [Crossref]
  2. Sischo L, Broder HL (2011) Oral health-related quality of life: what, why, how, and future implications. J Dent Res 90(11): 1264–70. [Crossref]
  3. Bennadi D, Reddy CV (2013) Oral health related quality of life. J Int Soc Prev Community Dent 3(1): 1–6. [Crossref]
  4. Cunningham SJ, O’Brien C. Quality of life and orthodontics. Semin Orthod 2007;13,96–103.
  5. Gherunpong S, Sheiham A, Tsakos G ( 2006) A sociodental approach to assessing children’s oral health needs: integrating an oral health-related quality of life (OHRQoL) measure into oral health service planning. Bull World Health Organ 84: 36–42. [Crossref]
  6. Murray Thomson W (2014) Epidemiology of oral health conditions in older people. Gerodontology 31 Suppl 1: 9–16. [Crossref]
  7. Lu HX, Wong MC, Lo EC, McGrath C (2015) Oral health related quality of life among young adults. Appl Res Qual Life 10(1): 37–47.
  8. Genderson MW, Sischo L, Markowitz K, Fine D (2013). An overview of children’s oral health-related quality of life assessment: from scale development to measuring outcomes. Caries Res 47 Suppl 1: 13–21. [Crossref]
  9. Gilchrist F, Rodd H, Deery C, Marshman Z (2014) Assessment of the quality of measures of child oral health-related quality of life. BMC Oral Health 2014;14: 40. [Crossref]
  10. Gherunpong S, Tsakos G, Sheiham A (2004) Developing and evaluating an oral health-related quality of life index for children; the CHILD-OIDP. Community Dent Health 21: 161–9.[Crossref]
  11. Broder HL, Wilson-Genderson M (2007) Reliability and convergent and discriminant validity of the Child Oral Health Impact Profile (COHIP Child’s version). Community Dent Oral Epidemiol 35 Suppl 1: 20–31. [Crossref]
  12. Jokovic A, Locker D, Stephens M, Kenny D (2002) Validity and reliability of a questionnaire for measuring child oral-health-related quality of life. J Dent Res 81: 459–63. [Crossref]
  13. Jokovic A, Locker D, Tompson B, Guyatt G (2004) Questionnaire for measuring oral health-related quality of life in eight- to ten-year-old children. Pediatr Dent 26: 512–8. [Crossref]
  14. Jokovic A, Locker D, Stephens M, Kenny D (2003) Measuring parental perceptions of child oral health-related quality of life. J Public Health Dent 63: 67–72.[Crossref]
  15. Jokovic A, Locker D, Guyatt G (2006) Short forms of the Child Perceptions Questionnaire for 11–14-year-old children (CPQ11–14): Development and initial evaluation. Health Qual Life Outcomes 4: 4. [Crossref]
  16. Kumar S, Kroon J, Lalloo R, Johnson NW (2016) Psychometric Properties of Translation of the Child Perception Questionnaire (CPQ11–14) in Telugu Speaking Indian Children. PLoS One 11(3): e0149181.[Crossref]
  17. Goursand D, Paiva SM, Zarzar PM, Ramos-Jorge ML (2008) Cross-cultural adaptation of the Child Perceptions Questionnaire 11–14 (CPQ11–14) for the Brazilian Portuguese language. Health Qual Life Outcomes 6: 2. [Crossref]
  18. Gururatana O, Baker S, Robinson PG (2011) Psychometric properties of long and short forms of the Child Perceptions Questionnaire (CPQ11–14) in a Thai population. Community Dent Health 28(3): 232–7. [Crossref]
  19. Bekes K, John MT, Zyriax R, Schaller HG (2012) The German version of the Child Perceptions Questionnaire (CPQ-G11–14): translation process, reliability, and validity in the general population. Clin Oral Investig 16(1): 165–71. [Crossref]
  20. Olivieri A, Ferro R, Benacchio L, Besostri A (2013) Validity of Italian version of the Child Perceptions Questionnaire (CPQ11–14). BMC Oral Health 13: 55. [Crossref]
  21. Shin HS, Han DH, Shin MS, Lee HJ (2015) Korean version of child perceptions questionnaire and dental caries among Korean children. PLoS One 10(2): e0116011. [Crossref]
  22. Brown A, Al-Khayal Z (2006) Validity and reliability of the Arabic translation of the child oral-health-related quality of life questionnaire (CPQ11–14) in Saudi Arabia. Int J Paediatr Dent 16(6): 405–11.[Crossref]
  23. Streiner D, Norman G (2000) Health Measurement Scales. A practical guide to their development and use. 2nd edition. New York, Oxford University Press.
  24. De Baets E, Lambrechts H, Lemiere J, Diya L (2012) Impact of self-esteem on the relationship between orthodontic treatment need and oral health-related quality of life in 11- to 16-year-old children. Eur J Orthod 34: 731–7. [Crossref]
  25. Paula JS, Cruz JND, Ramires TG, Ortega EMM (2017) Longitudinal impact of clinical and socioenvironmental variables on oral health-related quality of life in adolescents. Brazilian Oral Res 31,e70. doi: 10.1590/1807–3107BOR-2017.vol 31.0070 [Crossref]
  26. Ahuja V (2013) Oral health related quality of life among Iowa adolescents. Master thesis. Iowa City: The University of Iowa.
  27. Sun L, Wong HM, McGrath CPJ (2018) The factors that influence oral health-related quality of life in 15-year-old children. Health Qual Life Outcomes 16,19. [Crossref]
  28. WHO. Oral Health Surveys: Basic Methods. 5th ed. Geneva: World Health Organization. 2013.
  29. Inchley J, Currie D, Young T, Samdal O, et al. (Eds.) Growing up unequal: gender and socioeconomic differences in young people‘s health and well-being. Health Behaviour in School-aged Children (HBSC) study: International report from the 2013/2014 survey. Copenhagen: World Health Organization Regional Office for Europe, 2016.
  30. Richmond S (2008) Evaluating effective orthodontic care. 1st ed. Cardiff Medicentre. First Numerics Ltd.
  31. IBM Corp. IBM SPSS Complex Samples 21. Armonk, NY, USA: IBM Corp, 2012.
  32. Streiner D, Norman G. Health Measurement Scales. A practical guide to their development and use. 2nd edition. New York, Oxford University Press, 2000.
  33. Pakalniškienė V. Tyrimo ir įvertinimo priemonių patikimumo ir validumo nustatymas. Metodinė priemonė. (Evaluation of validity and reliability for examination and assessment tools.) Vilnius: Vilniaus universiteto leidykla, 2012 (in Lithuanian).
  34. Aldridge V. Reliability Assessment Using SPSS. University of York, Centre for Applied Statistics Courses, UCL Institute of Child Health, 2015. Available: http: //www.spssusers.co.uk/Events/2015/ALDRIDGE2015.pdf.
  35. Kiyak HA. (2008) Does orthodontic treatment affect patients’ quality of life? J Dent Educ 72(8): 886–94. [Crossref]
  36. Feu D, de Oliveira BH, de Oliveira Almeida MA, Kiyak HA(2010) Oral health-related quality of life and orthodontic treatment seeking. Am J Orthod Dentofacial Orthop 138: 152–9 [Crossref]
  37. Masood M, Masood Y, Saub R, Newton JT (2014) Need of minimal important difference for oral health-related quality of life measures. J Public Health Dent 74: 13–20. [Crossref]
  38. Bennett JC (2006) Orthodontic management of uncrowded class II division 1 malocclusion in children. London, UK: Elsevier.
  39. Chen M, Feng ZC, Liu X, Li ZM (2015) Impact of malocclusion on oral health-related quality of life in young adults. Angle Orthod 85(6): 986–91. [Crossref]
  40. McGrath C, Pang HN, Lo EC, King NM (2008) Translation and evaluation of a Chinese version of the Child Oral Health-related Quality of Life measure. Int J Paediatr Dent 18: 267–74. [Crossref]
  41. Sawyer SM, Afifi RA, Bearinger LH, Blakemore SJ (2012) Adolescence: A foundation for future health. The Lancet 379(9826): 1630–40. [Crossref]
  42. Masood Y, Masood M, Zainul NN, Araby NB (2013) Impact of malocclusion on oral health related quality of life in young people. Health Qual Life Outcomes 11: 25. [Crossref]
  43. Peres KG, Barros AJ, Anselmi L, Peres MA (2008) Does malocclusion influence the adolescent’s satisfaction with appearance? A cross-sectional study nested in a Brazilian birth cohort. Community Dent Oral Epidemiol Apr;36(2): 137–43.
  44. de Oliveira CM, Sheiham A (2004) Orthodontic treatment and its impact on oral health-related quality of life in Brazilian adolescents. J Orthod 31(1): 20–7; discussion 15. [Crossref]
  45. Kavaliauskienė A, Šidlauskas A, Zaborskis A (2017) Association between Global Life Satisfaction and Self-Rated Oral Health Conditions among Adolescents in Lithuania. Int J Environ Res Public (
  46. Zhang M, McGrath C, Hagg U (2006) The impact of malocclusion and its treatment on quality of life: a literature review. Int J Paed Dent 16: 381–7. [Crossref]
  47. Liu Z, McGrath C, Hägg U (2009) The impact of malocclusion/ orthodontic treatment need on the quality of life. A systematic review. Angle Orthod 2009;79: 585–91. [Crossref]
  48. Kragt L, Dhamo B, Wolvius EB, Ongkosuwito EM (2016) The impact of malocclusions on oral health-related quality of life in children-a systematic review and meta-analysis. Clin Oral Investig 20(8): 1881–94. [Crossref]
  49. Barbosa TS, Gavião MB (2015) Validation of the Parental-Caregiver Perceptions Questionnaire: agreement between parental and child reports. J Public Health Dent Fall 75(4): 255–64. [Crossref]
  50. Barbosa TS, Gavião MB (2008) Oral health-related quality of life in children: part III. Is there agreement between parents in rating their children’s oral health-related quality of life? A systematic review. Int J Dent Hyg 6(2): 108–13. [Crossref]
  51. Li YJ, Gao YH, Zhang Y (2014) The impact of oral health status on the oral health-related quality of life (OHRQoL) of 12-year-olds from children’s and parents’ perspectives. Community Dent Health 31(4): 240–4. [Crossref]
  52. O’Brien C, Benson PE, Marshman Z (2007) Evaluation of a quality of life measure for children with malocclusion. J Orthod 34(3): 185–93; discussion 176. [Crossref]
  53. Naito M, Yuasa H, Nomura Y, Nakayama T (2006) Oral health status and health-related quality of life: a systematic review. J Oral Sci 48(1): 1–7. [Crossref]
  54. Barbosa TS, Gavião MBD, Castelo PM, Leme MS (2016) Factors Associated with Oral Health-related Quality of Life in Children and Preadolescents: A Cross-sectional Study. Oral Health Prev Dent 14(2): 137–48. [Crossref]
  55. Martins MT, Sardenberg F, Bendo CB, Abreu MH (2017) Dental caries remains as the main oral condition with the greatest impact on children’s quality of life. PLoS One 12(10): e0185365. doi: 10.1371/journal.pone.0185365. [Crossref]
  56. Jokovic A, Locker D, Stephens M, Kenny D (2003) Measuring parental perceptions of child oral health-related quality of life. J Public Health Dent 63(2): 67–72. [Crossref]

The Effect of Ketorolac on Postoperative Hemoglobin Level after Vaginal Reconstructive Surgery

DOI: 10.31038/IGOJ.2018113

Abstract

Objectives: Ketorolac is an appealing alternative to narcotics in postoperative pain management, however, there is concern for postoperative bleeding.  We sought to evaluate and compare the effect of ketorolac on postoperative bleeding and to assess its impact on postoperative pain control in patients undergoing vaginal reconstructive surgery.

Methods: This is a retrospective cohort study of women who had vaginal reconstructive surgery at Christiana Care Health System between January 1, 2014-December 31, 2014. Data on preoperative and postoperative hemoglobin levels as well as total narcotic use (defined as 1mg of intravenous hydromorphone) was collected for each patient.  Data analysis was performed using a chi- square test and unpaired t-tests. Multiple regression and linear regression analyses were performed to assess the effect of ketorolac use on hemoglobin and total narcotic use.

Results: 129 vaginal surgery cases were identified in the study period. 54 (41.9%) patients received ketorolac and 75 (58.1%) patients did not receive ketorolac. There was no statistically significant difference in mean narcotic use between the ketorolac group and the no ketorolac group (3.85mg vs 3.0mg, p= 0.194). Total ketorolac use was not associated with an increase in estimated blood loss. Among patients who received ketorolac, there was no significant difference in pre-operative and post-operative hemoglobin when adjusting for estimated blood loss.

Conclusion: This study found that that there was no difference in change in hemoglobin with the use of ketorolac. The total amount of narcotic use was not decreased in patients given ketorolac postoperatively for additional pain control.

Introduction

Pain control in the postoperative period has been studied extensively in the gynecological literature. Currently, standard postoperative pain control includes a combination of narcotics and non-steroidal anti-inflammatory drugs (NSAIDs). Narcotic medications have well documented side effects including nausea, vomiting, constipation, dizziness, somnolence and a decreased respiratory drive. NSAIDs such as ketorolac have become an attractive option for pain control as an alternative to opioid medications. The effectiveness of ketorolac on postoperative pain control has been well established [1–3]. There is, however, a concern with the effect of ketorolac use on postoperative bleeding [4].

Ketorolac like other NSAIDs can prolong bleeding time by inhibiting platelet aggregation and thromboxaneA2 production [4, 5]. Early studies on the hemostatic effects of ketorolac have shown prolongation of bleeding time as well as an increased risk for gastrointestinal bleeding in the postoperative period [6,7]. Nevertheless, there are conflicting reports in the literature. A recent meta-analysis [8] of 27 randomized controlled trials examining postoperative bleeding with ketorolac use did not show a significant increase in bleeding compared to controls.  Additionally, the meta analysis also showed superior pain control with ketorolac compared with controls, and equally effective pain control when compared to opiates.

Postoperative bleeding after vaginal reconstructive surgery is a well established complication and can present in one of two ways. First, with vaginal bleeding noted several hours after the procedure that may be caused by bleeding from the vaginal cuff or vascular pedicles.  Secondly, with little or no vaginal bleeding but deteriorating vital signs, indicating a possible retroperitoneal hematoma.

Materials and Methods

This is an IRB approved retrospective cohort study of women who had vaginal reconstructive surgery at Christiana Care Health System between January 1 2014-December 31 2014. Patients were identified through the institutional perioperative database using CPT codes for various vaginal procedures.  All patients that underwent a vaginal reconstructive procedure done by a board certified Female Pelvic Medicine and Reconstructive Surgery surgeon were included in the data set.  A sequential retrospective chart review of patients who underwent vaginal reconstructive surgeries was then conducted. Data was collected through manual review of electronic and hand written paper charts. Patients who underwent additional laparoscopic procedures were excluded. Additionally, patient with a history of chronic narcotic use, history of chronic pain and a history of bleeding disorders were excluded. Inclusion criteria included patients over the age of 18 years who underwent a vaginal reconstructive procedure requiring at least an overnight hospital stay. Patient age, BMI, ethnicity, indication, length of procedure, and length of stay were recorded. Administration of Ketorolac was determined by both the surgeon or the anesthesiologist. Ketorolac use, timing of dosage, and total dosage were recorded. For each patient, the 24 hour and 48-hour postoperative narcotic requirement were recorded. Postoperative complications such as blood transfusions, return to the operating room, ileus, were also recorded.

One of the secondary outcomes was to analyze the use of narcotic medications in those patients that received ketorolac in comparison to those that did not. As a variety of narcotic medications were used depending on surgeon preference, narcotic medications were converted to 1mg IV hydromorphone using an online opioid conversion calculator [9]. The conversion was based upon standard dosing preparations. The time period of 24 hours began upon admission to the post anesthesia care unit.

Data was analyzed using chi-square test for categorical variables and t-test of continuous variables.  Linear regression analyses were used to compare ketorolac use with narcotic usage and hemoglobin levels. The latter analysis was adjusted for estimated blood loss during the surgery.

Results

There were 176 vaginal reconstructive surgery cases were identified during the study period. Based on the exclusion criteria, 47 cases were excluded.   Of the remaining 129 vaginal cases, 54 (41.9%) patients received ketorolac and 75 (58.1%) patients did not receive ketorolac. The group that received ketorolac were younger (56.0 vs 66.1, p=0.003). A large proportion of the study population was Caucasian (n=113, 87.6%).  There was no difference in body mass index in both groups.  There was no difference in length of stay between the two groups (Table 1). Estimated blood loss (EBL) during the surgery was significantly different in both groups, with the ketorolac group having a lower volume (84.5 mL vs. 117.1 mL, p = 0.049).  The difference in preoperative hemoglobin levels and postoperative hemoglobin levels were not significantly different between the two groups (Table 2). Additionally, there was no significant difference in hemoglobin when comparing the total dose of ketorolac with the decrease in hemoglobin level postoperatively (p=0.81).  One patient required a postoperative blood transfusion. This patient, who did not receive ketorolac, had a hemoglobin >7, but had clinical symptoms for acute blood loss anemia.

There was no difference in the mean narcotic use between the two groups (Table 3). The total amount of ketorolac used did not have a significant difference in narcotic usage (p=0.75). No significant difference was seen in narcotic use on postoperative day (POD) #1 or POD#2 in the ketorolac group. However, when adjusted for age, there was a significant decrease in narcotic use in the ketorolac group on POD#0 (p=0.045). Nineteen patients did not receive any postoperative analgesia, of which nine belonged to the ketorolac group and ten belonged to the no ketorolac group.

Table 1. Demographics


Ketorolac Use


no ketorolac

ketorolac

p-value

Age (yrs)

66.10 (13.3)

56.02 (14.3)

<0.001

BMI (mean SD)

29.9 (6.45)

28.69 (5.20)

0.30

Race/Ethnicity  (n%)

0.46

Caucasian

68 (90.7)

45 (83.3%)

African American

3 (4%)

6 (11.1%)

Hispanic

2 (2.7%)

1 (1.9%)

Other

2 (2.7%)

2 (3.7%)

Length of Stay  (days)

1.04 (0.20)

1.08(0.27)

0.39

Estimated Blood Loss (EBL) (mL)

117.1

84.47

0.05

Table 2. Ketorolac use and Hemoglobin Level

Ketorolac use

no ketorolac

ketorolac

p-value

Pre-op Hb

12.92

12.68

0.36

Post-op Hb

10.89

10.79

0.68

Difference in Average Pre and Post-op Hb

-2.14

-1.89

0.20

Table 3. Ketorolac and Narcotic use


Ketorolac Use

Mean Difference

p-value


no ketorolac
(n = 75)

ketorolac
(n = 54)

Any Narcotic Use (n%)

0.981

No

11 (14.67)

8 (14.81)

Yes

64 (85.33)

46 (85.19)

Total Narcotics (mg)

Mean (SD)

3.00 (2.95)

3.85 (4.04)

-0.846

0.194

Median (IQR)

2.00 (0.90, 4.60)

2.50 (0.85, 6.15)

Narcotic Dosage POD #0 (mg)

Mean (SD)

1.83 (1.80)

2.17 (2.25)

-0.347

0.3505

Median (IQR)

1.20 (0.30,2.90)

1.25 (0.50, 3.50)

Narcotic Dosage POD #1 (mg)

Mean (SD)

1.18 (1.41)

1.68 (2.27)

-0.499

0.157

Median (IQR)

0.80 (0.00, 1.60)

0.85 (0.00, 2.45)

In order to account for a potential confounder of increased pain leading to the addition of ketorolac to the regimen, a subanalysis comparing narcotic use in patients who received ketorolac on POD#0 was conducted. Patients who did not receive ketorolac on POD#0 were removed from the analysis. There was no difference in narcotic use in this group of patients (p=0.70)

Discussion

Our findings show that there was no difference in hemoglobin level postoperatively between the ketorolac and no ketorolac group.  Additionally, there was no difference in narcotic use between the two groups. There was no difference in narcotic use on POD#0 or POD#1. When adjusting for age, however, there was a significant decrease in narcotic use on POD#0 (p=0.045).

The current literature on whether there is a significant increase in bleeding with ketorolac is conflicting [10–13]. Strom et al (1996) reported a 50% increase in bleeding time in healthy subjects four hours after administration of Ketorolac [10]. They also showed that there was a 10% postoperative hemorrhage rate compared to 2% in patient who only received opioids. Another study showed an increase in bleeding time by 1 minute and 46 seconds in patients that were treated with IM Ketorolac [7]. Conrad et al. showed that bleeding time increased from 4.9 minutes to 7.8 minutes in patients who received IM ketorolac four times a day for five days.  An important distinction to make between these studies is the use of bleeding time as the indicator of abnormal bleeding. Bleeding time has been shown to be a reliable marker of abnormal bleeding in patients who receive antiplatelet agents [7].  However, it is unclear if bleeding time could predict clinically significant compromise in hemostasis in the postoperative period [14].  Importantly, there was no association noted between dosage of ketorolac and an increase in bleeding (p=0.1692). This is a different finding from the literature where there was dose dependent relationship with an increase in bleeding [14].

The effect of ketorolac on pain is well established. Studies in both surgery and gynecology literature have shown a morphine sparing effect with the use of ketorolac in the postoperative period.  In this study, unadjusted analyses showed no difference in narcotic usage based on if patient received ketorolac. There was also no dose dependent decrease noted in opiate usage noted. Interestingly, the mean narcotic use was slightly higher in the group that received ketorolac (3.86mg vs. 3.52mg), but not significant. A reason that could account for this finding is that ketorolac was given postoperatively to patients who had higher narcotic requirements.  When this was accounted for, by eliminating all patients who did not receive ketorolac on POD#0 from the ketorolac group, the mean narcotic use was lower in the ketorolac group. This finding was not significant. However, the sample size became significantly smaller (n=38) when these patients were removed from analysis. Adjusted analysis showed a significant decrease in narcotic use on POD#0, but not on POD#1. Additionally, there was no difference shown when comparing the total dosage of ketorolac with total narcotic use. These findings are not consistent with the literature which has shown a decrease in narcotic use with the use of ketorolac postoperatively.

The narcotic use overall was noted to be low in both groups. A study by Crisp et al. (2017) [15]  comparing PCA to nurse administered analgesia postoperative in patients who underwent vaginal reconstructive surgery noted similar dosage of IV hydromorphone, with total hydromorphone use as 3.56mg, and 1.803mg and 1.770mg on POD#0 and POD#1 respectively. Narcotic usage postoperative after abdominal hysterectomies are significantly higher as noted in a study by Moon et al (2011) [16] with a 24 hour consumption of 4.2mg ±2.3mg. An alternative hypothesis is that these surgeries may not be painful enough to show a true difference in narcotic consumption, and may require a larger study group to show a difference.

A strength of this study is that this question as not been answered in current literature specifically in Urogynecology. We also attempted to adjust for any confounders with linear regression analyses. All surgeries were preformed by board certified FPMRS surgeons at this institution who provide a consistent level of care. The limitations of the study include that it is a retrospective analysis. Additionally, the sample size is relatively small, and is potentially not large enough to show a true difference between hemoglobin change. Bleeding was assessed through a comparison of preoperative and postoperative hemoglobin. As ketorolac is a prostaglandin inhibitor, its effects are primarily on platelet function and a better parameter to study may be coagulation studies. These parameters were not available in our retrospective analysis but should be included in any prospective studies examining this question.  Future directions should include a comparison of ketorolac with IV Tylenol on narcotic use.

References

  1. Brown CR, Moodie JE, Wild VM, Bynum LJ (1990) Comparison of intravenous ketorolac tromethamine and morphine sulfate in the treatment of postoperative pain. Pharmacotherapy 10: 116S-121S. [crossref]
  2. Parker RK, Holtmann B, Smith J, White PF (1994) Use of ketorolac after lower abdominal surgery: effect on analgesic requirement and surgical outcome. Anesthesiology 80:6–12.
  3. Sevarino FB, Sinatra RS, Paige D, et al. (1992) The efficacy of intramuscular ketorolac in combination with intravenous PCA morphine for postoperative pain relief. J Clin Anesth 4:285–8.
  4. Buckley MM, Brogden RN (1990) Ketorolac: A review of its pharmacodynamic and pharmacokinetic properties, and therapeutic potential. Drugs 39:86–109.
  5. Greer IA (1990)  Effects of ketorolac tromethamine on hemostasis. Pharmacotherapy10:71S–76S.
  6. Rogers JE, Fleming BG, Macintosh KC, et al. (1995) Effect of timing of ketorolac administration on patient-controlled opioid use. Br J Anaesth 75:15–8.
  7. Singer AJ, Mynster CJ, McMahon BJ (2003) The effect of IM ketorolac tromethamine on bleeding time: A prospective, interventional, controlled study. Am J Emerg Med 21:441–443
  8. Gobble RM, Hoang HL, Kachniarz B, et al. (2014) Ketorolac does not increase perioperative bleeding: a meta-analysis of randomized controlled trials. Plast Reconstr Surg 133:741–55.
  9. McCauley, David (2017) Opioid Analgesic Converter
  10. Strom BL, Berlin JA, Kinman JL, et al. (1996) Parenteral ketorolac and risk of gastrointestinal and operative site bleeding: A postmarketing surveillance study. JAMA 275: 376–382.
  11. Gallagher J, Blauth J, Fornadley JA (1995) Perioperative Ketorolac tromethamine and postoperative hemorrhage in cases of tonsillectomy and adenoidectomy. Laryngoscope 105: 606–609
  12. Gobble RM, Hoang HL, Kachniarz B, et al. (2014) Ketorolac does not increase perioperative bleeding: a meta-analysis of randomized controlled trials. Plast Reconstr Surg 133:741–55.
  13. Conrad KA, Fagan TC, Mackie MJ, et al. (1988) Effects of ketorolac tromethamine on hemostasis in volunteers. Clin Pharmacol Ther 43:542–546.
  14. Lind SE (1991) The bleeding time does not predict surgical bleeding. Blood 77: 2547–2552
  15. Moon YE, Lee YK, Lee J, Moon DE (2011) The effects of preoperative intravenous acetaminophen in patients undergoing abdominal hysterectomy. Arch Gynecol Obstet 284:1455–60
  16. Crisp CC, Bandi, S; Kleeman, SD, et al. (2012) Patient-controlled versus scheduled, nurse-administered analgesia following vaginalreconstructive surgery: a randomized trial. Am J Obstet Gynecol 207:433.e1–6

Intravitreal Injections of Melanocortin Receptor 1, 5 Agonists Prevents Neovascularization in a VEGF165 Mouse Model of Retinopathy

DOI: 10.31038/JCRM.2018112

Abstract

Background: The present study focuses on the evaluation of the protective effect on retinal neovascularization exerted by melanocortin receptor 1–5 (MCR 1–5) agonists in a mouse model of proliferative retinopathy induced by intravitreal injection of vascular endothelial growth factor 165 (VEGF165).

Methods: Intravitreal injections of the MCR1 agonist BMS-470539 and of the MCR5 agonist PG-901 were performed 7 days before the VEGF165 injection and 1 day after VEGF165 injection. Fluorescein angiography (FAG), immunohistochemical and biochemical analysis were performed at different time points during the follow up.

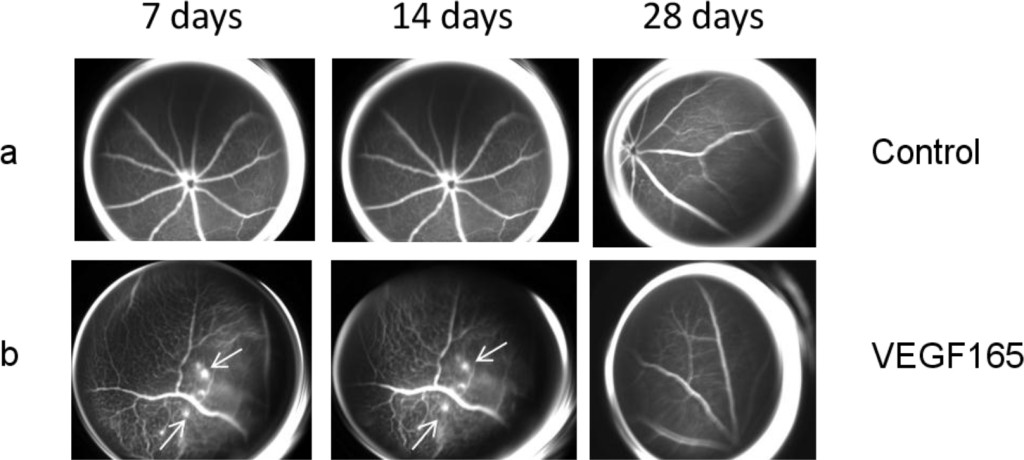
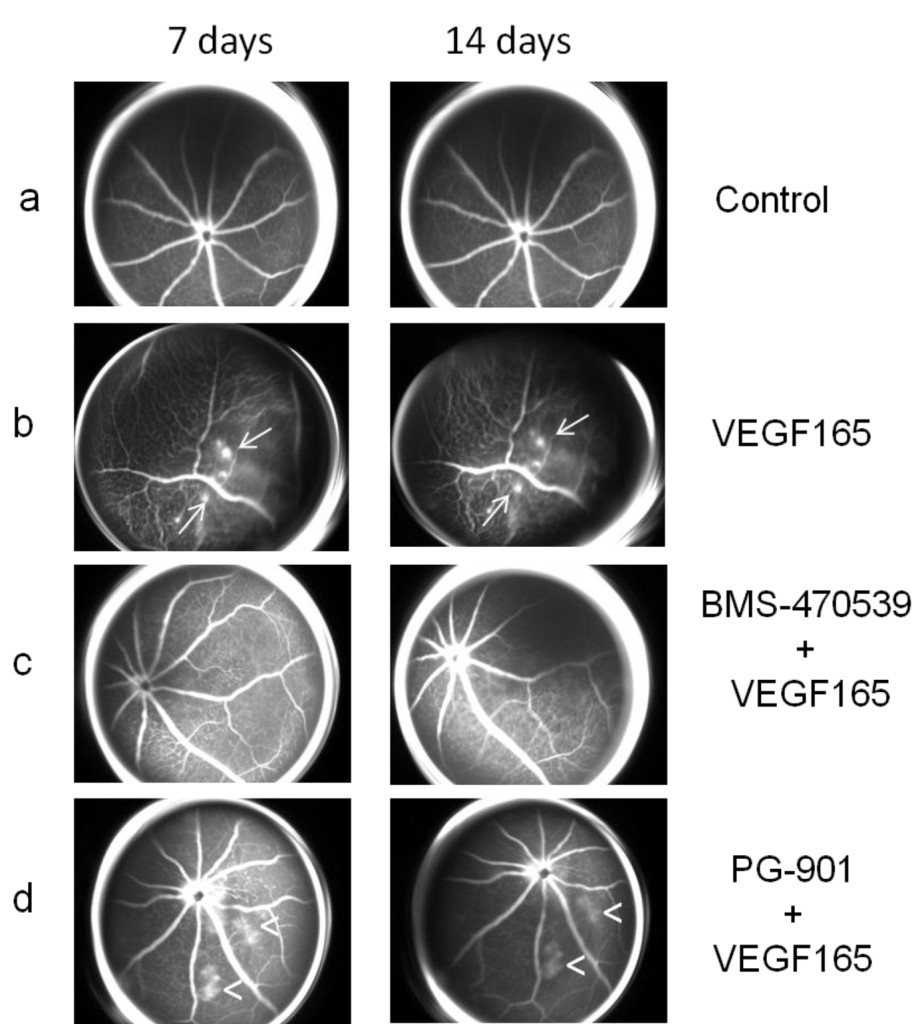
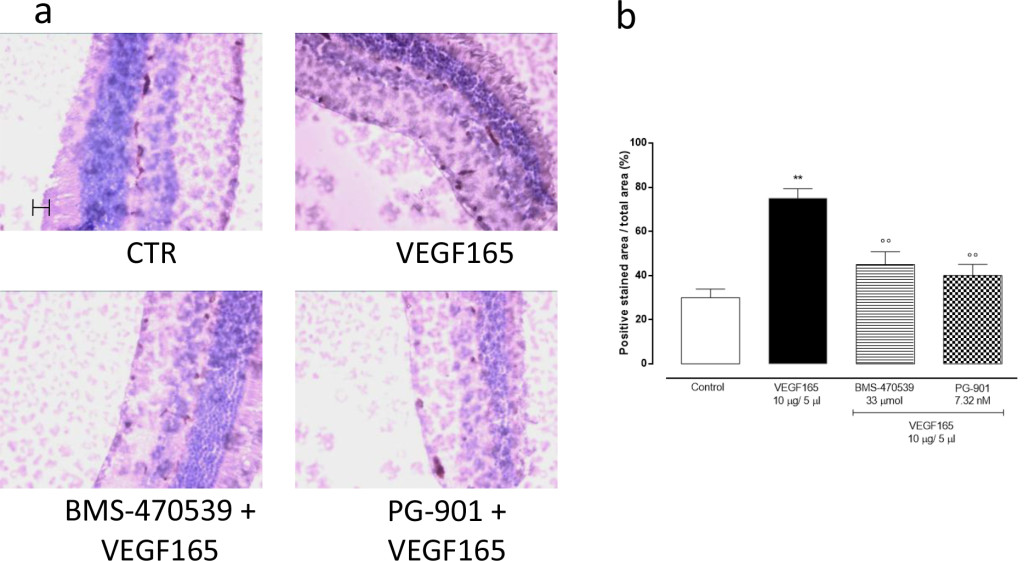
Results: FAG showed a marked vascular tortuosity accompanied by retinal neovascularization in mice receiving VEGF165 intravitreal injection and the absence of neovascularization in mice treated with MCR 1–5 agonists, confirmed by CD34 antigen immunostaining. The biochemical analysis of retinal VEGFR2 gene and protein expression showed that MCR 1–5 agonists significantly reduced VEGFR2 levels, increasing in parallel retinal mir-150 expression.

Conclusions: According to these evidences, we propose that intravitreal injections of melanocortin receptor agonists up-regulate mir-150 expression, and this consequently reduces VEGFR2 expression levels with the endpoint being the blockade of VEGF165 induced retinopathy.

Keywords

intravitreal injection; neovascularization; melanocortin receptors; retina; VEGF;

Introduction

Some of the major eye diseases that cause blindness worldwide are related to intraocular neovascularization. Among these conditions we must consider age-related macular degeneration (AMD), retinopathy of prematurity (ROP), diabetic retinopathy (DR) and retinal vascular occlusions (RVO), which are all linked to ocular ischemia that causes progressively elevated intraocular levels of vascular endothelial growth factor (VEGF) with secondary retinal, subretinal or intravitreal neovascularization leading to progressive visual impairment [1–4].

VEGF is the main player in neovascularization during proliferative retinopathy, it plays a key role as a potent inducer and modulator of proliferation, permeability and survival of endothelial cells. Four VEGF proteins are known VEGFA, -B, -C, -D that act through interaction with the VEGFR1, -2, and -3 receptor subtypes [5,6]. Among these, VEGFR2 is the main receptor that modulates endothelial cell proliferation, migration and in vivo angiogenesis [5,6]. Instead, VEGF-C and -D are involved in the modulation of cell adhesion and cell migration and in extracellular matrix degradation; VEGF-B and PIGF are involved in lymphangiogenesis [7]; VEGF-A promotes the process of neovascularization and increased vascular permeability. In particular, VEGF164(165) isoform is primarily implicated in the pathogenesis of major eye diseases that recognize ocular ischemia as a prime mover [8–11].

The introduction in clinical practice of various anti-VEGF drugs injected intravitreally (bevacizumab, ranibizumab, aflibercept) [12] for the management of the main eye diseases has positively changed the evolution and prognosis of diseases such as AMD,ROP, DR and RVO. In fact, an open research of new strategies and tools has been undertaken nowadays.

Previous studies by Rossi et al.,(2016) indicated that one of these strategies could be that of the modulation of the activity of the retinal endogenous melanocortin pathway and receptors. Indeed, he showed that an agonism at melanocortin receptor 1,5 (MCR1–5) attenuates retinal damage in a mouse model of streptozotocin (STZ) induced diabetic retinopathy (DR) by modulating the pattern of cytockine and chemochine expression [13]. Subsequently, Maisto el al. evidenced that this MCR1–5 agonism restores antioxidant enzyme levels in high glucose primary retinal cells and protects the photoreceptors from the glucose induced damage [14]. These receptors, therefore, appeared to be good candidates for targeted therapy of diabetic retinopathy and possibly its proliferative form as well. Noteworthy, these melanocortin receptors have already been accredited to control a wide range of biological activities including inflammation, oxidative stress, energy homeostasis, sexual function, pain and immune response [13].

Based on this experience, the present study aimed to evaluate the protective effect exerted by MCR 1–5 agonists on retinal vascularization in a mouse model of retinopathy induced by intravitreal injection of VEGF165.

Materials and Methods

BMS-470539 and PG-901 were used as MCR1 and MCR5 agonist respectively [15] and were supplied by Professor Grieco (Pharmacy Department, University of Naples Federico II).

Animals

All the experimental procedures were performed according to Animal Care Ethical Committee of the University of Campania, in accordance with ARVO Statement for the use of Animals in Ophthalmic and Vision Research.

C57BL/6 mice (Harlan, Italy) aged 7 to 10 weeks were housed in standard cages with 24-hours light-dark cycle, humidity and temperature automatically controlled. C57BL/6 mice were divided into 2 settings: the first setting was composed of 2 groups (n = 12 animals per group), treated respectively with sham intravitreous injections of 5μl balanced saline (0.1 ml) and 5μl intravitreal injection of VEGF165 (10μg, Sigma-Aldrich, Italy) [10,11] on day 0. The two groups were monitored by FAG in order to ascertain the time course of the vascular modifications. The second setting was composed of the following 2 groups (n = 8 animals per group): (1) mice treated with 5μl intravitreal injection of the MC1 receptor agonist BMS-470539 (33 μmol) [16] 7 days before the injection of VEGF165 and 1 day after VEGF165 injection; (2) mice treated with 5μl intravitreal injection of the MC5 receptor agonist PG-901 (7.32 nM) [17] 7 days before the VEGF165 injection and 1 day after VEGF165 injection, following pioneering in house experience.

Intravitreal injections

Mice were anesthetized by pentobarbital (45 mg/kg in saline i.p.). Tropicamide (5%) was instilled into the right eye of each animal, in order to induce papillary dilation, and tetracaine (1%) was topically applied for local anaesthesia. Physiological saline, VEGF165 or MC receptor agonists (5 μL volume) were injected intravitreally into the right eye using sterile syringes fitted with a 30-gauge needle (Microfine; Becton Dickinson AG, Meylan, France), as previously described [10,11,18]. Briefly, a transconjunctival 30-gauge, 1.5-mm needle was introduced behind the limbus in the superior temporal quadrant. When the needle was visualized at the vitreous, the various substances were injected in the various experimental groups. After the needle was withdrawn, the scleral entrance site was compressed with a cotton tip for 1 min and a topical antibiotic ointment was applied.

The following MC receptor ligands were used at the indicated doses as selected from the reported publications: BMS-470539, 33 μmol; PG-901, 7.32 nM [16,17].

Fluorescein Angiography (FAG)

For FAG assessment the animals were restrained without anesthesia by grasping firmly at the base of the tail and grasping the scruff of the neck. FAG was performed by using a Topcon TRC-50DX apparatus (Topcon, Japan) following intraperitoneal injection of 10% fluorescein sterile solution (1 mL/kg body weight, AK-Fluor; Akorn Inc., USA). Fundus photographs were captured in order to display the retinal vasculature and to evaluate the early typical alterations of microangiopathy.

Follow-up

In the first setting, FAG was performed after papillary dilatation on all the animals receiving the intravitreal injection of balanced saline or VEGF165 in order to detect the appearance of early vascular disorders. At 7 the day time point, when FAG evidenced neovascularization in VEGF165 mice, 4 animals out of the 12 for each group were randomly chosen, sacrificed and assayed for VEGFR2 and other biochemical parameters. The remaining 8 animals were monitored with FAG at the 14 day time point, when neovascularization was still evident. Again, 4 mice out of the 8 were randomly chosen, sacrificed and assayed for same biochemical parameters as at 7 day time point. The remaining 4 animals were monitored by FAG at 28 days, when no signs of neovascularization were evidenced.

In the second setting, mice receiving intravitreal injection of BMS-470539 and PG-901 seven days prior and one day after VEGF165 were monitored by FAG at 7 and 14 day time points. At 7 days, 4 animals out of the 8 for each group were randomly chosen, sacrificed and assayed for VEGFR2 and other biochemical parameters. The remaining 4 animals were sacrificed and assayed for same biochemical parameters at 14 day time points.

For the biochemical analysis, the eyes were displaced forward by placing curved forceps around the posterior part and cut in two halves. On one half of each eye the cornea was cut using a sharp blade or scalpel, and the retina was squeezed through the cut together with residual pigment epithelium and lens by applying gentle pressure with the forceps. Dissected retina was placed in cooled PBS, freed from non retinal tissue using the forceps, and immediately frozen in liquid nitrogen and stored at −80°C for subsequent biochemical analysis. The other half of each eye was fixed by immersion in 10% neutral buffered formalin and paraffin-embedded for immunohistochemistry.

Immunohistochemistry

CD34 antibody was used as marker of neo-angiogenesis (sc-74499 Santa Cruz Biotec, USA). The ocular tissues were incubated with the primary antibody, washed in PBS, and incubated with secondary antibody. The ocular samples were analyzed by an expert pathologist (variability 6%); every sample was visualized at 200x magnification. The number of CD34 positive particles per area was analyzed in 20 microscopic fields and expressed as percentage of positive stained area/total area.

Total RNA isolation; mir-150 and VEGFR2 mRNA expression levels

The extraction of total RNA, including small RNAs, was performed according the MiRNeasy Minikit protocol (Qiagen, Italy). Syn-cel-miR-39 miScript miRNA Mimic 5 nM (Qiagen, Italy) was added to each sample before the extraction as internal control. The total RNA concentration and integrity were determined by Nanodrop ND-1000 UV spectrophotometer (Nano-Drop® Technologies, Thermo Scientific, USA).

The qRT-PCR analysis for mir-150 was performed on Mastercycler personal (eppendorf, Germany) using miScript II Reverse Transcription Kit (Qiagen, Italy) and on CFX96 Real Time

System cycler (BioRad, Italy) using miScript SYBR Green Kit (Qiagen, Italy) and miScript Primer Assays specific for Syn-cel-miR-39 and mir-150 (Qiagen, Italy).

VEGFR2 gene expression was measured by RT-PCR amplification on Mastercycler personal (eppendorf, Germany). cDNA synthesis was obtained using SuperScript III Reverse Transcriptase Kit (Invitrogen, USA) starting from 200 ng of total RNA. Aliquots of 2 μl cDNA were transferred into a 25 μl PCR reaction mixture containing dNTPs, MgCl2, reaction buffer, specific primers and GoTaq Flexi DNA polymerase (Promega, USA). Sequences for the mouse VEGFR2 mRNA from GeneBank (DNASTAR INC., USA) were used to design specific primer pairs for RT-PCR (Microtech, Italy). The housekeeping gene chosen was hypoxanthine-guanine phosphoribosyl transferase (HPRT). PCR products were resolved into 2.0% agarose gel. A semiquantitative analysis of VEGFR2 mRNA levels was carried out by the Gel Doc EZ UV System (Bio-Rad, USA).

Relative quantification of gene expression was normalized to Syn-cel-miR-39 for mir-150 and to HPRT for VEGFR2, using the 2^−ΔΔCt method.

Enzyme-Linked Immunosorbent Assay (ELISA)

Mouse VEGFR2/Flk-1 Quantikine ELISA Kit (R&D System, UK) was used in the homogenate of dissected retina in order to assess the ocular protein VEGFR2 expression levels, according to the manufacturer’s protocol.

Statistical Analysis

All values are expressed as mean ± standard error of the mean (SEM) of = 4 mice. Statistical analyses were assessed either by Student’s -test (when only two groups were compared) or one-way analyses of variance (ANOVA), followed by Dunnett’s post hoc test (more than two experimental groups). < 0.05 was considered statistically significant.

Results

Melanocortin Receptor1–5 activation prevents the development of retinal neovascularization

No significant vascular alterations were observed in the control group at any of the various time points (Figure 1a and Figure 2a). All the mice treated only with intravitreal injection of VEGF165 developed vascular tortuosity accompanied by retinal neovascularization at 7 days that persisted up to 14 days post-treatment, while it disappeared at the day 28 time point (Figure 1b and Figure 2b).

JCRM2018-103-MaistoRosaItaly_F1

Figure 1. (a) Representative FAG images of a control eye. There are no vascular alterations at the various time points. (b) Representative FAG images of mice treated with intravitreal injection of VEGF165: a marked vascular tortuosity accompanied by retinal neovascularization is present at 7 days and persists until 14 days, while it disappears at the 28 day time point. Arrows indicate the formation of neovessels.

JCRM2018-103-MaistoRosaItaly_F2

Figure 2. (a) Representative FAG images of a control eye (as Figure 1a). (b) Representative FAG images of mice treated with intravitreal injection of VEGF165 (as Figure 1b). (c) Representative FAG images of mice treated with intravitreal injection of BMS-470539 (33 μmol) 7 days before and 1 day after the injection of VEGF165: the mice did not develop retinal neovascularization during the follow-up but only an irregular vessel caliber appeared at 7 days and persisted until the end of the follow-up at 14 days. (d) Representative FAG images of mice treated with intravitreal injection of PG-901 (7.32 nM) 7 days before and 1 day after the injection of VEGF165: the mice did not develop retinal neovascularization but only an irregular vascular course and caliber was observed, accompanied by an increase in vascular permeability, resulting in dye leakage evident at 7 days and persisting until the end of follow-up at 14 days. Arrows indicate the formation of neovessels; arrowheads indicate vascular leakage.

Intravitreal injections of MC1 receptor agonist BMS-470539 (33 μmol) or MC5 receptor agonist PG-901 (7.32 nM) protect retinal vasculature, as demonstrated by FAG. In particular, mice treated with BMS-470539 (33 μmol) 7 days before and 1 day after the injection of VEGF165 did not develop retinal neovascularization during the follow-up, only an irregular vessel caliber appeared at 7 days and persisted until the end of the follow-up at 14 days (Figure 2c). The mice treated with PG-901 (7.32 nM) 7 days before and 1 day after VEGF165 injection did not develop retinal neovascularization during the follow-up, only an irregularity of the vascular course and caliber was observed. However, this was accompanied by an increase in the vascular permeability resulting in dye leakage which was evident at the 7 day time point and persisted until the end of follow-up at 14 days (Figure 2d).

Melanocortin MC1,5 receptor agonists reduce the retinal expression of the hematopoietic endothelial progenitor cell antigen CD34.

In order to confirm the development of retinal neovascularization at 7 and 14 days after VEGF165 intravitreal injection, immunohistochemistry for CD34 was performed in 4 mice per group randomly chosen. At 7 and 14 days, the analysis showed a significant (P<0.01) increase of CD34 immunostaining in mice receiving intravitreal VEGF165 compared to the mice receiving saline solution (Figure 3–4). In contrast, a marked decrease in the percentages of CD34 positive stained area/total stained area was observed at both time points in retinal tissue of mice receiving intravitreal injections of the MC1 agonist BMS-470539 (40.0 ± 5.15% at 7 days; 31.8 ± 4.3% at 14 days) or the MC5 agonist PG-901 (46.7 ± 4.7% at 7 days; 28.9 ± 4.7%) as calculated against the values quantified in VEGF165 mice (Figure 3 and Figure 4).

JCRM2018-103-MaistoRosaItaly_F3

Figure 3.(a) Representative immunohistochemistry for CD34 in the retina of mice treated with vehicle, VEGF165(10 μg/5 μl), BMS-470539 (33 μmol) + VEGF165 and PG-901 (7.32 nM) + VEGF165, 7 days after VEGF165 intravitreal injection. BMS-470539 and PG-901 reduce CD34 immunostaining compared to rats receiving only VEGF165. Scale bar, 50 m. 200x magnification. (b) Graph showing the percentage of the total positive stained area for CD34 per total area analyzed at 200x magnification. Values are mean ± SEM of = 4 observations for each group. ** P < 0.01 vs Control; °° P < 0.01 vs VEGF165.

JCRM2018-103-MaistoRosaItaly_F4

Figure 4. (a) Representative immunohistochemistry for CD34 in the retina of mice treated with vehicle, VEGF165(10 μg/5 μl), BMS-470539 (33 μmol) + VEGF165 and PG-901 (7.32 nM) + VEGF165, 14 days after VEGF165 intravitreal injection. BMS-470539 and PG-901 reduce CD34 immunostaining compared to mice receiving only VEGF165. Scale bar, 50 m. 200x magnification. (b) Graph showing the percentage of the total positive stained area for CD34 per total area analyzed at 200x magnification. Values are mean ± SEM of = 4 observations for each group. ** P < 0.01 vs Control; ° P < 0.05 vs VEGF165.

Melanocortin MC1,5 receptor activation decreases retinal VEGFR2 gene expression

qRT-PCR analysis of VEGFR2 gene expression in the retina showed that in mice receiving a single intravitreal injection of BMS-470539 and PG-901 7 days prior and first day after VEGF165, BMS-470539 and PG-901 significantly down-regulate VEGFR2 gene expression levels both at 7 and 14 day (P < 0.01) time points compared with the group receiving saline only (Figure 5a).

JCRM2018-103-MaistoRosaItaly_F5

Figure 5. (a) RT-PCR analysis for VEGFR2 gene expression in retinal tissue 7 and 14 days after VEGF165 intravitreal injection. Treatment with BMS-470539 (33 μmol) and PG-901 (7.32 nM) significantly decreases VEGFR2 mRNA expression levels at 7 and 14 days, compared to mice receiving saline only. Results are expressed as mean ± SEM of = 4 observations for each group. ** P < 0.01 vs Control. A.U. = arbitrary units. (b) qRT-PCR analyzing mir-150 expression in retinal tissue 7 and 14 days after VEGF165 intravitreal injection. At 7 and 14 days, BMS-470539 (33 μmol) and PG-901 (7.32 nM) significantly increase mir-150 expression levels compared to mice receiving saline only. Values are mean ± SEM of = 4 observations for each group. ** P < 0.01 vs Control. A.U. = arbitrary units.

Melanocortin MC1,5 receptor activation increases mir-150 expression levels

Intravitreal injection of the MC1 agonist BMS-470539 and the MC5 agonist PG-901 7 days prior and first day after VEGF165, significantly up-regulate retinal mir-150 expression levels at 7 and 14 days (P < 0.01) time points compared with the group receiving saline only (Figure 5b). The single injection of VEGF165 into the vitreous does not affect qRT-PCR analysis of the retina for mir-150 expression levels (Figure 5b).

Intravitreal injection of melanocortin MC1,5 receptor agonists reduces retinal VEGFR2 protein levels

To confirm gene expression data, retinal VEGFR2 protein levels were measured by ELISA assay, and fitting with RT-PCR results, VEGRF2 protein levels significantly decreased after BMS-470539 and PG-901 (P < 0.01, Figure 6) at 7 and 14 time points.

JCRM2018-103-MaistoRosaItaly_F6

Figure 6. Retinal VEGFR2 protein expression levels (ng/ml) analyzed by Elisa assay 7 and 14 days after VEGF165 intravitreal injection. BMS-470539 (33 μmol) and PG-901 (7.32 nM) significantly decrease VEGFR2 protein expression levels at 7 and 14 days, compared to mice receiving saline only. Results are expressed as mean ± SEM of = 4 observations for each group. * P < 0.01 vs Control.

Discussion

This paper describes for the first time the protective role of the MC1–5 receptor agonists in a mouse model of retinopathy. The paper shows that a single intravitreal injection of the MC1 receptor agonist BMS-470539 or MC5 receptor agonist PG-901 7 days before and 1 day after the injection of VEGF165 into the vitreous prevents the development of retinal neovascularization as viewed by FAG.

Based on the results obtained in the present study, melanocortins and their receptors seem to be good candidates for treating VEGF dependent neovascularization of the retina having shown pivotal control of the development and progression of new vessels into the retina in the mouse model of retinopathy adopted here, although the single concentration of agonist used is a limitation of any cross-molecule comparison.

Melanocortins are endogenous peptides that possess a wide range of biological activities, including promotion of the resolution phase of inflammation effects in experimental models of inflammation-based diseases [19–27]. Their receptors are ubiquitously expressed into the eye and called MC1, MC3, MC4 and MC5. Rossi et al., in an experimental paper published in 2016 [13] showed that among the four melanocortin receptor subtypes expressed in the retina the MC1 and MC5 are the two involved in a positive control of diabetic retinopathy. Indeed, the activation of these receptors by specific agonists induces a series of downstream events such as reduction of inflammatory cytokines IL-1α, IL-1β, IL-6, chemokines MIP-1α, MIP-2α, MIP-3α and M1 macrophage that lead to reduced retinal damage. To this data, we add here a reduced retinal derangement from MC1,5 agonism exerted through reduced proliferation of new vessels in this tissue.

From the molecular point of view we noted that these structural changes were paralleled by biochemical alterations such as reduction in the expression of the VEGFR2 receptor within the retina both at 7 and 14 day time points. The down-regulation of VEGFR2 was caused by selective stimulation of MC1–5 receptors. Indeed, at the same time points it was not present in the control group treated with VEGF165 only. Thus, neovascularization induced by VEGF165 within the retina is hampered by selective activation of endogenous melanocortin MC1,5 receptors and reduced VEGFR2 receptor expression.

How this happens would require further investigation, but a novelty is provided here by the strict correlation between functional improvement of retinal vessel form, VEGFR2 expression and retinal expression of the miRNA mir-150. This mir-150, reported to attenuate retinal vascular overgrowth in diabetic mice through a down-regulation of VEGFR2 gene expression [27], is for the first time related to melanocortin MC1,5 receptors stimulation by the present study. MC1,5 receptors stimulation increases the expression of the retinal mir-150, consequently down-regulating VEGFR2 gene expression and protein levels. This finally improves the early vascular disorders induced by VEGF165 alone. Mirror of this mechanism, CD34 labeling within the retina was reduced. Particularly, CD34 labeling was increased by VEGF165 both at 7 and 14 day time points, confirming the early vascular disorders evidenced by FAG, while it was significantly reduced after MC1,5 agonists.

Noteworthy, CD34 is a transmembrane phosphoglycoprotein well known marker of hematopoietic endothelial progenitor cells (EPCs) proliferation [28], and shown to promote the formation of pathological, invasive vessels during neovascularization in a mouse model of oxygen-induced retinopathy [29]. Interestingly, the differentiation of these cells from the hematopoietic stem cells (HSCs) is associated with the up-regulation of vascular endothelial growth factor receptor 2 (VEGFR2), after which the HSCs are considered endothelial progenitor cells (EPCs), effectively [30–32].

Conclusions

In conclusion, there is positive interplay exerted through increase of mir-150 between retinal melanocortin MC1,5 receptors and VEGFR2 receptor in the model of VEGF165 induced retinopathy in order to prevent the local neoangiogenesis and retinopathy. From the translational point of view, it is tempting to speculate that the enhancement and reinforcement of the action of the endogenous melanocortins pathway can be a tool to prevent the development of retinal neovascularization, probably by amplifying its anti-inflammatory, anti-oxidant and anti-proliferative role. The potential systemic toxicity of the agents used in this study has not been investigated and would require deepening in order to reinforce their efficacy.

Acknowledgments: The authors are grateful to Professor Paolo Grieco (Pharmacy Department, University of Naples Federico II) for his support and acknowledge the precious funding of MIUR PRIN 2015 project.

Conflicts of Interest: The authors declare no conflict of interest.

References

  1. Miller JW (1997) Vascular endothelial growth factor and ocular neovascularization. Am J Pathol 151: 13–23. [Crossref]
  2. Wild S, Roglic G, Green A, Sicree R, King H (2004) Global prevalence of diabetes: estimates for the year 2000 and projections for 2030. Diabetes Care 27: 1047–1053. [Crossref]
  3. Friedman DS, O’Colmain BJ, Muñoz B, Tomany SC, McCarty C, et al. (2004) Prevalence of age-related macular degeneration in the United States. Arch Ophthalmol 122: 564–572. [Crossref]
  4. Visser L, Singh R, Young M, Lewis H, McKerrow N (2012) Guideline for the prevention, screening and treatment of retinopathy of prematurity (ROP). S Afr Med J 103: 116–125. [Crossref]
  5. Veikkola T, Alitalo K (1999) VEGFs, receptors and angiogenesis. Semin Cancer Biol 9: 211–220. [Crossref]
  6. Dai J, Rabie AB (2007) VEGF: an essential mediator of both angiogenesis and endochondral ossification. J Dent Res 86: 937–950. [Crossref]
  7. Park JE, Keller GA, Ferrara N (1993) The vascular endothelial growth factor (VEGF) isoforms: differential deposition into the subepithelial extracellular matrix and bioactivity of extracellular matrix-bound VEGF. Mol Biol Cell 4: 1317–1326.
  8. Ishida S, Usui T, Yamashiro K, Kaji Y, Amano S, et al. (2003) VEGF164-mediated inflammation is required for pathological, but not physiological, ischemia- induced retinal neovascularization. J Exp Med 198: 483–489. [Crossref]
  9. Ishida S, Usui T, Yamashiro K, Kaji Y, Ahmed E, et al. (2003) VEGF164 is proinflammatory in the diabetic retina. Invest Ophthalmol Vis Sci 44: 2155–2162. [Crossref]
  10. Arana LA, Pinto AT, Chader GJ, Barbosa JD, Morales S, et al. (2012) Fluorescein angiography, optical coherence tomography, and histopathologic findings in a VEGF(165) animal model of retinal angiogenesis. Graefes Arch Clin Exp Ophthalmol 250(10): 1421–8. [Crossref]
  11. Badaro E, Novais EA, Abdala K, Chun M, Urias, M, et al. (2014) Development of an experimental model of proliferative retinopathy by intravitreal injection of VEGF165. J Ocul Pharmacol Ther 30(9): 752–6. [Crossref]
  12. Andreoli CM, Miller JW (2007) Anti-vascular endothelial growth factor therapy for ocular neovascular disease. Curr Opin Ophthal mol 18: 502–508. [Crossref]
  13. Rossi S, Maisto R, Gesualdo C, Trotta M.C, Ferraraccio F, et al. (2016) Activation of Melanocortin Receptors MC 1 and MC 5 Attenuates Retinal Damage in Experimental Diabetic Retinopathy. Mediators Inflamm 7368389.
  14. Maisto R, Gesualdo C, Trotta MC, Grieco P, Testa F, et al. (2017) Melanocortin receptor agonists MCR 1–5 protect photoreceptors from high-glucose damage and restore antioxidant enzymes in primary retinal cell culture. J Cell Mol Med 21: 968–974. [Crossref]
  15. Grieco P, Cai M, Liu L, Mayorov A, Chandler K, et al. (2008) Design and microwave-assisted synthesis of novel macrocyclic peptides active at melanocortin receptors: discovery of potent and selective hMC5R receptor antagonists. J Med Chem 51, 9, 2701–2707. [Crossref]
  16. Leoni G, Voisin MB, Carlson K, Getting S, Nourshargh S, Perretti M (2010) The melanocortin MC1receptor agonist BMS-470539 inhibits leucocyte trafficking in the inflamed vasculature. Br. J. Pharmacol 160(1): 171–180. [Crossref]
  17. Møller CL, Raun K, Jacobsen ML, Pedersen TÅ, Holst B, et al. (2011) Characterization of murine melanocortin receptors mediating adipocyte lipolysis and examination of signalling pathways involved. Mol Cell Endocrinol 341(1–2): 9–17. [Crossref]
  18. Di Filippo C, Zippo M.V, Maisto R, Trotta M.C, Siniscalco D, et al. (2014) Inhibition of ocular aldose reductase by a new benzofuroxane derivative ameliorates rat endotoxic uveitis. Mediators Inflamm 9.
  19. Manna SK, Aggarwal BB (1998) Alpha-melanocyte-stimulating hormone inhibits the nuclear transcription factor NF- B activation induced by various inflammatory agents. J Immunol 161, 6, 2873–2880. [Crossref]
  20. Martin LW, Catania A, Hiltz ME, Lipton JM (1991) Neuropeptide alpha-MSH antagonizes IL-6- and TNF-induced fever. Peptides 12: 297–299. [Crossref]
  21. Bhardwaj RS, Schwarz A, Becher E, Mahnke K, Aragane Y, et al. (1996) Proopiomelanocortin-derived peptides induce IL-10 production in human monocytes. J Immunol 156, 7, 2517–2521. [Crossref]
  22. Redondo P, García-Foncillas J, Okroujnov I, Bandrés E (1998) Alpha-MSH regulates interleukin-10 expression by human keratinocytes. Arch Dermatol Res 290: 425–428. [Crossref]
  23. Grabbe S, Bhardwaj RS, Mahnke K, Simon MM, Schwarz T, Luger TA (1996) -melanocyte-stimulating hormone induces hapten-specific tolerance in mice. J Immunol 156, 2, 473–478.
  24. Slominski A, Wortsman J, Luger T, Paus R, Solomon S (2000) Corticotropin releasing hormone and proopiomelanocortin involvement in the cutaneous response to stress. Physiol. Rev 80, 3, 979–1020. [Crossref]
  25. Scholzen TE, Sunderk¨otter C, Kalden DH, Brzoska T, Fastrich M, et al. (2003) alpha-melanocyte stimulating hormone prevents lipopolysaccharide induced vasculitis by down-regulating endothelial cell adhesion molecule expression. Endocrinology 144, 1, 360–370. [Crossref]
  26. Raap U, Brzoska T, Sohl S, Päth G, Emmel J, et al. (2003) -melanocyte-stimulating hormone inhibits allergic airway inflammation. J Immunol 171, 1, 353–359. [Crossref]
  27. Shi L, Kim AJ, Cheng-An Chang R, Ying W, Ko ML, et al. (2016) Deletion of mir-150 exacerbates retinal vascular overgrowth in high-fat-diet induced diabetic mice. PLoS One 11(6): e0157543. [Crossref]
  28.  Ivanovic Z (2010) Hematopoietic stem cells in research and clinical applications: The “CD34 issue”. World J Stem Cells 2: 18–23. [Crossref]
  29. Siemerink MJ, Hughes MR, Dallinga MG, Gora T, Cait J, et al. (2016) CD34 promotes pathological epi-retinal neovascularization in mouse model of oxygen-induced retinopathy. PLoS One 11(6): e0157902. [Crossref]
  30. Körbling M, Katz RL, Khanna A, Ruifrok AC, Rondon G, et al. (2002) Hepatocytes and epithelial cells of donor origin in recipients of peripheral-blood stem cells. N Engl J Med 346(10): 738–46. [Crossref]
  31. Yeh ET, Zhang S, Wu HD, Körbling M, Willerson JT, Estrov Z (2003) Transdifferentiation of human peripheral blood CD34+-enriched cell population into cardiomyocytes, endothelial cells, and smooth muscle cells in vivo. Circulation 108(17): 2070–3.
  32. Murohara T, Ikeda H, Duan J, Shintani S, Sasaki Ki, et al. (2000) Transplanted cord blood-derived endothelial precursor cells augment postnatal neovascularization. J Clin Invest 105(11): 1527–1536. [Crossref]

Diagnostic Value of Cytotoxic Natural Killer Subpopulations in Malignant Pleural Effusions

DOI: 10.31038/CST.2018331

Abstract

Introduction

Malignant pleural effusion is a sign of advanced disease with poor prognosis. The function of natural killer (NK) cells is to identify and destroy target tumor cells. This study aims to evaluate the role that cytotoxic NK subpopulations play when diagnosing malignant pleural effusion.

Methods

NK subpopulations were determined in pleural fluid and peripheral blood by flow cytometry in 71 patients who had suffered pleural effusion of unknown etiology. They were classified into three groups according to their final diagnosis: malignant, paramalignant and benign.

Results

The NK CD56 dim CD16- subpopulation in peripheral blood was the highest subpopulation in benign than in malignant or paramalignant cases (18.5% vs. 5.5% or 5.6%; p<0.001). Cytotoxic subpopulations NK CD56 dim CD16 + and NK CD16+ were higher in malignant and paramalignant than in benign cases (NK CD56 dim CD16+: 90.7% and 90% vs. 81.4%; p<0.001; NK CD16+: 95% and 95.6% vs. 86.5%; p<0.002). No differences were found in any cells studied in pleural fluid.

Conclusions

The data from this study suggested that determining the percentage of subpopulations NK CD56 dim CD16+ and NK CD16+, which perform an antibody-dependent cytotoxic function in peripheral blood, can be useful to diagnose malignant pleural effusion.

Keywords

diagnosis; flow cytometry; natural killer cells; natural killer subpopulations; pleural effusion; malignant

Introduction

Malignant pleural effusion (MPE) is a common clinical problem among patients with neoplastic disease. It is a sign of advanced disease associated with symptoms deteriorating and worse quality of life, with mean survival varying between 3 and 12 months [1]. Given its poor prognosis and clinical involvement, diagnoses must be made early. However, a malignancy diagnosis is not always possible with cytology, whose sensitivity range is 40–87% [2]. Hence the need to resort to complementary methods to identify tumor cells within pleural effusions (PE), [3] and to start early therapeutic interventions in an attempt to reduce these patients’ morbimortality.

MPE are characterized by a high percentage of mononuclear cells involved in immunological defense mechanisms, natural killer (NK) cells being one of the main components of the immunological system that participate in anti-tumoral defense mechanisms [4]. In theory, the presence of a high percentage of NK cells in pleural fluid could help establish its neoplastic nature. However, total NK (CD3- CD56+) quantification in pleural effusions has provided contradictory results in former studies [5–9].

Nowadays, there is very little information about the different NK cell subpopulations which can be found in MPE. However, it is known that the function of these subpopulations can be identified using the intensity of the expression of CD56 and CD16 surface antigens [10]. NK CD56 bright are considered regulator cells given their high capacity of producing pro-inflammatory and anti-inflammatory cytokines, [11] while NK CD56 dim [12] are cytotoxic given their high lytic activity. If the latter are also accompanied by a high CD16 expression, this makes them efficient mediators of antibody-dependent cell cytotoxicity [13]. CD57+ expression is a marker with a strong cytotoxic potential [14,15]. However, there is no data available on CD57+ expression in MPE. Therefore, the already available data seems to indicate that determining only total NK cells is not enough to identify MPEs differentiate them from benign ones. As NK subpopulations are characterized by performing more specific functions, the objective of this study was to study NK cell subpopulations, mainly those with a cytotoxic function, and their discriminative power in early differentiation of MPE, paramalignant pleural effusions (PPE) and benign pleural effusions (BPE).

Methods And Materials

Subjects

This two year (January 2013 to February 2015) prospective observational cohort study included 73 patients who had suffered pleural effusion of unknown etiology and were to undergo diagnostic thoracentesis. The final sample included 71 patients, two patients were excluded as no cellularity was obtained in pleural fluid. Patients were classified into three well differentiated groups according to their PE diagnosis: MPE, PPE and BPE (Figure 1).

CST2018-111-MariaM.MoralesItaly_F1

Figure 1. Flow of patients included in the study

Diagnosis of the type of PE was done according to the following criteria:

MPE was diagnosed if the presence of tumor cells in the pleural cavity was confirmed by a cytological study of pleural fluid, or in pleural tissue obtained by blind pleural biopsy, thoracoscopy or thoracotomy.

PPE (16) is due to a tumor process, but with no direct pleural infiltration by the tumor, and no tumor cells in the pleural fluid or tissue can be determined.

A PE is considered a BPE or as non-specific, when tumor etiology has been reasonably ruled out by imaging techniques, previous examinations, medical history and patient follow-up.

This study complies with the principles of the Declaration of Helsinki. Ethical approval of the study was given by Committee of Ethics and Clinical Trials (CEIC) of the Dr. Peset University Hospital in Valencia, with CEIC code: 10/12 on 29 February 2012. All the participating patients received written information about the nature and purposes of the study and gave their informed consent. A prospective follow-up of patients’ progress was done until they died or the study ended. All patients who were asked to be included in the study agreed to participate.

Measuring Natural Killer Cells

The lymphocyte populations in both the pleural fluid obtained from the first diagnostic thoracentesis performed on each patient and in the peripheral blood taken on the same day were analyzed.

After extraction, homogenization of the peripheral blood sample is immediately performed by the stirrer and mixer The Coulter Mixer (Coulter Electronics Limited, Northwell Drive, Luton, Bedfordshire, LU3 3RH, England®). Then, in a polypropylene tube, 100 μl of sample is introduced with 10 μl of each of the chosen monoclonal antibodies: CD45, CD19, CD3, CD56, CD16 and CD57. The mixture will be incubated for 15 minutes in the dark at room temperature. 0.5ml of the erythrolytic solution OptiLyse® are added, vortexed (Super-Mixer, Lab-Line Instruments Inc.®) and re-incubated in the dark at room temperature for another 15 minutes. After incubation, 2 ml of phosphate-buffered saline are added, centrifuged for 5 minutes at 300 x g (~1,600 r.p.m.) in a Microcen 21® and finally the supernatants are decanted and the cells re-suspended in 1 ml of phosphate-buffered saline and then introduced into a Navios® flow cytometer (Beckman-Coulter).

As in peripheral blood, the pleural fluid sample requires homogenizing the sample after extraction performed using the stirrer and mixer The Coulter Mixer (Coulter Electronics Limited, Northwell Drive, Luton, Bedfordshire, LU3 3RH, England®). However, the pleural fluid sample must be enriched prior to incubation. To do this, 2 ml of phosphate-buffered saline are added to 2 ml of pleural fluid, shaken and centrifuged at 300 x g (~1,600 r.p.m.) in a Microcen 21® for 5 minutes. The supernatants are then decanted and the cells are re-suspended in 0.5 ml of phosphate-buffered saline. After this process, the incubation with the monoclonal antibodies and procurement of the sample to be introduced in the flow cytometer can be performed following the same steps as in the peripheral blood.

A blind analysis of the diagnosis was run with the Kaluza 1.3 software (Beckman-Coulter). The sensitivity of the technique was 10-2 –10-3. After the expression of CD45, B (CD19+ CD3-) and T (CD3+ CD19-) lymphocytes as well as NK cells (CD3- CD56+) were studied first and compared to the 100% total lymphocytes. After and according to the intensity of the expression of antigens CD56 and CD16, the following subpopulations were differentiated: NK CD56 bright (++) CD16-, NK CD56 bright (++) CD16+, NK CD56 dim (+) CD16-, NK CD56 dim (+) CD16+ and NKCD16+ (CD56+/++ CD16+). NKCD57+ (CD56+/++ CD57+) were also determined and percentage quantification was done of all the NK subpopulations compared to the percentage of total NK cells.

Statistical analysis

All the results obtained were analyzed using the Kolmogorov-Smirnov test for a sample to determine if they followed a normal distribution pattern. Results were compared using the chi-square test for qualitative variables, the Student’s t-test for parametric quantitative variables and the Mann-Whitney U test for non-parametric quantitative variables. When comparing more than two groups, a one-way ANOVA (analysis of variance) was applied to the parametric variables and the Kruskal-Wallis test to the non-parametric variables.

The diagnostic efficacy of the analysis of the cells from pleural fluid and peripheral blood which presented differences considered significant enough to discriminate between MPE/PPE and BPE was determined by a receiver operating characteristic (ROC) curve analysis with the area under the ROC curve (AUC). A p-value <0.05 was considered significant and their 95% confidence intervals (95% CI) were calculated by standard techniques. The statistical package IBM SPSS Statistics for Windows (version 21.0. Armonk, New York: IBM Corp., USA) was employed.

Results

Demographics

This study took place at the University Dr. Peset Hospital in Valencia from 2013 to 2015 and analyzed 71 patients who had suffered PE of unknown etiology. The study population’s mean age was 69.1 years, and no differences were observed among groups. Male gender clearly predominated among the MPE and PPE cases (Table 1). According to the final PE diagnosis made, three groups were formed: MPE, PPE and BPE (Figure 1). All the MPE were exudates as well as 93.3% of PPE and 80% of the BPE (p=0.027) Adenocarcinoma was the most frequent histology found among the MPE (Table 1).

Table 1. Characteristics of the patients with malignant, paramalignant and benign pleural effusions.

 Malignant

(n=31)

Paramalignant

 (n=15)

 Benign

(n=25)

 p-valueb

Age (years)

95% CI

69.2±8.9

65.9–72.4

69.8 ±11.1

63.6–76

68.7 ±12.2

63.6–73.7

0.949

Gender

0.133

Male

19 (61.3%)

12 (80%)

12 (48%)

Female

12 (38.7%)

3 (20%)

13 (52%)

Diagnosis

Adenocarcinoma 22 (71%)

Non-specific 12 (48%)

Lymphoma 4 (13%)

CHF 4 (16%)

Mesothelioma 2 (6.5%)

Infectious 3 (12%)

Epidermoid 1 (3.2%)

TBC 2 (8%)

Microcytic 1 (3.2%)

Exp. to asbestos 2 (8%)

Myxoid sarcoma 1 (3.2%)

Cirrhosis 1 (4%)

RA 1 (4%)

Abbreviations: CI (confidence interval), CHF (congestive heart failure), TBC (tuberculosis), Exp. (exposure), RA (rheumatoid arthritis).
aData expressed in absolute values and percentages or mean±SD.
bChi-square test or ANOVA.

Lymphocyte populations in pleural fluid and peripheral blood

Lymphocyte populations were studied by determining B and T lymphocytes and NK cells in pleural fluid and peripheral blood. No differences between the expression of any cell line of the different groups was observed; that is, NK cells showed no higher expression in any pleural effusion type.

NK subpopulations in pleural fluid and peripheral blood

NK subpopulations were analyzed according to the intensity of the expression of surface antigens CD56 and CD16. No differences were found between the MPE, PPE and BPE groups in any cells studied in pleural fluid. Surprisingly, in peripheral blood, significant differences between the groups in the NK subpopulations were found. Subpopulation NK CD56 dim CD16- was higher in BPE cases than in the MPE or PPE ones (18.5% vs. 5.5% or 5.6%; p<0.001). Cytotoxic subpopulations NK CD56 dim CD16 + and NK CD16+ were higher in the MPE and PPE cases than in BPE ones (NK CD56 dim CD16 +: 90.7% and 90% vs. 81.4%; p<0.001 and NK CD16+: 95% and 95.6% vs. 86.5%; p<0.002) (Table 2).

Similarly, NK subpopulations analysis in peripheral blood showed that subpopulation NK CD56 dim CD16- was higher in BPE cases (18.5% vs. 5.5%; p<0.001), and subpopulations NK CD56 dim CD16 + and NK CD16+ appeared mostly in the combined MPE and PPE group, and in the isolated MPE cases (NK CD56 dim CD16 +: 90.7% vs. 81.4%; p<0.001 and NK CD16+: 95% vs. 86.5%: p<0.002) (Table 3).

Table 2. Natural killer subpopulations in peripheral blood.

Malignant

(n=31)

Paramalignant

(n=15)

Benign

(n=25)

p-valueb


NK (CD3-CD56+)

11.6 (0.7–73.2)

9.6 (1.7–16.2)

7 (0.7–31.3)

0.520

NK CD56 bright

0.5 (0–12.7)

1.4 (0–9.1)

0.5 (0–31)

0.479

CD56 bright CD16-

0.2 (0–2.7)

0.4 (0–2)

0.3 (0–17.8)

0.720

CD56 bright CD16+

0.1 (0–11.4)

0.7 (0–8.1)

0 (0–13.2)

0.155

NK CD56 dim

98.6 (81.5–100)

96.9 (91.6–100)

99.4(65.9–100)

0.189

CD56 dim CD16-

5.5 (0.3–92.1)

5.6 (0.3–24.4)

18.5(2.5–100)

0.001***

CD56dim CD16+

90.7 (7.4–99)

90(70.7–99)

81.4 (0–95.4)

0.001***

NK CD16+

95 (7.8–99.6)

95.6 (76.1–99.5)

86.5 (0–97.1)

0.002**

NK CD57+

48.6±20

49.2±17.4

54.4±14.5

0.454

Abbreviations: NK (natural killer).
aPercentage data expressed as mean±SD or median (minimum-maximum).
bANOVA or Kruskal-Wallis test.
*p<0.05; **p<0.01; ***p<0.001

Table 3. Cytotoxic natural killer subpopulations in peripheral blood.

Malignant

(n=31)

Benign

 (n=25)

 p-valueb

CD56dim CD16-

5.5 (0.3–92.1)

18.5 (2.5–100)

0.001***

95%CI

2.3–13

11.8–28.1

CD56dim CD16+

90.7 (7.4–99)

81.4 (0–95.4)

0.001***

95%CI

87–97.7

71.9–88.2

NK CD16+

95 (7.8–99.6)

86.5 (0–97.1)

0.002**

95%CI

92.8–99.8

78.8–92.9

Abbreviations: NK (natural killer) CI (confidence interval).
aPercentage data expressed as median (minimum-maximum).
bStudent’s t-test or Mann-Whitney U test.
*p<0.05; **p<0.01; ***p<0.001

Diagnostic efficacy of cytotoxic NK subpopulations

These results reveal that, despite there being no differences in the NK subpopulations in pleural fluid to differentiate malignant cases from benign ones, differences appeared in the following NK subpopulations in peripheral blood: NK CD56 dim CD16-, NK CD56 dim CD16 + and NK CD16+. In order to determine the diagnostic efficacy of the analysis of these subpopulations in blood, a ROC curve analysis with AUC was performed. The isolated determination of the percentage in peripheral blood of subpopulation NK CD56 dim CD16- had an AUC of 0.777 to discriminate a BPE from a MPE (95%CI: 0.653–0.901; p<0.001). If the cut-off point was 9.82%, sensitivity would be 76% and specificity would be 71%. In order to differentiate a BPE from a MPE/PPE, the AUC was 0.784 (95%CI: 0.671–0.897; p<0.001), with a sensitivity of 76% and a specificity of 72% with the same cut-off point (Figure 2).

CST2018-111-MariaM.MoralesItaly_F2

Figure 2. ROC curve of subpopulation NK CD56 dim CD16- to differentiate benign pleural effusions from malignant and paramalignant ones

Subpopulations NK CD56 dim CD16 + and NK CD16+, which have an antibody-dependent cytotoxic function, allow for discrimination of a patient with MPE from one with a BPE with an AUC of 0.761 (95%CI: 0.637–0.885; p=0.001) and 0.747 (95%CI: 0.619–0.876; p=0.002), respectively. In order to differentiate a MPE and PPE from a BPE, the AUC was 0.774 (95%CI: 0.663–0.885; p<0.001) and 0.753 (95%CI: 0.640–0.867; p<0.001), respectively (Figure 3).

CST2018-111-MariaM.MoralesItaly_F3

Figure 3. ROC curves of subpopulations NK CD56 dim CD16 + and NK CD16+ to differentiate malignant and paramalignant pleural effusions from those of a benign type

Discussion

MPE is a sign of advanced neoplastic disease which implies the pleural space has been affected by this malignant process. Given these patients’ poor prognosis, its diagnosis is therefore essential, and it would be very useful to identify markers that increase the possibility of diagnosing this malignity. Here, NK cells can play a key role in the defense against neoplastic invasion of the pleural cavity. In theory, detecting a high percentage of NK cells in MPE could help establish their tumoral nature. Despite some authors having observed a higher NK cell percentage in MPE, [5–7] others have reported a lower percentage, [8] and some groups, including our own, have not even found any differences [9]. It would appear that published data may indicate that determining only total NK cells is not sufficient to distinguish MPE from BPE. Therefore, we have centered our research on the NK subpopulations characterized by playing a cytotoxic function as presence of neoplastic cells in pleural fluid or tissue should reflect increased cytolytic activity in MPE compared to those of other etiologies. Apart from the subpopulations that explain the intensity of the expression of CD56 and CD16, potentially cytotoxic subpopulation NK CD57+ was also evaluated in differentiating a MPE from a BPE. Our data demonstrated that although no differences between groups or between malignant and benign cases were found in any of the studied cells in pleural fluid, differences appeared in peripheral blood: subpopulation CD56 dim CD16- was higher in BPE cases, and subpopulations CD56 dim CD16 + and NK CD16+ were higher in MPE and PPE ones. This indicated that a high CD16 expression made them efficient mediators of antibody-dependent cell cytotoxicity [13] with expressions in blood, but not in pleural fluid. These findings led us to wonder if there was a more relevant systemic response than the local one in patients with MPE. No published works have analyzed the diagnostic value of NK subpopulations in peripheral blood to distinguish between MPE and BPE. Moreover, information about pleural fluid is scarce. Scherpereel et al.[17] found increased CD16+ in pleural fluid in all PE except for BPE. Cornfield et al.[4] analyzed 30 malignant (pleural, pericardial and ascitic) effusions and 30 benign ones, and found no differences in the percentage of any subpopulation they studied. These authors only reported an increase in the absolute value of NK CD16+ in malignant effusions. Pace et al.[18] encountered that NKCD16+ percentages in patients with MPE and BPE were similar. The comparison made of the findings from this work with the few existing studies is complicated due to the different methodologies employed. Our data coincide with those reported by Cornfield et al. [4] The work by Pace et al. [18] only included 19 patients with MPE, while the BPE group differed (due to heart failure) to that herein studied as they were effusions of unknown etiology suspected of malignity, which pose a problem in diagnosing MPE. Moreover, although NKCD57+ displayed high cytolytic activity, [14,15], no published studies have been conducted on this marker in MPE, and this is the first work to analyses it.

In order to determine the diagnostic efficiency of the analyses of these subpopulations in blood, a ROC curve analysis was carried out. The subpopulation with the largest AUC to differentiate BPE from malignant ones was NK CD56 dim CD16- (0.777), which increased to 0.784 when the discrimination was between BPE and both MPE and PPE. When distinguishing between malignant and benign cases, subpopulations NK CD56 dim CD16+ and NK CD16+ had an AUC of 0.761 and 0.757, respectively. When MPE and PPE were distinguished from BPE the AUC increased to 0.774 and 0.753. This result has never been previously reported.

The main limitation of this study was that 21.1% of the included effusions were of the PPE type. Other studies[4,18] did not include this type. However, as the PPE type has its typical characteristics and is associated with poor prognosis, we decided to include it to well reflect the usual clinical reality.

By way of conclusion, determining the percentage of NK cells in pleural fluid of PE of unknown etiology does not allow malignant cases to be differentiated from benign ones. However, determining the percentage of subpopulations NK CD56 dim CD16+ and NK CD16+ that perform an antibody-dependent cytotoxic function in peripheral blood was identified as a diagnostic test whose capacity helps to early discriminate a patient with a MPE.

Author Contributions: All authors have been involved in the conception and design, or analysis and interpretation of data, as well as in drafting the article or revising it critically for important intellectual content. Maria Morales-Suarez-Varela has been designated as guarantor for the article.

Acknowledgements: The authors would like to thank the Pulmonology Foundation of the Valencian Community for the grant this work was awarded with, and with which the monoclonal antibodies employed were obtained. They would also like to thank everyone who has collaborated either directly or indirectly in this research.

Ethical Approval: All procedures performed in studies involving human participants were in accordance with the ethical standards of the institutional and/or national research committee and with the 1964 Helsinki declaration and its later amendments or comparable ethical standards.

Informed Consent: Informed consent was obtained from all individual participants included in the study.

Competing Interest: The authors declare that they have no competing interest.

Funding Information: Dr. Herrera Lara has received research scholarship support from the Pulmonology Foundation of the Valencian Community.

References

  1. Roberts ME, Neville E, Berrisford RG, Antunes G, Ali NJ (2010) BTS Pleural Disease Guideline Group. Management of a malignant pleural effusion: British Thoracic Society Pleural Disease Guideline Thorax 65 Suppl 2: ii32–40.
  2. Villena Garrido V, Ferrer Sancho J, Hernández Blasco L, de Pablo Gafas A, Pérez Rodríguez E, Rodríguez Panadero F, et al. (2006) Diagnóstico y tratamiento del derrame pleural. Arch Bronconeumol 42: 349–372.
  3. Stonesifer KJ, Xiang JH, Wilkinson EJ, Benson NA, Braylan RC (1987) Flow cytometric analysis and cytopathology of body cavity fluids. Acta Cytol 31: 125–130.
  4. Cornfield DB, Gheith SM (2009) Flow cytometric quantitation of natural killer cells and T lymphocytes expressing T-cell receptors alpha/beta and gamma/delta is not helpful in distinguishing benign from malignant body cavity effusions. Cytometry B Clin Cytom 76: 213–217.
  5. Green LK, Griffin J (1996) Increased natural killer cells in fluids. A new, sensitive means of detecting carcinoma. Acta Cytol 40: 1240–1245. [crossref]
  6. Yu GH, Hida CA, Salhany KE, Baloch Z, Gupta PK (1999) Immunohistochemical detection of cytotoxic lymphocytes in malignant serous effusions. Diagn Cytopathol 21: 18–21.
  7. Laurini JA, Garcia A, Elsner B, Bellotti M, Rescia C (2000) Relation between natural killer cells and neoplastic cells in serous fluids. Diagn Cytopathol 22: 347–350.
  8. Sikora J, Dworacki G, Trybus M, Batura-Gabryel H, Zeromski J (1998) Correlation between DNA content, expression of Ki-67 antigen of tumor cells and immunophenotype of lymphocytes from malignant pleural effusions. Tumor Biol 19: 196–204.
  9. Jezewska E, Sikora J, Slowik-Gabryelska A, Zeromski J (1993) Evaluation of immunophenotype of lymphoid cells isolated from malignant pleural effusions. Arch Immunol Ther Exp (Warsz) 41: 51–56.
  10. Caligiuri MA (2008) Human natural killer cells. Blood 112: 461–469. [crossref]
  11. Poli A, Michel T, Thérésine M, Andres E, Hentges F, Zimmer J (2009) CD56bright natural killer (NK) cells: an important NK cell subset. Immunology 126: 458–465.
  12. Sedlmayr P, Schallhammer L, Hammer A, Wilders-Truschnig M, Wintersteiger R, Dohr G (1996) Differential phenotypic properties of human peripheral blood CD56dim and CD56bright natural killer cell subpopulations. Int Arch Allergy Immunol 110: 308–313.
  13. Montserrat Sanz J, García Torrijos C, Díaz Martín D, Prieto Martín A (2013) Linfocitos natural killer. Medicine(Spain) 11: 1728–1736.
  14. Lopez-Verges S, Milush JM, Pandey S, York VA, Arakawa-Hoyt J, Pircher H, et al (2010) CD57 defines a functionally distinct population of mature NK cells in the human CD56dimCD16+ NK-cell subset. Blood 116: 3865–3874.
  15. Nielsen CM, White MJ, Goodier MR, Riley EM (2013) Functional Significance of CD57 Expression on Human NK Cells and Relevance to Disease. Front Immunol 4: 422.
  16. American Thoracic Society (2000) Management of malignant pleural effusions. Am J Respir Crit Care Med 1987–2001.
  17. Scherpereel A, Grigoriu BD, Noppen M, Gey T, Chahine B, Baldacci S, et al. (2013) Defect in recruiting effector memory CD8 T-cells in malignant pleural effusions compared to normal pleural fluid. BMC Cancer 13: 324.
  18. Pace E, Di Sano C, Ferraro M, Tipa A, Olivieri D, Spatafora M, et al. (2011) Altered CD94/NKG2A and perforin expression reduce the cytotoxic activity in malignant pleural effusions. Eur J Cancer 47: 296–304.

Efficacy of Albendazole on Gastro-Intestinal Strongyles of Cattle in Ngaoundere (Adamawa-Cameroon)

DOI: 10.31038/IJVB.2018222

Abstract

The present study aimed at identifying the gastro-intestinal Strongyles of cattle and to evaluate the effect of albendazole on their population dynamics throughout the year. Three cattle farms located in the village of Velambai were used for the study. 175 animals were screened through coprological examination to assess their infection rate (IR) with gastro-intestinal nematodes. 50 Goudali were monitored from April 2015 to March 2016. Of these animals selected, 25 of them received albendazole on day 0 (D0) and constituted the treated group while the other 25 received nothing and stood for the non-treated group. Faeces were examined using the McMaster method to evaluate the efficacy of treatment and to monitor changes in faecal shedding of Strongyles. Faeces from animals were cultured to recover the infective L3 larval stage of Strongyles by the Baermann method. The survey revealed that Strongyles, Strongyloides and Toxocara were the main gastro-intestinal helminths infecting cattle with IRs of 64.5%, 15% and 24.1% respectively. Deworming at the beginning of the rainy season reduced the shedding of helminth eggs (EPG < 400) throughout the season. Percentage reduction in the number of eggs per gram of faeces (EPG) from Strongyles was 68% at day 30. Stool culture revealed the presence of four types of Strongyles with varying abundance depending on the genus (Trichostrongylus, Haemonchus, Cooperia and Oesophagostomum), animal group and month. The genera Trichostrongylus and Haemonchus were dominant throughout the year. Haemonchus spp were significantly sensitive to albendazole between D30 to D90. On D120, albendazole lost its effect with the genus Haemonchus which resulted in the re-infection of the animals, whereas this effect was rather late for the genus Oesophagostomum (from D270).

Key words

Gastro-intestinal helminths, stool culture, deworming, Albendazole, Ngaoundere, Cameroon.

Introduction

Livestock is an important source of income in most developing countries and contributes to food security. In Africa, it contributes upto 10–20% of the gross domestic product (GDP) [1]. However, in the Adamawa Region of Cameroon like in other African regions, this sector is subject to several constraints including diseases [2] for instance gastro-intestinal cattle strongylosis [1]. Strongylosis contributes to emaciation especially at the end of the dry season [3] and leads to production loss. The control of these pathologies in order to improve the individual productivity of cattle is therefore a necessity in a context already marked by the rapid growth of the human population and the increasing demand for animal protein, both in Cameroon and in all developing countries. In Cameroon, particularly in the Adamawa region, deworming has become a common practice by Veterinarians, but most often by breeders themselves and in most cases without seeking for medical advice [1–4]. For almost two decades now, the anti-parasitic pharmaceutical industries have made tremendous advancements in terms of developing new molecules with improved anthelminthic properties, but parasitism still prevails [5]. Just of recent, albendazole was introduced as an essential anthelmintic, but its usage is sometimes abused [6]. In a context where modern breeding is increasingly confronted with problems related to chemical residues (food safety) and the appearance of parasitic resistant strains to the main families of pharmaceuticals around the world, this has exposed the limitations of a systematic deworming and makes the implementation of treatment protocols essential [3–7]. Studies on the efficacy of albendazole on gastrointestinal parasites in calves in the dry season in vina by Sakativa [8] and Sassa et al. [9] in sheep in Mbé in the Adamawa region, revealed the significant impact of gastro-intestinal parasitosis on the productivity of ruminants in the respective areas. But a longitudinal follow-up study on the effect of deworming on the dynamics of gastro-intestinal Strongyles of adult cattle in Vina is lacking. The purpose of this study was to determine the prevalence of cattle helminths and to evaluate the impact of albendazole treatment on faecal egg counts.

Material and Methods

Study zone

This field trial was carried out in Velambai, geographically located between latitude 6° and 8° North and between longitude 11° and 15 ° East. This area is called the ‘Castle of water’ because large number of rivers in the country originates from this locality. Resulting from the emergence of the old crystalline basement, the department of Vina is elevated at an altitude between 1000 and 1300 meters [10]. The high altitude of this region provides a relatively cool climate with temperatures ranging between 22–25°C [11]. The climate is of the Sudanese tropical type with two seasons: the dry season that occurs from November to March, followed by the wet season. The average annual rainfall is 900 mm to 1500 mm. This area is covered by discontinuous vegetation consisting of savanna grasses such as Hyparrheenia, Panicum and Sporobolus. Three cattle farms were randomly selected from the Velambai locality, where 175 animals of the Goudali cattle breed of both study groups received food supplements such as molasses and cotton seed cake (two to three times a week) during the dry season. Coprological assays were carried out on day zero (D0). A study on the prevalence of gastrointestinal parasites was performed on all the 175 selected animals. Faeces was collected from the rectum, stored in a cooler and transported to the Wakwa Agricultural Research Institute for Development (IRAD) Parasitology laboratory for analysis using the McMaster method. The egg per gram of faeces (EPG) ≥ 50 was noted [12–13].

To evaluate the impact of deworming using albendazole on the population dynamics of gastrointestinal strongyles, two groups of cattle were used to monitor the variation of gastro-intestinal Strongyles for 12 months post albendazole administration. 50 cattle of both sexes were selected from the 175 cattle initially selected. These 50 animals were divided into two groups: treated group of 25 cattle including 8 males and 17 females and an untreated group of 25 cattle including 11 males and 14 females. Only the animals in the experimental group (treated group) had undergone deworming with albendazole in bolus (7.5mg / Kg per os).
Fecal samples were taken once a month for 12 months (from April 2015 to March 2016), ie D0, D30, D60, D90, D120, D150, D180, D210 D240, D270, D300 and D330 after the administration of albendazole. Faecal samples of the animals were cultured in a saturated salt solution and larvae were isolated using the Baermann method [14]. Larval identification was carried out using the identification key of [15].

Data Analysis

The One-way analysis of variance (ANOVA) was performed to compare the effect of age, sex, type with infection prevalence. To compare different infection rates of nematodes, the X2 test was performed. The EPG averages of the two groups of cattle were compared using the Student t-Test. These different statistics were carried out using the R version 3.2 software. The efficacy of the treatment with albendazole was calculated at day 30 using the method of Presidente [16].

Results

The identification of gastro-intestinal helminths in cattle led to the identification of helminth eggs of veterinary importance i.e. strongyles; Strongyloides papillosus and Toxocara vitulorum. Strongyles were the most common (64.7%) (170.65 ± 7.67). Age and sex were statistically significant (p ≤ 0.05) with infection prevalence. Young animals (1–2 years) were the most infected (85%) and males (76.92%) were more infected than females (60.29%) (Table 1). The prevalence of Toxocara vitulorum was 24.1% (20.3–28). The young recorded a prevalence of 24.28% more infested than adults with a significant difference (p ≤ 0.05) (Table 1). The prevalence of Strongyloides was 12.3% (8.6–16) (Table 1).

Table 1. The prevalence of gastro-intestinal nematodes

IJVB2018-104-LendzeCameroon_F6

a, b, c, d: values with different superscript letters on the same line are significantly different (p < 0.05). µ: mean. sd: standard deviation, EPG: egg per gram

Effect of albendazole on the EPG of gastro-intestinal Strongyles

From D30 to D120 after treatment with albendazole, there was a significant decrease (p < 0.001) in faecal excretion of Strongyles eggs in the treated group (Table II). The EPG’s percentage reduction was 67.15%. In the untreated group, monthly EPG averages were moderate (EPG < 400) throughout the study period. Mean faecal egg shedding variations with respect to Strongyles revealed a peak on D90, but decreased to 68EPG on D330 (Table 2).

Table 2. Effect of albendazole on the EPG of gastro-intestinal Strongyles

Period

Treated group (µ ± sd)

Non-treated group (µ ± sd)

P-value

Significant levels

April (D0)

204 ± 170.73

268 ± 226.33

0.265

NS

May (D30)

86 ± 65.38

344 ± 162.86

0,000

***

June (D60)

180 ± 139.19

330 ± 158.77

0.000

***

July (D90)

179.17 ± 207.95

381.25 ± 181.67

0,000

***

August (D120)

202.17 ± 188.58

360.41 ± 174.44

0.004

***

September (D150)

190.91 ± 243.80

291.67 ± 155.11

0.106

NS

October (D180)

204.35 ± 180.22

277.08 ± 129.36

0.121

NS

November (D210)

46.87 ± 71.81

127.08 ± 141.41

0.024

*

December (D240)

33.33 ± 48.80

147.83 ± 154.83

0.003

***

January (D270)

60.00 ± 91.03

135.29 ± 125.95

0.06

NS

February (D300)

75.00 ± 106.46

68.18 ± 83.87

0.833

NS

March (D330)

103.13 ± 107.19

145.24 ± 108.29

0.247

NS

*: significatif; **: more significatif; ***: most significatif; µ: mean; sd: standard deviation, NS: no significant difference.

After the coproculture of the L3 nematode larval stages, the following nematodes: Haemonchus spp., Trichostrongylus spp., Cooperia spp., and Oesophagostomum spp were identified at the beginning of the rainy season. The proportion of the nematodes recovered from the different parts of the gastro-intestinal tract was: Abomasum parasites: Trichostrongylus spp. (42%) and Haemonchus spp. (28%), Parasite of the small intestine, of Cooperia spp. (18%), Parasite of the large intestine, Oesophagostomum spp. (12%). These four genera were present throughout the study in all the sampled herds. The variations of the average monthly intensities of the L3 of the Strongyles showed an overall monthly variation of Strongyles. Trichostrongylus sp. was the most common species from April to October with the lowest infection rate (IR) in January. Haemonchus sp. had two peaks: the first one in August and the second higher rate (56%) in January. Cooperia sp peaked in September while Oesophagostomum presented two peaks, the first in October and the second in late January and declined with its lowest rate in March (Figure 1).

IJVB2018-104-LendzeCameroon_F1

Figure 1. Monthly evolution of the L3 stages of the species of the genera of helminthes identified (T, non-treated animals)

The impact of deworming on Trichostrongylus sp. population was remarkable on D90 in the month of July and the percentage L3 shedding significantly declined in January (Figure 2).

IJVB2018-104-LendzeCameroon_F2

Figure 2. Effect of albendazole on Trichostrongylus sp. (E, treated group and T, non-treated group)

Haemonchus in the treated group responded to treatment by recording an L3 reduction from 29% (April-D0) to 12% in May (D30) post albendazole administration (p.a.a). A statistical significant difference (p ≤ 0.05) was observed between the two groups (treated-E and untreated-T) on days 30 and 60 (Figure 3).

IJVB2018-104-LendzeCameroon_F3

Figure 3. Effect of albendazole on Haemonchus sp. (E, treated group and T, non-treated group)

The mean infection prevalence of Cooperia was 12.1% in the treated group and 13.4% in the untreated counterpart. This frequency in the treated group significantly decreased (p ≤ 0.05) at D30 as compared to the untreated group (Figure 4). The occurrence peak of Cooperia sp. in the treated group was observed on D30, > one month after that of the untreated group (Figure 4).

IJVB2018-104-LendzeCameroon_F4

Figure 4. Effect of albendazole on Cooperia sp. (E, treated group and T, non-treated group)

Oesophagostomum sp in the treated group decreased more than that of the untreated group from September (Figure 5). Its peak in the treated group was observed in May. In the untreated group, two L3 occurrence peaks were noticed, the first one in October and the second in January (Figure 5).

IJVB2018-104-LendzeCameroon_F5

Figure 5. Effect of albendazole on Oesophagostomum sp. (E, treated group and T, non-treated group)

Discussion

Prevalence of gastrointestinal nematodes

Of the 175 cattle sampled in three farms in Velambai, 113 (64.5%) shedded Strongyle eggs (mean: 170.65 ± 7.67). This low average EPG observed could be justified by the extreme weather conditions of the dry season which might have limited the survival of the infestive larvae and consequently the parasite load [17], although the effect of larval hypobiosis cannot be ruled-out [18]. This result is close to the  69.57% observed in calves in the Vina by Sakativa [8]. The prevalence of Strongyles was higher in the Velambai 1 farm (76%) than in the Velambai 2 and Velambai 3 farms (70% and 58.58% respectively) with a statistically significant difference between the three farms. These results are due to pasture management. Indeed, the animals of Velambai l and 2 were regularly dewormed which could have reduced the parasite load in these sites. This finding is similar to that of Sassa et al., [9] in small ruminant farms in Vina. Our results show that Toxocara sp. was frequent in the young animals (24.28%). Age and sex had statistically significant (p ≤ 0.05) effects on Toxocara sp occurence. The prevalence of Strongyloides was 12.3%. This prevalence is close to the 9% observed by Ntonifor et al., [4] in the Jakiri area, but far below the 75.5% obtained by Chollet et al., [3] in calves 0–12 months of age in the North and Far North of Cameroon. The low IR here could be due to the average age of the animals (three years six months). Indeed, with Strongyloides there was a strong immunity against this parasite in cattle from the age of 6–9 months [13].

Effect of albendazole on faecal shedding of Strongyles

After one month of treatment, there was a significant decrease (p ≤ 0.05) in the level of faecal egg shedding of Strongyles eggs in cattle receiving albendazole. This result corroborate with those observed in some studies on the resistance of gastro-intestinal Strongyles of ruminants to anthelmintics [19–9]. The percentage response to treated by this group was 68.7%, revealing a form of resistance to albendazole. In fact, in this study, 60% of the animals were adult cattle (more than two years old). These animals could have received several treatments with albendazole, resulting in Strongyles resistance to this molecule [13]. In the untreated group, OPG monthly averages were maintained at a moderate level (EPG < 400) throughout the year. This result confirmed the effect of the rainy season on the variation of Strongyles eggs. Chiejina and Behnke [20] showed that small rains at the end of the dry season resulted in the development of the infective larvae on the pasture. Acquired immunity might have maintained a moderate level of EPG since the group of cattle examined consisted of 60% of animals over two years old. This finding corroborates with that of Elele et al., [21] on cattle in Port Harcourt, Nigeria.

Variation of the larval population of Strongyles

This study revealed multiple infections in cattle in the Adamawa region of Cameroon and this parasitism was similar to that already reported in cattle in many countries in Africa including Burkina Faso [22], Senegal [18] and Cameroon in small ruminants [9]. Similar results with the predominance of Haemonchus and Trichostrongylus genera were also obtained in sheep in Brazil by Klauck et al., [23]. The antagonistic variation between Trichostrongylus sp and Haemonchus could be due to ecological niche competition as the two parasites share the same habitat (abomasum) [24]. On the other hand, this variation on the genera Cooperia (parasite of the small intestine) and Oesophagostomum (parasite of the large intestine) was rather due to an indirect mechanism occuring through the stimulation of the immune reaction of the host or non-specific inflammatory reactions [24]. The effect of deworming on Trichostrongylus sp was observed on the treated group on D90. But this difference was not statistically significant (p > 0, 05). Roeber et al., [25] and Demelash et al., [26] both observed this low sensitivity of Trichostrongylus sp to albendazole in sheep in Australia and cattle in Ethiopia respectively. The percentage of L3 of Trichostrongylus sp was lower at the end of the rainy season in both treated and untreated groups. Pfukenyi and Mukaratirwa [27] also observed low Trichostrongylus sp. L3 levels at the end of the rainy season, which according to these authors could be low due to the transition in climatic factors of the late seasons (rainy and dry). The percentage of L3 Haemonchus sp in the treated group dropped from 29% to 12%, one month (D30) p.a.a. Statistical significant differences (p ≤ 0.05) were observed between treated and untreated groups from D30 to D90. The susceptibility of Haemonchus sp to albendazole was also observed in cattle and equines in Morocco by Zoutien et al., [28] and sheep of Mbé in the Adamawa region of Cameroon [9]. The effect of albendazole on Haemonchus sp from D120 in the treated cattle group was reported to witness some sort of re-infection, especially with the presence of untreated animal faecal material reservoirs on the pasture land. The percentage of the L3 stage of Cooperia was average in both groups throughout the duration of the study (12.1% in the treated group and 13.4% in the untreated group). This may be due to its high resistance to extreme climatic conditions, despite its low fertility [3–29–27]. The effect of treatment with albendazole was significantly ((p ≤ 0.05) different from the untreated group only at day 30. The percentage of L3 of Oesophagostomum sp in the treated group decreased more than that in the untreated group from D90. This could be related to their sensitivity to albendazole that appears to be related to the location of adult worms in the digestive tract of cattle. Indeed, Oesophagostomum is a worm of the large intestine, since albendazole was administered as a 500 mg bolus, this would have required some time for the dissolution in the rumen and thus a late maximum concentration in the large intestine. Holsback et al., [30] also noted this form of resistance of Oesophagostomum in calves in Paraná.

Conclusion

The objective of self-sufficiency in meat products especially in the reduction of the scramble for beef that Cameroon aims at, a new policy on the development of the livestock sector must be established. Our study of gastrointestinal parasites in cattle in Vina demonstrated the validity of the initial hypothesis that gastrointestinal helminths of cattle are predominant in Vina and that the deworming effect of albendazole has an impact on population variation. It showed two peaks in the infestation level during the rainy season with significant intensities, unlike other studies in the area and showed that animals from one to two years were mostly infected. We were able to show the presence of four genera of gastrointestinal Strongyles among which the genera Trichostrongylus and Haemonchus (parasites of the abomasum) were with frequent. Also, it should be noted that deworming at the beginning of the rainy season will keep the animals at a low infection level until the beginning of the dry season. In addition, this study showed that albendazole has a much greater effect on the population of Haemonchus sp and that this effect is late when referring to the population of Oesophagostomum. Treatments could be administered in mid-May (one month after the actual start of the rains) and in late July (second half of the rainy season). Deworming in mid-May will greatly target the genus Trichostrongylus, while doing so at the end of July will greatly target the genus Haemonchus. Finally, this study also revealed high levels of trematode infection that should also be included in control measures. Any proposal for a deworming schedule should be a subject to economic evaluation and should consider the risk of development of resistance to anthelmintics.

Acknowledgements: This work was supported by the vaccine project. We thank the Department of Parasitology and Parasitological Diseases for the material support. We thank IRAD Wakwa for technical and material assistance.

Conflict of interest: Authors declare no conflict of interest

References

  1. Chartier C, Itard J, Morel P, Troncy P (2000) Précis de Parasitologie Vétérinaire Tropicale. Paris.
  2. Zinsstag J (2000) Nématodes gastro-intestinaux du bétail bovin N’Dama en Gambie: effets sur la productivité et options pour la lutte. Thèse PhD N° 11, Institut de Médecine Tropicale Prince Leopold, Antwerpen, Belgique.
  3. Chollet JY, Martrenchar A, Bouchel D, Njoya A (1994) Épidémiologie des parasitoses digestives des jeunes bovins dans le Nord-Cameroun. Revue d’Élevage et Médecine. Vétérinaire des Pays tropicaux. 47: 365–374
  4. Ntonifor HN, Shei S J, Ndaleh NW, Mbunkur G N (2013) Epidemiological studies of gastrointestinal parasitic infections in ruminants in Jakiri, Bui Division, North West Region of Cameroon. J Vet Med Anim Hlth 5: 344–352.
  5. Radostits OM, Gay CC, Hinchcliff KW, Constable PD (2006) Veterinary medecine: A textbook of the diseases of cattle, horses, sheep, pigs and goats. Tenth Edition, New York, USA, 2162p.
  6. Tanguy I (2011) Évaluation de la résistance des strongles digestifs aux anthelminthiques dans les élevages ovins en Bretagne ? 73p. Thèse de Doctorat Vétérinaire, École Nationale Vétérinaire d’Alfort.
  7. Wymann MN (2005) Calf mortality and parasitism in periurban livestock production in Mali, these PhD, Université de Basel, 227p.
  8. Sakativa D (2014) Effet de la vermifugation chez les jeunes bovins de l’Adamaoua pendant la saison sèche. Mémoire de Diplôme de Docteur Vétérinaire. Université de Ngaoundéré. 76p.
  9. Sassa MA, Agnem EC, Gambo H, Njan Nloga A (2014). Résistance des strongles gastro-intestinaux aux anthelminthiques chez les moutons à Mbé au Cameroun. Revue Africaine de Santé et de Productions Animales 12 : 21–26
  10. Letouzey (1968) Situation des resources genetiques forestieres du Nord-Cameroun, Archives de document de la FAO. Departement des forets 3: 12–14
  11. Mbahe RE (1998) Résultats de recherche agricole pour le développement en zone agro-écologique des hautes savanes guinéennes (Adamaoua). In : Comité régional des programmes, 27–28 oct. 1998. Ngaoundéré, Cameroun, Irad, 17 p.
  12. Hansen J, Perry B (1995). Épidémiologie, Diagnostic et Prophylaxie des Helminthiases des Ruminants Domestiques (7nd edn). FAO : Rome, Italie.
  13. Troncy PM, Chartier C (2000). Helminthoses et coccidioses du bétail et des oiseaux de la basse-cour en Afrique tropicale. In : Chartier C., Itard J., Morel P.C., Troncy P.M., éds, Précis de parasitologie vétérinaire tropicale. Paris, France, Tec & Doc, 773 p.
  14. Thienpont D, Rochette F, Vanparys OFJ (1979) Diagnostic de verminose par examen coprologique. Janssen Research Fondation, Beerse, Belgium, 187 p.
  15. Thienpont D, Rochette F, Vanparijs O (1995). Diagnostic de verminose par examen coprologique. Janssen Research Foundation: Beerse 187p.
  16. Presidente PJA (1985) Methods for the detection of resistance to anthelmintics. In: Resistance in Nematodes to Anthelmintic Drugs (Anderson, N., Waller, and P.J. Eds.). Division of Animal Health, CSIRO, Australia. 13–27.
  17. Ndamukong KJ1, Ngone MM (1996) Development and survival of Haemonchus contortus and Trichostrongylus sp. on pasture in Cameroon. Trop Anim Health Prod 28: 193–198. (crossref)
  18. Ndao M1, Pandey VS, Zinsstag J, Pfister K (1995) Effect of a single dry season anthelmintic treatment of N’Dama cattle on communal pastures in The Gambia. Vet Res Commun 19: 205–213. (crossref)
  19. Gasbarre L, Larry C, Smith L, Patricia E, Pilitt A (2009) Further characterization of a cattle nematode population with demonstrated resistance to current anthelmintics Vet Parasitol 166: 275–280.
  20. Chiejina SN, Behnke JM (2011). The unique resistance and resilience of the Nigerian West African Dwarf goat to gastrointestinal nematode infections. Parasites & Vectors 4: 12
  21. Elele KO, Owhoeli, Gboeloh LB (2013) Prevalence of species of helminths parasites in cattle slaughtered in selected abattoirs in Port Harcourt, south-south, Nigeria International Res Med Sci 1: 10–17.
  22. Ouedraogo A, Ouattara L, Kaufmann J, Pfister K (1992) Epidémiologie des nématodes gastro-intestinaux des ruminants au Burkina Faso: Spectre, fréquences et variations saisonnières. In: 7ème Conf. AIMVT, Yamoussoukro, Côte-d’Ivoire. 749–750.
  23. Klauck V, Pazinato R, Lopes L S, Cucco D C, De Lima H L, et al. (2014). Trichostrongylus and Haemonchus anthelmintic resistance in naturally infected sheep from southern Brazil. Annals of the Brazilian Academy of Sciences 86: 777–784
  24. Dorchies PH, Lacroux C, Levasseur G, Alzieu JP (2002) La paramphistomose bovine. Bulletin des GTV, 13: 87–90.
  25. Roeber F, Jex AR, Campbell AJD, Nielsen R, Anderson GA, et al. (2012). Establishment of a robotic, high-throughput platform for the specific diagnosis of gastrointestinal nematode infections in sheep. Int J Parasitol 42: 1151–1158.
  26. Demelash K, Alemu F, Niguse A, Feyera T (2014). Prevalence of gastrointestinal parasites and efficacy of anthelmintics against Nematodes in camels in Yabello District, Southern Ethiopia. Acta Parasitologica Globalis 5: 223–231.
  27. Pfukenyi DM, Mukaratirwa S (2013). A review of the epidemiology and control of gastrointestinal nematode infections in cattle in Zimbabwe. J Vet Res 80 : 12.
  28. Zouiten H (2006) Résistance aux anthelminthiques des nématodes parasites du tube digestif chez les ovins et les équidés au Maroc. Université MOHAMMED V-AGDAL (Maroc): 141p.
  29. Achi YL1, Zinsstag J, Yao K, Yeo N, Dorchies P, et al. (2003) Host specificity of Haemonchus spp. for domestic ruminants in the savanna in northern Ivory Coast. Vet Parasitol 116: 151–158. (crossref)
  30. Holsback L, Da Silva MA, Patelli T H C, Paula De Jesus A, et al. (2014). Resistance of Haemonchus, Cooperia, Trichostrongylus, and Oesophagostomum to ivermectin in dairy cattle in Paraná. Ciências Agrárias, Londrina. 36: 2031–2036.

Current and Emerging Treatments for Painful Diabetic Neuropathy

DOI: 10.31038/JCRM.2018111

Introduction

Diabetes affects more than 30 million people in the United States with type 2 diabetes accounting for 90–95% of cases (www.diabetes.org). Annual medical expense and disease-related societal burden from diabetes cost more than $245 billion. Most of the diabetic -related disabilities are from chronic diabetic complications in the cardiovascular, renal, retinal, and nervous systems. Among these, diabetic polyneuropathy occurs in approximately 60% of all diabetic patients [1, 2]. Diabetic polyneuropathy causes significant public health burden, serving as the leading cause of diabetes-related hospital admissions and non-traumatic amputations [1, 3, 4].

Patients with diabetic polyneuropathy frequently suffer from painful symptoms, termed as painful diabetic neuropathy (PDN) [2]. Clinically, PDN typically presents with length-dependent spontaneous pain with a combination of burning, tingling, electric-like, or achy sensations. It begins in the feet and extends proximally over time with bilateral and symmetric stocking distribution. Similar distal to proximal pattern of painful symptoms could develop at a later stage in the upper extremities. Patients with PDN also experience induced-pain, such as allodynia and hyperalgesia. Allodynia occurs when regularly innoxious stimuli, such as light touch, become painful, whereas hyperalgesia is increased nocuous sensitivity to painful stimuli, like pin prick. Despite the high morbidity of PDN [5, 6], the underlying molecular mechanisms of PDN are poorly understood [7]. Without targeting the key pathology that leads to the development of PDN, currently accepted medical approaches are only partially successful and are often ineffective [5, 8]. Inadequate control of PDN has significantly reduced quality of life for patients with diabetes [5, 6, 8]. In addition to suffering from painful symptoms, patients with PDN frequently develop insomnia, depression and anxiety, decreased mobility, psychomotor impairment and loss of work [5, 6, 8]. Clearly, more mechanism-specific therapies are urgently needed to effectively manage this common and important health problem.

Current treatment guidelines

Over the last three decades, basic science and clinical studies have generated significant amount of evidenced-based data to establish treatment guidelines for PDN. The 2006 and 2010 guidelines from the European Federation of Neurological Societies task Force (EFNS) [9, 10] and the 2011 guidelines from the American Academy of Neurology (AAN), the American Association of Neuromuscular and Electrodiagnostic Medicine, and American Academy of Physical Medicine and Rehabilitation [11] are the most thorough and up-to-date guidelines on this topic. Several class drugs including α2δ calcium channel antagonists (gabapentin, and pregabalin), anti-convulsants, tricyclic anti-depressants (TCAs), serotonin-norepinephrine reuptake inhibitors (SNRIs), opioids, and various other treatment modalities are discussed and recommended according to the quality of their supporting data. Each published clinical trial is classified according to its level of evidence, following guidelines such as the “AAN classification of recommendations” (www.AAN.com). Although there could be variations among these guidelines, trials deemed as class I are considered to have the highest quality of evidence with lowest risk of bias to support the application of the study drugs. The quality of evidence is decreased in high leveled classes; with class IV evidence has the highest bias potential and lowest supporting evidence for clinical use.

Level A treatments are strongly recommended with class I evidence or consistent findings from multiple studies of class II, III, or IV. They are recommended in clinical practice unless a clear and compelling rationale for an alternative approach is present. Level B treatments are with levels II, III, or IV evidence and findings are generally consistent. Generally, clinicians should follow this recommendation but should remain alert to new information and sensitive to patient preferences [12]. Level C, D, and U treatments do not have sufficient evidence to support their clinical practice.

The use of gabapentin, pregabalin, TCAs (such as amitriptyline), SNRIs (venlafaxine and duloxetine) are supported by EFNS with level A recommendation. In addition, controlled-release oxycodone is recommended by EFNS as effective with level A recommendation based on two class I studies. Tramadol alone or with acetaminophen were listed by the EFNS as level A effective treatments based on two class I studies. Level B recommendations from EFNS include Dextromethorphan (an agonist of N-methyl-D-aspartate receptor, 400 mg/d), Topical capsaicin 0.075% ointment that activates the transient receptor potential cation channel subfamily V member (TRPV) 1, isosorbide dinitrate spray (a vasodilator), type A botulinum toxin (BTX-A, blocks acetylcholine release) and levodopa (a dopamine precursor) [9, 10].

The guideline from AAN supports the use of pregabalin with level A recommendation. Gabapentin, sodium valproate (an anti-convulsant), venlafaxine, duloxetine, amitriptyline, dextromethorphan, morphine sulfate, tramadol, oxycodone, capsaicin 0.075% ointment, isosorbide dinitrate spray, electric stimulation and percutaneous nerve stimulation are presented as level B recommendations. Other anti-convulsants such as oxcarbazepine and lamotrigine; clonidine (an a2 adrenergic  agonist), pentoxifylline (a xanthine derivative), magnetic field treatment, low-intensity laser therapy, and Reiki therapy are not recommended [11].

Emerging treatments

One of the most promising new gene therapies for PDN is a DNA-based therapy using a plasmid DNA that contains the human hepatocyte growth factor (HGF) gene (VM202). VM202 enhances local expression of HGF to promote microvasculature growth and regenerate peripheral nerves to improve symptoms of PDN. A phase 3 study showed that PDN patients receiving 8 mg of VM202 injection per leg improved in all efficacy measures with 48.4 % of the patients experienced at least a 50% reduction in mean pain score in the treated group compared with 17.6 % in the placebo group after 3 months [13]. However, this analgesic effect was not statistically significant at 6 and 9 months. The study also demonstrated significant improvement in the brief pain inventory and the questionnaire portion of the Michigan Neuropathy Screening Instrument. Interestingly, the researchers noted that the largest reductions in pain were found among patients not on pregabalin or gabapentin. In addition, there were no significant adverse events attributable to VM202 and this treatment was deemed safe and well tolerated [13].

A network meta-analysis accumulated 25 randomized controlled trials for studying the effects of capsaicin 179 mg cutaneous patch (capsaicin 8% patch) on PDN. It was concluded that capsaicin 8% patch was significantly more effective than placebo with ≥30% pain reduction in PDN patients. In addition, capsaicin patch was statistically more efficacious when compared with pregabalin and gabapentin. It had similar efficacy while being compared with duloxetine [14].

Nerve growth factor (NGF) has been established as an essential factor for the development of nociceptive nerves. It also mediates the development of mechanical allodynia in animal model of type 2 diabetes [15]. Clinical trials using NGF neutralizing antibodies, including tanezumab and fulnatumab, have been reported with positive results for treating PDN. In the study that examined the effects of tanezumab in PDN, test subjects received subcutaneous tanezumab 20 mg or placebo on Day 1 and Week 8. Mean PDN pain reduction from baseline to Week 8 was greater with tanezumab vs placebo. However, differences in Patient’s Global Assessment of DPN were not significant [16].

Fulranumab, a fully human monoclonal anti-NGF antibody was also tested for PDN. In a phase II, double-blind, placebo-controlled trial, patients with moderate to severe PDN were randomized to treatments with fulranumab (1, 3, or 10 mg) or placebo administered subcutaneously every 4 weeks. Because of early study termination (clinical hold by the US Food and Drug Administration), only 77 of the planned 200 patients were enrolled. The primary endpoint, the mean reduction of average daily pain at week 12 compared with baseline, showed a positive dose-response relationship. The pair-wise comparison between the 10-mg group and placebo was significant. An exploratory responder analysis revealed that a greater proportion of patients in the 10-mg group reported ≥30% reduction in the average pain intensity compared with placebo at week 12. During the combined efficacy and safety extension phases, the top 3 treatment-emergent adverse events in the combined fulranumab group were arthralgia (11%), peripheral edema (11%), and diarrhea (9%). No cases of joint replacement or death were reported [17]. Despite early study termination, fulranumab treatment resulted in dose-dependent efficacy and was generally well tolerated.

ARA 290 is a nonhematopoietic peptide designed from the structure of erythropoietin. In this trial, ARA 290 (4 mg) or placebo were self-administered subcutaneously daily for 28 days and the subjects followed for an additional months without further treatment. During the 56-day observation period, subjects with ARA 290 treatments had improvement in hemoglobin A1c (Hb A1c) and lipid profiles. Neuropathic pain from PDN improved significantly in the ARA 290 group. In addition, subjects with >1 standard deviation reduction in mean corneal nerve fiber density (CNFD) showed a significant improvement in CNFD compared with no change in the placebo group [18].

Botulinum toxins (BoNTs) are used for treating multiple painful conditions. However, BoNTs are not yet approved for treating PDN in the United States. Multiple small-scaled clinical trials have provided evidence to support the use of type A BoNT (BTX-A) injections for PDN. A meta-analysis selected and analyzed the data from a class I [19] and class II [20] studies to examine the efficacy of BTX-A on PDN [21]. Combining the two qualifying studies, there were a total of 58 patients receiving a sum of 76 treatments for PDN randomly allocated to placebo or BTX-A treatments. The injected areas were identical in each trial with a fixed protocol using a 3 × 4 grid that was equally spaced to demarcate the injection sites on the dorsum of each foot. The class 2 study used OnabotulinumA while the class 1 study used AbobotulinumtoxinA. It was concluded that there was an improvement of 1.96 visual analogue scale points following treatment with BTX-A [21]. The results were concluded as clinically significant improvement of “minimum change in pain.” No serious adverse effects were reported in both trials. The meta-analysis evaluated the significance, low overall risk of bias, and almost no statistical heterogeneity support a correlation between Botox and improvement of pain scores for treating PDN [21]. However, further large scale controlled trials are needed to further establish the clinical efficacy and safety for this potential new indication for BTX-A.

Future study strategies

As reviewed in the current article, promising evidence support that several emerging treatments could be available for treating PDN in the near future. Other novel strategies are also under extensive study for developing new PDN treatments.

Animal studies have provided evidence that neurogenic inflammation in skin could be an important pathomechanisms for the development of PDN [22]. In a mouse model of type 2 diabetes, skin inflammatory cells (such as macrophages and Langerhans cells) could be activated by NGF signaling to target intraepidermal nerve fibers and be responsible for the development of pain behaviors. New evidence suggests that cytokine dysregulation could contribute to these skin inflammatory phenomena and suggest using immuno-modulatory therapies could be a novel treatment strategy for PDN [23].

Sodium channel NaV 1.7, NaV 1.8, and NaV 1.9 (encoded by SCN9A, SCN10A, and SCN11A respectively) are preferentially expressed in peripheral sensory neurons for nociception. Sodium channel Nav1.7 antagonists, including Xenon 402, CNV1014802, and PF-05089771, are being tested as new therapies for PDN [24]. Taken together, accumulating data from evidence-based studies shine light to the promising future of PDN management.

References

  1. Feldman EL (2001) Diabetic neuropathy, in Principles and Practice of Endocrinology and Metabolism. Philadelphia, Lippincott Williams & Wilkins, USA, pp. 1391–139.
  2. Feldman EL (2003) Somatosensory neuropathy, in Ellenberg and Rifkin’s Diabetes Mellitus. Pennsylvania, McGraw Hill, USA, pp: 771–788.
  3. Feldman EL (1999) Diabetic neuropathy, in Current Review of Diabetes. Current Medicine 71–83.
  4. Feldman EL (1999) Diabetic neuropathy, in Diabetes in the New Millennium. The Endocrinology and Diabetes Research Foundation of the University of Sydney: Sydney. pp: 387–402.
  5. Dworkin RH,  Turk DC,  Farrar JT,  Haythornthwaite JA,  Jensen MP, et al. (2005) Core outcome measures for chronic pain clinical trials: IMMPACT recommendations. Pain 113: 9–19. [Crossref]
  6. Jensen MP, Dworkin RH, Gammaitoni AR, Olaleye DO, Oleka N, et al. (2006) Do pain qualities and spatial characteristics make independent contributions to interference with physical and emotional functioning? J Pain 7: 644–653. [Crossref]
  7. Galer BS, Gianas A, Jensen MP (2000) Painful diabetic polyneuropathy: epidemiology, pain description, and quality of life. Diabetes Res Clin Pract 47: 123–128. [Crossref]
  8. Dworkin RH, Jensen MP, Gammaitoni AR, Olaleye DO, Galer BS. (2007) Symptom profiles differ in patients with neuropathic versus non-neuropathic pain. J Pain 8: 118–126. [Crossref]
  9. Attal N (2006) EFNS guidelines on pharmacological treatment of neuropathic pain. Eur J Neurol 13: 1153–1169. [Crossref]
  10. Attal N, Cruccu G, Baron R, Haanpää M, Hansson P, et al. (2010) EFNS guidelines on the pharmacological treatment of neuropathic pain: 2010 revision. Eur J Neurol 17: 1113. [Crossref]
  11. Bril V, England J, Franklin GM, Backonja M, Cohen J, et al. (2011) Evidence-based guideline: Treatment of painful diabetic neuropathy: report of the American Academy of Neurology, the American Association of Neuromuscular and Electrodiagnostic Medicine, and the American Academy of Physical Medicine and Rehabilitation. Neurology 76: 1758–1765. [Crossref]
  12. Burns PB, Rohrich RJ, Chung KC (2011) The levels of evidence and their role in evidence-based medicine. Plast Reconstr Surg 128: 305–310. [Crossref]
  13. Kessler JA, Smith AG, Cha BS, Choi SH, Wymer J, et al. (2015) Double-blind, placebo-controlled study of HGF gene therapy in diabetic neuropathy. Ann Clin Transl Neurol 2: 465–478. [Crossref]
  14. van Nooten F, Treur M, Pantiri K, Stoker M, Charokopou M (2017) Capsaicin 8% Patch Versus Oral Neuropathic Pain Medications for the Treatment of Painful Diabetic Peripheral Neuropathy: A Systematic Literature Review and Network Meta-analysis. Clin Ther 39: 787–803 e18. [Crossref]
  15. Cheng HT, Dauch JR, Hayes JM, Hong Y, Feldman EL (2009) Nerve growth factor mediates mechanical allodynia in a mouse model of type 2 diabetes. J Neuropathol Exp Neurol 68: 1229–1243. [Crossref]
  16. Bramson C, Herrmann DN, Carey W, Keller D, Brown MT et al. (2015) Exploring the role of tanezumab as a novel treatment for the relief of neuropathic pain. Pain Med 16: 1163–1176. [Crossref]
  17. Wang H, Romano G, Frustaci ME, Bohidar N, Ma H, et al. (2014) Fulranumab for treatment of diabetic peripheral neuropathic pain: A randomized controlled trial. Neurology 83: 628–637. [Crossref]
  18. Brines M, Dunne AN, van Velzen M, Proto PL, Ostenson CG et al. (2015) ARA 290, a nonerythropoietic peptide engineered from erythropoietin, improves metabolic control and neuropathic symptoms in patients with type 2 diabetes. Mol Med 20: 658–666. [Crossref]
  19. Ghasemi M, Ansari M, Basiri K, Shaigannejad V (2014) The effects of intradermal botulinum toxin type a injections on pain symptoms of patients with diabetic neuropathy. J Res Med Sci 19: 106–111. [Crossref]
  20. Yuan RY, Sheu JJ, Yu JM, Chen WT, Tseng IJ, et al. (2009) Botulinum toxin for diabetic neuropathic pain: a randomized double-blind crossover trial. Neurology 72: 1473–1478. [Crossref]
  21. Lakhan SE, Velasco DN, Tepper D (2015) Botulinum Toxin-A for Painful Diabetic Neuropathy: A Meta-Analysis. Pain Med 16: 1773–1780. [Crossref]
  22. Dauch JR, Bender DE, Luna-Wong LA, Hsieh W, Yanik BM, et al. (2013) Neurogenic factor-induced Langerhans cell activation in diabetic mice with mechanical allodynia. J Neuroinflammation 10: 64. [Crossref]
  23. Zhang C, Ward J, Dauch JR, Tanzi RE, Cheng HT (2018) Cytokine-mediated inflammation mediates painful neuropathy from metabolic syndrome. PLoS One 13. [Crossref]
  24. Bagal SK, Marron BE, Owen RM, Storer RI, Swain NA (2015) Voltage gated sodium channels as drug discovery targets. Channels (Austin) 9: 360–366. [Crossref]