Author Archives: author

A Comment on Nuclear Safety and Radiation Protection from a Historian of Science

DOI: 10.31038/CST.2021614


In 1985 Hans Blix, the then IAEA Director General, called for the creation of an advisory committee in the area of nuclear safety. As a result, IAEA’s International Nuclear Safety Advisory Group (INSAG) was formed with the main objective to offer advice on matters of nuclear safety, produce safety standards, and identify nuclear safety issues of international significance [1]. Only a year later the newly created Advisory Group was faced with one of the most terrifying nuclear accidents in history: Chernobyl. The concept of ‘safety culture’ was first introduced in the report that the Advisory Group issued a few months after the accident. Product of a crisis in the nuclear industry, the concept of safety culture was defined and analyzed as “assembly of characteristics and attitudes in organizations and individuals, which establishes that, as an overriding priority, nuclear plant safety issues receive the attention warranted by their significance.” Obviously, the emphasis was on organizational policies and managerial actions while individuals were seen as having “personal attitudes and habits of thought” linked to safety [2]. The aim was to strengthen the safety of nuclear power plants and avoid Chernobyl-type accidents in the future. Nevertheless, in a IAEA 2007 updated definition of culture, “nuclear power plant safety issues” (1986 definition) has been simply replaced by “protection and safety issues” [3] to mark a wider concern about safety culture in other “safety conscious industries” [4]. Evidently, since 1986 nuclear safety culture has been closely and primarily connected to organizational and technical issues within nuclear industrial settings leaving the medical sector largely unaffected. In this sense, culture is identified with learned behavior, a whole body of attitudes, habits, and practices passed on from one generation of nuclear operators to the next and related to the style of organizations and their culture. This understanding of safety culture is linked to earlier conceptualizations of culture—as static, shared, and uniform—that have prevailed in anthropology in the early part of the 20th century. The culture concept in use comes actually to mean the cultivation of people—in this case nuclear operators—through special technical education. Based on this perspective, individuals have been seen as complacent or in a position that is opposed to and thus outside culture [5-7].

Given the significant disengagement that exists between humanities and nuclear sciences and engineering, regulatory agencies’ recent attempts to reconceptualize safety culture have not been adequately informed by disciplinary developments in the humanities and social sciences. In contemporary anthropology and social history, culture is not considered any more as a package of knowledge shared by bounded individuals. A number of scholars have argued that anthropological and sociological analyses would be more productive if culture were to be broken into elements understood on their own terms rather than as unified corpus [5,7,8]. In addition, given that culture is closely intertwined with power, scholars of safety science in general, have only recently touched on issues of power and conflict in order to give an account of the dynamics of organizational life [9]. The time is ripe to rework the concept of nuclear safety culture based on insights from the social sciences and humanities while the world is becoming increasingly aware that human activities ranging from nuclear power production to the use of radiation in medicine could be very harmful and that protective actions should be taken.

Usually, the overall perception is that if workers are trained, operators are certified, and programs accredited then safety will ensue. But despite all this, incidents in both nuclear industrial and medical sectors continue to arise. Cited causes emphasize failures in techno-scientific issues, insufficient training, poor organizational and managerial structures, and inadequate safety culture. They neglect, however, to focus on the human and social aspects of the stakeholders involved, especially when dealing with liabilities that could spread beyond the originally conceived, or in accounting for human responsiveness and responses to safeguards and post-disaster mitigation [10]. In addition, although there is an international consensus on what safety culture means and consists of—a term widely used by regulators and corporate professionals in nuclear industry—its social dimensions are inadequately understood. Moreover, communities at the receiving end of nuclear are concerned with technological lockout, the fact that nuclear technology recipients are barred from accessing certain technologies due to lack of established frameworks within their societies for dealing with the safety hazards of such technologies. As recent as February 2016 the IAEA organized an international conference on the “Human and Organizational Aspects of Assuring Nuclear Safety” targeting mainly the nuclear power plants (NPPs). It was the first time that the Agency placed such an emphasis on the human and organizational factors affecting the safety culture of the nuclear industry and called for a reconceptualization of the term. In his introductory remarks, the then Director General (DG) Yukiya Amano, urged participants to reflect upon the lessons we learnt over the last 30 years since the Chernobyl disaster. The 2015 IAEA DG’s Report on the Fukushima Accident left no doubts that human and organizational factors played a big role in the management of the nuclear disaster following the earthquake and the subsequent tsunami in Japan [11].

Besides the IAEA, other regulatory agencies and stakeholders have noticed that safety is not an issue that should be left to nuclear scientists and engineers alone. In 2012 the International Radiation Protection Association (IRPA) organized its annual meeting in Glasgow under the overarching theme “Living with Radiation-Engaging with Society” http://www.irpa.net/page.asp?id=54516 In his report on the Fukushima accident, William Magwood, Director General of the Nuclear Energy Agency, a specialized agency within the Organization for Economic Co-operation and Development (OECD), argued that “we must address the human aspects of safety, such as ensuring effective safety cultures for both operators and regulators and continuing to learn from safety research, including through the NEA’s international joint research projects.” http://www.oecdnea.org/news/2016/2016-01.html

In the sector of nuclear medicine the “Bonn Call for Action,” a joint position statement published by the IAEA and the World Health Organization in 2012, argued for a holistic approach to the problem of radiation protection including among others the civil society as well. One of the major proposed actions is to improve radiation safety culture in health care.
https://rpop.iaea.org/RPOP/RPoP/Content/AdditionalResources/Bonn_Call_for_Action_Platform/index.htm

Nuclear safety and radiation protection continue to be major challenges and the next frontier in nuclear science and technology. The two terms are closely intertwined. Since safety is primarily concerned with control over radioactive sources it contributes towards protection. But how could the humanities and social sciences contribute to the effort of a) managing the risk for patients to be overexposed to radiation during radiotherapy or intervention and of b) improving nuclear safety and radiation protection in industrial settings? The suggested way is to generate a cross-disciplinary, trans-geographical, and trans-national network involving scholars from social sciences, the humanities, the nuclear sciences and engineering, medical physics and practitioners in both the nuclear industry and medical sector in order to establish a common knowledge base on how to deal with safety and risk in use of radiation a) in medicine and b) in nuclear industrial installations. Also achieving analytical clarity of the key notions of radiation risk and safety culture based on the historical, socio-political, economic, and cross-national context in which these concepts have been embedded is key in this effort. The overall aim is to educate a new generation of what I call “nuclear safety mediators,” that is all those individuals who could act as intermediaries among different social groups—i.e. workers in nuclear industry, CIOs in nuclear industry, nuclear engineers, patients, medical practitioners, radiotherapists and the public, to mention just a few—with direct interests to maintain nuclear safety and enforce radiation protection. Safety mediators should be trained in a way that will allow them to integrate perspectives of social sciences in nuclear settings. To do so we need to develop major interdisciplinary resources such as a) a common data framework on the history of radiological and nuclear incidents making it readily available in the public domain, b) a research agenda to allow greater articulation to the relation between humans and the complex technological systems in both the industrial and the medical sectors, c) an understanding of the role that the standardization of human skills has historically played in the fields of radiation protection and nuclear safety and d) a framework of understanding the human and social aspects of safety culture in the workplace using as a methodological tool ethnographic studies in nuclear industrial and medical settings. No focused institutional study and no national group of researchers can capture the dispersal needs of radiation protection and nuclear safety. Given the diverse interests involved and the expertise that is required in order to bring a step change in achieving both radiation protection and nuclear safety, inter- and trans-disciplinary networking seems to be a viable solution.

Funding

This publication is part of the “Living with Radiation: The Role of the International Atomic Energy Agency in the History of Radiation Protection” (HRP-IAEA) project that has received funding from the European Research Council (ERC) under the European Union’s Horizon 2020 research and innovation programme (Grant agreement No770548), https://iaeahistory.weebly.com.

Reference

  1. Meserve, Richard and Brockman Kenneth (2004) Safety for All, the New INSAG. IAEA Bulletin 46: 51-52.
  2. IAEA Safety Series No.75-INSAG-4 (1991) Safety Culture: A Report by the International Nuclear safety Advisory Group, IAEA, Vienna.
  3. IAEA Safety Glossary (2007) Terminology Used in Nuclear Safety and Radiation Protection, IAEA, Vienna
  4. IAEA Safety Report Series, no. 74 (2012) Safety Culture in Pre-Operational Phases of Nuclear Power Plant Projects. IAEA, Vienna.
  5. Beldo Les (2010) Concept of Culture. In: James Birx (ed) 21st Century Anthropology 1: 144-152. Thousand Oaks, CA: Sage.
  6. Sewell, William (1999) The Concept(s) of Culture, in Victoria Bonnell and Lynn Hunt, (eds.). Beyond the Cultural Turn pg: 35-61, California: University of California Press.
  7. Moore, Jerry D (2012) Visions of Culture: An Introduction to Anthropological Theories and Theorists. 4th Ed. Lanham, MD: Alta Mira Press.
  8. Kuper, Adam (1999). Culture: The Anthropologists’ Account. Harvard University Press.
  9. Antonsen Stian, Kari Skarholt, Arne Jarl Ringstad (2012) “The Role of Standardization in Safety Management” Safety Science 50: 2001-2009.
  10. Kyrtsis, Alexandros and Rentetzi, Maria (2021) From Lobbyists to Backstage Diplomats: How Insurers in the Field of Third Party Liability Shaped Nuclear Diplomacy. History and Technology
  11. IAEA Report by the Director General to the Board of Governors (2015) The Fukushima Daiichi Accident. IAEA, Vienna.

The Impact of Culture and Beliefs in Cancer Care: Turkish Experience

DOI: 10.31038/IMROJ.2021616

Abstract

The perception and the coping mechanism of cancer is directly affected by the cultures, values and belief systems. Turkish culture in this regard is unique, bridging conservative Islamic beliefs with contemporary Western way of thinking. In this study, the changing attitudes towards cancer and the factors pertaining to it in this process has been discussed within the cultural, social and spiritual framework. There used to be a widespread sense of fatalism and silence surrounding cancer. With increasing modernization, migration to cities, educational levels and prosperity, and the growth of Westernization and participatory society, perceptions and responses changed. Cancer is now a disease that is openly discussed. The sense of fatalism is getting less prevalent. Medical and scientific attitudes play a great role in treatment. The family institution also has a clear supportive function. Family, as well as religious attitudes and beliefs, go a long way in preserving hope.

Length of life is perceived as more important than quality of life. In treating the disease, curing it comes before aesthetic concerns. The importance of science in the perception of disease has become more prevalent. Fatalistic or religious attitudes do not play much of a role in undermining treatment. Cancer has resulted in a view and understanding that resynthesizes belief, science and human values in Turkish culture.

Keywords

Attitudes, Beliefs, Culture, Faith, Psychooncology, Participatory society, Perception, Traditional, Modernity, Turkish culture

Cancer is a chronic, life-threatening disease that greatly impacts all spheres of life. Cancer patients develop various and differing emotional, mental, and behavioural reactions regarding their illness during diagnosis, treatment, and the palliative period [1]. The experience of cancer cannot be understood independent from the specific culture [2]. Beliefs and values of a society influence perceptions about the meaning of an illness, the types of treatment or remedies that are useful, and the likely outcome. Cross-cultural differences may lead to ethical dilemmas regarding communication, decision-making, treatment choices and end-of-life decisions.

What is Culture?

Culture is the sum total of the way of living; includes values, beliefs, standards, language, thinking patterns, behavioural norms, communications styles, etc….

Culture influences many different aspects of daily life – including perceptions, emotions, belief systems, and behaviours. It has an important influence on religion, family structure, gender relationships, and social organisation – as well as on diet, dress, body image and perceptions of illness and medical treatment.

The most important issues that dominate cultural variations in symptom presentation, health care seeking behaviour and illness perception are:

  • Variations in family systems and structures (e.g. patriarchal families)
  • Variations in age and gender role
  • Educational factors
  • Socio-economic factors
  • Environmental factors (rural or urban)
  • The meaning and perceived cause of illness [3].

A culture specific understanding and approach is necessary in delivering the optimum psychiatric and physical care [4].

Turkish Culture

The history of Turks goes back to 20,000 years prior to the advent of Islam. Turkish culture begins in pre-Islamic Central Asia. The Turks, beginning there, spread over an extensive geographical area, to the Caucasus, Anatolia, the Middle East, the Balkans and Central Europe, and established various states and empires. With their acceptance of Islam, a new age began. Modern Turkey is the focal point of this culture. The modernization and Westernization movement that began in the last 150 years of the Ottoman Empire and was institutionalized by Atatürk, the founder of the republic, formed the basis for a new synthesis and prospects for this culture.

Turkish culture is a synthesis having historical depth and geographic expanse. Perhaps, too, it is a new model for the Central Asian Turkic republics, the Caucasus and the Middle East, and some Balcanic countries which share a common culture and civilizational past with the Turks.

Atatürk said that the basis of the Turkish republic is culture.

“Turkish culture” should be understood to mean the interaction and synthesis of pre-Central Asian Turkish culture with Islam, and the cultures of Anatolia, the Balkans, the Middle East, and the Caucasus, into which they spread, as well as other areas that were part of the Seljuk and Ottoman Empires, and the modern reformism of Atatürk, the founder of modern Turkey. It is a synthesis of conservative, traditional and religious values with modern Western culture. The Sufi movement is a traditional medieval Turkish approach that teaches spirituality through near-mysticism, using song, dance to induce an altered state and closer connection to God. This new attitude towards the mind, freeing mental illness from implications of wrongdoing, paved the way for a more scientific examination of the causes and symptoms of mental illness.

Turkish cultural traditions had developed a humanistic orientation that is concerned with treating the “whole person”, thus emphasizing on the integrity of the individual –his mind and body-. Through the centuries, all the “Houses of Healing” established in Turkish world integrated mental and physical health (Gevher Nesibe built in 1200’s is the first hospital serving both physically and mentally ill patients [5].

Illness Perception: IPQ-R: Turkish Version

Turkish version of the illness perception Questionnaire – R was adapted by [6] and is a reliable and valid tool in using for research studies in cultural aspects of cancer patients.

After the translation and language consistency of the Turkish version, the scale was applied to 203 cancer patients at Istanbul University, Oncology Institute. The study revealed that patients who lack of knowledge and information regarding cancer resulted in fatalistic and passive causal. The IPQ cause scale showed cancer patients to endorse most strongly “stress” or “chance/bad luck” as causes for their Illness, with “accident – injury” being the least favoured attribution. Majority of the participants proposed that “destiny” is the cause of illness in the section of the questionnaire where the perceived cause, is asked. The less educated patients in Turkey attribute their illness more to faith [7].

Erbil et al (I996)’s findings suggest that psychosocial distress is expressed differently in Belgium and Turkey. Turkish patients express their anxiety more with somatic complaints [8]. According to the authors, illness perception, a culture-dependent factor, appears to influence psychological adjustment very differently, a correct perception of illness leading to more anxiety in the Belgian patients compared to the Turkish patients [8]. Similarly [9], analyzed the perceptions, causal attributions, and attitudes toward help of a group of 33 Jewish Israeli cancer patients and found two distinct response patterns-that of the ‘Western’ patients (science-oriented, active) and that of the ‘Oriental’ ones (fatalistic, passive).

Special Issues in Communication: Telling the Truth

Revealing the diagnosis to a patient with terminal cancer is not currently fully accepted in some countries without an Anglo-Saxon cultural background such as Turkey, where there is a family hierarchy and the family of the patient makes the decisions about treatment, physicians discuss the cancer diagnosis with the family before discussing it with the patient and commonly comply with the family members’ requests. Similar paternalistic approach is also relevant for Arab and Islamic cultures. There is a tendency to disclose the truth more often than in the past, but full openness is still not a common practice.

Different practices and regulations: due to the current disclosure regulations and patient rights to participate in decision making in Western countries. Western medicine is taught and practised using a model of full disclosure which is considered important for patients to be able to make decisions about their treatment d to be informed fully prior to giving consent to treatment. At the opposite end of the spectrum is the non-maleficence model, whereby the patient is not told of a poor prognosis in the belief that this will protect him or her against unnecessary physical and emotional harm. Some cultures view discussion of serious illness and death as impolite and provoking unnecessary anxiety, depression, and a sense of helplessness, thereby eliminating all hope.

Somewhere in the middle of the spectrum is the model of beneficence, where family members actively participate in the communication, share the burden of a poor prognosis with the patient, and encourage hope. This is the general attitude in Turkey. In the last two decades, changes in Turkish society has been rapid, complex, and irregular. These changes include growth in population, urbanization, education; which altogether brought a participatory model. The stigma regarding cancer is more prevalent in patients from rural areas and in those who lack necessary knowledge concerning their disease. Studies generally revealed that lack of knowledge and information regarding cancer resulted in fatalistic and passive causal attributions [4]. A study done by [10] revealed that the degree of information and knowledge about one’s illness is related with positive problem solving strategies. A silent attitude was the general norm in Turkey. These appear to charge in accordance with changes in the society and culture.

There exist a polar attitude concerning perceptions, causal attributions and attitudes toward cancer: Western style (Science oriented, participating) and eastern style (fatalistic, passive). Our clinical experience and research findings obtained through our liaison psychiatry practice carried out with the breast surgery unit show that in breast cancer patients who had undergone mastectomy, the main basis for distress was the cancer itself, esthetical concerns and effects of cancer to the quality of life was secondary [11,12]. Feeling under threat and fear of death and the associated anxiety is prominent, rather than loss reaction associated with breast [4]. Fertility and motherhood are still important for the status of women in rural and more traditional parts of the society. A study by Kulakaç implied that “mother” role of women was considered more basic than female role [13].

Most adult and elderly patients state that their main concern is not facing death but becoming a burden on the family and dying in unbearable pain. Adjustment to cancer is better in a family environment characterized by obsessiveness, open expression of feelings, and absence of family conflict. The most challenging and difficult management issues arise with the loss of child in the family.

Regarding the effect of cancer on the perception of life [14], reported optimistic findings. In the study, 80 % of the cases reported that cancer had a great impact on their lives, and 48 % evaluated the impact as a positive, life-enhancing experience. Patients reported that experiencing cancer has been a power forcing them to see their lives more positively, giving them a chance to restructure their lives and to change their perspective toward people and the world. The authors reviewed 24 studies on breast cancer published from 1990 to 2010 which revealed a relatively small percentage of women experienced posttraumatic stress disorder, whereas the majority reported posttraumatic growth. Age, education, economic status, subjective appraisal of the threat of the disease, treatment, support from significant others, and positive coping strategies were among the most frequently reported factors associated with these phenomena.

The thesis of [15] was conducted at our department and was titled “Post traumatic growth in cancer patients and related factors.” The results revealed a relationship between posttraumatic growth and confrontive coping, self-controlling, accepting responsibility, escape-avoidance, intentional problem solving, positive reappraisal, and seeking social support. The ways of coping and perceptions of illness were important variables affecting posttraumatic growth. Parry and Chesler stated that coping processes and creating meaning and spiritual-moral development are especially associated with long-term psychosocial well-being [16]. The way pain is perceived, manifested and treated by patients and families is another area affected by culture. Cancer patients who are confident in coping and controlling cancer define less pain. In our practice, we see an association between the severity of pain and depression [17-20].

Taking into consideration and integrating our experience at the Department of Psychooncology, Institute of Oncology, University of Istanbul (main pioneering department in the country), the results of nearly 50 master thesis conducted at our department, and the general psychooncology researchers and experiences shared in major scientific meetings in the country, I would like to summarize my thoughts based on the above as follows:

  • In the past 40-50 years, prosperity, democratization and participatory culture has expanded in Turkey.
  • Urban migration and westernization has contributed to social consciousness.
  • Up until the 1970s and 1980s, cancer was perceived as equivalent to death and was referred to as a “cruel illness” and silent attitude most prevalent.
  • Cancer has become less of a taboo subject in Turkish society; there has been increasing awareness regarding cancer in society.
  • The discussion of cancer in academia and the media has become increasingly multifaceted.
  • The perception of cancer as a catastrophe has declined in society. More emphasis is placed on the importance of psychological and social support.
  • Psychooncology practice helped decreasing the prejudice such as only insane people receive treatment from psychiatrists or psychologists. The necessity of psychological support to cancer patients has been readily accepted by the culture.
  • The fear of recurrence is still the most prevalent source of anxiety in cancer patients.
  • The old-fashioned way of thinking was strongly influenced by religion and arose from within a traditional, feudal social structure. The Westernization occurring and an increasingly institutionalized process of modernization, has given rise to a brand-new structure and way of thinking.
  • Religious or spiritual approaches towards illnesses and cancer, with respect to both cause and treatment, have gradually diminished.
  • However, the impact of religion on the reactions to cancer can still be seen. A fatalistic approach can be anxiety relieving for some. For others, it can impede treatment. Nevertheless, a fairly widespread and functional way of perceiving and style of coping is characterized by “first do what you can, then leave it to God.”
  • The approach “if it’s cancer, take the entire organ” is common.
  • Society and the family still prioritizes longevity over quality of life.
  • We see the widespread impact of belief systems pertaining to death and the acceptance of death issues basically.
  • In Turkey, when it comes to cancer, religion, strongly tied to a belief in Islam, is associated with a reduction in loss of hope, suicidal thinking and dying in the hospital.
  • We see that in the terminal phase, turning toward religion and resorting to prayer increases more.
  • Religious thought and rituals are prevalent in the processes of saying goodbye.
  • There are conflicting reports on the effects of religion on (better) health.
  • In Turkish patients with cancer, it is commonly observed that a diagnosis of cancer makes people more faithful; while they may not practice more.
  • There is an increase in perceptions of meaningfulness in life and hope. The perception of “There is always hope with God.”
  • The association between religion and spirituality and cancer has not been systematically studied in Turkey. We do not know the impact of religion and spirituality on the outcome of cancer.
  • With regard to grief, concerns about death and the afterlife, I see that patients and families turn more to religion for guidance, without sacrificing scientific treatments.
  • In Turkish culture, the cancer care is more family oriented than individualistic. In cases that are perceived as catastrophic such as earthquakes, cancer, all the family members get together and face this situation all together. This is generally supportive for the patient. Sometimes it may act as a protective factor.
  • In case of grief and bereavement, the experience is lived collectively and more religiously. The grief process is not lived through individualistically and silently as in some Western countries. Wailing and crying outs are more common.
  • Religious assessment of cancer patients is not routinely done in clinics in Turkey.
  • Religious concerns and needs of patients are not routinely addressed.
  • On the other hand, the practice of psychotherapy does not routinely integrate spirituality, unless actively requested by the patient. This area is mostly covered by families.

The integration of traditional values of Turkish culture and modern western values, the impact and continued functionality of the family, a sense of social solidarity, religious beliefs, and a humanistic understanding rooted in culture has given rise to a synthesis of two views: “health is more important than anything else” and “with God there is hope.” Our culture has a positive impact on treatment by seeing the patient and his cancer within the framework of a mind-body holism.

References

  1. Ozkan M (2016) Psychosocial Adaptation During and After Breast Cancer. In: A Aydıner, A İğci, A Soran (eds.), Breast Disease: Management and Therapies, Istanbul: Springer International Publishing Switzerland, pp: 821-852.
  2. Brown R, Bylund C, Kissane D (2010) Principles of Communication Skills Training in Cancer Care. In: WBJ Holland (eds.,), Psycho-Oncology, New York: Oxford University Press, pp: 597-604.
  3. Anuk D, Özkan M, Kizir A, Özkan S (2019) The Characteristics and Risk Factors for Common Psychiatric Disorders in Patients with Cancer Seeking Help for Mental Health. BMC Psychiatry pp: 1-11.
  4. Özkan S, Özkan M, Armay Z (2011) Cultural Meaning of Cancer Suffering. Pediatr Hematol Oncol pp: 102-104.
  5. Özkan S (2007) The Historical Development of Mental Health in Turkish Culture. Gevher Nesibe Hospital and Medical Academy pp: 77-83.
  6. Kocaman N, Özkan M, Armay Z, Özkan S (2007) The Reliability and the Validity Study of Turkish Adaptation of the Revised Illness Perception Questionnaire. Anadolu Psikiyatri Dergisi pp: 271-280.
  7. Armay Z, Özkan M, Kocaman N, Özkan S (2007) Hastalık Algısı Ölçeği’nin Kanser Hastalarında Türkçe Geçerlilik ve Güvenilirlik Çalışması. Klinik Psikiyatri pp: 192-200.
  8. Erbil P, Razavi D, Farvacques C (1996) Cancer patients psychological adjustment and perception of illness: Cultural differences between Belgium and Turkey. Support Care Cancer pp: 455-461.
  9. Baider L, Sarell M (1983) Perceptions and causal attributions of Israeli women with breast cancer concerning their illness: the effect of ethnicity and religiosity. Psychother Psychosom pp: 136-143.
  10. Şener Ş, Günel N, Akçalı Z (1999) Meme Kanserinin Ruhsal ve Sosyal Etkileri Üzerine Bir Çalışma. Klinik Psikiyatri Dergisi 2: 254-260.
  11. Özkan S, Turgay M (1992) Masektomi Olgularında Psikiyatrik Morbidite Psikososyal Uyum ve Kanser – Organ Kaybı – Psikopatoloji İlişkisi. Nöropsikiyatri Arşivi, pp: 207-215.
  12. Isıkhan V, Güner P, Kömürcü S (2001) The Relationship Between Disease Features and Quality of Life in Patients With Cancer. Cancer Nursing, pp: 490-495.
  13. Kulakaç O, Buldukoglu K, Yılmaz M (2006) An Analysis of the Motherhood Concept in Employed Women in South Turkey. Social Behavior Personality, pp: 837-852.
  14. Öner H, İmamoğlu O (1994) Meme kanseri olan Türk kadınlarının hastalıklarına ve uyumlarına ilişkin yargılar. Kriz Derg 2: 261-268.
  15. Bayraktar S (2008) Kanser hastalarinda travma sonrasi gelisim olgusunun ve etkileyen faktörlerin incelenmesi. İstanbul Üniversitesi Saglık Bilimleri Enstitüsü, Yüksek lisans tezi.
  16. Parry C, Chesler M (2005) Thematic Evidence of Psycho-social Thriving in Childhood Cancer Survivors. Qual Health Res, pp: 1055-1073.
  17. Özkan S (2010) Psychiatric Aspects of Pain in Cancer Patients. Asian Pacific Journal of Cancer Prevention, pp: 113-116.
  18. Fitchett G, Canada A (2010) The Role of Religion / Spirituality in Coping with Cancer: Evidence, Assessment, and Intervention. In: J Holland, W Breitbart, P Jacobsen, M Lederberg, M Loscalzo, R McCorkle (eds.,), Psycho-Oncology, New York: Oxford University Press, pp: 440-446.
  19. Lepore S (2001) A Social Cognitive Processing Model of Emotional Adjustment to Cancer. American Psychological Association, pp: 99-116.
  20. Uzun Ö, Aslan F, Selimen D (2004) Quality of Life in Women With Breast Cancer in Turkey. Nursing Scholarship, pp: 207-214.

Reaching the Roof of the World: Assessing the SRHR Beliefs of Communities Residing in the Highest Mountain Ranges in the World for Integration of Lifeskills Based Education in School Curricula

DOI: 10.31038/AWHC.2021424

Abstract

The Gilgit-Baltistan (GB) region of Pakistan is home to the highest mountains in the world, and the communities residing here are largely disconnected from development efforts dedicated to Sexual and Reproductive Health and Rights (SRHR) in Pakistan. In Gilgit-Baltistan, the unique topography and isolated nature of communities residing at high altitudes makes it challenging for SRHR programmers to firstly access these communities and, secondly, understand their prevalent beliefs and practices. Aahung is a Karachi-based NGO which is planning to pilot a curriculum for Life-Skills Based Education (LSBE) in schools in GB; however, with limited information available, we conducted formative research to inform curriculum design. The aim of this study is to understand the prevalent SRHR beliefs and practices with adolescence and gender as the crosscutting themes. 25 Focus Group Discussions (FGDs) were conducted with 148 total participants in different districts of GB to assess the SRHR-related needs of adolescents in the region. Approximately 34 teachers, 36 parents, and 78 students between grades 6-10 participated in the study. All FGDs were separated by gender and the students were further divided into 2 groups: Grades 6-8 and Grades 9-10. FGD guides and consent forms were developed in English and translated into Urdu. Data were transcribed and thematically analyzed by researchers to identify the SRHR and health-related needs of adolescents in the studied region. Apart from the general prevalence of poor SRHR information among young people, findings showed a significant gender difference in SRHR knowledge and practices. Boys stated several sources of SRHR information, madrasah being the key one, whereas, girls shared that although they could receive some guidance regarding puberty from madrasah, friends and female family members, even their mothers were reluctant in discussing SRHR with them in greater detail. Findings from the study will be used to inform the design of a Life-Skills Based Education (LSBE) curriculum which will be piloted with schools in GB.

Keywords

LSBE, SRHR, Education, Gilgit-Baltistan, Adolescent, Gender

Introduction

Adolescence is a complex phase for any individual; it is the time for crucial development and change [1]. Perceptions drawn and normative behaviours adopted during this phase need to be more informed than at any other stage of life. As puberty onsets, the beginning of new biological and psychological processes drives many vital changes during this transitional phase [2]. At this stage, occurrences such as menstruation in girls, nocturnal emission in boys, and emotional adjustments in both can create difficulty in their lives, resulting in feelings of confusion and isolation [3]. These changes combined with various other experiences around the time of adolescence can impact an individual’s susceptibility to mental health problems [4]. To be able to effectively deal with this transition, adolescents do not only require information and clarity regarding their bodily, emotional, and social changes, but also need to be protected from adverse experiences such as violence, lack of familial support, and enforcement of myths around adolescence [4]. Accurate information and promotion of their psychological well-being at this time can save them from physical discomfort, mental health issues, guilt, confusion, and ambiguity, because any such grief can ultimately affect their social roles [5].

In Pakistan, adolescents are generally poorly informed about their sexual and reproductive health and rights (SRHR) issues including puberty, gender, marriage, family planning, and sexual concerns and sexuality [6]. Especially in the rural areas, owing to the cultural rigidity as well as the sensitive nature of this topic, young people are kept deprived of information around SRHR- related issues from their elders, including their parents and teachers [7,8]. A study conducted with school-going children from the ages of 13 to 19 in Gilgit-Baltistan (GB), a largely rural region (rural population in GB=83%), found that only 62% of the young respondents had some knowledge of puberty, whereas 91% were in need of proper guidelines on the topic [8,9]. The same study showed that due to lack of education on the subject, almost all respondents (96%) expressed the desire to learn about reproductive health. The study placed immense blame on low literacy and lack of communication between the growing children and elders; it was found that 85% of adolescence exclusively discussed academics with parents and refrained from engaging in conversations around bodily changes and about other personal matters [8].

This lack of communication is compounded by the poor state of education, which can manifest as negative SRHR behaviours among adolescents [7,10]. In GB, only 35% children of secondary school-going age are attending secondary school [9]. Past researches have also shed light upon the gender-biased education system in GB, wherein, girls suffer more at the hands of illiteracy in comparison to boys [9,11,12]. According to the 2017 report of Pakistan Education Statistics, the Gross Enrolment Ratio (GER) in Pre-Primary Education in GB is 42% and it drops to 38% for Secondary Education [12]. Another UNICEF survey in 2017 found that the girls-to-boys ratio for Education Gender Parity Index (GPI) across various households, divisions, and districts of GB stands at 0.78 [9]. The out-of-school gender parity in GB speaks volumes about the prevalence of gender discrimination in GB: at primary level, more than half of the out-of-school is that of girls; and in case of secondary level the number rises to a distressing 77% [9]. The landscape of GB is characterized by harsh physical and mountainous environment where travelling and communication are generally difficult [11]. The situation, therefore, automatically becomes worse for girls, whose parents are less likely to allow them to continue their education in circumstances when security and safety is compromised or where there are transportation problems [13]. Girls’ autonomy is further restricted by religious sensitivities and traditions that contribute to their early marriages resulting in discontinuation of education [14]. Low knowledge around SRHR among youth and the obvious gender disparity in the region strongly advocates the need for Comprehensive Sexuality Education (CSE) in schools. Evidence indicates that when provided with CSE, adolescents are better able to tackle SRHR-related challenges in a healthier and more informed way, leading to a positive long-term impact on their lives [15].

This paper illustrates the prevalent perceptions, knowledge, and behaviours around adolescent SRHR in Gilgit-Baltistan along with the needs of young people regarding the same. The findings will be used to design a Life-Skills Based Education [LSBE] programme which will contain CSE modules as well.

Methods

This study used an exploratory qualitative design and collected data through Focus-Group Discussions (FGDs). Based on saturation of information and minimum representation from all geographical areas, 28 FGDs were conducted with 148 total participants in districts Skardu, Hunza, and Nagar of the Gilgit-Baltistan region. Aahung, a Karachi-based NGO, in partnership with a school network in Gilgit-Baltistan, will develop a module for LSBE and will pilot it in selected schools in the study districts. Participants for the FGDs were recruited through the partner school network’s management. All key stakeholders for the LSBE pilot, children studying in the schools, parents of the children, and teachers in the partner schools, participated in the study. Data were collected from approximately 34 teachers, 36 parents, and 78 students between Grades 6-10 participated in the study. The distribution of study participants is presented in the table below.

Table 1: Number of FGDs by district and by type of participant.

Mothers

Fathers Male Teachers Female Teachers Grade 6-8

Boys

Grade 9-10

Boys

Grade 6-8

Girls

Grade 9-10

Girls

Total

Skardu

2

2 2 2 1 1 1 1

12

Hunza

1

1 1 1 1 1 1 1

8

Nagar

1

1 1 1 1 1 1 1

8

Total

4

4 4 4 3 3 3 3

28

Semi-structured discussion guides were developed for each type of study participant. Besides sociodemographic information from study participants, key thematic areas included perceptions around human rights, gender, health, puberty, substance use, mental health, violence, marriage, familial relationships, and LSBE in general. The discussion guides were developed in English and translated into Urdu. The discussion guides were shared with the school management for review and their feedback was incorporated into the guides. This was done by the researchers to ensure that the tools were culturally appropriate and the language was easily understood by participants. FGDs were conducted in September 2019 by the research team. FGDs were conducted in classrooms in partner schools and each FGD lasted 60-120 minutes.

All of the audio-recorded discussion guides were transcribed verbatim and translated into English. A team of four qualitative researchers conducted the analysis. Data analysis was conducted manually using the framework analysis approach [16,17]. Data analysis was conducted by the research team, based on three types of coding: sub themes, themes, and categories. The identified codes, themes, and patterns were reviewed alternately by each researcher to minimize bias and to ensure reliability. The identified themes and subthemes are organized in the table below.

Table 2: Identified Themes and Sub-themes.

#

Themes

Sub-themes

1 Perceptions around Human Rights Equal treatment


Necessities of life

2 Perceptions around Gender Meaning of Gender Perceptions around Boys

Perceptions around Girls

3 Perceptions around Puberty Sociocultural Practices and Restrictions


Perceptions around Menstruation and Menstrual Hygiene

4 Perceptions around Marriage Marriage norms


Problems Associated with Early Marriage

5 Perceptions around Mental Health Common Mental Health Issues Sources of Mental Distress Linkages with Substance Use

Perceptions around Violence

Informed consent was obtained from all participants. Since data were collected from children, special measures were taken to protect their interests by obtaining parental consent for all participating children beforehand.

Results

Perceptions around Human Rights

Participants conceptualized rights to be granted by a higher power; however, they indicated that these rights or the provision of these rights is muddled through corrupt states. Fulfillment of societal obligations, physiological and safety needs, love and belonging needs, freedom of choice, and equal respect were identified as an individual’s rights. Furthermore, participants believed that boys and girls should have equal rights, and should be respected equally.

“There are two types of rights. God’s rights and human being’s rights. Prayer, fasting, and Zakat1 are God’s rights. Human being’s rights are duties to one other such as neighbour’s rights, parents’ rights, and teachers’ rights.”

Young boy, Grade 6-8, Skardu, Gilgit-Baltistan

Participants shared that their certain fundamental human rights were affected by tourism and locals alike whereby the sensitive biodiversity of the area was being damaged resulting in high water and land pollution as well as hunting of animal species native to the region. Participants specifically mentioned behaviours such as littering in streams of drinking water and valleys and noise pollution from tourist vehicles.

Perceptions around Gender

Gender was mainly described as the difference between male and female whereas some identified it as the difference in social functioning. Social functions commonly associated with boys were out-of-home chores, bread winning, and physical labour, acting as the first line of defence in war, and supporting parents in old age.

“Boys go to the market. Boys can ride a bike but girls cannot. They don’t go to the market.

Boys can go anywhere but girls can’t go to most places”.

Young boy, Grade 6-8, Hunza, Gilgit-Baltistan

Participants said that girls are not given cell phones and bicycles, neither are they allowed to stay outside the house past sunset, which indicates that the girls’ physical as well digital mobility is restricted. Girls are expected only to wear loose-fitting clothes or remain concealed in pardah2 and it is considered inappropriate for girls to laugh in front of boys and usually only talk to boys when it is work-related. Most girls, however, are not given the opportunity to pursue higher studies and those who do pursue higher education are restricted to teaching and medical jobs.

“In our society, girls don’t get jobs and stay at home”.

Male parent, Nagar, Gilgit-Baltistan

Girls in GB are also not given their due right in inheritance and this contributes to their inability to attain socio-economic independence. Participants also agreed that there are more limitations and accountability in case of girls, whereas, boys are usually absolved of blame.

“Boys are given more information about society and if a boy is guilty of something, the blame is passed on to the girl.”

Female teacher, Hunza, Gilgit-Baltistan

Zakat1 is an annual alms tax that each Muslim is expected to pay as a religious duty and that is used for charitable purposes [18].

Pardah2 (“veil” or “curtain”) is a religious practice that involves the seclusion of women from public observation by means of concealing clothing [19].

Perceptions around Puberty

Participants associated puberty with becoming an adult, which is signified by the end of years of playfulness and the time to get married. Sharing their views on puberty, some participants said that this is when adolescents become disobedient, emotionally low, and are likely to engage in substance use and other ‘sins’.

Girls associated puberty with periods and associated it with sadness. Female participants listed activities exclusive to the days of menstruation: changing of bed sheets/covers, changing the pad/cloth twice to thrice a day, hiding from males, skipping school, washing and ironing the period cloth, and following remedies for period pain. Common remedies included eating boiled eggs with peanuts, drinking milk, remaining seated to limit physical activity, and taking medicine as a last resort. Participants shared that in order to not appear unwell; they had to pretend to work during menstruation.

“We work in the house every day and even if we have painful cramps, we keep working so that the males don’t find out.”

Young girl, Grade 9-10, Skardu, Gilgit-Baltistan

Sharing their sources of information on puberty and adolescence, participants listed parents, siblings, cousins, friends, older girls/boys, teachers, school principals, and the internet. A major source cited by both boys and girls, was madrasah where they are given lessons on puberty by the moulvi3 using the textbook: “Tauzeeh-ul-Masail4”.

Perceptions around Marriage

Participants shared that the normative age for marriage for a girl in GB is 15 to 20 years, or when the girl is in her first or second year of college. Normative age for marriage for boys, in GB, was shared to be within the range of 18 to 25 years. The participants, however, believed the ideal age should range from after puberty to 30 years. Commenting on the problems that stem from early marriages, participants relayed that they can result in early-age pregnancies and large families.

Perceptions around Mental Health

One participant described mental health as ‘feeling fresh’ while others automatically assumed a negative line and related it to stress, tension, pressure, frustration, depression, low self-esteem, inferiority complex, psychological problems, obsessions, and not finding peace. Discussing the GB community’s perceptions around mental health and mental illness, participants said that “pagal” (crazy) was usually considered synonymous with mentally ill.

“People are generally scared of the “powerful” ones and do not annoy them, where as the “weaker” ones are made fun of and teased. The powerful ones damage people’s property and should be locked in a room”.

Male parent, Nagar, Gilgit Baltistan

Moulvi3 is a learned teacher or doctor of Islamic law [20].

Tauzeeh ul Masail4 is a book of Islamic laws compiled by a Shi’a Muslim scholar [21].

On the subject of suicides, participants believed that only boys or men commit suicide, and never women, because men are more distressed. Moreover, on the matter of substance use, participants relayed that people residing outside of their localities, such as in Punjab or Karachi, are associated more with using substances. Substance use was associated with bad upbringing and the most commonly stated reasons for substance abuse were distress/depression, peer pressure, and influence of elders. Some believed that it is a way of celebrating new-found freedom amongst growing boys, and mainly associated it with recreation.

Discussion

Results of this analysis will be used to modify the LSBE program to be implemented into participating schools in 2020. The revised module will acknowledge the existing knowledge base that the children of GB have, from going through the madrasah system, rather than contradicting it. The programme will be tailored to the community’s beliefs and practices, and will integrate the teachings of the madrasah into the curriculum to prevent epistemological and pedagogical conflict. The content of the curriculum will be shared with parents, teachers, and school management before its implementation with children.

During the discussions, participants were reluctant to share information that they believed would reflect negatively on their community. Therefore, a shared form of communal protection was demonstrated with participants explicitly telling each other not attribute “blame” for problems such as substance use to the community itself. This could also be a function of courtesy bias whereby participants provided positively-framed answers to please the interviewers [22]. The study found that all participants had limited pubertal knowledge and shared that SRHR is considered to be a very taboo subject in these communities. Findings showed that parents do not talk to their children about puberty, and mothers specifically do not talk to their daughters about menstruation. These findings contrast starkly from the prevalent beliefs and practices in the rest of the country where mothers serve as the primary source of SRHR knowledge for girls while boys generally gain their knowledge through other sources [23]. All participants cited the madrasah as their source for all pubertal and SRH knowledge. Children, when they “hit puberty”, are sent to the madrasah whereby they’re provided Islamic religious texts on the subject. Participants had little knowledge on the biological and mental changes caused by puberty, and also conceptualized puberty as a singular point rather than a liminal process. Moreover, despite the community’s progressive insistence towards girls’ education, patriarchal and heteronormative beliefs prevail which hinders’ girls and women from claiming bodily autonomy and rights to inheritance, to work, to choose time of marriage, to choose to divorce, and to choose to procreate [24].

Modules focusing on career and educational choices should be developed as well with a gendered nuance to provide children with knowledge about avenues and resources that exist. Modules should also be developed as well on social responsibility towards the culture and the environment. Moreover, the madrasah system with the textbook appears to be a structural system for disseminating pubertal information among adolescents. The book should be reviewed prior to module development to ensure a “parallel” system is not created which could spark negative reaction from the community.

Conclusion

This was one of the first studies which specifically explored the SRHR beliefs and perceptions of communities residing in Gilgit-Baltistan. Apart from prevalence of low knowledge and misconceptions around puberty, marriage, and mental health, gender inequality was discovered as a strong theme lacing most of their SRHR beliefs and social behaviours. Greater emphasis needs to be placed on eliminating and/or transforming beliefs and attitudes that lower women’s position within a household and in society. The findings of this study will be used to inform the design of a LSBE module as well as a research trial to test the efficacy of the module. Future studies should also focus on 1) understanding the madrasah system better and the impact it has on shaping the community’s SRHR beliefs, and 2) exploring parental and community inclusion in interventional designs for improving adolescents’ SRHR.

References

  1. Özdemir A, Utkualp N, Palloş A (2016) Physical and Psychosocial Effects of the Changes in Adolescence Period. Int J Caring Sci 9: 717-723.
  2. McNeely C (2011) The teen years explained: a guide to healthy adolescent development. U.S.: Johns Hopkins Bloomberg.
  3. Najam N, Hussain S (2015) Gender and mental health in Gilgit-Baltistan, Pakistan. J Pioneer Med Sci
  4. World Health Organization. Adolescent mental health [Internet]. www.who.int. 2019.
  5. Morris JL, Rushwan H (2015) Adolescent Sexual and Reproductive Health: The Global challenges. Int J Gynecol Obstet 131: S40-42. [crossref]
  6. Population Council, UKAid, UNFPA (2019) Situation Analysis of Reproductive Health of Adolescents and Youth in Pakistan. Islamabad, Pakistan.
  7. Khan A (2003) Adolescent Reproductive Health in Pakistan: Status, Policies, Programs and Issues.
  8. Mamdani KF, Hussain A (2015) An evaluation of communication patterns between parents and children regarding puberty: a case study of Skardu, Gilgit-Baltistan. New Horiz 9: 47-65.
  9. Planning & Development Department, Government of the Gilgit-Baltistan, UNICEF Pakistan. GB Multiple Indicator Cluster Survey, 2016-17. Gilgit, Pakistan: P&D Department, Government of the Gilgit-Baltistan and UNICEF Pakistan. 2017.
  10. Andalón M, Williams J, Grossman M (2014) Empowering Women: The Effect of Schooling on Young Women’s Knowledge and Use of Contraception [Internet]. Cambridge, MA: National Bureau of Economic Research. p. w19961. Report No.: w19961.
  11. Murtaza KF (2012) Women Empowerment through Higher Education in Gilgit-Baltistan. Int J Acad Res Bus Soc Sci 2: 343-367.
  12. Shah Dr D, Amin N, Kakli MB, Piracha ZF, Muhammad Adeel Zia (2018) Pakistan Education Statistics 2016-2017. 25th ed. Islamabad: National Education Management Information System (NEMIS), Academy of Educational Planning and Management (AEPAM) with technical and financial support from United Nations Children’s Fund (UNICEF), Pakistan.
  13. Ali SW, Akhunzada T (2015) Unheard voices: engaging youth of Gilgit-Baltistan. Conciliation Resources, UK and Centre for Peace, Development and Reforms, Pakistan.
  14. Baig S, Ullah A (2017) Outcome and Roots of Early Marriages in Gilgit-Baltistan: A Quantitative Descriptive Study. J Mt Area Res 3: 1-7.
  15. Bashir Q, Usman A, Amjad A, Amjad U (2017) ‘The Taboo that Silences’: Awareness about Sexual and Reproductive Health Issues among Adolescent Females during Pubertal Transition. Isra Med J 9: 381-385.
  16. Gale NK, Heath G, Cameron E, Rashid S, Redwood S (2013) Using the framework method for the analysis of qualitative data in multi-disciplinary health research. BMC Med Res Methodol 13: 117. [crossref]
  17. Jane R, Liz S. Qualitative Data Analysis for Applied Policy Research. In: The Qualitative Researcher’s Companion [Internet]. 2455 Teller Road, Thousand
  18. Oaks California 91320 United States of America: SAGE Publications, Inc 305-329.
  19. Merriam-Webster. Zakat. In: Merriam-Webster.com [Internet]. 2020 [cited 2020 Apr 23].
  20. In: Encyclopaedia Britannica [Internet]. Encyclopædia Britannica, inc.; 2008 [cited 2020 Apr 23].
  21. Merriam-Webster. maulvi. In: Merriam-Webster.com [Internet]. 2020 [cited 2020 Apr 23].
  22. As-Sayyid Ali Al-Husseini As-Seestani. Islamic Laws: English Version of Tawdheehil Masaa’el [Internet]. Imam Ali Foundation; 2016.
  23. Hameed W, Ishaque M, Gul X, Siddiqui J-R, Hussain S, et al. (2018) Does courtesy bias affect how clients report on objective and subjective measures of family planning service quality? A comparison between facility- and home-based interviews. Open Access J Contracept 9: 33-43. [crossref]
  24. Ali TS, Rizvi SN (2010) Menstrual knowledge and practices of female adolescents in urban Karachi, Pakistan. J Adolesc 33: 531-541. [crossref]

Process Mapping

DOI: 10.31038/JPPR.2021413


Process mapping can be described as an “entire approach that leads to a holistic understanding of the process under review” [1] Although it has its roots outside lean thinking, process mapping has become part and parcel of the lean “toolkit”, and is used with lean practice given its strengths in data collection and process re-design by identifying value add and non-value add processes [2-4]. It involves documenting activities of a process in a detailed graphical format. Process mapping has long been an important technique in service assessment and improvement [5]. It has the advantage of communicating roles and responsibilities to team members, providing a useful “what-if” tool and improving all round efficiency [1]. In recent years, it has become a key component of popular techniques such as Six Sigma and lean thinking [6,7]. Figure 1 is an example of a process map from a project examining discharge of high risk patients [8].

fig 1

Figure 1: Swim lane diagram outlining steps within the discharge process.

Process Mapping in Healthcare

Process mapping has recently been used to examine and improve healthcare processes. It may also allow health policy decision makers to view the management of a medical condition in the form of sequential events, and by doing so gaining an insight into both the patient and staff experience [9]. Process Mapping has demonstrated clinical benefit in improving efficiency and reducing unnecessary or ineffective care [10].

A recent review of the literature by Antonacci et al. examined the findings of eight quality improvement projects from different healthcare settings within the NHS [11]. Inductive analysis on interviews of partcipants experience of using process mapping was carried out. There were eight key benefits related to process mapping reported by the participants;

(i) Gathering a shared understanding of the reality.

(ii) Identifying improvement opportunities.

(iii) Engaging stakeholders in the project.

(iv) Defining the project’s objectives.

(v) Monitoring project progress.

(vi) Learning

(vii) Increased empathy.

(viii) The simplicity of the exercise.

Five factors related to a successful process mapping exercise were identified;

(i) Simple and appropriate visual representation.

(ii) Information gathered from multiple stakeholders.

(iii) Facilitator’s experience and soft skills.

(iv) Basic training.

(v) Iterative use of process mapping throughout the project.

There are limitations to process mapping. It can be a costly and lengthy exercise. Manual process mapping takes resources in the form of money and time. There is a team directly responsible for producing the map, as well as the employees who are brought away from their work to be contribute their knowledge to the project [12], Process mapping often relies on the memory of the person describing the process, and any gap in that recollection can lead to a gap or error in the process map [12]. One way of remedying this is the “walk the journey” method of data collection, where the entire process is observed by the mapping team. This technique has been recommended for use in process mapping exercises in healthcare, with the added advantage of experiencing the patient journey and improving patient empathy [13].

Time Driven Activity Based Costing

Another use of Process Mapping is that of a costing approach, where the sequential events derived from process mapping can be used in time-driven activity-based costing (TDABC). TDABC uses two parameters [14];

(i) The unit cost supplying capacity and

(ii) The time required to perform the activity.

In 2011, Kaplan and Porter set out a seven step approach to TDABC in healthcare settings [15], presented in Table 1 below. TDABC model has been shown to be successful in process assessment and costing activities across a variety of disciplines, including emergency medicine, paediatrics, neurology and oncology [16-19]. In the systematic review of TDABC studies in the literature, Keel et al. found TDABC to be used in both operational improvement and also to inform reimbursement policy [20]. TDABC was found to be a simple procedure, yet more accurate than traditional activity-based costing. They noted that other than defining the medical condition and care delivery value chain, all other steps set out by Kaplan and Porter are mandatory for a proper TDABC analysis. The emerging theme was that TDABC is a growing discipline and should be slowly incorporated into existing systems to provide the best cost assessments possible [20].

Table 1: Seven steps of TDABC in healthcare.

Step

Process

Step 1

Select the medical condition.

Step 2

Define the care delivery value chain.

Step 3

Develop process maps of each activity in patient care delivery.

Step 4

Obtain time estimates for each process.

Step 5

Estimate the cost of supplying patient care resources.

Step 6

Estimate the capacity of each resource, and calculate the capacity cost rate.

Step 7

Calculate the total cost of patient care.

Footnote: Steps 2 and 3 of this model are delivered by the use of Process Mapping. In order for a precise costing model to be achieved, each event in the process must be detailed and a cost allocated.

Conclusion

Process mapping has long been a valuable tool in industrial engineering. It is beginning to find its way into healthcare settings and this should be welcomed, both for service improvement and of more general service evaluation, with a notable example being time-driven activity based costing. This methodology provides an easy-to-follow and accurate cost evaluation of healthcare services where staff time is the main driver of cost.

References

  1. Jacka JM, Keller P.J (2009) Business Process Mapping: Improving Customer Satisfaction.
  2. Rahani AR, AL-Ashraf M (2012) Production flow analysis through value stream mapping: a lean manufacturing process case study. Procedia Engineering 41: 1727-1734.
  3. Klotz L, Horman M, BI HH, Bechtel J (2008) The impact of process mapping on transparency. International Journal of Productivity and Performance Management 57: 623-636.
  4. King DL, Ben‐tovim DI, Bassham J (2006) Redesigning emergency department patient flows: application of lean thinking to health care. Emergency Medicine Australasia 18: 391-397. [crossref]
  5. Hunt VD (1996) Process mapping: how to reengineer your business processes, John Wiley & Sons.
  6. Schroeder RG, Linderman K, Liedtke C, Choo AS (2008) Six Sigma: Definition and underlying theory. Journal of Operations Management 26: 536-554.
  7. Womack JP, Jones, DT (1997) Lean thinking—banish waste and create wealth in your corporation. Journal of the Operational Research Society 48: 1148-1148.
  8. Das P, Benneyan J, Powers L, Carmody M, Kerwin J, Singer S (2018) Engineering safer care coordination from hospital to home: lessons from the USA. Future Healthcare Journal 5: 164-170. [crossref]
  9. Kim CS, Spahlinger DA, Kin JM, Billi JE (2006) Lean health care: what can hospitals learn from a world‐class automaker?. Journal of Hospital Medicine: an official publication of the Society of Hospital Medicine 1: 191-199. [crossref]
  10. Susan Oliver, Ailsa Bosworth, Mara Airoldi, Helen Bunyan, Audrey Callum (2008) Exploring the healthcare journey of patients with rheumatoid arthritis: a mapping project–implications for practice. Musculoskeletal Care 6: 247-266. [crossref]
  11. Antonacci G, Reed JE, Lennox L, Barlow J (2018) The use of process mapping in healthcare quality improvement projects. Health services management research 31: 74-84. [crossref]
  12. BIAZZO S (2002) Process mapping techniques and organisational analysis. Business Process Management Journal.
  13. Trebble TM, Hansi N, Hydes T, Smith MA, BAKER M (2010) Process mapping the patient journey: an introduction. BMJ.
  14. KAPLAN RS, Anderson SR (2003) Time-driven activity-based costing. Available at SSRN 485443.
  15. Kaplan RS, Porter ME (2011) How to solve the cost crisis in health care. Harv Bus Rev 89: 46-52. [crossref]
  16. MClaughlin N, Burke MA, Setlur NP, Niedzwiecki DR, Kaplan AL, et al. (2014) Time-driven activity-based costing: a driver for provider engagement in costing activities and redesign initiatives. Neurosurgical Focus
  17. Yun BJ, Prabhakar AM, Warsh J, Kaplan R, Brennan J, et al. (2016) Time-driven activity-based costing in emergency medicine. Annals of Emergency Medicine 67: 765-772. [crossref]
  18. Yangyang RY, Abbas PI, Smith CM, Carberry KE., Ren H, et al. (2016) Time-driven activity-based costing to identify opportunities for cost reduction in pediatric appendectomy. Journal of Pediatric Surgery 51: 1962-1966. [crossref]
  19. Laviana AA, Ilg AM, Veruttipong D, Tan HJ, Burke MA, et al. (2016) Utilizing time‐driven activity‐based costing to understand the short‐and long‐term costs of treating localized, low‐risk prostate cancer. Cancer 122: 447-455. [crossref]
  20. Keel G, Savage C, Rafiq M, Mazzocato P (2017) Time-driven activity-based costing in health care: a systematic review of the literature. Health Policy 121: 755-763. [crossref]

The Author’s Contributions to Electrocardiography Literature

DOI: 10.31038/JCCP.2021414

Abstract

The author has undertaken multiple electrocardiographic studies during his academic career; most of these were published in peer-reviewed journals. These studies include, normal Frank and McFee vector-cardiograms in the adolescent, diagnosis by intra-cavitary electrocardiography of Ebstein’s anomaly of the left atrio-ventricular valve in congenital corrected transposition of the great arteries, differentiation of right ventricular hypertrophy from posterobasal left ventricular hypertrophy, electrocardiographic features of tricuspid atresia, mechanism of abnormal superior vector (left axis deviation) in tricuspid atresia, mechanism of alternating failure of mechanical to electrical depolarization (AFORMED) phenomenon, racial variations in electrocardiograms and vectorcardiograms between black and white children, congestive cardiomyopathy due to chronic tachycardia: resolution with medications, electrocardiographic changes following balloon valvuloplasty for pulmonary stenosis, the role of the electrocardiogram in delineating atrial and ventricular situs in patients with dextrocardia and heterotaxy syndromes, and a review of arrhythmias.

Keywords

AFORMED phenomenon, Arrhythmias, Balloon pulmonary valvuloplasty, Congestive cardiomyopathy, Corrected transposition, Dextrocardia, Ebstein’s anomaly, Electrocardiogram, Vector-cardiogram, Ebstein’s anomaly, Intra-cavitary electrogram, Left axis deviation, Pulmonary stenosis, Racial variations, Right ventricular hypertrophy, Tricuspid atresia

Introduction

My fellowship training under the tutelage of Dr. Jerome Liebman, an outstanding electro-cardiographer of the 1970s, at the Babies’ and Children’s Hospital of Cleveland/Case-Western Reserve University, Cleveland, Ohio, resulted in my exposure to clinical electrocardiography and research on electro-vector-cardiography. This training was useful in conducting research studies involving electrocardiography. In this review, I will enumerate my contributions in the field of electrocardiography literature.

Normal Frank and McFee Vectorcardiograms in the Adolescent

I actively participated in the study of normal vectorcardiograms (VCGs) in adolescents [1]. Frank and McFee VCGs of 166 normal adolescents were analyzed. Normal values in adolescents were published in 24 tables [1]. The QRS and T magnitudes were higher in the male than in the female subjects; this difference was larger in 11- to 15-year-olds than in 16- to 19-year-old adolescents. This was attributed to females reaching puberty earlier than males. In addition, the male subjects achieved the maximal posterior QRS orientation much sooner than the females. The study also noted significant differences between the Frank and McFee VCG lead systems [1].

Diagnosis by Intra-cavitary Electrocardiography of Ebstein’s Anomaly of the Left Atrio-ventricular Valve in Congenital Corrected Transposition of the Great Arteries (CCTGA)

The diagnosis of Ebstein’s anomaly of the tricuspid valve by the simultaneous recording of intra-cavitary electrocardiograms and pressures across the tricuspid valve was a well-established technique as of the mid-1970s. However, such a method has not been used to diagnose Ebstein’s anomaly of the left atrioventricular valve in patients with CCTGA. We made simultaneous intra-cavitary electrocardiographic and pressure recordings across the left atrioventricular valve simultaneously (Figure 1) in a 13-month-old infant with angiographically confirmed CCTGA and left atrioventricular valve insufficiency (Figure 2) [2]. These recordings were similar to those obtained in classic cases of Ebstein’s anomaly of the tricuspid valve.
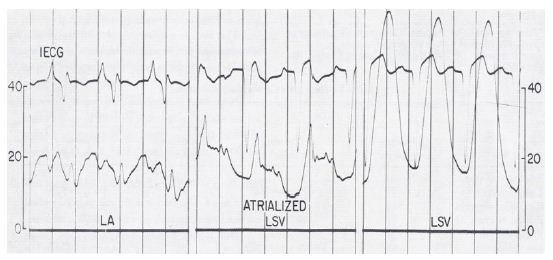
fig 1

Figure 1: Simultaneous recording of intra-cardiac electrocardiogram (ECG) and pressures as the electrode/pressure recording catheter is slowly withdrawn from the left atrium (LA) to the left-sided, morphology-right ventricle (LSV). The left panel shows the atrial pressure curve with an atrial electrogram. The middle panel shows the atrial pressure curve with a ventricular electrogram when the tip of the catheter is in the atrialized ventricular chamber. The right panel shows the ventricular pressure curve with a ventricular electrogram when the tip of the catheter is in the ventricular chamber. Pressure is marked in mmHg. The pressure in LSV is damped because of the small diameter of the catheter. Reproduced from Rogers JH, Jr, Rao PS. (1977) Chest 72: 253-256 [2].
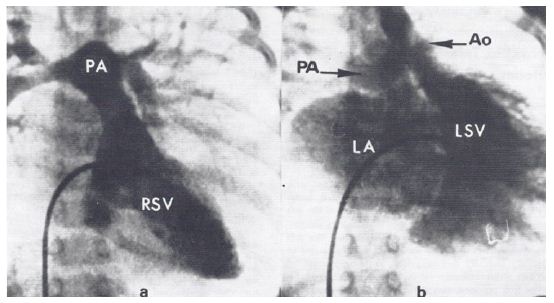
fig 2

Figure 2: a. Selected frame of right-sided ventricular (RSV) cineangiogram demonstrating smooth-walled morphologic left ventricle on the right side with opacification of the pulmonary artery (PA). b. Selected frame of left-sided ventricular (LSV) cineangiogram demonstrating coarsely trabeculated morphologic right ventricle on the left side with opacification of the aorta (Ao). Note the significant left-sided atrioventricular valve insufficiency, resulting in the opacification of the left atrium (LA). The PA is also opacified because of a left-to-right shunt via a ventricular septal defect (not marked). Reproduced from Rogers JH, Jr, Rao PS. (1977) Chest 72: 253-256 [2].

In the discussion section, we reviewed the historical aspects of CCTGA, described the anatomy and typical angiographic findings of the condition, and pointed out the frequent association of Ebstein’s type of malformation of the left-sided, morphologic tricuspid valve in CCTGA, and the usefulness of recognizing this abnormality in the management of CCTGA [2]. The characteristic features of Ebstein’s are 1. atrial pressure with atrial electrogram, 2. atrial pressure with ventricular electrogram, and 3. ventricular pressure with ventricular electrogram, in that order, as the electrode catheter is slowly withdrawn from the left atrium to the left-sided, morphology-right ventricle (Figure 1) [2]. Based on a thorough literature review, we determined that this was the first reported case of intra-cavitary electrocardiogram in a patient with CCTGA with Ebstein’s malformation of the left-sided, morphologic right atrioventricular valve. We emphasized the usefulness of the simultaneous recording of the intra-cavitary electrograms and pressures in the diagnosis of Ebstein’s anomaly of the left atrioventricular valve in patients with CCTGA [2].

Right Ventricular Hypertrophy Vs. Posterobasal Left Ventricular Hypertrophy

Both right ventricular hypertrophy (RVH) and posterobasal left ventricular hypertrophy (PBLVH) manifest by S waves greater than the 95th percentile in leads V5 and V6. At the time of our paper in 1981 [3], there were no published criteria to differentiate these two entities. To address this issue, we examined the ECGs of 5,240 patients; of these, 445 (8.5%) patients had S waves in lead V5 deeper than 95th percentile for age [3]. From these, the ECGs of 46 patients with cardiac lesions known to cause “isolated” RVH and 38 patients with lesions known to produce PBLVH were selected for further analysis. Criteria other than increased S waves in V5 & V6 were evident in 26 patients in the RVH group and 15 in the PBLVH group. The ECGs of the remaining 21 in the RVH group and 23 in the PBLVH group, which did not have other criteria to diagnose either RVH or PBLVH, were examined in detail. The results were presented in multiple tables and figures in the said paper [3]. There was considerable overlap of the frontal plane mean QRS vector (axis) of both groups (Figure 3).
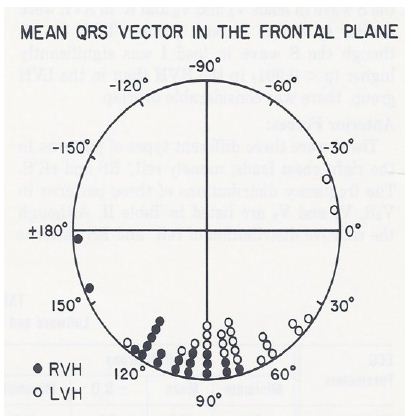
fig 3

Figure 3: The frontal plane mean QRS vectors in degrees, calculated from the scalar ECG, are shown for each of the right ventricular hypertrophy (RVH) (in closed circles) and posterobasal left ventricular hypertrophy (PBLVH) (in open circles) cases. There is considerable overlap of the mean vectors of both the groups. Consequently, the frontal plane mean QRS vector is not useful in distinguishing RVH from PBLVH. Reproduced from Rao PS, Monarrez CN. (1981) J Electrocardiol 14: 25-30 [3].

Terminal rightward forces (S waves in leads V5 and V6 and R waves in AVR), leftward forces (R waves in leads V5 and V6), other voltages (R waves in leads I, II, III, AVR, AVL and AVF and S waves in AVL and AVF) and ratio of RV5/SV5 were similar (p > 0.05 to 0.1) for both groups. However, anterior forces (R waves in leads V1 and V2), S wave in lead I and ratio of RV2/SV2 were higher (p < 0.05 to 0.01) in the RVH than in the PBLVH group. Similarly, posterior forces (S waves in leads V1 and V2) were higher (p < 0.001) in the PBLVH than in the RVH group. Despite these statistically significant differences, there was considerable overlap between these values, as shown in Figure 4, and consequently, these differences are not helpful in differentiating RVH from PBLVH.
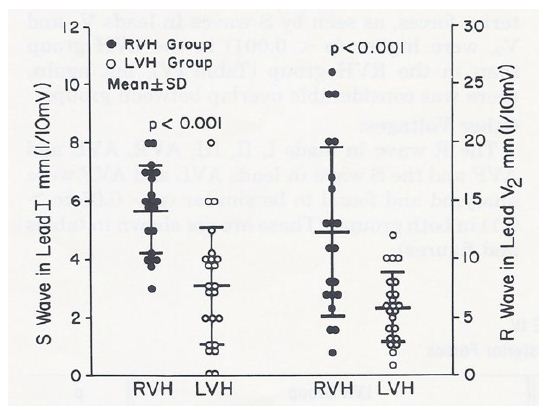
fig 4

Figure 4: S waves in lead I and R waves in lead V2 in mm (1/10 mV) are depicted in the left and right panels, respectively. The right ventricular hypertrophy (RVH) cases are shown in closed circles and the posterobasal left ventricular hypertrophy (LVH) cases are illustrated in open circles. The mean and standard deviation are marked as horizontal lines. While there are statistically significant differences (p < 0.001) between groups, there is considerable overlap of the voltage magnitudes. Therefore, these voltages are not useful in differentiating RVH from LVH. Reproduced from Rao PS, Monarrez CN. (1981) J Electrocardiol 14: 25-30 [3].

Therefore, the data were subjected to discriminant analysis. The results of this analysis indicated cases of RVH if the S wave in lead I was greater than 5 mm, the R wave in lead V2 was greater than 10 mm and the ratio of the R wave in V2/S wave in V2 was greater than 0.65; and of PBLVH if the S wave in lead I was less than 5 mm, the R wave in V2 was less than 10 mm and the ratio of the R wave in V2/S wave in V2 was less than 0.65. In addition, the mean horizontal plane QRS vector was between +60 degrees to +200 degrees in the RVH cases, while the mean horizontal plane QRS vector was between -10 degrees to -130 degrees in the PBLVH group (Figure 5). In addition, the horizontal plane QRS vector loops had a clockwise or figure of 8 rotation in the RVH group, while they had a counterclockwise loop in the PBLVH group (Table 1).
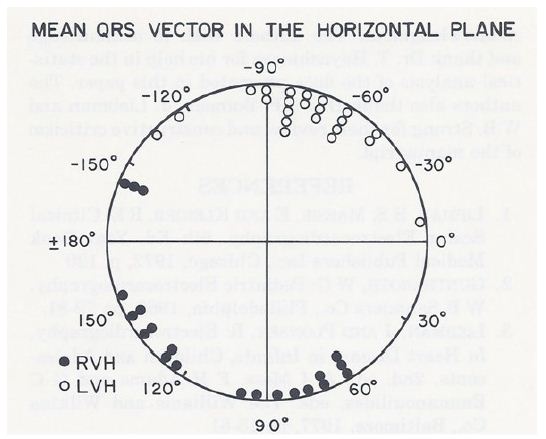
fig 5

Figure 5: The horizontal plane mean QRS vectors in degrees, calculated from the scalar ECG, are shown for each of the right ventricular hypertrophy (RVH) (in closed circles) and posterobasal left ventricular hypertrophy (LVH) (in open circles) cases. The mean horizontal plane QRS vector is between +60 degrees to +200 degrees in the RVH cases while the mean horizontal plane QRS vector is between -10 degrees to -130 degrees in the LVH cases. Unlike the frontal plane mean QRS vectors, there is no significant overlap of mean vectors between the groups. Consequently, the horizontal plane mean QRS vector is helpful in distinguishing RVH from LVH. Reproduced from Rao PS, Monarrez CN. (1981) J Electrocardiol 14: 25-30 [3].

Table 1: Rotation of QRS Vector Loop in the Differentiation of RVH from PBLVH.

Plane

RVH Group

PBLVH Group

Frontal Plane CW – 20

CCW – 1

CW – 21

CCW – 2

Horizontal Plane CW – 16

Figure of 8 – 5

CCW – 23

CW, clockwise; CCW, counterclockwise; PBLVH, posterobasal left ventricular hypertrophy; RVH, right ventricular hypertrophy.
Modified from Rao PS, Monarrez CN. (1981) J Electrocardiol,14: 25-30 [3].

In summary, the right ventricular outflow tract, posterobasal portion of the left ventricle and superior portion of the interventricular septum are the last portions of the heart to be depolarized both in normal and ventricular hypertrophy patients. Because of this reason, terminal rightward forces (S waves in V5 and V6) above the 95th percentile for age can be seen both in RVH and PBLVH. With regard to the differentiation of these entities, should there be other voltage criteria for the respective ventricular hypertrophy, the diagnosis of RVH or PBLVH may be made accordingly. In the absence of such voltage criteria, RVH may be diagnosed if the RV2 is greater than 10 mm, SI is greater than 5 mm and the mean horizontal plane QRS vector is between +60 degrees to +200 degrees with a clockwise or figure of 8 loop. A diagnosis of PBLVH may be made if the RV2 is less than 10 mm, SI is less than 5 mm and mean horizontal plane QRS vector is between -10 degrees to -130 degrees with a counterclockwise loop. It was concluded that these criteria are helpful in making appropriate diagnosis of RVH vs. PBLVH [3].

Electrocardiographic Features of Tricuspid Atresia

We have reviewed ECG data on 308 tricuspid atresia patients, including our own 37 cases seen at the Medical College of Georgia [4,5]. The ECG features of tricuspid atresia include right atrial enlargement (RAE), abnormal superior QRS vector (popularly called left axis deviation), left ventricular hypertrophy (LVH) and diminished right ventricular (RV) electrical forces. The ECG features of the most common muscular type of tricuspid atresia will be reviewed first, followed by the other types of tricuspid atresia. The vectorcardiographic data will not be reviewed since that modality is no longer used.

Right Atrial Enlargement and PR Interval

RAE is manifested by peaked P waves, in excess of 2.5 mm in amplitude (most usually in leads II and V1), is seen in nearly 75% of patients. P waves with double peaks, sometimes referred to as “P tricuspidale” may occasionally be seen; the terminal component is usually explained to be related to left atrial depolarization, but may be due to increased high to low right atrial conduction time. This prolonged high to low atrial conduction time may also produce a prolonged PR interval.

QRS Complex. Major QRS Vector

A frontal plane QRS vector displaced to the left and superiorly between 0° and -90°– formerly called left axis deviation, but more correctly termed abnormal superior vector – was present in 71% of all tricuspid atresia cases and in 83% of Type I tricuspid atresia patients.

Changing Frontal Plane QRS Vector

Some investigators [6] observed a change in the frontal plane QRS vector from +120° on the first day of life to -15° by two weeks of age, and suggested that this may be related to hemodynamic changes in the postnatal period. Documentation in a larger series of patients is needed to confirm these findings.

Ventricular Hypertrophy

Irrespective of the mean frontal plane vector, voltage criteria for LVH are seen in most cases of tricuspid atresia. The LVH is related to multiple factors: 1. Anatomic nature of the lesion, 2. Hemodynamic changes secondary to the defect, and 3. Unopposed RV electrical forces due to RV hypoplasia. The RV voltages (R waves in leads V4R, V1 and V2 and S waves in V5 and V6) are usually decreased and this finding is likely to be related to a small RV.

ST-T Waves

Abnormalities in ST-T waves suggestive of left ventricular (LV) strain are seen in 50% of tricuspid atresia patients; this pattern is more frequent in patients with high LV voltages.

ECG Features Other Types of Tricuspid Atresia

The ECG findings in different types of tricuspid atresia do differ. The frontal plane QRS vectors in 308 patients that we have examined are shown in Figure 6 [4,5]. While 83% of Type I (normally related great arteries) patients have an abnormally superior vector, only 46% of Type II (transposition of the great arteries) patients have such a vector. In Type III, they are even more diverse (Figure 6). While LVH is typical for Type I patients, biventricular hypertrophy on the ECG is likely to be seen in Type II patients. The reported ECG findings in rare forms of tricuspid atresia were reviewed in detail and tabulated in Tables II and III of the second edition of our book on tricuspid atresia [5] and the interested reader is referred to this publication.
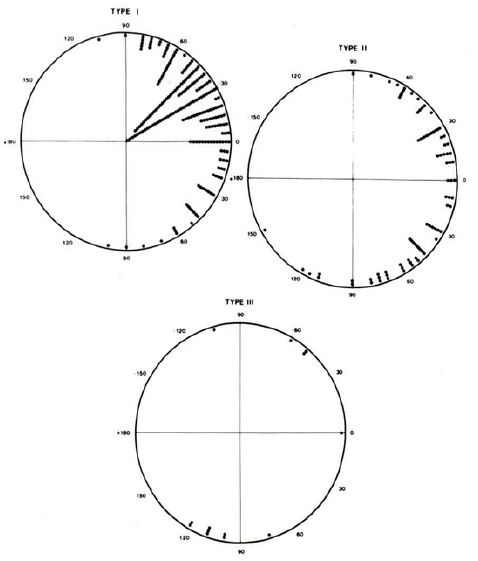
fig 6

Figure 6: QRS vectors in the frontal plane in 308 tricuspid atresia patients are shown separately for Types, I, II and III. The majority of patients with Type I have an abnormally superior vector while only one half of patients with Type II have such a vector. Also, note that most patients with Type III (subtype A) have an inferiorly oriented frontal plane mean vector. Reproduced from Reference [4].

Mechanism of Abnormal Superior Vector (Left Axis Deviation)

A number of hypotheses to explain the abnormal superior vector in tricuspid atresia have been proposed and include large left ventricle, small right ventricle, fibrosis or interruption of the left anterior bundle branch, early origin of the left bundle along with elongated course of the right bundle, and others as reviewed elsewhere [4,5]. In an attempt to define the mechanism of the abnormal superior vector in tricuspid atresia, my colleagues at the Medical College of Georgia and I undertook epicardial mapping and intramural activation studies in three children with tricuspid atresia [4,5,7]. These studies were conducted following approval by the local Institutional Review Board (IRB) and informed consent from the parents. The epicardial ventricular activation sequence from a patient with a normal QRS vector (Figure 7) and that of a patient with tricuspid atresia with an abnormal superior vector (Figure 8) are shown.
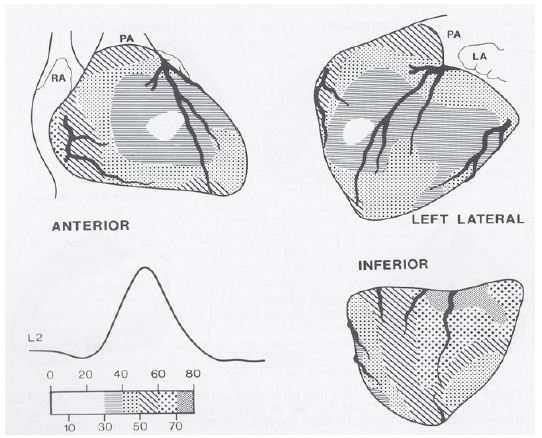
fig 7

Figure 7: Sequence of ventricular activation in a child with a normal QRS complex. Anterior, left lateral and inferior views are demonstrated. The location of the coronary arteries is superimposed on ventricular activation maps. The isochrones are set 10 msec apart and related to the lead II (L2) of the electrocardiogram. The earliest epicardial breakthrough occurs on the right ventricle at 27 msec and the last epicardial activation occurs at the inferior surface of base of the heart. LA, left atrium; PA, pulmonary artery; RA, right atrium. Reproduced from Reference [5].
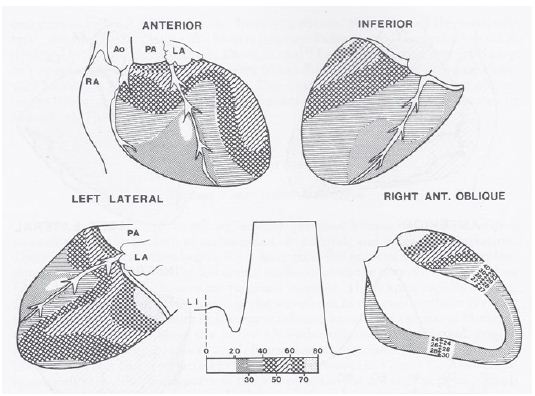
fig 8

Figure 8: Sequence of ventricular activation in a child with tricuspid atresia with an abnormal superior vector. The format is similar to that shown in figure 7, but anterior, inferior, left lateral and right anterior oblique views are shown. The earliest breakthrough occurs in the anterior right ventricle at 18 msec and is similar to normal, but the RV activation is completed within 65 msec – much earlier than normal. The latest epicardial activation area is located on the anteriolateral aspect of left ventricle at the base. Ao, aorta; LI, lead I; LA, left atrium; PA, pulmonary artery; RA, right atrium. Reproduced from Reference [5].

The data are similar in all three children with tricuspid atresia and appear to suggest that the QRS abnormalities of tricuspid atresia are related to: a. right-to-left phase asynchrony of the ventricular activation with early onset and completion of RV activation along with delayed left LV activation, b. early onset of epicardial breakthrough of the inferior LV, c. delayed activation of the superior aspect of the basal portion of the LV, presumably secondary to the asymmetric enlargement of the LV (tower effect), and d. a lack of apposition of the LV wave fronts (delayed activation of the thickened LV) by the early and small RV activation wave fronts [4,5,7]. The geometric and volume conductor effects of a hypoplastic RV and enlarged LV with a more horizontal base to apex orientation of the cardiac axis may also contribute to the expression of an abnormal superior vector. For additional details and discussion, the reader is referred to these publications [4,5,7]. In summary, the ventricular activation data from our studies [4,5,7] suggested that this distinctive abnormal superior vector of the QRS complex in tricuspid atresia is produced by the interaction of multiple factors, the most important of which appear to be right-to-left ventricular disproportion and an asymmetric distribution of the left ventricular mass favoring the superior wall.

Alternating Failure of Mechanical to Electrical Depolarization (AFORMED) Phenomenon

The AFORMED phenomenon was first described in the late 1960s. However, its cause has not been elucidated as of 1983. While studying the mechanism of hypoxic pulmonary hypertension, we observed the AFORMED phenomenon (Figure 9A) in three experimental open-chest dogs [8]. The AFORMED occurred during the tachycardia phase following recovery from cardiac arrest. Administration of intravenous calcium gluconate promptly abolished the AFORMED, but it recurred 10 to 15 minutes later. Administration of lanoctoside-C abolished the AFORMED in 30 minutes with no further recurrence during 2 to 3 hours of observation. However, when rapid acting digitalis preparation (G. strophanthin) was given intravenously, the AFORMED reverted to normal immediately (Figure 9B). We surmised that the lack of availability of calcium to the myofilament may be the cause of the AFORMED because the phenomenon could be abolished by increasing the calcium concentration or by augmenting its influx by cardiac glycosides. We recommended detailed studies of ionic fluxes to further clarify the role of calcium in causing the AFORMED phenomenon [8].
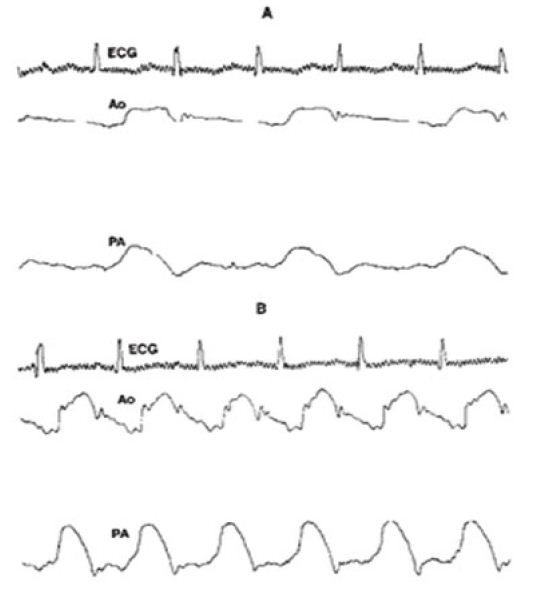
fig 9

Figure 9: A. Recording of the electrocardiogram (ECG), aortic (Ao) and pulmonary artery (PA) pressures showing that every other ECG complex is not followed by the PA and Ao pulse pressure during the AFORMED phenomenon. B. After administering G. strophanthin all ECG complexes are followed by the Ao and PA pulse traces. Reproduced from Rao PS, Thapar MK. (1983) Am J Cardiol 52: 655 [8].

Racial Variations in Electrocardiograms and Vectorcardiograms between Black and White Children

While it is generally thought that the ECGs of black and white children differ from each other, none of the normal standards in children have taken race into consideration in establishing the norms as of the mid-1980s. Therefore, we examined large groups of black and white children to see if any such differences exist, and if so, to investigate the reason for such differences [9,10]. A total of 244 normal children were studied; 124 were black and 120 were white. 125 were male and 119 were female. 144 measured parameters and 57 computed variables from these subjects were examined. In these studies, the children were divided into age groups of 3-5, 6-10, 11-14, and 15-17 years old. The number of teenagers between 15-17 was small (N=20) and therefore, their data were not analyzed in the initial study [9]. Subsequently, additional teenagers (N = 39) were added; this gave a total of 59 teenagers (28 black and 31 white adolescents between 15 and 19 years old) and were studied [10] in a manner similar to the first study [9]. These data were presented in multiple tables and figures [9,10].

No sex-related or race-related (Figure 10) differences (p > 0.1) in the ECGs/VCGs were detected in the 3- to 5-year-old children. Similarly, no race-related differences (p > 0.1) were seen in the 11- to14-year-old girls (Figure 11).
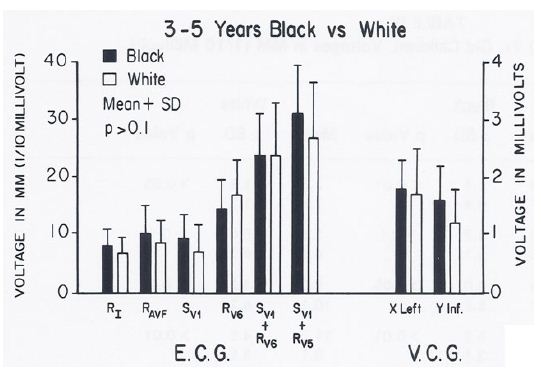
fig 10

Figure 10: Bar diagram illustrating the comparison of selected voltage amplitudes of the QRS complex of the electrocardiograms (E.C.G.) and vectorcardiograms (V.C.G.) between 3- to 5-year-old black and white children; filled bars represent black children and unfilled bars represent white children. Note that there were no statistically significant differences (p > 0.1) between the groups. Reproduced from Rao PS, et al. (1984) J Electrocardiol 17: 239-252 [9].
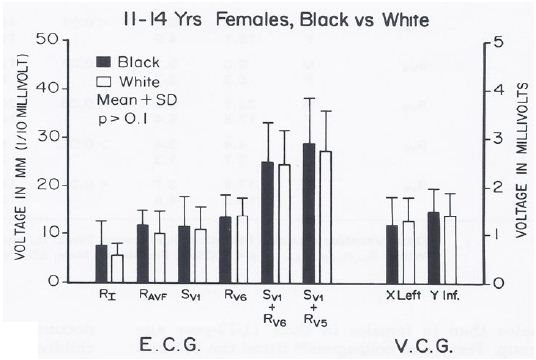
fig 11

Figure 11: Bar diagram illustrating the comparison of selected voltage amplitudes of the QRS complex of the electrocardiograms (E.C.G.) and vectorcardiograms (V.C.G.) between 11- to 14-year-old black and white females; filled bars represent black girls and unfilled bars represent white girls. Note that there were no statistically significant differences (p > 0.1) between the groups. Reproduced from Rao PS, et al. (1984) J Electrocardiol 17: 239-252 [9].

However, higher voltages (p < 0.05 to < 0.01) to the left, posterior and inferior were detected in the ECGs and VCGs of blacks than those of whites in the group of 6- to10-year-old children (Figure 12) and in the 11- to 14-year-old boys (Figure 13). In the 15- to 19-year-old adolescents, the male teenagers had higher (p < 0.05 to 0.001) leftward, inferior and/or posterior voltages than the females; this was true for both black and white adolescents (see Table I of Reference 10 for actual values) [10].
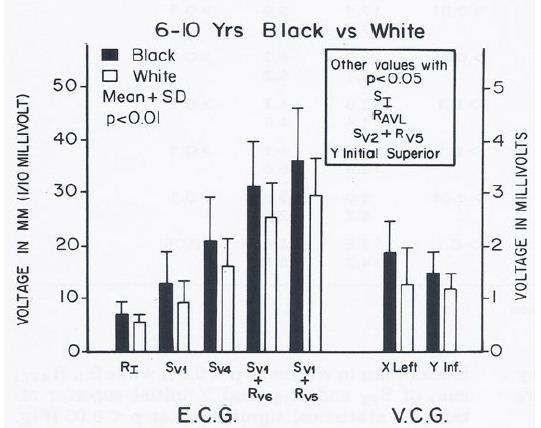
fig 12

Figure 12: Bar diagram illustrating the comparison of selected voltage amplitudes of the QRS complex of the electrocardiograms (E.C.G.) and vectorcardiograms (V.C.G.) between 6- to 10-year-old black and white children; filled bars represent black children and unfilled bars represent white children. Note that there were statistically significant differences (p < 0.01) between the groups. Other parameters with p values < 0.05 are shown in the insert. Reproduced from Rao PS, et al. (1984) J Electrocardiol 17: 239-252 [9].
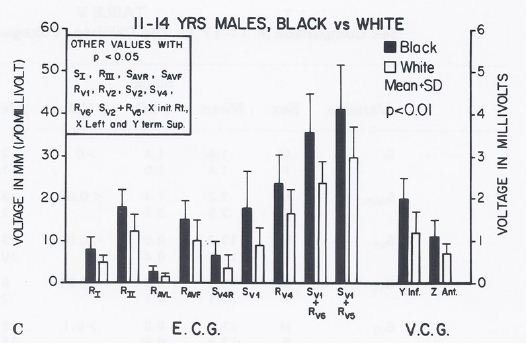
fig 13

Figure 13: Bar diagram illustrating the comparison of selected voltage amplitudes of the QRS complex of the electrocardiograms (E.C.G.) and vectorcardiograms (V.C.G.) between 11- to 14-year-old black and white males; filled bars represent black boys and unfilled bars represent white boys. Note that there were statistically significant differences (p < 0.01) between the groups. Other parameters with p values < 0.05 are shown in the insert. Reproduced from Rao PS, et al. (1984) J Electrocardiol 17: 239-252 [9].

When a racial comparison was made in black 15- to 19-year-olds, the males had higher (p < 0.05 to 0.01) leftward, posterior, inferior voltages than white adolescents (Figure 14) while no such differences (p > 0.05 to > 0.1) were observed in the female subjects (Figure 15).
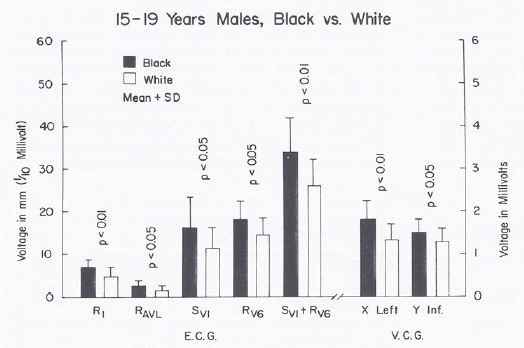
fig 14

Figure 14: Bar diagram illustrating a comparison of selected voltage amplitudes of the QRS complex of the electrocardiograms (E.C.G.) and vectorcardiograms (V.C.G.) between 15- to 19-year-old black and white males; filled bars represent black boys and unfilled bars represent white boys. Note that there were statistically significant differences (p < 0.05 to 0.01) between the groups. Reproduced from Rao PS. (1985) J Electrocardiol 18: 309-313 [10].
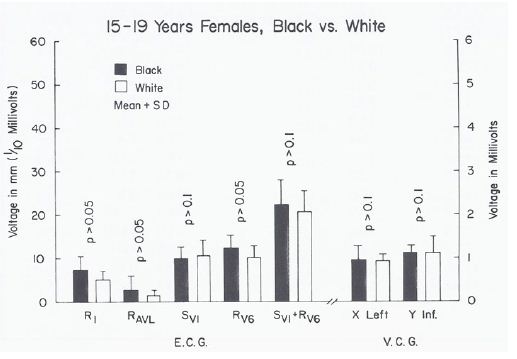
fig 15

Figure 15: Bar diagram illustrating a comparison of selected voltage amplitudes of the QRS complex of the electrocardiograms (E.C.G.) and vectorcardiograms (V.C.G.) between 15- to 19-year-old black and white females; filled bars represent black girls and unfilled bars represent white girls. Note that there were no statistically significant differences (p > 0.05 to 0.1) between the groups. Reproduced from Rao PS. (1985) J Electrocardiol 18: 309-313 [10].

The body surface area, height, weight, AP diameter and circumference of the chest, and systolic and diastolic blood pressures were similar (p > 0.1) in black and white children for all age groups. The hemoglobin and hematocrit values were lower (p < 0.05) in black than in white children. Yet, this difference was seen in all age-sex subgroups, indicating that hemoglobin/hematocrit levels are unlikely to explain the ECG-VCG differences. The left ventricular end-diastolic dimensions were similar (p > 0.1). But, on echocardiographic measurement, the left ventricular posterior wall in diastole was thicker (p < 0.05 to < 0.01) and the distance between the anterior chest wall to mid-left ventricle was shorter (p < 0.05 to < 0.01) in black than in white children in the age-sex subgroups in which the ECG-VCG differences were noted (Figures 16 through 18) while these differences were not seen in the groups in which the ECG differences were not observed (Figures 19 through 21).
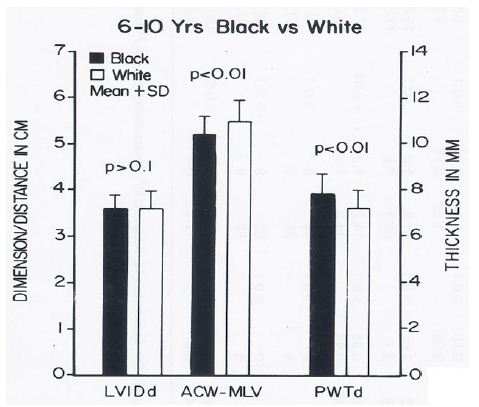
fig 16

Figure 16: Bar diagram comparing the left ventricular internal dimension in diastole (LVIDd), anterior chest wall (ACW) to mid-left ventricular (MLV) distance and left ventricular posterior wall thickness in diastole (PWTd) in 6- to 10-year-old black and white children; filled bars represent black children and unfilled bars represent white children. Note that the LVIDd is similar (p> 0.1) while the ACW to MLV distance is shorter (p < 0.01) and PWTd thicker (p < 0.01) in black than in white children. Reproduced from Rao PS, et al. (1984) J Electrocardiol 17: 239-252 [9].
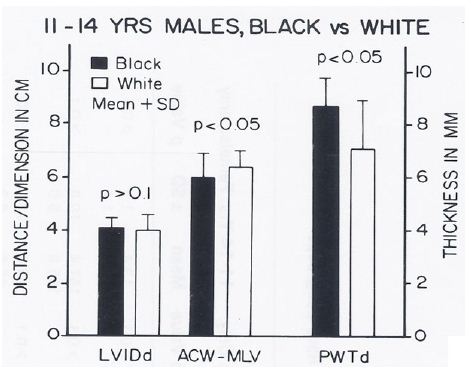
fig 17

Figure 17: Bar diagram comparing the left ventricular internal dimension in diastole (LVIDd), anterior chest wall (ACW) to mid-left ventricular (MLV) distance and left ventricular posterior wall thickness in diastole (PWTd) in 11- to 14-year-old black and white male children; filled bars represent black children and unfilled bars represent white children. Note that the LVIDd is similar (p> 0.1) while the ACW to MLV distance is shorter (p < 0.05) and PWTd thicker (p < 0.05) in black than in white children. Reproduced from Rao PS, et al. (1984) J Electrocardiol 17: 239-252 [9].
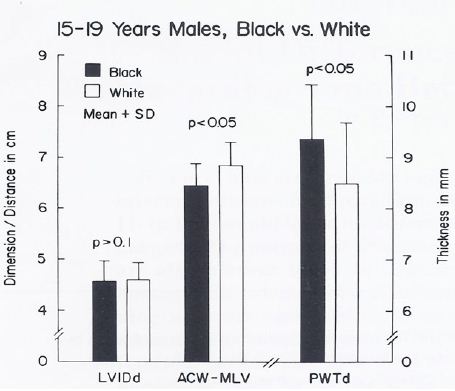
fig 18

Figure 18: Bar diagram comparing the left ventricular internal dimension in diastole (LVIDd), anterior chest wall (ACW) to mid-left ventricular (MLV) distance and left ventricular posterior wall thickness in diastole (PWTd) in 15- to 19-year-old black and white male teenagers; filled bars represent black teenagers and unfilled bars represent white teenagers. Note that the LVIDd is similar (p> 0.1) while the ACW to MLV distance is shorter (p < 0.05) and PWTd thicker (p < 0.05) in black than in white teenagers. Rao PS. (1985) J Electrocardiol 18: 309-313 [10].
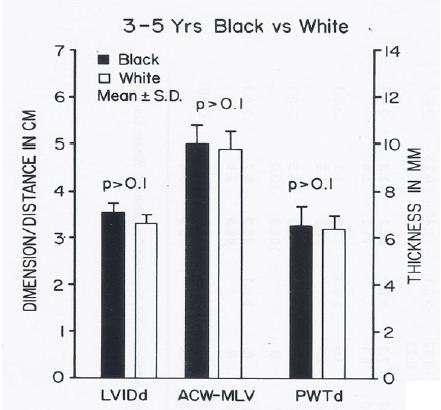
fig 19

Figure 19: Bar diagram comparing the left ventricular internal dimension in diastole (LVIDd), anterior chest wall (ACW) to mid-left ventricular (MLV) distance and left ventricular posterior wall thickness in diastole (PWTd) in 3- to 5-year-old black and white children; filled bars represent black children and unfilled bars represent white children. Note that the LVIDd, ACW to MLV distance and PWTd are similar (p > 0.1) in both groups. Reproduced from Rao PS, et al. (1984) J Electrocardiol 17: 239-252 [9].
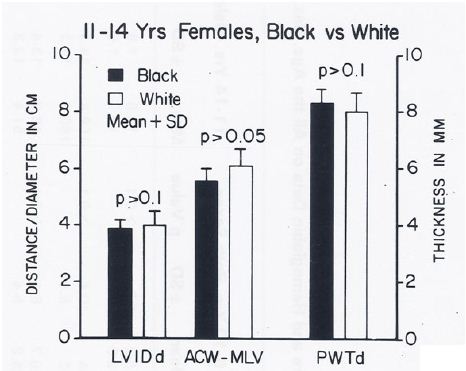
fig 20

Figure 20: Bar diagram comparing the left ventricular internal dimension in diastole (LVIDd), anterior chest wall (ACW) to mid-left ventricular (MLV) distance and left ventricular posterior wall thickness in diastole (PWTd) in 11- to 14-year-old black and white female children; filled bars represent black children and unfilled bars represent white children. Note that the LVIDd, ACW to MLV distance and PWTd are similar (p > 0.05 to > 0.1) in both groups. Reproduced from Rao PS, et al. (1984) J Electrocardiol 17: 239-252 [9].
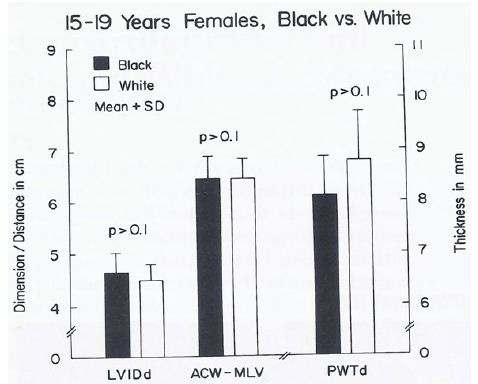
fig 21

Figure 21: Bar diagram comparing the left ventricular internal dimension in diastole (LVIDd), anterior chest wall (ACW) to mid-left ventricular (MLV) distance and left ventricular posterior wall thickness in diastole (PWTd) in 15- to 19-year-old black and white female teenagers; filled bars represent black teenagers and unfilled bars represent white teenagers. Note that the LVIDd, ACW to MLV distance and PWTd are similar (p > 0.1) in both groups. Reproduced from Rao PS. (1985) J Electrocardiol 18: 309-313 [10].

In the discussion following the presentation of the results, a review of the sexual and racial differences in the ECGs was presented. The sex-based differences (higher precordial voltages in males than females in children above 11 years of age) that we found in our study were similar to those observed by other workers as reviewed in our papers [9,10]. With regard to racial differences, higher leftward, posterior and inferior voltages were found in black children than in white children; these began to appear in 6- to 10-year-olds and became more pronounced during adolescence. These differences during adolescence were largely confined to the male subjects. Some earlier studies were in line with our observations, while other studies could not document such differences as reviewed in our papers [9,10].

In summary, the causes for the racial differences had not been adequately investigated prior to our study. Our thorough review indicated no differences in the specialized ventricular conduction system, ventricular activation patterns, duration of QRS complex or size of the left ventricle. Similarly, the body surface area, height, weight, AP diameter and circumference of the chest, and the systolic and diastolic blood pressures did not seem to vary in such a way that might explain the differences. The lower hemoglobin levels that we found in black children may, to some degree, explain the racial difference, but this difference was small, and more importantly, the lower hemoglobin levels were found in all age groups, including those groups in whom no ECG/VCG differences were observed, making hemoglobin an unlikely causative factor. In black children in the groups in which ECG-VCG differences were seen, a thicker left ventricular posterior wall and shorter anterior chest wall to mid-LV distance were observed than in white children in the same groups, and these factors are likely to be responsible for this difference. Based on these observations, we recommended that separate normal standards are needed for males and females beyond 11 years of age and for black and white children beyond six years of age [9,10].

Congestive Cardiomyopathy Due to Chronic Tachycardia (Resolution with Medications)

As of the mid-1980s, the importance of treatment of tachycardia by surgical or catheter-based ablation was emphasized to prevent arrhythmia-induced cardiomyopathy. We hypothesized that the reduction of the ventricular rate to normal by drug therapy would result in the regression of arrhythmia-induced cardiomyopathy. To support this hypothesis, we presented the case of a three-year-old child who developed arrhythmia-induced cardiomyopathy (Figure 22A) and who improved (Figure 22B) with drug therapy [11]. Treatment with medications (Digoxin and Verapamil) resulted in the immediate relief of symptoms, and was followed by a gradual improvement in cardiac size and function (Table 2) with a subsequent return of normal cardiac size and function (Figure 22).

Table 2: Cardiac Rate, Size and Function Prior to and Following Drug Treatment.

At initial presentation

After conversion One-year follow-up Two-year follow-up

Last follow-up (5.5 years)

Ventricular rate, ECG

200

67 85 96

69

CT ratio, X-ray

0.6

0.58 0.51 0.45

0.43

LVEDD, mm, echo

48

50 41 40

41

LVEDD/m2, mm, echo

87

91 65 53

54

LV shortening fraction

13

24 24 32

29

PEP /LVET ratio

0.74

0.51 0.39 0.24

0.24

LA/Ao ratio

1.5

1.4 1.3 1.0

1.1

Ao, aorta; CT, cardiothoracic; echo, echocardiogram; ECG, electrocardiogram; LA, left atrium; LV, left ventricle; LVEDD, left ventricular end-diastolic dimension; LVET, left ventricular ejection time; PEP, pre-ejection period.
Reproduced from Rao PS, Najjar HN. (1987) International J Cardiol 17: 216-220 [11].
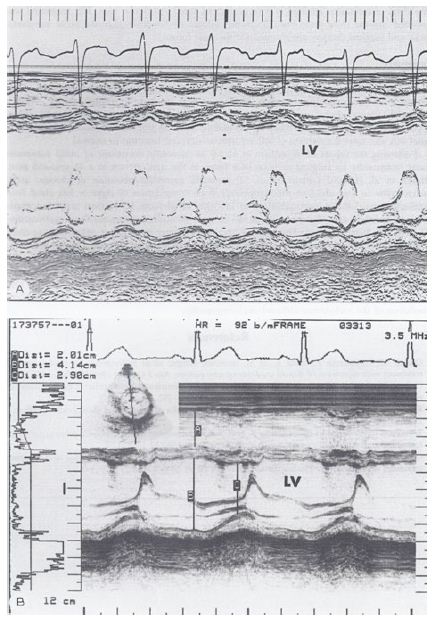
fig 22

Figure 22: A. M-mode echocardiogram of a 3-year-old child who developed arrhythmia-induced cardiomyopathy; note the markedly dilated left ventricle (LV) with poor function (calculated shortening fraction was 13%). B. M-mode echocardiogram of the same patient following successful drug therapy (5.5 years later); note the normal-sized LV with normal function (calculated shortening fraction was 29%). Reproduced from Rao PS, Najjar HN. (1987) International J Cardiol 17: 216-220 [11].

This case demonstrated that reducing the ventricular rate by medication may result in resolving arrhythmia-induced cardiomyopathy and that the surgical excision or catheter ablation of the atrial automatic focus is not necessary in all cases, at least as of the late 1980s. However, it should be noted that enormous advances in pediatric electrophysiology and catheter-based ablation techniques have taken place since the time of our publication [11], and catheter-based ablation of the inciting focus may be an excellent choice at the present time, once the acute symptoms have been controlled by drug therapy.

Electrocardiographic Changes Following Balloon Valvuloplasty for Pulmonary Stenosis

While the evaluation of the follow-up results of balloon pulmonary valvuloplasty by echo-Doppler have been found useful, there was sparse data on the utility of the ECG in the assessment of the results of balloon pulmonary valvuloplasty as of the mid-1980s. Therefore, we sought to examine ECG changes subsequent to balloon pulmonary valvuloplasty for pulmonary valve stenosis and to scrutinize whether ECG changes reflect an improvement in the pressure gradient across the pulmonary valve at follow-up [12].

Of the 41 patients – aged seven days to 20 years – who had balloon pulmonary valvuloplasty, 35 patients had ECGs available for review and comparison both prior to and at three to 34 months (mean 11 months) follow-up. On the basis of cardiac catheterization and echo-Doppler systolic pressure gradients across the pulmonary valve at follow-up, the study subjects were divided into two groups: group I, with good results (N = 30) and group II, with poor results (N = 5). There was no difference (p > 0.1) in any ECG parameters (Figures 23 and 24) between the groups prior to balloon valvuloplasty [12].
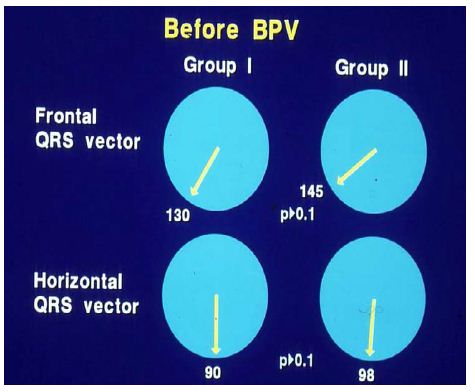
fig 23

Figure 23: Plots of mean QRS vectors (axis) in the frontal (top) and horizontal (bottom) planes in group I (with good results) (left circles) and group II (with poor results) (right circles) prior to balloon pulmonary valvuloplasty (BPV) are shown. Note that no significant (p > 0.1) difference was seen between groups I and II. Reproduced from reference [13].
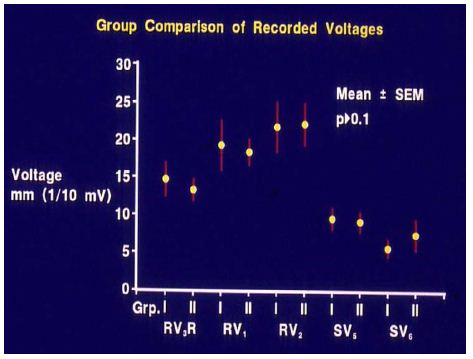
fig 24

Figure 24: Anterior (R waves in leads V3R, V1 and V2) and terminal rightward (S waves in leads V5 and V6) voltages in the electrocardiograms prior to balloon pulmonary valvuloplasty are compared between group I (with good results) and group II (with poor results). Mean and standard error of mean (SEM) are shown. Note that no significant (p > 0.1) difference is shown between groups I and II. Reproduced from reference [13].

In group I (with good results), the frontal plane mean QRS vector moved toward the left from 127 ± 25° to 81 ± 47°, as did the horizontal plane mean QRS vector, which moved from 88 ± 36° to 57 ± 31° (Figure 25) at follow-up; this change is statistically significant (< 0.05). The anterior (R waves in leads V3R, V1 and V2) and terminal rightward (S waves in lead V5 and V6) electrical forces decreased (Figures 26, left panel). However, there was no change (p > 0.1) in the frontal (145 ± 27° vs. 145 ± 27°) and horizontal (98 ± 19° vs. 112 ± 29°) vectors and in precordial voltages (Figures 26, right panel) in group II (with poor results).
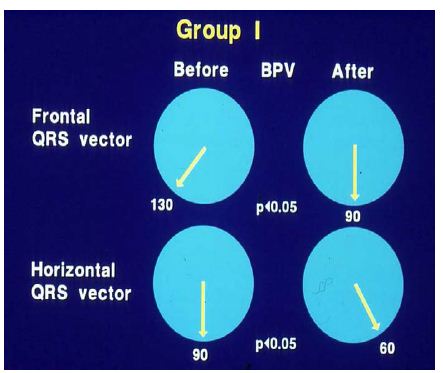
fig 25

Figure 25: Plots of mean QRS vectors (axis) in the frontal (top) and horizontal (bottom) planes in group I (with good results) prior to balloon pulmonary valvuloplasty (BPV) (left circles) and at follow-up (right circles) are shown. Note the significant (p < 0.05) improvement at follow-up. Reproduced from reference [13].
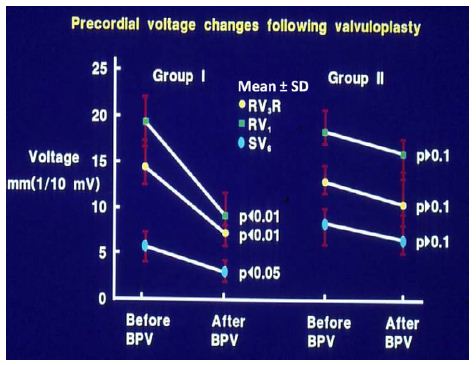
fig 26

Figure 26: Precordial ECG voltages (R waves in leads V3R and V1 and S waves in V6) prior to and at follow-up after balloon pulmonary valvuloplasty (BPV) in group I (with good results) (left panel) and group II (with poor results) (right panel) are depicted. The mean and standard deviation (SD) are shown. Note the significant (p < 0.05 to 0.01) decrease in the voltages in group I while there was no significant (p > 0.1) change in group II. Reproduced from reference [13].

When the time courses of the ECG voltage changes in group I were examined, a gradual improvement was noted; at three-month follow-up, there was no statistically significant decrease (p > 0.05), but at six and 12 months, a significant (p< 0.05 to 0.001) decrease in the voltages was observed (Figures 27 and 28).
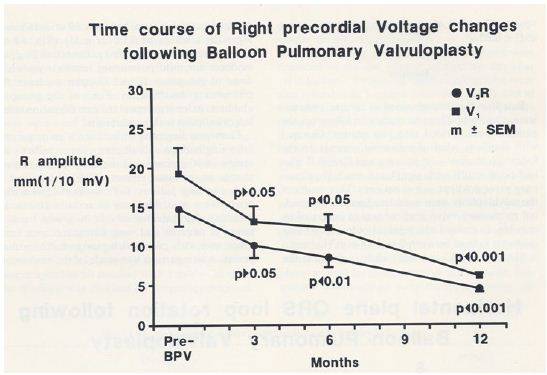
fig 27

Figure 27: Precordial ECG voltages (R waves in leads V3R [circles] and V1 [squares]) prior to and at three, six, and 12 months following balloon pulmonary valvuloplasty (BPV) in group I patients (with good results). Note that a gradual improvement was shown; at three month follow-up, there was no statistically significant decrease (p > 0.05), but at six and 12 months, a significant (p< 0.05 to 0.001) decrease was observed. The mean and standard error of mean (SEM) are shown. Reproduced from Rao PS, Solymar L. (1988) J Interventional Cardiol 1: 189-197 [12].
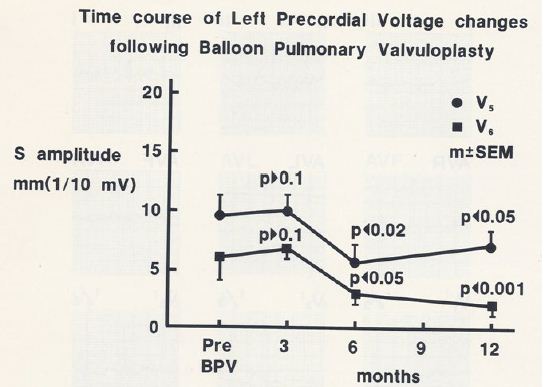
fig 28

Figure 28: Precordial ECG voltages (S waves in leads V5 [circles] and V6 [squares]) prior to and at three, six, and 12 months following balloon pulmonary valvuloplasty (BPV) in group I patients (with good results). Note that a gradual improvement was shown; at three month follow-up, there was no statistically significant decrease (p > 0.05), but at six and 12 months, a significant (p< 0.05 to 0.001) decrease was observed. The mean and standard error of mean (SEM) are shown. Reproduced from Rao PS, Solymar L. (1988) J Interventional Cardiol 1: 189-197 [12].

After concluding that the ECG gets better after successful balloon pulmonary valvuloplasty, we sought to determine whether the post valvuloplasty ECG reflects a residual valve gradient at follow-up. We analyzed thirty pairs of ECGs and trans-pulmonary valve systolic pressure gradients acquired within 24 hours of each other. The ECGs were interpreted as normal or right ventricular hypertrophy on the basis of standard criteria [12]. In fifteen patients with normal ECGs, the pulmonary valve peak systolic pressure gradients were 18.3 ± 8.2 mmHg (with a range of 4 to 30 mmHg) (Figures 29): these simultaneous ECGs/pulmonary valve gradients were secured seven to 28 months (12.0 ± 5.5 mo) after the balloon procedure. Five ECGs obtained within 6 months of balloon valvuloplasty, though improved, still showed RVH even though the gradients were low (15.2 ± 9.4; range 5 to 25 mmHg). The final 10 ECGs showed RVH and had high (55.8 ± 26.4; range 32 to 118 mmHg) residual gradients (Figures 29) at follow-up after 10 ± 5 months. These data suggest that 1. A normal ECG implies a minimal residual pulmonary valve gradient, 2. RVH indicates a significant residual gradient, and 3. Patients whose ECGs are recorded earlier than six months after balloon valvuloplasty may not have had time for the complete resolution of RVH, despite reduced gradients.
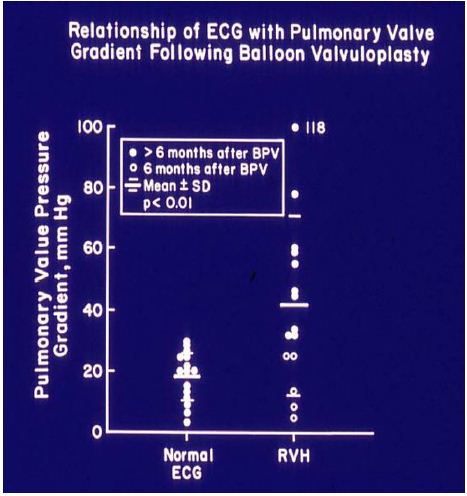
fig 29

Figure 29: The relationship of residual pulmonary valve gradients at follow-up after balloon pulmonary valvuloplasty (BPV) and electrocardiogram (ECG) is plotted. Note that a normal ECG is found in patients with minimal residual pulmonary valve gradients (left panel) while RVH indicates a significant residual gradient, or that the ECGs were recorded earlier than six months after BPV. The mean and standard deviation (SD) are shown. Filled circles – ECGs recorded six months after BPV. Open circles – ECGs recorded prior to six months after BPV. ECGs recorded prior to six months after BPV exhibited RVH, despite reduced gradients; this may in part be related to not yet having had a chance for the complete resolution of RVH. Reproduced from reference [13].

On the basis of these data, we concluded that the ECG is a good indicator of the improvement in gradients following balloon pulmonary valvuloplasty, but reduced valve gradients may not be reflected by the ECG until six months after balloon pulmonary valvuloplasty [12,13].

The Role of the ECG in Delineating Atrial and Ventricular Situs in Patients with Dextrocardia and Heterotaxy Syndromes

Early on we utilized the ECG to delineate atrial and ventricular situs in patients with asplenia/polysplenia syndromes and dextrocardia [14,15]. Atrial and ventricular situs determination was appraised.

Atrial Situs

There are multiple ways in which the atrial situs may be determined, and the ECG is one of the least invasive and easy methods to make such a determination [14-18]. Because the sinoatrial node is normally located at the superior vena cava (SVC)-right atrial (RA) junction, the atrial depolarization traverses leftward and inferiorly and produces “P” waves with a vector (axis) of +45° in the frontal plane (Figure 30). This results in upright P waves in leads I and AVF (Figure 31). With atrial inversion (situs inversus) the P vector is around +135° (Figure 30) with an inverted P wave in lead I and an upright P wave in lead AVF (Figure 32). If the P vector is -45° with upright P waves in lead I and inverted P waves in lead AVF (Figures 30 and 33), it may be called coronary sinus rhythm (or low atrial rhythm), and such a P vector is not helpful in determining atrial situs. However, coronary sinus rhythm is frequently associated with systemic venous anomalies (persistent left superior vena cava and infrahepatic interruption of the inferior vena cava) which are frequently seen with asplenia/polysplenia syndromes.
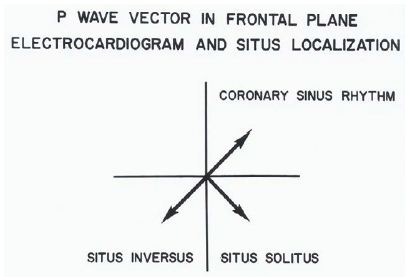
fig 30

Figure 30: The location of the P vector (axis) in the frontal plane is shown for situs solitus (+450) and situs inversus (+1350). A P vector between 00 and -900 is called coronary sinus rhythm and is not helpful in atrial situs assignment. Reproduced from Rao PS, Leonard T. (1976) Cardiology Digest 11(3): 14-22 [14].
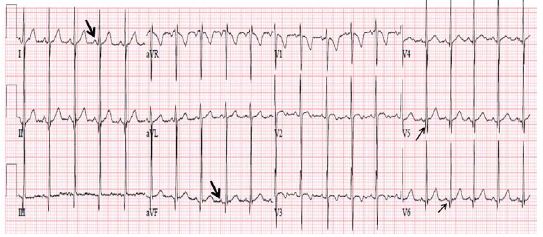
fig 31

Figure 31: ECG demonstrating a normal P vector (+450) with positive P waves in leads I and AVF (arrows in leads I and AVF) suggesting atrial situs solitus. Also, note that there are no Q waves in leads V1 and V2 and Q waves are present in leads V5 and V6 (arrows in V5 and V6), indicating a normal left-to-right ventricular relationship. Reproduced from Reference [17].
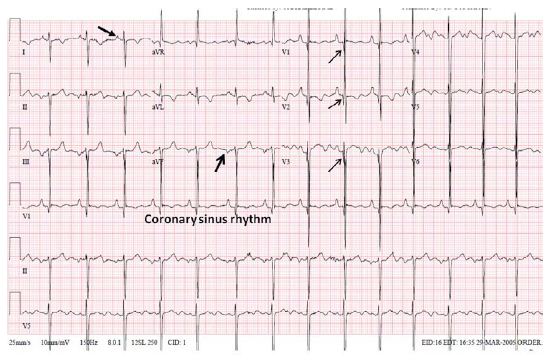
fig 32

Figure 32: ECG demonstrating an abnormal P vector (+1350) with a negative P wave in lead I and a positive P wave in lead AVF (arrows in leads I and AVF) suggesting atrial situs inversus. Reproduced from Reference [17].
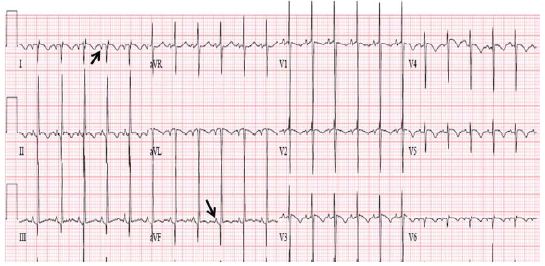
fig 33

Figure 33: ECG demonstrating an abnormal P vector (-450) with positive P waves in lead I and negative P waves in lead AVF (arrows in leads I and AVF) suggesting coronary sinus rhythm; this pattern is not useful in assigning atrial situs. Also note the Q waves in leads V1, V2 and V3 (arrows in V1 V2 and V3), and that there are no Q waves in leads V5 and V6, indicating ventricular inversion. Modified from Reference [17].

Ventricular Situs

The ECG may also be helpful in determining the ventricular situs. While it is generally thought that the qRs pattern of the QRS complex is seen over the left ventricle and the rS pattern over the right ventricle, this concept is not necessarily correct because most dextrocardia and heterotaxy syndrome patients have complex congenital heart disease causing right ventricular hypertrophy (RVH), or they may have a single ventricle. Therefore, it is frequently difficult to distinguish RV (rS pattern) from LV (qRs pattern) of QRS complexes. However, an initial QRS vector may be more helpful. The depolarization of the ventricular septum takes place from both the right and left sides of the septum, with slightly earlier depolarization on the left than on the right side. The sum total initial ventricular forces are directed to the right, anterior and slightly superiorly, resulting in Q waves in leads V5 and V6, no Q waves in leads V1 and V2 , and a small Q wave in lead AVF (Figure 31). In patients with ventricular inversion, the conduction system is also inverted and the initial QRS vector is directed to the left and posteriorly. Consequently, there will be Q waves in leads V1 and V2, no Q waves in leads V5 and V6 (Figure 33), and may have deep Q waves in leads II, III and AVF. These principles are equally applicable, irrespective of the heart’s position in the chest (levocardia, mesocardia or dextrocardia). While this type of analysis appears simple and logical, sometimes it may not be reliable because of variable degrees of rotation and hypertrophy of the ventricles.

The concepts, detailed in our early publications [13-15], appear to have stood the test of time, and we were thus able to reaffirm them in our recent publications [16-19].

Review of Arrhythmias

In Conn’s Current Therapy [20,21], we presented a detailed review of the identification and management of arrhythmias in the pediatric patient in the 1980s. The presentation included descriptions of normal rhythms (sinus arrhythmia, wandering atrial pacemaker, sinus tachycardia, sinus bradycardia), premature contractions (premature atrial beats, premature junctional contractions, premature ventricular beats), supraventricular (paroxysmal supraventricular tachycardia [SVT], atrial flutter, atrial fibrillation, junctional tachycardia, automatic atrial tachycardia) and ventricular (ventricular tachycardia, ventricular fibrillation and “torsade de point”) tachycardias, sick sinus syndrome, and heart blocks (first-degree heart block, second-degree heart block [Wenchebach (Mobitz Type I) and fixed (Mobitz Type II)] and third-degree heart block [complete heart block]), and their diagnosis and management. An alphabetical list of drugs commonly used in the management of pediatric patients with heart disease, with particular attention to the drugs used in the management of arrhythmias in infants and children, was included in these publications [20,21]. The material was presented to many groups of pediatric cardiology fellows, pediatric residents and pediatricians. In addition, examples of the arrhythmia ECG tracings were published in our book, Pediatric Cardiology, Medical Examination Review [22], in questions 1115 through 1167 and 1197 to 1200; the interested reader may review these.

Summary and Conclusions

A number of studies were conducted investigating the utility of ECGs in the assessment of clinical issues in children. Study of Frank and McFee vector-cardiograms in the adolescent established normal vectorcardiographic values in adolescents. Recording intra-cavitary electrocardiograms along with pressures in a patient with Ebstein’s anomaly of the left atrio-ventricular valve in CCTGA helped establish the diagnosis in a manner similar to Ebstein’s anomaly in children with normally related ventricles and great arteries. Investigation to differentiate right ventricular hypertrophy from posterobasal left ventricular hypertrophy resulted in developing criteria (RVH – RV2 greater than 10 mm, SI greater than 5 mm, and the mean horizontal plane QRS vector between +60 degrees to +200 degrees with a clockwise or figure of 8 loop; PBLVH – RV2 less than 10 mm, SI less than 5 mm and mean horizontal plane QRS vector between -10 degrees to -130 degrees with a counterclockwise loop) to distinguish them from each other. A detailed description of electrocardiographic features of tricuspid atresia was presented. The mechanism of abnormal superior vector (left axis deviation) in tricuspid atresia was studied with the resulting conclusion that distinctive abnormal superior vector of the QRS complex is produced by the interaction of multiple factors, the most important of which appear to be right-to-left ventricular disproportion and an asymmetric distribution of the left ventricular mass favoring the superior wall. The mechanism of AFORMED phenomenon was studied in experimental animal model with the conclusion that the lack of availability of calcium to the myofilament may be the cause of the AFORMED phenomenon. We have investigated racial variations in ECGs and VCGs between black and white children and these studies demonstrated: 1. Gender-based differences with higher precordial voltages in males than females in children above 11 years of age, 2. Racial differences with higher leftward, posterior and inferior voltages in black children than in white children; these began to appear in 6- to 10-year-olds and became more pronounced during adolescence. However, such differences were largely confined to the male subjects, and 3. In the groups in which ECG-VCG differences were seen, the black children had a thicker left ventricular posterior wall and shorter anterior chest wall to mid-LV distance than in white children, signifying that these factors are likely to be responsible for this difference. On the basis of these observations, we concluded that separate normal standards are needed for males and females beyond 11 years of age and for black and white children older than six years of age. Resolution of arrhythmia-induced congestive cardiomyopathy with medications in a child indicated that all such patients may not need surgical or transcatheter ablation of arrhythmogenic focus, given the state of the art in mid 1980s; however, currently available ablation techniques are likely to be more favorable. Electrocardiographic changes following balloon valvuloplasty for pulmonary stenosis were described which pointed out that the RVH in the ECG gets better during follow-up and the ECG is a good indicator of the improvement in pulmonary valve gradients following balloon pulmonary valvuloplasty, but reduced valve gradients may not be reflected by the ECG until six months after balloon pulmonary valvuloplasty. The role of the ECG in delineating atrial and ventricular situs in patients with dextrocardia and heterotaxy syndromes was reviewed; these concepts initially proposed the late 1970s and early 1980s remain true in the current era. Reviews of arrhythmias and their management in children, advocated in the 1980s, still remain true although new array of drug and transcatheter therapy by specially trained pediatric electro-physiologists have emerged in recent times.

References

  1. Liebman J, Lee MH, Rao PS, Mackay W (1973) Quantitation of the normal Frank and McFee Parungao orthogonal electrocardiogram in the adolescent. Circulation 48: 735-752. [crossref]
  2. Rogers JH, Rao PS (1977) Ebstein’s Anomaly of the left atrioventricular valve with congenital corrected transposition of the great arteries: Diagnosis by intracavitary electrocardiography. Chest 72: 253-256. [crossref]
  3. Rao PS, Monarrez CN (1981) Electrocardiographic differentiation of posterobasal left ventricular hypertrophy from right ventricular hypertrophy. J Electrocardiol 14: 25-30. [crossref]
  4. Kulangara RJ, Boineau JP, Rao PS (1982) Electrovectorcardiographic features of tricuspid atresia. In: Rao PS (ed). Tricuspid Atresia. Futura Publishing Co., Mount Kisco, New York, Chapter 9.
  5. Rao PS, Kulangara RJ, Boineau JP, Moore HV (1992) Electrovectorcardiographic features of tricuspid atresia. In: Rao PS (ed). Tricuspid Atresia, 2nd Edition, Futura Publishing Co, Mt. Kisco, NY, Chapter 9.
  6. Fuster Siebert M, García-Bengochea JB, Rubio J, et al. (1982) [Tricuspid atresia and interatrial communication of the ostium primum type: changes in the QRS electrical axis. Physiopathologic implications]. Rev Esp Cardio l35: 377-381.
  7. Kulangara RJ, Boineau JP, Moore HV, Rao PS (1981) Ventricular activation and genesis of QRS in tricuspid atresia. Circulation 64: VI-225.
  8. Rao PS, Thapar MK (1983) The AFORMED phenomenon: A proposed etiology. Am J Cardiol 52: 655. [crossref]
  9. Rao PS, Thapar MK, Harp RJ (1984) Racial variations in electrocardiograms and vectorcardiograms between black and white children and their genesis. J Electrocardiol 17: 239-252. [crossref]
  10. Rao PS (1985) Racial differences in electrocardiograms and vectorcardiograms between black and white adolescents. J Electrocardiol 18: 309-313. [crossref]
  11. Rao PS, Najjar HN (1987) Congestive cardiomyopathy due to chronic tachycardia: resolution of cardiomyopathy with antiarrhythmic drugs. International J Cardiol 17: 216-220. [crossref]
  12. Rao PS, Solymar L (1988) Electrocardiographic changes following balloon dilatation of valvar pulmonic stenosis. J Interventional Cardiol 1: 189-197.
  13. Rao PS (2015) Balloon valvuloplasty for pulmonary stenosis. In: Vijayalakshmi IB, , Cardiac Catheterization and Imaging (From Pediatrics to Geriatrics), Jaypee Publications, New Delhi, India, 2015:149-174.
  14. Rao PS, Leonard T (1976) Polysplenia syndrome. Cardiology Digest 11: 14-22.
  15. Rao PS (1981) Dextrocardia: Systematic approach to differential diagnosis. Amer Heart J 102: 389-403. [crossref]
  16. Rao PS (2015) Cardiac malpositions including heterotaxy syndromes. In: Rao PS, Vidyasagar D. (editors), Perinatal Cardiology: A Multidisciplinary Approach, Minneapolis, MN, Cardiotext Publishing, Chapter 36.
  17. Rao PS (2015) Cardiac malposition. In: Gupta P, Menon PSN, Ramji S, Lodha R (eds). PG Textbook of Pediatrics. Jaypee Brothers Medical Publishers (P) Ltd., New Delhi, India, 2015:1807-16.
  18. Rao PS (2018) Cardiac malposition. In: Gupta P, Menon PSN, Ramji S, Lodha R (eds). PG Textbook of Pediatrics. Second Edition, Jaypee Brothers Medical Publishers (P) Ltd., New Delhi, India.
  19. Rao PS (2021) Cardiac malpositions including heterotaxy syndromes. In: Rao PS, Vidyasagar D. (editors), A Multidisciplinary Approach to Perinatal Cardiology, Volume 2, Cambridge Scholars Publishing, New Castle Upon Tyne, UK, 2021: 433-466.
  20. Rao PS and Strong WB (1981) Congenital heart disease. In: Current Therapy 1981. Conn HF (Ed), W.B. Saunders, Philadelphia, PA. 1981: 185-209.
  21. Rao PS (1989) Congenital heart disease. In: Conn’s Current Therapy, 1989 Rakel RE (Ed), W.B. Saunders, Philadelphia, PA, 1989: 201-13.
  22. Rao PS, Miller MD (1980) Medical Examination Review, Pediatric Cardiology, Medical Examination Publishing Co., Inc., Garden City, New York, U.S.A., 1980.
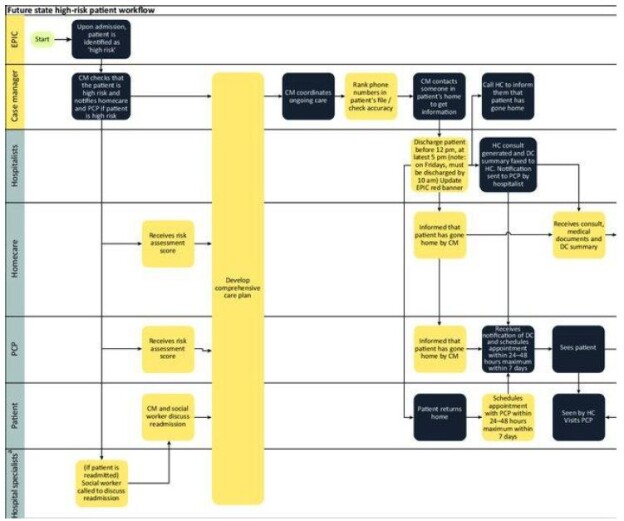
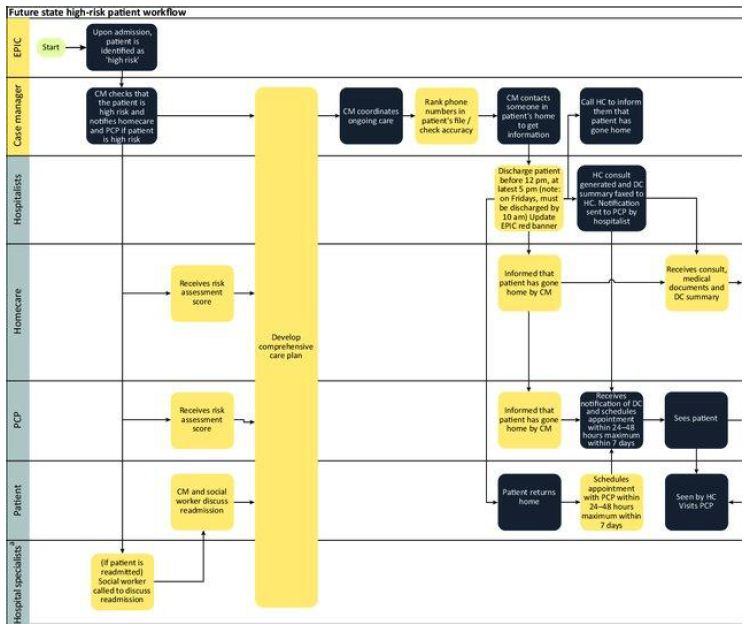
Delayed Presentation of Ventricular Septal Rupture After Untreated Inferior Myocardial Infarction

DOI: 10.31038/JCCP.2021413

Abstract

Ventricular septal rupture is one of the most devastating complications of post myocardial infarction. The mortality rate of post myocardial infarction ventricular septal rupture increases significantly for each week when left untreated. We describe a case of a 62-year-old male who presented with progressively worsening shortness of breath and lower extremity edema three months after a myocardial infarction. The patient was subsequently found to have an anterior apical ventricular septal rupture with left to right shunting. Requiring surgical repair.

Keywords

Myocardial infarction, Ventricular septal rupture

Introduction

The most devastating complication of post myocardial infarction (MI) involves tearing or rupture of infarcted myocardial tissue. The clinical course differs depending on the site of the complication, which may involve the septum, free wall, or papillary muscles. Before the age of reperfusion therapy, post-MI ventricular septal rupture (VSR) occurred in 1% to 3% of patients with STEMI. With fibrinolytic intervention, the occurrence of VSR is approximately 0.2% to 0.34%. Among those who have received reperfusion therapy, it occurs more commonly in those who received fibrinolytic therapy rather than percutaneous coronary intervention. In current times, patients not undergoing reperfusion therapy for an acute MI is a rare entity. For these patients, the first day after post-MI VSR is survived by approximately 75% of patients, the first week approximately 50%, two weeks 30%, and only 4-15% of patients survive the first month. Current guidelines recommend immediate operative intervention in patients with septal rupture, regardless of their clinical status. We present a case of an older gentleman who arrived approximately two months after initial MI whose chief complaint was progressively worsening dyspnea associated with lower extremity edema, and orthopnea. An EKG was obtained which illustrated Q waves in leads II, III, and aVF. Ultimately, he was found to have an anterior apical ventricular septal rupture with left-to-right shunt. The patient underwent repair with a bovine patch as well as coronary artery bypass grafting with the aorta to the posterior descending artery via reverse saphenous vein graft. Today’s literature demonstrates that patients with a post infarct VSR have a significantly high mortality rate that is typically described over a one-month time frame. Our case illustrates a patient who presented two months after an inferior MI with a post infarct VSR who underwent surgical intervention and had resolution of his presenting symptoms.

Case Presentation

A 62-year-old male with a past medical history of hypertension and dyslipidemia presented with the complaint of progressive worsening shortness of breath for over a month. Patient admitted to worsening shortness of breath with movement as well as lying flat and improving with sitting up. Also, the patient noted to have lower extremity edema for over a month. Of note, the patient stated that three months prior, while working, he began sweating profusely and had to stop working to sit down. He had a friend that worked in the fire department who performed an EKG supposedly showing no acute abnormalities. The patient ultimately went home after the EKG. His symptoms of shortness of breath and edema progressively worsened since this point in time. At presentation to the ER, the physical exam was consistent with volume overload and a holosystolic murmur was heard best at the left sternal border. EKG was performed showing sinus tachycardia, old inferior infarct with small Q-waves in leads III and aVF, left atrial enlargement, right axis deviation, and mild T-wave inversions. Additionally, there was poor R-wave progression from V1 through V5 suggestive of possible old anterior infarct. Labs revealed a BNP of 1255 and negative troponin. Echocardiogram showed an ejection fraction of 30%, moderate septal, posterior, and lateral wall hypokinesis, and submitral left ventricular aneurysm with a 0.5 cm ventricular septal defect with left to right shunting. He underwent an elective cardiac catheterization revealing a ventricular septal defect, aneurysmal left ventricle, and occluded left circumflex artery (Figure 1).

fig 1

Figure 1: Left heart catheterization demonstrating an occluded left circumflex artery.

Right heart catheterization pressures showed right ventricular systolic pressure of 62 mmHg with end diastolic pressure of 24 mmHg, pulmonary artery pressure 62/25 mmHg with mean of 41 mmHg, and right ventricle oxygen saturation of 69.1%. A transesophageal echocardiogram was completed due to concern for the ventricular septal defect being near the mitral valve, which would require replacement of the mitral valve during surgery. However, on TEE the ventricular septal defect was found to be apical with evidence of left to right shunting (Figures 2-4).

fig 2

Figure 2: Short axis epigastric 3D TEE demonstrating ventricular septal rupture with left to right shunt.

fig 3 and 4

Figure 3 and 4: Figure on left illustrates a view of the right ventricle, left ventricle, and left ventricular outflow tract. Figure on the right illustrates a short axis epigastric view. These figures demonstrate a ventricular septal rupture with left to right shunting.

Ultimately, the patient underwent repair of the post infarct anterior apical ventricular septal defect with bovine patch pericardium, as well as a coronary artery bypass grafting from aorta to posterior descending artery with reverse saphenous vein graft. Patient did well in the postoperative period and was discharged in good condition. He followed up in the Cardiology clinic 1 month after discharge and denied complaints of chest pain, shortness of breath, and lower extremity edema.

Discussion

VSR is a rare, but devastating complication usually occurring within the first week of post-myocardial infarction. Only 0.17-0.31% of patients experience VSR due to modern reperfusion modalities, such as thrombolysis and primary percutaneous interventions [1]. Anterior infarction, advanced age, female sex, and no smoking history are factors most associated with VSR complicating acute myocardial infarction [2]. In addition, cardiogenic shock at the time of surgery as well as incomplete revascularization were found to be independent, strong predictors of poor 30-day, and long-term survival [3].

The blood flow to the septum is derived from branches of the left anterior descending artery and the posterior descending artery. Nearly two-thirds of VSR occur in the anterior septal wall, and about one-third in the inferior or posterior wall. Three mechanisms of rupture have been proposed by Becker. Type I is sudden in onset, within 24hrs of a myocardial infarction and is typically due to a dissecting intramural hematoma. These have been described in small inferior MI’s that involve tissue associated with the distribution of the posterior descending artery. The primary mechanism for rupture is physical shear stressors, especially at the junction of the infarct area and normal healthy tissue receives blood supply from the left anterior descending artery [4]. Type II rupture involves the pathological finding of an infarcted septum and subsequent coagulation necrosis, which is a dry denaturation of proteins due to a lack of oxygen. Coagulation necrosis will progress to thinning and weakening of the septum, which takes approximately three to five days after an acute myocardial infarction, thus the presentation is typically subacute. Type III ruptures are more frequently encountered in patients that do not receive reperfusion therapy and occur due to perforation of a thinned, aneurysmal myocardial septum during the late post MI period [5].

The clinical presentation of VSR varies from asymptomatic murmur to advanced cardiogenic shock; however, a holosystolic murmur is heard in virtually all cases. Regarding diagnostic studies, echocardiography will likely demonstrate right ventricular dilatation and pulmonary hypertension due to the shunting of blood. When views are difficult or limited via a transthoracic echocardiogram, a transesophageal echocardiogram can be obtained. Cardiac catheterization in hemodynamically stable patients can illustrate a step up of oxygen between the right atrium and right ventricle and can help differential ventricular septal rupture from mitral regurgitation.

Acute treatment involves vasodilators to reduce afterload and potentially decrease the left to right shunting. However, in patients with low cardiac output, an intra-aortic balloon pump is vital for temporary hemodynamic support. Achieving hemodynamic stability prior to surgical treatment is beneficial; nevertheless, stabilization should not take priority over surgical repair, as this has been shown to have poor outcomes [6]. Medical therapy alone has a 90% mortality rate, and the current guidelines of the American College of Cardiology and American Heart Association recommend immediate surgical intervention regardless of the patient’s hemodynamic status [7].

Our patient exhibited a post-myocardial infarction VSR with presentation 3 months after symptom onset. He had resolution of his symptoms and was hemodynamically stable after surgical intervention. Not only are post-infarct VSRs rare in today’s era of reperfusion therapy, his survival, in a time frame with such high mortality rates, is what makes this case extremely unique. This case demonstrated that physicians should still carry a high suspicion for VSR as swift surgical intervention is crucial to increase survival of the deadliest complications of an MI.

References

  1. Moreyra AE, Huang MS, Wilson AC, Deng Y, Cosgrove NM, et al. (2010) Trends in incidence and mortality rates of ventricular septal rupture during acute myocardial infarction. Am J Cardiol 106: 1095-1100. [crossref]
  2. Crenshaw BS, Granger CB, Birnbaum Y, Pieper KS, Morris DC, et al. (2000) Risk factors, angiographic patterns, and outcomes in patients with ventricular septal defect complicating acute myocardial infarction. GUSTO-I (Global Utilization of Streptokinase and TPA for Occluded Coronary Arteries) Trial Investigators. Circulation 101: 27-32. [crossref]
  3. Lundblad R, Abdelnoor M, Geiran OR, Svennevig JL (2009) Surgical repair of postinfarction ventricular septal rupture: risk factors of early and late death. J Thorac Cardiovasc Surg 137: 862-868. [crossref]
  4. Mubarik A, Iqbal AM (2021) Ventricular Septal Rupture In: StatPearls [Internet]. Treasure Island (FL): StatPearls Publishing; 2021 Jan-. Available from: https://www.ncbi.nlm.nih.gov/books/nbk534857/
  5. Goyal A, Menon V (2018) Contemporary Management of Post-MI Ventricular Septal Rupture. American College of Cardiology.
  6. Heitmiller R, Jacobs ML, Daggett WM (1986) Surgical management of postinfarction ventricular septal rupture. Ann Thorac Surg 41: 683-691. [crossref]
  7. Cannon CP, Brindis RG, Chaitman BR, et al. (2013) ACCF/AHA key data elements and definitions for measuring the clinical management and outcomes of patients with acute coronary syndromes and coronary artery disease: a report of the American College of Cardiology Foundation/American Heart Association Task Force on clinical data standards. J Am Coll Cardiol 61: 992-1025. [crossref]

Review of Diabetes Mellitus in Relation to Pancreatic Cancer

DOI: 10.31038/CMCRR.2021111

Abstract

Pancreatic cancer (PC) and diabetes mellitus (DM) represent major research involvement worldwide. In the last few years, several clinical studies have confirmed that DM progression has a key role in the development of PC. In this mini-review, we analyze the current epidemiological data, in addition to the basic structural and physiological properties of pancreatic cancer tissue, and the relationship of cellular mechanisms between DM and subtypes of PC. We discuss current findings, as well as offer perspectives on proteomics and biomarker research.

Keywords

Biomarker, Diabetes mellitus, Glycosylated biomarker, Pancreatic cancer, Pancreatic ductal adenocarcinoma, PDAC subtypes

Background

Global Epidemiology of Pancreatic Cancer

Today’s statistical studies implicate that PC is the fourth leading cause of death among all the cancers, and is even projected to become the second leading cause of death in the coming years [1]. For this highly aggressive and devastating malignancy it is known that pancreatic cancer’s incidence and mortality patterns differ among populations. Overall clinical data show 93% pancreatic cancers are exocrine adenocarcinoma with the remainder (7%) being pancreatic neuroendocrine tumors. Pancreatic ductal adenocarcinoma (PDAC) remains highly lethal with a 5-year survival rate of 8.2% in United States and Europe [1,2] (American Cancer Society; https://www.cancer.org). ASCO guidelines for the management of locally advanced pancreatic (LAPC) with an expected 5-year overall survival rate of less than 5% are more limited than for a potentially curable disease, and much more so for metastatic pancreatic cancer whose patients have less than 1-year median life expectancy with the 5-year overall survival rate of only 2% [3].

It is estimated that during 2020 in the United States, 57,600 adults (30,400 men and 27,200 women) will be diagnosed with PC, 3-7% of all cancers in the US population [4]. Whereas Europe and the European Union (40 total countries) comprise 9% of the world population, the region has a 25% share of the global cancer (burden) and thus provides key cancer planning programs (European Network of Cancer Registries, ENCR, www.encr.eu and United Nations, population division, World Population Prospects, https://esa.un.org/unpd/wpp/). In 2018, estimated incidence of new PC cases and deaths for both sexes is 3.4% of the population and the mortality rate is estimated as 6% for males, 7.4% for the females [5]. Interestingly, pancreatic cancer incidence is 6.95% whereas the mortality rate shows an increasing trend (6.28%) in China where it could be related to the socioeconomic development in addition to an increasing aging population [6,7]. These worldwide statistics point to an urgent need for an early stage pancreatic cancer detection to identify precursors that are destined to progress to malignancy.

What Are The Risk Factors and Causes?

Several risk factors, such as age, genetics, lifestyle and environmental factors are linked to pancreatic cancer progression [4,8]. Pancreatic cancer is seen as hereditary and the non-hereditary form, known as sporadic. The risk of pancreatic cancer is higher in persons with a family history of Peutz-Jeghers syndrome (MIM#175200), Lynch syndrome/hereditary non-polyposis colorectal cancer (HNPCC; MIM#120435), familial adenamotous polyposis-FAP (MIM #616415), familial atypical multiple mole melanoma syndrome (MIM#155600) which are the hereditary forms seen in 5 to 10% of all cases. Now it is recommended that all diagnoses of pancreatic cancer include germline testing that may indicate a hereditary predisposition to pancreatic cancer [9]. When we look at the non-hereditary or sporadic forms of pancreatic cancer; several risk factors are playing major roles in the pathogenesis. The main factors are identified as age (>75%), smoking (cigarettes, cigars, pipes and chewing tobacco; 20%), obesity (>10%), chronic pancreatitis (long term inflammation of the pancreas;1%), diabetes, gallstones, metabolic syndrome, red meat, and exposure to high energy radiation (X-rays, gamma rays) [8]. Most of the patients (80-85%) are diagnosed with locally advanced or metastatic disease but only, 15-20% are diagnosed in an early stage allowing them to undergo surgical resection [10].

To date, our lack of understanding of the cellular biology of the PDAC has prevented the development of truly effective therapies and clinically useful pathogenesis markers for early screening the disease [11]. Thus, of the risk factors, we all know that DM (MIM# 222100, 125853) is a key player in the progression of PC [8].

What is the Relationship between Diabetes Mellitus and Pancreatic Cancer?

Structure of the Pancreas

A well-known glandular organ, the pancreas is a pear-shaped gland located quite high up in the abdomen between the stomach and spine and is part of the digestive system. It lies across the body where the ribs meet at the bottom of the breastbone, just behind the stomach. It is about 6 inches (15 centimeters) long. In embryogenesis, the pancreas is derived from the embryonic foregut region of the epidermal germ layer. Its main structure consists of 3 parts: the wide end called the head; the thin end is the tail and the part in the middle is the body as seen in Figure 1. The main function is to maintain the homeostasis of the body by producing hormones that regulate blood glucose levels, as well as enzymes that function in digestion [12].

fig 1

Figure 1: Cellular progression model of PDAC.

The pancreas has 2 major components; the exocrine part is made up of ducts and small sacs called acini on the end of the ducts, which secrete enzymes that are released into the small intestine. The endocrine part is made up of cells, called the islets of Langerhans, which makes the most important hormone insulin secreted by the beta cells. Insulin is considered the main anabolic hormone of the body. Other beta cell secretagogues are glucagon, somatostatin, pancreatic polypeptide (PP), and vasoactive intestinal peptide (VIP) all which play important roles in regulating metabolism. We know that cancers arise from both exocrine and endocrine regions and are different and cause various symptoms.

Two types of pancreatic cancers (PC) are known. Exocrine tumors are the most common type and are known as adenocarcinoma. These tumors usually start in the ducts of the pancreas and are termed ductal adenocarcinoma (Pancreatic ductal adenocarcinoma, PDAC) which are more common today: it is projected that this pancreatic cancer type will be the second highest cause of cancer related deaths by 2030 in USA [3,12]. Much less commonly, if the tumor begins in the acini, it is known as acinar adenocarcinoma. An increasingly common diagnosis is seen as intraductal papillary mucinous neoplasm (IPMN). An IPMN is a tumor that grows within the ducts of the pancreas and makes a thick fluid called mucin. Much rarer types of exocrine pancreatic tumors include: acinar cell carcinoma, adeno-squamous carcinoma, colloid carcinoma, giant cell tumor, hepatoid carcinoma, mucinous cystic neoplasms, pancreato-blastoma, serous cystadenoma, signet ring cell carcinoma, solid and pseudopapillary tumors, squamous cell carcinoma, and finally, undifferentiated carcinoma [13]. The endocrine tumors are called pancreatic neuroendocrine tumors (PNETs) or islet cell tumors. They are much less common than exocrine tumors, making up about 7% of all pancreatic cancers. A pancreatic neuroendocrine tumor can be functioning or nonfunctioning, meaning a functioning tumor produces hormones [14]. The American Society of Clinical Oncology (ASCO) has issued a series of guidelines on the management of potentially curable, locally advanced unresectable, and metastatic pancreatic cancers [3].

Early genetic studies of pancreatic cancer have clearly stated that the activating K-ras mutations, inactivating mutations or deletions in the TP53, CDKN2A, and SMAD4 tumor suppressor genes lead to the progression of PDAC [15-17]. By the use of next generation sequencing techniques such as whole genome and deep-exome sequencing analyses, valuable comprehensive genomic data is collected. These advanced studies clarified for us the molecular and cellular heterogeneity based on the different transcriptional networks (gene expression profile) which are playing roles in the pathogenesis of PDAC [18]. Based on the defined transcriptomic gene programs, such as signaling pathways (K-ras, TGFβ, NOTCH) and cellular mechanisms (cell cycle, DNA repair, RNA processing) applied to a large cohort of patients’ data, four PDAC subtypes were identified. Thus, in 2018 Torres et al. stated that identification of the PDAC subtypes [Squamous type (31%), pancreatic progenitor type (19%), immunogenic type (29%) and aberrantly differentiated endocrine exocrine (ADEX type (21%)] will be helpful for personalized diagnosis and individualized treatment dealing with the molecular and cellular heterogeneity of PDAC [19,20]. Interestingly, only the ADEX subtype shows the endocrine and exocrine dysfunction which may be linked to DM and PC pathogenesis [15,18-20].

From the clinical perspective, in clinical suspicion of pancreatic cancer within the frame of ASCO guidelines, the general algorithm for the evaluation of a patient starts with the multidisciplinary review of various diagnostic imaging modalities, such as computed tomography (CT or CAT) scan, positron emission tomography (PET) scan or PET-CT scan, magnetic resonance imaging (MRI), transabdominal ultrasound, endoscopic ultrasound (EUS), endoscopic retrograde cholangiopancreatography (ERCP) and percutaneous transhepatic cholangiography (PTC) used with tissue biopsies in addition to blood testing. Applied biopsy and tissue testing which include fine needle aspiration (FNA) and core needle biopsy sampling from the pancreas, have importance to make the diagnosis. To this date, there is no reliable early diagnostic marker to detect the progression of pancreatic cancer [21-25].

Since 2016 ASCO experts have issued a series of recommendations for the management of pancreatic cancer tailored to the stage of the disease [3]. In general a system is used for the results from diagnostic tests, scans, and surgery to answer these questions: Stage 1A, 1B, 2, 3 and 4 mean the size of the cancer and whether it has spread (stages 1 to 4). The numbering system is termed TNM standing for ‘Tumor, Node, Metastases’ to indicate the stage of cancer [13]. In the classification of human PanIN (pancreatic intraepithelial neoplasia) progression from the normal duct has key morphological characteristics as well as accumulation of genetic mutations in identified nuclear genes, such as KRAS, CDKN2A, TP53, SMAD4 and BRCA2 [26]. Based on the histological features, progression to pancreatic adenocarcinoma (PDAC) is defined by invasion of tumor epithelial cells through the basement membrane. Schematic representation of normal exocrine pancreas cells, and transitioning of dysplastic PanIN and PDAC is shown in Figure 1.

The Pancreas and Insulin

“The pancreas makes insulin. Insulin keeps the level of sugar in the blood at a stable level. This means that the body cells get enough food, but not too much. The pancreas makes and releases more insulin if the level of sugar in the blood is high. If the level is too low, it releases less. You have diabetes if you don’t make enough insulin” [27]. This simple statement emphasizes the major impact of the pancreas in DM, consequence of the lack of pancreatic substance transported by the blood stream. This original discovery made by Oscar Minkowski in 1889, is the most important one in the history of diabetes, and a monument in medical research [27]. Diabetes Mellitus is presently classified into two main forms, type 1 (MIM#222100) and type 2 (MIM#125853) diabetes, however type 2 diabetes (T2D) is heterogenous. Autoantibodies against pancreatic islet B-cell antigens is present in type 1 diabetes which is diagnosed at young ages. Type 2 is more prevalent as 75-85% of patients are classified with this form. In addition to type 1 and 2 forms, pancreatic cancer-induced diabetes is another form and is classified as pancreatogenic type 3c diabetes mellitus (T3cDM) which accounts for <10% of all diabetes cases. The underlying physiopathology of T3c DM and PC is still poorly understood [28-30].

Clinical classification and molecular subtyping studies done in recent years have not yet been incorporated into a revision of diabetes classification. In 2018, Groop et al. in Lund University identified five clusters of DM patients with different characteristics and risks of complications in four separate populations (n=14755 in Sweden and Finland). Individuals more resistant to insulin (cluster 3) had significantly higher risk of diabetic kidney disease than individuals in clusters 4 and 5. Individuals in cluster 2, insulin deficient, have the higher risk of retinopathy. Based on this group classification, genetic associations Single Nucleotide Polymorphism Analysis (SNP analysis) in the clusters differed from those seen in traditional T2D [31]. It is strongly stated that, by the use of this clustering/classification system, patients can be identified at high risk of diabetic complications at diagnosis and information about the underlying mechanisms, will guide the choice of therapy [31,32]. More clinical data collected from other ethnicities in larger cohorts will help to make a better classification of diabetes subtypes, as it is a heterogenous metabolic disorder [33,34].

Based on the biological complexity of PC, a bidirectional relationship between DM and PC has been identified, since 2005 [35]. As stated earlier, many recent studies have concluded that DM is both a consequence, as well as, a cause for PC [36]. Overall, studies report that most patients with pancreatic cancer have hyperglycemia or diabetes. Similarly, patients with new-onset diabetes have an escalated risk of being diagnosed with pancreatic cancer. The connection between PC and DM has been explained by several translational, clinical and epidemiological studies. The largest original epidemiological studies showed clearly that new-onset hyperglycemia and DM are early signs of PC [28,30,35,36]. As PC is usually diagnosed at the late stage of the disease, given the overall 5 year survival rate is less than 5%, the duration of survival actually depends on the histological TNM grading of tumor and the resection ratio [29,37,38]. Based on time-risk relationship, progressive beta-cell failure in long-standing T2D is definitely a risk factor for PDAC [14,39].

Diabetes Mellitus and Pancreatic Cancer Association at the Cellular Level

In general, diabetes is known as a multifactorial/polygenic and deficient carbohydrate metabolism disease which is characterized by hyperglycemia due to the defect in insulin secretion or action, or both. Recent epidemiological studies, and meta-analyses examining the association between the diabetes mellitus and pancreatic cancer indicate that; there is a multidirectional relationship between T2D and PC. Long-standing diabetes is an increased risk factor (1.5 to 2 fold) for PC; and new-onset diabetes (type 3c) is a possible clinical marker of asymptomatic pancreatic cancer [30,35,36,40]. DM, being the most significant disorder of glucose metabolism and as DM is genetically heterogeneous, variants of more than 50 nuclear genes have been found for the genetic risk by genome-wide association studies [16,39]. From the clinical perspective, the main symptoms are polyuria, polydipsia, weight loss, polyphagia, and blurred vision [41].

Type 1 Diabetes (T1D) is the result of destruction of the beta cells that leads to insulin deficiency, whereas T2D is the defect in insulin secretion caused by insulin resistance in the cells that leads to insulin over secretion then to insulin deficiency. Other known diabetes types are associated with the nuclear gene defects of beta cells such as MODY (Maturity onset diabetes of the young; MIM#125853), MELAS (Mitochondrial encephalopathy, lactic acidosis, and stroke -like episodes; MIM#540000) and endocrinopathies [34].

To date, several characteristics are identified in genetically engineered mouse models and summarized below for the association of DM and PC. Overall possible mechanisms could be due to mechanical defects, mechanical obstruction and/or enlargement of pancreatic ducts [11,42]; glycogen synthesis defects which are caused by the post-insulin receptor defects and glycogen storage [42]; plasma glucagon levels and islet amyloid polypeptide [39,43]; presence of K-ras codon 12 mutations (p.G12D;p.G12V) [4,13]; prognostic factors as tumor sizes and molecular factors [13]; increased levels of Insulin Growth Factor 1 (IGF-1) and its receptor in promoting carcinogenesis [36,39,44]; activation of Transforming Growth Factor (TGF-β) signaling and depletion of β-cells in Langerhans islets [45,46]; hyperglycemia induced levels of hydrogen peroxide that up regulates manganese superoxide dismutase (SOD2) expression that activates ERK and p38MAPK pathways, NF-kP and AP-1 transcription factors [25,47] and hyperglycemia induced levels of glycation end products that increases inflammation and metastatic ability, increased cytokines and receptors like epidermal growth factor (EGF), epidermal growth factor receptor (EGFR), Glial cell line derived neutrophilic factor (GDNF) [36,46,48] are potentially involved mechanisms in the pathobiology of pancreatic cancer [13,15,38,46,49-51].

Based on all these pathobiological measurements of the subtypes of diabetes mellitus, it is likely that a combination of blood-based biomarkers in correlation with the clinical/pathologic characteristics of diabetic patients could be very useful in early cancer detection and further studies should be done. Today, no blood-based biomarker is currently validated to differentiate between T2D or other cancer associated DM. Therefore, only 4 potential biomolecules are used in clinical practice currently. These are, Vanin-1 (VNN1), Adrenomedullin, CA19-9, and CEA, the ‘analytes’ that are used in clinical studies, so far [10,11,36,50,52].

A novel cell surface molecule that is involved in the thymus homing of bone marrow cells, is Vanin-1 which functions as a member of the biotinidase branch of the nitrilase superfamily. It is a glycosylphosphatidylinositol (GPI)-anchored molecule. In 1996, Aurrand-Lions et al. reported the cDNA cloning and functional analysis of mouse vanin-1, afterwards in 1998, Galland et al. identified cDNAs encoding human vanin-1 (VNN1; vascular noninflammatory molecule-1), which is located on human gene 6q21-q24. It is suggested that vanin-1 regulates late adhesion steps of thymus homing under physiologic, noninflammatory conditions. Elevated vanin-1 expression and activity serve a biomarker for pancreatic cancer associated new-onset diabetes [52]. Recently, novel heteroaromatic compounds as inhibitors of vanin-1 are used for the treatment of cancer and inflammatory diseases [53].

Another used biomarker is Adrenomedullin (ADM) which is a hypotensive, multifunctional regulatory peptide. It is found in human pheochromocytoma, consists of 52 amino acids and shows slight homology with the calcitonin gene-related peptide which is located on chromosome 11p15.2. ADM gene (consists of 4 exons) is located on chromosome 11p15.4, and encodes for a preprohormone, which is post-translationally processed to generate 2 biologically active peptides: adrenomedullin and proadrenomedullin N-terminal 20 peptide (PAMP). The latter may serve as a hormone in circulation because it is found in blood in a considerable concentration. Most importantly, adrenomedullin exerts paracrine effects on pancreatic β cells impairing insulin secretion, causing glucose intolerance, and thus leads to β cell dysfunction [54]. Studies strongly support that ADM is highly expressed in pancreatic cancer and stimulates pancreatic cancer cells leading to increased tumor growth and metastasis. ADM would be a possible target for pancreatic cancer treatment [50].

Presently, CA19-9 is an established biomarker, and is a modified Lewis A glycan blood group antigen, a component of glycoproteins and mucins. It is a tetra-saccharide, usually attached to O-glycans on the surface of cells. It is currently used in monitoring patients for PDAC progression and/or after surgical resection [55-57]. However, because of differences in the antibody specificities or differences in the assay platforms, the CA19-9 detection results are inconsistent [58].

In addition to CA19-9, the carcinoembryonic antigen (CEA) (MIM#109770; NC_000019.10) is another well-known biomarker in many cancers. The CEA gene family belongs to the immunoglobulin superfamily and is located on chromosome 19q13.1-q13.2. It is a diverse set of secreted highly glycosylated glycoproteins. Members of the CEA family consist of a single N domain, with structural homology to the immunoglobulin variable domains, followed by a variable number of immunoglobulin constant-like A and/or B domains. Based on sequence similarity and functional characteristics, the CEA family has been subdivided into the CEA subgroup and the pregnancy-specific glycoprotein (PSG) subgroup. The order of these 9 CEA subgroup genes is CEACAM4, CEACAM7, CEACAM5, CEACAM6, CEACAM3, CEACAM1, CEACAMP2, CEACAM8 and CEACAM to telomere organization [59,60]. However, genes in the CEA and PSG subgroups have a similar gene structure and organization. Both have multiple cellular activities, including roles in the differentiation and arrangement of tissue three-dimensional structure, angiogenesis, apoptosis, tumor suppression, metastasis, and the modulation of innate and adaptive immune responses. Thus, due to its multiple transcript variants, CEA is one of the most clinically useful biomarkers in PDAC, so far [55].

Most of the published papers have shown that CA19-9 and CEA are the potential preferred glycans for monitoring the disease progression because of higher specificity/sensitivity for pancreatic cancer [48,58,61]. It is evident that aberrant glycosylation patterns of cell surface and secreted glycoproteins occur during malignant transformation and cancer progression as a “hallmark of cancer”. This enzymatic process produces glycosidic linkages of saccharides to other saccharides, lipids, or proteins which can affect the activity and localization of proteins/transmembrane proteins involved in cell-cell adhesion [48,61]. Recently, it has been noted that N-glycosylation profiles or the ‘N-glycome’ of the potential protein biomarkers or panels of biomarkers are emerging as potential therapeutic targets in the various types/subtypes of diabetes [62,63]. In light of this, we believe that more hyperglycemia induced levels of glycosylated protein biomarkers will be found and helpful to understand the association of subtype-diabetes with subtype-pancreatic cancer in future. This can be a tool for personalized medicine in the future, as well.

Conclusions

Although the relationship between diabetes mellitus and pancreatic cancer is an innovative and inspiring field of research, several clinical points warrant more clarification. At present, the relationship/association between PC and DM is not well established. The reason for this unsolved relationship might be the complex nature of both diseases, e.g., various types of Diabetes and subtypes of pancreatic cancers. However, due to the aggressive nature of PC and the lack of blood-based biomarkers, glycosylated molecules represent a promising tool to help in the development of prediction, monitoring and treating agents (therapeutics) to improve low survival rates. Based on N-glycome profiling, large scale clinical studies need to be explored in classified DM patients in correlation with subtyped PC patients. Taken together based on the epidemiological data reflecting the alarming increase in worldwide obesity, there is an urgent need for improved understanding of the molecular pathology that can be utilized to develop novel blood based biomarkers and new therapies for pancreatic cancer.

Abbreviations

PC: Pancreatic Cancer; DM: Diabetes Mellitus; PP: Pancreatic Polypeptide; VIP: Vasoactive Intestinal Peptide; PDAC: Pancreatic Ductal AdenoCarcinoma; IPMN: Intraductal Papillary Mucinous Neoplasm; PNET: Pancreatic NeuroEndocrine Tumors; ASCO: American Society of Clinical Oncology; ADEX: Aberrantly differentiated Endocrine Exocrine; CT, CAT: Computed Tomography; PET: Positron Emission Tomography; MRI: Magnetic Resonance Imaging; EUS: Endoscopic Ultrasound; ERCP: Endoscopic Retrograde Cholangiopancreatography; PTC: Percutaneous Transhepatic Cholangiography; FNA: Fine Needle Aspiration; PanIN: Pancreatic Intraepithelial Neoplasia; LAPC: Locally Advanced Pancreatic; HNPCC: Hereditary Non-polyposis Colorectal Cancer; FAP: Familial Adenamotous Polyposis; T1D: Type 1 Diabetes; T2D: Type 2 Diabetes; T3cDM: Type 3c Diabetes Mellitus; MODY: Maturity Onset Diabetes of the Young; MELAS: Mitochondrial Encephalopathy, Lactic Acidosis, and Stroke-like Episodes; IGF-1: Insulin Growth Factor 1; TGF–β: Transforming Growth Factor; SOD2: Superoxide Dismutase; EGF: Epidermal Growth Factor; EGFR: Epidermal Growth Factor receptor; GDNF: Glial Cell Line Derived Neutrophilic Factor; VNN1: Vanin-1, Vascular Noninflammatory molecule-1; GPI:Glycosylphosphatidylinositol; ADM: Adrenomedullin; PAMP: Proadrenomedullin; CEA: CarcinoEmbryonic Antigen.

Declarations

Author’s Contributions

Ozge Alper drafted and reviewed the manuscript. Saeyoung Nate Ahn reviewed the manuscript. Martha Knight reviewed and edited the manuscript. Ozgul M Alper wrote and reviewed the manuscript. All authors read and approved the final manuscript.

References

  1. Raimondi S, Maisonneuve P, Lowenfels AB (2009) Epidemiology of pancreatic cancer: an overview. Nat Rev Gastroenterol Hepatol 6: 699-708. [crossref]
  2. Siegel RL, Miller KD, Jemal A (2017) Cancer Statistics. CA Cancer J Clin 67: 7-30. [crossref]
  3. Khorana AA, Pamela B Mangu, Jordan Berlin, Anitra Engebretson, Theodore S Hong, et al. (2017) Potentially Curable Pancreatic Cancer: American Society of Clinical Oncology Clinical Practice Guideline Update. J Clin Oncol 35: 2324-2328. [crossref]
  4. Idachaba S, Oluwafemi Dada, Olalekan Abimbola, Olamide Olayinka, Akunnaya Uma, et al. (2019) A Review of Pancreatic Cancer: Epidemiology, Genetics, Screening, and Management. Open Access Maced J Med Sci 7: 663-671. [crossref]
  5. Ferlay J, Colombet M, Soerjomataram I, Dyba T, Randi G, et al. (2018) Cancer incidence and mortality patterns in Europe: Estimates for 40 countries and 25 major cancers in 2018. Eur J Cancer 103: 356-387. [crossref]
  6. Jia X, Peiling Du, Kusheng Wu, Zhenxi Xu, Jiaying Fang, et al. (2018) Pancreatic Cancer Mortality in China: Characteristics and Prediction. Pancreas 47: 233-237. [crossref]
  7. Zhao C, Feng Gao, Quwen Li, Qicai Liu, Xinhua Lin, et al. (2019) The Distributional Characteristic and Growing Trend of Pancreatic Cancer in China. Pancreas 48: 309-314. [crossref]
  8. McLaughlin S (1994) Pancreatic cancer and diabetes. Diabetes Educ 20: 20, 24, 26. [crossref]
  9. Klein AP, Kieran A Brune, Gloria M Petersen, Michael Goggins, Anne C Tersmette, et al. (2004) Prospective risk of pancreatic cancer in familial pancreatic cancer kindreds. Cancer Res 64: 2634-2638. [crossref]
  10. Guo Q, Muxing Kang, Bo Zhang, Ying Chen, et al. (2010) Elevated levels of CA 19-9 and CEA in pancreatic cancer-associated diabetes. J Cancer Res Clin Oncol 136: 1627-1631. [crossref]
  11. Zhang L, Sanagapalli S, Stoita A (2018) Challenges in diagnosis of pancreatic cancer. World J Gastroenterol 24: 2047-2060. [crossref]
  12. Roder PV, Bingbing Wu, Yixian Liu, Weiping Han, et al. (2016) Pancreatic regulation of glucose homeostasis. Exp Mol Med 48: e219. [crossref]
  13. Yachida S, Iacobuzio-Donahue CA (2009) The pathology and genetics of metastatic pancreatic cancer. Arch Pathol Lab Med 133: 413-422. [crossref]
  14. Vincent A, Joseph Herman, Rich Schulick, Ralph H Hruban, Michael Goggins, et al. (2011) Pancreatic cancer. Lancet 378: 607-620. [crossref]
  15. Aguirre AJ, Collisson EA (2017) Advances in the Genetics and Biology of Pancreatic Cancer. Cancer J 23: 315-320. [crossref]
  16. Giri B, Vrishketan Sethi, Vikas Dudeja, Sulagna Banerjee, Alan Livingstone, et al. (2017) Genetics of pancreatic cyst-cancer progression: standing on the shoulders of giants. Curr Opin Gastroenterol 33: 404-410. [crossref]
  17. Bhosale P, Veronica Cox, Silvana Faria, Sanaz Javadi, Chitra Viswanathan, et al. (2018) Genetics of pancreatic cancer and implications for therapy. Abdom Radiol (NY) 43: 404-414. [crossref]
  18. Bailey P, David K Chang, Katia Nones, Amber L Johns, Ann-Marie Patch, et al. (2016) Genomic analyses identify molecular subtypes of pancreatic cancer. Nature 531: 47-52. [crossref]
  19. Pishvaian MJ, Brody JR (2017) Therapeutic Implications of Molecular Subtyping for Pancreatic Cancer. Oncology (Williston Park) 31: 159-166, 168. [crossref]
  20. Torres C, Grippo PJ (2018) Pancreatic cancer subtypes: a roadmap for precision medicine. Ann Med 50: 277-287. [crossref]
  21. Kunovsky L, Pavla Tesarikova, Zdenek Kala, Radek Kroupa, Petr Kysela, et al. (2018) The Use of Biomarkers in Early Diagnostics of Pancreatic Cancer. Can J Gastroenterol Hepatol 2018: 5389820. [crossref]
  22. Jelski W, Mroczko B (2019) Biochemical diagnostics of pancreatic cancer – Present and future. Clin Chim Acta 498: 47-51. [crossref]
  23. Litman-Zawadzka A, Lukaszewicz-Zajac M, Mroczko B (2019) Novel potential biomarkers for pancreatic cancer – A systematic review. Adv Med Sci 64: 252-257. [crossref]
  24. Shen GQ, Essa M Aleassa, Matthew Walsh R, Gareth Morris-Stiff (2019) Next-Generation Sequencing in Pancreatic Cancer. Pancreas 48: 739-748. [crossref]
  25. Singhi AD, Eugene J Koay, Suresh T Chari, Anirban Maitra (2019) Early Detection of Pancreatic Cancer: Opportunities and Challenges. Gastroenterology 156: 2024-2040. [crossref]
  26. Hezel AF, Alec C Kimmelman, Ben Z Stanger, Nabeel Bardeesy, Ronald A Depinho, et al. (2006) Genetics and biology of pancreatic ductal adenocarcinoma. Genes Dev 20: 1218-1249. [crossref]
  27. Luft R (1989) Oskar Minkowski: discovery of the pancreatic origin of diabetes, 1889. Diabetologia 32: 399-401. [crossref]
  28. Pannala R, Ananda Basu, Gloria M Petersen, Suresh T Chari, et al. (2009) New-onset diabetes: a potential clue to the early diagnosis of pancreatic cancer. Lancet Oncol 10: 88-95. [crossref]
  29. Hart PA, Chari ST (2013) Diabetes mellitus and pancreatic cancer: why the association matters? Pancreas 42: 1207-1209. [crossref]
  30. Hart PA, Melena D Bellin, Dana K Andersen, David Bradley, Zobeida Cruz-Monserrate, et al. (2016) Type 3c (pancreatogenic) diabetes mellitus secondary to chronic pancreatitis and pancreatic cancer. Lancet Gastroenterol Hepatol 1: 226-237. [crossref]
  31. Ahlqvist E, Petter Storm, Annemari Käräjämäki, Mats Martinell, Mozhgan Dorkhan, et al. (2018) Novel subgroups of adult-onset diabetes and their association with outcomes: a data-driven cluster analysis of six variables. Lancet Diabetes Endocrinol 6: 361-369. [crossref]
  32. Zaharia OP, Pavel Bobrov, Klaus Strassburger, Kálmán Bódis, Yanislava Karusheva, et al. (2018) Metabolic Characteristics of Recently Diagnosed Adult-Onset Autoimmune Diabetes Mellitus. J Clin Endocrinol Metab 103: 429-437. [crossref]
  33. Lindholm E, Agardh E, Tuomi T, Groop L, Agardh CD (2001) Classifying diabetes according to the new WHO clinical stages. Eur J Epidemiol 17: 983-989. [crossref]
  34. Petersmann A, Dirk Müller-Wieland, Ulrich A Müller, Rüdiger Landgraf, Matthias Nauck, et al, (2019) Definition, Classification and Diagnosis of Diabetes Mellitus. Exp Clin Endocrinol Diabetes 127: S1-S7. [crossref]
  35. Chari ST, Cynthia L Leibson, Kari G Rabe, Jeanine Ransom, Mariza de Andrade, et al. (2005) Probability of pancreatic cancer following diabetes: a population-based study. Gastroenterology 129: 504-511. [crossref]
  36. Pizzato M, Federica Turati, Valentina Rosato, Carlo La Vecchia (2019) Exploring the link between diabetes and pancreatic cancer. Expert Rev Anticancer Ther 19: 681-687. [crossref]
  37. Lerch MM, Julia Mayerle, Ujjwal Mahajan, Matthias Sendler, Ulrich Weiss F, et al. (2016) Development of Pancreatic Cancer: Targets for Early Detection and Treatment. Dig Dis 34: 525-531. [crossref]
  38. Khadka R, Weijun Tian, Xin Hao, Rakshya Koirala (2018) Risk factor, early diagnosis and overall survival on outcome of association between pancreatic cancer and diabetes mellitus: Changes and advances, a review. Int J Surg 52: 342-346. [crossref]
  39. Andersen DK, Murray Korc, Gloria M Petersen, Guido Eibl, Donghui Li, et al. (2017) Diabetes, Pancreatogenic Diabetes, and Pancreatic Cancer. Diabetes 66: 1103-1110. [crossref]
  40. Wang F, Gupta S, Holly EA (2006) Diabetes mellitus and pancreatic cancer in a population-based case-control study in the San Francisco Bay Area, California. Cancer Epidemiol Biomarkers Prev 15: 1458-1463. [crossref]
  41. Mettu NB, Abbruzzese JL (2016) Clinical Insights Into the Biology and Treatment of Pancreatic Cancer. J Oncol Pract 12: 17-23. [crossref]
  42. Li J, Gang Cao, Qingyong Ma, Han Liu, Wei Li, et al. (2012) The bidirectional interation between pancreatic cancer and diabetes. World J Surg Oncol 10: 171. [crossref]
  43. Brand RE, Xian-Zhong Ding, Christine M Young, Thomas E Adrian (2002) The specificity of amylin for the diagnosis of pancreatic adenocarcinoma. Int J Gastrointest Cancer 31: 123-128. [crossref]
  44. Andersen DK (2013) Diabetes and cancer: placing the association in perspective. Curr Opin Endocrinol Diabetes Obes 20: 81-86. [crossref]
  45. Parajuli P, Thien Ly Nguyen, Céline Prunier, Mohammed S Razzaque, Keli Xu, et al. (2020) Pancreatic cancer triggers diabetes through TGF-beta-mediated selective depletion of islet beta-cells. Life Sci Alliance 3: e201900573. [crossref]
  46. Poston GJ, Gillespie J, Guillou PJ (1991) Biology of pancreatic cancer. Gut 32: 800-812. [crossref]
  47. Murtaugh LC (2014) Pathogenesis of pancreatic cancer: lessons from animal models. Toxicol Pathol 42: 217-228. [crossref]
  48. Munkley J (2019) The glycosylation landscape of pancreatic cancer. Oncol Lett 17: 2569-2575. [crossref]
  49. Hruban RH, Goggins M, Parsons J, Kern SE (2000) Progression model for pancreatic cancer. Clin Cancer Res 6: 2969-2972. [crossref]
  50. Aggarwal G, Vijaya Ramachandran, Naureen Javeed, Thiruvengadam Arumugam, Shamit Dutta, et al. (2012) Adrenomedullin is up-regulated in patients with pancreatic cancer and causes insulin resistance in beta cells and mice. Gastroenterology 143: 1510-1517 e1. [crossref]
  51. Eijgenraam P, Heinen MM, Verhage BAJ, Keulemans YC, Schouten LJ, et al. (2013) Diabetes type II, other medical conditions and pancreatic cancer risk: a prospective study in The Netherlands. Br J Cancer 109: 2924-2932. [crossref]
  52. Kang M, Wenjie Qin, Miranbieke Buya, Xin Dong, Wen Zheng, et al. (2016) VNN1, a potential biomarker for pancreatic cancer-associated new-onset diabetes, aggravates paraneoplastic islet dysfunction by increasing oxidative stress. Cancer Lett 373: 241-250. [crossref]
  53. Sabnis RW (2020) Novel Heteroaromatic Compounds as Vanin Inhibitors. ACS Med Chem Lett 11: 1674-1675. [crossref]
  54. Ramachandran V, Thiruvengadam Arumugam, Robert Langley, Rosa F Hwang, Pablo Vivas-Mejia, et al. (2009) The ADMR receptor mediates the effects of adrenomedullin on pancreatic cancer cells and on cells of the tumor microenvironment. PLoS One 4: e7502. [crossref]
  55. Ni XG, Bai XF, Mao YL, Shao YF, Wu JX, et al. (2005) The clinical value of serum CEA, CA19-9, and CA242 in the diagnosis and prognosis of pancreatic cancer. Eur J Surg Oncol 31: 164-169. [crossref]
  56. Ballehaninna UK, Chamberlain RS (2012) The clinical utility of serum CA 19-9 in the diagnosis, prognosis and management of pancreatic adenocarcinoma: An evidence based appraisal. J Gastrointest Oncol 3: 105-119. [crossref]
  57. Huang Z, Liu F (2014) Diagnostic value of serum carbohydrate antigen 19-9 in pancreatic cancer: a meta-analysis. Tumour Biol 35: 7459-7465. [crossref]
  58. O’Brien DP, Neomal S Sandanayake, Claire Jenkinson, Aleksandra Gentry-Maharaj, Sophia Apostolidou, et al. (2015) Serum CA19-9 is significantly upregulated up to 2 years before diagnosis with pancreatic cancer: implications for early disease detection. Clin Cancer Res 21: 622-631. [crossref]
  59. Brandriff BF, Gordon LA, Tynan KT, Olsen AS, Mohrenweiser HW, et al. (1992) Order and genomic distances among members of the carcinoembryonic antigen (CEA) gene family determined by fluorescence in situ hybridization. Genomics 12: 773-779. [crossref]
  60. Thompson J, Zimmermann W, Osthus-Bugat P, Schleussner C, Eades AM -Perner, et al. (1992) Long-range chromosomal mapping of the carcinoembryonic antigen (CEA) gene family cluster. Genomics 12: 761-772. [crossref]
  61. Munkley J, Elliott DJ (2016) Hallmarks of glycosylation in cancer. Oncotarget 7: 35478-35489. [crossref]
  62. Rudman N, Gornik O, Lauc G (2019) Altered N-glycosylation profiles as potential biomarkers and drug targets in diabetes. FEBS Lett 593: 1598-1615. [crossref]
  63. Carmicheal J, Asish Patel, Vipin Dalal, Pranita Atri, Amaninder S Dhaliwal, et al. (2020) Elevating pancreatic cystic lesion stratification: Current and future pancreatic cancer biomarker(s). Biochim Biophys Acta Rev Cancer 1873: 188318. [crossref]

Conversion of IgM to IgG by Lysates of Burkitt’s Lymphoma Cells

DOI: 10.31038/TVI.2021111

Abstract

The immune response progresses by the dissociation of IgM to component IgG’s. What are the factors which guide the maturation? Cell lysates of Burkitt’s lymphoma cells (CRL-1647) strongly reduced IgM to smaller subunits, including those of IgG size with the antigenic identities of IgG. Sepharose column fractionation found them in size classes of 5 kDa to 20 kDa. Further identification of their components may give clues to therapeutic opportunities in the treatment of patients with hyperglobulinemias might result. Do patients lack the factors in 5 kDa to 20 kDa fractions or are their IgM’s deficient in receptors? Do B cells from normal subject contain such factors?

Introduction

The important landmark results of [1] showed that the IgM pentamer is an asymmetrical pentagon with an open groove that binds specific (AIM) protein. It contains one large gap. Other proteins could also bind in this way, perhaps leading to the evolution of single, ie. IgG, species. Here we examined the effects on IgM of protein and cell lysates of a leukemic cell line, CRL-1647. Lysates from 1.5 X l 08 cells were fractionated on Sepharose. The different size fractions were incubated with exogenous IgM to determine which ones could release immunopositive species, determined in Western blot analysis. IgG like proteins ~150 kDa and immunoreactive to IgG were released by fractions in the size range of 20 kDa to 5 kDa. When the fractions were incubated without exogenous IgM, IgG release was not found. Some IgG was found in the 150,000 MW size fraction with or without incubation, as expected, because the crude lysates contain endogeous IgG as well as IgM.

Mass spectroscopy analysis of the 20 kDa to 5 kDa fractions showed that they contained immunoproteins, as well as some proteins with catalytic activity, perhaps responsible for release of IgG from IgM. These experiments may provide clues to cell mechanisms responsible for the increased content of IgG found in Burkitt’s lymphoma cells after lucanthone and ionizing radiation treatment [2,3]. Incubation of exogenous or endogenous IgM with partially purified cell lysates released IgG immunopositive species. Presumably, proteases were responsible for the conversion of the IgM pentamers to IgG monomers, multimers, and fragments. Sepharose fractionation showed that active factor or factors in the conversion resided in 20 kDa to 5 kDa size classes. No detectable IgG was released when these fractions were incubated alone or without IgM. Small specific immunoglobulins were present in these Sepharose fractions, as determined by mass spectroscopy, but they are not known to be a factor in release of IgG. The factors described here might have relevance for certain hematological disorders, such as Waldenstrom’s macroglobulinemia. These patients have abundant serum IgM but little or no IgG. Is there a deficiency of factors such as those described here or are there IgM structural abnormalities in their IgM which render it refractory to normal factors?

Results

Experiments of Figures 1 and 2 showed that factors in lysates of CRL-1647 Burkitt’s lymphoma cells released IgG fragments, upon incubation with IgM. Purified IgM from a multiple myeloma patient or endogenous IgM from the Burkitt’s lymphoma cells served as substrates.

fig 1

Figure 1: Release of IgG reactive protein from exogenous substrate IgM was found in lanes 4-8. Enhancement of release by cell treatment with lucanthone (lanes 6 and 7) or radiation (lane 8) was not found, as with endogenous IgM (Ref #2) without further incubation. The released reactive species were not polydisperse, therefore, suggesting a specific attack on IgM.
Release of IgG fragments from exogenous human myeloma IgM by lysates of Burkitt’s lymphoma cells. Cell lysates were prepared from 3.5 X 10⁷ cells. Lysate contained 0.3 mg/ml in 1 ml final volume, followed by Western blot analysis, as in published Methods, appended. Twenty second exposure of the film.
Lane 1: No lysate. Lane 2: 5 µL of cell lysate incubated at 0°C for 50 minutes without exogenous IgM. Lane 3: 5 µL of cell lysate were incubated at 37°C for 50 minutes without exogenous IgM. Lanes 4 and 5: 5 µL of cell lysate incubated at 37°C for 50 minutes with 10 µL containing 0.45 µg of exogenous IgM. 10 µL of neutral loading buffer was added. Lanes 6 and 7: 5 µL from lucanthone treated cells were incubated at 37°C for 50 min. with 10 µL containing 0.45 µg of exogenous IgM, as above, before loading. Lane 8: 5 µL of cell lysate from cells taken 2 days after 10 Gy were incubated 50 min at 37°C with 0.45 µg of exogenous IgM. Lane 9: 0.45 µg of exogenous IgM in PBS (Fisher: myeloma monoclonal). Lane 10: 0.1 µg of IgG (Biolegend ultraleaf). Western blots were developed from a film exposed for 20 seconds (lanes-4-10). Endogenous IgM and IgG were only detectable after 10 minute exposures. Experiment was repeated twice.

fig 2

Figure 2: Release of IgG immuno positive species from endogenous IgM of Burkitt’s lymphoma cells CR2-1647 by lysate from those cells.
Cell lysates isolated from 1.5 X 10⁸ CRL-1647 cells were prepared in a final volume of 1 ml, as described in Methods. Exogenous IgM was not added to the lysate. The film was exposed for 4 minutes. The lysate protein content was 0.865 mg/ml.
IgG immunoreactive species were found in near the origins in lanes 2-7 and, as expected, in lanes 9 and 10. But released fractions were found; greater in lanes 5, 6, 7, containing 37°C incubated lysate material than in lanes 2,3,4, containing lysate material held at 0°C.
The faster anti IgG reactive material of lanes 5, 6, 7 were significantly more abundant than corresponding material in lanes 2,3,4 (p less than 0.029).
Lane 1: No cell lysate, mobility standards. Lanes 2, 3, 4: 0.2 µg/well of lysate incubated 1 hour at 0°C. Lanes 5, 6, 7: each received 0.32 µg/well of lysate incubated 1 hour at 37°C. Lane 8: no lysate added. Lane 9: 0.45 µg of exogenous human myeloma lgM. Lane 10: 0.1 µg of human IgG standard (Biolegend ultraleaf). One ml of lysate from 1.5 X 10⁸ CRL-1647 cells (not supplemented with IgM) contained:
Total protein: 865 µg.
IgM: 65 µg.
Faster IgG: 0.034 µg from lysate incubated 1 h at 0°C.
Faster IgG: 0.11 µg from lysate incubated 1 h at 37°C.
These values were determined from corresponding lanes of Western blot, as shown here and from other exposures of the Western blots not shown.
Results with lysates in these studies demonstrate their ability to release IgG reactive material from IgM. Interference from unknown sources in the lysates was encountered in many other experiments and in those of Figures 2. Column purification and fractionation was needed for characterization of the lysate fractions. Experiment was repeated twice.

Sepharose fractionation of the lysate showed that the release factors were mostly in 20 kDa to 5 kDa fractions (Figure 3). Some endogenous IgG was found in 250 to 110 kDa fractions and a high molecular weight fraction> 5000 kDa, contributed immunoglobulin specific protein, but were not studied further. The identity of release fractions B6 and B5 (20 kDa to 5 kDa) is to be the subject of further studies. So far, the immunoglobulin M-degrading enzyme of Streptococcus suis is the only known protease cleaving the IgM multimer specifically [4].

fig 3

Figure 3: Endogenous IgG was found in fraction B 10, a reference standard here. When incubated with IgM, fraction B6 was able to release IgG reactive species. Some IgG reactive material was associated with fraction A8, of unknown significance.
Gel filtration standards (BioRad) in a volume of 1 ml were injected into a Superose 6 Increase 10/300 GL (GE Life Sciences) in 50 mM Tris; pH 8.0, 0.1 M NaCl, 1 mM EDTA. The chromatogram was used to approximately calibrate the column for the analysis of Burkitt’s Lymphoma (CRL-1647) also injected in a volume of 1 ml.
The fractions in brackets correspond to the range of molecular weights that are within the range of our gel filtration markers.
Each well received 10 µL of Sepharose fraction and 10 µL of IgM. After incubation, 10 µl of loading buffer was added. The approximate molecular weight of protein in each fraction was calculated from the volume measurement at the beginning of each fraction. For example, fraction B- 11 contains proteins in the range of 250-500 kDa. IgG was found in fractions B 10.
FRACTION B6 contained factors or a factor which caused release of IgG, (reactive with anti IgG) when incubated with IgM. Without IgM no incubation of the fraction failed to release detectable IgG.
Endogenous IgG was found in fraction B 10, a reference standard here. When incubated with lgM, fraction B6 was able to release IgG reactive species. Some IgG reactive material was associated with fraction A8, of unknown significance.
Gel filtration standards (BioRad) in a volume of 1 ml were injected into a Superose 6 Increase 10/300 GL (GE Life Sciences) in 50 mM Tris; pH 8.0, 0.1 M NaCl, 1 mM EDTA. The chromatogram was used to approximately calibrate the column for the analysis of Burkitt’s Lymphoma (CRL-1647), also injected in a volume of 1 ml. A gel filtration separation was made of 1 mg of lysate of CRL-164 7 cells. Endogenous IgM and IgG are found in these lysates. Experiment was repeated twice.

The IgM pentamers appears to be an asymmetric pentagon with an open groove that binds the AIM protein, an apoptosis inhibitor of macrophage [5]. Other proteins may bind there and then digest IgM structures. IgG’s released by cell lysates in some experiments were between 150 kDa and 250 kDa (Figure 4). Presumably, some IgG protein monomers were released from the IgM pentamers with some remnant IgG proteins still attached to the monomers. Much immunopositive material from cell lysates migrated between the mobility of IgM and IgG. This may be due to incomplete digestion and release of IgG from pentamers, i.e. as fragments larger than IgG monomers. Self aggregation of 150 kDa IgG-like proteins might account for slower migration of considerable IgG immunopositive species. Self aggregation of the IgG standards also was found. The IgG standard in gels resembles the IgG species that was released from IgM (Figures 4-6).

fig 4

Figure 4: Sepharose fractionation of CRL 1647 lysates from a second harvest of CRL 1647 cells.
B5, B6, B7, released IgG reactive material, confirming results of Figure 2.
Release of IgG from exogenous IgM by Sepharose fractions, 4 to 20 kDa, from CRL 1647 lysate. Anti lgG antibody stained.
Lane 1: MW markers. Lanes 2, 3: 10 µL of Fraction B7 of Figure 4 incubated at 37°C with 0.45 µg of IgM. Lane 4,5: 10 µL of fraction B6 of Figure 4 incubated at 37°C with 0.45 µg of lgM. Lane 6, 7: 10 µL of fraction B5 of Figure 4 incubated at 37°C with 0.45 µg of lgM. Lane 8: No lysate. Lane 9: IgM. Lane 10: IgG (0.45 µg) 0.1 µg. Experiment was repeated three times.

fig 5

Figure 5: Western Blot.
B5, B6 did not release IgG reactive material when IgM was not included in the incubation.
Test of fractions incubated without IgM at 37°C 1 h. Refer to figure 3 for Sepharose fractions.
Anti IgG antibody stained.
Molecular weight markers: 10 µL fraction B11; 10 µL fraction B10; 10 µL fraction B9; 10 µL fraction B8; 10 µL fraction B7; 10 µL fraction B6; 10 µL fraction B5; 10 µL fraction B6; 10 µL fraction IgM 0.45 µg standard. Experiment was repeated twice.

fig 6

Figure 6: Digestion of IgM by another preparation of Sepharose fractions of CRL-1647 cell lysates. The Western blot was developed at 1/5 the sensitivity of the study in Figure 5.
Lane 1: IgM, undigested, 0.45 µg. Lane 2: IgM digested by Sepharose fraction B4 Lane 3: IgM digested by Sepharose fraction B5. Land 4: IgM digested by Sepharose fraction B6. Lane 5: IgM digested by Sepharose fraction B7. Lane 6: IgM digested by Sepharose fraction B8. Lane 7: IgM digested by Sepharose fraction B9. Lane 8: IgG digested by Sepharose fraction B 10. Lane 9: IgG standard 0.1 µg. Lane 10: MW standards (BioRad). 0.1 µg Standard IgG shown in lane 9 is polydisperse but most of it is seen when the other species are less evident. IgG migrated more slowly than expected. The 150 kDa and 250 kDa standards are faintly seen in lane 10. Inspection of lanes 3 and 4 suggests release of digestion products by Sephorose fractions 5 and 6 was greater than with other fractions. Lane 8 again indicates presence of IgG in Sepharose fraction B 10. Experiment was repeated twice.

We have identified the lysate digestion products of IgM as IgG by its immune relationship to IgG and its electrophoretic mobility (Figures 4 and 6). However, the amino acid composition of these species is needed for further definitive evaluation of them as IgG. Release of IgG immunopositive species after digestion of IgM with cell lysates exhibited in gels an array of polydisperse IgG positive entities. However, their mobility in the gels was similar to that observed with undigested IgG commercial standards in every study shown here. Their mobility, and that of the IgG standards were less than expected. Most of the IgG standard particles exhibited single mobility, as in lane 9 of Figure 6. The relevance of our findings of IgM sensitivity to certain 5 kD to 20 kD proteins should be explored, especially in patients with Waldenström’s macroglobulinemia [5]. Are these patients’ sera deficient?

Materials and Methods

Cells

CRL-1647 Burkitt human lymphoma cells (0 L) were purchased from American Type Culture Collection (ATCC), Manassas, VA 20108. They were grown in suspension at 37°C in Roswell Park Memorial Institute 1640 medium with 10% fetal bovine serum in 8% CO2 in a humidified atmosphere. The cell culture doubling time was 24 hours. Media and sera were from ATCC.

Cell Lysates

Cells were sedimented from phosphate buffered saline without Ca++ or Mg++, resuspended in lysis buffer with 10 µM Aprotinin and sonicated with 20 one-second strokes leaving 1-2% unbroken cells. Lysates of 107 to 108 cells that were clarified by centrifugation @ 15,500 g for 12 min contained approximately 1 µg/µl of protein. Lysis buffer: 0.lN NaCL, lmM EDTA, 0.05 M TRIS, pH 8.0 Aprotinin 10 µM.

Western Blots

For most experiments, 7 cm minigels, purchased from BioRad Laboratories, Los Angeles, CA were used. Buffer without SDS or methanol, containing 25 mM Tris, pH 8.3 and 192 mM glycine were used for gel electrophoresis and Western blot transfer. Human IgG l purified Ultraleaf Isotype l µg/ml CTRL was purchased from Biolegend 9727 Pacific Heights Blvd, San Diego, CA 92121. Human IgM 4.5 mg/ml was purchased from Fisher Thermofisher.com (product 31146). Horseradish peroxidase 0.4 mg/ml linked donkey anti human IgG was from Biolegend.

Sepharose Fractionation

Gel filtration standards (BioRad) in a volume of 1 ml were injected onto a Sepharose 6 Increase 10/300 GL (GE Lifesciences) in 50 mM Tris pH 8.0, 0.1 M NaCl, 1 mM EDTA. The chromatogram was used to approximately calibrate the column for analysis of Burkitt’s lymphoma lysate, also injected in a volume of 1 ml.

Mass Spectrometry Analysis

LC-ESI-MS/MS (liquid chromatography electrospray ionization mass spectrometry) analysis of the peptide digests was done by C18-Reversed Phase (RP) chromatography using an Ultimate 3000 RSLCnano System (ThermoScientific, USA) equipped with an Acclaim PepMap RSLC C18 column (2 µm, 100 Å, 75 µm x 15 cm, Thermo Scientific, USA). The UPLC was connected to a TriVersa NanoMate nanoelectrospray source (Advion, USA) and a linear ion trap LTQ-XL (ThermoScientific, USA) mass spectrometer with ESI source operated in the positive ionization mode. The MGF files generated from the raw LC-ESI-MS/MS data were searched by Mascot (version 2.5, Matrix Science, USA) against Swissprot AC database version 2016-05 (551,193 protein sequences) with the following search parameters: trypsin; two missed cleavages; peptide charges of +2 and +3; peptide tolerance of 2.5 Da; MS/MS tolerance of 0.8 Da; carbamidomethylation (Cys) for fixed modification; deamidation (Asn and Gin) and oxidation (Met) for variable modifications. A decoy database search was also performed to measure false discovery rate. The Mascot search results were validated by Scaffold version 4.1.1 (Proteome Software Inc., USA).

References

  1. Hiramoto E, Tsutsumi A, Suzuki R, Matsuoka S, Arai S, et al. The lgM pentamer is an asymmetric pantagon with an open groove that binds the AIM protein. Science Advances 4 eaau 1199.
  2. Bases R, Lekhraj R, Tang X, Huang JZ, Duan Z, et al. (2014) Enhanced content of IgG in Burkitt’s lymphoma cells after treatment with the topoisomerase II inhibitor, lucanthone. J Bioanal Biomed 9: 186-193.
  3. Bases R, Lekhraj R (2018) Ionizing Radiation and Lucanthone Enhance the IgG content of Burkitt’s lymphoma cells. J Bioanal Biomed 10: 105-107.
  4. Seele J, Beineke A, Hillermann LM, Jaschok B -Kentner, von Pauvel-Rammingen W, et al. (2015) The Immunoglobulin M-degrading enzyme of Streptococcus suis, ldessuis is involved in complement evasion. Veterinary Research 46: 45-59.
  5. Tedeschi A, Conticello kC, Rizzi R, Benevolo G, Laurenti kL, et al. (2019) Diagnostic framing of IgM monocolonal gammopathy: focus on Waldenström’s macroglobulinemia. Hematological Oncology 37: 117-128.

Giant Multiloculated Left Ventricular Pseudoaneurysm

DOI: 10.31038/JCCP.2021412


A 85-year-old woman, with a previous history of pericarditis was admitted to the ED for dyspnoea with evident signs of congestive heart failure. The patient underwent two-dimensional transthoracic echocardiography that showed left ventricular ejection fraction of 40% with an akinetic postero-lateral wall. The postero-lateral wall shows a discontinuity of the myocardium at the apical segments with the evidence of a giant pseudoaneurysm (Ps): multiloculated in three different sac connected each other (Figure 1 panel A, online video 1).

The color-Doppler visualized at the neck of the Ps showed a systo-diastolic turbulent jet filling the multiloculated structure (Figure 1 panel B; online video 2). The apical 3-chamber view confirmed the large neck of the multiloculated Ps (Figure 2 panel A).

fig 1

Figure 1: A. 2D transthoracic echocardiography, apical 4-chamber view. LV=left ventricle; LA=left atrium; RV=right ventricle; Numbers 1 to 3 are the multiple locations of the pseudoaneurysm. B. Color-Doppler echocardiography shows the communication with the Ps sac.

The previous patient history of pericarditis could have play a role, saving from dramatic rupture a silent myocardial infarction and leading to creation of a multiloculated sac. This case presents some complications of an untreated sub-acute myocardial infarction as Ps and mitral regurgitation secondary to the tethering of the mitral posterior leaflet. (Figure 2 panel B).

fig 2

Figure 2: A. 2D transthoracic echocardiography, apical 3-chamber view. LV=left ventricle; LA=left atrium; Ao=aorta; Numbers to 3 are the multiple locations of the giant pseudoaneurysm. B. Color-Doppler echocardiography at apical 3-chamber view.

Considering the prohibitive surgical risk leading by age and co-morbidities after discussion at Heart Teem the patient was stabilized on optimal medical therapy and discharged. Untreated left ventricular Ps leads to loss of anterograde stroke volume and systemic cardioembolic events [1,2]. After myocardial infarction other common causes of Ps are: cardiac surgery, bacterial endocarditis and chest trauma [3].

Keywords

Acute myocardial infarction, Echocardiography, Left ventricular pseudoaneurysm

References

  1. Hung MJ, Wang CH, Cherng WJ (1998) Unruptured left ventricular pseudoaneurysm following myocardial infarction. Heart 80: 94-97. [crossref]
  2. Altinier A, Negri F, Belgrano M, Gianfranco Sinagra (2015) The eight-shaped heart: an incidental giant left ventricular pseudoaneurysm. Eur Heart J 36: 1488. [crossref]
  3. Frances C, Romero A, Grady D (1998) Left Ventricular Pseudoaneurysm. J Am Coll Cardiol 32: 557-561. [crossref]

What is the Reason for Memory Deterioration during Aging?

DOI: 10.31038/ASMHS.2021517

Abstract

The fractional content of water soluble proteins in young and old rats’ brain has been studied. It has been established that the water soluble proteins in the brain of old rats are characterized by the excess of high molecular proteins, as compared to the proteins of young ones. We have supposed that the formation of high molecular proteins as a result of the aggregation of disulfide bonds of low molecular proteins should have been due to the determination of number of sulfhydryl groups. As a result of quantitative determination of sulfhydryl groups, the amount of disulfide bonds in the soluble proteins of the brain in old rats appeared to be 50-60% more, as compared to young rats. It turned out that the activity of NADP-H-dependent disulfide reductase enzyme was about 30-50% less. The impact of biologically active substances, which activate disulfide reductase on the activity of disulfide reductase and the elaboration of conditional avoidance reflex, was specially studied. It has been established that disulfide reductase activity in the various areas of old rats brain on average increases by 50-60-% and relatively the development of conditional avoidance reflexes and the memory is improved by 70%.

Keywords

Water soluble proteins, Sulfhydryl and disulfide groups, NADP-H-dependent enzyme

It has been established that young rats (4-7 months) for the correct decision of maze tests achieve a maximum criterion after the second test, while the old ones need (25-29 months) more tests, but still do not achieve a maximum criterion. As we have suggested these changes at the level of the brain proteins should have been due to the age of animals. For this purpose a quantitative distribution of water soluble proteins in the brain of young and old rats was studied according to molecular masses. It has been established that the soluble proteins of old rats were distinguished by the content of high molecular mass proteins. We have assumed that this should been have due to disulfide bonds of low molecular proteins, which, in our opinion, caused the aggregation of proteins and memory impairment. Based on the above-said, the number of sulfhydryl groups in the water soluble proteins of the brain in young and old rats was specially studied. After the homogenization of the cortex, white matter of the hemispheres, the cerebellum, the hippocampus and the medulla oblongata, the sulfhydryl groups in water extracts were determined by using the method on the device T-201 [1] developed by us and G. Ellman method [2]. The concentration of protein was measured by O. Lowry et al. method [3] (Table 1).

Table 1: Quantitative distribution of sulfhydryl and disulfhydryl groups in water soluble proteins in brain specific structures of young and old rats (10-6/100/mg protein).

Brain structures

Young rats

Old rats Young rats

-SH-

Old rats

-S-S-

The brain cortex

0.622

0.500 0.06

0.08

White matter

0.670

0.454 0.07

0.15

The cerebellum

0.680

0.526 0.06

0.12

Medulla oblongata

0.793

0.478 0.08

0.14

The hippocampus

0.543

0.352 0.05

0.12

Proceeding from the above-mentioned, we have got interested in the activity of NADP-H dependent disulfide reductase enzyme in the various brain areas of young and old rats [4-6]. The solution with the following content was used for the incubation: 0.5 ml buffer of Tris-HCl (pH 7.4, 0.5 ml DTNB (50 mM, 0.5 ml NADP-H (100 mM) and 0.5 ml; protein solution (1 mg/ml) [6]. As seen from the Table 2, the activity of HADP-H-dependent disulfide reductase is decreased about by 30-50% in the brain of old rats. Most researchers engaged in the study of reasons for the memory impairment attribute such changes in the functional activity of the brain to gene mutations and perhaps it is probable that the decrease in the activity of NADP-H-dependent disulfide reductase must be exactly the result of gene mutations at the level of nerve cells [7].

Table 2: The activity of NADP-H-dependent disulfide reductase of young and old rats in conventional units.

Brain structures

Young rats

Old rats

Cortex of hemispheres

0.125 ± 0.008

0.060 ± 0.003, <0.001

White matter

0.104 ± 0.013

0.058 ± 0.003, <0.003

The cerebellum

0.124 ± 0.009

0.064 ± 0.004 <0.001

Medulla oblongata

0.088 ± 0.004

0.062 ± 0.003, <0.01

The hippocampus

0.104 ± 0.005

0.087 ± 0.004, <0.01

Based on the above-mentioned, we started searching for the biologically active substances which activated the activity of disulfide reductase enzyme. The impact of the injection of biologically active substances into the ventricles of young and old rats’ brain on the activity of NADP-H-dependent disulfide reductase and the elaboration of conditional avoidance reflex was specially studied [8]. In the hemispheric cortex, the white matter, medulla oblongata and the hippocampus of the brain the number of sulfhydryl groups relatively increased by 30%, 29% and 37% only in old rats, as compared with the control, while under the influence of hydrocortisone the number of sulfhydryl groups increased by 45%. Relatively, the elaboration of conditional avoidance reflex and the memory was improved by 70% [6,8]. Based on the mentioned, we think that for the prevention it is desirable to take foods rich in amino acids containing sulfhydryl groups, cysteine and methionine: pork, salmon fillet, milk, cheese, chicken and turkey meat, sunflower, nuts, etc.

Noteworthy is the fact that in Nigeria, where the cases of Alzheimer’s disease are rare, the substances, inhibiting the activity of acetylcholinesterase in the vegetables have been discovered, at the affinity of which the activity of the enzyme is inhibited by the extract of Spondia mombin root bark – by 83.94%, the extract of Callophinophyllum inoophyllum root bark – by 58.52%, the extract of C. jagus leaves – by 74.25%, the extract of Combreteeum molle leaves and stem, relatively, by 90.42 and 88.13% [9]. It should also be mentioned that in conditions of memory impairment, the aged people were often offered to take the drugs, activating the cholinergic system. It is likely that at the expense of acetylcholinesterase activity inhibition, as a result of the accumulation of an exciting neurotransmitter – acetylcholine, the neurons and neuronal ensembles remain to be active for a long time and enhance the stabilization of memory engram. For the prevention it is necessary to activate the neurons and neuronal ensembles by reading, listening to classical music, playing chess, puzzle solution, learning foreign languages, physical trainings and active public activities [10]. Otherwise, while leaving neuronal ensembles in the state of hypokinesia for a long time a quantitative reduction of the number of synapses decreases, neuron death takes place and, as a result the memory is impaired [11].

Conclusion

Proceeding from the above data, one of the possibilities of memory improvement of aged people should be considered the recovery of disulfide bonds by means of those biologically active substances, by which the activation of NADP-H-dependent disulfhydreductase enzyme, the recovery of disulfide bonds excess and, in our opinion in the perspective, the memory improvement.

References

  1. Aleksidze N., Koshoridze N (1980) Determination of sulfhydryl groups by laboratory titrator T-201. Bull Experimental Biology and Medicine 89: 85-87.
  2. Ellman GL, Kcourtney YD, Andres V, Feather-Stone RM (1961) Rapid colorimetric determination of acetylcholinesterase activity. Biochem Pharmacol 7: 88-95. [crossref]
  3. Lowry OH, Rosenbrough NJ, Farr AL, Randall RJ (1951) Protein measurement with the Folin Phenol Reagent. J Biol Chem 193: 265- [crossref]
  4. Tietze T (1970) Arch Biochem Biophys 138: 112-114.
  5. Dringen R, Gutterer JM (2002) Glutathione reductase from bovine brain. Methods Enzymol 348: 281-288. [crossref]
  6. Aleksidze N, Koshoridze N (1984) Changes in disulfide reductase activity of rat brain at aging. Neirokhimia 3: 51-53 (in Russian).
  7. Aleman A (2018) Brain on pensions: what happens to the brain during aging? 450.
  8. Aleksidze N., Koshoridze N (1983) The impact of adrenaline and hydrocortisone on disulfide reductase activity of the brain. Neirokhimia 2: 199-204 (in Russian).
  9. Elufioye TO, Obuotor EM, Sennuga AT, Agbedahunsi JM, Adesanya SA (2010) Acetylcholinesterase and butyrylcholinesterase inhibitory activity of some selected Nigerian medicinal plants. Rev Bras Farmacogn 20: 45-50.
  10. Aleksidze N (2014) The basics of psychobiology. The Publishng House of Georgian National Academy of Sciences 223.
  11. Butz M, Ooyen A van (2013) A Simple rule for dendritic spine and axonal bouton formation can account for cortical reorganization after focal retinal lesions. PLoS Computational Biology 9: 1371-1380. [crossref]