Monthly Archives: March 2024

Geological and Water Resources of Afghanistan

DOI: 10.31038/GEMS.2024614

Abstract

Afghanistan is rich in mineral and water resources but lacks political leadership and mineral- extraction capacity to fully realize the value and benefits of such commodities, even several world-class mineral deposits. Afghan leaders fail to acknowledge or intervene in continued pollution of water resources that will most certainly be a detriment to future generations as climate change adds drought stress to the country. Many of the Afghanistan resources, except for water, can wait for some future date to develop. The Afghan people who must rely on some of these resources for survival, however, are suffering under the incompetence and backwardness.

Keywords

World-class mineral resources, Water resources, Hydro-cognizance, Hydro-hegemony, Climate change

All forms of rock, mineral, and water resources have been assessed in Afghanistan for about the past century, starting mainly by Russian geoscientists from the 1920s through the 1980s [1-5]. By the late 1960s enough progress had been made to produce detailed maps and reports that subsequently were reinterpreted considering plate-tectonic theory, coupled with independent reassessments by Afghan, American, British, French, German, Japanese, and a few other nationalities [6-9]. The result has been the recognition that several trillions of dollars of natural resources have been discovered [10], although recurring political instabilities have so far precluded actual mining much beyond small artisanal efforts to extract coal, gemstones, chromite, stone quarrying, and minor other resources. Several world-class deposits of copper, iron, rare earths, uranium, and lithium occur, with the copper and iron deposits being the largest in Asia [11-13].

Difficulties with studying and understanding all forms of water in Afghanistan (weather climate, glacier ice, river flow, underground water) are plentiful, with increased pollution, drawdown, natural hazards (landslides, rapid wet debris flows, mudflows), flashfloods, and multiple and increasing droughts [14,15]. On the other hand, over-extraction of ground and surface waters is occurring everywhere, particularly now that climate change is well underway across the whole region of South and Central Asia. Furthermore, long-term intransigencies by all prior Afghan governments and their bloated and incompetent bureaucracies were set firmly against even talking about water in any context. In fact, most of the water experts and engineers of the prior Ghani regime have long-since fled the country or gone underground to protect themselves and their families.

These aversions have compounded and added much to living difficulties, especially with the government now being run by an ineffective and largely illiterate Taliban. Almost no recognition of the Taliban government has been granted by outside countries or the United Nations, except for Pakistan, Saudi Arabia, and the United Arab Emirate. As a result, almost all external financial assistance has dried up in the face of pro-religious and anti-scientific pronouncements by the Taliban, who for example, have denied reports of water pollution and linked those reports to supposed enemies of the Afghan people. The traditional government arrangements are not working, however, to solve today’s problems with over-extraction and pollution [16]. The Taliban are unwilling to accept any such solutions because they seek to use only Sharia laws, which are only acceptable to some fundamentalist Muslims and are not useful to most villagers.

Hydro-cognizance and hydro-hegemony are two concepts about Afghanistan water that have emerged in the Western literature recently. These need to be understood in terms of scientific approaches to the hydrologic cycle (evaporation, precipitation, glacier, lake, ocean and underground water storage, river flow, etc.), as well as the means to exert hegemonic control over water between Afghanistan and its neighboring countries [17]. Hydro-hegemony has four major pillars: (1) geographic position (top, middle, or bottom of watersheds; (2) material power (demography, infrastructure, literacy, military strength, etc.); (3) bargaining power (water-law awareness, diplomatic skills, etc.); and (4) ideational power (skill with new ideas and new thinking). Afghanistan is at the top of the watershed, which is a very strong position compared to Pakistan and Iran, but quite weak in the other pillars. The result is that aside from the excellent geographic position at the top of the watersheds, Afghanistan is woefully deficient in all the other factors, so much so that the country is vulnerable to hydrologic machinations by the neighboring countries.

In sum, the geology and ores of Afghanistan could become part of the salvation of the sorely beset nation through wise resource extraction. Various transparencies to reduce individual, corporate and government corruption have been introduced by the prior governments, along with ideas on comprehensive extraction, transportation, and refining in various resource corridors, all of which could certainly help jumpstart the rebuilding of the Afghanistan economy. This would require adoption by the Taliban, who are not known for their ability to comprehend such modernism.

Competing Interests

The authors declare that they have no competing interests

References

  1. Abdullah S, Chmyriov VM (2008) Geology and mineral resources of Afghanistan, Book 1, Geology: Ministry of Mines and Industries of the Democratic Republic of Afghanistan. Afghanistan Geological Survey, 15, p. 488. British Geological Survey Occasional Publication.
  2. Ali SH, Shroder JF (2011) Afghanistan’s mineral fortune: Multinational influence and development in a post-war economy: Research Paper Series C: 1: 2011 (1): Institute forEnvironmental Diplomacy and Security; James Jeffords Center for Policy Research, v. 1(1), p. 24. University of Vermont.
  3. Shroder JF (2014) Natural resources in Afghanistan: Geographic and geologic perspectives on centuries of conflict. Elsevier 572.
  4. Shroder JF (2015) Progress with Afghanistan extractive industries: Will the country know resource success or failure evermore? Extractive Industries and Society 2: 264-275.
  5. Shroder JF, Eqrar N, Waizy H, Ahmadi H, Weihs BJ (2022) Review of the Geology of Afghanistan and its water resources. International Geology Review.
  6. Shareq A (1981) Geological observations and geophysical investigations carried out in Afghanistan over the period of 1972-1979, in Gupta HK, and Delany FM, eds. Zagros Hindu Kush Himalaya geodynamic evolution: American geo-physical union, geodynamics series 3, Pg: 75-86.
  7. Siehl A (2015) Structural setting and evolution of the Afghan orogenic segment – A review, in Brunet, MF, McCann T, Sobel RR, eds., Geological Evolution of Central Asian Basins and the Western Tien Shan Range, London: The Geological Society of London, Pg: 427.
  8. Debon F, Afzali H, Le Fort P, Sheppard SMF, Sonet J (1987) Major intrusive stages in Afghanistan: Typology, age and geodynamic setting. Geologische Rundschau 76: 245-264.
  9. Doebrich JL, Wahl RR (2006) Geologic and mineral resource map of Afghanistan, version 2: U.S. Geological Survey OF-2006-1038, scale 1: 850,000, 1 sheet.
  10. Risen J (2010) U.S. identifies vast mineral riches in Afghanistan. The New York Times, June 13.
  11. Peters SG (2011) Summaries and data packages of important areas for mineral investment production opportunities in Afghanistan, U.S. Geological Survey Fact Sheet 2011-3108.
  12. Peters SG, King TVV, Mack TJ, Chornack MP, eds. the U.S. Geological Survey Afghanistan Mineral Assessment Team (2011a) Summaries of important areas for mineral investment and production opportunities of nonfuel minerals in Afghanistan: U.S. Geological Survey Open-File Report 2011-1204.
  13. Peters SG, King TVV, Mack TJ, Chornack MP (2011b) Summaries of important areas for mineral investment and production of opportunities of nonfuel minerals in Afghanistan, U.S. Geological Survey Open-File repot 2011-1204.
  14. Shroder J, Ahmadzai S (2016) Transboundary water resources in Afghanistan – Climate change and land-use implications, Amsterdam. Elsevier.
  15. Shroder JF, Ahmadzai SJ (2017) Hydro-cognizance: Water knowledge for Afghanistan: Journal of Afghanistan Water Studies: Afghanistan Transboundary Waters. Perspectives on International Law and Development 1: 25-58.
  16. Mahaqhi A, Mehiqi M, Mohegy MM, Hussainzadah J (2022) Nitrate pollution in Kabul water supplies, Afghanistan; sources and chemical reactions: a review. International Journal of Environmental Science and Technology 19.
  17. Ahmadzai SJ, Shroder JF (2017) Water security: Kabul River basin: Journal of Afghanistan water studies: Afghanistan Transboundary Waters. Perspectives on International Law and Development 1: 91-109.
fig 3

Value of Ecosystem Conservation versus Local Economy Enhancement in Coastal Sri Lanka

DOI: 10.31038/GEMS.2024613

Abstract

The coastal natural ecosystem is the world’s most sensitive, threatened, and populated environmental system. Economic valuation of coastal ecosystems helps identify this complexity and justify conservation efforts that could divert the local attention of people for sustainable coastal management. The abundance of the quality of the coastal ecosystem affects the marine biological process, both primary and secondary production requirements that support the needs of humans. However, there are no prices for environmental resources to be valued and undervalued, as there is no price to appreciate the actual monetary value. Since the importance of coastal resources is undermined due to their undervaluation, valuation can help develop our knowledge of the true value of ecosystems. However, the Sri Lankan conservation planning process still needs to consider determining the economic value of coastal ecosystem conservation. Therefore, this study aims to estimate the monetary value of protecting coastal areas in Sri Lanka using the willingness to pay (WTP) approach. Further, it identifies attributes and measurable variables that reflect the economic value of conserved coastal areas by evaluating public preference over possible cases. The selected case study is the Mirissa coast from the southern coastal belt, enticing high tourism attractions. The Choice Experiment (CE) method determines the study’s primary objective. First, a questionnaire survey was used to collect data under a random sampling method with a sample size of around 250 using a face-to-face interview method. Then, researchers analyzed the data by using the Conditional Logit Model (CLM). According to the results, public preferences ranked three variables at the top: “All known coral reef conservation, WTP SLR500, and creating more opportunities for locals.” In addition, all the parameter variables used in the study were significant at α <0.01 level. Finally, the study has generated vital information about the values placed on different ranges of conservation of coastal resources and the tradeoffs by respondents.

Keywords

Coastal ecosystem, Conservation, Local economy, Tradeoff, Economic valuation

Introduction

Sri Lanka is rich with a valuable coastal belt of 1585 km, encircling the country with uncountable coastal natural resources. Generally, the coastal areas are low-lying landscapes with different geographical features like estuaries and lagoons. The total area of 126989 hectares (ha) includes 6,083 ha of mangroves, 68,000 ha of corals, and 15,576 ha of bays, dunes, and coastal marshes. The country’s coastal environment is beautiful and consists of rich biodiversity and different kinds of natural resources [1]. The main occupation of the coastal area is the tourism industry, as highly demanding leisure destinations are available around Sri Lanka. Coastal tourism empowers economic benefits to both local and national economies. Moreover, 80% of tourism infrastructure is based in coastal areas [2]. The increment of the coastal human population, poor environmental planning, and lack of consideration of social and ecological issues have manipulated the degradation of the coastal environment. Inland development has been related closely to the maritime activities of the country. Hence, coastal ecosystems are the most populated landscape threatened in Sri Lanka, like the situation worldwide. All people living in coastal areas would most likely be affected by the conservation or conversion of the land for development [3]. Open access areas such as coastal zones are continuously exploited for economic purposes, instigating the extinction of valuable species. The need to manage coastal problems came into practice in the 1920s; however, the effort in the field appeared sometime later. Coastal erosion problems are mainly due to the need for a better understanding of conservation values, ensuing vast destruction in the Sri Lankan coastline [4]. The relevant authorities need more capacity and efficiency in managing and maintaining the coastal resources. Moreover, public participation is significant in overcoming the situation as they are directly involved in the coastal natural resource conservation program. Thus, general users are more responsible for conservational coastal natural resource programs.

Moreover, this will be a good start for conserving and managing resources and saving for the future. Countries are practicing the willingness to pay (WTP) approach to determine user satisfaction with natural resources based on their happiness and perception of future conservation and management. However, only a few economic valuation studies on coastal resources in the Sri Lankan context are found in the literature review. Investigating stakeholder preferences spatially for conservation and development in unprotected wetland areas was conducted using the WTP and Analytical Hierarchy Process (AHP) techniques in Sri Lanka [5]. Economic valuation on coastal ecosystems will be a significant advantage for cost-effective designations to manage sustainable ecosystems. Some studies focus on the coastal belt of Sri Lanka and its valuable natural resources. However, most studies have been carried out to address the impacts of coastal pollution, coastal conservation, and coastal area management. There are even studies related to coastal protection in the literature. However, studies on the total economic value (TEV) of the welfare of” ‘use’ and ‘non-use’ values and conservation of coastal areas are minimal [3]. The research of this paper focuses on two main aspects. First, to identify attributes and measurable variables that reflect the economic value of conserved coastal areas. Second, to estimate the monetary value of conserving coastal regions of Sri Lanka using CE.

Materials and Methods

Coastal Management Methods

The country’s coastal management was initiated in the 1920s, focusing on engineering solutions for coastal erosion. In 1963, a comprehensive approach was required to manage coastal resources. Due to that, the Colombo Commission established a coastal protection unit. Under the Ministry of Fisheries, the Coast Conservation Division was established in 1978 and upgraded in 1984 as a department. The Coastal Conservation Act No. 57 of 1981 was enacted in 1981 and came into operation in 1983. The main legal document that frames the coastal zone activities is the Coast Conservation Act of 1981 and its 1988 amendment. Since 1930, the theme of social justification for projects has evolved. For example, the Flood Control Act of 1936 mentioned federal participation in controlling the flood hazard if the benefits of these projects exceeded the estimated costs. Managing coastal resources is essential to planning and developing a sustainable economy. Only a few advanced types of research were carried out in the Sri Lankan context to estimate coastal area management and conservation to achieve sustainable development. However, numerous types of research are available worldwide that analyze the public perception and apply it to coastline conservation. Many countries that own coastal resources are making decisions to conserve coastal areas against development activities. However, some small groups engage in activities that affect the coastal areas. Coastal protection methods such as conservation can ensure human health, protection, and improvements of renewable resources such as fisheries [6], mangroves, and coral reefs. As an island country, Sri Lanka also practices coastal conservation and preservation strategies to a certain extent. The environmental movement of the late 1960s talked about pollution control and highlighted the role of WTP for this purpose.

Environmental Valuation

Researchers believe there is an unpredictable value for unassessed coastal habitats due to the need for more prices in natural resources. However, using the WTP approach, it is possible to value it using the concept of maximum utility. Economists use environmental valuation techniques to appreciate natural resources and resource services as market and non-market goods. The term “value” is a precise term used to express the idea that a consumer’s highest price is WTP to obtain a good/service. Simply, it is about how much the user values the good/service. This value varies from person to person and good to good. Supply and demand concepts in Economics help estimate the WTP to obtain goods/services. Regarding the coastal context, the term valuing differs due to their interests. According to ecologists, the salt marsh value will be the significance of the marsh as a reproductive good/service to certain kinds of fish species. However, only some users look at that from this view. The economic value measures the maximum amount an individual is WTP for a good/service. The welfare measurement is expressed formally with the concept of WTP. Further, suppose a value loss occurs in a degraded environment of pollution. In that case, that lost amount is the maximum amount an individual is willing to accept (WTA) to compensate for pollution. In economic valuation, one can identify characteristics like money used as a unit of account. This value is relative because it measures tradeoffs of goods/services that have a value if people directly or indirectly value them. Otherwise, there is no value, and when determining values for the whole society, value aggregates from individual values [4].

Random Utility Theory

Utility theory, the random utility theory, and the theory of value are the main relevant theories for valuing coastal ecosystems. The basic meaning of the word “utility” can be assumed as satisfaction. In general, people make decisions based on their satisfaction. The four types of economic utilities are form, place, time, and possession. This theory says people choose WTP based on income, wealth, status, and mindset [7]. Random utility theory is used to derive behavioral models which must be obtained from the choice dimension. The rational behavior of humans and maximization of the utility relative to personal choice is the primary assumption when considering the approach to this theory. For example, there is a tendency of human behavior that, in most cases, each choice uses available alternatives [8]. The theory of value describes that desire and utility are not the only things when making decisions. Attributes or the characteristics of the good/service matter. Several approaches to this concept examine why, how, and to what extent people value things [7]. The CE method used in this research is a method that asks individuals to prefer their alternative among several available options to appreciate the natural resources.

The Choice Experiment Method

CE method is an application of the theory of value combined with random utility theory. This method estimates attributes’ economic values by measuring people’s WTP to achieve improvements or changes suggested by each option (attribute) [10]. Several methods for estimating CE parameters, such as Logit and Probit, were identified. The Multinomial Logit Model (MLM) is widely used for three or more choice categories in a problem and the respondents’ socio-economic characteristics. The Conditional Logit Model (CLM) is also a suitable method that extends the MLM. Moreover, the CLM is the most appropriate method when choosing the alternatives considered in the modeling process. Hence, the CLM procedure is used as the modeling method for this research. The choice among selected alternatives is a function of the other options in this research. The characteristics of respondents who are making a choice [11] are less likely essential to achieve the objectives of this research. This procedure estimates the Maximum Likelihood by “running” Cox regression” of SPSS.

for

According to the above equation, CLM estimates that an individual i chooses alternative j as a function of the attributes varying for the alternatives and unknown parameters [12]. Therefore, in CLM, Xij is used as a vector of attributes site j and individual i, with the probability that individual i chooses alternative j.

Choice Questionnaire Survey

Southern coastal areas of Sri Lanka have the highest tourism attraction; consequently, the Mirissa coastline is the location for the survey. This area is one of the coastal areas with the highest mean coral cover of 23.97%. The other most significant feature of the area is that the highest live coral is available in the same area, which should be conserved and protected. Southern coastal belts, including Mirissa, Weligama, Polhena, Hikkaduwa, and Rumassala, show high BOD levels (average=3.98mg). When considering the protection of the ecosystem, the case study area is worthy as it has evidence of the threat of human activities. Destructive fishing activities are mainly high within the region, threatening the coastal area’s natural resources. However, the high tourist arrival rate is on record during the year. Therefore, this study focuses on Mirissa’s natural coastal resources to preserve the ecosystem. Attribute selection of the study mainly focused on what is relevant to the respondent group and the policy context of respondents. Furthermore, selecting attributes wants to occur from end-user perspectives, which means the population of interest is the decision-makers [13]. Further, the selection of attributes uses three steps. First, it identified essential attributes that reveal the good or service. Second, it determined a suitable framework for the attributes and finally identified levels for each attribute (Table 1).

Table 1: Selected attributes and the levels

Attributes

Level 1 (Status quo) Level 2 Level 3

Environmental strategy to protect coral reefs

Identified coral reef conservation All known coral reef conservation

All known and unknown coral reef conservation

Local economy enhancement Benefits captured by well-established businesses Encourage small-scale local businesses which reflect the Sri Lankan culture

Creating more opportunities for locals to establish with high-income generations

Management and preservation payment

No payment

SLR0

SLR500

SLR1000

Levels and attributes were from the information collected in the literature and discussions with experts, stakeholders, practitioners, and university professionals. The following are the basic descriptions of each attribute and level.

First, the attribute selected considers the environmental strategy to protect coral reefs. Corals can be identified as susceptible living species adapting to changes in marine ecosystems. The corals are especially vulnerable to physical damage like pressure on ornamental fishing, deep-sea fishing, trawling for fishing, Moxy nets, and iron rods. The rapid growth of calcareous Halimeda sp. and Caulerpa sp. has been identified as a leading primary threat to the area’s corals [14]. At the status quo (current stage), steps are used to develop the conservation of the identified coral reefs, but the threat continues to grow. Therefore, level 2 uses level 1 plus the preservation of all known coral reefs and level 3, which is the level 2 + conservation of all unknown coral reefs’ environment for the future. The second attribute is the enhancement of the local economy in the area. It developed the Southern coastal line by expanding the tourism industry. Further, the contribution of the fishery industry was a substantial income generation source for the area. On the contrary, modern fishery practices and tourism threaten natural coastal ecosystems. The benefits of these activities are primarily obtained by well-established businessmen, leaving poor local people aside. This attribute encourages micro, small, and medium entrepreneurs (MSMEs) to boost their rural economies. This development will be a strategy for attracting local tourism and fisheries to promote the conservation of natural resources. Thus, levels 1 and 2 create more opportunities for locals to establish higher income generation potential and promote coastal protection.

Management and preservation payment is the third attribute used in the choice set. Competition for limited resources has intensified with human population growth in coastal regions and the diversion of coastal areas, including wetlands, for economic activities experienced globally [15]. The coastal areas are open access spaces, and free accessibility to public common spaces and resources makes excessive exploitations. To estimate the damage, there are no market prices for many characteristics in coastal natural areas. This study will evaluate the economic value of the coastal natural ecosystem based on the general public’s perception, including all stakeholders. These hypothetical payments are no payment, SLR0 (status quo), SLR500, and SLR1000. An experimental design can identify attributes and all levels as a choice set in the choice experiment study. For example, considering three attributes and three levels makes the total combination of 33 = 27; however, it is difficult to show all 27 combinations in a questionnaire. Therefore, 27 combinations have been reduced to 9 using the orthogonal procedure for convenience in field data collection. An orthogonal design stores the information in a data file. However, this active dataset is optional before running to generate an orthogonal design procedure. However, this procedure allows the researcher to create an active dataset that generates variable names, variable labels, and value labels from the options shown in the dialog boxes. The researcher can replace or save the orthogonal design as a separate data file if an active dataset is available. Thus, the initial step of a choice experiment creates the combinations of attributes and levels presented as product profiles to the subjects in the field. Moreover, even a few attributes and a few levels for each attribute will lead to an unmanageable number of potential product profiles. As such, the researcher needs to generate a representative subset known as an orthogonal array.

Respondents in the field choose 1 out of 9 shown to them. However, the probability can be estimated for all 27 combinations in the modeling stage. It is better to use fractional factorial design than complete factorial design in deriving alternatives of choice set due to its complexity. A full factorial design consists of combinations of all attributes and their levels. When combinations become too large, fractional factorial design will usually be used. This procedure is known as a total design sample that allows for estimating all the effects of interest. The fractional factorial design can be orthogonal, indicating no correlation between attribute levels [16]. Orthogonality estimates the correlation between two attributes. If it is 0 or less, then that is called orthogonal. An orthogonal plan then selects random pairing alternatives. After finalizing the other options, it can develop scenarios, create a choice card, and use it in the CE method. The questionnaire develops under crucial sectors, and the introduction consists of what, why, how, and who does this investigation. The questionnaire to gather ‘individual’ preferences consists of questions about public perception of coastal ecosystem conservation. Choice cards experiment with examples to introduce the task clearly to the respondents. A clear presentation is essential in the field to get complete answers. Socio-economic and demographic data interpretation and validation require data such as age, gender, household income, and education level of respondents.

Sample Selection

Simple random samples are a commonly applied sampling technique in CE studies [17]. This study mainly uses convenient sampling, replicating the simple random sampling method. The sample includes all users/visitors of the coastal natural areas within the selected case study area. With a 90% (1.65) confidence level, we set the n=250 sample. This sample only considers people between the ages of 18 and 65. The questionnaire survey was a face-to-face interview since it secured a higher rate of responses. When creating the choice card, all coded data consists of 0 or 1. All other data were entered as continuous data or as 0 or 1. The output combines the information about attributes levels chosen, not chosen, and the respondent’s socio-demographic data. In choice selection, level 1 (status quo) was constant as a base for other choice selections.

Results

Socio-Economic Characteristics

The socio-economic characteristics of the respondents are presented in Table 2. The gender balance is almost equal in the sample, with the highest percentage of the younger and active generation aged 18-40. The educational category of the highly educated group, “high to postgraduate qualification,” consists of 45%. Sixty percent of the sample in the group are married. At the same time, unemployed people are about 33%.

Table 2: Socio-economic characteristics of the respondents

tab 2

Estimation of Conditional Logit Model

We used the choice experiment procedure to estimate the economic value by ‘individuals’ preferences over a set of attributes. Respondents compared nine choice alternatives differing in terms of levels and attributes. CE results are generated from the survey using a choice card analyzed by CLM, and this sub-section presents the results of CE. In addition, the importance of the selected attributes is explored using Cox regression of continuous-time survival data in SPSS software. This procedure uses the partial likelihood method in SPSS, which helps match the choice CLM to the data set. The Likelihood ratio, Score, and Wald tests use Chi-squares (χ2) analysis to estimate the model parameter. As shown in Table 3, χ2 data for Likelihood ratio, Score, and Wald statistics indicate that the model is highly significant. The model test value for each test is 0.0001, smaller than 1% (α = 0.01), i.e., 0.0001<0.01; thus, all three tests confirm that the model is significant at α = 0.01 probability level. These results demonstrate a powerful interrelationship between the attributes and the Choice. The likelihood ratio test (Chi-square) rejects the null hypothesis of no relationship between attributes and the Choice at the significant level of α = 0.01.

Table 3: Model test statistics (global H0: β = 0)

Test

χ2

DF

Pr>χ2

Likelihood ratio

233.697

6

0.0001

Score

388.343

6

0.0001

Wald

388.343

6

0.0001

Estimating the parameter values of the maximum likelihood is vital in modeling choices. Table 4 shows parameter values for identified attributes and levels are statistically significant at α = 0.01 level as 0.000<0.01. For the entire model, the significant value, α < 0.01, indicates that the whole model is perfectly significant at a 1% level. The estimated model parameters for variables displaying zero coefficients indicate the status quo level (reference level). Coefficients for the other six levels have recorded values relative to the three references described above.

Table 4: Maximum likelihood estimation analysis for all respondents

Parameter Variable

Estimate

S.E.

χ2

Pr>χ2

Environmental strategy to protect coral reefs
L3-All known and unknown coral reefs conservation (AKUCC)

2.162

0.29

53.20

0.000

L2-All known coral reef conservation (AKCC)

2.956

0.31

92.93

0.000

L1-Identified coral reefs conservation (Status quo)

0

.
Local economy enhancement
L3-Creating more opportunities for locals to establish with high-income generations

3.675

0.42

76.32

0.000

L2-Encourage small-scale local businesses which reflect the Sri Lankan culture

3.379

0.44

59.40

0.000

L1-Benefits capturing by well-established businesses (Status quo)

0

Management and preservation payment
L3-SLR1000

1.595

0.25

41.06

0.000

L2-SLR500

2.147

0.27

62.64

0.000

L1-SLR0 (Status quo), No payment currently

0

Factors Affecting Conservation and Economic Activities

The first attribute tested is “environmental strategy to protect coral reefs.” The estimated coefficient of the first attribute, L1, is zero, as this is the status quo or reference level. It represents the current status of the resource. The part-worth utility (estimated coefficient) for “all known coral reef conservation” (AKCC) L2 is +2.956, which shows as the highest coefficient. “All known and unknown coral reef conservation” (AKUCC), L3 is +2.162, which indicates the second-highest part-worth utility component. The study area is highly known for coral reef-based tourism and is widely used for research. The unknown coral area may be a fantasy for the general public, hence a low preference for unexplored reef areas. Both L1 and L2 variables in attribute one are significant at α = 0.01, (1%) level, as Pr > χ2 value 0.000<0.01. The following attribute tested in this model was “local economy enhancement.” Benefits captured by well-established businesses (L1) is the current situation (status quo) in coral reef areas, which is structured zero. The part-worth utility for the variable (L2) “encourage small scale local businesses which reflect the Sri Lankan culture” is +3.379, while the part-worth utility (L3) is +3.675. Accordingly, L2 prefers over status quo (L1), while L3 prefers L1 and L2. Creating more opportunities for locals to establish with high-income generations from coral reefs is preferred over L2 and L1, which means L3 becomes the preferable level of the second attribute. This preference reveals the sustainable development of coral reefs by encouraging conservation and uplifting the local economy through the first two attributes. Further, all the variables in attribute two are significant at α = 0.01 (1%) as 0.00<0.01; parameter values tested under this attribute are highly significant. The third attribute tested under the model is “WTP” (Management and preservation payment). This WTP value contributes monthly from people towards the management and conservation cost for the coastal resources. The status quo remains the “SLR 0” (No payment). The SLR500 (L1) is highly favorable +2.147 over the status quo (No payment) and SLR1000. The estimated parameter for SLR1000 is +1.595, which is less favorable for SLR1000. Two parameters, L1 and L2, tested under this attribute, are also perfectly significant as Pr > χ2 values. Both are significant at α = 0.01 or 1% level. Thus, all the selected attributes considered to obtain the maximum utility from the conservation, management, and preservation of coastal natural resources are estimated to be crucial in the choices preferred by people.

‘Users’ Perception of Conservation and Economic Enhancement

Users’ perceptions of conservation and economic enhancement in coastal areas can be used to validate CE results. According to average public perception, more conserved coastal areas strongly agree with all the factors. The following have recorded more than 50% responses for the “strongly agree” category among the perceptions. They enjoy many things, including natural beauty, feeling fresh sea air, waves, and sunshine cures. Further, people felt relaxed (mind and body), gathered with friends/family, escaped the stress/pressure of work, and enhanced the local economy. However, more than 30% of the share agreed on category responses of enjoying fresh sea air and waves and sunshine cures, exercise, and leisure walks. Gathering with friends/family, being alone, and making seafood safer have also been recorded. Exercise, leisure walks, and meeting new people are neutral to more than 30% of respondents, and other categories are less than 30%. The importance of improving selected features in the case study area is displayed in Figure 1. On average, the public has a more significant percentage of enhancing the features chosen in the case study area under “significant” categories. Except for the increase of neighborhood property value near 40% of responses, all other responses have more than 40% of public responses. The most critical features under the category of “extremely important” were saving the natural resources for the future, reducing the pollution of the natural environment, and protecting the flora and fauna species in the coastal area.

fig 1

Figure 1: Public perceptions of ranking the conservation of coastal areas

The data regarding the “problems faced by people in coastal areas relative to the case study area” might provide essential facts in the future management of these areas. The categories of strongly disagree and disagree responses are less than 5% and 15%, respectively, for all problems suggested in this study. More than 50% of the respondents strongly agree with the existing problem of improper garbage disposal. Further, more than 25% of respondents strongly agree with inadequate parking areas, unclean environment, and poor sanitary facilities. More than 25% agree with deficient parking areas, messy environment safety issues (nearly 60% responses), insufficient clean facilities (more than 40%), and improper garbage disposal. Responses have recorded the neutral category (more than 20%) for all mentioned problems in the case study area, except improper garbage disposal (less than 10%) (Figure 2).

fig 2

Figure 2: Public perception of selected attributes

Public perception related to selected attributes in coastal conservation is displayed in Figure 2. Environmental sustainability and protection of natural coastal lives, including corals, have recorded the highest percentage of responses under significant sections and no answers for categories of somewhat, not significant, or not at all. These facts validate the CE results. For example, the “environmental sustainability and protection of natural coastal lives” has the highest percentage of ‘respondents’ share. Further, their parameter used in CE under (“AKCC” and “AKUCC”) have estimated the highest coefficients respectively, +2.956, which has the highest recorded coefficient, and +2.162 as the second-highest part-worth utility. Further, improvement of the local economy has a share of responses of 37% of the sample. Regarding conserving coastal natural resources, 42% of respondents share the “extremely important” category. Environmental sustainability was rated “extremely important” by 59%, while “protecting natural coastal life, including corals,” was rated 68%. More than a 30% share of responses to all the factors for the “important” type.s Only 3% of responses have been recorded as not crucial for the attribute charge for conserving coastal natural resources/WTP. In comparison, 42% agreed with choosing extremely important, and 39% agreed with choosing “important” categories. This result ratifies the CE results.

Probability for Conservation and Local Economy Enhancement

A probability test can be defined as the level of marginal significance within a statistical test representing the probability of the occurrence of a given event. The parameters shown in Table 4 are used to estimate the probability associated with the nine alternatives of the study. The ranking of the variables suggests that the best three preferences are AKCC with 22.1% preference, WTP500 with 19.7% preference, and creating more opportunities for locals (CMOFL) with 18.8% preference, respectively. However, the results show the importance of each variable based on respondent preference when considering 27 individual variables (Figure 3).

fig 3

Figure 3: Probability associated with each variable

Discussion

Southern coral reefs have been facing high degradation issues, and human activities have accelerated it drastically. The area has a high demand for coastal recreational and other uses from local and foreign tourists and natural hazards (MMDE, 2016). Local people should determine the conservation of coastal areas for future generations or covert for local area enhancement. In a democratic society, it can be decided by quantifying public preferences. In Figure 1, more than 80% of people identified these areas as extremely important in a) reducing pollution, b) protecting flora and fauna, c) increasing tourism, and d) saving natural resources for the future. This result is a clear signal for coastal area conservation and local area enhancement through ecotourism. The perception reported in Figure 2 also confirmed a similar trend. The preservation of all known corals (AKCC) with the highest probability value of 22.1% in Figure 3 indicates that stakeholders’ highest preference is conservation. Among the Southern coastal areas, Mirissa has the highest tourism attraction. It is one of the coastal areas with the highest mean coral cover of 23.97% [18]. The most significant feature is that the highest live coral is available in the same area, which should be protected at any cost. This result should be an essential aspect of future management and policymaking on coastal conservation. Furthermore, these results can be replicated elsewhere in estimating the monetary value of preserving coastal resources that deliver the best public utility using benefit transfer methods. The significant result of this research is not only about the natural capital in the case study area but also provides public utility in terms of economic value. For example, these results further describe complementary human-made capital like “local economy enhancement” related activities that can create additional economic outputs for the area. This study has represented the importance of conserving coastal natural resources and some identifiable essential policy implications.

First, selected attributes of CE, the results will enhance the ‘users’ experiences with estimated monetary value (WTP) for each alternative combination (Table 4). The identified range of alternatives and levels of choices, some potential options can create more economic benefits for the area by maximizing public welfare. For example, there are fewer alternative services/facilities in the current situation. However, they can enhance and contribute to the quality of public life in the coastal areas in many ways. These include creating more business opportunities for locals, encouraging small-scale local businesses, and environmental strategies, including coral conservation, to have high tourism attractions. CE results have recorded that all the alternatives combined with those services/facilities are significant. Further, investment options under the attributes of “local economy enhancement” and “environmental strategy to protect coral reefs” will improve the economic benefits by enhancing the quality of livelihood. Local financial improvement will automatically enhance participation in economic activities in the investment as mentioned earlier options. Secondly, the investment in conserving coastal public open spaces in terms of “environmental strategy to protect coral reefs” and related activities can add value to the cultural ecosystem services-based benefits. As the results revealed, the most preferred variables estimated by the model are AKCC (all-known coral conservation) and CMOFL (creating more opportunities for locals) with a WTP of SLR500. Choosing this alternative over the other 24 variables, even having SLR0 WTP (No payment), is a remarkable finding deeply considered in policy implications. The third aspect is policy implications derived from this research and concentrating on using public funds to conserve coastal resources. General preference for an attribute can be identified as helpful information on how funds should be invested with more advantages. The study results have shown that the public has agreed with WTP over the status quo scenario. The second most preferred variable that resulted from the model is the WTP of SLR500. The results of the public attitude examination reveal that the public has agreed with the “charge for the conservation of coastal natural resources.” Further, the results highlighted some problems the public faces in the existing situation and the fewer chances to experience what the public is looking for from coastal public open spaces. This fact proves why the public rejects the current condition of the selected area as a case study compared to the other alternatives shown in the choice card with price package (WTP).

Results reveal that “environmental strategy to protect coral reef” related activities will firstly append economic value to coastal conservation. The first recorded probability among the 27 variables is AKCC (all known coral conservation). Furthermore, the second is the WTP of SLR500, and the third is CMOFL (creating more opportunities for locals). Finally, this research has indicated vital information regarding the values of a range of conservation of coastal resources by users. For example, suppose the responsible parties of coastal public open spaces give considerable attention to valued public opinions and choices and interpret the results. In that case, how responsible parties can manage practical resource allocation decisions will be clear. Further, this research has confirmed the effectiveness of using the choice experiment method used in the study to reveal public preferences. Thus, CE can be a convenient tool to uncover public perception since it can provide in-depth information on ‘individual’ preferences. Future studies can be done with a larger respondent sample or specific visitor group to further explore this research’s findings.

Author Contributions

“Conceptualization, I.A., and P.W.; methodology, P.W.; software, P.W., and I.A.; validation, I.A., P.W., and P.B.; data; I.A.; formal analysis, I.A, and P.W.; investigation, P.W.; resources, I.A.; writing—original draft preparation, I.A., P.W.; writing—review and editing, P.W. and P.B.; visualization, I.A.; supervision, P.B., and P.W. All authors have read and agreed to the published version of the manuscript” Please turn to the CRediT taxonomy for the term explanation. Authorship must be limited to those who have contributed substantially to the work reported.

Funding

This research received no external funding.

Institutional Review Board Statement

Not applicable.

Informed Consent Statement

Not applicable.

Data Availability Statement

Sample data are available upon request.

Acknowledgments

None

Conflicts of Interest

The authors declare no conflict of interest

References

  1. Seneviratne C (2005) Coastal Zone Management in Sri Lanka: Current Issues and Management Strategies.
  2. White AT, Virginia B, Gunathilake T (1997) Using Integrated Coastal Management and Economics to conserve coastal tourism resources in Sri Lanka. Ambio 26: 335-344.
  3. Wattage P, Mardle S (2007) Total economic value of wetland conservation in Sri Lanka identifying use and non-use values. Wetlands Ecology and Management 16: 359-369.
  4. Lipton DW, Wellman K, Shleifer IC, Weiher RF (1995) Economic Valuation of Natural Resources: A Handbook for Coastal Resource Policymakers. Maryland: s.n.
  5. Wattage P, Simon M (2005) Stakeholder preferences towards conservation versus development for a wetland in Sri Lanka. Journal of Environmental Management 77: 122-132. [crossref]
  6. Lowry K, Wickramarathna H (1988) Coastal Area Management in Sri Lanka. Ocean Yearbook Online 7: 263-293.
  7. Navrud S, Kirsten GB (2007) Consumers’ preferences for green and brown electricity: a choice modeling approach. Revue d’économie politique 117: 795-811.
  8. Cassetta E, Random Utility Theory. In: Springer Optimization and Its Applications (volume 29) sl. sn. Pg: . 89-167.Christie M, et al., (2005) Valuing the diversity of biodiversity. Ecological economics, 2009, 4 October, 58(2), Pg: 304-317.
  9. Remoundou K, Phoebe K, Areti K, Paulo A. Nunes c, Michalis S, et al., (2009) valuation of natural marine ecosystems: an economic perspective. Environmental Science & Policy 12: 1040-1051.
  10. Hanley N, Wright RE, Adamowicz V (1998) Using Choice Experiments to Value the Environment. Environmental and Resource Economics, 11: 413-428.
  11. Wattage P, Glenn H, Mardle S, Van Rensburg T, Grehan A, et al. (2011) Economic value of conserving deep-sea corals in Irish waters: A choice experiment study on Marine Protected Areas. Fisheries Research 107: 59-67.
  12. McFadden D (1974) Conditional logit analysis of qualitative choice behavior. In: Zarembka, P. (Ed.), Frontier in Econometrics., Academic Press, Pg: 105-142.
  13. Cleland J, McCartney A (2010) Putting the Spotlight on Attribute Definition: Divergence Between Experts and the Public, l Environmental Economics Research Hub.
  14. Ministry of Mahaweli Development and Environment (2016) S. L., International Research Symposium Proceedings. Colombo-Sri Lanka: Sri Lanka Next-“A Blue-Green Era”, Conference and Exhibition, Pg: 88-89.
  15. Wattage P (2011) Valuation of ecosystem services in coastal ecosystems: Asian and European perspectives. Environment for Development, Ecosystem Services Economics, (ESE), Working Paper Series,, Paper N° 8, Division of Environmental Policy Implementation, The United Nations Environment Program.
  16. Hoyos D (2010) The state of the art of environmental valuation with discrete choice experiments. Ecological economics 69: 1595-1603.
  17. Louviere JJ, Hensher DA, Swait JD (2000) Stated choice methods: analysis and applications. s.l., Cambridge University Press.
  18. Anon (2019) Master plan on coast conservation & tourism development within the coastal zone from Negombo to Mirissa in Sri Lanka, s.l.: Environment, Coast Conservation, and Coastal Resource Management Department Ministry of Mahaweli Development.

Berkeley, Anti-Semitism, and AI-Suggested Remedies: Current Thinking and a Future Opportunity

DOI: 10.31038/CST.2024913

Abstract

This study examines the growing anti-Semitism on the Berkeley campus. The article combines simulations of anti-Semitic attitudes with AI proposed solutions. The technique is based on Mind Genomics, which searches for attitudes in the population. These mindsets are various approaches to making judgments based on the same data or information. The research demonstrates the benefits of mimicking biases while also employing artificial intelligence to provide solutions to such preconceptions.

Introduction – The Growth of Anti-Semitism

The current political climate has fueled anti-Semitism, both locally and globally. Recent years have witnessed an upsurge in hate speech and discriminatory actions, allowing extremist ideologies to spread and gain acceptability. In this toxic environment, anti-Semitic beliefs are more likely to propagate and manifest as threatening and aggressive behavior. The present political context, both locally and globally, has been blamed for some of today’s “newest incarnation” of anti-age-old Semitism’s myths. Recent years have witnessed an upsurge in hate speech and discriminatory actions, allowing extremist ideologies to spread and gain acceptability. In this toxic environment, anti-Semitic beliefs are more likely to propagate and manifest as threatening and aggressive behavior [1-5]. Covert but growing acceptance of anti-Semitism has resulted in an increase in hate speech and acts among certain organizations. As a result, a toxic environment has formed in which individuals feel free to express their anti-Semitic views without fear of repercussions. Furthermore, as both parties have become more entrenched and unwilling to engage in genuine negotiations, the Israeli-Palestinian issue has become more polarized. Anti-Semitism has become stronger in the current political climate, both locally and globally. The rise in hate speech and discriminatory conduct in recent years has provided a forum for extreme ideologies to spread and gain support. Anti-Semitism is more likely to spread in this poisoned climate, showing itself as violent and deadly behaviors [6-11]. Anti-Semitic feelings are common in America, especially among young people. These feelings may be a mirror of larger social problems including xenophobia and the growth of nationalism. In today’s politically sensitive environment, young people could be more vulnerable to the influence of extreme beliefs or extremist organizations. Propaganda and false information demonizing specific groups may also be the source of the hatred and intolerance becoming increasingly public and readily expressed.

Anti-Semitism in Higher Academe, Specifically UC Berkeley

Anti-Semitism has recently increased on college campuses, particularly at UC Berkeley, although it seems to be widespread as of this writing (March 2024). This might be due to a number of causes, including the impact of extremist organizations and the growing polarization of political beliefs. In addition, social media has been used to organize rallies against pro-Israel speakers and propagate hate speech. A lack of education and understanding of the history and consequences of anti-Semitism may contribute to the anti-Semitism pandemic at UC Berkeley. Many students may be unaware of the full ramifications of their words and actions, thereby fueling a vicious cycle of hate and prejudice toward Jews. Furthermore, the university’s failure to respond to and condemn anti-Semitic offenses may have given demonstrators the confidence to act without concerns about negative consequences [12-16]. There are most likely many explanations for the recent surge of anti-Jewish sentiment at the University of California, Berkeley. The ongoing wars in the Middle East, particularly those involving the Israeli-Palestinian conflict, might be one direct reason. This has the capacity to elicit strong emotions and generate conflicting views regarding Israel and its activities. Protests and threats against the Israel speaker may have stemmedfrom her apparent sympathy for the Israeli government’s harsh policies or practices. It is possible that university demonstrators responded against the speaker because they considered their affiliations or ideas of view caused unfairness or harm. The timing of this hate campaign may be related to recent events in Israel and its ties with other countries in the region. For example, a disputed decision or action by the Israeli government might reignite interest and support for anti-Semitism. Furthermore, the ubiquity of social media and instant messaging may affect how rapidly information travels and how protests are planned [17-20].

Mind-Sets Emerging from Mind Genomics and Mind-Sets Synthesized by AI

The emerging science of Mind Genomics focuses on the understand of how people make decisions about the everyday issues in their lives, viz., their normal, quotidian existence. Rather than focusing on experiments which put people in artificial situations in order to figure out ‘how they think’, Mind Genomics does simple yet powerful experiments. The different ways people think about the same topic become obvious from the results of a Mind Genomics study.

Mind Genomics studies are executed in a systematic fashion, using experimental design, statistics (regression, clustering) and then interpretation to delve deep into a person’s mind. The “process” of Mind Genomics begins by having the researcher develop questions about the topic, and, in turn, provide answers to those questions. The questions are often called ‘categories’, the answers are often called ‘elements’ or ‘messages.’ The questions deal with the different, general aspects of a topic. They should ‘tell a story’, or at least be able to be put together in a sequence which ‘tells a story’. The requirement is not rigid, but the ‘telling a story’ promotes the notion that there should be a rationale to the questions. In turn, the answers or elements are specific messages, phrases which can stand alone. These elements paint ‘word pictures’ in the mind of the respondent. The process continues, with the respondent reading vignettes, combinations of answers or elements, but without the questions. The respondent reads each vignette, rates the vignette, and at the end the Mind Genomics database comprises a set of vignettes (24 per respondent), the rating of the vignette, and finally the composition of the vignette, in terms of which elements appear in each vignette, and which elements are absent. The final analyses uses OLS (ordinary least-squares) regression to identify which particular elements ‘drive’ the response, as well as cluster analysis to divide the set of respondents into smaller groups based upon the similarity of patterns. Respondents with similar patterns of elements ‘driving’ the response are put into a common cluster. These clusters are called mind-sets. The mind-sets are remarkably easy to name because the patterns of strong performing elements within a mind-set immediately suggest a name for that mind-set.s All of a sudden, this blooming, buzzing confusion comes into clear relief and one sees the rules by which a person weights the different messages to assign the rating [21-25]. The development of mindsets through Mind Genomics leads naturally to the question about the use of artificial intelligence, AI, to synthesize these mindsets. The specific question is whether AI can be told that there are a certain number of mindsets and then instructed to synthesize those mindsets. The difference here is that AI is simply informed about the topic, given an abbreviated ‘introduction, and immediately instructed to create a certain number of mindsets, and of course afterwards answer questions about these mindsets, such as the name of the mindset, a description of the mindset, how the mindset react would to specific messages, slogans with which to communicate with the mind-set, etc. It will be that use of AI which will concern us for the rest of this paper, and especially a demonstration of what can be done with AI using Mind Genomics ‘thinking’ about the mind-sets based upon responses to the issues of the everyday.

A Worked Example Showing the Synthesis of Mind-Sets in Berkeley8803

The process begins by briefing AI about the topic. Table 1 shows the briefing given to AI. The specific instantiation of AI is called SCAS (Socrates as a Service.) SCAS is part of the BimiLeap platform for Mind Genomics. The text in Table 1 is typed into SCAS in the Mind Genomics platform. Note that the topic is explained in what might generously be labelled ‘sparsely.’ There is really no specific information.

Once the user has briefed SCAS (AI) has been briefed, it is a matter of iterations. Each iteration emerging from the AI ends up dealing with a specific mind-set. Occasionally the iteration fails, and the user has to return to try the iteration once again. The iterations require about 15 to 20 seconds each. The iterations are recorded in an Excel workbook. They are then analyzed after the study has been completed. The user might run 5-10 iterations in a matter of a few minutes. Each iteration, as noted above, is put into a separate tab in the Excel ‘Idea Book’. A secondary set of analyses, built in to the prompted by the user and carried out by AI works on the answers and provides additional insight. Table 2 shows the results from the iterations, generating the mind-sets. Note that the various iterations generated seven mind-sets, not six. The reason is that each iteration generated only one mind-set, even though the briefing in Table 1 specified six mind-sets. Each iteration begins totally anew, without any memory of the results from the previous iterations. The consequence is that SCAS (viz., AI) may return with many more different mind-sets since each iteration generates one mind-set in isolation.

Table 1: The briefing question provided to AI (SCAS)

tab 1

Table 2: AI Simulation of mind-sets of Berkeley protesters against Israel and an IDF speaker

tab 2(1)

tab 2(2)

Benefits from AI Empowered by Mind Genomics Thinking to Synthesize Mind-sets

Mind Genomics allows us to better comprehend the protestors’ individual tastes, values, and views by breaking them down into different mindsets. Having this information is essential for creating communication plans and focused interventions. AI enables us to analyze vast amounts of data and simulate a variety of scenarios. It can decipher complex data and identify patterns and trends that are not immediately apparent to human viewers. Artificial intelligence (AI) has the potential to help us make better decisions by helping us predict the potential outcomes of certain strategies and actions. Mind Genomics thinking empowering AI Intelligence simulation capabilities can allow us to analyze and understand the different mindsets of the protesters at UC Berkeley. Mind Genomics allows us the idea to segment the protesters based on their unique perceptions, attitudes, and beliefs towards the Israel speaker. This will give us a deeper insight into the underlying motives and triggers of their intolerant behavior. In turn, using AI almost immediately enables us create to virtual scenarios, simulate various perspectives, and then synthesize the array of reactions of the protesters [26]. This real-time synthesis of different mindsets may enable the creation of meaningful, feasible strategies to counter the intolerant antisemitism at a faster pace. Simulating this type of thinking and behavior is meaningful because it allows us to explore a wide range of possibilities and outcomes in a controlled environment. It provides us with valuable insights into the dynamics of group behavior and the factors that drive intolerance and protest movements. By conducting simulations, we can test different strategies and interventions in a risk-free setting and identify the most effective approaches. Rather of falling for artificial intelligence’s tricks, we should use its powers to improve our comprehension and judgment . Artificial intelligence (AI) has the potential to improve our capacity to evaluate complicated data and model various situations, opening up new avenues for investigation. We can learn more about the actions and motives of the UC Berkeley protestors by fusing the analytical framework of Mind Genomics with the computing capacity of AI. This makes it possible for us to examine the fundamental causes of intolerance and anti-Semitism in academic settings in more detail.

How AI can Synthesize the Future of Future of the Young Haters in UC Berkeley

As a final exercise, AI (SCAS) was instructed to use its ‘knowledge;’ about the mind-sets of students to predict their future. These were called the ‘young haters in UC Berkeley’. The request to AI was to predict their future. The prediction by AI appears in Table 3. It is clear from Table 3 that AI is able to synthesize what might be a reasonable future for the young haters in UC Berkeley. Whether the prediction is precisely correct or not is not important. What is important is the fact that AI can be interrogated to get ideas about the future of students who do certain things, about the nature of mindsets of people who hold certain beliefs, as well as issues which ordinarily would tax one’ thinking and creative juices but might eventually emerge given sufficient effort. The benefit here is that AI can be reduced to iterations, each of which takes approximately 15 seconds, each of which can be further analyzed subsequently by a variety of queries, and which together generate a corpus of knowledge.

Table 3: AI synthesis of the future of the young haters in UC Berkely

tab 3

Discussion and Conclusions

A House of Social Issues and Human Rights – A Library and Database Located at UC Berkeley

Rather than looking at the negative of the resurgent anti-Semitism at Berkeley, and indeed around the world, let us see whether, in fact, the emergent power of AI can be used to understand prejudice and combat it, just as we have seen what it can do to help us understand the possible sources of the attacks at Berkeley. We are talking here about the creation of a database using AI to understand all forms of the suppression of human rights and to suggest how to reduce this oppression, how to ameliorate the problems, how to negotiate coexistence, how to create a lasting peace. We could call this The house of social issues and human rights, and perhaps even locate it somewhere at Berkeley. What would be the specifics of this proposition? The next paragraphs outline the vision. We may imagine a vast collection paper dealing with the presentation, analysis, discussion, and solution of societal concerns. This library, which is possible to construct in a few months at a surprisingly cheap cost (apart from the people who do the thinking), will be a complete digital platform where people can get resources, knowledge, and answers on urgent social problems from anywhere in the globe. There will be parts of the library devoted to subjects including human rights, environmental sustainability, education, healthcare, and poverty, among others. Articles, research papers, case studies, and other materials will be included in each part to assist readers in comprehending the underlying causes of these problems as well as possible solutions The library will act as a center for cooperation and information exchange, enabling people and communities to benefit from one another’s triumphs and experiences. With this wealth of knowledge at its disposal, the library will enable people to take charge of their own lives and transform their communities for the better. By encouraging individuals to join together and work together to create a more fair and equal society, this library will benefit the whole planet. The library will boost empathy and understanding by encouraging social problem education and awareness, which will result in increased support for underprivileged communities. The library’s use of evidence-based remedies will address structural inequities and provide genuine opportunities.

Books on human rights and world order adorn the shelves of a large library devoted to tackling social concerns globally. Every book includes in-depth assessments and suggested solutions for the problems that humanity now and in the future may confront. The library provides a source of information and inspiration for change, addressing issues ranging from wars and injustices to prejudice and inequality. The collection covers a wide range of topics, including access to education, healthcare, and clean water, as well as gender equality and the empowerment of marginalized communities. It explores the root causes of poverty, violence, and environmental degradation, offering strategies for sustainable development and peacebuilding. The diversity of perspectives and approaches within the library reflects the complexity and interconnectedness of global issues, encouraging dialogue and collaboration among researchers, policymakers, and activists. As visitors navigate the aisles of the library, they discover case studies and success stories from around the world, showcasing innovative solutions and best practices in promoting human rights and fostering a more just and equitable world order. They engage with interactive exhibits and multimedia resources, highlighting the power of storytelling and advocacy in driving social change and building solidarity among diverse populations. The library serves as a hub for research, advocacy, and activism, fostering a sense of collective responsibility and global citizenship among its users. Scholars and practitioners from various fields converge in the library, exchanging ideas, sharing expertise, and mobilizing resources to address pressing social challenges and advance the cause of human rights and justice. They participate in workshops, seminars, and conferences, deepening their understanding of complex issues and sharpening their skills in advocacy, diplomacy, and conflict resolution. The library serves as a catalyst for social innovation and transformative change, inspiring individuals and organizations to unite in pursuit of a more inclusive, peaceful, and sustainable world. Visitors to the library are encouraged to reflect on their own role in promoting human rights and upholding ethical principles in their personal and professional lives. They are challenged to think critically about the impact of their actions on others, and to explore ways in which they can contribute to positive social change and build a more resilient and compassionate society. The library serves as a place of introspection and inspiration, empowering individuals to become agents of change and advocates for justice and equality in their communities and beyond.

References

  1. Friedman S (2023) Good Jew, Bad Jew: Racism, anti-Semitism and the assault on meaning. NYU Press.
  2. Gertensfeld M (2005) The deep roots of anti-semitism in European society. Jewish Political Studies Review 17: 3-46.
  3. Ginsberg B (2024) The New American Anti-Semitism: The Left, the Right, and the Jews. Independent Institute.
  4. Greenwood H (2020) Corona pandemic opens floodgates for antisemitism. Israel Hayom. March 19, 2020.
  5. Spektorowski A (2024) Anti-Semitism, Islamophobia and Anti-Zionism: Discrimination and political Construction. Religions 15:74.
  6. Alexander JC, Adams T (2023) The return of antisemitism? Waves of societalization and what conditions them. American Journal of Cultural Sociology 11: 251-268.
  7. Jikeli G (2015) European Muslim antisemitism: Why Young urban males say they don’t like jews. Bloomington: Indiana University Press.
  8. Kushner T (2017) Antisemitism in Britain: Continuity and the absence of a resurgence? In Antisemitism Before and Since the Holocaust, 253-276. Cham: Palgrave Macmillan.
  9. LaFreniere Tamez HD Anastasio N, Perliger A (2023) Explaining the Rise of Antisemitism in the United States. Studies in Conflict & Terrorism, pp.1-22, Taylor & Francis.
  10. Lewis B (2006) The new antisemitism. The American Scholar 75: 25-36.
  11. Lipstadt DE (2019) Antisemitism: Here and Now. New York: Schocken.
  12. Bailard CS, Graham MH, Gross K, Porter E, Tromble R (2023) Combating hateful attitudes and online browsing behavior: The case of antisemitism. Journal of Experimental Political Science, First View, 1-14.
  13. Kenedy RA (2022) Jewish Students’ Experiences in the Era of BDS: Exploring Jewish Lived Experience and Antisemitism on Canadian Campuses. In Israel and the Diaspora: Jewish Connectivity in a Changing World (pp. 183-204). Cham: Springer International Publishing.
  14. Harizi A, Trebicka B, Tartaraj A, Moskowitz H (2020) A mind genomics cartography of shopping behavior for food products during the COVID-19 pandemic. European Journal of Medicine and Natural Sciences 4: 25-33.
  15. Burton AL (2021) OLS (Linear) regression. The Encyclopedia of Research Methods in Criminology and Criminal Justice 2: 509-514.
  16. Fishman AC (2022) Discrimination on College Campuses: Perceptions of Evangelical Christian, Jewish, and Muslim Students: A Secondary Data Analysis (Doctoral dissertation, Yeshiva University).
  17. Al Jazeera (English) (2024) US rights group urges colleges to protect free speech amid Gaza war.” Al Jazeera English, 1 Nov. 2023, p. NA. Gale Academic OneFile.
  18. Wu T, He S, Liu J, Sun S, Liu K, Han QL, Tang Y et al. (2023) A brief overview of ChatGPT: The history, status quo and potential future development. IEEE/CAA Journal of Automatica Sinica 10: 1122-1136.
  19. Radványi D, Gere A, Moskowitz HR (2020) The mind of sustainability: a mind genomics cartography. International Journal of R&D Innovation Strategy (IJRDIS) 2: 22-43.
  20. Papajorgji P, Moskowitz H (2023) The ‘Average Person ‘Thinking About Radicalization: A Mind Genomics Cartography. Journal of Police and Criminal Psychology 38: 369-380. [crossref]
  21. Shapiro I (2024) Even Jew-haters have Free Speech, But … inFOCUS, 18, 10+. Gale Accessed 29 Feb. 2024.
  22. Papajorgji P, Ilollari O, Civici A, Moskowitz H (2021) A Mind Genomics based cartography to assess the effects of the COVID19 pandemic in the tourism industry. WSEAS Transactions on Environment and Development 17: 1021-1029.
  23. Mulvey T, Rappaport SD, Deitel Y, Morford T, DiLorenzo A, et al. (2024) Using structured AI to create a Socratic tutor to promote critical thinking about COVID-19 and congestive heart failure Advances in Public Health, Community and Tropical Medicine APCTM-195 ISSN 2691-8803
  24. Milligan GW, Cooper MC (1987) Methodology review: Clustering methods. Applied Psychological Measurement 11: 329-354.
  25. Nassar M (2023) Exodus, nakba denialism, and the mobilization of anti-Arab Racism. Critical Sociology 49: 1037-1051.
  26. Lonas, Lexi (2023) “Palestinian Student Group At Center of Antisemitism, Free Speech Debate: SJP chapters said the world witnessed ‘a historic win for the Palestinian resistance: across land, air, and sea, our people have broken down the artificial barriers of the Zionist entity.’.” Hill, 16 Nov. 2023, p. 11. Gale Academic OneFile.

Comments on “Cancer Diagnosis and Treatment Platform Based on Manganese-based Nanomaterials.”

DOI: 10.31038/NAMS.2024722


Cancer is a serious disease that poses a significant threat to human health. Early diagnosis and treatment are crucial for improving patient survival rates. In recent years, the application of nanotechnology in the field of cancer, particularly the precision diagnosis and treatment platform based on manganese-based nanomaterials, has garnered considerable attention. This novel nanomaterial possesses unique physical and chemical properties that enable precise diagnosis and treatment at the level of cancer cells, offering new hope for cancer patients. Manganese-based nanomaterials hold immense potential and significant advantages in precision cancer diagnosis and treatment. Due to their nanoscale characteristics, these materials can penetrate tissues more effectively, achieving higher sensitivity and more accurate diagnosis. However, manganese-based nanomaterials also have some limitations. Firstly, the accuracy of manganese-based nanomaterials in cancer diagnosis still needs improvement. While these materials can identify cancer cells through targeted actions, their ability to recognize different types of cancer cells remains limited. This may result in misdiagnosis or underdiagnosis, affecting treatment outcomes. Therefore, further research and enhancement of the targeted recognition mechanism of manganese-based nanomaterials are needed to improve their accuracy in cancer diagnosis.

The application of manganese-based nanomaterials in cancer treatment also presents notable advantages. By modifying the surface properties of manganese-based nanomaterials and functionalizing them, targeted recognition and eradication of cancer cells can be achieved while minimizing damage to normal cells. Additionally, these nanomaterials can serve as carriers for loading chemotherapy drugs or photothermal agents, enabling targeted release and localized treatment to enhance treatment effectiveness and reduce side effects. This precise treatment strategy can effectively inhibit tumour growth and metastasis, prolonging patient survival and increasing treatment success rates. However, the drug release efficiency of manganese-based nanomaterials in cancer treatment needs improvement. Although these materials can efficiently transport anticancer drugs to tumour sites, their drug release rate and efficiency are still not ideal. This may lead to premature or inadequate drug release in the body, impacting treatment outcomes. Therefore, new material designs and drug release mechanisms need to be explored to enhance the drug release efficiency of manganese-based nanomaterials in cancer treatment.Furthermore, manganese-based nanomaterials exhibit good biocompatibility and biodegradability, posing no long-term toxic side effects on the human body, providing a reliable guarantee for clinical applications. While these materials demonstrate good biocompatibility in vitro studies, their toxicity and metabolic mechanisms in vivo remain unclear. This may limit the widespread application of these materials in clinical practice. Thus, more in vivo studies are required to understand the toxicity and biocompatibility of manganese-based nanomaterials to ensure their safety and efficacy. The stability and controllability of manganese-based nanomaterials in practical clinical applications still need further improvement. Additionally, the high production cost of manganese-based nanomaterials restricts their potential for large-scale applications. Therefore, despite the significant importance of manganese-based nanomaterials in cancer treatment, their limitations need to be carefully addressed to promote their broader application and development.

In conclusion, the precision diagnosis and treatment platform for cancer based on manganese-based nanomaterials holds tremendous potential and prospects for development, yet it also presents some limitations. With the continuous advancement and refinement of nanotechnology, it is believed that manganese-based nanomaterials will become an essential tool for cancer diagnosis and treatment in the future, offering patients a better quality of life and health. It is hoped that in the near future, this novel nanomaterial can be widely applied in clinical practice, bringing new hope and possibilities for overcoming cancer.

fig 1

Accelerated the Mechanics of Science and Insight through Mind Genomics and AI: Policy for the Citrus Industry

DOI: 10.31038/NRFSJ.2024713

Abstract

The paper introduces a process to accelerate the mechanics of science and insight. The process comprises two parts, both involving artificial intelligence embedded in Idea Coach, part of the Mind Genomics platform. The first part of the process identifies a topic (policy for the citrus industry), and then uses Mind Genomics to understand the three emergent mind-sets of real people who evaluate the topic, along with the strongest performing ideas for each mind-set. Once the three mind-sets are determined, the second part of the process introduces the three mind-sets and the strongest performing elements to AI in a separate ‘experiment’, instructing Idea Coach to answer a series of questions from the point of view of each of the three mind-sets. The acceleration can be done in a short period of time, at low cost, with the ability to generate new insight about current data. The paper closes by referencing the issues of critical thinking and the actual meaning of ‘new knowledge’ emerging from a world of accelerated mechanics of science and insight.

Introduction

Traditionally, policy has been made by experts, often consultants to the government, these consultants being experts in the specific topic, in the art and science of communication, or both. The daily press is filled with stories about these experts, for example the so-called ‘Beltway Bandits’ surrounding Washington D.C. [1].

It is the job of these experts to help the government decide general policy and specific implementation. The knowledge of these experts helps to identify issues of importance to the government groups to whom they consult. The ability of these expert to communicates helps to assure that the policy issues on which they work will be presented to the public in the most felicitous and convincing manner.

At the same time that these experts are using the expertise of a lifetime to guide policy maker, there is the parallel world of the Internet, source of much information, and the emerging world of AI, artificial intelligence, with the promise of supplanting or perhaps more gently, the promise of augmenting, the capabilities and contributions of these expert. Both the internet and AI have been roundly attacked for the threat that they pose [2]. It should not come as a surprise that the world of the Internet has been accused of being replete with false information, which it no doubt is [3]. AI receives equally brutal attacks, such as producing false information [4], an accusation at once correct and capable of making the user believe that AI is simply not worth considering because of the occasional error [5].

The importance of public policy is already accepted, virtually universally. The issue is not the general intent of a particular topic, but the specifics. What should the policy emphasize? Who should be the target beneficiaries of the policy? What should be done, operationally, to achieve the policy? How can the policy be implemented? And finally, in this short list, what are the KPI’s, the key performance indicators by which a numbers-hungry administration can discover whether the policy is being adopted, and whether that adoption is leading to desire goals.

Theory and Pragmatics – The Origin of This Paper

This paper was stimulated by the invitation of HRM to attend a conference on the Citrus Industry in Florida, in 2023. The objective of the conference was to bring together various government, business and academic interests to discuss opportunities in the citrus industry, specifically for the state of Florida in the United States, but more generally as well. Industry-center conferences of this type welcome innovations from science, often with an eye on rapid application. The specific invitation was to share with the business, academic and government audiences new approaches which promised better business performance.

The focus of the conference was oriented towards business and towards government. As a consequence, the presentation to the conference was tailored to show how Mind Genomics as a science could produce interesting data about the response to statements about policy involving the business of citrus. As is seen below, the material focused on different aspects of the citrus industry, from the point of view of government and business, rather than from the point of view of the individual citrus product [6-9].

The Basic Research Tool-Mind Genomics

At the time of invitation, the scope of the presentation was to share with the audience HOW to do a Mind Genomics study, from start to finish. The focus was on practical steps, rather than theory, and statistics. As such the presentation was to be geared to pragmatics, about HOW to do the research, WHAT to expect, and how to USE the results. The actual work ended up being two projects, the first project to get some representative data using a combination of research methods and AI, AI to generate the ideas and then research to explore the ideas with people. The second part, done recently, almost five months after the conference, expanded the use of AI to further analyze the empirical results, opening up new horizons for application.

Project #1: Understanding the Mind of the Ordinary Person Faced with Messages about Citrus Policy

The objective of standard Mind Genomics studies is to understand how people make decisions about the issues of daily life. If one were to summarize the goals of this first project, the following sentence would do the best job, and ended up being the sentence which guided the efforts. The sentence reads: Help me understand how to bring together consumers, the food trade, and the farmer who raises citrus products, so we can grow the citrus industry for the next decade. Make the questions short and simple, with ideas such as ‘how’ do we do things. The foregoing is a ‘broad stroke’ effort to under what to do in the world of the everyday. The problem is general, there are no hypotheses to test, and the results are to be in the form of suggestions. There is no effort to claim that the results tell us how people really feel about citrus, or what they want to do when the come into contact with the world of citrus as business, as commerce, as a regulated piece of government, viz., the agriculture industry. In simple terms, the sentence in bold is a standard request that is made in industry all the time, but rarely treated as a topic to be explored in a disciplined manner.

Mind Genomics works by creating a set of elements, messages about a topic, and mixing/matching these elements to create small vignettes, combinations comprising a minimum of two messages and a maximum of four messages. The messages are created according to an underlying structure called an experimental design. The respondent, usually sitting at a remote computer, logs into the study, reads a very short introduction to the study, and then evaluates a set of 24 vignettes, one vignette at a time. The entire process takes less than 3-4 minutes and proceeds quickly when the respondents are members of an on-line panel and are compensated for their participation by the panel company.

The Mind Genomics process allows the user to understand what is important to people, and at the same time prevents the person from ‘gaming’ the study to give the correct answer. In most studies, the typical participant is uninterested in the topic. The assiduous researcher may instruct the participant to pay attention, and to give honest answers, but the reality is that people tend to be interested in what they are doing, not in what the researcher wants to investigate. As a consequence, their answers are filled with a variety of biases, ranging from different levels of interest and involvement to distractions by other thoughts. The Mind Genomics process works within these constraints by assuming that the respondent is simply a passive observer, similar to a person driving through their neighborhood, almost in an automatic fashion. The person takes in the information about the road, traffic, and so forth, but does not pay much attention. At the end, the driver gets to where they are going, but can barely remember what they did when asked to recall the steps. This seems to be the typical course of events.

The systematic combinations mirror these different ‘choice points.’ The assumption is that the respondent simply looks at the combination, and ‘guesses’, or at least judges with little real interest. Yet, the systematic variation of the elements in the vignettes ends up quickly revealing what elements are important, despite the often heard complain that ‘I was unable to see the pattern, so I just guess.’

The reasons for the success of Mind Genomics are in the design and the execution [10-12].

  1. The elements are created with the mind-set of a bookkeeper. The standard Mind Genomics study comprises four questions (or categories), each question generating four answers (also called element). The questions and answers can be developed by professionals, by amateurs, or by AI. This paper will show how AI can generate very powerful, insight questions and answers, given a little human guidance by the user
  2. The user is required to fill in a templated form, asking for the questions (see Figure 1, Panel A). When the user needs help the AI function (Idea Coach) can recommend questions once Idea Coach is given a sense of the nature of the topic. Figure 1, Panel B shows the request to Idea Coach in the form of a paragraph, colloquially called a ‘squib.’ The squib gives the AI a background, and what is desired. The squib need not follow a specific format, as long as it is clear. The Idea Coach returns with sets of suggested questions. The first part of the suggest questions appears in Figure 1, Panel C, showing six of the 15 questions returned by the AI-powered Idea Coach. The user need only scroll through to see the other suggestions. The user can select a question, edit it, and then move on. The user can run many iterations to create different sets of questions and can either edit the squib or edit the question, or both. At the end of the process, the user will have created the four questions, as shown in Figure 1, Panel D. Table 1 shows a set of questions produced by the Idea Coach, in response to the squib.
  3. The user follows the same approach in order to create the answers. This time, however, the squib does not need to be typed in by the user. Rather, the question selected by the user, and after editing, becomes the squib for Idea Coach to use. For this project, Figure 1, Panel D shows the four squibs, one for each question. Idea Coach once again returns with 15 answers (elements) for each squib. Once again the Idea Coach can be used, so that the Idea Coach becomes a tool to help critical thinking, providing sequential sets of 15 answers (elements). From one iteration to another the 15 answers provided by Idea Coach differ for the most part, but with a few repeats Over 10 or so iterations it’s likely that most of the answers will have been presented.
  4. Once the user has selected the questions, and then selected four answers for each question, the process continues with the creation of a self-profiling questionnaire. That questionnaire allows the user to find out how the respondent thinks about different topics directly or tangentially involved with the project. The self-profiling questionnaire has a built-in pair questions to record the respondent’s age (directly provided), and self-described gender. For all questions except that of age, the respondent is instructed to select the correct answer to the question, the question presented on the screen, the answers presented in a ‘pull-down’ menu which appears when the corresponding question is selected for answering.
  5. The next step in the process requires the user to create a rating scale (Figure 2, Panel A). The rating scale chosen has five points as show below. Note that the scale comprises two parts. The first part is evaluative viz., how does the respondent feel (hits a nerve vs hot air). The second part is descriptive (sounds real or does not sound real). This two-sided scale enables the user to measure both the emotions (key dependent variable for analysis), as well as cognitions. For this study, the focus will be on the percent of ratings that are either 5 or 4 (hitting a nerve). Note that all five scale points are labelled. Common practice in Mind Genomics studies has been to label all the scales for the simple reason that most users of Mind Genomics results really are not focused on the actual numbers, but on the meaning of the numbers.
    Here’s a blurb you just read this morning on the web when you were reading stuff.. What do you think
    1=It’s just hot air … and does not sound real
    2=It’s just hot air … but sounds real
    3=I really have no feeling
    4=It’s hitting a nerve… but does not sound real
    5=It’s hitting a nerve .. and sounds real
  6. The user next create a short introduction to the study, to orient the respondent (Figure 2, Panel B). Good practice dictates that wherever possible the user should provide as little information about the topic as possible. The reason is simple. It will be from the test stimuli, the elements in the 4×4 collection, or more specifically the combinations of those elements into vignette, that the respondent will make the evaluation and assign the judgment. The purpose of the orientation is to make the respondent comfortable and give general direction. The exceptions to this dictum come from situations, such the law, where knowledge of other factors outside of the material being presented can be relevant. Outside information is not relevant here.
  7. The last step of the setup consists of ‘sourcing’ the respondents (Figure 2, Panel C). Respondents can be sourced from standing panels of pre-screened individuals, or from people one invites, etc. Good practice dictates working with a so-called online panel provider, which for a fee can customize the number and type of respondent desired. With these online panel providers the study can be done in a matter of hours.
  8. Once the study has been set-up, including the selection of the categories and elements (viz, questions and answers), the Mind Genomics platform creates combinations of these elements ‘on fly’, viz., in real time, doing so for each respondent who participates in the study. It is at the creation of the vignettes where Mind Genomics differentiates itself from other approaches. The conventional approach to evaluating a topic uses questionnaires, with the respondent present with stand alone ideas in majestic isolation, one idea at a time. The idea or topic might be a sentence, but the sentence has the aspects of a general idea, such as ‘How important is government funding for a citrus project.’ The goal is to isolate different, relevant ideas, focus the mind of the respondent on each idea, one at a time, obtain what seems to be an unbiased evaluation of the idea, and then afterwards to the relevant analyses to obtain a measure of central tendency, viz., an average, a median, and so forth. The thinking is straightforward, the execution easy, and the user presumes to have a sense of the way the mind of the respondent works, having given the respondent a variety of ‘sterile ideas’, and obtained ratings for each of the separate ideas.

fig 1

Figure 1: Set up for the Mind Genomics study. Panel A shows the instructions to provide four questions. Panel B shows the input to Idea Coach. Panel C shows the first part of the output from Idea Coach, comprising six of the 15 questions generated. Panel D shows the four questions selected, edited, and inserted into the template.

fig 2

Figure 2: Final steps in the set-up of the study. Panel A shows the rating scale; the user types in the rating question, selects the number of scale points, and describes each scale point. Panel B shows the short orientation at the start of the study. Panel C shows the request to source respondents.

Table 1: Questions provided to the user by AI embedded in Idea Coach

tab 1

Figure 3 shows a sample vignette as the respondent would see it. The vignette comprises a question at the topic, a collection of four simple statements, without any connectives, and then the scale buttons on the bottom. The respondent is presented with 24 of these vignettes. Each vignette comprises a minimum of two and a maximum of four elements, in the spare structure shown in Figure 3. There is no effort made to make the combination into a coherent whole. Although the combinations do not seem coherent, and indeed they are not, after a moment’s shock the typical respondent has no problem reading through the vignette, as disconnected as the elements are, and assigning a rating to the combination. Although many respondents feel that they are ‘guessing,’ the subsequent analysis will reveal that they are not.

fig 3

Figure 3: Example of a four-element vignette, together with the rating question, the 5-point rating scale, and the answer buttons at the bottom of the screen.

The vignettes are constructed by an underlying plan known as an experimental design. The experimental design for these Mind Genomics studies calls for precisely 24 combinations of elements, our ‘vignettes’. There are certain properties which make the experimental design a useful tool to understand how people think.

  1. Each respondent sees a set of 24 vignettes. That set of vignette suffices to do a full analysis on the ratings of one respondent alone, or on the ratings of hundreds of respondents. The design is explicated in Gofman and Moskowitz (2010) [13].
  2. The design calls for each element to appear five times in 24 vignettes and be absent 19 times from the 24 vignettes.
  3. Each question or category contributes at most one element to a vignette, often no elements, but never two or more elements. In this way the underlying experimental design ensures that no vignette every present mutually contradictory information, which could easily happen if elements from the same category appeared together, presenting different specifics of the same type of information.
  4. Each respondent evaluates a different set of vignettes, all sets structurally equivalent to each other, but with different combinations [13]. The rationale underlying this so-called ‘permutation’ approach is that the researcher learns from many imperfectly measured vignettes than from the same set of vignettes evaluated by different respondents in order to reduce error of measurement. In other words, Mind Genomics moves away from reducing error by averaging out variability to reducing error by testing a much wider range of combinations. Each combination tested is subject to error, but the ability to test a wide number of different combinations allows the user to uncover the larger pattern. The pattern often emerges clearly, even when the measurements of the individual points on the pattern are subject to a lot of noise.

The respondent who evaluates the vignettes is instructed to ‘guess.’ In no way is the respondent encouraged to sit and obsess over the different vignettes. Once the respondent is shown the vignette and rates it, the vignette disappears, and a new vignette appears on the screen. The Mind Genomics platform constructs the vignettes at the local site where the respondent is sitting, rather than sending the vignettes through the email.

When the respondent finishes evaluating the vignettes, the composition of the vignette (viz., the elements present and absent) is sent to the database, along with the rating (1-5, as show above) as well as the response time, defined as the number of seconds (to the nearest 100th) elapsing between the appearance of the vignette on the respondent’s screen and the respondent’s assignment of a rating.

The last pieces of information to be added comprise the information about the respondent generated by the self—profiling questions, done at the start of the study, and a defined binary transformation of the five-point rating to a new variable, called convenient R54x.. Ratings 5 and 4 (hitting nerve) were transformed to the value 100. Ratings 3,2,1 (not hitting a nerve) were transformed to the value 0. To the transformed values 0 or 100, respectively, was added a vanishingly small random number (<10-5). The rationale for the random number is that later the ratings would be analyzed by OLS (ordinary least-squares) regression and then by k-means clustering, with the focus on the coefficients to emerge from OLS regression as inputs to the clustering. To this end it was necessary to ensure that all respondent data would generate meaningful coefficients from OLS regression, a requirement only satisfied when the newly created binary variables were all different from each other. Adding the vanishingly small random number to each newly created binary variable ensured that variation.

The analysis of the ratings follows two steps once the ratings have been transformed to R54x. The first step uses OLS (ordinary least-squares) regression, at the level of the individual respondent. OLS regression fits a simple linear equation to the data, relating the presence/absence of the 16 elements to the variable R54x. The second step uses k-means clustering (Likas et. al., 2003) to divide the respondents into groups, based upon the pattern of the coefficients for the equation.

The equation is expressed as: R54x = k1A1 + k2A2 … k16D4. The OLS regression program has no problem creating an equation for each respondent, based upon the prophylactic step of having added a vanishingly small random number to each transformed rating. That prophylactic step ensures that the OLS regression will never encounter the situation of ‘no variation in the dependent variable’, R54x.

Once the clustering has finished, the cluster program assigns each respondent first into one of two non-overlapping clusters, and second into one of three non-overlapping clusters. In the nomenclature of Mind Genomics these clusters are called ‘mind-sets’ to recognize the fact that they represent different points of view.

Table 2 presents the coefficients for the Total Panel, then for the two-mind-set solution, and then for the three-mind-set solution. Only positive coefficients are shown. The coefficient shows the proportion of time a vignette with the specific element generate a value of 100 for variable R54x. There emerges a large range in the numerical values of 16 coefficients, not so much for the Total Panel as for the mind-sets. This pattern of large difference across mind-sets in the range of the coefficients for R54x makes sense when we consider what the clustering is doing. Clustering is separating out groups of people who look at the topic in the same way, and do not cancel each other. When we remove the mutual cancellation through clustering the result is that all of the patterns of coefficients in a cluster are similar. The subgroup no longer has averages of numbers from very high to very low for a single element, an average which suppressed the real pattern. No longer do the we have the case that the Total Panel ends up putting together streams flowing in different directions. Instead, the strengths of different mind-sets becomes far more clear, more compelling, and more insights driven.

We focus here on the easiest take, namely, to interpret the mind-set. It is hard to name mind-sets 1 of 2 and 2 of 2. In contrast, it becomes far easier to describe the different mind-sets. We look only at the very strong coefficients; those score 21 or higher.

  1. Mind-Set 1 of 3-Focus on interacting with users, include local rowers, consumers, businesses which grow locally, and restauranteurs.
  2. Mind-Set 2 of 3-Focus on publicizing benefits to consumers
  3. Mind-Set 3 of 3-Focus on communication

Table 2: Coefficients for the Total Panel, and then for the two-mind-set solution, and then for the three-mind-set solution, respectively.

tab 2

Table 2 shows a strong consistency within the segments, a consistency which seems more art than science. The different groups emerge clearly, even though it would be seemingly impossible to find patterns among the 24 vignettes, especially recognizing that each respondent ended up evaluating a unique set of vignettes. The clarity of the mind-set emerges again and again in Mind Genomics studies, despite the continue plaint by study respondents that they could not ‘discover the pattern’ and ended up ‘guessing.’ Despite that plaint, the patterns emerging make overwhelming sense, disposing of the need of some of the art of storytelling, the ability to craft an interesting story from otherwise boring and seemingly pattern-less data. A compelling story emerges just from looking at what element are shade, for each mind-set. Finally, the reason for the clarity ends up being the hard-to-escape reality that the elements all are meaningful in and of themselves. Like the reality of the everyday, each individual element, like each individual impression of an experience, ‘makes sense’.

The Summarizer-finding Deeper Meanings in the Mind-set Results

Once the study has finished, the Mind Genomics platform does a thorough ‘work-up’ of the data, creating models, creating tables of coefficients, etc. As part of this the Mind Genomics platform applies a set of pre-specified queries to the set of strong performing elements, operationally defined as those elements with coefficients of 21 or higher. The seemingly artificial lower limit of 21 comes from analysis of the statistical properties of the coefficients, specifically at what value of coefficient can user feel that the pattern of coefficients is statistically robust, and thus feel the pattern to emerge has an improved sense of reality.

The Summarizer is programmed to write these short synopses and suggestions, doing so only with the tables generated by the Mind Genomics platform, as shown above in Table 2. Thus, for subgroups which generate no coefficients of 21 or higher, the Summarizer skips those subgroups. Finally, the summarizer is set up to work for every subgroups defined in the study, whether age, gender, or subgroup defined by the self-profiling classification question in which respondent profile themselves on topics relevant to the study.

Table 3 shows the AI summarization of the results for each of the three mind-sets. The eight summarizer topics are:

  1. Strong performing elements
  2. Create a label for this segment
  3. Describe this segment
  4. Describe the attractiveness of this segment as a target audience:
  5. Explain why this segment might not be attractive as a target audience:
  6. List what is missing or should be known about this segment, in question form:
  7. List and briefly describe attractive new or innovative products, services, experiences, or policies for this segment:
  8. Which messages will interest this segment?

The open discussions, information sharing, and understanding of the challenges faced by farmers.

Table 3: The output of the AI-based Summarizer applied to the strong performing elements from each of the mind-sets in the three-mind-set solution.

tab 3(1)

tab 3(2)

tab 3(3)

tab 3(4)

tab 3(5)

Part 2: AI as a Tool to Create New Thinking, Create New Hypotheses

During the past six months of experience with AI embedded in Idea Coach, a new and unexpected discovery emerged, resulting from exploratory work by author Mulvey. The discovery was that the squib for Idea Coach could be dramatically expanded, moving it beyond the request for questions, and into a more detailed request. The immediate reaction was to explore how deeply the Idea Coach AI could expand the discovery previously made.

Table 4 shows the expanded squib (bold), and the what the Idea Coach returned with later on. The actual squib was easy to create, requiring only that the user copy the winning elements for each mind-set (viz., elements with coefficients of 21 or higher). Once these were identified and listed out, squib was further amplified by a set of six questions.

Idea Coach returned with the answers to the six questions for each of the three mind-sets, and then later did its standard analysis using the eight prompts. These appear in Table 4. It is important to note that Table 4 contains no new information, but simply reworks the old information. In reworking that old information, however, the AI creates an entirely new corpus of suggestions of insights.

From this simple demonstration emerges the realization that the sequence of Idea Coach, questions, answers, results, all emerging in one hour or less for a set of 100 respondents or fewer, can be further used to springboard the investigations, and create new insights. These insights should be tested, but it seems likely that a great deal of knowledge can be obtained quickly, at very low cost, with no risk.

Table 4: AI ‘super-analysis’ of results from an earlier Mind Genomic study, revealing three mind-sets, and the strong performing elements for each mind-set.

tab 4(1)

tab 4(2)

tab 4(3)

tab 4(4)

Discussion and Conclusions

This paper began with a discussion of a small-scale project in the world of citrus, a project meant to be a demonstration to be given to a group at the citrus conference in September 2023. At that time, the Idea Coach had been introduced, and was used as a prompt for the study. It is important to note that the topic was not one based on a deep literature search of existing problems, but instead a topic crafted to be of interest to an industry-sector conference. The focus was not on science to understand deep problems, but rather research on how to satisfy industry-based needs. That focus explains why the study itself focuses on a variety of things that one should do. The focus was tactics, not knowledge.

The former being said, the capability to accelerate and expand knowledge is still relevant, especially as that capability bears upon a variety of important issues. The first issue is the need to instill critical thinking into students [14,15]. The speed, simplicity, and sheer volume of targeted information may provide an important contribution to the development of critical thinking. Rather than giving students simple answers to simple questions, the process presented here opens up the possibility that the Idea Coach format shown here can become a true ‘teacher’, working with students to formulate questions, and then giving the students the ability to go into depth, in any direction that they wish, simply by doing an experiment, and then investigating in greater depth any part of the results which interest them.

The second issue of relevance is the potential to create more knowledge through AI. There are continuing debates about whether or not AI actually produces new knowledge [16,17]. Rather than dealing with that issue simply in philosophy-based arguments, one might well embark on a small, affordable series of experiments dealing with a defined topic, find the results from the topic in terms of mind-sets, and then explore in depth the mind-sets using variations of the strategy used in the second part of the study. That is, once the user has obtained detailed knowledge about mind-sets for the topic, there is no limitation except for imagination which constrains the user from asking many different types of questions about what the mind-sets would say and do. After a dozen or so forays into the expansion of knowledge from a single small Mind Genomics project, it would then be of interest to assess the degree to which the entire newly developed corpus of AI-generated knowledge and insight is to be considered ‘new knowledge’, or simply a collection of AI-conjectures. That consideration awaits the researcher. The tools are already here, the effort is minor, and what awaits may become a treasure trove of new knowledge, perhaps.

References

  1. Butz EL (1989) Research that has value in policy making: a professional challenge. American Journal of Agricultural Economics 71: 1195-1199.
  2. Wang J, Molina MD, Sundar SS (2020) When expert recommendation contradicts peer opinion: Relative social influence of valence, group identity and artificial intelligence. Computers in Human Behavior 107: 106278.
  3. Molina MD, Sundar SS, L T, Lee D (2021) “Fake news” is not simply false information: A concept explication and taxonomy of online content. American Behavioral Scientist 65: 180-212.
  4. Dalalah D, Dalalah OM (2023) The false positives and false negatives of generative AI detection tools in education and academic research: The case of ChatGPT. The International Journal of Management Education 21: 100822.
  5. Brundage M, Avin S, Clark J, Toner H, Eckersley P, et al. (2018) The malicious use of artificial intelligence: Forecasting, prevention, and mitigation. arXiv preprint arXiv: 1802.07228.
  6. Batarseh FA, Yang R (2017) Federal data science: Transforming government and agricultural policy using artificial intelligence. Academic Press.
  7. Ben Ayed R, Hanana M (2021) Artificial intelligence to improve the food and agriculture sector. Journal of Food Quality 1-7.
  8. Sood A, Sharma RK, Bhardwaj AK (2022) Artificial intelligence research in agriculture: A review. Online Information Review 46: 1054-1075.
  9. Taneja A, Nair G, Joshi M, Sharma S, Sharma S, et al. (2023) Artificial Intelligence: Implications for the Agri-Food Sector. Agronomy 13: 1397.
  10. Harizi A, Trebicka B, Tartaraj A, Moskowitz H (2020) A mind genomics cartography of shopping behavior for food products during the COVID-19 pandemic. European Journal of Medicine and Natural Sciences 4: 25-33.
  11. Porretta S, Gere A, Radványi D, Moskowitz H (2019) Mind Genomics (Conjoint Analysis): The new concept research in the analysis of consumer behaviour and choice. Trends in Food Science & Technology 84: 29-33.
  12. Zemel R, Choudhuri SG, Gere A, Upreti H, Deite Y, et al. (2019) Mind, consumers, and dairy: Applying artificial intelligence, Mind Genomics, and predictive viewpoint typing. In: Current Issues and Challenges in the Dairy Industry (ed. R. Gywali S. Ibrahim, & T. Zimmerman), Intech Open, IntechOpen. IBSN: 9781789843552, 1789843553
  13. Gofman A, Moskowitz H (2010) Isomorphic permuted experimental designs and their application in conjoint analysis. Journal of Sensory Studies 25: 127-145.
  14. Guo Y, Lee D (2023) Leveraging chatgpt for enhancing critical thinking skills. Journal of Chemical Education 100: 4876-4883.
  15. Ibna Seraj PM, Oteir I (2022) Playing with AI to investigate human-computer Interaction Technology and Improving Critical Thinking Skills to Pursue 21st Century Age. Education Research International.
  16. Schäfer MS (2023) The Notorious GPT: science communication in the age of artificial intelligence. Journal of Science Communication 22: Y02.
  17. Spennemann DH (2023) ChatGPT and the generation of digitally born “knowledge”: How does a generative AI language model interpret cultural heritage values? Knowledge 3: 480-512.
fig 1

Disruptive Activity of Acetic Acid of Salmonella enterica Serovar Typhimurium and Escherichia coli O157 Biofilms Developed on Eggshells and Industrial Surfaces

DOI: 10.31038/MIP.2024511

Abstract

Communities of enteropathogenic microorganisms adhere as biofilms to both natural and artificial surfaces encountered by eggs and chickens during production, constituting a major source of food cross-contamination. Given the rising bacterial resistance to chemical sanitary agents and antibiotics, there is a need to explore alternative approaches, particularly using natural products, to control the proliferation of these microorganisms along the surfaces of the poultry production chain. This study investigates and compares the bactericidal and antibiofilm properties of acetic, citric, and lactic acids against Salmonella enterica serovar Typhimurium and Escherichia coli O157 cells. Biofilms were allowed to develop on eggshells, stainless steel, and polystyrene surfaces at temperatures of 22°C and 37°C, and subsequently exposed to the acids for durations of 2 and 24 hours. The three organic acids exhibited varying degrees of reduction in planktonic, swarmer, and biofilm cells. Notably, acetic acid consistently produced the most promising outcomes, resulting in a reduction between 3 and 6.6 Log10 in the quantities of young and mature biofilm cells adhered to eggshells or stainless steel. Additionally, a decrease of 1 and 2.5 optical density units was observed in biofilms formed on the polystyrene surface. Overall, these findings suggest that acetic acid can effectively act as an anti-biofilm agent, disrupting both newly formed and matured biofilms formed under conditions encountered along the production chain of eggs and broilers.

Keywords

Food-contamination, Bactericidal, Organic acids, Enteropathogenic bacteria, Poultry production

Introduction

Foodborne pathogens, such as Salmonella enterica Serovar Typhimurium (S. Typhimurium) and E. coli O157, linked to poultry production and the food industry, are major concerns in global gastroenteritis outbreaks affecting humans. According to the USA Centers for Disease Control and Prevention, these pathogens contribute to 76 million infections, 325.000 hospitalizations, and 5.000 deaths annually in the USA alone [1]. In Colombia, a South American country, the Colombian National Institute of Health-Sivigila reported a total of 9.781 cases of foodborne illnesses involving 679 outbreaks in 2017 [2]. Despite the inherent protective physical and chemical barriers in eggs, research reveals that S. Typhimurium, E. coli O157, and other enteropathogenic bacteria can contaminate and infect them. Eggs typically become contaminated through three general routes: before oviposition, when the reproductive organs suffer an infection, and secondly, by encountering feces or contaminated surfaces [3,4]. Accumulating evidence illustrates that S. Typhimurium and E. coli O157, through the formation of biofilms, not only colonize eggs but also surfaces throughout the production chain (Figure. 1). This contamination of surfaces may result in the transmission of these pathogens, posing significant risks to public health [4-6].

fig 1

Figure 1: Areas and surfaces of the Colombian poultry production chain at risk for contamination by biofilms formed by enteropathogenic bacteria. Numbers highlight the different steps at which eggs and chickens can be contaminated by enteropathogenic bacteria. Italic letters indicate the places or utensils that may be made of stainless steel or polystyrene from which cross-contamination of eggs and chickens can occur.

Several studies have demonstrated how Salmonella and E. coli strains that are common causes of human gastroenteritis presented firm attachment of their bacterial cells to the eggshell surface and several types of foods and plants of production surfaces, facilitating the formation of biofilms [7-9]. The formation of a biofilm comprises several distinct steps. First, the initial reversible adsorption of cells onto the surface. Second, production of surface polysaccharides or capsular material occurs followed by the formation of an extracellular polymeric matrix. At this stage, biofilm cells form a strong attachment to the surface. In the following steps, the biofilm architecture is developed and matured. The process ends with the liberation of single motile cells that disperse into the environment and initiate again the process [10]. Biofilm formation is known to be influenced by several environmental cues, such as as availability and concentration of nutrients, and the physicochemical parameters of the of the surrounding environment, such as temperature and the material composition of the surface [11]. The surface type can influence microbial interactions among pathogens and promote co-biofilm formation, increases in individual pathogen biomass, and cell activity [12]. By nature, biofilm structure allows microbes to resist chemical or biological sanitizers, while bacterial cells are more vulnerable during the planktonic state and in a short contact time than when sequestered and protected in biofilms. Bacteria cells within biofilms are more resistant to environmental stresses, such as desiccation and UV light exposure, as well as to host-mediated responses, such as phagocytes [13]. Bacterial biofilms are more resistant to antimicrobial agents than are free-living cells, which makes it difficult to eradicate pathogens from surfaces commonly used in the poultry industry [5].

With the rise in the occurrence of foodborne outbreaks associated with poultry production, there is increasing interest in the use of novel biocide applications to prevent or reduce microbial contamination in food industries. The viability of microbes on food contact surfaces varies according to the biofilm state and formation ability, as well as the type of surface. Biofilm formation from the highest to lowest degree follows the order of eggshell > rubber > stainless steel > plastic [14,15]. As reported by Lee [15], rinsing surfaces with water, even extensively, appears to have limited effect on reducing S. Typhimurium biofilm viability. The regular application of cleaning and disinfecting procedures are common strategies employed to control pathogen establishment on industrial equipment [16]. Importantly, Chemical sanitizer efficacy can significantly depend on surface types, bacterial strains, and relative humidity [17]. Therefore, such procedures may not be fully effective in impeding or disrupting biofilms and can induce the formation and persistence of resistant phenotypes [18].

Novel alternatives, such as natural compounds extracted from bacterial cultures or aromatic plants, as well as organic acids, are currently under evaluation for their potential in eradicating biofilms. These compounds may exhibit high lethality against pathogens, efficiently penetrate the structure of a biofilm, and degrade easily in the environment [16]. Organic acids are generally recognized as safe (GRAS) by the USA Federal Drug Administration (FDA) and have been documented to possess antimicrobial activities against different pathogens [5]. In studies involving antibiotic-resistant bacteria, Clary [19] demonstrated how low concentrations (5%) of acetic acid rapidly killed (30 min) planktonic cells of Mycobacterium abscessus. On the other hand, Bradhan [20] demonstrated that lactic acid can decrease viable cell counts of planktonic as well as biofilm-forming cells of multiple carbapenem-hydrolyzing, multi-drug-resistant Klebsiella pneumoniae strains. Acetic acid demonstrated antimicrobial effectiveness on both smooth and rough cell morphotypes. Besides directly affecting bacterial cell viability, organic acids can also influence the electrochemical properties of the attachment surface, leading to an effective antimicrobial outcome [21].

An antimicrobial mechanism of organic acids, such as citric acid, acetic acid, and lactic acid, involves decreasing the environmental pH, creating unfavorable growth conditions for pathogenic bacteria [22]. Weak acids like acetic acid, when at a pH lower than their pKa and in their undissociated form, have shown the ability to reduce biofilm formation by permeating the biofilm structure and inner cell membrane. Kundukad [23] demonstrated that these weak acids, including acetic acid, could effectively eliminate bacteria without harming human cells if the pH remains close to their pKa. Organic acids in their undissociated form possess lipophilic properties, enabling them to diffuse across bacterial cell membranes, thereby disrupting cell function upon reaching the cell interior [5].

Research focusing on evaluating alternative treatments and methods to control S. Typhimurium and E. coli O157 biofilm formation on surfaces along the egg and other animal-derived food production chains is crucial to reduce cross-contamination. Accordingly, the present study aimed to assess the efficacy of organic acids in: 1) controlling biofilm formation by S. Typhimurium and E. coli O157 during the initial stages of development, and 2) disrupting mature biofilms. Eggshells, stainless steel, and polystyrene were utilized to simulate potential soiling surfaces encountered by eggs and broilers throughout the production chain. Two temperatures were assessed as key environmental variables: 22°C, representing the mean environmental temperature of the largest broiler-producing region in Colombia, and 37°C, simulating the optimal growth temperature of these pathogens. Additionally, to track the impact of exposure time and the potential development of resistance, the biofilms were subjected to organic acids for 2 and 24 hours.

Materials and Methods

Bacterial Strains and Growth Conditions

Bacterial strains used in this study were S. Typhimurium ATCC 14028 (American Type Culture Collection, Manassas, VA., USA) and E. coli O157 strain AGROSAVIA_CMSABV_Ec-col-B-001-2007 from the Animal Health collection of the AGROSAVIA Microbial Germplasm Bank (Mosquera, Cundinamarca, Colombia). The bacteria were grown on nutrient agar (Merck, Darmstadt, Germany) or Luria Bertani low salt agar (LBL) (peptone (ThermoFisher, Waltham, Massachusetts, USA) at 10 g.L-1, yeast extract (Merck) at 5 g.L-1, sodium chloride (Merck) at g.L-1, agar (Merck) at g.L-1. When required, LBL agar was acidified to pH 3 with 0.3% (v/v) acetic acid (Merck), 0.2% (v/v) citric acid (Merck), or 0.2% (v/v) lactic acid (Merck). For biofilm assays, LBL broth (LBL without agar) was used.

Growth Curves

S. Typhimurium and E. coli O157 were aerobically grown on LBL agar plates at 37°C for 24 h. The inocula were prepared by scraping the surface of the agar plates following the addition of 10 mL of LBL broth at pH 7 or acidified to pH 3 with acetic (0.3% v/v), citric (0.2% v/v) or lactic acid (0.2% v/v). These cell suspensions were adjusted to an OD at 600 nm of 0.1 (2.2 × 10³ colony-forming units (cfu).mL-1) or 1.8 (2.8 × 10⁹ 103 cfu.mL-1). Three bacterial suspensions (n=3) per treatment and the control at an initial OD of 0.1 or 1.8 were incubated aerobically at 37°C for 48 h with constant shaking at 140 rpm. Every 2 h, 1-mL aliquots of the bacterial cultures were taken, and 10-fold serial dilutions and plating on LBL agar were made to determine Log10 cfu.mL-1 at each time.

Surface Spreading Assays

S. Typhimurium and E. coli O157 were grown aerobically in 5 mL of LBL broth at 37°C until reaching an optical density (OD) at 600 nm of 1 (16 h). Then, 1 mL of each culture was concentrated 10-fold by centrifugation at 4.400 × g for 5 min at room temperature. The pellets were suspended in 100 µL of LBL broth. The concentration of inocula for S. Typhimurium was 8.25 × 10¹⁰ and for E. coli O157 was 1.05 × 10¹¹ cfu.mL-1. Semi-solid agar surface spreading plates were prepared as described by Amaya [24] with 20 mL of LBL broth containing 8% (w/v) of glucose and 0.6% (w/v) of agar and if required acidified with acid acetic (0.3% v/v), citric acid (0.2% v/v), or lactic acid (0.2% v/v). A 5-µL drop of the suspended bacteria was placed in the center of the plates (n=10) and allowed to air-dry for 10 min. The plates were inverted and incubated aerobically for 24 h at 37°C. The areas of the spreading colonies were measured with ImageJ software 1.52a (Wayne Rasband, National Institute of Health, Bethesda, MD, USA) by delimiting the coly area using the shaped and measured tools.

Disruption of Newly Formed Biofilms Developed on Eggshells and Stainless Steel

S. Typhimurium and E. coli O157 were grown aerobically on LBL agar plates at 37°C for 24 h. The inocula of the pathogens were prepared by scraping the cell mass grown from the surface of the plates and washing twice in 2 mL of LBL broth at pH 7 or LBL broth at pH 3, acidified with acid acetic (0.3% v/v), citric acid (0.2% v/v), or lactic acid (0.2% v/v), and centrifugation at 4.400 × g for 5 min at room temperature. Washed cells were suspended in 20 mL of the respective media. The OD of each suspension was adjusted to 1.8 at 600 nm (5 × 10⁹ cfu.mL-1). Then, six 1-cm2 pieces of eggshell or stainless steel for each treatment, which were sterilized by autoclave at 15 lb of pressure and 121°C for 20 min, were weighted and covered with 5 mL of each bacterial suspension in 15-mL Falcon tubes. Negative controls contained each medium without inoculum. Following incubation for 2 or 24 h at 22°C or 37°C, eggshells and stainless-steel pieces were aseptically transferred with sterile forceps to 15-mL Falcon tubes. The eggshells and stainless-steel pieces were rinsed three times with 2 mL of sterile 0.85% NaCl solution to remove unbound cells. To detach the biofilm cells, the eggshells and stainless-steel pieces were sonicated twice in 2 mL of sterile 0.85% NaCl solution for 2 min with a pause of 2 min. Ten-fold serial dilutions were made in sterile 0.85% NaCl solution and plated using drop plate technique on nutrient agar. Plates were incubated aerobically at 37°C for 20 h and the numbers of colony-forming units were counted. The results were expressed as Log10 cfu.g-1 of eggshell or stainless steel.

Disruption of Mature Biofilms Formed on Eggshells and Stainless Steel

Pathogen biofilms were allowed to develop on the surface materials (n=9) for 2 or 24 h at 22 or 37°C in LBL broth (pH 7), following the procedures described above. Once the biofilms were formed, eggshells and stainless-steel pieces were aseptically transferred to LBL broth at pH 7 or acidified with acetic acid (0.3% v/v) to pH 3. The 2-h-old biofilms were incubated aerobically for 2 h and the 24-h-old biofilms were incubated for 24 h, at 22°C or 37°C. After rinsing three times with 2 mL of sterile 0.85% NaCl solution and sonication in 2 mL of sterile 0.85% NaCl solution, 10-fold serial dilutions were made and plated using drop plate technique on nutrient agar. Results were expressed as Log10 cfu.g-1 of eggshell or stainless steel.

Disruption of Biofilms Formed on Polystyrene

S. Typhimurium and E. coli O157 inocula were prepared as described above for the evaluation of biofilm formation on eggshells and stainless steel. To evaluate the disruption of young biofilms by acetic acid, ninety-six-well polystyrene plates (Becton Dickinson, Franklin Lakes, NY, USA) were inoculated with 180 µL of S. Typhimurium or E. coli O157 inoculum adjusted to an OD of 1.8 (approximately 5.12 × 10⁹ cfu.mL-1) in LBL broth pH 7 or broth acidified to a pH of 3 with acetic acid (0.3% v/v), n=24. The multi-well plates were incubated aerobically for 2 or 24 h at 22 or 37°C, without shaking and under humid conditions to prevent evaporation. To evaluate the disruption of matured biofilms, first, the biofilms were allowed to form aerobically in LBL broth at pH 7 for 2 or 24 h. Subsequently, the culture broth was removed and 150 µL of LBL broth at pH 7 or broth acidified to pH 3 with acetic acid (0.3% v/v) was added to the wells, the number of wells used per treatment was of 24. Then the plates were incubated aerobically once more for an additional 2 or 24 h at 22°C or 37°C. Controls consisted of uninoculated broths. At the end of the incubation times, the OD was read at 600 nm using a SunriseTM microtiter plate reader (Tecan Group Ltd, Männedorf, Switzerland). Subsequently, the liquid contents of each well were gently removed, and the biofilms were stained for 1 h with 180 µL of 0.01% (w/v) crystal violet (Sigma-Aldrich, St. Louis, MO., USA) 3. Excess dye was removed, and the wells were rinsed three times with sterile distilled water. The plates were allowed to air-dry at room temperature before adding 180 µL of ethanol: acetone (80: 20) to each well. Crystal violet-stained biofilms were measured at 600 nm using a SunriseTM microtiter plate reader.

Statistical Analysis

At least three biological replicates of each experiment were carried out to ensure the reproducibility of results. Data of surface spread colony areas, cfu.g-1 of eggshell or stainless steel and crystal-violet stained biofilms were Log10 (x + 1) transformed to homogenize variances between treatments. Linear models (LM) were employed for statistical analyses using R v. 3.6.0 (http://www.R-project.org/) with packages lme4, car, and emmeans. Surface spreading data were analyzed using LM and pairwise comparisons were performed for the interaction between all factors. The cfu.g-1 of eggshell or stainless steel and OD data for multi-well plate assays were analyzed with a negative binomial distribution. The negative binomial theta parameter was established with an alternating iteration procedure using the glm.nb function. Pairwise multiple comparisons were carried out using the false discovery rate (FDR) for P-value corrections.

Results

Impact of Acetic Acid on S. Typhimurium and E. coli O157 Planktonic Cells

Growth curves were conducted to monitor the antimicrobial activity of the three organic acids on planktonic cells. Initial low (0.1 OD) and high (1.8 OD) concentrations of cells were employed to simulate the numbers used in young and mature biofilm inoculants, respectively. The results indicated that irrespective of the initial concentration (Figure 2C and 2D), all three organic acids exhibited bactericidal activity against S. Typhimurium and E. coli O157 planktonic cells. In both scenarios, a progressive decrease in colony-forming unit (cfu) numbers was observed over time. Compared to cultures at pH 7 with an initial OD of 0.1, cultures in LBL broth acidified with acetic, citric, and lactic acids exhibited reductions of 7.86 Log10 cfu.mL-1 for S. Typhimurium (Figure 2A) and 8.17 Log10 cfu.mL-1 for E. coli O157 (Figure 3B). When initial cell concentrations were high, cfu.mL-1 numbers also decreased in cultures acidified with the three organic acids. After 48 hours of incubation, viable Log cfu.mL-1 counts of S. Typhimurium and E. coli O157 in acidified cultures revealed reductions of 8.36 and 8.10, respectively.

fig 2

Figure 2: S. Typhimurium and E. coli O157 growth curves for control (pH 7) and acid (pH 3) broth cultures with an initial optical density of 0.1 (A and B, respectively) and 1.8 (C and D, respectively). Error bars indicate standard error of the mean (n=9).

Interference of Organic Acids with Surface Spreading

Bacterial surface motility is known to be involved at different stages of biofilm formation, especially at its initial stages. We evaluated the impact of acetic, citric, and lactic acids on this phenotype. Compared to control conditions, a significant (P < 0.05) decrease in the surface spreading abilities of S. Typhimurium and E. coli O157, ranging between 97 to 98%, was observed on the semi-solid agar plates containing any of the three organic acids (Figure 3).

fig 3

Figure 3: Effect of organic acids on S. Typhimurium (A) and E. coli O157 (C) surface spreading. Error bars indicate the standard error of the means (n=10). Bars with the same letter do not differ significantly (P > 0.05). B and D demonstrate the observed surface spreading patterns of S. Typhimurium and E. coli O157 at 24 h post-inoculation, respectively (bar=1 cm).

Disruption of Newly Formed Biofilms

First, the capacity of acetic, citric, and lactic acid to disrupt biofilms formed at 2 and 24 h post-inoculation (hpi) on eggshells was evaluated. Under the control treatment conditions, the numbers of S. Typhimurium and E. coli O157 attached cells were similar in most comparisons at 2 and 24 hpi (Table 1); although at 24 hpi at 37°C, fewer (P < 0.05) E. coli O157 than S. Typhimurium cells were found to be attached. Of the three acids, acetic acid generated (P < 0.05) higher reductions on newly formed biofilms developed by both pathogens, with an overall 3 Log10 cfu.g-1 of eggshells decrease at both times and temperatures compared to the controls. An exception was at 2 hpi and 37°C with biofilm formation by S. Typhimurium being controlled to a greater extent by lactic acid rather than by acetic and citric acids. Compared to the effect achieved by the other two organic acids, at 2 and 24 hpi, acetic acid also yielded the highest (P < 0.05) reduction of E. coli O157 biofilm formation at both temperatures.

Table 1: Organic acids inhibition of young Salmonella Typhimurium and Escherichia coli O157 biofilms developed on eggshells and stainless steel surfaces.


Bacteria (Incubation Temperature)

Surface1

Treatment Time (h) ST (22°C) ST (37°C) EC (22°C) EC (37°C)
ES Con 2 8.58 ± 0.05aA 8.23 ± 0.12aA 8.31 ± 0.11aA

8.24 ± 0.13aA

24 8.48 ± 0.06aA 8.40 ± 0.18aA 8.33 ± 0.09abA 8.05 ± 0.10bA
AA 2 5.12 ± 0.07bC 7.36 ± 0.08aB 5.03 ± 0.03aC

5.12 ± 0.06bC

24 5.13 ± 0.06aC 5.07 ± 0.04aC 5.03 ± 0.03aC 5.06 ± 0.04aD
LA 2 5.17 ± 0.08cB 5.08 ± 0.05cC 7.33 ± 0.29bB

8.36 ± 0.06aA

24 7.56 ± 0.21aB 7.69 ± 0.07aB 7.65 ± 0.06aB 6.59 ± 0.07bC
CA 2 6.33 ± 0.17bB 8.13 ± 0.13aA 7.52 ± 0.30aB

6.23 ± 0.34bB

24 7.59 ± 0.08cB 8.14 ± 0.10Ba 7.79 ± 0.05cB 8.40 ± 0.11aB
SS Con 2 10.48 ± 0.01bA 10.72 ± 0.01aA 10.31 ± 0.01cA

10.50 ± 0.01bA

24 10.63 ± 0.01bA 10.96 ± 0.00aA 10.33 ± 0.01dA 10.50 ± 0.01cA
AA 2 4.04 ± 0.21aB 4.23 ± 0.01aB 4.20 ± 0.27aB

4.23 ± 0.03aB

24 4.41 ± 0.05bB 4.45 ± 0.03bB 4.61 ± 0.01aB

4.59 ± 0.02aB

1ES: Egg Shell, SS: Stainless Steel, Con: Control medium at pH 7, AC: Acetic acid medium at pH 3, LA: Lactic acid medium at pH 3, CA: Citric acid medium at pH 3, ST: Salmonella Typhimurium, EC: Escherichia coli O157.
abcdMeans (Log10 cfu/g) ± SE (n=9) in rows and with different letters are significantly different (P < 0.05).
ABCDMeans (Log10 cfu/g) ± SE (n=9) in columns, with the same surface material, and the same time, and with different letters are significantly different (P < 0.05).

The disruptive activity that citric and lactic acid caused on newly formed biofilms was found to depend on the time of exposure and the incubation temperature. Citric acid was found to be more effective in disrupting the 2-h-old biofilms formed by S. Typhimurium at 22°C, and by E. coli O157 at 37°C, causing a reduction in the number of cfu.g-1 of eggshell of 2.25 and 2.01 Log10, respectively. On the other hand, lactic acid exerted the higher antibiofilm activity against S. Typhimurium biofilms generating a decrease in the number of cfu attached per gram of eggshell at 22°C of 3.41 Log10 and at 37°C of 3.15 Log10. At the same time and temperatures, E. coli O157 biofilms saw a decrease of 1 and 0 Log10. Biofilms formed during 24 h, treated with this organic acid showed an overall decrease of less than 1 Log10 cfu.cm2-1 of eggshell, in both pathogens. Because acetic acid was observed to be the most effective organic acid in controlling S. Typhimurium and E. coli O157 biofilm formation on eggshells, this organic acid was selected for further studies.

As seen with eggshells, the number of cfu.g-1 of stainless steel attached at 2 and 24 h showed similar numbers by S. Typhimurium and E. coli O157 within control and acetic acid treatments (Table 1). The Attached S. Typhimurium cells to this surface were higher in the control treatment at 2 and 24 hpi (P < 0.05) at 37°C and lower (P < 0.05) for E. coli O157 at 22°C, although the differences were small. At all times and temperatures, acetic acid caused a reduction (P < 0.05) by nearly 6 Log10 of S. Typhimurium and E. coli O157 cfu.g-1 of stainless steel. All counts for acetic acid-treated biofilms were similar (P > 0.05) at 2 hpi; however, at 24 hpi, E. coli O157 counts at both temperatures were slightly higher (P < 0.05) than those for S. Typhimurium.

The formation of biofilms by both pathogens on multi-well polystyrene plates was also found to be influenced by temperature and incubation temperature (P < 0.05, Table 2). Lower (P < 0.05) biofilm OD values were found for S. Typhimurium and E. coli O157 at 22°C than at 37°C at 2 hpi and 24 hpi for the control and acetic acid treatments. Treatment with acetic acid resulted in both pathogens producing less (P < 0.05) biofilm at both temperatures when compared to control OD values at 2 and 24 hpi. However, there were higher decreases in OD values for both acetic acid-treated pathogens at both temperatures at 24 hpi as compared to 2 hpi. While an overall reduction of nearly 1 OD unit was obtained at 2 hpi for both pathogens, a decrease at 24 hpi of 2 OD units and 1.7 OD units was found for S. Typhimurium and E. coli O157, respectively.

Table 2: Acetic acid inhibition of young Salmonella Typhimurium and Escherichia coli O157 biofilms developed on polystyrene surfaces.


Bacteria (Incubation Temperature)

Surface1

Treatment Time (h) ST (22°C) ST (37°C) EC (22°C) EC (37°C)
PS Con 2 2.76 ± 0.04bA 3.14± 0.03aA 2.43 ± 0.07cA

2.98 ± 0.05aA

24 3.04 ± 0.02bA 3.62 ± 0.09aA 3.03 ± 0.03bA 3.12 ± 0.04bA
AA 2 1.68 ± 0.06bB 1.84 ± 0.08abB 1.68 ± 0.05bB

1.91 ± 0.05aB

24

0.64 ± 0.05cB 1.59 ± 0.10aB 1.22 ± 0.04bB

1.53 ± 0.09aB

1PS: Polystyrene, Con: Control medium at pH 7, AC: Acetic acid medium at pH 3, ST: Salmonella Typhimurium, EC: Escherichia coli O157
abcdMeans (OD) ± SE (n=24) in rows and with different letters are significantly different (P < 0.05).
ABMeans (OD) ± SE (n=24) in columns and with different letters are significantly different (P < 0.05).

Acetic Acid Disruption of Mature Biofilms

Control treatments showed that the number of cfu of S. Typhimurium and E. coli O157 attached per g of eggshell did not significantly increase from 2 to 24 h (P < 0.05) at any of the evaluated temperatures. On the other hand, 2 more hours of incubation were enough to allow higher (P < 0.05) numbers of S. Typhimurium and E. coli O157 cells to be attached to stainless steel than to eggshells for control and acetic acid-treated cultures at both temperatures. As observed in the assays of young biofilms, treatment with acetic acid for 2 and 24 h also generated significant (P < 0.05) reduction on the already formed and mature S. Typhimurium and E. coli O157 biofilms, regardless of the evaluated surface (Tables 3). Compared to control treatments, there was an overall 6.6 Log10 reduction in the number of cfu attached to eggshells and stainless-steel surfaces. Exposure to acetic acid for 2 h was enough to disrupt the already formed biofilms. Interestingly, prolonged exposure to acetic acid for 24 h did not incrementally affect these mature biofilms (Table 3). Furthermore, as observed when evaluating the disruption of young biofilms, the antibiofilm activity of acetic was higher on the biofilms formed on stainless steel than on eggshells.

Table 3: Acetic acid disruption of matured Salmonella Typhimurium and Escherichia coli O157 biofilms developed on eggshells and stainless surfaces.


Bacteria (Incubation Temperature)

Surface1

Treatment Time (h) ST (22°C) ST (37°C) EC (22°C) EC (37°C)
ES Con 2 8.67 ± 0.03aA 8.77 ± 0.03aA 8.31 ± 0.03bA

8.32 ± 0.05bA

24 8.78 ± 0.08bA 8.94 ± 0.01aA 8.39 ± 0.03cA 8.33 ± 0.03cA
AA 2 2.24 ± 0.01aB 2.23 ± 0.01aB 2.21 ± 0.02aB

2.22 ± 0.03aB

24 2.41 ± 0.05bB 2.45 ± 0.03bB 2.59 ± 0.01aB 2.59 ± 0.02aB
SS Con 2 10.54 ± 0.02bA 10.67 ± 0.02aA 10.11 ± 0.01cA

10.68 ± 0.02aA

24 10.76 ± 0.04bA 10.92 ± 0.01aA 10.85 ± 0.01aA 10.92 ± 0.00aA
AA 2 3.46 ± 0.03bB 3.65 ± 0.01aB 3.57 ± 0.03aB

3.62 ± 0.04aB

24

3.56 ± 0.04cB 3.88 ± 0.02aB 3.55 ± 0.07cB

3.72 ± 0.04bB

1ES: Egg Shell, SS: Stainless Steel, PS: Polystyrene, Con: Control medium at pH 7, AC: Acetic acid medium at pH 3, LA: Lactic acid medium at pH 3, CA: Citric acid medium at pH 3, ST: Salmonella Typhimurium, EC: Escherichia coli O157
abcdMeans (Log10 cfu/g) ± SE (n=9) in rows and with different letters are significantly different (P < 0.05).
ABCDMeans (Log10 cfu/g) ± SE (n=9) in columns, with the same surface material, and with different letters are significantly different (P < 0.05).

Incubation of the mature biofilms formed on the polystyrene surface for an additional 2 and 24 h generated significant differences (P < 0.05) in the OD values for S. Typhimurium and E. coli O157 biofilms. Regardless of the time and temperature of incubation, the OD values of E. coli O157 biofilms were higher than those of S. Typhimurium. Additionally, while S. Typhimurium showed higher OD values at 24 hpi than at 2 hpi, E. coli O157 OD values were reduced over time. An overall reduction on the OD values caused by acetic acid was observed in the matured biofilms formed by the two pathogens, however the antibiofilm activity of the acid varied depending on the time and temperature (P < 0.05). The higher antibiofilm activity exerted by acetic acid on S. Typhimurium matured biofilms was observed at 24 hpi and 22°C (1.08). Similarly, the higher reduction in the OD values in E. coli O157 was found at 22°C; although it was observed at 2 (2.49) and 24 hpi (2.33). Extending the exposure to acetic acid of S. Typhimurium matured biofilms formed at 22°C led to a higher reduction on the OD values at 24 hpi than at 2 hpi. However, this decrease caused by a longer exposure to acetic acid was not observed for the matured biofilms formed at 37°C by S. Typhimurium or by E. coli O157 at any of the evaluated temperatures (Table 4).

Table 4: Acetic acid disruption of matured Salmonella Typhimurium and Escherichia coli O157 biofilms developed polystyrene surfaces.


Bacteria (Incubation Temperature)

Surface1

Treatment Time (h) ST (22°C) ST (37°C) EC (22°C) EC (37°C)
PS Con 2 2.60 ± 0.05bA 1.19 ± 0.08cA 4.40 ± 0.06aA

2.77 ± 0.07bA

24

3.57 ± 0.06bA

2.09 ± 0.06dA 4.20 ± 0.08aA

2.35 ± 0.08cA

AA

2

2.20 ± 0.15aB 0.46 ± 0.07bB 1.91 ± 0.1aB

1.75 ± 0.09aB

24

2.49 ± 0.11aB 1.32 ± 0.14cB 1.87 ± 0.08bB

1.53 ± 0.11abB

1PS: Polystyrene, Con: Control medium at pH 7, AC: Acetic acid medium at pH 3, ST: Salmonella Typhimurium, EC: Escherichia coli O157
abcdMeans (OD) ± SE (n=24) in rows for each surface and with different letters are significantly different (P < 0.05).
ABMeans (OD) ± SE (n=9) in columns, with the same time, and with different letters are significantly different (P < 0.05).

Discussion

Complete removal of enteropathogenic bacteria from the poultry production chain environment is essential to ensure overall food safety. Pathogens like S. Typhymurium and E. coli O157 possess the capability to form biofilms, enabling their survival under unfavorable conditions by adhering to abiotic surfaces such as metals, plastic, or glass while creating a protective barrier [25,26]. Despite the implementation of numerous hygienic measures, concerns persist regarding the efficacy of disinfectants due to the emergence of bacterial resistance [27]. Moreover, several chemical sanitizers previously used for human health purposes are now prohibited, leading to a renewed interest in substituting chemical industrial sanitizers with natural antimicrobial agents. Organic acids, considered safe for food animal and human health, stand out as exceptional alternatives in this regard [28]. They are affordable and known to be safe compounds.

The results from the current study demonstrate the efficacy of acetic acid as an antibiofilm agent against S. Typhimurium and E. coli O157 biofilms. Halstead [29] similarly revealed the bactericidal actions of this organic acid against pathogens such as E. coli, Staphylococcus aureus, and Acinetobacter baumannii. However, in contrast to these findings, other studies have suggested that acetic acid might not be the most efficient biofilm disruptor when compared to other organic acids. For instance, Ban [30] evaluated the antibiofilm activities of propionic acid, acetic acid, lactic acid, malic acid, and citric acid, and found lactic acid to be the most effective in disrupting 6-day-old S. Typhimurium, E. coli O157: H7, and Listeria monocytogenes biofilms. Moreover, Amrutha [5] reported that, when comparing the activity of acetic, lactic, and citric acids at a 2% concentration, lactic acid achieved maximum inhibition of Salmonella sp. and E. coli biofilms formed on cucumber. The degree of antimicrobial effect might be influenced by the concentration of organic acid and the exposure time [28]. According to Beier [31], acetic, butyric, and propionic acids required lower molar amounts than citric, formic, and lactic acids to significantly inhibit enteropathogens. Furthermore, Bardhan [20] indicated that lactic acid was an effective antimicrobial against clinical carbapenem-hydrolyzing, multi-drug-resistant Klebsiella pneumoniae planktonic and biofilm-forming cells. The authors observed cell membrane damage and high rates of bacteriolysis after treatment with lactic acid at concentrations of 0.15% and 0.225%.

The antibacterial activity of organic acids has been associated with their pKa and the optimal pH for dissociation [28]. The pKa values for acetic, citric, and lactic acid are 4.476, 3.86, and 3.13, respectively. Kundukad [23] demonstrated that maintaining their pH close to their pKa enables weak acids like acetic and citric acid to eliminate persistent cells within biofilms of antibiotic-resistant bacteria such as Klebsiella pneumoniae KP1, Pseudomonas putida OUS82, Staphylococcus aureus 15981, Pseudomonas aeruginosa DK1-NH57388A, and P. aeruginosa PA_D25. When provided at a pH lower than their pKa, these compounds can penetrate the biofilm matrix and bacterial cell membranes. While lactic acid is considered a stronger acid than acetic acid based on their pKa values, the efficacy of organic acids also relies on pH levels. The proximity between the pKa value of lactic acid and the pH of 3 used in this study might explain why acetic acid exhibited better performance against biofilm formation and disruption than lactic acid. Further studies comparing the effectiveness of these organic acids at various pH values are necessary to confirm these observations.

In general, it has been suggested that increasing the contact time with disinfectants enhances their antibiofilm activities on various material surfaces [15]. In the current study, it was observed that prolonged exposure of S. Typhimurium and E. coli O157 planktonic cells to the tested organic acids resulted in lower OD values, as depicted by the presented growth curves. However, when mature biofilms of these microbes were exposed to acetic acid on polystyrene surfaces, this time-related effect was not observed. The OD values for mature biofilms did not decrease after exposure to acetic acid for 2 or 24 hours. Similar resistance over time was noted for biofilm cells attached to eggshells and stainless steel when the biofilm formation and contact time with organic acids extended from 2 hours to 24 hours. Amrutha [5] reported that exposure to acetic, citric, and lactic acids did not significantly reduce the production of exopolysaccharides in Salmonella sp. biofilms and resulted in reductions of 10.89%, 6.25%, and 13.42% in E. coli O157: H7 biofilms, respectively. The extracellular matrix developed by biofilm cells acts as a barrier, impeding the penetration or inactivation of antimicrobial compounds [31,32]. Therefore, the limited reduction in S. Typhimurium and E. coli O157 biofilms formed on eggshells, stainless steel, and polystyrene with increased exposure time to acetic acid is likely due to the obstruction presented by the biofilm matrix against the passage of organic acids. Research focusing on disrupting the biofilm matrix using alternative methods before exposure to organic acids could lead to the development of complementary approaches to enhance the antimicrobial activity of organic acids.

In addition to the biofilm matrix defensive shield, it is conceivable that the remaining cells inside the S. Typhimurium and E. coli O157 biofilms would respond to the effects of acetic acid by triggering other protection strategies. Changes in membrane lipids have been described as one of these defensive mechanisms [33]. Additional cell protective strategies would include the release of ammonia [34], the pumping out of protons, and the proton-consuming decarboxylation processes. More recently, Clary [19] demonstrated how the bacterial colony diversification (morphotype) would define the outcome of tolerance to a particular stressor during the process of biofilm formation and its persistence against environmental assaults. Amrutha [5] demonstrated that a reduction of exopolysaccharide (EPS) synthesis, EPS composition and organization, swimming and swarming cell patterns, and a negative impact on quorum sensing play crucial roles in microbial community architecture as well as resistance to toxic substances. Further research is required to identify which of these mechanisms are used by the remaining S. Typhimurium and E. coli O157 biofilm cells attached to eggshells and the industrial surfaces evaluated in the current study.

The antibiofilm activity of organic acids, such as acetic acid, might encounter hindrances due to alterations in the biofilm structure caused by temperature shifts and variations in adhesion surface types. Generally, temperature and surface material have been reported to influence the attachment ability of enteropathogenic and other bacteria, consequently affecting the biofilm structure [35]. In the current study, we did not assess the impact of temperature on the biofilm structure on the tested surfaces. However, our findings indicate that at 22°C, acetic acid exhibited less control only over mature biofilms formed by S. Typhimurium on polystyrene, differing from the conditions at 37°C. Similar temperature-related alterations in biofilm capacity were observed by Andersen [36] when evaluating the biofilm-forming capacity of several E. coli K12 clinical isolates. They reported a higher number of attached cells at 30°C compared to 35°C, observing denser and more evenly distributed biofilms on silicone surfaces at the lower temperature. Andersen [36] suggested that the presence of curli fibers, which facilitate cell adhesion, might have influenced the type and creation of the biofilm structure, particularly at lower temperatures where these cell surface adhesins are produced. Furthermore, another study focused on E. coli O157: H7 biofilms formed at 4°C and 15°C on beef processing surfaces concluded that while a slight decrease in the number of attached cells was noted at 4°C, it did not hinder the overall increase in attached cell numbers over time [37].

Conclusion

The efficacy of compounds utilized for sanitation involves multifaceted events associated not only with the morphology and physiology of the target microbial cells but also with factors such as relative surface hydrophobicity, material surface roughness, and the impact of shear stress [38]. Organic acids can influence the internal chemical equilibrium of microbial cells, leading to alterations in cell membrane integrity or cellular activities, ultimately resulting in cell death. Consequently, organic acids represent an important option for sanitizing purposes and may potentially be combined or incorporated into innovative carrier matrices with other established antimicrobial molecules, such as essential oil components, thereby improving molecule stability and extending their biological activity [39]. The results obtained from this study offer new insights into the effectiveness of acetic acid as an antibiofilm agent, which can be utilized to control S. Typhimurium and E. coli O157 biofilms formed under conditions encountered along the poultry production chain. This newfound information may facilitate the integration of this natural compound into hygiene programs aimed at preventing cross-contamination of eggs, broilers, and broiler meat products.

Acknowledgments

This work supported by the United States Department of Agriculture under grant number 58-3091-7-028-F; and by the Colombian Ministry of Agriculture and Rural Development under grant numbers Tv18 and Tv19. We thank Yessica Muñoz and Xiomara Abella for technical assistance, and Corporación Colombiana de Investigación Agropecuaria – Agrosavia for supporting this research.

Contributions

AGC and CVAG were involved in the experimental and performed biofilm experiments. AGC, MEH, FRV and CVAG participated in data analysis and wrote the manuscript.

Ethics Approval

Not applicable.

Consent to Participate

All authors approved the manuscript.

Consent for Publication

The authors consented for the publication.

Statements and Declarations

Competing Interests

The authors declare no competing interests.

References

  1. Afzal A, Hussain A, Irfan M, and Malik KA (2015) Molecular diagnostics for foodborne pathogens (Salmonella spp.) from poultry. Life Sci 2: 91-97.
  2. Instituto Nacional de Salud de Colombia (2017) Investigación de brote enfermedades transmitidas por alimentos y vehiculizadas por agua, 59(2): 4-16.
  3. Gantois I, Ducatelle R, Pasmans F, Haesebrouck F, et al. (2004) Cross-sectional analysis of clinical and environmental isolates of Pseudomonas aeruginosa: biofilm formation, virulence, and genome diversity. Pharmacol 72: 133-144. [crossref]
  4. Pande VV, McWhorter AR, Chousalkar KK (2016) Salmonella enterica isolates from layer farm environments are able to form biofilm on eggshell surfaces. Biofouling 32: 699-710.
  5. Amrutha B, Sundar K, Halady Shetty PH (2017) Effect of organic acids on biofilm formation and quorum signaling of pathogens from fresh fruits and vegetables. Microb Pathog 111: 156-162. [crossref]
  6. Chowdhury MAH, Ashrafudoulla, Mevo SIU, Mizan MFR, et al. (2023) Current and future interventions for improving poultry health and poultry food safety and security: A comprehensive review. Compr Rev Food Sci Food Saf 22: 1555-1596. [crossref]
  7. Yang X, Tran F, Youssef MK, Gill CO (2015) Determination of sources of Escherichia coli on beef by multiple-locus variable-number tandem repeat analysis. J Food Prot 78: 1296-1302. [crossref]
  8. Silva PL, Goulart LR, Reis TF, Mendonça EP, Melo RT, et al. (2019) Biofilm formation in different Salmonella serotypes isolated from poultry. Curr Microbiol 76: 124-129. [crossref]
  9. Harrell JE, Hahn MM, D’Souza SJ, Vasicek EM, Sandala JL, et al. (2021) Salmonella biofilm formation, chronic infection, and immunity within the intestine and hepatobiliary tract. Front Cell Infect Microbiol 10: 624622. [crossref]
  10. Kim SH, Wei CI (2007) Biofilm formation by multidrug-resistant Salmonella enterica serotype Typhimurium phage type DT104 and other pathogens. J Food Prot 70: 22-29.
  11. Schonewille E, Nesse LL, Hauck R, Windhorst D, Hafez HM, Vestby LK (2012) Biofilm building capacity of Salmonella enterica strains from the poultry farm environment. FEMS Microbiol Immunol 65: 360-365. [crossref]
  12. Maggio F, Rossi C, Chaves-López C, Serio A, Valbonetti L, Pomilio F, et al. (2021) Interactions between Listeria monocytogenes and Psuedomonas fluorescens in dual-species biofilms under simulated dairy processing conditions. Foods 10: 176. [crossref]
  13. Fatemi P, Frank JF (1999) Inactivation of Listeria monocytogenes/Pseudomonas biofilms by peracid sanitizers. J Food Prot 62: 761-765.
  14. Hingston PA, Stea EC, Knøchel S, Hansen T (2013) Role of initial contamination levels, biofilm maturity and presence of salt and fat on desiccation survival of Listeria monocytogenes on stainless steel surfaces. Food Microbiol 36: 46-56. [crossref]
  15. Lee KH, Lee JY, Roy PK, Mizan MFR, Hossain MI, et al. (2020) Viability of Salmonella Typhimurium biofilms on major food-contact surfaces and eggshell treated during 35 days with and without water storage at room temperature. Poult Sci 99: 4558-4565. [crossref]
  16. Bridier A, Sanchez-Vizuete P, Guilbaud M, Piard JC, et al. (2015) Biofilm-associated persistence of food-borne pathogens. Food Microbiol 45: 167-178. [crossref]
  17. Joseph B, Otta SK, Karunasagar I, Karunasagar I (2001) Biofilm formation by Salmonella on food contact surfaces and their sensitivity to sanitizers. Int J Food Microbiol 64: 367-372. [crossref]
  18. Simoes M, Simoes LC, Vieira MJ (2010) A review of current and emergent biofilm control strategies. LWT-Food Sci Technol 43: 573-583.
  19. Clary G, Sasindran SJ, Nesbitt N, Mason L, Cole S, Azad A, McCoy K, Schlesinger LS, Hall-Stoodley L (2018) Mycobacterium abscessus smooth and rough morphotypes form antimicrobial-tolerant biofilm phenotypes but are killed by acetic acid. Antimicrob Agents Chemother 62: e01782-17. [crossref]
  20. Bardhan T, Chakraborty M, Bhattacharjee B (2019) Bactericidal activity of lactic acid against clinical, carbapenem-hydrolyzing, multi-drug-resistant Klebsiella pneumoniae planktonic and biofilm-forming cells. Antibiotics 8: 181. [crossref]
  21. Souza JG, Cordeiro JM, Lima CV, Barão VA (2019) Citric acid reduces oral biofilm and influences the electrochemical behavior of titanium: An in situ and in vitro study. J Periodontol 90(2): 149-158. [crossref]
  22. Canibe N, Steien SH, Øverland M, Jensen BB (2001) Effect of K-diformate in starter diets on acidity, microbiota, and the amount of organic acids in the digestive tract of pig. J Anim Sci 79: 2123-2133. [crossref]
  23. Kundukad B, Schussman M, Yang K, Seviour T, Yang L, et al. (2017) Mechanistic action of weak acid drugs on biofilms. Sci Rep 7: 1-12. [crossref]
  24. Amaya-Gómez CV, Porcel M, Mesa-Garriga L, Gómez-Álvarez MI (2020) A framework for the selection of plant growth-promoting rhizobacteria based on bacterial competence mechanisms. Appl Environ Microbiol 86: e00760-20. [crossref]
  25. Peng D (2016) Biofilm formation of Salmonella. Microbial Biofilms. Biofilms-Importance and Applications. IntechOpen, 231-242.
  26. Yang X, Wang H, Hrycauk S, Holman DB, Ells TC (2023) Microbial dynamics in mixed-culture biofilms of Salmonella Typhimurium and Escherichia coli O157: H7 and bacteria surviving sanitation of conveyor belts of meat processing plants. Microorganisms 11: 421. [crossref]
  27. Yuan L, Sadiq FA, Wang N, Yang Z, He G (2020) Recent advances in understanding the control of disinfectant-resistant biofilms by hurdle technology in the food industry. Crit Rev Food Sci Nutr 1-16. [crossref]
  28. Coban HB (2020) Organic acids as antimicrobial food agents: applications and microbial productions. Bioprocess Biosyst Eng 43: 569-591.
  29. Halstead FD, Rauf M, Moiemen NS, Bamford A, Wearn CM, et al. (2015) The antibacterial activity of acetic acid against biofilm-producing pathogens of relevance to burns patients. PLoS One 10: e0136190. [crossref]
  30. Ban GH, Park SH, Kim SO, Ryu S, Kang DH (2012) Synergistic effect of steam and lactic acid against Escherichia coli O157: H7, Salmonella Typhimurium, and Listeria monocytogenes biofilms on polyvinyl chloride and stainless steel. Int J Food Microbiol 157(2): 218-223. [crossref]
  31. Beier RC, Harvey RB, Hernandez CA, Hume ME, et al. (2018) Interactions of organic acids with Campylobacter coli from swine. PLoS One 13: e0202100.
  32. Kim SH, Wei CI (2007) Biofilm formation by multidrug-resistant Salmonella enterica serotype Typhimurium phage type DT104 and other pathogens. J Food Prot 70: 22-29.
  33. Pienaar JA, Singh A, Barnard TG (2020) Membrane modification as a survival mechanism through gastric fluid in non-acid adapted enteropathogenic Escherichia coli (EPEC). Microb Pathog 144: 104180. [crossref]
  34. Lu P, Ma D, Chen Y, Guo Y, et al. (2013) L-glutamine provides acid resistance for Escherichia coli through enzymatic release of ammonia. Cell Res 23: 635-644. [crossref]
  35. Lund P, Tramonti A, De Biase D (2014) Coping with low pH: Molecular strategies in neutralophilic bacteria. FEMS Microbiol Rev 38(6): 1091-1125.
  36. Andersen TE, Kingshott P, Palarasah Y, Benter M, et al. (2010) A flow chamber assay for quantitative evaluation of bacterial surface colonization used to investigate the influence of temperature and surface hydrophilicity on the biofilm-forming capacity of uropathogenic Escherichia coli. J Microbiol Methods 81: 135-140. [crossref]
  37. Dourou D, Beauchamp CS, Yoon Y, Geornaras I, Belk KE, et al. (2011) Attachment and biofilm formation by Escherichia coli O157: H7 at different temperatures, on various food-contact surfaces encountered in beef processing. Int J Food Microbiol 149: 262-268. [crossref]
  38. Cai S, Phinney DM, Heldman DR, Snyder AB (2020) All treatment parameters affect environmental surface sanitation efficacy, but their relative importance depends on the microbial target. Appl Environ Microbiol 87: e01748-20. [crossref]
  39. Scaffaro R, Lopresti F, Marino A, Nostro A (2018) Antimicrobial additives for poly (lactic acid) materials and their applications: current state and perspectives. Appl Microbiol Biotechnol [crossref]

Attacks on ‘First Responders’ in the United States: Can AI Using Mind Genomics ‘Thinking’ Identify Mindsets and Provide Actionable Insight?

DOI: 10.31038/JCRM.2024714

Abstract

Using generative AI, the paper investigates the nature of individuals who are likely to attack first responders (e.g., police, fire fighter, medical professionals). AI suggested five different mind-sets, and a variety of factors about these mind-sets, including what they may be thinking, and how they can be recognized. The approach of synthesizing mind-sets provides society with a way to understand negative behaviors, and to protect against them.

Introduction

In today’s society, the traditional feeling towards first responders such as emergency services, law enforcement and firefighters at the scene of an accident or crime, as well as doctors and nurses providing care in clinics, is usually one of respect and gratitude. These individuals are seen as heroes who put their own lives at risk to help others in need. People typically view first responders as dedicated professionals, essential to maintaining order and providing crucial assistance in emergency situations. Often, their work is so stressful that in some cases they end up suffering with PTSD years after their efforts [1-6].

However, violence against first responders, appears to be a growing threat. While underreported, studies suggest a concerning rise. A 2019 report by the National Fire Protection Association (NFPA) highlights that a staggering 69% of EMS personnel experienced some form of violence on the job within a year, with a third being physically assaulted (NFPA 2019).

During the past 30 years, however, the United States has experienced significant changes in societal attitudes and behaviors which end up in the often-unthinkable behavior of attacking first responders, whether these be public servants like police [7] or doctors and nurses in clinics [8-10]. At first glance this behavior seems irrational because the first responders are actively helping the public.

Among the key reasons:

Emotional Intensity and Stress: Emergency situations can be highly emotional and stressful for everyone involved. First responders often encounter distressed individuals, family members, or witnesses. The intensity of these situations can lead to aggression directed at responders [11].

Substance Abuse and Mental Health Issues: People under the influence of drugs or alcohol may act irrationally and become aggressive. Additionally, individuals with mental health conditions might not respond well to assistance. This problem is made worse by the fact that mental health services are underfunded and under supported, which increases the likelihood that first responders may face violent incidents [12].

Vocal And Emotionally Charged Skepticism Towards Government, Law Enforcement, And The Media: Some scholars suggest that this trend owes its growth to the increasingly. The result is a culture where challenging authority is increasingly the norm. Sometimes this erosion is expressed by a simple expression, ‘is nothing sacred anymore?’ [13-15].

Economic Disparities and Social Inequalities in the US; Economics and daily struggle cannot help but create pockets of resentment and frustration within marginalized communities. First responders, often interacting with these communities in times of crisis, end-up becoming targets for the projected frustration and anger emerging from this economically driven sense of powerlessness and injustice. This was recognized more than a half century ago [16]. Also adding to the distrust and antagonism towards first responders is the militarization of police forces and the general increase in the use of force by police officers. When the public views police as tyrannical or hostile, trust in law enforcement may suffer and communities may stop working together to keep the peace [17].

AI Predictions about the Future for First Responders

To understand this topic and to offer recommendations capable of minimizing attacks on these essential workers, we used the AI embedded in the Mind Genomics platform to help us understand the mind-sets of people who attack first responders. The approach asked the AI embedded in Mind Genomics (SCAS, Socrates as a Service) what would happen if the current attitude towards the first responders were to be unchecked. Our specific questions were what would happen in 2026, then in 2030.

SCAS returned with the following ‘prediction’: ‘People will probably still respect and admire first responders in 2026, but they may be worried about their safety due to the rising frequency of assaults on them. Many people may start to be more cautious of the dangers that come with becoming a doctor, nurse, or police officer in light of the increasing number of occurrences targeting these professions. There may be a rising chorus of voices demanding more funding and assistance to shore up the safety nets that now shield first responders. Looking further ahead to 2030, if the trend of attacks on first responders continues unabated, people’s feelings towards these essential workers may become deeply polarized. There may be a growing divide between those who continue to view first responders as heroes deserving of support and admiration, and those who have lost faith in the system and believe that drastic measures are needed to address the root causes of the problem. The traditional feeling of respect and gratitude towards these individuals may be overshadowed by a sense of resentment and anger at the injustices faced by those who dedicate their lives to helping others.

Deeper Understanding of the Problem of Attacking First Responders: Mind-sets and the Contribution of Mind Genomics

Based upon the foregoing ‘prediction’ by AI, we move to a deeper understanding of the minds of people who are described as ‘attacking first responders.’ The approach was based upon the work in Mind Genomics, an emerging branch of psychology dealing with how people respond to the world of the everyday [18,19].

How people respond to stimuli is influenced by their cognitive biases, cultural background, childhood, and life experiences. Studying these individual differences, Mind Genomics zeroes down on the minute details of daily life by classifying individuals according to their thoughts on a subject, their motivations for doing something, and even their barriers to action. Mind genomics achieves this by utilizing a combination of controlled experiments, data analysis, and cognitive psychology principles to identify distinct mind-sets and predict corresponding behaviors [20-22].

Recently, attention has shifted to using artificial intelligence to suggest mind-sets [23]. By using AI, it becomes possible to create a situation where the different mind-sets are identified, along with their possible ‘internal conversation before the attack’, as well as things that can be done immediately as well as long term to discourage these behaviors.

Mind Genomics Empowered by AI, to Explore ‘Who’ Attacks and Why

The rest of the paper is devoted to an exploration of different mind-sets, using AI to drive the creation of the mind-set. The AI is Chat GPT [24], with a series of prompts developed specifically for Mind Genomics. The prompts enable the user to find out specific information about a topic, and later apply AI to further ‘analyze’ the information originally provided by AI. The system is called Socrates as a Service, abbreviated as SCAS. It will be SCAS which allows us to interact with AI.

The exploration begins by presenting SCAS, viz., the embedded AI, with background material, or more correctly with a simple prompting statement. This statement, chosen by the user, is simply the statement: There are six radically different mind-sets of individuals who attack first responders. This statement is presented as fact. (Note that AI will return with only five mind-sets). The rest of the information presented to SCAS is a set of six questions, generated by the user. Table 1 shows the information and request provided to AI.

Table 1: The input information provided by the user and the request for additional information. Note that AI ended up returning only five mind-sets.

TAB 1

The simplicity of the system reduces the anxiety of the user. The user ends up setting the scene for AI by stating the number of mind-sets, and then requests that the AI (viz., SCAS) become a tutor, by answering six questions for each mind-set just synthesized by AI.

Once the user has specified the requested information AI returns quickly with suggestions about the mind-sets. The request has to be made properly. In the effort to create Table 2, it took four iterations to get the request correct, viz., the request shown in Table 1. The iterations are fast, requiring about 15 second each, allowing for a trial-and-error change of instructions so that they end up being clear, and without ambiguity. It is important to emphasize that the ‘errors’ instructing the AI are usually the result of ambiguous instructions, and all-too-often, instructions which contain impossible-to-satisfy requests.

Table 2: The five mind-sets developed by SCAS as a direct response to the request

TAB 2

Table 2 shows the set of five mind-sets ‘synthesized’ by AI. A second iteration might return with some of the same mind-sets, but perhaps with one or two new mind-sets, as well as four of the previous five mind-sets. Note that although the user can request a certain number of mind-sets, the request ends up being a suggestion. Quite often AI returns with fewer mind-sets than requested, but never more than the number requested by the user.

The mind-sets appear with the relevant questions. Whether or not the information is accurate is not as important as the fact that within minutes the user has begun to learn about assaults against first responders. Just the information alone begins to educate, providing insights about what may be going on in the minds of those who do the assaulting, as well as what to say to them in terms of ‘slogans’.

Putting the Ideas into Action after Knowing Mind-sets

AI can predict and prevent attacks on first responders by understanding threat mindsets. By analyzing past incidents, AI can identify patterns and intervene before violence. This knowledge can de-escalate volatile encounters, suggest communication tactics, and prevent violence. With the right tools, first responders can manage unpredictable situations safely.

A short description of each mind-set was given to AI (SCAS), along with the background shown at the top of Table 3. The different mind-sets were provided to give AI a sense of the range of the different ways people might feel about first responders. The request, however, was to come back with a single strategy. The request was given twice, generating two iterations. These are shown in Table 3.

Table 3: Putting the ideas into action – how to prevent or ameliorate the attacks

TAB 3

Strategies Suggested by AI to Minimize Attacks on First Responders

The final activity in this exploration of attacks against first responders comprises the education of professionals. Here let us assume that we are dealing with police officers in a local precinct. The assumption here is that many of the potential attackers are thought to fall into the grouping of ‘Aggressive Defender.’

The strategy is first to create a briefing document for all officers to read (Table 4, and then to create a set of posters showing how the officers should behave towards the Aggressive Defender (Table 5). The briefing document and posters for police officers can enhance their understanding of Aggressive Defender mindsets. The briefing document provides detailed information on their characteristics, behaviors, and motivations, enabling them to anticipate, respond to, and de-escalate situations, thereby improving their safety and effectiveness on the job. In turn, the posters for the precinct teach the police officers how to effectively interact with Aggressive Defenders and potential threats.

It’s important to note that briefing documents and posters are just one method for communicating the information outlined. Multimedia formats for the same information, such as video generated by prompts or text are generally available, and could be used as an adjunct to or substitute for the poster approach outlined below.

Table 4: The briefing document for police officers, focusing on the AGGRESSIVE DEFENDER mind-set

TAB 4

Table 5: Three types of posters for the police precinct, dealing: The briefing document for police officers, focusing on the AGGRESSIVE DEFENDER mind-set.

TAB 5

Who Would be Interested in These AI-based Simulations of Potential Attacker Mind-sets’?

We close the ‘results section’ (viz., the simulations) with a second-level analysis by SCAS. Once the iterations are complete and delivered to the user, the embedded AI reviews the information, and provides deeper analysis of what was presented in the results immediately delivered to the user. This secondary ‘summarization’ of the information occurs some time later, after the project is closed.

Part of the summarization analysis considers WHO would be the audiences. SCAS is pre-programmed to provide three different groups: those who are interested, those who are opposed, and those who think differently and may bring new viewpoints to the problem. These appear in Table 6.

Table 6: AI summarization of three different types of audiences faced with information and simulation of potential attacker mind-sets.

TAB 6

Discussion and Conclusions

Understanding the roots of violence today is critical to safeguarding our first responders. They are continuously exposed to risky circumstances that might develop into violent assaults. The police are often the most visible targets of this assault, but physicians at clinics are also at danger. Individual physicians have been targeted in violent assaults because they are blamed for poor medical results.

Using AI to model mindsets may assist first responders in better understanding and anticipating possible violence. Mind Genomics is a helpful tool for better analyzing and communicating with diverse mindsets. Understanding the mindsets of prospective attackers allows first responders to effectively de-escalate situations and protect themselves and others. This may greatly enhance the safety and efficacy of our first responders in high-risk circumstances.

Imagine a future in which all first responders are educated to comprehend and communicate with diverse mindsets utilizing AI technology. This might transform how our essential front-line workers handle perilous circumstances, shield themselves from injury, and maintain public support. The capacity to detect and avoid violence may be the difference between life and death for the first individuals on the scene.

References

  1. Alexander DA, Klein S (2009) First responders after disasters: a review of stress reactions, at-risk, vulnerability, and resilience factors. Prehospital and Disaster Medicine 24: 87-94. [crossref]
  2. Henry VE (2015) Crisis intervention and first responders to events involving terrorism and weapons of mass destruction. Crisis Intervention Handbook: Assessment, Treatment, and Research, pp.214-47.
  3. Holgersson A (2016) Review of on-scene management of mass-casualty attacks. Journal of Human Security 12: 91-111.
  4. Jannussis D, Mpompetsi G, Vassileios K (2021) The Role of the first responder. in emergency medicine, trauma and disaster management: In: From Prehospital to Hospital Care and Beyond (pp. 11-18). Cham: Springer International Publishing.
  5. Prioux C, Marillier M, Vuillermoz C, Vandentorren S, Rabet G, et al. (2023) PTSD and Partial PTSD among first responders one and five Years after the Paris terror attacks in November 2015. International Journal of Environmental Research and Public Health 20,: 4160. [crossref]
  6. Wilson LC (2015) A systematic review of probable posttraumatic stress disorder in first responders following man-made mass violence. Psychiatry Research 229: 21-26. [crossref]
  7. Soltes V, Kubas J, Velas A, Michalík D (2021) Occupational safety of municipal police officers: Assessing the vulnerability and riskiness of police officers’ work. International Journal of Environmental Research and Public Health 18: 5605. [crossref]
  8. Huffman MC, Amman MA (2023) Violence in a place of healing: Weapons-based attacks in health care facilities. Journal of Threat Assessment and Management 10: 151-187.
  9. Gibbs JC (2020) Terrorist attacks targeting police, 1998–2010: Exploring heavily hit countries. International Criminal Justice Review 30: 261-278.
  10. Rohde D (1998) Sniper Attacks on Doctors Create Climate of Fear in Canada. New York Times.
  11. Richter G (2019) Assaults to EMS First Responders are Felonies in Pennsylvania, So Why Do Many Victims Feel They Do Not Receive Justice? Am J Ind Med [crossref]
  12. Coleman TG, Cotton DH (2010) Reducing risk and improving outcomes of police interactions with people with mental illness. Journal of Police Crisis Negotiations 10: 39-57.
  13. Cole J, Walters M, Lynch M (2011) Part of the solution, not the problem: the crowd’s role in emergency response. Contemporary Social Science 6: 361-375.
  14. Gibbs JC (2013) Targeting blue: Why we should study terrorist attacks on police. In: Examining Political Violence, Routledge (pp. 341-358).
  15. Gibbs JC (2018) Terrorist attacks targeting the police: the connection to foreign military presence. Police Practice and Research 19: 222-240.
  16. Ransford HE (1968) Isolation, powerlessness, and violence: A study of attitudes and participation in the Watts riot. American Journal of sociology 73: 581-591. [crossref]
  17. Smith DC (2018) The Blue Perspective: Police Perception of Police-Community Relations. University of Maryland, Baltimore County.
  18. Moskowitz HR, Gofman A, Beckley J, Ashman H (2006). Founding a new science: Mind Genomics.” Journal of Sensory Studies 21: 266-307.
  19. Moskowitz HR, Gofman A (2007) Selling Blue Elephants: How to Make Great Products that People Want Before They Even Know They Want Them. Pearson Education.
  20. Ilollari O, Papajorgji P, Gere A, Zemel R, Moskowitz H (2019) Using Mind Genomics to understand the specifics of a customer’s mind.The European Proceedings of Social, Behavioural Sciences EpSBS ISSN: 2357-1330.
  21. Moskowitz H, Wren J, Papajorgji P (2020) Mind Genomics and the Law (1st Edition). LAP LAMBERT Academic Publishing.
  22. Ilollari O, Papajorgji P, Civici A (2020) Understanding client’s feelings about mobile banking in Albania. Interdisciplinary International Conference On Management, Tourism And Development Of Territory 147-154.
  23. Moskowitz HR, Rappaport S, Saharan S,DiLorenzo, A (2024) What makes ‘good food’: Using AI to coach people to ask good questions. Food Science, Nutrition Research 7: 1-9. [crossref]
  24. Aher GV, Arriaga RI, Kalai AT (2023) Using large language models to simulate multiple humans and replicate human subject studies. Proceedings of the 40th International Conference on Machine Learning 202: 337-371.

The Financial Incentives Leading to the Overutilization of Cardiac Testing and Invasive Procedures

DOI: 10.31038/JCRM.2024712


The overutilization of cardiac testing and unnecessary referrals to invasive coronary angiography are significant clinical and health policy concerns. Inappropriate imaging cardiac stress tests are estimated to cost the U.S. healthcare system $500 million annually and expose many patients to unnecessary radiation. The unjustifiable use of diagnostic tests to screen for cardiac disease in asymptomatic and low-risk chest pain patients may lead to further testing and invasive procedures that are costly and potentially harmful, and have no clear outcome benefits. The principal trend in the treatment strategy for stable ischemic heart disease (SIHD) over the past two decades has been the utilization of percutaneous coronary intervention (PCI) and diminishing utilization of medical treatment and coronary artery bypass surgery (CABG). Despite these long-term changes in strategy, overall mortality has not improved significantly while costs have risen exponentially. One deleterious consequence has been an increasingly greater dependence on testing and interventional volume to maintain the revenue stream of cardiology practices.

Historical Background

The origins of this dependence are related to the original PCI learning curve. PCI quantity became a surrogate for quality: at an early stage, the standard was that “the more you do, the better you are”. This misconception persisted long after it was demonstrated to not be an accurate measure of quality despite the proposal of better metrics. There were several reasons for this tenacity. First, with the high reimbursement for PCI, cardiology sections and departments of medicine had found a “cash cow” in an era of “cost containment” that financed program expansion and higher compensation. Interventional leaders at first rigorously maintained high evidentiary standards of case selection. But then, as fellows were trained and entered outside practice with their newly minted skills, the potential income to physicians and hospitals became apparent. Teaching hospitals suddenly were in competition with previously small community hospitals, including those that previously were established referral sources. More and more interventionists entered practice, and competition expanded further; maintaining high volume meant moderating standards of case selection.

Another factor was an inherent uncertainty and unpredictability with balloon angioplasty. It was accepted that there was a risk of dissection and acute closure requiring urgent CABG, and thus only those who were surgical candidates could be PCI candidates. Some pioneers pushed that envelope with great success in otherwise hopeless cases. With the introduction of stents, the incidence of acute closure requiring CABG became zero. And with this fantastic tool, there was suddenly no contraindication to any patient with a severe lesion, including those with no symptoms at all.

Impact of Financial Incentives

Thereafter, the volume of procedures increased exponentially, and with it, revenue to hospitals, doctors, and programs at a time of diminishing reimbursements for cognitive skills. Hospital administrators, with the bottom line fully in focus, insisted on even more volume. As hospital systems increasingly acquired practices, these non-physicians became physician-leaders, and their bottom line was income generation. Any physician who wanted to see the science that showed evidence that all of these patients were getting benefits were suddenly no longer considered to have high standards, but rather naïve. The cardiology department and cardiac catheterization laboratory directors were expected to increase cath lab volumes.

In parallel, an entire lesion detection infrastructure sprung up with various forms of high-volume, moderately well-reimbursed stress testing being performed on any patient with even the most atypical symptoms. In a patient with a low pretest probability of coronary artery disease, a positive stress test is more likely to be a false positive than a true positive. Cardiologists developed an entire system to detect CAD that was revenue generating, even though the evidence suggesting it saved lives or improved quality of life was lacking. Finding disease to prevent sudden death is an attractive concept and was used to justify the liberalization of testing.

The fact that this testing strategy has led to millions of procedures with no scientific evidence to support it is unwelcome news to many. Science has taken a back seat to dogma in the promotion of procedures designed for a paradigm (obstructive lesion → ischemia → MI → mortality) that is known to be highly simplistic and incorrect. Any suggested harms became controversial and subjects of debate, in particular, whether a “small myocardial infarction” related to microthrombi and embolization during the procedure has long-term prognostic implications.

With academic leaders in interventional cardiology promoting PCI for MI prevention, it should have been no surprise that certain physicians with large practices of SIHD patients were doing unnecessary procedures on non-significant lesions, and sometimes, with no visible stenosis at all. A significant culprit of this time told the media that his 7-figure income was not an influence for placing 30 stents in a day. A few physician reputations were destroyed, but no hospitals went out of business—others, to keep that volume coming in, acquired them. The blame was placed on the “bad apple”, not the tree.

Guidelines

Rather than undertake a serious introspective evaluation at what was transpiring, an indirect evaluation was proposed. The cardiology societies collaborated to develop appropriateness criteria to classify which indications for revascularization were acceptable and which were not. The idea was to self-police and control the destiny of medical practice rather than allow outside agendas, clearly not attuned to the patient, control the procedure. Hospitals became interested in developing and paying for quality assurance programs as a defense against obvious malfeasance. These criteria were most notable for posing a temporary obstacle for clever interventionists to work around rather to assure that the right procedure is done for the right patient.

The flaws in these criteria were clear to many from the outset. Improved survival is not the only benefit a treatment strategy can offer, just the easiest to measure. Most patients prefer improved quality of life to longer survival alone, especially in regard to symptom status, but these are less objective in their assessment. If subjective improvement in symptoms is considered a benefit, then there was no way to generalize classifications, and they could also be subjectively influenced, so they weren’t included. Nearly all interventionists were displeased with a cookbook approach to case selection without reference to the individual patient. And with every new tweak of devices and technique, there was a disregard for prior studies that failed to show a benefit, even when new studies continued to show almost identical results. It is no coincidence that the most important PCI trials of the last 15 years (COURAGE, BARI2D, and ISCHEMIA) were not led by interventional cardiologists.

Contemporary Practice

Today, cardiologists can no longer compensate for declining reimbursement for their services by increasing the number of services they provide. The volume of coronary interventions performed in most institutions and by most interventional cardiologists is declining, just as the number of heart surgeries has been declining for years. Insurance companies require pre-approval for coronary CT angiograms, nuclear imaging, and other procedures. The pressure for interventional cardiologists to do as many cases as possible is motivated by demand from hospital and practice administration to increase revenue, which seems to conflict with the scientific evidence provided by randomized trials and summarized in practice guidelines.

Intervention has devolved to that of a commodity, a service provided on order as if there was no downside risk, with great benefits, and as if no alternative exists. Medical therapy remains the implied least attractive treatment modality, resorted to only when PCI or CABG are not favorably viewed from a technical standpoint. Standard management remains that invasive procedures always yield information that benefits the patient’s outcome. Discordant clinical trials are characterized as flawed in design.

As cardiologists, we see the patients referred to us to consider if a procedure is indicated, then we do the procedures, for which we are compensated; but receive only the fee for office visit if we do not advise the procedure be performed. That is self-referral, and the inherent conflict of interest this business model incorporates has had a substantial influence on modern practice. The pressure to do more cases is constantly applied from the administrative hierarchy: to prove quality, to generate income, to develop new referrals.

The response of third-party payors to the exponential rise in procedures was to suggest non-payment when the physician’s guidelines were abrogated. The physician’s response was to liberalize the criteria, eliminate the term “inappropriate” so that no case could be said to be not scientifically based, and denounce lack of payment for services in a fee-for-service environment. Consequently, the insurance companies now pay decreasing amounts for the procedure, currently at laughably low levels, because they realized that doctors and hospitals have no incentive to become partners in trying to control costs.

The decreased payment per case, of course, adds further pressure to do even more cases and procedures, of even less proven benefit to the patient, to generate more revenue. Hypothermia, ventricular assist devices, multivessel stenting in MI and shock, and specific treatment devices, have been advocated in these guidelines despite no studies showing benefits and even some showing a lack of benefit and even harm. Cycles of increasing indications for procedures following diminishing reimbursement have resulted.

Can This Be Fixed?

As Deming said, “Every system is perfectly designed to get the result that it does”; so to change the outcome, it would be necessary to change the system and its component parts which derive profit from these circumstances. One place to start is how trainees are taught. It’s not just what is said to fellows and housestaff, but how their teachers actually act. If they see their attendings say one thing and do another, with a wink and a nod, they get it. The practice of today has to reflect the values medicine should optimally follow in the future.

Incorporating the results of the ISCHEMIA Trial into practice guidelines is a significant challenge. The finding that SIHD with moderate-to-severe ischemia treated by revascularization had no benefit beyond OMT in preventing major cardiovascular events after 4 years challenges all of our preconceived notions. The premise that severely symptomatic SIHD should be treated invasively to improve mortality is incorrect: since worsening severity of ischemia is associated with increased mortality, logically it would seem to follow that procedures that reduce ischemia should improve survival, but this was not the case. Moreover, the traditional teaching that revascularization does not prevent MI in SIHD may be incorrect: the rate of spontaneous MI during 4-year follow-up was lower in the revascularization subgroup (HR 0.67 (0.53, 0.83), p<0.01), suggesting that perhaps PCI may reduce type I MIs.

For most patients with SIHD but without left main coronary disease or severely reduced left ventricular function, shared decision‐making about revascularization should be based on discussions of symptom relief and quality of life and not about reduction in mortality.

As better evidence is developed, more definitive appropriateness criteria should be implemented to ensure we deliver effective, valuable care — and contain costs.

This change would have immediate repercussions, as the entire medical payment system would have to re-equilibrate after decades of deception on all sides. It will mean less revenue in an environment in which over-utilized procedures are underpaid. Professional societies must take on the hard battles, showing responsibility and leadership. Mechanisms to self-regulate are needed. Those who repeatedly take advantage of the lack of objectivity in testing, without regard to costs to the patient, have to be discouraged, not rewarded, by their practice pattern.

Hospitals and physicians must agree to allow oversight of quality by outside, objective agencies and methods, and welcome it. The alternative is to continue down the current path, where costs are rising, reimbursement diminishing, income is threatened, and procedures are done with modest reference to clinical trials that determine what really helps the patient. The delivery of optimal clinical benefit requires an ongoing self-assessment structure comparing actual results to accepted benchmarks, with timely modification of practices when deficiencies are identified. The critical quality elements include adhering to evidence-driven case selection, ensuring proficient technical performance, and monitoring clinical outcomes [1-4].

References

  1. Klein LW, Dehmer GV, Anderson HV, Rao SV (2020) Overcoming obstacles in developing and sustaining a cardiovascular procedural quality program. Journal of the American College of Cardiology – Cardiovascular Interventions 13(23): 2806-2810. [crossref]
  2. Klein LW, Anderson HV, Rao SV (2019) Proposed framework for the optimal measurement of quality assessment in percutaneous coronary intervention. Journal of the American Medical Association – Cardiology 4(10): 963-964. [crossref]
  3. Klein LW, Anderson HV, Rao SV (2020) Performance metrics to improve quality in contemporary PCI practice. Journal of the American Medical Association – Cardiology 5(8): 859-860. [crossref]
  4. Anderson HV, Shaw RE, Brindis RG, et al. (2005) Relationship between procedure indications and outcomes of percutaneous coronary interventions by American College of Cardiology/American Heart Association Task Force Guidelines. Circulation 112 (18), 2786-2791. [crossref]
FIG 16

Overview of Hard Cyclic Viscoplastic Deformation as a New SPD Method for Modifying the Structure and Properties of Niobium and Tantalum

DOI: 10.31038/NAMS.2024721

Abstract

In this overview work the changes in the structure and properties of commercially pure niobium and tantalum under conditions of hard cyclic viscoplastic deformation are studied. During linear compression-tension deformation of the sample, wich was carried out in the strain control mode in the range from ε=±0.2% to ε=±3.0% with a frequency f=0.2-2.5 Hz and with a number of cycles in the range from 20 up to 40, respectively. In addition to classical methods of severe plastic deformation, this method can be used to improve and stabilize the microstructure, mechanical, physical and functional properties of single crystalline, coarse-grained, ultrafine and nanocrystalline metallic materials. The experimental results obtained can be used to study the stability and viability of metallic materials, as well as predict their suitability over time in harsh environments such as space and military applications, and thereby expand new understandings and connections in materials science.

Impact Statement

This overview article comprehensively reviews recent advantages of the development of niobium and tantalum structure and properties studyied by severe plastic deformation (SPD) and hard cyclic viscoplastic deformation (HCVD) at room temperature.

Keywords

Severe plastic deformation, Hard cyclic viscoplastic deformation, Microstructure, Mechanical properties, Physical properties, Wear, Tribological properties, Viability, Electrical conductivity, Hydrogen storage, Young´s modulus

Introduction

Written science in the field of SPD first appeared in the late 20th century [1,2], but archaeological research has shown that the process was known and used at least 2,700 years ago [3] in the production of knives and swords. Humanity has been working with metals since the Bronze Age and has created a common and understandable terminology for all communities. For example, the metalworking process with severe plastic deformation (SPD) in turn contains about a hundred technological processes and a large number of terms to describe these processes and their results. The field of SPD is constantly being improved with new methods already developed and partially patented for more than a hundred names. Currently, more than 1000 papers are published annually in the field of SPD. The emergence and application of new processes in materials science also require the development and addition of new terminologies.It is well known, that the SPD methods are popular due to their ability to modify the microstructure [4-6] and mechanical properties [7-10] of various plastic metal materials. At that time, it was well known that the mechanical properties of SPD-processed materials were significantly better compared to their coarse-grained counterparts [11-15]. Experimental results show that it is possible to change the initial microstructure from a coarse-grained (CG) to an ultrafine-grained (UFG) structure with grain sizes in the range from 1000 to 100 nanometers at ECAP and to a nanocrystalline (NC) structure with a crystal size below 100 nanometers [16-21] at HPT. Unfortunately, the scientific works on SPD listed in [1-21] have so far mainly studied only changes in the microstructure and mechanical properties of materials, such as hardness and strength. At the same time, a number of recent scientific articles have shown that changes in microstructure and mechanical properties during SPD also lead to changes in electrical conductivity [22-27], phase transformations [28-31], wear resistance [32-35], cyclic plasticity [36-41], and so on. Unfortunately, in these works relatively little attention was paid to changes in functional properties, which limits the widespread use of these materials in modern industry.

Components and entire systems are characterized by time-varying cyclic loads and often random load sequences that can cause material fatigue and damage. Therefore, understanding the relationship between fatigue damage and random cyclic loading is a necessary prerequisite for reliable sizing of components and structures. However, this design of fatigue components is motivated not only by the desire to avoid damage to products and their repair. Today, issues of materials and energy efficiency are becoming increasingly important, and therefore increasing their sustainability during operation, which requires accurate knowledge of the operating loads of the systems and the corresponding fatigue behavior of the materials. Sustainability in today’s sense means making the most efficient use of available resources, and this goal can only be achieved for many components and structures if the load sequences present in the operation are known and taken into account when optimizing materials, design and production in industry. Information on the latest developments in the field of variable load fatigue, new scientific approaches and industrial applications of materials, components and designs is up to date. The achievements and results of research in recent years, new approaches and the latest processes in various industries are highly appreciated.

Tension-compression amplitudes, as characteristic features of typical workload sequences in various mechanisms, are becoming very important parameters in the design and optimization of components and structures. Material testing methods such as low cycle fatigue (LCF) [42] and high cycle fatigue (HCF) [43], ratchet [44], Bauschinger effect [45-47], Young’s modulus [54], are very important to determine the durability of materials in actual use.

For example, the number of cycles to failure for the LCF test method is typically less than 10,000, and the failure mode is typically ductile failure. During HCF testing, the material or component fails after a large number of cycles, typically greater than 10,000. Thus, HCF is typically associated with very low strain amplitude at tensile, elastic deformation, crack initiation and growth. The difference between these test methods, LCF and HCF, depends on the level of strain under tensile stresses, the ductility of the material and the degree of elastic deformation. Fatigue behavior is characterized by loading frequency, loading history, loading type, ambient temperature, microstructure, defects and residual stresses in the material.

The ratcheting method uses only tensile deformation with controlled tensile strain and a very small number of cycles. The ratcheting method is based on the well-known Bauschinger effect. The method for testing of metallic materials in viscoplastic states is so called as Hard Cylic Viscoplastic Deformation (HCVD) is described in [55-59]. The viscoplastic behavior and hardening/softening of metallic materials allows you to very quickly, simply and cheaply change and study the structure and properties of metallic materials. For example, this method has been used at firstly to study the microstructure, mechanical and functional properties of metallic materials such as coarse grained (CG) copper [60], ultrafine-grained copper alloys [61], pure niobium [62-65], pure tantalum [66-69] with oligocrystalline structure and also Ni-based single-crystal superalloy [70-73], etc.

This overview study on Nb and Ta by uising HCVD technique is based primarily on my own research work in which I have studied materials using various SPD techniques. HCVD principles were first presented in 2004 at the TMS Ultrafine Grained Materials III Annual Meeting, Charlotte, North Carolina, USA [74] and at the 4th DAAAM International Conference on Industrial Engineering – Innovation as a Competitive Advantage for SMEs, Tallinn, Estonia. [75]. Unfortunately, HCVD as a new process in materials science has not yet been widely used in studying the evolution of the structure and properties of metallic materials. At present time the stability and viability of metallic materials, and predicting their suitability over time in harsh environments such as space and military applications is actual. Studying the behavior of metallic materials in viscoplastic states using HCVD method allows us to expand concepts and new connections in materials science.

Experimental Section

Materials

The materials for present experimental work were technically pure niobium (Nb) and tantalum (Ta) ingots, which were produced by electron beam melting (EBM) technique on Neo Performance Materials (NPM) Silmet AS, Estonia. The chemical analysis of NPM Silmet AS showed that the pure Nb ingots, with diameter of 220 mm, contained the following non-metallic elements: N (30 ppm), O (72 ppm), H (˂10 ppm), c (˂20 ppm), and metallic elements: Ta (160 ppm), Si (˂20 ppm), P (˂15 ppm), Mo (˂10 ppm), and W+Mo (˂20 ppm), respectively.

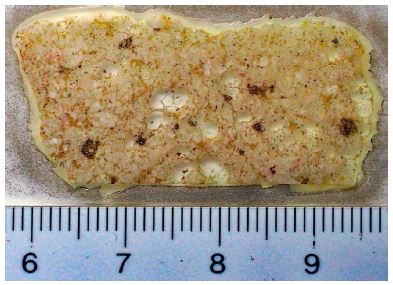
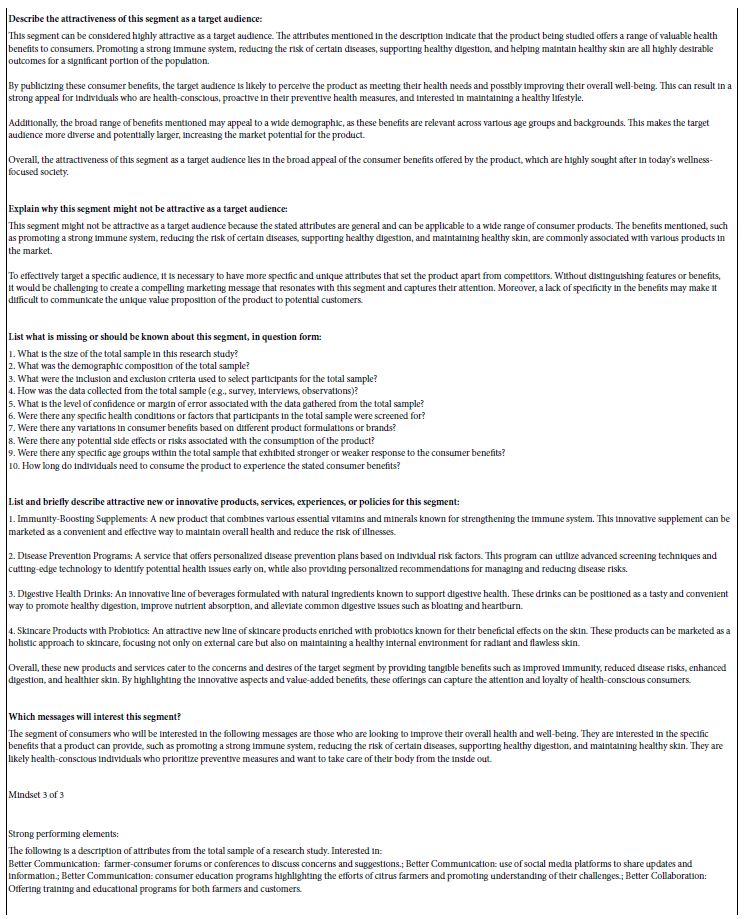
The Ta inots diameter was 120 mm and an oligocrystalline macrostructure. The chemical composition of Ta was: Al, Mg, Pb, Cu, Fe, Mo, Mn, Na, Sn (for all ˂5 ppm), Nb (˂20 ppm), W (˂10 ppm), and Si (˂10 ppm) and non-metallic elements: N (˂ 20 ppm), O (˂ 30 ppm), H (˂10 ppm), S (˂10 ppm), C (˂10 ppm), respectively. These ingots had a oligocrystalline macrostructure up to 15-20 cm in length and approximately 5-6 cm in thickness (Figure 1). The Nb and Ta samples were before for recrystallization heat treated in vacuum furnace at 1100°C for 30 min.

FIG 1

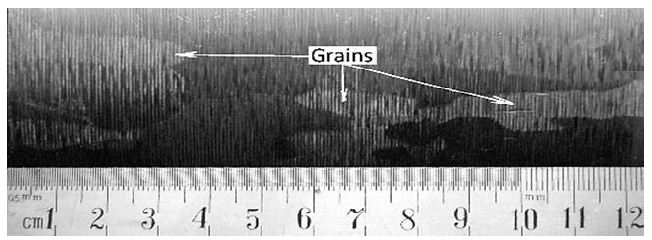
Figure 1: Oligocrystalline macrostructure of Ta after EBM by industrial processing

The IEAP Technique and Test Samples Manufacturing

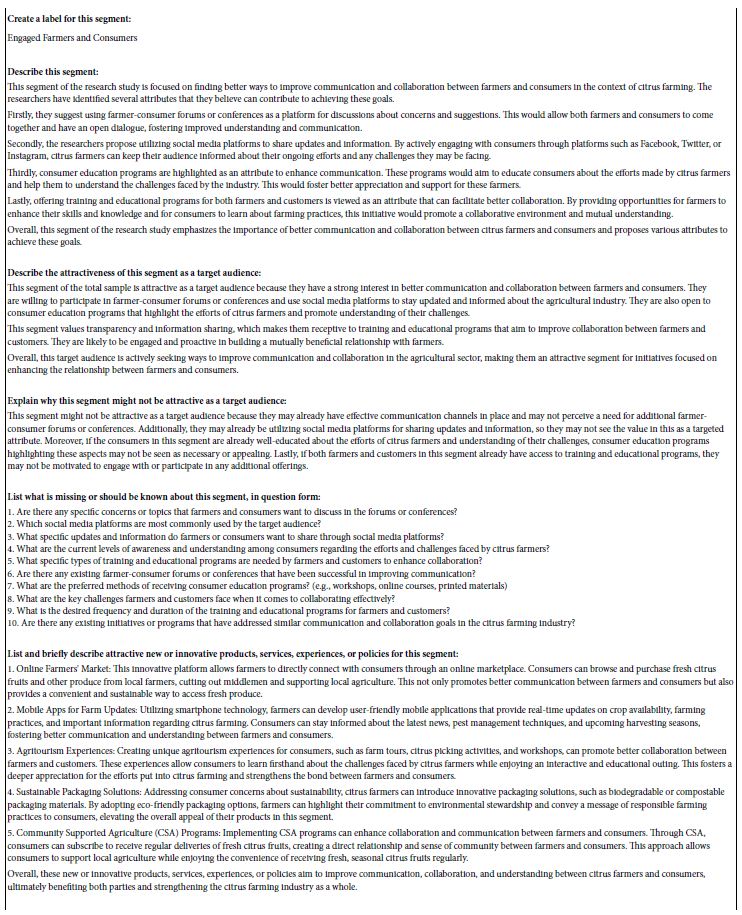
Using hard-to-deform Nb and Ta samples, the ECAP matrix was modified and a new so-called “indirect extrusion angle pressing” (IEAP) method was developed [34,63,66,67,76]. IEAP format channels do not have the same cross-section. The cross-section of the output channel, taking into account the elastic deformation of the base metal, was reduced to 5-7%, which makes it possible to use the conveyor method when pressing without intermediate processing of the cross-section of the workpiece. This is due to elastic deformation of the matrix and an increase in the cross-section of the sample during pressing. To process workpieces under HCVD, the developed IEAP technology was used. In the work under consideration, the microstructure of the samples under study was modified up to 12 passes of the IEAP along the BC route. The maximum degree of von Mises deformation during one pressing was 1.155, and after 12 passes – up to ~13.86, respectively. As experiments have shown, this IEAP die is convenient for processing high-strength materials, since at higher extrusion passes, when the strength of the materials increases sharply, the friction between the punch and the matrix during pressing also increases, and thus the risk of damage to the matrix or plunger increases. [67]. For comparison, the same metals (Ta and Nb of the oligocrystalline as well as recrystallization structure received at heat treatment) were used so that the results could be compared. Using the IEAP method, samples with dimensions of 12x12x130 mm are produced. The processing steps of IEAP samples are shown in Figure 2.

FIG 2

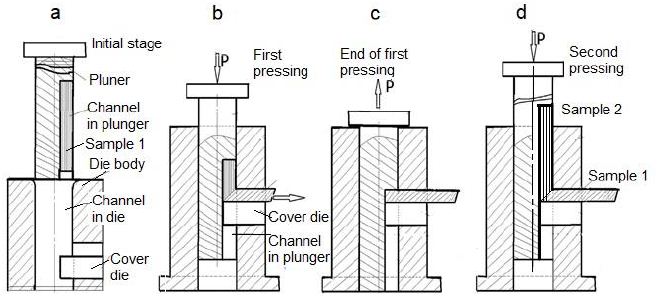
Figure 2: Diagram of the IEAP stamp and the corresponding stages (a, b, c, d) of sample processing using the so-called conveyor method, with this method in the stamp at the final stage two samples are simultaneously processed, the second sample pushes out the first (d).

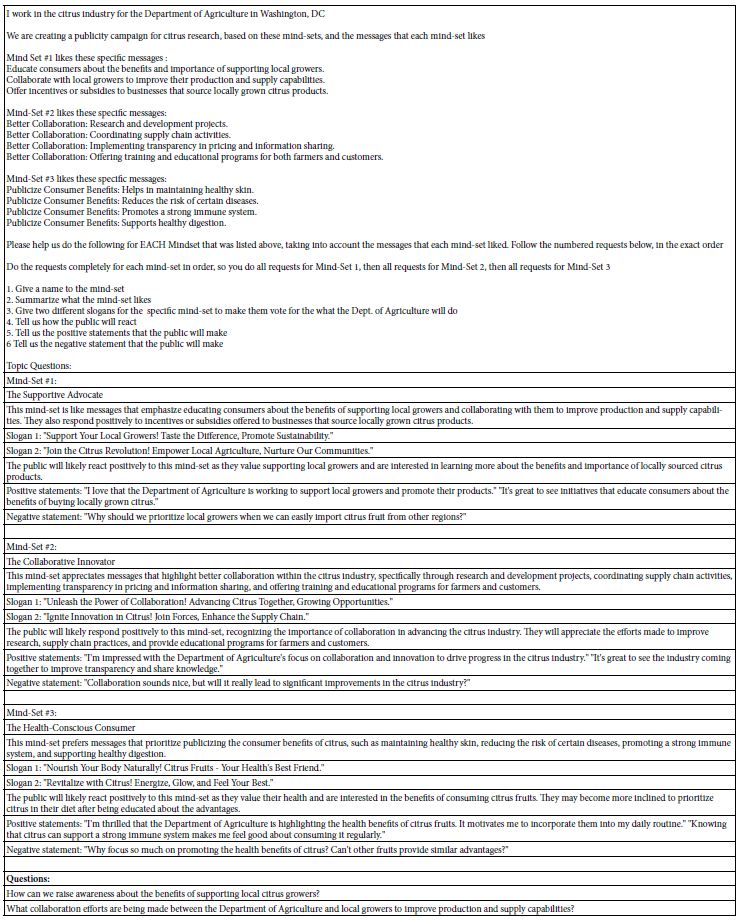
The specimens for hard cyclic viscoplastic deformation (HCVD) were manufacturing from EBM and IEAP-treated samples (Figure 3a and 3b). The mechanical cutting and electroerosion tchniques were used. The samples for electrical conduction, hardness, gases content, density, XRD, and microstructure study were cut off from HCVD sample (Figure 3c) and tensile tests minisamples Figure 3f) were cut off by electrical discharge method from HCVD sample (Figure 3d and 3e). The strain amplitude at HCVD testing was measured by extensometer with base length of 10 mm and it was mounted on sample with minimal cross section (Figure 3c). The strain amplitude for other cross sections were calculated. IEAP of the samples was carried out on a hydraulic press with a capacity of 100 tons [68].

FIG 3

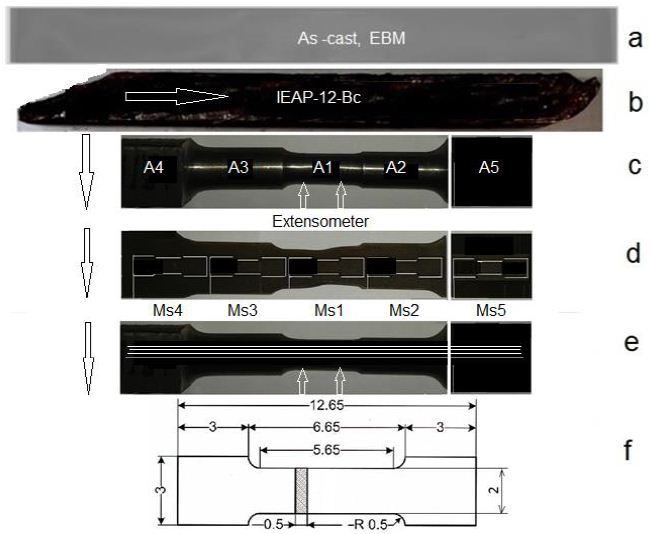
Figure 3: Mechanically cut sample from EBM ingot and heat treated at 1100°C for 30 minutes (a), IEAP treated sample (b), test sample for Young’s modulus measure by HCVD with stepped cross section (specimens A1, A2, A3, A4, A5 and A6 (as cast) with 5 mm in length) for measuring microhardness, density, XRD, gases content and electrical conductivity (c), mini-specimens (d) for tensile strength tests (MS1, MS2, MS3, MS4, MS5 and MS6-as cast), cut from the sample after HCVD in diametrical section in three layers 1, 2 and 3 (e), cut out using the electrical discharge method, and a mini-specimen for tensile testing with dimensions in mm is shown in (e).

The HCVD Technique

The HCVD technique was elaborated for materials structure modifing and properties testing [53,58,74,75]. The HCVD as a new process is not yet widespread in the study of metallic materials structure and properties evolution. It is well known that “viscoplasticity” is a response of solids involving time-dependent and irreversible deformations. In this research, we investigate the viscoplasticity of metallic materials and the accompanying changes in microstructure and properties at room temperature. To do this, we use cyclic deformation with a constant strain amplitude at each stage of the experiment. In the HCVD process, the strain amplitude ranges from ε=±0.2% to ±3.0% per cycle. The HCVD was conducted on an Instron-8516 metrials tester, Germany.This method is characterized by the generation of cyclic stress, the magnitude of which depends on the strength properties of the material at a given compression-tension deformation or strain amplitude. Therefore, this research method of metallic materials is called hard cyclic viscoplastic deformation (HCVD). The name of this new process begins with the word “hard”, which means that tensile and compressive deformations are used in the high-amplitude viscoplastic field in both tension and compression. The evolution of the microstructure of mixed metal materials is mainly studied from the deformation rate, the number of cycles, and the deformation stress amplitude of the HCVD method. The effect of HCVD on the improvement of the mechanical and physical properties of test materials has been described in various works [61,69,70,73]. In present overview work these large strain amplitudes of ε1=±0.2%, ε2 ±0.5%, ε3 ±1.0%, ε4 ±1.5%, ε5 ±2.0%, ε6 ±2.5%, and ε7±3.0% are used, respectively. At each degree of deformation, up to 20÷30 cycles are performed. The cycles number depend on material mechanical properties and viability. The frequency of cycling was chosed in the interval of ƒ=0.5 to 2.5 Hz, and were ƒ1=0.5 Hz, ƒ2=1.0 Hz, ƒ3=1.5 Hz, ƒ4=2.0 Hz, and ƒ5=2.5 Hz, respectively. The number of tests of the HCVD method starts from 20 cycles and up to 30 cycles per test for a series with the corresponding constant strain amplitude. The maximal number of cycles was not more then 100 for one sample. The frequency and strain amplitude at HCVD influenced on the strain rate and corresponding changes in the microstructure and properties.

To achieve the required results, the rated voltage, frequency, and a number of cycles are selected based on the test results. Usually, the technical strength is the strength of various constructions in calculations in elastic strain up to ε1=0.2% at tensile deformation, that is, until the beginning of plastic deformation of the material. In the LCF and HCF tests, the amount of elastic deformation is small, less than 0.2% of the deformation. At such a value of deformation, the metal material has an elastic behavior. The HCVD method determines the magnitude of the controlled amplitude of deformation and is controlled by an extensometer using a computer program that controls the process and displays the corresponding results on the computer screen. Typically, the fatigue test of metallic materials checks the tensile strength but does not check the deformation, which develops automatically according to the mechanical properties of the material. Micromechanical multiscale viscoplastic theory has been developed to relate the microscale mechanical responses of amorphous and crystalline subphases to the macroscale mechanical behavior of fibers, including cyclic hardening and stress recovery responses. The HCVD method can be used as a new test method in materials science when it is necessary to determine the behavior of a material under stresses that can exceed the elastic limit and deform under extreme operating conditions. For example, such extremes may occur in aviation, space, or military technology because these devices have a minimum calculated strength or margin of safety compared to other devices. For example, the compressor blades of a turbojet engine for military fighters have a safety margin of no more than 3-5%.

Methods for Other Properties Testing

The microhardness in cross section of samples A1, A2, A3, A4, A5, and A6 was measured using a Mikromet-2001 tester after holding for 12 s at a load of 50 and 100 g. At follows, the mini-samples (MS1, MS2, MS3, MS4, MS5 and MS6-as cast) at tension up to fracture were tested on the MDD MK2 Stand test system manufactured in the UK. The tribological behavior of materials under dry sliding conditions was investigated before and after IEAP, HCVD and heat treatment to provide a comparison over a range of material properties as well as collected strain to understand their influence on the coefficient of friction and on the specific wear rate. Dry sliding wear was studied in a ball-plate system with a tribometer (CETR, Bruker, and UMT2) using an aluminum oxide (Al2O3) ball with a diameter of 3 mm as a counter surface. The coefficient of friction (COF) was obtained automatically. For wear volume calculations, the cross-sectional area of the worn tracks was measured by the Mahr Pertohometer PGK 120 Concept 7.21. The content of metals inclusions (in ppm) were studied according to MBN 58.261-14 (ICP-OES Agilent 730) and gases concentration according to method of MBN 58.266-16 (LECO ONH-836) and S according to method of MBN 58.267-16 (LECO CS-844), respectively. The electrical conductivity (MS/m and/or %IACS) of metal materials was determined with a measurement uncertainty of 1% for different orientations on flat samples by means of the Sigmatest 2.069 (Foerster), accordingly to NLP standards at 60 and 480 kHz on a calibration area of 8 mm in diameter. The electrical conduction was measured at room temperature of 23.0±0.5°C and humidity of 45±5% according to the international annealed copper standard (IACS) in the Estonian national standard laboratory for electrical quantities. To obtain one electrical conductivity data, 30 measurement tests were automatically performed and the result was displayed on the computer screen.

The samples density after IEAP with different pressing number was measured by OHAUS Scout-Portable balances, Italy at room temperature. The dislocation density was calculated by the Rechinger method according to the results of the X-ray investigation by the D5005 AXS (Germany) and Rigaku (Japan) diffractometer. To study the microstructure, the samples were mechanically polished with silicon papers up to 4000, and then with diamond paste on Struers grinder. After the grinding, the samples were etched by an ion polishing/etching facility using precision etching system at 30 kV for 30 min in an argon atmosphere. The microstructure of the samples was studied using an optical microscope Nikon CX, Japan, and electron microscopes Zeiss EVO MA-15 and Gemini Supra-35, Germany, equipped with an EDS apparatus.

Results

Microstructure Evolution of Nb and Ta during HCVD

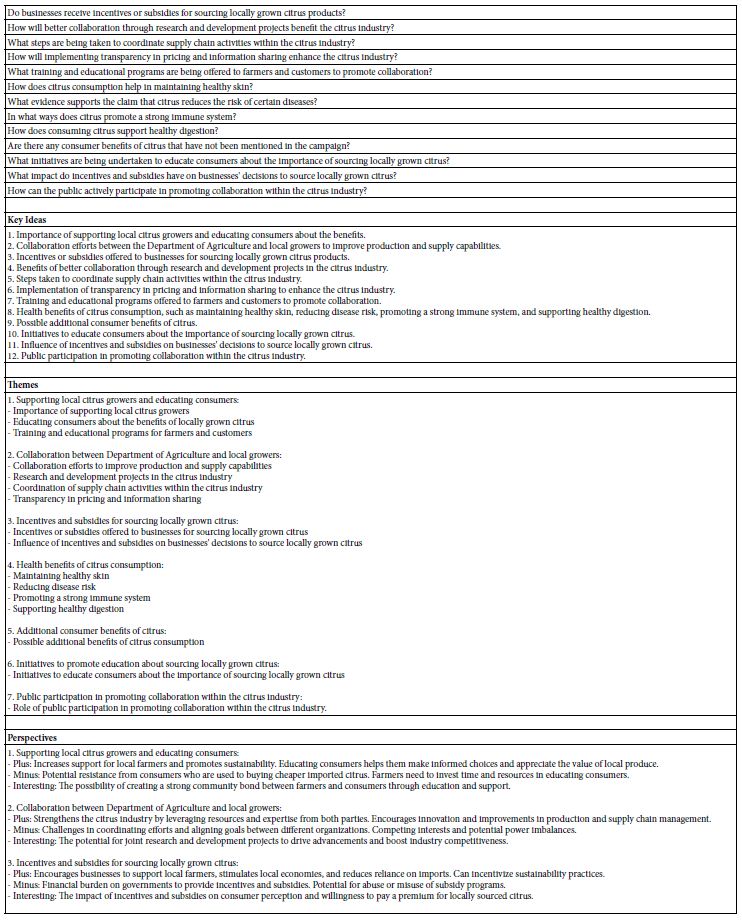
For example, full-scale diagrams of the HCVD of the Nb manufactured with various processing methods, microstructure, and properties at different strain amplitudes are shown in Figure 4a-4e [63].

FIG 4

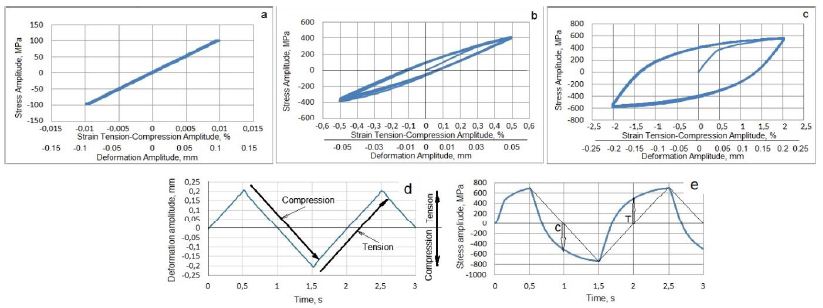
Figure 4: HCVD curves of pure Nb for the viscoelastic tension-compression straining at an amplitude of ε = ±0.1% and corresponding deformation amplitude of v ꞊ ± 0.01 mm in the base length of 10 mm (a), viscoelastic tension-compression straining at strain amplitude of ε = ±0.5% and v ꞊ ± 0.05 mm (b) and at strain amplitude of ε = ±2.0% with the corresponding deformation amplitude of v ꞊ ± 0.2 mm (c). The sample E12 HCVD time-deformation (d) and time-stress (e) curves received at ε = ±2% of strain amplitude. The effect of the elastic-plasticity of Nb on the deflection of the curves during the compression (C) and tension (T) cycles is shown by arrows.

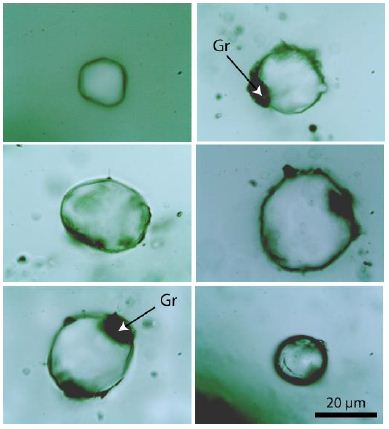
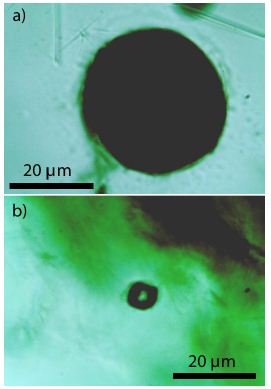
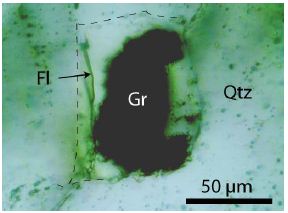
As can be seen in Figure 5, high-purity niobium as well as tantalum EBM ingots contain very large millimeter-sized grains connected by a fully wetted triple grain boundary (GB) (Figure 5a). This width of GBs is in nanometers because the metal is of high purity with thin grain boundaries as shown in the figures. Unfortunately, such large grains contain gas pores with dimensions in micrometers (Figure 5b). Under hydrostatic pressure in the shear region of the IEAP die, these pores are compressed and velded to zero. Such pores and GB defects can be completely repaired by hydrostatic compression and simple shear in the IEAP die. These changes take place in sample for 4 passes of IEAP by BC route (c) and for 12 passes of IEAP by BC route (d), respectively. Microstructural evolution in bulk Ta samples during HCVD are presented in Figure 6. As you can see the microstructure of high purity Ta has GB-s on atomic level [63,68].

FIG 5

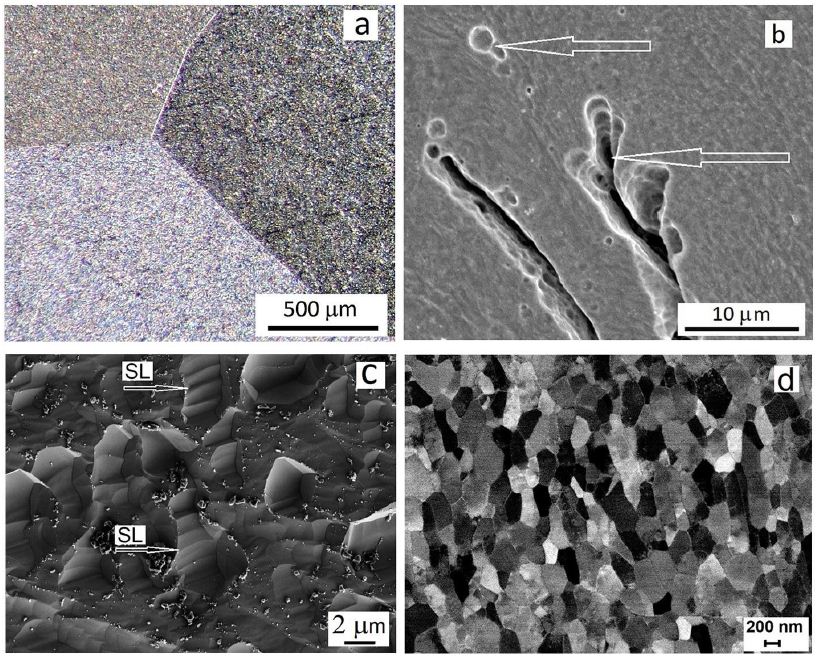
Figure 5: The triple grain boundary (a) and pores (b) in EBM as-cast Nb, and SEM pictures of microstructure evolution via grains fracture by slip lines (SL is shown by arrows) in the shear region of IEAP at von Mises strain of ƐvM=4.62 by BC route (c) and UFG microstructure formed at ƐvM=13.86 (d), respectively.

FIG 6

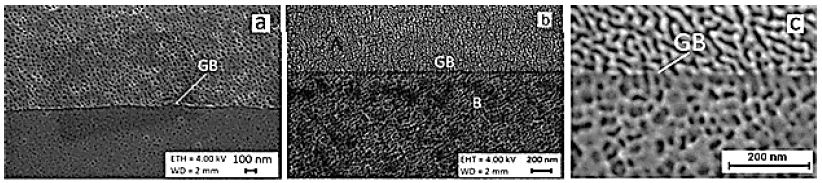
Figure 6: Microstructure evolution of pure Ta processed by HCVD at 5 test series (5 x 20 cycles with strain step-by-step increase up to ε5 ± 2.0%) for 100 tension-compression cycles in sum (a) and atomic level GB-s with different orientations of two grains is presented in (b, c).

The microstructure forming in Nb and Ta samples from initial to 8 passes by BC route for Nb and for 12 passes by BC route for Ta is shown in Figure 7a-7d. The relative frequency of grain size in mm was calculated by by ImageJ software and is presented in Figure 7e-7h. As you can see the grain size of Nb was decreased about 3 times and Ta grain size was decreased about 2.5 times, respectively [67].

FIG 7

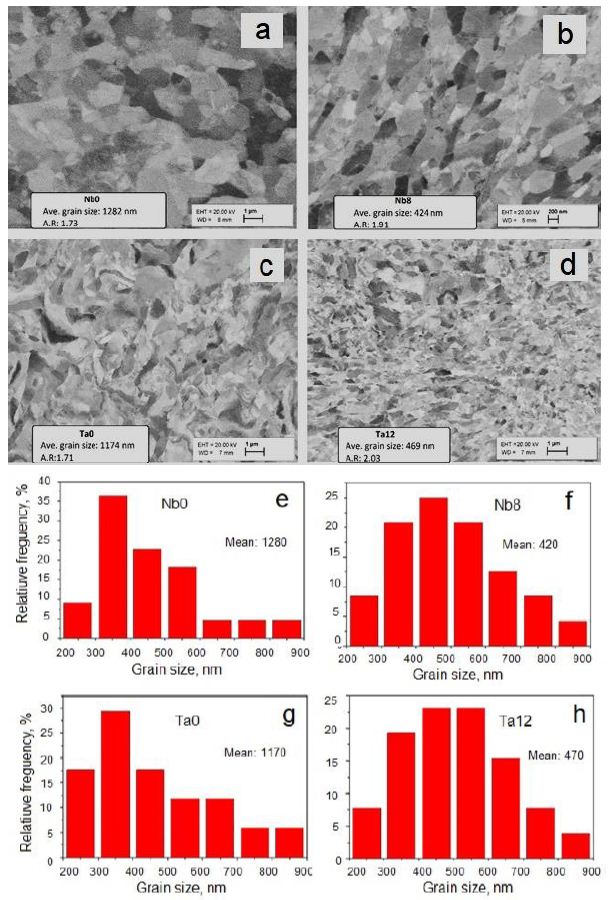
Figure 7: Distribution of grains sizes of Nb (a, b) for initial (Nb0) and after eight passes (Nb8) and Ta (c, d) for initial (Ta0) and after twelve (Ta12) passes by BC route of IEAP. The corresponding grain size measurements were made by ImageJ software (e, f, g, h), respectively.

The microstructure evolution of IEAP Nb sample during HCVD, with a number of 100 cycles for 5 test series is shown in Figure 8a. For comparison, the IEAP Nb after LCF testing for 100 cycles in Figure 8b. The fatigue cracks are formed during LCF. The TEM images of SB-s with a lowered dislocation density at HCVD in Figure 8c and with high dislocation density after LCF of IEAP sample in Figure 8d, respectively [64].

FIG 8

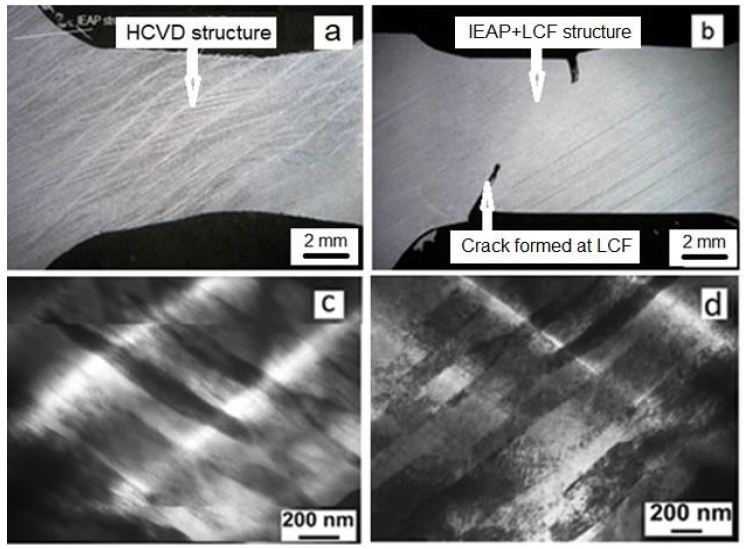
Figure 8: Optical pictures of double-banded microstructure forming in Nb sample at HCVD for 100 cycles (5 x 20 cycles) (a) [64,69] at increased strain amplitude to ε5 ± 2.0% and cracks initiation during LCF testing (b) for 100 cycles of the ECAP sample [69]. TEM images of SB-s with a lowered dislocation density at HCVD (c) and with high dislocation density after LCF of IEAP sample (d).

Young´s Modulus Evolution of Nb at IEAP and at HCVD

The evolution of physical properties during HCVD depends on the microstructure and properties of the metallic material achieved by IEAP treatment, as well as on the strain rate, which depends on the strain amplitude (measured in mm) during HCVD (Figure 4a-4c). As shown in the diagram (Figure 9a), the increase in tensile strength during HCVD at a strain amplitude ε4=±1.5% for all IEAP samples (E2, E4, E6, E8 and E12) with different accumulated von Mises strains is maximum. With an increase in deformation to ε5=±2.0%, the tensile strength of samples E8 and E12 decreased, since these workpieces had a UFG microstructure obtained in IEAP, with higher tensile strength and hardness. During the HCVD process, at a deformation amplitude ε5=±2.0%, softening occurs, since the GS begins to increase during the coalescence process. In these workpieces, Young’s modulus also decreases as they soften (Figure 9b) during HCVD treatment. The Young’s modulus of IEAP-treated samples decreases during the HCVD process as the dislocation density decreases (Figure 8c and 9) [63,64].

FIG 9

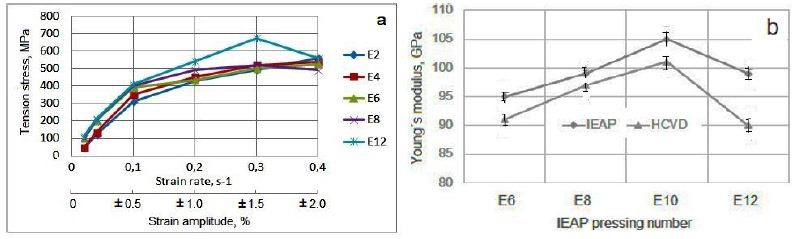
Figure 9: The IEAP samples E2, E4, E6, E8 and E12 tensile strength increases up to strain amplitude ε4=± 1.5%, as well as the strain rate (v=0.3 s-1) increases during HCVD and decrease for E8 and E12 by strain amplitude increase to ε4=±1.5%, (a) and the Yung modulus (b) increases when the von Mises strain increases to ƐvM=11.55 by BC route during IEAP, and the Young’s module decreases in samples E12 by increased von Mises strain up to ƐvM=13.86 by BC route as well by cycles number increase up to 100 cycles during HCVD, respectively.

Ta Physical Properties Evolution at HCVD

The Vickers hardness of Ta was measured, and it was found that with increasing of von Mises strain at IEAP in sample with stepped cross-section, the hardness of Ta increased mainly during the first pressing. By this, the hardness depends on the measurement of orientation to the sample; it is higher in the transverse direction (TD) and lower in cross directions (CS). As shown in Figure 10, a, the Vickers hardness of Ta was increased by increasing the von Mises strain at HCVD. The Vickers microhardness of Ta was increased from 100 HV0.2 to 285 HV0.2, respectively. It should be noted that the methods for measuring hardness according to Martens and Vickers are different. The Marten’s hardness is calculated from the difference between the maximum depth of indentation and after removing the load, when the Vickers hardness is calculated from the length of the diagonal, indentation load and only hardness are measured. The electrical conductivity of Ta (Figure 10b) has similar dependence on strain level and orientation of measure in the heat-treated sample [68].

FIG 10

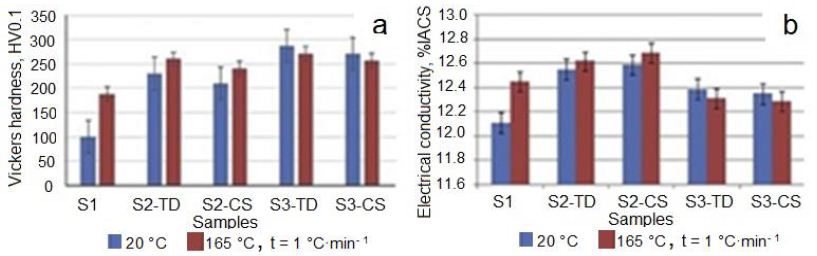
Figure 10: The evolution of Vickers microhardness (a), and electrical conductivity (b) depends on measuring orientation and heat treatment temperature from 20°C to 165°C with a heating rate of 1°C•min−1. TD: Transverse Direction and CS: Cross-Section.

A well-known fact from the scientific literature is that the Young’s modulus is constant in materials at room temperature. This modulus decreases with increasing temperature and increases with increasing the density of materials. Young’s modulus of Ta is about 186 GPa at room temperature and the maximum value is 193 GPA at 10−6 K. As can be seen in Figure 11, this modulus may also be affected by the amount of strain applied to the material (or the number of passes in IEAP) and the change in equivalent strain-stress amplitude during HCVD. The changes of Young’s module in the Ta samples (S1-initial, S2 – 5 pressings of IEAP, ƐvM=5.77, and S3 – 12 pressings of IEAP, ƐvM=13.86) are shown in Figure 11. Before Young module measure the samples were processed by HCVD at strains of ε2=±0.5%, ε3=±1.0%, and ε4=±1.5% for 20 cycles at one strain level. It should be mentioned that Young’s modulus of each sample was measured for three times in the intervals of tensile strains from 0÷0.06% and from 0÷0.1% to ensure about the reliability of results. Was established, that this modulus depends on von Mises strain, strain rate as well on the interval of strain, at which this parameter was measured. When the material is harder, Young’s modulus is higher at the tension in the interval of the strain of 0-0.1% (S2) and when the material is softer, Young’s modulus is higher for 0÷0.06% strain interval (S1) and lowers at 0÷0.1%, respectively [68].

FIG 11

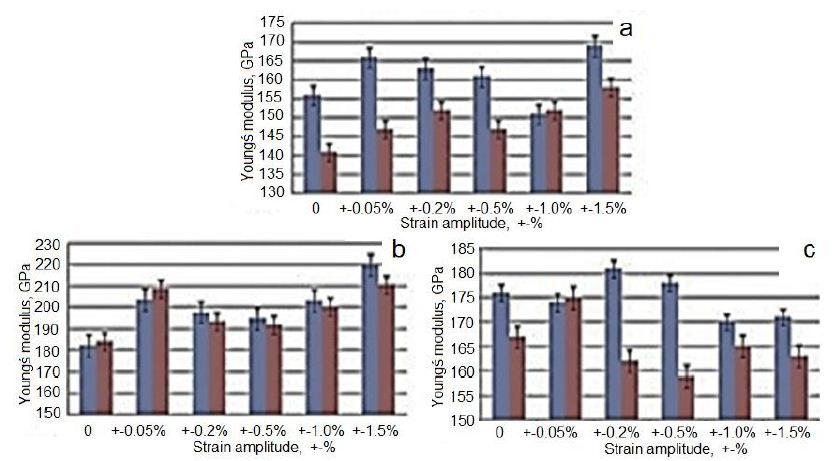
Figure 11: Change of Young’s modulus in Ta at uniaxial tension (measured after IEAP and HCVD) at strain of 0–0.06% (blue) and of 0–0.1% (red) of samples S1 (a), S2 (b) and S3 (c), respectively.

Changes in electrical conductivity and Vickers microhardness in IEAP samples (S1, S2, and S3) were measured with different orientations (Figure 12). These values vary depending on the strain applied during processing or hardness, as well as on the orientation of the measurement, in cross-section (CS) or transverse (TD) direction. As you can see (Figure 12), when the Vickers microhardness is higher, the conductivity is lower when the heating rate is low. In work is shown, that the electrical conductivity depends on the hardness and strength properties of CuCr-alloys. In the works [39] is shown, that the electrical conductivity and Vickers microhardness of CuCr-alloys increase with temperature increase and revealed maximal values at ~550°C. Accordingly, these parameters depend not only on the microhardness because the density of dislocations was lowered during heat treatment. In the present work, the Ta samples were heat treated at a very low heating rate of 1°C·min−1, and the Vickers microhardness and electrical conductivity increased in sample S2 and decrease in sample S3, respectively. The conductivity is expressed as a percentage of the International Standard Annealed Copper (%IACS), which is 5.80 × 10⁷ Siemens/m at 20°C. Results show, that the electrical conductivity varied in dependence on energy associated with dislocations, grain boundaries state, and vacancy concentration in Ta samples during ECAP and HCVD, respectively (Figures 12 and 13) [68,69].

FIG 12

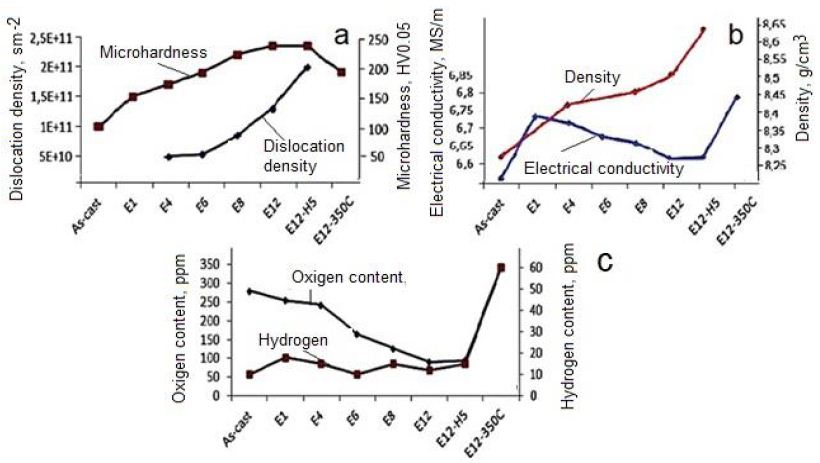
Figure 12: Influence of processing routes as well as microstructure on microhardness, and dislocation density (a), electrical conductivity and density (b), oxygen and hydrogen contents (c) of pure Niobium. Designations: E12-12 passes of IEAP by BC route, H5-five test series by strain rate increase during HCVD, E12-350°C- heat treatment temperature of sample E 12.

FIG 13

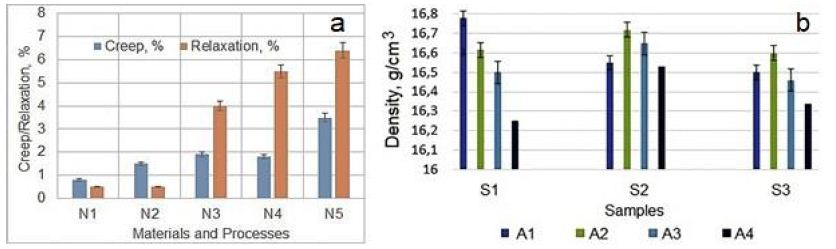
Figure 13: Creep and Relaxation of different materials vs. manufacturing technologies (a). Designations: N1 – By electrical forging (EF) processed Ni-based Fe containing superalloy, N2 – SC Ni-based superalloy, N3 – Cold-drawn pure Cu, N4 – Recrystallized pure Cu, and N5 – ECAP processed nanocrystalline pure Cu [78]. Density evolution of pure Ta processed by IEAP and HCVD (b). Designations: (A4) IEAP processed only, and (A1, A2, and A3) after followed HCVD with different strain amplitude (see Figure 3c) (b).

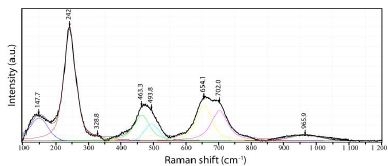
XRD Investigation of Changes in the Tantalum during EBM, IEAP, and HCVD

Anisotropic deformation during IEAP, and HCVD processes, as well as anisotropic properties in samples, can lead to the formation of anisotropic crystallites and, therefore, anisotropic peak intensities. The X-ray diffraction patterns of the samples: Ta, 2x EBM, Ta, 5x IEAP, Ta, 12x IEAP, and Ta, 5x HCVD are presented in Figure 14. As you can see the X-ray diffraction patterns of the HCVD Ta with compare to EBM and IEAP are differ significantly from other samples. It should be noted that this sample (5x HCVD) had a recrystallized microstructure before HCVD. During HCVD, the microstructure changed, and only one peak appeared in the X-ray diagram at ~ 55.6°. Such an X-ray pattern with a single peak is characteristic of a single-crystal metal and a single-crystal Ni-based superalloy [71]. XRD investigation revealed that at the phase transformation took place at the SPD processing [70,72]. The crystallite size and the dislocation density is possible to determine by X-ray line profile analysis [67,68].

FIG 14

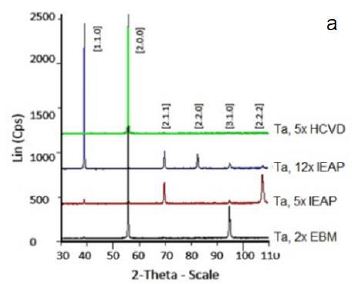
Figure 14: X-ray diffractogram (a) of the Ta samples. Designations: Ta, 2x EBM, initial, Ta, 5x IEAP, Ta, 12x IEAP, and Ta, 5x 5HCVD), respectively.

Influence of HCVD on Wear and Tribological Properties of Nanocrystalline Materials

The specific wear rate (the volume loss per distance per normal load) and coefficient of friction (COF) measurements show their dependence from sample material chemical composition, sample (surface) hardness as well material wear track surface softening/hardening [68,76] during wear testing (Figure 15). Results show that HCV deformed sample in surface was hardened from 77HV0.05 to 90HV0.05 and on the wear track surface from 115 HV0.05 to 126HV0.05, respectively. In this case the surface hardening was induced by cyclic straining and wears track hardening as result of sliding [69].

FIG 15

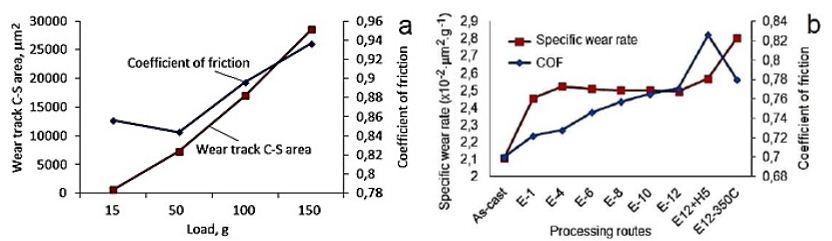
Figure 15: Influence of the load applied on the COF and wear track cross/sectional area of IEAP-12 Niobium (a) and specific wear rate of pure Niobium for different passes number and temperatures for a load of 50 gr (b).

The SEM investigation of the worn track surface shows (Figure 16a) that the UFG microstructure of Nb was abrased by the alumina ball during the dry sliding testing. In our experiments, the wear debris was not removed from the contact zone during testing, which has an influence on the results [35]. The damaged surface of the worn track has wear debris with size of approximately 100 nm. The test results show that the as-cast sample has the lowest amplitude of COF then UFG Nb. The as-cast material has the lowest COF (0.78) and the lowest specific wear rate (2.1, ×10-2×mm2×g-1) when compared to sample E12 (Figure 15b). The maximal COF was obtained for samples after HCV deformation and samples that were tested in directions that crossed the slip band direction. The specific wear rate was significantly increased after heat treatment at a temperature of 350°C (Figure 16) [69].

FIG 16

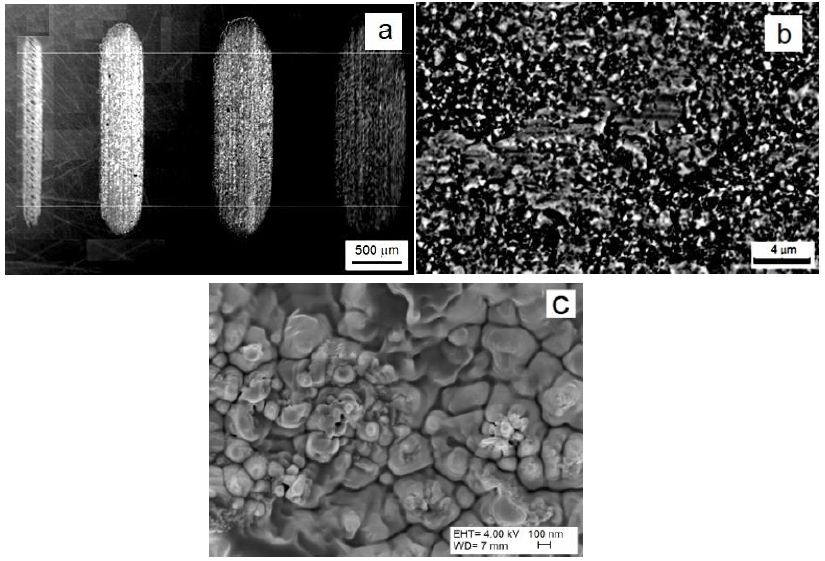
Figure 16: SEM picture of wear track surfaces for 15, 50, 100 and 150 g (a) and UFG Nb wear surfaces with debris formed under a load of 100 g (b), and worn surfaces at high magnification of 100000x of samples after 6 passes of IEAP (c).

When comparing our results with the results presented in previous work, the mass loss decreased remarkably as the number of ECAP passes increased, being affected more by the sliding distance than by the applied load under the experimental conditions. From these data, it has been shown that the wear mechanism was observed to be adhesive and delaminating initially, and an abrasive mechanism appeared as the sliding distance increased. In our experiments, the abrasive wear mechanism did not show any dependence on sliding distance.

Discussion

In the papers, a series of experiments were carried out to study the effect of IEAP and HCVD on the microstructure and properties of metallic materials at room temperature. During the subsequent HCVD, we studied the effect of the strain value during tension-compression with a gradual stepwise increase in strain, strain amplitude, and the corresponding strain rate on the microstructure, functional, physical, chemical, and mechanical properties of the studied Nb and Ta. Then, a series of experiments were carried out to study the influence of the number of deformation cycles, the magnitude of axial deformation, the frequency of cycling, and the strain rate during HCVD and followed heat treatment on the microstructure and evolution of the properties of materials in comparison with their initial state. A comparative analysis was carried out, according to the results of which the following conclusions can be drawn: This owerview study evaluated the impact of a new processing method so called as “Hard Cyclic Viscoplastic Deformation” (HCVD) on microstructure, mechanical, physical, chemical, functional, performance, etc. properties of metallic materials such as niobium, and tantalum. To expand the capabilities of the new processing method, the metal materials Nb and Ta with various structures were tested, such as oligocrystalline, coarse-grained, ultrafine-grained, and nanocrystalline. For pre-treatment, multiple methods of severe plastic deformation were used, such as “Indirect Extrusion Angular Pressing” (IEAP). With this new HCVD test method, it is possible to initiate and study the processes occurring in the microstructure of materials before their destruction. HCVD is based on the application of a cyclic tensile/compressive load by controlled strain amplitude on materials at a constant frequency at a given strain level. In this test method, the main parameters are the strain amplitude of compression/tension in the range from 0.2% to 3.0% with the number of cycles from 20 to 40 for one level of deformation and with a frequency of 0.5 to 2.5 Hz. The rest of the process parameters are set automatically depending on the strength properties of the tested metal material in general.

Conclusions

This review study evaluates the effect of a new processing method, the so-called HCVD, on the microstructure microstructure evolution, and mechanical, physical, chemical, functional, tribological properties change, as well as on phase transformations and interatomic interactions, and service life of various metallic materials. To expand the capabilities of the new processing, metallic materials selected for the study, such as Nb and Ta, with different structures: oligocrystalline, coarse-grained, ultrafine-grained and nanocrystalline were tested.

Using this new test method, it is possible to initiate and study the processes occurring in the microstructure and properties of materials during HCVD before their fatigue failure. HCVD is based on the application of cyclic tensile and compressive loads to materials through a controlled strain amplitude at a constant frequency and a specified level of strain. In this test method, the main parameters are the compression-tensile deformation amplitude in the range from ε=±0.2% to ε=±3.0% with a number of cycles from 20 to 40 for one level of deformation amplitude and with a frequency ƒ=from 0, 5 Hz to 2.5 Hz. The rate of deformation depends on the basic strength parameters of the material. The remaining process parameters are set automatically depending on the strength properties of the metal material being tested as a whole. The main outcomes of this overview work can be summarized as follows:

  • The microstructure of Nb and Ta processed by HCVD is significantly different from the microstructure obtained by other SPD methods.
  • During IEAP processing of EBM as-cast Nb or Ta samples, the gases pores and any defect in GB-s at hydrostatic compression pressure concurrently with the simple shear stress are eliminated.
  • The electrical conductivity in SPD processes decreases with increasing hardness, tensile stress and dislocation density and increases when HCVD is combined with heat treatment and lowering of dislocation density.
  • The density of pure Nb increased from 8.27 g/cm3 in the as-cast condition to 8.65 g/cm3 after IEAP and HCVD processing, whit’s is higher than the theoretical (8.55 g/cm3) density.
  • The density of pure Ta incrased from 16.26 g.cm-3 to 16.80 g.cm-3 during HCVD.
  • During the followed HCVD, the nanostructure (20-90 nm) was formed in shear bands.
  • The electrical conductivity during IEAP decreased and during HCVD it increased as a result of the dislocation density decreasing from 5E + 10 cm−2 to 2E + 11 cm−2 since the dislocations are the main obstacles for electrons moving.
  • During IEAP, Young’s modulus of Nb was increased to 105 GPa at the von Mises strain ƐvM = 13.86 and then decreased to 99 GPa during the HCVD. The Young modulus (89 GPa) was minimal for sample E12 after HCVD at strain amplitude (Ɛ5= ±2.0%).
  • The softening of the material is related to the decrease of Young’s modulus at the HCVD with the increase of the strain rate higher than έ (t)  = 0.3 s−1.
  • In turn, the decrease in Young’s modulus indicates a decrease in the attraction of interatomic forces in the metal.
  • The micromechanical properties differ for IEAP and HCVD samples, as well as for SB and in-body metal. For example, after IEAP for 12 passes by BC route, the SB maximal Vickers nano-hardness was NH = 4.78 GPa and the indentation modulus was Er = 177.7 GPa, respectively.
  • During the followed HCVD, these parameters were reduced to NH = 3.29 GPa and Er = 111.4 GPa, respectively.
  • The GB width of pure Nb is so small that it is not possible to measure its micromechanical properties by the nano-indentation method used in the present study.
  • The gas content in Nb depends on the microstructure condition and it is minimal for UFG pure Nb.
  • Compared to the LCF and HCF tests, the HCVD tests require a shorter timeframe.
  • Using the HCVD method, it is also possible to study the viability of different metallic materials during operation in aviation, space, and defense under conditions of high load, and close conditions before failure, when the margin of safety is only a few percent.
  • Accordingly, this overeview article provides a brief overview of the structure and properties of metallic materials that change as a result of HCVD and thereby extending materials science with new relationships.

Acknowledgment

This research was sponsored by the Estonian Research Council (Grant No. PRG1145).

ORCID Lembit Kommel http: //orcid.org/0000-0003-0303-3353.

References

  1. Bridgeman PW (1952) Studies of large plastic flow and fracture. McGraw-Hill, New York.
  2. Segal VM (2002) Severe plastic deformation: simple shear versus pure sheart. Materials Science and Engineering A 338: 331-344.
  3. Kaveh E, Andrea B, Victor A. Beloshenko, Yan B, et al. (2022) Nanomaterials by severe plastic deformation: review of historical developments and recent advances. Materials Research Letters 10: 163-256.
  4. Valiev RZ, Estrin Y, Horita Z, Langdon TG, Zehetbauer MJ, et al. (2016) Producing bulk ultrafine-grained materials by severe plastic deformation: Ten year later. JOM 68-4.
  5. Langdon TG (2013) Twenty-five years of ultrafine-grained materials: achieving exceptional properties through grain refinements. ActaMater 61: 7035-59.
  6. Estrin Y, Vinogradov A (2013) Extreme grain refinement by severe plastic deformation: a wealth of challenging science. Acta Mater 61: 782–817.
  7. Bogachev SO, Zavodov V, Naumova EA, Chernenok TV, Lukina EA, et al. (2023) Improvement of strength–ductility balance of Al–Ca–Mn–Fe alloy by severe plastic deformation. Mater Letters 349: 134797.
  8. Vinogradov A, Estrin J (2018) Analytical and numerical approaches to modelling severe plastic deformation. Progr Mater Sci 95: 172-242.
  9. 9.Azushima A, Kopp R, Korhonen A, Yang DY, Micari F, et al. (2008) Severe plastic deformation (SPD) process for metals. CIRP Annals-Manufact Techn 57: 716-735.
  10. Hai Z, Zhiyan H, Wenbin G (2023) Effect of surface severe plastic deformation on microstructure and hardness of Al alloy sheet with enhanced precipitation. Mater Letters 333: 133632.
  11. Zhaoming Y, Zhimin Z, Xubin L, Jian X, Qiang W.et al. (2020) A novel severe plastic deformation method and its effect on microstructure, texture and mechanical properties of Mg-Gd-Y-Zn-Zr alloy J Alloys and Compounds 822: 153698.
  12. Kulagin R, Beygelzimer Y, Bachmaier A, Pippan R, Estrin Y (2019) Benefits of pattern formation by severe plastic deformation. Appl Mater Today 15: 236-241.
  13. Lugo N, Llorca N, Suñol JJ, Cabrera JM (2010) Thermal stability of ultrafine grains of pure copper obtained by equal-channel angular pressing. J Mater Sci 45: 2264-2273.
  14. Petrov PA, Burlakov IA, Palacheva VV, Zadorozhnyy MY, Golovin IS (2022) Anelasticity of AA5051 alloy subjected to severe plastic deformation. Mater Letters 328: 133191.
  15. Omranpour B, Kommel L, Garcia Sanchez E, Ivanisenko J, Huot J (2019) Enhancement of hydrogen storage in metals by using a new technique in severe plastic deformation. Key Eng Mater.
  16. Lugo N, Llorca N, Cabrera JM, Horita Z (2008) Microstructures and mechanical properties of pure copper deformed severely by equal-channel angular pressing and high pressure torsion Materials Science and Engineering A 477: 366-371.
  17. Conrado RMA, Angelica A, Vladimir S, Dmitri G, Vicente A (2017) From porous to dense nanostructured β-Ti alloys through high-pressure torsion. SCIENTIFIC REPORTS 7: 13618.
  18. Klaus DL, Xiaojing L, Xi L, Jae KH, Rian J (2021) Dippenaar, Megumi Kawasaki. On the thermal evolution of high-pressure torsion processed titanium aluminide. Materials Letters, 304:130650.
  19. Zhilyaev A, Langdon T (2008) Using high-pressure torsion for metal processing: Fundamentals and applications, Prog Mater Sci 53: 893-979.
  20. Han K, Li X, Dippenaar R, Liss KD, Kawasaki M (2018) Microscopic plastic response in a bulk nano-structured TiAl intermetallic compound processed by high-pressure torsion. Mater Sci Eng A 714: 84-92.
  21. Omranpour B, Kommel L, Sergejev F, Ivanisenko J, Antonov M, et al. (2021) Tailoring the microstructure and tribological properties in commercially pure aluminum processed by High Pressure Torsion Extrusion. Proc Estonian Acad Sci.
  22. Kommel L, Pokatilov A (2014) Electrical conductivity and mechanical properties of Cu-0.7wt%Cr and Cu-1.0wt% Cr alloys processed by severe plastic deformation. 6th International Conference on Nanomaterials by Severe Plastic Deformation. IOP Conf Series: Mater Eng 63: 012169.
  23. Higuera-Cobos OF, Cabrera JM (2013) Mechanical, microstructural and electrical evolution of commercially pure copper processed by equal channel angular extrusion. Mater Sci Eng A 571: 103-114.
  24. Yu M. Murashkin, Sabirov I, Sauvage X, Valiev RZ (2015) Nanostructured Al and Cu alloys with superior strength and electrical conductivity. J Mate Sci 1: 1-19.
  25. Islamgaliev RK, Nesterov KM, Bourgon J, Champion Y, Valiev RZ (2014) Nanostructured Cu-Cr alloy with high strength and electrical conductivity. J Appl Physics 115: 194301.
  26. Wei KX, Wei W, Wang F, Du QB, Alexandrov IV (2011) Microstructure, mechanical properties and electrical conductivity of industrial Cu-0.5%Cr alloy processed by severe plastic deformation. Mater Sci Eng A 528: 1478-1484.
  27. Dobatkin SV, Gubicz J, Shangina DV, Bochvar NR, Tabachkova NY (2015) High Strength and Good Electrical Conductivity in Cu-Cr Alloys Processed by Severe Plastic Deformation, Mater Lett153: 5-9.
  28. Ma A, Zhu C, Chen J, Jiang J, Song D, S. et al. (2014) Grain refinement and high-performance of equal-channel angular pressing Cu-Mg alloy for electrical contact wire. Metals 4: 586-596.
  29. Straumal BB, Klimametov AR, Ivanisenko Y, Kurmanaeva L, Baretzky B, et al. (2014) Phase transitions during high pressure torsion of Cu-Co alloys. Mater Letters 118: 111-114.
  30. Korneva A, Straumal B, Kilmametov A, Chulist R, Straumal P, et al. (2016) Phase transformation in a Cu-Cr alloy induced by high pressure torsion. Mater Char 114: 151-156.
  31. Straumal BB, Kilmametov AR, Ivanisenko Y, Mazilkin AA, Kogtenkova OA, et al. (2015) Phase transitions induced by severe plastic deformation: steady-state and equifinality. Intern J Mater Research 106: 657-663.
  32. Mohsen C, Mohammad HS (2018) Effect of equal channel angular pressing on the mechanical and tribological behavior of Al-Zn-Mg-Cu alloy. Mater Char 140: 147-161.
  33. Chuan TW, Nong G, Robert JK. Wood TG (2011) Wear behavior of an aluminum alloy processed by equal-channel angular pressing. J Mater Sci 46: 123-130.
  34. Babak OS, Marco AL, Hernandez R, Edgar GS, Lembit K, et al. (2022) The impact of microstructural refinement on the tribological behavior of niobium processed by Indirect Extrusion Angular Pressing. Tribol Intern 167: 107412.
  35. Kommel L, Põdra P, Mikli V, Omranpour B (2021) Gadient microstructure in tantalum formed under the wear track during dry sliding friction. Wear 466-467: 203573.
  36. Varvani-Farahani A (2022) Nonlinear kinematic hardening cyclic plasticity. Cyclic Plasticity of Materials. Modeling Fundamentals and Application, Elsevier Series on Plasticity of Materials 2022: 139-174.
  37. Cyclic Plasticity of Metals, Modeling Fundamentals and Applications, 2021.
  38. Katerina D. Papoulia M. Rezal H, (2022) Computational methods for cyclic plasticity. Cyclic Plasticity of Metals 227-279.
  39. Gouzheng K, Qianhua K (2022) Application of cyclic plasticity for modeling ratcheting in metals. Cyclic Plasticity of Metals 325-355.
  40. Jafar A, Timothy T (2022) Application of cyclic plasticity to fatigue modeling. Cyclic Plasticity of Metals 357-395.
  41. Radim H, Kyriakos K, Marek P, Zbyněk P (2022) Cyclic plasticity of additively manufactured metals. Cyclic Plasticity of Metals 397-433.
  42. Agrawal (2014) Low Cycle Fatigue Life Prediction. Int J Emerg Engi Res Tech 2: 5-15.
  43. Pyttel B, Schwerdt D, Berger C, (2011) Very high cycle fatigue – Is there a fatigue limit? Int J Fatig Adv in Very High Cycle Fatigue 33: 49-58.
  44. Le Z, Songyun M, Dongxu L, Bei Z, Bernd M (2019) Fretting wear modelling incorporating cyclic ratcheting deformations and the debris evolution for Ti-6Al-4V. Tribol Intern 136: 317-331.
  45. Calaf J, Sa´nchez M, Bravo PM, D´ıez M. Preciado et al. (2021) Deviations in Yield and Ultimate Tensile Strength Estimation with the Small Punch Test: Numerical Analysis of PreStraining and Bauschinger Effect Influence, Mech Mater 153: 103696.
  46. Lee SW, Jennings AT, Greer JR (2013) Emergence of enhanced strengths and Bauschinger effect in conform ally passivated copper nanopillars as revealed by dislocation dynamics. Acta Mater 61: 1872-1885.
  47. Hu X, Jin S, Yin H, Yang J, Gong Y, et al. (2017) Bauschinger effect and back stress in gradient Cu-Ge alloy. Metal Mater Trans A 48-9: 3949-3950.
  48. Kenk K (2001) On the constitutive modeling of viscoplasticity. Proc. of VIII-th Intern. Conf. Topical Problems of Mechanics, St. Petersburg, Russia 77-86.
  49. Jong TY, Williams SJ, In SK, Nho KP (2001) Unified viscoplastic models for low cycle fatigue behavior of Waspaloy. Met Mater Int 7: 233–240.
  50. Li G, Shojaei A (2012) A viscoplastic theory of shape memory polymer fibres with application to self-healing materials. Proc R Soc A 468: 2319-2346.
  51. Dahlberg M, Segle P (2010) Evaluation of models for cyclic plastic deformation – A literature study. Inspecta Techn. pages 62.
  52. Sharma P, Diebels S (2023) Modelling crack propagation during relaxation of viscoplastic material. J Mater Sci 58: 6254-6266.
  53. Kommel L, Veinthal R (2005) HCV deformation – Method to study the viscoplastic behavior of nanocrystalline metallic materials. Rev Adv Mater Sci 10: 442-446.
  54. Sánchez MD, García VS, Martínez SL, Llumà J (2023) A strain rate dependent model with decreasing Young’s Modulus for cortical human bone. Biom Phys & Eng Expr 9.
  55. Kommel L (2008) Metals microstructure improving under hard cyclic viscoplastic deformation. Mater Sci Forum 584-586: 361-366.
  56. Kommel L (2009) Viscoelastic behavior of a single-crystal nickel-based superalloy. Mater Sci.
  57. Kommel L (2019) Microstructure and properties that change during hard cyclic visco-plastic deformation of bulk high purity niobium. Int J Ref Met Hard Mater.
  58. Kommel L, Hussainova I, Traksmaa R (2005) Characterization of the viscoplastic behavior of nanocrystalline metals at HCV deformation. Rev Adv Mater Sci 10: 447-453.
  59. Kommel L, Mikli V, Traksmaa R, Saarna M, Pokatilov A, et al. (2011) Influence of the SPD processing features on the nanostructure and properties of a pure niobium. Mater Sci Forum 667-669: 785-790.
  60. Kommel L, Rõzkina A, Vlasieva I (2008) Microstructural features of ultrafine-grained copper under severe deformation. Mater Sci (Medžiagotyra) 14: 206-209.
  61. Kommel L, Hout J, Shahreza BO (Effect of hard cyclic viscoplastic deformation on the microstructure, mechanical properties, and electrical conductivity of Cu-Cr alloy. J Mater Eng Perform.
  62. Kommel L, Saarna M, Traksmaa R, Kommel I (2012) Microstructure, properties and atomic level strain in severely deformed rare metal niobium. Mater Sci (Medžiagotyra) 18;330-335.
  63. Kommel L (2019) Microstructure and properties that change during hard cyclic visco-plastic deformation of bulk high purity niobium. Int J Ref Met Hard Mater 79: 10-17.
  64. Kommel L, Laev N (2008) Mechanism for single crystal refinement in high purity niobium during equal-channel angular pressing. Mater Sci (Medžiagotyra) 14: 319-323.
  65. Kommel L (2008) UFG microstructure processing by ECAP from double electron-beam melted rare metal. Mater Sci Forum 584-586: 349-354.
  66. Kommel L, Shahreza BO, Mikli V (2019) Structuration of refractory metals tantalum and niobium using modified equal channel angular pressing technique. Key Eng Mater 799: 103-108.
  67. Omranpour B, Kommel L, Mikli V, Garcia E, Huot J (2019) Nanostructure development in refractory metals: ECAP processing of Niobium and Tantalum using indirect-extrusion technique. Int J Refr Met Hard Mater 79: 1-9.
  68. Kommel L, Shahreza BO, Mikli V (2019) Microstructure and physical-mechanical properties evolution of pure tantalum processed with hard cyclic viscoplastic deformation. Int J Ref Met Hard Mater 83: 104983.
  69. Kommel L, Kimmari E, Saarna M, Viljus M (2013) Processing and propeties of bulk ultrafine-grained pure niobium. J Mater Sci 48: 4723-4729.
  70. Kommel LA, Straumal BB (2010) Diffusion in SC Ni-base superalloy under viscoplastic deformation. Def Diff Forum.
  71. Kommel L (2009) Viscoelastic behavior of a single-crystal nickel-base superalloy. Mater Sci (Medžiagotyra) 14: 123-128.
  72. Kommel LA, Straumal BB (2010) Diffusion in SC Ni-based superalloy under viscoplastic deformation. Defect and Diff Forum 297-301: 1340-1345.
  73. Kommel L (2015) Effect of hard cyclic viscoplastic deformation on phase’s chemical composition and micromechanical properties evolution in single crystal Ni-based superalloy. Acta Physica Polonica A.
  74. Kommel L (2004) The effect of HCV deformation on hardening/softening of SPD copper. Ultrafine Grained Materials III 571-576.
  75. Kommel L (2004) New advanced technologies for nanocrystalline metals manufacturing. 4th DAAAM Conference “Industrial Engineering – Innovation as Competitive Edge for SME”, 195-198.
  76. Shahreza BO, Sergejev F, Huot J, Antonov M, Kommel L, et al. (2023) The effect of microstructure evolution on the wear behavior of tantalum processed by Indirect Extrusion Angular Pressing. Inter J Refr Metals and Hard Materials 111: 106079.
  77. Omranpour B, Kommel L, Garcia Sanchez E, Ivanisenko J, Huot J (2019) Enhancement of hydrogen storage in metals by using a new technique in severe plastic deformations. Key Eng Mater.
  78. Kommel L (2001) The influence of development of new technology and materials on resource of gas turbine engines.
fig 1

Evaluation of Skin and Organ Dose of Patients Caused by Computed CT and Comparison with Monte Carlo Simulation Software GEANT4 (GATE)

DOI: 10.31038/NAMS.2024714

Abstract

Today, the use of CT scan as a type of diagnostic tool has increased dramatically. Therefore, controlled use and in accordance with protective regulations in order to reduce the harmful  effects of radiation, it is necessary. The purpose of this study was to measure the dose received by patients in computed CT scan protocols and compare it with Monte Carlo simulation using GEANT4 software. Radiation parameters were collected from 11 patients referred to Tohid Hospital in Sanandaj to measure DLP quantity in common protocols. In this study, DLP values for Chest Abdomen protocol were measured and compared with simulation values. Our results show Monte Carlo software outputs experimental data well and is a good benchmark for this software. Thus, the simulated and measured doses agreed well.

Keywords

Computed tomography, Chest CT scan, Monte Carlo, Dose during scan, Reference dose limit

Introduction

CT scan is an advanced imaging technique that provides cross- sectional and transverse images of body parts using X-rays using computer algorithms and calculations [1]. Today, use of CT scan as a type of diagnostic tool has increased dramatically. Specific information is required including activity distribution and organ boundaries for patient-specific dosimetry. CT data provides anatomical information which can be used for defining volume of interests specifying internal organs [2,3]. Nevertheless, using CT images for segmentation of anatomic structures of patient body, despite being more accurate, is time consuming. The alternative is using phantoms or Atlas data with already segmented organs and known organ boundaries. The anatomical structures are derived from these databases very easily [4]. In the United Kingdom, CT scans ranged from 250,000 to about 5 million from 1980 to 2013, representing a 20-fold increase, while in the United States, CT scans ranged from 2 million to 85 million. It has been shown to show a growth of approx. 43 [5]. In the United Kingdom and the United States, CT scans account for 11% and 17% of all medical X-ray tests and 67% and 49% of the cumulative effective dose, respectively. Absorption dose in tissues in CT scan is a higher component of the doses received by patients in diagnostic radiology methods [6,7]. Different parameters affect the dose received by patients in CT imaging. One of the most important factors influencing the dose received by patients is the intensity of the current in the tube (current generated in the tube due to the flow of electrons inside it) as a determinant of the amount of X-rays. For dosimetry calculations GATE (GEANT4) application to Tomographic Emission) [8], a Monte Carlo based script interface dedicated to nuclear medicine, was used. Different versions of this free open source toolkit are available on the open GATE collaboration website [9]. For dosimetry applications, GATE is capable to take either patient’s CT or a digital atlas phantom as input [10]. GATE has certain attractive features; some of them are inherited from GEANT4 [11] and some are additionally developed. These include flexible simulation geometry capable of accommodating a large variety of detector and source details and the physical events. In this study we review the evaluation skin and organ dose of patients caused by CT scan and comparison with Monte Carlo simulation software GEANT4 using DLP index.

Methods

Patient Study

This study was performed on 11 patients referred to Tohid Hospital in Sanandaj for chest CT scan. GE Light Speed RT, a third generation standard radiotherapy CT (GE Medical Systems, Milwaukee WI), was used in this study. The scanner has a large bore (80 cm), distance X-ray tube and isocenter 60.6 cm and performs 4-slice helical scanning. The tube voltage 80-140 kV step 20, tube current 10-440 mA step 5, rotation times of 1, 2, 3 and 4 seconds are available. Images were acquired with slice thicknesses of 2.5 mm on 10.0 mm collimation (4 × 2.5 mm) (GE Light Speed RT CT scanner technical evaluation November 2005). This scanner is used routinely for obtaining patient images for radiotherapy treatment planning at the Akdeniz University School of Medicine Department of Radiation Oncology. The regular quality assurance (QA) for image quality, 120-200 kV-mA measurement and mechanical tests based on national and international processes was performed. Three different body regions of the Rando phantom (head, chest and pelvic) were scanned by applying typical clinical protocols. The scan parameters kV, mA, pitch, FOV (field of view), rotation time, slice thickness of the CT examinations which were used in this study are given in Table 1. The scan length for each scanning protocol is also shown in Figure 1.

Table 1: Quality control tests include the accuracy and reproducibility of the parameters of each scan

Protocol

Mode KVp mAs P T (mm) I(mm)

L (cm)

Breast

Helical 120 200 1.5 10 10

33.26-1.5

fig 1

Figure 1: A typical transverse slice of CT image of two patients

Monte Carlo Simulation

For both simulations of patient-specific dosimetry with the CT and XCAT phantom, the simulations were performed in GATE Monte Carlo code (version 6.0.0). The data of SPECT, CT and XCAT phantoms were processed to prepare suitable input file formats for GATE. The results of the internal dosimetry for the real activity distribution in the patient body based on the computed CT data were calculated for the CT image and the XCAT phantom in skin as well as in the total body. Photon absorption, Compton and Rayleigh scattering, ionizations, multiple scattering photons were simulated. After completion of simulations, GATE produced two binary files, containing respectively the absolute absorbed dose delivered into the voxels as DLP index (mGy) and the corresponding uncertainties [12]. Dycom photos of each case with VV the 4D slicer software converted into an MHA file or in another way with Mimics Medical 21.0 software converted to 3D STL files. Then, dosimetry separate programs were written for each of these inputs, in MHA and STL formats, and the output of both was almost the same, but in the 2D mode the results were closer to reality.

Dosimetry Calculations

Dose length product (DLP) measured in mGy*cm is a measure of CT tube radiation output/exposure. It is related to volume CT dose index (CTDIvol), but CTDIvol represents the dose through a slice of an appropriate phantom. DLP accounts for the length of radiation output along the z-axis (the long axis of the patient).

DLP = (CTDIvol) * (length of scan, cm)

[units: mGy*cm]

DLP does not take the size of the patient into account and is not a measure of absorbed dose. If the AP and lateral dimensions of the patient are available, then the size specific dose estimate (SSDE) can be used to estimate the absorbed dose.

It is important to remember that the dose length product is not the patient’s effective dose. The effective dose depends on other factors including patient size and the region of the body being scanned. Some multipliers, called k-factors, have been estimated to convert DLPs into effective doses, depending on the body region. If interested, consult reference.

Results

Organ dose simulations were performed using the scan parameters for the chest and abdomen-pelvis CT examinations. The scan range used for the chest CT contained the entire pulmonary area and that used for the abdominal-pelvic CT extended from the diaphragm to the pubic symphysis. In each simulation the obtained results of DLP values for the dedicated GE Light Speed RT CT scanner for organ were about 250 mGy (Table 2). The reported values by manufacturer are 30.16 mGy and 23.9 mGy (GE Report 2005) so Commutated CT is used these values as standards at spreadsheet. The obtained results of DLP values from this study were less then reported values. As a general in the literature, the DLP value for conventional CT scanner is reported to be from 17 to 48 mGy [13-15]. For this dedicated CT scanner, the DLP values were in the range of values from conventional CT. In this study, the organ dose values were obtained by another measurement using the GATE Monte Carlo code (version 6.0.0) calculator and the two methods were compared for each scan protocol. The organs that were in the scanned region are blind listed in Table 3. First result of this study showed that the organ dose is relatively higher in helical mode by using GATE Monte Carlo simulation scanning.

Table 2: Results about dosimetry based on computed CT

Mode

DLP (mGy-cm) Number
helical 259.9

W .1

helical

226.5 M .2
helical 248.7

-W .3

helical

231.6 -M .4
helical 247.3

-M .5

helical

258.3 -M .6
helical 241.6

-M .7

helical

230.5 -M .8
helical 259.7

-W .9

helical

255.9 -M .10
helical 244/3

-M .11

helical

243/9

-W .12

Table 3: Comparison between dosimetry based on CT and GATE Monte Carlo simulation

(DLP) GATE Monte Carlo code

DLP (CT Scan) Number
267.4 259.9

1

232.5

226.5 2
296.1 248.7

3

264.7

231.6 4
270.8 247.3

5

280.5

258.3 6
255.2 241.6

7

266.3

230.5 8
298.5 259.7

9

276.5

255.9 10
264.9 244.3

11

282.3

243.9

12

Discussion

We observed similar organ dosimetry results based on phantom with and patient’s CT data (Table 2). The similarity of the whole body dosimetry shows that the phantom and the calculation/simulations are generally acceptable. Variation between the organ boundaries and geometry of organs between patient and phantom may cause the differences and affect the organ dosimetry. In this study we used the GATE Monte Carlo code for calculation of absorbed dose. GATE code is already validated for dosimetry in many clinical situations including brachytherapy, external beam radiotherapy with photons/electrons, systemic radiotherapy, and proton-therapy. One of the main privileges of GATE is the capability to support both imaging and therapy modeling procedures [16]. The method we used has been employed with variations in other studies [17] for example to study mathematical phantom derived from the MIRD-type adult phantom. The use of phantoms is already validated for internal dosimetry purposes. Another reports showed that the dosimetry based on phantom is different from those based on the Zubal phantom as well as different dosimetry estimations obtained from different BMIs. We showed, the calculated doses have a good approximation in the simulated software and the higher percentage of dose in the simulation can be attributed to the use of this approximation that the use of mono energy source in the simulated CT scan. the energy spectrum of the tube is not mono, and in a wide spectrum with a peak of one-third of energy, it sleeps like a rabbit. So in general, the computational results of DLS were similar.

Conclusion

In this study, we showed that the results of dosimetry Similar when the CT phantom is used in place of patient’s CT image and GATE Monte Carlo code simulation. Providing a simulation method could be an option to give less right to CT scams.

References

  1. Grimes J, Celler A, Birkenfeld B, Shcherbinin S, Listewnik MH, et al. (2011) Patient- specific radiation dosimetry of 99mTc-HYNIC-Tyr3-octreotide in neuroendocrine J Nucl Med 52: 1474-81. [crossref]
  2. Kolbert KS, Sgouros G, Scott AM, Bronstein JE, Malane RA, et al. (1997) Implementation and evaluation of patient-specific three-dimensional internal J Nucl Med 38: 301-308. [crossref]
  3. Saeedzadeh E, Sarkar S, Abbaspour Tehrani-Fard A, Ay MR, Khosravi HR, et al. (2012) 3D calculation of absorbed dose for 131I-targeted radiotherapy: A Monte Carlo study. Radiat Prot Dosimetry 150: 298-305. [crossref]
  4. Sgouros G, Kolbert KS, Sheikh A, Pentlow KS, Mun EF, et (2004) Patient-specific dosimetry for 131I thyroid cancer therapy using 124I PET and 3-dimensional- internal dosimetry (3D-ID) software J Nucl Med 45: 1366-72. [crossref]
  5. Tsougos I, Loudos G, Georgoulias P, Theodorou K, Kappas C (2010) Patient-specific internal radionuclide dosimetry. Nucl Med Commun 31: 97-106. [crossref]
  6. Dewaraja YK, Frey EC, Sgouros G, Brill AB, Roberson P, et al. (2012) MIRD pamphlet 23: quantitative SPECT for patient-specific 3-dimensional dosimetry in internal radionuclide therapy. J Nucl Med 2053: 1310-25. [crossref]
  7. Buck AK, Nekolla S, Ziegler S, Beer A, Krause BJ, et (2008) SPECT/CT. J Nucl Med 49: 1305-19.
  8. Segars WP, Sturgeon G, Mendonca S, Grimes J, Tsuen BMW (2010) 4D XCAT phantom for multimodality imaging research. Med Phys 37: 4902-15. [crossref]
  9. Bauman G, Charette M, Reid R, Sathya J. (2005) Radiopharmaceuticals for the palliation of painful bone metastasis-a systemic Radiother Oncol 75: 258-70. [crossref]
  10. Taschereau R, Chow PL, Cho JS, Chatziioannou (2006) A microCT X-ray head model for spectra generation with Monte Carlo simulations. Nucl Instrum Methods Phys Res A 569: 373-377.
  11. Parach AA, Rajabi H (2011) A comparison between GATE4 results and MCNP4B published data for internal radiation dosimetry. Nuklearmedizin 50: 122-133. [crossref]
  12. Díaz-Londoño G, García-Pareja S, Salvat F, Lallena AM (2015) Monte Carlo calculation of specific absorbed fractions: variance reduction Phys Med Biol 60: 2625-44. [crossref]
  13. Fallahpoor M, Abbasi M, Kalantari F, Parach AA, Sen A (2017) Practical Nuclear Medicine and Utility of Phantoms for Internal Dosimetry: XCAT Compared with Radiat Prot Dosimetry 174: 191-197. [crossref]
  14. Fallahpoor M, Abbasi M, Parach AA, Kalantari F (2017) Internal dosimetry for radioembolization therapy with Yttrium-90 J Appl Clin Med Phys 18: 176-180. [crossref]
  15. Fallahpoor M, Abbasi M, Parach AA, Kalantari F (2017) The importance of BMI in dosimetry of 153Sm-EDTMP bone pain palliation therapy: A Monte Carlo study. Appl Radiat Isot 124: 1-6. [crossref]
  16. Parach AA, Rajabi H, Askari MA (2011) Paired organs-should they be treated jointly or separately in internal dosimetry? Med Phys 38: 5509-21. [crossref]
  17. Loevinger R, Budinger TF, Watson EE (1988) MIRD primer for absorbed dose calculations. New York: Society of Nuclear Medicine.