Monthly Archives: September 2023

fig 1 new

Anti-inflammatory Metabolites and Allergenic Proteins from Green Lipped Mussel (Perna canaliculus)

DOI: 10.31038/IJVB.2023711

Abstract

Lipophilic extracts from the green-lipped mussel (Perna canaliculus) are known to have anti-inflammatory capacity, but allergenic proteins from Perna canaliculus were identified recently. This raises the question of the safety of the anti-inflammatory products of Perna canaliculus. The anti-inflammatory effects on symptoms of arthritis are reported for a lipid fraction, comprising inhibitors of cyclooxygenases (cox1 and cox2), histamine blockers and omega-3 fatty acids. The lipid fractions can be obtained by extracting mussel tissue using supercritical CO2 or organic solvents. To produce glycosaminoglycan-rich extracts, homogenates are delipidated, and the proteins are digested by proteases, leading to an enrichment of the carbohydrate fraction consisting primarily of glycosaminoglycans. Products for animal health care can also be prepared more cost-efficiently by simply homogenising mussel tissue and subsequent freeze-drying. These products are mainly applied as dietary supplements. We here review briefly the knowledge on the mode of action of the various supposed anti-inflammatory capacities of Perna canalicus associated with several classes of molecules and focus on the applied extraction protocols because the extraction methods define the potential risk of allergenic proteins, which were recently discovered.

Background

The Green Lipped Mussel (Perna canaliculus) is a bivalve mollusc from the family of Mytilidae and is found endemically in the sea around New Zealand. The mussels have been cultivated since the 1960s in large capacities by aqua farming and exported worldwide. P. canaliculus products are available as dietary supplements. They are promoted for therapy as well as for prevention of bone problems in humans as well as in animals.

Anti-inflammatory Activity of Lipid Fractions from Perna canaliculus

The anti-inflammatory potential of Perna canalicus was first reported about four decades ago [1]. The study by Couch et al. reported a positive effect in managing inflammatory joint disease [2], and Caughey et al. described a positive impact on treating rheumatoid arthritis [2]. The anti-inflammatory effects of Perna canaliculus were hypothesised to be caused by three different modes of action. First, there is evidence that Perna canaliculus extracts contain inhibitors of prostaglandin synthase, also known as cox-1 and cox-2 [3]; second, the histamine inhibitor lysolecithin was found in high abundance in P. canaliculus extracts [4], and thirdly also the relatively high content of Omega-3 fatty acids might exert an additional anti-inflammatory effect [5].The association of the prostaglandin level with auto-immune diseases is well documented for many auto-immune diseases like rheumatoid arthritis and osteoarthritis [6]. Cox-1 is constitutively expressed in many tissues, but the cox-2 gene is dramatically upregulated after inflammation [7]. Since the formation of prostaglandins is associated with inflammation and pain, many painkillers are cox-1 or cox-2 inhibitors. Due to its induction during inflammation, the cox-2 enzyme is a primary target for the therapy of auto-immune diseases [8-10]. Based on identifying cox-I inhibition by freeze-dried homogenates of P. canaliculus in different studies, the question was raised about the specific mode of action and the actively involved molecules. In the study of McPhee et al., the homogenate was saponified by KOH hydrolysis, which enormously increased the inhibition of cox-enyzmes [3]. The treatment of the homogenate with proteases and lipase also resulted in a substantial increase in the inhibitory capacity compared to the homogenate; please see Figure 1.

fig 1 new

Figure 1: Overview of processes resulting in P. canaliculus products. The lipid fraction, glycosaminoglycans and whole homogenate require different extraction methods and are promoted by commercial providers for applications like inflammation, arthritis, cartilage malfunctions and osteoarthritis. The extracellular matrix comprises a wide range of glycosaminoglycans and collagens as the main protein content and associated proteins.

These results rule out the role of proteins and complex lipids and favour the involvement of the lipid fraction. Such a lipid fraction from P. canaliculus is also produced as the commercially available extract Lyprinol ®(Pharmalink International Ltd.), which is achieved by extracting the lipid fraction from the homogenate by supercritical CO2. Further Lyprinol free fatty acid fraction tests revealed that purified polyunsaturated fatty acids (PUFA) extracts seem to be competitive substrate inhibitors of prostaglandin synthase [11]. The effects of different types of molecules were summarised in the review of Grienke et al. [1]. Besides the inhibition of prostaglandin synthase, the blocking of histamine by lysolecithin might contribute to the anti-inflammatory effects of extracts from P. canaliculus. Lysolecithin was isolated from a methanol-based extraction from Perna homogenate by liquid-liquid extractions, further silica-based chromatography, and size-exclusion chromatography. The molecular analysis of a single spot from thin-layer chromatography by NMR and mass spectrometry yielded the identification of lysolecithin [4]. Because phosphatidylcholine is relatively small, it is soluble in methanol and assumingly also in CO2, which explains the enrichment by these extraction methods. The third potential anti-inflammatory activity within lipid extracts is omega-3 fatty acids, which have been found to inhibit cox-2 [12]. In the case of osteoarthritis, both the lipid fraction and whole extracts of Perna canaliculus have yielded therapeutic benefits for the included patients [13].

Effects of Glycosaminoglycans

Besides the anti-inflammatory capacity of Perna extracts, there is also experimental evidence for the effects of Perna extracts on cartilage function in the case of osteoarthritis [13,14]. In this disease, inflammation is supposed to be the primary starting point with secondary effects on the cartilage function. Here, the high content of sulphated glycosaminoglycans in Perna canaliculus extracts [15] might play a role since they first replace a disease-induced lack of glycosaminoglycans in affected joints and secondly interact with proteins involved in regulating the inflammatory processes [16]. The main cartilage components are proteoglycans, consisting of a protein core with covalently bound glycosaminoglycans (GAGs). The high content of chondroitin-sulfate (up to 12%) in Perna canaliculus [15] might supply the chondrocytes in the cartilage to synthesise an increased amount of proteoglycans. The increase in proteoglycans in the cartilage might also affect the binding of cytokines that control the inflammation processes and contribute to the healing process.

Application of Whole Homogenates in Animals and Detection of Allergens Therein

Perna canaliculus extracts have been used in studies on animals like dogs with a focus on osteoarthritis [17]. Besides osteoarthritis in dogs, studies about the effects of feline degenerative joint disease and lameness and joint pain in horses have been reviewed earlier [18]. For most of the cases, positive results were found. Still, since the more cost-effective whole homogenates were used for animals, there is less information about the effective molecule class or molecule. Recently, proteins from Perna canaliculus were identified as allergenic in humans [19]. The sole case of an allergic reaction to Perna proteins was a dog owner who fed freeze-dried homogenate to her arthritic dog. The affected person had dermal contact with the powder and assumingly inhaled small amounts. Prick tests confirmed the allergic symptoms, and the allergic proteins were identified by IgE-based western blotting with the patient’s serum. The proteins in the IgE-positive bands were identified by mass-spectrometry as actin, tropomyosin, and paramyosin. All these proteins are highly abundant in all cells across the animal kingdoms. Actin is crucial in forming a part of the cytoskeleton, which is key for forming cells. Tropomyosin and paramoysin form fibres that are crucial for muscle contraction. The biggest part of the mussel is the muscle necessary to move the clamps, which leads to a very high abundance of these two proteins in extracts.Although these are the first allergens to be reported, they are closely related to allergens found in other mussels. For example, actin is a significant allergen in Paphia textile and tropomyosin in Haliotis discus [20-22]. Further evidence stems from the free available software AllCatPro which predicts high potential allergenicity for humans [23-25]. The prediction is primarily based on the degree of homology distance to human proteins because the more significant the difference, the higher the allergenicity prediction. The same principle also applies to the potential allergenic reactions in pet animals like dogs. However, much less is known about allergic reactions in dogs than in humans, which raises concerns about protein-containing Perna canaliculus extracts for treating arthritis in dogs. However, reports also describe a strong antioxidant and ACE inhibitory activity of peptides derived from a proteolytic digest of the mussel proteome [2].

Conclusions

Despite a lack of successful clinical studies on the therapeutic efficiency of Perna canaliculus in humans, there is plenty of experimental evidence for an anti-inflammatory capacity of both the lipid fraction and the glycosaminoglycan fraction. These purified extracts lack the protein content and thus do not suppose a threat of any protein-based allergenicity for humans or pet animals.

References

  1. Miller TE, Ormrod D The anti-inflammatory activity of Perna canaliculus (N.Z. green lipped mussel). N Z Med J [crossref]
  2. Caughey DE, et al. Perna canaliculus in the treatment of rheumatoid arthritis. Eur J Rheumatol Inflamm [crossref]
  3. McPhee S, et al. Anti-cyclooxygenase effects of lipid extracts from the New Zealand green-lipped mussel, Perna canaliculus. Comp Biochem Physiol B Biochem Mol Biol [crossref]
  4. Kosuge T, et al. Isolation of an anti-histaminic substance from green-lipped mussel (Perna canaliculus). Chem Pharm Bull (Tokyo) [crossref]
  5. Mickleborough TD, et al. Marine lipid fraction PCSO-524 (lyprinol/omega XL) of the New Zealand green lipped mussel attenuates hyperpnea-induced bronchoconstriction in asthma. Respir Med [crossref]
  6. Robinson DR, Dayer JM, Krane SM, Prostaglandins and their regulation in rheumatoid inflammation. Ann N Y Acad Sci [crossref]
  7. Crofford LJ, COX-1 and COX-2 tissue expression: implications and predictions. J Rheumatol Suppl [crossref]
  8. Ichikawa A [Molecular biology of prostaglandin E receptors–expression of multi-function by PGE receptor subtypes and isoforms]. Nihon Rinsho [crossref]
  9. Park JY, Pillinger MH, Abramson SB, Prostaglandin E2 synthesis and secretion: the role of PGE2 synthases. Clin Immunol [crossref]
  10. Ferrer MD, et al. Cyclooxygenase-2 Inhibitors as a Therapeutic Target in Inflammatory Diseases. Curr Med Chem [crossref]
  11. Whitehouse MW, et al. Anti-inflammatory activity of a lipid fraction (lyprinol) from the N.Z. green-lipped mussel. Inflammopharmacology [crossref]
  12. Calder PC, Omega-3 fatty acids and inflammatory processes. Nutrients [crossref]
  13. Abshirini M, et al. Green-lipped (greenshell) mussel (Perna canaliculus) extract supplementation in treatment of osteoarthritis: a systematic review. Inflammopharmacology, [crossref]
  14. Miller TE, et al. Anti-inflammatory activity of glycogen extracted from Perna canaliculus (N.Z. green-lipped mussel). Agents Actions [crossref]
  15. Mubuchi A, et al. Isolation and structural characterization of bioactive glycosaminoglycans from the green-lipped mussel Perna canaliculus. Biochem Biophys Res Commun [crossref]
  16. Crijns HV, Vanheule, and P. Proost, Targeting Chemokine-Glycosaminoglycan Interactions to Inhibit Inflammation Front Immunol [crossref]
  17. Bui LM, Bierer RL Influence of green lipped mussels (Perna canaliculus) in alleviating signs of arthritis in dogs. Vet Ther [crossref]
  18. Eason CT, et al. Greenshell Mussels: A Review of Veterinary Trials and Future Research Directions. Vet Sci [crossref]
  19. Kage, P, et al. Identification of New Potential Allergens from Green-lipped Mussel (Perna Canaliculus). Iran J Allergy Asthma Immunol [crossref]
  20. Mohamad Yadzir ZH, et al. Tropomyosin and Actin Identified as Major Allergens of the Carpet Clam (Paphia textile) and the Effect of Cooking on Their Allergenicity. Biomed Res Int [crossref]
  21. Naz S, et al. Characterization of Sarcoptes scabiei Tropomyosin and Paramyosin: Immunoreactive Allergens in Scabies. Am J Trop Med Hyg [crossref]
  22. Ji NR, et al. Analysis of Immunoreactivity of alpha/alpha(2)-Tropomyosin from Haliotis discus hannai, Based on IgE Epitopes and Structural Characteristics. J Agric Food Chem
  23. Maurer-Stroh S, et al. AllerCatPro-prediction of protein allergenicity potential from the protein sequence. Bioinformatics [crossref]
  24. Grienke UJ. Silke, and D. Tasdemir, Bioactive compounds from marine mussels and their effects on human health. Food Chem [crossref]
  25. Jayaprakash, R. and C.O. Perera, Partial Purification and Characterization of Bioactive Peptides from Cooked New Zealand Green-Lipped Mussel (Perna canaliculus) Protein Hydrolyzates. Foods [crossref]

Hearing from Refugee Adolescent Girls and Their Parents about Sexual Health Programming: Are We Listening?

DOI: 10.31038/AWHC.2023633


The world is facing a huge voluntary and involuntary migration across continents. In the U.S., more than 6000,00 refugees have been re-settled and more than half of these persons are children, adolescents, and emerging adults (US Dept of State, 2020) [1]. Developmentally, teens and young adults are at a stage where they are developing life skills, establishing social and romantic partnerships, and often experience testing of boundaries and exposure to risk-taking behaviors. Experimentation in the “s” aspects of life – social, sexual, substances, and safety – pose challenges to the health and well-being of both the adolescent and emerging adult as well as their parents and other connected adults.

Females in these age groups, in particular, face threats to their well-being and futures as they are disproportionately impacted by unplanned pregnancies, Sexually-Transmitted Infections (STIs), and HIV. Compounding these issues, diasporic populations – persons who migrated, moved, or been resettled suddenly or involuntarily – can enter a new country and face overwhelming obstacles to the transition. Successful and safe transition for young females includes preventing exposure to, or intervening early, in potential sexual risk situations to avoid pregnancy, STIs or HIV. Often concerning, is their lack of related experiences and exposures needed to build sexual risk prevention knowledge, attitudes, and skills including communication and negotiation competence [2,3] and being able to navigate potential risk situations and identifying triggers to unsafe decision-making (e.g., substance use, depression and anxiety).

We conducted studies with both resettled refugee adolescent girls (ages 15-17) and their parents to learn from them why they (or their daughters) were interested in participating in an evidence-based sexual health promotion program, The Health Improvement Project for Teens (HIP Teens). We also assessed outcomes based on qualitative thematic data analysis from separate interviews to more clearly understand the utility and acceptability of the program. Overall, study participants represented ten different countries providing a broad swath of impressions and feedback.

Recruited from an internationally-recognized refugee resettlement service in the U.S.F that offered this CDC- and DHHS-recognized evidence-based sexual health intervention, interviewers sought to gain an understanding of how the program was received and applied by the participants. Originally developed through extensive formative qualitative and quantitative studies and randomized controlled trial [4], this manualized intervention is theoretically-driven, using trauma-informed care approaches and uses interactive activities, games, and role plays to provide medically-accurate sexual risk reduction information. It enables participants to expand a personal “menu” of healthy behavior choices and reduce risk, while providing skills training in negotiation, assertive communication, risk appraisal, safer behaviors, and goal setting. Following individual interviews with the girls accompanied by interpreters, our qualitative content analysis identified three themes: (1) My cultural norm is not to ask; (2) Groups were a safe way for me to learn and share; and (3) I learned to use my voice [5].

Interviews, again accompanied by interpreters, with mothers (N=8) and fathers (N=5) provided insight into motivations and concerns driving their decision to consent for their daughter’s participation as well as discussions with their daughter during the program and after completion that they may have had that would provide insight on impact . We identified five predominant themes using in-depth qualitative thematic analysis including: (1) Protecting our daughters with knowledge; (2) A different country, a different approach to protection; (3) Consent and understanding can be different; (4) Parents cannot do it all; and (5) My daughter gained a voice [6].

Through the voices of both the girls who participated in the program and the parents who consented for their participation, we heard very clearly about the need for, and desire to learn from, a program tailored for the needs of refugee teens to improve sexual health outcomes. By providing information, increasing motivation, and, most importantly, developing risk-prevention and healthy choices behavioral skills, we addressed their deficits in this area while building on the strengths they brought to the program. Both parents and girls recognized the challenges they might face in a different country with a vast array of potential risk exposures. They were committed to preparing themselves as best they could and this intervention offered a targeted approach conducted within a trusted setting and with facilitators that they had already built relationships.

While refugee populations may enter into a new culture and country with hopes of both acclimating to their new residence while, importantly, maintaining their own mores, traditions, and customs, we still need to work hand-in-hand with them about the many challenges they often face in this transition. Parents may not be ready to address all these challenges solely within their home setting or communities and it was evident in our work that they wanted a guiding partnership with agencies that acknowledged and included them in approaches to meeting the needs of their families. Building upon the strengths that these communities bring to the partnership and integrating members into the organization’s team for programming and services is key to successful results. Identifying multiple approaches to providing opportunities for their voices to not only be heard, but listened to, can help create and grow approaches that are feasible, acceptable, and embraced by these vulnerable communities. Never is this more important than when addressing sexual health programming for girls and young women who continue to bear a disproportionate negative burden for health, education, employment, and social consequences as a result of pregnancy, STIs and HIV around the world.

References

  1. S. Department of State. Refugee admissions report. Refugee Processing Center. 2020.
  2. Kaczkowski W, Swartout KM (2020) Exploring gender differences in sexual and reproductive health literacy among young people from refugee backgrounds. Culture Health & Sexuality 22: 369-384. [crossref]
  3. Tirado V, Chu J, Hanson C, Ekström AM, Kågesten A (2020) Barriers and facilitators for the sexual and reproductive health and rights of young people in refugee contexts globally: A scoping review. PloS one 15: e0236316. [crossref]
  4. Morrison-Beedy D, Jones S, Xia Y, Tu X, Crean H, et al. (2012) Reducing Sexual Risk Behavior in Adolescent Girls: Results from a Randomized Controlled Trial. Journal of Adolescent Health 52: 314-321.
  5. Morrison-Beedy D, Wegener R, Ewart A, Ross S, Spitz A (2023) Reflections from refugee adolescent girls on participation in a US-based sexual health promotion project. Journal of Immigrant and Minority Health 25: 680-684. [crossref]
  6. Morrison-Beedy D, Ewart A, Ross S, Wegener R, Spitz A (2022) Protecting their daughters with knowledge: Understanding refugee parental consent for a US-based teen sexual health program. American Journal of Sexuality Education 17: 474-489.
fig 3

RGCC Promotes Adipocyte Thermogenesis by Modulating Pgc1α Expression

DOI: 10.31038/CST.2023832

Abstract

Brown and beige adipocytes dissipate energy in a non-shivering thermogenesis manner, exerting beneficial impact on metabolic homeostasis. RGCC (protein regulator of cell cycle) is BAT-enriched protein, while its role in thermogenic adipocytes remains unknown. RGCC is upregulated by acute cold challenge or β3 agonist in BAT and iWAT. Lack of RGCC constrains expression of a set of thermogenic genes in brown and beige adipocytes. Conversely, ectopic expression of RGCC drives a full of program of thermogenesis and promotes browning. Pgc1α knockdown obviously prevents expression of RGCC-elicited thermogenic genes. Together, these findings uncover that physiological role for RGCC-mediated activation of the thermogenic program in adipocytes.

Keywords

RGCC, Pgc1α, Brown adipocytes, Beige adipocytes, Thermogenesis

Introduction

Brown and beige adipocytes have long been well recognized as an organ specialized for energy expenditure by dissipating energy as heat in a process called non-shivering thermogenesis [1]. Beige adipocytes, resided in white adipose tissue (WAT), are induced by chronic cold exposure, exercise, and treatment with other external cues [2]. These adipocytes have a multilocular lipid droplet morphology, specifically expressing a group of thermogenic genes, involving in uncoupling protein 1(Ucp1)-dependent or Ucp1-independent pathway, which contributes to generate heat [3]. Both brown adipose tissue (BAT) and beige adipocytes are found in rodents and humans [4-6]. Recent studies further demonstrate that the BAT-positive group were younger and showed lower metabolism-related parameters such as the body mass index (BMI), body fat mass, glycated hemoglobin (HbA1c), glucose, total cholesterol and the LDL-cholesterol [4,7]. These findings lead to the proposal that increasing BAT mass/ activity or beige adipocytes transformation might be a promising therapeutic strategy for metabolic disease. RGCC (protein regulator of cell cycle), also known as RGC-32 (response gene to complement 32 protein), is an ancient and conserved intracellular proteins existed in all eukaryotes. It was found to function as a role in the cell cycle, cell differentiation, fibrosis and cell metabolism in various physiological and pathological states [8-16]. The previous data revealed that RGCC is a unique protein expressed in brown adipocytes, and regulates adipogenesis in the Pdgrfa +/ Thy1 (LP) cells sorted from E14.5 embryos to determine adipocyte fate. Adipocytes, derived from multipotent mesenchymal stem cells, goes through two phases of adipogenesis. The first phase, known as determination, converts the pluripotent stem cell into the adipocyte lineage which lost the potential to differentiate into other cell type. In the second phase, the preadipocytes give rise to mature adipocytes, which is called terminal differentiation [17]. However, the role of RGCC in the terminal differentiation stage of brown adipocytes, especially in the regulation of thermogenesis, had not yet been studied.

In this study, we found that RGCC expression in BAT and iWAT was strongly induced by β3-adrenergic signaling. Depletion of RGCC in brown and beige adipocytes led to defect in maintain of thermogenesis. Consistently, RGCC overexpression strongly promotes expression of BAT-selective gene. Mechanistically, RGCC drives a full program of thermogenesis in part through Pgc1α. Our studies identified RGCC as a major regulator for thermogenesis of brown and beige adipocytes, and may provide a potential therapeutic target for obesity and metabolic diseases.

Results

RGCC is BAT-enriched Protein and Triggered by Cold Exposure

BAT-enriched regulators have the potential function in adaptive thermogenesis. To identify the presumed activators, we analyzed a previously published RNA-Seq datasets of mouse tissues, and found that the RGCC gene was highly expressed in adipose tissues [18]. Similarly, real time-quantitative PCR (RT-PCR) analysis confirmed that RGCC was mostly expressed in the brown fat and white fat of adult mice (Figure 1A). While the protein levels of RGCC were strikingly higher in BAT, and were extremely lower in iWAT and eWAT compared to BAT (Figure 1A). Cold exposure or noradrenergic cascade activate thermogenesis in BAT and recruit beige adipocytes in WAT. RGCC mRNA level and protein level in BAT were evidently provoked upon mice were subjected to acute cold exposure (Figure 1B). Chronic activation of β3-signaling by Cl316,243 agonist certainly induced RGCC expression in BAT and iWAT (Figure 1C and 1D). Moreover, the RGCC messenger levels were progressively inducted during adipocyte differentiation and peaked at late stage in immortalized brown adipocytes and C3H10T1/2 cells (a beige-like adipocyte model) (Figure 1E and 1F). These data suggested RGCC may be participated in maintaining thermogenesis of brown adipocytes and browning process of white adipocytes.

fig 1

Figure 1: RGCC is a BAT-enriched protein and induced by cold challenge.
(A) RGCC mRNA levels in several tissues (top) (n=5 each group) and RGCC protein levels in adipose tissues of 8-week-old C57BL/6J mice (bottom).
(B) RGCC mRNA level (top) and protein expression (bottom) in BAT after cold challenge for 6 h (n=4 each group).
(C-D) RGCC mRNA levels (C) and protein levels (D) in adiposes of mice. C57BL/6J mice were intraperitoneally (i.p.) injected Cl316,243 or phosphate-buffered saline at a dose 0.5 ug /g body weight for 1, 2, or 3 days.
(E-F) qPCR analysis of RGCC mRNA expression in differentiating immortalized brown adipocytes (E) and C3H10T1/2 cells (F) (n=3 independent cultures).
Data are expressed as mean ± SEM of biological independent samples. Two-tailed unpaired Student’s t-test was performed. *P<0.05.

RGCC Perturbation in Brown Adipocytes Impairs Thermogenesis

To investigate whether RGCC is responsible for function of brown adipocytes, we knocked down RGCC with lentiviral short hairpin RNAs (shRNAs) in immortalized brown preadipocytes, which then were induced to differentiation. The previous study indicated that RGCC depletion by 80% in the Pdgrfa +/ Thy1 cells isolated from E14.5 embryos obviously hinders adipogenesis [19]. While we knocked down RGCC by 50-60% from preadipocytes which would not affect adipocyte differentiation as indicated by picture during differentiation course and similar expression levels of common fat marker genes ap2 and Pparγ (Figure 2A, 2B, 2D and 2E). RGCC-knockdown adipocytes were accumulated more enlarged lipid droplets and triglyceride (TG) content (Figure 2B and 2C), indicating weaker energy metabolism. Knockdown of Rgcc reduced a broad of BAT-selective gene expression, including Ucp1, Cox7a1, Cpt1b, which was further confirmed by western blot analysis (Figure 2D and 2E). Importantly, the effect of Rgcc knockdown is functionally relevant, as basal and uncoupled oxygen consumption rate was greatly reduced (Figure 2F). FCCP-induced maximal respiration was also lower than controls (Figure 2F). Collectively, these data demonstrates that RGCC is required for thermogenesis in brown adipocytes.

fig 2

Figure 2: RGCC modulates the thermogenesis gene program in brown adipocytes.
(A) Representative images of brown adipocytes during differentiation. The immortalized brown preadipocytes were infected with shRGCC or scramble knockdown lentiviruses and differentiated. Scale bar is 200 μm.
(B) Representative Oil-red staining of mature adipocyte generated as in (A). Scale bar is 200 μm.
(C) TG contents in RGCC knockdown cells generated as in (A) (n=3 each group).
(D-E) Gene mRNA levels (D) and protein levels (E) in RGCC knockdown cells from (A) (n=3 each group).
(F) Oxygen consumption rate (OCR) in brown adipocytes generated as in (A) by Oroboros O2K. Oligomycin (Oligo), FCCP and Rotenone (Rot) were added at the time points indicated by the arrows (n=3 independent cultures). Basal respiration, uncoupled respiration, and maximal respiration were showed in the right panel.
Data are expressed as mean ± SEM of biological independent samples. Two-tailed unpaired Student’s t-test was performed. *P<0.05, **P<0.01, ***P<0.001.

RGCC Depletion Restrains Browning of White Adipocytes

We observed that the RGCC protein is triggered in iWAT when subjected to activation of chronic β3-adregenic signaling, denoting it may be involved in white fat browning (Figure 1C and 1D). C3H10T1/2 derived from mesenchymal stem cells were utilized to induce beige adipocytes. Similar to what is observed in brown adipocytes, RGCC knockdown (nearly 50-60%) had no effect on adipogenesis, but clearly increased larger lipid droplets and more intracellular triglyceride TG content (Figure 3A and 3C). At a molecular level, diminishing RGCC expression in beige adipocytes led to systematic decreased expression of adipocyte genes including Ucp1, Cox7a1 and Cpt1b, which basically phenocopied the knockdown brown adipocytes (Figure 3C and 3D). Moreover, Rgcc disruption constrained the basal and FCCP-stimulated OCR of adipocytes (Figure 3E). Together, RGCC deficiency in beige adipocytes inhibits the expression of BAT-specific genes and β-oxidation genes, hinders the function of beige adipocytes.

fig 3

Figure 3: RGCC depletion constrains BAT-selective gene expression in beige cells.
(A) C3H10T1/2 preadipocytes were infected with RGCC knockdown lentiviruses and then subjected to the adipogenic differentiation process. Oil-red staining was performed on day 8.
(B) TG contents were performed in C3H10T1/2 adipocytes generated as in (A) (n=3 each group).
(C-D) mRNA levels (C) and protein levels (D) were analyzed in C3H10T1/2 adipocytes generated as in (A) (n=3 each group).
(E) OCR analysis in C3H10T1/2 adipocytes generated as in (A). Diagram of basal respiration, uncoupled respiration and maximal respiration were showed in the right panel (n=3 each group).
Data are expressed as mean ± SEM of biological independent samples. Two-tailed unpaired Student’s t-test was performed. *P<0.05, **P<0.01, ***P<0.001.

Pgc1α Mediated RGCC-dependent Thermogenesis

To study the gain-of-function of RGCC in adipocytes, we used lentiviruses to stably overexpress RGCC during differentiation of adipocytes. Ectopic expression of RGCC did not affect common fat maker gene Pparγ and Fabp4 expression, while increased Ucp1, Cox7a1 and Cpt1b expression whether in brown adipocytes or in beige adipocytes, indicating that RGCC promotes thermogenesis of adipocytes in cell-autonomous way (Figure 4A-4D). In order to identify the driver for RGCC-mediated thermogenesis, we screened a list of known positive regulators of thermogenesis in RGCC-knockdown brown and beige cells. Figure 4E-4F implied that peroxisome proliferator-activated receptor γ coactivator 1α (Pgc1α) was the only candidate whose expression level fully responses to RGCC changes. Its protein levels were further confirmed in Rgcc-knockdown adipocytes (Figure 4E-4F). Knockdown of Pgc1α did abolish RGCC-elicited strong effect on Ucp1, Cox7a1 and Cpt1b expression, in both brown adipocytes and C3H10T1/2 adipocytes (Figure 4G-4H). Taken together, we conclude that the Pgc1α is responsible for RGCC-mediated thermogenesis.

fig 4

Figure 4: Pgc1α mediates RGCC-dependent thermogenesis.
(A-B) protein levels (A) and mRNA levels (B) expression in mature brown adipocytes. Preadipocytes were infected with RGCC overexpression lentiviruses on day 2 and harvested on day6 (n=3 each group).
(C-D) Protein levels (C) and mRNA levels (D) levels analysis in C3H10T1/2 adipocytes. C3H10T1/2 preadipocytes were infected with lentiviruses expressing RGCC on day 4 and harvested on day 8 (n=3 each group).
(E-F) RT-PCR analysis in mature brown adipocytes (E) and C3H10T1/2 adipocytes (F). Immortalized brown preadipocyte or C3H10T1/2 preadipocytes were infected with shRGCC lentiviruses, differentiated, and harvested for analysis (n=3 each group). Pgc1α protein levels were separately showed in the bottom panel.
(G) Relative mRNA levels in brown adipocytes. lentiviral Pgc1α shRNA was infected with Rgcc-overexpressed cells on differentiation day 4 (n=3 each group).
(H) Relative mRNA levels in C3H10T1/2 adipocytes. Lentiviral Pgc1α shRNA was infected with Rgcc-overexpressed cells on differentiation day 5 (n=3 each group).
Data are expressed as mean ± SEM of biological independent samples. Two-tailed unpaired Student’s t-test was performed. *P<0.05, **P<0.01, ***P<0.001.

Discussion

Here, we found RGCC is induced upon β3-adregenic signaling and modulates the adaptive thermogenesis gene expression. Knockdown of RGCC in cultured brown and beige adipocytes evidently weaken the expression of a broad panel of thermogenic and fatty acid oxidation genes in cell-autonomous way. Consistently, RGCC overexpression strengthens expression of thermogenic marker genes and β-oxidation-related genes. Pgc1α expression is a potential key mechanism for RGCC-mediated thermogenesis. Our results demonstrate that RGCC is crucial for maintaining thermogenesis in brown and beige adipocytes. Previous studies reported that RGCC deficiency had no effect on 3T3-L1 differentiation, but modestly boosted Lipe and Pgc1α expression, which is contrary to our results. It may be because brown, beige and white adipocytes originate from different adipocyte lineage, involving divergent regulation mechanisms. Several regulators have been revealed the inconsistent regulation function in different adipocytes. In 3T3-L1 adipocytes, nutlin-3a-mediated activation of p53 or p53 overexpression suppresses adipogenesis [20]. In C3H10T1/2 cells and human adipose-derived stem cells, p53 knockdown enhances differentiation [21]. While in the skeletal muscle myogenic cell line-C2, as the brown preadipocyte, p53 abrogation substantially impaired differentiation [21]. RGCC-/- mice exhibited a lean phenotype and improved systemic inflammation, further alleviative dyslipidemia and insulin resistance upon HFD. It should not exclude the contribution of RGCC expressed in nonadipose cells on metabolism using while-body Rgcc KO mice. RGCC-mediated thermogenesis and energy homeostasis in vivo, especially in BAT and iWAT, need to be investigated in next study.Pgc1α is induced early in brown fat differentiation and is preferentially expressed in mature brown adipocytes compared to white adipocytes. Moreover, Pgc1α is highly induced by cold exposure and involved in the adaptive thermogenic program in BAT, including fatty-acid oxidation, mitochondrial biogenesis to increase thermogenic genes and promotes browning [22,23]. Obviously, Pgc1α is not a direct target of RGCC. How RGCC regulates Pgc1α mRNA level needs to be studied in future. In conclusion, our results have revealed that RGCC play a fundamental role in regulating thermogenic gene expression in brown adipocytes and beige adipocytes, which makes RGCC a potential drug target in the therapeutics of obesity.

Experimental Procedures

Animals and Treatment

All mice were housed at room temperature with a 12 h light/ dark cycle and ad libitum access to food and water. All studies involving animal experimentation were approved by the University Committee on Use and Care of Animals at the Zhejiang University. For cold experiment, 8-week-old Male C57BL6/J mice were housed at 4℃ for 6h.

Cell Culture

The immortalized brown preadipocytes are cultured and differentiated to brown adipocytes as previously described [24]. Briefly, upon reaching 70% confluence, brown preadipocytes were maintained in the induction medium (DMEM containing 10% FBS, 20 nM insulin, 1 nM T3) for 2 days. Then the differentiation medium containing 10% FBS, 20 nM insulin, 1 nM T3, 0.5 mM dexamethasone, 0.5 mM isobutylmethylxanthine, 0.125 mM indomethacin were changed for another 2 days. Next cells were cultured into induction medium and changed every other day until day 6 waiting for experiments.

The mesenchymal stem cell derived C3H10T1/2 were maintained in DMEM containing 10% CS (designed day-2) for 2 days and induced to differentiate into beige adipocytes with differentiation medium (DMEM containing 10% FBS, 1 μg/ml insulin, 1 mM dexamethasone, 0.5 mM isobutylmethylxanthine, 1 μm rosiglitazone). Two days after induction, cells were switched to maintenance medium containing 10% FBS, 1 μg/ml insulin and 1μm rosiglitazone for another 2 days. Then cells were cultured in DMEM containing 10% FBS every other day until day 8.

Plasmids and Viruses

The sequences of short hairpin RNA (shRNA) were as follows: shRGCC-1: 5’-CTCGAAGACTTCATTGCCGAT-3’; shRGCC-2: 5’-GCAGCATATT

CAACAGAGAAT-3’; shPgc1α-1: 5’-GGTGGATTGAAGTGGTG-TAGC-3’; shPgc1α-2: 5’-CCTCCTCATAAAGCCAACCAA-3’. All above of shRNA oligos were respectively subcloned into lentivirus vector Psp108 (addgene). The vectors were transfected into HEK 293T cells along with packaging plasmids (Pmd2.G, psPAX2 from addgene). Full-length Rgcc cDNAs was amplified by reverse transcription and constructed into lentiviral pENTR1A (addgene) system.

Lentivirus Infection

Overexpression plasmid and packaging plasmid (pLP1, pLP2, pVSVG) were together transfected in HEK 293T cells. The viral supernatant was harvested after 48 h post-transfection. The brown and C3H10T1/2 preadipocytes were infected with lentiviruses using polybrene of 5 μg/ ml, were selected with puromycin (3 μg/ ml) and were differentiated to mature adipocytes following the standard induction protocol. Lentiviruses bearing shPgc1α infected overexpressed-RGCC adipocytes on differentiation day 2 in brown adipocytes and day 4 in C4H10T1/2 adipocytes. The mature brown adipocytes were harvested for gene and protein analysis on day 6, and mature C3H10T1/2 were harvested on day 8.

Oil-red O staining

Differentiated cells were washed with PBS twice, fixed with 4% paraformaldehyde for 10 min at room temperature, and stained with oil-red O working solution (byotime C0158M) for 30 min. Then cells were washed with PBS for several times and waited for scan using a microscope.

Oxygen Consumption Measurement

Real-time measurements of oxygen consumption rates (OCR) were performed using a O2K (Oroboros). The mature brown and C3H10T1/2 adipocytes were washed twice by PBS, trypsinized and suspended in DMEM. The OCR were measured under basal conditions and after addition of oligomycin (2.5 μM), FCCP (1 μM), and rotenone (1 μM).

Antibodies

The following primary antibodies were used: anti-Ucp1 (Ucp11-A) from alpha diagnostic; anti-Pgc1α (66369-1-Ig), anti-Fabp4 (12802-1-AP) from Proteintech; anti-Pparγ1/2 (2443S) from Cell Signaling Technology; anti-Rgcc (A17689), anti-β-actin (AC026), anti-Cox7a1 (A21240), anti-Cpt1b (A6796), anti-β-Tubulin (AC008) from Abclonal.

Real-time qPCR

Total RNA from tissues were extracted using TRIzol (Vazyme R701) and an equal amount of RNA was reverse transcribed by HiSciptÒ QRT SuperMix with gDNA wiper (Vazyme R222). Quantitative real-time PCR was performed following the protocols of chamQ qPCR Master Mix (Vazyme Q711) with ViiA 7 Real-Time PCR system (Applied biosystems).

Western Blot

Mature adipocytes were harvested with cell lysis buffer (100 mM NaCl, 0.5% Triton-X-100, 5% glycerol, 50 mM Tris-HCl (pH 7.5), 1 mM PMSF and protease inhibitor mixture cocktail). Cell supernatants were collected by centrifugation at 16,000 g for 10 minutes at 4 ℃ and quantified for protein content using BCA kit (YEASEN, 20201ES86). The equal protein content of cells lysates was separated by sodium dodecyl sulfate polyacrylamide gel electrophoresis (SDS-PAGE) and revealed with chemiluminescence (ECL) system.

Statistical Analysis

Data are presented as mean ± standard error of the means. Differences between two groups were estimated using the unpaired two-tailed Student’s t-test. Statistical significance was showed as *P<0.05, **P<0.01, ***P<0.001.

Acknowledgements

This research was supported by Zhejiang Provincial Natural Science Foundation of China (LQ23C070004 to Q.Z., LQ21C110001 to S.H.), China Postdoctoral Science Foundation (2020M680053 to Q.Z), the Construction Fund of Key Medical Disciplines of Hangzhou (OO20200055 to Y.G.), and the National Natural Science Foundation of China (82100904 to S.H.).

Conflict of Interest

The authors declare that they have no conflict of interest.

Author Contributions

Q.Z. designed the project, performed most experiments, analyzed data and wrote the manuscript. Q.W., B.L., S.H., X.W., Y.Z., Y.Y., and Z.L. aided in some experiments. Y.G. supervised the study.

Data Availability

All study data, method, and results of statistical analyses are reported in this paper. We welcome any specific inquiries.

References

  1. T. Chouchani, S. Kajimura, Metabolic adaptation and maladaptation in adipose tissue, Nat Metab [crossref]
  2. Wolfrum, Z. Gerhart-Hines, Fueling the fire of adipose thermogenesis, Science [crossref]
  3. Ikeda, T. Yamada, UCP1 Dependent and Independent Thermogenesis in Brown and Beige Adipocytes, Front Endocrinol (Lausanne) [crossref]
  4. Matsushita, T. Yoneshiro, S. Aita, T. Kameya, H. Sugie, M. Saito, Impact of brown adipose tissue on body fatness and glucose metabolism in healthy humans, International journal of obesity [crossref]
  5. A. Virtanen, M.E. Lidell, J. Orava, M. Heglind, R. Westergren, T. Niemi, M. Taittonen, J. Laine, N.-J. Savisto, S. Enerbäck, Functional brown adipose tissue in healthy adults, New England Journal of Medicine [crossref]
  6. Zhang, G. Hao, M. Shao, K. Nham, Y. An, Q. Wang, Y. Zhu, C.M. Kusminski, G. Hassan, R.K. Gupta, Q. Zhai, X. Sun, P.E. Scherer, O.K. Oz, An Adipose Tissue Atlas: An Image-Guided Identification of Human-like BAT and Beige Depots in Rodents, Cell Metab [crossref]
  7. Yoneshiro, S. Aita, M. Matsushita, Y. Okamatsu‐Ogura, T. Kameya, Y. Kawai, M. Miyagawa, M. Tsujisaki, M. Saito, Age‐related decrease in cold‐activated brown adipose tissue and accumulation of body fat in healthy humans, Obesity [crossref]
  8. Saigusa, I. Imoto, C. Tanikawa, M. Aoyagi, K. Ohno, Y. Nakamura, J. Inazawa, RGC32, a novel p53-inducible gene, is located on centrosomes during mitosis and results in G2/M arrest, Oncogene [crossref]
  9. I. Vlaicu, C. Cudrici, T. Ito, M. Fosbrink, C.A. Tegla, V. Rus, P.A. Mircea, H. Rus, Role of response gene to complement 32 in diseases, Archivum immunologiae et therapiae experimentalis [crossref]
  10. Badea, F. Niculescu, L. Soane, M. Fosbrink, H. Sorana, V. Rus, M.L. Shin, H. Rus, RGC-32 increases p34CDC2 kinase activity and entry of aortic smooth muscle cells into S-phase, Journal of Biological Chemistry [crossref]
  11. A. Tegla, C.D. Cudrici, V. Nguyen, J. Danoff, A.M. Kruszewski, D. Boodhoo, A.P. Mekala, S.I. Vlaicu, C. Chen, V. Rus, RGC-32 is a novel regulator of the T-lymphocyte cell cycle, Experimental and molecular pathology 98 [crossref]
  12. P. Voigt, K. Mulfaul, N.K. Mullin, M.J. Flamme-Wiese, J.C. Giacalone, E.M. Stone, B.A. Tucker, T.E. Scheetz, R.F. Mullins, Single-cell transcriptomics of the human retinal pigment epithelium and choroid in health and macular degeneration, Proceedings of the National Academy of Sciences [crossref]
  13. Guo, M. Chen, Y. Chao, C. Cai, L. Liu, L. Zhao, L. Li, Q.R. Bai, Y. Xu, W. Niu, RGCC balances self‐renewal and neuronal differentiation of neural stem cells in the developing mammalian neocortex, EMBO reports [crossref]
  14. G. Luzina, V. Rus, V. Lockatell, J.-P. Courneya, B.S. Hampton, R. Fishelevich, A.V. Misharin, N.W. Todd, T.C. Badea, H. Rus, Regulator of cell cycle protein (RGCC/RGC-32) protects against pulmonary fibrosis, American journal of respiratory cell and molecular biology [crossref]
  15. -B. Cui, J.-N. Luan, S.-Y. Chen, RGC-32 deficiency protects against hepatic steatosis by reducing lipogenesis, Journal of Biological Chemistry [crossref]
  16. -B. Cui, J.-N. Luan, J. Ye, S.-Y. Chen, RGC-32 deficiency protects against high fat diet-induced obesity and insulin resistance in mice, The Journal of endocrinology [crossref]
  17. L. Ghaben, P.E. Scherer, Adipogenesis and metabolic health, Nat Rev Mol Cell Biol [crossref]
  18. E. Lattin, K. Schroder, A.I. Su, J.R. Walker, J. Zhang, T. Wiltshire, K. Saijo, C.K. Glass, D.A. Hume, S. Kellie, M.J. Sweet, Expression analysis of G Protein-Coupled Receptors in mouse macrophages, Immunome Res [crossref]
  19. W. Fung, S. Zhou, H. Zhu, X. Wei, Z. Wu, A.R. Wu, Cell fate determining molecular switches and signaling pathways in Pax7-expressing somitic mesoderm, Cell Discov [crossref]
  20. K. Behera, A. Bhattacharya, M. Vasudevan, T.K. Kundu, p53 mediated regulation of coactivator associated arginine methyltransferase 1 (CARM1) expression is critical for suppression of adipogenesis, Febs j [crossref]
  21. Molchadsky, O. Ezra, P.G. Amendola, D. Krantz, I. Kogan-Sakin, Y. Buganim, N. Rivlin, N. Goldfinger, V. Folgiero, R. Falcioni, R. Sarig, V. Rotter, p53 is required for brown adipogenic differentiation and has a protective role against diet-induced obesity, Cell Death Differ [crossref]
  22. Uldry, W. Yang, J. St-Pierre, J. Lin, P. Seale, B.M. Spiegelman, Complementary action of the PGC-1 coactivators in mitochondrial biogenesis and brown fat differentiation, Cell Metab [crossref]
  23. Wu, O. Boss, Targeting PGC-1 alpha to control energy homeostasis, Expert Opin Ther Targets [crossref]
  24. Zhao, Z. Zhang, W. Rong, W. Jin, L. Yan, W. Jin, Y. Xu, X. Cui, Q.Q. Tang, D. Pan, KMT5c modulates adipocyte thermogenesis by regulating Trp53 expression, Proc Natl Acad Sci U S A [crossref]
FIG 4

Combining AI, Mind Genomics, and Young Medical Minds to Address Communication: Diabetes Patients and Their Desire for Herbal Remedies

DOI: 10.31038/MGSPE.2023314

Abstract

Medical students were given the task to identify situations involving patients with diabetes, the situations developed through AI. The situation became variables or questions about the nature of the patient with diabetes or about the interaction. AI then suggested four answers to each question. The test materials became the four sets of four answers, vignettes which described the nature of the diabetes patient and the nature of the interactions. Each of 50 respondents, foreign medical graduates associated with xxxx, evaluated unique sets of 24 sets of descriptions, vignettes, constructed from combinations of these 16 answers, according to an experimental design. The respondents rated the vignettes on their feelings and the expected feeling of the diabetic patient. Modeling the relation between the answers (elements) and the ratings showed three distinct mind-sets of respondents. These mind-sets, different ways of responding to the elements, were.

Introduction

In today’s world where technology is advancing, and where people have many options for health, it is important to develop a system which can educate the medical professional in the way to work with the patient. The patient is becoming a client of the health care system. It is increasingly recognized that ‘one size does not fit all,’ that people are different, and that medical communications, or more generally communications about the arc of wellness to illness, needs to be fine-tuned for the person. Salespeople know this need for differentiated communication better than just about anyone. People are not convinced by facts, but by how they react both to the facts and to the method that the facts are presented. Ask any salesperson of long-standing experience and that salesperson typically ‘knows’ what to say to prospects. The knowledge may not be formalized, but comes from the years of experience, the trial and error.

In the world of medicine, where technology changes, where the customer is often in an unpleasant situation, and where the medical professional is young, how can a bank of information be developed about what types of communications seem appropriate. We are not talking about a military phrase book with the desire to achieve a single objective, but rather a way of using communication to understand the other person, that understanding moving towards a productive relationship, and restored or maintain health.

Mind Genomics

The present study comes from the effort to create a body of knowledge about how to communicate in the world medicine, and more generally in the arc of life from health and wellness to illness and hospitalization. The approach used here and in previous reports is known as Mind Genomics. Mind Genomics is an emerging science, roughly 30 years old, which deals with the decision making of the everyday world. Whereas many published papers in psychology and behavioral economics deal with unusual situations worthy of note, e.g., counter-intuitive behaviors, Mind Genomics espouses the view that a true relevant opportunity exists through the assessment of the quotidian world, the ordinary world of the everyday, where most people spend most of their time. The origins of Mind Genomics came from interest in applied problems, such as what are the decision rules that people use to buy products? Or what are the types of phrases to which people react when they want to decide? The ordinary, everyday world presents us with uncountable opportunities to understand the rules of decision making and behavior of daily life. The Mind Genomics ‘project’ began with a departure from the conventional ‘surveys’. A survey instructs people to answer questions, forcing the people to think analytically. One need only watch a political pollster ask the interviewer some questions pertaining to hotly contested election to see that the interviewee moves from a person moving through life to a suddenly thoughtful person, one making conscious decision, one trying to figure out the ‘correct answer.; In the words of Nobel laureate Daniel Kahneman, research ends up looking at thinking Slow, thinking 2, whereas the real daily activity is thinking fast, system 1 [1]. The bottom line is that the survey methods end up moving the research to an intellectualized process, often requiring experimental situations out of the ordinary to reveal how we think. Either than, or ask people to intellectualize, even though their daily life consists of automatic behaviors.

Rethinking the Process

Mind Genomics emerged from the combination of three disciplines: Experimental Psychology (and specifically psychophysics), Statistics (specifically experimental design of independent variables), and consumer research (specifically consumer behavior through conjoint analysis [2]; Psychophysics focused on the measurement of percepts. The original world of psychophysics focused on what Harvard’s S.S. Stevens called the ‘outer psychophysics’, viz., the measurement of how strong a physical stimulus was perceived [3]. One could measure the physical sound pressure level, but that did not tell the research how loud the sound felt. Or, moving into the world of communication, one could tell a person about winning or losing a certain amount of money, but that did not tell us the ‘utility’ of winning or losing the amount of money. In simple terms, just knowing the physical strength of a stimulus does not tell us how the stimulus is perceived. When it comes to Mind Genomics, the objective is to measure the strength of perception of an idea, not a simple physical stimulus. Statistics provides a way to help us create combinations of test stimuli. Often, it is the test stimuli, the mixture, which is meaningful for one’s experience, not the individual components. The individual components tested by themselves have no real meaning. But how then does one measure the response attributed to a component of a mixture, when one can only test mixtures. It is that problem which occupies statisticians, namely, to design experiments where the respondent evaluate meaningful or reasonable mixtures, but where the analysis can pull out the contribution of the components. Consumer research, the third part of the foundation, focuses on the world of the consumer, and the world of daily activities involving communication to drive a purchase. For most consumer research, the effort is to understand the parts of the daily process in a way which serves both science/understanding and daily commerce. It is from consumer research that we learn that there are ways to communicate which are effective, ways which are not effective, and how to discover the effective method. The three foregoing fields of knowledge provide both the way to think about problems, and the way(s) to solve the problems. For this study, the objective is to understand what types of messages are felt to ‘work’ among diabetic patients, from the point of view of a young professional in the medical field. The approach of Mind Genomics is straightforward. The strategy is to present respondents (viz., survey takers) with combinations of relevant messages, in our case about diabetes, and measure the response to the combination on one or several scales. Knowing the experimental design undergirding the vignettes allows the researcher to obtain ratings of the combination, and then trace the rating to the particular message or element. The design, analysis, and even some of the interpretation is ‘templated’, allowing any person to become a researcher, or at least follow the steps properly, design an experiment, get the data processed automatically, and emerge with results that often drive new insights.

Applications in the Fields of Wellness and Illness

Mind Genomics enjoys increasing use world-wide. Early work with Mind Genomics focused on the application to evaluating how people felt about different aspects of foods [4]. The Mind Genomics approach quickly found other interested audiences, such as interest in food and good nutrition [5,6]. Finally, interest emerged for applying Mind Genomics to commercial applications in diabetes [7], and in insurance with diabetes [8]. The ability of Mind Genomics to provide a deep understanding of decision emerged in books on social issues [9] and on the practice of law [10].

Those early studies with Mind Genomics revealed that it was quite straightforward and easy to discover how people thought about themselves regarding health and medical experiences, and what would be good language to use. Those topics and discoveries, done by inexperienced young researchers, revealed how easy it was to understand the mind of people regarding health. When the same science was put into the hands of the nurse in charge of hospital discharge for congestive heart failure, the science was able to identify the mind-sets of CHF patients, and prescribe what to say upon discharge, resulting in a large decrease in within 30-day readmission’s [11]. The same approach was used some years later to understand what to say to a low-income catchment area near Philadelphia to encourage colonoscopies, an effort which doubled the number of colonoscopies simply by knowing what to say to people about the topic [12]. One of the stumbling blocks is the need to create questions and answers, and then use combinations of answers in the actual Mind Genomics study/experiment. The study can be only as good as the questions. When the researcher can ask good questions, and create meaningful answers, the Mind Genomics process works well. Often, however, the prospect of creating a set of questions and then answers comes with the daunting prospect of having to think in ways that were never part of education. People can answer questions; we are taught that in school, and it is drilled into the mind of the student. It is the framing of good questions, however, which is the problem. Students are not taught to think critically, to pose a series of questions in a way which drives understanding. One consequence of this weakness in critical thinking affects Mind Genomics. The prospective user is intimidated by the prospect of coming up with a set of four questions, and then coming up with answers to the questions. The prospect is often so anxiety-provoking as to abort the process in the beginning, as the prospective researcher figuratively throws up her or his hands, and in fruition simply aborts the effort. AI, artificial intelligence, is creating an entirely new opportunity for Mind Genomics in wellness and illness, by providing a way to obtain questions and answers in an almost automatic fashion. The use of AI to obtain these questions will be explained in this paper, dealing with the interaction of a doctor and a diabetic patient. The specific topic chosen is: I am a doctor who wants to counsel a difficult diabetic patient who does not want to change her diet plan and wants herbal remedies. The remainder of this paper presents the results of a small-scale study with 50 respondents, medical students from the clinic of Dr. Rizwan Hameed in Brooklyn, NY. The paper shows the depth of information provided by the Mind Genomics approach, information about the granularity of experience of a doctor with a patience regarding a specific condition. It is important to emphasize here the notion of granularity of experience. Rather than looking for broad findings to confirm or falsify a hypothesis in the manner of today’s science, the Mind Geonomics world view is that taken grounded theory. That is, the science evaluates what exists, that which manifests, so in an organized, structured, yet more or less realistic format. The output provides clear information about the mind as it grapples with an everyday issue in the world of medicine, but also in the world of ordinary people faced with a medical decision.

Creating the Ideas Book: AI-generated Questions and Answers

Mind Genomics as presented to the user in the ‘BimiLeap’ app (www.bimileap.com) provides a templated, almost scripted set of steps by which the researcher can begin with virtually no knowledge about a topic yet proceed within 30-60 minutes to understand a topic in depth through the use of artificial intelligence. Figure 1 and Table 1 present the steps, and some output. The Mind Genomics study begins with the selection of a study name (Figure 1, Panel A). The study name should be short. Again, and again novice researchers find it hard to give the study a short name, often because they have been so conditioned to confuse the topic with the method that thy lose sight of the simple overarching topic. The study here is ‘Diabetes’. It comes as a surprise to many novice users that the short name is correct to begin. So many of the users feel compelled to expand the name to the actual study, creating a paragraph out of a word. This comment, while not germane to the actual study, is a cautionary word to the research to keep things simple and focused. The second stage in the Mind Genomics study is to develop four questions or categories of issues, related to the topic, and which ‘tell a story.’ The requirement of ‘story telling’ is not fixed in stone, but the combination of questions should provide different aspects of the general topic. Figure 2, Panel 2, shows the second screen of the BimiLeap program. The screen is empty. Although it might not seem to be daunting, viz., to create four questions which ‘tell a story’, it is at this point that many researchers or want-to-be researchers are gripped with discomfort. In the past, quite a number of budding researchers, as well as a number of professionals, have created an account, logged into their account, named a study, and then given up when confronted with the requirement to create four questions. It was in answer to this need that Dr. Judith Moskowitz Kunstadt, sister of author HRM and herself a child psychologist, suggested that this ‘stumbling block’ might be addressed by providing a guide to creating questions. Author Rappaport, in turn, suggested a pre-set list of questions as a tutorial. Both were meaningful, but during the beginning of 2023, AI emerged in the form of Chat GPT, which allowed the researcher to query the AI. The AI would return answers. The focus of AI in Mind Genomics is to provide questions to the researcher, rather than factual answers. Figure 1 (Panel C) shows the request by BimiLeap for the researcher to provide a ‘squib’ or short description of what is desired. Figure 1 (Panel D) shows four questions which emerge from the AI.

FIG 1

Figure 1: The set-up sets of BimiLeap. Panel A shows the choice of name. Panel B shows the request for four questions which tell a story, and the option to use Idea Coach. Panel C shows the box where the researcher enters a description of the topic to prompt the AI-driven Idea Coach. Panel D shows four questions provided by Idea Coach but edited by the researcher afterwards.

Table 1: Results from the first iteration of Idea Coach to answer the question put into the ‘squib’

TAB 1(1)

TAB 1(2)

TAB 1(3)

When looking at the four questions, it is important to keep in mind that the use of AI is to suggest topics. A confident researcher could do equally well. The role of AI here is to give some ‘tutoring’ or ‘coaching’ to the diffident respondent. In Table 1 we will see the nature of th questions returned by the AI.

Table 1 shows the first set of results from Idea Coach. The top (section A) shows the 15 questions from the first iteration (Results 1). The topic as written in the box for Idea Coach was: : I am a doctor who wants to counsel a difficult diabetic patient who does not want to change her diet plan and wants herbal remedies.

Idea Coach begins by returning 15 questions. These questions, or indeed any set of 1-4 can be selected and inserted into the four question slots shown in Figure 1, Panel D. Once in the panel, the questions can be edited by the researcher, usually to change the question from a ‘yes/no’ or a ‘list’ to one which is more conversational, requiring a more elaborate, evocative answers.

The researcher may return to the Idea Coach, rerun the Idea Coach with the same ‘squib’, or even edit the squib to produce a better question. Idea Coach has been developed to allow the researcher a great deal of latitude in exploring different types of questions. Often the researcher uses Idea Coach to create a number of such sets of questions, because of the additional information and ‘analyses’ provided by Idea Coach when it summarizes each set of 15 questions. In other words, the material provided in Table 1 is provided for the next set of 15 questions. Finally, the questions in subsequent runs of Idea Coach with the same ‘squib’ may generate some repeating questions. Each run of Idea Coach is complete unto itself.

The Idea Coach returns with a set of analyses, as follows:

  • Topic Questions. These are the questions themselves, in the form of questions
  • Key Ideas: These the are questions, but in the form of an idea, rather than a question
  • Themes: The AI embedded in Idea Coach attempts to summarize the 15 questions or ideas into a limited group of more general ideas.
  • Perspectives: The AI now attempts to move from themes to positive versus negative points of view about the themes
  • What is missing: The AI now considers the topic once again, looking for issues that may have been ignored in the body of the 15 questions. Note that each of the subsequent reruns of the Idea Coach to create questions may come up with these missing ideas, but there is no causal connection. AI does not ‘learn’ from one creation of 15 questions to the next creation of 15 questions. Every effort is expended to keep the AI efforts independent from one iteration to the next.
  • Alternative viewpoints: AI now attempts to move to the other spectrum, to the opposite point of view, and explore those.
  • Interested audiences to the ideas created by the Idea Coach
  • Opposing audiences to the ideas created by the Idea Coach
  • Innovations: New ideas suggested for products and services from the questions and ideas presented in this run of 15 questions.
  • Creating Answers to Questions Using AI

    Once the researcher has created the set of four questions, with or without the help of AI-driven Idea Coach, it is time to create the answers or ‘elements’, four for each question. It will be combinations of these answers which will constitute the test stimuli, the so-called vignettes or combinations of answers. In the actual evaluation done by the respondents, the respondent will see only unconnected combinations of answers. Figure 2 shows the second section of the study, where the question is presented at the top, and the research or Idea Coach is requested to present four answers. Figure 2 Panel A shows the request for four answers. Figure 2 Panel B shows the answers that were selected by the research, and perhaps edited manually to make the answer easier when the answer in embedded into the test vignette.

    FIG 2

    Figure 2: Panel A: The first question, and the request for Idea Coach. The question has been modified so that Idea Coach will return with a short answer. Panel B: The four answers returned by Idea Coach and modified slightly by the researcher.

    It is important, therefore, that the answers be both relevant, as well as paint a word picture through a phrase. For this reason, the Idea Coach one again provides the question, then 15 answers. The researcher may repeat the Idea Coach, indeed as many times as desired. Each repetition generates 15 answers. The researcher must select a total of four answers, and in free to edit the answers to make the answers seem less like a list, and more like a stand-alone description.

    The Idea Coach once again stores each iteration, allows the researcher to edit the answer, and even allows the researcher to go back and edit the question to instruct the Idea Coach to focus more on expanding the answer. In the end, however be, it is the researcher who chooses the answers, edits the answers, even edits the question to be more general or to move to a different ‘angle’. Idea Coach returns with one page for each iteration of answers for each question. Thus, Idea Coach generates a minimum of four pages of results when Idea Coach is used once for each question but could generate 20 pages of answer when Idea Coach is applied five times for each question.

    Finally, as was the case with the questions, Idea Coach provides additional AI summarization, synthesis, and exploration for each page. At the end of the creation of the answers, when all have been selected, and the researcher moves to the next step, the BimiLeap program returns the now-complete Idea Book to the research in the form of an Excel file. Each page or each tab of the Idea Book has the squib or the specific question on topic, followed by the AI analysis. The book can be quite large. For example, if the researcher were to use Idea Coach five times for the squib and each of the four questions, Idea Coach would with return with 25 pages of results, one per page or tab, with page capturing the output from AI as well as the AI summarization of the suggested questions or answers.

    Once the researcher has selected the elements for the study, the BimiLeap program moves to the orientation and the rating scale. Figure 3 shows the orientation (Panel A) and the rating scale (Panel). The rating scale shown below is a minimal scale, with very little information presented to the respondent about the purpose of the study. This minimalist approach is adopted to allow the elements, the specific phrases, to convey the information. Any additional information presented in the respondent orientation ends up weakening the contribution of the actual elements.

    FIG 3

    Figure 3: Respondent orientation (Panel A), and anchored rating scale (Panel B)

    The five scale points are labelled. Close inspection of the questions show that there are two dimensions. The first dimension of the scale is the respondent’s own feeling, whether that be like it or don’t like it, respectively. The second dimension of the scale is what the researcher thinks the rating will be as assigned by the respondent. Again, there are two options, like it or don’t like. The actual scale seems daunting at first, and indeed professionals often complain that they cannot make sense of the scale. Even worse, often the respondent feels that the two dimensions interfere with each other, and in frustration these professionals simply stop participating. Although disappointing, the response of professionals is understandable. They are trying to ‘assign the right answer’ and find rating scale hard to ‘game’.

    Rating question: Please select how you feel

    1=I don’t like it and the patient does not like it

    2=I don’t like it but the patient is ok with it

    3=I can’t answer

    4=I am ok with it but the patient is not ok

    5=We both are ok with it

    Table 2 shows the actual information about the study, taken from the information used when the researcher set up the study. The study set up enables the researcher to obtain a great deal of additional information about the respondent by means of the preliminary questions, also known as the self-profiling classification questions. The BimiLeap program automatically collects information on the respondent’s age and gender (not shown in Table 2). In addition, the program allows the researcher to ask up to eight additional questions, and for each question allow up to eight answers. The preliminary questions in Table 2 show the types of information that can be obtained from the study.

    Table 2: Study information obtained from the set-up, as well as the number of respondents who completed the study

    TAB 2

    Launching the Study and the Respondent Experience

    Once the researcher has finished setting up the study and previewing it, the researcher launches the study. The actual Mind Genomics study is completed on the internet. The participants receive an invitation to the site, log in to the site. The BimiLeap program provides a number of ways to acquire the respondents, as shown in Figure 4. These range from having the BimiLeap program allow the researcher to tailor a panel from various sets of qualifications, or to have the BimiLeap representative create the panel. Other ways include working with a different on-line panel provider instead of Luc.id, Inc., or sourcing the respondents oneself. It is this last option that was selected by the researchers. The respondents were young medical students, interns, and residents associated with the clinic of Dr. Riswan Hameed in Brooklyn, NY, USA, as well as fellow medical professionals of the respondents scattered around the world. All respondents participated voluntarily. The BimiLeap program is set up to preserve respondent confidentiality. No personal identifying information is kept as part of the study. When private information is obtained, it is usually in the form of general questions in the self-profiling classification, but that information does not suffice to reveal respondent identity.

    FIG 4

    Figure 4: Sourcing options for respondents

    Once the respondent agrees to participate, the study begins. The respondent reads the very short introduction, and then proceeds to the self-profiling classification. To keep the appearance spare and ‘clean’, the self-profiling classification questionnaire comprises a pull-down menu, shown in Figure 5. The respondent pressed the check button, and the appropriate question drops down, along with the answer.

    FIG 5

    Figure 5: The self-profiling classification, completed by the respondent at the start of the study. The classification comprises a set of pull-down questions.

    Rather than giving each respondent a set of 16 phrases, the four sets of answers to the four questions, Mind Genomics creates small, easy-to read s/. The basic experimental design used by Mind Genomics is a simple 4 variable x 4 level main effects design. The design comprising 16 elements generates 24 combinations. Each combination comprises a minimum of two elements or answers from (different) questions, and a maximum of four elements or answer from (different) questions. No question ever contributes more than one answer or element to a vignette. However, the underlying design ensures that quite a number of the vignettes are absent from one element or answer form a question, and some vignettes are absent two elements or answers from two questions.

    The experimental design ensures that each of the 16 elements or answers appears in a statistically independent fashion. This will become important when the data are submitted to OLS (ordinary least-squares) regression analysis to link together the elements and the responses. Furthermore, the combinations are not all complete, allowing the researcher to use the regression analysis to estimate the absolute level of contribution of the elements to the ratings [13]. This will be discussed below.

    A continuing issue in consumer researcher is the implicit belief that the test is being conducted with the stimuli that are believed to be important. The reality is that when the researcher tests combinations of answers, it is not clear that these are the appropriate combinations to test. The researcher may end up testing these combinations in order to reach closure, and get the study done. Such a requirement means that the test stimuli, the vignettes, end up being the ‘best guesses’ about what to test.

    The Mind Genomics system permuted the combination of 24 vignettes creating new combinations with the same mathematical properties. All that has changed is that the combinations change, but the property of statistical independence is maintained, along with the property that each vignette has at most one answer from a question. This approach, the permuted experimental design [14] ends up allowing the researcher to have each respondent test a different set of vignettes, but at the same tie a set of vignettes precisely designed for OLS regression at the individual respondent level.

    Figure 6 shows a test combination that was evaluated by the respondent. The question and rating scale are at the top. Below, and indented are the elements as prescribed by the underlying experimental design. The elements are simply presented in unconnected form. No effort is made to present a felicitous, well-crafted combination. Rather, the objective is to present the respondent with the necessary information in a simplistic manner. Respondents move through these vignettes quite quickly, ‘grazing’ for information in the manner called by economic Daniel Kahneman as System 1. The word ‘graze’ is particularly appropriate here. Rather than forcing the respondent to adopt an intellectualized, judgment approach, the Mind Genomics system seemingly ‘throws’ the information at the respondent in a manner reminiscent of daily life. It is left to the mind of the respondent to process the information and assign a rating.

    FIG 6

    Figure 6: Example of a test vignette evaluated by the respondent

    It is worth noting here that all too often professionals attempt to be analytical in the evaluation of these vignettes, a behavior which ends up being frustrating both for them and for the researcher. The professionals often try to ‘answer correctly,’ looking for underlying patterns to guide. All too often, the respondents get angry, irritated, refuse to participate, or simple complain at the end of the evaluation. Although the data ends up being quite information, especially after the respondents are clustered or segments by the pattern of their responses, many of the critics of Mind Genomics simply reject the system as being, in the words of Harvard’s legendary psychologist, William James, a ‘blooming, buzzing confusion.’ Nothing could be further from the truth, as will be shown below, especially once the clustering is done.

    Uncovering Patterns – How Elements Drive Responses

    The objective of Mind Genomics is to uncover patterns in daily life. The test stimuli are the different vignettes, 24×50 or 1200 mostly different vignettes across the 50 respondents, with each respondent evaluating 24 combinations, and most combinations different from each other as a result of the deliberate permutation strategy. The rating scale, however, is not simple, but rather asks two questions, namely how does the medical specialist feel about the vignette in relation to diabetes management, and how does the medical specialist think the patient will feel about the vignette in relation to diabetes management. There are two answers, OK and not OK. (Note the use of the colloquial, which in fact is the lingua franca of the everyday).

    The choice of a ‘two-faceted’ scale is deliberate. The single scale allows the researcher to probe how the medical specialists feels. There are really two scales here, a scale for how the medical professional feels (ok vs. not ok), and for how the medical professional thinks the patient will react (ok vs. not ok).

    The easiest way to deal with this data is to create five scales by simple transformation:

    Professional OK Ratings 5 and 4 transformed to 100, ratings 3, 2 and 1 transformed to 0

    Professional Not OK Ratings 1,2 transformed to 100, ratings 3,4, and 5 transformed to 0

    Patient OK Ratings 5 and 2 transformed to 100, ratings 4,3 and 1 transformed to 0

    Patient Not OK Ratings 1 and 4 transformed to 100, ratings 2,3,and 5 transformed to 0

    I can’t answer Rating 3 transformed to 100, ratings 1,2,4 and 5 transformed to 0

    To all the transformed variables a vanishingly small random umber is added. This is a prophylactic step to ensure that all of the newly transformed binary variables exhibit some minimal variability, allowing the ordinary least-squares regression to work.

    Once the transformation is complete, the five newly created variables can be related to the presence/absence of the 16 elements by means of a simple linear equation:

    Binary Dependent Variable = k1(A1) + k2(A2).. k16(D4)

    The database comprises columns which ‘code’ the structure of the vignette. Each of the 16 columns is reserved for one of the 16 elements. When the element or message appears in the vignette, dictated by the underlying experimental design, the value is ‘1’ for that element and that vignette. When the element or messages does not appear in the vignette, again dictated by the underlying experimental design, the value is ‘0’. The coding method is called ‘dummy variable’ coding because all we know about the variable is that it either appears in the vignette or does not appear in the vignette [15].

    The regression analysis is run five times, using the equation above. The regression model is estimated without an additive constant, so that all of the variation can be traced to the contribution of the 16 elements. The experimental design ensures that all 16 elements are statistically independent of each other, so that one can compute ratios of coefficients in a meaningful manner.

    The interpretation of the coefficients is straightforward, and easiest to explain by a simple example. A coefficient of +20 for an element means that when the element is inserted into a vignette, there is an increase of 20% in the likelihood that the vignette will reach the value of 100.

    Before looking at the results for the total panel for the newly created binary scales, it is helpful to anchor the performance. A coefficient of +4 or lower is simply not shown. It is irrelevant as a driver of the specific binary variable. A coefficient of approximately +15 to +16 approaches statistical significance. Important coefficients, however, move beyond simple statistical significance to much higher values, here +21 or higher.

    Tables 3 and 4 show the coefficients for the total panel. The five columns show the newly created binary variables. The numbers in the body of Table 4 are the coefficients. Coefficients less than 5 are simply not shown. Coefficients 21 or higher are shown in shaded cells. The most important outcome from Table 4 are that no elements perform strongly for any newly created dependent variable. There are some which are close, but none reach the imposed threshold of a coefficient of 21 or higher.

    Table 3: Coefficients for models relating the presence/absence of elements to the newly created binary variables

    TAB 3

    Table 4: Coefficients for models relating the presence/absence of elements to the Binary dependent variable=R54 (Medical professional says OK, medical professional believes patient would say ok). The table shows the total panel, and then the coefficients divided by the types of patients the respondent dislikes versus the types of patients the respondent likes.

    TAB 4

    The analysis now moves to dividing the respondents by the type of patients they dislike strongly, and by the type of patient they like stray. The coefficients appear in Table 5. Once again, the elements with coefficients lower than 5 are shown with blank cells, and the elements with strong coefficients greater than or equal to 21 are shown with shaded cells. There are five elements which perform strongly in the different breakouts of respondents. Although these are strong performing elements, the reality is that there is no clear pattern. Were we not to ‘know’ the meaning of the elements, we would say that knowing what the medical professional likes and dislikes gives us a few stronger opinions, but that is all. The reason we see that there is no pattern comes from the reality that the elements have cognitive meaning, and thus we can see similarities when they exist, or at least superficial similarities. The use of test stimuli with deep cognitive meaning, our elements. Allows us this ability to reject random strong performing elements because there is no apparent pattern emerging, despite that strong performance.

    Table 5: Coefficients for models relating the presence/absence of elements to the Binary dependent variable=R54 (Medical professional says OK, medical professional believes patient would say ok). The table shows the total panel, and then the coefficients divided by two and then three emergent mind-sets.

    TAB 5

    Uncovering New-to-the-World ‘Mind-Sets’

    Mind Genomics adds value to our understanding by dividing the respondents into groups based upon the pattern of their coefficients. Rather than assuming that respondents who seem to think alike when they describe themselves (Table 5), Mind Genomics looks for strong performing, interpretable groups of people in the population, these groups emerging from how the people respondent to a specific set of granular messages. These are the so-called ‘mind-sets’. Mind-sets are defined as homogeneous groups of individuals, the homogeneity limited to a specific and concrete situation. Mind-sets emerge as statistically coherent groups for the situation, but people in the same mind-set for one situation may be in different mind-sets for another situation.

    Creating the mind-sets is straightforward, to a great extent the result of creating the vignettes according to an underlying experimental design, and then permuting the design. Each respondent thus ends up evaluating an ‘appropriate’ but random portion of the design space. The word ‘appropriate’ is used in view of the subsequent analysis, which creates an individual-level model for each respondent. Although the respondents each evaluated different sets of combinations, their individual sets of ratings can be submitted to the regression analysis described above. The result for this study is 50 rows of coefficients, one for each respondent. Those 50 rows can be clustered into a small number of groups, such as two or three groups, not based upon who the respondent is, but rather on a measure of similarity between the rows, or more correctly, a measure of dissimilarity between pairs of rows. Rows whose set of 16 coefficients move in ‘opposite directions’ suggest that the respondents see this particular world of diabetics n different ways. Rows who set of 16 coefficients move in the same way suggest the respondents in this particular world of diabetics see the world in the same way.

    The computational approach is known as k-means clustering [16]. The clustering ends up dividing the group of 50 respondents into two groups, and then into three groups. These groups are ‘mind-sets.’ Table 6 shows the coefficients for the Total Panel, then for the two miond0-sets (viz., two clusters), and then for the three mind-sets (viz., three clusters).

    Table 6: The underlying ‘stories’ (viz., interpretations) of the strong performing elements for each mind-set

    TAB 6(1)

    TAB 6(2)

    TAB 6(3)

    TAB 6(4)

    Jumping out of the table is the far greater number of strong performing elements for the three-cluster solution. Not only are there’re more strong performing elements of coefficient 21 a d higher, but a story begins to emerge. The story emerges from the data and is not imposed. It is the meanings of the ‘cognitively rich’ elements which tell the stories:

    Mind-set 1: The medical professional focuses on eating

    The patient feels overwhelmed by the idea of changing her eating habits.

    Our patient’s current diet plan focuses on balanced meals with appropriate portion sizes.

    She believes her current diet is sufficient and sees no need for modifications.

    Mind-Set 2: The medical professional wants to educate the patient about herbal remedies.

    An online course or video was provided to educate the patient about herbal remedies and their effects on diabetes.

    Infographics or visual aids were utilized to convey the potential risks and benefits of herbal remedies.

    The patient attended a workshop or seminar dedicated to informing them about the risks and benefits of herbal remedies.

    A healthcare professional explained the potential risks and benefits of herbal remedies in diabetes management.

    Mind-Set 3: The medical professional is sensitive to the patient’s fear of missing out on favorite foods.

    Emotional attachment to comfort foods.

    AI can be used to summarize the data from the different groups. Table 7 presents the AI analysis for each of the three mind-sets, from the three-mind-set solution. Once again the researcher should winnow down the large amount of data produced by Mind Genomics. Rather than trying to synthesize a story using all the elements, a story based upon the coefficients, the Mind Genomics program uses only those elements with coefficients of 21 or higher. There are far fewer elements to generate the pattern. The AI creates its own story from the data, but at least that story is grounded in the data from strong performers only. Table 8 shows the answers to the queries put to AI, in the effort to discern the ‘story’ in the pattern generated by the strong performing elements.

    Table 7: Calculation of the IDT=Index of Divergent Thought, which measures the strength of the coefficients, and thus the strength of the study.

    TAB 7

    Gamifying the Process –‘How We Did We Do, and How Much Better Can We Do?’

    Mind Genomics is a science emerging only in recent years. With the ease, rapidly, and low cost of doing these experiments, the natural question is to ask, ‘how good are the data?’ After all, when a study can be designed, executed and analyzed in a matter of hours, with very low cost, by virtually anyone, how does one differentiate between good science and poor science? One cannot see the researcher. It might be possible for a researcher to offer an ‘oeuvre’ of work across several years, so that the overall quality of this oeuvre can be judged. But what about one-off studies which may be brilliant? Or, equally likely, maybe a simple waste. One way to assess quality is to look at the coefficients generated by the study. The vignettes are evaluated by people who cannot ‘guess’. When the coefficients are low, the coefficients are essentially ‘noise’. When the coefficients are consistently high, however, we must conclude that a meaningful pattern is emerging. Table 8 shows a way of estimating the performance of the elements. The calculations are simple. One divides the data into the six groups (total, two groups from the two-mind-set solution, three groups from the three-mind-set solution). Each has a relative base size, as Table 7 shows. The calculations show the progression to a single number, 50, which is the average squared coefficient. It is called the IDT, index of divergent thought. There are no norms for the IDT, at least not yet. When thousands of studies are done, there will be sufficient values for the IDT to be considered across topics, ages of researchers, and so forth. With this ability to ‘gamify’ the process, developing the IDT, one can imagine the competition among researchers. One potential of gamification is the ability to offer prizes to the highest-scoring studies in a topic presented as a challenge in a prize competition. The study here on diabetes is only one topic in diabetes. What might be the outcome if a ‘meaningful prize’ were to be offered for all studies having IDT values of 70 or higher, with additional incentive for studies with IDT values of 80 or higher. Such an approach done world-wide might well produce a plethora of new ideas.

    Assigning a New Person to a Mind-Set

    The final step in the analysis of these data creates a tool, a mind-set assigner, which enables the medical professional to assign a new person to one of the three mind-sets for this granular, relatively minor issue. A key benefit of the Mind Genomics project is the ability to do the research quickly and inexpensively. Yet, it is simply not realistic for a new person to have to go through the research protocol, evaluate 24 vignettes, and be assigned to a mind-set. The process would simply not work because there is no way to incorporate the data of this new respondent into the original data, rerun the data one again, this time with the 51st person and then re-discover the mind-sets anew.

    Figure 7 shows the system developed to assign a new respondent to a mind-set. This is called simply the mind-set assigner. The approach works with six questions, taken from the original study, and runs a Monte-Carlo c with the patterns of these six questions. The outcome is the selection of the proper six questions from the original study, and the assignment of each of the 64 possible response patterns to one of the three mid-sets.

    FIG 7

    Figure 7: The Mind-Set Assigner tool. Panel A shows the bookkeeping information, including the request for participation. Panel B shows additional ‘background questions’ requested of the respondent. Panel C show the actual se of six questions, and the two possible answers.

    The Mind Set assigner comprises three panels:

    Panel 7A shows the introduction as the respondent sees it. The introductions requests permission to acquire the data and presents the respondent with a variety of questions about background. All, some, or even just the permission itself can be asked. The researcher sets up the specific information desired.

    Panel 7B shows specific background questions that can be asked of the respondent. These questions are additional to the actual assigner tool. Often when one wishes to ‘type’ the larger population, the objective ay be to add in additional information about the individuals in the different mind-sets. Panel 7B allows the researcher to ask up to 16 additional questions, with up to four possible answers for each.

    Panel 7C shows the six questions in the mind-set assigner, these questions taken from the actual study. The questions can be slightly modified by the researcher, but good practice dictates that the questions be the same as the elements of the study. The order of the six questions is randomized from one respondent to the next. It is the pattern of responses which is used to assign the new person to one of the three mid-sets.

    It is worth noting that the researcher can do several studies, create mind-set assigning tools for each, and then combine these in a simple system allowing the research to ‘sequence the mind’ of the respondent.

    Discussion and Conclusions

    The Mind Genomics way of thinking, from conceptualizing a problem to providing a rapid and affordable experiment, offers science a new way to understand how people think. Researchers are accustomed to expensive, well-thought out, often laborious and time-consuming studies. One of the great problems today is the head on collision of the need to understand the person but the cost and time necessary to do so. So very often much of the research effort is spent getting the funding to do the research, and then cutting the problem down to a size where it can be solved. As a consequence, much of today’s research is done by committee, piecemeal, after inordinate wait, and only when the funding comes through. These are factors which act as a drag on our understanding of people, and our use of the data to improve the lives of people.

    The study reported here represents one simple project, readily done by one or a few researchers, at low cost. Beyond the benefits of speed and cost lie the potential to create a corpus of knowledge about people in their daily lives, how they react, and how they interact. Up to now there has been a dearth of knowledge about people from the point of view of their everyday lives, what they think, what they say, and how they should say it. The Mind Genomics project provides this corpus of knowledge in a scalable form, anywhere in the world, and at any time. One could imagine one of these studies for each country, for each topic area. The opportunity to create this database of the mind may now be a reality. This paper shows the tesserae, the pieces of that reality, for a specific, granular, almost minor topic. One need not ‘triage’ the research, at least for these types of topics. All the topics can be addressed. The vision of science driving a personalization of the medical experience, with better interactions, healthier populations, and improved economics, lies within reach [17].

    Acknowledgments

    The authors would like to thank Dr. Rizwan Hameed for the ongoing inspiration to pursue this work.

    References

    1. Tay SW, Ryan P, Ryan CA (2016) Systems 1 and 2 thinking processes and cognitive reflection testing in medical students. Canadian Medical Education. [crossref]
    2. Luce RD, Tukey JW (1964) Simultaneous conjoint measurement: A new type of fundamental measurement. Journal of Mathematical Psychology 1: 1-27.
    3. Stevens SS (1975) Psychophysics: An Introduction to its Perceptual, Neural and Social Prospects. New York, John Wiley.
    4. Moskowitz H, Beckley J, Adams J (2002) What makes people crave fast foods? Nutrition Today 37: 237-242.
    5. Drewnowski A, Moskowitz H, Reisner M, Krieger B (2010) Testing consumer perception of nutrient content claims using conjoint analysis. Public Health Nutrition.[crossref]
    6. Moskowitz H, Beckley J, Minkus-McKenn D (2004) Use of conjoint analysis to assess web-based communications on functional foods. Appetite. [crossref]
    7. Gabay G, Moskowitz HR (2019) “Are we there yet?” Mind-Genomics and data-driven personalized health plans. In: The Cross-Disciplinary Perspectives of Management: Challenges and Opportunities 7-28.
    8. Starke S, Gabay G, Zemel G, Gere, A, Sherman R, Moskowitz HR (2019) Frustration in seeking Information about health conditions and health insurance: Methodological presentation of a Mind Genomics cartography. Ageing Science and Mental Health Studies 3: 1-13.
    9. Moskowitz H, Kover A, Papajorgji P (eds.) (2022) (Applying Mind Genomics to Social Sciences. IGI Global.
    10. Moskowitz HR, Wren J, Papajorgji P (2020) Mind Genomics and the Law. LAP LAMBERT Academic Publishing.
    11. Gabay G, Moskowitz HR (2019) “Are we there yet?” Mind-Genomics and data-driven personalized health plans. In: The Cross-Disciplinary Perspectives of Management: Challenges and Opportunities 7-28.
    12. Oyalowo A, Forde KA, Lamanna A, Kochman ML (2022) Effect of patient-directed messaging on colorectal cancer screening: A randomized controlled trial. JAMA Network Open 5. [crossref]
    13. Craven BD, Islam SM (2011) Ordinary least-squares regression. The SAGE Dictionary of Quantitative Management Research 224-228.
    14. Gofman A, Moskowitz H (2010) Isomorphic permuted experimental designs and their application in. conjoint analysis. Journal of Sensory Studies 25: 127-145.
    15. Hardy MA (1993) Regression with Dummy Variables (Vol. 93) Sage.
    16. Ahmed M, Seraj R, Islam SMS (2020) The k-means algorithm: A comprehensive survey and performance evaluation. Electronics 9: 1295; https: //doi.org/10.3390/electronics9081295
    17. Smith LL, Lake NH, Simmons LA, Perlman A, Wroth S, Wolever RQ, et al. (2013) Integrative health coach training: a model for shifting the paradigm toward patient-centricity and meeting new national prevention goals. Global Advances in Health and Medicine. [crossref]
FIG 2

Communication Styles Regarding Child Obesity: Investigation of a Health and Communication Issue by a High School Student Researcher, Using Mind Genomics and Artificial Intelligence

DOI: 10.31038/MGSPE.2023313

Abstract

One hundred low-income respondents in New York City each evaluated 24 unique vignettes, combinations of 2-4 elements (messages). The vignettes were created according to a permuted experimental design, with each respondent evaluating full set of vignettes, allowing regression analysis to reveal the motivating power of each element, and k-means clustering to divide the 100 respondents into different groups, mind-sets, based upon the specific group of elements that were most motivating. The three emergent mind-sets were: MS1=Work on self and health; MS2=Set goals and structured reporting; MS3=Get family involved to focus on eating habits. To assign new individuals to a mind-set, the paper shows the construction and use of a PVI (personal viewpoint identifier) typing tool. The paper finishes with the use of artificial intelligence (AI) for three automated post-study applications; identify recurrent-themes in the data, suggest new areas of knowledge to pursue, and suggest new products and services for each mind-set.

Introduction

The world of 2023 is experiencing a rapidly growing epidemic, that of obesity, with innumerable consequences, diabetes the main source of worry, but many other diseases following behind [1,2]. One need not go through the litany of diseases, nor look for causes. There are many causes, a great number having to do with lifestyle alone with genetic proclivity [3,4]. The world of energy saving devices has made physical exercise into something often pursued specifically by regimented exercise, either alone, in a gym or with a personal trainer. To further complicate matters, the foods eaten are often simply not as healthy as they could be, perhaps because our lifestyle allows us to snack more than we should, on food, which is more delicious, but not healthful.

The literature is vast. One can find causes, report incidence of disease, create registries, attempt modifications. Much of the knowledge of what to do comes from the medical and the nutrition professionals. What happens, however, when we move from professionals to young people who explore obesity and the complex it comprehends. What more or what in general can we learn when we empower a young person to do the research, a person who is not yet jaded and hammered into conformity? What types of insights do we obtain? The Mind Genomics approach is a continuation of a stream of work using young minds to explore topics. What is presented here has already been used a number of times by elementary and middle school students, with significant new learning emerging from the process [5].

The approach of this paper is based on Mind Genomics, an emerging science of the ‘everyday’. The goal of Mind Genomics is to find out how people think about different aspects of ordinary life. The Mind Genomics studies works by presenting respondents with combinations of elements (messages about a topic), instructing the respondent to rate the combination, and deconstruct the ratings into the contributions of the different messages. The objective is to let the respondent evaluate almost realistic combinations of messages, a system which cannot be gamed, and which quickly reveals how the respondent thinks about the different aspects of a situation. Mind Genomics has a long history, beginning with conjoint measurement [6], moving to functional measurement [7] and finally to the form presented here [8,9]. Mind Genomics has already been used in many settings, ranging from marketing to social issues to health issues, to the law and beyond [10-14].

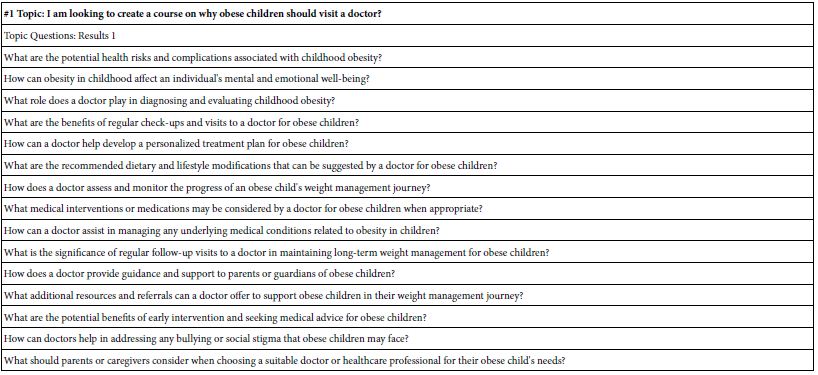
Part 1 – Searching for Questions, Answers, and Insights at the Initial Stage of Setting Up the Study

The Mind Genomics process is templated, with the website guiding the researcher through the different steps. The website itself is at www.BimiLeap.com. The first objective is to create the raw materials. This effort occurs only after the researcher creates the framework for the study, gives the study a name, selects the language for the prompts to the researcher, and finally agrees agree not to collect personal information unless knowingly provided by the respondent (viz. the survey-taker).

It is now time to create the raw materials. The raw materials for Mind Genomics are questions which tell a story, and then answers to those questions. The template for today’s Mind Genomics studies comprises four questions created by the researcher, and then four answers to each question. The questions will never be shown to the respondent, but the answers will be shown in combinations called vignettes.

When confronted with the Mind Genomics process, many researchers freeze, becoming nervous at the prospect of asking four questions which tell a story. Once the questions are asked, it becomes reasonably simple to provide answers. Despite the ability to provide answers, the nervousness of the researcher ends up being a major stumbling block hindering the adoption of Mind Genomics. The reality is that people are simply not educated in a way which encourages them to create questions and answers in the form of a narrative that can be used by researchers.

The idea Coach was invented in 2022 to circumvent the problem of the ‘stymied researcher’ the researcher who simply experiences too much fear and cannot move through that fear to produce the requisite questions and answers. Often after a few attempts the researcher become comfortable with the process of one question → multiple answers. The Idea Coach was created to help the novice advance to that stage.

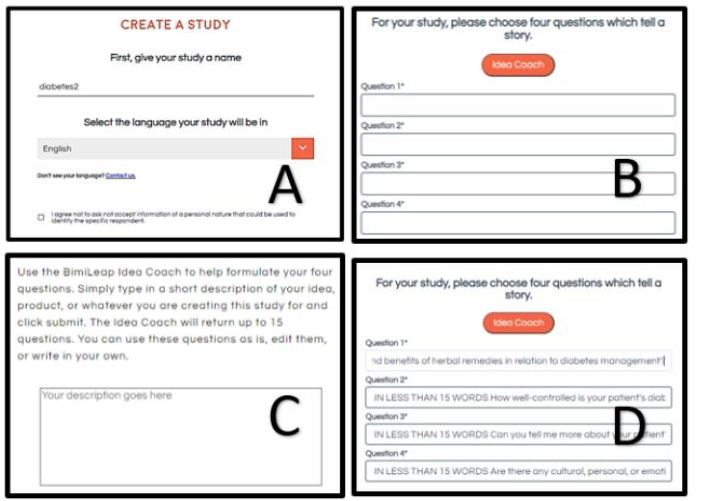
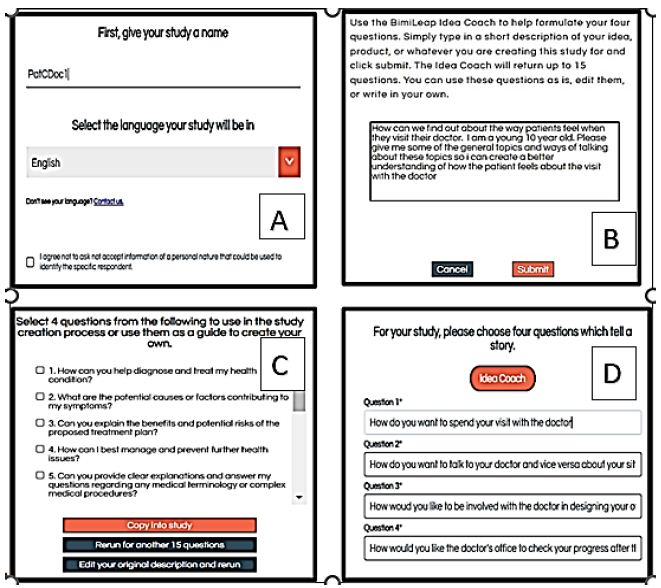
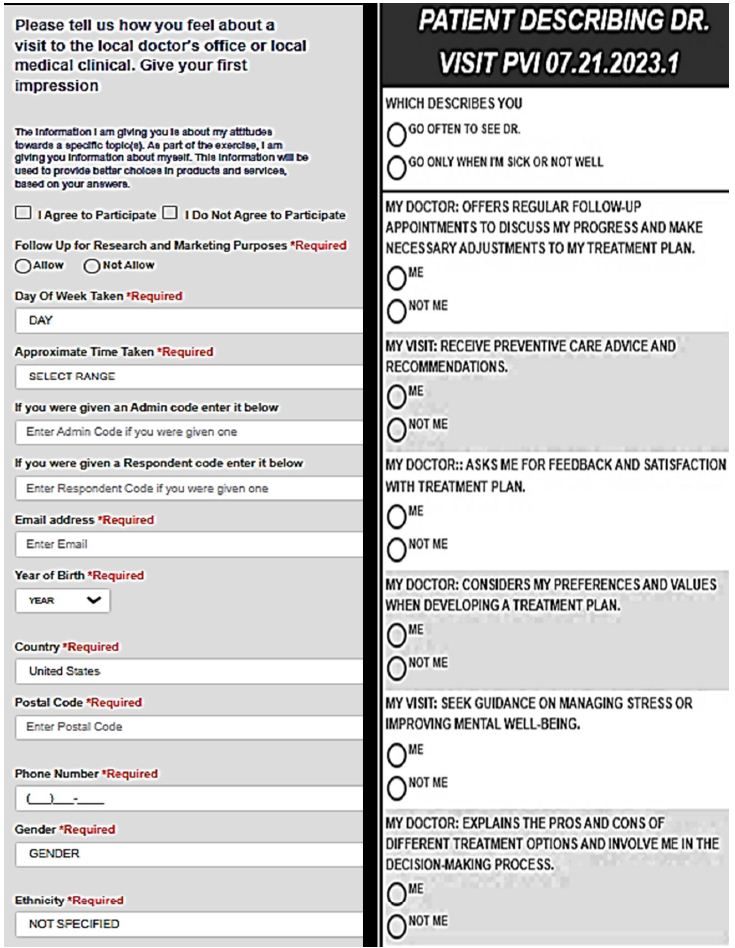
Figure 1 shows the screens from the study template requesting the four questions (A), the Idea Coach selected by the researcher (B), the computer screen showing the first few of the of 15 questions emerging from one request from the Idea Coach program within BimiLeap (C), and finally the four questions dropped into the template. The researcher can edit the questions to make it simpler for the Idea Coach. Table 1 shows the full text of each of the 15 questions generated by AI through Idea Coach.

FIG 1

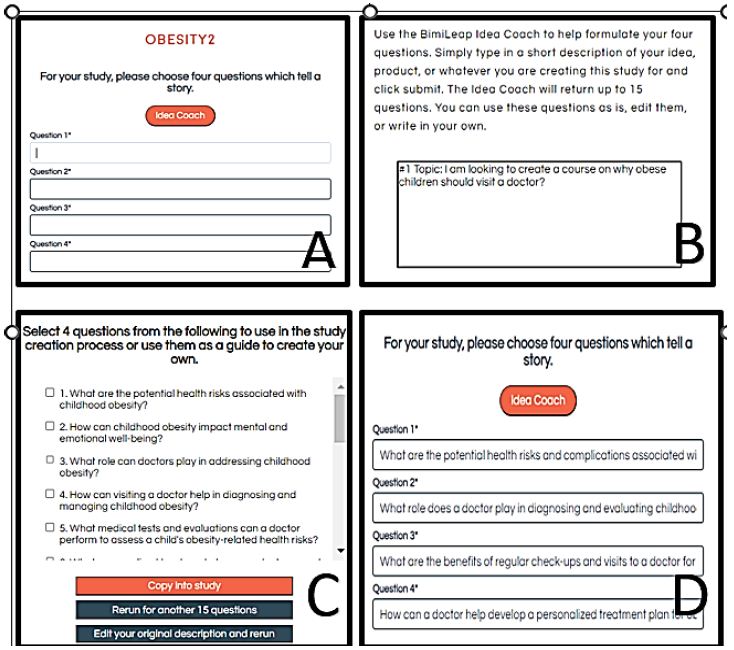
Figure 1: The request for four questions, the Mind Genomics Idea Coach, and the four questions which emerge

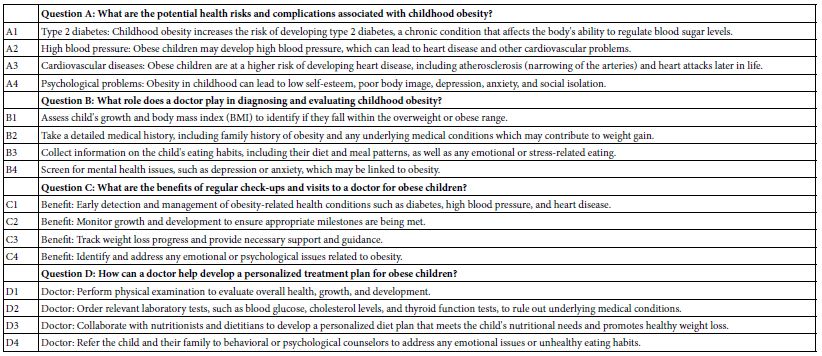
Table 1: The 15 questions generated by Idea Coach in its first pass. The 15 questions were generated in response to the paragraph written for Idea Coach in Figure 1, Panel B.

TAB 1
 

The Mind Genomics process continues with the creation of answers to each question, again by the AI-driven Idea Coach. Each iteration returns with 15 answers to a question, with an estimate of 15-30 seconds for the 15 answers to emerge. The answers are presented to the researcher, who can choose either to incorporate the answers into the template, or to request a re-run.

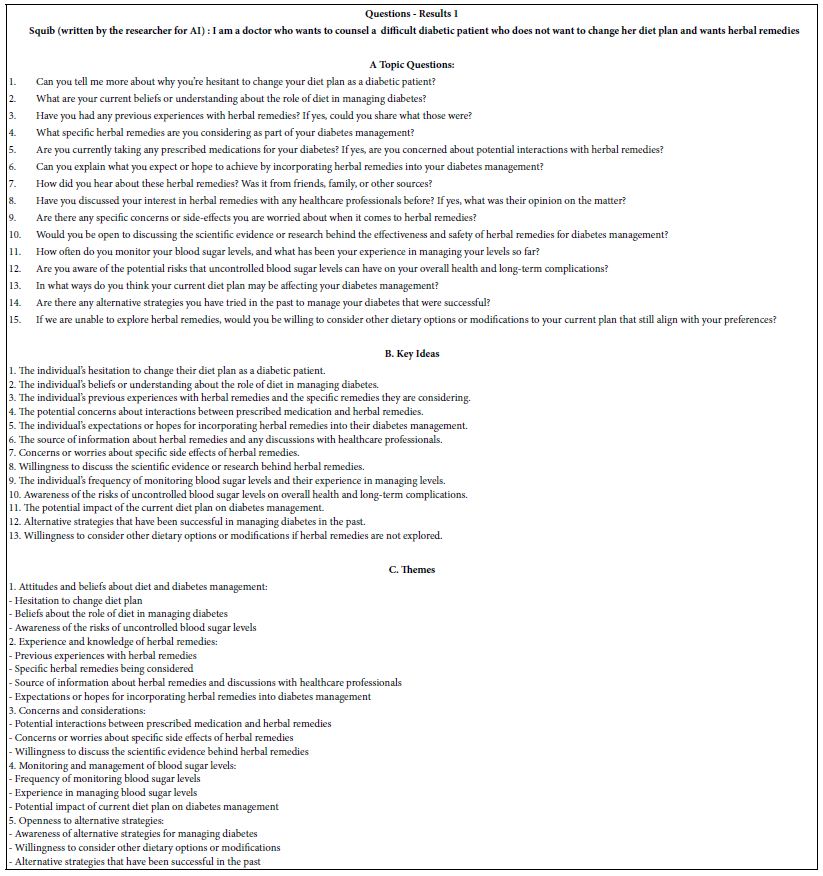
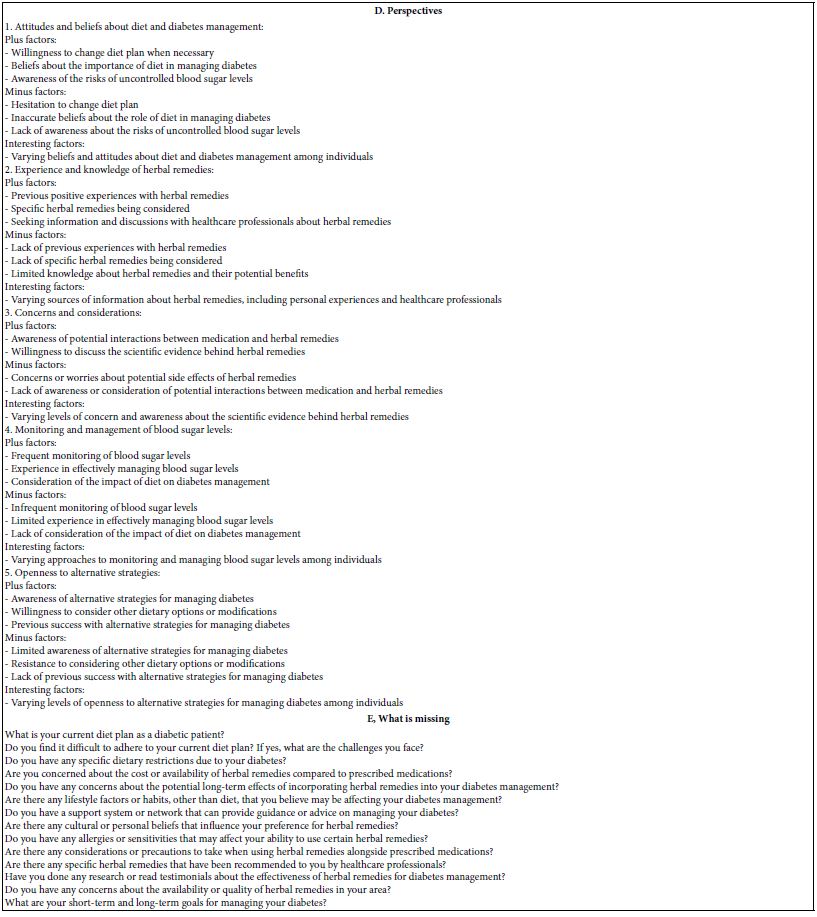
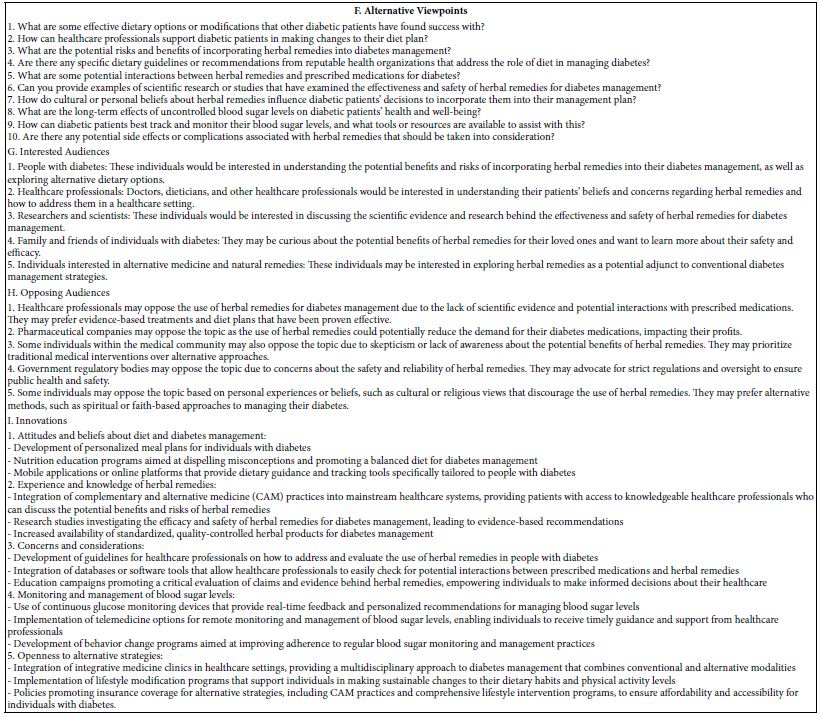
Note also that after the questions and answers have been presented to the respondent by Idea Coach, the BimiLeap program returns with the ‘Idea Book’, containing one page for each request for 15 questions, and one page for each request for 15 answers. Below the record of the questions and answers, the Idea Coach inserts the analysis by AI of additional understanding that the research can learn from those 15 questions or answers, the analysis done by having AI use a set of queries to summarize the questions or answers. Appendix 1 shows an example of this AI summarization and expansion of the information for the questions. The same work is done on each page, viz., for each request for questions, and for each request for answers.

Appendix 1 shows the set of questions returned by Idea Coach.

Appendix 2 shows the four sets of different answers

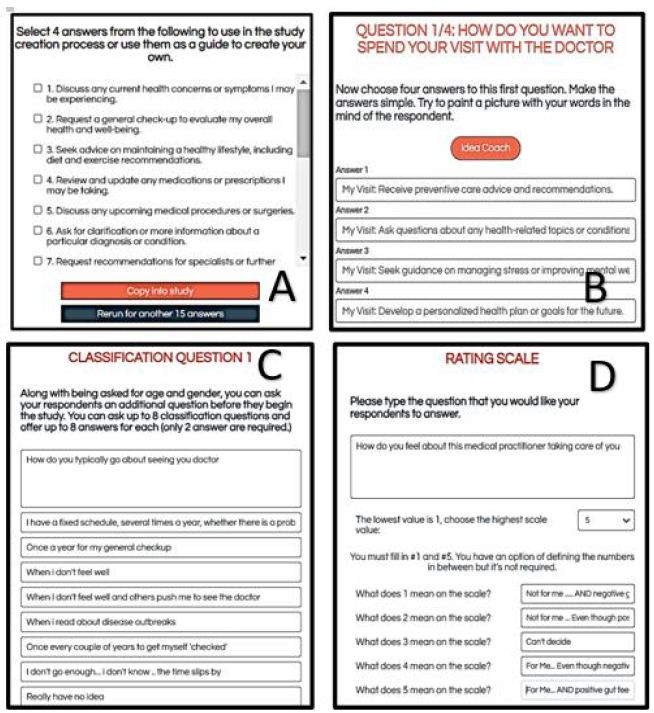
Figure 2 shows screenshots of the process, proceeding from the template with no answers to the question (Panel A), the Idea Coach Request (Panel B), the partial output of Idea Coach for that first iteration (Panel C), and the four final answers selected (Panel D). Although the researchers ran only one iteration and obtained the answers, as well as editing them before finalizing the answers, Idea Coach makes it easily to do iteration after iteration, enabling the researcher once again to have an AI-driven tutor become essentially ‘Socrates as a service.’

FIG 2

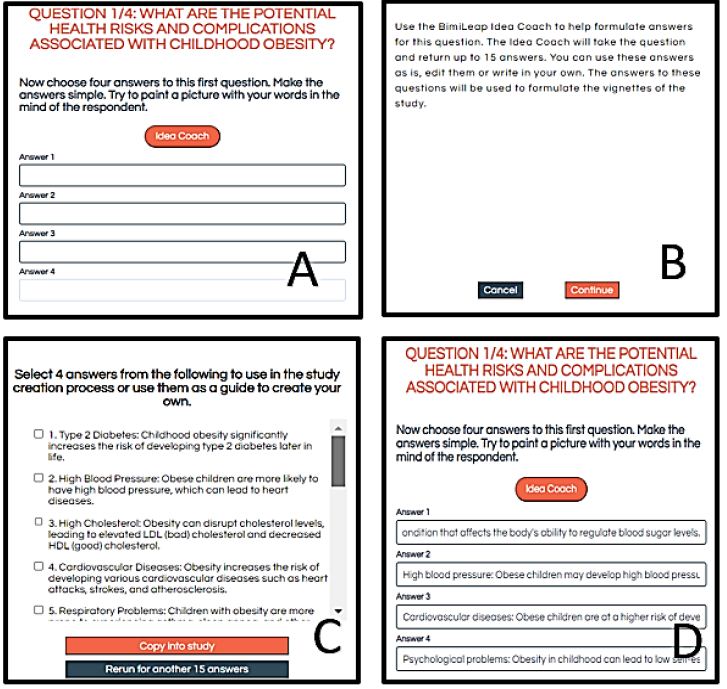
Figure 2: The template showing the request for four answers to the first question (Panel A), the Idea Coach which is either selected to skipped (Panel B), a set of prospective answers to question 1 returned by the Idea Coach (Panel C), and the four selected answers ‘dropped into’ the template.

It is important to keep in mind that this first step with Idea Coach becomes a teaching tool, viz., almost a Socratic tool. The researcher need not create the questions or the answers. The AI embedded in the BimiLeap program ends up providing questions and answers, each of which can be edited by the researcher. Table 2 presents the four questions and the four answers. Note that the answers have been edited for clarity by the researchers. The Mind Genomics template enables the researcher to edit or even entirely replace any question or answer that has been written by the researcher or by Idea Coach.

With the introduction of AI into the BimiLeap program in the form of Idea Coach, the AI has been given a new task, summarizing the different questions created in a single pass, or summarizing the 15 answers created in one pass to answer one question. Appendix 1 shows the AI summarization and expansion/interpretation of the 15 suggested questions for the first pass through Idea Coach, where the effort was to create four questions. (Note, the material returns in a separate book called the Idea Book. A researcher can run the effort many times, with each run creating a separate page of analysis and interpretation for the 15 questions generated by that pass.)

Running the Mind Genomics Study

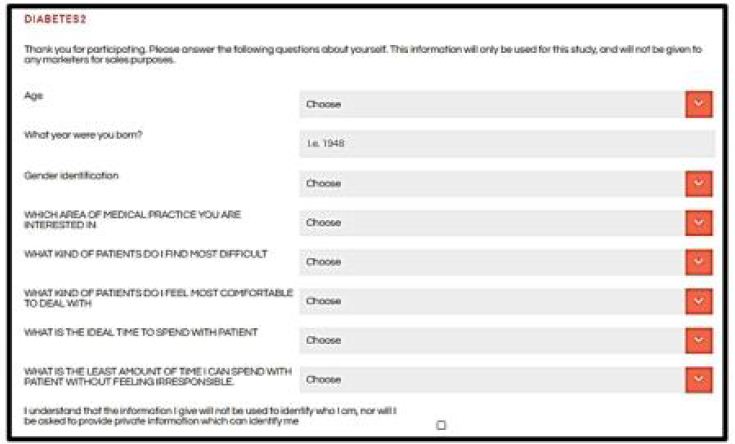
Figure 3 (Panel A) shows one of eight possible self-profiling questions chosen by the researcher. For each question the researcher may provide up to eight different answers but must have at least two. The respondent selects the most appropriate answer to each question. Not shown here are the questions of gender and age.

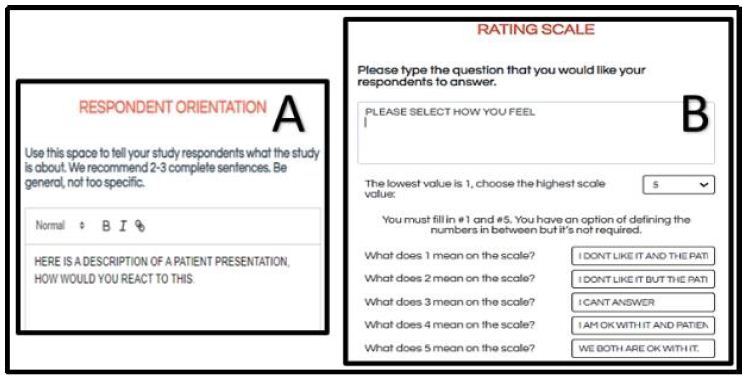
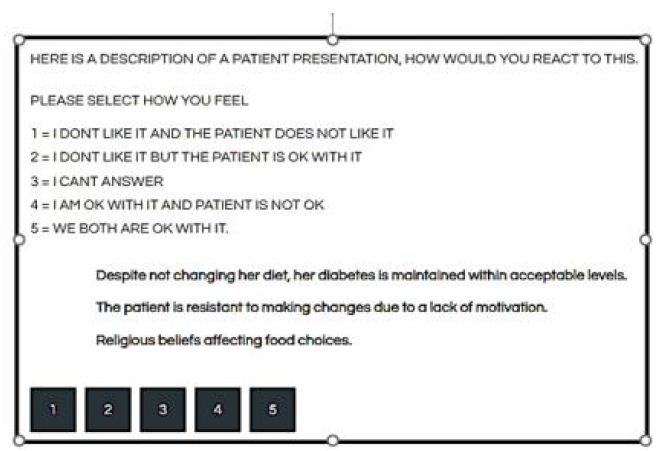
Figure 3 (Panel B) shows the very brief orientation screen shown to the respondent at the start of the study. The rationale for having a very short introduction, virtually a single sentence, is the desire to have the individual elements or messages generate the differences in the response. Where a specific frame of mind is desired, one with deeper knowledge of the topic, such as the background of a law or medical case, the orientation page can extend to half a page or more.

Figure 3 (Panel C) shows the rating question and the scale points. The scale is set up to be 5, 7 or 9 points. The researcher selects the anchors. The researcher is required to anchor the top and bottom of the scale but has the option to provide anchors for the other scale points.

Figure 3 (Panel D) shows the open-ended question, allowing the respondent to add additional reactions.

FIG 3

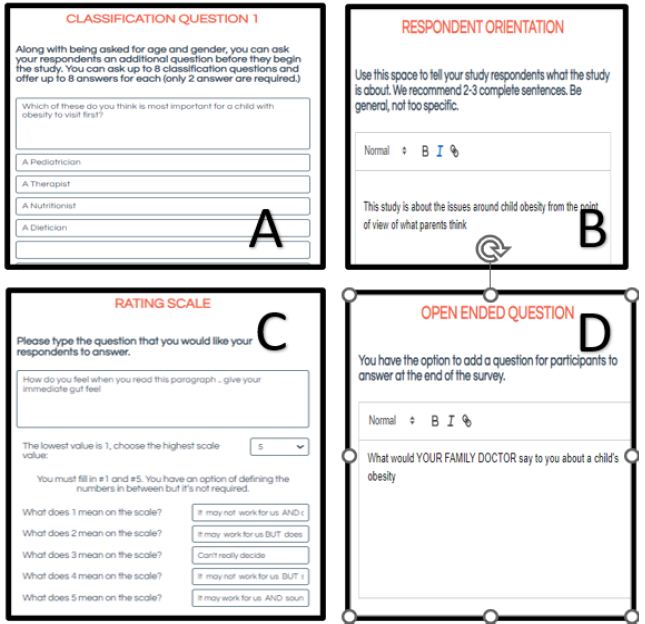
Figure 3: Additional study set-up screens. Panel A: Example of a self-profiling classification question. Panel B: Respondent orientation. Panel C: The rating scale and anchors. Panel D: Open-ended question.

Figure 4 shows two final screens in the set-up. Figure 4, Panel A shows the researcher’s final thoughts and key words. Mind Genomics studies are easy and quick to set-up. It is important to capture the thinking underlying the specific study, especially since a project might involve as many as 5-10 parallel studies, run at the same time, with different aspects covered by the various studies. It is always a good idea to record the momentary thinking underlying the specific study. The key words are also requested, with a minimum of one word required. The key words allow for database searches.

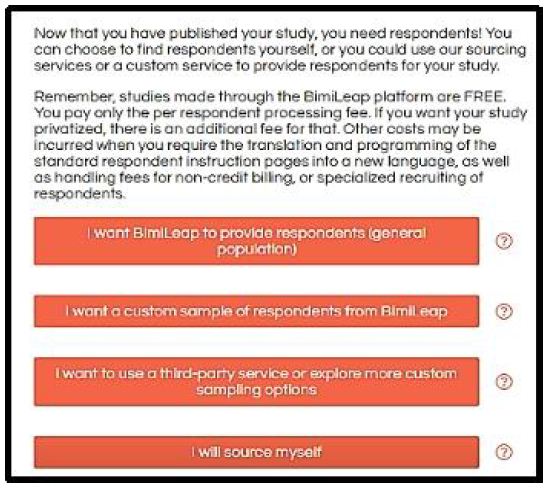
Figure 4, Panel B shows the request for panel sourcing. The researcher can choose from different sources, giving the researcher flexibility. When the researcher opts for the default provider, to provide the respondents, the researcher is led to the API for Luc.id Inc., a panel aggregator, and from there to the selection of respondents according to specific criteria. When the researcher wants to work with other panel providers or even source the respondents from a pool of specific individuals, the researcher chooses another option. The objective is to make respondent selection easier, driving the researcher to options which will greatly increase the likelihood of a successfully completed study, with the desired number of appropriate respondents.

FIG 4

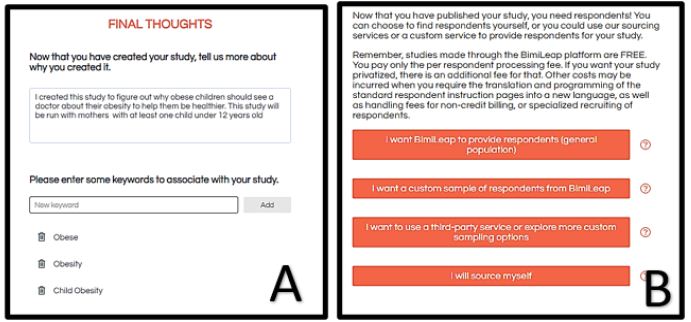
Figure 4: Final thoughts (Panel A), and sourcing the respondents (Panel B)

The Respondent Experience

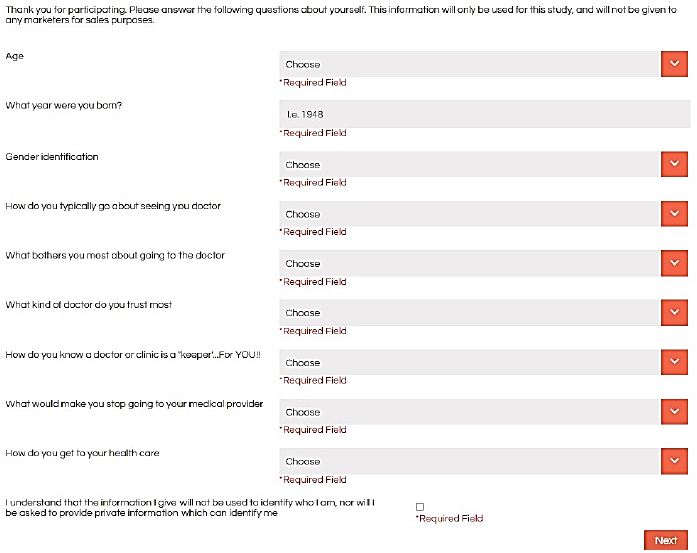
Once the study has been set up, and the financial aspects agreed upon (viz., platform charge and panelist recruitment fees) the respondents are invited to participate, usually by email. The respondents who agree to participate are led to the website which introduces the study through the short orientation (Figure 3, Panel B), and then proceed to the self-profiling classification (Figure 5). The self-profiling classification is presented as a pull-down menu, uncluttered and easy to complete.

FIG 5

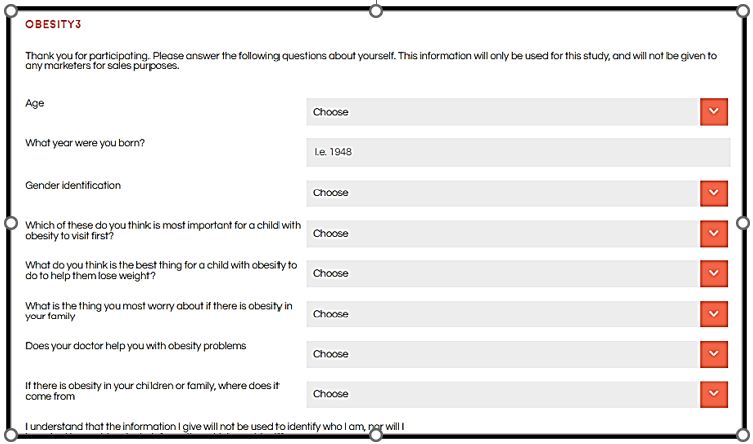
Figure 5: The screen showing the self-profiling classification for the study

The final steps are the presentation of the test vignettes (Figure 6), and the open-ended question (Figure 7). The test vignettes appear to be random combinations of elements, viz., answers to the question. Figure 6 shows a test vignette comprising the rating scale at the top, and the vignette in the middle. The respondent evaluates 24 unique vignettes, some having two elements, some having three elements, some having four elements. To the untutored eye, the 24 vignettes appear as a hodge-podge, a collection of screens comprising seemingly random mixtures of elements. The elements are the answers in Table 2. The questions never appear, and indeed their sole reason for being is that they motivate the different answers. The questions are not relevant for the respondents, whereas the answers are. Most respondents confronted with this seeming randomness end up looking at the combination on the screen and assigning a rating. Exit interviews with respondents, and especially with academics, end up with the same observation, viz., that everything seemed so ‘random’. Many respondents confess that they attempted to assign the ‘appropriate rating’ to the vignette, but had a hard time, and so they felt they just ‘guessed.’ This state of ‘indifference’, of lack of involvement, allows the respondent to answer honestly. The actual structure of the vignettes are anything but random. The basic design, a main effects experimental design, creates 24 combinations, the aforementioned vignettes. Each vignette has a minimum of two elements (answers in the terminology of Table 2), and a maximum of four elements. The experimental design ensures that each vignette has at most one element or answer from each question, but in those with three elements one question does not contribute an element, and in those with two elements two questions do not contribute elements. The underlying experimental design, known informally as a 4×4, ensures that the elements will appear five times in 24 vignettes, and be absent from 19 vignettes. Furthermore, the design ensures that the 16 elements will be statistically independent of each other, allowing for the analysis of the data by regression modeling, either at the group level or at the individual respondent level. Finally, the underlying experimental design is only a template. The design stays constant, but the elements can be permuted so that the elements are still associated with questions, but the combinations change. This strategy is called permuting the experimental design and ensures that the combinations or vignettes cover a lot of the possible combinations. At the level of science, this permutation means that the researcher does not have to limit the focus to pre-specified combinations that are thought to be most promising. Rather, he permuted design enables the researcher to quickly explore a large number of combinations of elements, and, at after-the-fact develop a detailed picture of the different elements. A good analogy is what the MRI ends up doing, taking pictures of the same tissue from different angles, and then combining these pictures after the fact [15]. When the respondent finishes reading the vignette the respondent simply presses the appropriate key on the computer or smartphone, the rating is registered along with the response time. The response time is defined as the number of thousandths of a second between the appearance of the vignette on the screen and the rating assigned by the respondent. After the respondent has assigned the rating the BimiLeap program automatically advances to assemble the next vignette at the local site viz., at the respondent’s computer or smartphone. Over a period of 20+ years the Internet-based surveys or experiments have gotten shorter. When the efforts were first launched in a major way around 1999, it was fairly easy and inexpensive to obtain respondents. The Internet was fairly new, respondents were interested in participating and the attention span seemed to be much longer. It was not unusual to be able to get hundreds of respondents for a study, and for the web-based interaction with the respondent to last 15-20 minutes. Today, however, people are time-starved, and have substantially shorter attention spans. The 4×4 experimental designs used here require about 3-4 minutes on the internet. Even with that short time, it is vital to work with a panel provider, unless one has a captive audience. The panel providers have access to millions of respondents. It becomes cost effective and time saving to work with these providers, an effort which ends up virtually guaranteeing that the study will be completed, often in an hour or sooner.

FIG 6

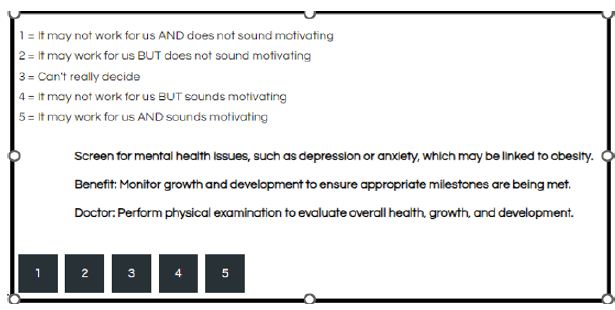
Figure 6: Example of a vignette

Table 2: The four questions and the four answers to each question provided by the Idea Coach, viz., AI embedded in the BimiLeap program.

TAB 2

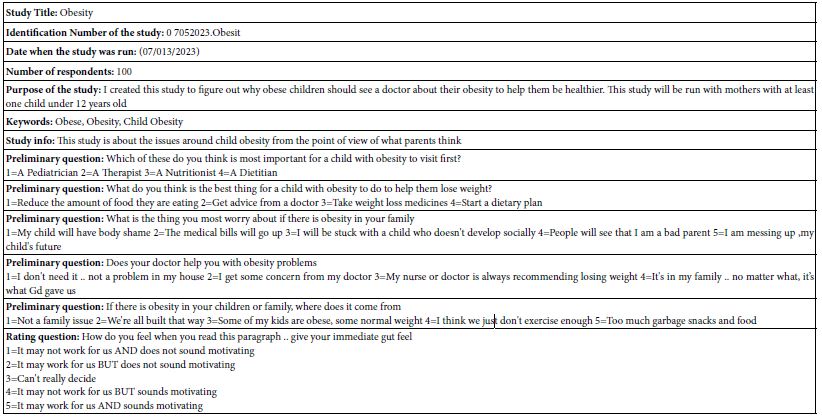
The Mind Genomics Study about Low-income Parent’s Response to What Do for an Obese Child

This study was run by the senior author (BK) following his interest in nutrition education. The focus of the study was on what are the aspects, concerns, and messages regarding a low-income parent thinking about a child who is obese. The study was created on the BimiLeap platform, and sent for participation to parents in New York City, with self-declared income less than $45,000, and with self-declared parent of at least one child under 12 years old.

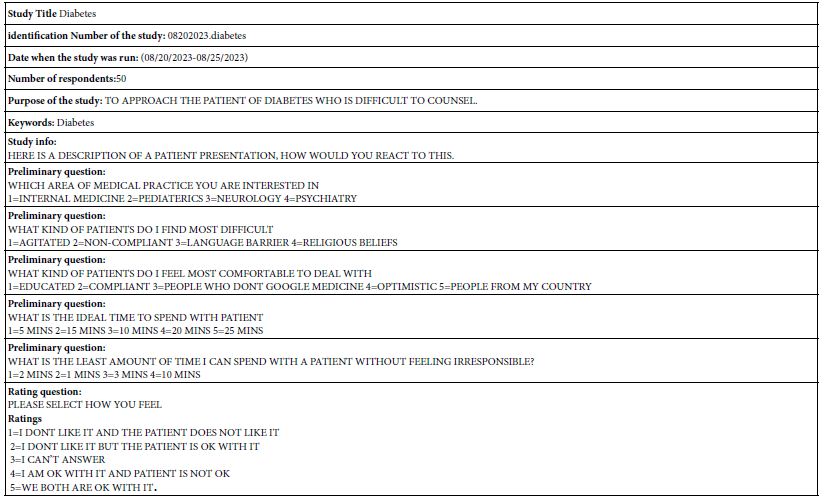
The study required about 30 minutes to set up with the assistance of the Idea Coach. The study was run by Luc.id, a panel provider, on July 13, 2021. Table 3 presents the set-up information taken from the set-up screens.

Analyzing the Data by Transforming the Ratings, and Using OLS (Ordinary Least-squares) Regression

The study comprised the responses of 100 individuals, each of whom evaluated 24 unique vignettes. Across all of the 2400 vignettes the vast majority of the vignettes were unique. This uniqueness means that the ordinary analyses of averaging ratings for a common stimulus won’t work, since the stimuli tested by the respondents are vignettes. What is important, however, is the response to the individual elements, the phrases which give the message. There were only 16 elements, each element appearing five times in 24 vignettes, so each element appearing 500 times the full set of 2400 vignettes.

The analysis first transforms the ratings. The rationale for transforming the ratings comes from the reality that most users of data do not know what to do with the actual ratings. For example, what does a 4.5 mean on a five-point scale? The scientists who do the research have a difficult time explaining the meaning of the intermediate scale point. This difficulty is glossed over because the research conclusions end up with ‘statistically speaking, these two ‘items’ are same, different, lower, higher.’ The pervasive use of inferential statistics, of same vs different, higher vs lower, ends up making the rating value a simple way by which to compare two or more groups on these simple ‘same/different/lower/higher’ categories of reporting. The reality of the scientific project is to find effects, find differences, using the rating as key indicator, with the discussion moving away from the focus on the rating value and on to the hypothesis.

The objective of Mind Genomics is to measure the mind or at least to put numbers onto messages so that one can create a metric of thoughts, of attitudes. The use of responses to vignettes is a good way to do that but the analysis has to extract the important information. That information must be a number, comparable across studies, amenable to being databases, to being used as a key performance indicator (KPI). To create these KPI-level numbers requires a few simple steps, which end up creating an easy-to-master system.

Step 1: Transform the Ratings to a Binary Scale

Most managers who use the data focus on simple numbers by which they understand and by which they take action. It is easy to communicate the percent of respondents saying yes vs percent saying no. To achieve this binary scale, the Mind Genomics convention is to pick some point on the scale which divides the Top from the Bottom. For the five-point scale, this cut-point is 4. Ratings of 5 and 4 are transformed into 100, ratings 1,2 and 3 are transformed into 0. To the newly created transformed variable is added a vanishingly small random number (<10-5). The rationale for the random number is that in the case that all of the ratings assigned by a respondent were either 1-3 or 4-5, there would be some randomness, preventing the regression from crashing.

The transformation is really a mapping of the anchored rating scale to a binary scale. For our analysis in this paper the ratings 5 and 4 have in common that the vignette is ‘motivating’ whereas the ratings 1, 2, and 3 have in common that the message is not ‘motivating’. The messages may not be demotivating, but rather simply are not motivating.

Finally, to finish the discussion of mapping, one could also create another binary variable ‘Work For Us’. This variable would take on the value 100 for ratings of 5 and 2, and then take on the value of 0 for ratings of 4, 3, and 1. This paper does not deal with the variable ‘Work For Us’, although everything that has been done for ‘Motivating’ can be done for ‘Work For Us’.

Step 2: Estimate the Parameters of the Equation Relating the Presence/Absence of the 16 Elements to the Dependent Variable

The equation is expressed as: DV (dependent variable)=k1(A1) + k2(A2)…k16(D4)

The equation has no additive constant. This is deliberate in order to make all coefficients comparable, both within an individual, across individuals within a single study, and across studies with different sets of elements.

The underlying experimental design ensures that each group of respondents will generate data that can be subject to OLS regression, ranging from data generated by all respondents together (Total Panel) and down to definable subset (e.g., based upon the answers of the respondent in the self-profiling classification), and down to the level of the individual.

The coefficients for the total panel are shown in screen shot in Figure 7. These are ‘flash results’ appearing on the researcher’s screen. The BimiLeap program updates the data every minute or so, providing a report of the coefficients for each defined group. The numbers are the coefficients of the model, shown for the Total Panel. We interpret the coefficient as the percent of responses achieving the rating 5 or 4 (viz., motivates) when the element is inserted into the vignette. Most of the coefficients are positive. Statistically ‘significant’ coefficients have values around 15-16.

FIG 7

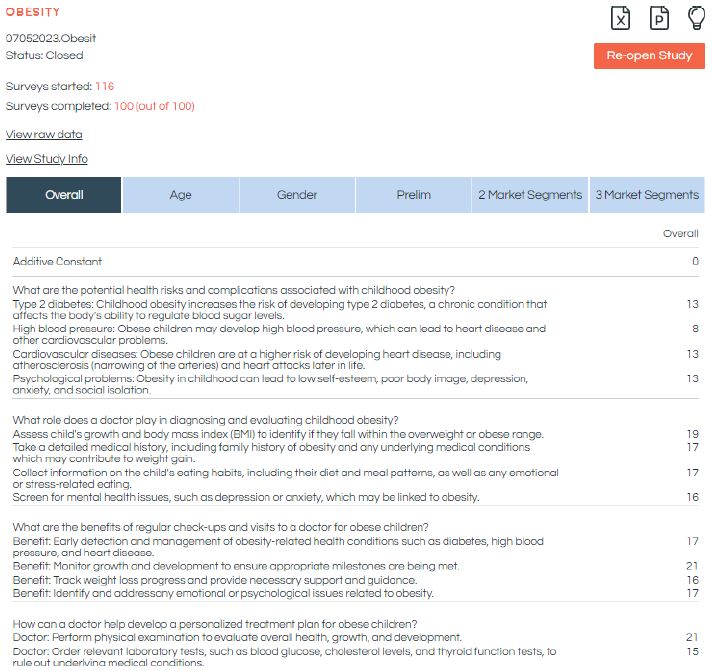
Figure 7: Screen shot of the visual report of the data. The visual report is updated when the researcher refreshes the screen. The screen shows the number of respondents who started the study, the number who completed, the elements and the coefficients estimated for the Total Panel.

Step 3: Create the Models for the Total Panel and for the Self-defined Groups

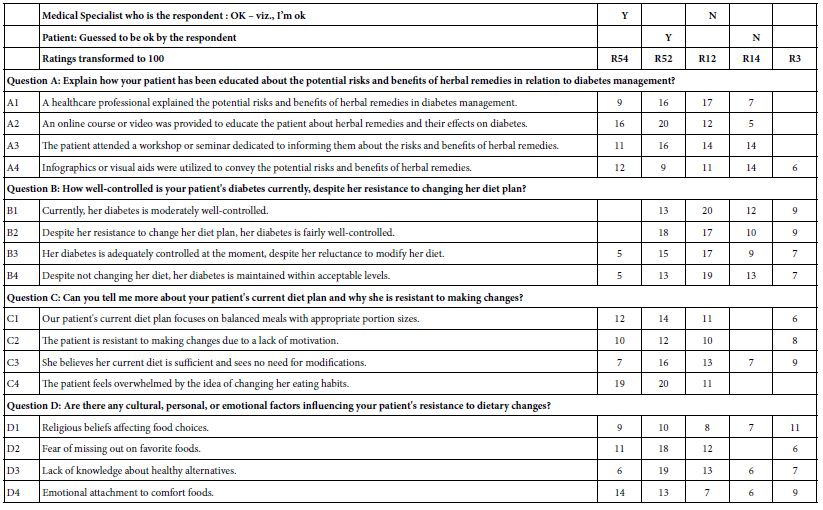
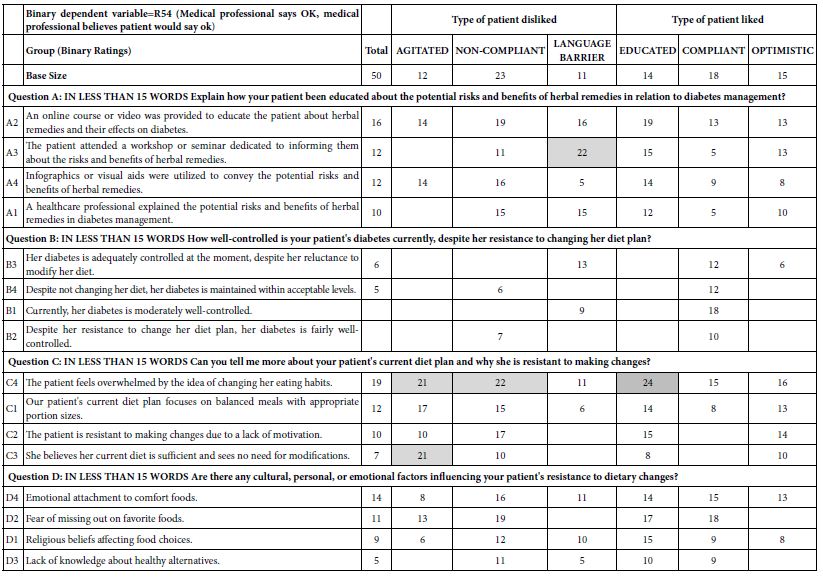
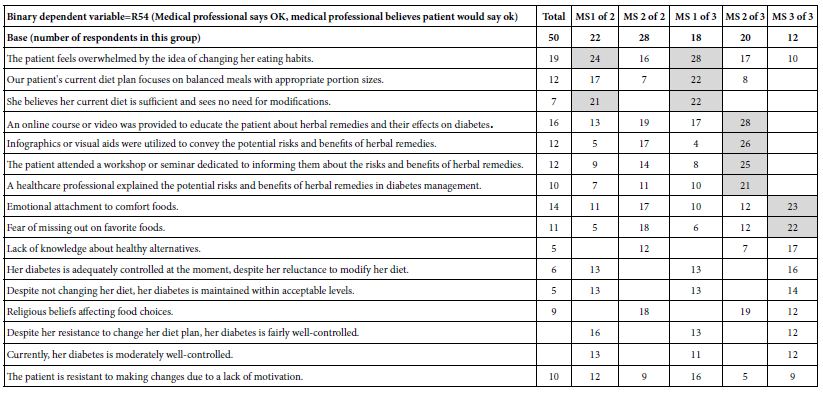
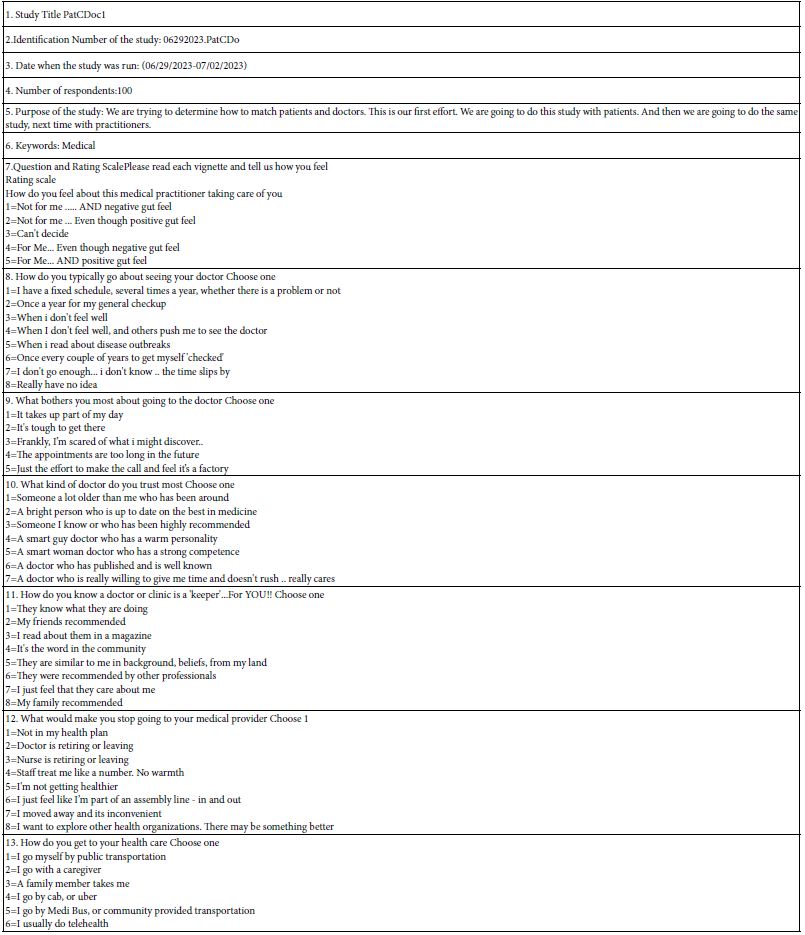
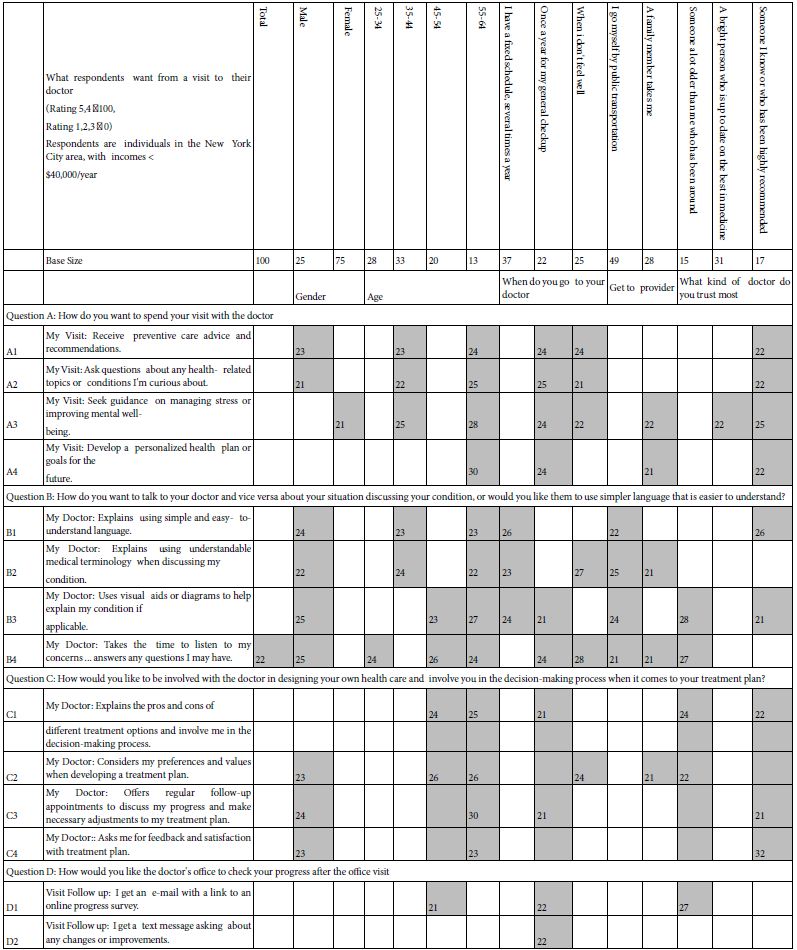
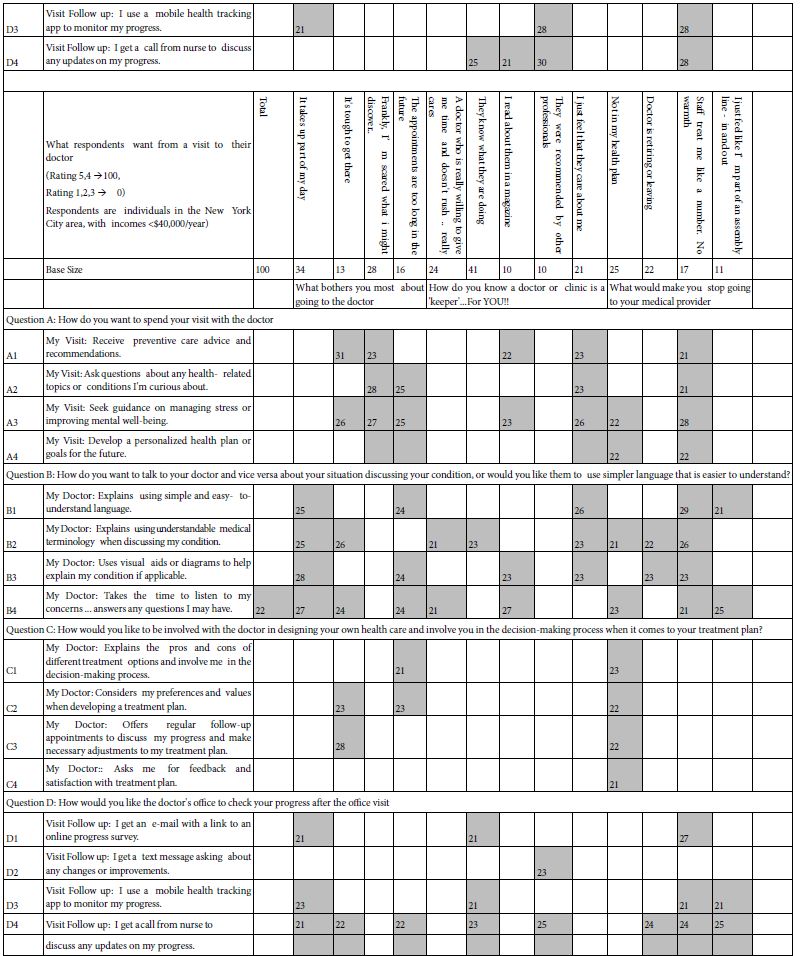
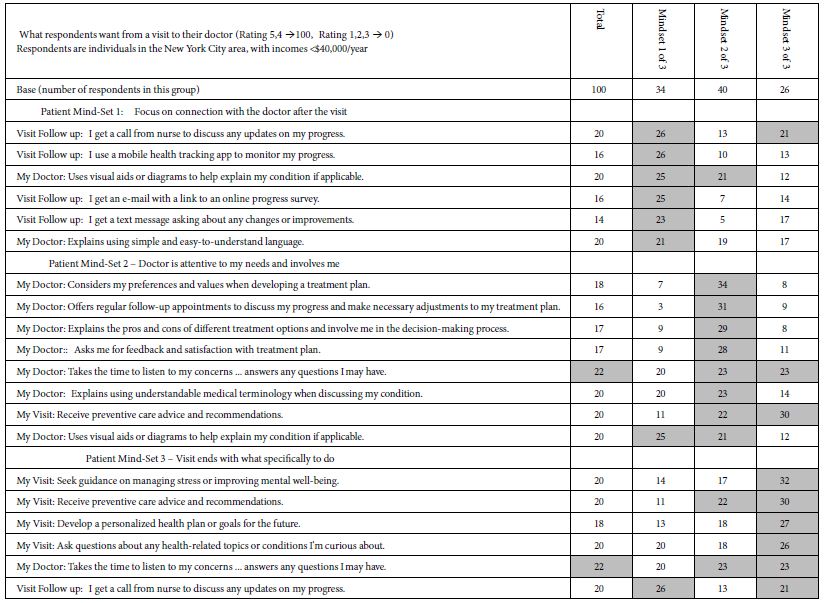
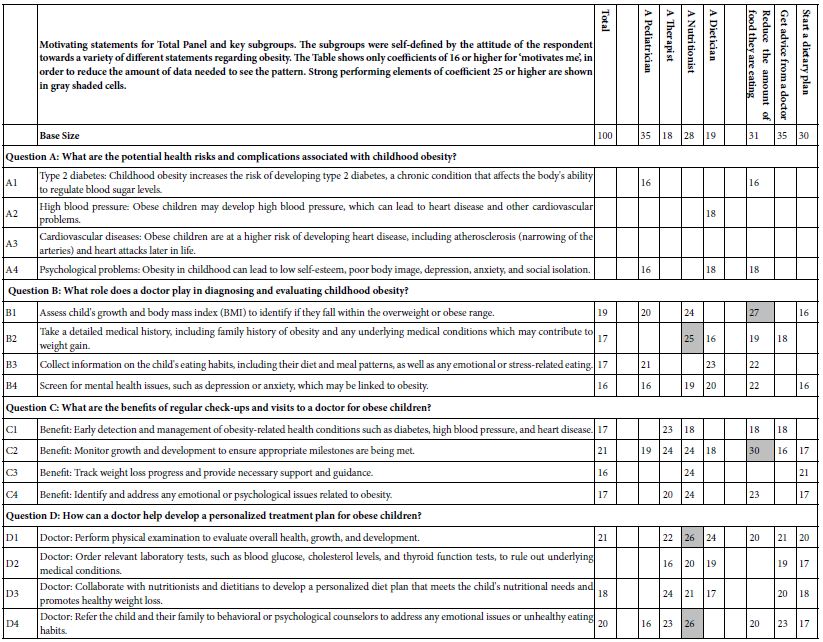
Once the data have been incorporated into the database, the OLS regression rapidly reveals the strong performing as well as the weak performing elements. Table 3 shows coefficients for the 16 elements for key self-defined subgroups. Only those subgroups with 10 or more respondents are shown. Fewer than 10 respondents generate readable data, but the base size makes the coefficients less robust.

Table 3 shows many blank cells. These correspond to coefficients which do not reach the cutoff point of 16 or higher. The coefficient value of 16 approaches statistical significance in terms of a t-test of coefficients. The strong performing elements are operationally defined as having coefficients of 25 or higher. These strong performers are shown as shaded cells.

Table 3: Study summary, provided when the data report is issued at the end of the field work and analysis.

TAB 3

A cursory look at the performance of the elements in Table 3 suggests that there may be patterns among strong performing elements, but these patterns are hard to discern. The same finding occurs in study after the study. Simply looking at the respondents by WHO they are, what they say they THINK, and what they say they DO produces data, but interpretable patterns usually fail to not emerge. The reason for the pattern not emerging is that there are 16 elements, not one or two. With 16 elements, the patterns which emerge should tie together a reasonable number of elements. With one or two elements, the temptation is to create a plausible ‘hypothesis.’ With its abundance of elements, patterns will emerge readily when present, letting the researcher focus on data, not on hypotheses which fit sparse data.

Mind Sets

A key tenet of Mind Genomics is that at the granular level of behavior, the everyday, people differ from each other in the way they make choices, in the way they value the information they receive. Furthermore, these person-to-person variations exist as basic, explainable differences among people. It is the job of the Mind Genomics researcher to uncover these different groups, these mind-sets.

The way to uncover these basic mind-sets at the level of granular and everyday topics is by clustering together people who show similar patterns of coefficients. The patterns of coefficients for our study on obesity show what is important to various people. Mind Genomics enables the researcher to discover these mind-sets using empirical methods.

The actual mechanics for discovering mind-sets are simple. The researcher creates an individual level for each respondent, and then clusters the set of individual coefficients using one or another method for clustering. The method used here is k-means clustering [16]. The metric for ‘distance’ between people is the value (1-Pearson Correlation), with the Pearson Correlation computed across the 16 coefficients for two people. Each respondent ends up being assigned to one of the segments or mind-sets.

Segmentation is a heuristic, aiming to simplify data by putting the items (viz., respondents) into non-overlapping groups. Depending upon the specific algorithm for doing the clustering, the result may end up as few clusters versus many clusters, and as clusters which may be easy-to-interpret or hard-to-interpret. The researcher makes the judgment considering the criteria of interpretability (do the mind-sets or segments make intuitive sense), and parsimony (the fewer the number of segments or min-sets the better, as long as the mind-sets tell a coherent story).

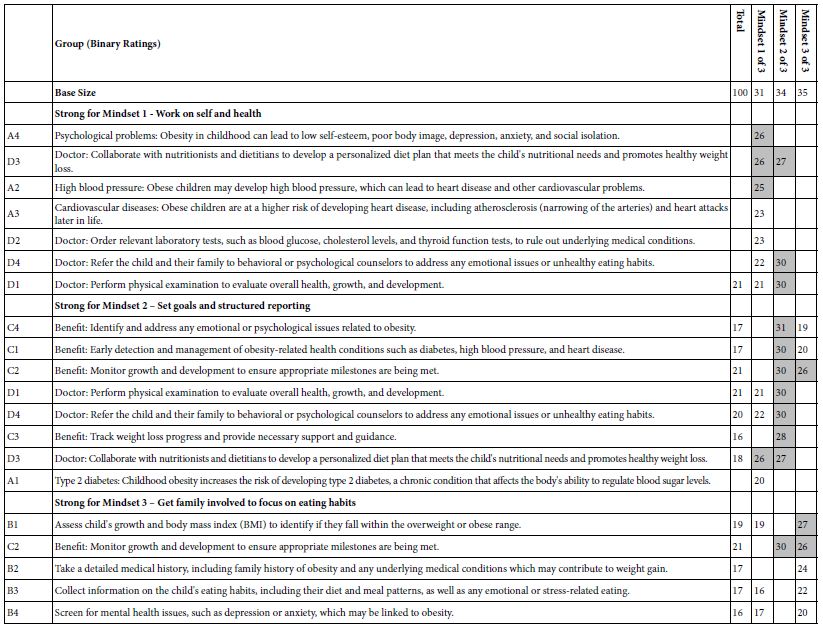
Table 4 shows the three mind-sets emerging from these data. The mind-sets all focus on obesity, medical interventions, and lifestyle interventions. What is important, however, is the fact that even with a fairly constrained topic such as obesity, there are clear and meaningful differences in the way people respond to the messaging. The nuanced differences among the groups emerge clearly, along with key messages for that group. In effect, the clustering provides a springboard for better thinking, better understanding, and hopefully improved communications.

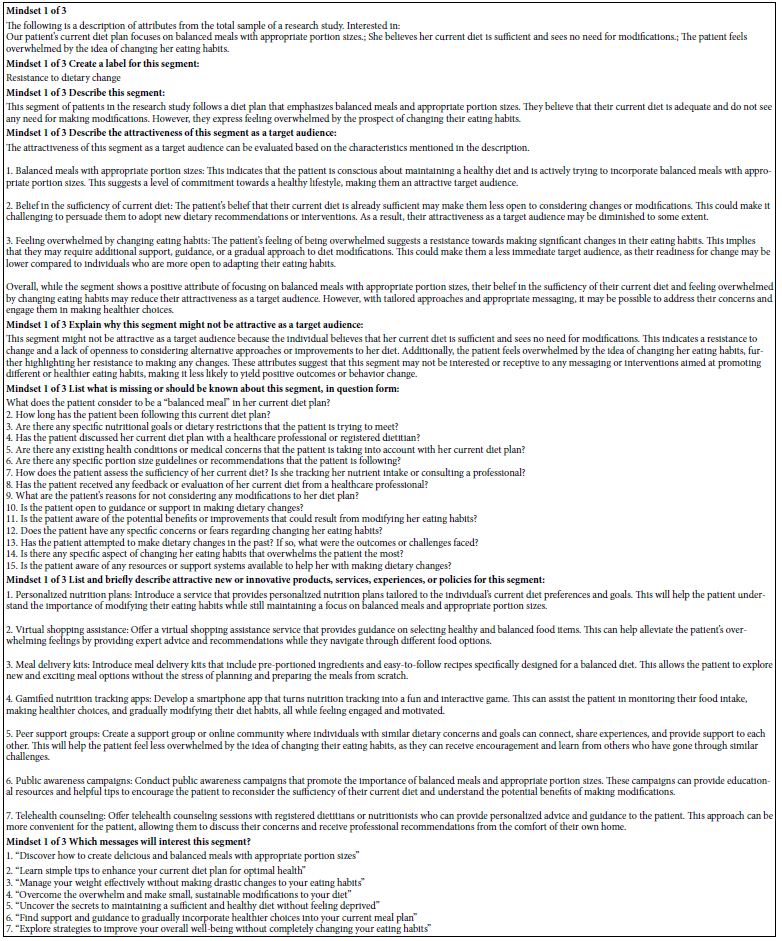
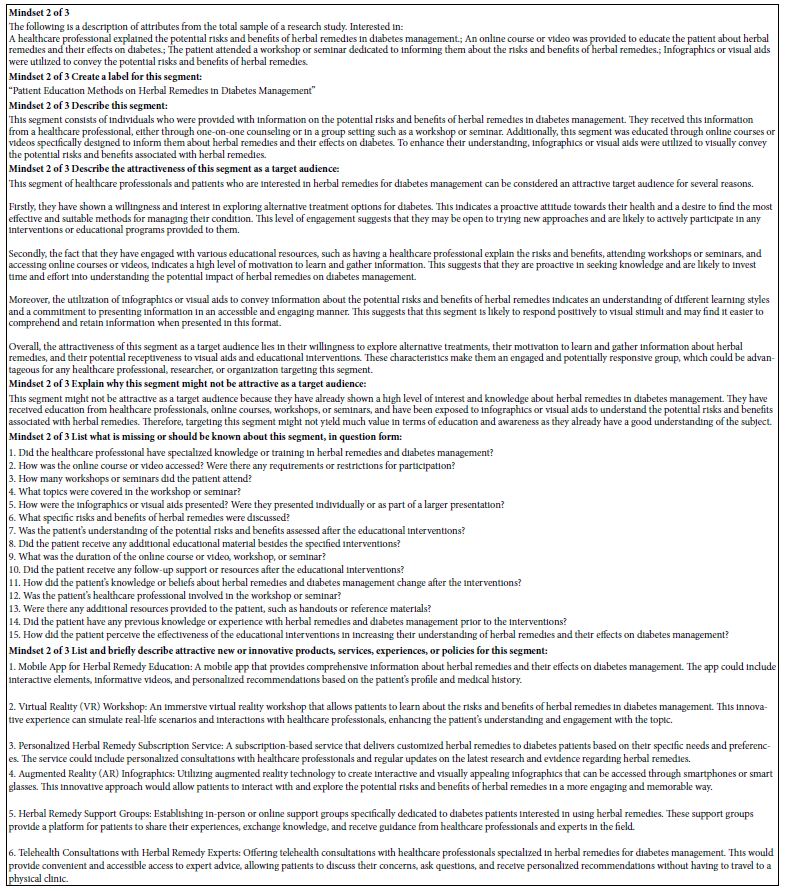
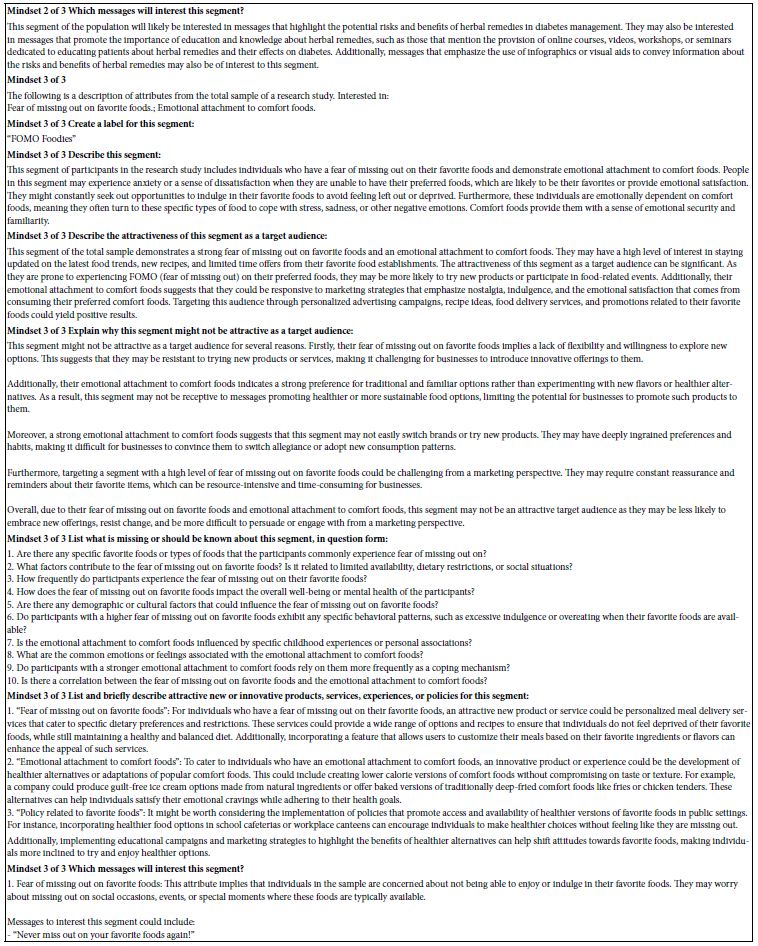
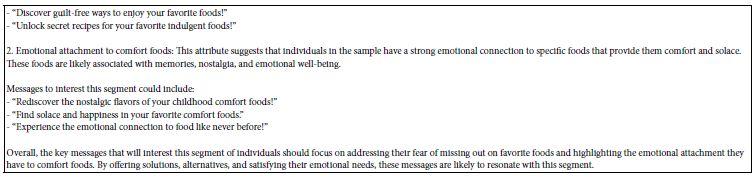
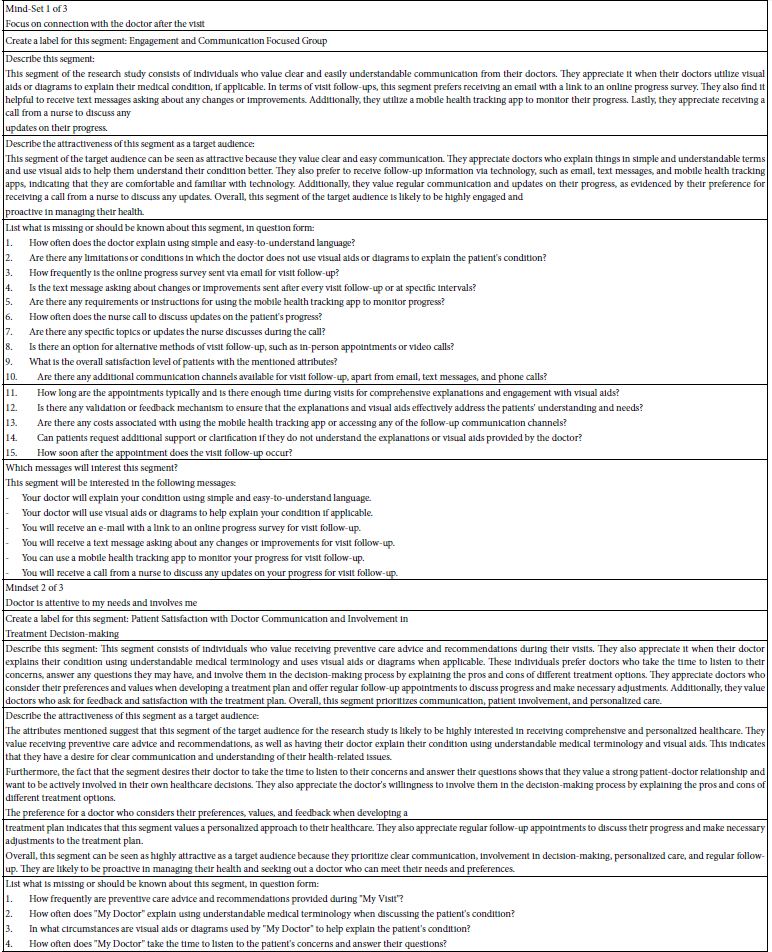
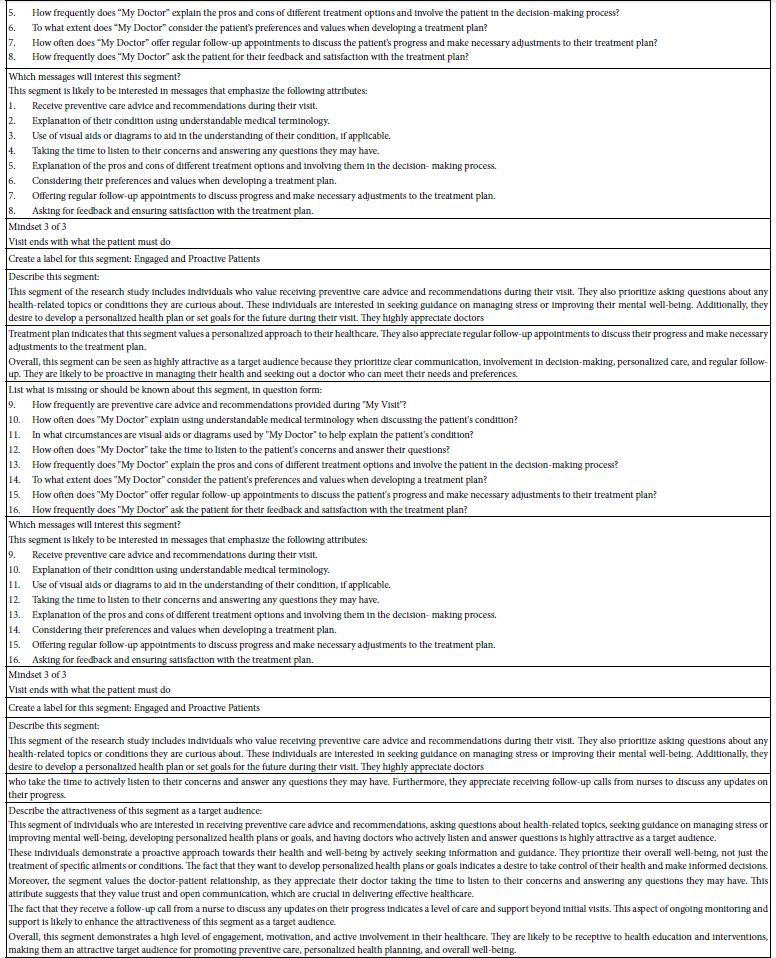
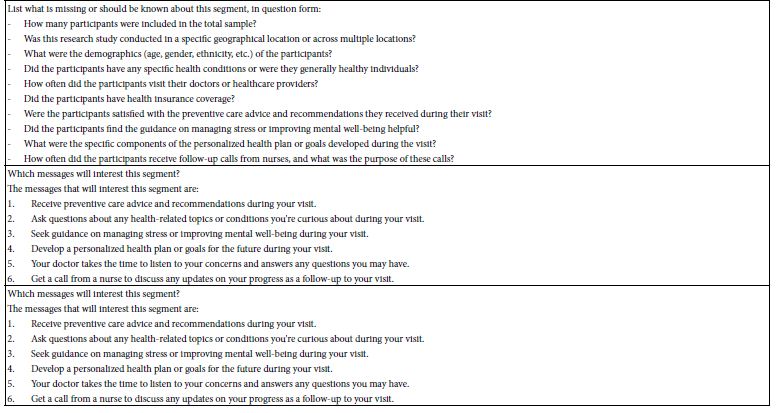
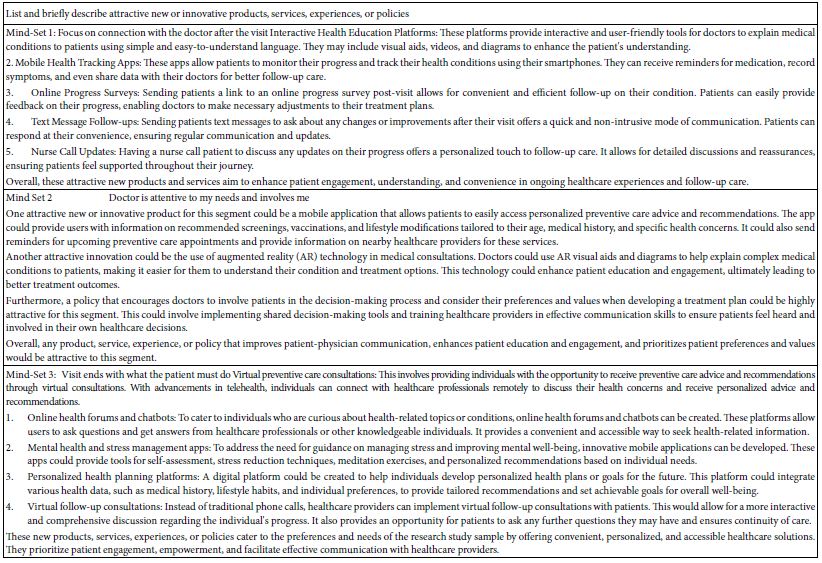
Appendix 3 shows AI interpretation of the strong performing elements from Table 4. The opportunity to use AI to interpret the results becomes more important when the clustering reveals interpretable clusters. Once again the interpretability of these clusters, these mind-sets, come from the commonality of elements which motivate the different groups of respondents. It is the sheer simplicity of similar ideas, important for clustering, which also boosts the ability of AI to create meaningful interpretations, enhancing patterns which are already obvious from the similar ‘meanings’ of the strong elements.

Table 4: Performance of elements across different self-defined groups of respondents. Only elements of +16 or higher are shown.

TAB 4

Appendix 4 shows AI suggestions about new products and services for the three mind-sets. These suggestions also emerge from the AI summarization of each set of answers.

Moving Beyond Knowledge to Actionable Communication – The Personal Viewpoint Identifier (PVI)

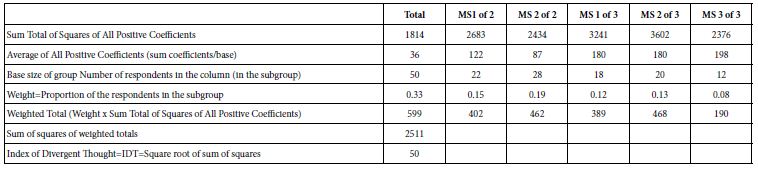
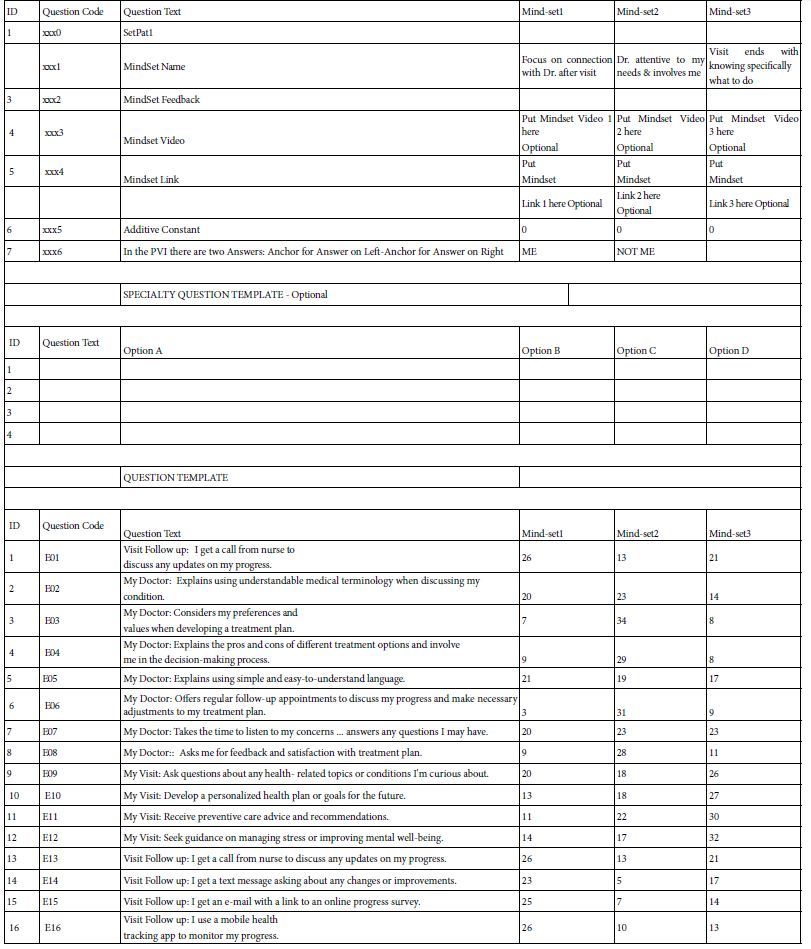
The ‘project’ of Mind Genomics does not stop at the experiments and at the identification of relevant interpersonal messaging and actions. Rather, having been nurtured in the business environment from the pioneering efforts of Wharton Business School professors Paul Green and Yoram Wind [17], Mind Genomics carries in its DNA the opportunity for application. The specific application is a bank of knowledge about interpersonal communications in the world of professional and client. The objective is not to prescribe clinical specifics but rather to tailor the style of communication to that which is empirically most appropriate for the patient. The data in this granular level study of the general nature of what to say to parents of children regarding obesity is a good example. What are the types of words to which the three different mind-sets will attend? The topic of childhood obesity seems so well defined that it’s quite likely the health professional might not even realize that more success could be had by knowing how to frame one’s messages It is to the end of assigning a person to a mind-set for purposes of general understanding ‘how to communicate’ that we now turn. During the past several years, the notion of developing a personal viewpoint identifier has come to the fore for a variety of issues [18,19]. The rationale for the of a personal viewpoint identifier, or indeed, for any typing tool is that once the science is established, those who need to know what to communicate are given actionable suggestions. The experienced person might not need that PVI typing tool, but the inexperienced person does, the person with decades of trial and error which makes the person an expert. The objective of the PVI is to present an individual with a simple to complete questionnaire, shown by Figure 8. Panel 8A shows the consent form, and background material about the respondent. Panel 8B shows the six-question typing tool. Panel C shows the assignment of the respondent to one of the three mind-sets, as well as feedback for the three mind-sets. The researcher creates the titles for the mind-sets, and the messages. The underlying algorithm sorts create the assignment method. There are many available statistical methods to create typing tools, such as discriminant function analysis or CHAID. It will be the large set of these easy-to-create databases and typing tools that will allow a new vista to emerge. This opportunity with be deeper, quickly and easily obtained knowledge of specifics in style, in language, to help professionals understand those who seek their advice. In other words, a system to understand the way the patient wants to interact as a person with the medical professional. The approach is not to diagnose the patient, not to suggest anything other than revealing the most likely ‘best style’ of communication.

FIG 8

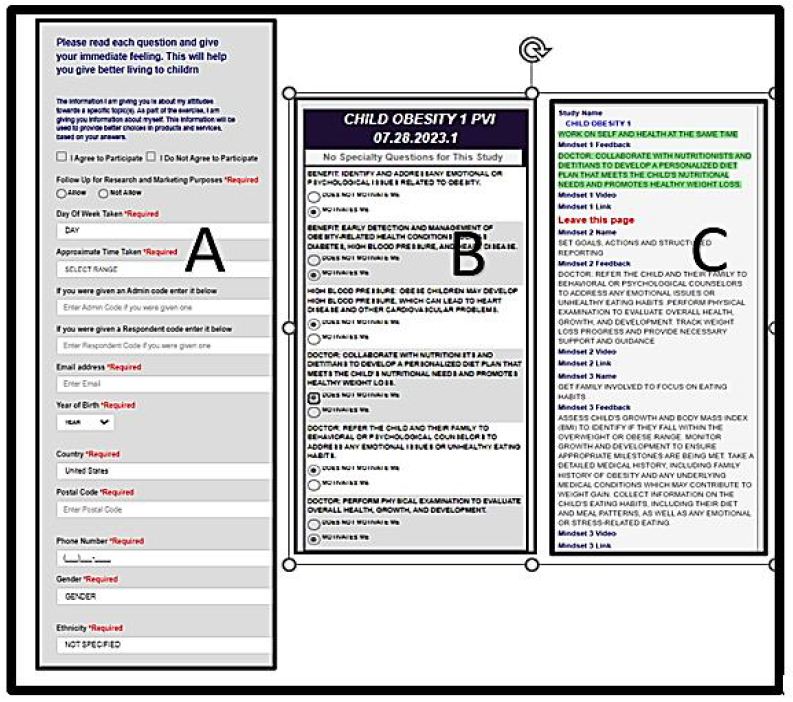
Figure 8: The PVI (personal viewpoint identifier) for the obesity topics covered in this study

Table 5: How the 16 elements perform among the Total Sample vs among three emergent mind-sets

TAB 5

Setting up the PVI is straightforward (see www.pvi360.com). The setup is formatted to accept Excel-type data, meaning that either the entries are entered by hand, or a complete excel matrix can be copied and pasted. Figure 9 shows the formatted sheet, which needs only be completed, with data easy to copy from the results file.

FIG 9

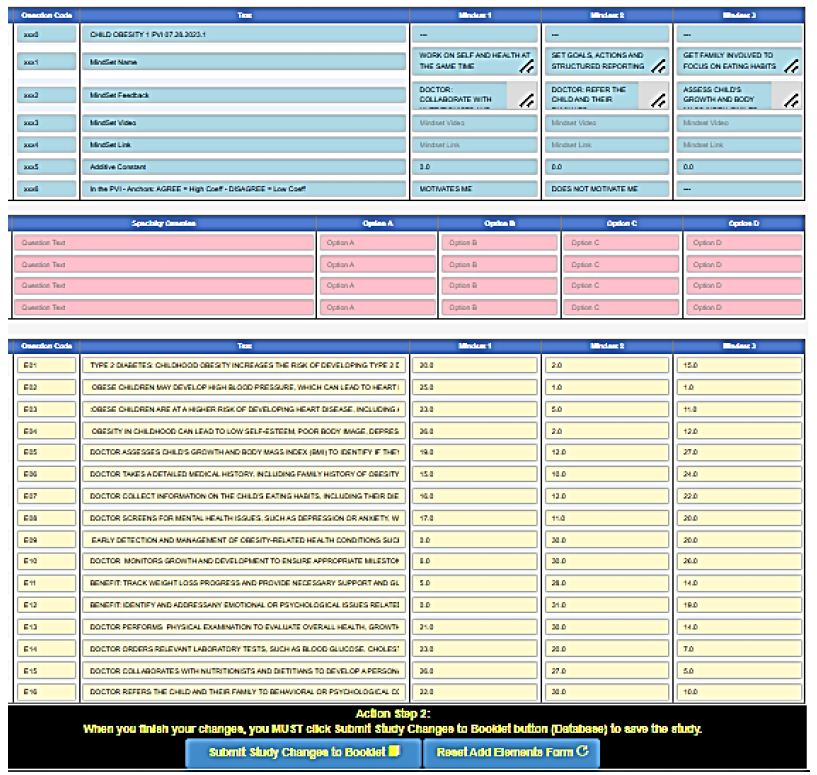
Figure 9: Set-up form for the PVI (personal viewpoint identifier), coded by colors to make the set up easy even for beginners.

Discussion and Conclusions

The foregoing study represents just one effort to generate deep knowledge about messaging to individuals regarding a health and wellness condition. The contribution of this paper is to present an approach which can generate large amounts of data about how people think, the data coming from different topics, or the same topic with different messages, or even the same topic with the same message across the world. The potential now exists for the industrial-level acceleration of curated primary information about how one should communicate with people, either within a topic area such as obesity, across different areas such as better living, and across different populations [20]. The challenge for today is straightforward. The challenge is to create this depth of knowledge on a daily basis, for all topics where people need to speak with those who are tasked with helping them on the arc of wellness and health to the point where they need intervention. Can these studies of effective language be automated around the world so that the precious, diminishing time of health professionals can be spent communicating in the best, most effective, kindest way possible, for every individual who shows up requesting health. It is that vision, of truly industrial-scale knowledge of the ‘how to effectively communicate’ which might well return a modicum of interpersonal intimacy, trust and communication effectiveness to a system thought by many to be slowly breaking down.

Acknowledgments

The author acknowledges the help provided by Yehoshua Deitel of Sifra Digital Inc., in Israel, both in the development of the Mind Genomics system and the Idea Book. The authors also acknowledge Professor Attila Gere of Hungarian University of Agriculture and Life Sciences and Mr. Robert Sherman of Robertsoft for their efforts in creating the PVI.

References

  1. Han JC, Lawlor DA, Kimm, SY (2010) Childhood obesity. The Lancet. [crossref]
  2. Lakshman R, Elks CE, Ong, KK (2012) Childhood obesity. Circulation. [crossref]
  3. McPherson AC, Hamilton J, Kingsnorth S, Knibbe, et al. (2017) Communicating with children and families about obesity and weight‐related topics: a scoping review of best practices. Obesity Reviews. [crossref]
  4. Mellor JM, Dolan CB, Rapoport RB (2011) Child body mass index, obesity, and proximity to fast food restaurants. International Journal of Pediatric Obesity. [crossref]
  5. Mendoza CL, Mendoza CI, Braun M, Deitel Y, Rappaport S (2023) Empowering Young Researchers: Searching for What to Say to Young People to Avoid Becoming Obese. Endocrinology, Diabetes and Metabolism Journal 7: 1-11.
  6. Luce RD and Tukey, JW (1964) Simultaneous conjoint measurement: A new type of fundamental measurement. Journal of Mathematical Psychology 1: 1-27.
  7. Anderson NH (1976) How functional measurement can yield validated interval scales of mental quantities. Journal of Applied Psychology 61: 677-692.
  8. Moskowitz HR (2012) ‘Mind genomics’: The experimental, inductive science of the ordinary, and its application to aspects of food and feeding. Physiology Behavior. [crossref]
  9. Moskowitz HR, Gofman, A, Beckley, et al. (2006) Founding a new science: Mind Genomics. Journal of Sensory Studies 21: 266-307.
  10. Gabay G, Moskowitz HR (2019) “Are We There Yet?” Mind-Genomics and data-driven personalized health plans. In: Cross-Disciplinary Perspectives of Management: Challenges and Opportunities, 7-28.
  11. Milutinovic V, Salom J (2016) Mind Genomics: A Guide to Data-Driven Marketing Strategy. Springer.
  12. Moskowitz HR, Wren J, Papajorgji P (2020) Mind Genomics and the Law. LAP LAMBERT Academic Publishing.
  13. Moskowitz HR, Gofman A (2007) Selling Blue Elephants: How to Make Great Products That People Want Before They Even Know They Want Them. Pearson Education.
  14. Porretta S, Gere A, Radványi D, Moskowitz H (2019) Mind Genomics (conjoint analysis): The new concept research in the analysis of consumer behaviour and choice. Trends in Food Science, Technology 84: 29-33.
  15. Gofman A, Moskowitz H (2010) Isomorphic permuted experimental designs and their application in conjoint analysis. Journal of Sensory Studies 25: 127-145.
  16. Likas A, Vlassis N and Verbeek JJ (2003) The global k-means clustering algorithm. Pattern Recognition 36: 451-461.
  17. Wind J, Rao VR, Green PE (1991) Behavioral methods. Handbook of Consumer Behavior, 507-532.
  18. Davidov S, al Humaidan, M, Gere A, Cooper, et al. (2021) Sequencing the ‘Dairy Mind ’using Mind Genomics to Create an “MRI of consumer decisions”. In: New Advances in the Dairy Industry. IntechOpen. DOI: 10.5772/intechopen.101422
  19. Zemel R, Choudhuri SG, Gere A, Upreti, H, Deite Y, et al. (2019) Mind, consumers, and dairy: Applying artificial intelligence, Mind Genomics, and predictive viewpoint typing. In Current Issues and Challenges in the Dairy Industrty. IntechOpen.
  20. Randle M, Okely, AD, Dolnicar S (2017) Communicating with parents of obese children: Which channels are most effective? Health Expectations.
fig 1

Epidemiological and Anatomopathological Profile of Prostate Cancer in Thiès

DOI: 10.31038/CST.2023831

Abstract

Prostate cancer is a cancer of the elderly: it rarely appears before the age of 50, and the incidence increases very rapidly with age. Age is the main risk factor identified for prostate cancer. This risk is 1% to 7% between 50 and 64 years of age, and rises from 14% to 26% between 65 and 74 years of age. These risks increase by 40% between the ages of 75 and 79 and reach 50% at the age of 80. The most common problems are: prostatitis or inflammation of the prostate, urinary urgency, urinary frequency, dysuria, acute retention of urine, or more rarely, initial hematuria. The objective of this study was to describe the epidemiological, clinical and histological aspects of prostate cancer in the Thiès region. Our study was conducted between January 2020 and December 2022 with a population of 165 patients with prostate cancer in the urology department of the regional hospital of Thiès and the Saint Jean de Dieu hospital of Thiès. The variables studied were age, PSA levels, Gleason score and histological grades. The mean age of the patients was 71.18 years with extremes ranging from 47 years to 90 years, and the mean PSA level was 965.33 ng/ml with extremes from 5 ng/ml to 5000 ng/ml. Our results show that 87% of our patients were older than 65 years. Gleason score 7 (4+3) was more represented with a rate of 37% corresponding to grade III according to WHO-ISUP 2016. The incidence is in average decline between 2020 and 2022.

Keywords

Prostate, Cancer, Epidemiology, Senegal

Introduction

In 2020, according to the World Health Organization (WHO), prostate cancer is the third most common diagnosed malignancy. With 1,414,259 cases (7.3% of the total), prostate cancer is preceded only by lung and colorectal cancer with 2,206,771 and 1,148,515 cases (11.4 and 10.0%), respectively [1]. It is the most commonly diagnosed cancer in more than 50% of the world’s countries (112 out of 185) and its incidence varies considerably between high and low human development index (HDI) countries, 37.5 versus 11.3 per 100,000 population respectively. Mortality rates are less variable (8.1 vs. 5.9 per 100,000 people). respectively. Mortality rates are less variable (8.1 vs. 5.9 per 100,000 people). Despite the significant burden of prostate cancer, established risk factors for this malignancy are limited to age, ethnicity, and a positive family history of the disease [2,3]. In fact, cancer incidence and mortality rates are strongly associated with increasing age, with a mean age at diagnosis of 66 years [4]. They also vary considerably by region and population, with higher rates among men of African descent and lower rates among those of Asian descent [3,5,6]. Epidemiological studies have also found that first-degree relatives of a patient with prostate cancer have two to three-fold increased risk of developing the disease compared to the general population, and the risk further increases with the number of affected relatives [7]. The aim of this prospective study was to investigate the clinical and histological characteristics of prostate cancer in the Thies region.

Material and Methods

This is a prospective descriptive study including 165 patients with prostate cancer. These patients were recruited from the urology department of the Thiès regional hospital and the Saint Jean de Dieu hospital in Thiès between January 2020 and December 2022. Inclusion criteria were a suspicious digital rectal exam with a PSA level above 4 ng/ml, then biopsies were performed for histopathological diagnosis. All histologically confirmed malignant prostate tumors were included in this study. Data were collected by consulting the hospitalization records, which are kept in the archives on a pre-established sheet, we collected in current family records the demographic data (name, surname, age, ethnicity, reason for consultation) and medical history. Data entry and analyses were performed using Microsoft Office Excel.

Results

Our epidemiological survey was conducted in a regional population of one hundred and sixtyfive (165) prostate cancer patients from January 2020 to December 2022. The mean age was 71.18 years with extremes ranging from 47 years to 90 years, and the mean PSA level was 965.33 ng/ml with extremes from 5 ng/ml to 5000 ng/ml. Only 16.36% of patients were less than or equal to 65 years of age (27/165). 82% of the patients were between 60 and 80 years of age and 11.5% were older than 80 years (Figure 1). In this study, the most common reasons for consultation were: urinary urgency, urinary frequency, dysuria, acute retention of urine, or more rarely, initial hematuria. The incidence of prostate cancer decreased with the years with 67 cases in 2020, 55 in 2021 and 47 cases in 2022 (Figure 2).

fig 1

Figure 1: Distribution of patients by age group

fig 2

Figure 2: Incidence of prostate cancer from 2020 to 2022

When examining histopathologic differentiation, patients with Gleason score 7 (4+3) prostate adenocarcinoma were more represented with a total of 61 individuals out of 165. According to WHO-ISUP 2016 grade, grade III was more frequent with 37% of cases, followed by grade IV with a frequency of 27%; only 2% of cases were grade V (Figure 3).

fig 3

Figure 3: Distribution of patients by WHO-ISUP Grade 2016

Discussion

We recruited 165 patients newly diagnosed with prostate cancer. These cases of prostate cancer, which made it possible to study the epidemiological and histopathological aspects of these cancers in Thiès, could not be considered as the totality of prostate cancers at the regional level because only anatomopathological specimens received in the laboratory were considered. The mean age of the patients was 71.18 years, comparable to those reported in the African literature, particularly that observed in Senegal by Gueye et al. and in Congo-Brazzaville by Peko et al. which is 69 years [8,9]. In the statistical studies of Amégbor et al. and Brawley et al. the average age of onset of prostate cancer is respectively 70 and 71 years [10,11]. In our study, the age range between 60 and 80 years was more represented with a frequency of 82%, this age range is found in Amegbor et al. and Ndoye et al. [12]. All these data confirm that prostate cancer is a disease of the elderly. According to Boyle, it is the most frequent cancer in men over 50 years old [13].

Moreover, the frequency of prostate cancer increases with age [14]. In our study 84% of the patients were older than 65 years. In addition, the low incidence rate in men under 50 years of age (0.06%) provided further evidence that the prevalence of prostate cancer is closely related to the increasing age of the patients [15,16]. The average age at diagnosis was high, hence the presence of these very advanced forms beyond any therapeutic resources. The delay in diagnosis is related to the natural history of prostate cancer but also to the apprehension that men had to come to the urologist. In addition, there is a lack of information and awarenessraising policy for the population about this condition, and difficulties in accessing health services. Contrary to the work carried out in the West where the average PSA level oscillates between 15 and 25 ng/ml [17], we note an elevation of the PSA level with an average PSA of 965.33 ng/ml, which is in line with the results of Nzamba et al. in Ivory Coast [18]. This PSA profile is consistent with the litterature, as several studies have reported a higher PSA level in African Americans than in Caucasian Americans [19-21]. This high PSA value could indicate early metastatic extension. In this study, Gleason score 7 (4+3) was the most represented with 61 out of 165 cases or 37%. This result is different from that of Jalloh et al. [22] and Amégbor et al. who found score 6 with a rate of 52% and 60% of cases. The patients in our study present a high proportion of advanced stage tumors (stage III and stage IV), i.e. 64% of cases; these results are matched with those of Gueye et al. and Benseba et al. in Algeria [23]. Only 2% of patients are stage V, these results confirm the progress of screening We note in this study population a relatively small decrease in the incidence of diagnosed cancers over the years, from 67 cases in 2020 to 43 cases of cancer in 2022. This relative decrease could be explained by a more targeted screening practice and improved diagnostic tools. Mass screening is not recommended. Early individual diagnosis is based on an annual PSA test associated with digital rectal examination in men between 50 and 75 years of age with a life expectancy of more than 10 years.

Conclusion

Prostate cancer in this study population is characterized by an advanced age at diagnosis that can lead to an advanced tumor grade correlated with a high PSA level and a huge frequency of metastasis.

The results of this study showed a relatively small decrease in the incidence of prostate cancer in the Thiès population for the period from 2020 to 2022. However, the relatively declining incidence in the Thies region indicates the need to optimize methods of timely diagnosis of prostate cancer by focusing on high-risk incidence groups.

References

  1. Sung H, Ferlay J, Siegel RL, Laversanne M, Soerjomataram I, Jemal A. Statistiques mondiales sur le cancer 2020: Estimations GLOBOCAN de l’incidence et de la mortalité dans le monde pour 36 cancers dans 185 pays. CA: Un Journal Sur le Cancer Pour les Cliniciens. 2021. [crossref]
  2. Pernar CH, Ebot EM, Wilson KM, Mucci, LA. The Epidemiology of Prostate Cancer. [crossref]
  3. Cold Spring Harb Perspect Med 2018;8: a030361
  4. Taitt, HE Tendances mondiales et cancer de la prostate: examen de l’incidence, de la détection et de la mortalité en fonction de la race, de l’ethnicité et de l’emplacement géographique. Un m. J. Men’s Heal. 2018, 12, 1807-1823.
  5. Brandt A, Bermejo JL, Sundquist J, Hemminki, K. Âge au diagnostic et âge au décès dans le cancer de la prostate familial. Oncologue. [crossref]
  6. Rebbeck TR, Devesa SS, Chang, B.-L, Bunker CH, Cheng, JE, Cooney K, Eeles R, Fernandez P, Giri VN, Gueye SM, et coll. Tendances mondiales de l’incidence, de l’agressivité et de la mortalité du cancer de la prostate chez les hommes d’ascendance africaine. Cancer de la prostate. [crossref]
  7. Odedina FT, Akinremi TO, Chinegwundoh F, Roberts R, Yu D, Rames RR, Freedman ML, Rivières BM, Vert BL, Kumar, N.-B. Disparités du cancer de la prostate chez les hommes noirs d’ascendance africaine: Une revue comparative de la littérature sur le fardeau du cancer de la prostate chez les hommes noirs aux États-Unis, dans les Caraïbes, au Royaume-Uni et en Afrique de l’Ouest. Agents infectieux Cancer. [crossref]
  8. Carter BS, Bova GS, Beaty TH, Steinberg GD, Childs B, Isaacs WB, Walsh, PC Cancer de la prostate héréditaire: caractéristiques épidémiologiques et cliniques. J Urol. [crossref]
  9. Gueye SM, Jalloh M, Labou I, Niang L, Kane R, Ndoye M. Profil clinique du cancer de la prostate au Sénégal. Afr J Urol 2004;10: 203-207.
  10. Peko JF, Bouya P, Kokolo J, Ngolet A. Cancers de la prostate au CHU de Brazzaville: épidémiologie et histopronostic. Med Afr Noire. [crossref]
  11. Amégbor K, Seddoh T Y, Tengué K, Songne-Gnamkoulamba B, Napo-Koura G, James K. Épidémiologie et histopronostic du cancer de la prostate au Togo: à propos de 202 cas diagnostiqués au laboratoire d’anatomie pathologique du CHU Tokoin de Lomé. Progrès En Urologie. [crossref]
  12. Brawlay O, Knopf K, Merill R. The epidemiology of prostate cancer, part 1: descriptive epidemiology. Semin Urol Oncol. [crossref]
  13. Ndoye M, Niang L, Gandaho K, Jalloh M, Labou I, Gueye S et al. (2013) Cancer avancé de la prostate au Sénégal. Aspects diagnostiques à l’hôpital de Grand Yoff. [crossref]
  14. Boyle P, Maisonneuve P, Napalkof P. Geographical and temporal pattern of incidence and mortality from prostate cancer. Urology. [crossref]
  15. Meikle AW, Smith JA. Epidemiology of prostate cancer: early detection and treatment of localized carcinoma of the prostate. Urol Clin North Am. [crossref]
  16. Houston KA, King J, Li J, Jemal A. Trends in prostate cancer incidence rates and prevalence of prostate specific antigen screening by socioeconomic status and regions in the United States, 2004 to 2013. Journal of Urology. [crossref]
  17. Daniyal M, Siddiqui ZA, Akram M, Asif HM, Sultana S, Khan A. Epidemiology, etiology, diagnosis and treatment of prostate cancer. Asian Pacific Journal of Cancer Prevention. [crossref]
  18. Hermabessiere J, Taillander J. Physiologie de la prostate. Encycl MedChir (Elsevier, Paris). France, Nephrol Urol. [crossref]
  19. NZAMBA B, Paul L, ODO B A, NZIENGUI T C, KOUASSI K Konan Y, KAGAMBEGA Zoewendbem A G, TOURE et al., 2020M Cancer de la prostate chez le sujet de race noire en Côte d’Ivoire
  20. Morgan TO, Jacobsen SJ, McCarthy WF, Jacobson DJ, McLeod DG? Moul JW. Agespecific reference ranges for serum prostate specific antigene in black men. N Eng J Med. [crossref]
  21. Freedland SJ, Sutter ME, Naitoh J, Dorey F, Csathy GS, Aronson WH. Clinical characteristics in black and white men with prostate cancer in an equal acces medical center. Urology. [crossref]
  22. Jalloh M, Thiaw G, Bathily EHAL, Dial C, Ndoye M, Diallo A et al. Corrélation entre Score de Gleason biopsique et métastases osseuses à la scintigraphie dans le cancer de la prostate. Revue Africaine d’Urologie et d’Andrologie. [crossref]
  23. Benseba S, Azem L, Mouaici K et al. (2021) Étude épidémiologique et physiopathologique du cancer de la prostate.
fig 1

In Search of a Better Doctor Visit: A Mind Genomics Exploration

DOI: 10.31038/IMROJ.2023821

Abstract

This paper explores the messaging about a doctor visit from the perspective of survey takers (respondents) acting as prospective patients. Respondents evaluated systematically varied vignettes, combinations of messages about a visit to the doctor. The elements were developed using artificial intelligence embedded in the BimiLeap program. Respondents each evaluated 24 unique vignettes comprising systematically varied combinations of the messages. Each vignette presented 2-4 messages, combined according to a main- effects permuted experimental design. Based upon the response to the vignettes about a ‘visit to the doctor’s office,’ regression and cluster analyses revealed three different-sets of prospective and current patients (Patient Mind-Set 1: Focus on connection with the doctor after the visit; Patient Mind-Set 2 – Doctor is attentive to my needs and involves me; Patient Mind-Set 3 – Visit ends with what specifically to do..) The Mind Genomics approach presented in this paper can be used to educate medical professionals about what they believe patients want and what patients actually want regarding the visit to their health care office.

Introduction

A search through the academic literature reveals what many practitioners and patients already know, namely that the patient-facing system today is ‘broken’, or at least can be optimized. One need only read the titles of papers to get a sense of the massive dissatisfaction, both from the viewpoint of the patient books detailing the issues, but perhaps a more productive solution is to find out what patients need and want from the point of view of human interaction. The clinical issues are best left to the experts, but what about the issues of patient experience? [1-4].

In today’s climate of hyper measurement, of everything, the patient experience is measured with an almost religious fervor. Following most visits, one receives the now-expected follow-up survey of the experience (e.g., Press-Ganey, Siegrist, 2013) [5]. No patient visit is left unexamined, as the patient is warned to expect a follow-up satisfaction survey and requested to be sure to uprate the scores for the experience if at all possible. Survey after survey, whether from a survey professional or from the office of the practitioner show remarkably similar structure, namely rating general statements about the experience on some type of point scale, along with questions about recommendations. These general surveys continue to show a decreasing satisfaction with the interaction with the doctor in the office, a trend that people may talk about in casual conversation but has now become a topic in the world of professional medicine [6]. Some of the issues may be individual differences, with doctors and nurses varying in their so-called bedside manner. Those differences are built into the system. People behave the way they behave. They may be taught some ways around their behavioral shortcomings once these shortcomings are identified, but the people may take years to really improve their behaviors. The other issue is the change in the economics, with insurance companies and venture capital using the medical system to optimize financial yield by treating the visit with the patient as a product whose ‘financials’ are to be optimized as if optimizing the production of any item to be sold to customers.

Exploring Granular Thinking about the Visit to the Doctor through Mind Genomics

Over the past forty years an alternative way of thinking about measuring experience has emerged, the origins of which go back to the pioneering work of functional measurement, and the foundations of mathematical psychology embodied in conjoint measurement. The common property here is to present respondents with combinations of alternatives and get their ratings of these alternatives or their choices. The subsequent mathematical analysis relating the choices or ratings to the composition of the test combinations reveals the underlying strength of the individual options or elements. The rationale for this approach comes from the realization that people react to stories, to vignettes of experience, not to single statements. It is more ecologically valid to present ‘small stories’ to be judged, and in turn identifying ‘what’ in the stories drives the reaction of the person judging the stories. It is from this worldview that Mind Genomics evolved, as an attempt to explore the granularity of experience in a way that does not allow the respondent to ‘game’ the system [7,8].

Mind Genomics evolved from this pioneering work, focusing on simple, DIY (do it y 0urself) templates, and automated analyses Underlying the DIY template is a carefully structured path which ensures that the data emerging from the Mind Genomics study will be statistically correct, even to the level of an individual respondent. The Mind Genomics approach has been used for many different types of problems, ranging from medical to legal, ethics, consumer products, social issues and education. The approach is similar for virtually all of the studies, with the exception of the specific elements or messages, and the underlying experimental design. The specific steps for the Mind Genomics studies have been presented in various papers. The approach followed in those papers will be one used here, with slight variations, such as the use of regression modeling without an additive constant, a change which makes the data easier to understand [9-11].

This study focuses on the application of the Mind Genomics approach to the issue of what do patients want in the sessions with their doctors, and in turn what do doctors, nurses, and senior medical students feel they want in their interaction with the patient.

The Mind Genomics World View

When one thinks about the mind of the patient regarding the session with a doctor, or vice versa, the mind of a doctor or other health professional thinking about the session with a patient, the topic at first seems easy, almost self-evident. There is an almost instinctive positive or negative reaction when patients describe their experiences with doctors, a reaction that can range from rapturous to disillusioned. A lot of it is emotion, with the catch-all phrase of bed-side manner summarizing a great deal of the feelings about the experience, even when the meeting occur at an appointment rather than at the bedside of a sick person [12]. The important thing to note is the reality that for most patients the doctor or nurse is the professional with whom they will interact, from whom they may get good news or less fortunately, bad news. Whether the doctor is proficient or not may be relevant and can be determined from reviews and from talking to one’s friends, but the immediate situation is one of emotion. The emotional tension may be mild, such as the visit to the doctor’s office for a routine physical, or the emotional tension may be significant as in the case of the doctor calling the patient to come in talk about some issues which have just surfaced for the patient.

At the end of the visit, the patient is often asked to complete a survey about responses to the visit. Press-Ganey surveys are well known in this regard [13], although patients may be asked to fill out any of many different ‘home-grown’ surveys, devised by the staff of the specific medical practice. T the typical survey might end up having the patient rate the doctor’s behavior at the visit, perhaps doing so with one overall rating or perhaps dimensionalizing the visit into such direct issues as the rating of promptness, explanation of the situation, the amount of time spent with the doctor, and so forth. These numbers are tabulated and produced into a report profiling the visit as a series of scaled responses, like a report card, albeit one with more emotion but perhaps absence of soul anyway.

The foregoing approach allows the researcher to cover many topics, but in superficial terms only. In the effort to capture as many aspects as possible about the visit of patient and health professional, the researcher ends up giving each topic short shrift, usually covering the topic by one general question or perhaps two or three general questions. There is usually none of the richness of language to capture the experience, and the feeling about such experience.

It is at this point that Mind Genomics departs from the conventional methods. Mind Genomics presents vignettes, combinations of messages, to the respondent, and instructs the respondent to rate the feeling about the vignette. The respondent is not asked to be analytical, but simply to rate the feeling on a scale. The respondent ends up rating a set of these vignettes, combinations of messages, with each vignette comprising a minimum of two and a maximum of four elements. The vignettes are simple to read, convey detailed information, and simply require the respondent to scan them and assign a rating. From the evaluation of 24 such vignettes, each rated by a respondent, the researcher can assemble a profile of how each of test phrases (16 of them) drive the respondent’s feelings. The respondent feels that she or he is guessing, but nothing can be further from the truth. Each set of 24 vignettes evaluated by a respondent differs in combination from every other set of 24 vignettes. Underneath the combinations is a carefully designed layout, the experimental design, which puts these combinations together in a structured manner, allowing the respondent to react to a compound description, but with the ability to tease out the contribution of each element of the vignette. Often the survey-taker’s response is that the interview seemed jumbled, the elements seemed randomly combined, and instead of trying to answer honestly (another way for saying ‘giving the correct response’), survey-taker confesses that she or he simply guessed.

The analysis of the results provides a deep snapshot of how the respondent feels about the elements. The system cannot be gamed. The ability to probe a topic deeply rather than superficially means that it is now possible to deeply understand the topic. The data make a great deal of sense as will be shown below. Almost always, faced with 24 seemingly random combinations of messages about a topic, the respondent feels she or he gives up trying to guess and simply assigns a rating which seems ‘correct.’ It is that level of focus, the same level that economic psychologists Daniel Kahneman calls ‘System 1’ [14].

Mind Genomics data are deconstructed into the contribution of the different messages. The story is in the pattern of coefficients from models or equations relating the presence/absence of elements the messages, the response. These coefficients emerge from regression. The pattern of coefficients often points to different groups of people, the differences now coming from who they are but from how they think about the specific topic. These are the mind-sets, the desired information emerging from the study of the granular experience.

Setting Up the Study on the Mind Genomics Platform

To illustrate the approach of Mind Genomics we present a study on what low-income respondents feel they want from a visit with the doctor. Thus, the Mind Genomics projects here are done in the spirit of patient satisfaction studies (e.g., like Press Ganey survey), or the very many after-the-fact customer satisfaction surveys which try to dimensionalized the experience with the professional, the sales representative, or the help desk..

The study was suggested by a constant topic surfaced in the daily online, world-wide meeting among clinicians and allied parties, the Global Population Health Management Forum. A continuing theme of the FORUM is the recognition that people feel shortchanged by the current medical care system, especially in the United States, but increasing in other countries. These feelings about ‘shortchange’ actually came from the doctors themselves and were supported by both medical literature [15], and by popular literature and advertisement.

Figures 1-4 show the steps of the process represented by screen shots. Figure 1, Panel A show the first screen, requiring the respondent to assign the study a name, to select the language of the prompts (e.g., English, Chinese, etc.), and to agree not to request personal information unless specifically agreed to by the survey taker before the start of the study.

Figure 1 Panel B shows introduction to the AI-powered Idea Coach. Often the researcher is unable to formulate questions. This inability to formulate a string of questions is increasingly common because it requires critical and structured thinking. During the years 20222-2023 the emergence of easily available AI in the form of Chat GPT allowed for the Mind Genomics program to incorporate a system to suggest questions, based upon the input of the researcher. These questions are suggestions for discussion, and not meant to be informational. They teach about the topic by presenting different questions that the researcher can ask. The Idea Coach can be accessed dozens of times until the researcher has discovered the four questions that are of greatest promise. Each use of the Idea Coach generates 15 questions. With many uses of Idea Coach for the same ‘squib’ or problem description, Idea Coach will produce a number of different questions, but some questions will repeat.

Figure 1 Panel C shows a set of questions produced by AI through Idea Coach. To reinforce the spirit of experimentation and inquiry and to reduce the fear of asking question, the Idea Coach can be re-interrogated as many times as desired. After a while the same questions will appear. The different suggestions for questions from Idea Coach will be stored for subsequent analysis and returned to the researcher in a comprehensive package called the ‘Idea Book’. The Idea Book is separate from the study, set up as a document to help learning.

Figure 1 Panel D shows the final four questions selected by the researchers with the aid of AI (Idea Coach), but with the language edited by the researcher to make the question easier to understand. Figure 2, Panel A shows the output of one run of Idea Coach to select answers for question A (How do you want to spend your visit with the doctor). Each iteration of the Idea Coach to provide answers to the questions will generate 15 answers. As in the case of generating questions, generating answers will produce both new answers and repeats.

fig 1

Figure 1: The first part of the set-up for the study, using a templated system and AI (Idea Coach) to suggest questions.

Figure 2, Panel B shows the four answers that were accepted by the researcher. As was the case for the generation of questions, the idea Coach returns with a mix of previously used answers and new answers. Once again the researcher can modify the answer and may return to the question section to modify the language of the question.

Figure 2, Panel C shows the self-profiling question, set up so that the researcher can find out more detailed information about who the survey taker is, what the survey taker thinks, and what the survey taker does. The language in Panel C for eight questions is left to the researcher. The two remaining questions are age and gender.

Figure 2, Panel D shows the rating question that will be used by the respondent, who in the course of the study will evaluate 24 vignettes, created by combining answers together. For right now, it is only important to keep in mind that the scale has a minimum number of points (five), and that the scale has two dimensions, first For Me vs Not For Me, and then Positive Gut Feel vs Negative Gut Feel. In this way the study generates a deeper picture of how the survey taker feels. Figure 3 shows final thoughts and the open-ended questions.

fig 2

Figure 2: Creating the answers, the self-profiling classification question(s), and the rating scale

Figure 3 (Panel A) shows the box where the respondent. Figure 3B shows the box where the researcher can record the purpose of the study. The researcher is required to write something in this box. The rationale is that the BimiLeap system is used for teaching as well as for exploring real situations. As such, it is a good idea for the person designing the study to record the rationale. The study is also meant to be searchable on a big database, requiring that the researcher select key worlds.

fig 3

Figure 3: The opened-ended question and the final thoughts about the study as written by the researcher

The respondent experience begins with the greeting to the respondent, and then the self-profiling questionnaire as shown in Figure 4. The questions were created at the set-up time (see Figure 2, Panel C). To make the introduction less daunting, the BimiLeap program presents the questions in one page, but the answers in pull-down form. The respondent provides the necessary information, including the agreement not to provide any information that would identify the respondent. For those cases where it is necessary to know who the respondent actually is, the study must be augmented by permission forms. Otherwise, the default is total privacy.

fig 4

Figure 4: The self-profiling questionnaire page

Figure 5 shows the vignette as it looks on a PC. The vignette presented to the respondent is a stark collection of phrases, put into the different groups as answers to questions. The vignette shows only the answers, not the questions. The layout of the vignette throws information at the respondent in what must seem like a ‘blooming, buzzing confusion’ in the words of Harvard psychologist William James when asked to describe the perceptual world of the newborn baby. Despite the stark appearance, the vignette is effective as a means to throw information at the respondent in a way which allows them to ‘graze’, to pick up information quickly, rate the vignette, and move on to the next. After 24 vignettes the respondent does not feel ‘drained’ by having had to read an enormous amount of prose. The sheer starkness of the layout allows the researcher to move quickly through the vignettes, rather than being caught in the quicksand of too much verbiage.

fig 5

Figure 5: Example of a vignette as it looks on a PC. Each respondent evaluated a unique set of 24 such vignettes.

The actual combinations of elements (vignettes) are prescribed by an underlying experimental design. The experimental design was developed in a fashion which allows each respondent to evaluate a unique set of 24 vignettes. Each vignette has a minimum of two elements, and a maximum of four elements. The elements are answers to the questions. A vignette never contains more than one answer from a question, but many vignettes are absent from one question or absent from two questions, respectively. Finally, the experimental design is created so that each respondent ends up evaluating an isomorphic experimental design, viz., the same mathematical design but with different combinations. This is called an isomorphic permuted design [16].

How Low-income Respondents in New York Design Their Visit to the Doctor

This study focused on the design of a visit to the doctor by the patient. The respondents were chosen to be low-income individuals. The respondents were provided by a Mind Genomics vendor specializing in on-line survey-takers. The vendor, Luc.id Inc., provides totally anonymized respondents who fit the above-mentioned criteria (Table 1).

Table 1: Specifics for study 1 (Low-income respondents design visit to doctor)

tab 1

Each respondent evaluated a full set of vignettes, as structured by the underlying experimental design. To reinforce the point made above, each respondent evaluated a totally different combination of vignettes. The ratings on the 5-point scale were transformed to a binary scale. Ratings of 5 and 4 (For Me) were transformed to 100, ratings of 3, 2 and 1 were transformed to 0. The conversion of a Likert scale to a simple binary scale makes the results easier to communicate.

After the transformation, the data from each self-defined group was subject to an OLS (ordinary lease-squares) regression. The regression is expressed by the statement: Top2 = k1(A1) + k2(A2)…K16(D4). The coefficients tell us the additive percent of respondents who will rate the vignettes 5 or 4 (viz., ‘Me’) when the vignette contains the specific element.

Often researchers and respondents feel that the evaluation of vignettes complicates an otherwise easy task. Table 2 shows the strong performing coefficients across the 16 elements, and all of the subgroups. There are no clear patterns across groups, a situation which typically appears in Mind Genomics studies when the focus is on clearly different groups, but when there is no method for understanding the deep differences in the way of thinking. The clear patterns will emerge from mind-set segmentation, shown in the next section.

Table 2: High scoring elements for the rating of ‘Fits Me’. Coefficients of 21 and above are shaded

tab 2(1)

tab 2(2)

Mind-Sets in the Population

Mind Genomics was developed as a response to the psychophysics of the 1950’s and 1960’s, which searched for invariance, for the ‘one’ or ‘correct’ relation between physical stimulus level and subjective response. Psychophysicists typically work with well-defined physical stimuli, such as tones of varying sound pressure levels, weights of varying mass, circles of different areas, or money of various amounts. The standard approach espoused by Harvard psychophysicist, S Smith Stevens was to present unpracticed respondents with stimuli of various magnitudes, instruct the respondents to rate the perceived intensity, and then plot the relation between the number assigned (so-called magnitude estimate) and the physical magnitude [17]. The relation conformed to a power equation pf the form Rating = k(Physical Magnitude)n. The exponent n becomes the slope when the foregoing power equation or power function was linearized by being plotted in log-log coordinates, viz. log Rating = log k + n(Log Physical Magnitude). Note that it was within this tradition the author HRM received his PhD with Professor Stevens, in 1969.

The linearizable power function breaks down when the rating is degree of liking. In that case the relation is a curve perhaps like a parabola. There is an optimal level of liking somewhere in the middle stimulus range [18]. Just as important, the optimum point varies across people. The optimal level of liking may be of low intensity, medium intensity or high intensity. One need only think of the addition of sweetener or whitener to coffee/ some people like sweet dark coffee, others like light but non sweet coffee, and so forth.

With the differences in optimal points, one needs to cluster the respondents to identify meaningful, although operationally defined groups, called taste segments. The same thing can be done for the different messages in a Mind Genomics study to identify mid-sets. The thinking is the same; create a measure for each individual showing the pattern of elements which drive interest, and then cluster the respondents based upon similarities these patterns.

The process to develop these segments, not of taste but of thinking, follows a straightforward path, one which does not make any assumptions but rather combines statistical analysis by k-means clustering [19], followed by regression analysis to create the ‘mind-set’ equations, and then interpretation. The interpretation of the clusters is left to the researcher, with the suggestion that there be as few clusters or ‘mind-sets’ as possible (parsimony), but with the mind-sets interpretable.

Table 3 shows the coefficients for the mind-sets. The data could have been limited to two mind-sets, but the clustering solution for two mind-sets was unclear. When three mind-sets were extracted the results made more sense. Table 3 shows the strongest performing elements for each mind-set. From time to time an element might perform well in two of the three mind-sets, almost never in three of the three mind-sets.

Table 3: Performance of the 16 coefficients among respondents assigned to the Total Panel and then to one of three mutually exclusive and exhaustive mind-sets. Strong performing elements, coefficients of 21 or higher, are shown in shaded cells.

tab 3

The three mind-sets are not mutually exclusive, but rather reflect the existence of individuals who stress different aspects of the visit with the doctor or other medical professional.

Patient Mind-Set 1: Focus on connection with the doctor after the visit

Patient Mind-Set 2 – Doctor is attentive to my needs and involves me

Patient Mind-Set 3 – Visit ends with what specifically to do.

During the past several years the emergence of AI, artificial intelligence, has become of increasing interest to researchers. The Mind Genomics program in BimiLeap now incorporates a set of queries for the strong elements of each key subgroup. Table 4 presents the AI ‘summarization’ of the three mind-sets. The summarization is not meant to replace the human interpretation but rather to highlight some possible patterns that would not have been suspected.

Table 4: AI summarization of the strong performing elements for each mind-set by using Chat GPT to identify commonalities among these elements.

tab 4(1)

tab 4(2)

tab 4(3)

During the past several years the emergence of AI, artificial intelligence, has become of increasing interest to researchers. The Mind Genomics program in BimiLeap now incorporates a set of queries for the strong elements of each key subgroup. Table 4 presents the AI ‘summarization’ of the three mind-sets. The summarization is not meant to replace the human interpretation but rather to highlight some possible patterns that would not have been suspected.

From Knowledge to Application: Creating ‘Service-Based Products’

As part of the AI ‘summarization’ by fixed queries about strong performing elements (Table 4), the notion emerged that perhaps armed with the strong performing ideas the AI might be able suggest new innovative products, services, experiences, or policies. Table 5 shows these AI-driven suggestions. It is important to keep in mind that the raw materials for these suggestions are the elements that were found to be most appealing by the mind-sets of actual people, the respondents or survey-takers participating in the study. Whether the suggestions are good or poor, meaningful or meaningless, is not the issue here. Rather, the ease with which the researcher can work with ordinary people to understand in the particulars of the wellness-illness continuum means that one can now use AI to suggest possible solutions to the problem. With a Mind Genomics study taking less than one hour to set up with the Idea Coach, about one-to-three hours to ‘field’ with a paid panel of survey takers, and about 30 minutes for complete analysis, the potential is here to systematize the array of problems and arrive at prospective solutions that can be tested in the subsequent iterations of the Mind Genomics process, perhaps a day later.

Table 5: AI driven suggestions for new or innovative products, services, experiences or policies, based upon the analysis of the strong performing elements in a Mind Genomics study.

tab 5

Table 6: The form used to create the PVI (personal viewpoint identifier). The format is a drag-and-drop powered by Microsoft Excel®.

tab 6

The PVI (Personal Viewpoint Identifier): Understanding New People through a Short Interview

The final topic of this paper is the creation of a tool to assign people to one of the three mind-sets. The notion of mind-set as a way of looking at the world is clear. What has become increasingly obvious is that people differ from each other in the style that they find most comfortable, whether the situation is buying food, interacting with friends, or even dealing with medical professionals during a visit. The differences are not in the substance of what is discussed, but rather the general style, the types of words, the types of feelings that are conveyed during the interaction. In the world of commerce this is known as the nature of the interaction such as the interaction between a sales prospect and a salesperson [20]. The knowledgeable salesperson adjusts the language and behavior to what is deemed most likely to make the sales prospect be interested in listening and perhaps even buying. In the medical world this sensitivity to how a patient likes to interact with the medical professional is also important. Often in part it is referred to as the doctor’s ‘bedside manner.’

The next question to apply this knowledge is to recognize how a person wants to be treated in the meeting with the medical professional, e.g., in the doctor’s office, in the hospital, even on the phone with telehealth. Is there a way to discover the person’s desired ‘style of interaction’ in a rushed, crowded environment, with say a new and inexperienced, young medical professional, perhaps doing a rotation in a foreign country? In other words, can the Mind Genomics results be incorporated into an easy-to-use tool, administered in less than a minute, to tell the medical professional the type of interaction that the person might find to be most comfortable. The questions are simply those asked by any consumer researcher, on the web. The analysis of the answers puts the individual into one of the three groups, with the new benefit that the medical professional has a sense of how to interact with the patient because of some new, codified knowledge [21].

During the past three years a great deal of effort has gone into creating a system which allows a person to develop a typing tool, based upon the summary data from the study, data which parallels the numerical results of Table 3, along with the option to provide feedback and recommendations to the user of the tool, and the ability to show a video, as well as obtain additional information from up to four new questions. Table 5 shows the input structure for the PVI, in three sections; names/feedback/rating questions, additional questions to be answered (chosen by the researcher), and the summary data from the three mind-sets used to create the PVI. In turn, Figure 6 shows the PVI as the respondent see it. The left panel shows database questions about the respondent. The right panel shows the six questions. The output ends up being information to the clinician about the style that the respondent finds best, viz., the style preferred by one of the three mind-sets. Thus, the clinician understands the mental ‘WHO’ in terms of what is relevant at the level of interpersonal behavior, perhaps allowing the clinician to fine tune the interaction to make it smoother [22-26].

fig 6

Figure 6: The PVI (personal viewpoint identifier), as shown to the respondent who completed the questionnaire. The results are immediately databased, and returned to the clinician and, when desired, to the patient.

Discussion and Conclusions

As the medical system continues to ‘break down’, at least in the minds of many medical professions as well as the rank-and-file individuals who are the patients, opportunities exist to improve the system, even without improvement in clinical aspects. The improvements presented in this paper are simple to discover with the Mind Genomics technology and with Idea Coach. The decisions about which improvements are most promising emerge from treating the effort as a conventional market research study. The output of the effort ends up being suggestions for behavior from the Idea Coach, and initial suggestions of promise from work with consumer survey-takers, the respondents in the study. These individuals can be stratified by who the people are (viz. geo-demographics), what the people do, what the people believe. The Mind Genomics technology through the BimiLeap platform works with those divisions of people but adds to those divisions the ability to identify new-to-the-world groups of individuals, not based on general behaviors, but rather base on their responses to granular level descriptions of the situation. It is the compilation of such data which promise the ability to know what to do, at least at the level of person-to-person interaction to create a better medical experience, here specifically a better visit to the doctor.

References

  1. Anderson R, Barbara A, Feldman S (2007) What patients want: a content analysis of key qualities that influence patient satisfaction. Journal of Medical Practice Management 22: 255-261. [crossref]
  2. Barsky AJ (1981) Hidden reasons some patients visit Annals of Internal Medicine 94: 492-498.
  3. Berry DC, Gillie T, Banbury S (1995) What do patients want to know: an empirical approach to explanation generation and validation. Expert Systems with Applications 8: 419-428.
  4. Topol E (2015) The Patient Will See You Now: The Future of Medicine Is In Your Basic Books.
  5. Siegrist Jr RB (2013) Patient satisfaction: history, myths, and misperceptions. AMA Journal of Ethics 15: 982-987. [crossref]
  6. Sia B (2016) Physician burnout: a global Lancet 388: 2272-2281. [crossref]
  7. Anderson NH (1976) How functional measurement can yield validated interval scales of mental quantities. Journal of Applied Psychology 61: 677-692.
  8. Green PE, Krieger AM, Wind Y (2004) Thirty years of conjoint analysis: Reflections and prospects. Springer US 117-139.
  9. Moskowitz HR, Gofman A (2007) Selling Blue Elephants: How to Make Great Products That People Want Before They Even Know They Want Them. Pearson Education.
  10. Davidov S, al Humaidan M, Gere A, Cooper T, Moskowitz H (2021) Sequencing the ‘Dairy Mind’ using Mind Genomics to create an “MRI of Consumer Decisions”. New Advances in the Dairy Industry. Intech Open.
  11. Losavio J, Gollub E (2022) Application of mindsets to Health education and behavior change. Programs. Health 14: 407-417.
  12. Epstein RM (2006) communication research matter: what do patients notice, what do patients want, and what do patients need? Patient Education and Counseling 60: 272-278.
  13. Newgard CD, Fu R, Heilman J, Tanski M, Ma OJ, et al. (2017) Using Press Ganey provider feedback to improve patient satisfaction: a pilot randomized controlled trial. Academic Emergency Medicine 24: 1051-1059.
  14. Kahneman D, Frederick S (2007) Frames and brains: Elicitation and control of response tendencies. Trends in Cognitive Sciences 11: 45-46. [crossref]
  15. Masege D (2022) Managed Healthcare: Ethical implications on the doctor-patient relationship (Doctoral dissertation, School of Clinical Medicine, University of the Witwatersrand, Johannesburg)
  16. Gofman A, Moskowitz H (2010A) Isomorphic permuted experimental designs and their application in conjoint analysis. Journal of Sensory Studies 25: 127-145.
  17. Stevens SS (1975) Psychophysics: An Introduction to its Perceptual, Neural and Social Prospects, New York, John Wiley.
  18. Moskowitz HR, Kluter RA, Westerling J, Jacobs HL (1974) Sugar sweetness and pleasantness: Evidence for different psychological laws. Science 184: 583-585.
  19. Likas A, Vlassis N, Verbeek JJ (2003) The global k-means clustering Pattern Recognition 36: 451-461.
  20. Moon Y (2002) Personalization and personality: Some effects of customizing message style based on consumer personality. Journal of Consumer Psychology 12: 313-326.
  21. Gabay G, Moskowitz HR (2019) Are we there yet? Mind-Gynomics and data-driven personalized health plans. In: The Cross-Disciplinary Perspectives of Management: Challenges and Opportunities. 7-28.
  22. Gofman A, Moskowitz H (2010B) Improving customers’ targeting with short intervention testing. International Journal of Innovation Management 14: 435-448.
  23. Williams S, Weinman J, Dale J, Newman S (1995) Patient expectations: what do primary care patients want from the GP and how far does meeting expectations affect patient satisfaction? Family Practice 12: 193-201.
  24. Berry DC, Mikhas IC, Gillie T, Forster M (1997) What do patients want to know about their medicines, and what do doctors want to tell them?: A comparative study. Psychology and Health 12: 467-480.
  25. Kolasa KM (2005) Strategies to enhance effectiveness of individual based nutrition communications. European Journal of Clinical Nutrition 59:S24-S30. [crossref]
  26. Kreuter M, Farrell D, Olevitch L, Brennan L (2000) Tailoring Health Messages: Customizing Communication with Computer Technology. Mahwah, NJ: Lawrence Erlbaum Associates.