Abstract
Medical students were given the task to identify situations involving patients with diabetes, the situations developed through AI. The situation became variables or questions about the nature of the patient with diabetes or about the interaction. AI then suggested four answers to each question. The test materials became the four sets of four answers, vignettes which described the nature of the diabetes patient and the nature of the interactions. Each of 50 respondents, foreign medical graduates associated with xxxx, evaluated unique sets of 24 sets of descriptions, vignettes, constructed from combinations of these 16 answers, according to an experimental design. The respondents rated the vignettes on their feelings and the expected feeling of the diabetic patient. Modeling the relation between the answers (elements) and the ratings showed three distinct mind-sets of respondents. These mind-sets, different ways of responding to the elements, were.
Introduction
In today’s world where technology is advancing, and where people have many options for health, it is important to develop a system which can educate the medical professional in the way to work with the patient. The patient is becoming a client of the health care system. It is increasingly recognized that ‘one size does not fit all,’ that people are different, and that medical communications, or more generally communications about the arc of wellness to illness, needs to be fine-tuned for the person. Salespeople know this need for differentiated communication better than just about anyone. People are not convinced by facts, but by how they react both to the facts and to the method that the facts are presented. Ask any salesperson of long-standing experience and that salesperson typically ‘knows’ what to say to prospects. The knowledge may not be formalized, but comes from the years of experience, the trial and error.
In the world of medicine, where technology changes, where the customer is often in an unpleasant situation, and where the medical professional is young, how can a bank of information be developed about what types of communications seem appropriate. We are not talking about a military phrase book with the desire to achieve a single objective, but rather a way of using communication to understand the other person, that understanding moving towards a productive relationship, and restored or maintain health.
Mind Genomics
The present study comes from the effort to create a body of knowledge about how to communicate in the world medicine, and more generally in the arc of life from health and wellness to illness and hospitalization. The approach used here and in previous reports is known as Mind Genomics. Mind Genomics is an emerging science, roughly 30 years old, which deals with the decision making of the everyday world. Whereas many published papers in psychology and behavioral economics deal with unusual situations worthy of note, e.g., counter-intuitive behaviors, Mind Genomics espouses the view that a true relevant opportunity exists through the assessment of the quotidian world, the ordinary world of the everyday, where most people spend most of their time. The origins of Mind Genomics came from interest in applied problems, such as what are the decision rules that people use to buy products? Or what are the types of phrases to which people react when they want to decide? The ordinary, everyday world presents us with uncountable opportunities to understand the rules of decision making and behavior of daily life. The Mind Genomics ‘project’ began with a departure from the conventional ‘surveys’. A survey instructs people to answer questions, forcing the people to think analytically. One need only watch a political pollster ask the interviewer some questions pertaining to hotly contested election to see that the interviewee moves from a person moving through life to a suddenly thoughtful person, one making conscious decision, one trying to figure out the ‘correct answer.; In the words of Nobel laureate Daniel Kahneman, research ends up looking at thinking Slow, thinking 2, whereas the real daily activity is thinking fast, system 1 [1]. The bottom line is that the survey methods end up moving the research to an intellectualized process, often requiring experimental situations out of the ordinary to reveal how we think. Either than, or ask people to intellectualize, even though their daily life consists of automatic behaviors.
Rethinking the Process
Mind Genomics emerged from the combination of three disciplines: Experimental Psychology (and specifically psychophysics), Statistics (specifically experimental design of independent variables), and consumer research (specifically consumer behavior through conjoint analysis [2]; Psychophysics focused on the measurement of percepts. The original world of psychophysics focused on what Harvard’s S.S. Stevens called the ‘outer psychophysics’, viz., the measurement of how strong a physical stimulus was perceived [3]. One could measure the physical sound pressure level, but that did not tell the research how loud the sound felt. Or, moving into the world of communication, one could tell a person about winning or losing a certain amount of money, but that did not tell us the ‘utility’ of winning or losing the amount of money. In simple terms, just knowing the physical strength of a stimulus does not tell us how the stimulus is perceived. When it comes to Mind Genomics, the objective is to measure the strength of perception of an idea, not a simple physical stimulus. Statistics provides a way to help us create combinations of test stimuli. Often, it is the test stimuli, the mixture, which is meaningful for one’s experience, not the individual components. The individual components tested by themselves have no real meaning. But how then does one measure the response attributed to a component of a mixture, when one can only test mixtures. It is that problem which occupies statisticians, namely, to design experiments where the respondent evaluate meaningful or reasonable mixtures, but where the analysis can pull out the contribution of the components. Consumer research, the third part of the foundation, focuses on the world of the consumer, and the world of daily activities involving communication to drive a purchase. For most consumer research, the effort is to understand the parts of the daily process in a way which serves both science/understanding and daily commerce. It is from consumer research that we learn that there are ways to communicate which are effective, ways which are not effective, and how to discover the effective method. The three foregoing fields of knowledge provide both the way to think about problems, and the way(s) to solve the problems. For this study, the objective is to understand what types of messages are felt to ‘work’ among diabetic patients, from the point of view of a young professional in the medical field. The approach of Mind Genomics is straightforward. The strategy is to present respondents (viz., survey takers) with combinations of relevant messages, in our case about diabetes, and measure the response to the combination on one or several scales. Knowing the experimental design undergirding the vignettes allows the researcher to obtain ratings of the combination, and then trace the rating to the particular message or element. The design, analysis, and even some of the interpretation is ‘templated’, allowing any person to become a researcher, or at least follow the steps properly, design an experiment, get the data processed automatically, and emerge with results that often drive new insights.
Applications in the Fields of Wellness and Illness
Mind Genomics enjoys increasing use world-wide. Early work with Mind Genomics focused on the application to evaluating how people felt about different aspects of foods [4]. The Mind Genomics approach quickly found other interested audiences, such as interest in food and good nutrition [5,6]. Finally, interest emerged for applying Mind Genomics to commercial applications in diabetes [7], and in insurance with diabetes [8]. The ability of Mind Genomics to provide a deep understanding of decision emerged in books on social issues [9] and on the practice of law [10].
Those early studies with Mind Genomics revealed that it was quite straightforward and easy to discover how people thought about themselves regarding health and medical experiences, and what would be good language to use. Those topics and discoveries, done by inexperienced young researchers, revealed how easy it was to understand the mind of people regarding health. When the same science was put into the hands of the nurse in charge of hospital discharge for congestive heart failure, the science was able to identify the mind-sets of CHF patients, and prescribe what to say upon discharge, resulting in a large decrease in within 30-day readmission’s [11]. The same approach was used some years later to understand what to say to a low-income catchment area near Philadelphia to encourage colonoscopies, an effort which doubled the number of colonoscopies simply by knowing what to say to people about the topic [12]. One of the stumbling blocks is the need to create questions and answers, and then use combinations of answers in the actual Mind Genomics study/experiment. The study can be only as good as the questions. When the researcher can ask good questions, and create meaningful answers, the Mind Genomics process works well. Often, however, the prospect of creating a set of questions and then answers comes with the daunting prospect of having to think in ways that were never part of education. People can answer questions; we are taught that in school, and it is drilled into the mind of the student. It is the framing of good questions, however, which is the problem. Students are not taught to think critically, to pose a series of questions in a way which drives understanding. One consequence of this weakness in critical thinking affects Mind Genomics. The prospective user is intimidated by the prospect of coming up with a set of four questions, and then coming up with answers to the questions. The prospect is often so anxiety-provoking as to abort the process in the beginning, as the prospective researcher figuratively throws up her or his hands, and in fruition simply aborts the effort. AI, artificial intelligence, is creating an entirely new opportunity for Mind Genomics in wellness and illness, by providing a way to obtain questions and answers in an almost automatic fashion. The use of AI to obtain these questions will be explained in this paper, dealing with the interaction of a doctor and a diabetic patient. The specific topic chosen is: I am a doctor who wants to counsel a difficult diabetic patient who does not want to change her diet plan and wants herbal remedies. The remainder of this paper presents the results of a small-scale study with 50 respondents, medical students from the clinic of Dr. Rizwan Hameed in Brooklyn, NY. The paper shows the depth of information provided by the Mind Genomics approach, information about the granularity of experience of a doctor with a patience regarding a specific condition. It is important to emphasize here the notion of granularity of experience. Rather than looking for broad findings to confirm or falsify a hypothesis in the manner of today’s science, the Mind Geonomics world view is that taken grounded theory. That is, the science evaluates what exists, that which manifests, so in an organized, structured, yet more or less realistic format. The output provides clear information about the mind as it grapples with an everyday issue in the world of medicine, but also in the world of ordinary people faced with a medical decision.
Creating the Ideas Book: AI-generated Questions and Answers
Mind Genomics as presented to the user in the ‘BimiLeap’ app (www.bimileap.com) provides a templated, almost scripted set of steps by which the researcher can begin with virtually no knowledge about a topic yet proceed within 30-60 minutes to understand a topic in depth through the use of artificial intelligence. Figure 1 and Table 1 present the steps, and some output. The Mind Genomics study begins with the selection of a study name (Figure 1, Panel A). The study name should be short. Again, and again novice researchers find it hard to give the study a short name, often because they have been so conditioned to confuse the topic with the method that thy lose sight of the simple overarching topic. The study here is ‘Diabetes’. It comes as a surprise to many novice users that the short name is correct to begin. So many of the users feel compelled to expand the name to the actual study, creating a paragraph out of a word. This comment, while not germane to the actual study, is a cautionary word to the research to keep things simple and focused. The second stage in the Mind Genomics study is to develop four questions or categories of issues, related to the topic, and which ‘tell a story.’ The requirement of ‘story telling’ is not fixed in stone, but the combination of questions should provide different aspects of the general topic. Figure 2, Panel 2, shows the second screen of the BimiLeap program. The screen is empty. Although it might not seem to be daunting, viz., to create four questions which ‘tell a story’, it is at this point that many researchers or want-to-be researchers are gripped with discomfort. In the past, quite a number of budding researchers, as well as a number of professionals, have created an account, logged into their account, named a study, and then given up when confronted with the requirement to create four questions. It was in answer to this need that Dr. Judith Moskowitz Kunstadt, sister of author HRM and herself a child psychologist, suggested that this ‘stumbling block’ might be addressed by providing a guide to creating questions. Author Rappaport, in turn, suggested a pre-set list of questions as a tutorial. Both were meaningful, but during the beginning of 2023, AI emerged in the form of Chat GPT, which allowed the researcher to query the AI. The AI would return answers. The focus of AI in Mind Genomics is to provide questions to the researcher, rather than factual answers. Figure 1 (Panel C) shows the request by BimiLeap for the researcher to provide a ‘squib’ or short description of what is desired. Figure 1 (Panel D) shows four questions which emerge from the AI.
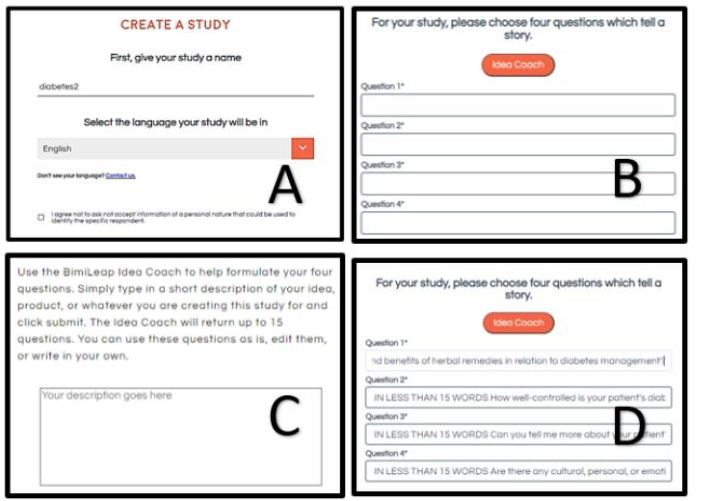
Figure 1: The set-up sets of BimiLeap. Panel A shows the choice of name. Panel B shows the request for four questions which tell a story, and the option to use Idea Coach. Panel C shows the box where the researcher enters a description of the topic to prompt the AI-driven Idea Coach. Panel D shows four questions provided by Idea Coach but edited by the researcher afterwards.
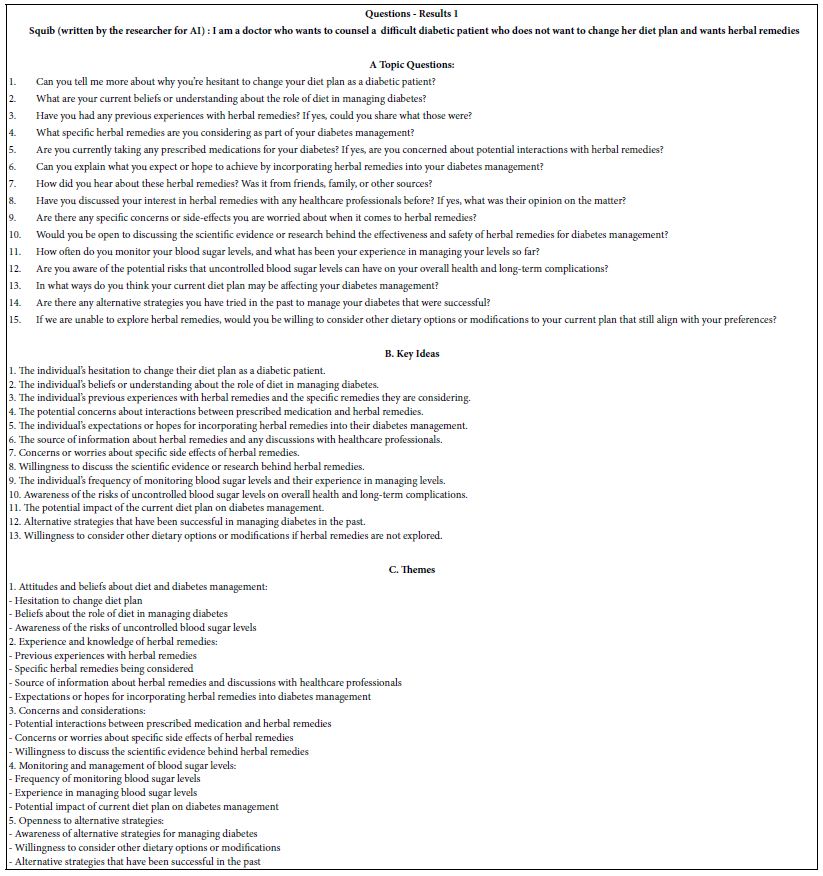
Table 1: Results from the first iteration of Idea Coach to answer the question put into the ‘squib’
When looking at the four questions, it is important to keep in mind that the use of AI is to suggest topics. A confident researcher could do equally well. The role of AI here is to give some ‘tutoring’ or ‘coaching’ to the diffident respondent. In Table 1 we will see the nature of th questions returned by the AI.
Table 1 shows the first set of results from Idea Coach. The top (section A) shows the 15 questions from the first iteration (Results 1). The topic as written in the box for Idea Coach was: : I am a doctor who wants to counsel a difficult diabetic patient who does not want to change her diet plan and wants herbal remedies.
Idea Coach begins by returning 15 questions. These questions, or indeed any set of 1-4 can be selected and inserted into the four question slots shown in Figure 1, Panel D. Once in the panel, the questions can be edited by the researcher, usually to change the question from a ‘yes/no’ or a ‘list’ to one which is more conversational, requiring a more elaborate, evocative answers.
The researcher may return to the Idea Coach, rerun the Idea Coach with the same ‘squib’, or even edit the squib to produce a better question. Idea Coach has been developed to allow the researcher a great deal of latitude in exploring different types of questions. Often the researcher uses Idea Coach to create a number of such sets of questions, because of the additional information and ‘analyses’ provided by Idea Coach when it summarizes each set of 15 questions. In other words, the material provided in Table 1 is provided for the next set of 15 questions. Finally, the questions in subsequent runs of Idea Coach with the same ‘squib’ may generate some repeating questions. Each run of Idea Coach is complete unto itself.
The Idea Coach returns with a set of analyses, as follows:
- Topic Questions. These are the questions themselves, in the form of questions
- Key Ideas: These the are questions, but in the form of an idea, rather than a question
- Themes: The AI embedded in Idea Coach attempts to summarize the 15 questions or ideas into a limited group of more general ideas.
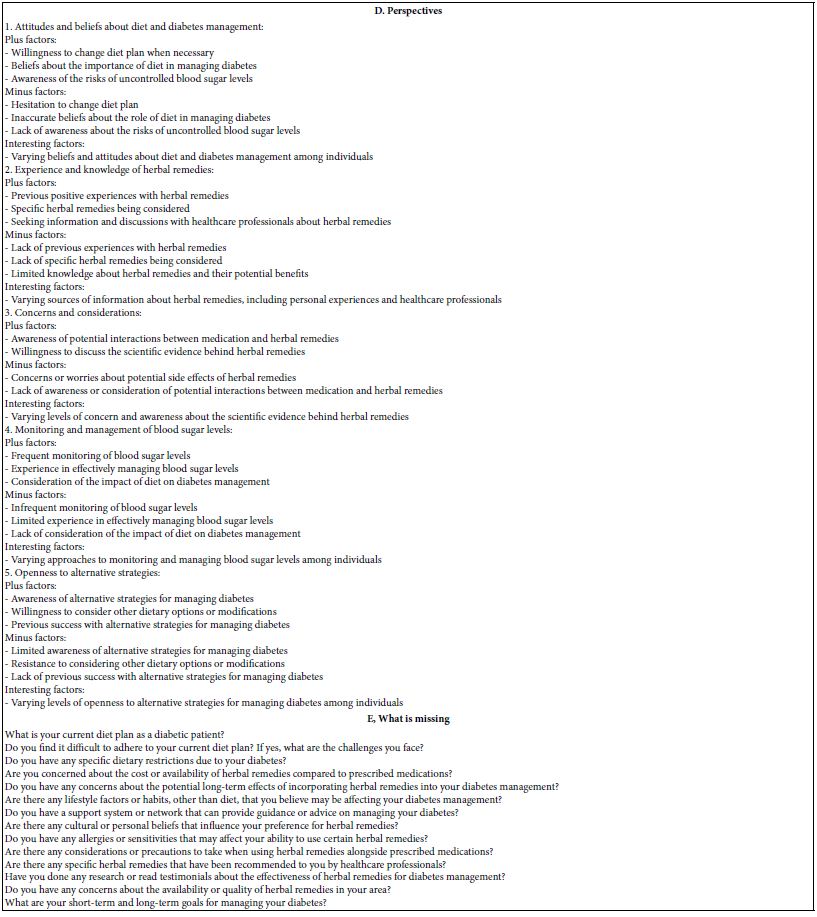
- Perspectives: The AI now attempts to move from themes to positive versus negative points of view about the themes
- What is missing: The AI now considers the topic once again, looking for issues that may have been ignored in the body of the 15 questions. Note that each of the subsequent reruns of the Idea Coach to create questions may come up with these missing ideas, but there is no causal connection. AI does not ‘learn’ from one creation of 15 questions to the next creation of 15 questions. Every effort is expended to keep the AI efforts independent from one iteration to the next.
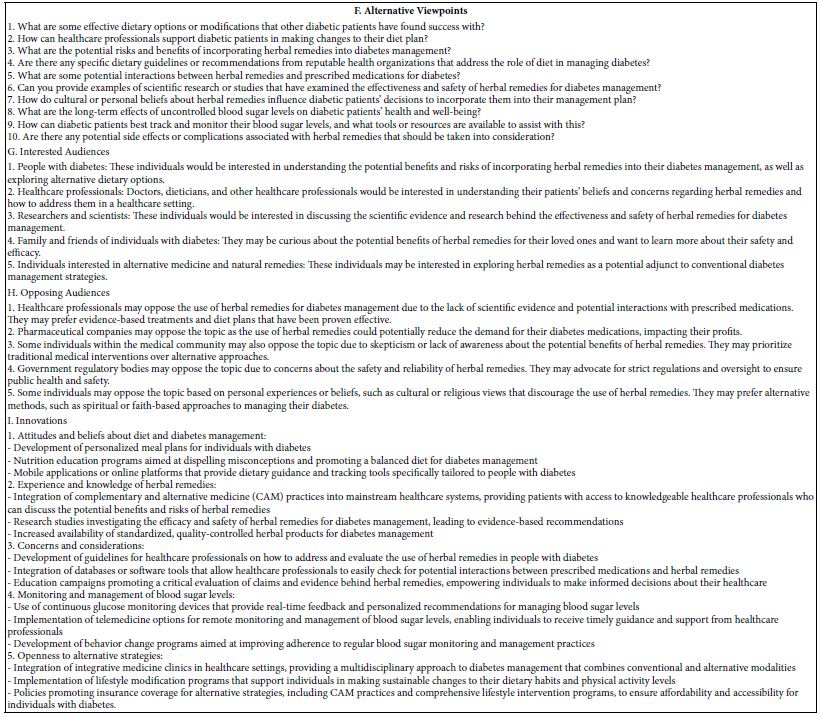
- Alternative viewpoints: AI now attempts to move to the other spectrum, to the opposite point of view, and explore those.
- Interested audiences to the ideas created by the Idea Coach
- Opposing audiences to the ideas created by the Idea Coach
- Innovations: New ideas suggested for products and services from the questions and ideas presented in this run of 15 questions.
- Tay SW, Ryan P, Ryan CA (2016) Systems 1 and 2 thinking processes and cognitive reflection testing in medical students. Canadian Medical Education. [crossref]
- Luce RD, Tukey JW (1964) Simultaneous conjoint measurement: A new type of fundamental measurement. Journal of Mathematical Psychology 1: 1-27.
- Stevens SS (1975) Psychophysics: An Introduction to its Perceptual, Neural and Social Prospects. New York, John Wiley.
- Moskowitz H, Beckley J, Adams J (2002) What makes people crave fast foods? Nutrition Today 37: 237-242.
- Drewnowski A, Moskowitz H, Reisner M, Krieger B (2010) Testing consumer perception of nutrient content claims using conjoint analysis. Public Health Nutrition.[crossref]
- Moskowitz H, Beckley J, Minkus-McKenn D (2004) Use of conjoint analysis to assess web-based communications on functional foods. Appetite. [crossref]
- Gabay G, Moskowitz HR (2019) “Are we there yet?” Mind-Genomics and data-driven personalized health plans. In: The Cross-Disciplinary Perspectives of Management: Challenges and Opportunities 7-28.
- Starke S, Gabay G, Zemel G, Gere, A, Sherman R, Moskowitz HR (2019) Frustration in seeking Information about health conditions and health insurance: Methodological presentation of a Mind Genomics cartography. Ageing Science and Mental Health Studies 3: 1-13.
- Moskowitz H, Kover A, Papajorgji P (eds.) (2022) (Applying Mind Genomics to Social Sciences. IGI Global.
- Moskowitz HR, Wren J, Papajorgji P (2020) Mind Genomics and the Law. LAP LAMBERT Academic Publishing.
- Gabay G, Moskowitz HR (2019) “Are we there yet?” Mind-Genomics and data-driven personalized health plans. In: The Cross-Disciplinary Perspectives of Management: Challenges and Opportunities 7-28.
- Oyalowo A, Forde KA, Lamanna A, Kochman ML (2022) Effect of patient-directed messaging on colorectal cancer screening: A randomized controlled trial. JAMA Network Open 5. [crossref]
- Craven BD, Islam SM (2011) Ordinary least-squares regression. The SAGE Dictionary of Quantitative Management Research 224-228.
- Gofman A, Moskowitz H (2010) Isomorphic permuted experimental designs and their application in. conjoint analysis. Journal of Sensory Studies 25: 127-145.
- Hardy MA (1993) Regression with Dummy Variables (Vol. 93) Sage.
- Ahmed M, Seraj R, Islam SMS (2020) The k-means algorithm: A comprehensive survey and performance evaluation. Electronics 9: 1295; https: //doi.org/10.3390/electronics9081295
- Smith LL, Lake NH, Simmons LA, Perlman A, Wroth S, Wolever RQ, et al. (2013) Integrative health coach training: a model for shifting the paradigm toward patient-centricity and meeting new national prevention goals. Global Advances in Health and Medicine. [crossref]
Creating Answers to Questions Using AI
Once the researcher has created the set of four questions, with or without the help of AI-driven Idea Coach, it is time to create the answers or ‘elements’, four for each question. It will be combinations of these answers which will constitute the test stimuli, the so-called vignettes or combinations of answers. In the actual evaluation done by the respondents, the respondent will see only unconnected combinations of answers. Figure 2 shows the second section of the study, where the question is presented at the top, and the research or Idea Coach is requested to present four answers. Figure 2 Panel A shows the request for four answers. Figure 2 Panel B shows the answers that were selected by the research, and perhaps edited manually to make the answer easier when the answer in embedded into the test vignette.

Figure 2: Panel A: The first question, and the request for Idea Coach. The question has been modified so that Idea Coach will return with a short answer. Panel B: The four answers returned by Idea Coach and modified slightly by the researcher.
It is important, therefore, that the answers be both relevant, as well as paint a word picture through a phrase. For this reason, the Idea Coach one again provides the question, then 15 answers. The researcher may repeat the Idea Coach, indeed as many times as desired. Each repetition generates 15 answers. The researcher must select a total of four answers, and in free to edit the answers to make the answers seem less like a list, and more like a stand-alone description.
The Idea Coach once again stores each iteration, allows the researcher to edit the answer, and even allows the researcher to go back and edit the question to instruct the Idea Coach to focus more on expanding the answer. In the end, however be, it is the researcher who chooses the answers, edits the answers, even edits the question to be more general or to move to a different ‘angle’. Idea Coach returns with one page for each iteration of answers for each question. Thus, Idea Coach generates a minimum of four pages of results when Idea Coach is used once for each question but could generate 20 pages of answer when Idea Coach is applied five times for each question.
Finally, as was the case with the questions, Idea Coach provides additional AI summarization, synthesis, and exploration for each page. At the end of the creation of the answers, when all have been selected, and the researcher moves to the next step, the BimiLeap program returns the now-complete Idea Book to the research in the form of an Excel file. Each page or each tab of the Idea Book has the squib or the specific question on topic, followed by the AI analysis. The book can be quite large. For example, if the researcher were to use Idea Coach five times for the squib and each of the four questions, Idea Coach would with return with 25 pages of results, one per page or tab, with page capturing the output from AI as well as the AI summarization of the suggested questions or answers.
Once the researcher has selected the elements for the study, the BimiLeap program moves to the orientation and the rating scale. Figure 3 shows the orientation (Panel A) and the rating scale (Panel). The rating scale shown below is a minimal scale, with very little information presented to the respondent about the purpose of the study. This minimalist approach is adopted to allow the elements, the specific phrases, to convey the information. Any additional information presented in the respondent orientation ends up weakening the contribution of the actual elements.
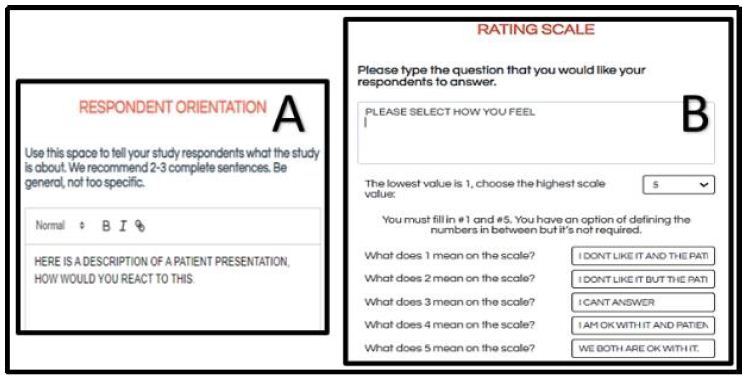
Figure 3: Respondent orientation (Panel A), and anchored rating scale (Panel B)
The five scale points are labelled. Close inspection of the questions show that there are two dimensions. The first dimension of the scale is the respondent’s own feeling, whether that be like it or don’t like it, respectively. The second dimension of the scale is what the researcher thinks the rating will be as assigned by the respondent. Again, there are two options, like it or don’t like. The actual scale seems daunting at first, and indeed professionals often complain that they cannot make sense of the scale. Even worse, often the respondent feels that the two dimensions interfere with each other, and in frustration these professionals simply stop participating. Although disappointing, the response of professionals is understandable. They are trying to ‘assign the right answer’ and find rating scale hard to ‘game’.
Rating question: Please select how you feel
1=I don’t like it and the patient does not like it
2=I don’t like it but the patient is ok with it
3=I can’t answer
4=I am ok with it but the patient is not ok
5=We both are ok with it
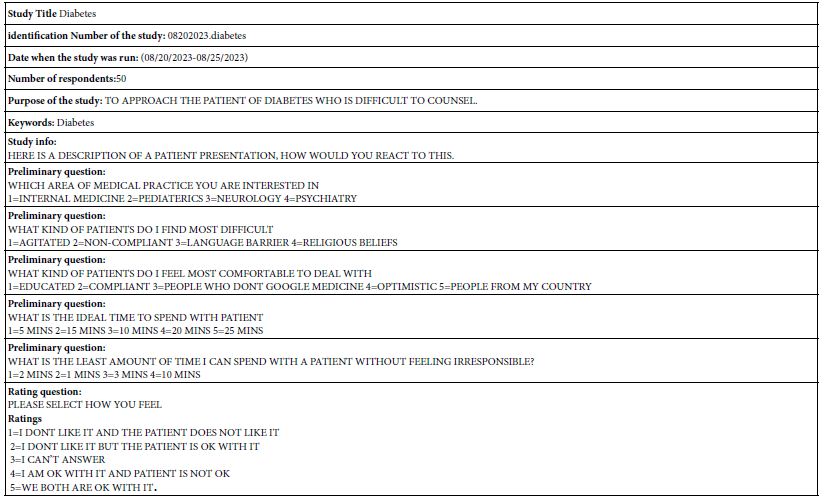
Table 2 shows the actual information about the study, taken from the information used when the researcher set up the study. The study set up enables the researcher to obtain a great deal of additional information about the respondent by means of the preliminary questions, also known as the self-profiling classification questions. The BimiLeap program automatically collects information on the respondent’s age and gender (not shown in Table 2). In addition, the program allows the researcher to ask up to eight additional questions, and for each question allow up to eight answers. The preliminary questions in Table 2 show the types of information that can be obtained from the study.
Table 2: Study information obtained from the set-up, as well as the number of respondents who completed the study
Launching the Study and the Respondent Experience
Once the researcher has finished setting up the study and previewing it, the researcher launches the study. The actual Mind Genomics study is completed on the internet. The participants receive an invitation to the site, log in to the site. The BimiLeap program provides a number of ways to acquire the respondents, as shown in Figure 4. These range from having the BimiLeap program allow the researcher to tailor a panel from various sets of qualifications, or to have the BimiLeap representative create the panel. Other ways include working with a different on-line panel provider instead of Luc.id, Inc., or sourcing the respondents oneself. It is this last option that was selected by the researchers. The respondents were young medical students, interns, and residents associated with the clinic of Dr. Riswan Hameed in Brooklyn, NY, USA, as well as fellow medical professionals of the respondents scattered around the world. All respondents participated voluntarily. The BimiLeap program is set up to preserve respondent confidentiality. No personal identifying information is kept as part of the study. When private information is obtained, it is usually in the form of general questions in the self-profiling classification, but that information does not suffice to reveal respondent identity.
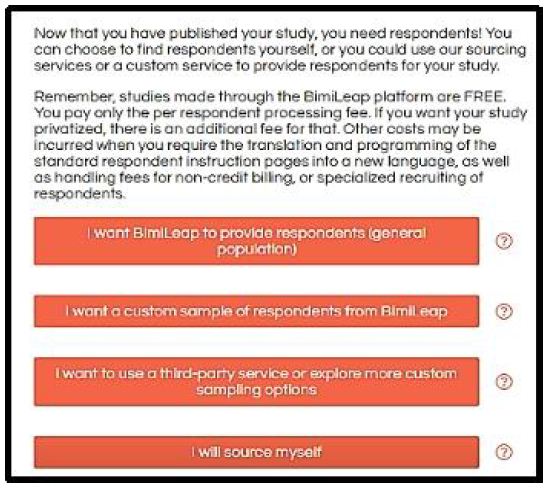
Figure 4: Sourcing options for respondents
Once the respondent agrees to participate, the study begins. The respondent reads the very short introduction, and then proceeds to the self-profiling classification. To keep the appearance spare and ‘clean’, the self-profiling classification questionnaire comprises a pull-down menu, shown in Figure 5. The respondent pressed the check button, and the appropriate question drops down, along with the answer.
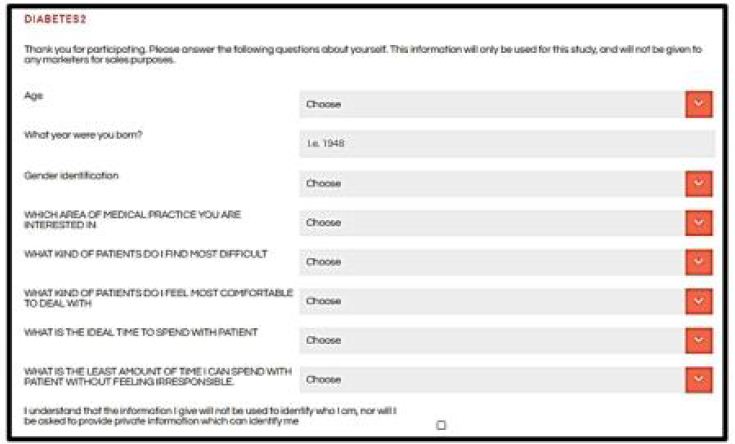
Figure 5: The self-profiling classification, completed by the respondent at the start of the study. The classification comprises a set of pull-down questions.
Rather than giving each respondent a set of 16 phrases, the four sets of answers to the four questions, Mind Genomics creates small, easy-to read s/. The basic experimental design used by Mind Genomics is a simple 4 variable x 4 level main effects design. The design comprising 16 elements generates 24 combinations. Each combination comprises a minimum of two elements or answers from (different) questions, and a maximum of four elements or answer from (different) questions. No question ever contributes more than one answer or element to a vignette. However, the underlying design ensures that quite a number of the vignettes are absent from one element or answer form a question, and some vignettes are absent two elements or answers from two questions.
The experimental design ensures that each of the 16 elements or answers appears in a statistically independent fashion. This will become important when the data are submitted to OLS (ordinary least-squares) regression analysis to link together the elements and the responses. Furthermore, the combinations are not all complete, allowing the researcher to use the regression analysis to estimate the absolute level of contribution of the elements to the ratings [13]. This will be discussed below.
A continuing issue in consumer researcher is the implicit belief that the test is being conducted with the stimuli that are believed to be important. The reality is that when the researcher tests combinations of answers, it is not clear that these are the appropriate combinations to test. The researcher may end up testing these combinations in order to reach closure, and get the study done. Such a requirement means that the test stimuli, the vignettes, end up being the ‘best guesses’ about what to test.
The Mind Genomics system permuted the combination of 24 vignettes creating new combinations with the same mathematical properties. All that has changed is that the combinations change, but the property of statistical independence is maintained, along with the property that each vignette has at most one answer from a question. This approach, the permuted experimental design [14] ends up allowing the researcher to have each respondent test a different set of vignettes, but at the same tie a set of vignettes precisely designed for OLS regression at the individual respondent level.
Figure 6 shows a test combination that was evaluated by the respondent. The question and rating scale are at the top. Below, and indented are the elements as prescribed by the underlying experimental design. The elements are simply presented in unconnected form. No effort is made to present a felicitous, well-crafted combination. Rather, the objective is to present the respondent with the necessary information in a simplistic manner. Respondents move through these vignettes quite quickly, ‘grazing’ for information in the manner called by economic Daniel Kahneman as System 1. The word ‘graze’ is particularly appropriate here. Rather than forcing the respondent to adopt an intellectualized, judgment approach, the Mind Genomics system seemingly ‘throws’ the information at the respondent in a manner reminiscent of daily life. It is left to the mind of the respondent to process the information and assign a rating.
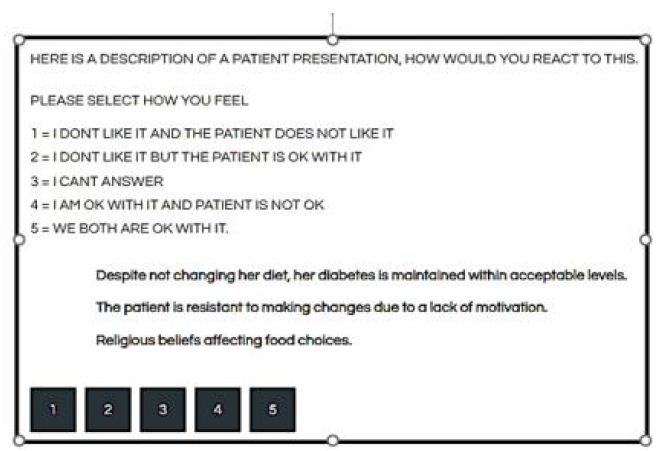
Figure 6: Example of a test vignette evaluated by the respondent
It is worth noting here that all too often professionals attempt to be analytical in the evaluation of these vignettes, a behavior which ends up being frustrating both for them and for the researcher. The professionals often try to ‘answer correctly,’ looking for underlying patterns to guide. All too often, the respondents get angry, irritated, refuse to participate, or simple complain at the end of the evaluation. Although the data ends up being quite information, especially after the respondents are clustered or segments by the pattern of their responses, many of the critics of Mind Genomics simply reject the system as being, in the words of Harvard’s legendary psychologist, William James, a ‘blooming, buzzing confusion.’ Nothing could be further from the truth, as will be shown below, especially once the clustering is done.
Uncovering Patterns – How Elements Drive Responses
The objective of Mind Genomics is to uncover patterns in daily life. The test stimuli are the different vignettes, 24×50 or 1200 mostly different vignettes across the 50 respondents, with each respondent evaluating 24 combinations, and most combinations different from each other as a result of the deliberate permutation strategy. The rating scale, however, is not simple, but rather asks two questions, namely how does the medical specialist feel about the vignette in relation to diabetes management, and how does the medical specialist think the patient will feel about the vignette in relation to diabetes management. There are two answers, OK and not OK. (Note the use of the colloquial, which in fact is the lingua franca of the everyday).
The choice of a ‘two-faceted’ scale is deliberate. The single scale allows the researcher to probe how the medical specialists feels. There are really two scales here, a scale for how the medical professional feels (ok vs. not ok), and for how the medical professional thinks the patient will react (ok vs. not ok).
The easiest way to deal with this data is to create five scales by simple transformation:
Professional OK Ratings 5 and 4 transformed to 100, ratings 3, 2 and 1 transformed to 0
Professional Not OK Ratings 1,2 transformed to 100, ratings 3,4, and 5 transformed to 0
Patient OK Ratings 5 and 2 transformed to 100, ratings 4,3 and 1 transformed to 0
Patient Not OK Ratings 1 and 4 transformed to 100, ratings 2,3,and 5 transformed to 0
I can’t answer Rating 3 transformed to 100, ratings 1,2,4 and 5 transformed to 0
To all the transformed variables a vanishingly small random umber is added. This is a prophylactic step to ensure that all of the newly transformed binary variables exhibit some minimal variability, allowing the ordinary least-squares regression to work.
Once the transformation is complete, the five newly created variables can be related to the presence/absence of the 16 elements by means of a simple linear equation:
Binary Dependent Variable = k1(A1) + k2(A2).. k16(D4)
The database comprises columns which ‘code’ the structure of the vignette. Each of the 16 columns is reserved for one of the 16 elements. When the element or message appears in the vignette, dictated by the underlying experimental design, the value is ‘1’ for that element and that vignette. When the element or messages does not appear in the vignette, again dictated by the underlying experimental design, the value is ‘0’. The coding method is called ‘dummy variable’ coding because all we know about the variable is that it either appears in the vignette or does not appear in the vignette [15].
The regression analysis is run five times, using the equation above. The regression model is estimated without an additive constant, so that all of the variation can be traced to the contribution of the 16 elements. The experimental design ensures that all 16 elements are statistically independent of each other, so that one can compute ratios of coefficients in a meaningful manner.
The interpretation of the coefficients is straightforward, and easiest to explain by a simple example. A coefficient of +20 for an element means that when the element is inserted into a vignette, there is an increase of 20% in the likelihood that the vignette will reach the value of 100.
Before looking at the results for the total panel for the newly created binary scales, it is helpful to anchor the performance. A coefficient of +4 or lower is simply not shown. It is irrelevant as a driver of the specific binary variable. A coefficient of approximately +15 to +16 approaches statistical significance. Important coefficients, however, move beyond simple statistical significance to much higher values, here +21 or higher.
Tables 3 and 4 show the coefficients for the total panel. The five columns show the newly created binary variables. The numbers in the body of Table 4 are the coefficients. Coefficients less than 5 are simply not shown. Coefficients 21 or higher are shown in shaded cells. The most important outcome from Table 4 are that no elements perform strongly for any newly created dependent variable. There are some which are close, but none reach the imposed threshold of a coefficient of 21 or higher.
Table 3: Coefficients for models relating the presence/absence of elements to the newly created binary variables
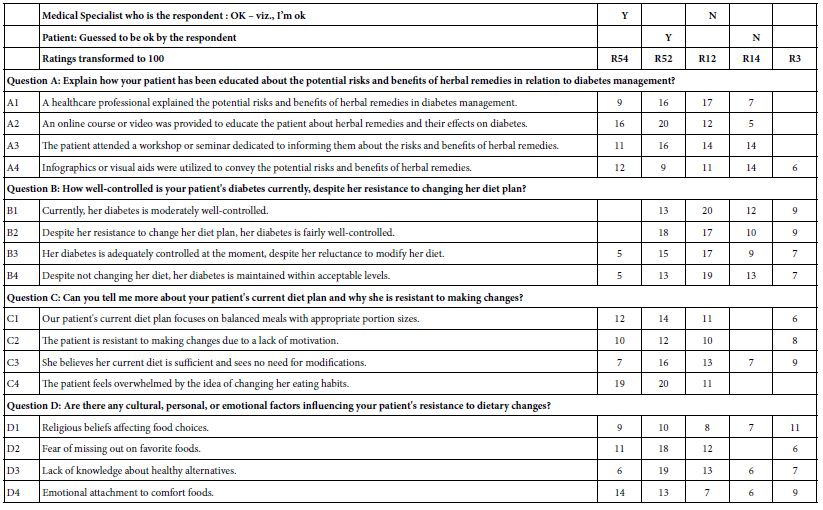
Table 4: Coefficients for models relating the presence/absence of elements to the Binary dependent variable=R54 (Medical professional says OK, medical professional believes patient would say ok). The table shows the total panel, and then the coefficients divided by the types of patients the respondent dislikes versus the types of patients the respondent likes.
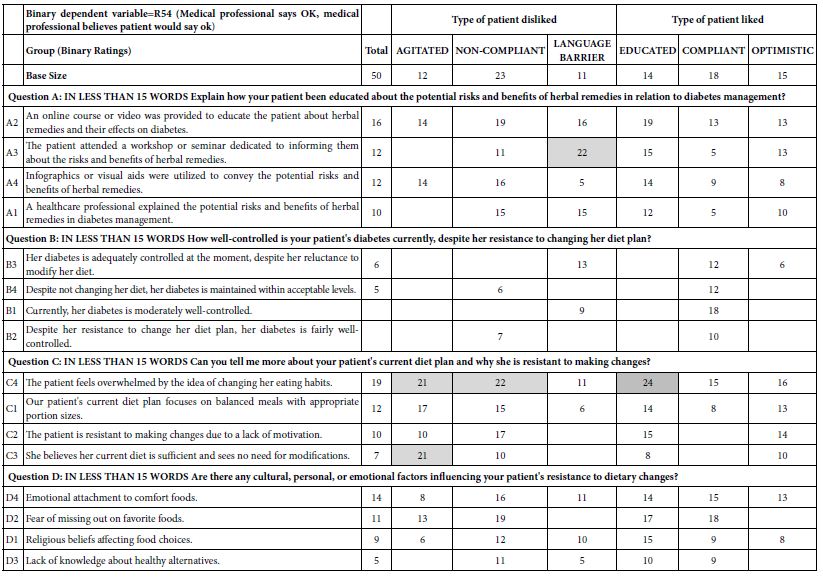
The analysis now moves to dividing the respondents by the type of patients they dislike strongly, and by the type of patient they like stray. The coefficients appear in Table 5. Once again, the elements with coefficients lower than 5 are shown with blank cells, and the elements with strong coefficients greater than or equal to 21 are shown with shaded cells. There are five elements which perform strongly in the different breakouts of respondents. Although these are strong performing elements, the reality is that there is no clear pattern. Were we not to ‘know’ the meaning of the elements, we would say that knowing what the medical professional likes and dislikes gives us a few stronger opinions, but that is all. The reason we see that there is no pattern comes from the reality that the elements have cognitive meaning, and thus we can see similarities when they exist, or at least superficial similarities. The use of test stimuli with deep cognitive meaning, our elements. Allows us this ability to reject random strong performing elements because there is no apparent pattern emerging, despite that strong performance.
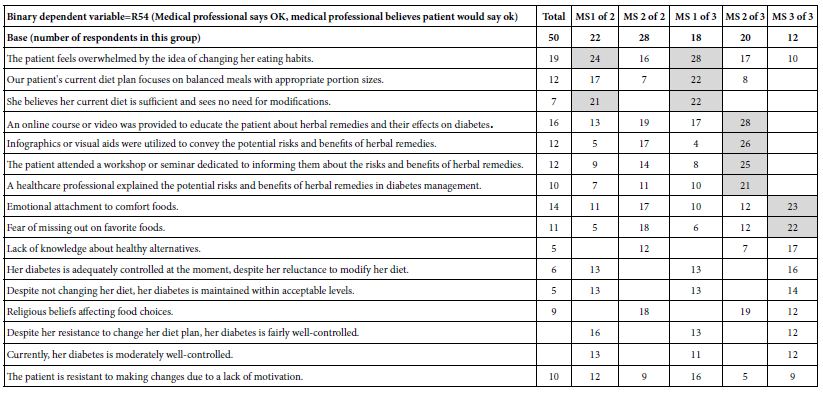
Table 5: Coefficients for models relating the presence/absence of elements to the Binary dependent variable=R54 (Medical professional says OK, medical professional believes patient would say ok). The table shows the total panel, and then the coefficients divided by two and then three emergent mind-sets.
Uncovering New-to-the-World ‘Mind-Sets’
Mind Genomics adds value to our understanding by dividing the respondents into groups based upon the pattern of their coefficients. Rather than assuming that respondents who seem to think alike when they describe themselves (Table 5), Mind Genomics looks for strong performing, interpretable groups of people in the population, these groups emerging from how the people respondent to a specific set of granular messages. These are the so-called ‘mind-sets’. Mind-sets are defined as homogeneous groups of individuals, the homogeneity limited to a specific and concrete situation. Mind-sets emerge as statistically coherent groups for the situation, but people in the same mind-set for one situation may be in different mind-sets for another situation.
Creating the mind-sets is straightforward, to a great extent the result of creating the vignettes according to an underlying experimental design, and then permuting the design. Each respondent thus ends up evaluating an ‘appropriate’ but random portion of the design space. The word ‘appropriate’ is used in view of the subsequent analysis, which creates an individual-level model for each respondent. Although the respondents each evaluated different sets of combinations, their individual sets of ratings can be submitted to the regression analysis described above. The result for this study is 50 rows of coefficients, one for each respondent. Those 50 rows can be clustered into a small number of groups, such as two or three groups, not based upon who the respondent is, but rather on a measure of similarity between the rows, or more correctly, a measure of dissimilarity between pairs of rows. Rows whose set of 16 coefficients move in ‘opposite directions’ suggest that the respondents see this particular world of diabetics n different ways. Rows who set of 16 coefficients move in the same way suggest the respondents in this particular world of diabetics see the world in the same way.
The computational approach is known as k-means clustering [16]. The clustering ends up dividing the group of 50 respondents into two groups, and then into three groups. These groups are ‘mind-sets.’ Table 6 shows the coefficients for the Total Panel, then for the two miond0-sets (viz., two clusters), and then for the three mind-sets (viz., three clusters).
Table 6: The underlying ‘stories’ (viz., interpretations) of the strong performing elements for each mind-set
Jumping out of the table is the far greater number of strong performing elements for the three-cluster solution. Not only are there’re more strong performing elements of coefficient 21 a d higher, but a story begins to emerge. The story emerges from the data and is not imposed. It is the meanings of the ‘cognitively rich’ elements which tell the stories:
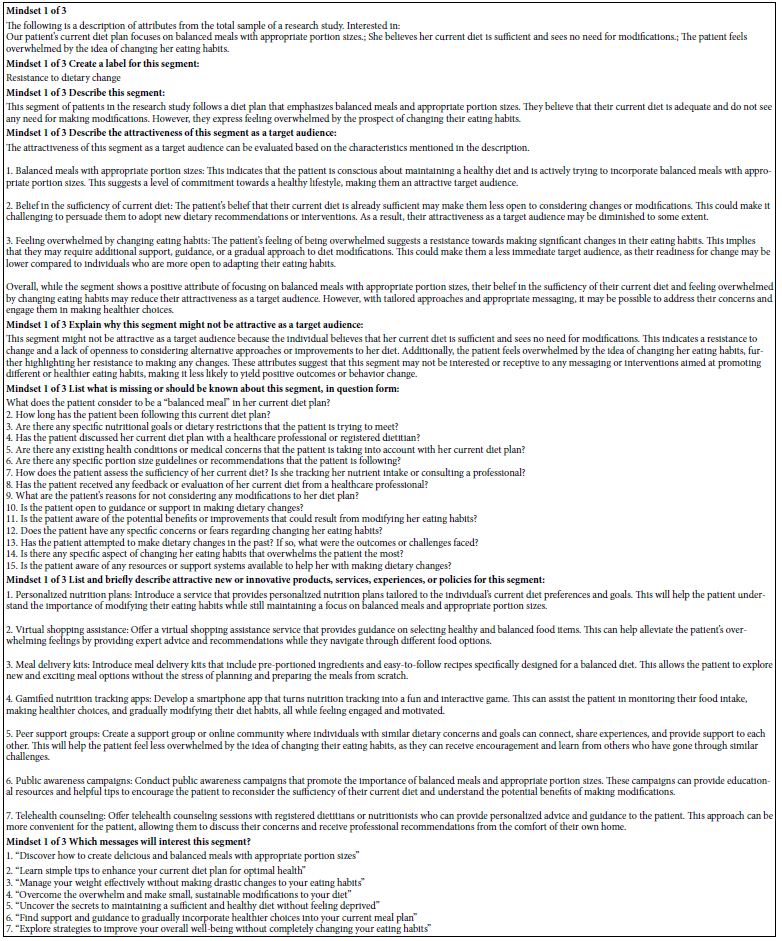
Mind-set 1: The medical professional focuses on eating
The patient feels overwhelmed by the idea of changing her eating habits.
Our patient’s current diet plan focuses on balanced meals with appropriate portion sizes.
She believes her current diet is sufficient and sees no need for modifications.
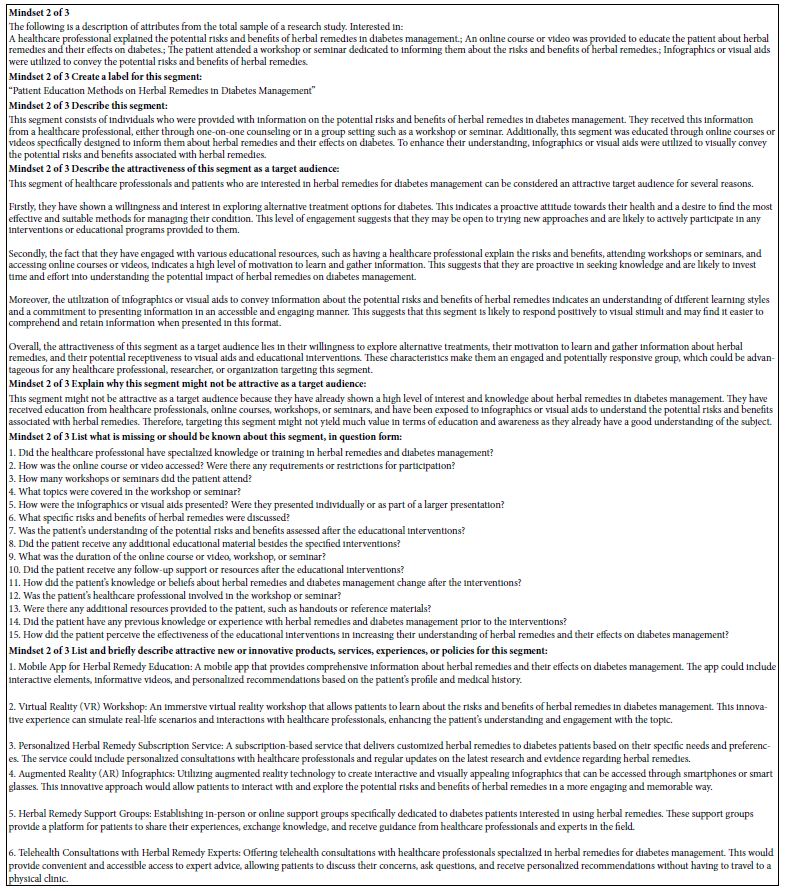
Mind-Set 2: The medical professional wants to educate the patient about herbal remedies.
An online course or video was provided to educate the patient about herbal remedies and their effects on diabetes.
Infographics or visual aids were utilized to convey the potential risks and benefits of herbal remedies.
The patient attended a workshop or seminar dedicated to informing them about the risks and benefits of herbal remedies.
A healthcare professional explained the potential risks and benefits of herbal remedies in diabetes management.
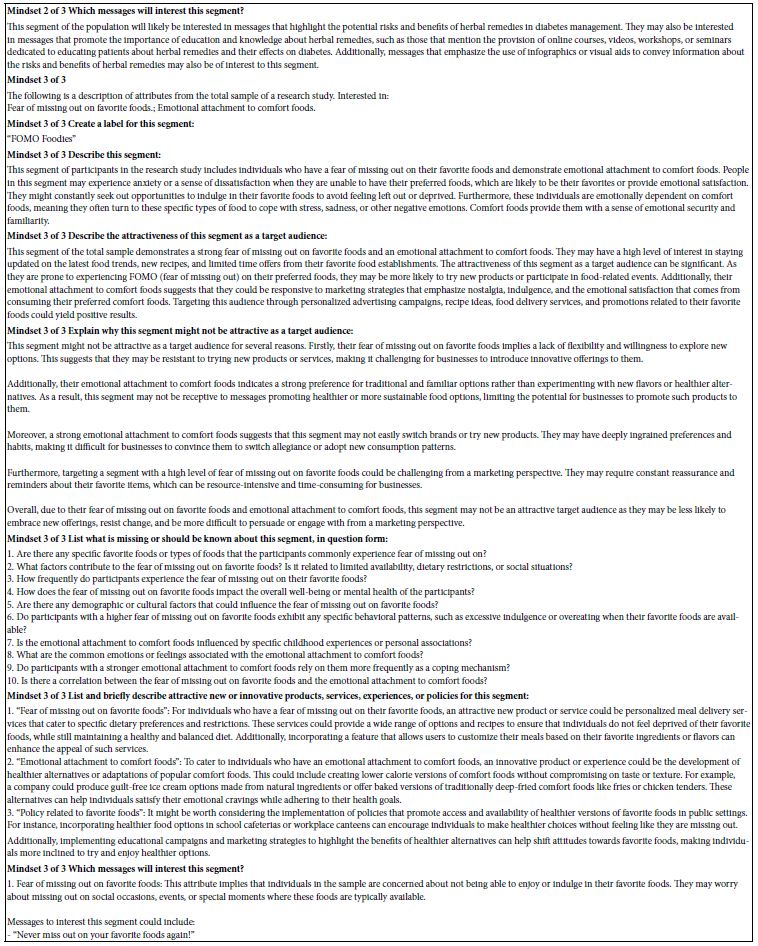
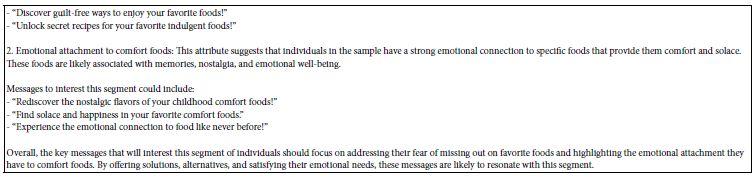
Mind-Set 3: The medical professional is sensitive to the patient’s fear of missing out on favorite foods.
Emotional attachment to comfort foods.
AI can be used to summarize the data from the different groups. Table 7 presents the AI analysis for each of the three mind-sets, from the three-mind-set solution. Once again the researcher should winnow down the large amount of data produced by Mind Genomics. Rather than trying to synthesize a story using all the elements, a story based upon the coefficients, the Mind Genomics program uses only those elements with coefficients of 21 or higher. There are far fewer elements to generate the pattern. The AI creates its own story from the data, but at least that story is grounded in the data from strong performers only. Table 8 shows the answers to the queries put to AI, in the effort to discern the ‘story’ in the pattern generated by the strong performing elements.
Table 7: Calculation of the IDT=Index of Divergent Thought, which measures the strength of the coefficients, and thus the strength of the study.
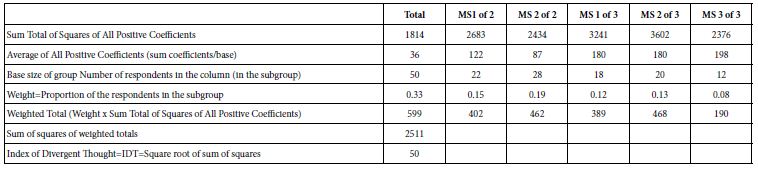
Gamifying the Process –‘How We Did We Do, and How Much Better Can We Do?’
Mind Genomics is a science emerging only in recent years. With the ease, rapidly, and low cost of doing these experiments, the natural question is to ask, ‘how good are the data?’ After all, when a study can be designed, executed and analyzed in a matter of hours, with very low cost, by virtually anyone, how does one differentiate between good science and poor science? One cannot see the researcher. It might be possible for a researcher to offer an ‘oeuvre’ of work across several years, so that the overall quality of this oeuvre can be judged. But what about one-off studies which may be brilliant? Or, equally likely, maybe a simple waste. One way to assess quality is to look at the coefficients generated by the study. The vignettes are evaluated by people who cannot ‘guess’. When the coefficients are low, the coefficients are essentially ‘noise’. When the coefficients are consistently high, however, we must conclude that a meaningful pattern is emerging. Table 8 shows a way of estimating the performance of the elements. The calculations are simple. One divides the data into the six groups (total, two groups from the two-mind-set solution, three groups from the three-mind-set solution). Each has a relative base size, as Table 7 shows. The calculations show the progression to a single number, 50, which is the average squared coefficient. It is called the IDT, index of divergent thought. There are no norms for the IDT, at least not yet. When thousands of studies are done, there will be sufficient values for the IDT to be considered across topics, ages of researchers, and so forth. With this ability to ‘gamify’ the process, developing the IDT, one can imagine the competition among researchers. One potential of gamification is the ability to offer prizes to the highest-scoring studies in a topic presented as a challenge in a prize competition. The study here on diabetes is only one topic in diabetes. What might be the outcome if a ‘meaningful prize’ were to be offered for all studies having IDT values of 70 or higher, with additional incentive for studies with IDT values of 80 or higher. Such an approach done world-wide might well produce a plethora of new ideas.
Assigning a New Person to a Mind-Set
The final step in the analysis of these data creates a tool, a mind-set assigner, which enables the medical professional to assign a new person to one of the three mind-sets for this granular, relatively minor issue. A key benefit of the Mind Genomics project is the ability to do the research quickly and inexpensively. Yet, it is simply not realistic for a new person to have to go through the research protocol, evaluate 24 vignettes, and be assigned to a mind-set. The process would simply not work because there is no way to incorporate the data of this new respondent into the original data, rerun the data one again, this time with the 51st person and then re-discover the mind-sets anew.
Figure 7 shows the system developed to assign a new respondent to a mind-set. This is called simply the mind-set assigner. The approach works with six questions, taken from the original study, and runs a Monte-Carlo c with the patterns of these six questions. The outcome is the selection of the proper six questions from the original study, and the assignment of each of the 64 possible response patterns to one of the three mid-sets.
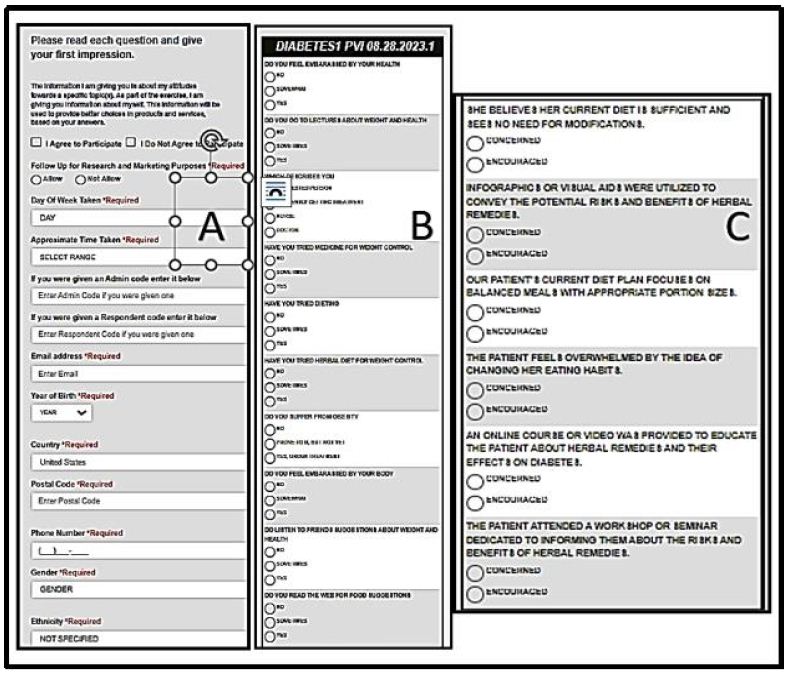
Figure 7: The Mind-Set Assigner tool. Panel A shows the bookkeeping information, including the request for participation. Panel B shows additional ‘background questions’ requested of the respondent. Panel C show the actual se of six questions, and the two possible answers.
The Mind Set assigner comprises three panels:
Panel 7A shows the introduction as the respondent sees it. The introductions requests permission to acquire the data and presents the respondent with a variety of questions about background. All, some, or even just the permission itself can be asked. The researcher sets up the specific information desired.
Panel 7B shows specific background questions that can be asked of the respondent. These questions are additional to the actual assigner tool. Often when one wishes to ‘type’ the larger population, the objective ay be to add in additional information about the individuals in the different mind-sets. Panel 7B allows the researcher to ask up to 16 additional questions, with up to four possible answers for each.
Panel 7C shows the six questions in the mind-set assigner, these questions taken from the actual study. The questions can be slightly modified by the researcher, but good practice dictates that the questions be the same as the elements of the study. The order of the six questions is randomized from one respondent to the next. It is the pattern of responses which is used to assign the new person to one of the three mid-sets.
It is worth noting that the researcher can do several studies, create mind-set assigning tools for each, and then combine these in a simple system allowing the research to ‘sequence the mind’ of the respondent.
Discussion and Conclusions
The Mind Genomics way of thinking, from conceptualizing a problem to providing a rapid and affordable experiment, offers science a new way to understand how people think. Researchers are accustomed to expensive, well-thought out, often laborious and time-consuming studies. One of the great problems today is the head on collision of the need to understand the person but the cost and time necessary to do so. So very often much of the research effort is spent getting the funding to do the research, and then cutting the problem down to a size where it can be solved. As a consequence, much of today’s research is done by committee, piecemeal, after inordinate wait, and only when the funding comes through. These are factors which act as a drag on our understanding of people, and our use of the data to improve the lives of people.
The study reported here represents one simple project, readily done by one or a few researchers, at low cost. Beyond the benefits of speed and cost lie the potential to create a corpus of knowledge about people in their daily lives, how they react, and how they interact. Up to now there has been a dearth of knowledge about people from the point of view of their everyday lives, what they think, what they say, and how they should say it. The Mind Genomics project provides this corpus of knowledge in a scalable form, anywhere in the world, and at any time. One could imagine one of these studies for each country, for each topic area. The opportunity to create this database of the mind may now be a reality. This paper shows the tesserae, the pieces of that reality, for a specific, granular, almost minor topic. One need not ‘triage’ the research, at least for these types of topics. All the topics can be addressed. The vision of science driving a personalization of the medical experience, with better interactions, healthier populations, and improved economics, lies within reach [17].
Acknowledgments
The authors would like to thank Dr. Rizwan Hameed for the ongoing inspiration to pursue this work.
References