DOI: 10.31038/MGSPE.2022212
Abstract
We present the results of two Mind Genomics cartographies, each focusing on the discovery of common points of view in areas of political disagreement (discussions about Israel among New York City Jews), and areas of open hostility (discussions about what is needed to stop hostilities and begin a peaceful future enjoyed by Palestinians and Israelis). The cartographies searched for specific messages which drive respondents to feel that these messages ‘will work.’. We suggest that an iterative, inexpensive, rapid set of such cartographies can quickly reveal common mind-sets in mutually argumentative and even openly hostile populations. The promise of such iteration is the discovery of topics of mutual interest and agreement in a manner which is practical, which increases insight and wisdom, and which can produce reference databases about the mind of the antagonist, becoming a guide for productive negotiations. We suggest that the effort to find the ‘right messages’ through extensively reasoned efforts followed by an effort to validate these messages be replaced by a mechanistic, iterative, rapid, inexpensive system requiring just a few hours from start-to-finish for each iteration.
Introduction
The world of people is no stranger to difficult issues. Whether the issues are people vs. the environment (viz., global warming), people vs. economic realities (we all cannot really live equally well), or people vs. people (long standing political disagreements, quick starting personal disagreements), there are always conflicts. And there are no prospects for the conflicts to end, or even to be resolved simply. Efforts as grand as the League of Nations and the United Nations, or as intimate as couples counseling continue to reveal the almost absolute impossibility of imposing harmony in an environment when there are different goals, different viewpoints, different levels of power and influence.
The foregoing is a truism. Anyone reading newspapers, sitting in a political debate, or sitting in a home with adolescent children and their parents know about the need to find ways to have meaningful conversations. The real issue is how to do it. Conversations themselves will not solve problems, but without the conversations the problems will never be solved, except through force. And force will not keep the problem solved when the balance of power shifts, when the anger builds. Conversations will help the parties involved come to an agreement, accepting each other. This paper focuses on two difficult problems, one involving the New York Community of identified Jewish people, and the other involving Palestinians and Israelis. The objective of both studies was to assess whether one apply a method hitherto used by marketers (Mind Genomics) to issues of public discourse, and specifically, divisions about Israel. The first was from the point of view of Jews in the United States, where there are many opinions about Israel, not all positive, not all negative [1-5]. The second was from the point of view of self-described Israelis and Palestinians [6-9]. The two projects were run during the two-year period 2012-2014 to determine what Mind Genomics might contribute.
Moving from Opinion to Experiment
It is obvious to anyone who observes the behavior of people, whether dealing in the worlds of goods or services that people differ from each other. Differences can end up being a simply a nagging reality which gets in the way of efficient activities, whether social, economic, and so forth. Indeed, there is an old French proverb, translated into English as ‘Of taste one does not dispute.’ The smart professional knows these differences exist, the experienced professional knows about the nature of these differences, and the effective professional knows how to work with these differences to achieve objectives. In their minds people live in different worlds; one size does not fit all. People need to hear different things. The smart marketer recognizes these different worlds, often establishing them by one or another research effort such as focus groups, in-depth interviews, surveys, and now more recently observing the behavior of a person over time in terms of what the person searches for or how the person shops on the Internet. The smart marketer then digests this information and feeds back a (presumably) motivating offer to the individual using messages which seem to be in line with what the person has done, said, or even looked at.
How can this knowledge-based approach be used in situations where there is natural disagreement, conflict? Is there a way to deeply understand the mind of people in conflict, whether the conflict is open and mutually aggressive, like war, or simple civil disagreement? In other words, if the knowledge-based approach can be used to sell soap, can it be used to sell or at least to message ‘peace’.
The Mind Genomics Worldview
In the 1960’s mathematical psychologists R. Duncan Luce and Patrick Suppes introduced what then was an esoteric paper, presented in the first issue of the Journal of Mathematical Psychology, and as the first paper of that issue. The title of the paper was daunting: Simultaneous conjoint measurement: A new type of fundamental measurement [10]. The focus of psychologists in the 1960’s was to establish the science of measurement, doing so in what was called the ‘axiomatic measurement’. The elegance was at first mathematical. Over the years, the importance of the thinking behind this new method, conjoint measurement, would overshadow the mathematical elegance. This then-esoteric approach would be a way to deep, often profound knowledge about how people think, knowledge that could be applied in a practical way to problems of everyday life. Conflict is one of those problems.
The basic idea behind conjoint measurement is that one could ‘measure’ ideas by putting them in combinations, getting responses to the combinations, and somehow deconstructing the response to the contribution of the separate ideas. The mathematics of the approach, the various postulates, lemmas, and so forth, are no longer of interest to most people, although remain of great import to mathematical psychologists. What is important is the notion that by measuring responses to combinations which simulate ‘reality’, one can deduce the part-worth contribution of each component of the combination.
The immediate importance of this discovery comes from the realization that the typical approach in science including social science, is to isolate the factors, control everything, and measure the response to those factors. Thus, in a study of conflict, for example, or in a study of tomato sauce in contrast, one might look at a set of single factors in a questionnaire and ask how important the factor is to drive negotiations for conflict or drive acceptance for tomato. The process breaks down for tomato sauce because tomato sauce is meaningless unless the mixture is created. Asking a person ‘how important is sweetness’ in tomato sauce is meaningless because the taste profile and smell and appearance profiles must be correctly balanced. So, when it comes to products, importance is not a meaningful topic. It is the mixture.
Moving now to conflict, it is hard to understand how to rate ‘openness to negotiation’ vs. rating ‘Having evidence about one’s point of view’, in terms of importance. It can be done. Most questions about ‘importance’ and aspects of the topic rely on this one-at-a-time effort. The effort certainly does not work for products, although it may work for more complete descriptions of products. The effort may or may not work for the topic of ‘discussions’, although showing that the one-at-a-time approach does not work for topics of ‘discussions’ and ‘arguments’ is harder to prove because we are dealing with simple ideas which have meaning.as.
Evolving from Compound Mixtures to Systematic Variation – The Contribution of Mind Genomics
Mind Genomics emerged in the early 1980’s, with work done under contract for a number of companies, one of which deserves both acknowledgment and thanks. This was the Colgate Palmolive Company of Canada, and its visionary general manager at the time, the late Mr. Court Shepard. As the general manager, it was Mr. Shepard’s simple objective to increase the company’s sales, rather than to simply do his job well and protect his job in any way he could. Mr. Shepard confessed at a meeting that he did not know what to say about Colgate Dental Cream to increase sales, a statement which led to the discussion of how a ‘different’, and possibly more complex but powerful method might help. The method involved mixing messages together in a systematized way using the statistical discipline of experimental design, presenting the combinations, obtaining ratings to the combinations, deconstructing the ratings to the contribution of the different messages, and then discovering which messages ‘worked’. To his credit, Mr. Shepard said ‘yes’, and within a week the study was run, analyzed, and the results implemented. Sales increased. The lesson from that early experiment, fall, 1980, was that systematics work. The respondent, the person evaluating the test combinations need not be an expert. In fact, what happened was that the respondent became disinterested in the task, and answered almost ‘automatically’, without thinking.
The approach ended up descending deeply into the mind of the respondent, even for such a mundane product as toothpaste or dental cream. What becomes important in this regard is that the results could not be faked. There could emerge a ‘stance,’ driven by one’s conscious beliefs. The mixtures of messages prescribed by experimental design, whether of dental cream or of social issues and feelings, were simply too hard to disentangle at an intellectual level. When the messages comprised three or four different ideas, seemingly thrown together, even the person who wants to ‘fake’ the study cannot figure out what to do to bias the results. One could answer randomly, but that is quickly revealed by a statistical analysis of how well the ratings co-vary with the presence/absence of the elements. In the end, the respondent relaxes, and in a somewhat bored way, reads the vignettes, and ‘guesses’.
To summarize the first part of the Mind Genomics effort emerged from the creation of mixtures of messages (elements) using experimental design, the evaluation of these mixtures by respondents, and then the deconstruction of the responses to the contributory impacts of the separate elements. There is a second part of this, one which is just as important. This second part is the discovery of mind-sets, of groups of people who respond in similar ways to sets of elements. These groups, mind-sets, are not necessarily similar in who they are, or what they buy. They are similar in the pattern of their responses to the elements but may be radically different otherwise. Yet, knowing these mind-sets allows the marketer to tailor the messages to a mind-set. That knowledge would prove invaluable for marketers, because it was simple to change the message in a knowing way to appeal to the mind-set. The discovery seemed to be like having an experienced salesperson involved in every messaging effort, a person who would know ‘what works.’ Only there was no person, just a simple algorithm to create these mind-sets, and then to uncover these mind-sets in new populations, groups who may never even have been encountered before.
Applications of Mind Genomics
The foregoing presented the theory of Mind Genomics. The two experiments presented here show the approach of Mind Genomics to issues of prospective conversations about Israel first, and then the Palestinians and Israel. The objective of the two experiments, both done around 2012, ten years ago, was to identify the common topics of conversation which could heal potential fractures in the relationship of people. The Mind Genomics process follows a set design and analysis approaches, created to produce ‘actionable’ data sets in days, and thus be amenable to continual improvement, at low cost, and in a speedy, efficient, knowledge-building way.
The background and processes of Mind Genomics have been written about for more than 15 years, and can be found in a variety of papers, some dealing with the general method and applications (e.g., [11]) others dealing in more depth with specific applications, such as the law [12], charity donations [13], environmental considerations [14], digital marketing [15], and so forth. Some of the seminal experiences in the formation of the emerging science of Mind Genomics appeared almost 15 years ago in a book Selling Blue Elephants: How to Make Great Products that People Want Before They Even Know They Want Them [16].
The Mind Genomics process follows these seven steps:
Step 1 – Define the Topic, Create a Set of Questions Which Elaborate the Topic, and for Each Question Create a Set of Answers
The Mind Genomics ‘template’ provides a structured system to focus the researcher’s effort. For these two projects presented in this paper, the experimental design comprises a topic, six questions elaborating the topic, and in turn six answers to each question. It is important to keep in mind that the Mind Genomics effort lends itself naturally to fast feedback and iteration. Thus, the elements need not be worked and reworked until ‘perfect.’ Rather, it suffices to have a reasonable set of elements. It is very straightforward to run the study, considering it as a first iteration. The results, when returned, can always be improved, and the study re-run in a few hours using new elements to replace the elements which did not perform well.
Step 2: Create Vignettes, Combinations of Elements
The vignettes are put together according to an underlying plan, the so-called experimental design [17]. The design for these studies prescribed precisely 48 combinations, vignettes, 36 of these vignettes comprising four elements, 12 of these vignettes comprising 3 elements. Each element appears exactly five times in 48 combinations and absent from the remaining 43 combinations.
An important feature of Mind Genomics is the ability to cover as much of the design space as possible. The design space is another way of describing the many possible combinations that could emerge from creating 48 vignettes, and it is in this precise point that Mind Genomics differs from conventional research. Conventional research would create 48 vignettes, and then have many respondents test the same 48 vignettes, with the objective of reducing the variability of measurement. That is, conventional research implicitly limits the focus of the effort, creating what is thought to be correct, and spending the time, money, and effort on validating the guess. There is little learning to be gained as one goes along the research path. The hope is that the research can ‘intuit’ what to do next when the effort fails, recognizing that the research steps are not iterative, but rather evaluative. Iteration thinking is not built in, but rather becomes an unwanted necessary step when the research fails to confirm the ingoing intuitions manifested in the test stimuli, here the 48 vignettes combining the 36 elements.
In contrast to the above, Mind Genomics takes as its cue the approach represented by the MRI, the magnetic resonance imaging, used in medicine. The MRI takes many pictures of the underlying tissue, each picture from a different angle. Afterwards, through a computer program, the MRI combines these pictures to get a better idea of the underlying tissue, one in three dimensions. No single ‘picture’ is right. Each picture is ‘noisy’, and not useful by itself, but it is the pattern emerging after combining the pictures which is realistic.
Step 3: Define the Rating Scale
The rating scale is the way that the respondent can communicate with the research and give her or his opinion. In these two studies, the rating scales were 9-point scales (Likert or category scales), anchored at each end.
The 9-point scale is simple, easy to use. The ratings for the scale, however, the nine points, are hard to understand for the manager, despite being easy and widely accepted by researchers. Common practice for the past decades is to transform the scale to a binary scale, a yes/no scale. Managers can easily understand the scale. Ratings of 1-6 were transformed to 0; ratings of 7-9 were transformed to 100. This transform converted the scale to a format that managers can more easily understand. The transformation is accompanied by the addition of a vanishingly small random number (~ 10-4). This small number prevents the analysis program (OLS, ordinary least-squares regression) from ‘crashing’ when it tried to deal with a set of data all of which have either value 0 (all vignettes had been rated 1-6), or values of 100 (all vignettes had been rated 7-9).
Step 4: Invite the Respondents to Participate
The respondents are invited by professional groups, called online panel providers. It is always tempting to save money and provide panelists from one’s ‘network’, but the reduced cost turns of out to be one of the most expensive ‘savings.’ With 304 respondents participating for the New York study, and with 158 respondents for the Israel Palestine study (about half Israelis, half Palestinians), the judicious approach is to hire a professional organization to provide the panelists. The organization does so at a reasonable fee, which allowed each study to be completed in less than 24-48 hours, without effort by the researcher.
Step 5: Orient the Respondents in the Task
It is best to provide as little information as possible about what is really expected, and instead simple introduce what the study is about, and some of the necessary information, such as the length of the interview (very important), the fact that the all the vignettes are different, and that there are either one or two rating scales. Often respondents who participate, evaluating 48 vignettes, feel sure that they have ‘seen this vignette before.’ They could not have, but it matters little, and it is important to assure them that they are seeing stimuli that have been meaningfully crafted.
Step 6: Create Equations (Models) Relating the Presence/Absence of the 36 Elements to the Binary Ratings (0/100)
The equation is written as: Dependent Variable (Top 3) = k0 + k1(A1) + k2(A2) … k36(F6). The foregoing equation deconstructs the response to the vignettes, so that we begin with an additive constant, and then estimate the part-worth contribution of each element to the dependent variable. The additive constant is the estimated value of the dependent variable (0 or 100), in the absence of any of the 36 elements.
The additive constant is a purely estimated parameter. It has no real existence, but it can be used to estimate the proclivity of the respondent to rate a vignette as 7-9 in the absence of elements. Of course, by design, all of the vignettes comprised 3-4 elements, so the additive constant cannot really exist. Nonetheless, as we will see, the additive constant gives us a sense of the degree to which a respondent is ‘ready’ to say something, even without evidence.
When we see high additive constants, we can be sure that the respondents feel strongly and positively towards the topic. In contrast when we see low additive constants, we can feel strongly that the respondent is not predisposed to rate the vignettes high but rather waits for the momentum imparted by just the right elements to carry matters forward.
The 36 coefficients each reflect the marginal, or part-worth contribution of the individual element to the value of TOP3. When the coefficient is 0, we conclude that the element has no ability to drive the response. When the coefficient is positive, we conclude that adding the element to a vignette increases the percent of respondents rating that vignette 7-9. For example, a coefficient of +5 for an element means that when the element appears in the vignette, an addition 5% of the responses will be 7-9. In contrast, when the coefficient turns out to be -5, we conclude that when the element appears in the vignette, 5% fewer of the responses will be 7-9. We don’t know whether the 5% fewer will migrate to very strong negatives (viz., 1-3) or migrate to mere indifferences (viz., ratings of 4-6).
From the point of view of statistics, the coefficients usually end up with standard errors of approximately 4-5, meaning that we should pay strong attention to elements with coefficients of 8 or greater. We should pay attention to all positive coefficients, but the elements with high positive coefficients, 8 or greater are really important.
The Mind Genomics method ends up producing many numbers. For example, just looking at the total panel coefficient can be overwhelming. There are 37 numbers to consider when searching for a pattern, the additive constant and be coefficient for each element A good practice, one adopted here, is to present only those coefficients that are noticeably positive (2 or higher) and ignore those coefficients which are 1 or lower. Furthermore, when an element has no coefficients for any group which are positive, it is not instructive to present that element. The element ends up taking up room, and not teaching anything. In the data tables presented later in this paper many elements do not appear because they fail to produce impactful statements.
Step 7: Create Individual Level Models and Use the Coefficients as Inputs to Clustering
Clustering will identify new-to-the-world groups (mind-sets) based on the patterns of responses to the messages. We are taught to think of people in terms of who they ARE, what they DO, and what they say they THINK/BELIEVE. Marketers call this segmentation.
The standard ways of dividing people, so-called geo-demographics, can generate a large vector of information about a person, based upon gender, age, income, education, marital status, and so forth. In the 1960’s, William Wells, a market researcher working in advertising introduced the notion of psychographic segmentation [18], a way to divide people by the pattern of what they believed when the topics were lifestyle, beliefs, etc., so-called macro-topics. Today’s technologies allow people to be divided by more micro-patterns, such as the way they search on the Internet for specific ‘things.’
In the spirit of dividing people, Mind Genomics looks for groups as well, but this time groups based upon the pattern of responses to a limited, focused issue. These are called mind-sets. A mind-set comprises individuals who think alike in a limited topic, such as the patterns of discussions that they prefer (viz. mind-sets emerging from Study 1 on Jewish discussions or mind-sets emerging from Study 2 on positive outcomes in the conflict between Israelis and Palestinians). The mind-sets are obtained from the pattern of coefficients of the respondents who participated. Recall that each respondent evaluated a unique set of vignettes, but that the mathematical structure of the 48 combinations evaluated by each respondent was the same. The 48 combinations sufficed for a valid experimental design that one creates the set of coefficients for each respondent separately. It is the set of 36 coefficients for each respondent in the study which becomes the basis on which individuals are separated into mind-sets. Individuals with ‘similar’ patterns of 36 coefficients are put into a cluster or mind-set by a mathematical algorithm (k-means; [19]). The outcome is a small set of clusters, which comprise individuals within a cluster having similar patterns of coefficients, and with the patterns of averages of the 36 coefficients different from cluster to cluster. One might envision this as a set of globes, far away from each other (the clusters or mind-sets), but a group of points (respondents) swirling around inside the globe and being close to each other. The number of such mind-sets is left to the researcher. Two criteria have been used to select the number of clusters, parsimony and interpretability, respectively. Parsimony refers to the number of clusters or mind-sets. Fewer is better. Interpretability refers to the fact that the pattern of coefficients, the strong performing elements are similar, and tell a ‘coherent story.’ Not a perfect story, of course, but something which seems to make sense.
As the number of clusters increases, parsimony decreases, but interpretability increases. The act of clustering respondents calls into play a balancing act between creating sets of respondents whose data can be easily understand, and creating at the same time a large number of such groups, so that at the end of the process one is not sure whether the clusters or mind-sets are ‘real’ They may tell interesting stories, but there may be simply too many clusters on which to make generalizations.
We now move to the two studies, first the study of a cohesive group, the Jewish population of New York, and then study of two historically opposed populations, Palestinians and Israelis. Both studies are about discussion, about finding common ground, the first with New York City Jews to bring an ethnic group together, the second with Palestinians and Israelis to reduce tension, and begin to bring the groups together.
Study 1: Search for Common Ground for Discussions about Israel among NYC Self-defined Jews
This study was run under to aegis of Dr. Jonathan Cummings of the Jewish Community Relations Council of New York to determine the features of a venue for productive conversations. We show the elements, the mind-sets, and then where relevant information about the mind-sets (for study 2). Table 1 presents the elements.
Table 1: Elements for the Mind Genomics study regarding common ground for discussions about Israel among NY self-defined Jews.
|
Question A: What kind of activity is it? |
| A1 |
A highly structured single meeting… where people feel free to disagree with each other |
| A2 |
People sharing ideas/feelings during a highly structured single meeting |
| A3 |
People sharing ideas/feelings during a single meeting with no clear structure |
| A4 |
Several highly structured meetings…where people feel free to disagree with each other |
| A5 |
People sharing ideas/feelings during several highly structured meetings |
| A6 |
People sharing ideas/feelings during several meetings with no clear structure |
|
Question B: Who provides the content? |
| B1 |
Group members give presentations… then open the discussion to everyone |
| B2 |
A facilitator presents a topic… then opens it up for discussion |
| B3 |
A prestigious speaker is invited to the meeting… then every gets a chance to present their views or ask questions |
| B4 |
No preparation… whatever is the hot topic of the day |
| B5 |
Studying important historical texts… then open discussion |
| B6 |
Current events about Israel… then open to Q&A |
|
Question C: What is talked about? |
| C1 |
Discuss the peace process between Israelis and Palestinians |
| C2 |
Talk about the American Jewish community… their views, their concerns, what’s near and dear to their heart |
| C3 |
Talk about the Israel you love! |
| C4 |
Discuss how you can stop American Jews from fighting about Israel |
| C5 |
Discuss how Israel is part of my Jewish identity or heritage |
| C6 |
Discuss Israeli arts and culture as a way to understand Israel better |
|
Question D: Who should be in this conversation? |
| D1 |
With people who have a different perspective |
| D2 |
With people who want to get to know you personally…to really understand how you think |
| D3 |
With people who are very knowledgeable about Israel’s history and current affairs |
| D4 |
With people who already have a strong standpoint about Israeli |
| D5 |
With individuals who rarely consider Israel in their day-to-day lives |
| D6 |
With individuals who are concerned about the divisions in the Jewish community about Israel |
|
Question E: What are the outcomes? |
| E1 |
After the meeting, you decide who’s right and who’s wrong |
| E2 |
Hear other people’s views and learn how they think about a particular issue |
| E3 |
Get to meet and mingle with interesting people |
| E4 |
Understand the range of feelings and thoughts on a particular topic |
| E5 |
You continue to meet and work together on Israel activities |
| E6 |
Nothing changes, but you enjoy it nevertheless |
|
Question F: Where is the venue? |
| F1 |
In someone’s living room |
| F2 |
In a classroom |
| F3 |
At a synagogue |
| F4 |
In a conference room at someone’s office |
| F5 |
In a restaurant |
| F6 |
Over dinner in your home |
The orientation was simple, focusing primarily on the process, and providing few specifics about the topic. It is the topic which will be ‘particularized through the elements.
Today you will be taking a survey regarding conversations about Israel in New York’s Jewish Community. Sometimes, talking about Israel can be difficult. Sometimes, we may not want to talk about Israel at all. We are interested in finding out what might make those conversations more satisfying and would like to know your opinion regarding different kinds of conversations with others in the local Jewish community, outside of your inner circle of contacts and friends. It will take you between 10-15 minutes to complete the survey. During this survey, we will show you several scenarios describing different conversations in various discussion settings. Although they may seem similar, please note that each screen combination is UNIQUE.
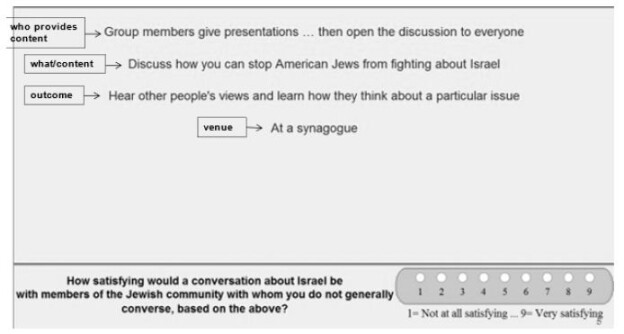
You will be asked the same question for each test screen: How satisfying would a conversation about Israel be with members of the Jewish community with whom you do not generally converse based on the above: 1 = not at all satisfying…, 9 = very satisfying
Figure 1 shows a sample vignette that the respondent would see, except for the boxed information on the left. These are the ‘questions’, which the respondent never sees. The role of the question is to provide a stimulus for the six different answers.

Figure 1: Example of a 4-element vignette shown to the respondent. The respondent does not see the boxed information on the left.
The study was run with 304 respondents. Table 2 shows the strong performing elements. Table 2 suggests that:
Table 2: Result from models for the conversations about Israel among NYC Jews (Study 1).
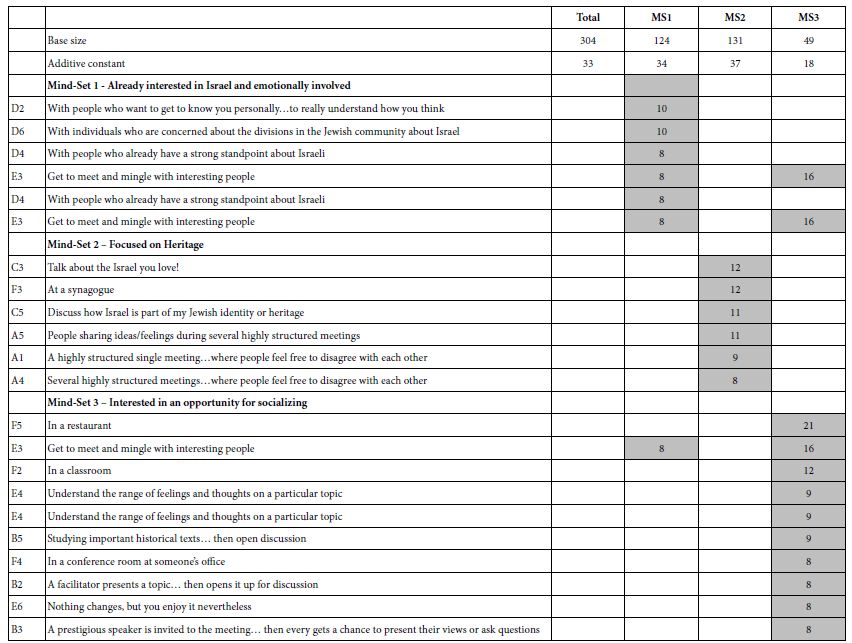
- The basic level of expected satisfaction from the conversation (additive constant) is moderate for total, for Mind-Set 1 and Mind-Set 2, but quite low for Mind-Set 3
- No element drives a feeling of strong satisfaction when we look at the total panel of 304 self-identified Jews in the New York region. The 304 respondents would be considered a homogeneous group, discussing a topic of concern among Jews.
- The data suggests dramatically different mind-sets. What appear to be irrelevant elements at the level of the total panel end up being strong performers for the mind-sets?
Study 2: Discussion among Palestinians and Israelis Regarding What Will It Take to End the Conflict (Question 1) and Create Lasting Peace (Question 2)
The objective of Study 2 was to develop a system which could deal with conflicts in a way consonant with the vision of Mind Genomics, namely treat the issue as the conflict of different mind-sets. The second study was run, under the aegis of Professor Peter Coleman and his associates at Teacher’s College, in Columbia University, and under the aegis of Professor Martin Braun of Queens College, City University of New York. The study was run 2011-2012, a decade ago, using the same experimental design as had been used for Study 1 on Discussions about Israel.
The elements appear in Table 3. The elements were created by the team led by Naira Musallam at Teacher’s College. They were designed to be short, easy to read ideas. The elements were created through a process involving depth interviews, ethnography, brainstorming, competitive analysis. Finally, the elements were developed with a psychodynamic and psychoanalytic orientation, dealing with different aspects of needs, wants, and perceptions.
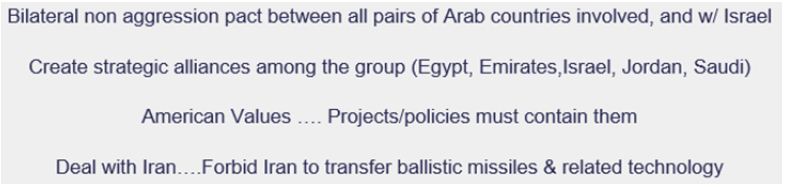
Table 3: Elements for the Mind Genomics study regarding cessation of hostilities and lasting peace.
|
Question A: What are individual benefits? |
| A1 |
Lasting peace will allow me to fulfill my personal dreams and aspirations |
| A2 |
Lasting peace will help improve my physical and mental health |
| A3 |
Lasting peace will ensure a better future for my children and grandchildren |
| A4 |
Lasting peace will allow me to live a much more fulfilling life |
| A5 |
Lasting peace will improve my personal economic situation |
| A6 |
Imagine what our life would be like if the conflict and occupation had ended 10 years ago |
|
Question B: What positive events are happening or could happen? |
| B1 |
Israelis and Palestinians are increasingly working together to address the pending water crisis in the region |
| B2 |
The safety and security of our children are completely dependent on the safety and security of their children, and vice-versa |
| B3 |
Lasting peace and justice in Israel-Palestine will only happen when Israelis and Palestinians are working together |
| B4 |
There are currently many areas of economic, technological, cultural and educational cooperation between Israelis and Palestinians |
| B5 |
Israelis and Palestinians both have much to gain from negotiating an end to the conflict and a lasting peace |
| B6 |
A solution to the conflict and compromise over Jerusalem and the refugees is possible |
|
Question C: What are the benefits of lasting peace |
| C1 |
Lasting peace will bring great economic prosperity to the region |
| C2 |
Lasting peace will enhance everyone’s health and well being |
| C3 |
Lasting peace here will stand as a beacon of hope for all societies suffering from violent conflict |
| C4 |
Lasting peace will lead to vast improvements in the education of our children |
| C5 |
Lasting Peace will bring more stability and security to the region |
| C6 |
Once a peace agreement is reached, the UN, US, Arab League, NGO’s and the International Community will work together to help maintain a lasting peace |
|
Question D: What are the benefits of ceasing violence? |
| D1 |
Freedom from violence and oppression are individual human rights |
| D2 |
Committing acts of violence and oppression always have unintended consequences that eventually come back to haunt you |
| D3 |
I don’t believe everything I am told by our leaders about the history of the conflict and the occupation |
| D4 |
I am eager for a more safe, just, and peaceful life |
| D5 |
I believe that Palestinians and Israelis can coexist without oppressing and killing one another |
| D6 |
I have a great deal to gain personally from ending the occupation and building a lasting peace |
|
Question E: How can we build a community to incorporate both groups, and what will be the benefits? |
| E1 |
Parents would be increasingly able to raise their children in a safe, secure home and community |
| E2 |
Communities would be increasingly working to increase fairness, safety, security, and non-violence |
| E3 |
Our communities would do more to limit hate speech against members of other groups |
| E4 |
The Internet and social media provide ideal places for young Palestinians and Israelis to communicate and share their experiences and interests |
| E5 |
Ongoing community exchanges between Israeli and Palestinian youth help our situations |
| E6 |
The schools would improve the accuracy and reduce the bias with which history is taught to our children |
|
Question F: What is happening on an international scale |
| F1 |
The UN/US/EU and Regional Arab nations are working together to establish less unjust processes for allocation of scarce resources such as land and water |
| F2 |
Increasing signs of cooperation are emerging between the Arab League, the UN, US, and EU |
| F3 |
More and more people everywhere are developing a stronger sense that they are all members of one global community |
| F4 |
Thee UNB/US/EU and Regional Arab nations are increasingly working together to fight crime and corruption in our region. |
| F5 |
GPS mapping is showing a significant increase in joint Jewish/Arabic development projects in the region |
| F6 |
The increasing number of projects by businesses that encourage entrepreneurship by our youth will substantially improve our economic future. |
It is important to note that there is no fixed process for developing ideas. in the end, it is always a matter of creative thinking, of merging the richness of language to describe and the need to portray what should be described.
The respondents read the test vignettes, but this time rated the vignette on two rating scales. The first was the likelihood that this described the situation where the mutual hostilities would stop. The second scale was whether this described a situation which would move to lasting peace. One can look at these two sales as intellectual and emotional, as evaluating what will happen, and what could happen.
Half the respondents were Palestinians, recruited by friends, and half the respondents were Israelis, also recruited by friends. There was no pre-screening about attitude. Rather, the respondents simply were introduced to the topic with an explanation of the scale.
The study was set up so that the 158 different experimental designs were divided, so that the first set of unique designs was allocated to the Palestinians (with study totally in Arabic), the second set of unique designs was allocated to the Israelis (with study totally in Hebrew), and then the process repeated. The data for the Palestinians and for the Israelis were treated as one large group, both for clustering into mind-sets, and for reportage of results. This is possible because to the computer we are dealing with 158 respondents, all evaluate vignettes from the same large design.
Once again, the focus of the study is the identification of groups of like-minded individuals existing in groups which are in conflict.
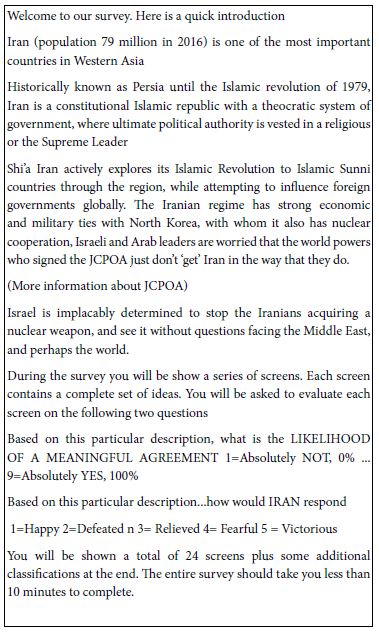
Figure 2 shows the orientation pages in Hebrew and Arabic. Figure 3 shows examples of what the respondents saw in terms of vignettes. Since there were two rating questions, the vignette remained on the screen, the rating question changed. When the respondent completed the second rating, the vignette changed to the next prescribed by the underlying experimental design.
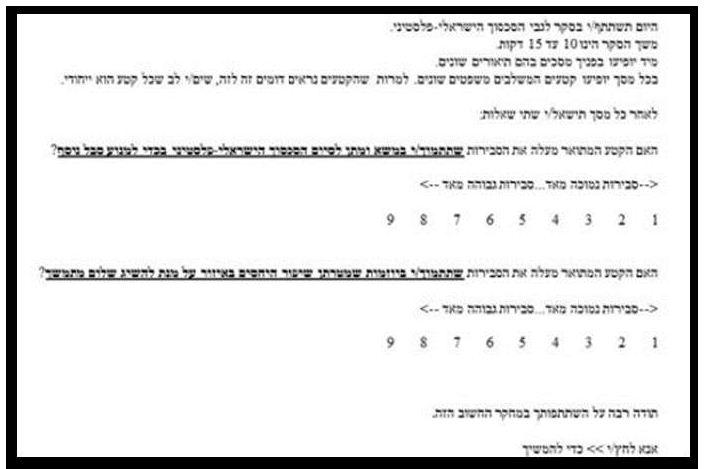

Figure 2: The orientation screen in both Hebrew and Arabic.
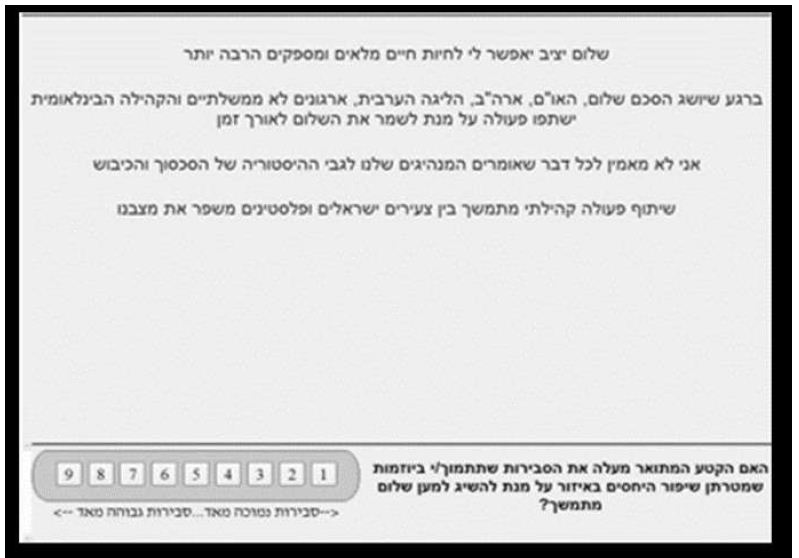

Figure 3: Example of a screen showing a vignette and the rating scale, in Hebrew and Arabic.
After the vignettes were completed, the respondents completed a short, self-profiling questionnaire, with some results shown in Table 5.
Table 5: Self-profile of the respondents in the two key mind-sets who are enthusiasts: Mind-set 3 (End conflict enthusiasts) and Mind-Set 2 (Peace enthusiasts).
|
End Conflict & Peace Enthusiasts (Combined) %
|
| Age |
|
| 18-29 |
47
|
| 30-38 |
22
|
| 39-44 |
16
|
| 45-52 |
13
|
| 53-64 |
2
|
| Political Affiliation |
|
| Rightist |
16
|
| Centrist |
38
|
| Leftist |
16
|
| No Answer |
31
|
| How many years have you been living in Israel/Palestine |
|
| 11-15 years |
6
|
| 16-20 years |
6
|
| 21-25 years |
16
|
| More than 25 years |
69
|
| I do not live in…. |
3
|
| Were you or any members of your family harmed by the Palestinian-Israeli conflict |
|
| Yes, I was personally harmed |
9
|
| Yes, someone from my family was harmed |
25
|
| Yes, someone I know (not family) was harmed |
19
|
| No |
47
|
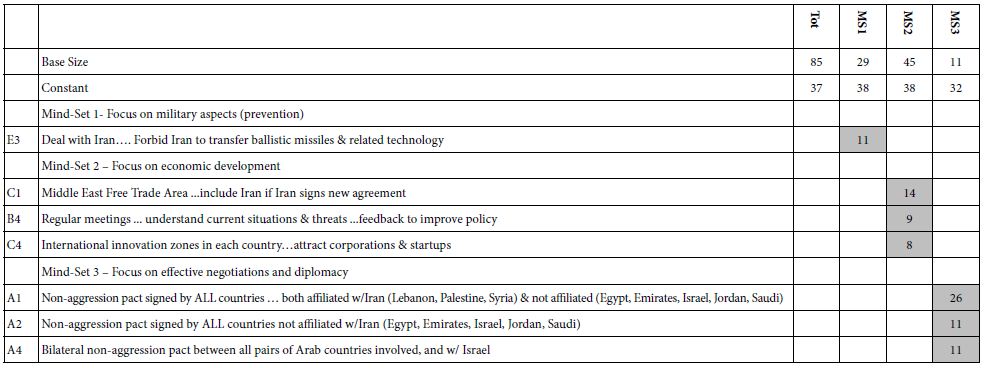
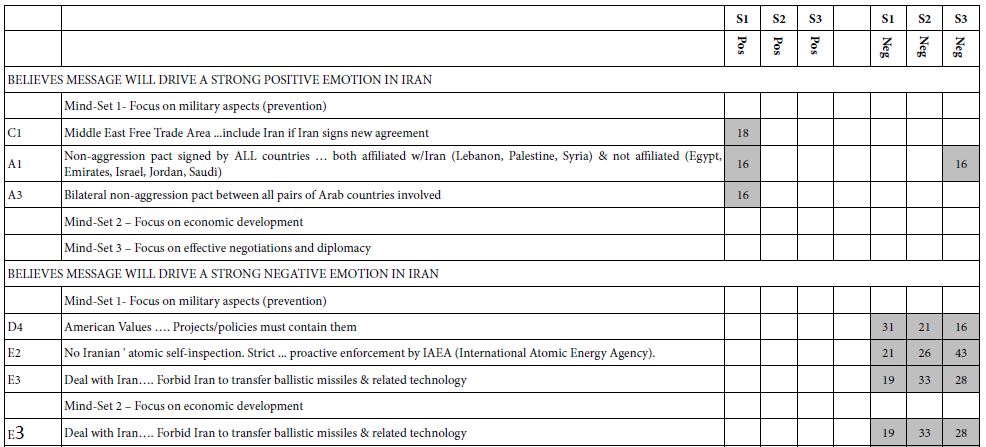
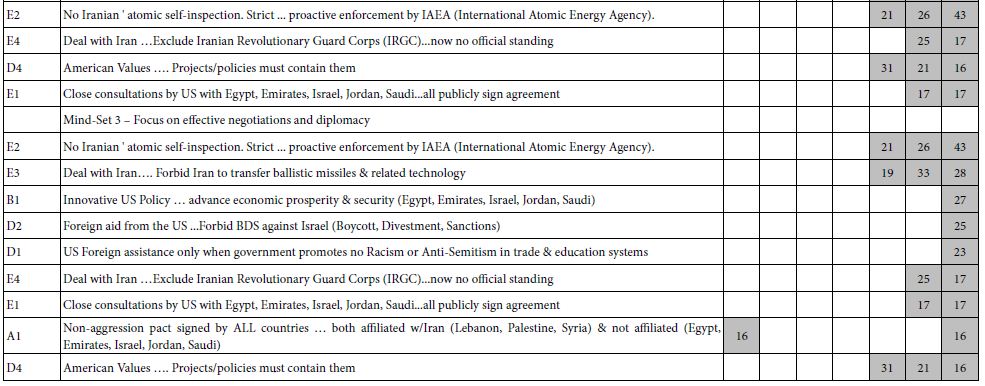
Table 4 shows the significantly positive elements and the strong performing elements. The respondents were clustered simultaneously on ratings for Question 1 (cessation of hostilities) and Question 2 (lasting peace). This joint clustering was done by combining the two sets of coefficients to create a vector of 72 numbers, to which the k-means clustering was applied.
Table 4: Result from models for ending the conflict (Q1) and establishing long-lasting peace (Q2), from Israelis and Palestinians. Each mind-set comprises both Israelis and Palestinians.
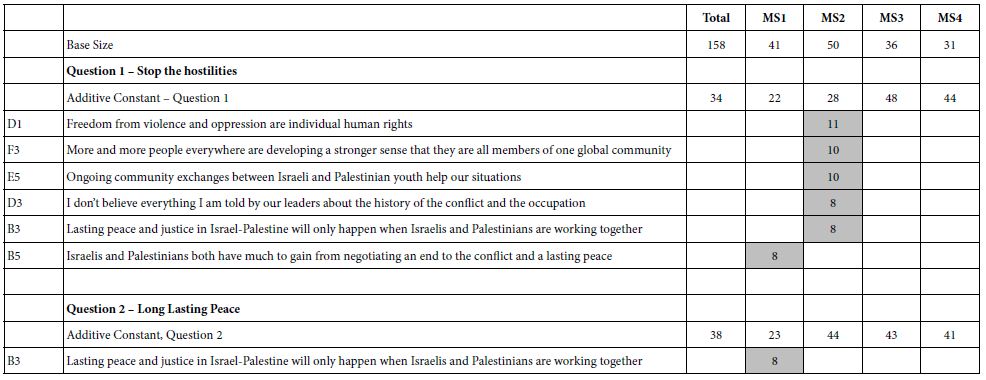
The results suggest four interpretable mind-sets. Across both questions Mind-Set 2 appears to respond to elements which are positioned as ‘end the hostilities’ and Mind-Set 1 appears to respond to elements which are positioned as peace.
It is striking and somewhat disconcerting that in Table 4 that most of the cells are blank, having generated coefficients of +7 or lower. To help the patterns emerge, we show only those cells with strong performance, viz., coefficients of +8 or higher dramatically, we look only for strong performing elements.
The four mind-sets each comprise a mix of Palestinians and Israelis. This is important, because it gives hope that there can be found like-minded individuals in hostile populations, with perhaps some of the mind-sets capable of negotiation.
The total panel contains no strong performing elements at all. Nor do Mind-Sets 3 and 4, comprising 67 of the 158 respondents. There are, however, strong responses in the mind-sets, viz., suggesting that there are areas of agreement. All that we have to is find them.
The messages which drive interest for ending the conflict are:
- Freedom from violence and oppression are individual human rights
- Ongoing community exchanges between Israeli and Palestinian youth help our situation
- More and more people everywhere are developing a stronger sense that they are all members of one global community
The messages which drive work for peace (Mind-Set 1) are:
- Lasting peace and justice in Israel-Palestine will only happen by Israelis and Palestinians working together
- There are currently many areas of economic, technological, cultural and educational cooperation between Israelis and Palestinians
- A solution to the conflict and compromise over Jerusalem and the refugees is possible
The traditional approach to understanding people is to create a surface understand of their minds, and in turn probe deeply into who they are. Table 5 shows a breakdown of self-profiling classification of mind-sets 2 (End Conflict enthusiasts) and mind-set 3 (Peace enthusiasts). The information is enlightening, but the important information is missing, viz., the reason for the strong performing messages. We know about the enthusiasts, but would never have predicted which elements in Table 4 would have performed well
Discussion and Conclusions
At the start of the efforts underlying these two studies a decade ago, the vision for Mind Genomics was to identify the ‘optimum messaging.’ The size of the study, 36 elements (six questions, each with six answers) provided a large array of possible ideas to include in the study. The rapid turn-around time, less than a day, was not considered a particularly strong ‘positive’, but the possibility of testing many messages was a positive. The notion was that Mind Genomics provided a testing platform for many well-thought-out ideas, rather than one or two ideas. The worldview that accuracy, even with long cycle times, was critical. It was better to expend a great effort, to get deep thinking, and then to do the study.
The outcomes of the studies, reported here, were “interesting” but failed to find a receptive audience. Part of the failure was lack of visibility of the results. Another part was lack of knowledge about what Mind Genomics was, and what Mind Genomics could deliver. The target audiences, those in policy, those in academia, were stuck on the traditional methods, the slow, often tedious, eventually self-correcting, one-at-a-time thinking.
Over the decade, however, Mind Genomics has evolved to an iterative system, one providing virtually instantaneous results, at very low prices, with the objective of creating an ongoing database, the wiki of the mind. Coupled with this is the recognition that the traditional methods of science, the tortuous one-at-a-time hypothetical-deductive system, the creation of hypotheses and careful testing, does not work well in a world of language and feelings, where there are many ways to express winning ideas, and many more ways to express losing ideas. Furthermore, speed, once a negative because ‘if it is so fast it can’t be particularly good!’ has been supplanted by a culture of speed.
There is something, so obvious that it may be boggling. A continuing finding of Mind Genomics is that virtually no one really ‘knows what will work.’ These studies, run today, often show a lot of blank cells, not so much for products and services which are tangible, but rather for social issues which have been the food and drink of policy makes for generations. A better system was needed. The plethora of empty ‘data’ cells in Tables 2 and 4 are witness to the fact that the ‘best guess’ elements from experts do not drive the response. People in the business of ‘knowing’ may not know. This is not a criticism. The same plethora of empty cells for results occurs for marketing services and products, as well as social issues, legal statements in litigation or patients in the hands of medical professionals looking for guidance in the way which is most appropriate to their mind-sets.
Some of the answer to ‘fewer empty cells’ comes from the use of Mind Genomics, perhaps in a more abbreviated, simper form, not with 36 elements (6×6; 48 combinations) but with fewer than half that number, 16 elements (4×4; 24 combinations). There are three aspects to the opportunity all embodied in a publicly available tool, BimiLeap (www.BimiLeap.com).
Up-front Thinking
It may be daunting to have to think of 36 elements, but to think of 16 elements should be a far simpler task.
Speed, Collapsing the Process to Minutes and Hours
The second is to produce a system with collapsed timelines, a system which is templated, so that the Mind Genomics Project’ can be set in up in 15 minutes, launched, and the fully analyzed reports, ready for presentation,, emerge within 15 minutes, or at most minutes.
Change from Confirming to Iterating
Analysis paralysis, one of the banes of progress, perhaps the cause of the results here, emerges from the dutiful action of ‘measuring nine times, cutting once’. It might be better to think quickly, iterate quickly, update, and iterate again. Each iteration, in turn, to be done from front to back in the space of 60-90 minutes, at low cost, with ongoing updating, keeping and expanding the good, throwing away the ‘bad’, the ‘poor’, the irrelevant.
The prospect of going from no knowledge at 9am to nine iterations by 9pm or earlier, is simply ‘game changing.’ One can just imagine the number of elements which emerge over time as potentially strong messages, as the researcher iterates to better and better messages, simply by the mechanical effort of testing, evaluating, discarding, expanding, and retesting. Furthermore, the proof is immediate, manifested in the number of ‘filled cells,’ the magnitude of the positive coefficients, and the practical results from messaging.
One last part of the vision from 2012 deserves mention, a vision which is now becoming almost a trivial application of the above. As noted above segmentation and the use of mind-sets has been the domain of the world of marketers. But would about databases of mind-sets for conflicts around the world? What if each conflict could be studies with an iteration of 20 studies, as noted above, so that one arrives as a database of elements which reveal what can be agreed upon? It is quite likely that the results will require mind-sets. What if the process of iterating could be continued, the strong performing elements validated, and then a ‘PVI’, personal viewpoint identifier incorporated into the database [20]. The PVI would allow people in the conflict on both sides to be assigned to one of the mind-sets involved in the conflict. From there, negotiations could begin between antagonists on the two sides who happen to share the same mind-set, a mind-set which holds a point of view allowing for peace. One can imagine a library of 100 books, the Library of Today’s Conflicts, one book for each conflict, created in weeks, at low cost, from 10-20 iterations, and with its own PVI!
Acknowledgments
The authors wish to acknowledge the support and encouragement of these individuals a decade ago who made the studies possible, both through financial support, and through direct participation.
Peter Coleman, Columbia University, Teacher’s College, New York, USA
Jonathan Cummings, Jewish Community Relations Council of New York, New York, USA
Naira Mussallem, Columbia University, Teacher’s College New York, USA,
Janna Kaminsky, Moskowitz Jacobs, Inc. White Plains, USA
John Lightstone, Lightstone Capital (Deceased), White Plains, USA
Taly Marian, Teacher College, Columbia University, New York, USA
Nora el Zokm, Teacher’s College, Columbia University, New York, USA
Steven Onufrey, The Onufrey Group (Deceased), Philadelphia, USA
Note: The current (free) program for Mind Genomics is located at www.BimiLeap.com. The only fees are processing fees on a per respondent basis.
References
- Cohen SM (2002) Relationships of American Jews with Israel: What we know and what we need to know. Contemporary Jewry 132-155.
- Coleman PT, Bass B (2019) Facing uncertain times together: Strengthening intercultural connections. Journal of Intercultural Communication 22: 1-14.
- Dessel AB, Yazbak Abu Ahmad M, Dembo R, Ben Hagai E (2017) Support for Palestinians among Jewish Americans: The importance of education and contact. Journal of Peace Education 14: 347-369.
- Keysar A (2010) Distancing from Israel: Evidence on Jews of no religion. Contemporary Jewry 30: 199-204.
- Waxman D (2010) The Israel lobbies: A survey of the pro-Israel community in the United States. Israel Studies Review 25: 5-28.
- Ben Hagai E, Zurbriggen EL (2019) Bridging narratives: Predictors of Jewish American and Arab American support for a two‐state solution to the Israeli–Palestinian conflict. Analyses of Social Issues and Public Policy 19: 177-203.
- Hagai EB, Zurbriggen EL, Hammack PL, Ziman (2013) Beliefs predicting peace, beliefs predicting war: Jewish Americans and the Israeli-Palestinian conflict. Analyses of Social Issues and Public Policy 13: 286-309.
- Mearsheimer JJ, Walt SM (2009) Is it love or the lobby? Explaining America’s special relationship with Israel. Security Studies 18: 58-78.
- Rosenthal ST (2001) Irreconcilable differences? The waning of the American Jewish love affair with Israel. Brandeis University Press.
- Luce RD, Tukey JW (1964) Simultaneous conjoint measurement: A new type of fundamental measurement. Journal of mathematical psychology 1: 1-27.
- Moskowitz HR (2012) ‘Mind Genomics’: The experimental, inductive science of the ordinary, and its application to aspects of food and feeding. Physiology & behavior 107: 606-613. [crossref]
- Wren JE, Williams TC (2009) Selling blue elephants to the jury: Potential application of rule developing experimentation in Litigation. Baylor Law Review. Rev 61: 1.
- Gabay G, Moskowitz H, Gere A (2019) Understanding the donating mind and optimizing messaging- public hospitals. In 12th Annual Conference of the EuroMed Academy of Business.
- Gere A, Zemel R, Papajorgij P, Radványi D, Moskowitz H (2020) Public driven and public perceptible innovation of environmental sector. In: Innovation Strategies in Environmental Science 69-106.
- Salom J (2021) Mind Genomics with big data for digital marketing on the internet. In: Handbook of Research on Methodologies and Applications of Supercomputing. IGI Global 282-289.
- Moskowitz HR, Gofman A (2007) Selling Blue Elephants: How to Make Great Products that People Want Before They Even Know They Want Them. Pearson Education.
- Gofman A, Moskowitz H (2010) Isomorphic permuted experimental designs and their application in conjoint analysis. Journal of Sensory Studies 25: 127-145.
- Wells WD (1975) Psychographics: A critical review. Journal of Marketing Research 12: 196-213.
- Kaufman L, Rousseeuw PJ (2009) Finding groups in data: an introduction to cluster analysis (Vol. 344). John Wiley & Sons.
- Gere A, Moskowitz H (2021) Assigning people to empirically uncovered mind-sets: A new Horizon to understand the minds and behaviors of People. In: Consumer-based New Product Development for the Food Industry 132-149.
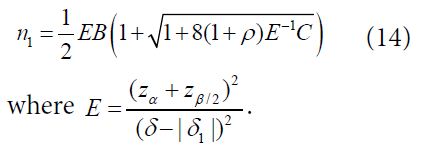
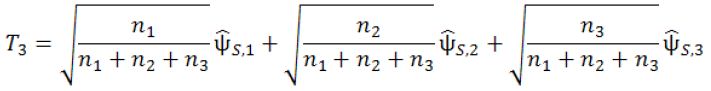
 be the pair wise test statistics, and
  , then if
  for some c1, then the trial is stopped and H0,1 is accepted. Otherwise, if
  , then the treatment Esis recommended as the most promising treatment and will be used in all the subsequent stages. Note that only the subjects receiving either the promising treatment or the control will be followed formally for the primary endpoint. The treatment assessment on all other subjects will be terminated and the subjects will receive standard care and undergo necessary safety monitoring.
 be the pairwise test statistics from Stage 1 based on the surrogate endpoint and the primary endpoint, respectively, and
 , then we will move on to Stage 2b.
 and
and  with
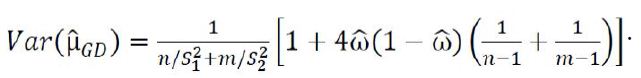
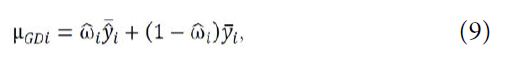
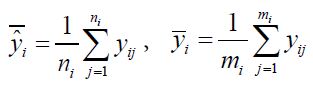
with  respectively. For hypotheses (8), consider the following test statistic,
 Using arguments similar to those in section 2.1, it can be verified that
 For the case of testing for equivalence with a significance level α, consider the local alternative hypothesis that