Monthly Archives: April 2021

ELISA and Neutralising Antibody Development in 27 Kenyan Horses after Vaccination with Inactivated African Horse Sickness Vaccines Containing All 9 Serotypes

DOI: 10.31038/JCRM.2021423

Abstract

Twenty-seven horses were simultaneously vaccinated against all 9 African Horses Sickness (AHS) serotypes in 2 injections and their seroconversion was recorded after several years. Sixteen horses which were regularly immunized with the Onderstepoort attenuated vaccine (OBP) until 2013 and then annually 6 times until 2019 with the inactivated CVRL vaccine, developed high ELISA and VN antibodies. Ten horses which never received the OBP vaccine but since 2015 six times the CVRL vaccine also had developed ELISA and VN antibodies which, however were lower than in the first group.

This shows that multiple vaccinations against all 9 AHS serotypes are important for the development of high antibody levels. It also seems to be an advantage to vaccinate horses with the inactivated vaccine which had been previously immunized with the OBP vaccine, as this approach will induce high levels of antibodies.

Introduction

African Horse Sickness is an insect borne viral disease of equids that is endemic to sub-Saharan African countries [1,2]. It is caused by the AHS virus (AHSV) of the genus Orbivirus in the family Reoviridae. Culicoides (C.) spp midges are the principal vectors of all 9 serotypes and C. imicola is the most important midge for the AHSV transmission [3]. There is no treatment for AHS available, but prevention can be achieved by vector control and vaccination. Vaccination is the most effective way of bringing the disease under control and vaccination was used successfully during the Spain outbreak between 1987 and 1991 [4]. First attempts to control AHS by vaccination dates back to the beginning of the last century by using commercially live, attenuated vaccines even until today, which provide strong humoral and cell immunity. Neutralising antibodies reflect the horses’ immunity [5] and protection against AHS is serotype specific, which means that horses must be immune to all 9 serotypes. However, to ensure a polyvalent immunity against all 9 serotypes, horses need at least 3 to 4 annual vaccinations [5,6].

There is increasing concern regarding the use of attenuated vaccines because of their potential reversion to virulence by re-assortment of their gene segments with other vaccine and field serotypes which were reported [7,8]. Similar drawbacks of attenuated Orbivirus vaccines are known from attenuated Bluetongue (BT) vaccines, which even may cause abortion and congenital malformations when pregnant ewes are vaccinated. It was also discussed that clinical signs may be caused in some sheep breeds by the vaccine virus itself with a viraemia in the vaccinates. These vaccine viruses may then consequently be transmitted in the field by midges meeting field strains and then reassort to produce new virus strains. Consequently, the widespread use of such attenuated vaccines against BT was not recommended and the recent BTV-8 outbreak in Europe was controlled using inactivated vaccines [9,10].

The aim of this vaccination experiment was to evaluate the serological response of 27 Kenyan horses from the field with a different vaccination history.

Material and Methods

Horses

Twenty-seven horses which were kept in the Laikipia area of Kenya were selected for this AHS vaccination experiment. During the day all horses were grazing together in open undulating Savannah and during the night they were kept near a homestead in open fenced areas under acacia trees. Horses were divided in 2 groups. Sixteen horses (1-16) had been regularly vaccinated with the Onderstepoort attenuated OBP vaccine until 2013. Thereafter, since 2014, they received only the inactivated CVRL vaccine as an annual vaccination, in total 6 times. Ten horses (17-27) never received the OBP vaccine and only since 2014 the CVRL vaccine, in total also 6 times.

Vaccine

Over a period of 17 years all 9 AHS serotypes were isolated at CVRL from horse fatalities in Kenya. These serotypes were chemically inactivated by BEI and formalin, ultra-filtrated and used for this vaccine experiment which is described earlier [11,12]. The inactivated vaccine comes in 2 shots which are simultaneously and subcutaneously (sc) injected into the left and right side of the horses’ necks. Shot 1 contains serotypes 1,4,7,8,9 and shot two 2,3,5,6.

Serology

Four weeks after the last annual booster in September 2019, blood was withdrawn from the jugular vein of all 27 horses and tested for AHS antibodies with the competitive ELISA and the virus neutralization test (VNT) which are both described in details [13]. Serum samples showing blocking percentage (Percentage inhibition, PI) values lower than 45% were considered negative, whereas samples above 50% were considered positive. Serotype specific antibodies which were tested with the VNT were according to the Spearman-Karber method expressed as negative log10.

Results

Results of this vaccination experiment are shown in Tables 1 and 2. Group 1 which consisted of 16 horses (1-16) received the South African vaccine until 2013 and then annually the CVRL vaccine 6 times until 2019. Horses had developed high ELISA and VN antibodies. The mean ELISA antibody result of these horses was 93% PI, whereas the mean VN antibody result were between 3 and 4 log10.

Table 1: ELISA and VN antibodies of 16 Kenyan horses vaccinated until 2013 with the attenuated OBP vaccine and 6 times until 2019 with the inactivated CVRL AHS vaccine containing all 9 serotypes.

table 1

*ELISA is expressed as Percentage Inhibition (PI%) and cut-off value for ELISA ≥ 50% are shown in green colour. **VNT results are expressed in log10 and titres ≥ 1 are shown in yellow colour.

Table 2: ELISA and VN antibodies of 10 Kenyan horses vaccinated 6 times with the inactivated CVRL AHS vaccine containing all 9 serotypes.

table 2

*ELISA is expressed as Percentage Inhibition (PI%) and cut-off value for ELISA ≥ 50% are shown in green colour. **VNT results are expressed in log10 and titres ≥ 1 are shown in yellow colour.

Horses of group 2 comprising of 10 horses (17-27) which had received only the CVRL vaccine 6 times until 2019 also developed ELISA and VN antibodies which were, however lower than in the first group. Their mean values for ELISA antibodies were 85% PI and their VN antibodies stood between 1 and 3 log10.

Discussion

Inactivated vaccines for the protection of horses from AHS were previously successfully used to control an AHS serotype 9 outbreak in Spain [14] and in a vaccination and challenge experiment with serotype 4 [15]. However, to the knowledge of the authors, so far, no vaccination experiment had been conducted with an inactivated vaccine containing all 9 serotypes in 2 injections. Vaccination trials are currently carried out in Dubai with an inactivated vaccine containing all 9 AHS serotypes in one injection. The results of this study show that multiple vaccinations against all 9 serotypes are essential for the development of high ELISA and VN antibodies. Horses showing high VN antibodies between 1 and 2 log10 and above seem to be immune against an AHS infection [16], but the absence of detectable VN antibodies to one or more serotypes may not always necessarily be suggestive of lack of protection against AHS, as these animals might appear to be resistant to a challenge which also may depend on a cell mediated immunity [17].

Ten horses in the second group which did not receive the OBP vaccine, but 6 times the inactivated CVRL vaccine like the first group developed lower ELISA and VN titres. This seems to indicate that it is an advantage to vaccinate horses with inactivated AHS vaccines which had been immunised with an attenuated vaccine.

Conclusion

Multiple vaccines against all 9 AHS serotypes are essential for the development of high and protective antibodies against AHS. It seems to be an advantage to immunize horses with the CVRL inactivated AHS vaccines that had been previously immunised with an attenuated vaccine as these horses produce high ELISA and VN antibodies.

References

  1. Coetzer J, Guthrie AJ (2004) African Horse Sickness. In: Infectious Diseases of Livestock, ed Coetzer J, Tustin RC 2nd edition, Volume 2 Oxford University. pp. 1231-1246.
  2. Zientara St (2010) African horse sickness. In: Infectious and Parasitic Diseases of Livestock, ed Lefèvre, P.-Ch, Blancou J, Chermette R, Uilenberg, G. Volume 1, Lavoisier, pp 689-704.
  3. Guthrie AJ, Quan, M (2009) African Horse Sickness. In: Infectious diseases of the horse, ed Mair TS, Hutchinson RE. A Peer-Reviewed Publication, 72-82.
  4. Rodgriguez M, Hooghuis H, Cartano, M (1992) African horse sickness in Spain. Vet Microbiology 33, 129-142. [crossref]
  5. van Dijk AA (1999) African Horse Sickness vaccine development. In: Equine infectious diseases VIII ed. Wernery U, Wade JF, Mumford JA, Kaaden, O. R. R and W Publications, Newmarket, UK, pp. 261-265.
  6. Zientara S, Weyer CT, Lecollinet, S (2015) African horse sickness. Rev Sci Tech Off Int Epiz 34(2), 315-327. [crossref]
  7. Weyer C Th (2016) African horse sickness outbreak investigation and disease surveillance using molecular techniques. Doctoral thesis, University Pretoria, South Africa.
  8. Weyer CT, Grewar JD, Burger, Ph, Rossouw E, Lourens C, et al. (2016) African Horse Sickness caused by genome reassortment and reversion to virulence of live, attenuated vaccine viruses, South Africa, 2004–2014. Emerg Inf Dis 22(12): 2087-2096. [crossref]
  9. European Medicines Agency (2009) mail@emea.europa.eu https://www.ema.europa.eu/en
  10. Lefèvre PCh, Mellor, Ph, Saegerman, Cl (2010) Bluetongue. In: Infectious and Parasitic Diseases of Livestock, ed. Lefèvre, P.-Ch, Blancou J, Chermette R, Uilenberg, G. Volume 1, Lavoisier, pp. 663-688.
  11. Rodriguez M, Joseph S, Pfeffer M, Raghavan R, Wernery, U (2020) Immune response of horses to inactivated African horse sickness vaccines. BMC (in press) [crossref]
  12. Wernery U, Joseph S, Elizabeth, Sh. K, Patteril NG, Wernery R, Spendrup, S (2016) Production of an African Horse Sickness killed vaccine containing all 9 serotypes. 10th IEIDC Abstracts/Journal of Equine Veterinary Science 39, S101-S102.
  13. OIE, Manual of Diagnostic Tests and Vaccines for Terrestrial Animals (2018) African Horse Sickness, 8th edition, OIE, pp. 1237-1252.
  14. Lubroth, J (1988) African horse sickness and the epizootic in Spain in 1987. Equine Pract 10, 26-33.
  15. House J, Lombard M, Dubourget P, House C, Mebus, C (1992) Efficacy of an inactivated African horse sickness serotype 4 vaccine. In: Bluetongue, African Horse Sickness and related Orbivirus: Proc Of the Sec Int Symposium, Eds. Walton TE, Osburn BI. CRC Press, Boca Raton, Florida, USA, pp. 891-895.
  16. Lelli R, Molini U, Ronchi GF, Rossi E, Franchi P, et al. (2013) Inactivated and adjuvanated vaccine for the control of the African horse sickness virus serotype 9 infection: evaluation of efficacy in horses and guinea-pig model. Vet Italiana 49(1), 89-98. [crossref]
  17. Hamblin C, Mellor PS, Graham SD, Hooghuis H, Montejano RC, et al. (1991) Antibodies in horses, mules and donkeys following monovalent vaccination against African horse sickness. Epidemiol Infect 106, 365-371. [crossref]
fig 2

Mind-Sets across House Furnishings: A Simultaneous Mind Genomics Cartography across Five Products

DOI: 10.31038/AWHC.2021431

Abstract

We present a new approach to understand the importance of aspects of shopping behavior, focusing the empirical portion of the paper on the multiple attributes of shopping for home furnishings. Respondents evaluated different combinations of 36 descriptive elements of the shopping experience, doing so in five different studies, each pertaining to one product (bed sheets, decorator pillows, drapes, table cloths, towels, respectively). The ratings were deconstructed into the part-worth contribution of each of the 36 elements. Clustering the 622 respondents into five groups (mind-sets) showed that four of the five mind-sets valued similar features of the shopping experience (assortment, convenience price), but in different rank orders of importance. We suggest that when the topic combines both the experience and the product, mind-set segmentation may not reveal polar opposites, but rather gradations of what is really important. There may be fundamentally different ways of when people thinking about thinking about the combination of experience + product versus thinking separately about product or experience.

Introduction

During the past two decades author HR has explored the use of Mind Genomics as a way to understand the underlying criteria by which people make decisions. Rather than working from a top-down framework where individuals are assigned to clusters based upon the pattern of responses to different aspects of life [1], Mind Genomics works at the granular level, assigning people to clusters or mind-sets based upon the patterns of reaction to description of specific situations, and specific products. Mind Genomics can thus be seen as an inductive approach to understand the world, an approach which does not prescribe a specific pattern, but which simply organizes responses to a limited part of a person’s experience [2,3].

During the early years of the 21st Century, the author and colleagues from the Understanding and Insight Group began work on large scale Mind Genomics studies in specific areas, such as products that one might buy at a store (Buy It!), on different types of insurance (Protect It!), on foods (Crave It!) and on beverages (Drink It!). At the time of these experiments, the idea was to create a series of related studies, with similar elements, but particularized in certain aspects, such as the store where things were sold (Buy It!), or the ingredients that the product included (e.g., Crave It! and Drink It!). The objective was to create the studies, present the respondents with a wall of studies from which to choose (Figure 1), and then analyze the results of the respondents who chose to participate.

One of the interesting patterns to emerge was the existence of general patterns across related studies (e.g., [4]. As an example, for food and beverage, three mind-sets emerge. These were the classics (want what is typical), the elaborates (describe the sensory characteristics or the ingredients), and the imaginers (talk about the experience.) The emergence of three general, overarching mind-sets was interesting, especially when the topic was products in a store. But what about experience? Do we have the same clearly simple, obvious mind-sets emerging when we have a complex experience, involving the person, the action, but a goal (viz., buying a specific product)? The topic is not new, interesting researchers over a period of decades, because it involves what has come to be called multi-attribute decision making [5-7]. Multi-attribute decision making becomes very interesting and attracts attention, both in theory and in practice, when the topic involves shopping [8-10].

The project reported here moved the focus beyond the simple product, and beyond the simple experience, to conjoin them. The topic was explored in the Buy It! study, with 30 different products, shown in Figure 1. Figure 1 shows the array of different products that were studied. In the actual study we had respondent select the product in which they were most interested.

fig 1

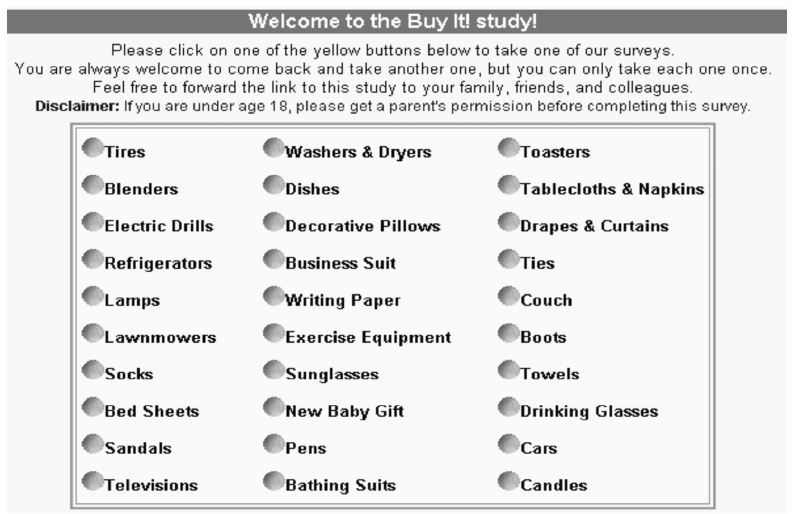
Figure 1: The ‘screen’ showing the different studies for Buy It!

It is now two decades after the data were collected. In the world of science, especially in the world of the hypothetico-deductive, that type of data is considered irrelevant, ante-diluvian, and perhaps other, more negative terms. The data from these ‘attitude studies’ is often considered valuable only when the data are collected ‘today,’ to address ‘today’s issues.’ Yet, the data from Mind Genomics studies have been designed to be archival and to represent the way the mind works, not to necessary to reflect the momentary issues of today. It is with this perspective that we proceed to evaluate the data of two decades ago, data which will prove just as enlightening today as they proved two decades ago, although we will add some new analyses to the old data.

The importance of similar underlying structures cannot be emphasized enough. Too much research in the world of consumer decision making, as well as deep analysis of attitudes, is a one-off, without the possibility of creating a database to understand the mind, either across relative topics or across time, or both. There are simplistic trends evaluations, such the Quinnipiac polls for political opinion, but the polls are simplistic, and do not provide the potential for a deeper analysis, indeed one analysis becoming increasing value with more data collected in a disciplined manner.

The Buy It! Experiment

The data come from Buy It! a large-scale study of more than 4,000 respondents across 30 different products that one could purchase (Figure 1). The It! studies were designed to investigate related topics using a structured set of elements, these elements being particularized to the specific product, but being as similar as possible across the 30 studies. In that way it would be straightforward to compare the data from study to study, product to product, because the phrasing of the element was maintained. Table 1 shows the 36 phrases. These phrases apply to each product. The word PRODUCT is inserted where each study would have the actual product name. The objective is to find the degree to which each phrase drives similarity to one’s ideal shopping experience.

Table 1: The elements. The table shows the elements, with the study configured to bedsheets (replaced by PRODUCT).

Question 1: What type of selection does the store feature?

A1 We have catalogs that feature sheets of all sizes, blankets, comforters, and bedspreads… page after page of bed linens
A2 Online or in the store… lots of choices in today’s most popular styles
A3 Shop at our online store for every kind of (PRODUCT) you can imagine… plus all the accessories you could want
A4 A discount store featuring all kinds of (PRODUCTS)
A5 Featuring areas for all types of (PRODUCT)… and many related items
A6 Lots of very different store environments showcasing the latest trends in (PRODUCTS)… shop the entire day
A7 Your favorite specialty store… they always seem to have that special (PRODUCT) set you are looking for and all the accessories you need
A8 A relaxing shopping experience… well designed displays, marble, wood, soft lighting and professional salespeople
A9 (PRODUCTS) chosen to fit your decorating style, lifestyle, room colors, and personality…to try out at your leisure
How is price described?
B1 The price is JUST RIGHT … ALL OF THE TIME
B2 Self-service… no one to get in your way or slow you down
B3 Start anxious, leave happy … spending that is well worth it
B4 Offering a GREAT DEAL on the suggested retail price
B5 An upscale focus makes you feel like you’re part of an exclusive club
B6 Offering affordable packaging and gift wrapping for your (PRODUCTS)
B7 Priced a bit more than you would expect – but worth it!
B8 Shopping with salespeople just like you… who take the time to appreciate your needs!
B9 Helpful staff, not patronizing … the service is personalized but you don’t feel like you’re being taken advantage of!
How is the shopping experience described?
C1 A practical and useful store setup… just right for targeted shopping
C2 Lets you get your shopping done quickly
C3 One stop shopping … lots of choices, options, brands, colors and sizes
C4 An easy-to-use gift registry to help you find the perfect gift for someone on your shopping list
C5 Such a good experience you just have to come back for more
C6 Takes away the boredom … just when you need it
C7 When you’re feeling down, shopping lifts your spirits up
C8 Share the experience with family and friends … get the encouragement when you need it!
C9 Designer (PRODUCT)s with a range of matching complementary items
What is the nature of the ‘place’ or ‘process’ by which to obtain the PRODUCT?
D1 At a store such as Wal-Mart, Kmart, or Target PARTICULARIZED TO THE PRODUCT
D2 At a store such as Sears, JC Penney, or Kohl’s PARTICULARIZED TO THE PRODUCT
D3 At a store such as Linens & Things or Bed Bath & Beyond PARTICULARIZED TO THE PRODUCT
D4 At a store such as Macy’s, Marshall Fields, Famous-Barr, L.S. Ayres, Lazarus, Burdines, or Rich’s PARTICULARIZED TO THE PRODUCT
D5 At Williams-Sonoma PARTICULARIZED TO TH PRODUC
D6 When ordering by phone or by Internet … friendly customer service helps you through it all
D7 Simple, easy shopping … no hassles
D8 Great hours … it may not be around the corner, but it’s still convenient for you
D9 With a chain of stores all over … buy your (PRODUCTS) anywhere

The Mind Genomics process differs from the conventional questionnaire or polls. Most researchers as well as respondents are accustomed either to simple questionnaires presenting one-at-a-time ideas, or concepts/mini advertisements, crafted in such a way as to present coherent selling propositions.

The typical approach, questionnaire or polls, presents the 36 phrases to a respondent, one phrase at a time, instructing the respondent to assign a rating to the phrase. In the Buy It! study, the rating would be ‘How similar is this phrase to your ideal shopping experience for the PRODUCT? This popular ‘one-at-a-time’ scaling procedure ends up producing data, but one cannot be clear about the stability of the judgment criterion used by a respondent as the respondent evaluates single element of different types. For one-element-at-a-time, this method makes little sense. For example, can a respondent instructed to rate a single element on the scale of similarity to ideal shopping, actually use the same criterion when applying that scale to the selection (elements A1-A9) versus to price (B1-B9)? There is no context, and the idea of ‘shopping experience’ is hard to understand.

Having the respondents rating lists of ideas is typically done at the start of a project, when there is little idea about what may be important to the shopper, and may not be important. Later, after the lists of ideas have been evaluated, and promising elements chosen, the research will involve the evaluation of, completed, polished concepts. The test stimulus moves from a single idea or set of ideas (so-called promise testing) to a fully executed idea, the concept incorporating the winning ideas into a proposition evaluated by the respondents, and used as a basis for a go/no go decision.

The Mind Genomics approach begins with a different point of view. To get the best answer the respondent should evaluate vignettes, combinations of messages which paint a more realistic word picture of the situation. The vignettes need not be crafted, but should contain different types of elements, put together, presented to the respondent as a single idea, and the whole idea then itself rated. No effort should be made to craft the combination. Rather, the combination should be created according to an underlying rule, the so-called experimental design [11], which specifies the composition of the combination. The combinations should be created so that each element from a category (or question in today’s language) appears approximately equally often with every element from the other categories. This approach, called a permuted design [12] ends up producing a unique 60 combinations of vignettes for each respondent. The permutations mean that the research covers more of the ‘design space.’ The researcher need not know ‘what works’ ahead of the study.

The approach, embodied in the Mind Genomics approach, today available as a do it yourself ‘app’ for a small set of 4 categories or questions x 4 answers or elements, was done with a bit more effort in 2002. However, the actual study was run in the same way, totally automatically after the set-up. For each respondent, the combinations were created automatically by computer and evaluated by the respondent. Each respondent evaluated 60 unique combinations. Each element appeared an equal number of times across the 60 vignettes or combinations, the element appearing in five of the 60 vignettes, and thus absent from 55 of the 60 vignettes. The vignettes themselves comprised 2-4 elements, most one element from each group or question.

The benefit of this seeming ‘blooming, buzzing confusion’ is that the respondents pay minimal attention, but do pay attention, and cannot game the system. Respondents can’t figure out the correct answer. Furthermore, the elements appear in combination, defeating the respondent’s effort to adjust the judgment criterion to match the element.

Another key benefit of the Mind Genomics approach is the use of individual-level experimental design, permutations of the same basic experimental design, but with the combinations differing from one respondent to another [12]. Recall that each respondent evaluated combinations. Across all respondents participating in the same study, it is unlikely that the same vignette will appear twice, and extremely rare that the vignette will appear three times. This feature means that the researcher needs not know the ‘correct answer,’ because the pattern will emerge from the array of the thousands of vignettes evaluate. The analogy is the MRI in medicine, which takes many pictures of the underlying tissue from different angles, and combines them analytically afterwards to provide the picture. The really important thing to know is the elements can be developed quickly, and the process is inexpensive, and welcomes iterations.

The goal of the Mind Genomics study is not the measurement of the combinations. The combinations are only vehicles to embed the elements. Rather, Mind Genomics measures of the strength of each element, as the driver of the ideal shopping experience for the product (ratings 7-9 on the scale).

Figure 1 shows an example of one combination, comprising three elements. Figure 1 provides a ‘scenario’ that can be judged. The respondent is still presented with ‘incomplete’ information, an unpleasant fact which irritates many perfectionist marketers, who want a densely written concept to be judged. The reality, however, is that respondents presented with short vignettes such as the one shown in Figure experience little difficulty assigning a rating to the vignette. Figure 1 comprises enough information to describe a shopping experience. No effort is made to polish the combination. The specific product is particularized, so that the third element (Design exercise equipment with a range of matching complementary items) would have the world ‘tablecloth’ substituted for the phrase Designer exercise equipment. The same substitution would be done for the rating scale.

The respondent presented with the vignette in Figure 1 often feels confused. Some significant portion of the time the respondent’s first attempt is to identify the one element that the respondent feels to be important. The respondent will attempt to select that element but become frustrated because there is no place on the screen to select a single element. It is for that reason that the Mind Genomics studies begin with an introduction.

Figure 2 shows the introduction to the study as it was done in 2002. By today’s standards, 2021, 19 years later, the respondent orientation is unnecessarily long. The objective in 2002 was to ensure that the respondent ‘knew’ what the stimuli were (combinations of the elements), that the respondent understood the meaning of the rating question, and that the respondent knew how long the Mind Genomics interview (really experiment) would take (15-17 minutes). As of this writing (2021), the introduction is a line or two, telling the respondent about the topic of the study, and to consider the elements are one idea.

fig 2

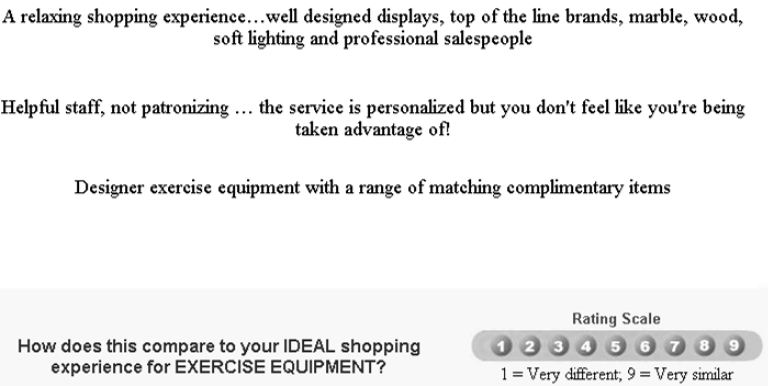
Figure 2: Example of a three-element vignette. The phrase ‘exercise equipment’ would be changed to the appropriate product for the Mind Genomics topic.

fig 3

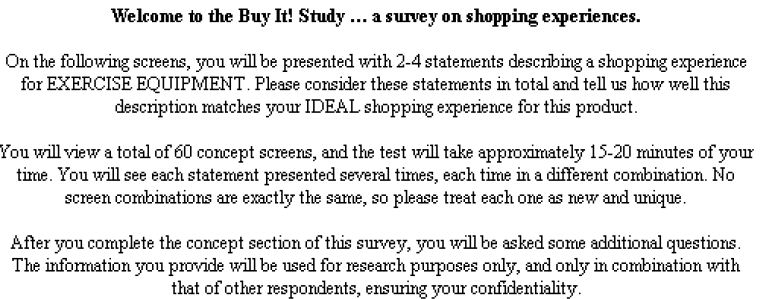
Figure 3: The orientation page. The phrase ‘exercise equipment’ would be replaced by the appropriate product.

The study is itself was ‘fielded’ by Open Venue, Ltd., of Canada, which had a large panel of online respondents. The respondents were invited to participate. Those respondents agreeing to participate clicked on the link embedded in the email, were led to the ‘wall’ of studies shown in Figure 1, selected the study, read the introduction, evaluated 60 vignette, and completed large-scale self-profiling classification. Some of the self-profiling data will be referenced in this paper to give a better sense of the nature of emergent mind-sets.

Experimental Design, Modeling, and Clustering

Figure 2 shows an example of one vignette, one combination of elements. Each respondent evaluated 60 different vignettes, a vignette comprising 2-4 elements, at most one element (or answer; Table 1) from a question. The vignettes were created by a systematic plan, experimental design. The underlying experimental design prescribed which combinations a respondent would evaluate. The experimental design was the same for each person, but the specific combinations differed from person to person, according to a permutation scheme [12]. This scheme ensured that the study for any product would cover a large number of possible combinations. The scheme also ensured that no mutually contradictory elements would appear in the same vignette, e.g., two different stores. Finally, the scheme ensured that it would be possible to do complete statistical analyses such as OLS (ordinary least-squares) regression on the results of each separate respondent, a capability that would prove vital to understand the different ‘mind-sets’ of the 622 respondents who would participate.

Each respondent chose one of the studies shown in Figure 1. The data presented here will deal with the results of five studies; bed sheets, decorator pillows, drapes; tablecloths, and towels, respectively. The respondent was presented with the requisite set of 60 vignettes in randomized order, responded to the combination, with the response being on a 1-9 scale. In addition, the respondent completed an extensive self-profiling classification, some of the results from which will be shown at the end of this paper.

The Mind Genomics program (then called IdeaMap®) presented the combination, recording the structure of the combination, as well as the rating. The structure of the combination comprised 36 columns, one column for each of the 36 elements. The coding for a specific vignette comprised a set of 1’s for the elements (columns) which appeared in the vignette, and a set of 0’s for the elements (columns) which did not appear in the vignette. Since the vignettes comprised 2-4 elements by design, across the 36 columns coding the elements, only 2-4 of the columns contained the number ‘1’, and the remaining columns contained the number ‘0’. The 37th column was the rating, later converted to a binary value. The 38th column, corresponding to the newly created binary variable, contained the number ‘0’ plus a very small random number for those ratings which were 1-6. The 38th column contained the number ‘100’plus a very small random number for those ratings which were 7-9. It will be the binary transformation that we will use for the analysis. The very small random number added to each transformed value ensured that the dependent variable would show some miniscule variability in the unlikely case that all of the transformed ratings for a respondent turned out to be either 0 or 100, respectively.

The OLS regression computed this equation for each respondent, storing the parameters in a data file associated with the respondent: Transformed Binary Value = k0 + k1(A1) + k2(A2) … k36(D9). The regression output, therefore, comprises a set of 37 numbers, the additive constant (k0), and numbers, one for element.

At the very start of the research the experimental design ensures ensured that the 36 elements are statistically independent of each other at the level of each respondent. Furthermore, the vignettes are incomplete, with many of the vignettes absent elements from one or two of the questions. This independence and the incompleteness of the vignettes ensures that the coefficients k0-k36 in the foregoing equation have ratio scale properties.

We interpret the additive constant, k0, as the estimated likelihood of a rating of 7-9 assigned (similar to my ideal shopping experience) for a vignette comprising no elements. Of course, the experimental design ensured that every vignette would comprise a minimum 2-4 element. Thus, the reality is that the additive constant is a purely estimated parameter. A baseline, telling us the degree to which the respondent is prepared to respond strongly and positively to a vignette as representing their ‘ideal shopping experience’. In turn, the coefficient shows the driving power of the element to a response of 7-9 when the element is part of the vignette. The additive constant and the coefficients can be added to estimate the percent of respondents who would rate a vignette 7-9, ‘matches my ideal shopping experience’. When constructing new vignettes it is best to use only one element from each of the four questions.

The Standard Analysis for a Single Study and Its Modification to Combine the Five Studies

Mind Genomics studies comprising one topic typically follow a templated analysis, beginning with the creation of equations for total panel, and for subgroups. All of the data for a specific subgroup are placed into the same data set and then a single OLS regression is performed on the full data set. There is no worry that the OLS regression will fail since the permuted experimental design ensures that each individual’s data constitutes the appropriate number of cases (observations) to run a valid regression. Incorporating many respondents with the same experimental design but permuted to create different combinations across respondents simply strengthens the statistical power of the regression.

For this study, however, we looked at five different products. Following a slightly different path, the analysis created an individual model for each respondent. A total of 622 respondents participated across the five studies, creating a database of 622 rows, one row for each respondent. The first data column was the additive constant, the second to the 37th column corresponded to the coefficient of each of the 36 coefficients.

We treated the 622 rows of data (viz., additive constant and coefficients) as one large one data set, despite the fact that there were five products. The elements were similar from product to product. The next step clustered the 622 respondents into mutually exclusive groups, based upon the patterns of the coefficients [13]. For this analysis we removed the five elements corresponding to stores, leaving 31 coefficients. Based upon previous suggestions of at least three major groups of respondents (price, convenience, assortment) we opted to divide the 622 respondents into five groups or clusters, based upon the pattern of their 31 coefficients. The rationale for selecting five was to keep the number of clusters to a minimum, recognizing that there were five different products. Three were known; two additional clusters might reveal new to the world criteria of judgment.

The actual clustering was preceded by a data simplification task. Previous experience revealed that many of the different answers or elements were correlated with each other. To reduce the correlation, we performed a principal components factor analysis on the matrix of 31 variables (viz., all elements but the five stores), and 622 rows (viz., the respondents). The additive constant was not used. The principal components factor analysis revealed 14 statistically independent factors, rather than 31 corresponding to the 31 elements. Each respondent became a set of 14 factors scores, on this ‘reduced space.’ We then clustered the respondents based on their 14 newly created factor scores, rather than on their 31 original coefficients. The approach of clustering is k-means. The measure of distance between respondents is defined as (1-Pearson Correlation, viz., 1-R). When the 14 factor scores of two respondents correlated perfectly (R=1), the distance between them is 0. When the 14 factor scores of two respondents correlated perfectly but inversely, viz. moving in precisely opposite directions (R=-1), the distance between them is 2. The k-means clustering put the respondents into five groups, based upon minimizing the distance between respondents with a cluster, and maximizing the distance between the centroids of the five clusters.

What Stories Do the Coefficients Tells Us for Each of the Five Mind-sets?

The important outcome from the analysis is the ‘story’ told by the elements which score strongly for a mind-set. These are the elements which drive the respondent in the mind-set to say what is being read corresponds to something driving towards an ideal shopping experience. We should keep in mind that the respondent never saw single elements, but only combinations comprising 2-4 elements. Yet, some of the vignettes were rated far more similar to the ideal shopping experience than were others, so the respondents are differentiating.

We begin with some information about the five mind-sets emerging from the clustering. Keep in mind that these clusters were created from the data of all respondents, and so respondents from studies with several products can appear in the same mind-set. The clustering program neither considered the study in which the respondent participated (viz., product), nor considered the additive constant.

Table 2 shows the distribution of the respondents in the five mind-sets created by the clustering program. The five mind-sets are shown in descending order of the strong performing coefficients. That is, each mind-set shows will have a set of elements which score highly, viz., which correspond to the ideal shopping experience. The strong performing elements, shown in subsequent tables, will suggest names for the emergent mind-sets. These names are based upon discovering a possible theme uniting, when possible, the strong performing coefficients in that mind-set

  1. The five mind-sets are shown in order, based upon the sum of strong performing coefficients (coefficient >=8). This number is shown at the bottom. Mind-Set A shows the largest sum of positive coefficients greater than 8. The sum is 1,006. In contrast, Mind-Set E shows the smallest sum of positive coefficients greater than 8. The sum is 19.
  2. Each product shows a different number of respondents in every mind-set. The five mind-sets distribute in similar but not identical numbers in each product.
  3. Mind-Set E shows the greatest number of respondents, 202 out of 622, or one third of the respondents.

Table 2: Distribution of respondents in the five product studies across five mind-sets.

 Mind-Set

A B C D E1

Total


Product & Experience

Price Convenience Shopping Emotions Everything – Choice, Price, Shopping Experience High Quality, Choice


Base size of each product (row) in each mind-set (column)

Bedsheet

30

29 22 27 33

141

Decorator Pillow

25

25 21 19 42

132

Drapes

19

23 18 28 38

126

Tablecloth

25

17 25 17 45

129

Towel

17

22 31 20 44

134

Total

116

116 117 111 202

662

Sum of strong performing coefficients (>=8)

1006

571 556 396 19

2548

The fact that this mind-set shows the lowest sum of strong performing elements (19) suggests that there may be other mind-sets hidden by in Mind-Set E1, failing to surface because the patterns of coefficients of these hidden mind-sets possibly canceling out one another. The extraction of six, seven or even more mind-sets would make this paper unduly long, so the statistical analysis was stopped at five.

Research note: There is no fixed number of clusters of mind-sets to extract in these types of studies. The objective is to create a workable set of different groups, with clearly different patterns. It is quite possible, although statistically nonsensical; to make every person into a mind-set, viz., create 622 clusters. In the same fashion, it is equally nonsensical to create one mind-set and force everyone into that mindset. The best practice is to create a relatively small number of mind-sets which seem to tell ‘different, but interpretable stories.’ The operative words are parsimony (fewer mind-sets are better than many mind-sets), and interpretability (the mind-sets should be coherent, telling a story or suggesting a common theme).

With five different products of the same type, and with 31 elements in the segmentation, the data becomes overwhelming. Patterns cannot be easily seen in this ‘wall of numbers,’ defeating the purpose of the project. To make the analysis simpler, and to allow patterns to emerge. We show only those elements which achieve at least a coefficient of +8 for one or more of the five products. All other cells are blanked out. We will show the data for each of the five mind-sets in a separate table.

None of the mind-sets emerging from the combination of five studies could be described as single-minded. Each of the five mind-sets comprised at least two different aspects, albeit in different patterns as shown below.

We begin with the strongest performing mind-set, Mind-Set A which focuses on the product and the experience. Mind-Set A is the most likely to feel that the elements portray the idea shopping experience. Yet, Mind-Set A is discriminating. Here is a comparison of the strongest performing positive element versus the weakest performing positive element (Table 3):

A4              A discount store featuring all kinds of (PRODUCT) (Total =119)

D9             With a chain of stores all over. buy your (PRODUCT) anywhere (Total = 8)

Table 3: Strong performing elements for Mind-Set A: It’s about the product and the experience.

table 3

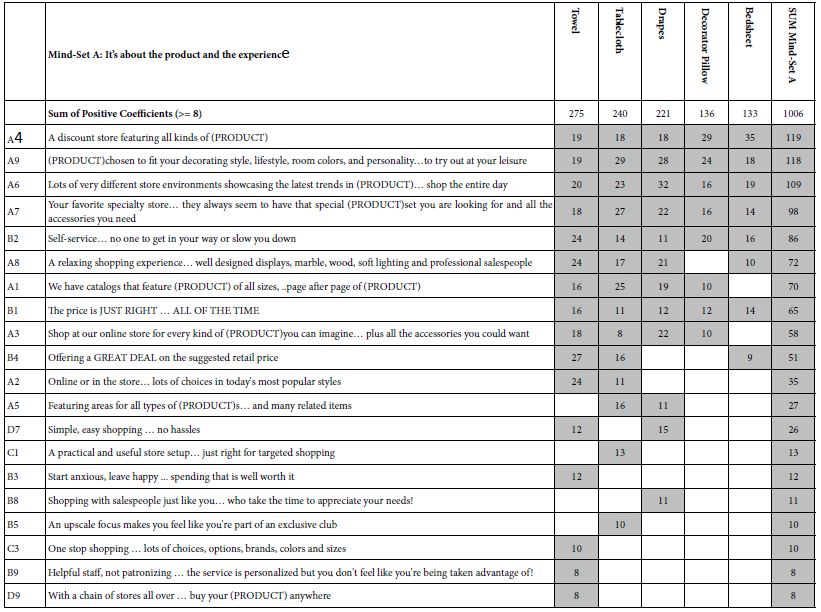
Table 4 presents the results for Mind-Set B, which might comprise those respondents focusing both on price and on convenience, respectively. The orders of the five studies differ, with the highest sum emerging for drapes, and the lowest sum emerging for tablecloths and towels. This difference across the different products suggests an interaction between product and mind-set. Here are the strongest and weakest performing ‘relevant’ elements.

B1               The price is JUST RIGHT … ALL OF THE TIME                            (Total = 119)

B3               Start anxious, leave happy … spending that is well worth it        (Total = 8)

Table 4: Strong performing elements for Mind-Set B: It’s about price and convenience.

table 4

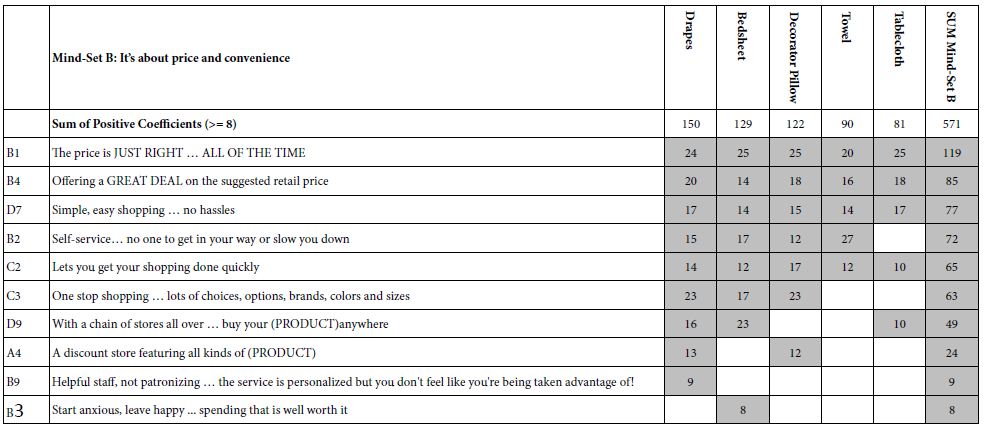
Table 5 presents the results for Mind-Set C, comprising respondents focusing on shopping and emotions, as well as the other aspects such as price and convenience. It is clear from Mind-Set C that the respondents in a mind-set do not focus only on the distinguishing elements (viz., emotion), but rather include those distinguishing elements in the ones important to them. Here are the strongest two and weakest one elements for Mind- Set C. Notice that element C7 introduces emotion as a strong part of the ideal shopping experience.

A4               A discount store featuring all kinds of (PRODUCT)                               Total = 74

C7              When you’re feeling down, shopping lifts your spirits up                       Total = 56

D6              When ordering by phone or by Internet … friendly customer service     Total = 8

                         helps you through it all

Table 5: Strong performing elements for Mind-Set C: It’s about shopping and emotions.

table 5

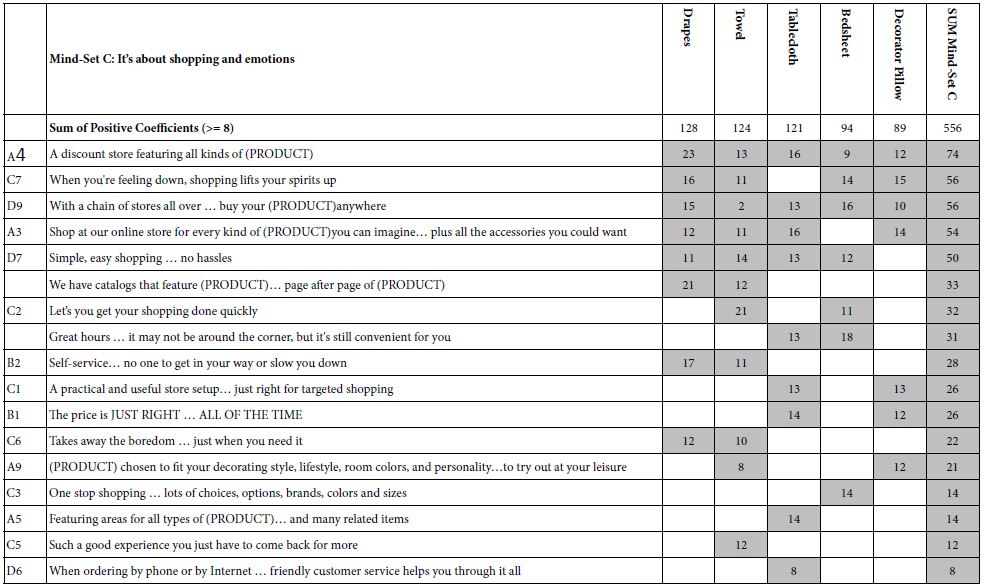
Table 6 presents the results for Mind-Set D, which might comprise those respondents without a specific focus. They appear to react to only nine elements, but these elements come from all of the aspects of shopping: choice, price, shopping, and experience. Here are the strongest and weakest elements from the relevant set of elements.

C3 One stop shopping … lots of choices, options, brands, colors and sizes Total = 72

B4 Offering a GREAT DEAL on the suggested retail price Total = 8

Table 6: Strong performing elements for Mind-Set D: Choice, Price, Shopping Experience.

table 6

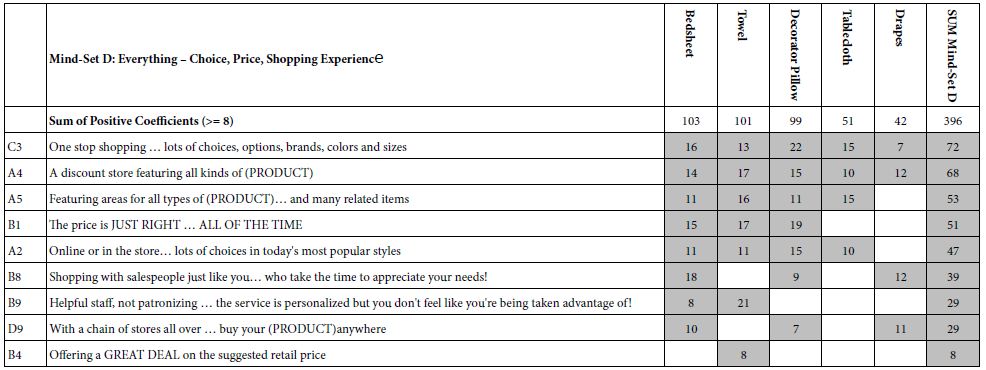
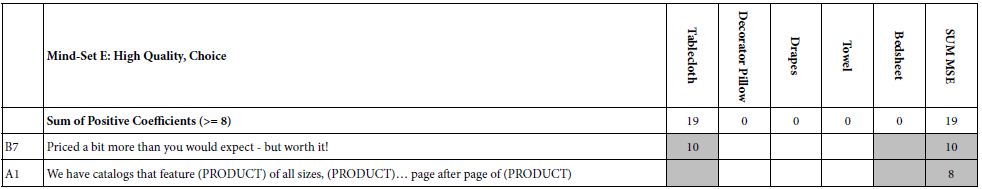
Table 7 presents the results for Mind-Set E, the most numerous mind-set, but the group which responds to only two elements, representing high quality and choice. Mind-Set E might comprise several mind-sets within it, but we focus here only on five mind-sets, and treat Mind-Set E as a single mind-set

Table 7: Strong performing elements for Mind-Set E: Quality and choice.

table 7

We now move to the additive constant, which was not included in the clustering, but nonetheless plays an important part in the interpretation of the results, and their practical application. The additive constant tells us about the basic proclivity of the respondent in the mind-set to assign the rating (7-9) to a mind-set which is absent any elements. Again we see different patterns (Table 8).

Table 8: The additive constants for the five mind-sets and the five products within each mind-set.

table 8

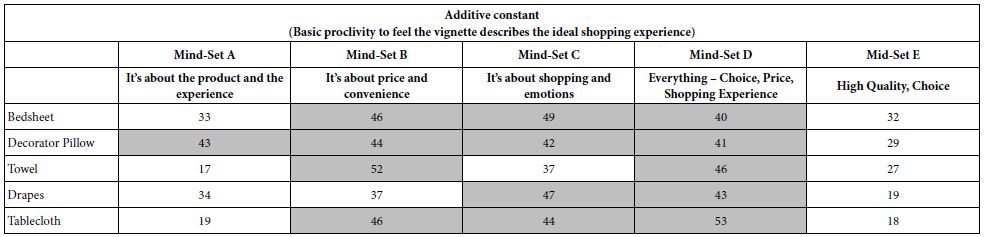
Mind-Set A (It’s about the product and the experience) shows the highest additive constant for the decorator pillow, the one item which can be considered the least necessary item.

Mind-Set B (It’s about price and convenience) show the highest additive constant for bedsheets and towel, and unexpectedly for decorator pillow.

Mind-Set C (It’s about shopping and emotions) show the high additive constant for all products except towel.

Mind-Set D (Everything, chi8ce, price, shopping experience) shows the highest additive constant for all five products.

Mind-Set D (High Quality, Choice) shows no additive high additive constant, and seems to be uninterested in the topic

Can We Find a ‘Golden Message’ Which Works for a Product across Mind-sets?

Thus far, we have in front of us an unusual situation in which there exist mind-sets, but the mind-sets are not opposite of each other, but rather emphasize the same types of messages (price, convenience, assortment), albeit in different orders. The next level of question, and the final in our analysis of messages, the elements of the vignette, is whether there exist a set of messages for each product which promise good performance across the mind-sets. Based upon what we have seen above its quite likely that the strongest performing elements will comprise messages from price, convenience, and assortment, and that the strongest performing messages will do well for all five products.

Table 9 shows the performance of each of the elements across the mind-sets, broken out by product. The e table shows the number of mind-sets out of five mind-sets where the element generates a positive coefficient of 8 or higher. The right half of the table shows the sum of the strong performing coefficients for the element across the five mind-sets, for each product.

Table 9: Performance of each element in terms of generating strong performing coefficients (>=8).


Count (Number of mind-sets out of five in which the element performs well (>=8))
    Total Bedsheet Decorator Pillow Drape Tablecloth

Towel

A4 A discount store featuring all kinds of (PRODUCT)

17

3 4 4 3

3

B1 The price is JUST RIGHT … ALL OF THE TIME

15

3 4 2 3

3

D9 With a chain of stores all over … buy your (PRODUCT)anywhere

12

3 2 3 2

2

B2 Self-service… no one to get in your way or slow you down

11

2 2 3 1

3

D7 Simple, easy shopping … no hassles

11

2 1 3 2

3

C3 One stop shopping … lots of choices, options, brands, colors and sizes

10

3 2 2 1

2

B4 Offering a GREAT DEAL on the suggested retail price

9

2 1 1 2

3

A3 Shop at our online store for every kind of (PRODUCT)you can imagine… plus all the accessories you could want

8

0 2 2 2

2

A1 We have catalogs that feature sheets of all sizes, blankets, comforters, and bedspreads… page after page of bed linens

7

0 1 2 2

2

A5 Featuring areas for all types of bed sheets… and many related items

7

1 1 1 3

1

A9 (PRODUCT)chosen to fit your decorating style, lifestyle, room colors, and personality…to try out at your leisure

7

1 2 1 1

2

C2 Let’s you get your shopping done quickly

7

2 1 1 1

2

A2 Online or in the store… lots of choices in today’s most popular styles

6

1 1 0 2

2

A6 Lots of very different store environments showcasing the latest trends in bed sheets… shop the entire day

5

1 1 1 1

1

A7 Your favorite specialty store… they always seem to have that special (PRODUCT)set you are looking for and all the accessories you need

5

1 1 1 1

1

A8 A relaxing shopping experience… well designed displays, marble, wood, soft lighting and professional salespeople

4

1 0 1 1

1

B8 Shopping with salespeople just like you… who take the time to appreciate your needs!

4

1 1 2 0

0

B9 Helpful staff, not patronizing … the service is personalized but you don’t feel like you’re being taken advantage of!

4

1 0 1 0

2

C7 When you’re feeling down, shopping lifts your spirits up

4

1 1 1 0

1

C1 A practical and useful store setup… just right for targeted shopping

3

0 1 0 2

0

B3

Start anxious, leave happy … spending that is well worth it

2 1 0 0 0

1

C6 Takes away the boredom … just when you need it

2

0 0 1 0

1

D8 Great hours … it may not be around the corner, but it’s still convenient for you

2

1 0 0 1

0

B5 An upscale focus makes you feel like you’re part of an exclusive club

1

0 0 0 1

0

B7 Priced a bit more than you would expect – but worth it!

1

0 0 0 1

0

C5 Such a good experience you just have to come back for more

1

0 0 0 0

1

D6 When ordering by phone or by Internet … friendly customer service helps you through it all

1

0 0 0 1

0

B6 Offering affordable packaging and gift wrapping for your (PRODUCT)

0

0 0 0 0

0

C4 An easy-to-use gift registry to help you find the perfect gift for someone on your shopping list

0

0 0 0 0

0

C8 Share the experience with family and friends … get the encouragement when you need it!

0

0 0 0 0

0

C9 Designer (PRODUCT)with a range of matching complementary items

0

0 0 0 0

0

The data tell a straightforward story. There are four tiers of messages:

Very strong messages, likely appealing to all mind-sets and all products

A4                               A discount store featuring all kinds of (PRODUCT)

B1                               The price is JUST RIGHT … ALL OF THE TIME

Strong messages, appealing to all mind-sets, but only some of the products

D9                               With a chain of stores all over … buy your (PRODUCT)anywhere

B2                               Self-service… no one to get in your way or slow you down

D7                               Simple, easy shopping … no hassles

C3                               One stop shopping … lots of choices, options, brands, colors and sizes

Truly losing messages, performing poorly, possibly well with one product/mindset combinations

B5                               An upscale focus makes you feel like you’re part of an exclusive club

B7                               Priced a bit more than you would expect – but worth it!

C5                               Such a good experience you just have to come back for more

D6                               When ordering by phone or by Internet … friendly customer service helps you

                                   through it all

B6                               Offering affordable packaging and gift wrapping for your (PRODUCT)

C4                               An easy-to-use gift registry to help you find the perfect gift for someone on                                                    your shopping list

C8                               Share the experience with family and friends … get the encouragement when                                                  you  need it!

C9                               Designer (PRODUCT)with a range of matching complementary items

All other messages.

Learning about the Mind-sets by What They Say about Themselves

The foregoing analysis suggested at least five mind-sets about shopping, as well as showing that for each mind-set (except Mind-Set E), the elements which ‘drive’ the perception of an ideal shopping experience come from three major groups; product choice, price, shopping convenience. Do these respondents feel the same regarding the way they describe the shopping?. That is, how do the respondents in a mind-set feel about the shopping experience, and do respondents in the five mind-sets answer differently? Furthermore, if there are segment to segment differences are there a clear story, or are the differences unrelated to the mind-sets?

At the end of the evaluation of the 60 vignettes, the respondents completed a lengthy self-profiling questionnaire on shopping habits, feelings, etc. This is the so-called habits and practices or attitude and usage questionnaire. The question is quite lengthy, often reflecting the researcher’s effort to acquire as much information about the topic as possible.

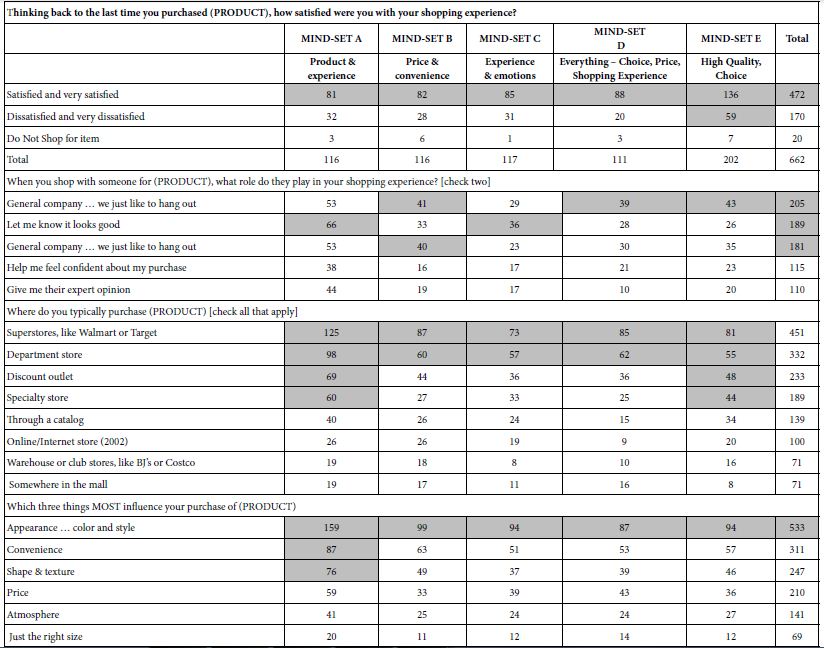
Table 10 shows the tabulation of the some of the questions by the five mind-sets. The self-profiling questionnaire suggests that the mind-sets are similar in the pattern of their attitudes. In light of previous studies with Mind Genomics which reveal dramatically different attitudes and behaviors of mind-sets, the similarity of patterns in Table 10 beg the question of ‘what is special about the topic of shopping for household furnishings?’

Table 10: How the total panel and the five mind-sets respond four questions taken from the self-profiling questionnaire. All numbers in the table refer to the number of respondents.

table 10

Discussion and Conclusions

Most of the previous work using Mind Genomics focused on products, specific experiences, social issues, medical, and legal topics, respectively. Many of these studies revealed dramatically different mind-sets, with the coefficients of the elements clearly revealing the nature of the mind-set. This study on shopping, and a recently published study on the experience of dining in a casual restaurant [14] suggest that the mind-sets which emerge are less polarized.

In the 1980’s a similar observation emerged, not with ideas, but with food products. There were some food products wherein the taste preference segments were dramatic, including pasta sauce, pickles, and coffee [15]. Yet, there was one product, pizza, which showed some sensory preference segmentation, but the segmentation was a matter of degree to which one topping scored higher than other, rather than accept/reject. The explanation proffered at that time was that flavor-driven foods, the segmentation would be polarization. Pizza, however, is not a flavor driven food as much as it is different levels of acceptance of the various toppings. As a consequence, there were differences in the preference for pizza, leading Pizza Hut to modify some of its offerings to better accord with the preferences [16]. That finding for pizza confirmed the results of almost a decade earlier before, for exploratory studies with pizza done with Campbell Soup Company [17].

We surmise from the pizza vs pasta sauce that the shopping experience is not one of ‘flavor’ but rather one of a hierarchy of preferences. That is, a person does not fail to care about price, but care about assortment, and so forth. It is just a matter of which is somewhat more important than others. The nature of the segmentation is not dramatically different. Rather the segmentation reveals the minor differences among people.

The pattern of likes for many products is based upon simple dimensions, such as flavor, and to a lesser extent appearance and texture (mouthfeel). These simple dimensions drive strong likes and dislikes, which emerge in the description of the product. The mind-set segmentation may be too simple, too dramatic, when the focus moves from simple products or simple, relatively one-dimensional experiences to a complex of experiences with clearly different aspects, shopping as well as eating in a restaurant, represent these complex situations. Both shopping, the topic of this paper [18-22] and eating at restaurants [14], there are two aspects making the segmentation less powerful. The first aspect is that which is sought and for which the experience is initiated (the item shopped for, the food served in the restaurant). The second aspect is the dimensions of the experience as it happens. It may well be that fuzzy mind-sets emerge when there are these two-pronged situations, that which is being sought, and that which has to be experienced, separate and parallel to what is being sought.

Acknowledgment

Author Howard Moskowitz wishes to acknowledge the help of the late Hollis Ashman, a member of It! Ventures at the time of the research. Hollis created the study, and put together the basic data from the study results.

References

  1. Moskowitz HR, Gofman A, Beckley J, Ashman H (2006) Founding a new science: Mind Genomics. Journal of Sensory Studies 21: 266-307.
  2. Kell DB, Oliver SG (2004) Here is the evidence, now what is the hypothesis? The complementary roles of inductive and hypothesis‐driven science in the post‐genomic era. Bioessays 26: 99-105. [crossref]
  3. Moskowitz HR (2012) ‘Mind Genomics’: The experimental, inductive science of the ordinary, and its application to aspects of food and feeding. Physiology & behavior 107: 606-613. [crossref]
  4. Rabino S, Moskowitz H, Katz R, Maier A, Paulus K, et al. (2007) Creating databases from cross‐national comparisons of food mind‐ Journal of Sensory Studies 22: 550-586.
  5. Chopra K (2014) Study of relationship between utilitarian and hedonic motives and temporal perspective at retail malls. International Journal for Research in Applied Science and Engineering Technology 2: 35-40.
  6. Van Limburg B (1998) City marketing: a multi-attribute approach. Tourism Management 19: 475-477.
  7. Zanakis SH, Solomon A, Wishart N, Dublish S (1998) Multi-attribute decision making: A simulation comparison of select methods. European journal of operational research 107: 507-529.
  8. Milutinovic V, Salom J (2016) Mind Genomics: A Guide to Data-Driven Marketing Strategy. Springer.
  9. Marmorstein H, Grewal D, Fishe RP (1992) The value of time spent in price-comparison shopping: Survey and experimental evidence. Journal of Consumer Research 19: 52-61.
  10. Neal WD (2005) Principles of market segmentation. AMA Core Marketing Knowledge: Segmentation, American Marketing Association, New York.
  11. Lundstedt T, Seifert E, Abramo L, Thelin B, Nyström Å, et al. (1998) Experimental design and optimization. Chemometrics and Intelligent Laboratory Systems 42: 3-40.
  12. Gofman A, Moskowitz H (2010) Isomorphic permuted experimental designs and their application in conjoint analysis. Journal of Sensory Studies 25: 127-145.
  13. Likas A, Vlassis N, Verbeek JJ (2003) The global k-means clustering algorithm. Pattern Recognition 36: 451-461.
  14. Mazzio J, Harizi A, Rappaport SER, Bejarano L, Moskowitz H (2021) Mind Genomics & perception of the restaurant: Homo Emotionalis vs Homo Economicus. Psychology Journal of Research Open 3: 1-8.
  15. Moskowitz HR, Gofman A (2007) Selling Blue Elephants: How to Make Great Products that People Want Before They Even Know They Want Them. Pearson Education.
  16. Abbot M (1986) Personal communication.
  17. Adams A (1977) Personal communication.
  18. Sarantopoulos P, Theotokis A, Pramatari K, Doukidis G (2016) Shopping missions: Analytical methods for the identification of shopper need states. Journal of Business Research 69: 1043-1052.
  19. Turley LW, Milliman RE (2000) Atmospheric effects on shopping behavior: A review of the experimental evidence. Journal of Business Research 49: 193-211.
  20. Vaughn RL, Hansotia BJ (1977) A multi-attribute approach to understanding shopping behavior. Journal of the Academy of Marketing Science 5: 281-293.
  21. Büttner OB, Florack A, Göritz AS (2013) Shopping orientation and mindsets: How motivation influences consumer information processing during shopping. Psychology & Marketing 30: 779-793.
  22. Harizi A, Trebicka B, Tartaraj A (2020) A Mind Genomics cartography of shopping behavior for food products during the Covid-19 pandemic. European Journal of Medicine and Natural Sciences 4: 25-33.

Clarification of Research Study: ADHD Does Not Provide Special Conditions for Entrepreneurship

DOI: 10.31038/ASMHS.2021518


Is it the case that our hopes and wishful thinking about the state of affairs lead us to lose our analytical gaze and shortcomings in analysis?

In the article on ADHD and entrepreneurship that was published in The Journal of Applied Psychiatry, [1] the authors Frummerin and Lindström [2] emphasized that ADHD would not offer any special conditions for entrepreneurship and were critical of some article authors who emphasized that ADHD would provide favorable conditions for entrepreneurship.

To avoid a discussion characterized by seeing things in black and white, the article tried to describe the limitations that ADHD entails in a nuanced way with an insight that in exceptional cases there are designated ADHDs that could function entrepreneurially if there was support for them in other ways.

I.e., the article brought up:

“ADHD linked to restlessness and difficulty paying attention.”

“ADHD. Difficulties in concentration and not being able to focus on performing tasks for a long period of time”

“A person with ADHD is often exposed to a significant challenge in enduring and reaching all the way until the task is completed”.

It is interesting to note that some of those who read the article appreciated it because they perceived it as that ADHD can be an asset in entrepreneurial work. We the authors become self-critical and thoughtful about how we have expressed ourselves and how the readers have drawn conclusions from the article. In what way can we interpret these, albeit minority, reactions that for us are not in line with the message we hoped to convey?

There are certainly a variety of reasons why several readers of the article have not embraced the article’s message about the limitations associated with ADHD.

To note is that is that several entrepreneurs or self-employed people with their own ADHD diagnoses who have claimed that they have read it, mention they perceived the article directly positive and ADHD as an asset, this which in itself is interesting due to the examples above mentioned, as well mentioned in the article about mental health and challenges in functioning in everyday life.

We cannot interpret this in any other way than that some debaters and trendsetters for several years have tried to convey that ADHD would provide conditions for entrepreneurial action without drawing attention to the limitations and problems that ADHD can bring to individuals in terms of mental health and challenges in functioning in everyday life.

In Sweden there has been a strong effort to find opportunities for everyone, and this is an extremely positive desire. Every individual should be able to have the opportunity to realize their full potential. But when it comes to giving ADHD diagnosed individuals extra ordinary hope to act as entrepreneurs, it may approach the unrealistic and possibly raise more hopes than realistic possibilities.

In the quest to find new types and varieties of management, and looking for new ways to lead where creativity and focus could add new qualities and energy for entrepreneurship. Which is fully understandable but also possibly contains more visionary approaches than being realistic. Entrepreneurship if it is to have a long-term viability often includes more trivial components such as stability and organizational ability.

It is interesting to note that the message we tried to convey did not reach everyone and because of that we feel compelled to supplement our argumentation. We have some comments.

Is it the case that the discussion that has taken place, not only in Sweden, has not taken into account that ADHD often affects and limits an individual’s opportunities to function in an optimal way. In some articles, ADHD has been highlighted in such a way that one gets the impression that ADHD would provide special conditions to be an entrepreneur. What is the background to this?

Is it about wishful thinking and perceptual defense mechanisms?

That one has a picture and wishful thinking that it relates in a certain way. Or one does not have the patience and composure to read a text and analyse and draw conclusions.

Another factor that may possibly explain why one so reluctantly claims ADHD as a positive factor in this context is the image one makes of the entrepreneur. It is an image of an entrepreneur who leads an uncomplicated and clear business.

Certainly, ADHD characterized have often been able to lead activities of this nature.

Having that said, it can be easily confused or even mixed together what is entrepreneurship, and what is entrepreneurship. Or what is self-employed and running its own business versus- what is entrepreneurship? [1] [5].

A 2020 survey shows, [3] among other things, that the traditional image of the entrepreneur is no longer really adequate. Often one has had a simpler picture of entrepreneurs.

We can therefore not avoid stating that there has been and still is a general picture of the entrepreneur that can lead to mistakes with quick conclusions within the area.

We would like to emphasize that it is extremely commendable that we jointly try to create as favourable conditions as possible for individuals with ADHD behaviours. A variety of measures are needed at different levels that can make it easier for individuals with ADHD to develop their potential.

In the current debate no higher attention has been paid to the facts that say that ADHD often limits an individual’s opportunities to function in an optimal way.

This can lead to the creation of a notion that ADHD would provide conditions that are not fulfilled in reality. As a consequence, this could mean that individuals with ADHD are expected to perform commitments that they do not in fact have the conditions to perform. The consequence could be that people with ADHD would end up in professional roles in which they feel great frustration or that they simply fail.

As we judge it based on the response to the article, [1] the opportunity thinking about ADHD that has developed over time has led to a wishful thinking that overlooks realities regarding professional roles and interactions in the workplace [4].

This requires a more analytical approach without wishful thinking and defense mechanisms. It benefits those with diagnosed ADHD the best.

References

  1. Do Typical ADHD Traits Offer Advantages to Entrepreneurs? (sciaeon.org).
  2. About us – Entrepreneur profile test.
  3. New research about the entrepreneur in Sweden/Ny bild av den svenske entreprenören, (researchgate.net).
  4. Do Typical ADHD Traits Offer Advantages to Entrepreneurs? (researchgate.net).
  5. About the test – Entrepreneur profile test.
fig 8a,b

Some Deformed Specimens of Tor tor (Ham.-Buch.) and Tor putitora (Ham.-Buch.) from the Torrential River Chenab, An Important Himalayan River, Draining Union Territory of the Jammu and Kashmir, India

DOI: 10.31038/AFS.2021313

Abstract

Anomalous specimens of Tor tor and Tor putitora were noticed among fish collections made by fishermen from the river Chenab in Pargwal Wetland area, Akhnoor, over a period of three years, and are reported. Morphologically these deformed fishes were truncated and showed displacement of fins. Radiological analysis exhibited truncated vertebral column and compressed vertebrae with reduced vertebral thickness and intervertebral spaces. A possible cause of these aberrations is fast currents in various Himalayan tributaries of the torrential river Chenab in which Tor generally breeds.

Keywords

Deformed; Tor tor; Tor putitora; Truncated; The river Chenab; Currents

Introduction

Tor tor and Tor putitora, the important food and game fishes, are widely distributed in Himalayan lotic waters in India. In Jammu region of the Union territory of J&K, these fish species inhabit the river Chenab and its tributaries in Kishtwar, Doda, Banihal, Reasi, Udhampur, Rajouri and Jammu; the river Ravi and its tributaries in Kathua and Samba and Poonch river and its tributaries, including Mendhar nullah. Tor spp. migrate from plains, including Pakistan, for breeding in freshwater streams of Jammu region during monsoon and are netted in good number. Due to good water quality in streams and rivers of Jammu region, there are few reports of anomalous fishes in natural waters [1-10]. During hydrobiological studies of the river Chenab deformed specimens of Tor tor and Tor putitora were noticed along with normal fishes and have been described. The objective of the study is to find out the types and causes of various anomalies, though rare, in the Himalayan lotic water bodies.

Material and Methods

Deformed specimens of Tor spp. were purchased from fishermen collecting fishes from the river Chenab, in Pargwal wetland area, Akhnoor, and studied for morphological aberrations, parasitic infections and photographed. For detailed skeletal analysis these anomalous and normal fish specimens were radiographed with digital x-ray machine (Ray’s India).

For water quality characteristics, water samples were collected in plastic containers and analysed following standard methods [11].

Observations

During fish survey of the River Chenab six deformed specimens of Tor tor and five of Tor putitora were observed along with normal specimens and have been described as below.

Tor tor (Ham.-Buch.)

Head length is equal to body depth in a normal streamlined Tor tor Dorsal fin installation is midway between snout tip and caudal fin base and its longest fin ray is quite anterior to anal aperture. There is a wide space between longest pectoral fin ray and pelvic fin origin, pelvic fin ray and anal fin origin and anal fin ray and caudal fin base (Figure 1a).

Vertebral column is streamlined with normal uniform vertebral thickness and inter-vertebral spaces (Figure 1b).

fig 1A,B

Figure 1a: Photograph of a Normal Specimen of Tor tor (Ham.-Buch.).

Figure 1b: X-ray Photograph of a normal specimen of Tor tor (Ham.-Buch.).

Morphological and vertebral deformities observed in six specimens of Tor tor collected from the river Chenab in Pargwal wetland area are shown in Table 1.

Table 1: Morphological and vertebral characteristics of abnormal Tor tor (Ham.-Buch.) collected from the river Chenab in Pargwal wetland, Akhnoor, Jammu

S.No.

Size(Length cm/Wt. g) Morphological characteristics Fins placement

Vertebral deformities


1


23.5 cm/200 g


Highly truncated body, abnormal height more than head length and curved caudal peduncle;

(Figure 2a).


Dorsal fin placement is towards caudal fin base and its longest dorsal fin ray extends beyond anal fin base.


1st to 17th vertebrae irregularly compressed with reduced vertebral thickness and inter-vertebral spaces (Figure 2b).

2 29 cm/500 g Highly truncated globular body,

abnormal height more than head length and displacement of fins (Figure 3a).

Dorsal fin installation is towards caudal fin base and its longest fin ray is short. Longest pectoral fin ray extends pelvic fin base, longest pelvic fin ray extends anal fin base and latter the caudal fin base. 5th to 30nd vertebrae irregularly compressed and fused with variable vertebral thickness and intervertebral spaces. (Figure 3b).
3 21 cm/155 g Minor truncated body and displacement of fins (Figure 4a). Dorsal fin placement is towards caudal fin base and its longest fin ray extend anal fin base. Longest pectoral fin ray extends pelvic fin base, pelvic fin ray anal fin base and anal fin ray caudal fin base. 11th to 30th vertebrae, with variable vertebral thickness and inter-vertebral spaces, irregularly compressed. Compression is more marked between 11th to 16th vertebrae (Figure 4b).
4 25 cm/185 g Truncated body, displacement of fins, short caudal peduncle (Figure 5a). Dorsal fin placement is towards caudal fin base and its longest fin ray extends beyond anal fin base. Space between longest pectoral fin ray and pelvic fin base, pelvic fin ray and anal fin base and anal fin ray and caudal fin base is short. 10thto 29th vertebrae irregularly compressed with reduced vertebral thickness and inter- vertebral spaces (Figure 5b).
5 22 cm/165 g Dorsal dome (Figure 6a). All fins like normal fish. Vertebral column is dorsally curved in thoracic region (Figure 6b).
6 20 cm/150 g Highly truncated caudal peduncle and displacement of anal fin (Figure 7a). Dorsal fin placement is towards caudal fin base and longest anal fin ray extends caudal fin base. X-ray is not available.

fig 2a,b

Figure 2a: Photograph of Tor tor (Ham.-Buch) showing highly truncated body, abnormal height and curved caudal peduncle.

Figure 2b: X-ray Photograph of Tor tor (Ham.-Buch) showing highly truncated body, abnormal height and curved caudal peduncle.

fig 3a,b

Figure 3a: Photograph of Tor tor (Ham.-Buch) showing highly truncated globular body, abnormal height and displacement of fins.

Figure 3b: X-ray Photograph of Tor tor (Ham.-Buch) with highly truncated globular body, abnormal height and displacement of fins.

fig 4a,b

Figure 4a: Photograph of Tor tor (Ham.-Buch) showing minor truncated body and extension of the longest dorsal fin ray beyond the anal fin origin.

Figure 4b: X-ray Photograph of minor truncated Tor tor (Ham.-Buch) with extension of the longest dorsal fin ray beyond the anal fin origin.

fig 5a,b

Figure 5a: Photograph of Tor tor (Ham.-Buch) showing truncated body, displacement of fins, short caudal peduncle and overlapping scales.

Figure 5b: X-ray Photograph of Tor tor (Ham.-Buch) with truncated body, displacement of fins, short caudal peduncle and overlapping scales.

fig 6a,b

Figure 6a: Photograph of Tor tor (Ham.-Buch) showing a dorsal dome.

Figure 6b: X-ray Photograph of Tor tor (Ham.-Buch) with a dorsal dome.

fig 7a

Figure 7a: Photograph of Tor tor (Ham.-Buch) showing highly truncated caudal peduncle and extension of longest anal fin ray to the caudal fin base.

Tor putitora (Ham.-Buch.)

In a normal streamlined Tor putitora head length is greater than body depth. Dorsal fin insertion is midway between snout tip and caudal fin base. There is a wide space between longest dorsal fin ray and anal fin base, pectoral fin ray and pelvic fin base, pelvic fin ray and anal fin base and anal fin ray and caudal fin base (Figure 8a). Vertebral column is streamlined with normal vertebral thickness, inter-vertebral spaces, urostyle and caudal fin bones (Figure 8b).

fig 8a,b

Figure 8a: Photograph of a normal specimen of Tor putitora (Ham.-Buch).

Figure 8b: X-ray Photograph of a normal specimen of Tor putitora (Ham.-Buch).

Various morphological and vertebral deformities observed in five specimens of Tor putitora are given in the Table 2.

Table 2: Morphological and vertebral column characteristics of abnormal Tor putitora (Ham.-Buch.) collected from the river Chenab in Pragwal wetland, Akhnoor, Jammu.

S.No.

Size(Length cm/Wt. g) Morphological characteristics Fins placement

Vertebral deformities


1


25.4 cm/192 g


Truncated body, short caudal peduncle and displacement of dorsal and anal fin.

(Figure 9a).


Dorsal fin placement is towards the caudal fin base and its longest fin ray reaches anal aperture. Longest anal fin ray extends caudal fin base.


3rd – 9th and 17th – 23rd vertebrae are irregularly compressed and fused with variable vertebral thickness and inter vertebral spaces. 38th to 40th vertebrae highly compressed and fused (Figure 9b).

2 55 cm/200 g Mid truncated body, abnormal height and fins disposition.

(Figure 10a).

Dorsal fin insertion is towards caudal fin base. Space between longest pectoral fin ray and pelvic fin base, pelvic fin ray and anal fin base and anal fin ray and caudal fin base reduced. Vertebral column between 7th to 32nd vertebrae truncated and vertebrae irregularly compressed. 7th to 12th vertebrae are highly compressed and attenuated. Vertebral thickness and inter vertebral spaces reduced.

(Figure 10b and 10c).

3 17.8cm/150 g Mild truncated body and minor displacement of fins (Figure 11a). Dorsal fin placement is towards caudal fin base and its longest fin ray extends opposite to the tip of longest anal fin ray. 15th to 23th vertebrae compressed with irregular reduced vertebral thickness and inter vertebral spaces (Figure 11b).
4 18.2 cm/96 g Abnormal height more than head length, highly truncated caudal peduncle, fins displacement (Figure 12a). Dorsal fin is located towards caudal fin base and its longest fin ray extends middle of anal fin. Longest pelvic fin ray reaches anal aperture and longest anal fin ray extends caudal fin base. Vertebral column between 15th to 35th vertebrae truncated, vertebrae irregularly compressed with reduced vertebral thickness and inter-vertebral spaces (Figure 12b).
5 23 cm/150 g Highly truncated body, abnormal height more than head length, displacement of fins, short caudal peduncle (Figure 13a). Dorsal fin insertion is towards caudal fin base and its longest fin ray extends beyond anal fin origin. Longest pelvic fin ray reaches anal aperture and anal fin ray extends caudal fin base. First twenty nine vertebrae differently compressed and fused with variable vertebral thickness and inter-vertebral spaces (Figure 13b).

fig 9a,b

Figure 9a: Photograph of Tor putitora (Ham.-Buch) showing truncated body, short caudal peduncle and extension of the longest anal fin ray to the caudal fin base.

Figure 9b: X-ray Photograph of Tor putitora (Ham.-Buch) with truncated body, short caudal peduncle and extension of the longest anal fin ray to the caudal fin base.

fig 10a,b,c

Figure 10a: Photograph of Tor putitora (Ham.-Buch) showing mid truncated body, abnormal height and disposition of fins.

Figure 10b: X-ray Photograph of deformed specimens of Tor putitora (Ham.-Buch) with mid truncated body, abnormal height and disposition of fins.

Figure 10c: Enlarged x-ray photograph of vertebral column of deformed Tor putitora (Ham.-Buch)

fig 11a,b

Figure 11a: Photograph of Tor putitora (Ham.-Buch) showing mild truncated body and minor displacement of fins.

Figure 11b: X-ray Photograph of Tor putitora (Ham.-Buch) with mild truncated body and minor displacement of fins.

fig 12a,b

Figure 12a: Photograph of Tor putitora (Ham.-Buch) showing abnormal height, highly truncated caudal peduncle, displacement of fins and overlapping scales.

Figure 12b: X-ray Photograph of Tor putitora (Ham.-Buch) with abnormal height, highly truncated caudal peduncle, displacement of fins and overlapping scales.

fig 13a,b

Figure 13a: Photograph of Tor putitora (Ham.-Buch) showing highly truncated body displacement of fins, short caudal peduncle and overlapping scales.

Figure 13b: X-ray Photograph of Tor putitora (Ham.-Buch) with highly truncated body displacement of fins, short caudal peduncle and overlapping scales.

Discussion

Records of only eleven adult deformed fishes, over a period of three years, in the river Chenab suggest their low percentage. This may be due to good water quality, inability of such fishes to resist against fast current or they easily fall prey to predators. Presence of these adult deformed fishes suggests that these aberrations are non fatal, feeding is normal and they are able to avoid predators.

Morphological aberrations observed among Tor species netted from the river Chenab are truncated body, abnormal height and displacement of various fins. Vertebral column deformities commonly reported among fishes include ankylosis, lordosis, kyphosis, scoliosis, irregular shape showing coiling and vertebral fusion and compression. Vertebral deformities noticed during the present study include truncated vertebral column, vertebrae compression and fusion, reduction in inter-vertebral spaces and vertebral thickness. Truncated body and displacement of fins observed in abnormal specimens of Tor is due to vertebral compressions and fusion. Vertebral fusion is known to alter the shape and length of the fish depending on the severity and number of structures affected [12].

Fish anomalies have been attributed to abiotic factors like temperature, light, low pH, salinity and low dissolved oxygen [13-23].

Water analysis in the river Chenab has revealed optimum range of water temperature (8-16°C), pH (8.23-8.46), conductivity (140.05-308.47 µs/cm-1), total dissolved solids (63.90-140.88 mg/l), salinity (0.2 ppt), DO (6.24-13.08 mg/l), BOD (1.07-5.56 mg/l), free CO2 (nil), carbonate (1.16-3.97 mg/l), bicarbonate (54.27-116.25 mg/l), chloride (2.33-9.28 mg/l), calcium (14.79-32.49 mg/l), magnesium (3.87-10.13 mg/l), total hardness (58.32-119.56 mg/l), sodium (1.11-1.69 mg/l), potassium (1.23-2.54 mg/l), phosphate (0.040-0.075 mg/l), nitrate (0.145-0.323 mg/l), silicate (4.08-9.33 mg/l) and sulphate (11.35-19.30 mg/l). Moreover, heavy metal analysis of lead, copper, nickel, zinc and iron is below detectable limits of instrument. This clearly suggests that abnormalities in Tor species, under discussion, are not due to fluctuations in abiotic characteristics of water. These optimum levels of water quality also suggest absence of any type of water pollution in the river Chenab. Therefore, fish aberrations caused by water quality degradation resulting from pollutants and suggested by earlier workers [24-27] are ruled out in the present case.

Among biological factors, fish aberrations have been attributed to parasitic infestations [3,27-32]. Absence of any parasite and sign of disease among the presently collected deformed specimens of Tor species from the river Chenab suggests that these aberrations are not due to this biological factor.

Aberrations in Tor tor and Tor putitora netted from the river Chenab are most probably induced by fast currents faced by larvae and young fishes in various tributaries (fish breeding grounds) of the river Chenab. Young fishes migrating from the Himalayan streams (breeding grounds) into the river Chenab are also exposed to torrential waters inducing various aberrations. Fish anomalies due to currents are well documented [2,5,33-36].

A detailed study on fish larvae and young fishes in their breeding grounds in various Himalayan streams and young fishes in the river Chenab is suggested to understand the role of currents in inducing various fish aberrations in torrential lotic waters.

Acknowledgements

This paper is a part of the project supported by the UGC, New Delhi and is gratefully acknowledged. HOD, Environmental sciences, University of Jammu, Jammu, is acknowledged for providing necessary facilities in the department.

References

  1. Dutta SPS (1989-90) Vertebral-spinal deformity in Barilius vargra (Ham.-Buch.) from Jammu. Matsya 15-16: 166-168.
  2. Dutta SPS (2016) Record of an abnormal Schizothoraichthys esocinus (Heckel) from the Himalayan River Chenab draining Jammu region of the J&K State, India. Journal of Aquaculture Research & Development 7: 1-3.
  3. Dutta SPS (2016) Some deformed specimens of Mystus bleekeri (Day) and Labeo bata (Ham.-Buch.) from the river Chenab in Pargwal wetland, Akhnoor, Jammu. Journal of Applied and Natural Science, 8: 481-484.
  4. Dutta SPS, Kour H (1994) Pelvic fin deformity in Schizothorax richardsonii (Gray and Hard) inhabiting Rajouri river, (J&K). J Freshwater Biol 6: 195-196.
  5. Dutta SPS, Sheikh A (2017) Skeletal deformities in Bagarius bagarius (Ham.-Buch.) and Crossocheilus latius diplocheilus (Ham.-Buch.) from river Tawi, a Himalayan stream, in Udhampur area, Jammu region, J&K, India. International Journal of Fisheries and Aquatic Studies 5: 247-251.
  6. Dutta SPS, Sharma J, Koul V (1993) A truncated specimen of Garra lamta (Ham.). J Nature Conservators 5: 115-116.
  7. Dutta SPS, Kour H, Sharma J (1996) On the occurrence of malformed specimen of Labeo bata (Ham.-Buch.) in river Tawi, Jammu. J Nature Conservators 8: 147-149.
  8. Gupta SC, Dutta SPS, Verma M (1998) A report on abnormal specimen of Puntius sarana (Ham.-Buch.) from river Basantar, Samba, Jammu (J&K). J Freshwater Biol 10: 137-140.
  9. Kour H, Kaul V, Dutta SPS (1997) Deformities in some freshwater fishes of Jammu. J Freshwater Biol 8: 213-216.
  10. Shekhar C, Dutta SPS (1993) An abnormal specimen of Shizothorax richadsonii (Gary and Hard) with vertebral deformities. Him J Env Zool 7: 101-102.
  11. APHA (1998) Standard methods for the examination of water and waste water.20th American Public Health Association, New York.
  12. Gavia PJ, Dinis MT, Cancela ML (2002) Osteological development and abnormalities of the vertebral column and caudal skeleton in larval and juvenile stages of hatchery reared Senegal sole (Solea senegalensis) Aquaculture 211: 305-323.
  13. Alderdice DF, Wickett WP, Brett JR (1958) Some effects of temporary exposure to low dissolved oxygen levels in Pacific salmon eggs. J Fish Res Bd Canada 15: 229-249.
  14. Al–Hassan LAJ (1982) Vertebral deformities in fishes from Iraq and United Arab Emirates, Arabian Gulf. Iraqi Jour Mar Sci 1: 13-23.
  15. Beamish RJ (1972) Lethal pH for the white sucker (Catostomus commersonii) (Scapede).Trans. American Fish Society 101: 355-358.
  16. Bolla S, HolmefJord I (1988) Effect of temperature and light on development of Atlantic halibut (Hippoglossus hippoglossus) larvae Aquaculture 74: 355-358.
  17. Hubbs C (1959) High incidence of vertebral deformity in two natural populations of fishes inhabiting warm springs. Ecology 40: 154-155.
  18. Jawad LA, Oktener A (2007) Incidence of lordosis in the freshwater mullet, Liza abu (Heckel, 1843) collected from Ataturk Dam Lake, Turkey Anales de Biologia 29: 105-113.
  19. Lee CS, Williams WD (1970) Abnormality in fishes due to salinity fluctuations. J Fish Biol 2: 55.
  20. Lee CS, Menu B (1981) Effects of salinity on egg development and hatching in grey mullet, Mugil cephalus J Fish Biol 19: 179-188.
  21. Steingraeber MT, Gingerich WH (1991) Hatching, growth, ion accumulation and ossification of brook trout (Salvelinus alpinus) alevins in acidic soft waters. Can J Zool 69: 2266-2276.
  22. Wang LH, Tsai CL (2000) Effects of temperature on the deformity and sex differentiation of Tilapia, Oreochromis mossambicus. J Expt Zool 286: 534-537.
  23. Antunes M & Lopes Da-Cunha P (2002) Skeltal anomalies in Gobius niger (Gobiidae) from Saddo estuary, Portugal. Cybium 26: 179-184.
  24. Dulcic J (2004) Incidence of spinal deformities in natural populations of grass-goby, Zosterisessor ophiocephalus, from the Karin Sea, Eastern middle Adriatic. Cybium 28: 7-11.
  25. Subba BR (2004) Anomalies in bighead carp Aristichthys nobilis and African catfish Clarias gariepinus in Birat nagar, Nepal. Our Nature 2: 41-44.
  26. Sloof W (1982) Skeletal anomalies in fish from polluted surface waters. Aquat Toxicol 5: 157-173.
  27. Sun PL, Hawkins WE Overstreet, RM, Brown-Peterson NJ (2009) Morphological deformities as biomarkers in fish from contaminated rivers in Taiwan. J. Environ. Res. Public Hlth 6: 2307-2331.
  28. Kent ML, Watral VG, Whipps CM, Cunningham ME, Criscione CD et al., (2004) A digenean metacercaria (Apophallus sp.) and a Myxozoan (Myxobolus sp.) associated with vertebral deformities in cyprinid fishes from the Willamette River, Oregon. Journal of Aquatic Animal Health 16: 116-129.
  29. Schwartz FJ (1973) Spinal and cranail deformities in the elasmobranchs Carcharhinus leucas, Squalus acanthias and Carcharhinus milberti. J. Elisha Mitchell Sci. Soc 89: 74-77.
  30. Taylor LH, Hall BK, Miyake T, Cone DK (1994) Ectopic ossicles associated with metacercariae of Apophalluus brevis (Trematoda) in yellow perch, Perca flavescens (Teleostei) development and identification of bone and chondroid bone. Embryol (Berl.) 190: 29-46.
  31. Villeneuve DL, Curtis LR, Jenkins JJ, Warner KE, Tilton et al., (2005) Environmental stresses and skeletal deformities in fish from the Willamette River, Oregen. Environmental Scienece and Technology 39: 3495-3506.
  32. Yokoyama H, Freeman MA, Itoh N, Fukuda Y (2005) Spinal curvature of cultured Japanese mackerel, Scomber japanicus associated with brain myxosporean, Myxobolus acanthogobii. Dis. Aquat. Org 66: 1-7.
  33. Backiel T, Kokurewicz B, Ogorzalek A (1984) High incidence of skeletal anomalies in carp, Cyprinus carpio, reared in cages in flowing water. Aquaculture 43: 369-380.
  34. Chatain B (1994) Abnormal swimbladder development and lordosis in sea bass (Dicentrarchus labrax) and sea bream (Sparus auratus). Aquaculture 119: 371-379.
  35. Divanach P, Papandroulakis N, Anastasiadis P, Koumoundouros G, Kentouri M (1997) Effect of water currents on the development of skeletal deformities in sea bass (Dicentrarchus labrax L.) with functional swimbladder during postlarval and nursery phase. Aquaculture 156: 145-155.
  36. KitaJima C, Watanabe T, Tsukashima Y, Fujita S (1994) Lordotic deformition and abnormal development of swim bladders in some hatchery-bred marine physoclistous fish in Japan. World Aquaculture Soc 25: 64-77.

Fish Fauna of the River Ravi and Its Some Tributaries with a New Record of Ailia puncata and Clupisoma naziri for Punjab State and Union Territory of Jammu and Kashmir, India

DOI: 10.31038/AFS.2021312

Abstract

Fish fauna of the river Ravi and its some tributaries in Chamba district (H.P.) and from Shahpur (H.P.) to Gogga Mahal, Amritsar (Punjab) reported earlier and present survey from Ranjit Sagar dam to Kathour, Pathankot, Punjab, including Kathua district, has revealed the presence of 97 fish species belonging to 8 orders, 18 families and 53 genera. Among various orders, there is dominance of Cypriniformes (54 spp.) followed by Siluriformes (26 species), Percformes (9 species), Synbranchiformes (3 species), Osteoglossiformes (2 species) and Clupeiformes, Salmoniformes and Beloniformes (1 species, each). The list also includes a new record of Ailia punctata and Clupisoma naziri (reported earlier from Pakistan) for Punjab state and Union territory of Jammu and Kashmir. Salmo trutta fario noticed in Sewa River is also included in the present list. Like other Indian states, fish fauna is rapidly declining due to overfishing, fishing during monsoon breeding and illegal fishing methods (Dynamiting, electric shocking, poisoning etc.). Conservation status based on IUCN observations has also been discussed.

Keywords

Fish fauna, The River Ravi, New record of Ailia punctata and Clupisoma naziri

Introduction

Our knowledge of fish fauna of the river Ravi is by [1] from Chamba area of Himachal Pradesh; Kumar and Dua [2] from Punjab, [3] from Shahpur (H.P.) to Gogga Mahal, Amritsar, Punjab and [4] from Madhopur to Kathour (Pathankot). Earlier [5-12] surveyed fish fauna of some tributaries of the river Ravi in Kathua and Samba districts of Jammu. During the survey of river Ravi for the last ten years from Ranjit Sagar Dam to Kathour, Pathankot, some new records of fish have been observed and enlisted along with the earlier reports [1-4]. This work shall be helpful for the fishery biologists and fishery departments of Jammu, Punjab and Himachal Pradesh to undertake various fishery developmental programmes for the perennial river Ravi and its various tributaries.

Topography of the Area and Methods

The perennial Ravi River originates in the Himalayas in the Multhan tehsil of Kangra district, H.P., India. It is the smallest of the five Punjab Rivers that rises from glacier fields at an elevation of 14000 feet on the southern side of the Mid Himalayas. It flows through Bara Bhanghal, Bara Bansu and Chamba districts, H.P. It is joined by the Budhil River that rises in Lahul range of hills and is sourced from Manimahesh Kailash Peak and Manimahas Lake, at an elevation of 4080 meters above sea level. The second important tributary is the Nai or Dhona that rises at Kali Debi pass and flows 48 km before joining the river Ravi. Another major tributary that joins the Ravi River just below Bharmour, the old capital of Chamba, is the Seoul River. One more major tributary that joins the river Ravi near Bassohli, Kathua is Sewa River. The main river Ravi flows through the base of Dalhousie hill. Downstream it enters the Punjab plain near Madhopur and Pathankot. On its right bank, is the town of Lakhanpur and Kathua of Jammu Region. In Kathua district, the river Ravi is joined by Kathua Khad, Wajoo nullah, Tarna nullah, Jhandi nullah etc. Ujh River is another major tributary of the river Ravi in Kathua district. Its source is in the Kailash Mountains at an elevation of 14100 feet, close to the Bhaderwah Mountains in Doda district. It joins the river Ravi at Nainkot in Pakistan. Below Pathankot the river Ravi flows along the Indo Pak border for 80 kms before entering Pakistan and joining the river Chenab. Basantar River, draining Samba district of Jammu region, joins the river Ravi in Pakistan.

Fishes collected by fishermen by using various methods were purchased, studied for colour patterns, photographed and fixed in 10% formaldehyde. For identification works of [13-21] have been consulted. For the systematic arrangement of the reported fish species, classification referred by [21] has been followed.

Observations and Discussion

Fish fauna of the river Ravi including earlier reports [1-4] is represented by 97 fish species belonging to 8 orders, 18 families and 52 genera (Table 1). Ailia punctata reported earlier [22] from Pakistan segment of the river Ravi and Clupisoma naziri distributed in the rivers of Pakistan are the new records for Punjab and Jammu and Kashmir. Fish analysis in the Indian segment of the river Ravi has shown the dominance of Cypriniformes (54 spp.) followed by Siluriformes (26 species), Percformes (9 species), Synbranchiformes (3 species), Osteoglossiformes (2 species) and Clupeiformes, Salmoniformes and Beloniformes (1 species, each). In the river Ravi from the Ranjit Sagar dam to Kathour (Pathankot), including Kathua area, is more diversified (Table 1) in comparison to 16 fish species viz. Barilius bendelisis, B. vagra, Puntius conchonius, Labeo dero, Cyprinus carpio specularis, C. communis, Garra gotyla, Schizothorax richardsonii, Crossocheilus latius punjabensis, Noemacheilus corica, N. montanus, Lepidocephalus guntea, Glyptosternum reticulatum, Glytothorax conirostres, G. pectinopterus and G. stoliczkae belonging to 2 orders, 3 families and 11 genera reported by [1] from Chamba area, H.P., drained by the river Ravi.

Table 1: Fish fauna of the river Ravi including the earlier reports by Sehgal (1974), Kumar and Dua (2012) and Moza (2014).

Conservation Status

IUCN (2020)

Superclass: Gnathostomata
Class: Actinopterygii
Subclass: Neopterygii
Division: Teleostei
Subdivision: Osteoglossomorpha
Order: Osteoglossiformes
Suborder: Notopteroidei
Family: Notopteridae
Genus: Notopterus lacepede
1. N. notopterus (Pallas)

LC

Genus: Chitala Fowler

NT

2. C. chitala (Ham.-Buch.)
Sub division: Clupeomorpha
Order: Clupeiformes
Family: Clupeidae
Subfamily: Aliosinae
Genus: Gudusia Fowler
3. G. chapra (Ham.-Buch.)

LC

Subdivision: Euteleosostei
Superorder: Ostariophysi
Order: Cypriniformes
Family: Cyprinidae
Subfamily: Danioninae (= Rasborinae)
Genus: Salmophasia Swainson
4. S. bacaiIa (Ham.-Buch.)

LC

5. S. phulo (Ham.-Buch.)

LC

6. S. punjabensis (Day)

NE

Genus Securicula Gunther
7. S. gora (Ham.-Buch.)

LC

Genus: Asidoparia Heckel
8. A morar (Ham.-Buch.)

LC

Genus: Barilius Ham.-Buch.
9. B. vagra vagra (Ham.-Buch.)

LC

10. B. barila (Ham.-Buch.)

LC

11. B. modestus Day

NE

12. B. radiolatus Gunther

DD

13. B. bendelisis (Ham.-Buch.)

LC

Genus: Raiamas Jordan
14. R. bola (Ham.-Buch.)

LC

Genus: Chela (Ham.-Buch.)
15. Chela cachius (Ham.-Buch.)

LC

16. Chela laubuca (Ham.-Buch.)

LC

Genus: Esomus Swainson
17. Esomus danricus (Ham.-Buch.)

LC

Genus: Danio (Ham. Buch.)
18. D. devario (Ham.-Buch.)

LC

Genus: Rasbora Bleeker
19. R. daniconius (Ham.-Buch.)

LC

Genus: Amblypharyngodon Bleeker
20. A. mola (Ham.-Buch.)

LC

Subfamily: Cyprininae
Genus: Cyprinus Linnaeus
21. C. carpio communis Linn.

NE

22. C. carpio specularis Lacepede

NE

Genus: Tor Gray
23. T. tor (Ham.-Buch.)

DD

24. T. putitora (Ham.-Buch.)

ENDN

Genus: Osteobrama Heckel
25. O. cotio cotio (Ham.-Buch.)

LC

Genus: Puntius Ham.-Buch.
26. P. sarana sarana (Ham.-Buch.)

LC

27. P. conchonius (Ham.-Buch.)

LC

28. P. terio (Ham.-Buch.)

LC

29. P. ticto (Ham.-Buch.)

LC

30. P. chola (Ham.-Buch.)

LC

31. P. sophore (Ham.-Buch.)

LC

Genus: Cirrhinus Cuvier
32. C. mirgala (Ham.-Buch.)

LC

33. C. reba (Ham.-Buch.)

LC

Genus: Catla Valenciennes
34. C. catla (Ham.-Buch.)

LC

Genus: Labeo Cuvier
35. L. bata (Ham.-Buch.)

LC

36. L. boga (Ham.-Buch.)

LC

37. L. calbasu (Ham.-Buch.)

LC

38. L. dero (Ham.-Buch.)

LC

39. L. dyocheilus (McClelland )

LC

40. L. gonius (Ham.-Buch.)

LC

41. L. pangusia (Ham.-Buch.)

NT

42. L. rohita (Ham.-Buch.)

LC

43. L. lippus*** Fowler

DD

Subfamily: Oreininae (=Schizothoracinae)
Genus: Schizothorax Heckel
44. S. richardsonii (Gray)

VULN

Sub-family: Garrinae
Genus: Crossocheilus Kuhl and van Hasselt
45. C. latius diplocheilus (Heckel)

NE

46. C. latius punjabensis*

NE

Genus: Garra Hamilton – Buchanan
47. G. gotyla gotyla (Gray)

LC

48. G. lamta (Ham.-Buch.)

LC

Family: Balitoridae
Subfamily: Nemacheilinae
Genus: Nemacheilus Bleeker
49. N. corica (Ham.-Buch.)*

LC

Genus: Acanthocobitis Peters
50. A. botia (Ham.-Buch.)

LC

Genus: Schistura McClelland
51. S. prashadi (Hora)

VULN

52. S. montanus (Mc Clelland.)*

NE

53. S. punjabensis (Hora)

NE

Family: Cobitidiae
Subfamily: Botinae
Genus: Botia Gray
54. Botia almorhae Gray

LC

55. Botia birdi Chaudhuri

NE

56. Botia lohachata Chaudhuri

NE

Subfamily: Cobitinae
Genus: Lepidocephalus Bleeker
57. L. guntea (Ham.-Buch.)

LC

Order: Siluriformes
Family: Bagridae
Subfamily: Ritinae
Genus: Rita Bleeker
58. R. rita (Ham. Buch.)

LC

Subfamily: Bagrinae: Genus: Mystus Scopoli
59. M. bleekeri (Day)

LC

60. M. cavasius (Ham.-Buch.)

LC

61. M. vittatus (Bloch.)

LC

62. M. tengara (Ham.-Buch.)

LC

Genus: Aorichthys Wu
63. A. seenghala (Sykes)

LC

64. A. aor (Ham.-Buch.)**

LC

Family: Siluridae
Genus: Ompok Lacepede
65. O. pabda (Ham.-Buch.)

NT

Genus: Wallago Bleeker
66. W. attu (Bloch. & Schn.)

VULN

Family: Schilbidae
Subfamily: Ailinae
Genus: Ailia Gray
67. A punctata (Day)

DD

Sub family: Schilbinae
Genus: Neotropius Kulkarni
68. N. atherinoides (Bloch.)

LC

Genus: Clupisoma Swainson
69. C. garua (Ham.-Buch.)

LC

70. C. nazri Mirza and Awan

NE

Genus: Eutropiichthys Bleeker
71. E. murius (Ham.-Buch.)

LC

72. E. vacha (Ham.-Buch.)

LC

Family: Amblycipitidae
Genus: Amblyceps Blyth
73. A mangois (Ham.-Buch.)

LC

Family: Sisoridae
Genus: Bagarius Bleeker
74. B. bagarius (Ham.-Buch.)

NT

Genus: Gagata Bleeker
75. G. cenia (Ham.-Buch.)

LC

Genus: Glyptosternum McClelland
76. G. reticulatum McClelland*

NE

Genus: Glyptothorax Blyth
77. G. cavia (Ham.-Buch.)

LC

78. G. conirostre conirostre( Steindachner)*

DD

79. G. pectinopterus (McClelland)*

LC

80. G. stoliczkae (Steindachner)

LC

81. G. telchitta (Ham.-Buch.)

LC

Family: Clariidae
Sub-Family: Heteropneustinae
Genus: Heteropneustes Muller
82. H. fossilis (Bloch.)

LC

Sub-Family: Clariinae
Genus: Clarius Scopoli
83. C. batrachus (Linneaus)

LC

Superorder: Protacanthopterygii
Order: Salmoniformes
Family: Salmonidae
Genus: Salmo Linnaeus
84. S. trutta fario Linn.

NE

Superorder: Acanthopterygii
Order: Beloniformes
Suborder: Belonoidei (=Exocoetoidei)
Family: Belonidae Genus: Xenentodon Regan
85. X. cancila (Ham.-Buch.)

LC

Order: Synbranchiformes
Suborder: Mastacembeloidei
Family: Mastacembelidae
Subfamily: Mastacembelinae
Genus: Macroganthus Lacepede
86. M. aral (Bloch and Schn.)

LC

87. M. pancalus (Ham.-Buch.)

LC

Genus: Mastacembelus Scopoli
88. M. armatus (Lac.)

LC

Order: Perciformes
Suborder: Percoidei
Family: Chandidae (Ambassidae)
Genus: Chanda (Ham.-Buch.)
89. C. nama Ham.-Buch.

LC

Genus: Parambassis Bleeker
90. P. baculis (Ham.-Buch)

LC

91. P. ranga (Ham.-Buch.)

LC

Family: Nandidae
Subfamily: Nandinae
Genus: Nandus Valenciennes
92. N. nandus (Ham.-Buch.)

LC

Sub order: Gobioidei
Family: Gobiidae
Genus: Glossogobius Gill
93. G. giuris (Ham.-Buch.)

LC

Suborder: Channoidei
Family: Channidae
Genus: Channa Scopoli
94. C. marulius (Ham.-Buch.)

LC

95. C. orientalis Bloch&Schneider

LC

96. C. punctatus (Bloch.)

LC

97. C. striatus (Bloch.)

LC

*Reported by Sehgal (1974) and not seen during present study
**Reported by Moza (2014) and not seen during present study
***Reported by Kumar and Dua (2012) and not seen during present study
LC = Least Concern
ENDN = Endangered
NT = Near Threatened
DD = Data Deficient
NE = Not Evaluated
VULN = Vulnerable

[2] enlisted 38 fish species viz. Notopterus notopterus, Catla catla, Cirrhinus mrigala, Cirrhinus reba, Cyprinus carpio communis, Labeo bata, L. calbasu, L. dero, L. lippus, L. rohita, Osteobrama cotio cotio, Puntius sarana sarana, P. terio, Salmostoma bacaila, Parluciosoma daniconius, Schizothorax richardsonii, Tor tor, Lepidocephalus guntea, Aorichthys aor, A. seenghala, Mystus bleekeri, M. cavasius, M. vittatus, Rita rita, Wallago attu, Clupisoma garua, Eutropiichthys murius, E. vacha, Bagarius bagarius, Clarias batrachus, Xenentodon cancila, Colisa fasciatus, Channa marulius, C. punctatus, C. striatus, Macrognathus aral, M. pancalus and Mastacembelus armatus belonging to 5 orders, 12 families and 25 genera from the Indian segment of the river Ravi in Punjab.

Present record of fish diversity in the river Ravi is higher than the earlier reports of 31 fish species viz. Notopterus notopterus, N. chitala, Chela bacaila, Tor putitora, Puntius sarana, Catla catla, Cirrhinus mrigala, C. reba, Labeo dyocheilus, L. gonius, L. rohita, L. calbasu, L. dero, L. bata, Cyprinus carpio specularis, Schizothorax richardsonii, Mystus aor, M. seenghala, M. tengara, Rita rita, Bagarius bagarius, Wallago attu, Eutropiichthys vacha, Clupisoma garua, Heteropneustes fossilis, Clarias batrachus, Xenentodon cancila, Mastacembelus armatus, M. pancalus, Channa marulius and Channa punctaus belonging to 5 orders, 9 families and 20 genera enlisted by Moza [3] in the river Ravi from Shahpur (H.P) to Goga Mahal, Amritsar, Punjab.

Fish diversity in the Indian segment of river Ravi is even higher in comparison to the earlier reports of 75 fish species (Notopterus notopterus, N. chitala, Gudusia chapra, Aspidoparia morar, Amblypharyngodon mola, Barilius bendelisis, B. modestus, B. vagra, Cirrhinus mrigala, C. reba, Cyprinus carpio, Carasius auratus, Crossocheilus diplocheilus, Chela cachius, Chela labuca, Esomus danricus, Gibleon catla, Garra gotyla, L. dyocheilus pakistanicus, Labeo rohita, L. gonius, L. calbasu, L. dero, Osteobrama cotio, Puntius punjabensis, P. sophore, P. ticto, P. chola, P. conchonius, Rasbora daniconius, Salmophasia punjabensis, S. bacaila, Securicula gora, Systomus sarana, Tor macrolepis, Nemacheilus sp., Botia lohachita, Ailia punctatus, Ailia coilia, Clupisoma garua, Eutropiichthys vacha, Gagata cenia, Heteropneustes fossilis, Mystus bleekeri, M. cavasius, M. vitatus, M. tengra, Ompok bimaculatus, Pseudoeutropis atherinoides, Wallago attu, Rita rita, Sisor pakistanicus, Sperata sarwari (Mystus seenghala and M. aor), Glyptothorax stocki, G. punjabensis, Xenetodon cancila, Macrognathus aculeatus, Macrognathus pancalus, Mastacembelus armatus, Monopterus cuchia, Colissa fasciata, Colissa latia, Chanda nama, Parambassius baculis, P. ranga, Glossogobius giuris, Nandus nandus, Oreochromis aureus, O. mosambicus, O. niloticus, Channa marulius, C. punctatus, Channa striatus, C. gachua and Sicamugal cascasia) enlisted from Pakistan segment of the river Ravi by Ahmad* (1943, 49 fish species), Mirza* (1970, 65 fish species), Zahoor and Mirza* (2002, 49 fish species) and [22] (2018, 38 fish species). Recent study of the river Ravi in Pakistan segment by [22] has revealed the presence of 38 fish species (Aspidoparia morar, Barilius bendelisis, B. modestus, B. vagra, Cirrhinus mrigala, C. reba, Cyprinus carpio, Carasius auratus, Gibleon catla, Labeo rohita, L. gonius, L. calbasu, L. dyocheilus pakistanicus, Puntius punjabensis, P. sophore, P. ticto, Salmophasia punjabensis, Securicula gora, Clupisoma garua, Eutropiichthys vacha, Heteropneustes fossilis, Wallago attu, Sperata sarwari, Chanda nama, Colissa fasciata, Colissa latia Channa marulius, C. punctatus, Channa striatus, C. gachua, Oreochromis aureaus, O. mosambicus, O. niloticus, Parambassius baculis, P. ranga Mastacembelus armatus, Notopterus chitala and N. notopterus) belonging to 22 genera, 10 families and 8 orders. This fish decline during last few decades has been attributed to degrading water quality caused by increased anthropogenic activities and many fold decline in water flow in the rivers after Indus water Basin treaty with India.

*Cited from [22].

Rich diversity in the river Ravi downstream Ranjit Sagar Dam to Kathour is due to reduced water flow, shallowness and penetration of light upto the bottom, presence of pools supporting a rich diversity and density of fish food organisms viz. macrophytes, algae, benthos, zooplankton, fish, etc. and absence of any pollution. Moreover, there is an upstream fish migration, even from Pakistan, during summer and monsoon. During monsoon, there is downstream fish drift from upper catchment along with floods. It is during summer and monsoon when a rich diversity and density of fish in the river Ravi has been noticed. Moreover, a large number of tributaries join the river Ravi at various places and add to rich fish diversity.

Study of fish fauna of various tributaries of the river Ravi in Kathua district started with a survey by [5] who enlisted 12 fish species belonging to 4 orders, 6 families and 11 genera from Kathua Khad and 3 fish species viz. Barilus vagra, Tor putitora and Channa punctatus from Ujh River. [8] noticed 27 fish species belonging to 4 orders, 8 families and 20 genera from Ujh River; 16 fish species belonging to 2 orders, 4 families and 12 genera from Tarnah nullah and total absence of fish from seasonal Kathua Khad, Rathore and [11] noticed 42 fish species belonging to 5 orders, 10 families and 27 genera from river Ujh. [12] reported 64 fish species belonging to 7 orders, 17 families and 42 genera from Wajoo nullah and its tributaries. Dutta and Gupta (unpublished) noticed 8 fish species viz. Schizothorax richardsonii, Barilius vagra vagra, B. bendelisis, Crossocheilus latius diplocheilus, Tor putitora, Cirrhinus reba, Salmo trutta fario and Glyptothorax stoliczkae from Sewa river, an important tributary of the river Ravi in Bassohli, Kathua.

[7] surveyed fish fauna of river Basantar, an important tributary of the river Ravi, in Samba district of Jammu, and enlisted 59 fish species belonging to 6 orders, 15 families and 41 genera. Sharma and Dutta≠π documented 35 fish species belonging to 5 orders, 10 families and 25 genera, with maximum diversity and density during monsoon floods, in river Basantar.

The [23] redlist showed that, among 97 fish species in the river Ravi, only Tor putitora is endangered, Chitala chitala, Labeo pangusia, Ompok pabda and Bagarius bagarius are near threatened; Schizothorax richardsonii, Schistura prashadi and Wallago attu are vulnerable; Tor tor, Barilius radiolatus, Labeo lippus, Ailia punctata and Glyptothorax conirostrae conirostrae are data deficient; Barilius modestus, Schistura punjabensis, Schistura mountanous, Salmophasia punjabensis, Crossocheilus latius punjabensis, Crossocheilus latius diplocheilus, Cyprinus carpio communis, Cyprinus carpio specularis, Botia birdi, Botia lohachata, Salmo trutta fario, Clupisoma naziri and Glyptosternum reticulatum are not evaluated and remaining fishes are in the least concern category.

An overall study has revealed a decline in fish diversity and density in the river Ravi and its tributaries. This needs immediate attention by the fishery departments of Himachal Pradesh and Punjab states and Jammu & Kashmir union territory. Illegal destructive methods of fishing like dynamiting, poisoning and diversion of water for catching fish should be checked. Total ban on fishing during summer and monsoon spawning migration should be implemented. In the tributaries, Juveniles need protection when the water level goes low in summer months. To protect them from poaching certain artificial pools need to be created. Some areas along the river Ravi and its tributaries should be declared as protected and reserved waters. Cultural possibilities of native and other fish species need exploration in different segments of the river Ravi and its tributaries.

Acknowledgements

This paper is a part of the Emeritus Fellowship Project sanctioned by UGC, New Delhi, and is gratefully acknowledged. Thanks are due to HOD, Environmental Sciences, University of Jammu, Jammu, for providing necessary laboratory facilities in the department.

References

  1. Sehgal KL (1974) Fisheries survey of Himachal Pradesh and some adjacent areas with special reference to trout, mahseer and allied species. J Bombay Nat Hist Soc 70: 458-474.
  2. Kumar A, Dua A (2012) Fish diversity of River Ravi in Indian region. Eco Env and Cons 18: 861-864.
  3. Moza U (2014) River Ravi: Ecology and Fishery. Directorate of knowledge management in agriculture. Indian Council of Agricultural Research, New Delhi 110012: 101.
  4. Dutta SPS (2015) Fish fauna of the river Ravi with a new record of (Day) for Jammu and Kashmir and Punjab states and Gudusia Chapra (Ham.-Buch.) for Jammu and Kashmir state. 26 All India Congress of Zoology and International Seminar on Innovation in Animal Science for Food security, Health security and Livelihood. Organised by Baba Saheb Bhimrao Ambedkar Central University, Lucknow. 29th-31st October, 2015.
  5. Joshi CS, Sehgal KL, Sunder S (1978) Observations on the fishery resources of hill streams of Jammu province with special reference to mahseer and other commercially important species. Indian J Fish 25: 197-206.
  6. Guglani HK (2000) Survey and systematic analysis of fish fauna of Jammu region. PhD. Thesis. University of Jammu, Jammu.
  7. Dutta SPS, Kour H, Bali JPS, Sharma LD (2001) Hydrobiological studies on river Basantar, Samba, Jammu, jammu and Kashmir. Aquatic Biol 16: 41-44.
  8. Dutta SPS, Gupta SC, Rathore V, Sharma A (2006) Fish fauna of some tributaries of the river Ravi; District Kathua, J&K state, In: Trends in Biodiversity and Aquaculture. Edited by Wanganeo, A. and Langer, R.K. Daya Publishing House, New Delhi: 443-452.
  9. Dutta SPS, Kour H (2005) Fish fauna of Kathua District, Jammu region. In Proceedings National Seminar: New trends in Fishery Development in India, Punjab University, Chandigarh Feb 16-18: 233-240.
  10. Sharma A, Dutta SPS (2012) Present and past status of fish fauna of river Basantar, an important tributary of the river Ravi in Samba district, Jammu (J&K). J Applied and Natural Resources 4: 123-126.
  11. Rathore V, Dutta SPS (2015) Fish fauna of river Ujh, an important tributary of the river Ravi, District Kathua, Jammu. Environment Conservation J 16: 81-86.
  12. Dutta SPS (2016) Fish fauna of Wajoo nullah, an important tributary of river Ravi in Kathua district, Jammu region, Jammu and Kashmir state, India. JANS 8: 1087-1089.
  13. Hamilton BF (1822) An account of the fishes found in the river Ganga and its tributaries. Edinburg and London.
  14. Misra KS (1962) An aid to the identification of the common commercial fishes of India and Pakistan. Rec Indian Mus 57: 1-320.
  15. Malhotra YR, Jyoti MK (1971) An identification of fishes found in Jammu. J Assam Sci Soc 14: 184-192.
  16. Dutta SPS, Malhotra YR (1984) An upto date checklist and a key to the identification of fishes of Jammu. Jammu University Review (Sciences) J 2: 65-92.
  17. Johal MS, Tandon KK (1979) Monograph on the fishes of re-organised Punjab. Pb Fish Bull 3: 1-44.
  18. Johal MS, Tandon KK (1980) Monograph on the fishes of re-organised Punjab. Pb Fish Bull 4: 39-51.
  19. Talwar PK, Jhingram AG (1991) Inland fishes of India and adjacent countries, Oxford and IBH publishing Co. Pvt. Ltd., New Delhi, Vols. I and II.
  20. Day F (1994) The fishes of India, being a natural history of the fishes known to inhabit seas and freshwaters of India, Burma and Ceylon, Fourth India Reprint Vol I and II, Jagmandir Book Agency, New Delhi.
  21. Jayaram KC (2013) The freshwater fishes of the Indian region, Narendra Publishing House, Delhi.
  22. Pervaiz K, Mirza ZS, Siddiqui S, Waheed KN, Hayat S, et al. (2018) Studies on the fish biodiversity of river Ravi in Punjab, Pakistan. J Entomology and Zoology Studies 6: 1442-1448.
  23. IUCN (2020) The IUCN Redlist of threatened species. Version 2020-2. www.iucnredlist.org.

A Comment on Nuclear Safety and Radiation Protection from a Historian of Science

DOI: 10.31038/CST.2021614


In 1985 Hans Blix, the then IAEA Director General, called for the creation of an advisory committee in the area of nuclear safety. As a result, IAEA’s International Nuclear Safety Advisory Group (INSAG) was formed with the main objective to offer advice on matters of nuclear safety, produce safety standards, and identify nuclear safety issues of international significance [1]. Only a year later the newly created Advisory Group was faced with one of the most terrifying nuclear accidents in history: Chernobyl. The concept of ‘safety culture’ was first introduced in the report that the Advisory Group issued a few months after the accident. Product of a crisis in the nuclear industry, the concept of safety culture was defined and analyzed as “assembly of characteristics and attitudes in organizations and individuals, which establishes that, as an overriding priority, nuclear plant safety issues receive the attention warranted by their significance.” Obviously, the emphasis was on organizational policies and managerial actions while individuals were seen as having “personal attitudes and habits of thought” linked to safety [2]. The aim was to strengthen the safety of nuclear power plants and avoid Chernobyl-type accidents in the future. Nevertheless, in a IAEA 2007 updated definition of culture, “nuclear power plant safety issues” (1986 definition) has been simply replaced by “protection and safety issues” [3] to mark a wider concern about safety culture in other “safety conscious industries” [4]. Evidently, since 1986 nuclear safety culture has been closely and primarily connected to organizational and technical issues within nuclear industrial settings leaving the medical sector largely unaffected. In this sense, culture is identified with learned behavior, a whole body of attitudes, habits, and practices passed on from one generation of nuclear operators to the next and related to the style of organizations and their culture. This understanding of safety culture is linked to earlier conceptualizations of culture—as static, shared, and uniform—that have prevailed in anthropology in the early part of the 20th century. The culture concept in use comes actually to mean the cultivation of people—in this case nuclear operators—through special technical education. Based on this perspective, individuals have been seen as complacent or in a position that is opposed to and thus outside culture [5-7].

Given the significant disengagement that exists between humanities and nuclear sciences and engineering, regulatory agencies’ recent attempts to reconceptualize safety culture have not been adequately informed by disciplinary developments in the humanities and social sciences. In contemporary anthropology and social history, culture is not considered any more as a package of knowledge shared by bounded individuals. A number of scholars have argued that anthropological and sociological analyses would be more productive if culture were to be broken into elements understood on their own terms rather than as unified corpus [5,7,8]. In addition, given that culture is closely intertwined with power, scholars of safety science in general, have only recently touched on issues of power and conflict in order to give an account of the dynamics of organizational life [9]. The time is ripe to rework the concept of nuclear safety culture based on insights from the social sciences and humanities while the world is becoming increasingly aware that human activities ranging from nuclear power production to the use of radiation in medicine could be very harmful and that protective actions should be taken.

Usually, the overall perception is that if workers are trained, operators are certified, and programs accredited then safety will ensue. But despite all this, incidents in both nuclear industrial and medical sectors continue to arise. Cited causes emphasize failures in techno-scientific issues, insufficient training, poor organizational and managerial structures, and inadequate safety culture. They neglect, however, to focus on the human and social aspects of the stakeholders involved, especially when dealing with liabilities that could spread beyond the originally conceived, or in accounting for human responsiveness and responses to safeguards and post-disaster mitigation [10]. In addition, although there is an international consensus on what safety culture means and consists of—a term widely used by regulators and corporate professionals in nuclear industry—its social dimensions are inadequately understood. Moreover, communities at the receiving end of nuclear are concerned with technological lockout, the fact that nuclear technology recipients are barred from accessing certain technologies due to lack of established frameworks within their societies for dealing with the safety hazards of such technologies. As recent as February 2016 the IAEA organized an international conference on the “Human and Organizational Aspects of Assuring Nuclear Safety” targeting mainly the nuclear power plants (NPPs). It was the first time that the Agency placed such an emphasis on the human and organizational factors affecting the safety culture of the nuclear industry and called for a reconceptualization of the term. In his introductory remarks, the then Director General (DG) Yukiya Amano, urged participants to reflect upon the lessons we learnt over the last 30 years since the Chernobyl disaster. The 2015 IAEA DG’s Report on the Fukushima Accident left no doubts that human and organizational factors played a big role in the management of the nuclear disaster following the earthquake and the subsequent tsunami in Japan [11].

Besides the IAEA, other regulatory agencies and stakeholders have noticed that safety is not an issue that should be left to nuclear scientists and engineers alone. In 2012 the International Radiation Protection Association (IRPA) organized its annual meeting in Glasgow under the overarching theme “Living with Radiation-Engaging with Society” http://www.irpa.net/page.asp?id=54516 In his report on the Fukushima accident, William Magwood, Director General of the Nuclear Energy Agency, a specialized agency within the Organization for Economic Co-operation and Development (OECD), argued that “we must address the human aspects of safety, such as ensuring effective safety cultures for both operators and regulators and continuing to learn from safety research, including through the NEA’s international joint research projects.” http://www.oecdnea.org/news/2016/2016-01.html

In the sector of nuclear medicine the “Bonn Call for Action,” a joint position statement published by the IAEA and the World Health Organization in 2012, argued for a holistic approach to the problem of radiation protection including among others the civil society as well. One of the major proposed actions is to improve radiation safety culture in health care.
https://rpop.iaea.org/RPOP/RPoP/Content/AdditionalResources/Bonn_Call_for_Action_Platform/index.htm

Nuclear safety and radiation protection continue to be major challenges and the next frontier in nuclear science and technology. The two terms are closely intertwined. Since safety is primarily concerned with control over radioactive sources it contributes towards protection. But how could the humanities and social sciences contribute to the effort of a) managing the risk for patients to be overexposed to radiation during radiotherapy or intervention and of b) improving nuclear safety and radiation protection in industrial settings? The suggested way is to generate a cross-disciplinary, trans-geographical, and trans-national network involving scholars from social sciences, the humanities, the nuclear sciences and engineering, medical physics and practitioners in both the nuclear industry and medical sector in order to establish a common knowledge base on how to deal with safety and risk in use of radiation a) in medicine and b) in nuclear industrial installations. Also achieving analytical clarity of the key notions of radiation risk and safety culture based on the historical, socio-political, economic, and cross-national context in which these concepts have been embedded is key in this effort. The overall aim is to educate a new generation of what I call “nuclear safety mediators,” that is all those individuals who could act as intermediaries among different social groups—i.e. workers in nuclear industry, CIOs in nuclear industry, nuclear engineers, patients, medical practitioners, radiotherapists and the public, to mention just a few—with direct interests to maintain nuclear safety and enforce radiation protection. Safety mediators should be trained in a way that will allow them to integrate perspectives of social sciences in nuclear settings. To do so we need to develop major interdisciplinary resources such as a) a common data framework on the history of radiological and nuclear incidents making it readily available in the public domain, b) a research agenda to allow greater articulation to the relation between humans and the complex technological systems in both the industrial and the medical sectors, c) an understanding of the role that the standardization of human skills has historically played in the fields of radiation protection and nuclear safety and d) a framework of understanding the human and social aspects of safety culture in the workplace using as a methodological tool ethnographic studies in nuclear industrial and medical settings. No focused institutional study and no national group of researchers can capture the dispersal needs of radiation protection and nuclear safety. Given the diverse interests involved and the expertise that is required in order to bring a step change in achieving both radiation protection and nuclear safety, inter- and trans-disciplinary networking seems to be a viable solution.

Funding

This publication is part of the “Living with Radiation: The Role of the International Atomic Energy Agency in the History of Radiation Protection” (HRP-IAEA) project that has received funding from the European Research Council (ERC) under the European Union’s Horizon 2020 research and innovation programme (Grant agreement No770548), https://iaeahistory.weebly.com.

Reference

  1. Meserve, Richard and Brockman Kenneth (2004) Safety for All, the New INSAG. IAEA Bulletin 46: 51-52.
  2. IAEA Safety Series No.75-INSAG-4 (1991) Safety Culture: A Report by the International Nuclear safety Advisory Group, IAEA, Vienna.
  3. IAEA Safety Glossary (2007) Terminology Used in Nuclear Safety and Radiation Protection, IAEA, Vienna
  4. IAEA Safety Report Series, no. 74 (2012) Safety Culture in Pre-Operational Phases of Nuclear Power Plant Projects. IAEA, Vienna.
  5. Beldo Les (2010) Concept of Culture. In: James Birx (ed) 21st Century Anthropology 1: 144-152. Thousand Oaks, CA: Sage.
  6. Sewell, William (1999) The Concept(s) of Culture, in Victoria Bonnell and Lynn Hunt, (eds.). Beyond the Cultural Turn pg: 35-61, California: University of California Press.
  7. Moore, Jerry D (2012) Visions of Culture: An Introduction to Anthropological Theories and Theorists. 4th Ed. Lanham, MD: Alta Mira Press.
  8. Kuper, Adam (1999). Culture: The Anthropologists’ Account. Harvard University Press.
  9. Antonsen Stian, Kari Skarholt, Arne Jarl Ringstad (2012) “The Role of Standardization in Safety Management” Safety Science 50: 2001-2009.
  10. Kyrtsis, Alexandros and Rentetzi, Maria (2021) From Lobbyists to Backstage Diplomats: How Insurers in the Field of Third Party Liability Shaped Nuclear Diplomacy. History and Technology
  11. IAEA Report by the Director General to the Board of Governors (2015) The Fukushima Daiichi Accident. IAEA, Vienna.

The Impact of Culture and Beliefs in Cancer Care: Turkish Experience

DOI: 10.31038/IMROJ.2021616

Abstract

The perception and the coping mechanism of cancer is directly affected by the cultures, values and belief systems. Turkish culture in this regard is unique, bridging conservative Islamic beliefs with contemporary Western way of thinking. In this study, the changing attitudes towards cancer and the factors pertaining to it in this process has been discussed within the cultural, social and spiritual framework. There used to be a widespread sense of fatalism and silence surrounding cancer. With increasing modernization, migration to cities, educational levels and prosperity, and the growth of Westernization and participatory society, perceptions and responses changed. Cancer is now a disease that is openly discussed. The sense of fatalism is getting less prevalent. Medical and scientific attitudes play a great role in treatment. The family institution also has a clear supportive function. Family, as well as religious attitudes and beliefs, go a long way in preserving hope.

Length of life is perceived as more important than quality of life. In treating the disease, curing it comes before aesthetic concerns. The importance of science in the perception of disease has become more prevalent. Fatalistic or religious attitudes do not play much of a role in undermining treatment. Cancer has resulted in a view and understanding that resynthesizes belief, science and human values in Turkish culture.

Keywords

Attitudes, Beliefs, Culture, Faith, Psychooncology, Participatory society, Perception, Traditional, Modernity, Turkish culture

Cancer is a chronic, life-threatening disease that greatly impacts all spheres of life. Cancer patients develop various and differing emotional, mental, and behavioural reactions regarding their illness during diagnosis, treatment, and the palliative period [1]. The experience of cancer cannot be understood independent from the specific culture [2]. Beliefs and values of a society influence perceptions about the meaning of an illness, the types of treatment or remedies that are useful, and the likely outcome. Cross-cultural differences may lead to ethical dilemmas regarding communication, decision-making, treatment choices and end-of-life decisions.

What is Culture?

Culture is the sum total of the way of living; includes values, beliefs, standards, language, thinking patterns, behavioural norms, communications styles, etc….

Culture influences many different aspects of daily life – including perceptions, emotions, belief systems, and behaviours. It has an important influence on religion, family structure, gender relationships, and social organisation – as well as on diet, dress, body image and perceptions of illness and medical treatment.

The most important issues that dominate cultural variations in symptom presentation, health care seeking behaviour and illness perception are:

  • Variations in family systems and structures (e.g. patriarchal families)
  • Variations in age and gender role
  • Educational factors
  • Socio-economic factors
  • Environmental factors (rural or urban)
  • The meaning and perceived cause of illness [3].

A culture specific understanding and approach is necessary in delivering the optimum psychiatric and physical care [4].

Turkish Culture

The history of Turks goes back to 20,000 years prior to the advent of Islam. Turkish culture begins in pre-Islamic Central Asia. The Turks, beginning there, spread over an extensive geographical area, to the Caucasus, Anatolia, the Middle East, the Balkans and Central Europe, and established various states and empires. With their acceptance of Islam, a new age began. Modern Turkey is the focal point of this culture. The modernization and Westernization movement that began in the last 150 years of the Ottoman Empire and was institutionalized by Atatürk, the founder of the republic, formed the basis for a new synthesis and prospects for this culture.

Turkish culture is a synthesis having historical depth and geographic expanse. Perhaps, too, it is a new model for the Central Asian Turkic republics, the Caucasus and the Middle East, and some Balcanic countries which share a common culture and civilizational past with the Turks.

Atatürk said that the basis of the Turkish republic is culture.

“Turkish culture” should be understood to mean the interaction and synthesis of pre-Central Asian Turkish culture with Islam, and the cultures of Anatolia, the Balkans, the Middle East, and the Caucasus, into which they spread, as well as other areas that were part of the Seljuk and Ottoman Empires, and the modern reformism of Atatürk, the founder of modern Turkey. It is a synthesis of conservative, traditional and religious values with modern Western culture. The Sufi movement is a traditional medieval Turkish approach that teaches spirituality through near-mysticism, using song, dance to induce an altered state and closer connection to God. This new attitude towards the mind, freeing mental illness from implications of wrongdoing, paved the way for a more scientific examination of the causes and symptoms of mental illness.

Turkish cultural traditions had developed a humanistic orientation that is concerned with treating the “whole person”, thus emphasizing on the integrity of the individual –his mind and body-. Through the centuries, all the “Houses of Healing” established in Turkish world integrated mental and physical health (Gevher Nesibe built in 1200’s is the first hospital serving both physically and mentally ill patients [5].

Illness Perception: IPQ-R: Turkish Version

Turkish version of the illness perception Questionnaire – R was adapted by [6] and is a reliable and valid tool in using for research studies in cultural aspects of cancer patients.

After the translation and language consistency of the Turkish version, the scale was applied to 203 cancer patients at Istanbul University, Oncology Institute. The study revealed that patients who lack of knowledge and information regarding cancer resulted in fatalistic and passive causal. The IPQ cause scale showed cancer patients to endorse most strongly “stress” or “chance/bad luck” as causes for their Illness, with “accident – injury” being the least favoured attribution. Majority of the participants proposed that “destiny” is the cause of illness in the section of the questionnaire where the perceived cause, is asked. The less educated patients in Turkey attribute their illness more to faith [7].

Erbil et al (I996)’s findings suggest that psychosocial distress is expressed differently in Belgium and Turkey. Turkish patients express their anxiety more with somatic complaints [8]. According to the authors, illness perception, a culture-dependent factor, appears to influence psychological adjustment very differently, a correct perception of illness leading to more anxiety in the Belgian patients compared to the Turkish patients [8]. Similarly [9], analyzed the perceptions, causal attributions, and attitudes toward help of a group of 33 Jewish Israeli cancer patients and found two distinct response patterns-that of the ‘Western’ patients (science-oriented, active) and that of the ‘Oriental’ ones (fatalistic, passive).

Special Issues in Communication: Telling the Truth

Revealing the diagnosis to a patient with terminal cancer is not currently fully accepted in some countries without an Anglo-Saxon cultural background such as Turkey, where there is a family hierarchy and the family of the patient makes the decisions about treatment, physicians discuss the cancer diagnosis with the family before discussing it with the patient and commonly comply with the family members’ requests. Similar paternalistic approach is also relevant for Arab and Islamic cultures. There is a tendency to disclose the truth more often than in the past, but full openness is still not a common practice.

Different practices and regulations: due to the current disclosure regulations and patient rights to participate in decision making in Western countries. Western medicine is taught and practised using a model of full disclosure which is considered important for patients to be able to make decisions about their treatment d to be informed fully prior to giving consent to treatment. At the opposite end of the spectrum is the non-maleficence model, whereby the patient is not told of a poor prognosis in the belief that this will protect him or her against unnecessary physical and emotional harm. Some cultures view discussion of serious illness and death as impolite and provoking unnecessary anxiety, depression, and a sense of helplessness, thereby eliminating all hope.

Somewhere in the middle of the spectrum is the model of beneficence, where family members actively participate in the communication, share the burden of a poor prognosis with the patient, and encourage hope. This is the general attitude in Turkey. In the last two decades, changes in Turkish society has been rapid, complex, and irregular. These changes include growth in population, urbanization, education; which altogether brought a participatory model. The stigma regarding cancer is more prevalent in patients from rural areas and in those who lack necessary knowledge concerning their disease. Studies generally revealed that lack of knowledge and information regarding cancer resulted in fatalistic and passive causal attributions [4]. A study done by [10] revealed that the degree of information and knowledge about one’s illness is related with positive problem solving strategies. A silent attitude was the general norm in Turkey. These appear to charge in accordance with changes in the society and culture.

There exist a polar attitude concerning perceptions, causal attributions and attitudes toward cancer: Western style (Science oriented, participating) and eastern style (fatalistic, passive). Our clinical experience and research findings obtained through our liaison psychiatry practice carried out with the breast surgery unit show that in breast cancer patients who had undergone mastectomy, the main basis for distress was the cancer itself, esthetical concerns and effects of cancer to the quality of life was secondary [11,12]. Feeling under threat and fear of death and the associated anxiety is prominent, rather than loss reaction associated with breast [4]. Fertility and motherhood are still important for the status of women in rural and more traditional parts of the society. A study by Kulakaç implied that “mother” role of women was considered more basic than female role [13].

Most adult and elderly patients state that their main concern is not facing death but becoming a burden on the family and dying in unbearable pain. Adjustment to cancer is better in a family environment characterized by obsessiveness, open expression of feelings, and absence of family conflict. The most challenging and difficult management issues arise with the loss of child in the family.

Regarding the effect of cancer on the perception of life [14], reported optimistic findings. In the study, 80 % of the cases reported that cancer had a great impact on their lives, and 48 % evaluated the impact as a positive, life-enhancing experience. Patients reported that experiencing cancer has been a power forcing them to see their lives more positively, giving them a chance to restructure their lives and to change their perspective toward people and the world. The authors reviewed 24 studies on breast cancer published from 1990 to 2010 which revealed a relatively small percentage of women experienced posttraumatic stress disorder, whereas the majority reported posttraumatic growth. Age, education, economic status, subjective appraisal of the threat of the disease, treatment, support from significant others, and positive coping strategies were among the most frequently reported factors associated with these phenomena.

The thesis of [15] was conducted at our department and was titled “Post traumatic growth in cancer patients and related factors.” The results revealed a relationship between posttraumatic growth and confrontive coping, self-controlling, accepting responsibility, escape-avoidance, intentional problem solving, positive reappraisal, and seeking social support. The ways of coping and perceptions of illness were important variables affecting posttraumatic growth. Parry and Chesler stated that coping processes and creating meaning and spiritual-moral development are especially associated with long-term psychosocial well-being [16]. The way pain is perceived, manifested and treated by patients and families is another area affected by culture. Cancer patients who are confident in coping and controlling cancer define less pain. In our practice, we see an association between the severity of pain and depression [17-20].

Taking into consideration and integrating our experience at the Department of Psychooncology, Institute of Oncology, University of Istanbul (main pioneering department in the country), the results of nearly 50 master thesis conducted at our department, and the general psychooncology researchers and experiences shared in major scientific meetings in the country, I would like to summarize my thoughts based on the above as follows:

  • In the past 40-50 years, prosperity, democratization and participatory culture has expanded in Turkey.
  • Urban migration and westernization has contributed to social consciousness.
  • Up until the 1970s and 1980s, cancer was perceived as equivalent to death and was referred to as a “cruel illness” and silent attitude most prevalent.
  • Cancer has become less of a taboo subject in Turkish society; there has been increasing awareness regarding cancer in society.
  • The discussion of cancer in academia and the media has become increasingly multifaceted.
  • The perception of cancer as a catastrophe has declined in society. More emphasis is placed on the importance of psychological and social support.
  • Psychooncology practice helped decreasing the prejudice such as only insane people receive treatment from psychiatrists or psychologists. The necessity of psychological support to cancer patients has been readily accepted by the culture.
  • The fear of recurrence is still the most prevalent source of anxiety in cancer patients.
  • The old-fashioned way of thinking was strongly influenced by religion and arose from within a traditional, feudal social structure. The Westernization occurring and an increasingly institutionalized process of modernization, has given rise to a brand-new structure and way of thinking.
  • Religious or spiritual approaches towards illnesses and cancer, with respect to both cause and treatment, have gradually diminished.
  • However, the impact of religion on the reactions to cancer can still be seen. A fatalistic approach can be anxiety relieving for some. For others, it can impede treatment. Nevertheless, a fairly widespread and functional way of perceiving and style of coping is characterized by “first do what you can, then leave it to God.”
  • The approach “if it’s cancer, take the entire organ” is common.
  • Society and the family still prioritizes longevity over quality of life.
  • We see the widespread impact of belief systems pertaining to death and the acceptance of death issues basically.
  • In Turkey, when it comes to cancer, religion, strongly tied to a belief in Islam, is associated with a reduction in loss of hope, suicidal thinking and dying in the hospital.
  • We see that in the terminal phase, turning toward religion and resorting to prayer increases more.
  • Religious thought and rituals are prevalent in the processes of saying goodbye.
  • There are conflicting reports on the effects of religion on (better) health.
  • In Turkish patients with cancer, it is commonly observed that a diagnosis of cancer makes people more faithful; while they may not practice more.
  • There is an increase in perceptions of meaningfulness in life and hope. The perception of “There is always hope with God.”
  • The association between religion and spirituality and cancer has not been systematically studied in Turkey. We do not know the impact of religion and spirituality on the outcome of cancer.
  • With regard to grief, concerns about death and the afterlife, I see that patients and families turn more to religion for guidance, without sacrificing scientific treatments.
  • In Turkish culture, the cancer care is more family oriented than individualistic. In cases that are perceived as catastrophic such as earthquakes, cancer, all the family members get together and face this situation all together. This is generally supportive for the patient. Sometimes it may act as a protective factor.
  • In case of grief and bereavement, the experience is lived collectively and more religiously. The grief process is not lived through individualistically and silently as in some Western countries. Wailing and crying outs are more common.
  • Religious assessment of cancer patients is not routinely done in clinics in Turkey.
  • Religious concerns and needs of patients are not routinely addressed.
  • On the other hand, the practice of psychotherapy does not routinely integrate spirituality, unless actively requested by the patient. This area is mostly covered by families.

The integration of traditional values of Turkish culture and modern western values, the impact and continued functionality of the family, a sense of social solidarity, religious beliefs, and a humanistic understanding rooted in culture has given rise to a synthesis of two views: “health is more important than anything else” and “with God there is hope.” Our culture has a positive impact on treatment by seeing the patient and his cancer within the framework of a mind-body holism.

References

  1. Ozkan M (2016) Psychosocial Adaptation During and After Breast Cancer. In: A Aydıner, A İğci, A Soran (eds.), Breast Disease: Management and Therapies, Istanbul: Springer International Publishing Switzerland, pp: 821-852.
  2. Brown R, Bylund C, Kissane D (2010) Principles of Communication Skills Training in Cancer Care. In: WBJ Holland (eds.,), Psycho-Oncology, New York: Oxford University Press, pp: 597-604.
  3. Anuk D, Özkan M, Kizir A, Özkan S (2019) The Characteristics and Risk Factors for Common Psychiatric Disorders in Patients with Cancer Seeking Help for Mental Health. BMC Psychiatry pp: 1-11.
  4. Özkan S, Özkan M, Armay Z (2011) Cultural Meaning of Cancer Suffering. Pediatr Hematol Oncol pp: 102-104.
  5. Özkan S (2007) The Historical Development of Mental Health in Turkish Culture. Gevher Nesibe Hospital and Medical Academy pp: 77-83.
  6. Kocaman N, Özkan M, Armay Z, Özkan S (2007) The Reliability and the Validity Study of Turkish Adaptation of the Revised Illness Perception Questionnaire. Anadolu Psikiyatri Dergisi pp: 271-280.
  7. Armay Z, Özkan M, Kocaman N, Özkan S (2007) Hastalık Algısı Ölçeği’nin Kanser Hastalarında Türkçe Geçerlilik ve Güvenilirlik Çalışması. Klinik Psikiyatri pp: 192-200.
  8. Erbil P, Razavi D, Farvacques C (1996) Cancer patients psychological adjustment and perception of illness: Cultural differences between Belgium and Turkey. Support Care Cancer pp: 455-461.
  9. Baider L, Sarell M (1983) Perceptions and causal attributions of Israeli women with breast cancer concerning their illness: the effect of ethnicity and religiosity. Psychother Psychosom pp: 136-143.
  10. Şener Ş, Günel N, Akçalı Z (1999) Meme Kanserinin Ruhsal ve Sosyal Etkileri Üzerine Bir Çalışma. Klinik Psikiyatri Dergisi 2: 254-260.
  11. Özkan S, Turgay M (1992) Masektomi Olgularında Psikiyatrik Morbidite Psikososyal Uyum ve Kanser – Organ Kaybı – Psikopatoloji İlişkisi. Nöropsikiyatri Arşivi, pp: 207-215.
  12. Isıkhan V, Güner P, Kömürcü S (2001) The Relationship Between Disease Features and Quality of Life in Patients With Cancer. Cancer Nursing, pp: 490-495.
  13. Kulakaç O, Buldukoglu K, Yılmaz M (2006) An Analysis of the Motherhood Concept in Employed Women in South Turkey. Social Behavior Personality, pp: 837-852.
  14. Öner H, İmamoğlu O (1994) Meme kanseri olan Türk kadınlarının hastalıklarına ve uyumlarına ilişkin yargılar. Kriz Derg 2: 261-268.
  15. Bayraktar S (2008) Kanser hastalarinda travma sonrasi gelisim olgusunun ve etkileyen faktörlerin incelenmesi. İstanbul Üniversitesi Saglık Bilimleri Enstitüsü, Yüksek lisans tezi.
  16. Parry C, Chesler M (2005) Thematic Evidence of Psycho-social Thriving in Childhood Cancer Survivors. Qual Health Res, pp: 1055-1073.
  17. Özkan S (2010) Psychiatric Aspects of Pain in Cancer Patients. Asian Pacific Journal of Cancer Prevention, pp: 113-116.
  18. Fitchett G, Canada A (2010) The Role of Religion / Spirituality in Coping with Cancer: Evidence, Assessment, and Intervention. In: J Holland, W Breitbart, P Jacobsen, M Lederberg, M Loscalzo, R McCorkle (eds.,), Psycho-Oncology, New York: Oxford University Press, pp: 440-446.
  19. Lepore S (2001) A Social Cognitive Processing Model of Emotional Adjustment to Cancer. American Psychological Association, pp: 99-116.
  20. Uzun Ö, Aslan F, Selimen D (2004) Quality of Life in Women With Breast Cancer in Turkey. Nursing Scholarship, pp: 207-214.

The Organization of the Dental Service in the Voronezh Region


In the article, on the territory of a large subject of the Russian Federation, the features of the organization of dental care for adults and children are considered. During the meetings in the autonomous health care institution, in accordance with the action plan of the Department of Health of the Voronezh Region, the issues of primary prevention of dental diseases among the population of the Voronezh Region within the framework of the state program of the Russian Federation “Development of Health Care”are highlighted. When considering the current state of scientific medicine and the practical direction of preserving the health of the population, the relevance of dental research remains unchanged. The analysis of literature sources and reporting materials showed the importance of dynamic observation of medical and social indicators, conditions and lifestyle, the level and structure of dental morbidity, and the demographic situation. The author of the work is well aware of the importance of the background of dental measures aimed at prevention (first of all) and treatment (if necessary). Speaking about the indicators of morbidity in dentistry, the author emphasizes the need to study it to assess the public health of the entire population. The data of the social and hygienic monitoring of the Voronezh Region for 2017-2019 were used.

Keywords

Curatorship, Dental service, Perspective directions of development

In recent decades, the broadest powers to provide medical care to the population have been transferred to the level of the constituent entities of the Russian Federation, including the dental service. The broad capabilities of specialized medical organizations operating in legally permitted forms of ownership are provided by a significant number of personnel, high external and internal resources, and constant updating of prescriptive directives on professional activities in relation to all personnel with explanations on the implementation of effective and high-quality provision of medical care. The dental service in the health care system of the Voronezh Region is currently characterized by the availability and quality of care to the population, the introduction of modern dental technologies into practice, and constantly improving the professional level of specialists [1].

Materials and Methods

In order to analyze and evaluate the results of preventive and curative work to reduce the incidence of diseases among the population in the dental profile, it is extremely important to consider the shortcomings available in the official accounting documents. Therefore, every year the results of the work are summed up through the preparation of an analytical review of the activities of the dental service of the Voronezh Region. It is such a study that creates the possibility of forming a strategy for organizing work on the part of a dentist working in outpatient clinics (APU) and managing the health care vertical at the regional level. At the beginning of 2020 in the Voronezh region, the number of initially applying for dental care fell by 3.9%, while initially seeking children at 6.5%. There is no doubt about the information that crisis situations in various spheres of society aggravate social and hygienic factors that affect the dental morbidity in the direction of deterioration. This constantly directs the theoretical and practical parts of the work carried out to re-evaluate the forces of these factors, as well as to find ways to optimize the ongoing preventive work.

We have studied and used the data of the reports, conducted a comparative analysis concerning the personnel potential of the dental service of the Voronezh region in 2017-2019. (report forms No. 17, 30, 47), the availability of resources, as well as the opinion that the health of the population is directly related to medical and demographic indicators against the background of the results of preventive work included in the main indicators of the dental service. This work, carried out in the Voronezh Region, is fully comparable with the existing world experience in planning preventive programs to reduce the dental morbidity of the population, for the strategic unity of science and practice.

Results of the Study

At the beginning of 2020, the dental service of the Voronezh Region, as a subject of the Russian Federation, has 13 dental clinics, including one for children, 19 dental departments, 10 dental offices at district hospitals (RB), 293-at other medical organizations of the Voronezh region, including dispensaries, sanatoriums, general education institutions, enterprises. The structural composition of dental specialists has remained virtually unchanged over the past years. In 2019, 1156 doctors of the dental profile (in state medical organizations) and 607 doctors of the non-state dental profile provided outpatient dental care in the region. The share of dentists in the structure of the region’s dental specialists working in the public sector was 8.8% in the reporting year (9.1% in 2018).

In recent years, the stability of the personnel potential of public sector dental doctors has been noted. In state medical organizations in the region as a whole, in 2019, 1308.5 full – time positions of dental doctors were allocated (in 2018 – 1319), employed – 1151 (in 2018 – 1164.25), individuals – 1156 (in 2018-1156). The percentage of staffing for occupied positions was 88% (in 2018 – 88.3%), for individuals-88.3% (in 2018-87). The percentage of dental doctors in 2019 by position (public sector) is shown in Figure 1.

fig 1

Figure 1: Percentage of dental doctors in 2019 in the Voronezh Region.

Of course, the focus is on the work of the therapeutic APUs of the region, both in the adult and in the child population, the figures show the indicators of the availability of dentists-therapists for 2017 – 2019 (Figure 2 and 3, respectively). The priority remains to work with the younger generation on the basis of the principle “prevention is better than treatment” [2]. But with the staff at pediatric dentistry of the medical organizations of the districts in a difficult situation: a low security child population by dentists for children (1.7 while the recommended ratio of 5.0) due to insufficient staffing and lack of them in a few areas (in 2019 is not entered into the appointment with a dentist in BUZ VO “Nizhnedevitskiy RB”) (Figures 2 and 3).

fig 2

Figure 2: The provision of dentists-therapists per 10 thousand adults in the region in 2017-2019.

fig 3

Figure 3: Provision of dentists-therapists for 10 thousand children in the region in 2017-2019.

Children’s dentists actively participated in the medical examination of the children’s population of the region [3]. The school preventive program is carried out in all general education institutions of Voronezh and the districts of the region. The activities of the dental service of the Voronezh Region are carried out in accordance with the Procedures for Providing Medical Care to Adults and Children with dental diseases, as well as in accordance with the Clinical Recommendations (treatment protocols) of major dental diseases. The proportion of sanitized patients from primary referrals in the region in 2019 was 59.85% (in 2018 – 60.1%), in the regions of the region decreased from 60.5% in 2018 to 57.62% in 2019, in Voronezh increased from 63.1% in 2018 to 63.4% in 2019. The indicator of those examined for preventive purposes from the number of primary applicants in the region decreased from 50.1% in 2018 to 47.36% in 2019, in Voronezh also decreased from 46.2% in 2018 to 45.16% in 2019, in the regions of the region there was also a decrease – from 52.4% in 2018 to 50.04% in 2019.

In all schools, gymnasiums and lyceums of Voronezh, hygiene lessons are held in primary school classes on the rules of oral care, and health schools are open. Despite this, the number of people with a healthy oral cavity per 1000 children under the age of 14 years, 11 months and 29 days in the whole region decreased and amounted to 548.73 (in 2018 – 575.42), in the districts of the region the indicator increased slightly – from 477.04 in 2018 to 477.66 in 2019, and in Voronezh it decreased – from 695.28 in 2018 to 627.13 in 2019 [4].

Discussion

The implementation of the financial plan for 1 dentist-orthopedist for 2019 was 98.5% in the region (in 2018 – 99.4%), including 98.5% in the regions of the region (in 2018 – 104%), 100.8% in Voronezh (in 2018 – 97.6%). Kantemirovskaya RB (92%), Repyevskaya RB (93.7%), Rossoshanskaya RB (91.2%), Ternovskaya RB (95.97%), Ertilskaya RB (86%), VOKB No. 2 (34.3%), VSP No. 2 (86.7%), VSMU Dental Polyclinic did not meet this indicator.. N. N. Burdenko (92.6%), BUZ VO “VSP No. 5” (99.1%). ganizations of the dental profile of the Voronezh region actively participate in the actions held within the framework of the regional interdepartmental project “Live long!”, with the support of the Department of Health – the program “Kaleidoscope of Health”, with the support of the Dental Association of Russia in the person of the VROO “Dental Association” from 01.03.2019 to 31.03.2019, the campaign “A dazzling smile for life” was held for schoolchildren of the Voronezh region. And on May 23, 2019, the departure of 3 specialists of the AUZ VO “VOKSP” was carried out in the city of Liski for participation in the review-competition within the framework of the specified project. This event was attended by representatives of all dental clinics in Voronezh. In 2019, the specialists of the regional clinical dental polyclinic (AUZ VO “VOKSP”) carried out 17 visits to medical organizations in the region (in 2018 – 17).

Supervision is in AUZ IN “WAXP” a huge breakthrough in the provision of organizational and methodological assistance to the heads of the dental service areas. In 2019, 1710,438 visits were made to the doctors of the dental profile of the region, which is 2.8% less than in 2018 (1759,157 visits). In order to improve dental knowledge in the field and in accordance with the work plan of the dental service of the region, together with the specialized departments of the Burdenko State Medical University, 6 events were held in 2019 (7 in 2018): inter – regional events – 3, regional workshop – 2, city event – 1. Annually, the staff of the regional clinical dental clinic publishes information and methodological materials for dentists of the region. The program of state guarantees for dentistry for 2019, according to preliminary data, was implemented in the region by 101.3% in the UET, in Voronezh-by 100.9%, in the regions of the region-by 100.5%. Below the control values, the PGG was performed by the dental services of the Bogucharskaya RB, Petropavlovsk RB, Podgorenskaya RB, and Ternovskaya RB dental hospitals.

The development and implementation of the main directions of development of stoma-tragicheskoi services, and coordination of dental medical organizations of all forms of ownership in the field provides organizational and methodical study of the regional clinical dental clinic.

The priority areas of organizational and methodological work are defined as:

  • providing organizational, methodological and advisory assistance to the heads of dental services
  • field forms of operational control over the activities of dental units
  • systematic analysis of the activities of the dental service of the region, the implementation of analytical work on the assessment of the state and dynamics of the development of its individual structures
  • development of current and long-term plans for the activities of the dental service of the region, strategic planning
  • organization of activities in priority areas of development of the dental service of the region, their implementation, monitoring and evaluation of the effectiveness of implementation
  • conducting permanent training of specialists of the dental service of the region of the middle and senior level (conferences, seminars)
  • information support (issue of methodological recommendations and information letters).

Insufficient provision and understaffing of staff in the districts of the region, especially secondary medical personnel, weak material and technical base of a number of facilities for providing dental care to the population of the districts of the region remain problematic [5]. The best performance has reached the dental service of BUZ VO “Anna RB”, BUZ VO “Bobrovskaya RB”, BUZ VO “Kalacheevskogo RB”, BUZ VO “Liskinsky RB”, BUZ VO “Pavlovskaya RB”, BUZ VO “Ramon RB”, BUZ VO “Buturlinovskiy RB”, BUZ VO “Novousmanskiy RB”. Last rank place in the rating table of the medical organizations of the districts is a dental service BUZ VO “Bogucharskaya RB”, BUZ VO “Vorob RB”, BUZ VO “Ternovskaya RB”, BUZ VO “Kantemirovskaya RB”, BUZ VO “Novokhoperskiy RB”.

Among the dental clinics in Voronezh, the best indicators were achieved by the VSP No. 6 and VKSP No. 4 dental clinics [5].

Conclusion

The priority directions of the development of the dental service of the Voronezh region can be considered:

  • strict implementation of the Program of state guarantees to the population of the region for the provision of dental care
  • equipping dental departments and offices in accordance with the standards of equipping Procedures for providing medical care to adults and children with dental diseases
  • improving the availability, safety and quality of dental care to the population
  • priority of prevention in the field of health protection, including in the organization of the work of the school dental service of the districts of the region
  • entry into the continuing medical education program.

References

  1. Antonenkov Yu E, Chaikina NN, Saurina OS (2020) About the dental service of the Voronezh region. Problems of social hygiene, health care and the history of medicine 28: 239-242.
  2. Korolenkova MV, Khachatryan AG, Harutyunyan LK (2020) Perinatal risk factors for caries of temporary teeth 99: 47-51.
  3. Pervushina OA, Antonenkov Yu E, Chaikina NN (2014) On the issues of optimizing the work of secondary medical personnel with the adult population in the dentistry of the Voronezh region. Current Issues of Education and Science 1: 99-100.
  4. Chubirko MI, JM Chubirko, Yu e He (2019) Internal quality control of medical care in scientific publications and normativnyh legal acts of the Russian Federation (review). Saratov Journal of Medical Scientific 15: 928-930.
  5. Golikova LO, Yu E Antonenkov, Yu Yu Bortnikova (2020) Formation of a health-saving environment in youth educational organizations as a basis for the prevention of morbidity, Based on the materials of the international scientific and practical conference. Modern Society, Education and Science 64: 76-80.

Reaching the Roof of the World: Assessing the SRHR Beliefs of Communities Residing in the Highest Mountain Ranges in the World for Integration of Lifeskills Based Education in School Curricula

DOI: 10.31038/AWHC.2021424

Abstract

The Gilgit-Baltistan (GB) region of Pakistan is home to the highest mountains in the world, and the communities residing here are largely disconnected from development efforts dedicated to Sexual and Reproductive Health and Rights (SRHR) in Pakistan. In Gilgit-Baltistan, the unique topography and isolated nature of communities residing at high altitudes makes it challenging for SRHR programmers to firstly access these communities and, secondly, understand their prevalent beliefs and practices. Aahung is a Karachi-based NGO which is planning to pilot a curriculum for Life-Skills Based Education (LSBE) in schools in GB; however, with limited information available, we conducted formative research to inform curriculum design. The aim of this study is to understand the prevalent SRHR beliefs and practices with adolescence and gender as the crosscutting themes. 25 Focus Group Discussions (FGDs) were conducted with 148 total participants in different districts of GB to assess the SRHR-related needs of adolescents in the region. Approximately 34 teachers, 36 parents, and 78 students between grades 6-10 participated in the study. All FGDs were separated by gender and the students were further divided into 2 groups: Grades 6-8 and Grades 9-10. FGD guides and consent forms were developed in English and translated into Urdu. Data were transcribed and thematically analyzed by researchers to identify the SRHR and health-related needs of adolescents in the studied region. Apart from the general prevalence of poor SRHR information among young people, findings showed a significant gender difference in SRHR knowledge and practices. Boys stated several sources of SRHR information, madrasah being the key one, whereas, girls shared that although they could receive some guidance regarding puberty from madrasah, friends and female family members, even their mothers were reluctant in discussing SRHR with them in greater detail. Findings from the study will be used to inform the design of a Life-Skills Based Education (LSBE) curriculum which will be piloted with schools in GB.

Keywords

LSBE, SRHR, Education, Gilgit-Baltistan, Adolescent, Gender

Introduction

Adolescence is a complex phase for any individual; it is the time for crucial development and change [1]. Perceptions drawn and normative behaviours adopted during this phase need to be more informed than at any other stage of life. As puberty onsets, the beginning of new biological and psychological processes drives many vital changes during this transitional phase [2]. At this stage, occurrences such as menstruation in girls, nocturnal emission in boys, and emotional adjustments in both can create difficulty in their lives, resulting in feelings of confusion and isolation [3]. These changes combined with various other experiences around the time of adolescence can impact an individual’s susceptibility to mental health problems [4]. To be able to effectively deal with this transition, adolescents do not only require information and clarity regarding their bodily, emotional, and social changes, but also need to be protected from adverse experiences such as violence, lack of familial support, and enforcement of myths around adolescence [4]. Accurate information and promotion of their psychological well-being at this time can save them from physical discomfort, mental health issues, guilt, confusion, and ambiguity, because any such grief can ultimately affect their social roles [5].

In Pakistan, adolescents are generally poorly informed about their sexual and reproductive health and rights (SRHR) issues including puberty, gender, marriage, family planning, and sexual concerns and sexuality [6]. Especially in the rural areas, owing to the cultural rigidity as well as the sensitive nature of this topic, young people are kept deprived of information around SRHR- related issues from their elders, including their parents and teachers [7,8]. A study conducted with school-going children from the ages of 13 to 19 in Gilgit-Baltistan (GB), a largely rural region (rural population in GB=83%), found that only 62% of the young respondents had some knowledge of puberty, whereas 91% were in need of proper guidelines on the topic [8,9]. The same study showed that due to lack of education on the subject, almost all respondents (96%) expressed the desire to learn about reproductive health. The study placed immense blame on low literacy and lack of communication between the growing children and elders; it was found that 85% of adolescence exclusively discussed academics with parents and refrained from engaging in conversations around bodily changes and about other personal matters [8].

This lack of communication is compounded by the poor state of education, which can manifest as negative SRHR behaviours among adolescents [7,10]. In GB, only 35% children of secondary school-going age are attending secondary school [9]. Past researches have also shed light upon the gender-biased education system in GB, wherein, girls suffer more at the hands of illiteracy in comparison to boys [9,11,12]. According to the 2017 report of Pakistan Education Statistics, the Gross Enrolment Ratio (GER) in Pre-Primary Education in GB is 42% and it drops to 38% for Secondary Education [12]. Another UNICEF survey in 2017 found that the girls-to-boys ratio for Education Gender Parity Index (GPI) across various households, divisions, and districts of GB stands at 0.78 [9]. The out-of-school gender parity in GB speaks volumes about the prevalence of gender discrimination in GB: at primary level, more than half of the out-of-school is that of girls; and in case of secondary level the number rises to a distressing 77% [9]. The landscape of GB is characterized by harsh physical and mountainous environment where travelling and communication are generally difficult [11]. The situation, therefore, automatically becomes worse for girls, whose parents are less likely to allow them to continue their education in circumstances when security and safety is compromised or where there are transportation problems [13]. Girls’ autonomy is further restricted by religious sensitivities and traditions that contribute to their early marriages resulting in discontinuation of education [14]. Low knowledge around SRHR among youth and the obvious gender disparity in the region strongly advocates the need for Comprehensive Sexuality Education (CSE) in schools. Evidence indicates that when provided with CSE, adolescents are better able to tackle SRHR-related challenges in a healthier and more informed way, leading to a positive long-term impact on their lives [15].

This paper illustrates the prevalent perceptions, knowledge, and behaviours around adolescent SRHR in Gilgit-Baltistan along with the needs of young people regarding the same. The findings will be used to design a Life-Skills Based Education [LSBE] programme which will contain CSE modules as well.

Methods

This study used an exploratory qualitative design and collected data through Focus-Group Discussions (FGDs). Based on saturation of information and minimum representation from all geographical areas, 28 FGDs were conducted with 148 total participants in districts Skardu, Hunza, and Nagar of the Gilgit-Baltistan region. Aahung, a Karachi-based NGO, in partnership with a school network in Gilgit-Baltistan, will develop a module for LSBE and will pilot it in selected schools in the study districts. Participants for the FGDs were recruited through the partner school network’s management. All key stakeholders for the LSBE pilot, children studying in the schools, parents of the children, and teachers in the partner schools, participated in the study. Data were collected from approximately 34 teachers, 36 parents, and 78 students between Grades 6-10 participated in the study. The distribution of study participants is presented in the table below.

Table 1: Number of FGDs by district and by type of participant.

Mothers

Fathers Male Teachers Female Teachers Grade 6-8

Boys

Grade 9-10

Boys

Grade 6-8

Girls

Grade 9-10

Girls

Total

Skardu

2

2 2 2 1 1 1 1

12

Hunza

1

1 1 1 1 1 1 1

8

Nagar

1

1 1 1 1 1 1 1

8

Total

4

4 4 4 3 3 3 3

28

Semi-structured discussion guides were developed for each type of study participant. Besides sociodemographic information from study participants, key thematic areas included perceptions around human rights, gender, health, puberty, substance use, mental health, violence, marriage, familial relationships, and LSBE in general. The discussion guides were developed in English and translated into Urdu. The discussion guides were shared with the school management for review and their feedback was incorporated into the guides. This was done by the researchers to ensure that the tools were culturally appropriate and the language was easily understood by participants. FGDs were conducted in September 2019 by the research team. FGDs were conducted in classrooms in partner schools and each FGD lasted 60-120 minutes.

All of the audio-recorded discussion guides were transcribed verbatim and translated into English. A team of four qualitative researchers conducted the analysis. Data analysis was conducted manually using the framework analysis approach [16,17]. Data analysis was conducted by the research team, based on three types of coding: sub themes, themes, and categories. The identified codes, themes, and patterns were reviewed alternately by each researcher to minimize bias and to ensure reliability. The identified themes and subthemes are organized in the table below.

Table 2: Identified Themes and Sub-themes.

#

Themes

Sub-themes

1 Perceptions around Human Rights Equal treatment


Necessities of life

2 Perceptions around Gender Meaning of Gender Perceptions around Boys

Perceptions around Girls

3 Perceptions around Puberty Sociocultural Practices and Restrictions


Perceptions around Menstruation and Menstrual Hygiene

4 Perceptions around Marriage Marriage norms


Problems Associated with Early Marriage

5 Perceptions around Mental Health Common Mental Health Issues Sources of Mental Distress Linkages with Substance Use

Perceptions around Violence

Informed consent was obtained from all participants. Since data were collected from children, special measures were taken to protect their interests by obtaining parental consent for all participating children beforehand.

Results

Perceptions around Human Rights

Participants conceptualized rights to be granted by a higher power; however, they indicated that these rights or the provision of these rights is muddled through corrupt states. Fulfillment of societal obligations, physiological and safety needs, love and belonging needs, freedom of choice, and equal respect were identified as an individual’s rights. Furthermore, participants believed that boys and girls should have equal rights, and should be respected equally.

“There are two types of rights. God’s rights and human being’s rights. Prayer, fasting, and Zakat1 are God’s rights. Human being’s rights are duties to one other such as neighbour’s rights, parents’ rights, and teachers’ rights.”

Young boy, Grade 6-8, Skardu, Gilgit-Baltistan

Participants shared that their certain fundamental human rights were affected by tourism and locals alike whereby the sensitive biodiversity of the area was being damaged resulting in high water and land pollution as well as hunting of animal species native to the region. Participants specifically mentioned behaviours such as littering in streams of drinking water and valleys and noise pollution from tourist vehicles.

Perceptions around Gender

Gender was mainly described as the difference between male and female whereas some identified it as the difference in social functioning. Social functions commonly associated with boys were out-of-home chores, bread winning, and physical labour, acting as the first line of defence in war, and supporting parents in old age.

“Boys go to the market. Boys can ride a bike but girls cannot. They don’t go to the market.

Boys can go anywhere but girls can’t go to most places”.

Young boy, Grade 6-8, Hunza, Gilgit-Baltistan

Participants said that girls are not given cell phones and bicycles, neither are they allowed to stay outside the house past sunset, which indicates that the girls’ physical as well digital mobility is restricted. Girls are expected only to wear loose-fitting clothes or remain concealed in pardah2 and it is considered inappropriate for girls to laugh in front of boys and usually only talk to boys when it is work-related. Most girls, however, are not given the opportunity to pursue higher studies and those who do pursue higher education are restricted to teaching and medical jobs.

“In our society, girls don’t get jobs and stay at home”.

Male parent, Nagar, Gilgit-Baltistan

Girls in GB are also not given their due right in inheritance and this contributes to their inability to attain socio-economic independence. Participants also agreed that there are more limitations and accountability in case of girls, whereas, boys are usually absolved of blame.

“Boys are given more information about society and if a boy is guilty of something, the blame is passed on to the girl.”

Female teacher, Hunza, Gilgit-Baltistan

Zakat1 is an annual alms tax that each Muslim is expected to pay as a religious duty and that is used for charitable purposes [18].

Pardah2 (“veil” or “curtain”) is a religious practice that involves the seclusion of women from public observation by means of concealing clothing [19].

Perceptions around Puberty

Participants associated puberty with becoming an adult, which is signified by the end of years of playfulness and the time to get married. Sharing their views on puberty, some participants said that this is when adolescents become disobedient, emotionally low, and are likely to engage in substance use and other ‘sins’.

Girls associated puberty with periods and associated it with sadness. Female participants listed activities exclusive to the days of menstruation: changing of bed sheets/covers, changing the pad/cloth twice to thrice a day, hiding from males, skipping school, washing and ironing the period cloth, and following remedies for period pain. Common remedies included eating boiled eggs with peanuts, drinking milk, remaining seated to limit physical activity, and taking medicine as a last resort. Participants shared that in order to not appear unwell; they had to pretend to work during menstruation.

“We work in the house every day and even if we have painful cramps, we keep working so that the males don’t find out.”

Young girl, Grade 9-10, Skardu, Gilgit-Baltistan

Sharing their sources of information on puberty and adolescence, participants listed parents, siblings, cousins, friends, older girls/boys, teachers, school principals, and the internet. A major source cited by both boys and girls, was madrasah where they are given lessons on puberty by the moulvi3 using the textbook: “Tauzeeh-ul-Masail4”.

Perceptions around Marriage

Participants shared that the normative age for marriage for a girl in GB is 15 to 20 years, or when the girl is in her first or second year of college. Normative age for marriage for boys, in GB, was shared to be within the range of 18 to 25 years. The participants, however, believed the ideal age should range from after puberty to 30 years. Commenting on the problems that stem from early marriages, participants relayed that they can result in early-age pregnancies and large families.

Perceptions around Mental Health

One participant described mental health as ‘feeling fresh’ while others automatically assumed a negative line and related it to stress, tension, pressure, frustration, depression, low self-esteem, inferiority complex, psychological problems, obsessions, and not finding peace. Discussing the GB community’s perceptions around mental health and mental illness, participants said that “pagal” (crazy) was usually considered synonymous with mentally ill.

“People are generally scared of the “powerful” ones and do not annoy them, where as the “weaker” ones are made fun of and teased. The powerful ones damage people’s property and should be locked in a room”.

Male parent, Nagar, Gilgit Baltistan

Moulvi3 is a learned teacher or doctor of Islamic law [20].

Tauzeeh ul Masail4 is a book of Islamic laws compiled by a Shi’a Muslim scholar [21].

On the subject of suicides, participants believed that only boys or men commit suicide, and never women, because men are more distressed. Moreover, on the matter of substance use, participants relayed that people residing outside of their localities, such as in Punjab or Karachi, are associated more with using substances. Substance use was associated with bad upbringing and the most commonly stated reasons for substance abuse were distress/depression, peer pressure, and influence of elders. Some believed that it is a way of celebrating new-found freedom amongst growing boys, and mainly associated it with recreation.

Discussion

Results of this analysis will be used to modify the LSBE program to be implemented into participating schools in 2020. The revised module will acknowledge the existing knowledge base that the children of GB have, from going through the madrasah system, rather than contradicting it. The programme will be tailored to the community’s beliefs and practices, and will integrate the teachings of the madrasah into the curriculum to prevent epistemological and pedagogical conflict. The content of the curriculum will be shared with parents, teachers, and school management before its implementation with children.

During the discussions, participants were reluctant to share information that they believed would reflect negatively on their community. Therefore, a shared form of communal protection was demonstrated with participants explicitly telling each other not attribute “blame” for problems such as substance use to the community itself. This could also be a function of courtesy bias whereby participants provided positively-framed answers to please the interviewers [22]. The study found that all participants had limited pubertal knowledge and shared that SRHR is considered to be a very taboo subject in these communities. Findings showed that parents do not talk to their children about puberty, and mothers specifically do not talk to their daughters about menstruation. These findings contrast starkly from the prevalent beliefs and practices in the rest of the country where mothers serve as the primary source of SRHR knowledge for girls while boys generally gain their knowledge through other sources [23]. All participants cited the madrasah as their source for all pubertal and SRH knowledge. Children, when they “hit puberty”, are sent to the madrasah whereby they’re provided Islamic religious texts on the subject. Participants had little knowledge on the biological and mental changes caused by puberty, and also conceptualized puberty as a singular point rather than a liminal process. Moreover, despite the community’s progressive insistence towards girls’ education, patriarchal and heteronormative beliefs prevail which hinders’ girls and women from claiming bodily autonomy and rights to inheritance, to work, to choose time of marriage, to choose to divorce, and to choose to procreate [24].

Modules focusing on career and educational choices should be developed as well with a gendered nuance to provide children with knowledge about avenues and resources that exist. Modules should also be developed as well on social responsibility towards the culture and the environment. Moreover, the madrasah system with the textbook appears to be a structural system for disseminating pubertal information among adolescents. The book should be reviewed prior to module development to ensure a “parallel” system is not created which could spark negative reaction from the community.

Conclusion

This was one of the first studies which specifically explored the SRHR beliefs and perceptions of communities residing in Gilgit-Baltistan. Apart from prevalence of low knowledge and misconceptions around puberty, marriage, and mental health, gender inequality was discovered as a strong theme lacing most of their SRHR beliefs and social behaviours. Greater emphasis needs to be placed on eliminating and/or transforming beliefs and attitudes that lower women’s position within a household and in society. The findings of this study will be used to inform the design of a LSBE module as well as a research trial to test the efficacy of the module. Future studies should also focus on 1) understanding the madrasah system better and the impact it has on shaping the community’s SRHR beliefs, and 2) exploring parental and community inclusion in interventional designs for improving adolescents’ SRHR.

References

  1. Özdemir A, Utkualp N, Palloş A (2016) Physical and Psychosocial Effects of the Changes in Adolescence Period. Int J Caring Sci 9: 717-723.
  2. McNeely C (2011) The teen years explained: a guide to healthy adolescent development. U.S.: Johns Hopkins Bloomberg.
  3. Najam N, Hussain S (2015) Gender and mental health in Gilgit-Baltistan, Pakistan. J Pioneer Med Sci
  4. World Health Organization. Adolescent mental health [Internet]. www.who.int. 2019.
  5. Morris JL, Rushwan H (2015) Adolescent Sexual and Reproductive Health: The Global challenges. Int J Gynecol Obstet 131: S40-42. [crossref]
  6. Population Council, UKAid, UNFPA (2019) Situation Analysis of Reproductive Health of Adolescents and Youth in Pakistan. Islamabad, Pakistan.
  7. Khan A (2003) Adolescent Reproductive Health in Pakistan: Status, Policies, Programs and Issues.
  8. Mamdani KF, Hussain A (2015) An evaluation of communication patterns between parents and children regarding puberty: a case study of Skardu, Gilgit-Baltistan. New Horiz 9: 47-65.
  9. Planning & Development Department, Government of the Gilgit-Baltistan, UNICEF Pakistan. GB Multiple Indicator Cluster Survey, 2016-17. Gilgit, Pakistan: P&D Department, Government of the Gilgit-Baltistan and UNICEF Pakistan. 2017.
  10. Andalón M, Williams J, Grossman M (2014) Empowering Women: The Effect of Schooling on Young Women’s Knowledge and Use of Contraception [Internet]. Cambridge, MA: National Bureau of Economic Research. p. w19961. Report No.: w19961.
  11. Murtaza KF (2012) Women Empowerment through Higher Education in Gilgit-Baltistan. Int J Acad Res Bus Soc Sci 2: 343-367.
  12. Shah Dr D, Amin N, Kakli MB, Piracha ZF, Muhammad Adeel Zia (2018) Pakistan Education Statistics 2016-2017. 25th ed. Islamabad: National Education Management Information System (NEMIS), Academy of Educational Planning and Management (AEPAM) with technical and financial support from United Nations Children’s Fund (UNICEF), Pakistan.
  13. Ali SW, Akhunzada T (2015) Unheard voices: engaging youth of Gilgit-Baltistan. Conciliation Resources, UK and Centre for Peace, Development and Reforms, Pakistan.
  14. Baig S, Ullah A (2017) Outcome and Roots of Early Marriages in Gilgit-Baltistan: A Quantitative Descriptive Study. J Mt Area Res 3: 1-7.
  15. Bashir Q, Usman A, Amjad A, Amjad U (2017) ‘The Taboo that Silences’: Awareness about Sexual and Reproductive Health Issues among Adolescent Females during Pubertal Transition. Isra Med J 9: 381-385.
  16. Gale NK, Heath G, Cameron E, Rashid S, Redwood S (2013) Using the framework method for the analysis of qualitative data in multi-disciplinary health research. BMC Med Res Methodol 13: 117. [crossref]
  17. Jane R, Liz S. Qualitative Data Analysis for Applied Policy Research. In: The Qualitative Researcher’s Companion [Internet]. 2455 Teller Road, Thousand
  18. Oaks California 91320 United States of America: SAGE Publications, Inc 305-329.
  19. Merriam-Webster. Zakat. In: Merriam-Webster.com [Internet]. 2020 [cited 2020 Apr 23].
  20. In: Encyclopaedia Britannica [Internet]. Encyclopædia Britannica, inc.; 2008 [cited 2020 Apr 23].
  21. Merriam-Webster. maulvi. In: Merriam-Webster.com [Internet]. 2020 [cited 2020 Apr 23].
  22. As-Sayyid Ali Al-Husseini As-Seestani. Islamic Laws: English Version of Tawdheehil Masaa’el [Internet]. Imam Ali Foundation; 2016.
  23. Hameed W, Ishaque M, Gul X, Siddiqui J-R, Hussain S, et al. (2018) Does courtesy bias affect how clients report on objective and subjective measures of family planning service quality? A comparison between facility- and home-based interviews. Open Access J Contracept 9: 33-43. [crossref]
  24. Ali TS, Rizvi SN (2010) Menstrual knowledge and practices of female adolescents in urban Karachi, Pakistan. J Adolesc 33: 531-541. [crossref]
fig 1

Process Mapping

DOI: 10.31038/JPPR.2021413


Process mapping can be described as an “entire approach that leads to a holistic understanding of the process under review” [1] Although it has its roots outside lean thinking, process mapping has become part and parcel of the lean “toolkit”, and is used with lean practice given its strengths in data collection and process re-design by identifying value add and non-value add processes [2-4]. It involves documenting activities of a process in a detailed graphical format. Process mapping has long been an important technique in service assessment and improvement [5]. It has the advantage of communicating roles and responsibilities to team members, providing a useful “what-if” tool and improving all round efficiency [1]. In recent years, it has become a key component of popular techniques such as Six Sigma and lean thinking [6,7]. Figure 1 is an example of a process map from a project examining discharge of high risk patients [8].

fig 1

Figure 1: Swim lane diagram outlining steps within the discharge process.

Process Mapping in Healthcare

Process mapping has recently been used to examine and improve healthcare processes. It may also allow health policy decision makers to view the management of a medical condition in the form of sequential events, and by doing so gaining an insight into both the patient and staff experience [9]. Process Mapping has demonstrated clinical benefit in improving efficiency and reducing unnecessary or ineffective care [10].

A recent review of the literature by Antonacci et al. examined the findings of eight quality improvement projects from different healthcare settings within the NHS [11]. Inductive analysis on interviews of partcipants experience of using process mapping was carried out. There were eight key benefits related to process mapping reported by the participants;

(i) Gathering a shared understanding of the reality.

(ii) Identifying improvement opportunities.

(iii) Engaging stakeholders in the project.

(iv) Defining the project’s objectives.

(v) Monitoring project progress.

(vi) Learning

(vii) Increased empathy.

(viii) The simplicity of the exercise.

Five factors related to a successful process mapping exercise were identified;

(i) Simple and appropriate visual representation.

(ii) Information gathered from multiple stakeholders.

(iii) Facilitator’s experience and soft skills.

(iv) Basic training.

(v) Iterative use of process mapping throughout the project.

There are limitations to process mapping. It can be a costly and lengthy exercise. Manual process mapping takes resources in the form of money and time. There is a team directly responsible for producing the map, as well as the employees who are brought away from their work to be contribute their knowledge to the project [12], Process mapping often relies on the memory of the person describing the process, and any gap in that recollection can lead to a gap or error in the process map [12]. One way of remedying this is the “walk the journey” method of data collection, where the entire process is observed by the mapping team. This technique has been recommended for use in process mapping exercises in healthcare, with the added advantage of experiencing the patient journey and improving patient empathy [13].

Time Driven Activity Based Costing

Another use of Process Mapping is that of a costing approach, where the sequential events derived from process mapping can be used in time-driven activity-based costing (TDABC). TDABC uses two parameters [14];

(i) The unit cost supplying capacity and

(ii) The time required to perform the activity.

In 2011, Kaplan and Porter set out a seven step approach to TDABC in healthcare settings [15], presented in Table 1 below. TDABC model has been shown to be successful in process assessment and costing activities across a variety of disciplines, including emergency medicine, paediatrics, neurology and oncology [16-19]. In the systematic review of TDABC studies in the literature, Keel et al. found TDABC to be used in both operational improvement and also to inform reimbursement policy [20]. TDABC was found to be a simple procedure, yet more accurate than traditional activity-based costing. They noted that other than defining the medical condition and care delivery value chain, all other steps set out by Kaplan and Porter are mandatory for a proper TDABC analysis. The emerging theme was that TDABC is a growing discipline and should be slowly incorporated into existing systems to provide the best cost assessments possible [20].

Table 1: Seven steps of TDABC in healthcare.

Step

Process

Step 1

Select the medical condition.

Step 2

Define the care delivery value chain.

Step 3

Develop process maps of each activity in patient care delivery.

Step 4

Obtain time estimates for each process.

Step 5

Estimate the cost of supplying patient care resources.

Step 6

Estimate the capacity of each resource, and calculate the capacity cost rate.

Step 7

Calculate the total cost of patient care.

Footnote: Steps 2 and 3 of this model are delivered by the use of Process Mapping. In order for a precise costing model to be achieved, each event in the process must be detailed and a cost allocated.

Conclusion

Process mapping has long been a valuable tool in industrial engineering. It is beginning to find its way into healthcare settings and this should be welcomed, both for service improvement and of more general service evaluation, with a notable example being time-driven activity based costing. This methodology provides an easy-to-follow and accurate cost evaluation of healthcare services where staff time is the main driver of cost.

References

  1. Jacka JM, Keller P.J (2009) Business Process Mapping: Improving Customer Satisfaction.
  2. Rahani AR, AL-Ashraf M (2012) Production flow analysis through value stream mapping: a lean manufacturing process case study. Procedia Engineering 41: 1727-1734.
  3. Klotz L, Horman M, BI HH, Bechtel J (2008) The impact of process mapping on transparency. International Journal of Productivity and Performance Management 57: 623-636.
  4. King DL, Ben‐tovim DI, Bassham J (2006) Redesigning emergency department patient flows: application of lean thinking to health care. Emergency Medicine Australasia 18: 391-397. [crossref]
  5. Hunt VD (1996) Process mapping: how to reengineer your business processes, John Wiley & Sons.
  6. Schroeder RG, Linderman K, Liedtke C, Choo AS (2008) Six Sigma: Definition and underlying theory. Journal of Operations Management 26: 536-554.
  7. Womack JP, Jones, DT (1997) Lean thinking—banish waste and create wealth in your corporation. Journal of the Operational Research Society 48: 1148-1148.
  8. Das P, Benneyan J, Powers L, Carmody M, Kerwin J, Singer S (2018) Engineering safer care coordination from hospital to home: lessons from the USA. Future Healthcare Journal 5: 164-170. [crossref]
  9. Kim CS, Spahlinger DA, Kin JM, Billi JE (2006) Lean health care: what can hospitals learn from a world‐class automaker?. Journal of Hospital Medicine: an official publication of the Society of Hospital Medicine 1: 191-199. [crossref]
  10. Susan Oliver, Ailsa Bosworth, Mara Airoldi, Helen Bunyan, Audrey Callum (2008) Exploring the healthcare journey of patients with rheumatoid arthritis: a mapping project–implications for practice. Musculoskeletal Care 6: 247-266. [crossref]
  11. Antonacci G, Reed JE, Lennox L, Barlow J (2018) The use of process mapping in healthcare quality improvement projects. Health services management research 31: 74-84. [crossref]
  12. BIAZZO S (2002) Process mapping techniques and organisational analysis. Business Process Management Journal.
  13. Trebble TM, Hansi N, Hydes T, Smith MA, BAKER M (2010) Process mapping the patient journey: an introduction. BMJ.
  14. KAPLAN RS, Anderson SR (2003) Time-driven activity-based costing. Available at SSRN 485443.
  15. Kaplan RS, Porter ME (2011) How to solve the cost crisis in health care. Harv Bus Rev 89: 46-52. [crossref]
  16. MClaughlin N, Burke MA, Setlur NP, Niedzwiecki DR, Kaplan AL, et al. (2014) Time-driven activity-based costing: a driver for provider engagement in costing activities and redesign initiatives. Neurosurgical Focus
  17. Yun BJ, Prabhakar AM, Warsh J, Kaplan R, Brennan J, et al. (2016) Time-driven activity-based costing in emergency medicine. Annals of Emergency Medicine 67: 765-772. [crossref]
  18. Yangyang RY, Abbas PI, Smith CM, Carberry KE., Ren H, et al. (2016) Time-driven activity-based costing to identify opportunities for cost reduction in pediatric appendectomy. Journal of Pediatric Surgery 51: 1962-1966. [crossref]
  19. Laviana AA, Ilg AM, Veruttipong D, Tan HJ, Burke MA, et al. (2016) Utilizing time‐driven activity‐based costing to understand the short‐and long‐term costs of treating localized, low‐risk prostate cancer. Cancer 122: 447-455. [crossref]
  20. Keel G, Savage C, Rafiq M, Mazzocato P (2017) Time-driven activity-based costing in health care: a systematic review of the literature. Health Policy 121: 755-763. [crossref]