Abstract
Colorectal Cancer (CRC) is a common malignant tumor with high mortality arising from adenomatous polyps of the large intestine. The rapid development of multiple immunofluorescence has led to the widespread application of a newly advanced technology called multiplex immunohistochemistry (mIHC), which enables the detection of multiple fluorescent proteins on a tumor tissue microarray (TMA) within the same temporal and spatial organization. Using this mIHC technology, we detected six tumor-associated proteins, including cluster of differentiation 4 (CD4), cluster of differentiation 8 (CD8), Pan-cytokeratin (P-CK), forkhead box P3 (FOXP3), programmed cell death 1 (PD1) as well as programmed death ligand-1 (PDL1) in cancer tissues and para-carcinomatous normal tissues from a cohort of 79 colorectal cancer patients. Results showed that, in CRC tissues, expression levels of P-CK and FOXP3 were upregulated while CD4 expression decreased significantly in comparison with adjacent normal tissues. What’s more, no significantly differential expression of CD8, PD1 or PDL1 was observed between cancer and normal tissues. FOXP3 expression was found to be correlated with tumor size (FOXP3 expression in tumor with volume >10 cm3 was significantly lower than that in tumor with volume ≤ 10 cm3), and reduced FOXP3 expression was associated with worse prognosis. P-CK expression in low-grade (Grade I-II) CRC patients was higher than that in advanced grade (Grade III-IV) patients, while association of P-CK expression with CRC prognosis was of no significance. In conclusion, FOXP3 and P-CK could be utilized as biopredictors of CRC (FOXP3 as a diagnostic and prognostic biomarker; P-CK as a diagnostic biomarker) for their differential expression patterns and clinicopathological correlation, while CD4, CD8, PD1 and PDL1 are more suitable for combined use.
Keywords
Colorectal cancer (CRC), Multiplex immunohistochemistry (mIHC), Tumor tissue microarray (TMA), Diagnosis, Prognosis, Biomarker
Introduction
Colorectal Cancer (CRC), one of the major causes of morbidity and mortality worldwide, is the second most common type of cancer in women and the third most common type of cancer in men, accounting for over 9% of all cancer incidence and causing death for more than 600,000 cases all over the world per year [1-4]. CRC is widely believed to develop in a multi-step process from Aberrant Crypt Foci (ACF), through benign and precancerous lesions (adenomas), to malignant tumors (adenocarcinomas) over an extended period of time [5]. Treatment of CRC usually comprises surgical resection of the primary tumors in patients followed by chemotherapy, radiotherapy and/or immunotherapy for advanced stages (stage III and IV) [6]. Despite advances in detection and available therapeutic strategies, the clinical outcomes for CRC remain poor due to tumor recurrence, metastasis, and resistance to radio-/chemo-therapy [7,8].
Early diagnosis of CRC is of importance for its significant impacts on cancer management, prognosis, recurrence and survival [9-11]. The 5-year survival rate could rise up to 90% in CRC patients who were diagnosed in the early stage, but unfortunately, the great majority of CRC cases had developed to an advanced stage at the time of diagnosis with a low survival rate around 8-9% [12,13]. Invasive techniques used for CRC diagnosis including endoscopic and radiological imaging suffered from poor patient compliance [14]. In addition, tumor markers such as carbohydrate antigen 19-9 (CA 19-9) and Carcinoembryonic Antigen (CEA) commonly used in clinical circumstance have the problems of unsatisfactory sensitivity and specificity, resulting in limited clinical application in CRC diagnosis, prognosis and survival [15]. Thus, the development of noninvasive and accurate screening tools for early detection and precise staging of CRC are of great importance and significance.
Conventional Immunohistochemistry (IHC) is a diagnostic technique widely used in the field of tissue pathology. However, IHC suffers from a number of limitations such as relatively high interobserver variability and limited labelling of a single marker per tissue section, resulting in missed opportunities of important diagnostic and prognostic information [16-18]. By contrast, multiplex Immunohistochemistry (mIHC), allowing simultaneous detection of multiple markers on a single tissue section, has emerged as a promising technology for its capability of provision of high throughput multiplex immunohistochemical staining and standardized quantitative analysis of highly reproducible and efficient tissue studies, as well as comprehensive study of cellular component, marker expression patterns, relative spatial distribution of multiple cell types and cell‐cell interactions, which are of benefit to diagnostic accuracy [19-21].
In light of this, we analyzed the expression levels and potential clinicopathological prognosis values of six tumor-associated proteins including cluster of differentiation 4 (CD4), cluster of differentiation 8 (CD8), Pan-cytokeratin (P-CK), forkhead box P3 (FOXP3), programmed cell death 1 (PD1) and programmed death ligand-1 (PDL1) in colorectal cancer, relying on 7-color fluorescent multiplex immunostaining of tumor tissue microarray (TMA) from a cohort of 79 cancer patients.
Materials and Methods
Information for Patients
The HColA180Su17 tumor Tissue Microarray (TMA) (Outdo, Shanghai, China) consisted of paired colorectal adenocarcinoma tissues and adjacent normal tissues derived from 79 colorectal cancer patients. These patients underwent surgery from Jun. 2006 to Apr. 2007, and the follow-up information was available from Sep. 2007 to Jul. 2015. The study was conducted under the approval of the Institutional Ethics Committee and all procedures were performed according to relevant guidelines and regulations for research. The clinicopathological characteristics of 79 cancer patients were summarized in Table 1.
Table 1: Clinicopathological characteristics of a cohort of 79 colorectal cancer patients
|
Clinicopathological characteristics (N=79) |
Number |
Proportion (%) |
| Gender | ||
| Male |
38 |
48.10% |
| Female |
41 |
51.90% |
| Age (years) | ||
|
≤65 |
36 |
45.57% |
| >65 |
43 |
54.43% |
| T stage | ||
|
T1 |
1 |
1.27% |
| T2 |
5 |
6.33% |
| T3 |
58 |
73.42% |
| T4 |
15 |
18.98% |
| Lymph node (N stage) | ||
| Negative (N0) |
48 |
60.76% |
| Positive (N1a, b-N2a, b) |
31 |
39.24% |
| Metastasis (M stage) | ||
| Negative (M0) |
78 |
98.73% |
| Positive (M1a, b) |
1 |
1.27% |
| TNM stage | ||
| I |
5 |
6.33% |
| II A |
34 |
43.04% |
| II B |
6 |
7.59% |
| II C |
3 |
3.80% |
| III A |
0 |
0.00% |
| III B |
28 |
35.44% |
| III C |
3 |
3.80% |
| IV A |
0 |
0.00% |
| IV B |
0 |
0.00% |
| Pathological grade | ||
| I |
16 |
20.25% |
| II |
50 |
63.29% |
| III |
12 |
15.19% |
| IV |
1 |
1.27% |
| Histology | ||
| Adenocarcinoma |
31 |
39.24% |
|
Canalicular adenoma |
41 |
51.90% |
| Mucinous adenocarcinoma |
6 |
7.59% |
| Signet-ring cell carcinoma |
1 |
1.27% |
| Disease status at last follow-up | ||
| Survival |
42 |
53.16% |
|
Death |
37 |
46.84% |
Preparation of Tissue Microarray (TMA)
Tissue Microarray (TMA) was made on basis of pathological diagnosis of each tissue. Briefly, formalin-fixed and paraffin-embedded samples were identified as well as the specimens were reviewed with hematoxylin and eosin stain by an independent surgical pathologist in order to confirm the presence of colorectal cancer and adjacent normal tissues [22]. For the formation of TMA, core cylinders (1 mm) were punched from each of circled areas and stored in a recipient paraffin block after circling of at least two representative tumor areas from each block by the pathologist. At last, consecutive TMA sections (6 mm thick) were cut and placed onto poly-L-lysinecoated slides for subsequent analysis [23].
Fluorescent mIHC of TMA
For multiplex Immunohistochemistry (mIHC) staining, antibodies for CD4, CD8, PCK, FOXP3, PD1 and PDL1were optimized by concentration and application order, meanwhile, a spectral library was built based on the single-stained slides [24]. The multiplex immunofluorescence staining and multispectral imaging of these six proteins were obtained on a TMA slide using Opal Polaris 7 Color Manual IHC Detection Kit (cat NEL861001KT, Akoya, US). In brief, the slide was deparaffinized by xylene for 10 min for three times, followed by 100% ethanol, 95% ethanol, 85% ethanol, and 75% ethanol for 5 min, respectively. After rinsing in distilled water for 3 min, slide was pretreated with 100 ml citric acid solution (pH6.0/pH9.0) for antigen retrieval with microwaving (15 min on 20% power after 45 s on 100% power) and transferred to a slide jar containing 1xTBST to mix well. Afterwards, the slide was blocked in 10% blocking solution for 10 min, stained respectively with primary antibody against CD4, CD8, P-CK, FOXP3, PD1 or PDL1 for 1 h at room temperature, washed with 1xTBST for 3 min twice and incubated with polymer HRPanti-mouse/rabbit IgG secondary antibody for 10 min at room temperature. The slide was covered by Tyramide (TSA)-conjugated fluorophore (TSA Fluorescence Kits, Panovue, Beijing, China) at 1:100 dilution and incubated for 10 min at room temperature, washed with 1xTBST for 3 min twice for next staining procedure. Furthermore, the process was repeated by microwave heat-treating the slide for antigen retrieval for every additional marker in mIHC assay, followed by one primary antibody staining during each cycle ordered as CD4, CD8, P-CK, FOXP3, PD1 and PDL1, respectively, and then downstream procedures as mentioned above. After labelling of all these human antigens, cell nucleus were counterstained with 4′,6diamidino-2-phenylindole (DAPI) (Sigma-Aldrich, US). Detailed information about primary antibodies was summarized in Table 2.
Table 2: Primary antibodies used for mIHC staining
|
Antibodies |
Dilution | Antibody Type | Catalogue# |
Vender |
| CD4 |
1:200 |
Rabbit monoclonal | ab133616 |
Abcam |
| CD8 |
1:100 |
Mouse monoclonal | NBP2-34039 |
NOVUS |
| P-CK |
1:100 |
Mouse monoclonal | GM351529 |
Gene Tech |
| FOXP3 |
1:200 |
Mouse monoclonal | 14-4777-83 |
Thermo |
| PD1 |
1:200 |
Mouse monoclonal | GT228129 |
Gene Tech |
| PDL1 |
1:200 |
Rabbit monoclonal | ab213524 |
Abcam |
Multispectral Imaging
The stained slide was scanned using the Vectra Polaris (Akoya, US) to obtain multispectral images, which precisely captures the fluorescent spectra from 420 to 720 nm (at 20-nm wavelength intervals) with identical exposure time. Next, the scans were combined into a single stack image with high contrast and accuracy
Scoring Multispectral Images
InForm Tissue Analysis Software (Akoya, US) was used in batch analysis of experimental multispectral images [25]. Firstly, images of single-stained and unstained sections were used to respectively extract the fluorescent spectrum of each fluorescein and autofluorescence of tissues. Secondly, the extracted images were used in establishment of a spectral library for multispectral unmixing by InForm image analysis software. Finally, using this established spectral library, gain of reconstructed images of sections with removed autofluorescence was fulfilled. In order to score multispectral images, three to six representative regions of interest for imaging (200×) from each case were selected. A few representative multispectral images were then loaded into analysis software to build an algorithm for segmenting tissues and cells. Next, two tissue categories of STROMA and TUMOR were trained in accordance with intensity of DAPI signals, these detected tissue compartments were selected and quantified for each stained target proteins, and corresponding number of positive and total cells were counted as well. 4-bin (0, 1+, 2+, 3+) scoring system was used for quantification of expression levels of target proteins by calculating H-score (a score which was calculated using the percentage in each bin and ranges from 0 to 300) with cell stains. Results of H-score were shown by the positive rate of cells in each bin, including four levels (0~1, 1~2, 2~3, 3~) so as to measure and categorize protein expression levels into negative, low, medium and high levels, respectively. Generally, H-score with 0~1 and 1~2 (0, 1+) were considered as low expression level, while score with 2~3 and 3~ (2+, 3+) were considered as high expression level.
Statistical Analysis
The significance of experimental data from patient specimens was determined by the Mann-Whitney U test. The Kaplan-Meier test was used to assess overall survival (OS) rates, and survival curves were plotted by the log-rank test. *P<0.05 was considered as statistically significant, **P<0.01 and ***P<0.0001 were considered as strongly significant. Statistics software GraphPad Prism version 8 was used for all statistical analyses.
Results
Demographics
A following-up for the cohort of 79 CRC patients was performed from 2008 to 2015 for the evaluation of a seven-year survival. Among these eight clinicopathological characteristics including gender, age, tumor size, T stage, N stage, M stage, TNM stage and pathological grade, the survival was associated with three of them, namely N stage, TNM stage as well as pathological grade. The results showed that prognosis of patients with negative lymph nodes (N0), early TNM stage (TNM I-II) and low pathological grade (Grade I-II) were significantly better than those with positive lymph nodes (N1-2), late TNM stage (TNM 3-4) and advanced pathological grade (Grade III-IV) (P<0.05, Figure 1 and Table 3).
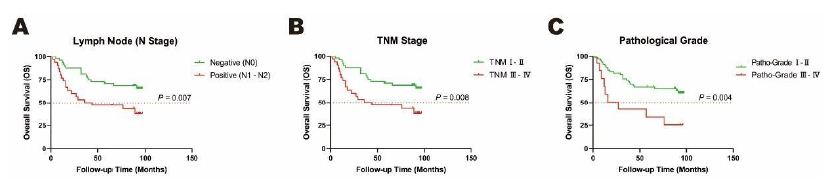
Figure 1: Overall survival (OS) rates of clinicopathological characteristics analyzed by Kaplan-Meier test. A. Lymph Node (N Stage), B. TNM Stage, C. Pathological Grade as clinical prognostic factors in cancer tissues in a cohort of 79 CRC patients. Orange dotted line: Overall survival (OS) rates as 50%.
Table 3: Prognostic clinicopathological characteristics of a cohort of 79 colorecta cancer patients
|
Clinicopathological characteristics |
HR (95%CI) |
P Value |
| Gender (male vs. female) |
0.806 (0.410-1.584) |
0.532 |
| Age (yeas≤65 vs. yeas>65) |
0.755 (0.384-1.484) |
0.415 |
| Tumor size (V≤10 cm3 vs. V>10 cm3) |
0.783 (0.327-1.876) |
0.584 |
| T stage (T1-3 vs. T4) |
0.812 (0.333-1.978) |
0.646 |
| N stage (Negative vs. Positive) |
0.3709 (0.179-0.768) |
<0.01 |
| M stage (Negative vs. Positive) |
2.787 (0.179-43.36) |
0.464 |
| TNM (TNM I-II vs. TNM III-IV) |
0.413 (0.201-0.852) |
<0.01 |
| Pathological grade (I-II vs. III-IV) |
0.209 (0.071-0.611) |
<0.01 |
Fluorescent mIHC Profile on TMA Slides Derived from Colorectal Cancer Patients
In order to obtain multiple fluorescent images, the TMA slides were trained according to intensity of DAPI signals before the selection of detected tissue compartments for each stained target proteins on slides. All six antibodies of CD4, CD8, P-CK, FOXP3, PD1 and PDL1 were then performed ahead of the quantification of protein expression level by scoring system to calculate H-score based on cell fluorescence. In detected tissue compartments and cells, images of monochromatic proteins were shown in the upper row ordered as DAPI, CD4, CD8, P-CK, FOXP3, PD1 as well as PDL1 (Figure 2). In addition, merged images of the multispectral fluorescence of these target proteins and DAPI were displayed at the bottom of the figure. The selected images displayed tumor (Figure 2A) and adjacent normal (Figure 2B) tissues, respectively.
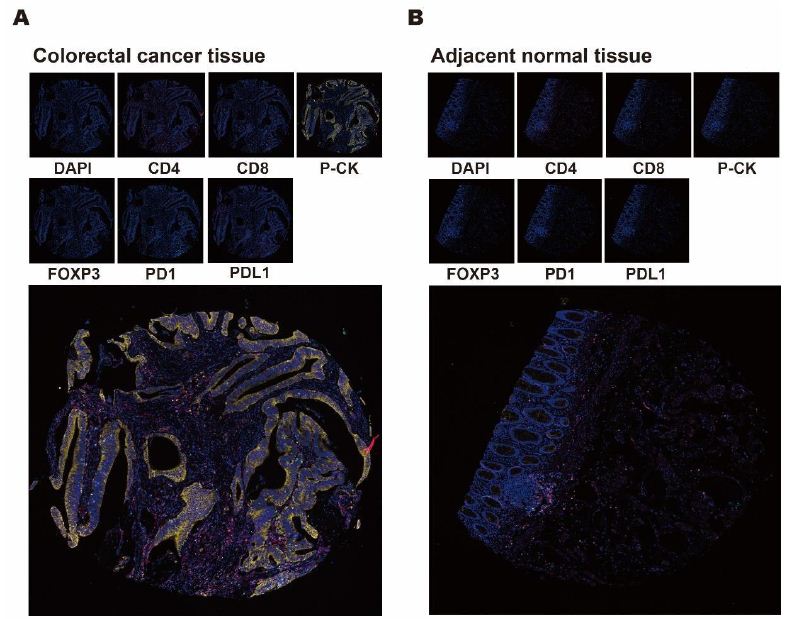
Figure 2: Mono- and multi-chromatic mIHC profile of colorectal cancer and adjacent normal tissues. A, B. Representative images of monochromatic and multispectral fluorescence in tissues from colorectal cancer and adjacent normal areas. Small images in the upper row displayed selected tissue compartments stained by DAPI, CD4, CD8, P-CK, FOXP3, PD1 and PDL1. Large images at the bottom showed a merged multispectral fluorescence from DAPI, CD4, CD8, P-CK, FOXP3, PD1 and PDL1.
Determination of Significant Markers by Fluorescent mIHC in Colorectal Cancer Patients
In a cohort of 79 colorectal patients, comparison of the expression levels of CD4, CD8, P-CK, FOXP3, PD1 and PDL1 were performed between tumor and paracarcinomatous normal tissues for the exploration of cancer associated potential biomarker. As shown in Figure 3 for monochromatic proteins, expressions of P-CK and FOXP3 were upregulated while CD4 expression decreased significantly in cancer tissues compared with adjacent normal tissues (Figure 3A, P<0.05; Figure 3C, P<0.001; Figure 3D, P<0.01). As shown in Figure 4 for bi- as well as multi-chromatic combinations, except that the expression levels of bichromatic CD4/P-CK, CD8/P-CK and P-CK/FOXP3, trichromatic CD4/CD8/P-CK, multichromatic CD4/CD8/P-CK/FOXP3 and CD4/CD8/P-CK/FOXP3/PD1/PDL1 were of significant differences (Figure 4A to 4F, P<0.001), differential expressions were not observed in other combinations in cancer tissues. As to the compared expression levels of single, double or multiple stained combinations of these six target proteins, all data were analyzed by Mann-Whitney U test and the P values were shown in Table 4.
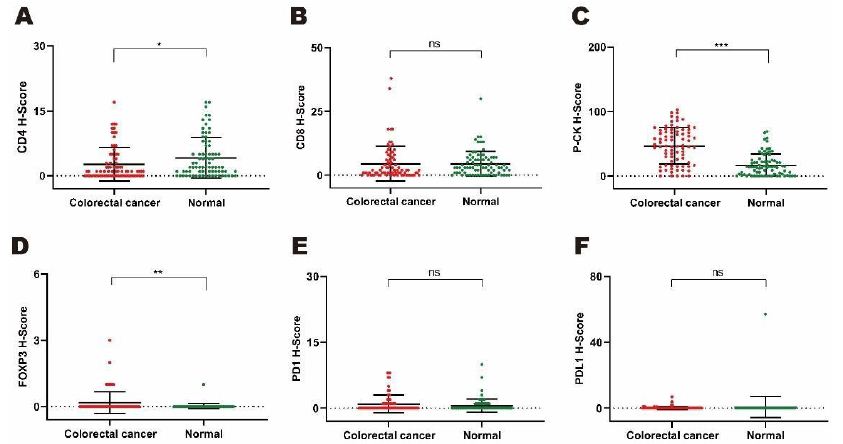
Figure 3: Comparing expression levels of monochromatic target proteins based on H-scores by mIHC from tumor versus normal tissues in a cohort of 79 colorectal cancer patients. A to F. Differential expression patterns of single stained proteins including CD4 (3A. P<0.05), CD8 (3B, P=0.915), P-CK (3C, P<0.001), FOXP3 (3D, P<0.01), PD1 (3E, ns. P=0.231) and PDL1 (3F, P=0.511).
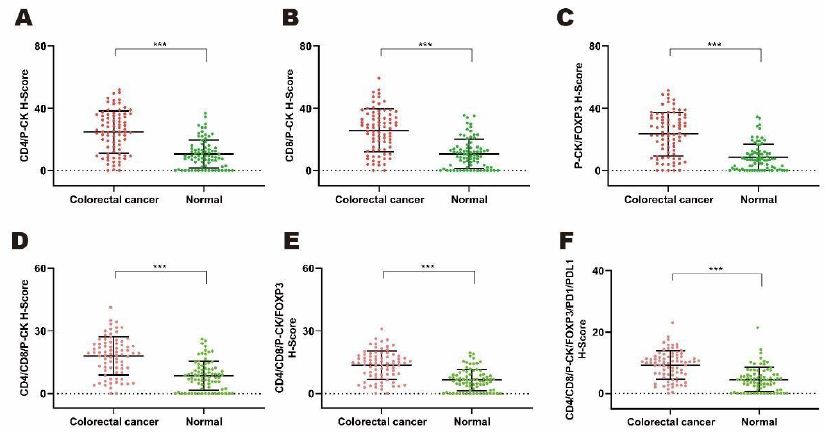
Figure 4: Comparing expression levels of di- and multi-chromatic target proteins based on H-scores by mIHC from tumor versus normal tissues in a cohort of 79 colorectal cancer patients. A to F. Comparing expression patterns of combination of double and multiple stained proteins including CD4/P-CK (3A. P<0.001), CD8/PC-K (3B, P<0.001), P-CK/FOXP3 (3C, P<0.05), CD4/CD8/P-CK (3D, P<0.001), CD4/CD8/P-CK/FOXP3 (3E, P<0.001), and CD4/CD8/P-CK/FOXP3/PD1/PDL1 (3F, P<0.001).
Table 4: Differential expression of mIHC markers in cancer vs. normal tissues
|
mIHC target proteins |
Cancer vs. Normal (N=79) |
| CD4 |
P < 0.05 |
| CD8 |
P=0.915 |
|
P-CK |
P < 0.001 |
|
FOXP3 |
P < 0.01 |
|
PD1 |
P=0.231 |
|
PDL1 |
P=0.511 |
|
CD4/CD8 |
P=0.340 |
|
CD4/P-CK |
P < 0.001 |
|
CD8/P-CK |
P < 0.001 |
|
CD4/FOXP3 |
P=0.058 |
|
CD8/FOXP3 |
P=0.781 |
|
P-CK/FOXP3 |
P < 0.001 |
|
PD1/PDL1 |
P=0.859 |
|
CD4/CD8/P-CK |
P < 0.001 |
|
CD4/CD8/FOXP3 |
P=0.402 |
|
FOXP3/PD1/PDL1 |
P=0.975 |
|
CD4/CD8/P-CK/FOXP3 |
P < 0.001 |
|
CD4/CD8/PD1/PDL1 |
P=0.392 |
|
CD4/CD8/FOXP3/PD1/PDL1 |
P=0.481 |
|
CD4/CD8/P-CK/FOXP3/PD1/PDL1 |
P < 0.001 |
Correlation between Six Proteins and Clinicopathological Characteristics
Statistic analyses were performed by Mann-Whitney U test to explore the correlation between six proteins (CD4, CD8, P-CK, FOXP3, PD1 and PDL1) and eight cancer related clinicopathological factors (gender, age, tumor size, T stage, lymph node, metastasis, TNM stage, pathological grade). FOXP3 and P-CK were found to be correlated with tumor size and pathological grade, respectively , even though most of the correlations were of no significance (Table 5). Among which, expression of FOXP3 in tumor with volume>10 cm3 (N=65) was significantly lower than that in tumor with volume≤10 cm3 (N=14) (Figure 5A, P<0.01), and expression of P-CK in low pathological grade (Grade I-II) (N=66) was higher than that in advanced grade (Grade III-IV) (N=13) (Figure 5B, P<0.05).
Table 5: Correlation between mIHC target proteins and clinicopathological characteristics
|
Clinicopathological characteristics |
P value |
|||||
|
CD4 |
CD8 | P-CK | FOXP3 | PD1 |
PDL1 |
|
| Gender (male vs. female) |
0.901 |
0.232 | 0.540 | 0.351 | 0.375 |
0.656 |
| Age (yeas ≤65 vs. yeas >65) |
0.805 |
0.419 | 0.503 | 0.491 | 0.768 |
0.730 |
| Tumor size (V≤10 cm3 vs. V>10 cm3) |
0.843 |
0.673 | 0.817 | <0.01 | 0.695 |
0.912 |
| T stage (T1-3 vs. T4) |
0.587 |
0.780 | 0.995 | 0.527 | 0.350 |
0.231 |
| N stage (negative vs. positive) |
0.778 |
0.432 | 0.877 | 0.253 | 0.784 |
0.194 |
| M stage (negative vs. positive) |
– |
– | – | – | – |
– |
| TNM (TNM I-II vs. TNM III-IV) |
0.775 |
0.424 | 0.866 | 0.533 | 0.835 |
0.939 |
| Pathological grade (I-II vs. III-IV) |
0.417 |
0.423 | <0.05 | 0.924 | 0.526 |
0.537 |
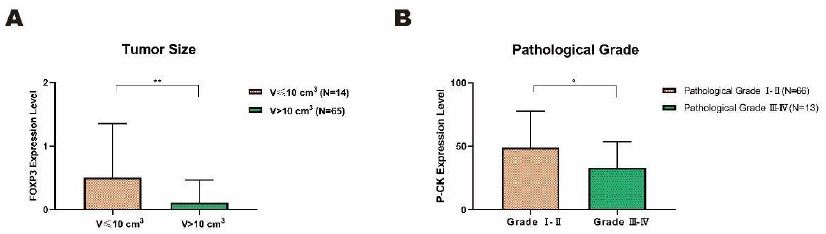
Figure 5: Significant correlations between two target proteins and clinicopathological characteristics in colorectal cancer tissues. A. The expression level of FOXP3 significantly declined in larger tumor (V>10 cm3) in comparison with smaller tumor (V≤10 cm3). B. The expression level of P-CK in pathological grade I and II was significantly higher than that in advanced grade III and IV. Data on the graph was displayed as mean ± SD (*P<0.05, **P<0.01).
Association of Prognosis Markers with Clinical Outcomes
For purpose of prognosis potential of these six proteins in CRC, expression of each protein was divided into low-expressed group (H-score 0 to 1+) and high-expressed group (H-score 2+ to 3+) on the basis of H-score representation calculated by the fluorescence intensity from three to six representative regions of each sample. Association of low-/high-level protein expression with the seven-year overall survival (OS) status of 79 CRC patients were analyzed by Kaplan-Meier test. Compared with CD4 (Figure 6A, P=0.122), CD8 (Figure 6B, P=0.905), P-CK (Figure 6C, P=0.406), PD1 (Figure 6E, P=0.582) and PDL1 (Figure 6F, P=0.156), FOXP3 was the only one with statistically significant association with CRC prognosis (Figure 6D, P<0.05). CRC patients with high-level FOXP3 expression (N=6) seemed to have a longer OS time than those with low-level expression (N=73) (Figure 6D, P<0.05), which supported the tumor-growth potential of low-expressed FOXP3 observed in our study (Figure 5A, P<0.01).
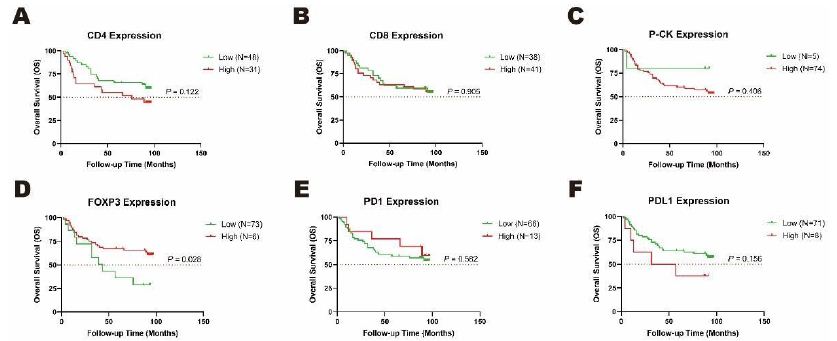
Figure 6: Overall survival (OS) rates with differential expression levels of CD4 and FOXP3 analyzed by Kaplan-Meier test. The low- and high-expression of A. CD4 and B. FOXP3 were associated with a status of seven-year survival in cancer tissues in a cohort of 79 CRC patients. Orange dotted line: half of OS rates as 50%.
Discussion
In this study, we performed multiplex immunohistochemistry analysis on six target proteins to explore the correlation of these molecules with colorectal cancer. FOXP3 (forkhead box P3, also named IPEX, PIDX) is a member of the forkhead box (FOX) family of transcription factors consisting of an evolutionarily conserved group of transcriptional regulators whose dysfunction has been associated with human malignant neoplasias [26-35]. FOXP3 is mainly expressed in regulatory T (Treg) cells, and it has also been found in other cells such as B lymphocytes [36-42]. FOXP3 was described as an important molecular actor involved in the development and function of Treg cells playing essential roles in the regulation of autoimmunity, infection and tumor environment [36-38]. FOXP3 is considered as a molecule at the crossroads of tumorigenesis and immunity for its bilateral role of cancer promotor or suppressor [42-46]. Furthermore, the role of FOXP3 in the biogenesis, development as well as clinical prognosis of colorectal cancer is still not completely understood, thereinto, infiltration of FOXP3+ Treg cells indicated favorable prognosis in some but not all studies [47-57]. Our results showed that the expression level of FOXP3 was not only significantly upregulated in tumor tissues (Figure 3D, P<0.01), but also associated with tumor size (Table 5, P<0.01). Additionally, FOXP3 expression in CRC patients with tumor volume>10 cm3 was significantly lower than that in patients with tumor volume≤10 cm3 (Figure 5A, P<0.01), indicating a tumor growth potential of FOXP3 with low expression in CRC, consistently, reduced expression of FOXP3 was associated with worse prognosis (Figure 6D, P<0.05). All these results showed that FOXP3 could be applied as a potential biomarker for CRC diagnosis and prognosis.
CD4, a membrane glycoprotein of T lymphocytes, is expressed not only in T lymphocytes, but also in B cells, macrophages as well as granulocytes. CD4 acts as a coreceptor with the T-cell receptor on T lymphocytes in recognition of antigens displayed by antigen-presenting cells in the context of class II major histocompatibility complex (MHC) molecules, and functions to initiate or augment the early phase of T-cell activation. Similarly, CD8, a cell surface glycoprotein found on most cytotoxic T lymphocytes mediating immune cell-cell interactions, acts as a coreceptor with the T-cell receptor on T lymphocytes to recognize antigens displayed by antigen-presenting cells in the context of class I MHC molecules. In general, CD4+ and CD8+ T cells identify antigens related to cancer cells and play significant roles in cancer immunology and immunotherapy [58,59]. Additionally, various studies have demonstrated that CD4+ and CD8+ T cells may also control tumor growth [60,61]. Increased levels of CD4+ and CD8+ T cells in colorectal tumor microenvironment were shown to correlate with improved response to chemoradiotherapy [62]. Results of prevenient studies suggested that levels of tumor infiltration by CD4+ and CD8+ T cells may be good predictive factors for patient clinical prognosis of various tumors including colorectal cancer, melanoma, oesophageal squamous cell carcinoma, ovarian cancer, pancreatic cancer and renal cancer [63-71]. Differently, compared with adjacent normal tissues, the expression levels of CD4 and CD8 in colorectal cancer tissues here decreased significantly and had no difference, respectively (Figure 3A and 3B), suggesting reduced immune infiltration of CD4+ and CD8+ T cells. What’s more, association of differential expression levels of CD4 or CD8 with clinical outcomes of CRC patients was of no significance (Figure 6A and 6B), and they had no significant association with tumor size or other clinicopathological characteristics (Table 5). Malignant tumors like CRC can cause the functional loss of antigen recognition, cell proliferation and activation of effector T cells, which is known as T cell exhaustion accompanied by the activation of multiple inhibitory receptors such as CTLA4 and PD1/PDL1 [72-74]. The decreased infiltration and effects on prognosis of CD4+ and CD8+ T cells observed here may be related to T cell exhaustion. Generally, the biological behaviors of cancers are influenced by the functional status of tumor-infiltrating immune cells whose roles in response to cancer are component- and stage-dependent. The CD4+ T cells consist of multiple morphologically and functionally distinctive subpopulations such as T regulatory (Treg) cells, T helper 1 (Th1), Th2, Th9, Th17 and follicular helper T (Tfh) cells, whose roles related to proinflammation and/or antiinflammation, activation and infiltration of CD8+ T cells in tumor microenvironment display tumor-promoting or tumor-suppressing effects in a case-dependent manner [75-87]. The limited tumor infiltration and functional potential of CD8+ T cells over served in this study might be partially due to a lack of CD4+ Th cell-mediated function.
PD1 (programmed cell death 1, also named PDCD1, CD279), an immunoinhibitory receptor belonging to the CD28 family that is expressed on activated T cells, is involved in T cell proliferation and functional regulation including those of effector CD8+ T cells, and also able to promote the differentiation of CD4+ T cells into T regulatory cells [88-90]. PD1 is expressed in many types of tumors and has demonstrated to play roles in anti-tumor immunity, safeguarding against autoimmunity as well as the inhibition of effective anti-tumor and anti-microbial immunity. Furthermore, PD1 interacts with ligand PDL1 (also named B7-H1, CD274) to form the PD1/PDL1 axis, an immune checkpoint which is usually up-regulated to help tumor cells avoid immune destruction in an immunosuppressive tumor microenvironment [91]. Overexpressed PDL1 can protect tumor cells by inhibiting the activity of PD1 expressing adjoining tumor-infiltrating effector CD4+/CD8+ T cells [92]. PDL1 is mainly expressed on the surface of antigen-representing and tumor cells in various types of cancer such as carcinomas of the adrenal cortex, bladder, brain, breast, colorectum, esophagus, gastrointestinal tract, kidney, liver, lung, ovary, pancreas, thymus, thyroid and urothelium [93]. Contradictory correlations of expression of PD1 and/or PDL1 with prognosis results and clinicopathological characteristics of colorectal cancer were observed (some investigations showed that overexpression of PD1 and/or PDL1 forecasted better prognosis, while others presented opposite results), even if PD1 and PDL1 may play oncogenic roles in colon cancer carcinogenesis [94-98]. Again, in our study, no significant difference was observed between expression of either PD1 or PDL1 in colorectal cancer tissues and those in normal tissues (Figure 3E and 3F), they also had no significant association with pathological grade or other characteristics (Table 5). Differential expression of PD1 or PDL1 was not statistically associated with CRC prognosis (Figure 6E and 6F). All these results indicated that PD1 and PDL1, in comparison to using alone, are more suitable for combination with other proteins for the application as potential biopredictors of CRC diagnosis.
References
- McGuire S Geneva (2016) Switzerland: World Health Organization, International Agency for Research on Cancer, WHO Press, 2015. Advances in Nutrition An International Review Journal 7: 418-419. [crossref]
- Jahani-Sherafat S, Alebouyeh M, Moghim S, et al. (2018) Role of gut microbiota in the pathogenesis of colorectal cancer; a review article. Gastroenterology and Hepatology from Bed to Bench 11: 101-109. [crossref]
- Torre LA, Bray F, Siegel RL, Ferlay J, Lortet-Tieulent J, et al. (2015) Global cancer statistics, 2012. CA: A Cancer Journal for Clinicians 65: 87-108. [crossref]
- Favoriti P, Carbone G, Greco M, et al. (2016) Worldwide burden of colorectal cancer: a review. Updates in Surgery 68: 7-11. [crossref]
- Fearon ER, Vogelstein B (1990) A genetic model for colorectal tumorigenesis. Cell 61: 759-767. [crossref]
- Graham JS, Cassidy J (2012) Adjuvant therapy in colon cancer. Expert Review of Anticancer Therapy 12: 99-109. [crossref]
- Bandar MA, Kim N (2017) Current status and future perspectives on treatment of liver metastasis in colorectal cancer (Review). Oncology Reports 37: 2553-2564. [crossref]
- Soon-Chan K, Young-Kyoung S, Ye-Ah K, et al. (2018) Identification of genes inducing resistance to ionizing radiation in human rectal cancer cell lines: re-sensitization of radio-resistant rectal cancer cells through down regulating NDRG1. BMC Cancer 18: 594. [crossref]
- Duffy MJ, Dalen AV, Haglund C, et al. (2007) Tumour markers in colorectal cancer: European Group on Tumour Markers (EGTM) guidelines for clinical use. European Journal of Cancer 43: 1348-1360. [crossref]
- Duffy MJ, Dalen AV, Haglund C, et al. (2003) Clinical utility of biochemical markers in colorectal cancer: European Group on Tumour Markers (EGTM) guidelines. European Journal of Cancer 39: 718-727. [crossref]
- Zhou Y, Abel G A, Hamilton W, et al. (2017) Diagnosis of cancer as an emergency: a critical review of current evidence. Nature Reviews Clinical Oncology 14: 45-56. [crossref]
- Meyerhardt JA, Mayer RJ (2005) Systemic therapy for colorectal cancer. New England Journal of Medicine 352: 476-487. [crossref]
- Mazzanti R, Solazzo M, Ornella Fantappié, et al. (2006) Differential expression proteomics of human colon cancer. American Journal of Physiology Gastrointestinal & Liver Physiology 290: G1329.
- Wang H, Tso VK, Slupsky CM, Fedorak RN (2010) Metabolomics and detection of colorectal cancer in humans: a systematic review. Future Oncology 6: 1395-1406. [crossref]
- Ni Y, Xie G, Jia W (2014) Metabonomics of human colorectal cancer: new approaches for early diagnosis and biomarker discovery. Journal of Proteome Research 13: 3857-3870. [crossref]
- Polley M, Leung S, Mcshane LM, Gao D, Hugh JC, et al. (2013) An International Ki67 Reproducibility Study. Journal of the National Cancer Institute 105: 1897-1906. [crossref]
- Varga Z, Diebold J, Dommann-Scherrer C, Frick H, Kaup D, et al. (2015) How Reliable Is Ki-67 Immunohistochemistry in Grade 2 Breast Carcinomas? A QA Study of the Swiss Working Group of Breast- and Gynecopathologists. Plos One 7: e37379. [crossref]
- Cheng CL, Thike AA, Tan S, Chua PJ, Bay BH, et al. (2015) Expression of FGFR1 is an independent prognostic factor in triple-negative breast cancer. Breast Cancer Research & Treatment 151: 99-111. [crossref]
- Stack Edward C, Wang C, Roman KA, Hoyt CC (2014) Multiplexed immunohistochemistry, imaging, and quantitation: A review, with an assessment of Tyramide signal amplification, multispectral imaging and multiplex analysis. Methods: A Companion to Methods in Enzymology 70: 46-58.
- Abel EJ, Bauman TM, Weiker M, Shi F, Downs TM, et al. (2014) Analysis and validation of tissue biomarkers for renal cell carcinoma using automated high-throughput evaluation of protein expression. Human Pathology 45: 1092-1099. [crossref]
- Lim JCT, Yeong JPS, Lim CJ, Ong CCH, Wong SC, et al. (2018) An automated staining protocol for 7colour immunofluorescence of human tissue sections for diagnostic and prognostic use. Pathology 50: 333. [crossref]
- Ring Kari L, Frumovitz MM, Yemelyanova AV, Soliman PT, Jazaeri AA (2017) Potential immunotherapy targets in recurrent cervical cancer. Gynecologic Oncology: An International Journal 145: 462-468. [crossref]
- F Min, Li Y, Kai H, Qi S, Zhang J, et al. (2017) IL33 Promotes Colon Cancer Cell Stemness via JNK Activation and Macrophage Recruitment. Cancer Research 77: 2735. [crossref]
- Ying L, Yan F, Meng Q, Yu L, Yuan X, et al. (2018) PD-L1 expression is a prognostic factor in subgroups of gastric cancer patients stratified according to their levels ofCD8 and FOXP3 immune markers. Oncoimmunology 7: e1433520. [crossref]
- Yang L, Liu Z, Tan J, Dong H, Zhang X (2018) Multispectral imaging reveals hyper active TGF-β signaling in colorectal cancer. Cancer biology & therapy 19: 1-8. [crossref]
- Darnell James E (2002) Transcription factors as targets for cancer therapy. Nature Reviews Cancer 2: 740-749. [crossref]
- Tong IL, Young RA (2013) Transcriptional Regulation and Its Misregulation in Disease. Cell 152: 1237-1251. [crossref]
- Bhagwat AS, Vakoc CR (2015) Targeting Transcription Factors in Cancer. Trends in Cancer 1: 53-65.
- Myatt SS, Lam WF (2007) The emerging roles of forkhead box (Fox) proteins in cancer. Nature Reviews Cancer 7: 847-859. [crossref]
- Hannenhalli S, Kaestner KH (2009) The evolution of Fox genes and their role in development and disease. Nature Reviews Genetics 10: 233-240. [crossref]
- Benayoun BA, Caburet S, Veitia RA (2011) Forkhead transcription factors: key players in health and disease. Trends in Genetics 27: 224-232. [crossref]
- Lam EF, Brosens JJ, Gomes AR, Koo CY (2013) Forkhead box proteins: tuning forks for transcriptional harmony. Nature Reviews Cancer 13: 482-495. [crossref]
- Katoh M, Igarashi M, Fukuda H, Nakagama H, Katoh M (2013) Cancer genetics and genomics of human FOX family genes. Cancer Letters 328: 198-206. [crossref]
- Lam EW, Gomes AR (2014) Forkhead box transcription factors in cancer initiation, progression and chemotherapeutic drug response. Frontiers Research Topic. Molecular & Cellular Oncology 4: 305. [crossref]
- Golson ML, Kaestner KH (2016) Fox transcription factors: from development to disease. Development 143: 4558-4570. [crossref]
- Fontenot JD, Gavin MA, Rudensky AY (2003) Foxp3 programs the development and function of CD4+CD25+ regulatory T cells. Nature Immunology 4: 330336. [crossref]
- Khattri R, Cox T, Yasayko SA, Ramsdell F (2003) An essential role for Scurfin in CD4+CD25+ T regulatory cells. Nature Immunology 4: 337-342. [crossref]
- Campbell DJ, Ziegler SF (2007) FOXP3 modifies the phenotypic and functional properties of regulatory T cells. Nature Reviews Immunology 7: 305. [crossref]
- Triulzi T, Tagliabue E, Balsari A, Casalini P (2013) FOXP3 expression in tumor cells and implications for cancer progression. Journal of Cellular Physiology 228: 30-35. [crossref]
- Mercer F, Unutmaz D (2009) The Biology of FoxP3: A Key Player in Immune Suppression during Infections, Autoimmune Diseases and Cancer. Oxygen Transport to Tissue 665: 47-59. [crossref]
- Martin F, Ladoire S, Mignot G, Apetoh L, Ghiringhelli F (2010) Human FOXP3 and cancer. Oncogene 29: 4121-4129. [crossref]
- Redpath M, Xu B, Kempen L, Spatz A (2011) The dual role of the X-linked FoxP3 gene in human cancers. Molecular Oncology 5: 156-163. [crossref]
- Tao Z, Wang L, Morrison C, Chang X, Zhang H, et al. (2007) FOXP3 is an X-linked breast cancer suppressor gene and an important repressor of the HER-2/ErbB2 oncogene. Cell 129: 1275-1286. [crossref]
- Katoh H, Zheng P, Liu Y (2010) Signalling through FOXP3 as an X-linked tumor suppressor. International Journal of Biochemistry & Cell Biology 42: 1784-1787. [crossref]
- Wang L, Liu R, Ribick M, et al. (2010) FOXP3 as an X-linked tumor suppressor. Discovery medicine 10: 322-328.
- Redpath M, Xu B, Kempen LC, Spatz A (2011) The dual role of the X-linked FoxP3 gene in human cancers. Molecular Oncology 5: 156-163. [crossref]
- Xu P, Wei F, Zheng Z, Wang J, Wang P, et al. (2017) The Clinicopathological and Prognostic Implications of FoxP3+ Regulatory T Cells in Patients with Colorectal Cancer: A Meta-Analysis. Frontiers in Physiology 8: 950. [crossref]
- Sinicrope FA, Rego RL, Ansell SM, Knutson KL, Foster NR, et al. (2009) Intraepithelial Effector (CD3+)/Regulatory (FoxP3+) T-Cell Ratio Predicts a Clinical Outcome of Human Colon Carcinoma. Gastroenterology 137: 1270-1279. [crossref]
- Fridman WH, Pagès F, Sautès-Fridman C, Galon J (2012) The immune contexture in human tumours: impact on clinical outcome. Nature Reviews Cancer 12: 298-306. [crossref]
- Suzuki, H, Onishi, Morisaki T, Tanaka M, Katano M (2013) Intratumoral FOXP3+VEGFR2+ regulatory T cells are predictive markers for recurrence and survival in patients with colorectal cancer. Clinical Immunology San Diego Academic Press 146: 26-33. [crossref]
- Yong H, Huaiwei L, Yong Z, Yuan R, Wang F, et al. (2014) Prognostic Value of Tumor-Infiltrating FoxP3+ T Cells in Gastrointestinal Cancers: A Meta Analysis. Plos One 9: e94376. [crossref]
- Shang B, Liu Y, Jiang SJ, Liu Y (2015) Prognostic value of tumor-infiltrating FoxP3+ regulatory T cells in cancers: a systematic review and meta-analysis. Scientific Reports 5: 15179. [crossref]
- Yoon HH, Orrock JM, Foster NR, Sargent DJ, Smyrk TC, et al. (2012) Prognostic Impact of FoxP3+ Regulatory T Cells in Relation to CD8+ T Lymphocyte Density in Human Colon Carcinomas. PLoS ONE 7: e42274. [crossref]
- Salama P, Phillips M, Grieu F, Morris M, Zeps N, et al. (2009) Tumor-infiltrating FOXP3+ T regulatory cells show strong prognostic significance in colorectal cancer. Journal of Clinical Oncology 27: 186-192. [crossref]
- Sinicrope FA, Rego RL, Ansell SM, Knutson KL, Foster NR, et al. (2009) Intraepithelial Effector (CD3+)/Regulatory (FoxP3+) T-Cell Ratio Predicts a Clinical Outcome of Human Colon Carcinoma. Gastroenterology 137: 1270-1279. [crossref]
- Deleeuw RJ, Kost SE, Kakal JA, Nelson BH (2012) The Prognostic Value of FoxP3+ TumorInfiltrating Lymphocytes in Cancer: A Critical Review of the Literature. Clinical Cancer Research 18: 3022-3029. [crossref]
- Saito T, Nishikawa H, Wada H, Nagano Y, Sugiyama D, et al. (2016) Two FOXP3+CD4+ T cell subpopulations distinctly control the prognosis of colorectal cancers. Nature Medicine 22: 679-684. [crossref]
- Jannie B, Tomasz A, Nikolina B, Melief CJM, Kastenmüller W (2018) CD4+ T cell help in cancer immunology and immunotherapy. Nature Reviews Immunology 18: 635-647. [crossref]
- Bagher Farhood, Masoud N, Mortezaee K (2019) CD8+ cytotoxic T lymphocytes in cancer immunotherapy: A review. Journal of cellular physiology 234: 8509-8521. [crossref]
- Flynn S, Stockinger B (2003) Tumor and CD4 T-cell interactions: tumor escape as result of reciprocal inactivation. Blood 101: 4472-4478. [crossref]
- Boer D Th A, van Mierlo GJ, Fransen MF, Melief CJ, Offringa R, et al. (2005) CD4+ T Cells Are Able to Promote Tumor Growth through Inhibition of Tumor-Specific CD8+ T-Cell Responses in Tumor-Bearing Hosts. Cancer Research 65: 6984. [crossref]
- Yasuda K, Nirei T, Sunami E, Nagawa H, Kitayama J (2011) Density of CD4(+) and CD8(+) T lymphocytes in biopsy samples can be a predictor of pathological response to chemoradiotherapy (CRT) for rectal cancer. Radiation Oncology 6: 49. [crossref]
- Olino K, Park T, Ahuja N (2020) Exposing Hidden Targets: Combining epigenetic and immunotherapy to overcome cancer resistance – Science Direct. Seminars in Cancer Biology 65: 114-122.
- Mlecnik B, Bindea G, Angell HK, Maby P, Angelova M, et al. (2016) Integrative Analyses of Colorectal Cancer Show Immunoscore Is a Stronger Predictor of Patient Survival Than Microsatellite Instability. Immunity 44: 698-711. [crossref]
- Fukunaga A, Miyamoto M, Cho Y, Murakami S, Kawarada Y, et al. (2004) CD8+ tumor-infiltrating lymphocytes together with CD4+ tumor-infiltrating lymphocytes and dendritic cells improve the prognosis of patients with pancreatic adenocarcinoma. Pancreas 28: 26-31. [crossref]
- Cho Y, Miyamoto M, Kato K, Fukunaga A, Shichinohe T, et al. (2003) CD4+ and CD8+ T cells cooperate to improve prognosis of patients with esophageal squamous cell carcinoma. Cancer Research 63: 1555-1559. [crossref]
- Zhang L, Conejogarcia J R, Katsaros D, Gimotty PA, Massobrio M, et al. (2003) Intratumoral T cells, recurrence, and survival in epithelial ovarian cancer. N Engl J Med 348: 203-213. [crossref]
- Nakano O, Sato M, Naito Y, Suzuki K, Orikasa S, et al. (2001) Proliferative activity of intratumoral CD8 (+) T-lymphocytes as a prognostic factor in human renal cell carcinoma: clinicopathologic demonstration of antitumor immunity. Cancer Res 61: 5132-5136. [crossref]
- Bromwich EJ, Mcardle PA, Canna K, McMillan DC, McNicol AM, et al. (2003) The relationship between Tlymphocyte infiltration, stage, tumour grade and survival in patients undergoing curative surgery for renal cell cancer. British Journal of Cancer 89: 1906-1908. [crossref]
- Giraldo NA, Sanchez-Salas R, Peske JD, Vano Y, Becht E, et al. (2018) The clinical role of the TME in solid cancer. British Journal of Cancer 120: 45-53. [crossref]
- Wang B, Li F, Guo L, et al. (2020) Loss of survival advantage for deficient mismatch repair in patients with advanced colorectal cancer may be caused by changes in prognostic value of CD8+T cell expression. World J Surg Oncol 18: 196. [crossref]
- Wherry E J, Kurachi M (2015) Molecular and cellular insights into T cell exhaustion. Nature Reviews Immunology 15: 486-499. [crossref]
- Blackburn SD, Shin H, Haining WN, Zou T, Workman CJ, et al. (2009) Coregulation of CD8+ T cell exhaustion by multiple inhibitory receptors during chronic viral infection. Nature Immunology 10: 29-37. [crossref]
- Sen DR, Kaminski J, Barnitz RA, Kurachi M, Gerdemann U, et al. (2016) The epigenetic landscape of T cell exhaustion. Science 354: 1165-1169. [crossref]
- Grivennikov SI, Greten FR, Karin M (2010) Immunity, Inflammation, and Cancer. Cell 140: 883-899. [crossref]
- Baitsch L, Baumgaertner P, Estelle Devêvre, Raghav SK, Legat A, et al. (2011) Exhaustion of tumor-specific CD8+ T cells in metastases from melanoma patients. Journal of Clinical Investigation 3: 23-25. [crossref]
- Zarour HM (2016) Reversing T-cell Dysfunction and Exhaustion in Cancer. Clinical Cancer Research 22: 1856-1864. [crossref]
- Bos R, Sherman LA (2010) CD4+ T-Cell Help in the Tumor Milieu Is Required for Recruitment and Cytolytic Function of CD8+ T Lymphocytes. Cancer Research 70: 8368. [crossref]
- Ruffell B, De Nardo DG, Affara NI, Coussens LM (2010) Lymphocytes in cancer development: Polarization towards pro-tumor immunity. Cytokine & Growth Factor Reviews 21: 3-10. [crossref]
- Zanetti Maurizio (2015) Tapping CD4 T Cells for Cancer Immunotherapy: The Choice of Personalized Genomics. The Journal of Immunology: Official Journal of the American Association of Immunologists 194: 2049-2056. [crossref]
- Vegran F, Apetoh L, Ghiringhelli F (2015) Th9 Cells: A Novel CD4 T-cell Subset in the Immune War against Cancer. Cancer Research 75: 475-479. [crossref]
- Vegran F, Berger H, Boidot R, Mignot G, Bruchard M, et al. (2014) The transcription factor IRF1 dictates the IL21-dependent anticancer functions of [T.sub.H] 9 cells. Nature Immunology 15: 758-766. [crossref]
- Bailey SR, Nelson MH, Himes RA, Li Z, Mehrotra S, et al. (2014) Th17 cells in cancer: the ultimate identity crisis. Frontiers in Immunology 5: 276. [crossref]
- Sara O, Pizarro TT (2015) The Treg/Th17 Axis: A Dynamic Balance Regulated by the Gut Microbiome. Frontiers in Immunology 6: 639. [crossref]
- El-Omar E M, Rabkin C S, MD Gammon, et al. (2003) Increased risk of noncardia gastric cancer associated with proinflammatory cytokine gene polymorphisms. Gastroenterology 124: 1193-1201.
- Grivennikov Sergei I (2013) Inflammation and colorectal cancer: colitis-associated neoplasia. Seminars in Immunopathology 35: 229-244. [crossref]
- Huang J, Shen F, Huang H, Ling C, Zhang G (2017) Th1 high in tumor microenvironment is an indicator of poor prognosis for patients with NSCLC. Oncotarget 8: 13116-13125. [crossref]
- Freeman GJ, Long AJ, Iwai Y, Bourque K, Chernova T, et al. (2000) Engagement of the Pd-1 Immunoinhibitory Receptor by a Novel B7 Family Member Leads to Negative Regulation of Lymphocyte Activation. The Journal of Experimental Medicine 192: 1027-1034. [crossref]
- Nishimura H, Nose M, Hiai H, et al. (1999) Development of Lupus-like Autoimmune Diseases by Disruption of the PD-1 Gene Encoding an ITIM Motif-Carrying Immunoreceptor. Immunity 11: 141-151. [crossref]
- Nishimura H, Okazaki T, Tanaka Y, Nakatani K, Hara M, et al. (2001) Autoimmune Dilated Cardiomyopathy in PD-1 Receptor-Deficient Mice. Science 291: 319-322. [crossref]
- Fusi A, Festino L, Botti G, Masucci G, Melero I, et al. (2015) PD-L1 expression as a potential predictive biomarker. Lancet Oncology 16: 1285-1287. [crossref]
- Dong Haidong, Strome SE, Salomao DR, Tamura H, Hirano F, et al. (2002) Tumor-associated B7-H1 promotes T-cell apoptosis: A potential mechanism of immune evasion. Nature Medicine 8: 793-800. [crossref]
- Yu J, Wang X, Teng F, Kong L (2016) PD-L1 expression in human cancers and its association with clinical outcomes. Oncotargets & Therapy 9: 5023-5039. [crossref]
- Shi SJ, Wang LJ, Wang GD, Guo ZY, Wei M, et al. (2013) B7-H1 Expression Is Associated with Poor Prognosis in Colorectal Carcinoma and Regulates the Proliferation and Invasion of HCT116 Colorectal Cancer Cells. Plos One 8: e76012. [crossref]
- Angelica C M, Cristina I, David V, Wang X, Peltier HJ, et al. (2016) PDL1 Regulation by p53 via miR-34. Journal of the National Cancer Institute 108: 303. [crossref]
- Yang L, Xue R, Pan C (2019) Prognostic and clinicopathological value of PD-L1 in colorectal cancer: a systematic review and meta-analysis. OncoTargets and therapy 12: 3671-3682. [crossref]
- Masugi Y, Nishihara R, Yang J, Mima K, da Silva A, et al. (2016) Tumour CD274 (PD-L1) expression and T cells in colorectal cancer. Gut 1463. [crossref]
- Li Y, Liang L, Dai W, Cai G, Xu Y, et al. (2016) Prognostic impact of programed cell death-1 (PD-1) and PD-ligand 1 (PD-L1) expression in cancer cells and tumor infiltrating lymphocytes in colorectal cancer. Molecular Cancer 15: 55. [crossref]